Exhibit 99.1

FIRST BANCORP. ANNOUNCES EARNINGS FOR THE QUARTER ENDED SEPTEMBER 30, 2024
SAN JUAN, Puerto Rico – October 23, 2024 – First BanCorp. (the “Corporation” or “First BanCorp.”) (NYSE:
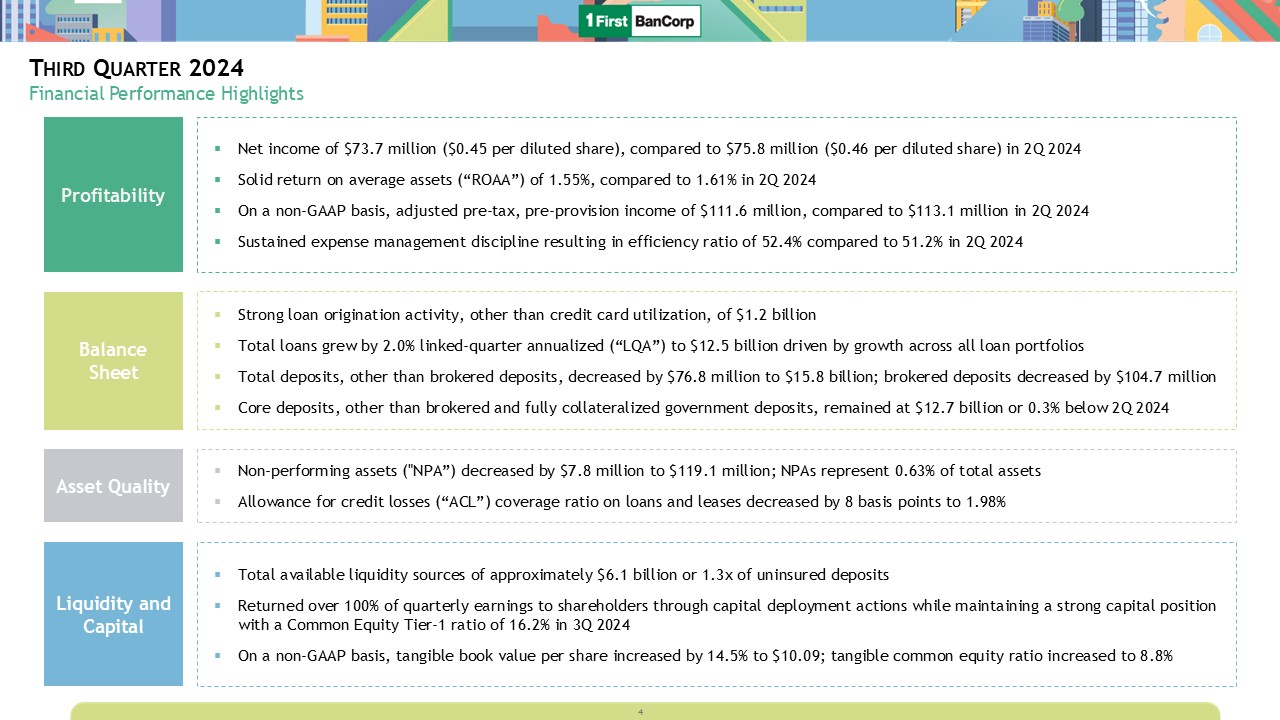
FBP), the bank holding company for FirstBank Puerto Rico (“FirstBank” or “the Bank”), today reported a net income of $73.7 million, or $0.45 per diluted share, for the third quarter of 2024, compared to $75.8 million, or $0.46 per diluted
share, for the second quarter of 2024, and $82.0 million, or $0.46 per diluted share, for the third quarter of 2023.
Aurelio Alemán, President and Chief Executive Officer of First BanCorp, commented: “Our third quarter results reflect our commitment to deliver consistent performance and our ability to generate organic capital on the back of a stable environment in our main market. We posted a strong return on
assets of 1.55%, maintained positive credit performance and stable deposit trends, and made good progress on our capital deployment strategy.
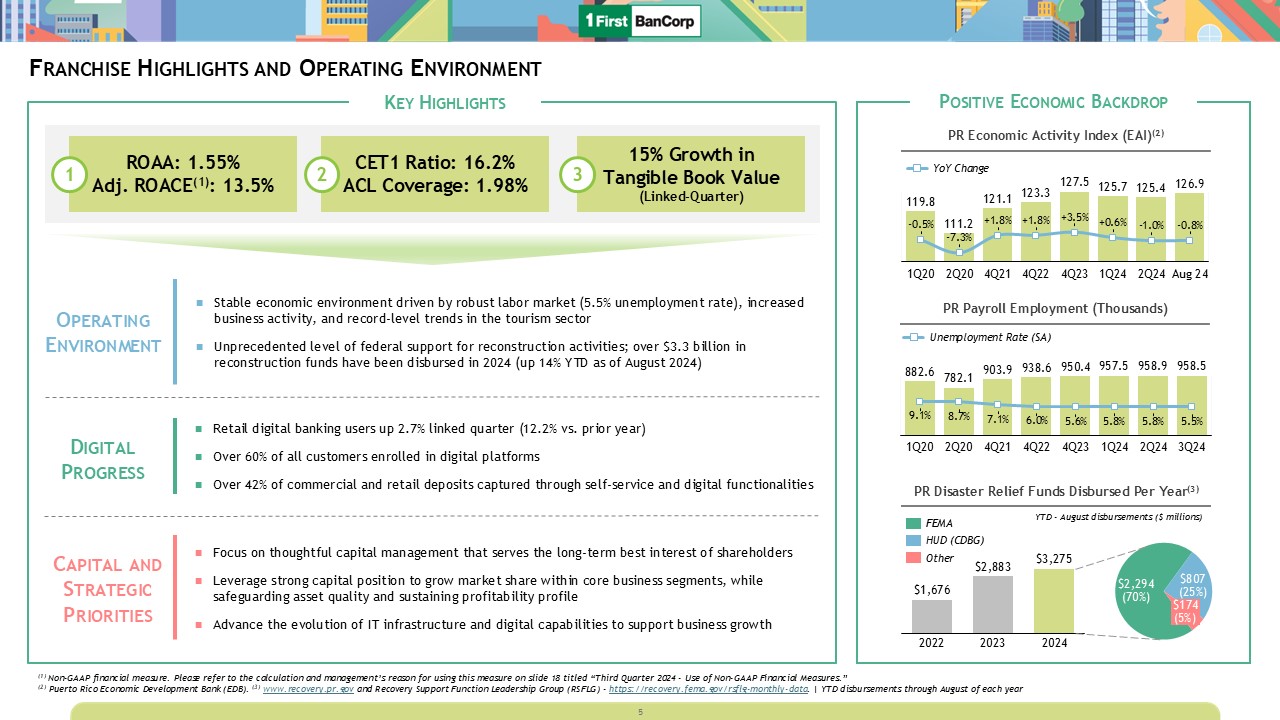
The economy remains on solid footing driven by positive labor market trends and increased business activity. This environment continues to support credit demand and
has enabled our strongest quarter of commercial loan originations this year. Our loan portfolio grew by $63 million despite higher levels of unexpected commercial prepayments that amounted to approximately $122 million in the third quarter.
Our teams remain focused on expanding existing relationships, building loan pipelines, and adopting new platforms to enable future growth as we close out 2024 and enter 2025.
Net interest income and the margin continued to expand after reaching a trough in the first quarter. We continue to expect that our bond book repricing opportunities
will allow for some net interest income expansion in 2025. Finally, consistent with our guidance, we deployed over 100% of our quarterly earnings for the redemption of $50 million in junior subordinated debentures and the payment of common
stock dividends. Our franchise is delivering solid results, we have a strong capital base, and we have ample flexibility to prudently allocate that capital into opportunities that best serve the long-term interests of our clients,
communities and shareholders.”
|
Q3
|
Q2
|
Q3
|
YTD
|
|||||||||||||||||
|
2024
|
2024
|
2023
|
2024
|
2023
|
||||||||||||||||
|
Financial Highlights (1)
|
||||||||||||||||||||
|
Net interest income
|
$
|
202,064
|
$
|
199,628
|
$
|
199,728
|
$
|
598,212
|
$
|
600,428
|
||||||||||
|
Provision for credit losses
|
15,245
|
11,605
|
4,396
|
39,017
|
42,128
|
|||||||||||||||
|
Non-interest income
|
32,502
|
32,038
|
30,296
|
98,523
|
99,085
|
|||||||||||||||
|
Non-interest expenses
|
122,935
|
118,682
|
116,638
|
362,540
|
344,823
|
|||||||||||||||
|
Income before income taxes
|
96,386
|
101,379
|
108,990
|
295,178
|
312,562
|
|||||||||||||||
|
Income tax expense
|
22,659
|
25,541
|
26,968
|
72,155
|
89,187
|
|||||||||||||||
|
Net income
|
$
|
73,727
|
$
|
75,838
|
$
|
82,022
|
$
|
223,023
|
$
|
223,375
|
||||||||||
|
Selected Financial Data (1)
|
||||||||||||||||||||
|
Net interest margin
|
4.25
|
%
|
4.22
|
%
|
4.15
|
%
|
4.21
|
%
|
4.24
|
%
|
||||||||||
|
Efficiency ratio
|
52.41
|
%
|
51.23
|
%
|
50.71
|
%
|
52.03
|
%
|
49.29
|
%
|
||||||||||
|
Earnings per share - diluted
|
$
|
0.45
|
$
|
0.46
|
$
|
0.46
|
$
|
1.35
|
$
|
1.25
|
||||||||||
|
Book value per share
|
$
|
10.38
|
$
|
9.10
|
$
|
7.47
|
$
|
10.38
|
$
|
7.47
|
||||||||||
|
Tangible book value per share (2)
|
$
|
10.09
|
$
|
8.81
|
$
|
7.16
|
$
|
10.09
|
$
|
7.16
|
||||||||||
|
Return on average equity
|
18.31
|
%
|
20.80
|
%
|
20.70
|
%
|
19.52
|
%
|
19.00
|
%
|
||||||||||
|
Return on average assets
|
1.55
|
%
|
1.61
|
%
|
1.72
|
%
|
1.57
|
%
|
1.59
|
%
|
||||||||||
.
|
Results for Third Quarter of 2024 compared to Second Quarter of 2024
|
||||
|
Profitability
|
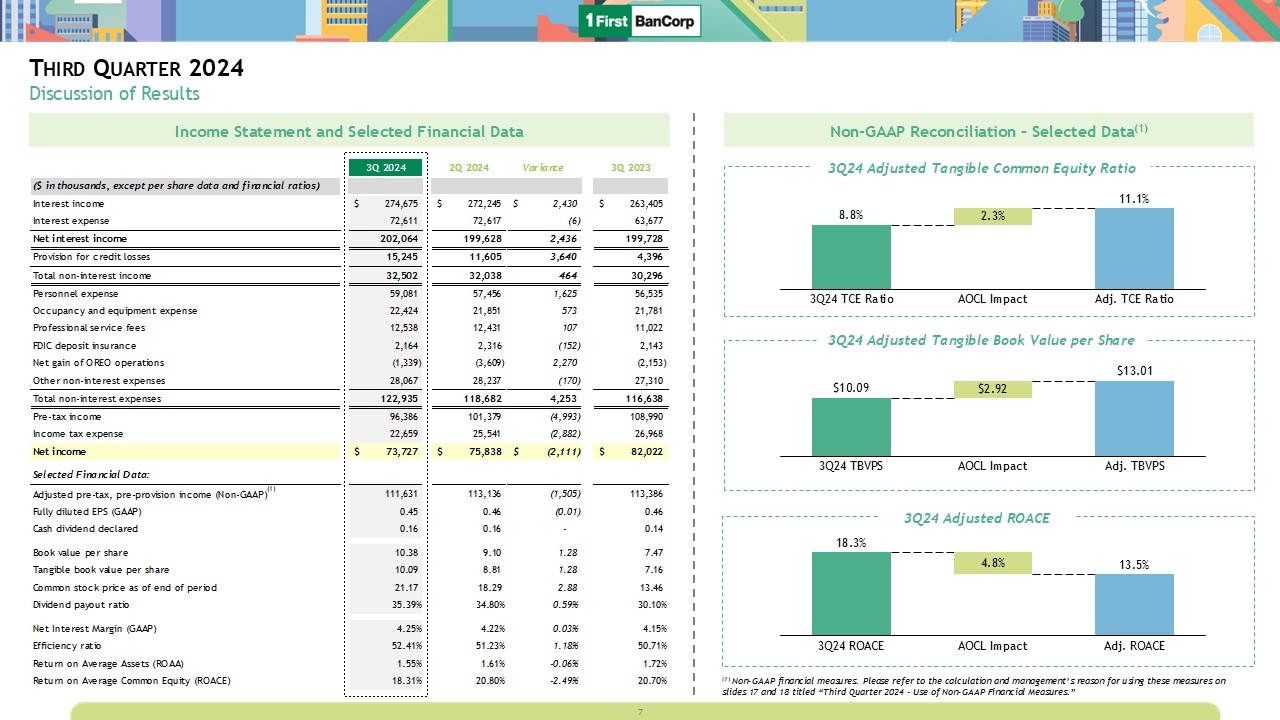
Net income – $73.7 million, or $0.45 per diluted share compared to $75.8 million,
or $0.46 per diluted share.
Income before income taxes – $96.4 million
compared to $101.3 million.
Adjusted pre-tax, pre-provision income (Non-GAAP)(2) – $111.6 million, compared to $113.1 million.
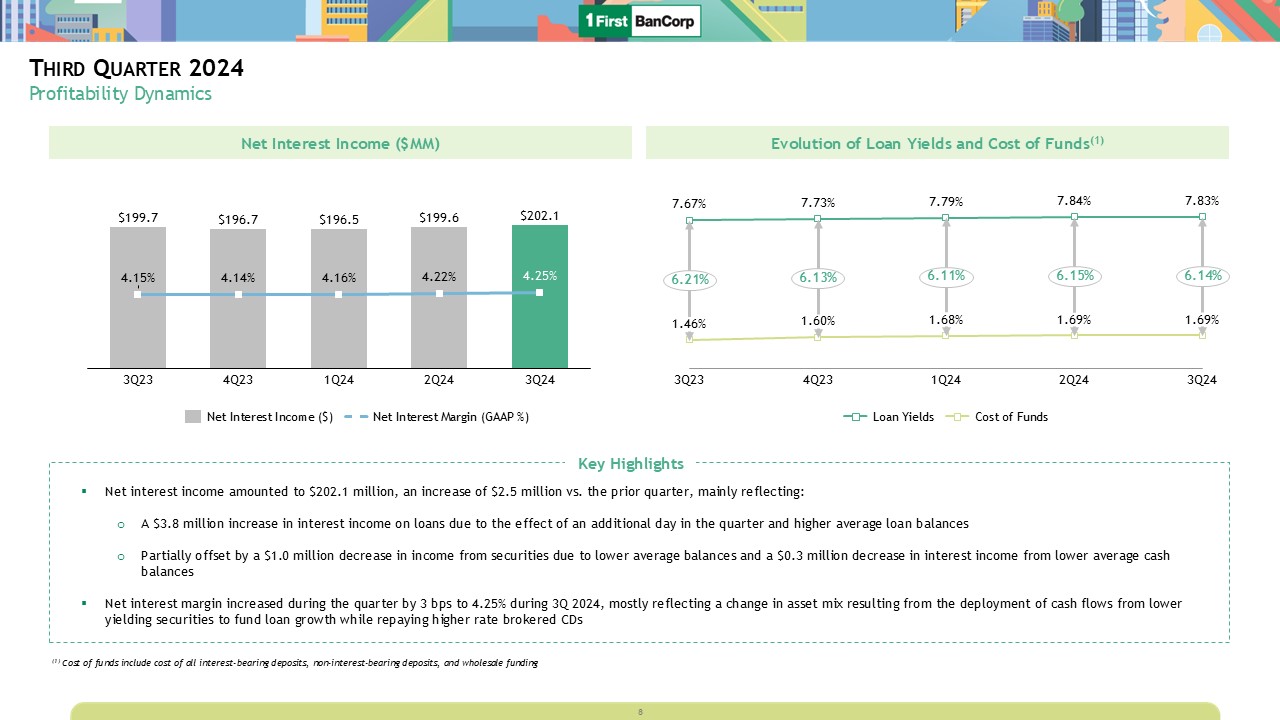
Net interest income – $202.1 million compared to $199.6 million. The increase was
mainly due to a higher volume of loans and an increase of approximately $1.2 million associated with the effect of an additional day in the third quarter of 2024. Net interest margin increased to 4.25%, compared to 4.22%.
Provision for credit losses – $15.2 million compared to $11.6 million. The
increase in provision reflects the impact of higher charge-off levels in the consumer loan and finance lease portfolios, partially offset by reductions associated with the improved financial condition from certain commercial
borrowers and improvements in the long-term projections of the unemployment rate primarily in the Puerto Rico region and the commercial real estate (“CRE”) price index.
Non-interest income – $32.5 million compared to $32.0 million. The increase was
driven by insurance proceeds of $0.8 million received in the third quarter of 2024.
Non-interest expenses – $122.9 million compared to $118.7 million. The increase
was mainly due to a $2.3 million realized gain on the sale of a commercial other real estate owned (“OREO”) property in the Puerto Rico region in the second quarter of 2024 and a $1.6 million increase in employees’ compensation and
benefits expense, driven by annual salary merit increases and an additional working day in the third quarter of 2024. The efficiency ratio was 52.41%, compared to 51.23%.
|
|||
|
Balance
Sheet
|
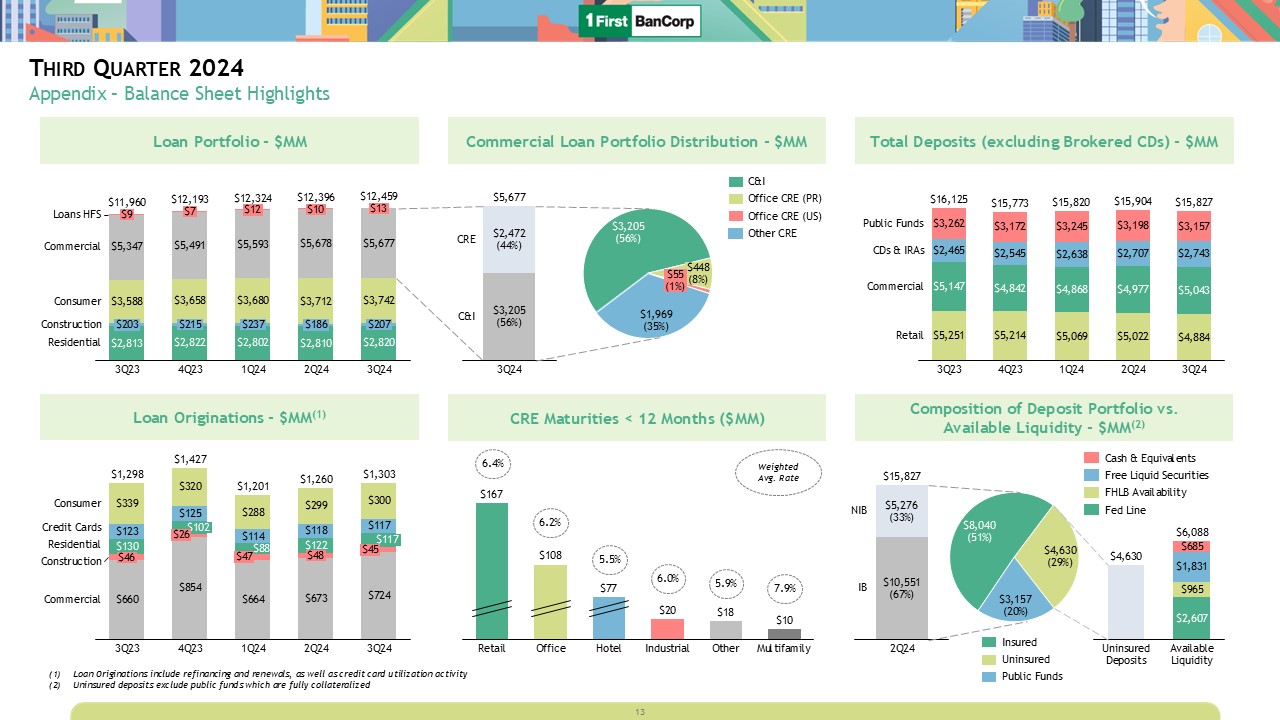
Total loans – grew by $62.8 million to $12.5 billion, primarily reflecting growth in the consumer
and commercial loan portfolios. Total loan originations, other than credit card utilization activity, of $1.2 billion, up $43.1 million, mainly in commercial and construction loans.
Core deposits (other than brokered and government deposits) – decreased by $36.8 million to $12.7
billion, reflecting a decline of $51.0 million in the Virgin Islands region and $31.5 million in the Puerto Rico region, partially offset by a $45.7 million increase in the Florida region. This decline includes a $96.9 million
decrease in non-interest-bearing deposits, partially offset by a $35.9 million increase in time deposits.
Government deposits (fully collateralized) – decreased by $40.1 million to $3.2 billion, mainly in
the Virgin Islands region.
Brokered certificates of deposits (“CDs”) – decreased by $104.7 million to $520.0 million, mainly
in the Puerto Rico region.
|
|||
|
Asset
Quality
|
Allowance for credit losses (“ACL”) coverage ratio – amounted to 1.98%, compared to 2.06%.
Annualized net charge-offs to average loans ratio increased to 0.78%, compared to 0.69%; the
increase includes a $1.2 million fully reserved charge-off taken in connection with the sale of an $8.2 million nonaccrual commercial and industrial (“C&I”) loan in the Puerto Rico region.
Non-performing assets – decreased by $7.8 million, driven by the sale and charge-off of the
aforementioned nonaccrual C&I loan.
|
|||
|
Liquidity
and
Capital
|
Liquidity – Cash and cash equivalents amounted to $685.4 million, compared to $586.3 million. When
adding $1.8 billion of free high-quality liquid securities that could be liquidated or pledged within one day and $964.7 million in available lending capacity at the Federal Home Loan Bank (“FHLB”), available liquidity amounted to
18.43% of total assets, compared to 18.50%.
Capital – Repurchased $50.0 million of junior subordinated debentures and paid $26.1 million in
common stock dividends. Capital ratios exceeded required regulatory levels. The Corporation’s estimated total capital, common equity tier 1 (“CET1”) capital, tier 1 capital, and leverage ratios were 18.25%, 16.18%, 16.18%, and
10.96%, respectively, as of September 30, 2024. On a non-GAAP basis, the tangible common equity ratio(2) increased to 8.79% when compared to 7.66%,
driven by the $160.1 million increase in the fair value of available-for-sale debt securities due to changes in market interest rates which is recognized as part of accumulated other comprehensive loss.
|
|||
|
(1)
|
In thousands, except per share information and financial ratios.
|
|
(2)
|
Represents a non-GAAP financial measure. Refer to Non-GAAP Disclosures - Non-GAAP Financial Measures for the definition of and additional information about this non-GAAP financial measure
|
First BanCorp. Announces Earnings for the Quarter Ended September 30, 2024 – Page 2 of 27
NET INTEREST INCOME
The following table sets forth information concerning net interest income for the last five quarters:
|
Quarter Ended
|
||||||||||||||||||||
|
(Dollars in thousands)
|
September 30, 2024
|
June 30, 2024
|
March 31, 2024
|
December 31, 2023
|
September 30, 2023
|
|||||||||||||||
|
Net Interest Income
|
||||||||||||||||||||
|
Interest income
|
$
|
274,675
|
$
|
272,245
|
$
|
268,505
|
$
|
265,481
|
$
|
263,405
|
||||||||||
|
Interest expense
|
72,611
|
72,617
|
71,985
|
68,799
|
63,677
|
|||||||||||||||
|
Net interest income
|
$
|
202,064
|
$
|
199,628
|
$
|
196,520
|
$
|
196,682
|
$
|
199,728
|
||||||||||
|
Average Balances
|
||||||||||||||||||||
|
Loans and leases
|
$
|
12,354,679
|
$
|
12,272,816
|
$
|
12,207,840
|
$
|
12,004,881
|
$
|
11,783,456
|
||||||||||
|
Total securities, other short-term investments and interest-bearing cash balances
|
6,509,789
|
6,698,609
|
6,720,395
|
6,835,407
|
7,325,226
|
|||||||||||||||
|
Average interest-earning assets
|
$
|
18,864,468
|
$
|
18,971,425
|
$
|
18,928,235
|
$
|
18,840,288
|
$
|
19,108,682
|
||||||||||
|
Average interest-bearing liabilities
|
$
|
11,743,122
|
$
|
11,868,658
|
$
|
11,838,159
|
$
|
11,665,459
|
$
|
11,671,938
|
||||||||||
|
Average Yield/Rate
|
||||||||||||||||||||
|
Average yield on interest-earning assets - GAAP
|
5.78
|
%
|
5.76
|
%
|
5.69
|
%
|
5.59
|
%
|
5.47
|
%
|
||||||||||
|
Average rate on interest-bearing liabilities - GAAP
|
2.45
|
%
|
2.45
|
%
|
2.44
|
%
|
2.34
|
%
|
2.16
|
%
|
||||||||||
|
Net interest spread - GAAP
|
3.33
|
%
|
3.31
|
%
|
3.25
|
%
|
3.25
|
%
|
3.31
|
%
|
||||||||||
|
Net interest margin - GAAP
|
4.25
|
%
|
4.22
|
%
|
4.16
|
%
|
4.14
|
%
|
4.15
|
%
|
||||||||||
Net interest income amounted to $202.1 million for the third quarter of 2024, an increase of $2.5 million, compared to $199.6 million for the second quarter of 2024, including a net increase of approximately
$1.2 million associated with the effect of an additional day in the third quarter of 2024. The increase in net interest income reflects the following:
| • |
A $3.8 million increase in interest income on loans, driven by:
|
| - |
A $1.6 million increase in interest income on commercial and construction loans, driven by increases of $1.1 million associated with the effect of an additional day in the third quarter of 2024, and a $0.4 million increase
associated with a $37.8 million increase in the average balance.
|
| - |
A $1.4 million increase in interest income on consumer loans and finance leases, of which $0.7 million was associated with a $35.3 million increase in the average balance, mainly in the auto loans and finance leases portfolios, and
$0.7 million was associated with the effect of an additional day in the third quarter of 2024.
|
| - |
An $0.8 million increase in interest income in residential mortgage loans driven by higher interest income recognized on nonaccrual loans that returned to accrual status.
|
Partially offset by:
| • |
A $1.0 million decrease in interest income from investment securities driven by a $168.7 million decrease in the average balance.
|
| • |
A $0.3 million decrease in interest income from interest-bearing cash balances driven by a $22.2 million reduction in the average cash balances deposited at the Federal Reserve Bank (the “FED”).
|
Interest expense on interest-bearing liabilities remained relatively flat during the third and second quarters of 2024, as further explained below.
| • |
A $1.2 million increase in interest expense on time deposits, excluding brokered CDs, mainly due to increases of approximately $0.5 million associated with a $55.8 million increase in the average balance, $0.4 million associated
with higher interest rates paid in the third quarter of 2024 on renewals, and $0.3 million associated with the effect of an additional day in the third quarter of 2024. The average cost of non-brokered time deposits in the third
quarter of 2024 increased 5 basis points to 3.60% when compared to the previous quarter.
|
First BanCorp. Announces Earnings for the Quarter Ended September 30, 2024 – Page 3 of 27
Partially offset by:
| • |
A $1.0 million decrease in interest expense on brokered CDs, primarily related to a $76.1 million reduction in the average balance.
|
| • |
A $0.2 million decrease in interest expense on interest-bearing checking and saving accounts, mainly due to a decrease of approximately $0.4 million associated with a $99.2 million reduction in the average balance, partially offset
by a $0.3 million increase associated with the effect of an additional day in the third quarter of 2024. The average cost of interest-bearing checking and saving accounts, excluding public sector deposits, remained relatively flat at
0.76% in the third quarter of 2024, when compared to 0.75% in the second quarter.
|
Net interest margin for the third quarter of 2024 was 4.25%, a 3 basis points increase when compared to the second quarter of 2024, mostly reflecting a change in asset mix resulting from the deployment of cash
flows from lower-yielding investment securities to fund loan growth while simultaneously repaying higher rate brokered CDs.
NON-INTEREST INCOME
The following table sets forth information concerning non-interest income for the last five quarters:
|
Quarter Ended
|
||||||||||||||||||||
|
September 30, 2024
|
June 30, 2024
|
March 31, 2024
|
December 31, 2023
|
September 30, 2023
|
||||||||||||||||
|
(In thousands)
|
||||||||||||||||||||
|
Service charges and fees on deposit accounts
|
$
|
9,684
|
$
|
9,725
|
$
|
9,662
|
$
|
9,662
|
$
|
9,552
|
||||||||||
|
Mortgage banking activities
|
3,199
|
3,419
|
2,882
|
2,094
|
2,821
|
|||||||||||||||
|
Insurance commission income
|
3,003
|
2,786
|
5,507
|
2,379
|
2,790
|
|||||||||||||||
|
Card and processing income
|
11,768
|
11,523
|
11,312
|
11,015
|
10,841
|
|||||||||||||||
|
Other non-interest income
|
4,848
|
4,585
|
4,620
|
8,459
|
4,292
|
|||||||||||||||
|
Non-interest income
|
$
|
32,502
|
$
|
32,038
|
$
|
33,983
|
$
|
33,609
|
$
|
30,296
|
||||||||||
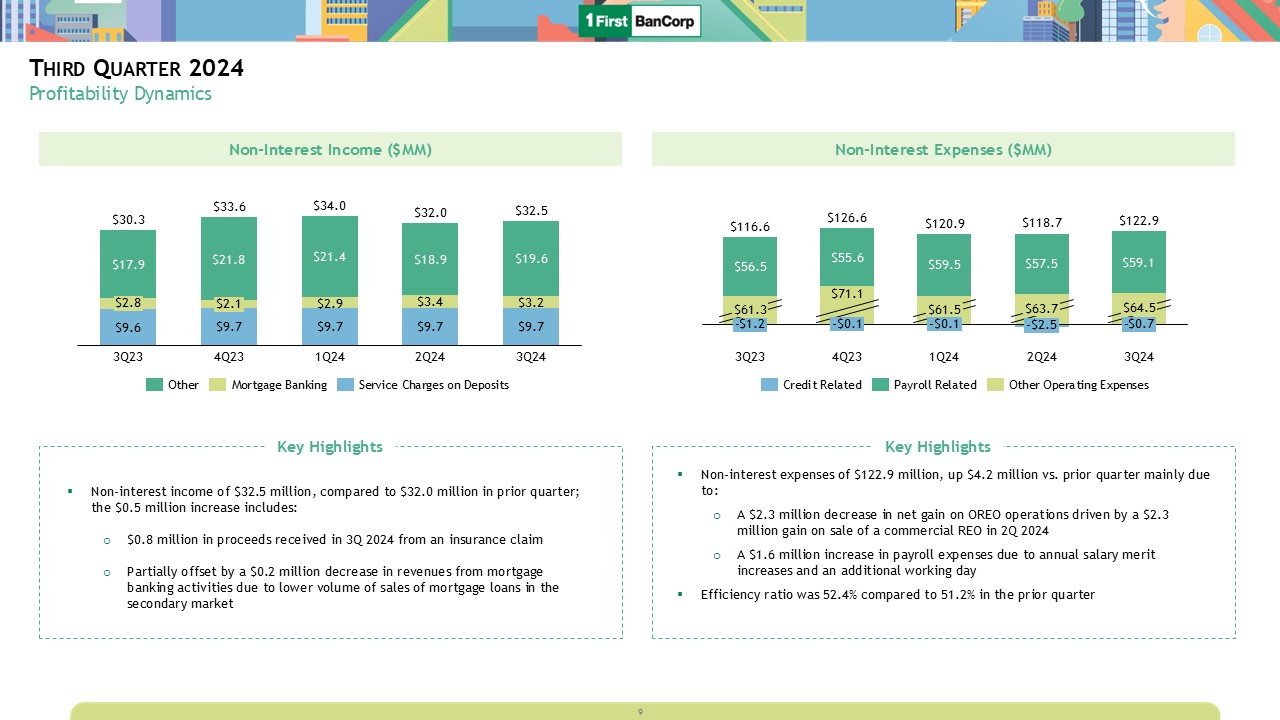
Non-interest income increased by $0.5 million to $32.5 million for the third quarter of 2024, compared to $32.0 million for the second quarter of 2024, mainly due to:
| • |
A $0.3 million increase in other non-interest income driven by $0.8 million in insurance proceeds received in the third quarter of 2024 related to a 2020 outstanding insurance claim, partially offset by a $0.6 million decrease
related to lower realized gains from purchased income tax credits.
|
| • |
A $0.2 million increase in card and processing income, mainly in merchant-related referral fees and interchange income due to higher transactional volumes.
|
| • |
A $0.2 million increase in insurance commission income.
|
Partially offset by:
| • |
A $0.2 million decrease in revenues from mortgage banking activities driven by a lower volume of sales of residential mortgage loans in the secondary market. During the third and second quarters of 2024, Government National
Mortgage Association (“GNMA”) securitization transactions and whole loan sales to U.S. government-sponsored enterprises amounted to $38.2 million and $43.5 million, respectively.
|
First BanCorp. Announces Earnings for the Quarter Ended September 30, 2024 – Page 4 of 27
NON-INTEREST EXPENSES
The following table sets forth information concerning non-interest expenses for the last five quarters:
|
Quarter Ended
|
||||||||||||||||||||
|
September 30, 2024
|
June 30, 2024
|
March 31, 2024
|
December 31, 2023
|
September 30, 2023
|
||||||||||||||||
|
(In thousands)
|
||||||||||||||||||||
|
Employees' compensation and benefits
|
$
|
59,081
|
$
|
57,456
|
$
|
59,506
|
$
|
55,584
|
$
|
56,535
|
||||||||||
|
Occupancy and equipment
|
22,424
|
21,851
|
21,381
|
21,847
|
21,781
|
|||||||||||||||
|
Business promotion
|
4,116
|
4,359
|
3,842
|
6,725
|
4,759
|
|||||||||||||||
|
Professional service fees:
|
||||||||||||||||||||
|
Collections, appraisals and other credit-related fees
|
688
|
1,149
|
1,366
|
952
|
930
|
|||||||||||||||
|
Outsourcing technology services
|
7,771
|
7,698
|
7,469
|
7,003
|
7,261
|
|||||||||||||||
|
Other professional fees
|
4,079
|
3,584
|
3,841
|
3,295
|
2,831
|
|||||||||||||||
|
Taxes, other than income taxes
|
5,665
|
5,408
|
5,129
|
5,535
|
5,465
|
|||||||||||||||
|
FDIC deposit insurance
|
2,164
|
2,316
|
3,102
|
8,454
|
2,143
|
|||||||||||||||
|
Other insurance and supervisory fees
|
2,092
|
2,287
|
2,293
|
2,308
|
2,356
|
|||||||||||||||
|
Net gain on OREO operations
|
(1,339
|
)
|
(3,609
|
)
|
(1,452
|
)
|
(1,005
|
)
|
(2,153
|
)
|
||||||||||
|
Credit and debit card processing expenses
|
7,095
|
7,607
|
5,751
|
7,360
|
6,779
|
|||||||||||||||
|
Communications
|
2,170
|
2,261
|
2,097
|
2,134
|
2,219
|
|||||||||||||||
|
Other non-interest expenses
|
6,929
|
6,315
|
6,598
|
6,413
|
5,732
|
|||||||||||||||
|
Total non-interest expenses
|
$
|
122,935
|
$
|
118,682
|
$
|
120,923
|
$
|
126,605
|
$
|
116,638
|
||||||||||
Non-interest expenses amounted to $122.9 million in the third quarter of 2024, an increase of $4.2 million, from $118.7 million in the second quarter of 2024. Non-interest expenses
for the second quarter of 2024 include a $0.2 million charge related to an adjustment to the Federal Deposit Insurance Corporation (“FDIC”) special assessment expense. Refer to Non-GAAP
Disclosures - Special Items for additional information. On a non-GAAP basis, excluding the effect of this Special Item (as defined below in Non-GAAP
Disclosures - Special Items), adjusted non-interest expenses increased by $4.4 million mainly due to:
| • |
A $2.3 million decrease in net gain on OREO operations, driven by the aforementioned $2.3 million realized gain on the sale of a commercial real estate OREO property in the Puerto Rico region in the second quarter of 2024.
|
| • |
A $1.6 million increase in employees’ compensation and benefits expense, driven by annual salary merit increases and an additional working day in the third quarter of 2024, partially offset by a
decrease in payroll taxes due to employees reaching maximum taxable amounts.
|
| • |
A $0.6 million increase in other non-interest expenses, mainly due to higher charges for operational and fraud losses, partially offset by a decrease in amortization of intangible assets.
|
| • |
A $0.6 million increase in occupancy and equipment expenses, including a $0.1 million increase in rent expense related to a branch which is expected to close during the fourth quarter of 2024.
|
Partially offset by:
| • |
A $0.5 million decrease in credit and debit card processing expenses, mainly due to higher reimbursements from credit card networks compared to the second quarter of 2024.
|
INCOME TAXES
The Corporation recorded an income tax expense of $22.7 million for the third quarter of 2024, compared to $25.5 million for the second quarter of 2024, mainly due to lower pre-tax income and a $0.4 million
tax contingency accrual release in connection with the expiration of the statute of limitation on some uncertain tax positions.
The Corporation’s estimated annual effective tax rate, excluding entities with pre-tax losses from which a tax benefit cannot be recognized and discrete items, was 23.7% for the third quarter of 2024,
compared to 24.1% for the second quarter of 2024. As of September 30, 2024, the Corporation had a deferred tax asset of $137.5 million, net of a valuation allowance of $121.6 million against the deferred tax assets.
First BanCorp. Announces Earnings for the Quarter Ended September 30, 2024 – Page 5 of 27
CREDIT QUALITY
Non-Performing Assets
The following table sets forth information concerning non-performing assets for the last five quarters:
|
(Dollars in thousands)
|
September 30, 2024
|
June 30, 2024
|
March 31, 2024
|
December 31, 2023
|
September 30, 2023
|
|||||||||||||||
|
Nonaccrual loans held for investment:
|
||||||||||||||||||||
|
Residential mortgage
|
$
|
31,729
|
$
|
31,396
|
$
|
32,685
|
$
|
32,239
|
$
|
31,946
|
||||||||||
|
Construction
|
4,651
|
4,742
|
1,498
|
1,569
|
1,640
|
|||||||||||||||
|
Commercial mortgage
|
11,496
|
11,736
|
11,976
|
12,205
|
21,632
|
|||||||||||||||
|
C&I
|
18,362
|
27,661
|
25,067
|
15,250
|
18,809
|
|||||||||||||||
|
Consumer and finance leases
|
23,106
|
20,638
|
21,739
|
22,444
|
19,137
|
|||||||||||||||
|
Total nonaccrual loans held for investment
|
$
|
89,344
|
$
|
96,173
|
$
|
92,965
|
$
|
83,707
|
$
|
93,164
|
||||||||||
|
OREO
|
19,330
|
21,682
|
28,864
|
32,669
|
28,563
|
|||||||||||||||
|
Other repossessed property
|
8,844
|
7,513
|
6,226
|
8,115
|
7,063
|
|||||||||||||||
|
Other assets (1)
|
1,567
|
1,532
|
1,551
|
1,415
|
1,448
|
|||||||||||||||
|
Total non-performing assets (2)
|
$
|
119,085
|
$
|
126,900
|
$
|
129,606
|
$
|
125,906
|
$
|
130,238
|
||||||||||
|
Past due loans 90 days and still accruing (3)
|
$
|
43,610
|
$
|
47,173
|
$
|
57,515
|
$
|
59,452
|
$
|
62,892
|
||||||||||
|
Nonaccrual loans held for investment to total loans held for investment
|
0.72
|
%
|
0.78
|
%
|
0.76
|
%
|
0.69
|
%
|
0.78
|
%
|
||||||||||
|
Nonaccrual loans to total loans
|
0.72
|
%
|
0.78
|
%
|
0.75
|
%
|
0.69
|
%
|
0.78
|
%
|
||||||||||
|
Non-performing assets to total assets
|
0.63
|
%
|
0.67
|
%
|
0.69
|
%
|
0.67
|
%
|
0.70
|
%
|
||||||||||
| (1) |
Residential pass-through mortgage-backed securities (“MBS”) issued by the Puerto Rico Housing Finance Authority (“PRHFA”) held as part of the available-for-sale debt securities portfolio.
|
| (2) |
Excludes purchased-credit deteriorated (“PCD”) loans previously accounted for under Accounting Standards Codification (“ASC”) Subtopic 310-30 for which the Corporation made the accounting policy election
of maintaining pools of loans as “units of account” both at the time of adoption of current expected credit losses (“CECL”) on January 1, 2020 and on an ongoing basis for credit loss measurement. These loans will continue to be excluded
from nonaccrual loan statistics as long as the Corporation can reasonably estimate the timing and amount of cash flows expected to be collected on the loan pools. The portion of such loans contractually past due 90 days or more amounted
to $6.5 million as of September 30, 2024 (June 30, 2024- $7.4 million; March 31, 2024 - $8.6 million; December 31, 2023 - $8.3 million; September 30, 2023 - $8.9 million).
|
| (3) |
These include rebooked loans, which were previously pooled into GNMA securities, amounting to $6.6 million as of September 30, 2024 (June 30, 2024- $6.8 million; March 31, 2024 - $8.8 million; December
31, 2023 - $7.9 million; September 30, 2023 - $8.5 million). Under the GNMA program, the Corporation has the option but not the obligation to repurchase loans that meet GNMA’s specified delinquency criteria. For accounting purposes, the
loans subject to the repurchase option are required to be reflected on the financial statements with an offsetting liability.
|
Variances in credit quality metrics:
| • |
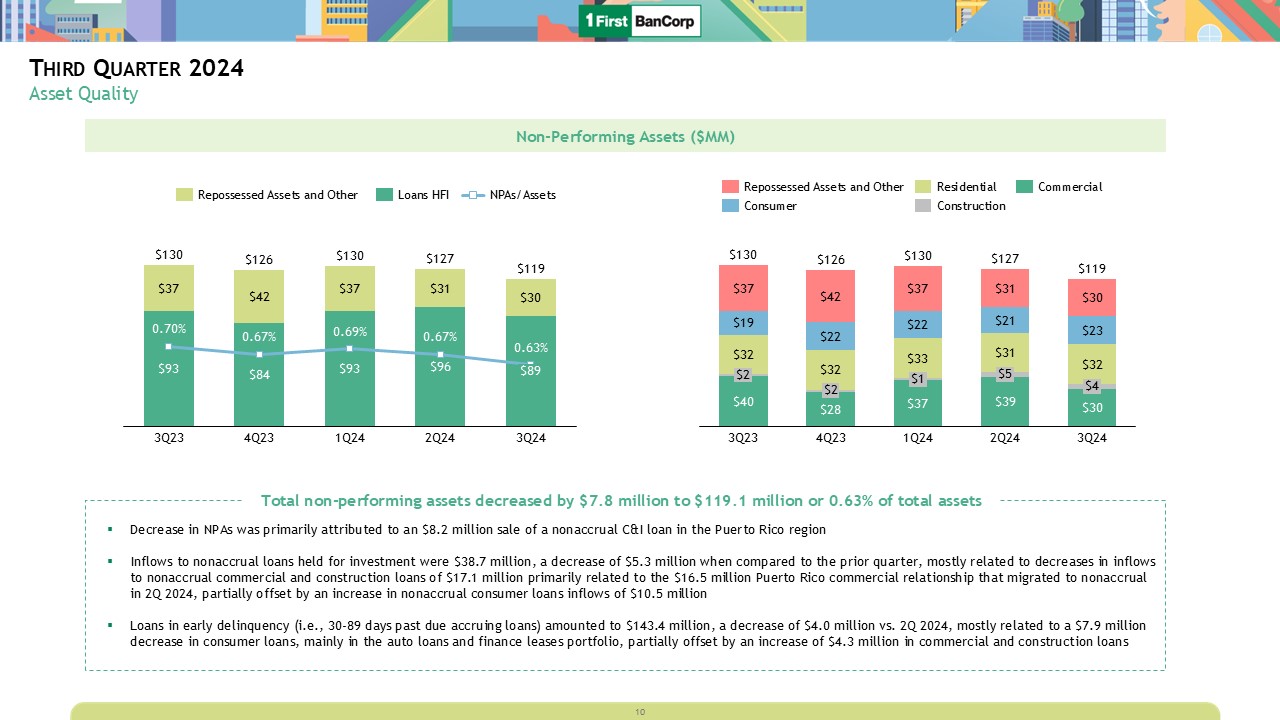
Total non-performing assets decreased by $7.8 million to $119.1 million as of September 30, 2024, compared to $126.9 million as of June 30, 2024. Total
nonaccrual loans held for investment decreased by $6.9 million to $89.3 million as of September 30, 2024, compared to $96.2 million as of June 30, 2024.
|
The decrease in non-performing assets was driven by:
| - |
A $9.6 million decrease in nonaccrual commercial and construction loans, mainly associated with the sale of an $8.2 million nonaccrual C&I loan in the Puerto Rico region. The sale resulted in a $1.2 million charge-off that had
been previously reserved.
|
| - |
A $2.3 million decrease in the OREO portfolio balance, mainly attributable to the sale of residential properties in the Puerto Rico region.
|
Partially offset by:
| - |
A $2.5 million increase in nonaccrual consumer loans, consisting mainly of auto loans.
|
| - |
A $1.3 million increase in other repossessed property, consisting of repossessed automobiles.
|
| - |
A $0.3 million increase in nonaccrual residential mortgage loans.
|
First BanCorp. Announces Earnings for the Quarter Ended September 30, 2024 – Page 6 of 27
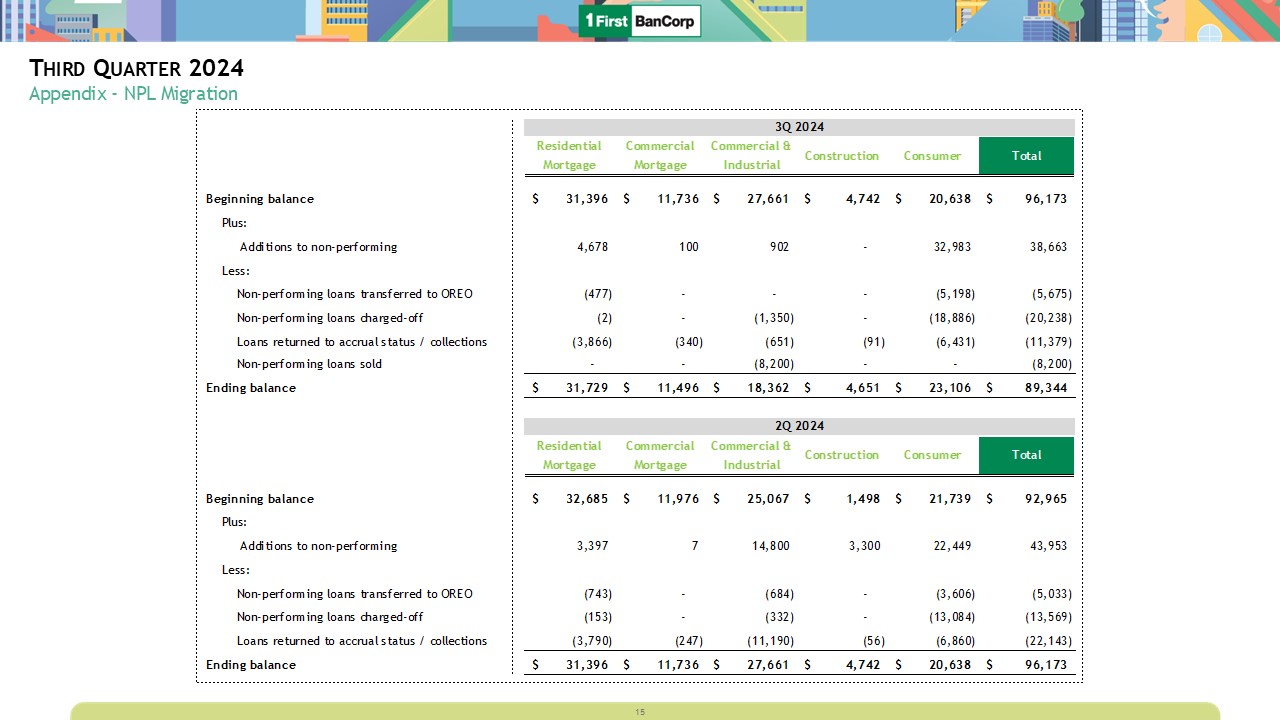
| • |
Inflows to nonaccrual loans held for investment were $38.7 million in the third quarter of 2024, a decrease of $5.3 million, when compared to the second quarter of 2024. Inflows to nonaccrual commercial and construction loans were
$1.0 million in the third quarter of 2024, a decrease of $17.1 million when compared to the second quarter of 2024, related to the inflow in the second quarter of a $16.5 million commercial relationship in the Puerto Rico region.
Inflows to nonaccrual consumer loans were $33.0 million in the third quarter of 2024, an increase of $10.5 million compared to inflows of $22.5 million in the second quarter of 2024. Inflows to nonaccrual residential mortgage loans
were $4.7 million in the third quarter of 2024, an increase of $1.3 million compared to inflows of $3.4 million in the second quarter of 2024. See Early Delinquency below for additional
information.
|
| • |
Adversely classified commercial and construction loans decreased by $9.1 million to $77.7 million as of September 30, 2024, also driven by the sale and charge-off of the aforementioned
nonaccrual C&I loan.
|
Early Delinquency
Total loans held for investment in early delinquency (i.e., 30-89 days past due accruing loans, as defined in regulatory reporting instructions) amounted to $143.4 million as of September 30, 2024, a decrease
of $4.0 million, compared to $147.4 million as of June 30, 2024. The variances by major portfolio are as follows:
| • |
Consumer loans in early delinquency decreased by $7.9 million to $103.9 million, mainly in the auto loans and finance leases portfolios.
|
| • |
Residential mortgage loans in early delinquency decreased by $0.4 million to $31.9 million.
|
Partially offset by:
| • |
Commercial and construction loans in early delinquency increased by $4.3 million to $7.6 million, mainly due to a C&I loan in the Florida region that matured and is in the process of renewal but for which the Corporation
continued to receive interest and principal payments from the borrower.
|
First BanCorp. Announces Earnings for the Quarter Ended September 30, 2024 – Page 7 of 27
Allowance for Credit Losses
The following table summarizes the activity of the ACL for on-balance sheet and off-balance sheet exposures during the third and second quarters of 2024:
|
Quarter Ended September 30, 2024
|
||||||||||||||||||||||||||||||||
|
Loans and Finance Leases
|
Debt Securities
|
|||||||||||||||||||||||||||||||
|
(Dollars in thousands)
|
Residential
Mortgage
Loans
|
Commercial
and
Construction
Loans
|
Consumer
Loans and
Finance
Leases
|
Total Loans
and Finance
Leases
|
Unfunded
Loans
Commitments
|
Held-to-
Maturity
|
Available-
for-Sale
|
Total ACL
|
||||||||||||||||||||||||
|
Allowance for Credit Losses
|
||||||||||||||||||||||||||||||||
|
Allowance for credit losses, beginning balance
|
$
|
46,051
|
$
|
70,172
|
$
|
138,309
|
$
|
254,532
|
$
|
4,502
|
$
|
1,267
|
$
|
549
|
$
|
260,850
|
||||||||||||||||
|
Provision for credit losses - (benefit) expense
|
(5,476
|
)
|
(6,435
|
)
|
28,381
|
16,470
|
(1,041
|
)
|
(148
|
)
|
(36
|
)
|
15,245
|
|||||||||||||||||||
|
Net recoveries (charge-offs)
|
76
|
(1,088
|
)
|
(22,994
|
)
|
(24,006
|
)
|
-
|
-
|
13
|
(23,993
|
)
|
||||||||||||||||||||
|
Allowance for credit losses, end of period
|
$
|
40,651
|
$
|
62,649
|
$
|
143,696
|
$
|
246,996
|
$
|
3,461
|
$
|
1,119
|
$
|
526
|
$
|
252,102
|
||||||||||||||||
|
Amortized cost of loans and finance leases
|
$
|
2,820,147
|
$
|
5,884,535
|
$
|
3,741,342
|
$
|
12,446,024
|
||||||||||||||||||||||||
|
Allowance for credit losses on loans to amortized cost
|
1.44
|
%
|
1.06
|
%
|
3.84
|
%
|
1.98
|
%
|
||||||||||||||||||||||||
|
Quarter Ended June 30, 2024
|
||||||||||||||||||||||||||||||||
|
Loans and Finance Leases
|
Debt Securities
|
|||||||||||||||||||||||||||||||
|
(Dollars in thousands)
|
Residential
Mortgage
Loans
|
Commercial
and
Construction
Loans
|
Consumer
Loans and
Finance
Leases
|
Total Loans
and Finance
Leases
|
Unfunded
Loans
Commitments
|
Held-to-
Maturity
|
Available-
for-Sale
|
Total ACL
|
||||||||||||||||||||||||
|
Allowance for Credit Losses
|
||||||||||||||||||||||||||||||||
|
Allowance for credit losses, beginning balance
|
$
|
56,689
|
$
|
73,337
|
$
|
133,566
|
$
|
263,592
|
$
|
4,919
|
$
|
1,235
|
$
|
442
|
$
|
270,188
|
||||||||||||||||
|
Provision for credit losses - (benefit) expense
|
(10,593
|
)
|
(4,198
|
)
|
26,721
|
11,930
|
(417
|
)
|
32
|
60
|
11,605
|
|||||||||||||||||||||
|
Net (charge-offs) recoveries
|
(45
|
)
|
1,033
|
(21,978
|
)
|
(20,990
|
)
|
-
|
-
|
47
|
(20,943
|
)
|
||||||||||||||||||||
|
Allowance for credit losses, end of period
|
$
|
46,051
|
$
|
70,172
|
$
|
138,309
|
$
|
254,532
|
$
|
4,502
|
$
|
1,267
|
$
|
549
|
$
|
260,850
|
||||||||||||||||
|
Amortized cost of loans and finance leases
|
$
|
2,809,666
|
$
|
5,863,843
|
$
|
3,711,999
|
$
|
12,385,508
|
||||||||||||||||||||||||
|
Allowance for credit losses on loans to amortized cost
|
1.64
|
%
|
1.20
|
%
|
3.73
|
%
|
2.06
|
%
|
||||||||||||||||||||||||
Allowance for Credit Losses for Loans and Finance Leases
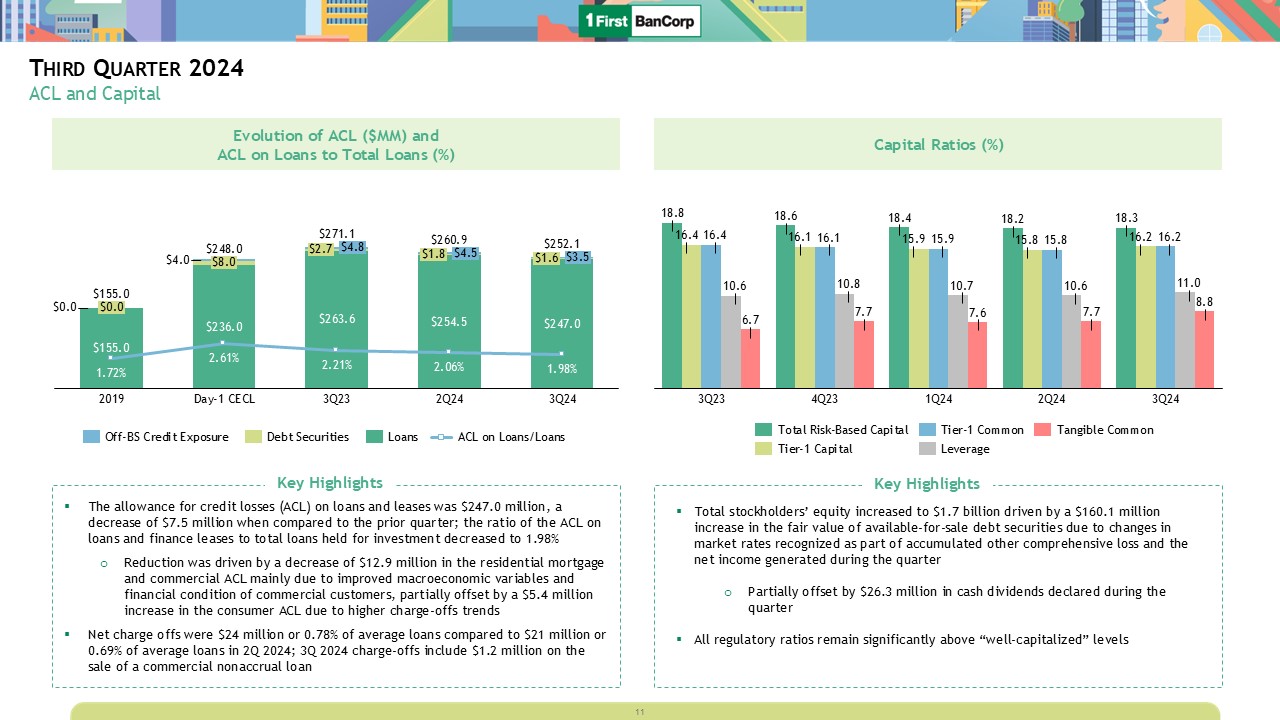
As of September 30, 2024, the ACL for loans and finance leases was $247.0 million, a decrease of $7.5 million, from $254.5 million as of June 30, 2024. The
decrease was mainly related to the ACL for commercial and construction loans, which decreased by $7.5 million, mainly due to releases associated with the improved
financial condition of certain commercial borrowers and the improvement in the forecasted CRE price index, as well as the effect of the aforementioned $1.2 million charge-off recorded on the sale of a nonaccrual C&I loan that had been
previously reserved. The ACL for residential mortgage loans decreased by $5.4 million, driven by updated macroeconomic variables, mainly in the long-term projection of the unemployment rate in the Puerto Rico region. Meanwhile, the ACL
for consumer loans increased by $5.4 million, driven by higher charge-off levels and loan portfolio
growth.
The provision for credit losses on loans and finance leases was $16.5 million for the third quarter of 2024, compared to $11.9 million in the second quarter of 2024, as detailed below:
| • |
Provision for credit losses for the residential mortgage loan portfolio was a net benefit of $5.5 million for the third quarter of 2024, compared to a net benefit of $10.6 million for the second quarter of 2024. The net benefit
recorded during the third quarter of 2024 was driven by the aforementioned changes in macroeconomic variables. Meanwhile, the net benefit recorded during the second quarter of 2024 was driven by updated historical loss experience used
for determining the ACL estimate resulting in a downward revision of estimated loss severities and lower required reserve levels.
|
| • |
Provision for credit losses for the consumer loan and finance lease portfolios was an expense of $28.4 million for the third quarter of 2024, compared to an expense of $26.7 million for the second quarter of 2024. The increase in
provision expense was driven by higher charge-off levels in these portfolios.
|
| • |
Provision for credit losses for the commercial and construction loan portfolios was a net benefit of $6.4 million for the third quarter of 2024, compared to a net benefit of $4.2 million for the second quarter of 2024. The increase
in net benefit during the third quarter of 2024 was driven by the aforementioned improvement in the financial condition of certain commercial borrowers, and, to a lesser extent, an improvement in the forecasted CRE price index.
|
The ratio of the ACL for loans and finance leases to total loans held for investment was 1.98% as of September 30, 2024, compared to 2.06% as of June 30, 2024. The ratio of the total ACL for loans and finance
leases to nonaccrual loans held for investment was 276.46% as of September 30, 2024, compared to 264.66% as of June 30, 2024.
First BanCorp. Announces Earnings for the Quarter Ended September 30, 2024 – Page 8 of 27
Net Charge-Offs
The following table presents ratios of annualized net (recoveries) charge-offs to average loans held-in-portfolio for the last five quarters:
|
Quarter Ended
|
||||||||||||||||||||||
|
September 30, 2024
|
June 30, 2024
|
March 31, 2024
|
December 31, 2023
|
September 30, 2023
|
||||||||||||||||||
|
Residential mortgage
|
-0.01
|
%
|
0.01
|
%
|
0.03
|
%
|
-0.04
|
%
|
-0.01
|
%
|
||||||||||||
|
Construction
|
-0.02
|
%
|
-0.02
|
%
|
-0.02
|
%
|
0.01
|
%
|
-3.18
|
%
|
||||||||||||
|
Commercial mortgage
|
-0.01
|
%
|
-0.07
|
%
|
-0.01
|
%
|
0.09
|
%
|
-0.01
|
%
|
||||||||||||
|
Commercial and Industrial
|
0.14
|
%
|
-0.08
|
%
|
-0.59
|
%
|
0.00
|
%
|
-0.02
|
%
|
||||||||||||
|
Consumer loans and finance leases
|
2.47
|
%
|
2.38
|
%
|
1.70
|
%
|
(1) |
|
2.26
|
%
|
1.79
|
%
|
||||||||||
|
Total loans
|
0.78
|
%
|
0.69
|
%
|
0.37
|
%
|
(1) |
|
0.69
|
%
|
0.48
|
%
|
||||||||||
| (1) |
The $9.5 million recovery associated with the bulk sale of fully charged-off consumer loans during the first quarter of 2024 reduced the consumer loans and finance leases and total net charge-offs to
related average loans ratio for the quarter ended March 31, 2024 by 104 basis points and 31 basis points, respectively.
|
The ratios above are based on annualized net charge-offs and are not necessarily indicative of the results expected in subsequent periods.
Net charge-offs were $24.0 million for the third quarter of 2024, or an annualized 0.78% of average loans, compared to $21.0 million, or an annualized 0.69% of average loans, in the second quarter of 2024. The
$3.0 million increase in net charge-offs was driven by the aforementioned $1.2 million charge-off recorded on the sale of a nonaccrual C&I loan in the third quarter of 2024; $1.2 million in recoveries recorded on two commercial loans in
the Florida region during the second quarter of 2024; and a $1.0 million increase in net charge-offs in consumer loans and finance leases.
Allowance for Credit Losses for Unfunded Loan Commitments
As of September 30, 2024, the ACL for off-balance sheet credit exposures decreased to $3.5 million, compared to $4.5 million as of June 30, 2024, driven by an improvement on the economic outlook of certain
macroeconomic variables, particularly in variables associated with the CRE price index.
Allowance for Credit Losses for Debt Securities
As of September 30, 2024, the ACL for debt securities was $1.6 million, of which $1.1 million related to Puerto Rico municipal bonds classified as held-to-maturity, compared to $1.8 million and $1.3 million,
respectively, as of June 30, 2024.
First BanCorp. Announces Earnings for the Quarter Ended September 30, 2024 – Page 9 of 27
STATEMENT OF FINANCIAL CONDITION
Total assets were approximately $18.9 billion as of September 30, 2024, down $22.2 million from June 30, 2024.
The following variances within the main components of total assets are noted:
| • |
A $99.1 million increase in cash and cash equivalents, mainly related to net cash inflows from the investment securities portfolio, partially offset by repayments of brokered CDs, the redemption of $50.0 million in outstanding
trust-preferred securities (“TruPS”) and loan growth funding. The redemption of TruPS was aligned with the Corporation’s plan for optimization of its capital structure while reducing financing costs.
|
| • |
An $82.3 million decrease in investment securities, driven by maturities of $140.8 million and principal repayments of $117.3 million, which include repayments of $101.7 million of U.S. agencies MBS and debentures and $15.6 million
of municipal bonds, partially offset by a $160.1 million increase in the fair value of available-for-sale debt securities attributable to changes in market interest rates and $16.1 million in purchases of Community Reinvestment Act
qualified debt securities during the third quarter of 2024.
|
| • |
A $62.8 million increase in total loans. The growth consisted of increases of $65.3 million in the Puerto Rico region and $47.5 million in the Florida region, partially offset by a $50.0 million decrease in the Virgin Islands
region. On a portfolio basis, the variance consisted of increases of $29.4 million in consumer loans, primarily auto loans and finance leases in the Puerto Rico region, $20.7 million in commercial and construction loans, and $12.7
million in residential mortgage loans. The increase in commercial and construction loans was mainly related to growth in the Florida and Puerto Rico regions of approximately $40.8 million and $29.1 million, respectively, partially
offset by a $49.2 million decrease in the Virgin Islands region. The increase is net of multiple repayments, including a $54.8 million repayment of a government line of credit in the Virgin Islands region, a $36.3 million repayment of
a commercial loan in the Puerto Rico region, and $31.0 million in repayments prior to maturity of three commercial loans in the Florida region.
|
Total loan originations, including refinancings, renewals, and draws from existing commitments (excluding credit card utilization activity), amounted to $1.2 billion in the third quarter of
2024, an increase of $43.1 million compared to the second quarter of 2024.
Total loan originations in the Puerto Rico region amounted to $902.2 million in the third quarter of 2024, compared to $840.5 million in the second quarter of 2024. The $61.7 million increase in total loan originations was mainly in commercial and construction loans, driven by five C&I originations totaling $107.1 million, each in excess of $10 million, partially offset by decreases
in commercial mortgage and construction loan originations.
Total loan originations in the Virgin Islands region amounted to $34.7 million in the third quarter of 2024, compared to $20.8 million in the second quarter of 2024. The $13.9 million
increase in total loan originations was mainly in commercial and construction loans.
Total loan originations in the Florida region amounted to $248.4 million in the third quarter of 2024, compared to $280.9 million in the second quarter of 2024. The $32.5 million decline in
total loan originations consisted of decreases of $23.0 million in commercial and construction loans, mainly in C&I loans; $7.0 million in residential mortgage loans; and $2.5 million in consumer loans.
| • |
An $87.3 million decrease in other assets, in part due to the settlement in the third quarter of 2024 of certain receivables associated with amounts in transit related to customer payments and prepaid assets.
|
First BanCorp. Announces Earnings for the Quarter Ended September 30, 2024 – Page 10 of 27
Total liabilities were approximately $17.2 billion as of September 30, 2024, a decrease of $231.6 million from June 30, 2024.
| • |
Total deposits decreased $181.6 million consisting of:
|
| o |
A $104.7 million decrease in brokered CDs, mainly in the Puerto Rico region. The decline reflects maturing short-term brokered CDs amounting to $170.2 million with an all-in cost of 5.38% that were paid off during the third quarter
of 2024, partially offset by $65.5 million of new issuances with original average maturities of approximately 1 year and an all-in cost of 4.86%.
|
| o |
A $40.1 million decrease in government deposits, which includes a decline of $47.9 million in the Virgin Islands region, partially offset by increases of $7.6 million in the Puerto Rico region
and $0.2 million in the Florida region.
|
| o |
A $36.8 million decrease in deposits, excluding brokered CDs and government deposits, reflecting decreases of $51.0 million in the Virgin Islands region and $31.5 million in the Puerto Rico region, partially offset by a $45.7
million increase in the Florida region. The decrease in such deposits includes a $96.9 million decrease in non-interest-bearing deposits, partially offset by a $35.9 million increase in time deposits.
|
| • |
A $50.0 million decrease in other borrowings related to the aforementioned redemption of outstanding TruPS issued by FBP Statutory Trust II.
|
Total stockholders’ equity amounted to $1.7 billion as of September 30, 2024, an increase of $209.4 million from June 30, 2024, driven by a $160.1 million increase in the fair value of available-for-sale debt securities due to changes in market interest rates recognized as part of accumulated other comprehensive loss and the net income generated in the
third quarter of 2024, partially offset by $26.3 million in common stock dividends declared in the third quarter of 2024.
As of September 30, 2024, capital ratios exceeded the required regulatory levels for bank holding companies and well-capitalized banks. The Corporation’s estimated CET1 capital, tier 1 capital, total capital
and leverage ratios under the Basel III rules were 16.18%, 16.18%, 18.25%, and 10.96%, respectively, as of September 30, 2024, compared to CET1 capital, tier 1 capital, total capital, and leverage ratios of 15.77%, 15.77%, 18.21%, and 10.63%,
respectively, as of June 30, 2024.
Meanwhile, estimated CET1 capital, tier 1 capital, total capital and leverage ratios of our banking subsidiary, FirstBank, were 16.00%, 16.76%, 18.01%, and 11.36%, respectively, as of September 30, 2024,
compared to CET1 capital, tier 1 capital, total capital and leverage ratios of 15.97%, 16.73%, 17.98%, and 11.29%, respectively, as of June 30, 2024.
LIQUIDITY
Cash and cash equivalents increased by $99.1 million to $685.4 million as of September 30, 2024. When adding $1.8 billion of free high-quality liquid securities that could be liquidated or pledged within one
day, total core liquidity amounted to $2.5 billion as of September 30, 2024, or 13.32% of total assets, compared to $2.5 billion, or 13.37% of total assets as of June 30, 2024. In addition, as of
September 30, 2024, the Corporation had $964.7 million available for credit with the FHLB based on the value of collateral pledged with the FHLB. As such, the basic liquidity ratio (which includes cash, free high-quality liquid assets such as
U.S. government and government-sponsored enterprises’ obligations that could be liquidated or pledged within one day, and available secured lines of credit with the FHLB to total assets) was approximately 18.43% as of September 30, 2024,
compared to 18.50% as of June 30, 2024.
In addition to the aforementioned available credit from the FHLB, the Corporation also maintains borrowing capacity at the FED Discount Window Program. The Corporation had approximately $2.6 billion available
for funding under the FED’s Borrower-In-Custody Program as of September 30, 2024. In the aggregate, as of September 30, 2024, the Corporation had $6.1 billion, or 131% of estimated uninsured deposits (excluding fully collateralized government
deposits), available to meet liquidity needs.
The Corporation’s total deposits, excluding brokered CDs, amounted to $15.8 billion as of September 30, 2024, compared to $15.9 billion
as of June 30, 2024, which includes $3.2 billion in government deposits that are fully collateralized as of each of September 30, 2024 and June
30, 2024. Excluding fully collateralized government deposits and FDIC-insured deposits, as of September 30, 2024, the estimated amount of uninsured deposits was $4.6 billion, which represents 29.25%
of total deposits, compared to $4.5 billion, or 28.46% of total deposits, as of June 30, 2024. Refer to Table 11 in the accompanying tables (Exhibit A) for additional information about the deposits composition.
First BanCorp. Announces Earnings for the Quarter Ended September 30, 2024 – Page 11 of 27
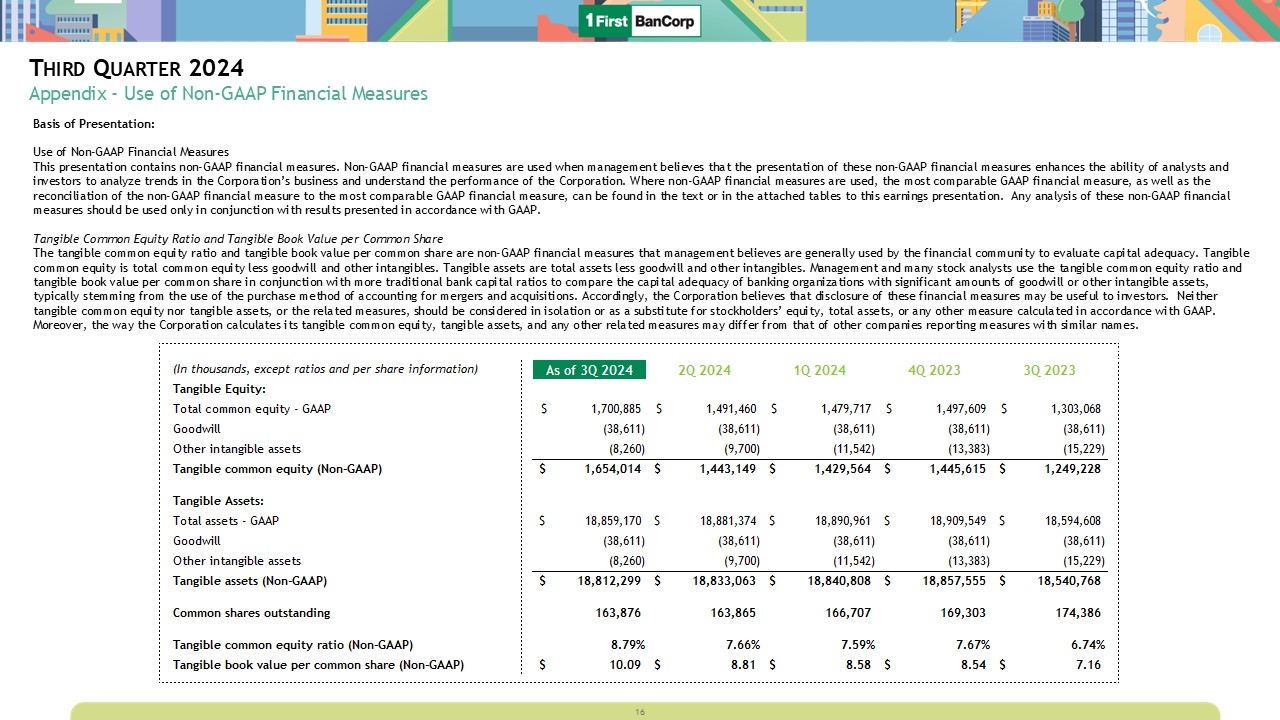
Tangible Common Equity (Non-GAAP)
On a non-GAAP basis, the Corporation’s tangible common equity ratio increased to 8.79% as of September 30, 2024, compared to 7.66% as of June 30, 2024, driven by the $160.1 million increase in the fair value of
available-for-sale debt securities. Refer to Non-GAAP Disclosures- Non-GAAP Financial Measures for the definition of and additional information about this non-GAAP financial measure.
The following table presents a reconciliation of the Corporation’s tangible common equity and tangible assets to the most comparable GAAP items as of the indicated dates:
|
September 30, 2024
|
June 30, 2024
|
March 31, 2024
|
December 31, 2023
|
September 30, 2023
|
||||||||||||||||
|
(In thousands, except ratios and per share information)
|
||||||||||||||||||||
|
Tangible Equity:
|
||||||||||||||||||||
|
Total common equity - GAAP
|
$
|
1,700,885
|
$
|
1,491,460
|
$
|
1,479,717
|
$
|
1,497,609
|
$
|
1,303,068
|
||||||||||
|
Goodwill
|
(38,611
|
)
|
(38,611
|
)
|
(38,611
|
)
|
(38,611
|
)
|
(38,611
|
)
|
||||||||||
|
Other intangible assets
|
(8,260
|
)
|
(9,700
|
)
|
(11,542
|
)
|
(13,383
|
)
|
(15,229
|
)
|
||||||||||
|
Tangible common equity - non-GAAP
|
$
|
1,654,014
|
$
|
1,443,149
|
$
|
1,429,564
|
$
|
1,445,615
|
$
|
1,249,228
|
||||||||||
|
Tangible Assets:
|
||||||||||||||||||||
|
Total assets - GAAP
|
$
|
18,859,170
|
$
|
18,881,374
|
$
|
18,890,961
|
$
|
18,909,549
|
$
|
18,594,608
|
||||||||||
|
Goodwill
|
(38,611
|
)
|
(38,611
|
)
|
(38,611
|
)
|
(38,611
|
)
|
(38,611
|
)
|
||||||||||
|
Other intangible assets
|
(8,260
|
)
|
(9,700
|
)
|
(11,542
|
)
|
(13,383
|
)
|
(15,229
|
)
|
||||||||||
|
Tangible assets - non-GAAP
|
$
|
18,812,299
|
$
|
18,833,063
|
$
|
18,840,808
|
$
|
18,857,555
|
$
|
18,540,768
|
||||||||||
|
Common shares outstanding
|
163,876
|
163,865
|
166,707
|
169,303
|
174,386
|
|||||||||||||||
|
|
||||||||||||||||||||
|
Tangible common equity ratio - non-GAAP
|
8.79
|
%
|
7.66
|
%
|
7.59
|
%
|
7.67
|
%
|
6.74
|
%
|
||||||||||
|
Tangible book value per common share - non-GAAP
|
$
|
10.09
|
$
|
8.81
|
$
|
8.58
|
$
|
8.54
|
$
|
7.16
|
||||||||||
First BanCorp. Announces Earnings for the Quarter Ended September 30, 2024 – Page 12 of 27
Exposure to Puerto Rico Government
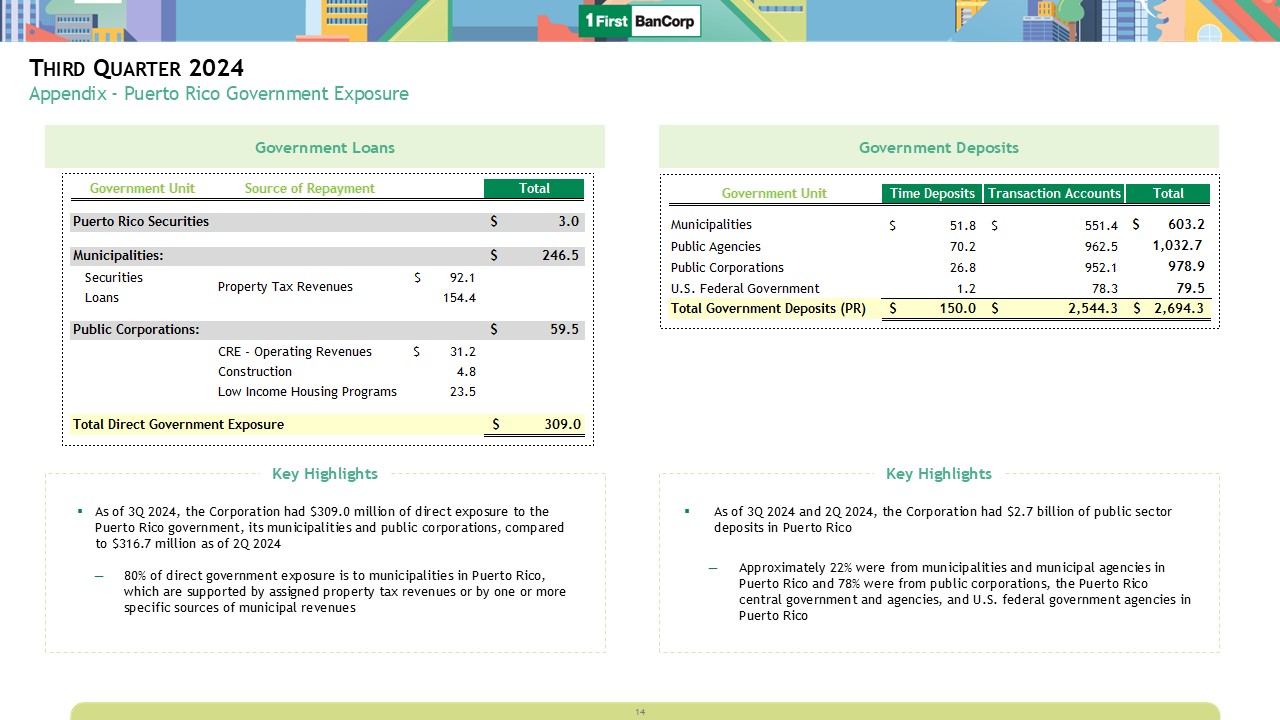
As of September 30, 2024, the Corporation had $309.0 million of direct exposure to the Puerto Rico government, its municipalities, and public corporations, a decrease of $7.7 million when compared to $316.7
million as of June 30, 2024, mainly due to multiple repayments. As of September 30, 2024, approximately $195.6 million of the exposure consisted of loans and obligations of municipalities in Puerto
Rico that are supported by assigned property tax revenues and for which, in most cases, the good faith, credit, and unlimited taxing power of the applicable municipality have been pledged to their repayment, and $50.9 million consisted of
loans and obligations which are supported by one or more specific sources of municipal revenues. The Corporation’s total direct exposure to the Puerto Rico government also included $8.8 million in a loan extended to an affiliate of the Puerto
Rico Electric Power Authority and $50.7 million in loans to agencies of Puerto Rico public corporations. In addition, the total direct exposure included an obligation of the Puerto Rico government, specifically a residential pass-through MBS
issued by the PRHFA, at an amortized cost of $3.0 million (fair value of $1.6 million as of September 30, 2024), included as part of the Corporation’s available-for-sale debt securities portfolio. This residential pass-through MBS issued by
the PRHFA is collateralized by certain second mortgages and had an unrealized loss of $1.4 million as of September 30, 2024, of which $0.3 million is due to credit deterioration.
The aforementioned exposure to municipalities in Puerto Rico included $92.1 million of financing arrangements with Puerto Rico municipalities that were issued in bond form but underwritten as loans with
features that are typically found in commercial loans. These bonds are accounted for as held-to-maturity debt securities.
As of each of September 30, 2024 and June 30, 2024, the Corporation had $2.7 billion of public sector deposits in Puerto Rico. Approximately 22% of the public sector deposits as of September 30, 2024 were from
municipalities and municipal agencies in Puerto Rico, and 78% were from public corporations, the Puerto Rico central government and agencies, and U.S. federal government agencies in Puerto Rico.
First BanCorp. Announces Earnings for the Quarter Ended September 30, 2024 – Page 13 of 27
NON-GAAP DISCLOSURES
This press release contains GAAP financial measures and non-GAAP financial measures. Non-GAAP financial measures are used when management believes that the presentation of these non-GAAP financial measures
enhances the ability of analysts and investors to analyze trends in the Corporation’s business and understand the performance of the Corporation. The Corporation may utilize these non-GAAP financial measures as guides in its budgeting and
long-term planning process. Where non-GAAP financial measures are used, the most comparable GAAP financial measure, as well as the reconciliation of the non-GAAP financial measure to the most comparable GAAP financial measure, can be found in
the text or in the tables in or attached to this press release. Any analysis of these non-GAAP financial measures should be used only in conjunction with results presented in accordance with GAAP.
Certain non-GAAP financial measures, such as adjusted net income and adjusted earnings per share, adjusted pre-tax, pre-provision income, and adjusted non-interest expenses
exclude the effect of items that management believes are not reflective of core operating performance (the “Special Items”). Other non-GAAP financial measures include adjusted net interest income and adjusted net interest income margin,
tangible common equity, tangible book value per common share, and certain capital ratios. These measures should be read in conjunction with the accompanying tables (Exhibit A), which are an integral part of this press release, and
the Corporation’s other financial information that is presented in accordance with GAAP.
Special Items
The financial results for the nine-month periods ended September 30, 2024 and 2023 included the following Special Items:
Quarter Ended June 30, 2024 and Nine-Month Period Ended September 30, 2024
FDIC Special Assessment Expense
Charges of $0.2 million ($0.1 million after-tax, calculated based on the statutory tax rate of 37.5%) and $1.1 million ($0.7 million after-tax, calculated based on the statutory tax rate of
37.5%) were recorded in the second quarter of 2024 and nine-month period ended September 30, 2024, respectively, to increase the initial estimated FDIC special assessment resulting from the FDIC’s updates related to the loss estimate in
connection with losses to the Deposit Insurance Fund associated with protecting uninsured deposits following the failures of certain financial institutions during the first half of 2023. The aforementioned charges increased the estimated FDIC
special assessment to a total of $7.4 million, which was the revised estimated loss reflected in the FDIC invoice for the first quarterly collection period with a payment date of June 28, 2024. The FDIC deposit special assessment is reflected
in the condensed consolidated statements of income as part of “FDIC deposit insurance” expenses.
Nine-Month Period Ended September 30, 2023
Gain Recognized from Legal Settlement
During the second quarter of 2023, the Corporation recognized a $3.6 million ($2.3 million after-tax, calculated based on the statutory tax rate of 37.5%) gain from a legal settlement reflected
in the condensed consolidated statements of income as part of other non-interest income.
Gain on Early Extinguishment of Debt
During the second quarter of 2023, the Corporation recognized a $1.6 million gain on the repurchase of $21.4 million in junior subordinated debentures reflected in the condensed consolidated
statements of income as “Gain on early extinguishment of debt.” The junior subordinated debentures are reflected in the condensed consolidated statements of financial condition as “Other borrowings.” The purchase price equated to 92.5% of the
$21.4 million par value. The 7.5% discount resulted in the gain of $1.6 million. The gain, realized at the holding company level, had no effect on the income tax expense in the second quarter of 2023.
First BanCorp. Announces Earnings for the Quarter Ended September 30, 2024 – Page 14 of 27
Non-GAAP Financial Measures
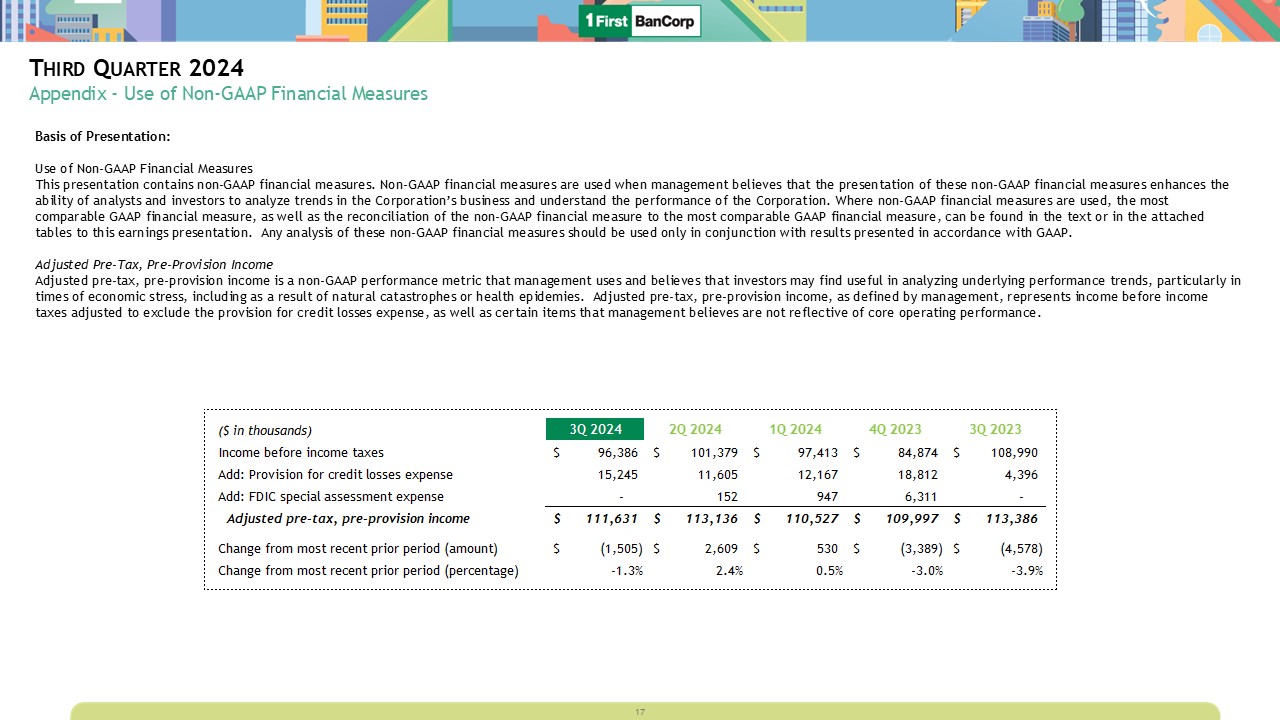
Adjusted Pre-Tax, Pre-Provision Income
Adjusted pre-tax, pre-provision income is a non-GAAP performance metric that management uses and believes that investors may find useful in analyzing underlying performance trends, particularly in times of
economic stress, including as a result of natural catastrophes or health epidemics. Adjusted pre-tax, pre-provision income, as defined by management, represents income before income taxes adjusted to exclude the provisions for credit losses
on loans, unfunded loan commitments and debt securities. In addition, from time to time, earnings are also adjusted for certain items that management believes are not reflective of core operating performance, which are regarded as Special
Items.
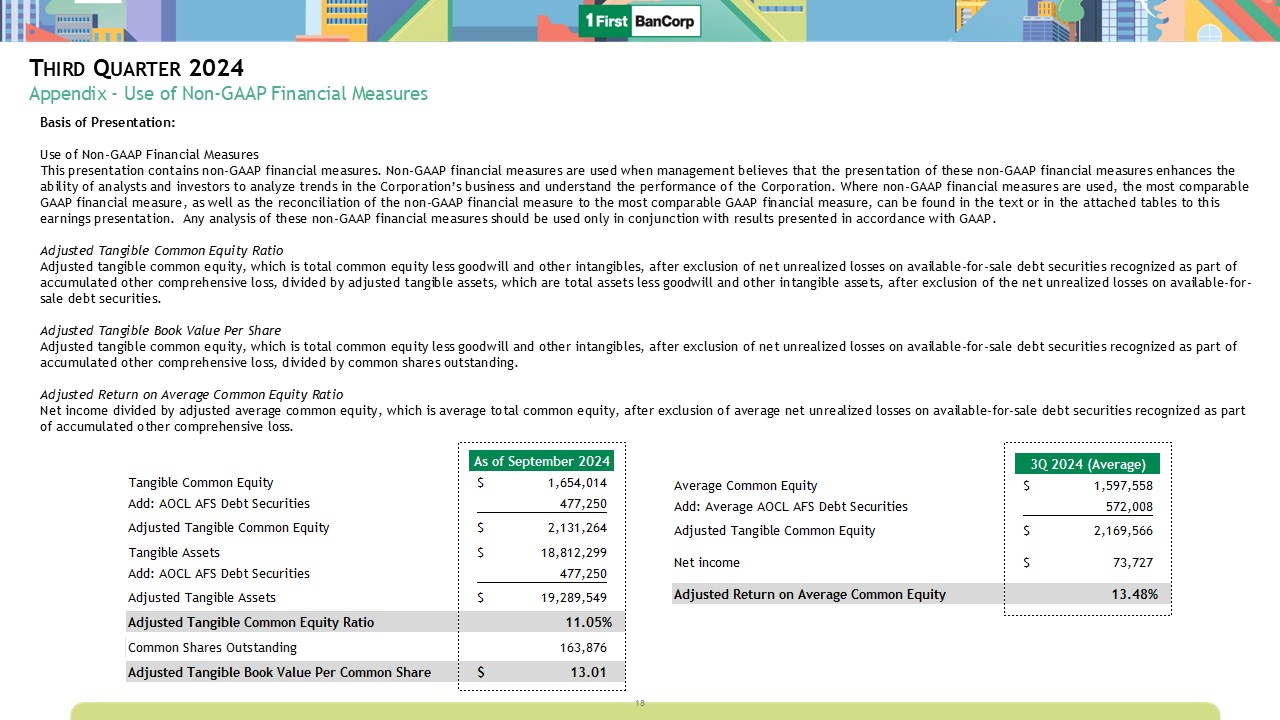
Tangible Common Equity Ratio and Tangible Book Value per Common Share
The tangible common equity ratio and tangible book value per common share are non-GAAP financial measures that management believes are generally used by the financial community to evaluate capital adequacy.
Tangible common equity is total common equity less goodwill and other intangible assets. Tangible assets are total assets less goodwill and other intangible assets. Tangible common equity ratio is tangible common equity divided by tangible
assets. Tangible book value per common share is tangible assets divided by common shares outstanding. Refer to Statement of Financial Condition - Tangible Common Equity (Non-GAAP) for a reconciliation
of the Corporation’s total stockholders’ equity and total assets in accordance with GAAP to the non-GAAP financial measures of tangible common equity and tangible assets, respectively. Management uses and believes that many stock analysts use
the tangible common equity ratio and tangible book value per common share in conjunction with other more traditional bank capital ratios to compare the capital adequacy of banking organizations with significant amounts of goodwill or other
intangible assets, typically stemming from the use of the purchase method of accounting for mergers and acquisitions. Accordingly, the Corporation believes that disclosure of these financial measures may be useful to investors. Neither
tangible common equity nor tangible assets, or the related measures, should be considered in isolation or as a substitute for stockholders’ equity, total assets, or any other measure calculated in accordance with GAAP. Moreover, the manner in
which the Corporation calculates its tangible common equity, tangible assets, and any other related measures may differ from that of other companies reporting measures with similar names.
Net Interest Income Excluding Valuations, and on a Tax-Equivalent Basis
Net interest income, interest rate spread, and net interest margin are reported excluding the changes in the fair value of derivative instruments and on a tax-equivalent basis in order to provide to investors
additional information about the Corporation’s net interest income that management uses and believes should facilitate comparability and analysis of the periods presented. The changes in the fair value of derivative instruments have no effect
on interest due or interest earned on interest-bearing liabilities or interest-earning assets, respectively. The tax-equivalent adjustment to net interest income recognizes the income tax savings when comparing taxable and tax-exempt assets
and assumes a marginal income tax rate. Income from tax-exempt earning assets is increased by an amount equivalent to the taxes that would have been paid if this income had been taxable at statutory rates. Refer to Table 4 in the accompanying
tables (Exhibit A) for a reconciliation of the Corporation’s net interest income to adjusted net interest income excluding valuations, and on a tax-equivalent basis. Management believes that it is a standard practice in the banking industry
to present net interest income, interest rate spread, and net interest margin on a fully tax-equivalent basis. This adjustment puts all earning assets, most notably tax-exempt securities and tax-exempt loans, on a common basis that management
believes facilitates comparison of results to the results of peers.
First BanCorp. Announces Earnings for the Quarter Ended September 30, 2024 – Page 15 of 27
NET INCOME AND RECONCILIATION TO ADJUSTED NET INCOME (NON-GAAP)
The following table shows, for the third quarters of 2024 and 2023, net income and earnings per diluted share, and reconciles, for the second quarter of 2024 and nine-month periods ended September 30, 2024 and
2023, net income to adjusted net income and adjusted earnings per diluted share, which are non-GAAP financial measures that exclude the significant Special Items discussed in the Non-GAAP Disclosures -
Special Items section.
|
Quarter Ended
|
Nine-Month Period Ended
|
|||||||||||||||||||
|
September 30, 2024
|
June 30, 2024
|
September 30, 2023
|
September 30, 2024
|
September 30, 2023
|
||||||||||||||||
|
(In thousands, except per share information)
|
||||||||||||||||||||
|
Net income, as reported (GAAP)
|
$
|
73,727
|
$
|
75,838
|
$
|
82,022
|
$
|
223,023
|
$
|
223,375
|
||||||||||
|
Adjustments:
|
||||||||||||||||||||
|
FDIC special assessment expense
|
-
|
152
|
-
|
1,099
|
-
|
|||||||||||||||
|
Gain recognized from legal settlement
|
-
|
-
|
-
|
-
|
(3,600
|
)
|
||||||||||||||
|
Gain on early extinguishment of debt
|
-
|
-
|
-
|
-
|
(1,605
|
)
|
||||||||||||||
|
Income tax impact of adjustments (1)
|
-
|
(57
|
)
|
-
|
(412
|
)
|
1,350
|
|||||||||||||
|
Adjusted net income attributable to common stockholders (non-GAAP)
|
$
|
73,727
|
$
|
75,933
|
$
|
82,022
|
$
|
223,710
|
$
|
219,520
|
||||||||||
|
Weighted-average diluted shares outstanding
|
163,872
|
165,543
|
176,962
|
165,730
|
179,144
|
|||||||||||||||
|
Earnings Per Share - diluted (GAAP)
|
$
|
0.45
|
$
|
0.46
|
$
|
0.46
|
$
|
1.35
|
$
|
1.25
|
||||||||||
|
Adjusted Earnings Per Share - diluted (non-GAAP)
|
$
|
0.45
|
$
|
0.46
|
$
|
0.46
|
$
|
1.35
|
$
|
1.23
|
||||||||||
| (1) |
See Non-GAAP Disclosures - Special Items above for discussion of the individual tax impact related to the above adjustments.
|
INCOME BEFORE INCOME TAXES AND RECONCILIATION TO ADJUSTED PRE-TAX, PRE-PROVISION INCOME (NON-GAAP)
The following table reconciles income before income taxes to adjusted pre-tax, pre-provision income for the last five quarters and for the nine-month periods ended September 30, 2024 and 2023:
|
Quarter Ended
|
Nine-Month Period Ended
|
|||||||||||||||||||||||||||
|
September 30, 2024
|
June 30, 2024
|
March 31, 2024
|
December 31, 2023
|
September 30, 2023
|
September 30, 2024
|
September 30, 2023
|
||||||||||||||||||||||
|
(Dollars in thousands)
|
||||||||||||||||||||||||||||
|
Income before income taxes
|
$
|
96,386
|
$
|
101,379
|
$
|
97,413
|
$
|
84,874
|
$
|
108,990
|
$
|
295,178
|
$
|
312,562
|
||||||||||||||
|
Add: Provision for credit losses expense
|
15,245
|
11,605
|
12,167
|
18,812
|
4,396
|
39,017
|
42,128
|
|||||||||||||||||||||
|
Add: FDIC special assessment expense
|
-
|
152
|
947
|
6,311
|
-
|
1,099
|
-
|
|||||||||||||||||||||
|
Less: Gain recognized from legal settlement
|
-
|
-
|
-
|
-
|
-
|
-
|
(3,600
|
)
|
||||||||||||||||||||
|
Less: Gain on early extinguishment of debt
|
-
|
-
|
-
|
-
|
-
|
-
|
(1,605
|
)
|
||||||||||||||||||||
|
Adjusted pre-tax, pre-provision income (1)
|
$
|
111,631
|
$
|
113,136
|
$
|
110,527
|
$
|
109,997
|
$
|
113,386
|
$
|
335,294
|
$
|
349,485
|
||||||||||||||
|
Change from most recent prior period (amount)
|
$
|
(1,505
|
)
|
$
|
2,609
|
$
|
530
|
$
|
(3,389
|
)
|
$
|
(4,578
|
)
|
$
|
(14,191
|
)
|
$
|
(3,553
|
)
|
|||||||||
|
Change from most recent prior period (percentage)
|
-1.3
|
%
|
2.4
|
%
|
0.5
|
%
|
-3.0
|
%
|
-3.9
|
%
|
-4.1
|
%
|
-1.0
|
%
|
||||||||||||||
| (1) |
Non-GAAP financial measure. See Non-GAAP Disclosures above for the definition and additional information about this non-GAAP financial measure.
|
Conference Call / Webcast Information
First BanCorp.’s senior management will host an earnings conference call and live webcast on Wednesday, October 23, 2024, at 10:00 a.m. (Eastern Time). The call may be accessed via a live Internet webcast
through the Corporation’s investor relations website, fbpinvestor.com, or through a dial-in telephone number at (833) 470-1428 or (404) 975-4839. The participant access code is
104808. The Corporation recommends that listeners go to the web site at least 15 minutes prior to the call to download and install any necessary software. Following the webcast presentation, a question and answer session will be made
available to research analysts and institutional investors. A replay of the webcast will be archived in the Corporation’s investor relations website, fbpinvestor.com, until October
23, 2025. A telephone replay will be available one hour after the end of the conference call through November 22, 2024, at (866) 813-9403. The replay access code is 131916.
First BanCorp. Announces Earnings for the Quarter Ended September 30, 2024 – Page 16 of 27
Safe Harbor
This press release may contain “forward-looking statements” concerning the Corporation’s future economic, operational, and financial performance. The words or
phrases “expect,” “anticipate,” “intend,” “should,” “would,” “will,” “plans,” “forecast,” “believe,” and similar expressions are meant to identify “forward-looking statements” within the meaning of Section 27A of the Securities Act of 1933, as
amended, and Section 21E of the Securities Exchange Act of 1934, as amended, and are subject to the safe harbor created by such sections. The Corporation cautions readers not to place undue reliance on any such forward-looking statements, which
speak only as of the date hereof, and advises readers that any such forward-looking statements are not guarantees of future performance and involve certain risks, uncertainties, estimates, and assumptions by us that are difficult to predict.
Various factors, some of which are beyond our control, including, but not limited to, the uncertainties more fully discussed in Part I, Item 1A, “Risk Factors” of the Corporation’s Annual Report on Form 10-K for the year ended December 31, 2023,
as updated in the Corporation’s subsequent Quarterly Reports on Form 10-Q, and the following, could cause actual results to differ materially from those expressed in, or implied by, such forward-looking statements: the effect of the current
global interest rate environment (including the potential for ongoing reductions in interest rates) and inflation levels on the level, composition and performance of the Corporation’s assets and liabilities, and corresponding effects on the
Corporation’s net interest income, net interest margin, loan originations, deposit attrition, overall results of operations, and liquidity position; the effects of changes in the interest rate environment, including any adverse change in the
Corporation’s ability to attract and retain clients and gain acceptance from current and prospective customers for new products and services, including those related to the offering of digital banking and financial services; volatility in the
financial services industry, including failures or rumored failures of other depository institutions, and actions taken by governmental agencies to stabilize the financial system, which could result in, among other things, bank deposit runoffs,
liquidity constraints, and increased regulatory requirements and costs; the effect of continued changes in the fiscal and monetary policies and regulations of the U.S. federal government, the Puerto Rico government and other governments,
including those determined by the Federal Reserve Board, the Federal Reserve Bank of New York, the FDIC, government-sponsored housing agencies and regulators in Puerto Rico, the U.S., and the U.S. and British Virgin Islands, that may affect the
future results of the Corporation; uncertainty as to the ability of FirstBank to retain its core deposits and generate sufficient cash flow through its wholesale funding sources, such as securities sold under agreements to repurchase, FHLB
advances, and brokered CDs, which may require us to sell investment securities at a loss; adverse changes in general political and economic conditions in Puerto Rico, the U.S., and the U.S. and British Virgin Islands, including in the interest
rate environment, unemployment rates, market liquidity, housing absorption rates, real estate markets, and U.S. capital markets, which may affect funding sources, loan portfolio performance and credit quality, market prices of investment
securities, and demand for the Corporation’s products and services, and which may reduce the Corporation’s revenues and earnings and the value of the Corporation’s assets; the impact of government
financial assistance for hurricane recovery and other disaster relief on economic activity in Puerto Rico, and the timing and pace of disbursements of funds earmarked for disaster relief; the
ability of the Corporation, FirstBank, and third-party service providers to identify and prevent cyber-security incidents, such as data security breaches, ransomware, malware, “denial of service” attacks, “hacking,” identity theft, and
state-sponsored cyberthreats, and the occurrence of and response to any incidents that occur, which may result in misuse or misappropriation of confidential or proprietary information, disruption, or damage to our systems or those of
third-party service providers on which we rely, increased costs and losses and/or adverse effects to our reputation; general competitive factors and other market risks as well as the implementation of existent or planned strategic growth
opportunities, including risks, uncertainties, and other factors or events related to any business acquisitions, dispositions, strategic partnerships, strategic operational investments, including systems conversions, and any anticipated
efficiencies or other expected results related thereto; uncertainty as to the implementation of the debt restructuring plan of Puerto Rico and the fiscal plan for Puerto Rico as certified on June 5,
2024, by the oversight board established by the Puerto Rico Oversight, Management, and Economic Stability Act, or any revisions to it, on our clients and loan portfolios, and any potential impact from future economic or political developments
and tax regulations in Puerto Rico; the impact of changes in accounting standards, or determinations and assumptions in applying those standards, and of forecasts of economic variables considered for the determination of the ACL; the
ability of FirstBank to realize the benefits of its net deferred tax assets; the ability of FirstBank to generate sufficient cash flow to pay dividends to the Corporation; environmental, social, and
governance matters, including our climate-related initiatives and commitments; the impacts of natural or man-made disasters, the emergence or continuation of widespread health emergencies, geopolitical conflicts (including sanctions,
war or armed conflict, such as the ongoing conflict in Ukraine, the conflict in the Middle East, and the possible expansion of such conflicts in surrounding areas and potential geopolitical consequences), terrorist attacks, or other catastrophic
external events, including impacts of such events on general economic conditions and on the Corporation’s assumptions regarding forecasts of economic variables; the risk that additional portions of the unrealized losses in the Corporation’s debt
securities portfolio are determined to be credit-related, resulting in additional charges to the provision for credit losses on the Corporation’s debt securities portfolio, and the potential for additional credit losses that could emerge from the
downgrade of the U.S.’s Long-Term Foreign-Currency Issuer Default Rating to ‘AA+’ from ‘AAA’ in August 2023 and subsequent negative ratings outlooks; the impacts of applicable legislative, tax, or regulatory changes or changes in legislative, tax, or regulatory priorities, potential government shutdowns, and political impasses, including uncertainties regarding the U.S. debt ceiling and federal budget, as well as of the 2024 U.S.
and Puerto Rico general election, on the Corporation’s financial condition or performance; the risk of possible failure or circumvention of the Corporation’s internal controls and procedures and the risk that the Corporation’s risk management
policies may not be adequate; the risk that the FDIC may further increase the deposit insurance premium and/or require further special assessments, causing an additional increase in the Corporation’s non-interest expenses; any need to recognize
impairments on the Corporation’s financial instruments, goodwill, and other intangible assets; the risk that the impact of the occurrence of any of these uncertainties on the Corporation’s capital would preclude further growth of FirstBank and
preclude the Corporation’s Board of Directors from declaring dividends; and uncertainty as to whether FirstBank will be able to continue to satisfy its regulators regarding, among other things, its asset quality, liquidity plans, maintenance of
capital levels, and compliance with applicable laws, regulations and related requirements. The Corporation does not undertake to, and specifically disclaims any obligation to update any “forward-looking statements” to reflect occurrences or
unanticipated events or circumstances after the date of such statements, except as required by the federal securities laws.
First BanCorp. Announces Earnings for the Quarter Ended September 30, 2024 – Page 17 of 27
First BanCorp. is the parent corporation of FirstBank Puerto Rico, a state-chartered commercial bank with operations in Puerto Rico, the U.S., and the British Virgin
Islands and Florida, and of FirstBank Insurance Agency. First BanCorp.’s shares of common stock trade on the New York Stock Exchange under the symbol FBP. Additional information about First BanCorp. may be found at www.1firstbank.com.
###
First BanCorp.
Ramon Rodriguez
Senior Vice President
Ramon Rodriguez
Senior Vice President
Corporate Strategy and Investor Relations
ramon.rodriguez@firstbankpr.com
ramon.rodriguez@firstbankpr.com
(787) 729-8200 Ext. 82179
First BanCorp. Announces Earnings for the Quarter Ended September 30, 2024 – Page 18 of 27
EXHIBIT A
Table 1 – Condensed Consolidated Statements of Financial Condition
|
As of
|
||||||||||||
|
September 30, 2024
|
June 30, 2024
|
December 31, 2023
|
||||||||||
|
(In thousands, except for share information)
|
||||||||||||
|
ASSETS
|
||||||||||||
|
Cash and due from banks
|
$
|
684,028
|
$
|
581,843
|
$
|
661,925
|
||||||
|
Money market investments:
|
||||||||||||
|
Time deposits with other financial institutions
|
500
|
500
|
300
|
|||||||||
|
Other short-term investments
|
843
|
3,939
|
939
|
|||||||||
|
Total money market investments
|
1,343
|
4,439
|
1,239
|
|||||||||
|
Debt securities available for sale, at fair value (ACL of $526 as of September 30, 2024; $549 as of
June 30, 2024; and $511 as of December 31, 2023)
|
4,894,781
|
4,957,311
|
5,229,984
|
|||||||||
|
Debt securities held to maturity, at amortized cost, net of ACL of $1,119 as of September 30, 2024; $1,267
as of June 30, 2024; and $2,197 as of December 31, 2023 (fair value of $316,854 as of September 30,
2024; $333,690 as of June 30, 2024; and $346,132 as of December 31, 2023)
|
322,023
|
343,168
|
351,981
|
|||||||||
|
Total debt securities
|
5,216,804
|
5,300,479
|
5,581,965
|
|||||||||
|
Equity securities
|
52,432
|
51,037
|
49,675
|
|||||||||
|
Total investment securities
|
5,269,236
|
5,351,516
|
5,631,640
|
|||||||||
|
Loans, net of ACL of $246,996 as of September 30, 2024; $254,532 as of June 30, 2024;
and $261,843 as of December 31, 2023
|
12,199,028
|
12,130,976
|
11,923,640
|
|||||||||
|
Loans held for sale, at lower of cost or market
|
12,641
|
10,392
|
7,368
|
|||||||||
|
Total loans, net
|
12,211,669
|
12,141,368
|
11,931,008
|
|||||||||
|
Accrued interest receivable on loans and investments
|
67,112
|
77,895
|
77,716
|
|||||||||
|
Premises and equipment, net
|
136,401
|
138,554
|
142,016
|
|||||||||
|
OREO
|
19,330
|
21,682
|
32,669
|
|||||||||
|
Deferred tax asset, net
|
137,484
|
142,725
|
150,127
|
|||||||||
|
Goodwill
|
38,611
|
38,611
|
38,611
|
|||||||||
|
Other intangible assets
|
8,260
|
9,700
|
13,383
|
|||||||||
|
Other assets
|
285,696
|
373,041
|
229,215
|
|||||||||
|
Total assets
|
$
|
18,859,170
|
$
|
18,881,374
|
$
|
18,909,549
|
||||||
|
LIABILITIES
|
||||||||||||
|
Deposits:
|
||||||||||||
|
Non-interest-bearing deposits
|
$
|
5,275,733
|
$
|
5,406,054
|
$
|
5,404,121
|
||||||
|
Interest-bearing deposits
|
11,071,657
|
11,122,902
|
11,151,864
|
|||||||||
|
Total deposits
|
16,347,390
|
16,528,956
|
16,555,985
|
|||||||||
|
Advances from the FHLB
|
500,000
|
500,000
|
500,000
|
|||||||||
|
Other borrowings
|
111,700
|
161,700
|
161,700
|
|||||||||
|
Accounts payable and other liabilities
|
199,195
|
199,258
|
194,255
|
|||||||||
|
Total liabilities
|
17,158,285
|
17,389,914
|
17,411,940
|
|||||||||
|
STOCKHOLDERSʼ EQUITY
|
||||||||||||
|
Common stock, $0.10 par value, 223,663,116 shares issued (September 30, 2024 - 163,875,810
shares outstanding; June 30, 2024 - 163,865,453 shares outstanding; and December 31, 2023 -
169,302,812 shares outstanding)
|
22,366
|
22,366
|
22,366
|
|||||||||
|
Additional paid-in capital
|
962,973
|
961,254
|
965,707
|
|||||||||
|
Retained earnings
|
1,989,419
|
1,941,980
|
1,846,112
|
|||||||||
|
Treasury stock, at cost (September 30, 2024 - 59,787,306 shares; June 30, 2024 - 59,797,663 shares; and
December 31, 2023 - 54,360,304 shares)
|
(790,252
|
)
|
(790,465
|
)
|
(697,406
|
)
|
||||||
|
Accumulated other comprehensive loss
|
(483,621
|
)
|
(643,675
|
)
|
(639,170
|
)
|
||||||
|
Total stockholdersʼ equity
|
1,700,885
|
1,491,460
|
1,497,609
|
|||||||||
|
Total liabilities and stockholdersʼ equity
|
$
|
18,859,170
|
$
|
18,881,374
|
$
|
18,909,549
|
||||||
First BanCorp. Announces Earnings for the Quarter Ended September 30, 2024 – Page 19 of 27
Table 2 – Condensed Consolidated Statements of Income
|
Quarter Ended
|
Nine-Month Period Ended
|
|||||||||||||||||||
|
September 30, 2024
|
June 30, 2024
|
September 30, 2023
|
September 30, 2024
|
September 30, 2023
|
||||||||||||||||
|
(In thousands, except per share information)
|
||||||||||||||||||||
|
Net interest income:
|
||||||||||||||||||||
|
Interest income
|
$
|
274,675
|
$
|
272,245
|
$
|
263,405
|
$
|
815,425
|
$
|
758,005
|
||||||||||
|
Interest expense
|
72,611
|
72,617
|
63,677
|
217,213
|
157,577
|
|||||||||||||||
|
Net interest income
|
202,064
|
199,628
|
199,728
|
598,212
|
600,428
|
|||||||||||||||
|
Provision for credit losses - expense (benefit):
|
||||||||||||||||||||
|
Loans
|
16,470
|
11,930
|
10,643
|
41,317
|
47,669
|
|||||||||||||||
|
Unfunded loan commitments
|
(1,041
|
)
|
(417
|
)
|
(128
|
)
|
(1,177
|
)
|
488
|
|||||||||||
|
Debt securities
|
(184
|
)
|
92
|
(6,119
|
)
|
(1,123
|
)
|
(6,029
|
)
|
|||||||||||
|
Provision for credit losses - expense
|
15,245
|
11,605
|
4,396
|
39,017
|
42,128
|
|||||||||||||||
|
Net interest income after provision for credit losses
|
186,819
|
188,023
|
195,332
|
559,195
|
558,300
|
|||||||||||||||
|
Non-interest income:
|
||||||||||||||||||||
|
Service charges and fees on deposit accounts
|
9,684
|
9,725
|
9,552
|
29,071
|
28,380
|
|||||||||||||||
|
Mortgage banking activities
|
3,199
|
3,419
|
2,821
|
9,500
|
8,493
|
|||||||||||||||
|
Gain on early extinguishment of debt
|
-
|
-
|
-
|
-
|
1,605
|
|||||||||||||||
|
Card and processing income
|
11,768
|
11,523
|
10,841
|
34,603
|
32,894
|
|||||||||||||||
|
Other non-interest income
|
7,851
|
7,371
|
7,082
|
25,349
|
27,713
|
|||||||||||||||
|
Total non-interest income
|
32,502
|
32,038
|
30,296
|
98,523
|
99,085
|
|||||||||||||||
|
Non-interest expenses:
|
||||||||||||||||||||
|
Employees’ compensation and benefits
|
59,081
|
57,456
|
56,535
|
176,043
|
167,271
|
|||||||||||||||
|
Occupancy and equipment
|
22,424
|
21,851
|
21,781
|
65,656
|
64,064
|
|||||||||||||||
|
Business promotion
|
4,116
|
4,359
|
4,759
|
12,317
|
12,901
|
|||||||||||||||
|
Professional service fees
|
12,538
|
12,431
|
11,022
|
37,645
|
34,591
|
|||||||||||||||
|
Taxes, other than income taxes
|
5,665
|
5,408
|
5,465
|
16,202
|
15,701
|
|||||||||||||||
|
FDIC deposit insurance
|
2,164
|
2,316
|
2,143
|
7,582
|
6,419
|
|||||||||||||||
|
Net gain on OREO operations
|
(1,339
|
)
|
(3,609
|
)
|
(2,153
|
)
|
(6,400
|
)
|
(6,133
|
)
|
||||||||||
|
Credit and debit card processing expenses
|
7,095
|
7,607
|
6,779
|
20,453
|
18,637
|
|||||||||||||||
|
Other non-interest expenses
|
11,191
|
10,863
|
10,307
|
33,042
|
31,372
|
|||||||||||||||
|
Total non-interest expenses
|
122,935
|
118,682
|
116,638
|
362,540
|
344,823
|
|||||||||||||||
|
Income before income taxes
|
96,386
|
101,379
|
108,990
|
295,178
|
312,562
|
|||||||||||||||
|
Income tax expense
|
22,659
|
25,541
|
26,968
|
72,155
|
89,187
|
|||||||||||||||
|
Net income
|
$
|
73,727
|
$
|
75,838
|
$
|
82,022
|
$
|
223,023
|
$
|
223,375
|
||||||||||
|
Net income attributable to common stockholders
|
$
|
73,727
|
$
|
75,838
|
$
|
82,022
|
$
|
223,023
|
$
|
223,375
|
||||||||||
|
Earnings per common share:
|
||||||||||||||||||||
|
Basic
|
$
|
0.45
|
$
|
0.46
|
$
|
0.47
|
$
|
1.35
|
$
|
1.25
|
||||||||||
|
Diluted
|
$
|
0.45
|
$
|
0.46
|
$
|
0.46
|
$
|
1.35
|
$
|
1.25
|
||||||||||
First BanCorp. Announces Earnings for the Quarter Ended September 30, 2024 – Page 20 of 27
Table 3 – Selected Financial Data
|
Quarter Ended
|
Nine-Month Period Ended
|
|||||||||||||||||||
|
September 30,
2024
|
June 30,
2024
|
September 30,
2023
|
September 30,
2024
|
September 30,
2023
|
||||||||||||||||
|
(Shares in thousands)
|
||||||||||||||||||||
|
Per Common Share Results:
|
||||||||||||||||||||
|
Net earnings per share - basic
|
$
|
0.45
|
$
|
0.46
|
$
|
0.47
|
$
|
1.35
|
$
|
1.25
|
||||||||||
|
Net earnings per share - diluted
|
$
|
0.45
|
$
|
0.46
|
$
|
0.46
|
$
|
1.35
|
$
|
1.25
|
||||||||||
|
Cash dividends declared
|
$
|
0.16
|
$
|
0.16
|
$
|
0.14
|
$
|
0.48
|
$
|
0.42
|
||||||||||
|
Average shares outstanding
|
163,059
|
164,945
|
176,358
|
165,041
|
178,486
|
|||||||||||||||
|
Average shares outstanding diluted
|
163,872
|
165,543
|
176,962
|
165,730
|
179,144
|
|||||||||||||||
|
Book value per common share
|
$
|
10.38
|
$
|
9.10
|
$
|
7.47
|
$
|
10.38
|
$
|
7.47
|
||||||||||
|
Tangible book value per common share (1)
|
$
|
10.09
|
$
|
8.81
|
$
|
7.16
|
$
|
10.09
|
$
|
7.16
|
||||||||||
|
Common stock price: end of period
|
$
|
21.17
|
$
|
18.29
|
$
|
13.46
|
$
|
21.17
|
$
|
13.46
|
||||||||||
|
Selected Financial Ratios (In Percent):
|
||||||||||||||||||||
|
Profitability:
|
||||||||||||||||||||
|
Return on average assets
|
1.55
|
1.61
|
1.72
|
1.57
|
1.59
|
|||||||||||||||
|
Return on average equity
|
18.31
|
20.80
|
20.70
|
19.52
|
19.00
|
|||||||||||||||
|
Interest rate spread (2)
|
3.42
|
3.41
|
3.41
|
3.39
|
3.60
|
|||||||||||||||
|
Net interest margin (2)
|
4.34
|
4.32
|
4.24
|
4.31
|
4.36
|
|||||||||||||||
|
Efficiency ratio (3)
|
52.41
|
51.23
|
50.71
|
52.03
|
49.29
|
|||||||||||||||
|
Capital and Other:
|
||||||||||||||||||||
|
Average total equity to average total assets
|
8.46
|
7.74
|
8.32
|
8.06
|
8.39
|
|||||||||||||||
|
Total capital
|
18.25
|
18.21
|
18.84
|
18.25
|
18.84
|
|||||||||||||||
|
Common equity Tier 1 capital
|
16.18
|
15.77
|
16.35
|
16.18
|
16.35
|
|||||||||||||||
|
Tier 1 capital
|
16.18
|
15.77
|
16.35
|
16.18
|
16.35
|
|||||||||||||||
|
Leverage
|
10.96
|
10.63
|
10.57
|
10.96
|
10.57
|
|||||||||||||||
|
Tangible common equity ratio (1)
|
8.79
|
7.66
|
6.74
|
8.79
|
6.74
|
|||||||||||||||
|
Dividend payout ratio
|
35.39
|
34.80
|
30.10
|
35.52
|
33.56
|
|||||||||||||||
|
Basic liquidity ratio (4)
|
18.43
|
18.50
|
19.67
|
18.43
|
19.67
|
|||||||||||||||
|
Core liquidity ratio (5)
|
13.32
|
13.37
|
14.58
|
13.32
|
14.58
|
|||||||||||||||
|
Loan to deposit ratio
|
76.21
|
75.00
|
72.77
|
76.21
|
72.77
|
|||||||||||||||
|
Uninsured deposits, excluding fully collateralized deposits, to total deposits (6)
|
29.25
|
28.46
|
27.74
|
29.25
|
27.74
|
|||||||||||||||
|
Asset Quality:
|
||||||||||||||||||||
|
Allowance for credit losses for loans and finance leases to total loans
held for investment
|
1.98
|
2.06
|
2.21
|
1.98
|
2.21
|
|||||||||||||||
|
Net charge-offs (annualized) to average loans outstanding
|
0.78
|
0.69
|
0.48
|
0.61
|
0.54
|
|||||||||||||||
|
Provision for credit losses for loans and finance leases to net charge-offs
|
68.61
|
56.84
|
75.56
|
73.56
|
102.22
|
|||||||||||||||
|
Non-performing assets to total assets
|
0.63
|
0.67
|
0.70
|
0.63
|
0.70
|
|||||||||||||||
|
Nonaccrual loans held for investment to total loans held for investment
|
0.72
|
0.78
|
0.78
|
0.72
|
0.78
|
|||||||||||||||
|
Allowance for credit losses for loans and finance leases to total nonaccrual loans
held for investment
|
276.46
|
264.66
|
282.96
|
276.46
|
282.96
|
|||||||||||||||
|
Allowance for credit losses for loans and finance leases to total nonaccrual loans
held for investment, excluding residential estate loans
|
428.70
|
392.94
|
430.62
|
428.70
|
430.62
|
|||||||||||||||
| (1) |
Non-GAAP financial measures. Refer to Non-GAAP Disclosures and Statement of Financial Condition - Tangible Common Equity (Non-GAAP) above for additional information about the components and a reconciliation of these measures.
|
| (2) |
Non-GAAP financial measures reported on a tax-equivalent basis and excluding changes in the fair value of derivative instruments. Refer to Non-GAAP Disclosures and Table 4 below for additional information and a reconciliation of these measures.
|
| (3) |
Non-interest expenses to the sum of net interest income and non-interest income.
|
| (4) |
Defined as the sum of cash and cash equivalents, free high quality liquid assets that could be liquidated within one day, and available secured lines of credit with the FHLB to
total assets.
|
| (5) |
Defined as the sum of cash and cash equivalents and free high quality liquid assets that could be liquidated within one day to total assets.
|
| (6) |
Exclude insured deposits not covered by federal deposit insurance.
|
First BanCorp. Announces Earnings for the Quarter Ended September 30, 2024 – Page 21 of 27
Table 4 – Reconciliation of Net Interest Income to Net Interest Income Excluding Valuations and on a Tax-Equivalent Basis
The following table reconciles net interest income in accordance with GAAP to net interest income excluding valuations, and net
interest income on a tax-equivalent basis for the third and second quarters of 2024, the third quarter of 2023, and the nine-month periods ended September 30, 2024 and 2023, respectively. The table also reconciles net interest spread and net interest margin to these items excluding valuations, and on a tax-equivalent basis.
|
Quarter Ended
|
Nine-Month Period Ended
|
|||||||||||||||||||
|
September 30,
|
June 30,
|
September 30,
|
September 30,
|
September 30,
|
||||||||||||||||
|
(Dollars in thousands)
|
2024
|
2024
|
2023
|
2024
|
2023
|
|||||||||||||||
|
Net Interest Income
|
||||||||||||||||||||
|
Interest income - GAAP
|
$
|
274,675
|
$
|
272,245
|
$
|
263,405
|
$
|
815,425
|
$
|
758,005
|
||||||||||
|
Unrealized loss (gain) on derivative instruments
|
5
|
-
|
(3
|
)
|
3
|
-
|
||||||||||||||
|
Interest income excluding valuations - non-GAAP
|
274,680
|
272,245
|
263,402
|
815,428
|
758,005
|
|||||||||||||||
|
Tax-equivalent adjustment
|
4,528
|
4,866
|
4,690
|
14,207
|
16,577
|
|||||||||||||||
|
Interest income on a tax-equivalent basis and excluding valuations - non-GAAP
|
$
|
279,208
|
$
|
277,111
|
$
|
268,092
|
$
|
829,635
|
$
|
774,582
|
||||||||||
|
Interest expense - GAAP
|
$
|
72,611
|
$
|
72,617
|
$
|
63,677
|
$
|
217,213
|
$
|
157,577
|
||||||||||
|
Net interest income - GAAP
|
$
|
202,064
|
$
|
199,628
|
$
|
199,728
|
$
|
598,212
|
$
|
600,428
|
||||||||||
|
Net interest income excluding valuations -
non-GAAP
|
$
|
202,069
|
$
|
199,628
|
$
|
199,725
|
$
|
598,215
|
$
|
600,428
|
||||||||||
|
Net interest income on a tax-equivalent basis and excluding valuations - non-GAAP
|
$
|
206,597
|
$
|
204,494
|
$
|
204,415
|
$
|
612,422
|
$
|
617,005
|
||||||||||
|
Average Balances
|
||||||||||||||||||||
|
Loans and leases
|
$
|
12,354,679
|
$
|
12,272,816
|
$
|
11,783,456
|
$
|
12,278,724
|
$
|
11,632,424
|
||||||||||
|
Total securities, other short-term investments and interest-bearing cash balances
|
6,509,789
|
6,698,609
|
7,325,226
|
6,642,446
|
7,297,528
|
|||||||||||||||
|
Average Interest-Earning Assets
|
$
|
18,864,468
|
$
|
18,971,425
|
$
|
19,108,682
|
$
|
18,921,170
|
$
|
18,929,952
|
||||||||||
|
Average Interest-Bearing Liabilities
|
$
|
11,743,122
|
$
|
11,868,658
|
$
|
11,671,938
|
$
|
11,816,378
|
$
|
11,271,354
|
||||||||||
|
Average Assets (1)
|
$
|
18,883,374
|
$
|
18,884,431
|
$
|
18,895,980
|
$
|
18,875,397
|
$
|
18,748,479
|
||||||||||
|
Average Non-Interest-Bearing Deposits
|
$
|
5,341,589
|
$
|
5,351,308
|
$
|
5,621,233
|
$
|
5,333,838
|
$
|
5,861,680
|
||||||||||
|
Average Yield/Rate
|
||||||||||||||||||||
|
Average yield on interest-earning assets - GAAP
|
5.78
|
%
|
5.76
|
%
|
5.47
|
%
|
5.74
|
%
|
5.35
|
%
|
||||||||||
|
Average rate on interest-bearing liabilities - GAAP
|
2.45
|
%
|
2.45
|
%
|
2.16
|
%
|
2.45
|
%
|
1.87
|
%
|
||||||||||
|
Net interest spread - GAAP
|
3.33
|
%
|
3.31
|
%
|
3.31
|
%
|
3.29
|
%
|
3.48
|
%
|
||||||||||
|
Net interest margin - GAAP
|
4.25
|
%
|
4.22
|
%
|
4.15
|
%
|
4.21
|
%
|
4.24
|
%
|
||||||||||
|
Average yield on interest-earning assets excluding valuations - non-GAAP
|
5.78
|
%
|
5.76
|
%
|
5.47
|
%
|
5.74
|
%
|
5.35
|
%
|
||||||||||
|
Average rate on interest-bearing liabilities
|
2.45
|
%
|
2.45
|
%
|
2.16
|
%
|
2.45
|
%
|
1.87
|
%
|
||||||||||
|
Net interest spread excluding valuations - non-GAAP
|
3.33
|
%
|
3.31
|
%
|
3.31
|
%
|
3.29
|
%
|
3.48
|
%
|
||||||||||
|
Net interest margin excluding valuations - non-GAAP
|
4.25
|
%
|
4.22
|
%
|
4.15
|
%
|
4.21
|
%
|
4.24
|
%
|
||||||||||
|
Average yield on interest-earning assets on a tax-equivalent basis
and excluding valuations - non-GAAP
|
5.87
|
%
|
5.86
|
%
|
5.57
|
%
|
5.84
|
%
|
5.47
|
%
|
||||||||||
|
Average rate on interest-bearing liabilities
|
2.45
|
%
|
2.45
|
%
|
2.16
|
%
|
2.45
|
%
|
1.87
|
%
|
||||||||||
|
Net interest spread on a tax-equivalent basis and excluding valuations - non-GAAP
|
3.42
|
%
|
3.41
|
%
|
3.41
|
%
|
3.39
|
%
|
3.60
|
%
|
||||||||||
|
Net interest margin on a tax-equivalent basis and excluding valuations - non-GAAP
|
4.34
|
%
|
4.32
|
%
|
4.24
|
%
|
4.31
|
%
|
4.36
|
%
|
||||||||||
|
(1)
|
Includes, among other things, the ACL on loans and finance leases and debt securities, as well as unrealized gains and losses on
available-for-sale debt securities.
|
First BanCorp. Announces Earnings for the Quarter Ended September 30, 2024 – Page 22 of 27
Table 5 – Quarterly Statement of Average Interest-Earning Assets and Average Interest-Bearing Liabilities (On a Tax-Equivalent Basis)
|
Average Volume
|
Interest Income (1) / Expense
|
Average Rate (1)
|
||||||||||||||||||||||||||||||||||
|
Quarter Ended
|
September 30,
|
June 30,
|
September 30,
|
September 30,
|
June 30,
|
September 30,
|
September 30,
|
June 30,
|
September 30,
|
|||||||||||||||||||||||||||
|
2024
|
2024
|
2023
|
2024
|
2024
|
2023
|
2024
|
2024
|
2023
|
||||||||||||||||||||||||||||
|
(Dollars in thousands)
|
||||||||||||||||||||||||||||||||||||
|
Interest-earning assets:
|
||||||||||||||||||||||||||||||||||||
|
Money market and other short-term investments
|
$
|
645,398
|
$
|
667,564
|
$
|
807,883
|
$
|
8,782
|
$
|
9,060
|
$
|
10,956
|
5.40
|
%
|
5.44
|
%
|
5.38
|
%
|
||||||||||||||||||
|
Government obligations (2)
|
2,520,133
|
2,619,778
|
2,817,646
|
8,458
|
8,947
|
9,415
|
1.33
|
%
|
1.37
|
%
|
1.33
|
%
|
||||||||||||||||||||||||
|
MBS
|
3,290,547
|
3,359,598
|
3,650,737
|
13,830
|
14,339
|
15,677
|
1.67
|
%
|
1.71
|
%
|
1.70
|
%
|
||||||||||||||||||||||||
|
FHLB stock
|
33,985
|
34,032
|
34,666
|
804
|
818
|
768
|
9.39
|
%
|
9.64
|
%
|
8.79
|
%
|
||||||||||||||||||||||||
|
Other investments
|
19,726
|
17,637
|
14,294
|
73
|
244
|
61
|
1.47
|
%
|
5.55
|
%
|
1.69
|
%
|
||||||||||||||||||||||||
|
Total investments (3)
|
6,509,789
|
6,698,609
|
7,325,226
|
31,947
|
33,408
|
36,877
|
1.95
|
%
|
2.00
|
%
|
2.00
|
%
|
||||||||||||||||||||||||
|
Residential mortgage loans
|
2,816,343
|
2,807,639
|
2,800,675
|
41,505
|
40,686
|
39,640
|
5.85
|
%
|
5.81
|
%
|
5.62
|
%
|
||||||||||||||||||||||||
|
Construction loans
|
195,001
|
245,219
|
183,507
|
4,417
|
4,955
|
4,937
|
8.99
|
%
|
8.10
|
%
|
10.67
|
%
|
||||||||||||||||||||||||
|
C&I and commercial mortgage loans
|
5,616,658
|
5,528,607
|
5,261,849
|
102,768
|
100,919
|
93,711
|
7.26
|
%
|
7.32
|
%
|
7.07
|
%
|
||||||||||||||||||||||||
|
Finance leases
|
885,807
|
873,908
|
808,480
|
17,290
|
17,255
|
15,802
|
7.74
|
%
|
7.92
|
%
|
7.75
|
%
|
||||||||||||||||||||||||
|
Consumer loans
|
2,840,870
|
2,817,443
|
2,728,945
|
81,281
|
79,888
|
77,125
|
11.35
|
%
|
11.37
|
%
|
11.21
|
%
|
||||||||||||||||||||||||
|
Total loans (4) (5)
|
12,354,679
|
12,272,816
|
11,783,456
|
247,261
|
243,703
|
231,215
|
7.94
|
%
|
7.96
|
%
|
7.78
|
%
|
||||||||||||||||||||||||
|
Total interest-earning assets
|
$
|
18,864,468
|
$
|
18,971,425
|
$
|
19,108,682
|
$
|
279,208
|
$
|
277,111
|
$
|
268,092
|
5.87
|
%
|
5.86
|
%
|
5.57
|
%
|
||||||||||||||||||
|
Interest-bearing liabilities:
|
||||||||||||||||||||||||||||||||||||
|
Time deposits
|
$
|
3,057,918
|
$
|
3,002,159
|
$
|
2,708,297
|
$
|
27,768
|
$
|
26,588
|
$
|
19,852
|
3.60
|
%
|
3.55
|
%
|
2.91
|
%
|
||||||||||||||||||
|
Brokered CDs
|
600,319
|
676,421
|
318,831
|
7,656
|
8,590
|
3,830
|
5.06
|
%
|
5.09
|
%
|
4.77
|
%
|
||||||||||||||||||||||||
|
Other interest-bearing deposits
|
7,429,163
|
7,528,378
|
7,956,856
|
28,280
|
28,493
|
30,616
|
1.51
|
%
|
1.52
|
%
|
1.53
|
%
|
||||||||||||||||||||||||
|
Securities sold under agreements to repurchase
|
-
|
-
|
26,254
|
-
|
-
|
359
|
0.00
|
%
|
0.00
|
%
|
5.43
|
%
|
||||||||||||||||||||||||
|
Advances from the FHLB
|
500,000
|
500,000
|
500,000
|
5,672
|
5,610
|
5,675
|
4.50
|
%
|
4.50
|
%
|
4.50
|
%
|
||||||||||||||||||||||||
|
Other borrowings
|
155,722
|
161,700
|
161,700
|
3,235
|
3,336
|
3,345
|
8.24
|
%
|
8.27
|
%
|
8.21
|
%
|
||||||||||||||||||||||||
|
Total interest-bearing liabilities
|
$
|
11,743,122
|
$
|
11,868,658
|
$
|
11,671,938
|
$
|
72,611
|
$
|
72,617
|
$
|
63,677
|
2.45
|
%
|
2.45
|
%
|
2.16
|
%
|
||||||||||||||||||
|
Net interest income
|
$
|
206,597
|
$
|
204,494
|
$
|
204,415
|
||||||||||||||||||||||||||||||
|
Interest rate spread
|
3.42
|
%
|
3.41
|
%
|
3.41
|
%
|
||||||||||||||||||||||||||||||
|
Net interest margin
|
4.34
|
%
|
4.32
|
%
|
4.24
|
%
|
||||||||||||||||||||||||||||||
| (1) |
Non-GAAP financial measures reported on a tax-equivalent basis. The tax-equivalent yield was estimated by dividing the interest rate spread on exempt assets by 1 less the
Puerto Rico statutory tax rate of 37.5% and adding to it the cost of interest-bearing liabilities. When adjusted to a tax-equivalent basis, yields on taxable and exempt assets are comparable. Changes in the fair value of derivative
instruments are excluded from interest income because the changes in valuation do not affect interest paid or received. Refer to Non-GAAP Disclosures - Non-GAAP Financial
Measures and Table 4 above for additional information and a reconciliation of these measures.
|
| (2) |
Government obligations include debt issued by government-sponsored agencies.
|
| (3) |
Unrealized gains and losses on available-for-sale debt securities are excluded from the average volumes.
|
| (4) |
Average loan balances include the average of non-performing loans.
|
| (5) |
Interest income on loans includes $3.2 million, $3.1 million, and $2.9 million, for the quarters ended September 30, 2024, June 30, 2024, and September 30, 2023, respectively,
of income from prepayment penalties and late fees related to the Corporation’s loan portfolio.
|
First BanCorp. Announces Earnings for the Quarter Ended September 30, 2024 – Page 23 of 27
Table 6 – Year-to-Date Statement of Average Interest-Earning Assets and Average Interest-Bearing Liabilities (On a Tax-Equivalent Basis)
|
Average Volume
|
Interest Income (1) / Expense
|
Average Rate (1)
|
||||||||||||||||||||||
|
Nine-Month Period Ended
|
September 30, 2024
|
September 30, 2023
|
September 30, 2024
|
September 30, 2023
|
September 30, 2024
|
September 30, 2023
|
||||||||||||||||||
|
(Dollars in thousands)
|
||||||||||||||||||||||||
|
Interest-earning assets:
|
||||||||||||||||||||||||
|
Money market and other short-term investments
|
$
|
615,679
|
$
|
611,308
|
$
|
25,096
|
$
|
23,486
|
5.43
|
%
|
5.14
|
%
|
||||||||||||
|
Government obligations (2)
|
2,607,706
|
2,878,603
|
26,458
|
31,153
|
1.35
|
%
|
1.45
|
%
|
||||||||||||||||
|
MBS
|
3,366,866
|
3,756,654
|
43,407
|
52,160
|
1.72
|
%
|
1.86
|
%
|
||||||||||||||||
|
FHLB stock
|
34,217
|
37,234
|
2,476
|
1,969
|
9.64
|
%
|
7.07
|
%
|
||||||||||||||||
|
Other investments
|
17,978
|
13,729
|
383
|
258
|
2.84
|
%
|
2.51
|
%
|
||||||||||||||||
|
Total investments (3)
|
6,642,446
|
7,297,528
|
97,820
|
109,026
|
1.96
|
%
|
2.00
|
%
|
||||||||||||||||
|
Residential mortgage loans
|
2,811,447
|
2,814,667
|
122,664
|
119,298
|
5.81
|
%
|
5.67
|
%
|
||||||||||||||||
|
Construction loans
|
219,601
|
159,914
|
13,909
|
10,516
|
8.44
|
%
|
8.79
|
%
|
||||||||||||||||
|
C&I and commercial mortgage loans
|
5,550,259
|
5,207,216
|
302,761
|
268,886
|
7.27
|
%
|
6.90
|
%
|
||||||||||||||||
|
Finance leases
|
874,508
|
771,366
|
51,672
|
44,325
|
7.87
|
%
|
7.68
|
%
|
||||||||||||||||
|
Consumer loans
|
2,822,909
|
2,679,261
|
240,809
|
222,531
|
11.36
|
%
|
11.10
|
%
|
||||||||||||||||
|
Total loans (4) (5)
|
12,278,724
|
11,632,424
|
731,815
|
665,556
|
7.94
|
%
|
7.65
|
%
|
||||||||||||||||
|
Total interest-earning assets
|
$
|
18,921,170
|
$
|
18,929,952
|
$
|
829,635
|
$
|
774,582
|
5.84
|
%
|
5.47
|
%
|
||||||||||||
|
Interest-bearing liabilities:
|
||||||||||||||||||||||||
|
Time deposits
|
$
|
2,984,413
|
$
|
2,522,061
|
$
|
78,766
|
$
|
46,301
|
3.52
|
%
|
2.45
|
%
|
||||||||||||
|
Brokered CDs
|
675,226
|
273,586
|
25,926
|
9,178
|
5.11
|
%
|
4.49
|
%
|
||||||||||||||||
|
Other interest-bearing deposits
|
7,497,046
|
7,674,759
|
85,708
|
70,308
|
1.52
|
%
|
1.22
|
%
|
||||||||||||||||
|
Securities sold under agreements to repurchase
|
-
|
72,648
|
-
|
2,756
|
0.00
|
%
|
5.07
|
%
|
||||||||||||||||
|
Advances from the FHLB
|
500,000
|
553,993
|
16,892
|
18,899
|
4.50
|
%
|
4.56
|
%
|
||||||||||||||||
|
Other borrowings
|
159,693
|
174,307
|
9,921
|
10,135
|
8.28
|
%
|
7.77
|
%
|
||||||||||||||||
|
Total interest-bearing liabilities
|
$
|
11,816,378
|
$
|
11,271,354
|
$
|
217,213
|
$
|
157,577
|
2.45
|
%
|
1.87
|
%
|
||||||||||||
|
Net interest income
|
$
|
612,422
|
$
|
617,005
|
||||||||||||||||||||
|
Interest rate spread
|
3.39
|
%
|
3.60
|
%
|
||||||||||||||||||||
|
Net interest margin
|
4.31
|
%
|
4.36
|
%
|
||||||||||||||||||||
| (1) |
Non-GAAP financial measures reported on a tax-equivalent basis. The tax-equivalent yield was estimated by dividing the interest rate spread on exempt assets by 1 less the
Puerto Rico statutory tax rate of 37.5% and adding to it the cost of interest-bearing liabilities. When adjusted to a tax-equivalent basis, yields on taxable and exempt assets are comparable. Changes in the fair value of derivative
instruments are excluded from interest income because the changes in valuation do not affect interest paid or received. Refer to Non-GAAP Disclosures - Non-GAAP Financial
Measures and Table 4 above for additional information and a reconciliation of these measures.
|
| (2) |
Government obligations include debt issued by government-sponsored agencies.
|
| (3) |
Unrealized gains and losses on available-for-sale debt securities are excluded from the average volumes.
|
| (4) |
Average loan balances include the average of non-performing loans.
|
| (5) |
Interest income on loans includes $9.5 million and $8.9 million for the nine-month periods ended September 30, 2024 and 2023, respectively, of income from prepayment penalties
and late fees related to the Corporation's loan portfolio.
|
First BanCorp. Announces Earnings for the Quarter Ended September 30, 2024 – Page 24 of 27
Table 7 – Loan Portfolio by Geography
|
As of September 30, 2024
|
||||||||||||||||
|
Puerto Rico
|
Virgin Islands
|
United States
|
Consolidated
|
|||||||||||||
|
(In thousands)
|
||||||||||||||||
|
Residential mortgage loans
|
$
|
2,168,590
|
$
|
159,088
|
$
|
492,469
|
$
|
2,820,147
|
||||||||
|
Commercial loans:
|
||||||||||||||||
|
Construction loans
|
173,352
|
2,001
|
31,989
|
207,342
|
||||||||||||
|
Commercial mortgage loans
|
1,728,552
|
68,781
|
674,547
|
2,471,880
|
||||||||||||
|
Commercial and Industrial loans
|
2,161,688
|
81,942
|
961,683
|
3,205,313
|
||||||||||||
|
Commercial loans
|
4,063,592
|
152,724
|
1,668,219
|
5,884,535
|
||||||||||||
|
Finance leases
|
893,374
|
-
|
-
|
893,374
|
||||||||||||
|
Consumer loans
|
2,770,616
|
69,751
|
7,601
|
2,847,968
|
||||||||||||
|
Loans held for investment
|
9,896,172
|
381,563
|
2,168,289
|
12,446,024
|
||||||||||||
|
Loans held for sale
|
12,641
|
-
|
-
|
12,641
|
||||||||||||
|
Total loans
|
$
|
9,908,813
|
$
|
381,563
|
$
|
2,168,289
|
$
|
12,458,665
|
||||||||
|
As of June 30, 2024
|
||||||||||||||||
|
Puerto Rico
|
Virgin Islands
|
United States
|
Consolidated
|
|||||||||||||
|
(In thousands)
|
||||||||||||||||
|
Residential mortgage loans
|
$
|
2,163,245
|
$
|
161,057
|
$
|
485,364
|
$
|
2,809,666
|
||||||||
|
Commercial loans:
|
||||||||||||||||
|
Construction loans
|
160,093
|
3,681
|
22,183
|
185,957
|
||||||||||||
|
Commercial mortgage loans
|
1,697,939
|
62,821
|
662,549
|
2,423,309
|
||||||||||||
|
Commercial and Industrial loans
|
2,176,489
|
135,456
|
942,632
|
3,254,577
|
||||||||||||
|
Commercial loans
|
4,034,521
|
201,958
|
1,627,364
|
5,863,843
|
||||||||||||
|
Finance leases
|
880,312
|
-
|
-
|
880,312
|
||||||||||||
|
Consumer loans
|
2,755,077
|
68,540
|
8,070
|
2,831,687
|
||||||||||||
|
Loans held for investment
|
9,833,155
|
431,555
|
2,120,798
|
12,385,508
|
||||||||||||
|
Loans held for sale
|
10,392
|
-
|
-
|
10,392
|
||||||||||||
|
Total loans
|
$
|
9,843,547
|
$
|
431,555
|
$
|
2,120,798
|
$
|
12,395,900
|
||||||||
|
As of December 31, 2023
|
||||||||||||||||
|
Puerto Rico
|
Virgin Islands
|
United States
|
Consolidated
|
|||||||||||||
|
(In thousands)
|
||||||||||||||||
|
Residential mortgage loans
|
$
|
2,187,875
|
$
|
168,131
|
$
|
465,720
|
$
|
2,821,726
|
||||||||
|
Commercial loans:
|
||||||||||||||||
|
Construction loans
|
111,664
|
3,737
|
99,376
|
214,777
|
||||||||||||
|
Commercial mortgage loans
|
1,725,325
|
65,312
|
526,446
|
2,317,083
|
||||||||||||
|
Commercial and Industrial loans
|
2,130,368
|
119,040
|
924,824
|
3,174,232
|
||||||||||||
|
Commercial loans
|
3,967,357
|
188,089
|
1,550,646
|
5,706,092
|
||||||||||||
|
Finance leases
|
856,815
|
-
|
-
|
856,815
|
||||||||||||
|
Consumer loans
|
2,726,457
|
68,498
|
5,895
|
2,800,850
|
||||||||||||
|
Loans held for investment
|
9,738,504
|
424,718
|
2,022,261
|
12,185,483
|
||||||||||||
|
Loans held for sale
|
7,368
|
-
|
-
|
7,368
|
||||||||||||
|
Total loans
|
$
|
9,745,872
|
$
|
424,718
|
$
|
2,022,261
|
$
|
12,192,851
|
||||||||
First BanCorp. Announces Earnings for the Quarter Ended September 30, 2024 – Page 25 of 27
Table 8 – Non-Performing Assets by Geography
|
As of September 30, 2024
|
||||||||||||||||
|
(In thousands)
|
Puerto Rico
|
Virgin Islands
|
United States
|
Total
|
||||||||||||
|
Nonaccrual loans held for investment:
|
||||||||||||||||
|
Residential mortgage
|
$
|
16,047
|
$
|
6,434
|
$
|
9,248
|
$
|
31,729
|
||||||||
|
Construction
|
3,687
|
964
|
-
|
4,651
|
||||||||||||
|
Commercial mortgage
|
2,734
|
8,762
|
-
|
11,496
|
||||||||||||
|
Commercial and Industrial
|
17,131
|
1,231
|
-
|
18,362
|
||||||||||||
|
Consumer and finance leases
|
22,763
|
307
|
36
|
23,106
|
||||||||||||
|
Total nonaccrual loans held for investment
|
62,362
|
17,698
|
9,284
|
89,344
|
||||||||||||
|
OREO
|
15,715
|
3,615
|
-
|
19,330
|
||||||||||||
|
Other repossessed property
|
8,655
|
186
|
3
|
8,844
|
||||||||||||
|
Other assets (1)
|
1,567
|
-
|
-
|
1,567
|
||||||||||||
|
Total non-performing assets (2)
|
$
|
88,299
|
$
|
21,499
|
$
|
9,287
|
$
|
119,085
|
||||||||
|
Past due loans 90 days and still accruing (3)
|
$
|
40,458
|
$
|
3,152
|
$
|
-
|
$
|
43,610
|
||||||||
|
As of June 30, 2024
|
||||||||||||||||
|
(In thousands)
|
Puerto Rico
|
Virgin Islands
|
United States
|
Total
|
||||||||||||
|
Nonaccrual loans held for investment:
|
||||||||||||||||
|
Residential mortgage
|
$
|
16,895
|
$
|
6,446
|
$
|
8,055
|
$
|
31,396
|
||||||||
|
Construction
|
3,776
|
966
|
-
|
4,742
|
||||||||||||
|
Commercial mortgage
|
2,865
|
8,871
|
-
|
11,736
|
||||||||||||
|
Commercial and Industrial
|
26,387
|
1,274
|
-
|
27,661
|
||||||||||||
|
Consumer and finance leases
|
20,276
|
326
|
36
|
20,638
|
||||||||||||
|
Total nonaccrual loans held for investment
|
70,199
|
17,883
|
8,091
|
96,173
|
||||||||||||
|
OREO
|
17,413
|
4,202
|
67
|
21,682
|
||||||||||||
|
Other repossessed property
|
7,330
|
183
|
-
|
7,513
|
||||||||||||
|
Other assets (1)
|
1,532
|
-
|
-
|
1,532
|
||||||||||||
|
Total non-performing assets (2)
|
$
|
96,474
|
$
|
22,268
|
$
|
8,158
|
$
|
126,900
|
||||||||
|
Past due loans 90 days and still accruing (3)
|
$
|
44,028
|
$
|
3,145
|
$
|
-
|
$
|
47,173
|
||||||||
|
As of December 31, 2023
|
||||||||||||||||
|
(In thousands)
|
Puerto Rico
|
Virgin Islands
|
United States
|
Total
|
||||||||||||
|
Nonaccrual loans held for investment:
|
||||||||||||||||
|
Residential mortgage
|
$
|
18,324
|
$
|
6,688
|
$
|
7,227
|
$
|
32,239
|
||||||||
|
Construction
|
595
|
974
|
-
|
1,569
|
||||||||||||
|
Commercial mortgage
|
3,106
|
9,099
|
-
|
12,205
|
||||||||||||
|
Commercial and Industrial
|
13,414
|
1,169
|
667
|
15,250
|
||||||||||||
|
Consumer and finance leases
|
21,954
|
419
|
71
|
22,444
|
||||||||||||
|
Total nonaccrual loans held for investment
|
57,393
|
18,349
|
7,965
|
83,707
|
||||||||||||
|
OREO
|
28,382
|
4,287
|
-
|
32,669
|
||||||||||||
|
Other repossessed property
|
7,857
|
252
|
6
|
8,115
|
||||||||||||
|
Other assets (1)
|
1,415
|
-
|
-
|
1,415
|
||||||||||||
|
Total non-performing assets (2)
|
$
|
95,047
|
$
|
22,888
|
$
|
7,971
|
$
|
125,906
|
||||||||
|
Past due loans 90 days and still accruing (3)
|
$
|
53,308
|
$
|
6,005
|
$
|
139
|
$
|
59,452
|
||||||||
| (1) |
Residential pass-through MBS issued by the PRHFA held as part of the available-for-sale debt securities portfolio.
|
| (2) |
Excludes PCD loans previously accounted for under ASC Subtopic 310-30 for which the Corporation made the accounting policy election of maintaining pools of loans as “units of
account” both at the time of adoption of CECL on January 1, 2020 and on an ongoing basis for credit loss measurement. These loans will continue to be excluded from nonaccrual loan statistics as long as the Corporation can reasonably
estimate the timing and amount of cash flows expected to be collected on the loan pools. The portion of such loans contractually past due 90 days or more amounted to $6.5 million as of September 30, 2024 (June 30, 2024 - $7.4 million;
December 31, 2023 - $8.3 million).
|
| (3) |
These include rebooked loans, which were previously pooled into GNMA securities, amounting to $6.6 million as of September 30, 2024 (June 30, 2024 - $6.8 million; December 31,
2023 - $7.9 million). Under the GNMA program, the Corporation has the option but not the obligation to repurchase loans that meet GNMA's specified delinquency criteria. For accounting purposes, the loans subject to the repurchase option are
required to be reflected on the financial statements with an offsetting liability.
|
First BanCorp. Announces Earnings for the Quarter Ended September 30, 2024 – Page 26 of 27
|
Quarter Ended
|
Nine-Month Period Ended
|
|||||||||||||||||||
|
September 30,
|
June 30,
|
September 30,
|
September 30,
|
September 30,
|
||||||||||||||||
|
2024
|
2024
|
2023
|
2024
|
2023
|
||||||||||||||||
|
(Dollars in thousands)
|
||||||||||||||||||||
|
Allowance for credit losses on loans and finance leases, beginning of period
|
$
|
254,532
|
$
|
263,592
|
$
|
267,058
|
$
|
261,843
|
$
|
260,464
|
||||||||||
|
Impact of adoption of ASU 2022-02
|
-
|
-
|
-
|
-
|
2,116
|
|||||||||||||||
|
Provision for credit losses on loans and finance leases expense
|
16,470
|
11,930
|
10,643
|
41,317
|
47,669
|
|||||||||||||||
|
Net recoveries (charge-offs) of loans and finance leases:
|
||||||||||||||||||||
|
Residential mortgage
|
76
|
(45
|
)
|
35
|
(213
|
)
|
(840
|
)
|
||||||||||||
|
Construction
|
11
|
14
|
1,459
|
35
|
1,893
|
|||||||||||||||
|
Commercial mortgage
|
41
|
393
|
74
|
474
|
192
|
|||||||||||||||
|
Commercial and Industrial
|
(1,140
|
)
|
626
|
152
|
4,146
|
(6,094
|
)
|
|||||||||||||
|
Consumer loans and finance leases
|
(22,994
|
)
|
(21,978
|
)
|
(15,806
|
)
|
(60,606
|
)(1)
|
(41,785
|
)
|
||||||||||
|
Net charge-offs
|
(24,006
|
)
|
(20,990
|
)
|
(14,086
|
)
|
(56,164
|
)(1)
|
(46,634
|
)
|
||||||||||
|
Allowance for credit losses on loans and finance leases, end of period
|
$
|
246,996
|
$
|
254,532
|
$
|
263,615
|
$
|
246,996
|
$
|
263,615
|
||||||||||
|
Allowance for credit losses on loans and finance leases to period end total
loans held for investment
|
1.98
|
%
|
2.06
|
%
|
2.21
|
%
|
1.98
|
%
|
2.21
|
%
|
||||||||||
|
Net charge-offs (annualized) to average loans outstanding during the period
|
0.78
|
%
|
0.69
|
%
|
0.48
|
%
|
0.61
|
%
|
0.54
|
%
|
||||||||||
|
Provision for credit losses on loans and finance leases to net charge-offs during the period
|
0.69
|
x
|
0.57
|
x
|
0.76
|
x
|
0.74
|
x
|
1.02
|
x
|
||||||||||
| (1) |
For the nine-month period ended September 30 2024, includes a recovery totaling $10.0 million associated with the aforementioned bulk sale of fully charged-off consumer loans
and finance leases.
|
|
Quarter Ended
|
Nine-Month Period Ended
|
|||||||||||||||||||
|
September 30, 2024
|
June 30, 2024
|
September 30, 2023
|
September 30, 2024
|
September 30, 2023
|
||||||||||||||||
|
Residential mortgage
|
-0.01
|
%
|
0.01
|
%
|
-0.01
|
%
|
0.01
|
%
|
0.04
|
%
|
||||||||||
|
Construction
|
-0.02
|
%
|
-0.02
|
%
|
-3.18
|
%
|
-0.02
|
%
|
-1.58
|
%
|
||||||||||
|
Commercial mortgage
|
-0.01
|
%
|
-0.07
|
%
|
-0.01
|
%
|
-0.03
|
%
|
-0.01
|
%
|
||||||||||
|
Commercial and Industrial
|
0.14
|
%
|
-0.08
|
%
|
-0.02
|
%
|
-0.17
|
%
|
0.28
|
%
|
||||||||||
|
Consumer loans and finance leases
|
2.47
|
%
|
2.38
|
%
|
1.79
|
%
|
2.19
|
%(1)
|
1.61
|
%
|
||||||||||
|
Total loans
|
0.78
|
%
|
0.69
|
%
|
0.48
|
%
|
0.61
|
%(1)
|
0.54
|
%
|
||||||||||
| (1) |
The $10.0 million recovery associated with the aforementioned bulk sale reduced the consumer loans and finance leases and total net charge-offs to related average loans ratio
for the for the nine-month period ended September 30, 2024 by 36 basis points and 11 basis points, respectively.
|
First BanCorp. Announces Earnings for the Quarter Ended September 30, 2024 – Page 27 of 27
Table 11 – Deposits
|
As of
|
||||||||||||
|
September 30, 2024
|
June 30, 2024
|
December 31, 2023
|
||||||||||
|
(In thousands)
|
||||||||||||
|
Time deposits
|
$
|
3,067,261
|
$
|
3,037,120
|
$
|
2,833,730
|
||||||
|
Interest-bearing saving and checking accounts
|
7,484,348
|
7,461,003
|
7,534,800
|
|||||||||
|
Non-interest-bearing deposits
|
5,275,733
|
5,406,054
|
5,404,121
|
|||||||||
|
Total deposits, excluding brokered CDs (1)
|
15,827,342
|
15,904,177
|
15,772,651
|
|||||||||
|
Brokered CDs
|
520,048
|
624,779
|
783,334
|
|||||||||
|
Total deposits
|
$
|
16,347,390
|
$
|
16,528,956
|
$
|
16,555,985
|
||||||
|
Total deposits, excluding brokered CDs and government deposits
|
$
|
12,669,900
|
$
|
12,706,646
|
$
|
12,600,719
|
||||||
| (1) |
As of each of September 30, 2024, June 30, 2024 and December 31, 2023, government deposits amounted to $3.2 billion.
|