vz-2024102210/22/20240000732712false00007327122024-10-222024-10-220000732712exch:XNYMus-gaap:CommonStockMember2024-10-222024-10-220000732712exch:XNGSus-gaap:CommonStockMember2024-10-222024-10-220000732712vz:A0.875NotesDue2025Member2024-10-222024-10-220000732712vz:A3.250NotesDue2026Member2024-10-222024-10-220000732712vz:A1.375NotesDue2026Member2024-10-222024-10-220000732712vz:A0.875NotesDue2027Member2024-10-222024-10-220000732712vz:A1.375NotesDue2028Member2024-10-222024-10-220000732712vz:A1125NotesDue2028Member2024-10-222024-10-220000732712vz:A2350FixedRateNotesDue2028Member2024-10-222024-10-220000732712vz:A1.875NotesDue2029Member2024-10-222024-10-220000732712vz:A0375NotesDue2029Member2024-10-222024-10-220000732712vz:A1.250NotesDue2030Member2024-10-222024-10-220000732712vz:A1.875NotesDue2030Member2024-10-222024-10-220000732712vz:NotesDue20304250Member2024-10-222024-10-220000732712vz:A2.625NotesDue2031Member2024-10-222024-10-220000732712vz:A2.500NotesDue2031Member2024-10-222024-10-220000732712vz:A3000FixedRateNotesDue2031Member2024-10-222024-10-220000732712vz:A0.875NotesDue2032Member2024-10-222024-10-220000732712vz:A0750NotesDue2032Member2024-10-222024-10-220000732712vz:A3.500NotesDue2032Member2024-10-222024-10-220000732712vz:A1300NotesDue2033Member2024-10-222024-10-220000732712vz:NotesDue2034475Member2024-10-222024-10-220000732712vz:A4.750NotesDue2034Member2024-10-222024-10-220000732712vz:A3.125NotesDue2035Member2024-10-222024-10-220000732712vz:A1125NotesDue2035Member2024-10-222024-10-220000732712vz:A3.375NotesDue2036Member2024-10-222024-10-220000732712vz:A3.750NotesDue2036Member2024-10-222024-10-220000732712vz:A2.875NotesDue2038Member2024-10-222024-10-220000732712vz:A1875NotesDue2038Member2024-10-222024-10-220000732712vz:A1.500NotesDue2039Member2024-10-222024-10-220000732712vz:A3.500FixedRateNotesDue2039Member2024-10-222024-10-220000732712vz:A1850NotesDue2040Member2024-10-222024-10-220000732712vz:A3850FixedRateNotesDue2041Member2024-10-222024-10-22
UNITED STATES
SECURITIES AND EXCHANGE COMMISSION
Washington, D.C. 20549
_____________________________________________________________________________
FORM 8-K
______________________________________________________________________________
CURRENT REPORT
Pursuant to Section 13 or 15(d) of the
Securities Exchange Act of 1934
Date of Report: October 22, 2024
(Date of earliest event reported)
______________________________________________________________________________
Verizon Communications Inc.
(Exact name of registrant as specified in its charter)
_______________________________________________________________________________
| | | | | | | | | | | |
| | | |
| Delaware | 1-8606 | 23-2259884 |
(State or other jurisdiction
of incorporation) | (Commission File Number) | (I.R.S. Employer Identification No.) |
| | | |
| 1095 Avenue of the Americas | | 10036 |
| New York, | New York | | |
| (Address of principal executive offices) | | (Zip Code) |
Registrant’s telephone number, including area code: (212) 395-1000
Not Applicable
(Former name or former address, if changed since last report)
Check the appropriate box below if the Form 8-K filing is intended to simultaneously satisfy the filing obligation of the registrant under any of the following provisions:
☐ Written communications pursuant to Rule 425 under the Securities Act (17 CFR 230.425)
☐ Soliciting material pursuant to Rule 14a-12 under the Exchange Act (17 CFR 240.14a-12)
☐ Pre-commencement communications pursuant to Rule 14d-2(b) under the Exchange Act (17 CFR 240.14d-2(b))
☐ Pre-commencement communications pursuant to Rule 13e-4(c) under the Exchange Act (17 CFR 240.13e-4(c))
Securities registered pursuant to Section 12(b) of the Act:
| | | | | | | | | | | | | | |
| Title of Each Class | | Trading Symbol(s) | | Name of Each Exchange on Which Registered |
| Common Stock, par value $0.10 | | VZ | | New York Stock Exchange |
| Common Stock, par value $0.10 | | VZ | | The Nasdaq Global Select Market |
| 0.875% Notes due 2025 | | VZ 25 | | New York Stock Exchange |
| 3.25% Notes due 2026 | | VZ 26 | | New York Stock Exchange |
| 1.375% Notes due 2026 | | VZ 26B | | New York Stock Exchange |
| 0.875% Notes due 2027 | | VZ 27E | | New York Stock Exchange |
| 1.375% Notes due 2028 | | VZ 28 | | New York Stock Exchange |
| 1.125% Notes due 2028 | | VZ 28A | | New York Stock Exchange |
| 2.350% Fixed Rate Notes due 2028 | | VZ 28C | | New York Stock Exchange |
| 1.875% Notes due 2029 | | VZ 29B | | New York Stock Exchange |
| 0.375% Notes due 2029 | | VZ 29D | | New York Stock Exchange |
| 1.250% Notes due 2030 | | VZ 30 | | New York Stock Exchange |
| 1.875% Notes due 2030 | | VZ 30A | | New York Stock Exchange |
| 4.250% Notes due 2030 | | VZ 30D | | New York Stock Exchange |
| 2.625% Notes due 2031 | | VZ 31 | | New York Stock Exchange |
| 2.500% Notes due 2031 | | VZ 31A | | New York Stock Exchange |
| 3.000% Fixed Rate Notes due 2031 | | VZ 31D | | New York Stock Exchange |
| 0.875% Notes due 2032 | | VZ 32 | | New York Stock Exchange |
| 0.750% Notes due 2032 | | VZ 32A | | New York Stock Exchange |
| 3.500% Notes due 2032 | | VZ 32B | | New York Stock Exchange |
| 1.300% Notes due 2033 | | VZ 33B | | New York Stock Exchange |
| 4.75% Notes due 2034 | | VZ 34 | | New York Stock Exchange |
| 4.750% Notes due 2034 | | VZ 34C | | New York Stock Exchange |
| 3.125% Notes due 2035 | | VZ 35 | | New York Stock Exchange |
| 1.125% Notes due 2035 | | VZ 35A | | New York Stock Exchange |
| 3.375% Notes due 2036 | | VZ 36A | | New York Stock Exchange |
| 3.750% Notes due 2036 | | VZ 36B | | New York Stock Exchange |
| 2.875% Notes due 2038 | | VZ 38B | | New York Stock Exchange |
| 1.875% Notes due 2038 | | VZ 38C | | New York Stock Exchange |
| 1.500% Notes due 2039 | | VZ 39C | | New York Stock Exchange |
| 3.50% Fixed Rate Notes due 2039 | | VZ 39D | | New York Stock Exchange |
| 1.850% Notes due 2040 | | VZ 40 | | New York Stock Exchange |
| 3.850% Fixed Rate Notes due 2041 | | VZ 41C | | New York Stock Exchange |
Indicate by check mark whether the registrant is an emerging growth company as defined in Rule 405 of the Securities Act of 1933 (§230.405 of this chapter) or Rule 12b-2 of the Securities Exchange Act of 1934 (§240.12b-2 of this chapter).
☐ Emerging growth company
If an emerging growth company, indicate by check mark if the registrant has elected not to use the extended transition period for complying with any new or revised financial accounting standards provided pursuant to Section 13(a) of the Exchange Act. ☐
Item 2.02. Results of Operations and Financial Condition
Attached as Exhibit 99.1 hereto are a press release and financial tables, dated October 22, 2024, issued by Verizon Communications Inc. (Verizon). Attached as Exhibit 99.2 hereto is commentary, dated October 22, 2024, discussing Verizon's financial and operating results for the third quarter of 2024.
Non-GAAP Measures
Verizon’s press release, financial tables and commentary attached to the report include financial information prepared in conformity with generally accepted accounting principles in the United States (GAAP) as well as non-GAAP financial information. It is management's intent to provide non-GAAP financial information to enhance the understanding of Verizon's GAAP financial information and it should be considered by the reader in addition to, but not instead of, the financial statements prepared in accordance with GAAP. Each non-GAAP financial measure is presented along with the corresponding GAAP measure so as not to imply that more emphasis should be placed on the non-GAAP measure. We believe that providing these non-GAAP measures in addition to the GAAP measures allows management, investors and other users of our financial information to more fully and accurately assess both consolidated and segment performance. The non-GAAP financial information presented may be determined or calculated differently by other companies and may not be directly comparable to that of other companies.
EBITDA and EBITDA Margin Related Non-GAAP Measures
Consolidated earnings before interest, taxes, depreciation and amortization (EBITDA), Segment EBITDA and Segment EBITDA Margin are non-GAAP financial measures that we believe are useful to management, investors and other users of our financial information as they are widely accepted financial measures used in evaluating the profitability of a company and its operating performance in relation to its competitors.
Consolidated EBITDA is calculated by adding back interest, taxes and depreciation and amortization expense to net income.
Segment EBITDA is calculated by adding back segment depreciation and amortization expense to segment operating income. Segment EBITDA Margin is calculated by dividing Segment EBITDA by total segment operating revenues.
Consolidated Adjusted EBITDA and Consolidated Adjusted EBITDA Growth Forecast
Consolidated Adjusted EBITDA and Consolidated Adjusted EBITDA Growth Forecast are non-GAAP financial measures that we believe provide relevant and useful information to management, investors and other users of our financial information in evaluating the effectiveness of our operations and underlying business trends. We believe that Consolidated Adjusted EBITDA and Consolidated Adjusted EBITDA Growth Forecast are used by investors to compare a company’s operating performance to its competitors by minimizing impacts caused by differences in capital structure, taxes and depreciation and amortization policies. Further, the exclusion of non-operational items and special items enables comparability to prior period performance and trend analysis.
Consolidated Adjusted EBITDA is calculated by excluding from Consolidated EBITDA the effect of the following non-operational items: equity in earnings and losses of unconsolidated businesses and other income and expense, net, and the following special items: severance charges, asset and business rationalization, legacy legal matter, Verizon Business Group ("Verizon Business") goodwill impairment, legal settlement, business transformation costs and non-strategic business shutdown. Severance charges recorded during 2024 relate to separations under our voluntary separation program for select U.S.-based management employees as well as other headcount reduction initiatives. Severance charges recorded during 2023 and 2022 primarily relate to involuntary separations under our existing plans. Asset and business rationalization recorded during 2024 predominately relates to the decision to cease use of certain real estate assets and exit non-strategic portions of certain businesses, as part of our continued transformation initiatives. Asset rationalization recorded during the second quarter of 2023 relates to certain real estate and non-strategic assets that we made a decision to cease use of as part of our transformation initiatives. Asset rationalization recorded during the fourth quarter of 2023 primarily relates to Verizon Business network assets that we made a decision to cease use of as part of our transformation initiatives. Legacy legal matter recorded during 2024 relates to a litigation matter associated with a legacy contract for the production of telephone directories in Costa Rica by a subsidiary of Verizon. Verizon Business goodwill impairment relates to an impairment charge recognized in the fourth quarter of 2023 as a result of Verizon's annual goodwill impairment test. Legal settlement recorded during 2023 relates to the settlement of a litigation matter regarding certain administrative fees. Business transformation costs recorded during 2023 primarily relate to costs incurred in connection with strategic partnership initiatives in our managed network support services for certain Verizon Business customers. Non-strategic business shutdown relates to the shutdown of our BlueJeans business offering in 2023.
We have not provided a reconciliation for our Consolidated Adjusted EBITDA Growth Forecast because we cannot, without unreasonable effort, predict the special items that could arise during 2024.
Net Unsecured Debt and Net Unsecured Debt to Consolidated Adjusted EBITDA Ratio
Net Unsecured Debt and Net Unsecured Debt to Consolidated Adjusted EBITDA Ratio are non-GAAP financial measures that we believe are useful to management, investors and other users of our financial information in evaluating Verizon’s ability to service its unsecured debt from continuing operations.
Net Unsecured Debt is calculated by subtracting secured debt and cash and cash equivalents from the sum of debt maturing within one year and long-term debt. Net Unsecured Debt to Consolidated Adjusted EBITDA Ratio is calculated by dividing Net Unsecured Debt by Consolidated Adjusted EBITDA. For purposes of Net Unsecured Debt to Consolidated Adjusted EBITDA Ratio, Consolidated Adjusted EBITDA is calculated for the last twelve months.
Adjusted Earnings per Common Share (Adjusted EPS) and Adjusted EPS Forecast
Adjusted EPS and Adjusted EPS Forecast are non-GAAP financial measures that we believe are useful to management, investors and other users of our financial information in evaluating our operating results and understanding our operating trends without the effect of special items which could vary from period to period. We believe excluding special items provides more comparable assessment of our financial results from period to period.
Adjusted EPS is calculated by excluding from the calculation of reported EPS the effect of the following special items: amortization of acquisition-related intangible assets, severance charges, asset and business rationalization, business transformation costs and non-strategic business shutdown.
We exclude the amortization of acquisition-related intangible assets because the amount and timing of such charges are significantly impacted by the timing, size, number and nature of the acquisitions we consummate. While we have a history of significant acquisition activity, we do not acquire businesses on a predictable cycle, and the amount of an acquisition’s purchase price allocated to intangible assets and related amortization term are unique to each acquisition and can vary significantly from acquisition to acquisition. Exclusion of this amortization expense facilitates more consistent comparisons of operating results over time between our newly acquired and long-held businesses, and with both acquisitive and non-acquisitive peer companies. We believe that it is important for investors to understand that our non-GAAP financial measure adjusts for the intangible asset amortization but does not adjust the revenue that is generated in part from the use of such intangible assets.
We have not provided a reconciliation for our Adjusted EPS Forecast because we cannot, without unreasonable effort, predict the special items that could arise during 2024.
Adjusted Effective Income Tax Rate Attributable to Verizon Forecast (Adjusted ETR Forecast)
Adjusted ETR Forecast is a non-GAAP financial measure that we believe is useful to management, investors and other users of our financial information in assessing our effective income tax rate without the effect of special items which could vary from period to period. Adjusted ETR Forecast is calculated by dividing the provision for income taxes by net income attributable to Verizon before tax after adjusting for the effect of special items.
We have not provided a reconciliation for our Adjusted ETR Forecast because we cannot, without unreasonable effort, predict the special items that could arise during 2024.
Free Cash Flow
Free cash flow is a non-GAAP financial measure that reflects an additional way of viewing our liquidity that, when viewed with our GAAP results, provides a more complete understanding of factors and trends affecting our cash flows. We believe it is a more conservative measure of cash flow since capital expenditures are necessary for ongoing operations. Free cash flow has limitations due to the fact that it does not represent the residual cash flow available for discretionary expenditures. For example, free cash flow does not incorporate payments made or expected to be made on finance lease obligations or cash payments for acquisitions of businesses or wireless licenses. Therefore, we believe it is important to view free cash flow as a complement to our entire consolidated statements of cash flows.
Free cash flow is calculated by subtracting capital expenditures (including capitalized software) from net cash provided by operating activities.
Consolidated Operating Expenses Excluding Depreciation and Amortization and Special Items
Consolidated operating expenses excluding depreciation and amortization and special items is a non-GAAP financial measure that we believe is useful to management, investors and other users of our financial information in evaluating our operating expenses and underlying operating trends. We believe that consolidated operating expenses excluding depreciation and amortization and special items is used by investors to more accurately compare a company’s operating expenses to those of its competitors by eliminating impacts caused by differences in depreciation and amortization policies. In addition, the exclusion of the effects of special items allows for better comparability of our financial results from period to period.
Consolidated operating expenses excluding depreciation and amortization and special items is calculated by excluding from consolidated operating expenses the effects of depreciation and amortization expense and the following special items: severance charges, asset and business rationalization, business transformation costs and non-strategic business shutdown.
See the accompanying schedules for reconciliations of non-GAAP financial measures to GAAP.
Item 9.01. Financial Statements and Exhibits
| | | | | | | | |
| (d) Exhibits. | | |
| |
Exhibit
Number | | Description |
| |
| | Press release and financial tables, dated October 22, 2024, issued by Verizon Communications Inc. |
| | Commentary discussing financial and operating results of Verizon Communications Inc. for the third quarter of 2024. |
| | |
| | |
| 104 | | Cover Page Interactive Data File (formatted as inline XBRL). |
| | |
| | |
| | |
| | |
| | |
| | |
| | |
| | |
| | |
| | |
SIGNATURE
Pursuant to the requirements of the Securities Exchange Act of 1934, the registrant has duly caused this report to be signed on its behalf by the undersigned, thereunto duly authorized.
| | | | | | | | | | | | | | | | | | | | |
| | | | | | Verizon Communications Inc. |
| | | | | | (Registrant) |
| | | | |
| Date: | | October 22, 2024 | | | | /s/ Mary-Lee Stillwell |
| | | | | | Mary-Lee Stillwell |
| | | | | | Senior Vice President and Controller |
Exhibit 99.1
News Release
| | | | | |
FOR IMMEDIATE RELEASE | Media contacts: |
| October 22, 2024 | Katie Magnotta |
| 201-602-9235 |
| katie.magnotta@verizon.com |
| |
| Eric Wilkens |
| 201-572-9317 |
| eric.wilkens@verizon.com |
Verizon delivers strong third quarter results with customer growth in mobility, extending industry leadership
Achieves fixed wireless subscriber target 15 months ahead of schedule and double-digit growth in total broadband connections
Company remains on track to meet full-year 2024 financial guidance
3Q 2024 Highlights
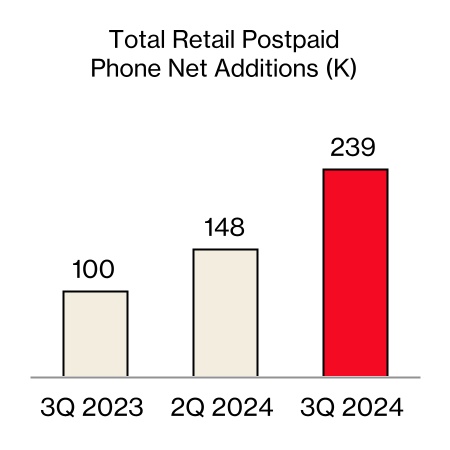
Wireless: More than doubled wireless postpaid phone net additions year over year
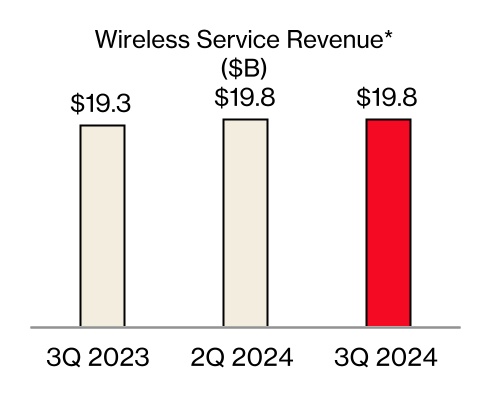
•Total wireless service revenue1 of $19.8 billion, a 2.7 percent increase year over year.
•Retail postpaid phone net additions of 239,000, and retail postpaid net additions of 349,000.
•Retail postpaid phone churn of 0.89 percent, and retail postpaid churn of 1.16 percent.
Broadband: Achieved fixed wireless subscriber target 15 months ahead of schedule
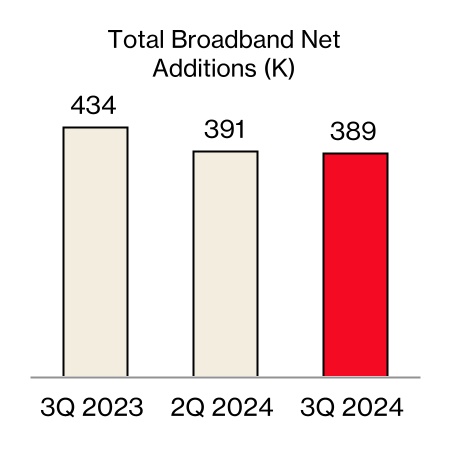
•Total broadband net additions of 389,000. This was the ninth consecutive quarter with more than 375,000 broadband net additions.
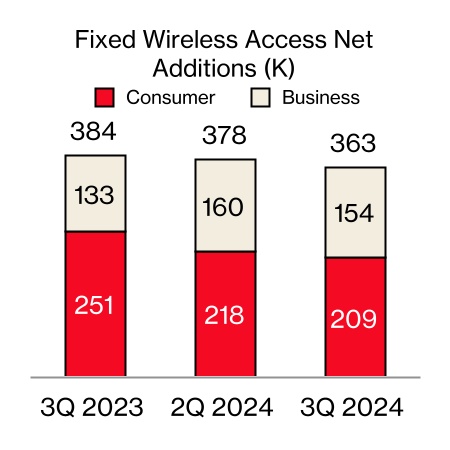
•Total fixed wireless net additions of 363,000. At the end of third-quarter 2024, the company had a base of nearly 4.2 million fixed wireless subscribers. The company reached its fixed wireless subscriber target 15 months ahead of schedule, which is a reflection of the product's popularity and customer demand for high quality broadband services.
•Total broadband connections grew to more than 11.9 million as of the end of third-quarter 2024, representing a nearly 16 percent increase year over year.
•Fixed wireless revenue for third-quarter 2024 was $562 million, up $215 million year over year.
Page 1
VlpHU09DSUQyMDE5UTE=
Consolidated: Sustained focus on profitable growth
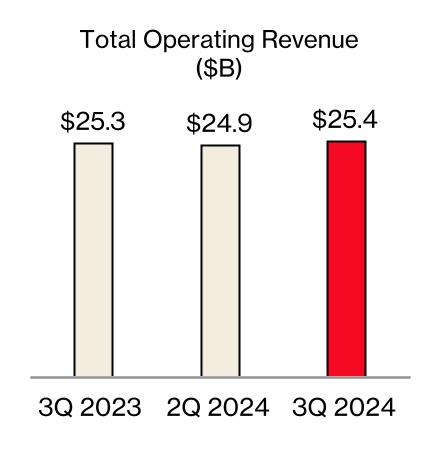
•Total operating revenue of $33.3 billion, essentially flat compared to third-quarter 2023.
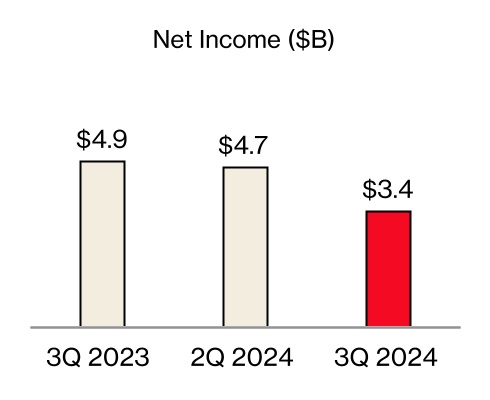
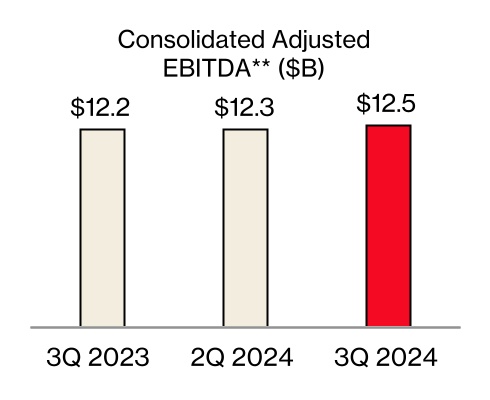
•Consolidated net income for the third quarter of $3.4 billion, down from consolidated net income of $4.9 billion in third-quarter 2023. This decrease was primarily driven by severance charges of $1.7 billion related to separations under the company's voluntary separation program for select U.S.-based management employees as well as other headcount reduction initiatives. Consolidated adjusted EBITDA2 for the third quarter of $12.5 billion, up from $12.2 billion in third-quarter 2023.
•Earnings per share of $0.78, compared with earnings per share of $1.13 in third-quarter 2023; adjusted EPS2, excluding special items, of $1.19, compared with $1.22 in third-quarter 2023.
NEW YORK - Verizon Communications Inc. (NYSE, Nasdaq: VZ) reported third-quarter 2024 results today with customer growth in mobility and broadband. The company also continued its momentum in its three financial priorities of wireless service revenue, consolidated adjusted EBITDA and free cash flow.
"This has been a pivotal quarter for Verizon, with transformative strategic moves and continued operational excellence. We continue to deliver strong results in mobility and broadband, and we are on track to meet our full-year 2024 financial guidance, with wireless service revenue and adjusted EBITDA trending at or above the midpoint of the guided range," said Verizon Chairman and CEO Hans Vestberg. "Our new products — myPlan, myHome and Verizon Business Complete — and our brand refresh are resonating with customers. Through our pending acquisition of Frontier Communications, and our agreement for Vertical Bridge to lease, operate and manage thousands of wireless communications towers, we have set Verizon up for disciplined growth, now and into the future."
For third-quarter 2024, Verizon reported earnings per share of $0.78, compared with earnings per share of $1.13 in third-quarter 2023. On an adjusted basis2, excluding special items, EPS was $1.19 in third-quarter 2024, compared with adjusted EPS2 of $1.22 in third-quarter 2023.
Reported third-quarter 2024 financial results reflected $2.3 billion in charges related to special items. This included a severance charge of $1.7 billion related to separations under the
Page 2
VlpHU09DSUQyMDE5UTE=
company's voluntary separation program for select U.S.-based management employees as well as other headcount reduction initiatives; an asset and business rationalization charge of $374 million predominantly related to the decision to cease use of certain real estate assets and exit non-strategic portions of certain businesses; and amortization of intangible assets of $186 million related to Tracfone and other acquisitions.
Consolidated results: Financially disciplined, consistent with overall strategy
•Total consolidated operating revenue in third-quarter 2024 was $33.3 billion, essentially flat compared to third-quarter 2023, as service and other revenue growth was offset by declines in wireless equipment revenue.
•Total wireless service revenue1 in third-quarter 2024 was $19.8 billion, a sequential increase of $70 million, and an increase of 2.7 percent year over year. This increase was primarily driven by pricing actions implemented in recent quarters and growth from fixed wireless connections.
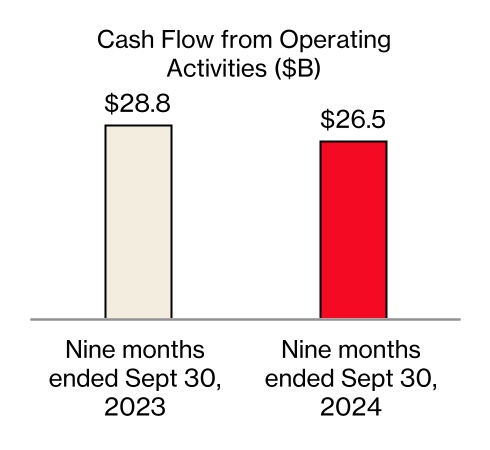
•Cash flow from operations year-to-date3 totaled $26.5 billion, compared with $28.8 billion in 2023. This result reflects higher cash taxes, as well as higher interest expense primarily driven by the decrease in capitalized interest and higher interest rates.
•Capital expenditures year-to-date3 were $12.0 billion.
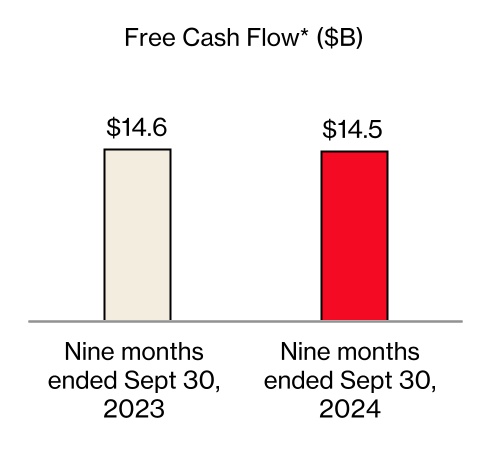
•Free cash flow2 year-to-date3 was $14.5 billion, compared with $14.6 billion in 2023.
•Consolidated net income for third-quarter 2024 was $3.4 billion, down from consolidated net income of $4.9 billion in third-quarter 2023, and consolidated adjusted EBITDA2 was $12.5 billion, up from $12.2 billion in third-quarter 2023.
•Verizon's total unsecured debt as of the end of third-quarter 2024 was $126.4 billion, a $1.1 billion increase compared to second-quarter 2024, and approximately $70 million lower year over year. The company's net unsecured debt2 at the end of third-quarter 2024 was $121.4 billion. At the end of third-quarter 2024, Verizon's ratio of unsecured debt to net income (LTM) was 12.3 times and net unsecured debt to consolidated adjusted EBITDA ratio2 was 2.5 times.
Verizon Consumer: Seventh consecutive quarter of year over year growth in postpaid phone gross additions
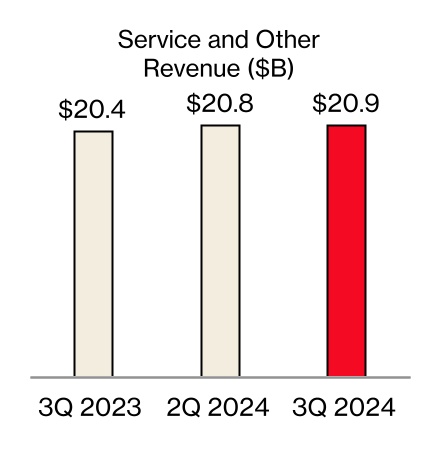
•Total Verizon Consumer revenue in third-quarter 2024 was $25.4 billion, an increase of 0.4 percent year over year as gains in service revenue were partially offset by declines in wireless equipment revenue.
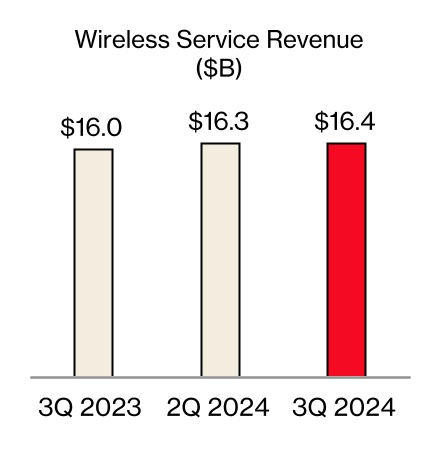
•Wireless service revenue in third-quarter 2024 was $16.4 billion, up 2.6 percent year over year, driven by growth in Consumer wireless postpaid average revenue per account (ARPA) from pricing actions and continued fixed wireless adoption.
Page 3
VlpHU09DSUQyMDE5UTE=
•Consumer wireless retail postpaid churn was 1.07 percent in third-quarter 2024, and wireless retail postpaid phone churn was 0.84 percent.
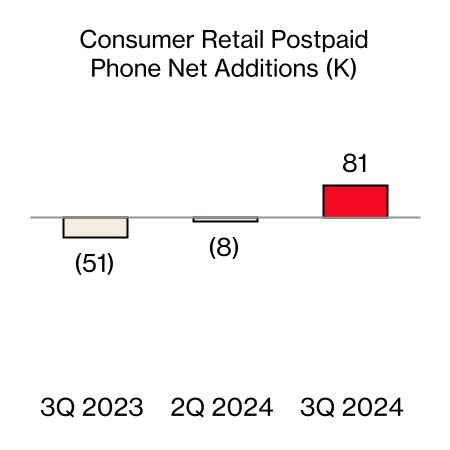
•In third-quarter 2024, Consumer reported 81,000 wireless retail postpaid phone net additions, compared with 51,000 net losses in third-quarter 2023. This improvement was driven by a 5.9 percent year over year increase in postpaid phone gross additions. This marks the seventh consecutive quarter of year over year growth in postpaid phone gross additions. Excluding the contribution from the company's second number offering, Consumer reported 18,000 wireless retail postpaid phone net additions. Verizon expects to have positive Consumer postpaid phone net additions for full-year 2024, with and without the contribution from the second number offering.
•In third-quarter 2024, Consumer reported 80,000 wireless retail prepaid net additions, excluding Safelink, Verizon's brand offering access to government-sponsored connectivity benefits and programs.
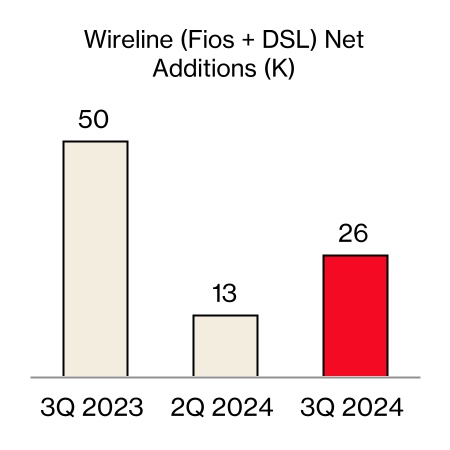
•Consumer reported 209,000 fixed wireless net additions and 39,000 Fios Internet net additions in third-quarter 2024. Consumer Fios revenue was $2.9 billion in third-quarter 2024.
•In third-quarter 2024, Consumer operating income was $7.6 billion, an increase of 0.8 percent year over year, and segment operating income margin was 30.0 percent, an increase from 29.9 percent in third-quarter 2023. Segment EBITDA2 in third-quarter 2024 was $11.0 billion, an increase of 1.8 percent year over year. This improvement can be attributed to service and other revenue growth partially offset by lower upgrade volumes. Segment EBITDA margin2 in third-quarter 2024 was 43.4 percent, an increase from 42.8 percent in third-quarter 2023.
Verizon Business: Continued mobility and broadband growth
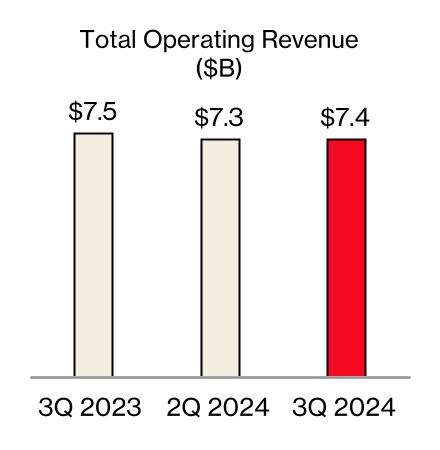
•Total Verizon Business revenue was $7.4 billion in third-quarter 2024, a decrease of 2.3 percent year over year, as increases in wireless service revenue were more than offset by decreases in wireline revenue.
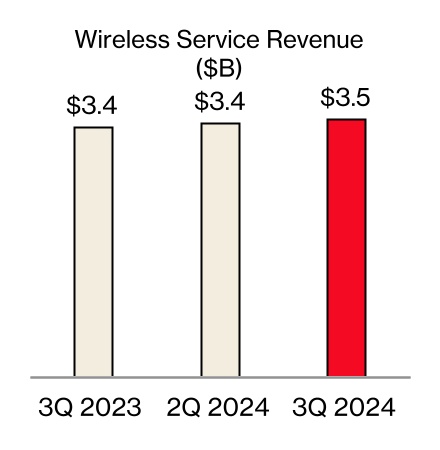
•Business wireless service revenue in third-quarter 2024 was $3.5 billion, an increase of 2.9 percent year over year. This result was driven by continued strong net additions for both mobility and fixed wireless, as well as benefits from pricing actions implemented in recent quarters.
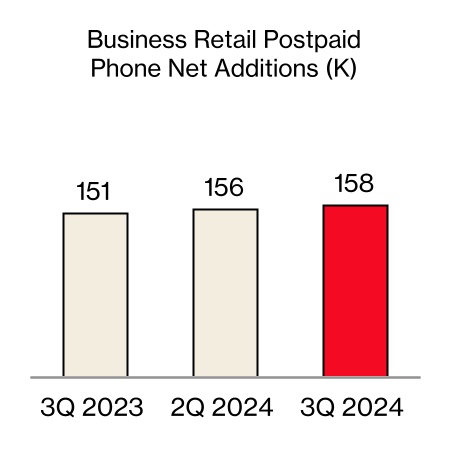
•Business reported 281,000 wireless retail postpaid net additions in third-quarter 2024. This result included 158,000 postpaid phone net additions. The company experienced sustained growth in phone net additions across its small and medium business, enterprise, and public sector customers throughout the quarter.
•Business wireless retail postpaid churn was 1.45 percent in third-quarter 2024, and wireless retail postpaid phone churn was 1.12 percent.
•Business reported 154,000 fixed wireless net additions in third-quarter 2024.
•In third-quarter 2024, Verizon Business operating income was $565 million, an increase of 4.8 percent year over year, and segment operating income margin was 7.7 percent,
Page 4
VlpHU09DSUQyMDE5UTE=
an increase from 7.2 percent in third-quarter 2023. Segment EBITDA2 in third-quarter 2024 was $1.6 billion, a decrease of 3.7 percent year over year, driven by continued declines in wireline revenues. Segment EBITDA margin2 in third-quarter 2024 was 21.8 percent, a decrease from 22.1 percent in third-quarter 2023.
Outlook and guidance: Verizon is on track to meet financial guidance
The company does not provide a reconciliation for any of the following adjusted (non-GAAP) forecasts because it cannot, without unreasonable effort, predict the special items that could arise, and the company is unable to address the probable significance of the unavailable information.
For 2024, Verizon continues to expect the following:
•Total wireless service revenue growth1 of 2.0 percent to 3.5 percent.
•Adjusted EBITDA growth2 of 1.0 percent to 3.0 percent.
•Adjusted EPS2 of $4.50 to $4.70.
•Capital expenditures between $17.0 billion and $17.5 billion.
•Adjusted effective income tax rate2 in the range of 22.5 percent to 24.0 percent.
1 Total wireless service revenue represents the sum of Consumer and Business segments.
2 Non-GAAP financial measure. See the accompanying schedules and www.verizon.com/about/investors for reconciliations of non-GAAP financial measures cited in this document to most directly comparable financial measures under generally accepted accounting principles (GAAP).
3 Nine months ended September 30, 2024.
Verizon Communications Inc. (NYSE, Nasdaq: VZ) powers and empowers how its millions of customers live, work and play, delivering on their demand for mobility, reliable network connectivity and security. Headquartered in New York City, serving countries worldwide and nearly all of the Fortune 500, Verizon generated revenues of $134.0 billion in 2023. Verizon’s world-class team never stops innovating to meet customers where they are today and equip them for the needs of tomorrow. For more, visit verizon.com or find a retail location at verizon.com/stores.
####
VERIZON’S ONLINE MEDIA CENTER: News releases, stories, media contacts and other resources are available at verizon.com/news. News releases are also available through an RSS feed. To subscribe, visit www.verizon.com/about/rss-feeds/.
Forward-looking statements
In this communication we have made forward-looking statements. These statements are based on our estimates and assumptions and are subject to risks and uncertainties. Forward-looking statements include the information concerning our possible or assumed future results of operations. Forward-looking statements also include those preceded or followed by the words “anticipates,” “assumes,” “believes,” “estimates,” “expects,” “forecasts,” “hopes,” “intends,” “plans,” “targets” or similar expressions. For those statements, we claim the protection of the safe harbor for forward-looking statements contained in the Private Securities Litigation Reform Act of 1995. We undertake no obligation to revise or publicly release the results of any revision to these forward-looking statements, except as required by law. Given these risks and uncertainties, readers are cautioned not to place undue reliance on such forward-looking statements. The following important factors, along with those discussed in our filings with the Securities and Exchange Commission (the “SEC”), could affect future results and could cause those results to differ materially from those expressed in the forward-looking statements: the effects of competition in the markets in which we operate, including the inability to successfully respond to competitive factors such as prices, promotional
Page 5
VlpHU09DSUQyMDE5UTE=
incentives and evolving consumer preferences; failure to take advantage of, or respond to competitors' use of, developments in technology and address changes in consumer demand; performance issues or delays in the deployment of our 5G network resulting in significant costs or a reduction in the anticipated benefits of the enhancement to our networks; the inability to implement our business strategy; adverse conditions in the U.S. and international economies, including inflation and changing interest rates in the markets in which we operate; cyber attacks impacting our networks or systems and any resulting financial or reputational impact; damage to our infrastructure or disruption of our operations from natural disasters, extreme weather conditions, acts of war, terrorist attacks or other hostile acts and any resulting financial or reputational impact; disruption of our key suppliers’ or vendors' provisioning of products or services, including as a result of geopolitical factors or the potential impacts of global climate change; material adverse changes in labor matters and any resulting financial or operational impact; damage to our reputation or brands; the impact of public health crises on our operations, our employees and the ways in which our customers use our networks and other products and services; changes in the regulatory environment in which we operate, including any increase in restrictions on our ability to operate our networks or businesses; allegations regarding the release of hazardous materials or pollutants into the environment from our, or our predecessors’, network assets and any related government investigations, regulatory developments, litigation, penalties and other liability, remediation and compliance costs, operational impacts or reputational damage; our high level of indebtedness; significant litigation and any resulting material expenses incurred in defending against lawsuits or paying awards or settlements; an adverse change in the ratings afforded our debt securities by nationally accredited ratings organizations or adverse conditions in the credit markets affecting the cost, including interest rates, and/or availability of further financing; significant increases in benefit plan costs or lower investment returns on plan assets; changes in tax laws or regulations, or in their interpretation, or challenges to our tax positions, resulting in additional tax expense or liabilities; changes in accounting assumptions that regulatory agencies, including the SEC, may require or that result from changes in the accounting rules or their application, which could result in an impact on earnings; and risks associated with mergers, acquisitions and other strategic transactions, including our ability to consummate the proposed acquisition of Frontier Communications Parent, Inc. and obtain cost savings, synergies and other anticipated benefits within the expected time period or at all.
Page 6
VlpHU09DSUQyMDE5UTE=
Verizon Communications Inc.
Condensed Consolidated Statements of Income
| | | | | | | | | | | | | | | | | | | | | | | | | | | | | | | | | | | | | | |
(dollars in millions, except per share amounts) |
| Unaudited | | 3 Mos. Ended 9/30/24 | | 3 Mos. Ended 9/30/23 | | %
Change | | 9 Mos. Ended 9/30/24 | | 9 Mos. Ended 9/30/23 | | %
Change |
| | | | | | | | | | | | |
| Operating Revenues | | | | | | | | | | | | |
| Service revenues and other | | $ | 27,987 | | | $ | 27,523 | | | 1.7 | | $ | 83,405 | | | $ | 81,994 | | | 1.7 |
| Wireless equipment revenues | | 5,343 | | | 5,813 | | | (8.1) | | 15,702 | | | 16,850 | | | (6.8) |
| Total Operating Revenues | | 33,330 | | | 33,336 | | | — | | 99,107 | | | 98,844 | | | 0.3 |
| | | | | | | | | | | | |
| Operating Expenses | | | | | | | | | | | | |
| Cost of services | | 7,193 | | | 7,084 | | | 1.5 | | 21,064 | | | 21,148 | | | (0.4) |
| Cost of wireless equipment | | 6,047 | | | 6,353 | | | (4.8) | | 17,519 | | | 18,557 | | | (5.6) |
| Selling, general and administrative expense | | 9,706 | | | 7,995 | | | 21.4 | | 25,873 | | | 23,754 | | | 8.9 |
| Depreciation and amortization expense | | 4,458 | | | 4,431 | | | 0.6 | | 13,386 | | | 13,108 | | | 2.1 |
| | | | | | | | | | | | |
| Total Operating Expenses | | 27,404 | | | 25,863 | | | 6.0 | | 77,842 | | | 76,567 | | | 1.7 |
| | | | | | | | | | | | |
| Operating Income | | 5,926 | | | 7,473 | | | (20.7) | | 21,265 | | | 22,277 | | | (4.5) |
| Equity in losses of unconsolidated businesses | | (24) | | | (18) | | | 33.3 | | (47) | | | (42) | | | 11.9 |
| Other income, net | | 72 | | | 170 | | | (57.6) | | 198 | | | 494 | | | (59.9) |
| Interest expense | | (1,672) | | | (1,433) | | | 16.7 | | (5,005) | | | (3,925) | | | 27.5 |
| Income Before Provision For Income Taxes | | 4,302 | | | 6,192 | | | (30.5) | | 16,411 | | | 18,804 | | | (12.7) |
| Provision for income taxes | | (891) | | | (1,308) | | | (31.9) | | (3,576) | | | (4,136) | | | (13.5) |
| Net Income | | $ | 3,411 | | | $ | 4,884 | | | (30.2) | | $ | 12,835 | | | $ | 14,668 | | | (12.5) |
| | | | | | | | | | | | |
| Net income attributable to noncontrolling interests | | $ | 105 | | | $ | 122 | | | (13.9) | | $ | 334 | | | $ | 349 | | | (4.3) |
| Net income attributable to Verizon | | 3,306 | | | 4,762 | | | (30.6) | | 12,501 | | | 14,319 | | | (12.7) |
| Net Income | | $ | 3,411 | | | $ | 4,884 | | | (30.2) | | $ | 12,835 | | | $ | 14,668 | | | (12.5) |
| | | | | | | | | | | | |
| Basic Earnings Per Common Share | | | | | | | | | | | | |
| Net income attributable to Verizon | | $ | 0.78 | | | $ | 1.13 | | | (31.0) | | $ | 2.96 | | | $ | 3.40 | | | (12.9) |
| Weighted-average shares outstanding (in millions) | | 4,220 | | | 4,213 | | | | | 4,217 | | | 4,209 | | | |
| | | | | | | | | | | | |
Diluted Earnings Per Common Share(1) | | | | | | | | | | | | |
| Net income attributable to Verizon | | $ | 0.78 | | | $ | 1.13 | | | (31.0) | | $ | 2.96 | | | $ | 3.40 | | | (12.9) |
| Weighted-average shares outstanding (in millions) | | 4,225 | | | 4,216 | | | | | 4,221 | | | 4,214 | | | |
Footnotes: (1)Diluted Earnings per Common Share includes the dilutive effect of shares issuable under our stock-based compensation plans, which represents the only potential dilution.
Verizon Communications Inc.
Condensed Consolidated Balance Sheets
| | | | | | | | | | | | | | | | | | | | |
| (dollars in millions) |
| Unaudited | | 9/30/24 | | 12/31/23 | | $ Change |
| | | | | | |
| Assets | | | | | | |
| Current assets | | | | | | |
| Cash and cash equivalents | | $ | 4,987 | | | $ | 2,065 | | | $ | 2,922 | |
| Accounts receivable | | 27,040 | | | 26,102 | | | 938 | |
| Less Allowance for credit losses | | 1,086 | | | 1,017 | | | 69 | |
| | | | | | |
| Accounts receivable, net | | 25,954 | | | 25,085 | | | 869 | |
| Inventories | | 2,523 | | | 2,057 | | | 466 | |
| | | | | | |
| Prepaid expenses and other | | 7,177 | | | 7,607 | | | (430) | |
| Total current assets | | 40,641 | | | 36,814 | | | 3,827 | |
| | | | | | |
| Property, plant and equipment | | 327,555 | | | 320,108 | | | 7,447 | |
| Less Accumulated depreciation | | 220,027 | | | 211,798 | | | 8,229 | |
| Property, plant and equipment, net | | 107,528 | | | 108,310 | | | (782) | |
| Investments in unconsolidated businesses | | 867 | | | 953 | | | (86) | |
| Wireless licenses | | 156,481 | | | 155,667 | | | 814 | |
| | | | | | |
| Goodwill | | 22,844 | | | 22,843 | | | 1 | |
| Other intangible assets, net | | 10,674 | | | 11,057 | | | (383) | |
| Operating lease right-of-use assets | | 23,613 | | | 24,726 | | | (1,113) | |
| Other assets | | 18,516 | | | 19,885 | | | (1,369) | |
| Total assets | | $ | 381,164 | | | $ | 380,255 | | | $ | 909 | |
| | | | | | |
| Liabilities and Equity | | | | | | |
| Current liabilities | | | | | | |
| Debt maturing within one year | | $ | 21,763 | | | $ | 12,973 | | | $ | 8,790 | |
| Accounts payable and accrued liabilities | | 22,222 | | | 23,453 | | | (1,231) | |
| | | | | | |
| Current operating lease liabilities | | 4,312 | | | 4,266 | | | 46 | |
| Other current liabilities | | 13,519 | | | 12,531 | | | 988 | |
| Total current liabilities | | 61,816 | | | 53,223 | | | 8,593 | |
| | | | | | |
| Long-term debt | | 128,878 | | | 137,701 | | | (8,823) | |
| Employee benefit obligations | | 12,744 | | | 13,189 | | | (445) | |
| Deferred income taxes | | 45,865 | | | 45,781 | | | 84 | |
| Non-current operating lease liabilities | | 19,247 | | | 20,002 | | | (755) | |
| Other liabilities | | 14,946 | | | 16,560 | | | (1,614) | |
| Total long-term liabilities | | 221,680 | | | 233,233 | | | (11,553) | |
| | | | | | |
| Equity | | | | | | |
| Common stock | | 429 | | | 429 | | | — | |
| Additional paid in capital | | 13,479 | | | 13,631 | | | (152) | |
| Retained earnings | | 86,958 | | | 82,915 | | | 4,043 | |
| Accumulated other comprehensive loss | | (1,665) | | | (1,380) | | | (285) | |
| Common stock in treasury, at cost | | (3,585) | | | (3,821) | | | 236 | |
| Deferred compensation – employee stock ownership plans and other | | 710 | | | 656 | | | 54 | |
| Noncontrolling interests | | 1,342 | | | 1,369 | | | (27) | |
| Total equity | | 97,668 | | | 93,799 | | | 3,869 | |
| Total liabilities and equity | | $ | 381,164 | | | $ | 380,255 | | | $ | 909 | |
Verizon Communications Inc.
Consolidated - Selected Financial and Operating Statistics
| | | | | | | | | | | | | | | | | | |
| (dollars in millions, except per share amounts) | | | | |
| Unaudited | | 9/30/24 | | 12/31/23 | | | | |
| | | | | | | | |
| Total debt | | $ | 150,641 | | | $ | 150,674 | | | | | |
| | | | | | | | |
| Unsecured debt | | $ | 126,369 | | | $ | 128,491 | | | | | |
Net unsecured debt(1) | | $ | 121,382 | | | $ | 126,426 | | | | | |
| | | | | | | | |
| Unsecured debt / Consolidated Net Income (LTM) | | 12.3 | x | | 10.6 | x | | | | |
Net unsecured debt / Consolidated Adjusted EBITDA(1)(2) | | 2.5 | x | | 2.6 | x | | | | |
| Common shares outstanding end of period (in millions) | | 4,210 | | | 4,204 | | | | | |
Total employees (‘000)(3) | | 101.2 | | | 105.4 | | | | | |
| Quarterly cash dividends declared per common share | | $ | 0.6775 | | | $ | 0.6650 | | | | | |
Footnotes:
(1)Non-GAAP financial measure.
(2)Consolidated Adjusted EBITDA excludes the effects of non-operational items and special items.
(3)Number of employees on a full-time equivalent basis.
Verizon Communications Inc.
Condensed Consolidated Statements of Cash Flows
| | | | | | | | | | | | | | | | | | | | |
| (dollars in millions) |
| Unaudited | | 9 Mos. Ended 9/30/24 | | 9 Mos. Ended 9/30/23 | | $ Change |
| | | | | | |
| Cash Flows from Operating Activities | | | | | | |
| Net Income | | $ | 12,835 | | | $ | 14,668 | | | $ | (1,833) | |
| Adjustments to reconcile net income to net cash provided by operating activities: | | | | | | |
| Depreciation and amortization expense | | 13,386 | | | 13,108 | | | 278 | |
| Employee retirement benefits | | 469 | | | 161 | | | 308 | |
| Deferred income taxes | | 247 | | | 822 | | | (575) | |
| Provision for expected credit losses | | 1,623 | | | 1,596 | | | 27 | |
| Equity in losses of unconsolidated businesses, inclusive of dividends received | | 62 | | | 69 | | | (7) | |
| | | | | | |
| | | | | | |
| | | | | | |
Changes in current assets and liabilities, net of effects from acquisition/disposition of businesses | | (2,609) | | | 972 | | | (3,581) | |
| | | | | | |
| Other, net | | 467 | | | (2,598) | | | 3,065 | |
| Net cash provided by operating activities | | 26,480 | | | 28,798 | | | (2,318) | |
| | | | | | |
| Cash Flows from Investing Activities | | | | | | |
| Capital expenditures (including capitalized software) | | (12,019) | | | (14,164) | | | 2,145 | |
| | | | | | |
| Acquisitions of wireless licenses | | (768) | | | (1,859) | | | 1,091 | |
| Collateral receipts (payments) related to derivative contracts, net | | (332) | | | 162 | | | (494) | |
| | | | | | |
| Other, net | | 6 | | | 253 | | | (247) | |
| Net cash used in investing activities | | (13,113) | | | (15,608) | | | 2,495 | |
| | | | | | |
| Cash Flows from Financing Activities | | | | | | |
| Proceeds from long-term borrowings | | 3,142 | | | 1,999 | | | 1,143 | |
| Proceeds from asset-backed long-term borrowings | | 8,229 | | | 4,656 | | | 3,573 | |
| Net proceeds from short-term commercial paper | | — | | | 333 | | | (333) | |
| Repayments of long-term borrowings and finance lease obligations | | (6,623) | | | (5,568) | | | (1,055) | |
| Repayments of asset-backed long-term borrowings | | (6,158) | | | (3,729) | | | (2,429) | |
| Dividends paid | | (8,399) | | | (8,231) | | | (168) | |
| Other, net | | (1,668) | | | (1,101) | | | (567) | |
| Net cash used in financing activities | | (11,477) | | | (11,641) | | | 164 | |
| | | | | | |
| Increase in cash, cash equivalents and restricted cash | | 1,890 | | | 1,549 | | | 341 | |
| Cash, cash equivalents and restricted cash, beginning of period | | 3,497 | | | 4,111 | | | (614) | |
| Cash, cash equivalents and restricted cash, end of period | | $ | 5,387 | | | $ | 5,660 | | | $ | (273) | |
Verizon Communications Inc.
Consumer - Selected Financial Results
| | | | | | | | | | | | | | | | | | | | | | | | | | | | | | | | | | | | | | |
| (dollars in millions) |
| Unaudited | | 3 Mos. Ended 9/30/24 | | 3 Mos. Ended 9/30/23 | | %
Change | | 9 Mos. Ended 9/30/24 | | 9 Mos. Ended 9/30/23 | | %
Change |
| | | | | | | | | | | | |
| Operating Revenues | | | | | | | | | | | | |
| Service | | $ | 19,260 | | | $ | 18,850 | | | 2.2 | | $ | 57,466 | | | $ | 55,947 | | | 2.7 |
| Wireless equipment | | 4,478 | | | 4,902 | | | (8.6) | | 13,111 | | | 14,210 | | | (7.7) |
| Other | | 1,622 | | | 1,505 | | | 7.8 | | 4,767 | | | 4,515 | | | 5.6 |
| Total Operating Revenues | | 25,360 | | | 25,257 | | | 0.4 | | 75,344 | | | 74,672 | | | 0.9 |
| | | | | | | | | | | | |
| Operating Expenses | | | | | | | | | | | | |
| Cost of services | | 4,567 | | | 4,419 | | | 3.3 | | 13,554 | | | 13,218 | | | 2.5 |
| Cost of wireless equipment | | 4,850 | | | 5,133 | | | (5.5) | | 14,032 | | | 14,950 | | | (6.1) |
| Selling, general and administrative expense | | 4,928 | | | 4,886 | | | 0.9 | | 15,064 | | | 14,795 | | | 1.8 |
| Depreciation and amortization expense | | 3,411 | | | 3,272 | | | 4.2 | | 10,114 | | | 9,733 | | | 3.9 |
| Total Operating Expenses | | 17,756 | | | 17,710 | | | 0.3 | | 52,764 | | | 52,696 | | | 0.1 |
| | | | | | | | | | | | |
| Operating Income | | $ | 7,604 | | | $ | 7,547 | | | 0.8 | | $ | 22,580 | | | $ | 21,976 | | | 2.7 |
| Operating Income Margin | | 30.0 | % | | 29.9 | % | | | | 30.0 | % | | 29.4 | % | | |
| | | | | | | | | | | | |
Segment EBITDA(1) | | $ | 11,015 | | | $ | 10,819 | | | 1.8 | | $ | 32,694 | | | $ | 31,709 | | | 3.1 |
Segment EBITDA Margin(1) | | 43.4 | % | | 42.8 | % | | | | 43.4 | % | | 42.5 | % | | |
Footnotes:
(1) Non-GAAP financial measure.
The segment financial results and metrics above exclude the effects of special items (other than the effects of acquisition-related intangible asset amortization), which the Company’s chief operating decision maker does not consider in assessing segment performance.
Certain intersegment transactions with corporate entities have not been eliminated.
Verizon Communications Inc.
Consumer - Selected Operating Statistics
| | | | | | | | | | | | | | | | | | | | | | | | | | | | | | | | | | | | | | |
|
| Unaudited | | | | | | | | 9/30/24 | | 9/30/23 | | % Change |
| | | | | | | | | | | | |
| Connections (‘000): | | | | | | | | | | | | |
| Wireless retail postpaid | | | | | | | | 94,005 | | | 92,704 | | | 1.4 |
| Wireless retail prepaid | | | | | | | | 20,206 | | | 21,420 | | | (5.7) |
| Total wireless retail | | | | | | | | 114,211 | | | 114,124 | | | 0.1 |
| | | | | | | | | | | | |
Wireless retail prepaid excl. SafeLink | | | | | | | | 18,780 | | | 19,123 | | | (1.8) |
| Wireless retail postpaid phone | | | | | | | | 74,624 | | | 74,407 | | | 0.3 |
| | | | | | | | | | | | |
| Fios video | | | | | | | | 2,744 | | | 3,013 | | | (8.9) |
| Fios internet | | | | | | | | 7,088 | | | 6,923 | | | 2.4 |
| | | | | | | | | | | | |
| | | | | | | | | | | | |
| | | | | | | | | | | | |
| Fixed wireless access (FWA) broadband | | | | | | | | 2,498 | | | 1,641 | | | 52.2 |
| Wireline broadband | | | | | | | | 7,264 | | | 7,151 | | | 1.6 |
| Total broadband | | | | | | | | 9,762 | | | 8,792 | | | 11.0 |
| | | | | | | | | | | | |
| Unaudited | | 3 Mos. Ended 9/30/24 | | 3 Mos. Ended 9/30/23 | | %
Change | | 9 Mos. Ended 9/30/24 | | 9 Mos. Ended 9/30/23 | | %
Change |
| | | | | | | | | | | | |
| Gross Additions (‘000): | | | | | | | | | | | | |
| Wireless retail postpaid | | 3,088 | | | 3,152 | | | (2.0) | | 8,972 | | | 9,290 | | | (3.4) |
| Wireless retail postpaid phone | | 1,952 | | | 1,843 | | | 5.9 | | 5,420 | | | 5,037 | | | 7.6 |
| | | | | | | | | | | | |
Net Additions Detail (‘000): | | | | | | | | | | | | |
| Wireless retail postpaid | | 68 | | | 251 | | | (72.9) | | 215 | | | 876 | | | (75.5) |
| Wireless retail prepaid | | (69) | | | (207) | | | 66.7 | | (909) | | | (862) | | | (5.5) |
| Total wireless retail | | (1) | | | 44 | | | * | | (694) | | | 14 | | | * |
| | | | | | | | | | | | |
Wireless retail prepaid excl. SafeLink | | 80 | | | (221) | | | * | | (63) | | | (815) | | | 92.3 |
| Wireless retail postpaid phone | | 81 | | | (51) | | | * | | (85) | | | (450) | | | 81.1 |
| | | | | | | | | | | | |
| Fios video | | (74) | | | (78) | | | 5.1 | | (207) | | | (221) | | | 6.3 |
| Fios internet | | 39 | | | 69 | | | (43.5) | | 112 | | | 183 | | | (38.8) |
| | | | | | | | | | | | |
| | | | | | | | | | | | |
| | | | | | | | | | | | |
| FWA broadband | | 209 | | | 251 | | | (16.7) | | 630 | | | 758 | | | (16.9) |
| Wireline broadband | | 26 | | | 53 | | | (50.9) | | 75 | | | 135 | | | (44.4) |
| | | | | | | | | | | | |
| Total broadband | | 235 | | | 304 | | | (22.7) | | 705 | | | 893 | | | (21.1) |
| | | | | | | | | | | | |
| Churn Rate: | | | | | | | | | | | | |
| Wireless retail postpaid | | 1.07 | % | | 1.04 | % | | | | 1.04 | % | | 1.01 | % | | |
| Wireless retail postpaid phone | | 0.84 | % | | 0.85 | % | | | | 0.82 | % | | 0.82 | % | | |
| Wireless retail prepaid | | 4.08 | % | | 4.39 | % | | | | 4.28 | % | | 4.31 | % | | |
Wireless retail prepaid excl. SafeLink | | 3.72 | % | | 3.85 | % | | | | 3.64 | % | | 3.76 | % | | |
| Wireless retail | | 1.61 | % | | 1.68 | % | | | | 1.62 | % | | 1.65 | % | | |
| | | | | | | | | | | | |
| Revenue Statistics (in millions): | | | | | | | | | | | | |
| Wireless service revenue | | $ | 16,377 | | | $ | 15,963 | | | 2.6 | | $ | 48,853 | | | $ | 47,324 | | | 3.2 |
| Fios revenue | | $ | 2,916 | | | $ | 2,897 | | | 0.7 | | $ | 8,708 | | | $ | 8,672 | | | 0.4 |
| | | | | | | | | | | | |
| | | | | | | | | | | | |
| | | | | | | | | | | | |
| | | | | | | | | | | | |
| | | | | | | | | | | | |
| | | | | | | | | | | | |
| | | | | | | | | | | | |
Verizon Communications Inc.
Consumer - Selected Operating Statistics (continued)
| | | | | | | | | | | | | | | | | | | | | | | | | | | | | | | | | | | | | | |
| Unaudited | | 3 Mos. Ended 9/30/24 | | 3 Mos. Ended 9/30/23 | | %
Change | | 9 Mos. Ended 9/30/24 | | 9 Mos. Ended 9/30/23 | | %
Change |
| | | | | | | | | | | | |
| Other Wireless Statistics: | | | | | | | | | | | | |
Wireless retail postpaid ARPA(1) | | $ | 139.06 | | | $ | 133.47 | | | 4.2 | | $ | 137.75 | | | $ | 131.79 | | | 4.5 |
Wireless retail postpaid upgrade rate | | 3.2 | % | | 3.6 | % | | | | | | | | |
Wireless retail postpaid accounts (‘000)(2) | | | | | | | | 32,719 | | | 32,938 | | | (0.7) |
Wireless retail postpaid connections per account(2) | | | | | | | | 2.87 | | | 2.81 | | | 2.1 |
Wireless retail prepaid ARPU(3) | | $ | 30.70 | | | $ | 31.87 | | | (3.7) | | $ | 30.93 | | | $ | 31.32 | | | (1.2) |
Wireless retail prepaid ARPU(3) excl. SafeLink | | $ | 32.41 | | | $ | 33.13 | | | (2.2) | | $ | 32.38 | | | $ | 32.72 | | | (1.0) |
| | | | | | | | | | | | |
Footnotes:
(1) Wireless retail postpaid ARPA - average service revenue per account from retail postpaid accounts.
(2) Statistics presented as of end of period.
(3) Wireless retail prepaid ARPU - average service revenue per unit from retail prepaid connections.
Where applicable, the operating results reflect certain adjustments, including those related to the 3G network shutdowns, migration activity among different types of devices and plans, customer profile changes, and adjustments in connection with mergers, acquisitions and divestitures.
Certain intersegment transactions with corporate entities have not been eliminated.
* Not meaningful
Verizon Communications Inc.
Business - Selected Financial Results
| | | | | | | | | | | | | | | | | | | | | | | | | | | | | | | | | | | | | | |
| (dollars in millions) |
| Unaudited | | 3 Mos. Ended 9/30/24 | | 3 Mos. Ended 9/30/23 | | %
Change | | 9 Mos. Ended 9/30/24 | | 9 Mos. Ended 9/30/23 | | %
Change |
| | | | | | | | | | | | |
| Operating Revenues | | | | | | | | | | | | |
| | | | | | | | | | | | |
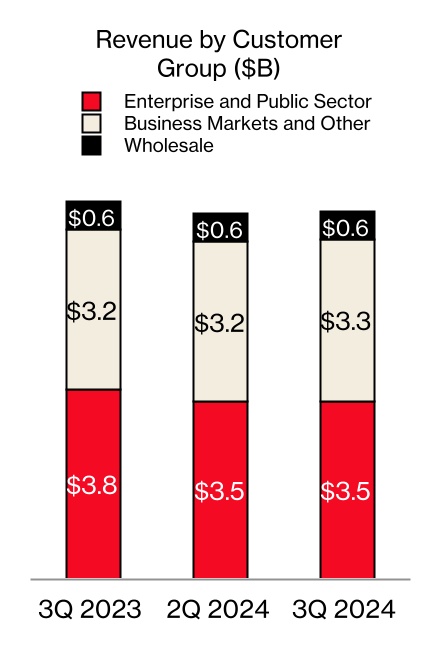
| Enterprise and Public Sector | | $ | 3,538 | | | $ | 3,787 | | | (6.6) | | $ | 10,670 | | | $ | 11,358 | | | (6.1) |
| | | | | | | | | | | | |
| Business Markets and Other | | 3,263 | | | 3,184 | | | 2.5 | | 9,661 | | | 9,397 | | | 2.8 |
| Wholesale | | 550 | | | 556 | | | (1.1) | | 1,696 | | | 1,749 | | | (3.0) |
| Total Operating Revenues | | 7,351 | | | 7,527 | | | (2.3) | | 22,027 | | | 22,504 | | | (2.1) |
| | | | | | | | | | | | |
| Operating Expenses | | | | | | | | | | | | |
| Cost of services | | 2,440 | | | 2,536 | | | (3.8) | | 7,327 | | | 7,661 | | | (4.4) |
| Cost of wireless equipment | | 1,197 | | | 1,220 | | | (1.9) | | 3,487 | | | 3,606 | | | (3.3) |
| Selling, general and administrative expense | | 2,109 | | | 2,105 | | | 0.2 | | 6,503 | | | 6,290 | | | 3.4 |
| Depreciation and amortization expense | | 1,040 | | | 1,127 | | | (7.7) | | 3,246 | | | 3,324 | | | (2.3) |
| Total Operating Expenses | | 6,786 | | | 6,988 | | | (2.9) | | 20,563 | | | 20,881 | | | (1.5) |
| | | | | | | | | | | | |
| Operating Income | | $ | 565 | | | $ | 539 | | | 4.8 | | $ | 1,464 | | | $ | 1,623 | | | (9.8) |
| Operating Income Margin | | 7.7 | % | | 7.2 | % | | | | 6.6 | % | | 7.2 | % | | |
| | | | | | | | | | | | |
Segment EBITDA(1) | | $ | 1,605 | | | $ | 1,666 | | | (3.7) | | $ | 4,710 | | | $ | 4,947 | | | (4.8) |
Segment EBITDA Margin(1) | | 21.8 | % | | 22.1 | % | | | | 21.4 | % | | 22.0 | % | | |
Footnotes:
(1) Non-GAAP financial measure.
The segment financial results and metrics above exclude the effects of special items (other than the effects of acquisition-related intangible asset amortization), which the Company’s chief operating decision maker does not consider in assessing segment performance.
Certain intersegment transactions with corporate entities have not been eliminated.
Verizon Communications Inc.
Business - Selected Operating Statistics
| | | | | | | | | | | | | | | | | | | | | | | | | | | | | | | | | | | | | | |
|
| Unaudited | | | | | | | | 9/30/24 | | 9/30/23 | | %
Change |
| | | | | | | | | | | | |
| Connections (‘000): | | | | | | | | | | | | |
| Wireless retail postpaid | | | | | | | | 30,532 | | | 29,455 | | | 3.7 |
| Wireless retail postpaid phone | | | | | | | | 18,649 | | | 18,019 | | | 3.5 |
| | | | | | | | | | | | |
| Fios video | | | | | | | | 56 | | | 63 | | | (11.1) |
| Fios internet | | | | | | | | 397 | | | 383 | | | 3.7 |
| | | | | | | | | | | | |
| | | | | | | | | | | | |
| FWA broadband | | | | | | | | 1,698 | | | 1,038 | | | 63.6 |
| Wireline broadband | | | | | | | | 459 | | | 461 | | | (0.4) |
| | | | | | | | | | | | |
| | | | | | | | | | | | |
| Total broadband | | | | | | | | 2,157 | | | 1,499 | | | 43.9 |
| | | | | | | | | | | | |
| Unaudited | | 3 Mos. Ended 9/30/24 | | 3 Mos. Ended 9/30/23 | | %
Change | | 9 Mos. Ended 9/30/24 | | 9 Mos. Ended 9/30/23 | | %
Change |
| | | | | | | | | | | | |
| Gross Additions (‘000): | | | | | | | | | | | | |
| Wireless retail postpaid | | 1,601 | | | 1,618 | | | (1.1) | | 4,711 | | | 4,815 | | | (2.2) |
| Wireless retail postpaid phone | | 784 | | | 761 | | | 3.0 | | 2,249 | | | 2,251 | | | (0.1) |
| | | | | | | | | | | | |
| Net Additions Detail (‘000): | | | | | | | | | | | | |
| Wireless retail postpaid | | 281 | | | 330 | | | (14.8) | | 727 | | | 950 | | | (23.5) |
| Wireless retail postpaid phone | | 158 | | | 151 | | | 4.6 | | 404 | | | 431 | | | (6.3) |
| | | | | | | | | | | | |
| Fios video | | (2) | | | (1) | | | * | | (5) | | | (4) | | | (25.0) |
| Fios internet | | 4 | | | 3 | | | 33.3 | | 12 | | | 10 | | | 20.0 |
| | | | | | | | | | | | |
| | | | | | | | | | | | |
| FWA broadband | | 154 | | | 133 | | | 15.8 | | 465 | | | 403 | | | 15.4 |
| Wireline broadband | | — | | | (3) | | | * | | (1) | | | (7) | | | 85.7 |
| | | | | | | | | | | | |
| Total broadband | | 154 | | | 130 | | | 18.5 | | 464 | | | 396 | | | 17.2 |
| | | | | | | | | | | | |
| Churn Rate: | | | | | | | | | | | | |
| Wireless retail postpaid | | 1.45 | % | | 1.47 | % | | | | 1.47 | % | | 1.48 | % | | |
| Wireless retail postpaid phone | | 1.12 | % | | 1.14 | % | | | | 1.12 | % | | 1.13 | % | | |
| | | | | | | | | | | | |
| Revenue Statistics (in millions): | | | | | | | | | | | | |
| Wireless service revenue | | $ | 3,466 | | | $ | 3,367 | | | 2.9 | | $ | 10,276 | | | $ | 10,008 | | | 2.7 |
| Fios revenue | | $ | 314 | | | $ | 308 | | | 1.9 | | $ | 938 | | | $ | 923 | | | 1.6 |
| | | | | | | | | | | | |
| Other Operating Statistics: | | | | | | | | | | | | |
| | | | | | | | | | | | |
| Wireless retail postpaid upgrade rate | | 2.5 | % | | 2.9 | % | | | | | | | | |
| | | | | | | | | | | | |
| | | | | | | | | | | | |
| | | | | | | | | | | | |
| | | | | | | | | | | | |
| | | | | | | | | | | | |
Footnotes:
Where applicable, the operating results reflect certain adjustments, including those related to the 3G network shutdowns, migration activity among different types of devices and plans, customer profile changes, and adjustments in connection with mergers, acquisitions and divestitures.
Certain intersegment transactions with corporate entities have not been eliminated.
* Not meaningful
Verizon Communications Inc.
Supplemental Information - Total Wireless Operating and Financial Statistics
The following supplemental schedule contains certain financial and operating metrics which reflect an aggregation of our Consumer and Business segments’ wireless results.
| | | | | | | | | | | | | | | | | | | | | | | | | | | | | | | | | | | | | | |
|
| Unaudited | | 9/30/24 | | 9/30/23 | | % Change |
| | | | | | | | | | | | |
| Connections (‘000) | | | | | | | | | | | | |
| Retail postpaid | | | | | | | | 124,537 | | | 122,159 | | | 1.9 |
Retail prepaid | | | | | | | | 20,206 | | | 21,420 | | | (5.7) |
| Total retail | | | | | | | | 144,743 | | | 143,579 | | | 0.8 |
| | | | | | | | | | | | |
Retail prepaid excl. SafeLink | | | | | | | | 18,780 | | | 19,123 | | | (1.8) |
| Retail postpaid phone | | | | | | | | 93,273 | | | 92,426 | | | 0.9 |
| | | | | | | | | | | | |
| Unaudited | | 3 Mos. Ended 9/30/24 | | 3 Mos. Ended 9/30/23 | | %
Change | | 9 Mos. Ended 9/30/24 | | 9 Mos. Ended 9/30/23 | | %
Change |
| | | | | | | | | | | | |
| Net Additions Detail (‘000) | | | | | | | | | | | | |
| Retail postpaid phone | | 239 | | | 100 | | | * | | 319 | | | (19) | | | * |
| Retail postpaid | | 349 | | | 581 | | | (39.9) | | 942 | | | 1,826 | | | (48.4) |
| Retail prepaid | | (69) | | | (207) | | | 66.7 | | (909) | | | (862) | | | (5.5) |
| Total retail | | 280 | | | 374 | | | (25.1) | | 33 | | | 964 | | | (96.6) |
| | | | | | | | | | | | |
| Retail prepaid excl. SafeLink | | 80 | | | (221) | | | * | | (63) | | | (815) | | | 92.3 |
| | | | | | | | | | | | |
| Account Statistics | | | | | | | | | | | | |
Retail postpaid accounts (‘000)(1) | | | | | | | | 34,746 | | | 34,855 | | | (0.3) |
Retail postpaid connections per account(1) | | | | | | | | 3.58 | | | 3.50 | | | 2.3 |
Retail postpaid ARPA(2) | | $ | 162.05 | | | $ | 156.13 | | | 3.8 | | $ | 160.50 | | | $ | 154.30 | | | 4.0 |
Retail prepaid ARPU(3) | | $ | 30.70 | | | $ | 31.87 | | | (3.7) | | $ | 30.93 | | | $ | 31.32 | | | (1.2) |
Retail prepaid ARPU(3) excl. SafeLink | | $ | 32.41 | | | $ | 33.13 | | | (2.2) | | $ | 32.38 | | | $ | 32.72 | | | (1.0) |
| | | | | | | | | | | | |
| Churn Detail | | | | | | | | | | | | |
| Retail postpaid phone | | 0.89 | % | | 0.90 | % | | | | 0.88 | % | | 0.88 | % | | |
| Retail postpaid | | 1.16 | % | | 1.15 | % | | | | 1.14 | % | | 1.12 | % | | |
| Retail prepaid | | 4.08 | % | | 4.39 | % | | | | 4.28 | % | | 4.31 | % | | |
Retail prepaid excl. SafeLink | | 3.72 | % | | 3.85 | % | | | | 3.64 | % | | 3.76 | % | | |
| Retail | | 1.57 | % | | 1.63 | % | | | | 1.59 | % | | 1.61 | % | | |
| | | | | | | | | | | | |
| Retail Postpaid Connection Statistics | | | | | | | | | | | | |
| | | | | | | | | | | | |
| | | | | | | | | | | | |
| Upgrade rate | | 3.0 | % | | 3.4 | % | | | | | | | | |
| | | | | | | | | | | | |
Revenue Statistics (in millions)(4) | | | | | | | | | | | | |
| FWA revenue | | $ | 562 | | | $ | 347 | | | 62.0 | | $ | 1,528 | | | $ | 899 | | | 70.0 |
| Wireless service | | $ | 19,843 | | | $ | 19,330 | | | 2.7 | | $ | 59,129 | | | $ | 57,332 | | | 3.1 |
| Wireless equipment | | 5,343 | | | 5,813 | | | (8.1) | | 15,702 | | | 16,850 | | | (6.8) |
| Wireless other | | 1,662 | | | 1,507 | | | 10.3 | | 4,847 | | | 4,508 | | | 7.5 |
| Total Wireless | | $ | 26,848 | | | $ | 26,650 | | | 0.7 | | $ | 79,678 | | | $ | 78,690 | | | 1.3 |
Footnotes:
(1) Statistics presented as of end of period.
(2) Wireless retail postpaid ARPA - average service revenue per account from retail postpaid accounts.
(3) Wireless retail prepaid ARPU - average service revenue per unit from retail prepaid connections.
(4) Intersegment transactions between Consumer or Business segment with corporate entities have not been eliminated.
Where applicable, the operating results reflect certain adjustments, including those related to the 3G network shutdowns, migration activity among different types of devices and plans, customer profile changes, and adjustments in connection with mergers, acquisitions and divestitures.
* Not meaningful
Verizon Communications Inc.
Non-GAAP Reconciliations - Consolidated Verizon | | | | | | | | | | | | | | | | | | | | | | | | | | | | | | | | | | | | | | | | | | | | | | | | | | | | |
Consolidated EBITDA and Consolidated Adjusted EBITDA | | | | | | | | | | | | | | | | | | |
| (dollars in millions) |
| Unaudited | | | | | | | | 3 Mos. Ended 9/30/24 | | 3 Mos. Ended 6/30/24 | | 3 Mos. Ended 3/31/24 | | | | | | 3 Mos. Ended 12/31/23 | | 3 Mos. Ended 9/30/23 | | 3 Mos. Ended 6/30/23 | | 3 Mos. Ended 3/31/23 |
| | | | | | | | | | | | | | | | | | | | | | | | |
| Consolidated Net Income (Loss) | | | | | | | | $ | 3,411 | | | $ | 4,702 | | | $ | 4,722 | | | | | | | $ | (2,573) | | | $ | 4,884 | | | $ | 4,766 | | | $ | 5,018 | |
| Add: | | | | | | | | | | | | | | | | | | | | | | | | |
| Provision for income taxes | | | | | | | | 891 | | | 1,332 | | | 1,353 | | | | | | | 756 | | | 1,308 | | | 1,346 | | | 1,482 | |
| Interest expense | | | | | | | | 1,672 | | | 1,698 | | | 1,635 | | | | | | | 1,599 | | | 1,433 | | | 1,285 | | | 1,207 | |
Depreciation and amortization expense(1) | | | | | | | | 4,458 | | | 4,483 | | | 4,445 | | | | | | | 4,516 | | | 4,431 | | | 4,359 | | | 4,318 | |
| Consolidated EBITDA | | | | | | | | $ | 10,432 | | | $ | 12,215 | | | $ | 12,155 | | | | | | | $ | 4,298 | | | $ | 12,056 | | | $ | 11,756 | | | $ | 12,025 | |
| | | | | | | | | | | | | | | | | | | | | | | | |
| Add/(subtract): | | | | | | | | | | | | | | | | | | | | | | | | |
Other (income) expense, net(2) | | | | | | | | $ | (72) | | | $ | 72 | | | $ | (198) | | | | | | | $ | 807 | | | $ | (170) | | | $ | (210) | | | $ | (114) | |
| Equity in (earnings) losses of unconsolidated businesses | | | | | | | | 24 | | | 14 | | | 9 | | | | | | | 11 | | | 18 | | | 33 | | | (9) | |
| | | | | | | | | | | | | | | | | | | | | | | | |
| Severance charges | | | | | | | | 1,733 | | | — | | | — | | | | | | | 296 | | | — | | | 237 | | | — | |
| Asset and business rationalization | | | | | | | | 374 | | | — | | | — | | | | | | | 325 | | | — | | | 155 | | | — | |
| Legacy legal matter | | | | | | | | — | | | — | | | 106 | | | | | | | — | | | — | | | — | | | — | |
| Verizon Business Group goodwill impairment | | | | | | | | — | | | — | | | — | | | | | | | 5,841 | | | — | | | — | | | — | |
| Legal settlement | | | | | | | | — | | | — | | | — | | | | | | | 100 | | | — | | | — | | | — | |
| Business transformation costs | | | | | | | | — | | | — | | | — | | | | | | | — | | | 176 | | | — | | | — | |
| Non-strategic business shutdown | | | | | | | | — | | | — | | | — | | | | | | | — | | | 158 | | | — | | | — | |
| | | | | | | | | | | | | | | | | | | | | | | | |
| | | | | | | | | | | | | | | | | | | | | | | | |
| | | | | | | | | | | | | | | | | | | | | | | | |
| | | | | | | | | | | | | | | | | | | | | | | | |
| | | | | | | | | | | | | | | | | | | | | | | | |
| | | | | | | | | | | | | | | | | | | | | | | | |
| | | | | | | | 2,059 | | | 86 | | | (83) | | | | | | | 7,380 | | | 182 | | | 215 | | | (123) | |
| | | | | | | | | | | | | | | | | | | | | | | | |
| Consolidated Adjusted EBITDA | | | | | | | | $ | 12,491 | | | $ | 12,301 | | | $ | 12,072 | | | | | | | $ | 11,678 | | | $ | 12,238 | | | $ | 11,971 | | | $ | 11,902 | |
| | | | | | | | | | | | | | | | | | | | | | | | |
| | | | | | | | | | | | | | | | | | | | | | | | |
| | | | | | | | | | | | | | | | | | | | | | | | |
| | | | | | | | | | | | | | | | | | | | | | | | |
| | | | | | | | | | | | | | | | | | | | | | | | |
| | | | | | | | | | | | | | | | | | | | | | | | |
| | | | | | | | | | | | | | | | | | | | | | | | |
| | | | | | | | | | | | | | | | | | | | | | | | |
| | | | | | | | | | | | | | | | | | | | | | | | |
| | | | | | | | | | | | | | | | | | | | | | | | |
| | | | | | | | | | | | | | | | | | | | | | | | |
| | | | | | | | | | | | | | | | | | | | | | | | |
| | | | | | | | | | | | | | | | | | | | | | | | |
| | | | | | | | | | | | | | | | | | | | | | | | |
| | | | | | | | | | | | | | | | | | | | | | | | |
| | | | | | | | | | | | | | | | | | | | | | | | |
| | | | | | | | | | | | | | | | | | | | | | | | |
| | | | | | | | | | | | | | | | | | | | | | | | |
| | | | | | | | | | | | | | | | | | | | | | | | |
| | | | | | | | | | | | | | | | | | | | | | | | |
| Footnotes: | | | | | | | | | | | | | | | | | | | | | | | | |
(1) Includes Amortization of acquisition-related intangible assets and a portion of the Non-strategic business shutdown, where applicable. | | |
(2) Includes Pension and benefits remeasurement adjustments, where applicable. | | | | | | |
Verizon Communications Inc.
| | | | | | | | | | | | | | | | | | | | | | | | | | | | | | | | | | |
| Consolidated EBITDA and Consolidated Adjusted EBITDA (LTM) | | | | | | | | | | | | | | | | | | | | | | |
(dollars in millions) | | | | | | | | | | | | |
| Unaudited | | 12 Mos. Ended 9/30/24 | | | | 12 Mos. Ended 6/30/24 | | | | 12 Mos. Ended 12/31/23 | | | | | | | | | | | | |
| | | | | | | | | | | | | | | | | | | | | | |
| Consolidated Net Income | | $ | 10,262 | | | | | $ | 11,735 | | | | | $ | 12,095 | | | | | | | | | | | | | |
| Add: | | | | | | | | | | | | | | | | | | | | | | |
| Provision for income taxes | | 4,332 | | | | | 4,749 | | | | | 4,892 | | | | | | | | | | | | | |
| Interest expense | | 6,604 | | | | | 6,365 | | | | | 5,524 | | | | | | | | | | | | | |
Depreciation and amortization expense(1) | | 17,902 | | | | | 17,875 | | | | | 17,624 | | | | | | | | | | | | | |
| Consolidated EBITDA | | $ | 39,100 | | | | | $ | 40,724 | | | | | $ | 40,135 | | | | | | | | | | | | | |
| | | | | | | | | | | | | | | | | | | | | | |
| Add/(subtract): | | | | | | | | | | | | | | | | | | | | | | |
Other expense, net(2) | | $ | 609 | | | | | $ | 511 | | | | | $ | 313 | | | | | | | | | | | | | |
Equity in losses of unconsolidated businesses | | 58 | | | | | 52 | | | | | 53 | | | | | | | | | | | | | |
| | | | | | | | | | | | | | | | | | | | | | |
| Severance charges | | 2,029 | | | | | 296 | | | | | 533 | | | | | | | | | | | | | |
| Asset and business rationalization | | 699 | | | | | 325 | | | | | 480 | | | | | | | | | | | | | |
| Legacy legal matter | | 106 | | | | | 106 | | | | | — | | | | | | | | | | | | | |
| Verizon Business Group goodwill impairment | | 5,841 | | | | | 5,841 | | | | | 5,841 | | | | | | | | | | | | | |
| Legal settlement | | 100 | | | | | 100 | | | | | 100 | | | | | | | | | | | | | |
| Business transformation costs | | — | | | | | 176 | | | | | 176 | | | | | | | | | | | | | |
| Non-strategic business shutdown | | — | | | | | 158 | | | | | 158 | | | | | | | | | | | | | |
| | | | | | | | | | | | | | | | | | | | | | |
| | | | | | | | | | | | | | | | | | | | | | |
| | | | | | | | | | | | | | | | | | | | | | |
| | | | | | | | | | | | | | | | | | | | | | |
| | | | | | | | | | | | | | | | | | | | | | |
| | 9,442 | | | | | 7,565 | | | | | 7,654 | | | | | | | | | | | | | |
| | | | | | | | | | | | | | | | | | | | | | |
| Consolidated Adjusted EBITDA | | $ | 48,542 | | | | | $ | 48,289 | | | | | $ | 47,789 | | | | | | | | | | | | | |
| | | | | | | | | | | | | | | | | | | | | | |
| Footnotes: | | | | | | | | | | | | |
| (1) Includes Amortization of acquisition-related intangible assets and a portion of the Non-strategic business shutdown, where applicable. | | | | | | | | | | | | |
(2) Includes Pension and benefits remeasurement adjustments, where applicable. | | | | | | | | | | | | | | | | |
Verizon Communications Inc.
| | | | | | | | | | | | | | | | | | | | | | | | | | | | | | | | |
| Net Unsecured Debt and Net Unsecured Debt to Consolidated Adjusted EBITDA Ratio | | | | | | | | | | |
| (dollars in millions) | | | | |
| Unaudited | | 9/30/24 | | 6/30/24 | | | | 12/31/23 | | 9/30/23 | | | | |
| | | | | | | | | | | | | | |
| Debt maturing within one year | | $ | 21,763 | | | $ | 23,255 | | | | | $ | 12,973 | | | $ | 12,950 | | | | | |
| Long-term debt | | 128,878 | | | 126,022 | | | | | 137,701 | | | 134,441 | | | | | |
| Total Debt | | 150,641 | | | 149,277 | | | | | 150,674 | | | 147,391 | | | | | |
| Less Secured debt | | 24,272 | | | 24,015 | | | | | 22,183 | | | 20,951 | | | | | |
| Unsecured Debt | | 126,369 | | | 125,262 | | | | | 128,491 | | | 126,440 | | | | | |
| Less Cash and cash equivalents | | 4,987 | | | 2,432 | | | | | 2,065 | | | 4,210 | | | | | |
Net Unsecured Debt | | $ | 121,382 | | | $ | 122,830 | | | | | $ | 126,426 | | | $ | 122,230 | | | | | |
| | | | | | | | | | | | | | |
| | | | | | | | | | | | | | |
| | | | | | | | | | | | | | |
| Consolidated Net Income (LTM) | | $ | 10,262 | | | | | | | $ | 12,095 | | | | | | | |
| Unsecured Debt to Consolidated Net Income Ratio | | 12.3 | x | | | | | | 10.6 | x | | | | | | |
| Consolidated Adjusted EBITDA (LTM) | | $ | 48,542 | | | | | | | $ | 47,789 | | | | | | | |
| Net Unsecured Debt to Consolidated Adjusted EBITDA Ratio | | 2.5 | x | | | | | | 2.6 | x | | | | | | |
| | | | | | | | | | | | | | |
| | | | | | | | | | | | | | |
| | | | | | | | | | | | | | |
| | | | | | | | | | | | | | |
| | | | | | | | | | | | | | | | | | | | | | | | | | | | | | | | |
| Adjusted Earnings per Common Share (Adjusted EPS) | | | | | | | | |
(dollars in millions, except per share amounts) |
| Unaudited | | 3 Mos. Ended 9/30/24 | | 3 Mos. Ended 9/30/23 |
| | Pre-tax | Tax | After-Tax | | | Pre-tax | Tax | After-Tax | |
| EPS | | | | | $ | 0.78 | | | | | | $ | 1.13 | |
| Amortization of acquisition-related intangible assets | | $ | 186 | | $ | (46) | | $ | 140 | | 0.03 | | | $ | 224 | | $ | (56) | | $ | 168 | | 0.04 | |
| | | | | | | | | | |
| | | | | | | | | | |
| | | | | | | | | | |
| | | | | | | | | | |
| | | | | | | | | | |
| | | | | | | | | | |
| | | | | | | | | | |
| | | | | | | | | | |
| | | | | | | | | | |
| | | | | | | | | | |
| | | | | | | | | | |
| Severance charges | | 1,733 | | (429) | | 1,304 | | 0.31 | | | — | | — | | — | | — | |
| | | | | | | | | | |
| Asset and business rationalization | | 374 | | (90) | | 284 | | 0.07 | | | — | | — | | — | | — | |
| | | | | | | | | | |
| Business transformation costs | | — | | — | | — | | — | | — | | 176 | | (45) | | 131 | | 0.03 | |
| Non-strategic business shutdown | | — | | — | | — | | — | | | 179 | | (83) | | 96 | | 0.02 | |
| | | | | | | | | | |
| | | | | | | | | | |
| | $ | 2,293 | | $ | (565) | | $ | 1,728 | | $ | 0.41 | | | $ | 579 | | $ | (184) | | $ | 395 | | $ | 0.09 | |
| Adjusted EPS | | | | | $ | 1.19 | | | | | | $ | 1.22 | |
| | | | | | | | | | |
| | | | | | | | | | |
Footnote: | | | | | | | | | | |
Adjusted EPS may not add due to rounding. | | | | | | | | | | |
| | | | | | | | | | | | | | | | | |
| | | | | | | |
| Free Cash Flow | | | | | | | |
| (dollars in millions) | |
| Unaudited | | 9 Mos. Ended 9/30/24 | | | | 9 Mos. Ended 9/30/23 | |
| | | | | | | |
| Net Cash Provided by Operating Activities | | $ | 26,480 | | | | | $ | 28,798 | | |
| Capital expenditures (including capitalized software) | | (12,019) | | | | | (14,164) | | |
| Free Cash Flow | | $ | 14,461 | | | | | $ | 14,634 | | |
| | | | | | | |
| | | | | | | |
| | | | | | | |
| | | | | | | |
Verizon Communications Inc.
Non-GAAP Reconciliations - Segments
| | | | | | | | | | | | | | | | | | | | | | | | | | |
| Segment EBITDA and Segment EBITDA Margin | | | | | | | | |
| | | | | | | | |
| Consumer | | | | | | | | |
| (dollars in millions) |
| Unaudited | | 3 Mos. Ended 9/30/24 | | 3 Mos. Ended 9/30/23 | | 9 Mos. Ended 9/30/24 | | 9 Mos. Ended 9/30/23 |
| | | | | | | | |
| Operating Income | | $ | 7,604 | | | $ | 7,547 | | | $ | 22,580 | | | $ | 21,976 | |
| Add Depreciation and amortization expense | | 3,411 | | | 3,272 | | | 10,114 | | | 9,733 | |
| Segment EBITDA | | $ | 11,015 | | | $ | 10,819 | | | $ | 32,694 | | | $ | 31,709 | |
| Year over year change % | | 1.8 | % | | | | 3.1 | % | | |
| | | | | | | | |
| Total operating revenues | | $ | 25,360 | | | $ | 25,257 | | | $ | 75,344 | | | $ | 74,672 | |
| Operating Income Margin | | 30.0 | % | | 29.9 | % | | 30.0 | % | | 29.4 | % |
| Segment EBITDA Margin | | 43.4 | % | | 42.8 | % | | 43.4 | % | | 42.5 | % |
| | | | | | | | |
| | | | | | | | |
| | | | | | | | | | | | | | | | | | | | | | | | | | |
| Business | | | | | | | | |
| (dollars in millions) |
| Unaudited | | 3 Mos. Ended 9/30/24 | | 3 Mos. Ended 9/30/23 | | 9 Mos. Ended 9/30/24 | | 9 Mos. Ended 9/30/23 |
| | | | | | | | |
| Operating Income | | $ | 565 | | | $ | 539 | | | $ | 1,464 | | | $ | 1,623 | |
| Add Depreciation and amortization expense | | 1,040 | | | 1,127 | | | 3,246 | | | 3,324 | |
| Segment EBITDA | | $ | 1,605 | | | $ | 1,666 | | | $ | 4,710 | | | $ | 4,947 | |
| Year over year change % | | (3.7) | % | | | | (4.8) | % | | |
| | | | | | | | |
| Total operating revenues | | $ | 7,351 | | | $ | 7,527 | | | $ | 22,027 | | | $ | 22,504 | |
| Operating Income Margin | | 7.7 | % | | 7.2 | % | | 6.6 | % | | 7.2 | % |
| Segment EBITDA Margin | | 21.8 | % | | 22.1 | % | | 21.4 | % | | 22.0 | % |
| | | | | | | | |
| | | | | | | | |
This supplemental information regarding the financial and operating results of Verizon Communications Inc. (Verizon) for the third quarter ended September 30, 2024 contains statements about expected future events and financial results that are forward-looking and subject to risks and uncertainties. Discussion of factors that may affect future results is included at the end of this document and is also contained in Verizon's filings with the US Securities and Exchange Commission.
Consolidated Financial Results
* Total Wireless service represents the sum of Consumer and Business segments.
** Non-GAAP financial measure.
Consolidated total operating revenue for the third quarter was $33.3 billion, flat year over year.
•Service and other revenue was $28.0 billion, up 1.7% year over year.
◦Total Wireless service revenue2 was $19.8 billion, up 2.7% year over year, driven primarily by pricing actions implemented in recent quarters and growth from our fixed wireless access (FWA) connections.
◦Total Fios revenue was $3.2 billion, up 0.8% year over year.
•Wireless equipment revenue was $5.3 billion, down 8.1% year over year, predominantly due to lower upgrade volumes.
Page 2
VlpHU09DSUQyMDE5UTE=
Consolidated net income for the third quarter was $3.4 billion compared to $4.9 billion in the prior year period. The year over year decline in net income was primarily driven by severance charges of $1.7 billion related to separations under our voluntary separation program for select U.S.-based management employees as well as other headcount reduction initiatives.
Consolidated adjusted EBITDA1 for the third quarter was $12.5 billion compared to $12.2 billion in the prior year period. This result was driven by Wireless service revenue growth and the benefits of lower upgrade volumes, and was partially offset by ongoing declines in Verizon Business Group wireline revenue.
Consolidated operating expenses for the third quarter were $27.4 billion, up 6.0% year over year. Consolidated operating expenses, excluding depreciation and amortization and special items,1 were $20.8 billion, down 1.2% year over year.
Interest expense for the third quarter was $1.7 billion compared to $1.4 billion for the prior year period due to lower capitalized interest and higher interest rates on our outstanding debt balance.
Earnings per share (EPS) was $0.78 compared to EPS of $1.13 in the prior year period. Reported third quarter 2024 financial results reflected $2.3 billion in charges related to the following special items:
•severance charge of $1.7 billion related to separations under our voluntary separation program for select U.S.-based management employees as well as other headcount reduction initiatives;
•asset and business rationalization charge of $374 million predominately related to the decision to cease use of certain real estate assets and exit non-strategic portions of certain businesses, as part of our continued transformation initiatives; and
•amortization of intangible assets of $186 million related to Tracfone and other acquisitions.
Adjusted EPS1 for the third quarter was $1.19 compared to $1.22 in the prior year period.
Page 3
VlpHU09DSUQyMDE5UTE=
Cash Flow Summary
* Non-GAAP financial measure.
Cash flow from operating activities for the nine months ended September 30, 2024 was $26.5 billion compared to $28.8 billion in the prior year period driven by year over year pressures from cash taxes, and higher interest expense primarily related to a reduction in capitalized interest as well as higher interest rates.
•Capital spending for the nine months ended September 30, 2024 was $12.0 billion compared to $14.2 billion in the prior year period.
•Our guidance for 2024 capital expenditures of $17.0 billion to $17.5 billion remains unchanged.
Free cash flow1 for the nine months ended September 30, 2024 was $14.5 billion compared to $14.6 billion in the prior year period.
Total unsecured debt as of the end of the third quarter was $126.4 billion, a $1.1 billion increase compared to the prior quarter and approximately $70 million lower year over year. Unsecured debt to net income (LTM) ratio was 12.3x as of the end of the third quarter, an increase of 1.6x compared to the prior quarter and a 6.4x increase year over year.
Net unsecured debt1 as of the end of the third quarter was $121.4 billion, an improvement of over $1.4 billion compared to the prior quarter and more than $0.8 billion lower year over year. Net unsecured debt to adjusted EBITDA ratio1 was 2.5x as of the end of the third quarter, flat compared to the prior quarter and a 0.1x improvement over the prior year period.
Page 4
VlpHU09DSUQyMDE5UTE=
Mobility Highlights
Note: Where applicable, the operating results reflect certain adjustments.
Consolidated
Total postpaid net additions for the third quarter were 349 thousand, down from 581 thousand in the prior year period, as growth in phone net additions were offset by reduced FWA volumes and losses in tablets, wearables, and other connected devices.
Total postpaid phone net additions for the third quarter were 239 thousand, an improvement from 100 thousand in the prior year period.
•Postpaid phone gross additions were 2.7 million, up 5.1% year over year.
•Postpaid phone churn was 0.89%, down 1 basis point year over year.
Consumer Group
Postpaid net additions for the third quarter were 68 thousand, down from 251 thousand in the prior year period.
•Postpaid phone net additions were 81 thousand compared to 51 thousand net losses in the prior year period.
◦Postpaid phone gross additions were approximately 2.0 million, up 5.9% year over year. Excluding the contribution from our second number offering, postpaid phone gross additions grew approximately 1.0% year over year.
◦Postpaid phone churn was 0.84%, down 1 basis point year over year.
Prepaid net additions, excluding SafeLink Wireless (SafeLink), our brand offering access to government-sponsored connectivity benefits and programs,
were 80 thousand compared to 221 thousand net losses in the prior year period.
•Excluding SafeLink, prepaid churn was 3.72%, down 13 basis points year over year.
Business Group
Postpaid phone net additions for the third quarter were 158 thousand, up from 151 thousand in the prior year period.
•Postpaid phone churn was 1.12%, down 2 basis points year over year.
Broadband Highlights
Total broadband net additions for the third quarter were 389 thousand compared to 434 thousand in the prior year period.
•FWA net additions were 363 thousand, down from 384 thousand in the prior year period.
◦Consumer FWA net additions were 209 thousand, down 42 thousand year over year.
◦Business FWA net additions were 154 thousand, up 21 thousand year over year.
•Fios internet net additions were 43 thousand, down from 72 thousand in the prior year period.
Page 6
VlpHU09DSUQyMDE5UTE=
Consumer Financial Results
Total Consumer revenue for the third quarter was $25.4 billion, up 0.4% year over year, as gains in Service revenue were partially offset by declines in Wireless equipment revenue.
•Consumer Service and other revenue was $20.9 billion, up 2.6% year over year.
•Consumer Wireless service revenue was $16.4 billion, up 2.6% year over year, driven by growth in Consumer wireless postpaid average revenue per account (ARPA) from pricing actions and continued FWA adoption.
•Consumer Fios revenue was $2.9 billion, up 0.7% year over year.
•Consumer Wireless equipment revenue was $4.5 billion, down 8.6% year over year, driven primarily by a 10.1% year over year decline in upgrades.
Consumer Wireless postpaid ARPA was $139.06 for the third quarter, up 4.2% year over year, driven by pricing actions implemented in recent quarters, and an increased contribution from FWA.
Consumer operating income for the third quarter was $7.6 billion, up 0.8% year over year, resulting in operating income margin of 30.0% compared to 29.9% in the prior year period.
Consumer segment EBITDA1 for the third quarter was $11.0 billion, up 1.8% year over year. This improvement can be attributed to Service revenue growth and lower upgrade volumes. Consumer segment EBITDA margin1 for the third quarter was 43.4% compared to 42.8% in the prior year period.
Page 7
VlpHU09DSUQyMDE5UTE=
Business Financial Results
Note: Revenue by customer group may not add due to rounding.
Total Business revenue for the third quarter was $7.4 billion, down 2.3% year over year, as increases in Wireless service revenue were more than offset by decreases in Wireline revenue.
•Business Wireless service revenue was $3.5 billion, up 2.9% year over year, driven by continued strong net additions for both mobility and FWA, as well as benefits from pricing actions implemented in recent quarters.
•Business wireline results reflect continued secular declines in the prevailing wireline market, consistent with prior periods.
Business operating income for the third quarter was $565 million, up 4.8% year over year, resulting in operating income margin of 7.7%.
Business segment EBITDA1 for the third quarter was $1.6 billion, down 3.7% year over year, driven by continued declines in Wireline revenues. Business segment EBITDA margin1 for the third quarter was 21.8%.
Notes
1 Non-GAAP financial measure. See the accompanying schedules and www.verizon.com/about/investors for reconciliations of non-GAAP financial measures cited in this document to most directly comparable financial measures under generally accepted accounting principles (GAAP).
2 Total Wireless service revenue represents the sum of Consumer and Business segments.
Page 8
VlpHU09DSUQyMDE5UTE=
Forward-looking statements
In this communication we have made forward-looking statements. These statements are based on our estimates and assumptions and are subject to risks and uncertainties. Forward-looking statements include the information concerning our possible or assumed future results of operations. Forward-looking statements also include those preceded or followed by the words “anticipates,” “assumes,” “believes,” “estimates,” “expects,” “forecasts,” “hopes,” “intends,” “plans,” “targets” or similar expressions. For those statements, we claim the protection of the safe harbor for forward-looking statements contained in the Private Securities Litigation Reform Act of 1995. We undertake no obligation to revise or publicly release the results of any revision to these forward-looking statements, except as required by law. Given these risks and uncertainties, readers are cautioned not to place undue reliance on such forward-looking statements. The following important factors, along with those discussed in our filings with the Securities and Exchange Commission (the “SEC”), could affect future results and could cause those results to differ materially from those expressed in the forward-looking statements: the effects of competition in the markets in which we operate, including the inability to successfully respond to competitive factors such as prices, promotional incentives and evolving consumer preferences; failure to take advantage of, or respond to competitors' use of, developments in technology and address changes in consumer demand; performance issues or delays in the deployment of our 5G network resulting in significant costs or a reduction in the anticipated benefits of the enhancement to our networks; the inability to implement our business strategy; adverse conditions in the U.S. and international economies, including inflation and changing interest rates in the markets in which we operate; cyber attacks impacting our networks or systems and any resulting financial or reputational impact; damage to our infrastructure or disruption of our operations from natural disasters, extreme weather conditions, acts of war, terrorist attacks or other hostile acts and any resulting financial or reputational impact; disruption of our key suppliers’ or vendors' provisioning of products or services, including as a result of geopolitical factors or the potential impacts of global climate change; material adverse changes in labor matters and any resulting financial or operational impact; damage to our reputation or brands; the impact of public health crises on our operations, our employees and the ways in which our customers use our networks and other products and services; changes in the regulatory environment in which we operate, including any increase in restrictions on our ability to operate our networks or businesses; allegations regarding the release of hazardous materials or pollutants into the environment from our, or our predecessors’, network assets and any related government investigations, regulatory developments, litigation, penalties and other liability, remediation and compliance costs, operational impacts or reputational damage; our high level of indebtedness; significant litigation and any resulting material expenses incurred in defending against lawsuits or paying awards or settlements; an adverse change in the ratings afforded our debt securities by nationally accredited ratings organizations or adverse conditions in the credit markets affecting the cost, including interest rates, and/or availability of further financing; significant increases in benefit plan costs or lower investment returns on plan assets; changes in tax laws or regulations, or in their interpretation, or challenges to our tax positions, resulting in additional tax expense or liabilities; changes in accounting assumptions that regulatory agencies, including the SEC, may require or that result from changes in the accounting rules or their application, which could result in an impact on earnings; and risks associated with mergers, acquisitions and other strategic transactions, including our ability to consummate the proposed acquisition of Frontier Communications Parent, Inc. and obtain cost savings, synergies and other anticipated benefits within the expected time period or at all.
Page 9
VlpHU09DSUQyMDE5UTE=
Page 10
VlpHU09DSUQyMDE5UTE=
Verizon Communications Inc.
Non-GAAP Reconciliations - Consolidated Verizon
Consolidated EBITDA and Consolidated Adjusted EBITDA
| | | | | | | | | | | | | | | | | | | | | | | | | | | | | | | | | | | | | | | | | | | | | | | | | | | | | | |
| (dollars in millions) |
| Unaudited | | | | 3 Mos. Ended 9/30/24 | | 3 Mos. Ended 6/30/24 | | 3 Mos. Ended 3/31/24 | | 3 Mos. Ended 12/31/23 | | 3 Mos. Ended 9/30/23 | | 3 Mos. Ended 6/30/23 | | 3 Mos. Ended 3/31/23 | | 3 Mos. Ended 12/31/22 | | | | |
| | | | | | | | | | | | | | | | | | | | | | |
| Consolidated Net Income (Loss) | | | | $ | 3,411 | | | $ | 4,702 | | | $ | 4,722 | | | $ | (2,573) | | | $ | 4,884 | | | $ | 4,766 | | | $ | 5,018 | | | $ | 6,698 | | | | | |
| Add: | | | | | | | | | | | | | | | | | | | | | | |
| Provision for income taxes | | | | 891 | | | 1,332 | | | 1,353 | | | 756 | | | 1,308 | | | 1,346 | | | 1,482 | | | 2,113 | | | | | |
| Interest expense | | | | 1,672 | | | 1,698 | | | 1,635 | | | 1,599 | | | 1,433 | | | 1,285 | | | 1,207 | | | 1,105 | | | | | |
Depreciation and amortization expense(1) | | | | 4,458 | | | 4,483 | | | 4,445 | | | 4,516 | | | 4,431 | | | 4,359 | | | 4,318 | | | 4,218 | | | | | |
| Consolidated EBITDA | | | | $ | 10,432 | | | $ | 12,215 | | | $ | 12,155 | | | $ | 4,298 | | | $ | 12,056 | | | $ | 11,756 | | | $ | 12,025 | | | $ | 14,134 | | | | | |
| | | | | | | | | | | | | | | | | | | | | | |
| Add/(subtract): | | | | | | | | | | | | | | | | | | | | | | |
Other (income) expense, net(2) | | | | $ | (72) | | | $ | 72 | | | $ | (198) | | | $ | 807 | | | $ | (170) | | | $ | (210) | | | $ | (114) | | | $ | (2,687) | | | | | |
| Equity in (earnings) losses of unconsolidated businesses | | | | 24 | | | 14 | | | 9 | | | 11 | | | 18 | | | 33 | | | (9) | | | (4) | | | | | |
| | | | | | | | | | | | | | | | | | | | | | |
| Severance charges | | | | 1,733 | | | — | | | — | | | 296 | | | — | | | 237 | | | — | | | 304 | | | | | |
| Asset and business rationalization | | | | 374 | | | — | | | — | | | 325 | | | — | | | 155 | | | — | | | — | | | | | |
| Legacy legal matter | | | | — | | | — | | | 106 | | | — | | | — | | | — | | | — | | | — | | | | | |
| Verizon Business Group goodwill impairment | | | | — | | | — | | | — | | | 5,841 | | | — | | | — | | | — | | | — | | | | | |
| Legal settlement | | | | — | | | — | | | — | | | 100 | | | — | | | — | | | — | | | — | | | | | |
| Business transformation costs | | | | — | | | — | | | — | | | — | | | 176 | | | — | | | — | | | — | | | | | |
| Non-strategic business shutdown | | | | — | | | — | | | — | | | — | | | 158 | | | — | | | — | | | — | | | | | |
| | | | | | | | | | | | | | | | | | | | | | |
| | | | | | | | | | | | | | | | | | | | | | |
| | | | | | | | | | | | | | | | | | | | | | |
| | | | | | | | | | | | | | | | | | | | | | |
| | | | | | | | | | | | | | | | | | | | | | |
| | | | 2,059 | | | 86 | | | (83) | | | 7,380 | | | 182 | | | 215 | | | (123) | | | (2,387) | | | | | |
| | | | | | | | | | | | | | | | | | | | | | |
| Consolidated Adjusted EBITDA | | | | $ | 12,491 | | | $ | 12,301 | | | $ | 12,072 | | | $ | 11,678 | | | $ | 12,238 | | | $ | 11,971 | | | $ | 11,902 | | | $ | 11,747 | | | | | |
| | | | | | | | | | | | | | | | | | | | | | |
| | | | | | | | | | | | | | | | | | | | | | |
| | | | | | | | | | | | | | | | | | | | | | |
| | | | | | | | | | | | | | | | | | | | | | |
| | | | | | | | | | | | | | | | | | | | | | |
| | | | | | | | | | | | | | | | | | | | | | |
| | | | | | | | | | | | | | | | | | | | | | |
| | | | | | | | | | | | | | | | | | | | | | |
| | | | | | | | | | | | | | | | | | | | | | |
| | | | | | | | | | | | | | | | | | | | | | |
| | | | | | | | | | | | | | | | | | | | | | |
| | | | | | | | | | | | | | | | | | | | | | |
| | | | | | | | | | | | | | | | | | | | | | |
| | | | | | | | | | | | | | | | | | | | | | |
| | | | | | | | | | | | | | | | | | | | | | |
| | | | | | | | | | | | | | | | | | | | | | |
| | | | | | | | | | | | | | | | | | | | | | |
| | | | | | | | | | | | | | | | | | | | | | |
| | | | | | | | | | | | | | | | | | | | | | |
Footnotes:
(1) Includes Amortization of acquisition-related intangible assets and a portion of the Non-strategic business shutdown, where applicable.
(2) Includes Pension and benefits remeasurement adjustments, where applicable.
Verizon Communications Inc.
Consolidated EBITDA and Consolidated Adjusted EBITDA (LTM)
| | | | | | | | | | | | | | | | | | | | | | | | | | | | | | | | | | |
| (dollars in millions) | | | | | | |
| | | | 12 Mos. Ended | | 12 Mos. Ended | | | | | | 12 Mos. Ended | | | | | | | | | | |
| Unaudited | | | | 9/30/24 | | 6/30/24 | | | | | | 9/30/23 | | | | | | | | | | |
| | | | | | | | | | | | | | | | | | | | | | |
| Consolidated Net Income | | | | $ | 10,262 | | | $ | 11,735 | | | | | | | $ | 21,366 | | | | | | | | | | | |
| Add: | | | | | | | | | | | | | | | | | | | | | | |
| Provision for income taxes | | | | 4,332 | | | 4,749 | | | | | | | 6,249 | | | | | | | | | | | |
| Interest expense | | | | 6,604 | | | 6,365 | | | | | | | 5,030 | | | | | | | | | | | |
Depreciation and amortization expense(1) | | | | 17,902 | | | 17,875 | | | | | | | 17,326 | | | | | | | | | | | |
| Consolidated EBITDA | | | | $ | 39,100 | | | $ | 40,724 | | | | | | | $ | 49,971 | | | | | | | | | | | |
| | | | | | | | | | | | | | | | | | | | | | |
| Add/(subtract): | | | | | | | | | | | | | | | | | | | | | | |
Other (income) expense, net(2) | | | | $ | 609 | | | $ | 511 | | | | | | | $ | (3,181) | | | | | | | | | | | |
| Equity in losses of unconsolidated businesses | | | | 58 | | | 52 | | | | | | | 38 | | | | | | | | | | | |
| Severance charges | | | | 2,029 | | | 296 | | | | | | | 541 | | | | | | | | | | | |
| Asset and business rationalization | | | | 699 | | | 325 | | | | | | | 155 | | | | | | | | | | | |
| Legacy legal matter | | | | 106 | | | 106 | | | | | | | — | | | | | | | | | | | |
| Verizon Business Group goodwill impairment | | | | 5,841 | | | 5,841 | | | | | | | — | | | | | | | | | | | |
| Legal settlement | | | | 100 | | | 100 | | | | | | | — | | | | | | | | | | | |
| Business transformation costs | | | | — | | | 176 | | | | | | | 176 | | | | | | | | | | | |
| Non-strategic business shutdown | | | | — | | | 158 | | | | | | | 158 | | | | | | | | | | | |
| | | | | | | | | | | | | | | | | | | | | | |
| | | | | | | | | | | | | | | | | | | | | | |
| | | | | | | | | | | | | | | | | | | | | | |
| | | | | | | | | | | | | | | | | | | | | | |
| | | | | | | | | | | | | | | | | | | | | | |
| | | | | | | | | | | | | | | | | | | | | | |
| | | | 9,442 | | | 7,565 | | | | | | | (2,113) | | | | | | | | | | | |
| | | | | | | | | | | | | | | | | | | | | | |
| Consolidated Adjusted EBITDA | | | | $ | 48,542 | | | $ | 48,289 | | | | | | | $ | 47,858 | | | | | | | | | | | |
Footnotes:
(1) Includes Amortization of acquisition-related intangible assets and a portion of the Non-strategic business shutdown, where applicable.
(2) Includes Pension and benefits remeasurement adjustments, where applicable.
Verizon Communications Inc.
Net Unsecured Debt and Net Unsecured Debt to Consolidated Adjusted EBITDA Ratio | | | | | | | | | | | | | | | | | | | | | | | | | | | | |
| (dollars in millions) |
| Unaudited | | 9/30/24 | | 6/30/24 | | 9/30/23 | | | | | | | | |
| | | | | | | | | | | | | | |
| Debt maturing within one year | | $ | 21,763 | | | $ | 23,255 | | | $ | 12,950 | | | | | | | | | |
| Long-term debt | | 128,878 | | | 126,022 | | | 134,441 | | | | | | | | | |
| Total Debt | | 150,641 | | | 149,277 | | | 147,391 | | | | | | | | | |
| Less Secured debt | | 24,272 | | | 24,015 | | | 20,951 | | | | | | | | | |
| Unsecured Debt | | 126,369 | | | 125,262 | | | 126,440 | | | | | | | | | |
| Less Cash and cash equivalents | | 4,987 | | | 2,432 | | | 4,210 | | | | | | | | | |
Net Unsecured Debt | | $ | 121,382 | | | $ | 122,830 | | | $ | 122,230 | | | | | | | | | |
| Consolidated Net Income (LTM) | | $ | 10,262 | | | $ | 11,735 | | | $ | 21,366 | | | | | | | | | |
| Consolidated Adjusted EBITDA (LTM) | | $ | 48,542 | | | $ | 48,289 | | | $ | 47,858 | | | | | | | | | |
| Unsecured Debt to Consolidated Net Income Ratio | | 12.3 | x | | 10.7 | x | | 5.9 | x | | | | | | | | |
| Net Unsecured Debt to Consolidated Adjusted EBITDA Ratio | | 2.5 | x | | 2.5 | x | | 2.6 | x | | | | | | | | |
| Net Unsecured Debt - Quarter over quarter change | | $ | (1,448) | | | | | | | | | | | | | |
| Net Unsecured Debt - Year over year change | | $ | (848) | | | | | | | | | | | | | |
| | | | | | | | | | | | | | |
Net Unsecured Debt to Consolidated Adjusted EBITDA Ratio - Quarter over quarter change | | — | x | | | | | | | | | | | | |
| Net Unsecured Debt to Consolidated Adjusted EBITDA Ratio - Year over year change | | (0.1) | x | | | | | | | | | | | | |
| | | | | | | | | | | | | | |
| | | | | | | | | | | | | | |
| | | | | | | | | | | | | | |
Adjusted Earnings per Common Share (Adjusted EPS)
| | | | | | | | | | | | | | | | | | | | | | | | | | | | | | | | |
(dollars in millions, except per share amounts) |
| Unaudited | | 3 Mos. Ended 9/30/24 | | 3 Mos. Ended 9/30/23 |
| | Pre-tax | Tax | After-Tax | | | Pre-tax | Tax | After-Tax | |
| EPS | | | | | $ | 0.78 | | | | | | $ | 1.13 | |
| Amortization of acquisition-related intangible assets | | $ | 186 | | $ | (46) | | $ | 140 | | 0.03 | | | $ | 224 | | $ | (56) | | $ | 168 | | 0.04 | |
| Severance charges | | 1,733 | | (429) | | 1,304 | | 0.31 | | | — | | — | | — | | — | |
| | | | | | | | | | |
| | | | | | | | | | |
| | | | | | | | | | |
| Asset and business rationalization | | 374 | | (90) | | 284 | | 0.07 | | | — | | — | | — | | — | |
| | | | | | | | | | |
| Business transformation costs | | — | | — | | — | | — | | | 176 | | (45) | | 131 | | 0.03 | |
| Non-strategic business shutdown | | — | | — | | — | | — | | | 179 | | (83) | | 96 | | 0.02 | |
| | | | | | | | | | |
| | | | | | | | | | |
| | | | | | | | | | |
| | | | | | | | | | |
| | | | | | | | | | |
| | | | | | | | | | |
| | | | | | | | | | |
| | | | | | | | | | |
| | | | | | | | | | |
| | | | | | | | | | |
| | $ | 2,293 | | $ | (565) | | $ | 1,728 | | $ | 0.41 | | | $ | 579 | | $ | (184) | | $ | 395 | | $ | 0.09 | |
| Adjusted EPS | | | | | $ | 1.19 | | | | | | $ | 1.22 | |
| | | | | | | | | | |
Footnote:
Adjusted EPS may not add due to rounding.
| | | | | | | | | | | | | | | |
| | | | | |
| Free Cash Flow | | | | | |
| (dollars in millions) | |
| Unaudited | | 9 Mos. Ended 9/30/24 | | 9 Mos. Ended 9/30/23 | |
| | | | | |
| Net Cash Provided by Operating Activities | | $ | 26,480 | | | $ | 28,798 | | |
| Capital expenditures (including capitalized software) | | (12,019) | | | (14,164) | | |
| Free Cash Flow | | $ | 14,461 | | | $ | 14,634 | | |
| | | | | |
| | | | | |
| | | | | |
| | | | | |
Verizon Communications Inc.
| | | | | | | | | | | | | | | |
| | | | | |
| Consolidated Operating Expenses Excluding Depreciation and Amortization and Special Items | | | | | |
| (dollars in millions) |
| Unaudited | | 3 Mos. Ended 9/30/24 | | | 3 Mos. Ended 9/30/23 |
| | | | | |
| Consolidated Operating Expenses | | $ | 27,404 | | | | $ | 25,863 | |
Depreciation and amortization expense(1) | | 4,458 | | | | 4,431 | |
| Severance charges | | 1,733 | | | | — | |
| | | | | |
| | | | | |
| Asset and business rationalization | | 374 | | | | — | |
| | | | | |
| Business transformation costs | | — | | | | 176 | |
| Non-strategic business shutdown | | — | | | | 158 | |
| Consolidated Operating Expenses Excluding Depreciation and Amortization and Special Items | | $ | 20,839 | | | | $ | 21,098 | |
| Year over year change % | | (1.2) | % | | | |
| | | | | |
| | | | | |
Footnote:
(1) Includes Amortization of acquisition-related intangible assets and a portion of the Non-strategic business shutdown, where applicable.
Verizon Communications Inc.
Non-GAAP Reconciliations - Segments
Segment EBITDA and Segment EBITDA Margin
Consumer
| | | | | | | | | | | | | | | | | | |
| (dollars in millions) |
| Unaudited | | 3 Mos. Ended 9/30/24 | | 3 Mos. Ended 9/30/23 | | | | |
| | | | | | | | |
| Operating Income | | $ | 7,604 | | | $ | 7,547 | | | | | |
| Add Depreciation and amortization expense | | 3,411 | | | 3,272 | | | | | |
| Segment EBITDA | | $ | 11,015 | | | $ | 10,819 | | | | | |
| Year over year change % | | 1.8 | % | | | | | | |
| | | | | | | | |
| Total operating revenues | | $ | 25,360 | | | $ | 25,257 | | | | | |
| Operating Income Margin | | 30.0 | % | | 29.9 | % | | | | |
| Segment EBITDA Margin | | 43.4 | % | | 42.8 | % | | | | |
| | | | | | | | |
| | | | | | | | |
Business
| | | | | | | | | | | | | | | | | | |
| (dollars in millions) |
| Unaudited | | 3 Mos. Ended 9/30/24 | | 3 Mos. Ended 9/30/23 | | | | |
| | | | | | | | |
| Operating Income | | $ | 565 | | | $ | 539 | | | | | |
| Add Depreciation and amortization expense | | 1,040 | | | 1,127 | | | | | |
| Segment EBITDA | | $ | 1,605 | | | $ | 1,666 | | | | | |
| Year over year change % | | (3.7) | % | | | | | | |
| | | | | | | | |
| Total operating revenues | | $ | 7,351 | | | $ | 7,527 | | | | | |
| Operating Income Margin | | 7.7 | % | | 7.2 | % | | | | |
| Segment EBITDA Margin | | 21.8 | % | | 22.1 | % | | | | |
| | | | | | | | |
| | | | | | | | |