Alexandria Real Estate Equities, Inc. All Rights Reserved. © 2024 |
Alexandria Real Estate Equities, Inc. All Rights Reserved. © 2024 |
 | |
Table of Contents | |
September 30, 2024 | |
COMPANY HIGHLIGHTS | Page | Page | ||||
Mission and Cluster Model ..................................................................... | Industry and Corporate Responsibility Leadership ............................ | |||||
EARNINGS PRESS RELEASE | Page | Page | ||||
Third Quarter Ended September 30, 2024 Financial and Operating Results ................................................................................ | Earnings Call Information and About the Company ....................... | |||||
Guidance ................................................................................................... | Consolidated Statements of Operations .......................................... | |||||
Acquisitions ............................................................................................... | Consolidated Balance Sheets ............................................................ | |||||
Dispositions ............................................................................................... | ||||||
SUPPLEMENTAL INFORMATION | Page | Page | ||||
Company Profile ....................................................................................... | External Growth / Investments in Real Estate | |||||
Investor Information ................................................................................. | Investments in Real Estate ................................................................ | |||||
Financial and Asset Base Highlights ..................................................... | New Class A/A+ Development and Redevelopment Properties: | |||||
High-Quality and Diverse Client Base ................................................. | Recent deliveries ............................................................................ | |||||
Occupancy ................................................................................................ | Current Projects .............................................................................. | |||||
Internal Growth | Summary of Pipeline ...................................................................... | |||||
Key Operating Metrics ............................................................................. | Construction Spending and Capitalization of Interest .................... | |||||
Same Property Performance .................................................................. | Joint Venture Financial Information ................................................... | |||||
Leasing Activity ......................................................................................... | Balance Sheet Management | |||||
Contractual Lease Expirations ............................................................... | Investments .......................................................................................... | |||||
Top 20 Tenants ......................................................................................... | Key Credit Metrics ............................................................................... | |||||
Summary of Properties and Occupancy .............................................. | Summary of Debt ................................................................................. | |||||
Property Listing ........................................................................................ | Definitions and Reconciliations | |||||
Definitions and Reconciliations .......................................................... | ||||||
CONFERENCE CALL INFORMATION: | ||
Tuesday, October 22, 2024 3:00 p.m. Eastern Time | ||
12:00 p.m. Pacific Time | ||
(833) 366-1125 or (412) 902-6738 | ||
Ask to join the conference call for Alexandria Real Estate Equities, Inc. | ||
CONTACT INFORMATION: | ||
Alexandria Real Estate Equities, Inc. corporateinformation@are.com | ||
JOEL S. MARCUS Executive Chairman & Founder | ||
PETER M. MOGLIA Chief Executive Officer & Chief Investment Officer | ||
DANIEL J. RYAN Co-President & Regional Market Director – San Diego | ||
HUNTER L. KASS Co-President & Regional Market Director – Greater Boston | ||
MARC E. BINDA Chief Financial Officer & Treasurer | ||
PAULA SCHWARTZ Managing Director, Rx Communications Group (917) 633-7790 | ||
SARA M. KABAKOFF Senior Vice President – Chief Content Officer |
Alexandria Real Estate Equities, Inc. All Rights Reserved. © 2024 | iii |

Alexandria Real Estate Equities, Inc. All Rights Reserved. © 2024 | iv |
Alexandria Real Estate Equities, Inc. All Rights Reserved. © 2024 | v |
ALEXANDRIA’S
COMPETITIVE
ADVANTAGES
First mover advantage in the
top life science clusters
High-quality assets aggregated
in desirable and well-amenitized
mega campuses
High-quality cash flows and
substantial embedded future
net operating income
Longstanding tenant
relationships that demonstrate
stellar brand loyalty
Fortress balance sheet with
significant liquidity
Unique and deep life science
industry expertise
Long-tenured and highly
experienced management team
IRREPLACEABLE
LABSPACE® REAL ESTATE
PLATFORM THAT LEADS THE
ASSET CLASS WE PIONEERED
OPERATING RSF
41.8M
MEGA CAMPUSES ENCOMPASS |
76% |
OF OUR ANNUAL RENTAL REVENUE |

As of September 30, 2024. Refer to “Definitions and reconciliations” in the Supplemental Information for additional details.
Alexandria Real Estate Equities, Inc. All Rights Reserved. © 2024 | vi |
ALEXANDRIA’S MEGA CAMPUS PLATFORM DRIVES
SUPERIOR OPERATING RESULTS
76% | 72% | 69% |
of Alexandria’s Annual Rental Revenue | of Alexandria’s Operating RSF | of Total Development & Redevelopment Pipeline RSF |
MEGA CAMPUSES ENCOMPASS | MEGA CAMPUS OCCUPANCY OUTPERFORMANCE | ||
Average Occupancy(1) Since 2020 | |||
92% | 96% | 4% | ||
Non-Mega Campus | Mega Campus | Occupancy Outperformance |
As of September 30, 2024. Refer to “Definitions and reconciliations” in the Supplemental Information for additional details.
(1)Represents the average occupancy percentage of operating properties as of December 31 for 2020–2023 and September 30, 2024.
Alexandria Real Estate Equities, Inc. All Rights Reserved. © 2024 | vii |

ALEXANDRIA’S OUTSTANDING LONG-TERM VALUE
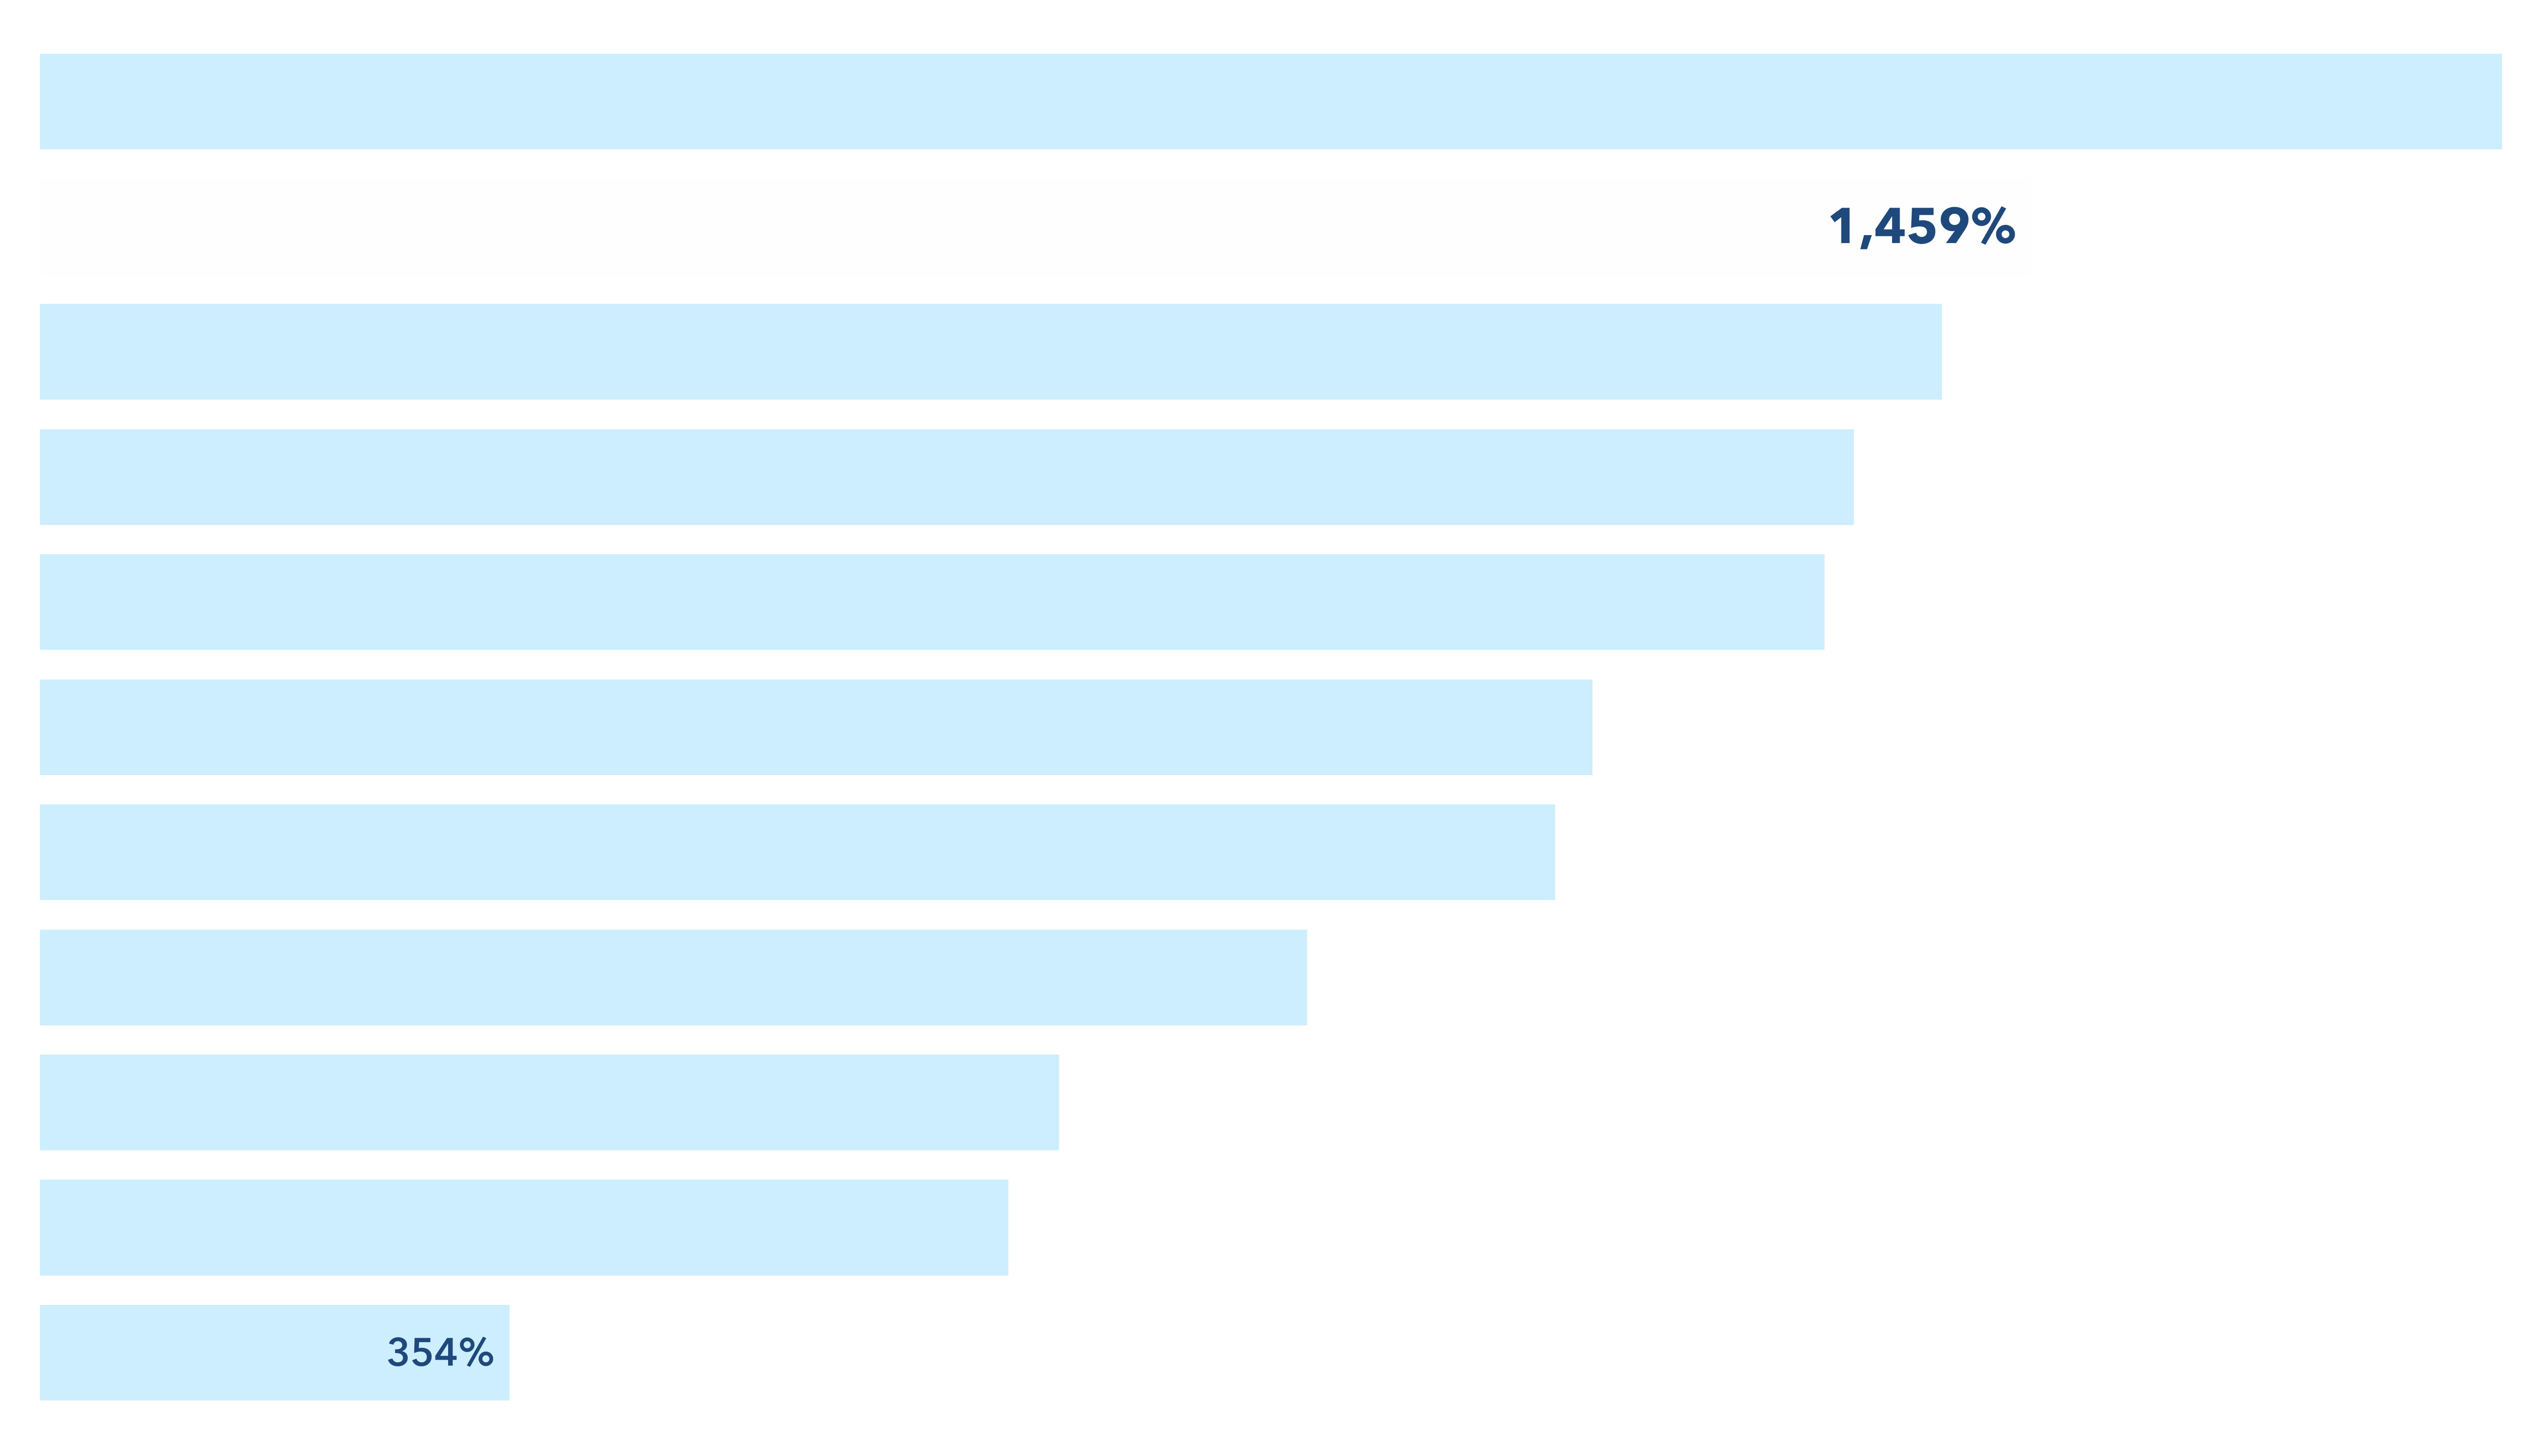
HEALTHCARE
REALTY TRUST
WELLTOWER | 2,833% | |
NATIONAL HEALTH INVESTORS | 1,395% | |
FTSE NAREIT EQUITY HEALTH CARE INDEX | 1,332% | |
UNIVERSAL HEALTH REALTY INCOME TRUST | 1,309% | |
LTC PROPERTIES | 1,140% | |
VENTAS | 1,114% | |
MSCI US REIT INDEX | 934% | |
OMEGA HEALTHCARE INVESTORS | 753% | |
HEALTHPEAK PROPERTIES | 715% |
Total Shareholder Return From ARE’s IPO on May 27, 1997(1) to September 30, 2024

Source: S&P Global Market Intelligence. Assumes reinvestment of dividends.
The REITs presented individually in the chart above are only those constituents of the FTSE NAREIT Equity Health Care Index as of September 30, 2024 for which TSR information since May 27, 1997 is available.
(1)Alexandria’s initial public offering (“IPO”) was priced at $20.00 per share on May 27, 1997.
Alexandria Real Estate Equities, Inc. All Rights Reserved. © 2024 | viii |

ALEXANDRIA’S
INTERNAL
GROWTH
Alexandria Real Estate Equities, Inc. All Rights Reserved. © 2024 | ix |
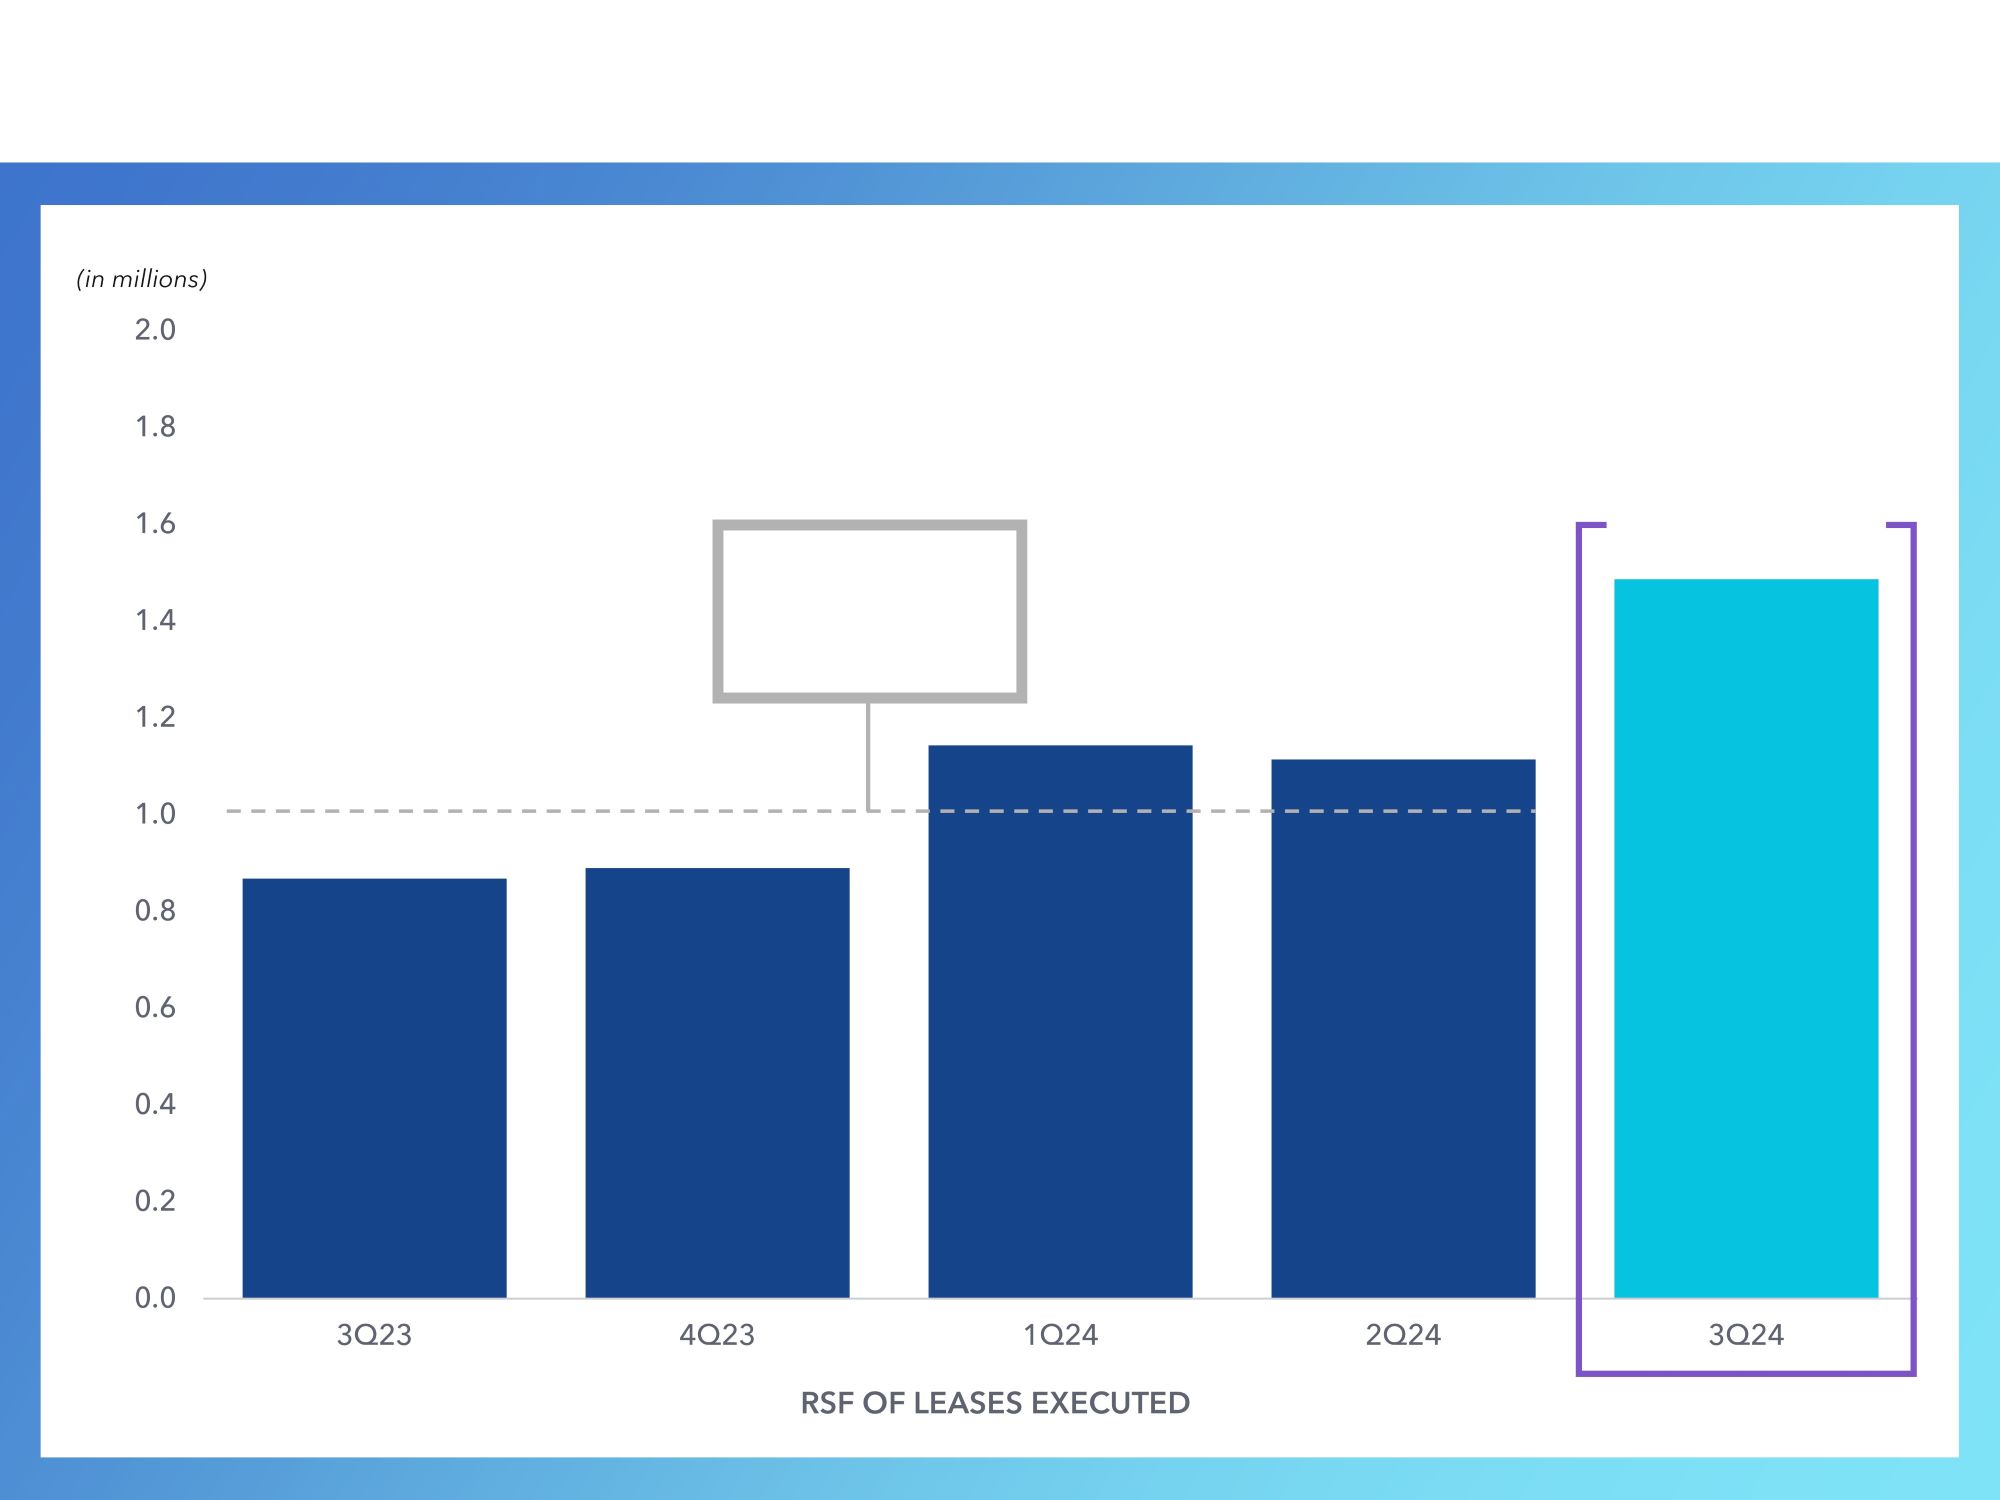
ALEXANDRIA 3Q24 LEASING VOLUME EXCEEDS PREVIOUS
FOUR-QUARTER AVERAGE
1.0M RSF
Quarterly Average
(3Q23–2Q24)
1.5M RSF
Exceeds
Quarterly
Average by 48%
Alexandria Real Estate Equities, Inc. All Rights Reserved. © 2024 | x |
ALEXANDRIA’S OPERATIONAL EXCELLENCE DRIVES STEADY
AND CONSISTENTLY HIGH OCCUPANCY
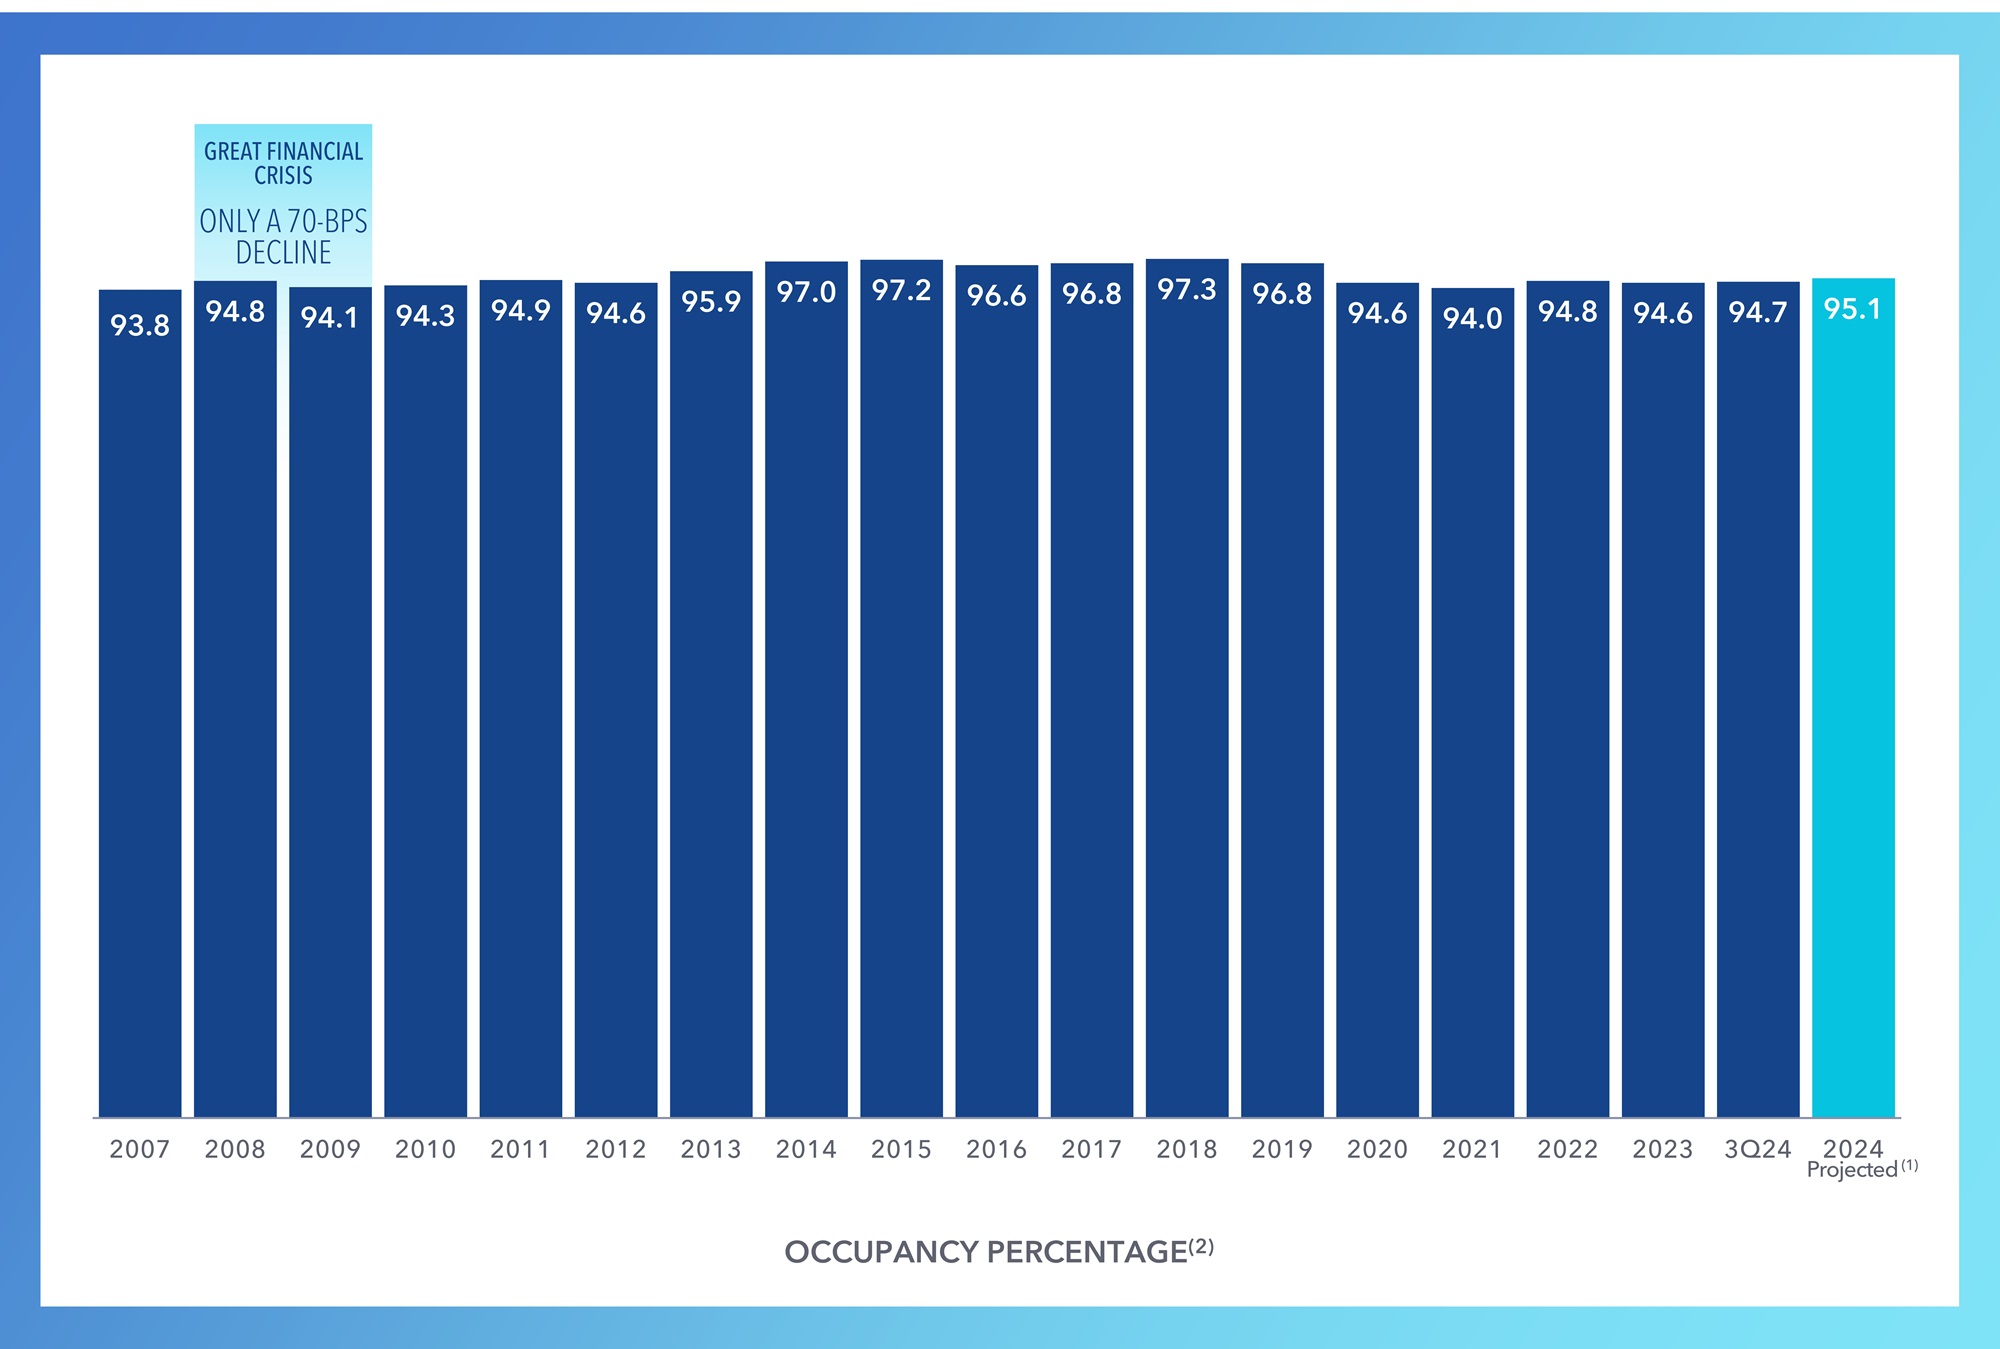
(1)Represents the midpoint of our 2024 guidance range for occupancy percentage in North America as of December 31, 2024. Refer to “Guidance” in the Earnings Press Release for additional details.
(2)Represents occupancy percentage of operating properties in North America as of each period-end.
Alexandria Real Estate Equities, Inc. All Rights Reserved. © 2024 | xi |

ALEXANDRIA’S REIT INDUSTRY-LEADING CLIENT BASE OF APPROXIMATELY
800 TENANTS DRIVES STABLE, RESILIENT, AND LONG-DURATION CASH FLOWS
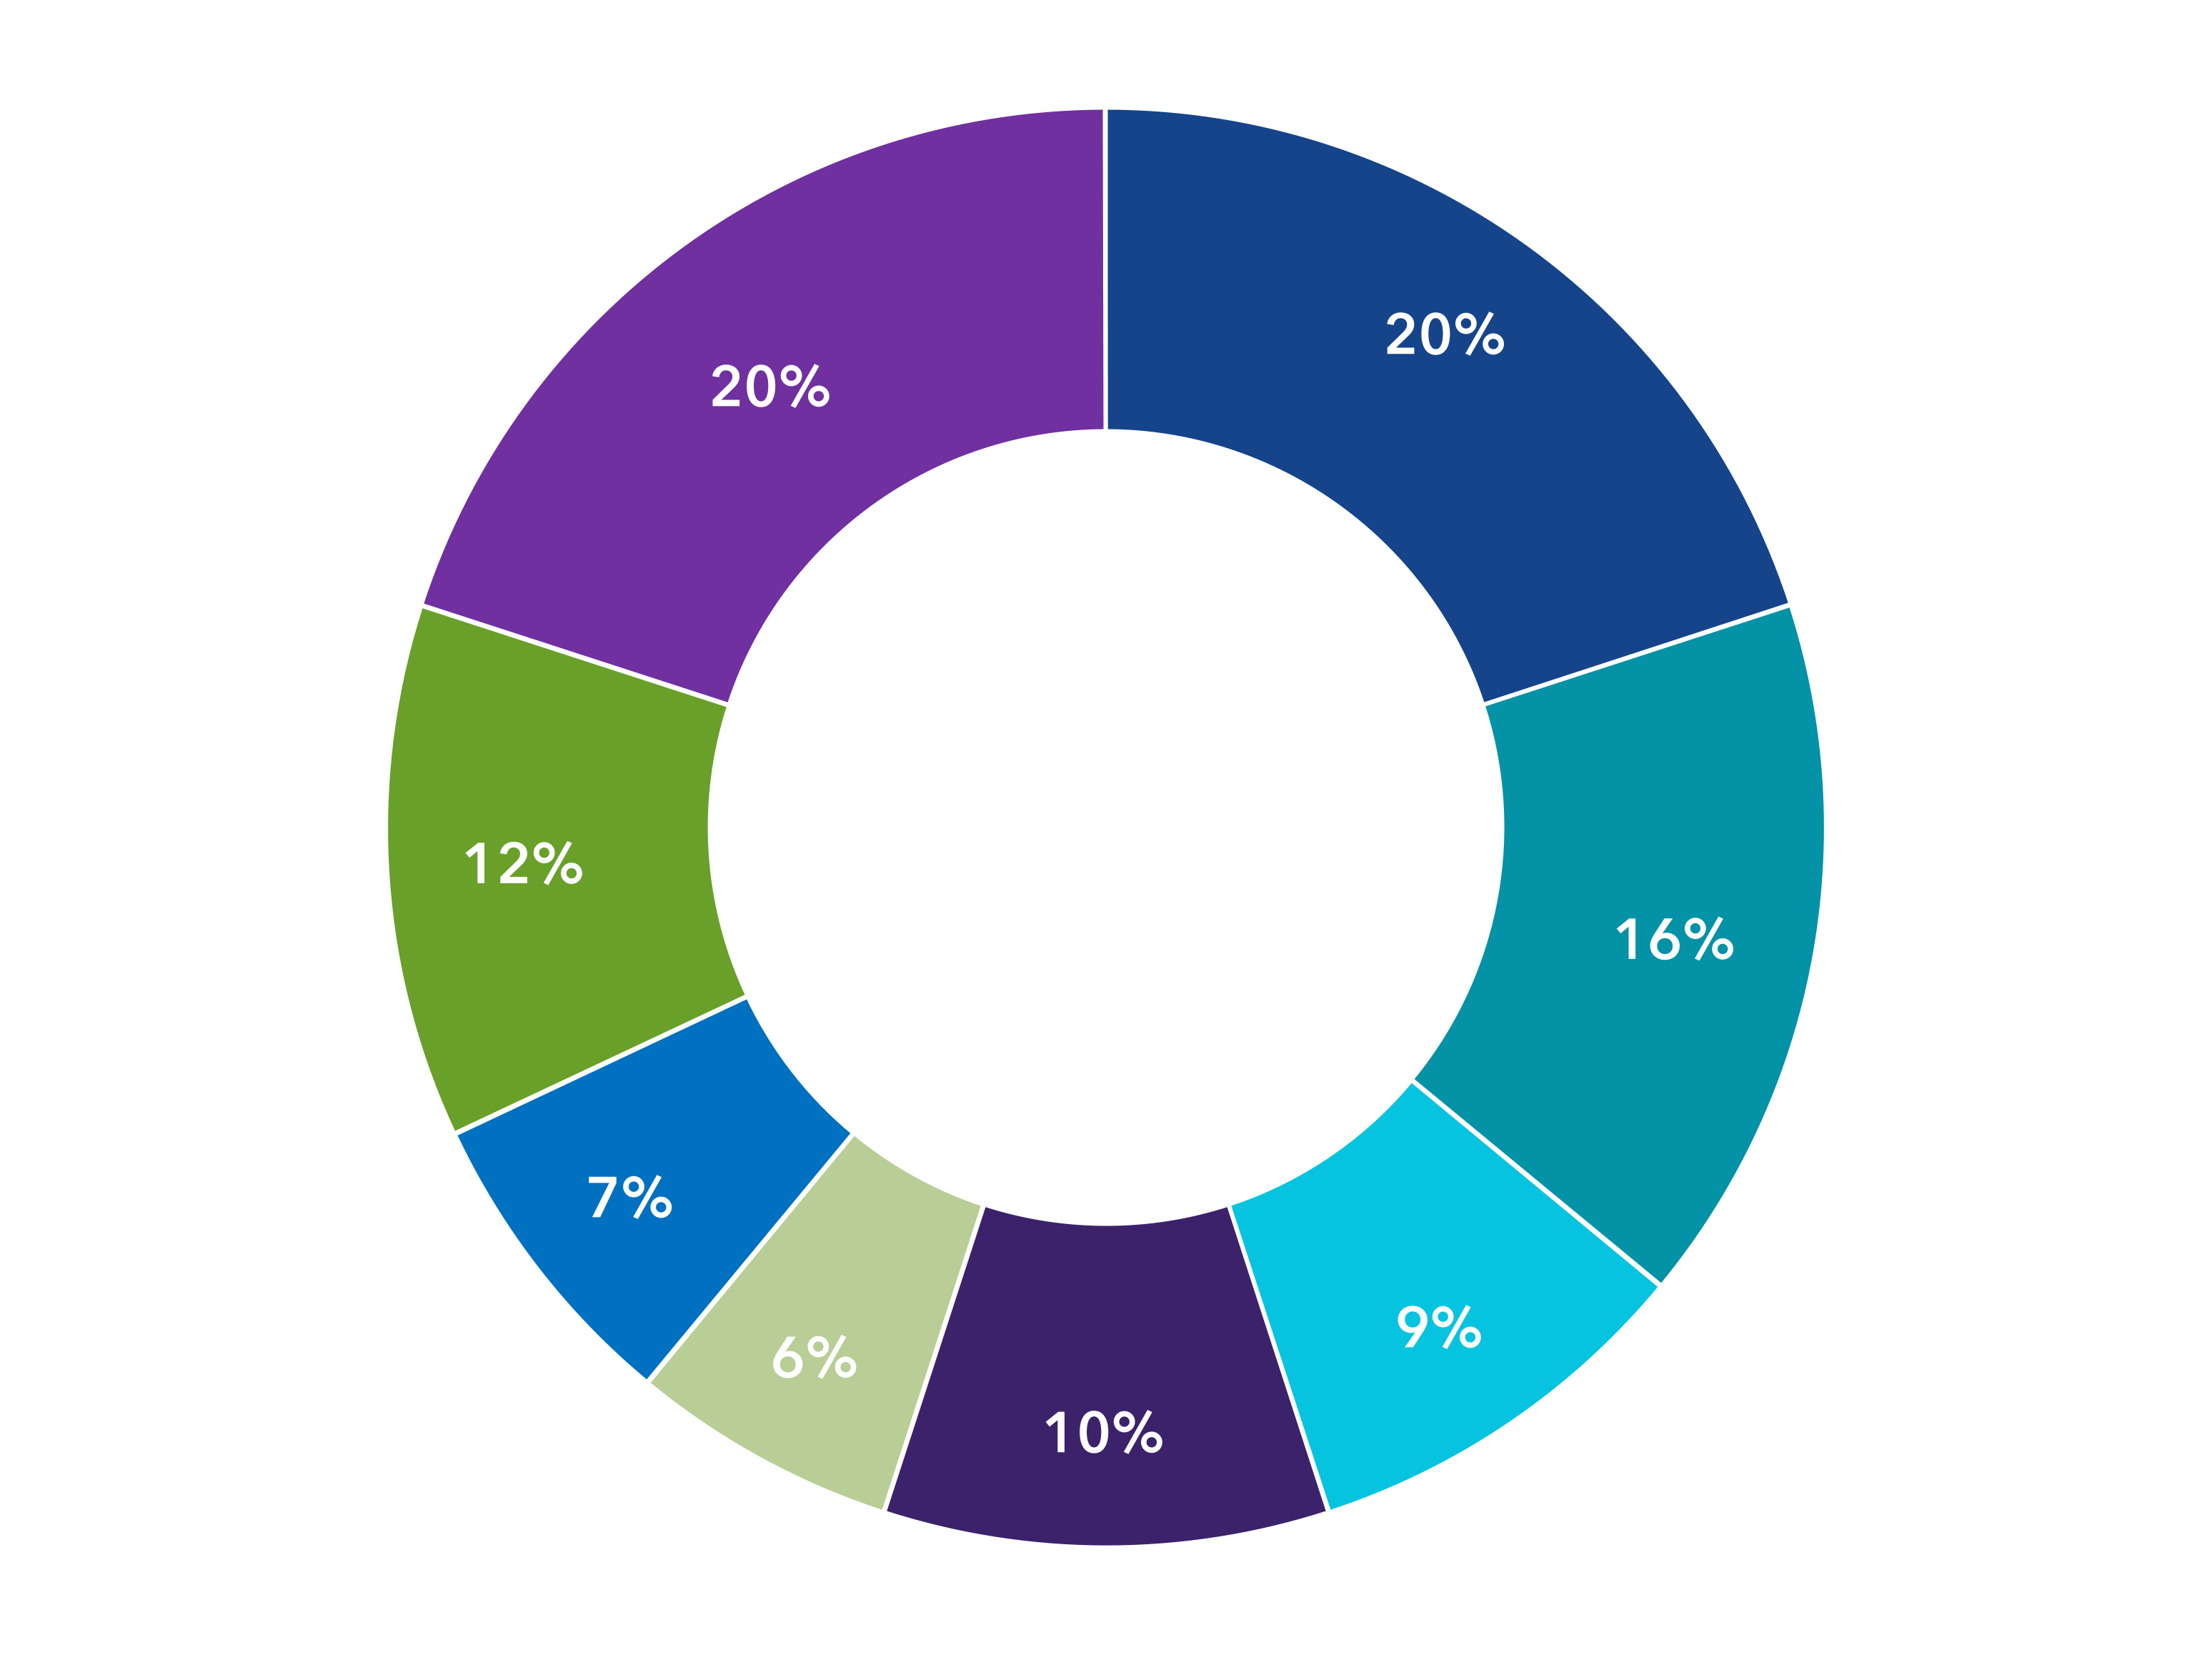
Life Science
Product,
Service, and
Device
Multinational
Pharmaceutical
Public
Biotechnology –
Approved or
Marketed
Product
Public
Biotechnology –
Preclinical or
Clinical Stage
Private
Biotechnology
Other Investment-Grade
or Large Cap Tech
Other(1)
Biomedical and
Government
Institutions
92%
of Top 20 Tenant Annual Rental
Revenue as of 3Q24 Is From
Investment-Grade or Publicly
Traded Large Cap Tenants
80%
of Leasing Activity During the
Last Twelve Months Was
Generated From Alexandria’s
Existing Client Base
As of September 30, 2024. Annual rental revenue represents amounts in effect as of September 30, 2024. Refer to “Definitions and reconciliations” in the Supplemental Information for additional details, including our methodology of calculating
annual rental revenue from unconsolidated real estate joint ventures.
(1)Represents the percentage of our annual rental revenue generated by technology, professional services, finance, telecommunications, and construction/real estate companies, as well as retail-related tenants, which generate less than
1.0% of our annual rental revenue.
Alexandria Real Estate Equities, Inc. All Rights Reserved. © 2024 | xii |

ALEXANDRIA’S SUSTAINED OPERATIONAL EXCELLENCE AND
STRENGTH IN TENANT COLLECTIONS
99.8%
Average Tenant
Collections
1Q21–3Q24
Tenant Receivables
Represent
0.9%
of 3Q24
Rental Revenues
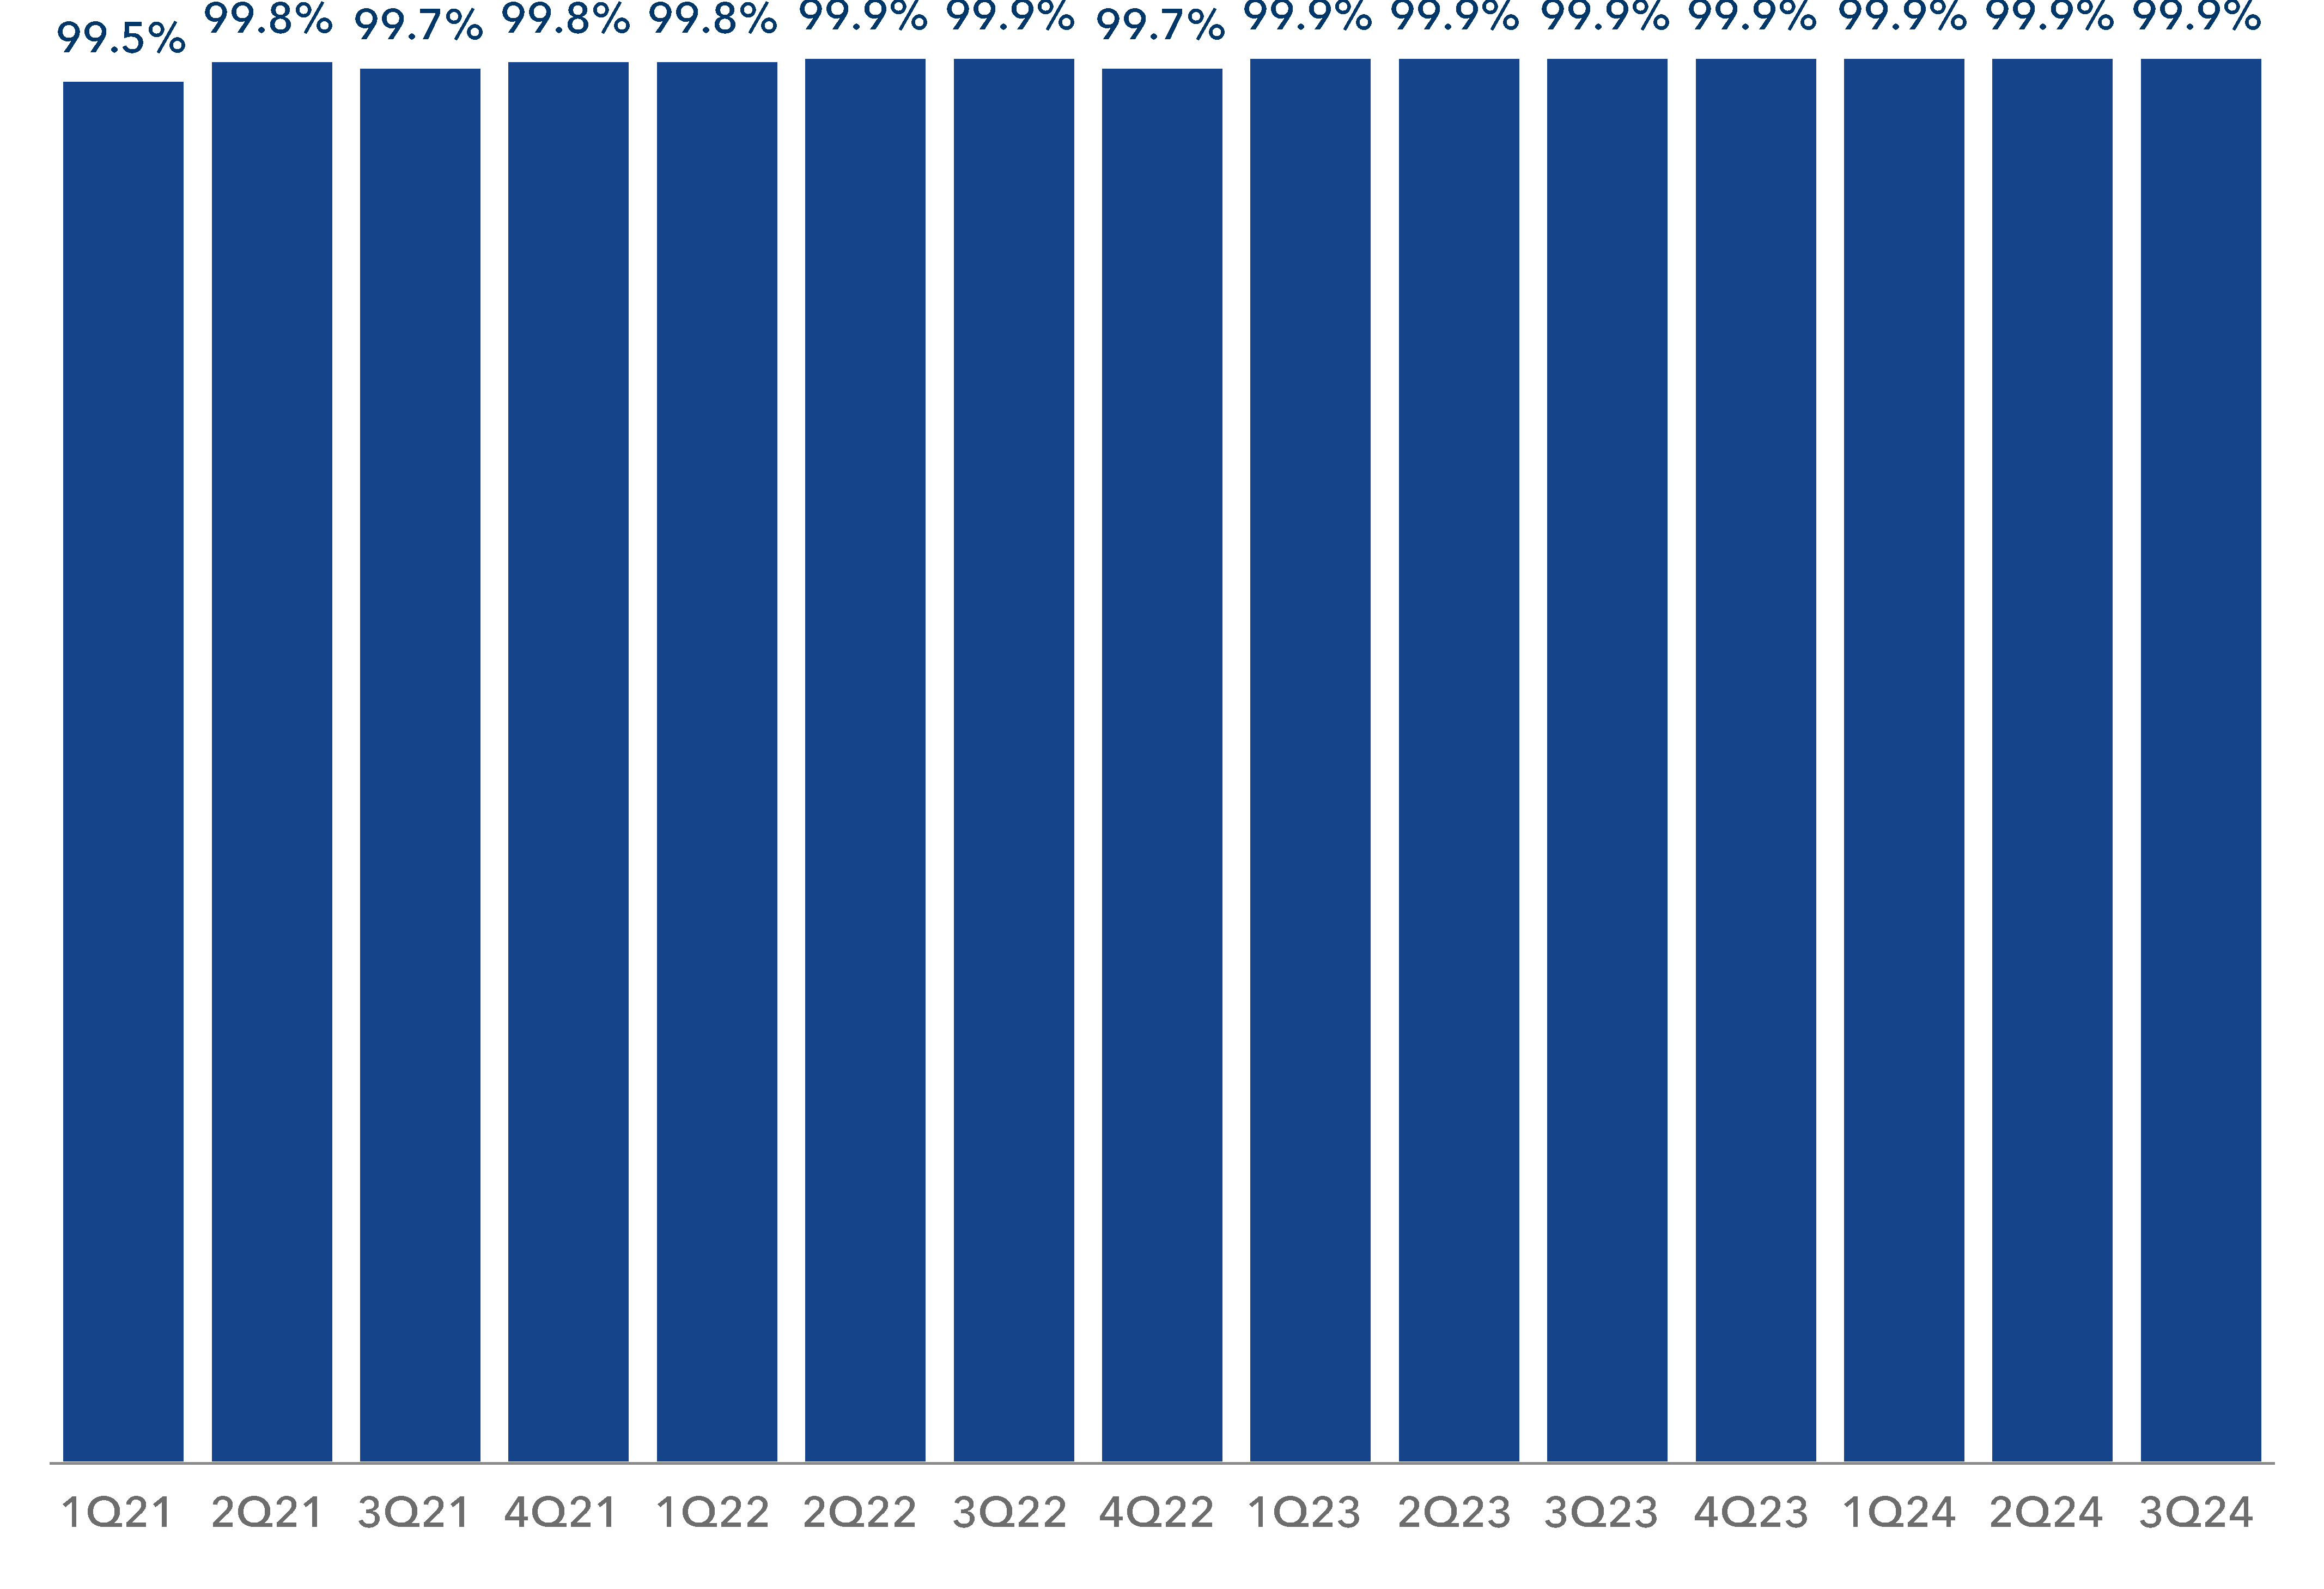
TENANT RENTS AND RECEIVABLES COLLECTED(1)
(1)Represents tenant rents and receivables collected for each quarter-end as of each respective earnings release date.
Alexandria Real Estate Equities, Inc. All Rights Reserved. © 2024 | xiii |
ALEXANDRIA’S FORTRESS
BALANCE SHEET AND
STRONG EXECUTION OF
ASSET RECYCLING
Alexandria Real Estate Equities, Inc. All Rights Reserved. © 2024 | xiv |
ALEXANDRIA’S STRONG AND FLEXIBLE BALANCE SHEET
WITH SIGNIFICANT LIQUIDITY
TOP 10%
CREDIT RATING RANKING
AMONG ALL PUBLICLY
TRADED U.S. REITS(1)
WEIGHTED AVERAGE
4Q24 TARGET
YEARS
SIGNIFICANT LIQUIDITY(2) | PERCENTAGE OF DEBT MATURING 2049 & BEYOND | PERCENTAGE OF FIXED RATE DEBT SINCE 2020(3) | ||
$5.4B | 31% | 97.7% | ||
Baa1
Stable
BBB+
Stable
NET DEBT AND PREFERRED STOCK TO ADJUSTED EBITDA(4) | REMAINING DEBT TERM | INTEREST RATE | ||
≤5.1x | 12.6 | 3.91% |
As of September 30, 2024.
(1)A credit rating is not a recommendation to buy, sell, or hold securities and may be subject to revision or withdrawal at any time. Top 10% ranking represents credit rating levels from Moody’s Ratings and S&P Global Ratings for publicly
traded U.S. REITs, from Bloomberg Professional Services and Nareit.
(2)Refer to “Key credit metrics” in the Supplemental Information for additional details.
(3)Represents the average fixed rate debt as of each December 31 from 2020 through 2023 and as of September 30, 2024.
(4)Quarter annualized. Refer to “Definitions and reconciliations” in the Supplemental Information for additional details.
Alexandria Real Estate Equities, Inc. All Rights Reserved. © 2024 | xv |
ALEXANDRIA’S HISTORICALLY CONSISTENT, STRONG, AND INCREASING
DIVIDENDS WITH A FOCUS ON RETAINING SIGNIFICANT CASH FLOWS FROM
OPERATING ACTIVITIES AFTER DIVIDENDS FOR REINVESTMENT
For 3Q24, we declared a cash dividend of $1.30 per common share

4.4%
Dividend Yield
5.4%
Average Annual Dividend
Per-Share Growth
$2.1B
Net Cash Provided by
Operating Activities
After Dividends
(1)
(2)
(3)
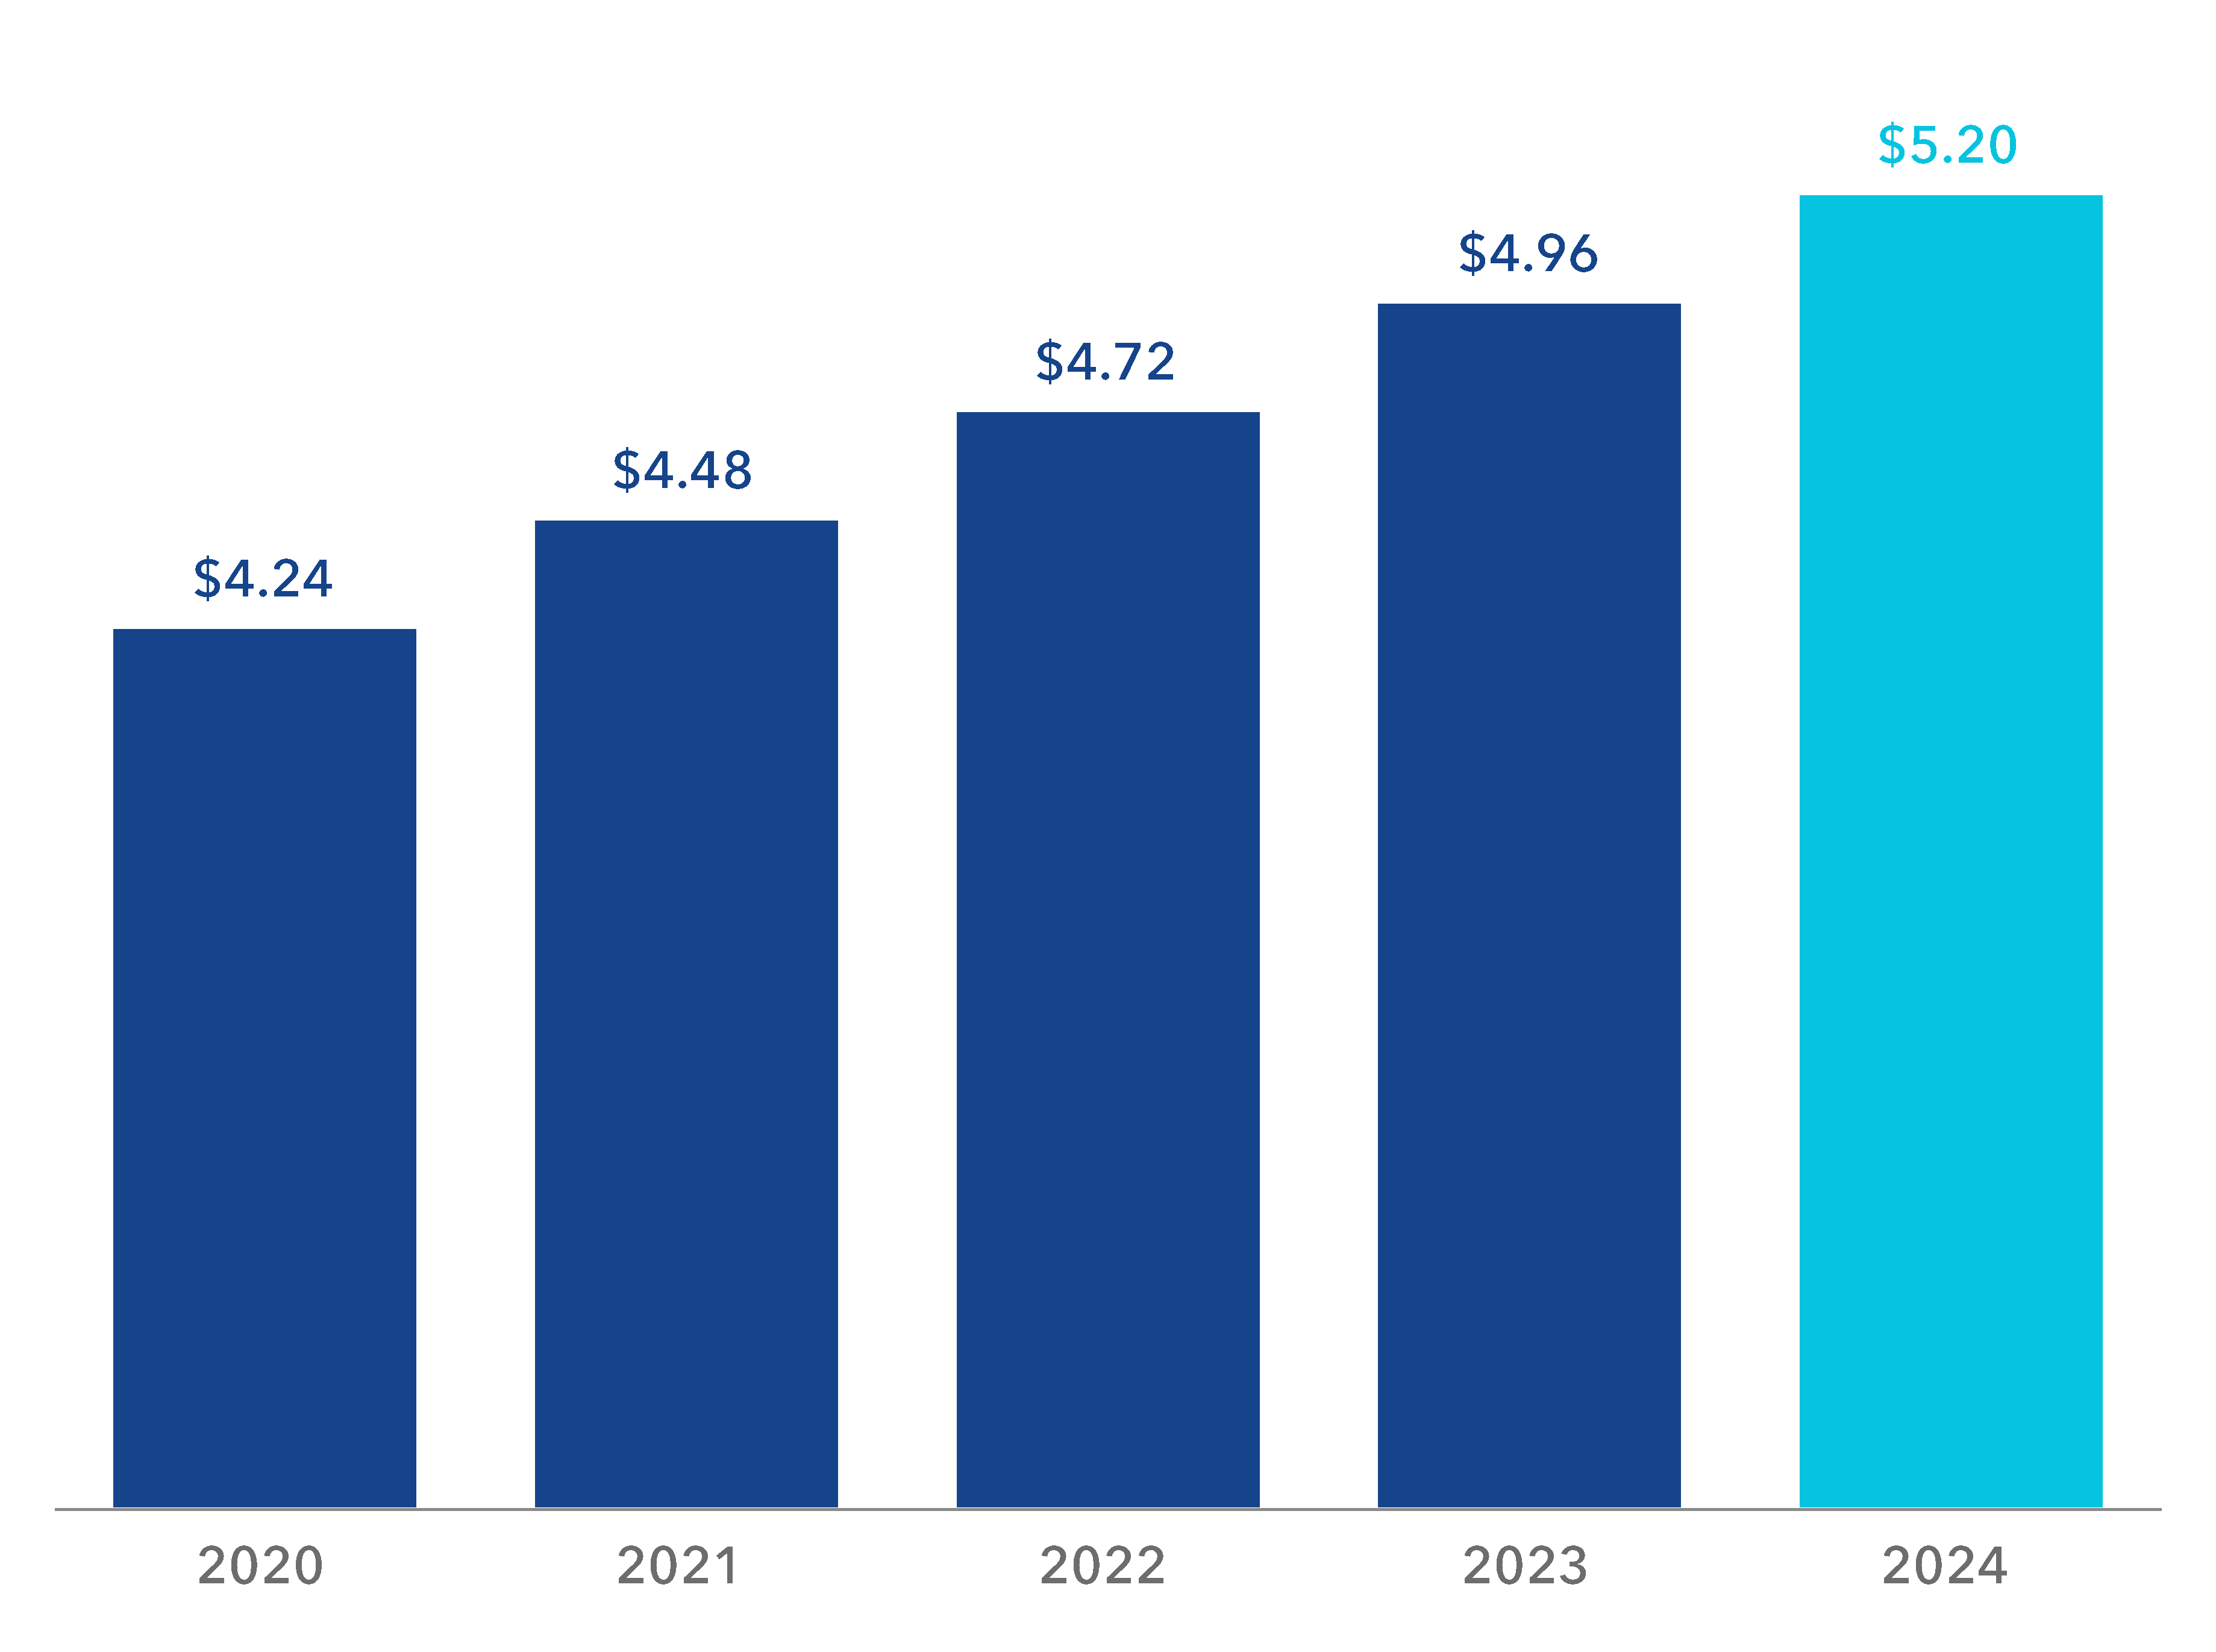
ANNUAL COMMON STOCK DIVIDEND PER SHARE
(4)
(1)Dividend yield is calculated as the dividend declared for the three months ended September 30, 2024 of $1.30 per common share annualized divided by the closing price of our common stock on September 30, 2024 of $118.75.
(2)Represents the years ended December 31, 2020 through 2023 and the three months ended September 30, 2024 annualized.
(3)Represents the years ended December 31, 2020 through 2023 and the midpoint of our 2024 guidance range. Refer to “Guidance” in the Earnings Press Release for additional details.
(4)Represents common stock dividend declared for the three months ended September 30, 2024 annualized.
Alexandria Real Estate Equities, Inc. All Rights Reserved. © 2024 | xvi |

ALEXANDRIA’S STRONG
EXECUTION OF OUR
ASSET RECYCLING
PROGRAM
STRATEGIC DISPOSITIONS
AND SALES OF PARTIAL
INTERESTS SINCE 2019
$8.7 BILLION
IN SALES
$3.0 BILLION
IN GAINS
(1)
(3)
(2)
(1)Includes amounts related to real estate dispositions and sales of partial interests completed from January 1, 2019 through October 21, 2024.
(2)Dispositions in 100% interest in properties completed since 2019, excluding sales of partial interests, had annual rental revenues of $202.0 million based on the quarter preceding the date on which each property is sold.
(3)Represents aggregate gains on real estate sales and associated real estate impairments and consideration in excess of book value of partial interests sold that were accounted as equity transactions.
Alexandria Real Estate Equities, Inc. All Rights Reserved. © 2024 | xvii |
ALEXANDRIA CONTINUES STRATEGIC VALUE-HARVESTING DURING 3Q24 WITH
DISPOSITION OF 1165 EASTLAKE AVENUE EAST IN LAKE UNION, SEATTLE
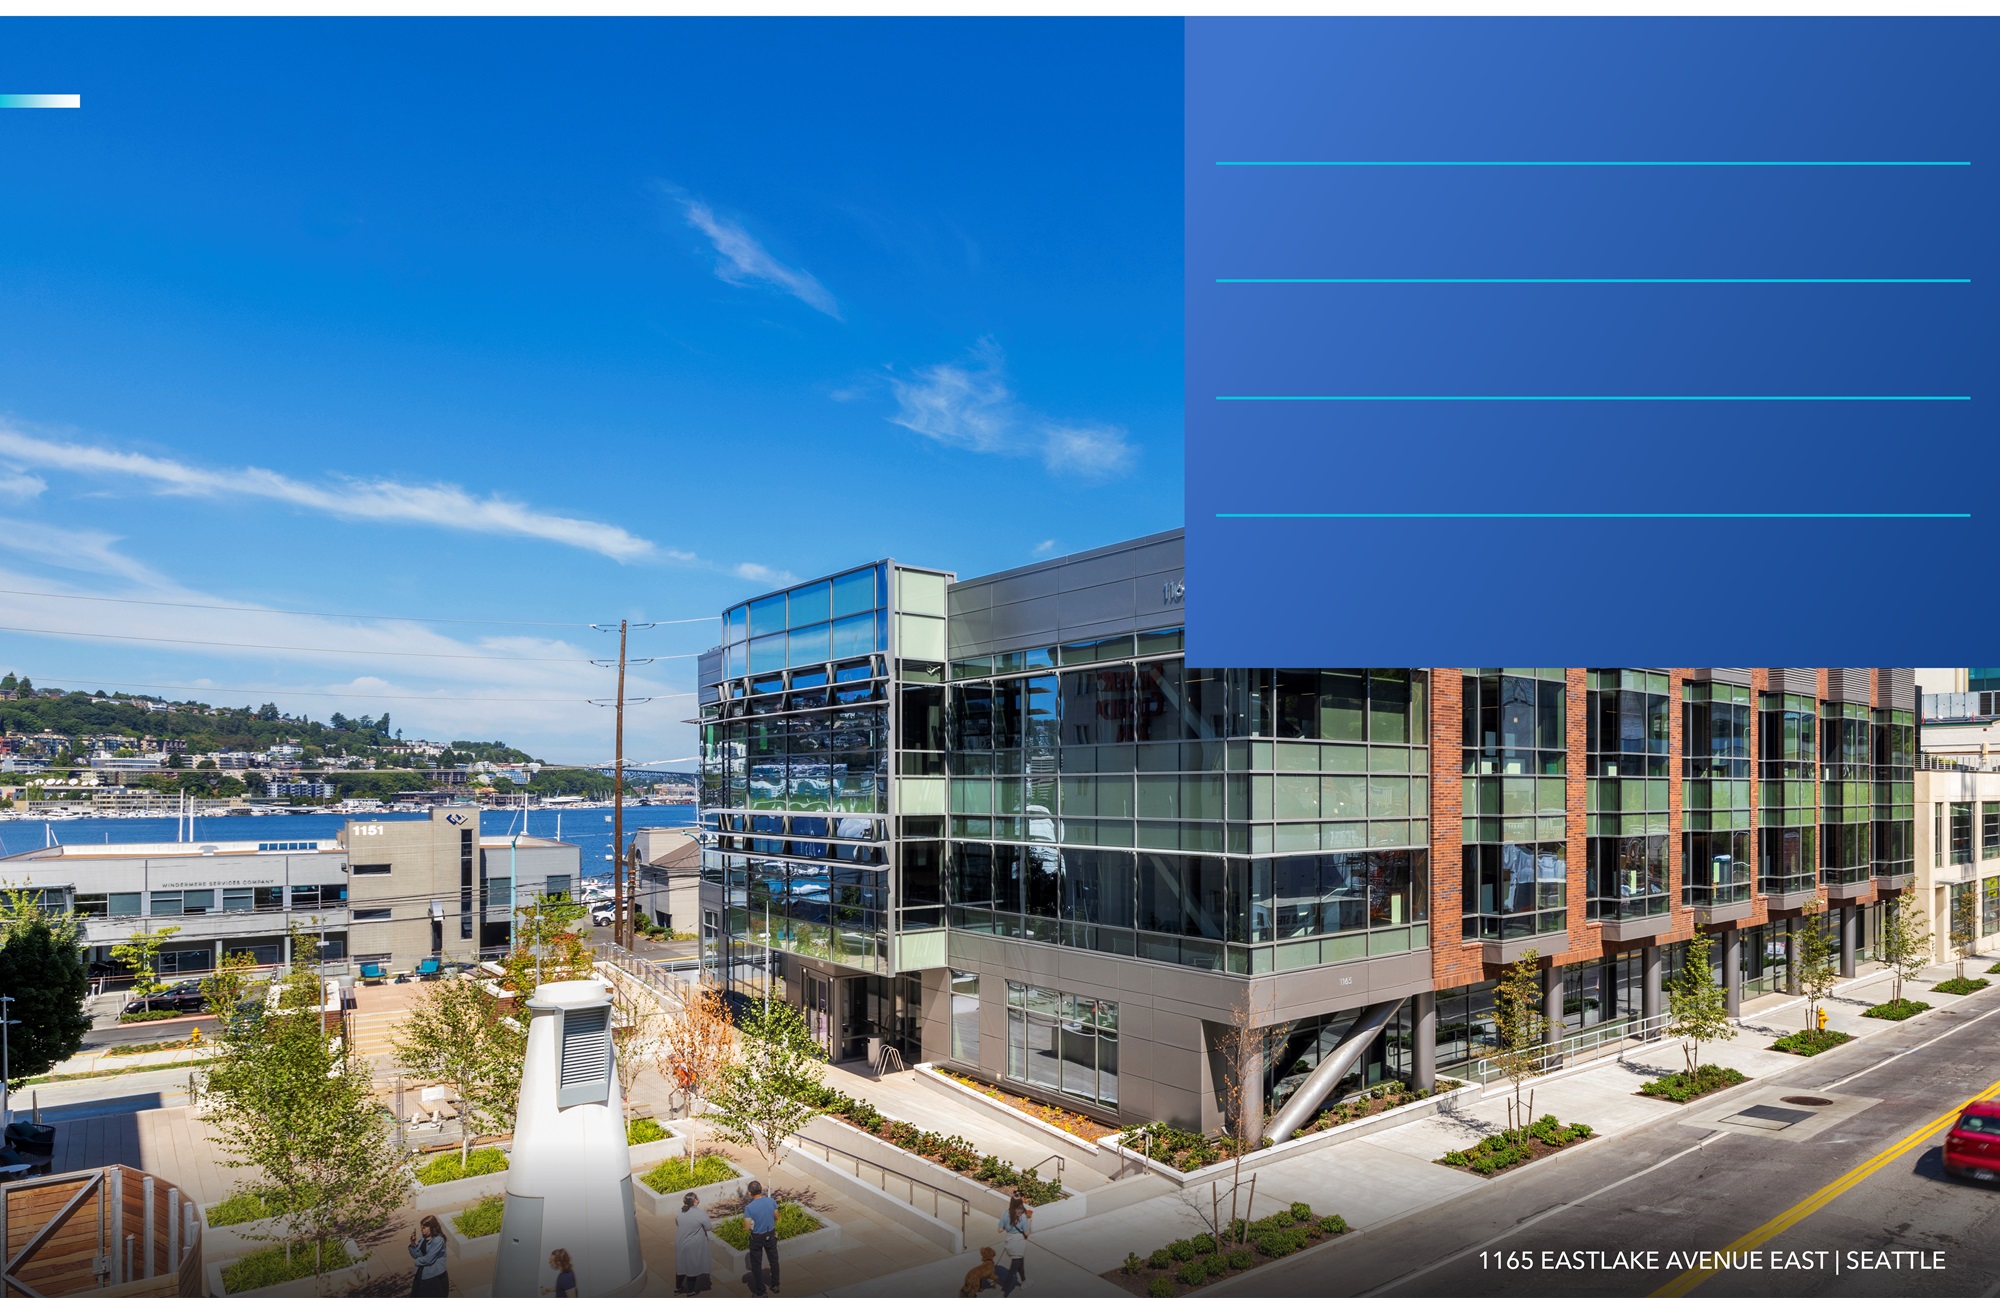
$150.0M | SALES PRICE | |
4.7% | CAPITALIZATION RATE | |
4.9% | CAPITALIZATION RATE (CASH BASIS) | |
$1,499 | SALES PRICE PER RSF | |
$21.5M | GAIN ON SALE OF REAL ESTATE |
Alexandria’s opportunistic sale to Fred Hutchinson
Cancer Center, a longstanding tenant, deepens
our relationship and enables Fred Hutch to
expand its South Lake Union footprint within the
Alexandria Center® for Life Science – Eastlake
mega campus ecosystem.
Alexandria Real Estate Equities, Inc. All Rights Reserved. © 2024 | xviii |
ALEXANDRIA’S STRATEGIC VALUE-HARVESTING DISPOSITION OF A NON-CORE,
STAND-ALONE ASSET: 14225 NEWBROOK DRIVE IN NORTHERN VIRGINIA
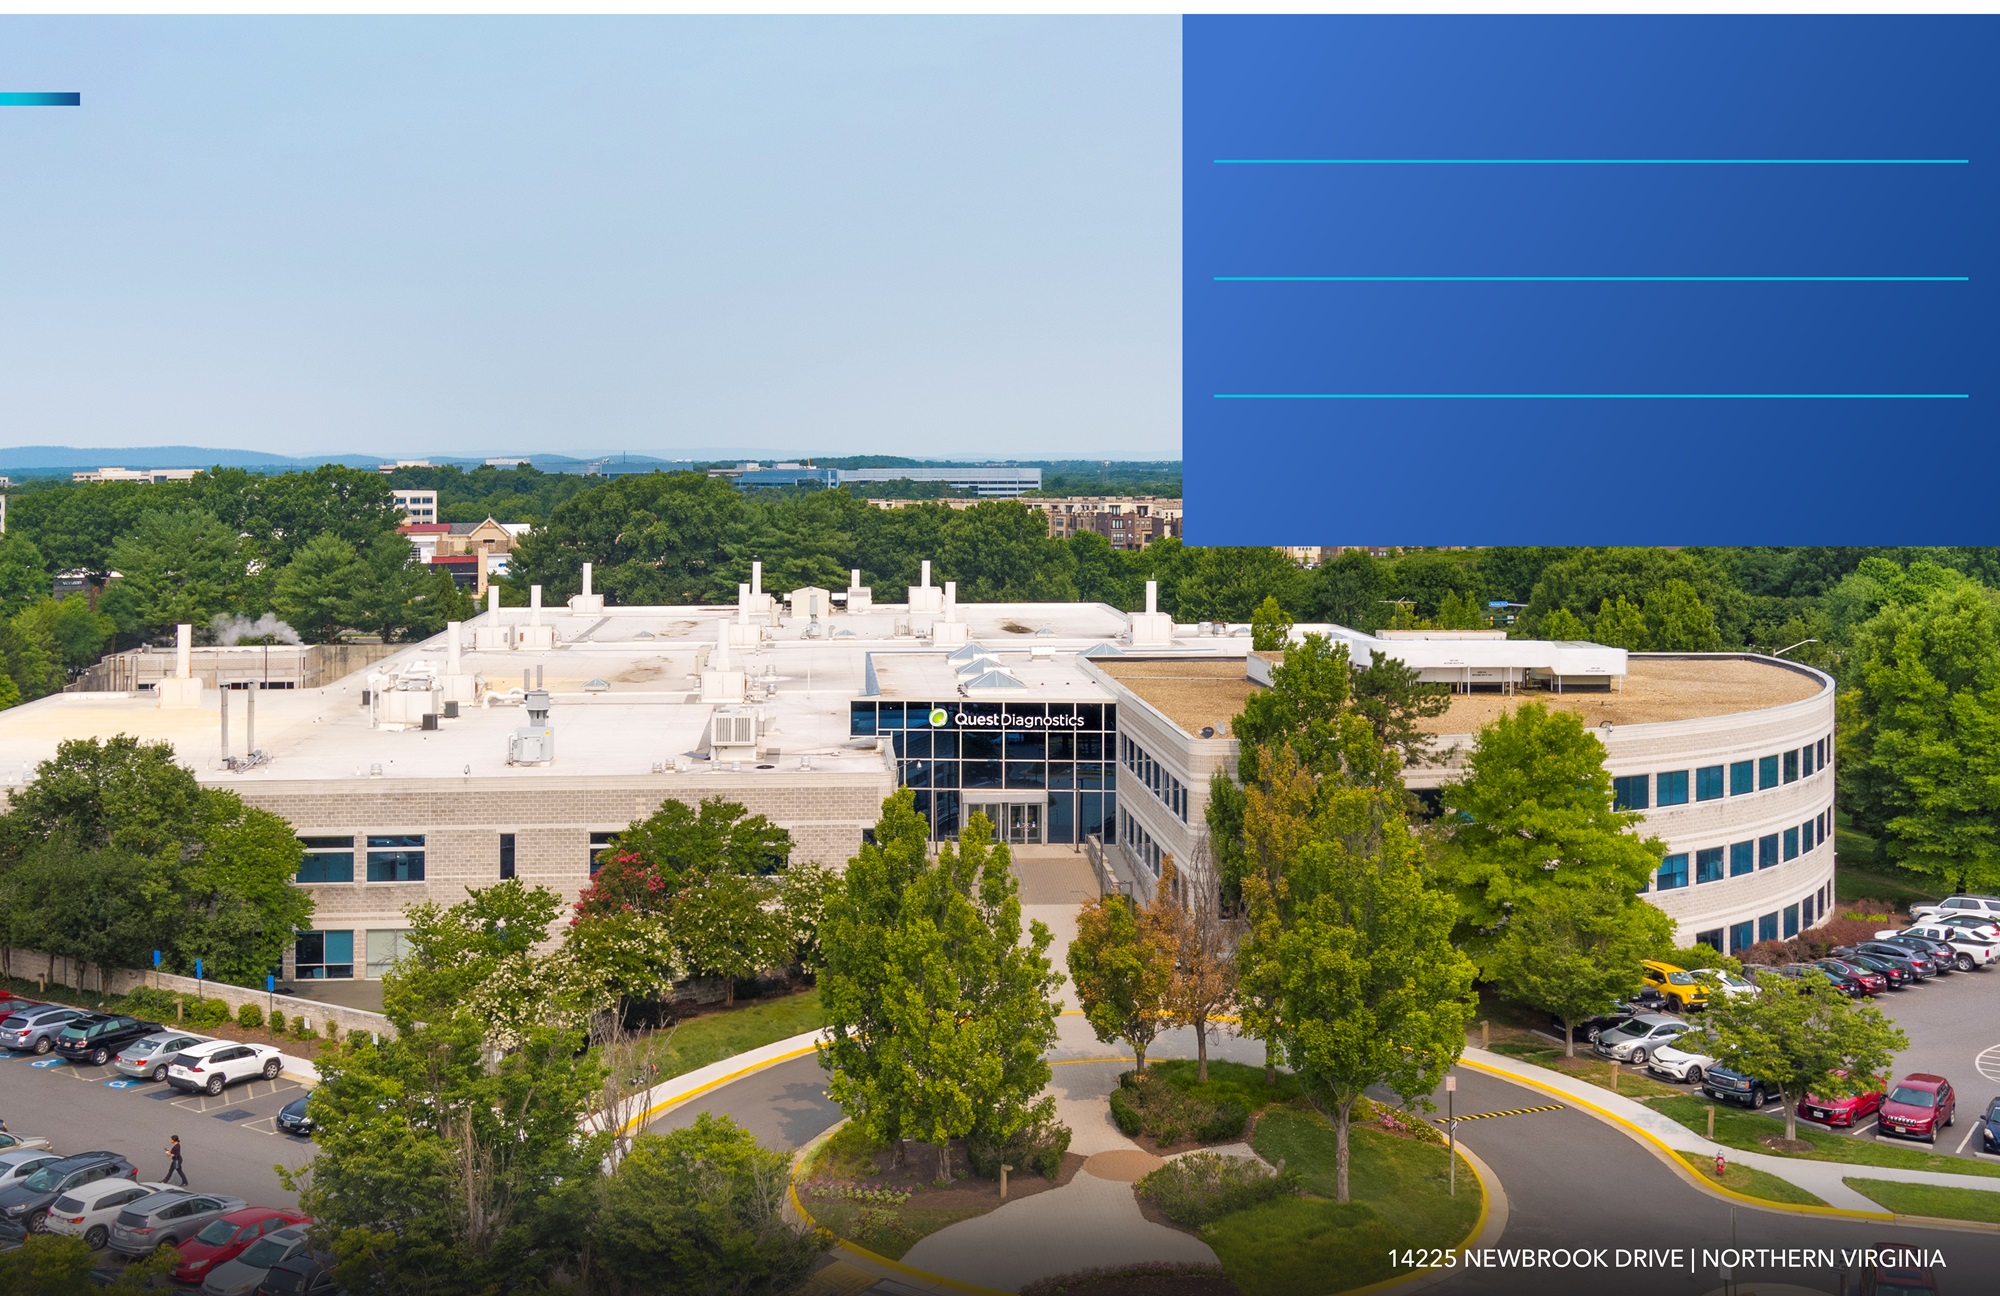
$80.5M | SALES PRICE | |
7.6% | CAPITALIZATION RATE | |
7.4% | CAPITALIZATION RATE (CASH BASIS) | |
$37.1M | GAIN ON SALE OF REAL ESTATE |
Demonstrating the long-term enduring value of
our laboratory facilities, Alexandria successfully
operated this property from its acquisition in
1997 (prior to our IPO) through its sale
in October 2024.
Alexandria Real Estate Equities, Inc. All Rights Reserved. © 2024 | xix |
ALEXANDRIA: AT THE
VANGUARD AND HEART
OF THE $5 TRILLION
SECULARLY GROWING
LIFE SCIENCE INDUSTRY
(1)Source: YCharts. Represents the aggregate market capitalization for the life science industry, including companies in the biotechnology and pharmaceutical sectors, as of July 12, 2024.
(1)
Alexandria Real Estate Equities, Inc. All Rights Reserved. © 2024 | xx |
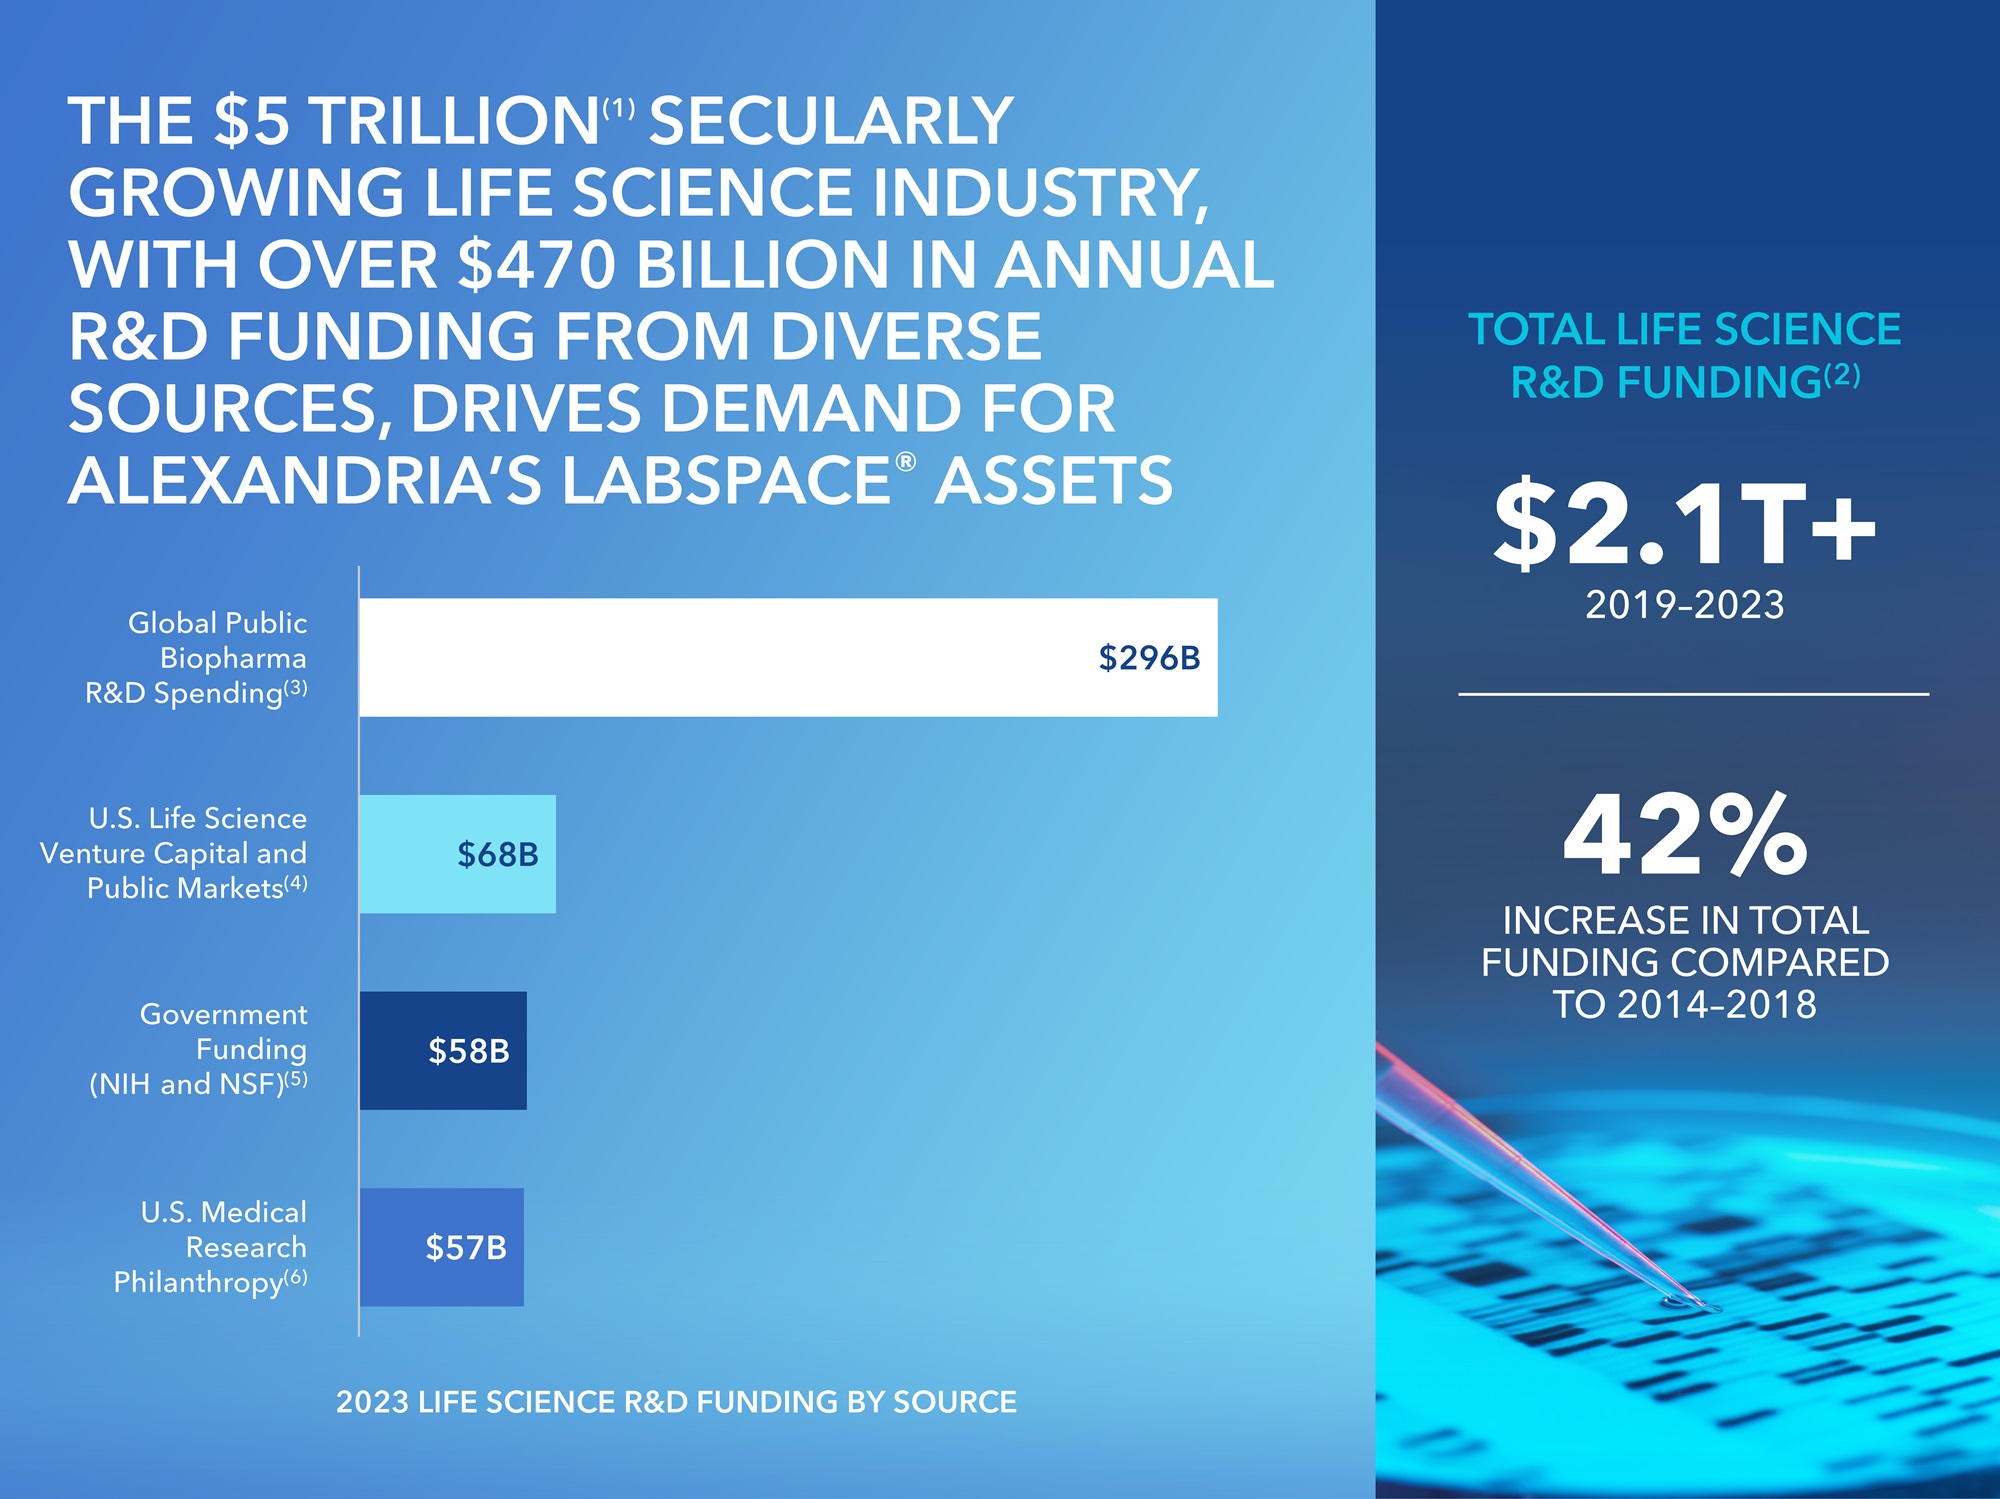
(1)Source: YCharts. Represents the aggregate market capitalization for the life science industry, including companies in the biotechnology and pharmaceutical sectors, as of July 12, 2024.
(2)Dollar amount represents aggregate funding from all sources presented, and percentage represents the aggregate increase in funding compared to the previous five-year period (2014–2018).
(3)Source: Evaluate Pharma, March 2024. Represents consensus forecast for global biopharma R&D spend in 2023.
(4)Sources: PitchBook, BioCentury, and NASDAQ. Includes venture capital investments in U.S.-based life science companies and IPOs, follow-ons, and public equity financings raised by U.S. listed biopharma companies in 2023.
(5)Sources: National Institutes of Health (“NIH”) and National Science Foundation (“NSF”). Includes FY2023 NIH funding and FY2023 NSF research and related activities.
(6)Source: The Giving Institute, “Giving USA 2024: The Annual Report on Philanthropy for the Year 2023.”
Alexandria Real Estate Equities, Inc. All Rights Reserved. © 2024 | xxi |
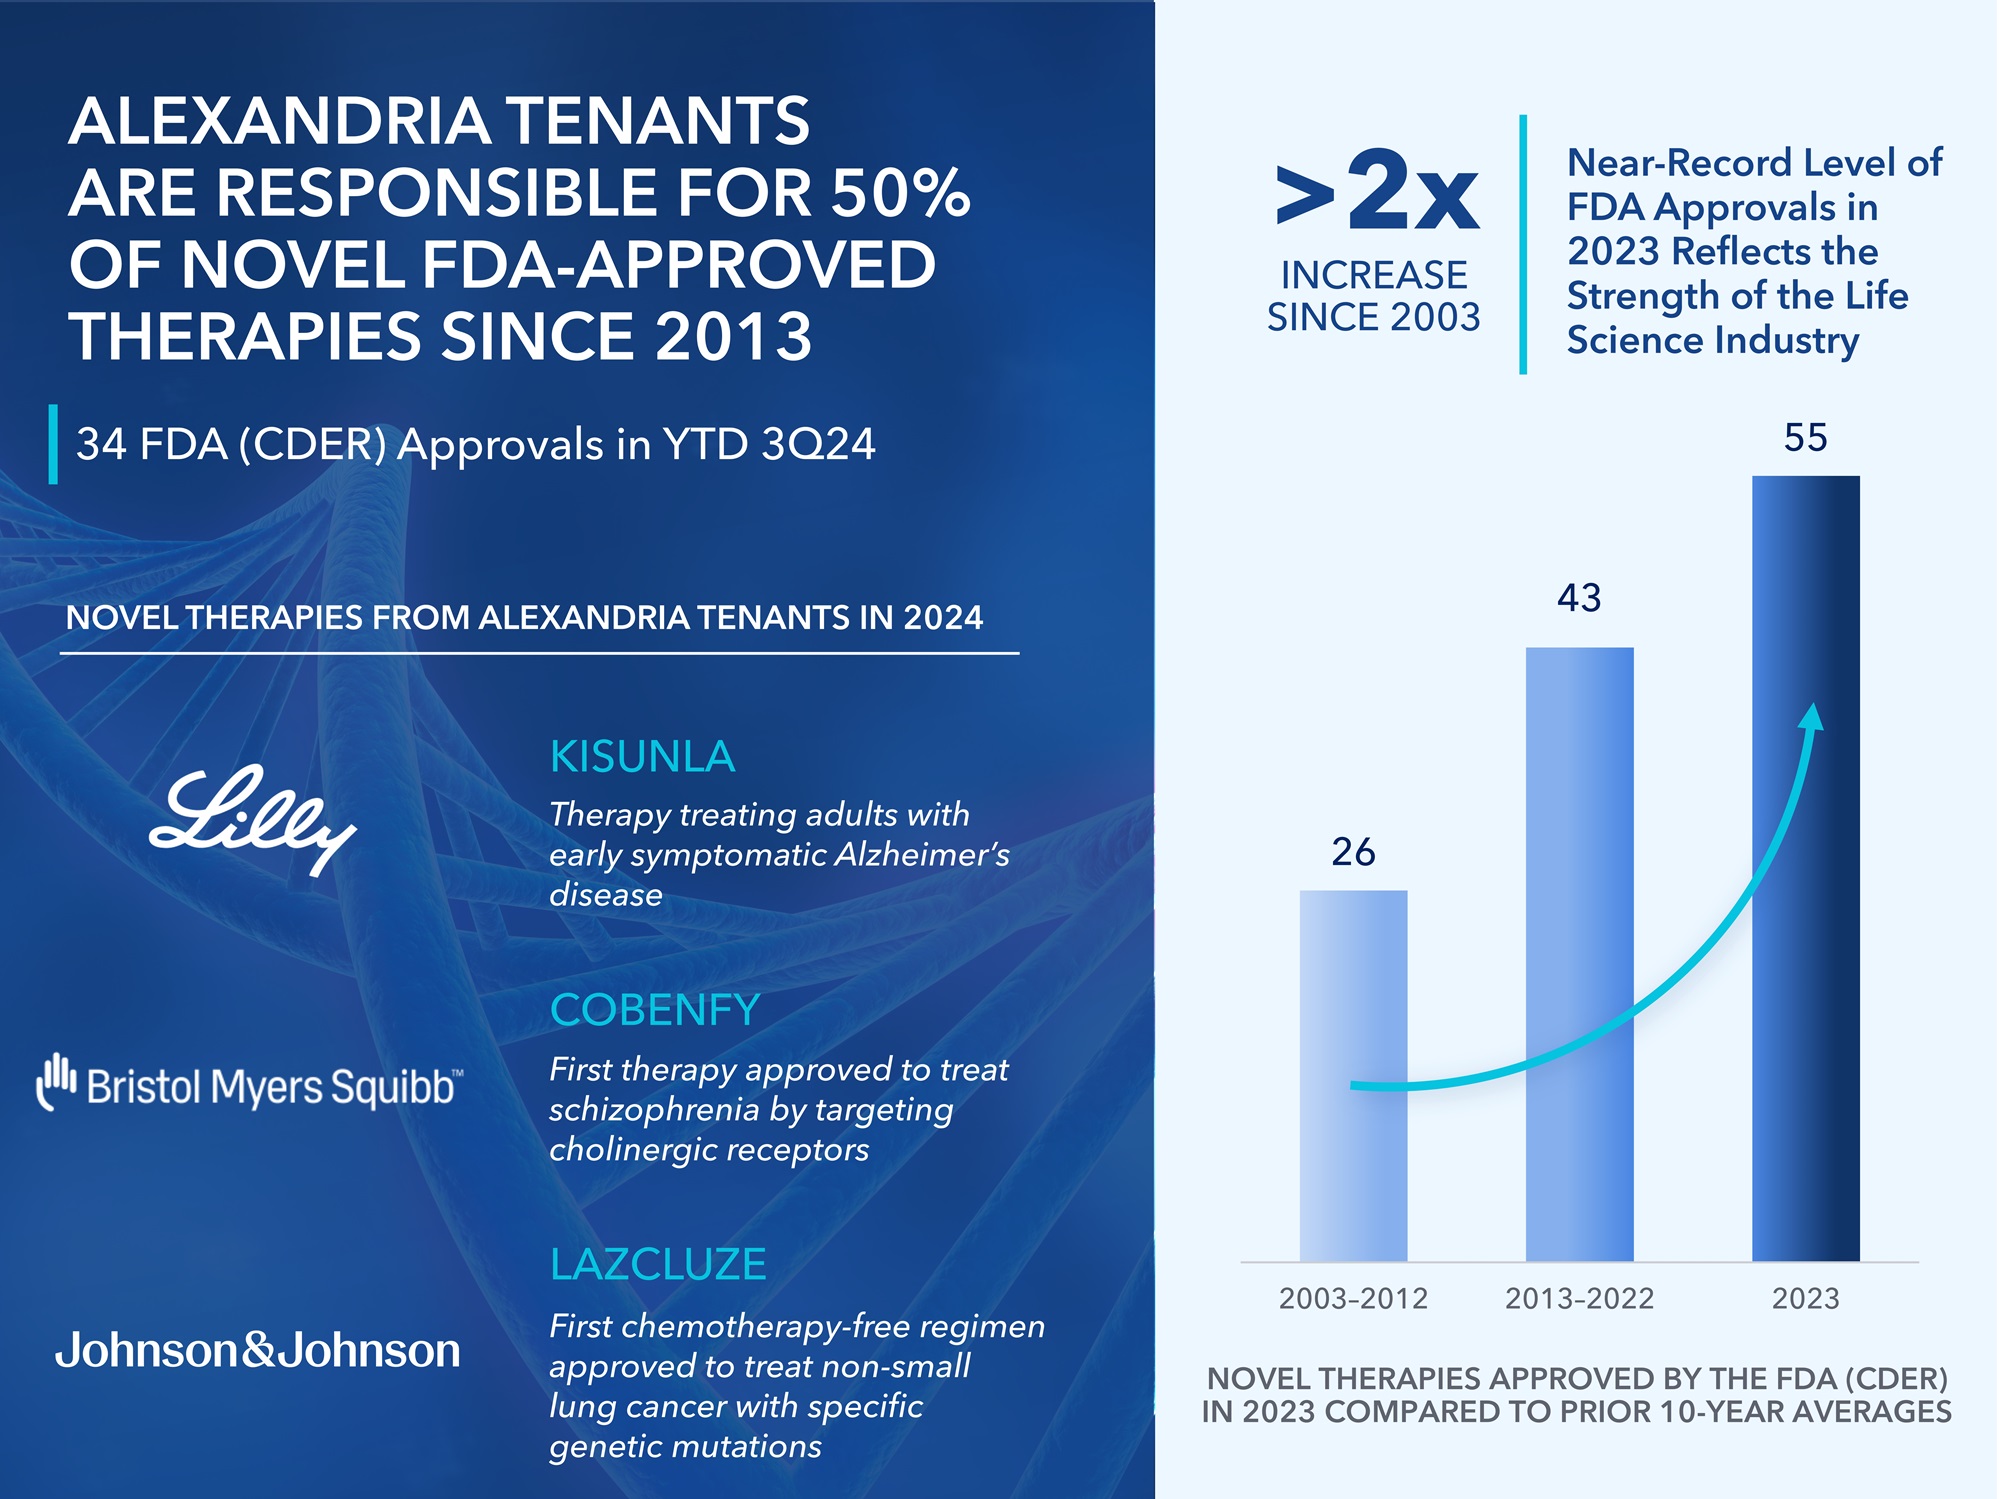
Source: U.S. Food and Drug Administration. Novel therapies approved by the FDA (Center for Drug Evaluation and Research (“CDER”)) include new molecular entities and new biologics defined as products containing active moieties that have
not previously been approved by the FDA.
Alexandria Real Estate Equities, Inc. All Rights Reserved. © 2024 | xxii |
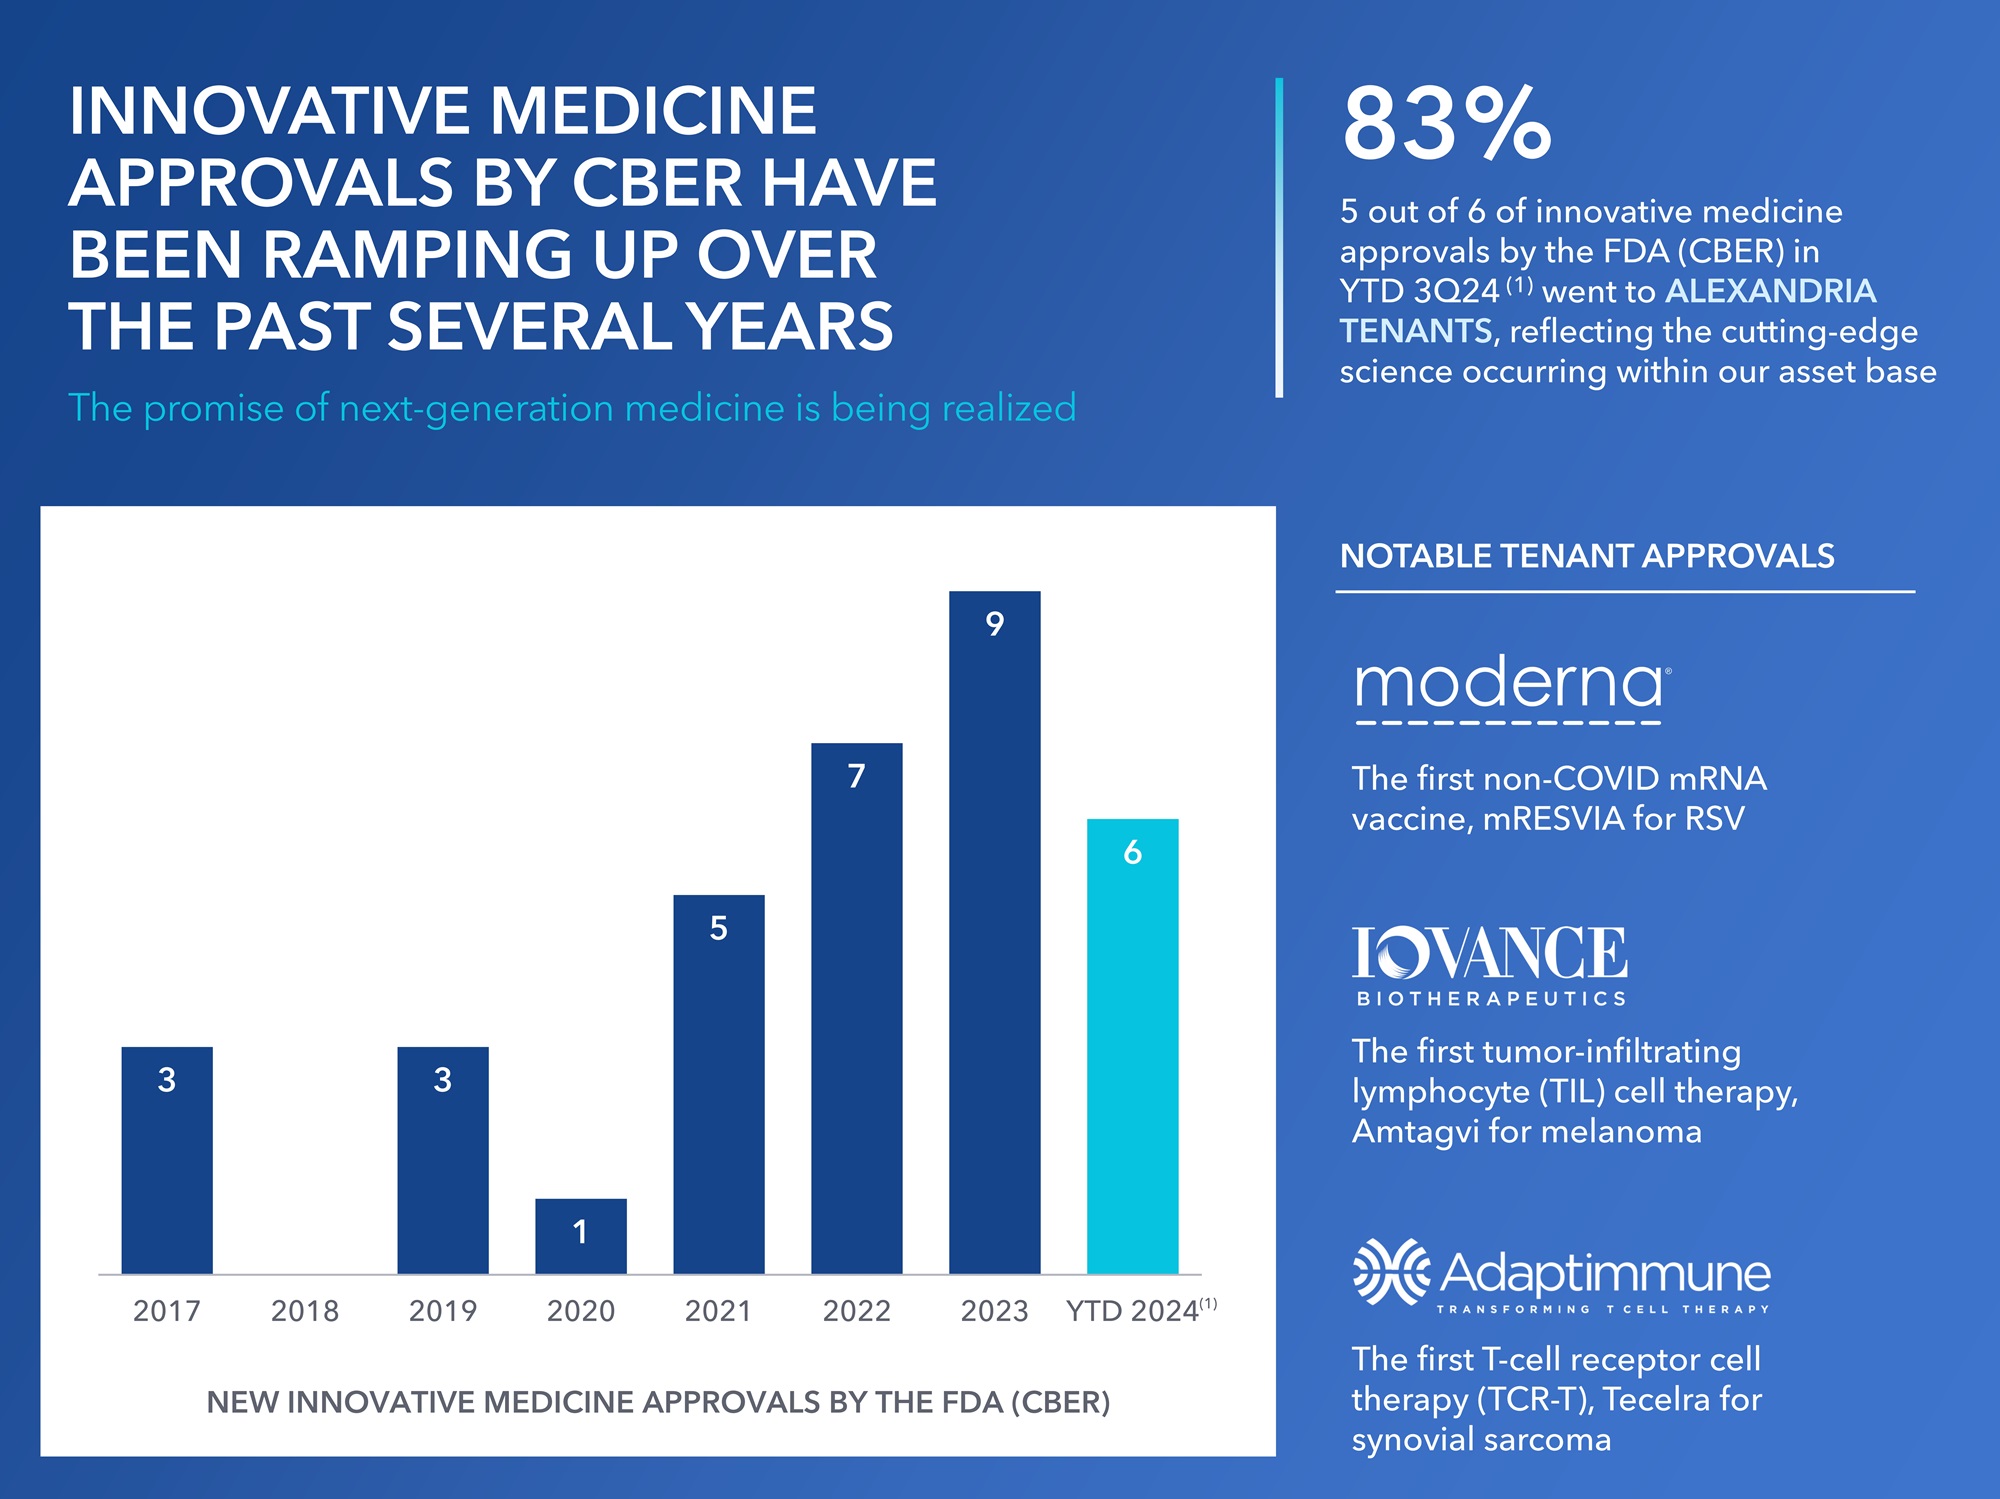
Source: U.S. Food and Drug Administration. Innovative medicine approvals by the FDA (Center for Biologics Evaluation and Research (“CBER”)) include novel vaccines and next-generation modalities such as cell therapies, gene therapies,
mRNA products, live biotherapeutics, and oncolytic viruses. These are distinct from the FDA CDER approvals on the prior slide.
(1)YTD 3Q24 represents the period from January 1, 2024 through September 19, 2024.
Alexandria Real Estate Equities, Inc. All Rights Reserved. © 2024 | xxiii |
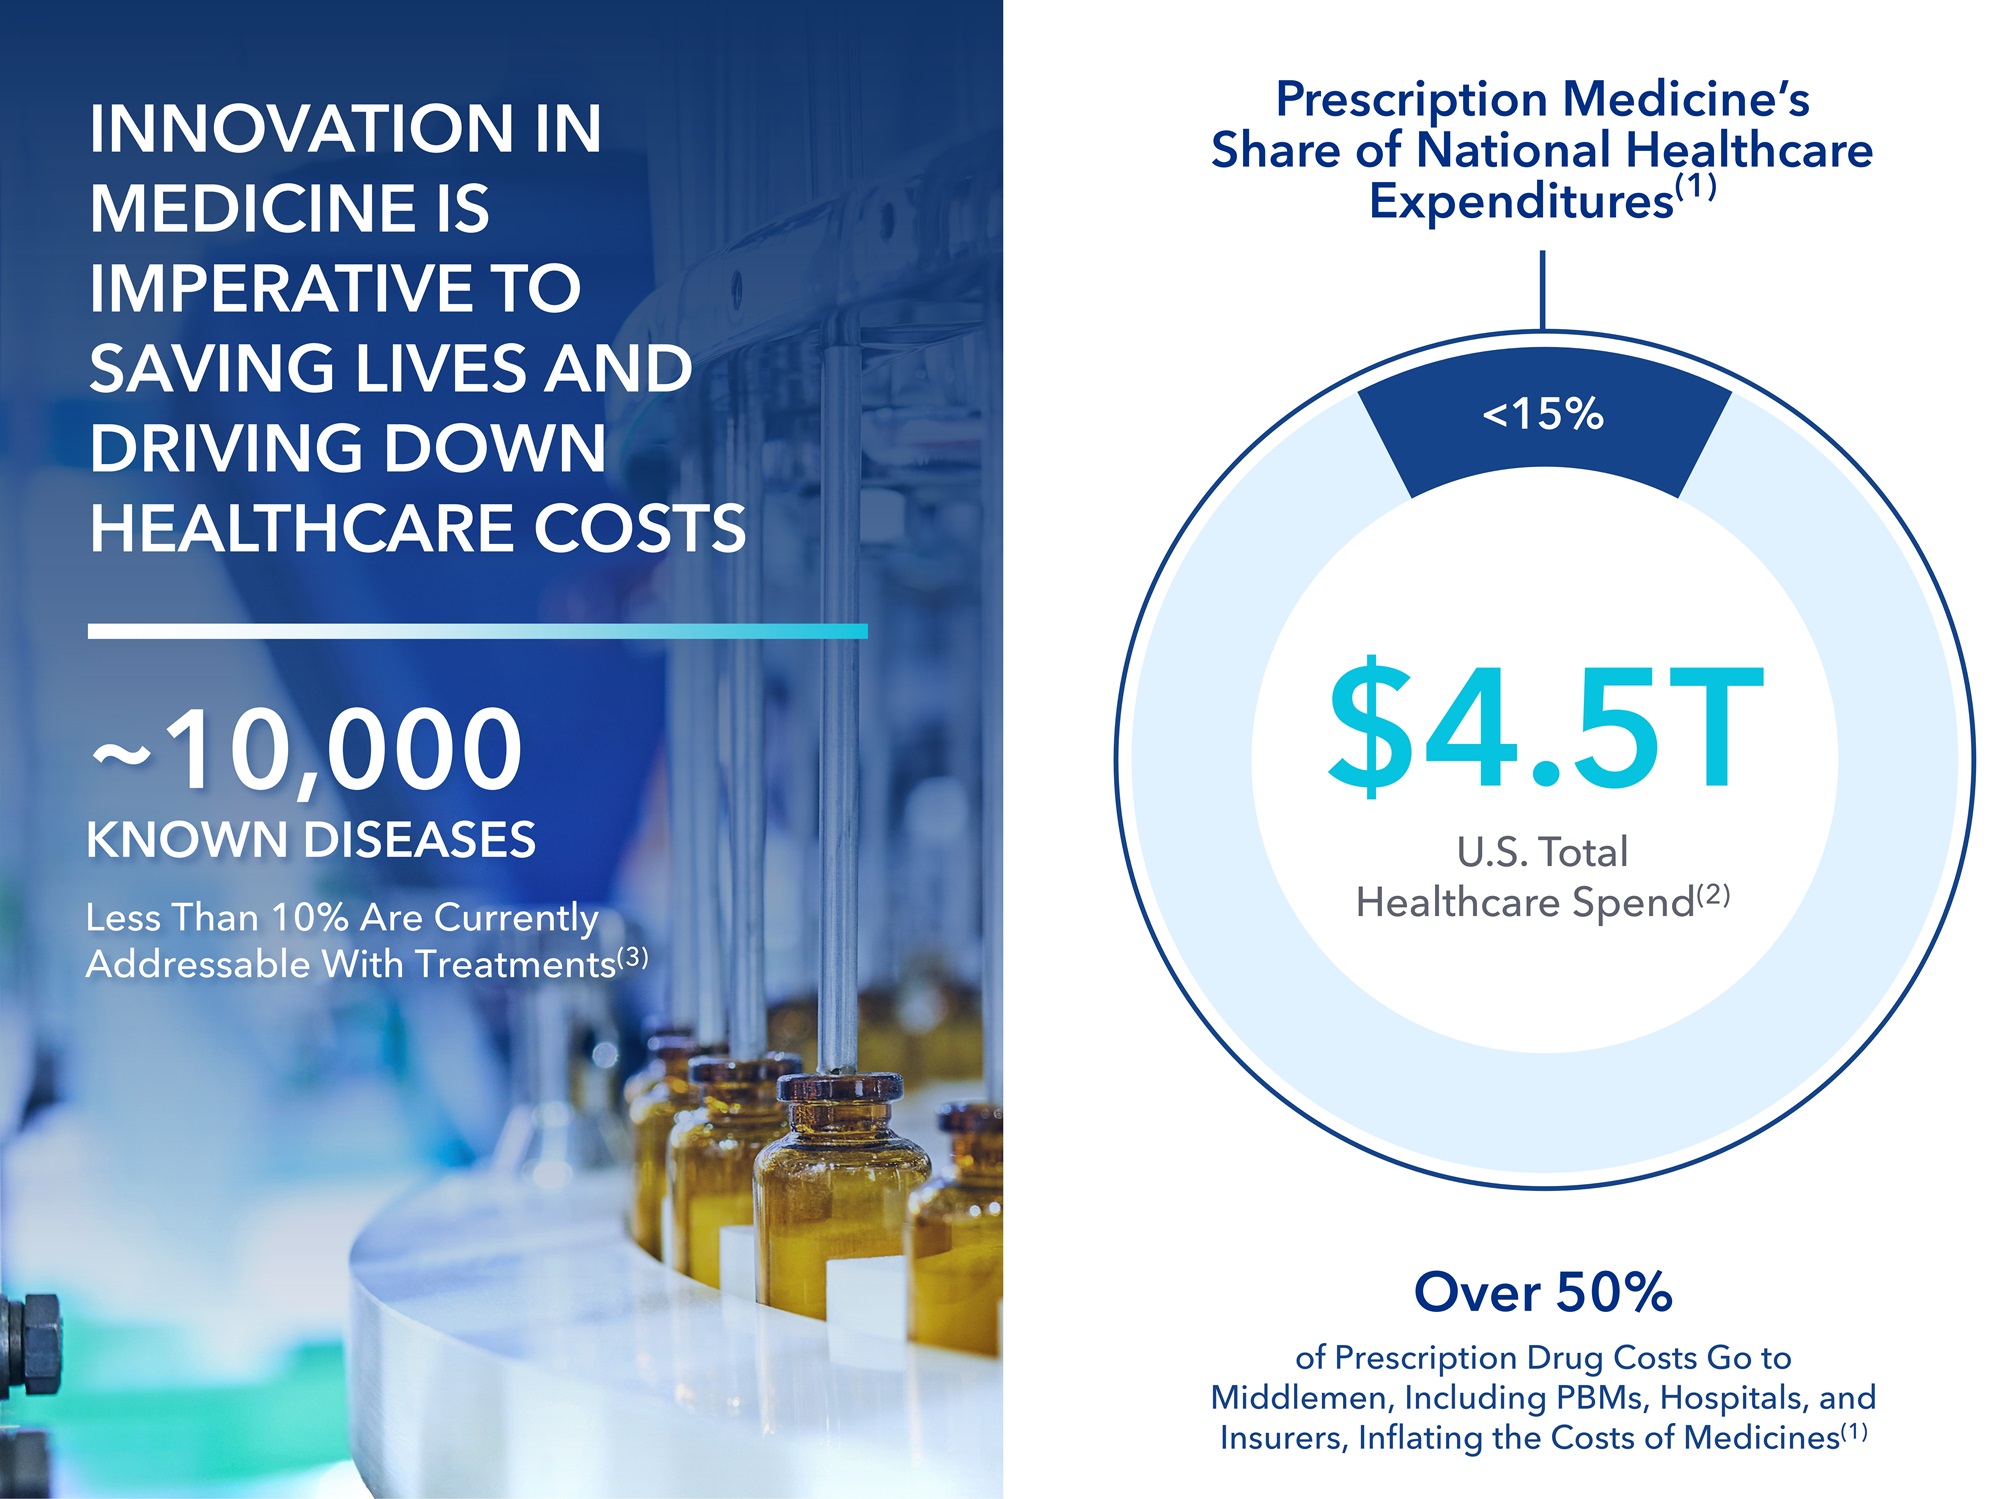
(1)Source: PhRMA, “Understanding Prescription Medicine Spending,” 2022.
(2)Source: Centers for Medicare & Medicaid Services, “National Health Expenditures 2022 Highlights,” 2022.
(3)Source: U.S. House Committee on Energy and Commerce, “The 21st Century Cures Discussion Document White Paper,” January 27, 2015.
Alexandria Real Estate Equities, Inc. All Rights Reserved. © 2024 | xxiv |
ALEXANDRIA’S INDUSTRY
AND CORPORATE
RESPONSIBILITY
LEADERSHIP
Alexandria Real Estate Equities, Inc. All Rights Reserved. © 2024 | xxv |
Alexandria Real Estate Equities, Inc. All Rights Reserved. © 2024 | xxvi |
Alexandria Real Estate Equities, Inc. All Rights Reserved. © 2024 | 1 |

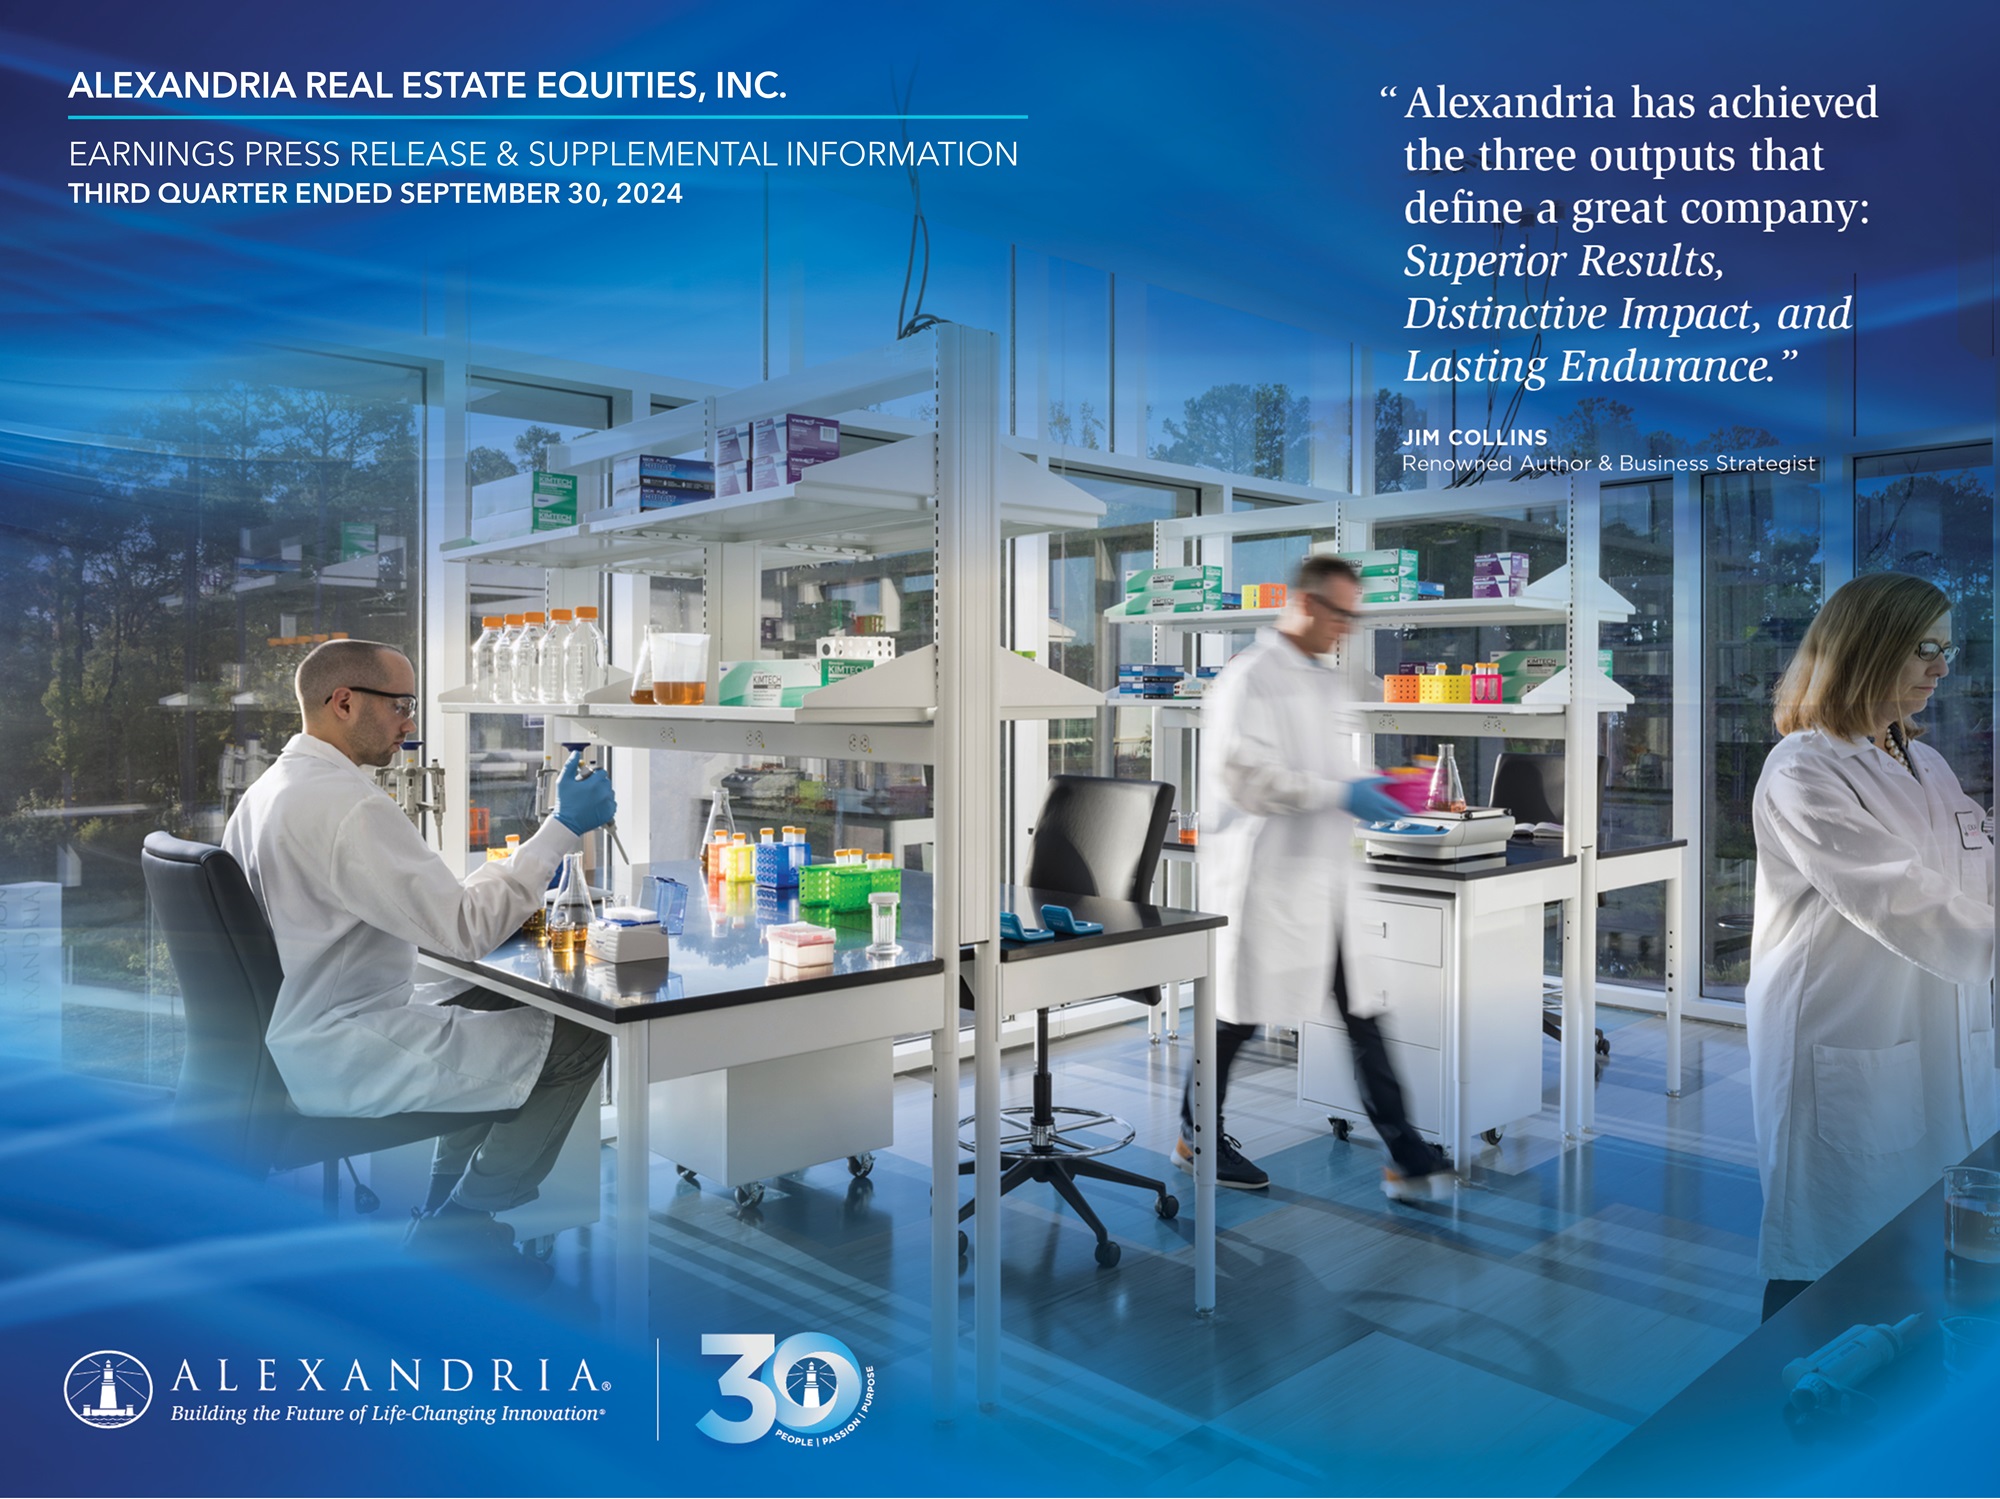
Alexandria Real Estate Equities, Inc. Reports:
3Q24 and YTD 3Q24 Net Income per Share – Diluted of $0.96 and $2.18, respectively; and
3Q24 and YTD 3Q24 FFO per Share – Diluted, as Adjusted, of $2.37 and $7.08, respectively
PASADENA, Calif. – October 21, 2024 – Alexandria Real Estate Equities, Inc. (NYSE: ARE)
announced financial and operating results for the third quarter ended September 30, 2024.
Key highlights | ||||||||
YTD | ||||||||
Operating results | 3Q24 | 3Q23 | 3Q24 | 3Q23 | ||||
Total revenues: | ||||||||
In millions | $791.6 | $713.8 | $2,327.4 | $2,128.5 | ||||
Growth | 10.9% | 9.3% | ||||||
Net income attributable to Alexandria’s common stockholders – diluted: | ||||||||
In millions | $164.7 | $21.9 | $374.5 | $184.4 | ||||
Per share | $0.96 | $0.13 | $2.18 | $1.08 | ||||
Funds from operations attributable to Alexandria’s common stockholders – diluted, as adjusted: | ||||||||
In millions | $407.9 | $386.4 | $1,217.3 | $1,142.5 | ||||
Per share | $2.37 | $2.26 | $7.08 | $6.69 | ||||
An industry-leading REIT with a high-quality, diverse tenant base and strong margins
(As of September 30, 2024, unless stated otherwise) | |||
Occupancy of operating properties in North America | 94.7% | ||
Percentage of annual rental revenue in effect from mega campuses | 76% | ||
Percentage of annual rental revenue in effect from investment-grade or publicly traded large cap tenants | 53% | ||
Operating margin | 71% | ||
Adjusted EBITDA margin | 70% | ||
Percentage of leases containing annual rent escalations | 96% | ||
Weighted-average remaining lease term: | |||
Top 20 tenants | 9.5 | years | |
All tenants | 7.5 | years | |
Sustained strength in tenant collections: | |||
Tenant receivables as a percentage of 3Q24 rental revenues | 0.9% | ||
October 2024 tenant rents and receivables collected as of October 21, 2024 | 99.6% | ||
3Q24 tenant rents and receivables collected as of October 21, 2024 | 99.9% |
Strong and flexible balance sheet with significant liquidity; top 10% credit rating ranking among all
publicly traded U.S. REITs
•Net debt and preferred stock to Adjusted EBITDA of 5.5x and fixed-charge coverage ratio of
4.4x for 3Q24 annualized (targets for 4Q24 annualized of ≤5.1x and ≥4.5x, respectively).
•Significant liquidity of $5.4 billion.
•31% of our total debt matures in 2049 and beyond.
•12.6 years weighted-average remaining term of debt.
•Since 2020, an average of 97.7% of our debt has been fixed rate.
•Total debt and preferred stock to gross assets of 29%.
•$1.0 billion of capital contribution commitments from existing consolidated real estate joint
venture partners to fund construction from 4Q24 through 2027.
Strong leasing volume and solid rental rate changes
•Strong leasing volume aggregating 1.5 million RSF during 3Q24, up 48% compared to our
previous four-quarter average of 1.0 million RSF.
•Rental rate changes on lease renewals and re-leasing of space were 5.1% and 1.5% (cash
basis) for 3Q24 and 16.4% and 8.9% (cash basis) for YTD 3Q24.
•80% of our leasing activity during the last twelve months was generated from our existing
tenant base.
3Q24 | YTD 3Q24 | |||||
Total leasing activity – RSF | 1,486,097 | 3,742,955 | ||||
Leasing of development and redevelopment space – RSF | 39,121 | 480,342 | ||||
Lease renewals and re-leasing of space: | ||||||
RSF (included in total leasing activity above) | 1,278,857 | 2,863,277 | ||||
Rental rate changes | 5.1% | (1) | 16.4% | |||
Rental rate changes (cash basis) | 1.5% | (1) | 8.9% |
(1)Includes a five-year lease extension to an investment-grade rated technology tenant aggregating 357,136
RSF of recently acquired tech R&D space in our Texas market that was renewed with rental rate changes of
(33.6)% and (4.8)% (cash basis). These spaces were originally targeted for a future change in use at
acquisition, but we instead renewed them with a lower capital investment while we continue to evaluate
options to convert these spaces in the future, subject to market conditions. Excluding this lease, rental rate
changes for renewed/re-leased space for 3Q24 were 13.0% and 2.3% (cash basis).
Attractive dividend strategy to share net cash flows from operating activities with stockholders
while retaining a significant portion for reinvestment
•Common stock dividend declared for 3Q24 of $1.30 per common share aggregating $5.14
per common share for the twelve months ended September 30, 2024, up 24 cents, or 5%,
over the twelve months ended September 30, 2023.
•Dividend yield of 4.4% as of September 30, 2024.
•Dividend payout ratio of 55% for the three months ended September 30, 2024.
•Average annual dividend per-share growth of 5.4% from 2020 through 3Q24 annualized.
•Significant net cash flows from operating activities after dividends retained for reinvestment
aggregating $2.1 billion for the years ended December 31, 2020 through 2023 and including
the midpoint of our 2024 guidance range for net cash provided by operating activities after
dividends.
Ongoing successful execution of Alexandria’s 2024 capital strategy
We expect to continue pursuing our strategy to fund a significant portion of our capital
requirements for the year ending December 31, 2024 with dispositions primarily focused on
sales of properties and land parcels not integral to our mega campus strategy. Refer to
“Dispositions” in the Earnings Press Release for additional details.
(in millions) | ||
Completed dispositions of 100% interest in properties | $319 | |
Pending dispositions subject to non-refundable deposits | 577 | |
Pending dispositions subject to executed letters of intent and/or purchase and sale agreements | 603 | |
Forward equity sales agreements | 28 | |
Total | $1,527 | |
2024 guidance midpoint for dispositions and common equity | $1,550 |
Alexandria Real Estate Equities, Inc. All Rights Reserved. © 2024 | 2 |
| |
Third Quarter Ended September 30, 2024 Financial and Operating Results (continued) | |
September 30, 2024 | |
Ongoing successful execution of Alexandria’s 2024 capital strategy (continued)
•In September 2024, we completed the following transactions with our longstanding tenant,
Fred Hutchinson Cancer Center (“Fred Hutch”), in the Lake Union submarket:
•Sale of 1165 Eastlake Avenue East, a fully leased 100,086 RSF single-tenant Class A+ life
science facility that was developed in 2021. We sold the property for $150.0 million, or
$1,499 per RSF, at strong capitalization rates of 4.7% and 4.9% (cash basis). Upon
completion of the sale, we recognized a gain on sale of real estate aggregating
$21.5 million.
•Fred Hutch executed early renewals aggregating 117,479 RSF at our 1201 and 1208
Eastlake Avenue East properties, including a 15-year lease extension at 1201 Eastlake
Avenue East.
•Our prior joint venture partner sold their partial interest ownership in each of 1201 and
1208 Eastlake Avenue East to Fred Hutch. Our ownership interest in both properties
remains unchanged at 30.0%. This sale, lease extensions, and new joint venture affirm
Fred Hutch’s commitment to South Lake Union.
Alexandria’s development and redevelopment pipeline delivered incremental annual net operating
income of $21 million commencing during 3Q24 and is expected to deliver incremental annual net
operating income aggregating $510 million primarily by 1Q28
•During 3Q24, we placed into service development and redevelopment projects aggregating
316,691 RSF that are 100% leased across multiple submarkets and delivered incremental
annual net operating income of $21 million. 3Q24 deliveries included 250,000 RSF at 9820
Darnestown Road on the Alexandria Center® for Life Science – Shady Grove mega campus
in our Rockville submarket.
•Annual net operating income (cash basis) is expected to increase by $57 million upon the
burn-off of initial free rent, with a weighted-average burn-off period of approximately
six months, from recently delivered projects.
•69% of the RSF in our total development and redevelopment pipeline is within our mega
campuses.
Development and Redevelopment Projects | Incremental Annual Net Operating Income | RSF | Leased/ Negotiating Percentage | |||||
(dollars in millions) | ||||||||
Placed into service: | ||||||||
1H24 | $42 | 628,427 | 100% | |||||
3Q24 | 21 | 316,691 | 100 | |||||
Placed into service in YTD 3Q24 | $63 | 945,118 | 100% | |||||
Expected to be placed into service(1): | ||||||||
4Q24 through 4Q25 | $158 | (2) | 5,467,897 | 55% | ||||
1Q26 through 1Q28 | 352 | (3) | ||||||
$510 | ||||||||
(1)Represents expected incremental annual net operating income to be placed into service from deliveries of
projects undergoing construction and one committed near-term project expected to commence construction in
the next two years.
(2)Includes (i) 1.0 million RSF that is expected to stabilize through 2025 and is 92% leased/negotiating and
(ii) expected partial deliveries through 4Q25 from projects expected to stabilize in 2026 and beyond. Refer to
the initial and stabilized occupancy years under “New Class A/A+ development and redevelopment properties:
current projects” in the Supplemental Information for additional details.
(3)70% of the leased RSF of our development and redevelopment projects was generated from our existing
tenant base.
Continued solid net operating income and internal growth
•Net operating income (cash basis) of $2.0 billion for 3Q24 annualized, up $274.2 million, or
15.5%, compared to 3Q23 annualized.
•Same property net operating income growth of 1.5% and 6.5% (cash basis) for 3Q24 over
3Q23 and 1.6% and 4.6% (cash basis) for YTD 3Q24 over YTD 3Q23.
•96% of our leases contain contractual annual rent escalations approximating 3%.
Strong balance sheet management
Key metrics as of or for the three months ended September 30, 2024
•$33.1 billion in total market capitalization.
•$20.5 billion in total equity capitalization, which ranks in the top 10% among all publicly traded
U.S. REITs.
3Q24 | Target | |||||||
Quarter | Trailing | 4Q24 | ||||||
Annualized | 12 Months | Annualized | ||||||
Net debt and preferred stock to Adjusted EBITDA | 5.5x | 5.6x | Less than or equal to 5.1x | |||||
Fixed-charge coverage ratio | 4.4x | 4.5x | Greater than or equal to 4.5x | |||||
Key capital events
•In September 2024, we amended and restated our unsecured senior line of credit to, among
other changes, extend the maturity date from January 22, 2028 to January 22, 2030,
including extension options that we control.
•During 3Q24, we had no activity under our ATM program. As of October 21, 2024, the
remaining aggregate amount available for future sales of common stock was $1.47 billion.
Investments
•As of September 30, 2024:
•Our non-real estate investments aggregated $1.5 billion.
•Unrealized gains presented in our consolidated balance sheet were $166.2 million,
comprising gross unrealized gains and losses aggregating $284.4 million and
$118.2 million, respectively.
•Investment income of $15.2 million for 3Q24 presented in our consolidated statement of
operations consisted of $23.0 million of realized gains and $2.6 million of unrealized gains,
partially offset by $10.3 million of impairment charges.
Alexandria Real Estate Equities, Inc. All Rights Reserved. © 2024 | 3 |
| |
Third Quarter Ended September 30, 2024 Financial and Operating Results (continued) | |
September 30, 2024 | |
Other key highlights
Key items included in net income attributable to Alexandria’s common stockholders: | |||||||||||||||
YTD | |||||||||||||||
3Q24 | 3Q23 | 3Q24 | 3Q23 | 3Q24 | 3Q23 | 3Q24 | 3Q23 | ||||||||
(in millions, except per share amounts) | Amount | Per Share – Diluted | Amount | Per Share – Diluted | |||||||||||
Unrealized gains (losses) on non-real estate investments | $2.6 | $(77.2) | $0.02 | $(0.45) | $(32.5) | $(221.0) | $(0.19) | $(1.29) | |||||||
Gain on sales of real estate | 27.1 | — | 0.16 | — | 27.5 | 214.8 | 0.16 | 1.26 | |||||||
Impairment of non-real estate investments | (10.3) | (28.5) | (0.06) | (0.17) | (37.8) | (51.5) | (0.22) | (0.30) | |||||||
Impairment of real estate | (5.7) | (20.6) | (0.03) | (0.12) | (36.5) | (189.2) | (0.22) | (1.11) | |||||||
Acceleration of stock compensation expense due to executive officer resignations | — | (1.9) | — | (0.01) | — | (1.9) | — | (0.01) | |||||||
Total | $13.7 | $(128.2) | $0.09 | $(0.75) | $(79.3) | $(248.8) | $(0.47) | $(1.45) | |||||||
Refer to “Funds from operations and funds from operations per share” in the Earnings Press Release for additional details. | |||||||||||||||
Subsequent events
•In October 2024, we agreed to sell four properties located in our Greater Boston market for a
sales price of $369.4 million to the current tenant of the properties with whom we have a long-
established relationship. The sales price represents capitalization rates of 8.5% and 6.3%
(cash basis) based upon net operating income and net operating income (cash basis),
respectively, for 3Q24 annualized. These properties, acquired primarily during 2020–2021,
are currently 100% leased with a weighted-average remaining lease term of 18 years. In
October 2024, we recognized an impairment charge aggregating $40.9 million to reduce the
carrying amounts of these properties by approximately 10% to the expected sales price less
costs to sell. Our decision to dispose of these properties is based on their non-strategic
location and the significant capital that the expected sales proceeds provide for immediate
reinvestment into our development and redevelopment pipeline.
•In October 2024, we agreed to sell five operating properties aggregating 203,223 RSF and
land parcels aggregating 1.5 million SF in our Sorrento Mesa and University Town Center
submarkets to buyers that are expected to develop residential properties on these sites for an
aggregate sales price of approximately $314.0 million. In October 2024, we recognized
impairment charges aggregating $65.9 million to reduce the carrying amounts of these
properties to the expected aggregate sales price less costs to sell. Our decision to dispose of
these assets, which are not integral to our mega campus strategy, is primarily based on the
substantial capital that the sales proceeds will provide for immediate reinvestment into our
development and redevelopment pipeline.
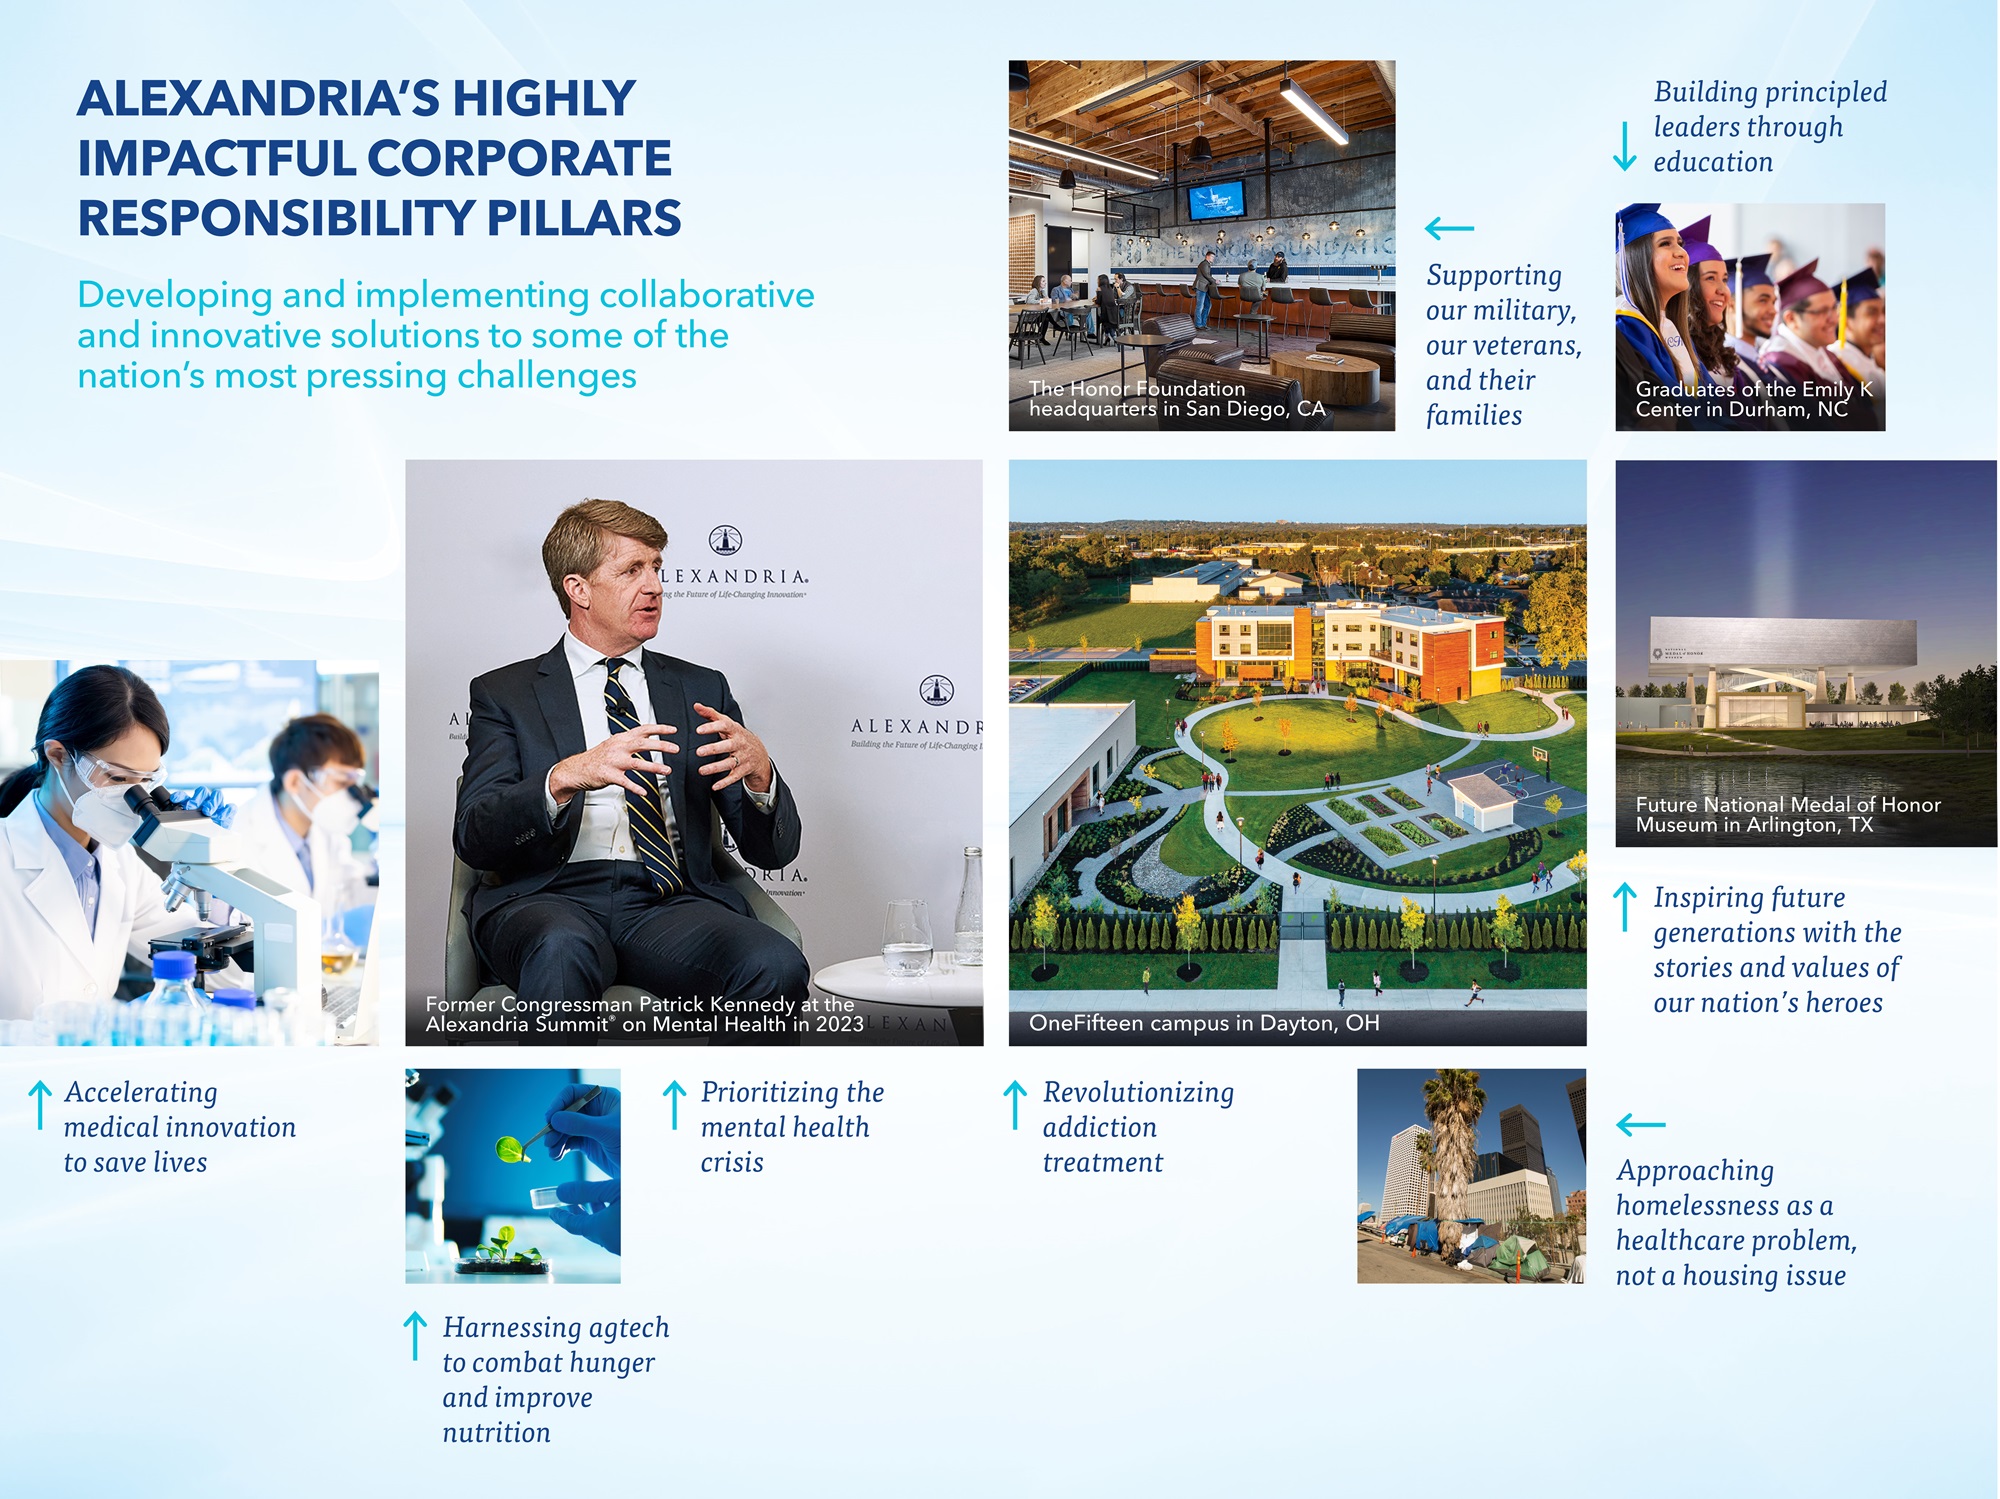
Industry and corporate responsibility leadership: catalyzing and leading the way for
positive change to benefit human health and society
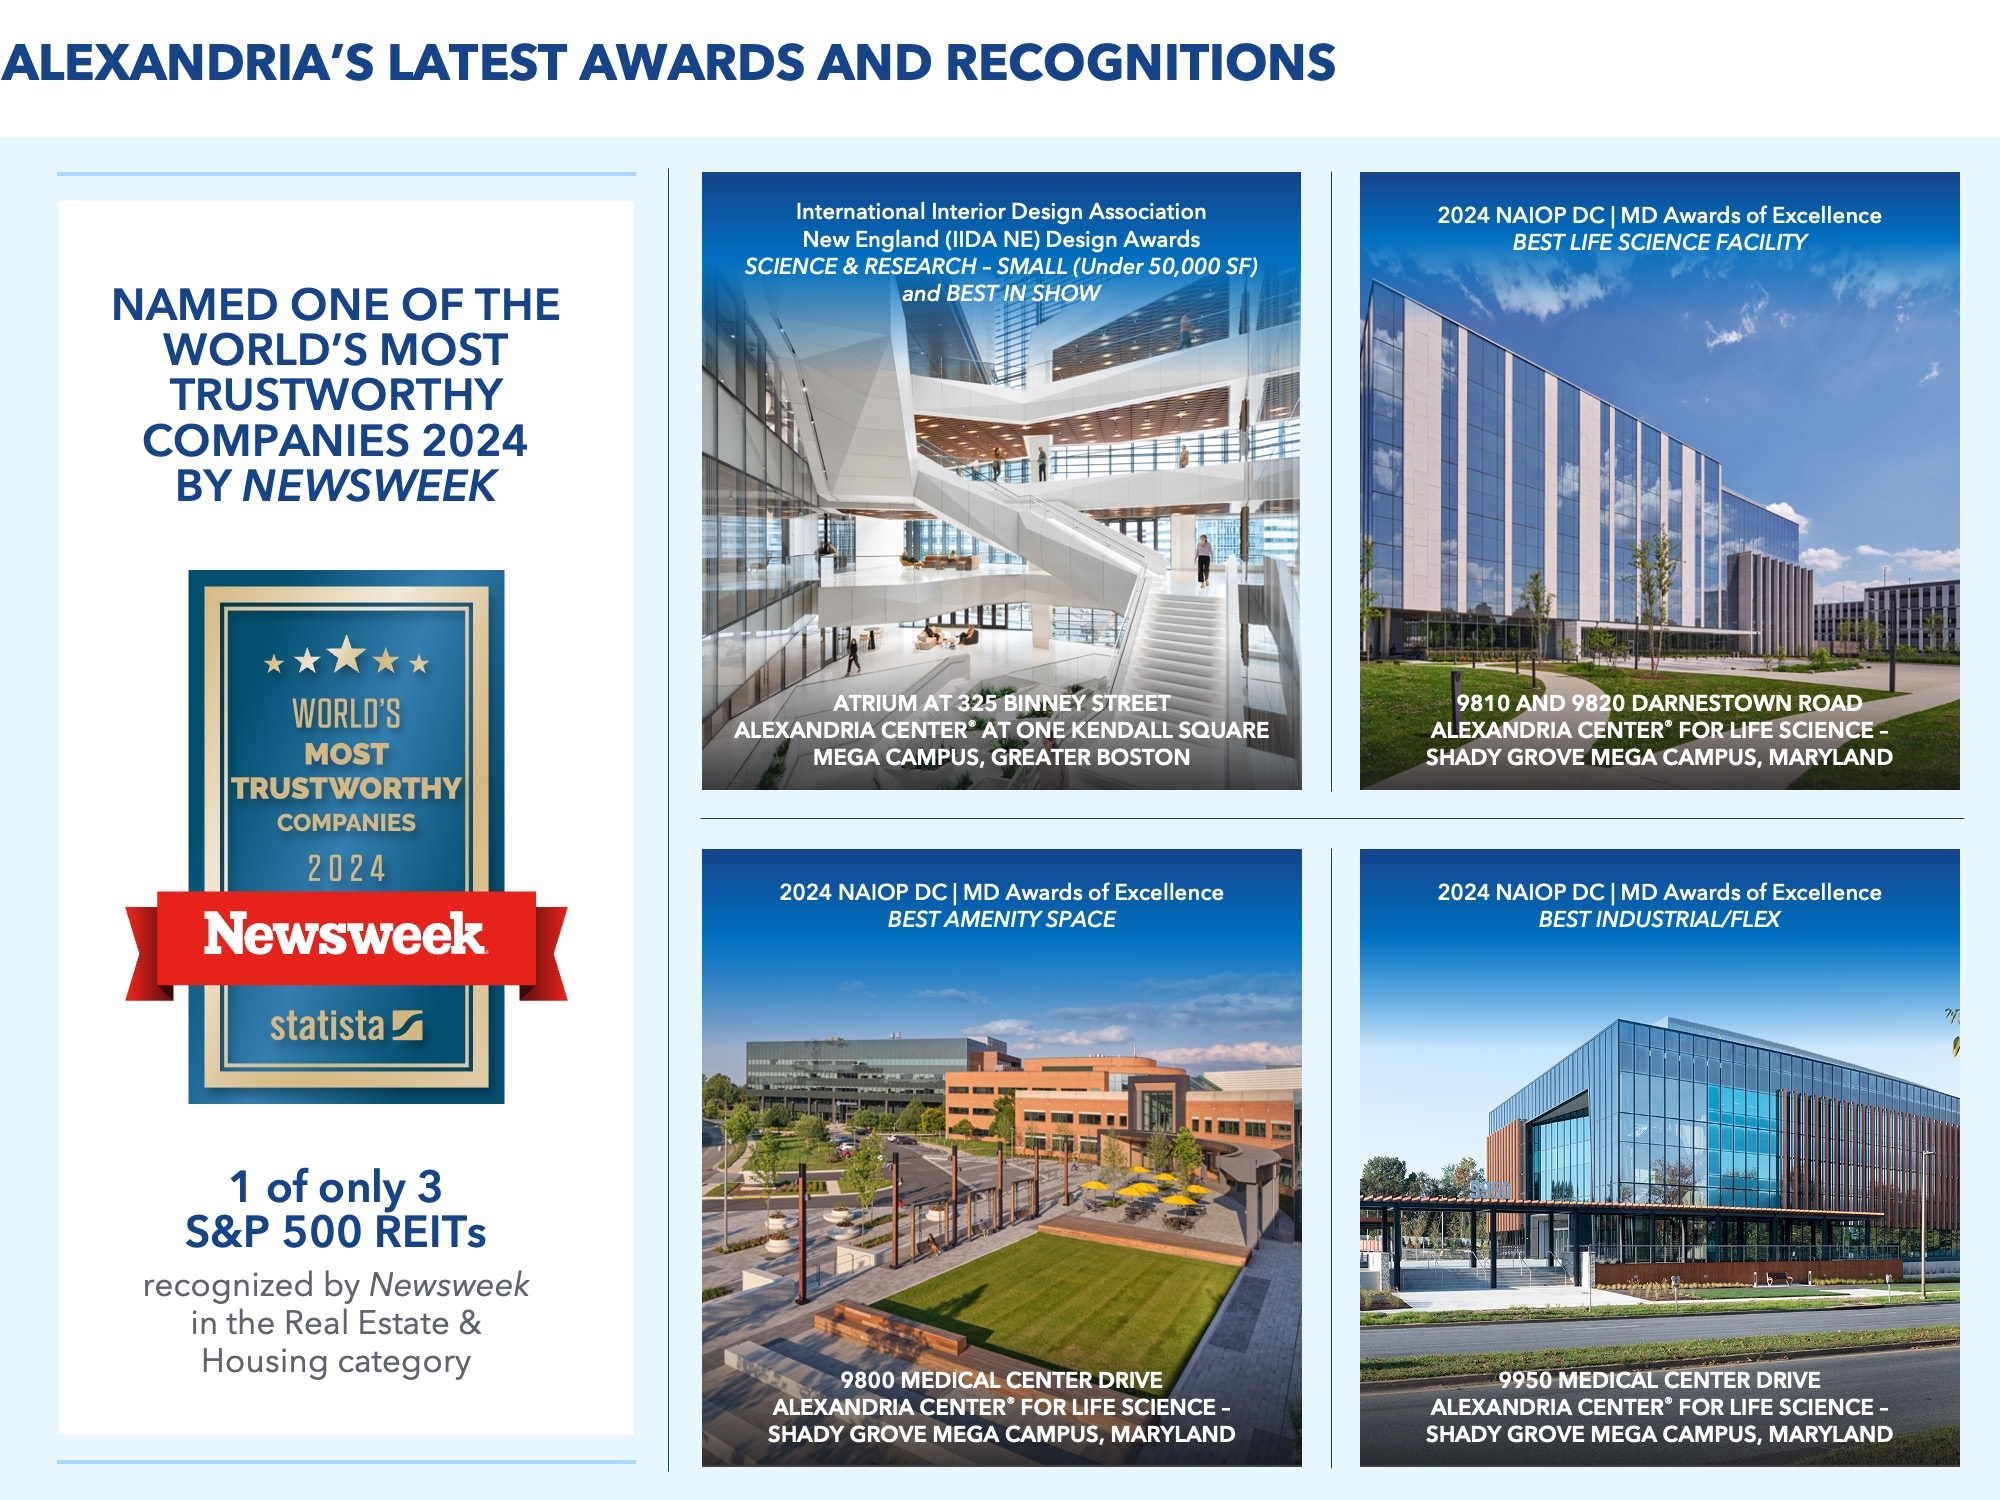
•In September 2024, Alexandria was named one of the World’s Most Trustworthy Companies
by Newsweek. This significant distinction builds on the Company’s recognition by the
publication as one of America’s Most Trustworthy Companies in 2023 and 2024. Alexandria is
one of only three S&P 500 REITs recognized in the real estate and housing category.
•In September 2024, Alexandria and its executive chairman and founder, Joel S. Marcus, were
honored with the inaugural Bisnow Life Sciences Icon & Influencer Award. This prestigious
award highlights Mr. Marcus and the Company’s significant long-term contributions to and
lasting impact on the life science real estate sector and broader life science industry. Mr.
Marcus accepted the award on his own behalf and that of Alexandria at Bisnow’s International
Life Sciences & Biotech Conference, where he was also the keynote speaker.
•Alexandria continued to receive broad recognition for our operational excellence in asset
management, design, development, and sustainability, including the following recent awards:
•In our Greater Boston market, the atrium at 325 Binney Street, located on the Alexandria
Center® at One Kendall Square mega campus, is a light-filled collaboration space with a
terraced garden and communal staircase that was celebrated for design excellence in the
Science & Research – Small (under 50,000 SF) category of the 2024 International Interior
Design Association New England (IIDA NE) Design Awards and also received the award
program’s top honor, Best in Show.
•In our Maryland market, we were awarded three 2024 NAIOP DC|MD Awards of
Excellence for developments and enhancements on the Alexandria Center® for Life
Science – Shady Grove mega campus: 9810 and 9820 Darnestown Road for Best Life
Science Facility, 9800 Medical Center Drive for Best Amenity Space, and 9950 Medical
Center Drive for Best Industrial/Flex.
•We received a 2024 Nareit Sustainable Design Impact Award for our groundbreaking
approach to utilizing alternative energy sources such as geothermal energy and
wastewater heat recovery systems to reduce operational greenhouse gas emissions in
Labspace® development projects in our Greater Boston and Seattle markets.
•Alexandria GradLabs® at 9880 Campus Point Drive, located on the Campus Point by
Alexandria mega campus in our San Diego market, earned a 2024 International Institute
for Sustainable Laboratories (I2SL) Lab Buildings and Projects Award for Excellence in
Energy Efficiency. The state-of-the-art building was designed to operate as a highly energy-
efficient research facility. In 2023, the LEED Platinum certified facility earned an I2SL
Labs2Zero pilot Energy Score of 96 out of 100, indicating its operational energy
performance is better than 96% of similar facilities.
Alexandria Real Estate Equities, Inc. All Rights Reserved. © 2024 | 4 |
| |
Third Quarter Ended September 30, 2024 Financial and Operating Results (continued) | |
September 30, 2024 | |
About Alexandria Real Estate Equities, Inc.
Alexandria Real Estate Equities, Inc. (NYSE: ARE), an S&P 500® company, is a best-in-class,
mission-driven life science REIT making a positive and lasting impact on the world. As the pioneer
of the life science real estate niche with our founding in 1994, Alexandria is the preeminent and
longest-tenured owner, operator, and developer of collaborative mega campuses in AAA life
science innovation cluster locations, including Greater Boston, the San Francisco Bay Area, San
Diego, Seattle, Maryland, Research Triangle, and New York City. As of September 30, 2024,
Alexandria has a total market capitalization of $33.1 billion and an asset base in North America
that includes 41.8 million RSF of operating properties, 5.3 million RSF of Class A/A+ properties
undergoing construction, and one committed near-term project expected to commence
construction in the next two years. Alexandria has a longstanding and proven track record of
developing Class A/A+ properties clustered in mega campuses that provide our innovative tenants
with highly dynamic and collaborative environments that enhance their ability to successfully
recruit and retain world-class talent and inspire productivity, efficiency, creativity, and success.
Alexandria also provides strategic capital to transformative life science companies through our
venture capital platform. We believe our unique business model and diligent underwriting ensure a
high-quality and diverse tenant base that results in higher occupancy levels, longer lease terms,
higher rental income, higher returns, and greater long-term asset value. For more information on
Alexandria, please visit www.are.com.
Alexandria Real Estate Equities, Inc. All Rights Reserved. © 2024 | 5 |
Guidance | |
September 30, 2024 | |
(Dollars in millions, except per share amounts) | |
The following guidance for 2024 has been updated to reflect our current view of existing market conditions and assumptions for the year ending December 31, 2024. There can be no assurance that actual
results will not be materially higher or lower than these expectations. Also, refer to our discussion of “forward-looking statements” on page 8 of the Earnings Press Release for additional details.
2024 Guidance Midpoint | ||||||||||
Summary of Key Changes in Guidance | As of 10/21/24 | As of 7/22/24 | Summary of Key Changes in Sources and Uses of Capital | As of 10/21/24 | As of 7/22/24 | |||||
EPS, FFO per share, and FFO per share, as adjusted | See updates below | Cash expected to be held at December 31, 2024 | $150 | $— | ||||||
Straight-line rent revenue | $147 to $162 | $169 to $184 | ||||||||
General and administrative expenses | $176 to $186 | $181 to $191 | ||||||||
Projected 2024 Earnings per Share and Funds From Operations per Share Attributable to Alexandria’s Common Stockholders – Diluted | |||||||||
As of 10/21/24 | As of 7/22/24 | ||||||||
Earnings per share(2) | $2.60 to $2.64 | $2.98 to $3.10 | |||||||
Depreciation and amortization of real estate assets | 6.05 | 5.95 | |||||||
Gain on sales of real estate(3) | (0.38) | — | |||||||
Impairment of real estate – rental properties and land(4) | 0.67 | 0.01 | |||||||
Allocation to unvested restricted stock awards | (0.06) | (0.05) | |||||||
Funds from operations per share(1) | $8.88 to $8.92 | $8.89 to $9.01 | |||||||
Unrealized losses on non-real estate investments | 0.19 | 0.20 | |||||||
Impairment of non-real estate investments | 0.22 | 0.16 | |||||||
Impairment of real estate | 0.17 | 0.17 | |||||||
Allocation to unvested restricted stock awards | (0.01) | (0.01) | |||||||
Funds from operations per share, as adjusted(1) | $9.45 to $9.49 | $9.41 to $9.53 | |||||||
Midpoint | $9.47 | $9.47 | |||||||
Key Assumptions | Low | High | |||
Occupancy percentage in North America as of December 31, 2024 | 94.6% | 95.6% | |||
Lease renewals and re-leasing of space: | |||||
Rental rate changes | 11.0% | 19.0% | |||
Rental rate changes (cash basis) | 5.0% | 13.0% | |||
Same property performance: | |||||
Net operating income changes | 0.5% | 2.5% | |||
Net operating income changes (cash basis) | 3.0% | 5.0% | |||
Straight-line rent revenue(9) | $147 | $162 | |||
General and administrative expenses(10) | $176 | $186 | |||
Capitalization of interest | $325 | $355 | |||
Interest expense | $154 | $184 | |||
Realized gains on non-real estate investments(11) | $95 | $125 |
Key Credit Metric Targets(1) | ||
Net debt and preferred stock to Adjusted EBITDA – 4Q24 annualized | Less than or equal to 5.1x | |
Fixed-charge coverage ratio – 4Q24 annualized | Greater than or equal to 4.5x |
Certain Completed Items | |||||||||
Key Sources and Uses of Capital | Range | Midpoint | |||||||
Sources of capital: | |||||||||
Incremental debt | $885 | $1,185 | $1,035 | See below | |||||
Net cash provided by operating activities after dividends | 400 | 500 | 450 | ||||||
Dispositions and common equity(5) (refer to page 7) | 1,050 | 2,050 | 1,550 | (5) | |||||
Total sources of capital | $2,335 | $3,735 | $3,035 | ||||||
Uses of capital: | |||||||||
Construction | $1,950 | $2,550 | $2,250 | ||||||
Acquisitions (refer to page 6) | 250 | 750 | 500 | $249 | |||||
Ground lease prepayment(6) | 135 | 135 | 135 | ||||||
Cash expected to be held at December 31, 2024(7) | — | 300 | 150 | ||||||
Total uses of capital | $2,335 | $3,735 | $3,035 | ||||||
Incremental debt (included above): | |||||||||
Issuance of unsecured senior notes payable(8) | $1,000 | $1,000 | $1,000 | $1,000 | (8) | ||||
Unsecured senior line of credit, commercial paper, and other | (115) | 185 | 35 | ||||||
Net incremental debt | $885 | $1,185 | $1,035 | ||||||
(1)Refer to “Definitions and reconciliations” in the Supplemental Information for additional details.
(2)Excludes unrealized gains or losses on non-real estate investments after September 30, 2024 that are required to be recognized in earnings and are excluded from funds from operations per share, as adjusted.
(3)Includes $37.1 million of gain on sales of real estate recognized in October 2024. Refer to “Dispositions” in the Earnings Press Release for additional details.
(4)Includes $106.8 million of real estate impairments recognized in October 2024. Refer to “Subsequent Events” in the Earnings Press Release for additional details.
(5)We expect to fund our remaining capital requirements for the year ending December 31, 2024 with real estate dispositions. As of October 21, 2024, we completed real estate dispositions aggregating $319.2 million, have additional pending
transactions subject to (i) non-refundable deposits aggregating $577.2 million and (ii) executed letters of intent and/or purchase and sale agreements aggregating $602.5 million and forward equity sales agreements aggregating $28 million,
which in aggregate, represents 98% of the $1.55 billion midpoint of our guidance range. We do not expect to issue additional equity in 2024 beyond the existing forward equity sales agreements outstanding.
(6)In July 2024, we executed an amendment to our existing ground lease agreement at the Alexandria Technology Square® mega campus in our Cambridge submarket, which requires that we prepay our entire rent obligation for the extended
lease term aggregating $270.0 million in two equal installments during the fourth quarter of 2024 and the first quarter of 2025.
(7)The increase in cash expected to be held at December 31, 2024 is primarily due to changes in the mix and timing of pending dispositions that are subject to non-refundable deposits or subject to executed letters of intent and/or purchase
and sale agreements that are expected to close in 4Q24. This cash is expected to reduce our 2025 debt capital needs.
(8)Represents $1.0 billion of unsecured senior notes payable issued in February 2024. Subject to market conditions, we may seek additional opportunities in 2024 to fund all or a portion of the proceeds necessary for the repayment of our
$600.0 million of 3.45% unsecured senior notes payable due on April 30, 2025 through the issuance of additional unsecured senior notes payable that is not assumed in our current 2024 guidance.
(9)Reduction in the midpoint of our guidance range for straight-line rent revenue by $22 million is primarily attributable to (i) the write-off of a deferred rent receivable of $9 million related to the lease termination and a payment of $10 million
from a tenant at 409 Illinois Street in our Mission Bay submarket, a 234,249 RSF property owned by our consolidated real estate joint venture for which we have an ownership interest of 25%, and (ii) a change in the expected stabilization
date from 4Q24 to 1Q25 at our fully leased development project at 230 Harriet Tubman Way in our South San Francisco submarket as reported in our 2Q24 Earnings Press Release and Supplemental Information.
(10)Reduction in the midpoint of our guidance range for general and administrative expense by $5 million is primarily attributable to the realization of savings associated with overall efficiencies, including enhanced cost control measures,
incremental use of technology, streamlined processes, and optimization of execution in connection with the sale of non-core assets not integral to our mega campus strategy.
(11)Represents realized gains and losses included in funds from operations per share – diluted, as adjusted, and excludes significant impairments realized on non-real estate investments, if any. Refer to “Investments” in the Supplemental
Information for additional details.
Alexandria Real Estate Equities, Inc. All Rights Reserved. © 2024 | 6 |
Acquisitions | |
September 30, 2024 | |
(Dollars in thousands) | |
Property | Submarket/Market | Date of Purchase | Number of Properties | Operating Occupancy | Square Footage | Purchase Price | |||||||||||
Future Development(1) | Operating With Future Development/ Redevelopment(1) | ||||||||||||||||
Completed in 1H24: | |||||||||||||||||
285, 299, 307, and 345 Dorchester Avenue (60% interest in consolidated JV) | Seaport Innovation District/Greater Boston | 1/30/24 | — | N/A | 1,040,000 | — | $ | 155,321 | |||||||||
Other | 46,490 | ||||||||||||||||
201,811 | |||||||||||||||||
Completed in October 2024: | |||||||||||||||||
428 Westlake Avenue North | Lake Union/Seattle | 10/1/24 | 1 | 100% | — | 88,514 | 47,600 | ||||||||||
$ | 249,411 | ||||||||||||||||
2024 guidance range for acquisitions | $250,000 – $750,000 | ||||||||||||||||
(1)We expect to provide total estimated costs and related yields for development and significant redevelopment projects in the future, subsequent to the commencement of construction.
Alexandria Real Estate Equities, Inc. All Rights Reserved. © 2024 | 7 |
Dispositions | |
September 30, 2024 | |
(Dollars in thousands) | |
Property | Submarket/Market | Date of Sale | Interest Sold | RSF | Capitalization Rate | Capitalization Rate (Cash Basis) | Sales Price | Sales Price per RSF | |||||||||||
Completed in 1H24 | $17,213 | ||||||||||||||||||
Completed in 3Q24: | |||||||||||||||||||
Sale to longstanding tenant | |||||||||||||||||||
1165 Eastlake Avenue East | Lake Union/Seattle | 9/12/24 | 100% | 100,086 | 4.7% | 4.9% | 149,985 | (1) | $1,499 | ||||||||||
Dispositions of properties not integral to our mega campus strategy | |||||||||||||||||||
219 East 42nd Street | New York City/New York City | 7/9/24 | 100% | 349,947 | N/A | N/A | 60,000 | (2) | N/A | ||||||||||
Other | 11,511 | ||||||||||||||||||
221,496 | (3) | ||||||||||||||||||
Dispositions completed in YTD 3Q24 | 238,709 | ||||||||||||||||||
Completed in October 2024: | |||||||||||||||||||
Dispositions of properties not integral to our mega campus strategy | |||||||||||||||||||
14225 Newbrook Drive | Northern Virginia/Maryland | 10/15/24 | 100% | 248,186 | 7.6% | 7.4% | 80,500 | (4) | $324 | ||||||||||
319,209 | |||||||||||||||||||
Pending 4Q24 dispositions subsequent to October 21, 2024: | |||||||||||||||||||
Subject to non-refundable deposits | |||||||||||||||||||
Sale to longstanding tenant | Greater Boston | 4Q24 | 100% | 8.5% | 6.3% | 369,439 | (5) | ||||||||||||
Other | 207,713 | ||||||||||||||||||
577,152 | |||||||||||||||||||
Subject to executed letters of intent and/or purchase and sale agreements | 602,500 | (5) | |||||||||||||||||
1,179,652 | (6) | ||||||||||||||||||
$1,498,861 | |||||||||||||||||||
2024 guidance range for dispositions and common equity | $1,050,000 – $2,050,000 | ||||||||||||||||||
(1)Upon completion of the sale, we recognized a gain on sale of real estate aggregating $21.5 million.
(2)The property was leased to a single tenant with a July 2024 lease expiration and had annual net operating income of $18.6 million based on 2Q24 annualized. This property was previously considered to be a potential development project
upon expiration of the in-place non-laboratory space lease.
(3)Dispositions completed during the three months ended September 30, 2024 had annual net operating income of $26.5 million (based on 2Q24 annualized) with a weighted-average disposition date of July 28, 2024 (weighted by net
operating income for 2Q24 annualized).
(4)Demonstrating the long-term enduring value of our laboratory facilities, Alexandria successfully operated our only asset in the Northern Virginia submarket from its acquisition in 1997 (prior to our IPO) through its sale in October 2024. Upon
completion of the sale, we recognized a gain on sale of real estate aggregating $37.1 million.
(5)Refer to “Subsequent events” in the Earnings Press Release for additional details.
(6)Pending dispositions subsequent to October 21, 2024 have estimated annual net operating income of approximately $95.8 million (based on 3Q24 annualized) with a weighted-average estimated disposition date of December 5, 2024
(weighted by net operating income for 3Q24 annualized). Approximately half of our pending dispositions are non-core stabilized stand-alone properties with weighted-average capitalization rates of 8.5% and 7.0% (cash basis), and the
remaining half are land and non-stabilized properties that have vacancy or significant near-term lease expirations that will require capital to re-tenant, including one building with approximately 72% of non-laboratory space.
Alexandria Real Estate Equities, Inc. All Rights Reserved. © 2024 | 8 |
| |
Earnings Call Information and About the Company | |
September 30, 2024 | |
We will host a conference call on Tuesday, October 22, 2024, at 3:00 p.m. Eastern Time (“ET”)/noon Pacific Time (“PT”), which is open to the general public, to discuss our financial and operating results
for the third quarter ended September 30, 2024. To participate in this conference call, dial (833) 366-1125 or (412) 902-6738 shortly before 3:00 p.m. ET/noon PT and ask the operator to join the call for Alexandria
Real Estate Equities, Inc. The audio webcast can be accessed at www.are.com in the “For Investors” section. A replay of the call will be available for a limited time from 5:00 p.m. ET/2:00 p.m. PT on Tuesday,
October 22, 2024. The replay number is (877) 344-7529 or (412) 317-0088, and the access code is 1168152.
Additionally, a copy of this Earnings Press Release and Supplemental Information for the third quarter ended September 30, 2024 is available in the “For Investors” section of our website at www.are.com
or by following this link: https://www.are.com/fs/2024q3.pdf.
For any questions, please contact corporateinformation@are.com; Joel S. Marcus, executive chairman and founder; Peter M. Moglia, chief executive officer and chief investment officer; Marc E. Binda,
chief financial officer and treasurer; Paula Schwartz, managing director of Rx Communications Group, at (917) 633-7790; or Sara M. Kabakoff, senior vice president – chief content officer.
About the Company
Alexandria Real Estate Equities, Inc. (NYSE: ARE), an S&P 500® company, is a best-in-class, mission-driven life science REIT making a positive and lasting impact on the world. As the pioneer of the life
science real estate niche with our founding in 1994, Alexandria is the preeminent and longest-tenured owner, operator, and developer of collaborative mega campuses in AAA life science innovation cluster locations,
including Greater Boston, the San Francisco Bay Area, San Diego, Seattle, Maryland, Research Triangle, and New York City. As of September 30, 2024, Alexandria has a total market capitalization of $33.1 billion
and an asset base in North America that includes 41.8 million RSF of operating properties, 5.3 million RSF of Class A/A+ properties undergoing construction, and one committed near-term project expected to
commence construction in the next two years. Alexandria has a longstanding and proven track record of developing Class A/A+ properties clustered in mega campuses that provide our innovative tenants with highly
dynamic and collaborative environments that enhance their ability to successfully recruit and retain world-class talent and inspire productivity, efficiency, creativity, and success. Alexandria also provides strategic
capital to transformative life science companies through our venture capital platform. We believe our unique business model and diligent underwriting ensure a high-quality and diverse tenant base that results in
higher occupancy levels, longer lease terms, higher rental income, higher returns, and greater long-term asset value. For more information on Alexandria, please visit www.are.com.
Forward-Looking Statements
This document includes “forward-looking statements” within the meaning of Section 27A of the Securities Act of 1933, as amended, and Section 21E of the Securities Exchange Act of 1934, as amended.
Such forward-looking statements include, without limitation, statements regarding our 2024 earnings per share, 2024 funds from operations per share, 2024 funds from operations per share, as adjusted, net
operating income, and our projected sources and uses of capital. You can identify the forward-looking statements by their use of forward-looking words, such as “forecast,” “guidance,” “goals,” “projects,” “estimates,”
“anticipates,” “believes,” “expects,” “intends,” “may,” “plans,” “seeks,” “should,” “targets,” or “will,” or the negative of those words or similar words. These forward-looking statements are based on our current
expectations, beliefs, projections, future plans and strategies, anticipated events or trends, and similar expressions concerning matters that are not historical facts, as well as a number of assumptions concerning
future events. There can be no assurance that actual results will not be materially higher or lower than these expectations. These statements are subject to risks, uncertainties, assumptions, and other important
factors that could cause actual results to differ materially from the results discussed in the forward-looking statements. Factors that might cause such a difference include, without limitation, our failure to obtain
capital (debt, construction financing, and/or equity) or refinance debt maturities, lower than expected yields, increased interest rates and operating costs, adverse economic or real estate developments in our
markets, our failure to successfully place into service and lease any properties undergoing development or redevelopment and our existing space held for future development or redevelopment (including new
properties acquired for that purpose), our failure to successfully operate or lease acquired properties, decreased rental rates, increased vacancy rates or failure to renew or replace expiring leases, defaults on or
non-renewal of leases by tenants, adverse general and local economic conditions, an unfavorable capital market environment, decreased leasing activity or lease renewals, failure to obtain LEED and other healthy
building certifications and efficiencies, and other risks and uncertainties detailed in our filings with the Securities and Exchange Commission (“SEC”). Accordingly, you are cautioned not to place undue reliance on
such forward-looking statements. All forward-looking statements are made as of the date of this Earnings Press Release and Supplemental Information, and unless otherwise stated, we assume no obligation to
update this information and expressly disclaim any obligation to update or revise any forward-looking statements, whether as a result of new information, future events, or otherwise. For more discussion relating to
risks and uncertainties that could cause actual results to differ materially from those anticipated in our forward-looking statements, and risks to our business in general, please refer to our SEC filings, including our
most recent annual report on Form 10-K and any subsequent quarterly reports on Form 10-Q.
This document is not an offer to sell or a solicitation to buy securities of Alexandria Real Estate Equities, Inc. Any offers to sell or solicitations to buy our securities shall be made only by means of a
prospectus approved for that purpose. Unless otherwise indicated, the “Company,” “Alexandria,” “ARE,” “we,” “us,” and “our” refer to Alexandria Real Estate Equities, Inc. and our consolidated subsidiaries.
Alexandria®, Lighthouse Design® logo, Building the Future of Life-Changing Innovation®, That’s What’s in Our DNA®, Labspace®, At the Vanguard and Heart of the Life Science Ecosystem™, Alexandria Center®,
Alexandria Technology Square®, Alexandria Technology Center®, and Alexandria Innovation Center® are copyrights and trademarks of Alexandria Real Estate Equities, Inc. All other company names, trademarks,
and logos referenced herein are the property of their respective owners.
Alexandria Real Estate Equities, Inc. All Rights Reserved. © 2024 | 9 |
Consolidated Statements of Operations | |
September 30, 2024 | |
(Dollars in thousands, except per share amounts) | |
Three Months Ended | Nine Months Ended | |||||||||||||
9/30/24 | 6/30/24 | 3/31/24 | 12/31/23 | 9/30/23 | 9/30/24 | 9/30/23 | ||||||||
Revenues: | ||||||||||||||
Income from rentals | $775,744 | $755,162 | $755,551 | $742,637 | $707,531 | $2,286,457 | $2,099,819 | |||||||
Other income | 15,863 | 11,572 | 13,557 | 14,579 | 6,257 | 40,992 | 28,664 | |||||||
Total revenues | 791,607 | 766,734 | 769,108 | 757,216 | 713,788 | 2,327,449 | 2,128,483 | |||||||
Expenses: | ||||||||||||||
Rental operations | 233,265 | 217,254 | 218,314 | 222,726 | 217,687 | 668,833 | 636,454 | |||||||
General and administrative | 43,945 | 44,629 | 47,055 | 59,289 | 45,987 | 135,629 | 140,065 | |||||||
Interest | 43,550 | 45,789 | 40,840 | 31,967 | 11,411 | 130,179 | 42,237 | |||||||
Depreciation and amortization | 293,998 | 290,720 | 287,554 | 285,246 | 269,370 | 872,272 | 808,227 | |||||||
Impairment of real estate | 5,741 | 30,763 | — | 271,890 | 20,649 | 36,504 | 189,224 | |||||||
Total expenses | 620,499 | 629,155 | 593,763 | 871,118 | 565,104 | 1,843,417 | 1,816,207 | |||||||
Equity in earnings of unconsolidated real estate joint ventures | 139 | 130 | 155 | 363 | 242 | 424 | 617 | |||||||
Investment income (loss) | 15,242 | (43,660) | 43,284 | 8,654 | (80,672) | 14,866 | (204,051) | |||||||
Gain on sales of real estate | 27,114 | — | 392 | 62,227 | — | 27,506 | 214,810 | |||||||
Net income (loss) | 213,603 | 94,049 | 219,176 | (42,658) | 68,254 | 526,828 | 323,652 | |||||||
Net income attributable to noncontrolling interests | (45,656) | (47,347) | (48,631) | (45,771) | (43,985) | (141,634) | (131,584) | |||||||
Net income (loss) attributable to Alexandria Real Estate Equities, Inc.’s stockholders | 167,947 | 46,702 | 170,545 | (88,429) | 24,269 | 385,194 | 192,068 | |||||||
Net income attributable to unvested restricted stock awards | (3,273) | (3,785) | (3,659) | (3,498) | (2,414) | (10,717) | (7,697) | |||||||
Net income (loss) attributable to Alexandria Real Estate Equities, Inc.’s common stockholders | $164,674 | $42,917 | $166,886 | $(91,927) | $21,855 | $374,477 | $184,371 | |||||||
Net income (loss) per share attributable to Alexandria Real Estate Equities, Inc.’s common stockholders: | ||||||||||||||
Basic | $0.96 | $0.25 | $0.97 | $(0.54) | $0.13 | $2.18 | $1.08 | |||||||
Diluted | $0.96 | $0.25 | $0.97 | $(0.54) | $0.13 | $2.18 | $1.08 | |||||||
Weighted-average shares of common stock outstanding: | ||||||||||||||
Basic | 172,058 | 172,013 | 171,949 | 171,096 | 170,890 | 172,007 | 170,846 | |||||||
Diluted | 172,058 | 172,013 | 171,949 | 171,096 | 170,890 | 172,007 | 170,846 | |||||||
Dividends declared per share of common stock | $1.30 | $1.30 | $1.27 | $1.27 | $1.24 | $3.87 | $3.69 | |||||||
Alexandria Real Estate Equities, Inc. All Rights Reserved. © 2024 | 10 |
Consolidated Balance Sheets | |
September 30, 2024 | |
(In thousands) | |
9/30/24 | 6/30/24 | 3/31/24 | 12/31/23 | 9/30/23 | ||||||
Assets | ||||||||||
Investments in real estate | $32,951,777 | $32,673,839 | $32,323,138 | $31,633,511 | $31,712,731 | |||||
Investments in unconsolidated real estate joint ventures | 40,170 | 40,535 | 40,636 | 37,780 | 37,695 | |||||
Cash and cash equivalents | 562,606 | 561,021 | 722,176 | 618,190 | 532,390 | |||||
Restricted cash | 17,031 | 4,832 | 9,519 | 42,581 | 35,321 | |||||
Tenant receivables | 6,980 | 6,822 | 7,469 | 8,211 | 6,897 | |||||
Deferred rent | 1,216,176 | 1,190,336 | 1,138,936 | 1,050,319 | 1,012,666 | |||||
Deferred leasing costs | 516,872 | 519,629 | 520,616 | 509,398 | 512,216 | |||||
Investments | 1,519,327 | 1,494,348 | 1,511,588 | 1,449,518 | 1,431,766 | |||||
Other assets | 1,657,189 | 1,356,503 | 1,424,968 | 1,421,894 | 1,501,611 | |||||
Total assets | $38,488,128 | $37,847,865 | $37,699,046 | $36,771,402 | $36,783,293 | |||||
Liabilities, Noncontrolling Interests, and Equity | ||||||||||
Secured notes payable | $145,000 | $134,942 | $130,050 | $119,662 | $109,110 | |||||
Unsecured senior notes payable | 12,092,012 | 12,089,561 | 12,087,113 | 11,096,028 | 11,093,725 | |||||
Unsecured senior line of credit and commercial paper | 454,589 | 199,552 | — | 99,952 | — | |||||
Accounts payable, accrued expenses, and other liabilities | 2,865,886 | 2,529,535 | 2,503,831 | 2,610,943 | 2,653,126 | |||||
Dividends payable | 227,191 | 227,408 | 222,134 | 221,824 | 214,450 | |||||
Total liabilities | 15,784,678 | 15,180,998 | 14,943,128 | 14,148,409 | 14,070,411 | |||||
Commitments and contingencies | ||||||||||
Redeemable noncontrolling interests | 16,510 | 16,440 | 16,620 | 16,480 | 51,658 | |||||
Alexandria Real Estate Equities, Inc.’s stockholders’ equity: | ||||||||||
Common stock | 1,722 | 1,720 | 1,720 | 1,719 | 1,710 | |||||
Additional paid-in capital | 18,238,438 | 18,284,611 | 18,434,690 | 18,485,352 | 18,651,185 | |||||
Accumulated other comprehensive loss | (22,529) | (27,710) | (23,815) | (15,896) | (24,984) | |||||
Alexandria Real Estate Equities, Inc.’s stockholders’ equity | 18,217,631 | 18,258,621 | 18,412,595 | 18,471,175 | 18,627,911 | |||||
Noncontrolling interests | 4,469,309 | 4,391,806 | 4,326,703 | 4,135,338 | 4,033,313 | |||||
Total equity | 22,686,940 | 22,650,427 | 22,739,298 | 22,606,513 | 22,661,224 | |||||
Total liabilities, noncontrolling interests, and equity | $38,488,128 | $37,847,865 | $37,699,046 | $36,771,402 | $36,783,293 |
Alexandria Real Estate Equities, Inc. All Rights Reserved. © 2024 | 11 |
Funds From Operations and Funds From Operations per Share | |
September 30, 2024 | |
(In thousands) | |
The following table presents a reconciliation of net income (loss) attributable to Alexandria’s common stockholders, the most directly comparable financial measure presented in
accordance with U.S. generally accepted accounting principles (“GAAP”), including our share of amounts from consolidated and unconsolidated real estate joint ventures, to funds from operations
attributable to Alexandria’s common stockholders – diluted, and funds from operations attributable to Alexandria’s common stockholders – diluted, as adjusted, for the periods below:
Three Months Ended | Nine Months Ended | |||||||||||||
9/30/24 | 6/30/24 | 3/31/24 | 12/31/23 | 9/30/23 | 9/30/24 | 9/30/23 | ||||||||
Net income (loss) attributable to Alexandria’s common stockholders – basic and diluted | $164,674 | $42,917 | $166,886 | $(91,927) | $21,855 | $374,477 | $184,371 | |||||||
Depreciation and amortization of real estate assets | 291,258 | 288,118 | 284,950 | 281,939 | 266,440 | 864,326 | 798,590 | |||||||
Noncontrolling share of depreciation and amortization from consolidated real estate JVs | (32,457) | (31,364) | (30,904) | (30,137) | (28,814) | (94,725) | (85,212) | |||||||
Our share of depreciation and amortization from unconsolidated real estate JVs | 1,075 | 1,068 | 1,034 | 965 | 910 | 3,177 | 2,624 | |||||||
Gain on sales of real estate | (27,114) | — | (392) | (62,227) | — | (27,506) | (214,810) | |||||||
Impairment of real estate – rental properties and land | 5,741 | (1) | 2,182 | — | 263,982 | 19,844 | 7,923 | 186,446 | ||||||
Allocation to unvested restricted stock awards | (2,908) | (1,305) | (3,469) | (2,268) | (838) | (7,657) | (3,050) | |||||||
Funds from operations attributable to Alexandria’s common stockholders – diluted(2) | 400,269 | 301,616 | 418,105 | 360,327 | 279,397 | 1,120,015 | 868,959 | |||||||
Unrealized (gains) losses on non-real estate investments | (2,610) | 64,238 | (29,158) | (19,479) | 77,202 | 32,470 | 220,954 | |||||||
Impairment of non-real estate investments | 10,338 | (3) | 12,788 | 14,698 | 23,094 | 28,503 | 37,824 | 51,456 | ||||||
Impairment of real estate | — | 28,581 | — | 7,908 | 805 | 28,581 | 2,778 | |||||||
Acceleration of stock compensation expense due to executive officer resignations | — | — | — | 18,436 | 1,859 | — | 1,859 | |||||||
Allocation to unvested restricted stock awards | (125) | (1,738) | 247 | (472) | (1,330) | (1,640) | (3,503) | |||||||
Funds from operations attributable to Alexandria’s common stockholders – diluted, as adjusted | $407,872 | $405,485 | $403,892 | $389,814 | $386,436 | $1,217,250 | $1,142,503 | |||||||
Refer to “Definitions and reconciliations” in the Supplemental Information for additional details.
(1)Primarily to reduce the carrying amount of one property in Canada that continued to meet the held-for-sale classification to the sales price under negotiation with a potential buyer less costs to sell.
(2)Calculated in accordance with standards established by the Nareit Board of Governors.
(3)Primarily related to two non-real estate investments in privately held entities that do not report NAV.
Alexandria Real Estate Equities, Inc. All Rights Reserved. © 2024 | 12 |
Funds From Operations and Funds From Operations per Share (continued) | |
September 30, 2024 | |
(In thousands, except per share amounts) | |
The following table presents a reconciliation of net income (loss) per share attributable to Alexandria’s common stockholders, the most directly comparable financial measure presented in
accordance with GAAP, including our share of amounts from consolidated and unconsolidated real estate joint ventures, to funds from operations per share attributable to Alexandria’s common
stockholders – diluted, and funds from operations per share attributable to Alexandria’s common stockholders – diluted, as adjusted, for the periods below. Per share amounts may not add due to
rounding.
Three Months Ended | Nine Months Ended | |||||||||||||
9/30/24 | 6/30/24 | 3/31/24 | 12/31/23 | 9/30/23 | 9/30/24 | 9/30/23 | ||||||||
Net income (loss) per share attributable to Alexandria’s common stockholders – diluted | $0.96 | $0.25 | $0.97 | $(0.54) | $0.13 | $2.18 | $1.08 | |||||||
Depreciation and amortization of real estate assets | 1.51 | 1.50 | 1.48 | 1.48 | 1.40 | 4.49 | 4.19 | |||||||
Gain on sales of real estate | (0.16) | — | — | (0.36) | — | (0.16) | (1.26) | |||||||
Impairment of real estate – rental properties and land | 0.03 | 0.01 | — | 1.54 | 0.12 | 0.05 | 1.09 | |||||||
Allocation to unvested restricted stock awards | (0.01) | (0.01) | (0.02) | (0.01) | (0.01) | (0.05) | (0.01) | |||||||
Funds from operations per share attributable to Alexandria’s common stockholders – diluted | 2.33 | 1.75 | 2.43 | 2.11 | 1.64 | 6.51 | 5.09 | |||||||
Unrealized (gains) losses on non-real estate investments | (0.02) | 0.37 | (0.17) | (0.11) | 0.45 | 0.19 | 1.29 | |||||||
Impairment of non-real estate investments | 0.06 | 0.08 | 0.09 | 0.13 | 0.17 | 0.22 | 0.30 | |||||||
Impairment of real estate | — | 0.17 | — | 0.05 | — | 0.17 | 0.02 | |||||||
Acceleration of stock compensation expense due to executive officer resignations | — | — | — | 0.11 | 0.01 | — | 0.01 | |||||||
Allocation to unvested restricted stock awards | — | (0.01) | — | (0.01) | (0.01) | (0.01) | (0.02) | |||||||
Funds from operations per share attributable to Alexandria’s common stockholders – diluted, as adjusted | $2.37 | $2.36 | $2.35 | $2.28 | $2.26 | $7.08 | $6.69 | |||||||
Weighted-average shares of common stock outstanding – diluted | 172,058 | 172,013 | 171,949 | 171,096 | 170,890 | 172,007 | 170,846 | |||||||
Refer to “Definitions and reconciliations” in the Supplemental Information for additional details.
SUPPLEMENTAL
INFORMATION
Alexandria Real Estate Equities, Inc. All Rights Reserved. © 2024 | 14 |
| |
Company Profile | |
September 30, 2024 | |
Alexandria Real Estate Equities, Inc. (NYSE: ARE), an S&P 500® company, is a
best-in-class, mission-driven life science REIT making a positive and lasting impact on the
world. As the pioneer of the life science real estate niche with our founding in 1994,
Alexandria is the preeminent and longest-tenured owner, operator, and developer of
collaborative mega campuses in AAA life science innovation cluster locations, including
Greater Boston, the San Francisco Bay Area, San Diego, Seattle, Maryland, Research
Triangle, and New York City. As of September 30, 2024, Alexandria has a total market
capitalization of $33.1 billion and an asset base in North America that includes 41.8 million
RSF of operating properties, 5.3 million RSF of Class A/A+ properties undergoing
construction, and one committed near-term project expected to commence construction in
the next two years. Alexandria has a longstanding and proven track record of developing
Class A/A+ properties clustered in mega campuses that provide our innovative tenants with
highly dynamic and collaborative environments that enhance their ability to successfully
recruit and retain world-class talent and inspire productivity, efficiency, creativity, and
success. Alexandria also provides strategic capital to transformative life science
companies through our venture capital platform. We believe our unique business model
and diligent underwriting ensure a high-quality and diverse tenant base that results in
higher occupancy levels, longer lease terms, higher rental income, higher returns, and
greater long-term asset value. For more information on Alexandria, please visit
www.are.com.
Tenant base
Alexandria is known for our high-quality and diverse tenant base, with 53% of our
annual rental revenue being generated from tenants that are investment-grade rated or
publicly traded large cap companies. The quality, diversity, breadth, and depth of our
significant relationships with our tenants provide Alexandria with high-quality and stable
cash flows. Alexandria’s underwriting team and long-term industry relationships positively
distinguish us from all other publicly traded REITs and real estate companies.
Executive and senior management team
Alexandria’s executive and senior management team has unique experience and
expertise in creating, owning, and operating highly dynamic and collaborative mega
campuses in key life science cluster locations to catalyze innovation. From design to
development to the management of our high-quality, sustainable real estate, as well as our
ongoing cultivation of collaborative environments with unique amenities and events, the
Alexandria team has a best-in-class reputation of excellence in life science real estate.
Alexandria’s highly experienced management team includes regional market directors with
leading reputations and longstanding relationships within the life science communities in
their respective innovation clusters. We believe that our experience, expertise, reputation,
and key relationships in the real estate and life science industries provide Alexandria
significant competitive advantages in attracting new business opportunities.
Alexandria’s executive and senior management team consists of
63 individuals, averaging 24 years of real estate experience,
including 13 years with Alexandria. Our executive management
team alone averages 19 years with Alexandria.
EXECUTIVE MANAGEMENT TEAM | ||
Joel S. Marcus | Peter M. Moglia | |
Executive Chairman & Founder | Chief Executive Officer & Chief Investment Officer | |
Daniel J. Ryan | Hunter L. Kass | |
Co-President & Regional Market Director – San Diego | Co-President & Regional Market Director – Greater Boston | |
Marc E. Binda | Vincent R. Ciruzzi | |
Chief Financial Officer & Treasurer | Chief Development Officer | |
Lawrence J. Diamond | Joseph Hakman | |
Co-Chief Operating Officer & Regional Market Director – Maryland | Co-Chief Operating Officer & Chief Strategic Transactions Officer | |
Hart Cole | Jackie B. Clem | |
Executive Vice President – Capital Markets/Strategic Operations & Co-Regional Market Director – Seattle | General Counsel & Secretary | |
Gary D. Dean | Andres R. Gavinet | |
Executive Vice President – Real Estate Legal Affairs | Chief Accounting Officer | |
Onn C. Lee | Kristina A. Fukuzaki-Carlson | |
Executive Vice President – Accounting | Executive Vice President – Business Operations | |
Madeleine T. Alsbrook | ||
Executive Vice President – Talent Management | ||
Alexandria Real Estate Equities, Inc. All Rights Reserved. © 2024 | 15 |
| |
Investor Information | |
September 30, 2024 | |
Corporate Headquarters | New York Stock Exchange Trading Symbol | Information Requests | |||
26 North Euclid Avenue | Common stock: ARE | Phone: | (626) 578-0777 | ||
Pasadena, California 91101 | Email: | corporateinformation@are.com | |||
www.are.com | Website: | investor.are.com | |||
Equity Research Coverage |
Alexandria is currently covered by the following research analysts. This list may be incomplete and is subject to change as firms initiate or discontinue coverage of our company. Please note that any opinions, estimates, or forecasts regarding our historical or predicted performance made by these analysts are theirs alone and do not represent opinions, estimates, or forecasts of Alexandria or our management. Alexandria does not by our reference or distribution of the information below imply our endorsement of or concurrence with any opinions, estimates, or forecasts of these analysts. Interested persons may obtain copies of analysts’ reports on their own as we do not distribute these reports. Several of these firms may, from time to time, own our stock and/or hold other long or short positions in our stock and may provide compensated services to us. |
BNP Paribas Exane | Citigroup Global Markets Inc. | Jefferies Research Services, LLC | RBC Capital Markets | |||
Nate Crossett / Monir Koummal | Nicholas Joseph / Michael Griffin | Peter Abramowitz / Katie Elders | Michael Carroll / Aditi Balachandran | |||
(646) 342-1588 / (646) 342-1554 | (212) 816-1909 / (212) 816-5871 | (212) 336-7241 / (212) 284-2300 | (440) 715-2649 / (212) 428-6200 | |||
BofA Securities | Citizens JMP Securities, LLC | J.P. Morgan Securities LLC | Robert W. Baird & Co. Incorporated | |||
Jeff Spector / Joshua Dennerlein | Aaron Hecht | Anthony Paolone / Ray Zhong | Wesley Golladay / Nicholas Thillman | |||
(646) 855-1363 / (646) 855-1681 | (415) 835-3963 | (212) 622-6682 / (212) 622-5411 | (216) 737-7510 / (414) 298-5053 | |||
BTIG, LLC | Evercore ISI | Mizuho Securities USA LLC | Wedbush Securities | |||
Tom Catherwood / Michael Tompkins | Steve Sakwa / James Kammert | Vikram Malhotra / Georgi Dinkov | Richard Anderson / Jay Kornreich | |||
(212) 738-6140 / (212) 527-3566 | (212) 446-9462 / (312) 705-4233 | (212) 282-3827 / (617) 352-1721 | (212) 931-7001 / (212) 938-9942 | |||
CFRA | Green Street | |||||
Paige Meyer | Dylan Burzinski | |||||
(800) 220-0502 | (949) 640-8780 | |||||
Fixed Income Research Coverage | Rating Agencies | |||||
Barclays Capital Inc. | J.P. Morgan Securities LLC | Moody’s Ratings | S&P Global Ratings | |||
Srinjoy Banerjee / Japheth Otieno | Mark Streeter | (212) 553-0376 | Alan Zigman | |||
(212) 526-3521 / (212) 526-6961 | (212) 834-5086 | (416) 507-2556 | ||||
Alexandria Real Estate Equities, Inc. All Rights Reserved. © 2024 | 16 |
Financial and Asset Base Highlights | |
September 30, 2024 | |
(Dollars in thousands, except per share amounts) | |
Three Months Ended (unless stated otherwise) | ||||||||||
9/30/24 | 6/30/24 | 3/31/24 | 12/31/23 | 9/30/23 | ||||||
Selected financial data from consolidated financial statements and related information | ||||||||||
Rental revenues | $579,569 | $576,835 | $581,400 | $561,428 | $526,352 | |||||
Tenant recoveries | $196,175 | $178,327 | $174,151 | $181,209 | $181,179 | |||||
General and administrative expenses | $43,945 | $44,629 | $47,055 | $59,289 | $45,987 | |||||
General and administrative expenses as a percentage of net operating income – trailing 12 months | 8.9% | 9.2% | 9.5% | 9.8% | 9.3% | |||||
Operating margin | 71% | 72% | 72% | 71% | 70% | |||||
Adjusted EBITDA margin | 70% | 72% | 72% | 69% | 69% | |||||
Adjusted EBITDA – quarter annualized | $2,219,632 | $2,216,144 | $2,206,428 | $2,094,988 | $1,971,440 | |||||
Adjusted EBITDA – trailing 12 months | $2,184,298 | $2,122,250 | $2,064,904 | $1,997,518 | $1,935,505 | |||||
Net debt at end of period | $12,191,574 | $11,940,144 | $11,569,666 | $10,731,200 | $10,713,620 | |||||
Net debt and preferred stock to Adjusted EBITDA – quarter annualized | 5.5x | 5.4x | 5.2x | 5.1x | 5.4x | |||||
Net debt and preferred stock to Adjusted EBITDA – trailing 12 months | 5.6x | 5.6x | 5.6x | 5.4x | 5.5x | |||||
Total debt and preferred stock at end of period | $12,691,601 | $12,424,055 | $12,217,163 | $11,315,642 | $11,202,835 | |||||
Gross assets at end of period | $44,112,770 | $43,305,279 | $42,915,903 | $41,756,421 | $41,639,729 | |||||
Total debt and preferred stock to gross assets at end of period | 29% | 29% | 28% | 27% | 27% | |||||
Fixed-charge coverage ratio – quarter annualized | 4.4x | 4.5x | 4.7x | 4.5x | 4.8x | |||||
Fixed-charge coverage ratio – trailing 12 months | 4.5x | 4.6x | 4.7x | 4.7x | 4.9x | |||||
Unencumbered net operating income as a percentage of total net operating income | 99.1% | 99.1% | 99.3% | 99.8% | 99.8% | |||||
Closing stock price at end of period | $118.75 | $116.97 | $128.91 | $126.77 | $100.10 | |||||
Common shares outstanding (in thousands) at end of period | 172,244 | 172,018 | 172,008 | 171,911 | 170,997 | |||||
Total equity capitalization at end of period | $20,454,023 | $20,120,907 | $22,173,547 | $21,793,107 | $17,116,784 | |||||
Total market capitalization at end of period | $33,145,624 | $32,544,962 | $34,390,710 | $33,108,749 | $28,319,619 | |||||
Dividend per share – quarter/annualized | $1.30/$5.20 | $1.30/$5.20 | $1.27/$5.08 | $1.27/$5.08 | $1.24/$4.96 | |||||
Dividend payout ratio for the quarter | 55% | 55% | 54% | 56% | 55% | |||||
Dividend yield – annualized | 4.4% | 4.4% | 3.9% | 4.0% | 5.0% | |||||
Amounts related to operating leases: | ||||||||||
Operating lease liabilities at end of period | $648,338 | (1) | $379,223 | $381,578 | $382,883 | $384,958 | ||||
Rent expense | $10,180 | $9,412 | $8,683 | $8,964 | $8,317 | |||||
Capitalized interest | $86,496 | $81,039 | $81,840 | $89,115 | $96,119 | |||||
Average real estate basis capitalized during the period | $8,281,318 | $7,936,612 | $8,163,289 | $9,116,700 | $9,872,650 | |||||
Weighted-average interest rate for capitalization of interest during the period | 3.98% | 3.96% | 3.92% | 3.92% | 3.77% | |||||
Refer to “Definitions and reconciliations” in the Supplemental Information for additional details. (1)Includes a ground lease liability related to an amendment to our existing ground lease agreement at the Alexandria Technology Square® mega campus in our Cambridge submarket, which extended its term by 24 years from January 1, 2065 to December 31, 2088. The amendment requires that we prepay our entire rent obligation for the extended lease term aggregating $270.0 million in two equal installments in 4Q24 and 1Q25. Upon the execution of the amendment in July 2024, we recognized the present value of our rent obligation aggregating $265.1 million related to the amendment as an operating lease liability. | ||||||||||
Alexandria Real Estate Equities, Inc. All Rights Reserved. © 2024 | 17 |
Financial and Asset Base Highlights (continued) | |
September 30, 2024 | |
(Dollars in thousands, except annual rental revenue per occupied RSF amounts) | |
Three Months Ended (unless stated otherwise) | ||||||||||
9/30/24 | 6/30/24 | 3/31/24 | 12/31/23 | 9/30/23 | ||||||
Amounts included in funds from operations and non-revenue-enhancing capital expenditures | ||||||||||
Straight-line rent revenue | $29,087 | $48,338 | $48,251 | $41,586 | $29,805 | |||||
Amortization of acquired below-market leases | $17,312 | $22,515 | $30,340 | $23,684 | $23,222 | |||||
Amortization of deferred revenue related to tenant-funded and -built landlord improvements | $329 | $— | $— | $— | $— | |||||
Straight-line rent expense on ground leases | $789 | $341 | $358 | $366 | $372 | |||||
Stock compensation expense | $15,525 | $14,507 | $17,125 | $34,592 | $16,288 | |||||
Amortization of loan fees | $4,222 | $4,146 | $4,142 | $4,059 | $4,059 | |||||
Amortization of debt discounts | $330 | $328 | $318 | $309 | $306 | |||||
Non-revenue-enhancing capital expenditures: | ||||||||||
Building improvements | $4,270 | $4,210 | $4,293 | $4,167 | $4,510 | |||||
Tenant improvements and leasing commissions | $55,920 | (1) | $15,724 | $21,144 | $12,155 | $7,560 | ||||
Funds from operations attributable to noncontrolling interests | $78,113 | $78,711 | $79,535 | $75,908 | $72,799 | |||||
Operating statistics and related information (at end of period) | ||||||||||
Number of properties – North America | 406 | 408 | 410 | 411 | 419 | |||||
RSF – North America (including development and redevelopment projects under construction) | 46,748,734 | 47,085,993 | 47,206,639 | 47,228,485 | 47,089,826 | |||||
Total square feet – North America | 73,611,815 | 74,103,404 | 74,069,321 | 73,532,305 | 75,057,289 | |||||
Annual rental revenue per occupied RSF – North America | $57.09 | $56.87 | $56.86 | $56.08 | $53.34 | |||||
Occupancy of operating properties – North America | 94.7% | 94.6% | 94.6% | 94.6% | 93.7% | |||||
Occupancy of operating and redevelopment properties – North America | 89.7% | 89.9% | 90.2% | 90.2% | 89.4% | |||||
Weighted-average remaining lease term (in years) | 7.5 | 7.4 | 7.5 | 7.4 | 7.0 | |||||
Total leasing activity – RSF | 1,486,097 | 1,114,001 | 1,142,857 | 889,737 | 867,582 | |||||
Lease renewals and re-leasing of space – change in average new rental rates over expiring rates: | ||||||||||
Rental rate changes | 5.1% | 7.4% | 33.0% | 9.2% | 28.8% | |||||
Rental rate changes (cash basis) | 1.5% | 3.7% | 19.0% | 5.5% | 19.7% | |||||
RSF (included in total leasing activity above) | 1,278,857 | 589,650 | 994,770 | 477,142 | 396,334 | |||||
Top 20 tenants: | ||||||||||
Annual rental revenue | $796,898 | $805,751 | $802,605 | $769,066 | $655,990 | |||||
Annual rental revenue from investment-grade or publicly traded large cap tenants | 92% | 92% | 92% | 92% | 91% | |||||
Weighted-average remaining lease term (in years) | 9.5 | 9.4 | 9.7 | 9.6 | 8.9 | |||||
Same property – percentage change over comparable quarter from prior year: | ||||||||||
Net operating income changes | 1.5% | 1.5% | 1.0% | 0.7% | 3.1% | |||||
Net operating income changes (cash basis) | 6.5% | 3.9% | 4.2% | 0.8% | 4.6% | |||||
Refer to “Definitions and reconciliations” in the Supplemental Information for additional details.
(1)Includes tenant improvements and leasing commissions related to a 10.5-year extension of a recently acquired lease aggregating 85,019 RSF in our Fenway submarket to an investment-grade rated academic institution. Excluding
this extension, tenant improvements and leasing commissions for the three months ended September 30, 2024 aggregated $39.6 million, which approximates our trailing five-year quarterly average of $38.2 million. Refer to
“Leasing Activity” in the Supplemental Information for additional details.
Alexandria Real Estate Equities, Inc. All Rights Reserved. © 2024 | 18 |
| |
High-Quality and Diverse Client Base | |
September 30, 2024 | |
Stable Cash Flows From Our High-Quality and Diverse Mix of Approximately 800 Tenants | ||||
Investment-Grade or Publicly Traded Large Cap Tenants | ||||
92% | ||||
of ARE’s Top 20 Tenant Annual Rental Revenue | ||||
53% | ||||
Percentage of ARE’s Annual Rental Revenue | of ARE’s Annual Rental Revenue | |||
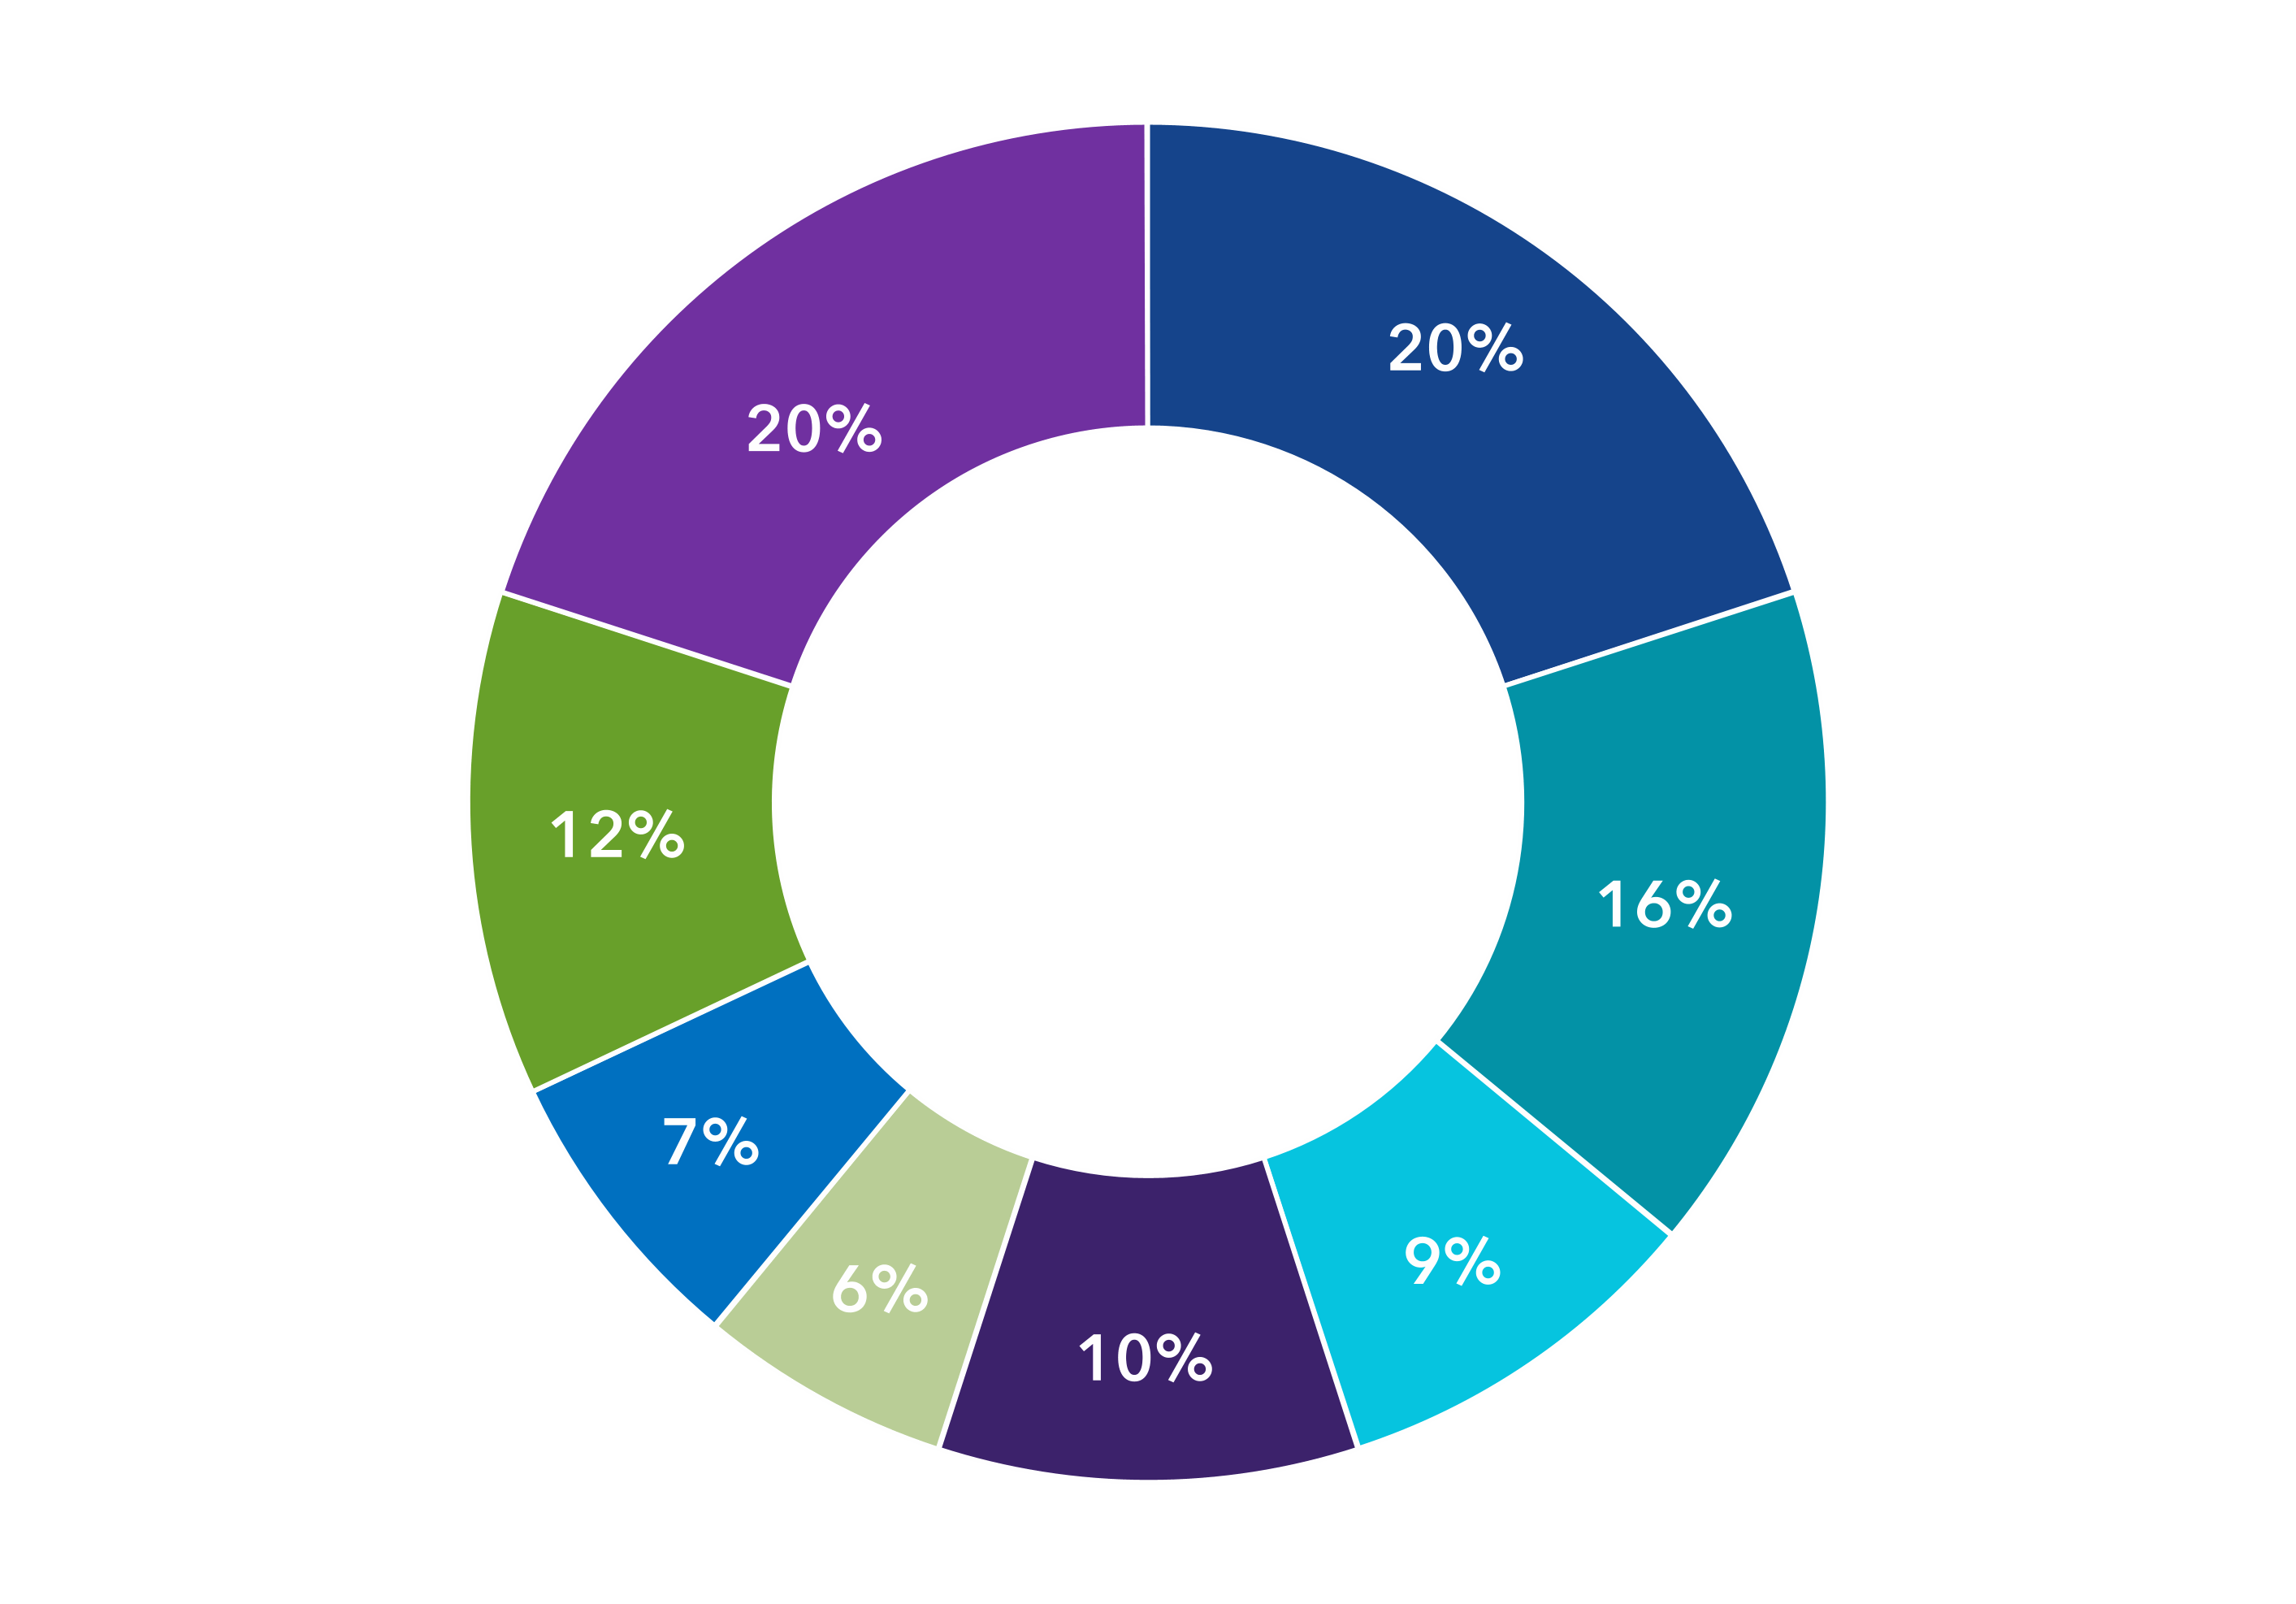
Life Science
Product,
Service, and
Device
Multinational
Pharmaceutical
Public
Biotechnology –
Approved or
Marketed
Product
Public
Biotechnology –
Preclinical or
Clinical Stage
Private
Biotechnology
Other(1)
Other Investment-Grade
or Large Cap Tech
Biomedical and
Government
Institutions
As of September 30, 2024. Annual rental revenue represents amounts in effect as of September 30, 2024. Refer to “Definitions and reconciliations” in the Supplemental Information for additional details, including our methodology of calculating
annual rental revenue from unconsolidated real estate joint ventures.
(1)Represents the percentage of our annual rental revenue generated by technology, professional services, finance, telecommunications, and construction/real estate companies, as well as retail-related tenants, which generate less than
1.0% of our annual rental revenue.
Alexandria Real Estate Equities, Inc. All Rights Reserved. © 2024 | 19 |
| |
High-Quality and Diverse Client Base (continued) | |
September 30, 2024 | |
Long-Duration and Stable Cash Flows From
High-Quality and Diverse Tenants
Sustained Strength in Tenant Collections(1) | ||||
99.9% | 99.6% | |||
3Q24 | October 2024 | |||
Long-Duration Lease Terms | ||||
9.5 Years | 7.5 Years | |||
Top 20 Tenants | All Tenants | |||
Weighted-Average Remaining Term(2) | ||||
(1)Represents the portion of total receivables billed for each period collected as of October 21, 2024.
(2)Based on annual rental revenue in effect as of September 30, 2024.
Alexandria Real Estate Equities, Inc. All Rights Reserved. © 2024 | 20 |
| |
Occupancy | |
September 30, 2024 | |
Solid Historical Occupancy of 96% Over Past 10 Years(1) From
Historically Strong Demand for Our Class A/A+ Properties in AAA Locations
Mega Campuses | Occupancy Across Key Locations | |||
Percentage of ARE’s Annual Rental Revenue | ||||
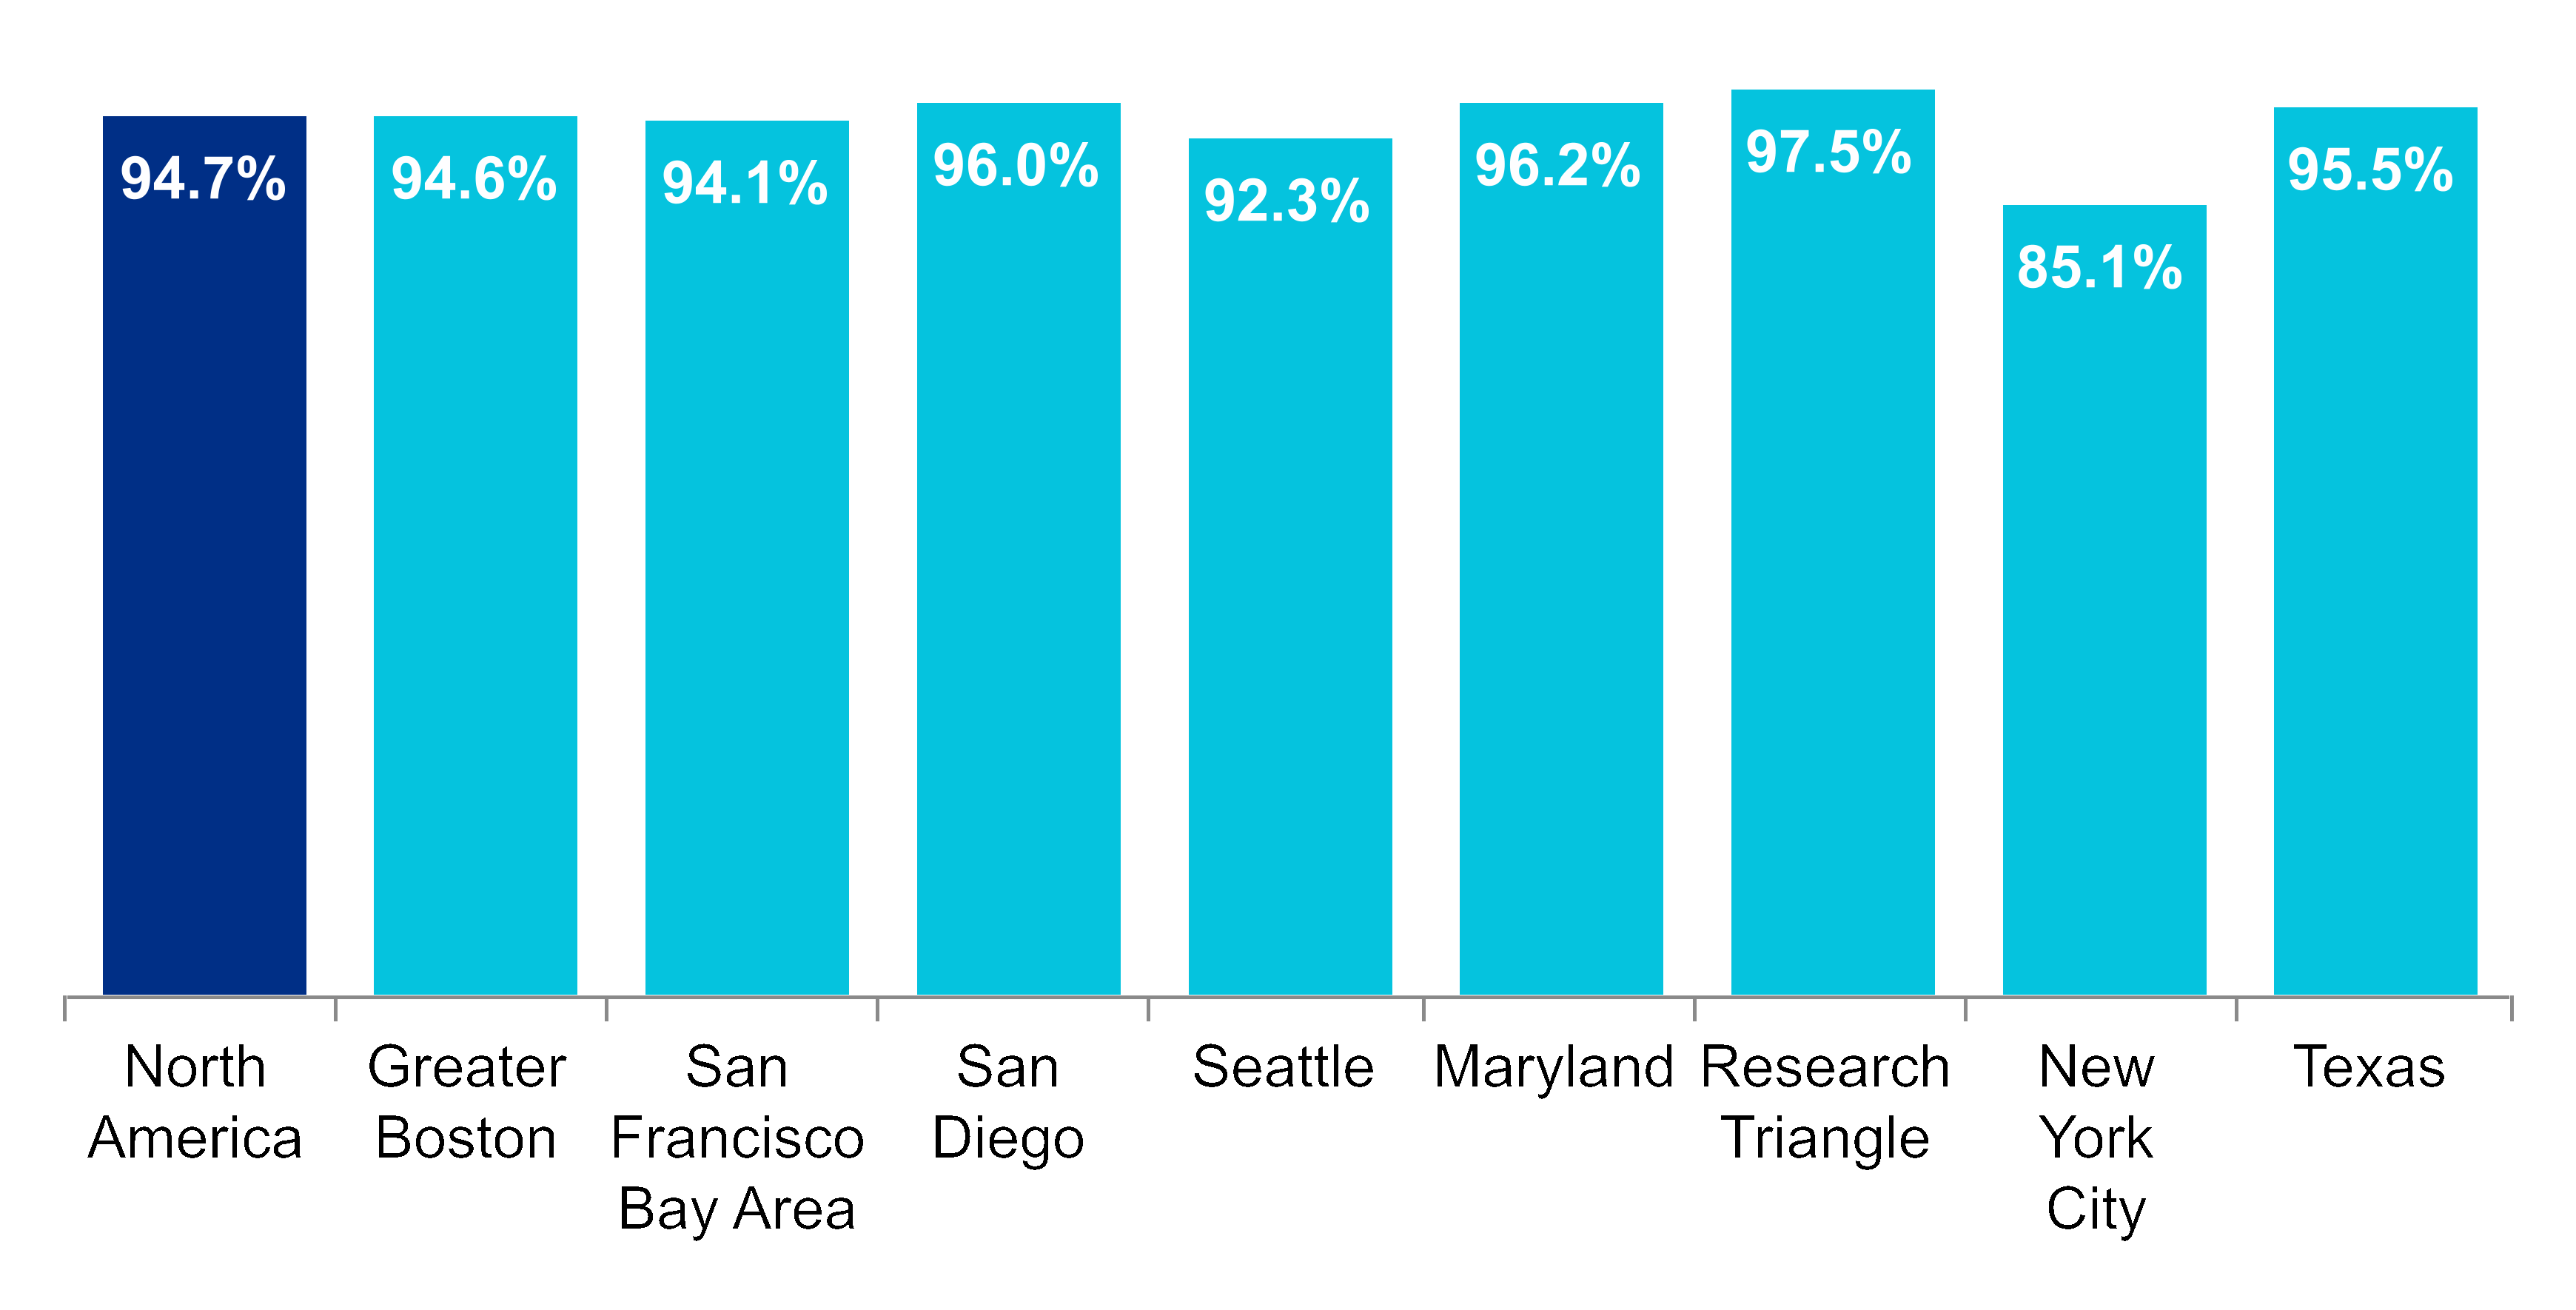
(2)

76%
Mega
Campuses
24%
Non-Mega
Campuses
As of September 30, 2024. Annual rental revenue represents amounts in effect as of September 30, 2024. Refer to “Definitions and reconciliations” in the Supplemental Information for additional details.
(1)Represents average occupancy of operating properties as of each December 31 from 2015 through 2023 and as of September 30, 2024.
(2)Refer to footnote 1 under “Summary of occupancy” in “Summary of properties and occupancy” in the Supplemental Information for additional details.
Alexandria Real Estate Equities, Inc. All Rights Reserved. © 2024 | 21 |
| |
Key Operating Metrics | |
September 30, 2024 | |
Same Property Net Operating Income Growth | Rental Rate Growth: Renewed/Re-Leased Space | ||||||||||
Margins(1) | Favorable Lease Structure(2) | ||||||||||
Operating | Adjusted EBITDA | Strategic Lease Structure by Owner and Operator of Collaborative Mega Campuses | |||||||||
71% | 70% | Increasing cash flows | |||||||||
Percentage of leases containing annual rent escalations | 96% | ||||||||||
Stable cash flows | |||||||||||
Weighted-Average Lease Term of Executed Leases(3) | Percentage of triple net leases | 93% | |||||||||
8.8 Years | Lower capex burden | ||||||||||
Percentage of leases providing for the recapture of capital expenditures | 92% | ||||||||||
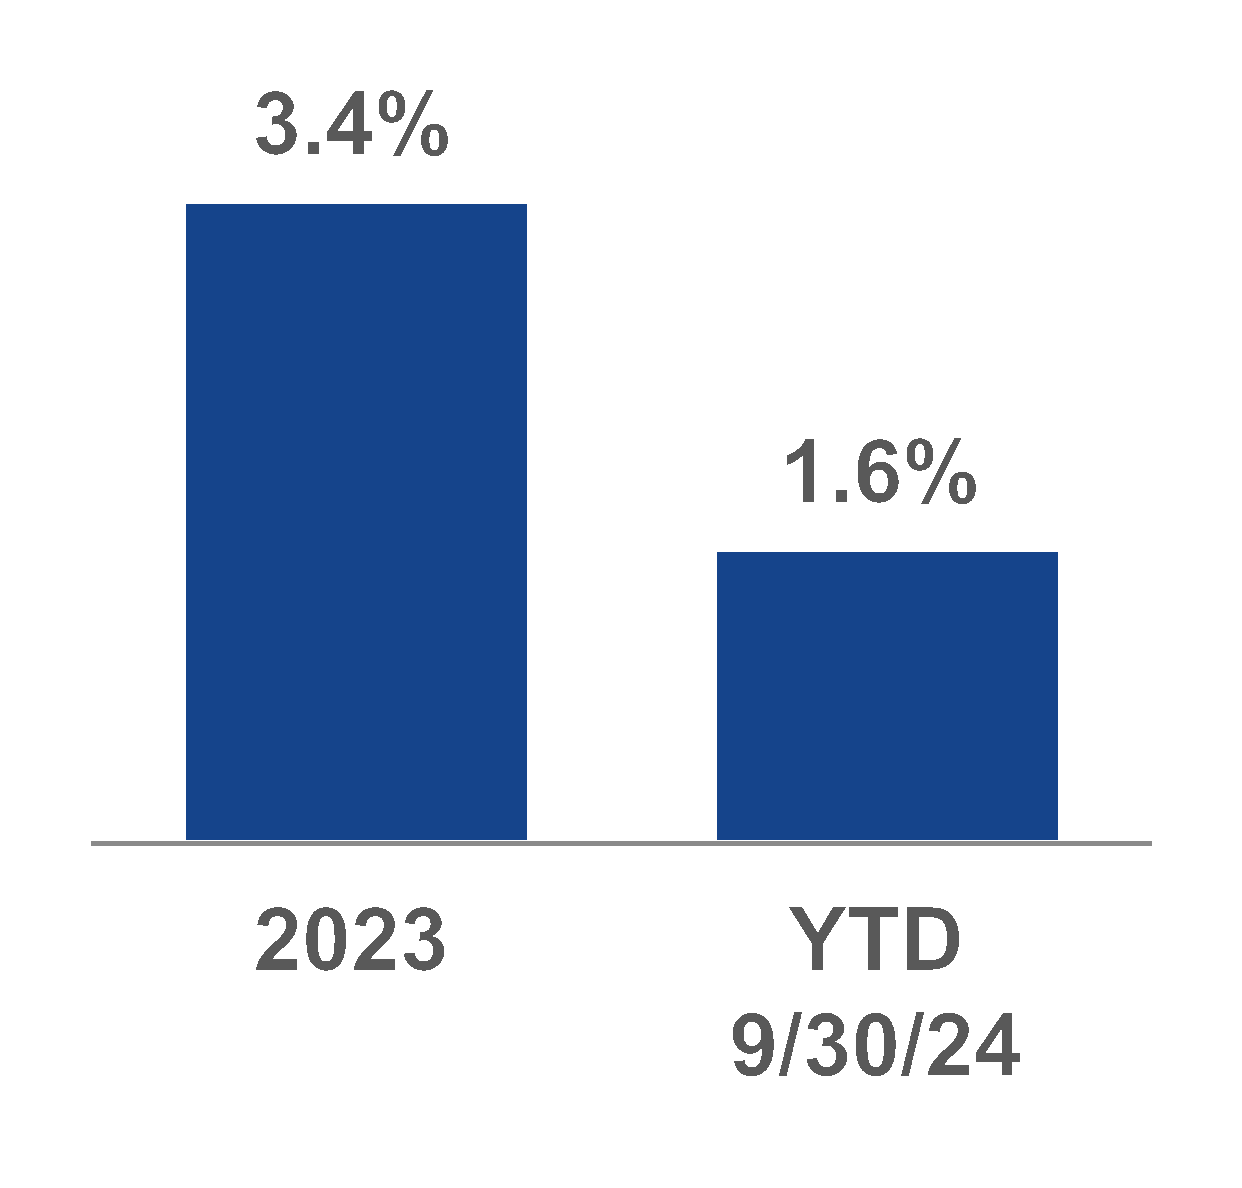
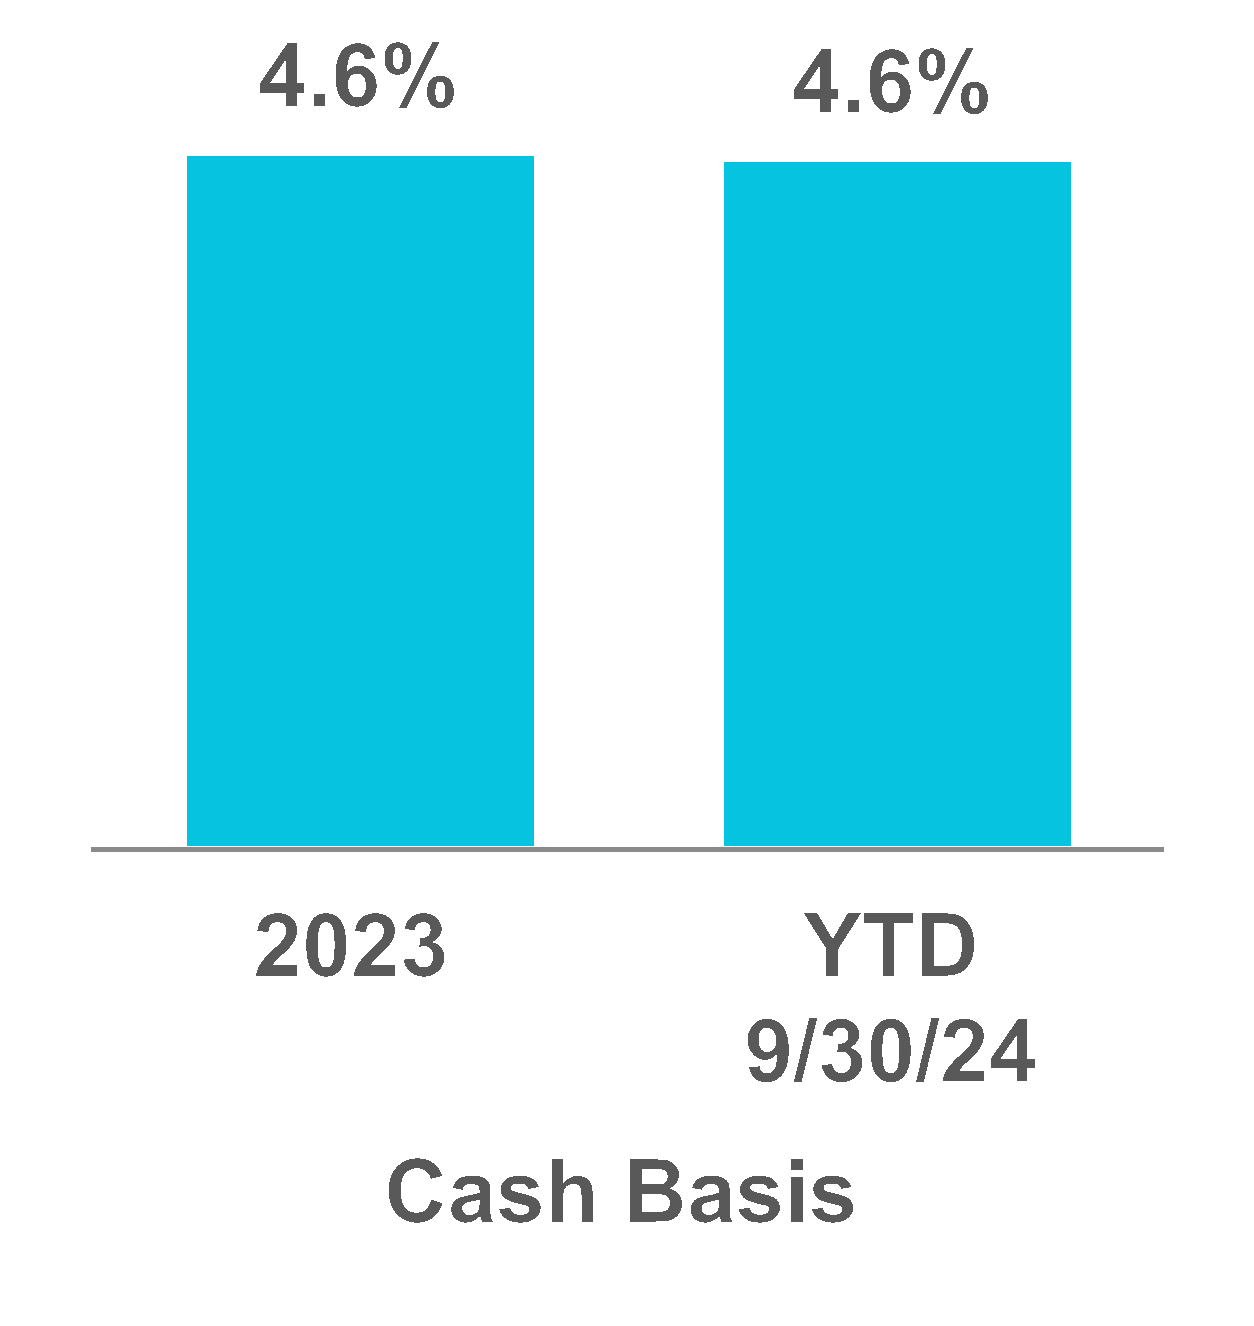
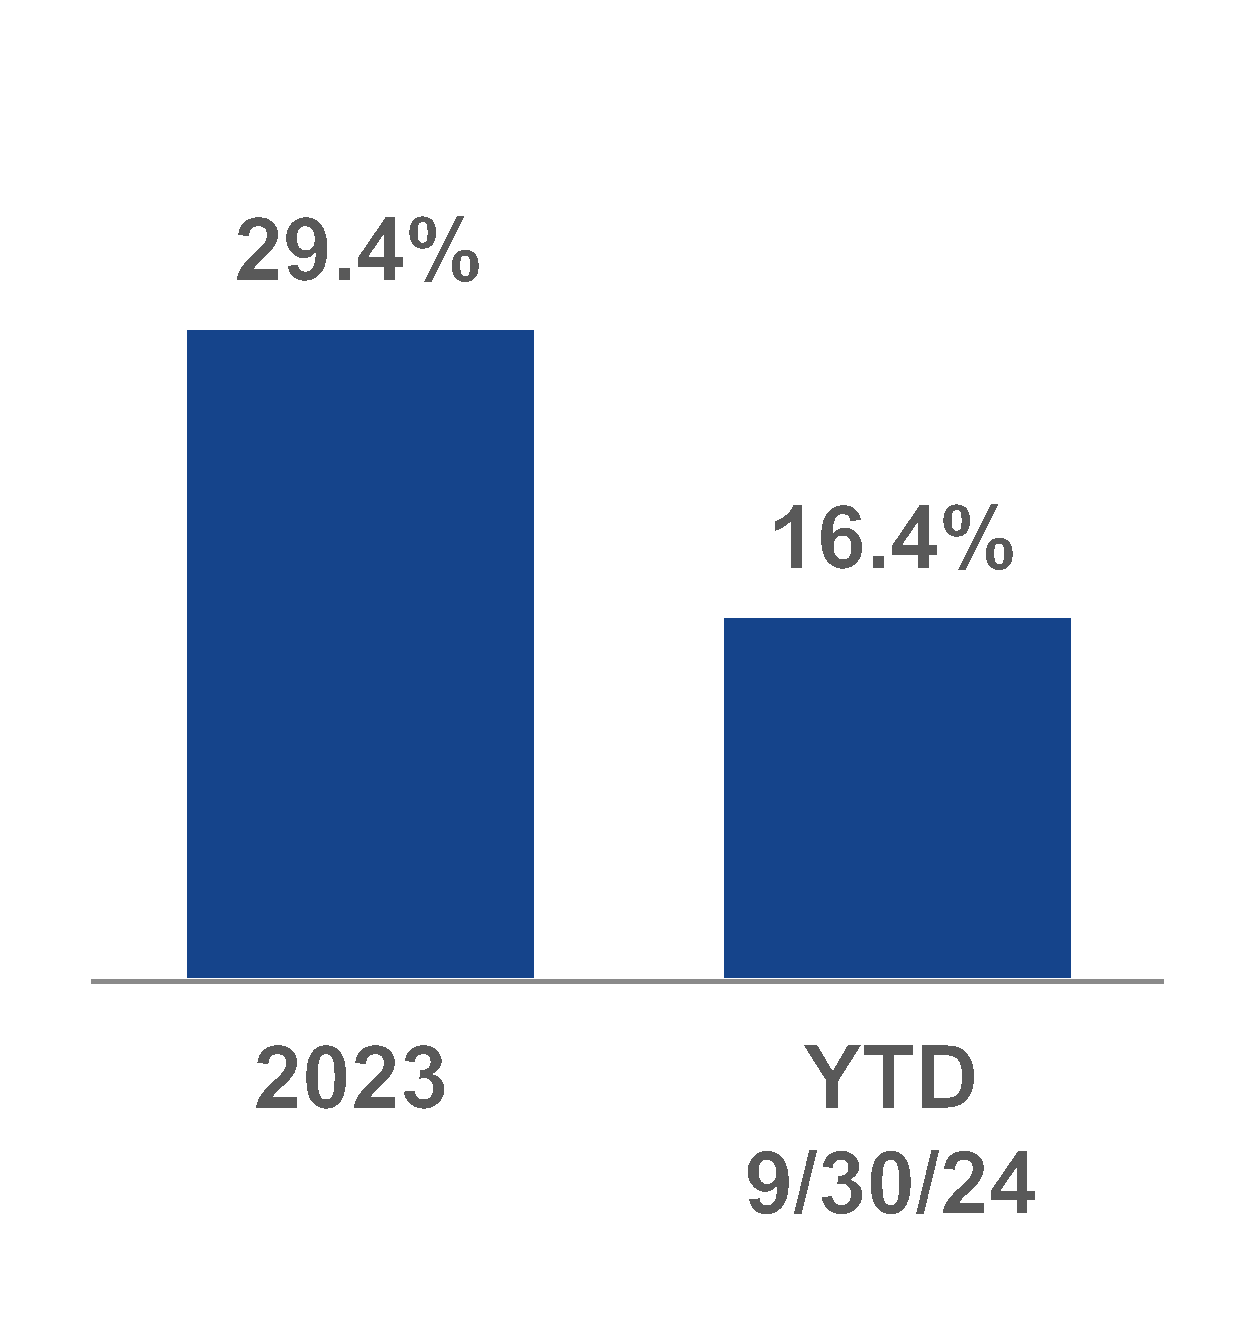
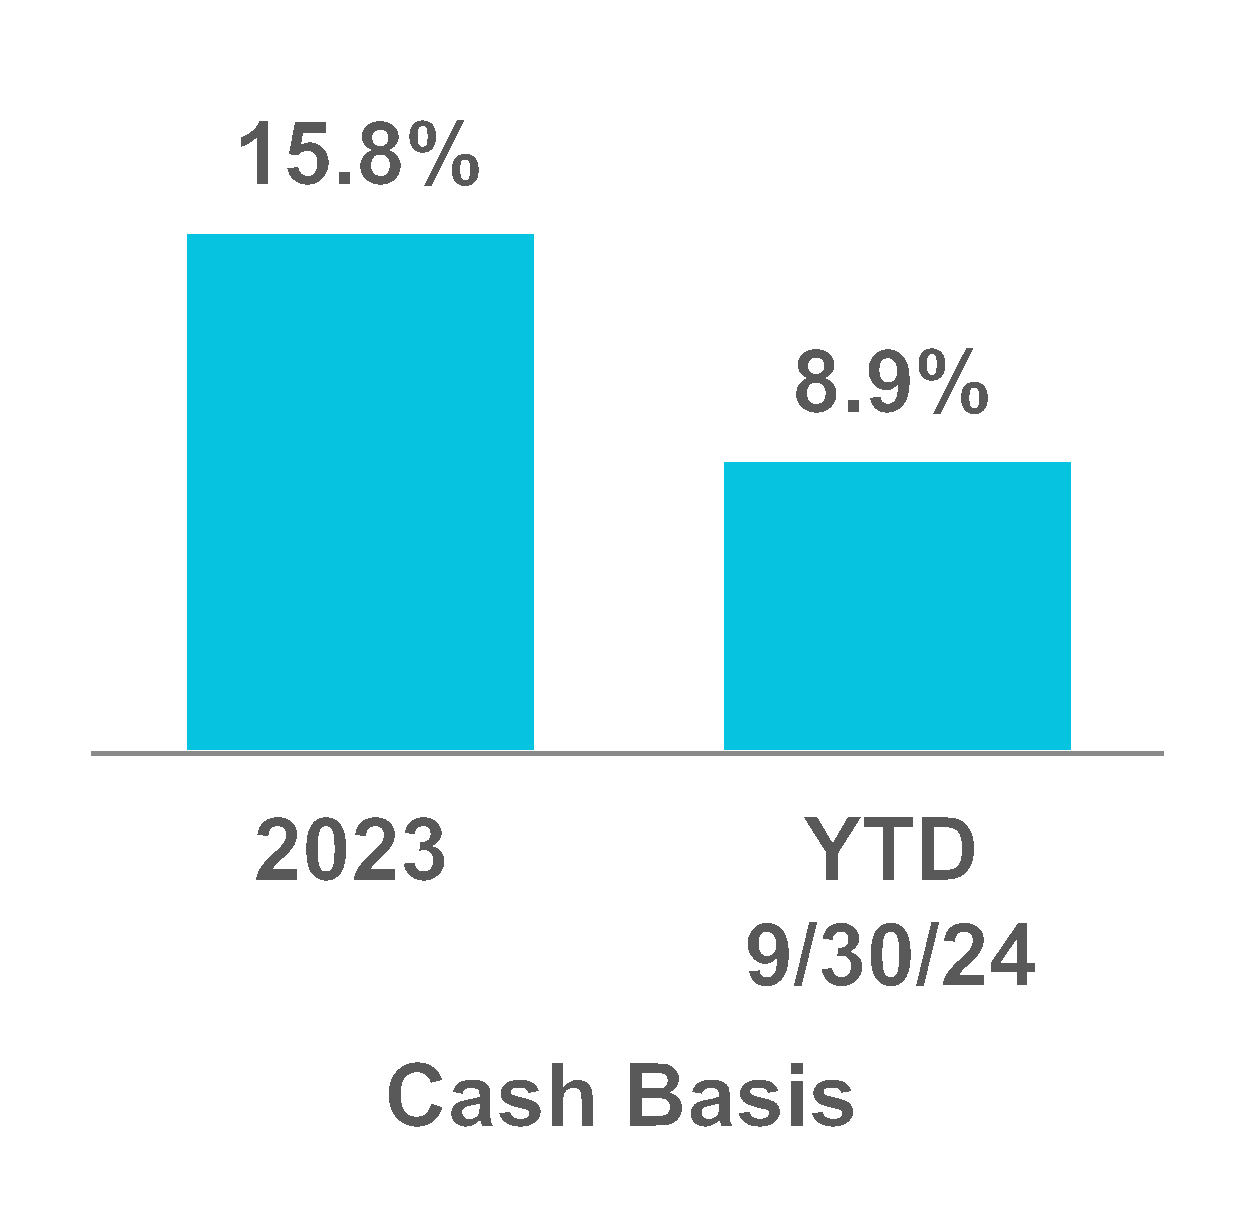
Refer to “Same property performance” and “Definitions and reconciliations” in the Supplemental Information for additional details. “Definitions and reconciliations” contains the definition of “Net operating income” and its reconciliation
from the most directly comparable financial measure presented in accordance with GAAP.
(1)For the three months ended September 30, 2024.
(2)Percentages calculated based on our annual rental revenue in effect as of September 30, 2024.
(3)Represents the weighted-average lease term of executed leases based on annual rental revenue for the 10-year period from December 31, 2015 through September 30, 2024.
Alexandria Real Estate Equities, Inc. All Rights Reserved. © 2024 | 22 |
Same Property Performance | |
September 30, 2024 | |
(Dollars in thousands) | |
September 30, 2024 | September 30, 2024 | |||||||||
Same Property Financial Data | Three Months Ended | Nine Months Ended | Same Property Statistical Data | Three Months Ended | Nine Months Ended | |||||
Percentage change over comparable period from prior year: | Number of same properties | 344 | 339 | |||||||
Net operating income changes | 1.5% | 1.6% | Rentable square feet | 34,652,674 | 33,720,609 | |||||
Net operating income changes (cash basis) | 6.5% | 4.6% | Occupancy – current-period average | 94.8% | 94.4% | |||||
Operating margin | 68% | 69% | Occupancy – same-period prior-year average | 94.1% | 94.3% | |||||
Three Months Ended September 30, | Nine Months Ended September 30, | ||||||||||||||||
2024 | 2023 | $ Change | % Change | 2024 | 2023 | $ Change | % Change | ||||||||||
Income from rentals: | |||||||||||||||||
Same properties | $452,417 | $439,541 | $12,876 | 2.9% | $1,342,463 | $1,307,866 | $34,597 | 2.6% | |||||||||
Non-same properties | 127,152 | 86,811 | 40,341 | 46.5 | 395,341 | 274,677 | 120,664 | 43.9 | |||||||||
Rental revenues | 579,569 | 526,352 | 53,217 | 10.1 | 1,737,804 | 1,582,543 | 155,261 | 9.8 | |||||||||
Same properties | 168,923 | 165,226 | 3,697 | 2.2 | 473,061 | 461,555 | 11,506 | 2.5 | |||||||||
Non-same properties | 27,252 | 15,953 | 11,299 | 70.8 | 75,592 | 55,721 | 19,871 | 35.7 | |||||||||
Tenant recoveries | 196,175 | 181,179 | 14,996 | 8.3 | 548,653 | 517,276 | 31,377 | 6.1 | |||||||||
Income from rentals | 775,744 | 707,531 | 68,213 | 9.6 | 2,286,457 | 2,099,819 | 186,638 | 8.9 | |||||||||
Same properties | 386 | 619 | (233) | (37.6) | 1,102 | 1,356 | (254) | (18.7) | |||||||||
Non-same properties | 15,477 | 5,638 | 9,839 | 174.5 | 39,890 | 27,308 | 12,582 | 46.1 | |||||||||
Other income | 15,863 | 6,257 | 9,606 | 153.5 | 40,992 | 28,664 | 12,328 | 43.0 | |||||||||
Same properties | 621,726 | 605,386 | 16,340 | 2.7 | 1,816,626 | 1,770,777 | 45,849 | 2.6 | |||||||||
Non-same properties | 169,881 | 108,402 | 61,479 | 56.7 | 510,823 | 357,706 | 153,117 | 42.8 | |||||||||
Total revenues | 791,607 | 713,788 | 77,819 | 10.9 | 2,327,449 | 2,128,483 | 198,966 | 9.3 | |||||||||
Same properties | 199,369 | 189,368 | 10,001 | 5.3 | 559,427 | 532,942 | 26,485 | 5.0 | |||||||||
Non-same properties | 33,896 | 28,319 | 5,577 | 19.7 | 109,406 | 103,512 | 5,894 | 5.7 | |||||||||
Rental operations | 233,265 | 217,687 | 15,578 | 7.2 | 668,833 | 636,454 | 32,379 | 5.1 | |||||||||
Same properties | 422,357 | 416,018 | 6,339 | 1.5 | 1,257,199 | 1,237,835 | 19,364 | 1.6 | |||||||||
Non-same properties | 135,985 | 80,083 | 55,902 | 69.8 | 401,417 | 254,194 | 147,223 | 57.9 | |||||||||
Net operating income | $558,342 | $496,101 | $62,241 | 12.5% | $1,658,616 | $1,492,029 | $166,587 | 11.2% | |||||||||
Net operating income – same properties | $422,357 | $416,018 | $6,339 | 1.5% | $1,257,199 | $1,237,835 | $19,364 | 1.6% | |||||||||
Straight-line rent revenue | (4,974) | (23,981) | 19,007 | (79.3) | (37,251) | (73,626) | 36,375 | (49.4) | |||||||||
Amortization of acquired below-market leases | (14,582) | (13,792) | (790) | 5.7 | (44,993) | (40,410) | (4,583) | 11.3 | |||||||||
Net operating income – same properties (cash basis) | $402,801 | $378,245 | $24,556 | 6.5% | $1,174,955 | $1,123,799 | $51,156 | 4.6% | |||||||||
Refer to “Same property comparisons” under “Definitions and reconciliations” in the Supplemental Information for additional details, including a reconciliation of same properties to total properties. “Definitions and reconciliations” also
contains definitions of “Tenant recoveries” and “Net operating income” and their respective reconciliations from the most directly comparable financial measures presented in accordance with GAAP.
Alexandria Real Estate Equities, Inc. All Rights Reserved. © 2024 | 23 |
Leasing Activity | |
September 30, 2024 | |
(Dollars per RSF) | |
Three Months Ended | Nine Months Ended | Year Ended | ||||||||||||||||||||||
September 30, 2024 | September 30, 2024 | December 31, 2023 | ||||||||||||||||||||||
Including Straight-Line Rent | Cash Basis | Including Straight-Line Rent | Cash Basis | Including Straight-Line Rent | Cash Basis | |||||||||||||||||||
Leasing activity: | ||||||||||||||||||||||||
Renewed/re-leased space(1) | ||||||||||||||||||||||||
Rental rate changes | 5.1% | (2) | 1.5% | (2) | 16.4% | 8.9% | 29.4% | 15.8% | ||||||||||||||||
New rates | $56.60 | $55.77 | $63.43 | $62.39 | $52.35 | $50.82 | ||||||||||||||||||
Expiring rates | $53.86 | $54.95 | $54.47 | $57.28 | $40.46 | $43.87 | ||||||||||||||||||
RSF | 1,278,857 | 2,863,277 | 3,046,386 | |||||||||||||||||||||
Tenant improvements/leasing commissions | $43.73 | (3) | $33.92 | (3) | $26.09 | |||||||||||||||||||
Weighted-average lease term | 9.7 years | 8.7 years | 8.7 years | |||||||||||||||||||||
Developed/redeveloped/previously vacant space leased(4) | ||||||||||||||||||||||||
New rates | $52.66 | $52.18 | $64.59 | $62.90 | $65.66 | $59.74 | ||||||||||||||||||
RSF | 207,240 | 879,678 | (5) | 1,259,686 | ||||||||||||||||||||
Weighted-average lease term | 10.6 years | 8.1 years | 13.8 years | |||||||||||||||||||||
Leasing activity summary (totals): | ||||||||||||||||||||||||
New rates | $56.05 | $55.27 | $63.69 | $62.50 | $56.09 | $53.33 | ||||||||||||||||||
RSF | 1,486,097 | 3,742,955 | 4,306,072 | |||||||||||||||||||||
Weighted-average lease term | 9.8 years | 8.6 years | 11.3 years | |||||||||||||||||||||
Lease expirations(1) | ||||||||||||||||||||||||
Expiring rates | $51.62 | $53.17 | $52.01 | $54.40 | $43.84 | $45.20 | ||||||||||||||||||
RSF | 1,500,213 | 3,801,559 | 5,027,773 | |||||||||||||||||||||
Leasing activity includes 100% of results for properties in North America in which we have an investment.
(1)Excludes month-to-month leases aggregating 355,698 RSF and 86,092 RSF as of September 30, 2024 and December 31, 2023, respectively. Month-to-month leases aggregating 355,698 RSF as of September 30, 2024
include 226,144 RSF in our University Town Center submarket primarily related to space being temporarily held over by an expiring tenant at buildings that are targeted for the future development of laboratory space,
subject to market conditions and leasing. During the trailing twelve months ended September 30, 2024, we granted free rent concessions averaging 0.7 months per annum.
(2)Includes a five-year lease extension to an investment-grade rated technology tenant aggregating 357,136 RSF of recently acquired tech R&D space in our Texas market that was renewed with rental rate changes of
(33.6)% and (4.8)% (cash basis). These spaces were originally targeted for a future change in use at acquisition, but we instead renewed them with a lower capital investment while we continue to evaluate options to
convert these spaces in the future, subject to market conditions. Excluding this lease, rental rate changes for renewed/re-leased space for 3Q24 were 13.0% and 2.3% (cash basis). Rental rate changes may experience
volatility from quarter to quarter based on the volume and mix of leases executed. Refer to “Guidance” in the Earnings Press Release for rental rate changes expected from leases executed for the year ending December
31, 2024.
(3)Includes tenant improvements and leasing commissions related to a 10.5-year extension of a recently acquired lease aggregating 85,019 RSF in our Fenway submarket to an investment-grade rated academic institution.
Excluding this lease, tenant improvements and leasing commissions per RSF for the three and nine months ended September 30, 2024 were $33.16 and $28.85, respectively, which are consistent with the five-year
quarterly average of $32.17 per RSF.
(4)Refer to “New Class A/A+ development and redevelopment properties: summary of pipeline” in the Supplemental Information for additional details, including total project costs.
(5)Includes the five-year extension of 171,102 RSF at our 4155 Campus Point Court property in San Diego, a fully leased development project expected to deliver in 4Q24.
Alexandria Real Estate Equities, Inc. All Rights Reserved. © 2024 | 24 |
| |
Contractual Lease Expirations | |
September 30, 2024 | |
Year | RSF | Percentage of Occupied RSF | Annual Rental Revenue (per RSF)(1) | Percentage of Annual Rental Revenue | |||||||||||||||
2024 | (2) | 518,665 | 1.4% | $69.19 | 1.7% | ||||||||||||||
2025 | 3,785,573 | 10.0% | $49.64 | 8.8% | |||||||||||||||
2026 | 2,714,170 | 7.1% | $53.21 | 6.7% | |||||||||||||||
2027 | 3,242,737 | 8.5% | $51.87 | 7.9% | |||||||||||||||
2028 | 4,332,150 | 11.4% | $51.78 | 10.5% | |||||||||||||||
2029 | 2,437,921 | 6.4% | $51.25 | 5.8% | |||||||||||||||
2030 | 3,135,445 | 8.3% | $43.25 | 6.3% | |||||||||||||||
2031 | 3,425,338 | 9.0% | $55.11 | 8.8% | |||||||||||||||
2032 | 1,093,311 | 2.9% | $59.53 | 3.0% | |||||||||||||||
2033 | 2,772,455 | 7.3% | $50.81 | 6.6% | |||||||||||||||
Thereafter | 10,541,840 | 27.7% | $68.66 | 33.9% | |||||||||||||||
Market | 2024 Contractual Lease Expirations (in RSF) | Annual Rental Revenue (per RSF)(1) | 2025 Contractual Lease Expirations (in RSF) | Annual Rental Revenue (per RSF)(1) | |||||||||||||||||||||||||||
Leased | Negotiating/ Anticipating | Targeted for Future Development/Redevelopment(3) | Remaining Expiring Leases | Total(2) | Leased | Negotiating/ Anticipating | Targeted for Future Development/ Redevelopment(3) | Remaining Expiring Leases(4) | Total | ||||||||||||||||||||||
Committed Near-Term/ Priority Anticipated | Future | ||||||||||||||||||||||||||||||
Greater Boston | 73,614 | 21,621 | — | 104,500 | 80,788 | (5) | 280,523 | $86.07 | 172,446 | 145,715 | 25,312 | 659,355 | (5) | 1,002,828 | $76.13 | ||||||||||||||||
San Francisco Bay Area | 12,847 | 13,943 | 107,250 | — | 14,682 | 148,722 | 49.58 | 72,162 | 247,827 | — | 547,092 | 867,081 | 51.33 | ||||||||||||||||||
San Diego | 27,119 | — | — | — | 17,408 | 44,527 | 55.30 | 83,546 | — | 269,048 | 260,627 | 613,221 | 22.98 | ||||||||||||||||||
Seattle | — | — | — | — | 3,652 | 3,652 | N/A | — | — | — | 196,419 | 196,419 | 25.10 | ||||||||||||||||||
Maryland | — | — | — | — | 182 | 182 | N/A | 35,055 | 6,926 | — | 151,958 | 193,939 | 27.51 | ||||||||||||||||||
Research Triangle | 10,478 | — | — | — | 8,202 | 18,680 | 28.31 | — | — | — | 306,916 | 306,916 | 51.16 | ||||||||||||||||||
New York City | — | — | — | — | 9,058 | 9,058 | 109.57 | — | 13,273 | — | 54,966 | 68,239 | 105.86 | ||||||||||||||||||
Texas | — | — | — | — | — | — | — | — | — | 198,972 | 247,246 | 446,218 | 40.09 | ||||||||||||||||||
Canada | 13,321 | — | — | — | — | 13,321 | 26.54 | — | — | — | 88,412 | 88,412 | 20.28 | ||||||||||||||||||
Non-cluster/other markets | — | — | — | — | — | — | — | — | — | — | 2,300 | 2,300 | 40.17 | ||||||||||||||||||
Total | 137,379 | 35,564 | 107,250 | 104,500 | 133,972 | 518,665 | $69.19 | 363,209 | 413,741 | 493,332 | (3) | 2,515,291 | 3,785,573 | $49.64 | |||||||||||||||||
Percentage of expiring leases | 26% | 7% | 21% | 20% | 26% | 100% | 10% | 11% | 13% | 66% | 100% | ||||||||||||||||||||
Contractual lease expirations at properties classified as held for sale as of September 30, 2024 are excluded from the information on this page.
(1)Represents amounts in effect as of September 30, 2024.
(2)Excludes month-to-month leases aggregating 355,698 RSF as of September 30, 2024. Refer to “Leasing Activity” in the Supplemental Information for additional details.
(3)Primarily represents assets that were recently acquired for future development and redevelopment opportunities, for which we expect, subject to market conditions and leasing, to commence first-time conversion from non-laboratory space
to laboratory space, or to commence future ground-up development. As of September 30, 2024, annual rental revenue from these leases expiring in 2024, including 226,144 RSF of month-to-month leases in our University Town Center
submarket primarily related to space being temporarily held over by an expiring tenant, and 2025 is $20.9 million and $17.5 million, respectively. The weighted-average expiration date of these leases expiring in 2024 and 2025 is
October 20, 2024 and January 10, 2025, respectively. Refer to “Investments in real estate” under “Definitions and reconciliations” in the Supplemental Information for additional details, including development and redevelopment square
feet currently included in rental properties.
(4)Includes 768,080 RSF in four submarkets with a weighted-average expiration date of January 21, 2025 and annual rental revenue aggregating approximately $47 million, with our share of this annual rental revenue aggregating
$35 million, comprising the following: (i) existing laboratory spaces for which we are evaluating options to re-lease or reposition from single tenancy to multi-tenancy that will remain in our same property pool at Alexandria Technology
Square® in our Cambridge submarket for 182,054 RSF and at 409 Illinois Street, where we have an ownership interest of 25.0%, in our Mission Bay submarket for 234,249 RSF (we are in early discussions with a tenant to lease
approximately 50% of this space); and (ii) non-laboratory space for which we are evaluating options to re-lease generally in their current condition, reposition, or, subject to market conditions, may undergo a conversion through
redevelopment in our Austin submarket for 247,246 RSF and in our Research Triangle market for 104,531 RSF. Should we commence redevelopment efforts, these properties would be placed into our active pipeline and removed from our
same property pool; otherwise, they would remain in our same property pool. We expect downtime on the 768,080 RSF to range from 12 to 24 months on a weighted-average basis.
(5)Includes 41,908 RSF and 210,868 RSF expiring in 2024 and 2025, respectively, related to properties that are under executed letters of intent and/or purchase and sale agreements to sell. Approximately 95% of the 2025 remaining
expiring leases in Greater Boston are located in our Cambridge/Inner Suburbs submarket. Refer to footnote 4 for additional details.
Alexandria Real Estate Equities, Inc. All Rights Reserved. © 2024 | 25 |
Top 20 Tenants | |
September 30, 2024 | |
(Dollars in thousands, except average market cap amounts) | |
92% of Top 20 Tenant Annual Rental Revenue Is From Investment-Grade
or Publicly Traded Large Cap Tenants(1)
Tenant | Remaining Lease Term(1) (in years) | Aggregate RSF | Annual Rental Revenue(1) | Percentage of Annual Rental Revenue(1) | Investment-Grade Credit Ratings | Average Market Cap (in billions) | |||||||||||||||||
Moody’s | S&P | ||||||||||||||||||||||
1 | Moderna, Inc. | 12.6 | 1,385,678 | $127,387 | 5.8% | — | — | $38.6 | |||||||||||||||
2 | Eli Lilly and Company | 8.2 | 1,166,754 | 94,814 | 4.3 | A1 | A+ | $712.4 | |||||||||||||||
3 | Bristol-Myers Squibb Company | 6.4 | 999,379 | 76,363 | 3.5 | A2 | A | $99.1 | |||||||||||||||
4 | Takeda Pharmaceutical Company Limited | 10.7 | 549,759 | 47,899 | 2.2 | Baa1 | BBB+ | $44.5 | |||||||||||||||
5 | Roche | 6.7 | 770,279 | 47,104 | 2.2 | Aa2 | AA | $227.8 | |||||||||||||||
6 | Illumina, Inc. | 7.4 | 857,967 | 35,362 | 1.6 | Baa3 | BBB | $19.7 | |||||||||||||||
7 | Alphabet Inc. | 3.1 | 625,015 | 34,899 | 1.6 | Aa2 | AA+ | $1,916.3 | |||||||||||||||
8 | 2seventy bio, Inc.(2) | 8.9 | 312,805 | 33,543 | 1.5 | — | — | $0.2 | |||||||||||||||
9 | Novartis AG | 3.8 | 450,664 | 30,969 | 1.4 | Aa3 | AA- | $231.8 | |||||||||||||||
10 | United States Government | 5.9 | 429,359 | 28,593 | 1.3 | Aaa | AA+ | $— | |||||||||||||||
11 | Cloud Software Group, Inc. | 2.4 | (3) | 292,013 | 28,537 | 1.3 | — | — | $— | ||||||||||||||
12 | Uber Technologies, Inc. | 58.0 | (4) | 1,009,188 | 27,776 | 1.3 | Baa2 | BBB- | $137.1 | ||||||||||||||
13 | AstraZeneca PLC | 5.1 | 450,848 | 27,156 | 1.2 | A2 | A+ | $222.8 | |||||||||||||||
14 | Harvard University | 7.2 | 343,858 | 27,084 | 1.2 | Aaa | AAA | $— | |||||||||||||||
15 | The Regents of the University of California | 6.6 | 372,647 | 23,670 | 1.1 | Aa2 | AA | $— | |||||||||||||||
16 | Sanofi | 6.3 | 267,278 | 21,444 | 1.0 | A1 | AA | $126.6 | |||||||||||||||
17 | Merck & Co., Inc. | 8.8 | 337,703 | 21,401 | 1.0 | A1 | A+ | $300.8 | |||||||||||||||
18 | Amgen Inc. | 8.3 | 428,227 | 21,314 | 1.0 | Baa1 | BBB+ | $159.2 | |||||||||||||||
19 | New York University | 7.4 | 218,983 | 21,056 | 1.0 | Aa2 | AA- | $— | |||||||||||||||
20 | Massachusetts Institute of Technology | 4.7 | 246,725 | 20,527 | 0.9 | Aaa | AAA | $— | |||||||||||||||
Total/weighted-average | 9.5 | (4) | 11,515,129 | $796,898 | 36.4% | ||||||||||||||||||
Annual rental revenue and RSF include 100% of each property managed by us in North America. Refer to “Annual rental revenue” and “Investment-grade or publicly traded large cap tenants” under “Definitions and reconciliations” in the
Supplemental Information for additional details, including our methodology of calculating annual rental revenue from unconsolidated real estate joint ventures and average market capitalization, respectively.
(1)Based on annual rental revenue in effect as of September 30, 2024.
(2)As of June 30, 2024, 2seventy bio, Inc. held $201.9 million of cash, cash equivalents, and marketable securities. In March 2024, Regeneron Pharmaceuticals, Inc., a publicly traded biotechnology company with investment-grade credit
ratings of Baa1 and BBB+ assigned by Moody’s and S&P, respectively, entered into a sublease for approximately 195,000 RSF, or 62.8% of our annual rental revenue generated from 2seventy bio as of September 30, 2024. Additionally,
90.2% of the annual rental revenue generated by 2seventy bio is guaranteed by another related public biotechnology company.
(3)Consists of one lease at a property acquired in 2022 with future development and redevelopment opportunities. This lease with Cloud Software Group, Inc. (formerly known as TIBCO Software, Inc.) was in place when we acquired the
property.
(4)Includes (i) ground leases for land at 1455 and 1515 Third Street (two buildings aggregating 422,980 RSF) and (ii) leases at 1655 and 1725 Third Street (two buildings aggregating 586,208 RSF) in our Mission Bay submarket owned by our
unconsolidated real estate joint venture in which we have an ownership interest of 10%. Annual rental revenue is presented using 100% of the annual rental revenue from our consolidated properties and our share of annual rental revenue
from our unconsolidated real estate joint ventures. Excluding these ground leases, the weighted-average remaining lease term for our top 20 tenants was 7.8 years as of September 30, 2024.
Alexandria Real Estate Equities, Inc. All Rights Reserved. © 2024 | 26 |
Summary of Properties and Occupancy | |
September 30, 2024 | |
(Dollars in thousands, except per RSF amounts) | |
Summary of properties
Market | RSF | Number of Properties | Annual Rental Revenue | ||||||||||||||||
Operating | Development | Redevelopment | Total | % of Total | Total | % of Total | Per RSF | ||||||||||||
Greater Boston | 10,352,695 | 764,036 | 1,762,974 | (1) | 12,879,705 | 28% | 72 | $833,562 | 38% | $85.09 | |||||||||
San Francisco Bay Area | 7,784,590 | 498,142 | 259,689 | 8,542,421 | 18 | 65 | 432,102 | 20 | 63.54 | ||||||||||
San Diego | 7,673,315 | 1,186,104 | — | 8,859,419 | 19 | 87 | 330,596 | 15 | 44.90 | ||||||||||
Seattle | 3,108,593 | 227,577 | 34,306 | 3,370,476 | 7 | 45 | 137,044 | 6 | 47.78 | ||||||||||
Maryland | 3,819,512 | 29,890 | — | 3,849,402 | 8 | 50 | 145,847 | 7 | 40.12 | ||||||||||
Research Triangle | 3,770,927 | — | — | 3,770,927 | 8 | 38 | 116,318 | 5 | 31.64 | ||||||||||
New York City | 921,686 | — | — | 921,686 | 2 | 4 | 72,439 | 3 | 92.37 | ||||||||||
Texas | 1,845,159 | — | 73,298 | 1,918,457 | 4 | 15 | 54,958 | 3 | 31.19 | ||||||||||
Canada | 887,737 | — | 139,311 | 1,027,048 | 2 | 11 | 19,790 | 1 | 23.33 | ||||||||||
Non-cluster/other markets | 347,806 | — | — | 347,806 | 1 | 10 | 14,623 | 1 | 57.76 | ||||||||||
Properties held for sale | 1,261,387 | — | — | 1,261,387 | 3 | 9 | 26,796 | 1 | N/A | ||||||||||
North America | 41,773,407 | 2,705,749 | 2,269,578 | 46,748,734 | 100% | 406 | $2,184,075 | 100% | $57.09 | ||||||||||
4,975,327 | |||||||||||||||||||
(1)Primarily includes our active redevelopment projects aggregating 735,744 RSF at 40, 50, and 60 Sylvan Road and 840 Winter Street located on the Alexandria Center® for Life Science – Waltham mega campus. This
mega campus project is expected to capture demand in our Route 128 submarket.
Summary of occupancy
Operating Properties | Operating and Redevelopment Properties | |||||||||||
Market | 9/30/24 | 6/30/24 | 9/30/23 | 9/30/24 | 6/30/24 | 9/30/23 | ||||||
Greater Boston | 94.6% | 94.2% | 93.2% | 80.9% | 81.7% | 83.3% | ||||||
San Francisco Bay Area | 94.1 | 94.0 | 95.3 | 91.1 | 90.7 | 91.9 | ||||||
San Diego | 96.0 | 95.1 | 90.9 | 96.0 | 95.1 | 90.9 | ||||||
Seattle | 92.3 | (1) | 94.7 | 95.1 | 91.3 | 93.7 | 90.3 | |||||
Maryland | 96.2 | 96.5 | 96.6 | 96.2 | 96.5 | 96.6 | ||||||
Research Triangle | 97.5 | 97.4 | 96.9 | 97.5 | 97.4 | 96.9 | ||||||
New York City | 85.1 | (2) | 85.1 | 89.4 | 85.1 | 85.1 | 89.4 | |||||
Texas | 95.5 | 95.5 | 95.1 | 91.8 | 91.8 | 91.5 | ||||||
Subtotal | 94.9 | 94.7 | 93.9 | 90.0 | 90.2 | 89.9 | ||||||
Canada | 95.5 | 94.9 | 88.9 | 82.6 | 82.5 | 75.7 | ||||||
Non-cluster/other markets | 72.8 | 75.6 | 80.5 | 72.8 | 75.6 | 80.5 | ||||||
North America | 94.7% | 94.6% | 93.7% | 89.7% | 89.9% | 89.4% | ||||||
(1)Decline in occupancy relates to the expiration of an acquired non-laboratory lease aggregating 87,273 RSF at one property in our Bothell submarket that is expected to be converted to laboratory space subject to
market conditions and leasing.
(2)The Alexandria Center® for Life Science – New York City mega campus is 95.3% occupied as of September 30, 2024. Occupancy percentage in our New York City market reflects vacancy at the Alexandria Center®
for Life Science – Long Island City property, which was 42.8% occupied as of September 30, 2024.
Alexandria Real Estate Equities, Inc. All Rights Reserved. © 2024 | 27 |
Property Listing | |
September 30, 2024 | |
(Dollars in thousands) | |
Mega Campuses Encompass 76% of Our Annual Rental Revenue
Market / Submarket / Address | RSF | Number of Properties | Annual Rental Revenue | Occupancy Percentage | |||||||||||||||||
Operating | Operating and Redevelopment | ||||||||||||||||||||
Operating | Development | Redevelopment | Total | ||||||||||||||||||
Greater Boston | |||||||||||||||||||||
Cambridge/Inner Suburbs | |||||||||||||||||||||
Mega Campus: Alexandria Center® at Kendall Square | 2,856,043 | — | — | 2,856,043 | 11 | $275,724 | 97.5% | 97.5% | |||||||||||||
50(1), 60(1), 75/125(1), 100(1), and 225(1) Binney Street, 140 and 215 First Street, 150 Second Street, 300 Third Street(1), 11 Hurley Street, and 100 Edwin H. Land Boulevard | |||||||||||||||||||||
Mega Campus: Alexandria Center® at One Kendall Square | 1,281,583 | — | 104,956 | 1,386,539 | 12 | 144,595 | 93.7 | 86.6 | |||||||||||||
One Kendall Square (Buildings 100, 200, 300, 400, 500, 600/700, 1400, 1800, and 2000), 325 and 399 Binney Street, and One Hampshire Street | |||||||||||||||||||||
Mega Campus: Alexandria Technology Square® | 1,185,286 | — | — | 1,185,286 | 7 | 114,942 | 100.0 | 100.0 | |||||||||||||
100, 200, 300, 400, 500, 600, and 700 Technology Square | |||||||||||||||||||||
Mega Campus: The Arsenal on the Charles | 702,745 | 109,481 | 308,446 | 1,120,672 | 13 | 53,481 | 99.3 | 69.0 | |||||||||||||
311, 321, and 343 Arsenal Street, 300, 400, and 500 North Beacon Street, 1, 2, 3, and 4 Kingsbury Avenue, and 100, 200, and 400 Talcott Avenue | |||||||||||||||||||||
Mega Campus: 480 Arsenal Way, 446, 458, 500, and 550 Arsenal Street, and 99 Coolidge Avenue(1) | 633,056 | 204,395 | — | 837,451 | 6 | 39,618 | 100.0 | 100.0 | |||||||||||||
Cambridge/Inner Suburbs | 6,658,713 | 313,876 | 413,402 | 7,385,991 | 49 | 628,360 | 97.7 | 91.9 | |||||||||||||
Fenway | |||||||||||||||||||||
Mega Campus: Alexandria Center® for Life Science – Fenway | 1,218,257 | 450,160 | 159,959 | 1,828,376 | 3 | 90,984 | 89.3 | 78.9 | |||||||||||||
401 and 421(1) Park Drive and 201 Brookline Avenue(1) | |||||||||||||||||||||
Seaport Innovation District | |||||||||||||||||||||
5 and 15(1) Necco Street | 441,396 | — | — | 441,396 | 2 | 40,401 | 75.7 | 75.7 | |||||||||||||
Seaport Innovation District | 441,396 | — | — | 441,396 | 2 | 40,401 | 75.7 | 75.7 | |||||||||||||
Route 128 | |||||||||||||||||||||
Mega Campus: Alexandria Center® for Life Science – Waltham | 326,110 | — | 735,744 | 1,061,854 | 5 | 23,198 | 100.0 | 30.7 | |||||||||||||
40, 50, and 60 Sylvan Road, 35 Gatehouse Drive, and 840 Winter Street | |||||||||||||||||||||
Mega Campus: One Moderna Way | 722,130 | — | — | 722,130 | 4 | 31,422 | 100.0 | 100.0 | |||||||||||||
19, 225, and 235 Presidential Way | 585,226 | — | — | 585,226 | 3 | 14,381 | 100.0 | 100.0 | |||||||||||||
Route 128 | 1,633,466 | — | 735,744 | 2,369,210 | 12 | 69,001 | 100.0 | 68.9 | |||||||||||||
Other | 400,863 | — | 453,869 | 854,732 | 6 | 4,816 | 59.7 | 28.0 | |||||||||||||
Greater Boston | 10,352,695 | 764,036 | 1,762,974 | 12,879,705 | 72 | $833,562 | 94.6% | 80.9% | |||||||||||||
Refer to “New Class A/A+ development and redevelopment properties: summary of pipeline” and “Definitions and reconciliations” in the Supplemental Information for additional details. (1)We own a partial interest in this property through a real estate joint venture. Refer to “Joint venture financial information” in the Supplemental Information for additional details. | |||||||||||||||||||||
Alexandria Real Estate Equities, Inc. All Rights Reserved. © 2024 | 28 |
Property Listing (continued) | |
September 30, 2024 | |
(Dollars in thousands) | |
Market / Submarket / Address | RSF | Number of Properties | Annual Rental Revenue | Occupancy Percentage | |||||||||||||||||
Operating | Operating and Redevelopment | ||||||||||||||||||||
Operating | Development | Redevelopment | Total | ||||||||||||||||||
San Francisco Bay Area | |||||||||||||||||||||
Mission Bay | |||||||||||||||||||||
Mega Campus: Alexandria Center® for Science and Technology – Mission Bay(1) | 2,005,369 | 212,796 | — | 2,218,165 | 10 | $74,676 | 95.1% | 95.1% | |||||||||||||
1455(2), 1515(2), 1655, and 1725 Third Street, 409 and 499 Illinois Street, 1450, 1500, and 1700 Owens Street, and 455 Mission Bay Boulevard South | |||||||||||||||||||||
Mission Bay | 2,005,369 | 212,796 | — | 2,218,165 | 10 | 74,676 | 95.1 | 95.1 | |||||||||||||
South San Francisco | |||||||||||||||||||||
Mega Campus: Alexandria Technology Center® – Gateway(1) | 1,409,825 | — | 259,689 | 1,669,514 | 12 | 76,150 | 82.9 | 70.0 | |||||||||||||
600(2), 601, 611, 630(2), 650(2), 651, 681, 685, 701, 751, 901(2), and 951(2) Gateway Boulevard | |||||||||||||||||||||
Mega Campus: Alexandria Center® for Advanced Technologies – South San Francisco | 919,703 | — | — | 919,703 | 5 | 57,788 | 100.0 | 100.0 | |||||||||||||
213(1), 249, 259, 269, and 279 East Grand Avenue | |||||||||||||||||||||
Alexandria Center® for Life Science – South San Francisco | 504,053 | — | — | 504,053 | 3 | 32,767 | 93.9 | 93.9 | |||||||||||||
201 Haskins Way and 400 and 450 East Jamie Court | |||||||||||||||||||||
Mega Campus: Alexandria Center® for Advanced Technologies – Tanforan | 445,232 | — | — | 445,232 | 2 | 4,020 | 100.0 | 100.0 | |||||||||||||
1122 and 1150 El Camino Real | |||||||||||||||||||||
Alexandria Center® for Life Science – Millbrae(1) | — | 285,346 | — | 285,346 | 1 | — | N/A | N/A | |||||||||||||
230 Harriet Tubman Way | |||||||||||||||||||||
500 Forbes Boulevard(1) | 155,685 | — | — | 155,685 | 1 | 10,680 | 100.0 | 100.0 | |||||||||||||
South San Francisco | 3,434,498 | 285,346 | 259,689 | 3,979,533 | 24 | 181,405 | 92.1 | 85.6 | |||||||||||||
Greater Stanford | |||||||||||||||||||||
Mega Campus: Alexandria Center® for Life Science – San Carlos | 739,157 | — | — | 739,157 | 9 | 49,891 | 97.4 | 97.4 | |||||||||||||
825, 835, 960, and 1501-1599 Industrial Road | |||||||||||||||||||||
Alexandria Stanford Life Science District | 703,843 | — | — | 703,843 | 9 | 66,558 | 98.6 | 98.6 | |||||||||||||
3160, 3165, 3170, and 3181 Porter Drive and 3301, 3303, 3305, 3307, and 3330 Hillview Avenue | |||||||||||||||||||||
3412, 3420, 3440, 3450, and 3460 Hillview Avenue | 340,103 | — | — | 340,103 | 5 | 23,603 | 82.9 | 82.9 | |||||||||||||
3875 Fabian Way | 228,000 | — | — | 228,000 | 1 | 9,402 | 100.0 | 100.0 | |||||||||||||
2475 and 2625/2627/2631 Hanover Street and 1450 Page Mill Road | 193,688 | — | — | 193,688 | 3 | 16,994 | 100.0 | 100.0 | |||||||||||||
2100, 2200, and 2400 Geng Road | 78,501 | — | — | 78,501 | 3 | 4,803 | 100.0 | 100.0 | |||||||||||||
3350 West Bayshore Road | 61,431 | — | — | 61,431 | 1 | 4,770 | 100.0 | 100.0 | |||||||||||||
Greater Stanford | 2,344,723 | — | — | 2,344,723 | 31 | 176,021 | 96.3 | 96.3 | |||||||||||||
San Francisco Bay Area | 7,784,590 | 498,142 | 259,689 | 8,542,421 | 65 | $432,102 | 94.1% | 91.1% | |||||||||||||
Refer to “New Class A/A+ development and redevelopment properties: summary of pipeline” and “Definitions and reconciliations” in the Supplemental Information for additional details. (1)We own a partial interest in this property through a real estate joint venture. Refer to “Joint venture financial information” in the Supplemental Information for additional details. (2)We own 100% of this property. | |||||||||||||||||||||
Alexandria Real Estate Equities, Inc. All Rights Reserved. © 2024 | 29 |
Property Listing (continued) | |
September 30, 2024 | |
(Dollars in thousands) | |
Market / Submarket / Address | RSF | Number of Properties | Annual Rental Revenue | Occupancy Percentage | |||||||||||||||||
Operating | Operating and Redevelopment | ||||||||||||||||||||
Operating | Development | Redevelopment | Total | ||||||||||||||||||
San Diego | |||||||||||||||||||||
Torrey Pines | |||||||||||||||||||||
Mega Campus: One Alexandria Square | 748,674 | 334,996 | — | 1,083,670 | 10 | $43,059 | 98.8% | 98.8% | |||||||||||||
3115 and 3215(1) Merryfield Row, 3010, 3013, and 3033 Science Park Road, 10935, 10945, and 10955 Alexandria Way, 10975 North Torrey Pines Road, and 10996 Torreyana Road, and 3545 Cray Court | |||||||||||||||||||||
ARE Torrey Ridge | 297,784 | — | — | 297,784 | 3 | 13,661 | 85.9 | 85.9 | |||||||||||||
10578, 10618, and 10628 Science Center Drive | |||||||||||||||||||||
ARE Nautilus | 218,459 | — | — | 218,459 | 4 | 12,743 | 86.3 | 86.3 | |||||||||||||
3530 and 3550 John Hopkins Court and 3535 and 3565 General Atomics Court | |||||||||||||||||||||
Torrey Pines | 1,264,917 | 334,996 | — | 1,599,913 | 17 | 69,463 | 93.6 | 93.6 | |||||||||||||
University Town Center | |||||||||||||||||||||
Mega Campus: Campus Point by Alexandria(1) | 1,666,590 | 598,029 | — | 2,264,619 | 13 | 80,167 | 99.0 | 99.0 | |||||||||||||
9880(2), 10010(2), 10140(2), 10210, 10260, 10290, and 10300 Campus Point Drive and 4135, 4155, 4161, 4224, 4242, and 4275(2) Campus Point Court | |||||||||||||||||||||
Mega Campus: 5200 Illumina Way(1) | 792,687 | — | — | 792,687 | 6 | 29,978 | 100.0 | 100.0 | |||||||||||||
ARE Esplanade | 243,084 | — | — | 243,084 | 4 | 11,976 | 74.6 | 74.6 | |||||||||||||
4755, 4757, and 4767 Nexus Center Drive and 4796 Executive Drive | |||||||||||||||||||||
9625 Towne Centre Drive(1) | 163,648 | — | — | 163,648 | 1 | 6,520 | 100.0 | 100.0 | |||||||||||||
Costa Verde by Alexandria | 8,730 | — | — | 8,730 | 2 | 941 | 100.0 | 100.0 | |||||||||||||
8505 Costa Verde Boulevard and 4260 Nobel Drive | |||||||||||||||||||||
University Town Center | 2,874,739 | 598,029 | — | 3,472,768 | 26 | 129,582 | 97.3 | 97.3 | |||||||||||||
Sorrento Mesa | |||||||||||||||||||||
Mega Campus: SD Tech by Alexandria(1) | 981,195 | 253,079 | — | 1,234,274 | 14 | 41,534 | 94.3 | 94.3 | |||||||||||||
9605, 9645, 9675, 9725, 9735, 9808, 9855, and 9868 Scranton Road, 5505 Morehouse Drive(2), and 10055, 10065, 10075, 10121(2), and 10151(2) Barnes Canyon Road | |||||||||||||||||||||
Mega Campus: Sequence District by Alexandria | 801,575 | — | — | 801,575 | 7 | 28,766 | 100.0 | 100.0 | |||||||||||||
6260, 6290, 6310, 6340, 6350, 6420, and 6450 Sequence Drive | |||||||||||||||||||||
Pacific Technology Park(1) | 544,352 | — | — | 544,352 | 5 | 8,936 | 89.1 | 89.1 | |||||||||||||
9389, 9393, 9401, 9455, and 9477 Waples Street | |||||||||||||||||||||
Summers Ridge Science Park(1) | 316,531 | — | — | 316,531 | 4 | 11,521 | 100.0 | 100.0 | |||||||||||||
9965, 9975, 9985, and 9995 Summers Ridge Road | |||||||||||||||||||||
Scripps Science Park by Alexandria | 144,113 | — | — | 144,113 | 1 | 11,379 | 100.0 | 100.0 | |||||||||||||
10102 Hoyt Park Drive | |||||||||||||||||||||
ARE Portola | 101,857 | — | — | 101,857 | 3 | 4,022 | 100.0 | 100.0 | |||||||||||||
6175, 6225, and 6275 Nancy Ridge Drive | |||||||||||||||||||||
5810/5820 Nancy Ridge Drive | 83,354 | — | — | 83,354 | 1 | 4,581 | 100.0 | 100.0 | |||||||||||||
9877 Waples Street | 63,774 | — | — | 63,774 | 1 | 2,680 | 100.0 | 100.0 | |||||||||||||
5871 Oberlin Drive | 33,842 | — | — | 33,842 | 1 | 1,909 | 100.0 | 100.0 | |||||||||||||
Sorrento Mesa | 3,070,593 | 253,079 | — | 3,323,672 | 37 | $115,328 | 96.2% | 96.2% | |||||||||||||
Refer to “New Class A/A+ development and redevelopment properties: summary of pipeline” and “Definitions and reconciliations” in the Supplemental Information for additional details. (1)We own a partial interest in this property through a real estate joint venture. Refer to “Joint venture financial information” in the Supplemental Information for additional details. (2)We own 100% of this property. | |||||||||||||||||||||
Alexandria Real Estate Equities, Inc. All Rights Reserved. © 2024 | 30 |
Property Listing (continued) | |
September 30, 2024 | |
(Dollars in thousands) | |
Market / Submarket / Address | RSF | Number of Properties | Annual Rental Revenue | Occupancy Percentage | |||||||||||||||||
Operating | Operating and Redevelopment | ||||||||||||||||||||
Operating | Development | Redevelopment | Total | ||||||||||||||||||
San Diego (continued) | |||||||||||||||||||||
Sorrento Valley | |||||||||||||||||||||
3911, 3931, and 3985 Sorrento Valley Boulevard | 108,812 | — | — | 108,812 | 3 | $3,834 | 68.5% | 68.5% | |||||||||||||
11045 and 11055 Roselle Street | 43,233 | — | — | 43,233 | 2 | 2,191 | 100.0 | 100.0 | |||||||||||||
Sorrento Valley | 152,045 | — | — | 152,045 | 5 | 6,025 | 77.4 | 77.4 | |||||||||||||
Other | 311,021 | — | — | 311,021 | 2 | 10,198 | 100.0 | 100.0 | |||||||||||||
San Diego | 7,673,315 | 1,186,104 | — | 8,859,419 | 87 | 330,596 | 96.0 | 96.0 | |||||||||||||
Seattle | |||||||||||||||||||||
Lake Union | |||||||||||||||||||||
Mega Campus: Alexandria Center® for Life Science – Eastlake | 1,153,742 | — | — | 1,153,742 | 9 | 81,380 | 95.2 | 95.2 | |||||||||||||
1150, 1201(1), 1208(1), 1551, 1600, and 1616 Eastlake Avenue East, 188 and 199(1) East Blaine Street, and 1600 Fairview Avenue East | |||||||||||||||||||||
Mega Campus: Alexandria Center® for Life Science – South Lake Union | 290,754 | 227,577 | — | 518,331 | 2 | 17,501 | 100.0 | 100.0 | |||||||||||||
400(1) and 701 Dexter Avenue North | |||||||||||||||||||||
219 Terry Avenue North | 31,797 | — | — | 31,797 | 1 | 1,311 | 56.9 | 56.9 | |||||||||||||
Lake Union | 1,476,293 | 227,577 | — | 1,703,870 | 12 | 100,192 | 95.3 | 95.3 | |||||||||||||
SoDo | |||||||||||||||||||||
830 4th Avenue South | 45,615 | — | — | 45,615 | 1 | 676 | 29.8 | 29.8 | |||||||||||||
Elliott Bay | |||||||||||||||||||||
410 West Harrison Street and 410 Elliott Avenue West | 20,101 | — | — | 20,101 | 2 | 672 | 100.0 | 100.0 | |||||||||||||
Bothell | |||||||||||||||||||||
Mega Campus: Alexandria Center® for Advanced Technologies – Canyon Park | 1,061,778 | — | — | 1,061,778 | 22 | 22,235 | 87.9 | 87.9 | |||||||||||||
22121 and 22125 17th Avenue Southeast, 22021, 22025, 22026, 22030, 22118, and 22122 20th Avenue Southeast, 22333, 22422, 22515, 22522, 22722, and 22745 29th Drive Southeast, 21540, 22213 and 22309 30th Drive Southeast, and 1629, 1631, 1725, 1916, and 1930 220th Street Southeast | |||||||||||||||||||||
Alexandria Center® for Advanced Technologies – Monte Villa Parkway | 429,143 | — | 34,306 | 463,449 | 6 | 12,420 | 97.5 | 90.3 | |||||||||||||
3301, 3303, 3305, 3307, 3555, and 3755 Monte Villa Parkway | |||||||||||||||||||||
Bothell | 1,490,921 | — | 34,306 | 1,525,227 | 28 | 34,655 | 90.7 | 88.6 | |||||||||||||
Other | 75,663 | — | — | 75,663 | 2 | 849 | 100.0 | 100.0 | |||||||||||||
Seattle | 3,108,593 | 227,577 | 34,306 | 3,370,476 | 45 | $137,044 | 92.3% | 91.3% | |||||||||||||
Refer to “New Class A/A+ development and redevelopment properties: summary of pipeline” and “Definitions and reconciliations” in the Supplemental Information for additional details. (1)We own a partial interest in this property through a real estate joint venture. Refer to “Joint venture financial information” in the Supplemental Information for additional details. | |||||||||||||||||||||
Alexandria Real Estate Equities, Inc. All Rights Reserved. © 2024 | 31 |
Property Listing (continued) | |
September 30, 2024 | |
(Dollars in thousands) | |
Market / Submarket / Address | RSF | Number of Properties | Annual Rental Revenue | Occupancy Percentage | |||||||||||||||||
Operating | Operating and Redevelopment | ||||||||||||||||||||
Operating | Development | Redevelopment | Total | ||||||||||||||||||
Maryland | |||||||||||||||||||||
Rockville | |||||||||||||||||||||
Mega Campus: Alexandria Center® for Life Science – Shady Grove | 1,662,460 | 29,890 | — | 1,692,350 | 20 | $80,356 | 99.3% | 99.3% | |||||||||||||
9601, 9603, 9605, 9704, 9708, 9712, 9714, 9800, 9804, 9808, 9900, and 9950 Medical Center Drive, 14920 and 15010 Broschart Road, 9920 Belward Campus Drive, and 9810 and 9820 Darnestown Road | |||||||||||||||||||||
1330 Piccard Drive | 131,508 | — | — | 131,508 | 1 | 4,210 | 100.0 | 100.0 | |||||||||||||
1405 and 1450(1) Research Boulevard | 114,849 | — | — | 114,849 | 2 | 3,029 | 73.3 | 73.3 | |||||||||||||
1500 and 1550 East Gude Drive | 91,359 | — | — | 91,359 | 2 | 1,844 | 100.0 | 100.0 | |||||||||||||
5 Research Place | 63,852 | — | — | 63,852 | 1 | 3,073 | 100.0 | 100.0 | |||||||||||||
5 Research Court | 51,520 | — | — | 51,520 | 1 | 1,779 | 100.0 | 100.0 | |||||||||||||
12301 Parklawn Drive | 49,185 | — | — | 49,185 | 1 | 1,598 | 100.0 | 100.0 | |||||||||||||
Rockville | 2,164,733 | 29,890 | — | 2,194,623 | 28 | 95,889 | 98.0 | 98.0 | |||||||||||||
Gaithersburg | |||||||||||||||||||||
Alexandria Technology Center® – Gaithersburg I | 619,061 | — | — | 619,061 | 9 | 19,486 | 93.1 | 93.1 | |||||||||||||
9, 25, 35, 45, 50, and 55 West Watkins Mill Road and 910, 930, and 940 Clopper Road | |||||||||||||||||||||
Alexandria Technology Center® – Gaithersburg II | 486,301 | — | — | 486,301 | 7 | 18,788 | 100.0 | 100.0 | |||||||||||||
700, 704, and 708 Quince Orchard Road and 19, 20, 21, and 22 Firstfield Road | |||||||||||||||||||||
20400 Century Boulevard | 81,006 | — | — | 81,006 | 1 | 3,016 | 100.0 | 100.0 | |||||||||||||
401 Professional Drive | 63,154 | — | — | 63,154 | 1 | 1,930 | 90.1 | 90.1 | |||||||||||||
950 Wind River Lane | 50,000 | — | — | 50,000 | 1 | 1,234 | 100.0 | 100.0 | |||||||||||||
620 Professional Drive | 27,950 | — | — | 27,950 | 1 | 1,207 | 100.0 | 100.0 | |||||||||||||
Gaithersburg | 1,327,472 | — | — | 1,327,472 | 20 | 45,661 | 96.3 | 96.3 | |||||||||||||
Beltsville | |||||||||||||||||||||
8000/9000/10000 Virginia Manor Road | 191,884 | — | — | 191,884 | 1 | 2,974 | 97.7 | 97.7 | |||||||||||||
101 West Dickman Street(1) | 135,423 | — | — | 135,423 | 1 | 1,323 | 64.4 | 64.4 | |||||||||||||
Beltsville | 327,307 | — | — | 327,307 | 2 | 4,297 | 83.9 | 83.9 | |||||||||||||
Maryland | 3,819,512 | 29,890 | — | 3,849,402 | 50 | 145,847 | 96.2 | 96.2 | |||||||||||||
Research Triangle | |||||||||||||||||||||
Research Triangle | |||||||||||||||||||||
Mega Campus: Alexandria Center® for Life Science – Durham | 2,152,397 | — | — | 2,152,397 | 15 | 53,168 | 97.5 | 97.5 | |||||||||||||
6, 8, 10, 12, 14, 40, 42, and 65 Moore Drive, 21, 25, 27, 29, and 31 Alexandria Way, 2400 Ellis Road, and 14 TW Alexander Drive | |||||||||||||||||||||
Mega Campus: Alexandria Center® for Advanced Technologies and AgTech – Research Triangle | 687,467 | — | — | 687,467 | 6 | 32,633 | 99.1 | 99.1 | |||||||||||||
6, 8, 10, and 12 Davis Drive and 5 and 9 Laboratory Drive | |||||||||||||||||||||
Mega Campus: Alexandria Center® for Sustainable Technologies | 364,493 | — | — | 364,493 | 7 | $12,117 | 93.0% | 93.0% | |||||||||||||
104, 108, 110, 112, and 114 TW Alexander Drive and 5 and 7 Triangle Drive | |||||||||||||||||||||
Refer to “New Class A/A+ development and redevelopment properties: summary of pipeline” and “Definitions and reconciliations” in the Supplemental Information for additional details. (1)We own a partial interest in this property through a real estate joint venture. Refer to “Joint venture financial information” in the Supplemental Information for additional details. | |||||||||||||||||||||
Alexandria Real Estate Equities, Inc. All Rights Reserved. © 2024 | 32 |
Property Listing (continued) | |
September 30, 2024 | |
(Dollars in thousands) | |
Market / Submarket / Address | RSF | Number of Properties | Annual Rental Revenue | Occupancy Percentage | |||||||||||||||||
Operating | Operating and Redevelopment | ||||||||||||||||||||
Operating | Development | Redevelopment | Total | ||||||||||||||||||
Research Triangle (continued) | |||||||||||||||||||||
Research Triangle (continued) | |||||||||||||||||||||
Alexandria Technology Center® – Alston | 155,731 | — | — | 155,731 | 3 | $4,168 | 94.7% | 94.7% | |||||||||||||
100, 800, and 801 Capitola Drive | |||||||||||||||||||||
Alexandria Innovation Center® – Research Triangle | 136,692 | — | — | 136,692 | 3 | 4,260 | 100.0 | 100.0 | |||||||||||||
7010, 7020, and 7030 Kit Creek Road | |||||||||||||||||||||
2525 East NC Highway 54 | 82,996 | — | — | 82,996 | 1 | 3,651 | 100.0 | 100.0 | |||||||||||||
407 Davis Drive | 81,956 | — | — | 81,956 | 1 | 3,323 | 100.0 | 100.0 | |||||||||||||
601 Keystone Park Drive | 77,595 | — | — | 77,595 | 1 | 2,137 | 100.0 | 100.0 | |||||||||||||
6101 Quadrangle Drive | 31,600 | — | — | 31,600 | 1 | 861 | 100.0 | 100.0 | |||||||||||||
Research Triangle | 3,770,927 | — | — | 3,770,927 | 38 | 116,318 | 97.5 | 97.5 | |||||||||||||
New York City | |||||||||||||||||||||
New York City | |||||||||||||||||||||
Mega Campus: Alexandria Center® for Life Science – New York City | 742,586 | — | — | 742,586 | 3 | 67,220 | 95.3 | 95.3 | |||||||||||||
430 and 450 East 29th Street | |||||||||||||||||||||
Alexandria Center® for Life Science – Long Island City | 179,100 | — | — | 179,100 | 1 | 5,219 | 42.8 | 42.8 | |||||||||||||
30-02 48th Avenue | |||||||||||||||||||||
New York City | 921,686 | — | — | 921,686 | 4 | 72,439 | 85.1 | 85.1 | |||||||||||||
Texas | |||||||||||||||||||||
Austin | |||||||||||||||||||||
Mega Campus: Intersection Campus | 1,525,359 | — | — | 1,525,359 | 12 | 40,156 | 99.2 | 99.2 | |||||||||||||
507 East Howard Lane, 13011 McCallen Pass, 13813 and 13929 Center Lake Drive, and 12535, 12545, 12555, and 12565 Riata Vista Circle | |||||||||||||||||||||
1001 Trinity Street and 1020 Red River Street | 198,972 | — | — | 198,972 | 2 | 11,630 | 100.0 | 100.0 | |||||||||||||
Austin | 1,724,331 | — | — | 1,724,331 | 14 | 51,786 | 99.3 | 99.3 | |||||||||||||
Greater Houston | |||||||||||||||||||||
Alexandria Center® for Advanced Technologies at The Woodlands | 120,828 | — | 73,298 | 194,126 | 1 | 3,172 | 41.5 | 25.8 | |||||||||||||
8800 Technology Forest Place | |||||||||||||||||||||
Texas | 1,845,159 | — | 73,298 | 1,918,457 | 15 | 54,958 | 95.5 | 91.8 | |||||||||||||
Canada | 887,737 | — | 139,311 | 1,027,048 | 11 | 19,790 | 95.5 | 82.6 | |||||||||||||
Non-cluster/other markets | 347,806 | — | — | 347,806 | 10 | 14,623 | 72.8 | 72.8 | |||||||||||||
North America, excluding properties held for sale | 40,512,020 | 2,705,749 | 2,269,578 | 45,487,347 | 397 | 2,157,279 | 94.7% | 89.7% | |||||||||||||
Properties held for sale | 1,261,387 | — | — | 1,261,387 | 9 | 26,796 | 66.7% | 66.7% | |||||||||||||
Total – North America | 41,773,407 | 2,705,749 | 2,269,578 | 46,748,734 | 406 | $2,184,075 | |||||||||||||||
Refer to “New Class A/A+ development and redevelopment properties: summary of pipeline” and “Definitions and reconciliations” in the Supplemental Information for additional details.
Alexandria Real Estate Equities, Inc. All Rights Reserved. © 2024 | 33 |
Investments in Real Estate | |
September 30, 2024 | |

ALEXANDRIA’S FUTURE GROWTH IN
ANNUAL NET OPERATING INCOME FROM
DEVELOPMENT AND REDEVELOPMENT DELIVERIES
$510 MILLION
(1)
Placed Into Service
Expected to Be Placed Into Service
(2)
YTD 3Q24 | 3Q24 | ||
$63M | $21M | ||
945,118 RSF | 316,691 RSF | ||
100% Leased | |||
(3)
4Q24–4Q25 | 1Q26–1Q28 | ||
$158M | $352M | ||
Aggregating 5.5M RSF | |||
55% Leased/Negotiating | |||
Refer to “Net operating income” under “Definitions and reconciliations” in the Supplemental Information for additional details, including its reconciliation from the most directly comparable financial measure presented in accordance with GAAP.
(1)Our share of incremental annual net operating income from development and redevelopment projects expected to be placed into service primarily commencing from 4Q24 through 1Q28 is projected to be $407 million.
(2)Represents expected incremental annual net operating income to be placed into service from deliveries of projects undergoing construction and one committed near-term project expected to commence construction in the next two years.
(3)Includes (i) 1.0 million RSF that is expected to stabilize through 2025 and is 92% leased/negotiating and (ii) expected partial deliveries through 4Q25 from projects expected to stabilize in 2026 and beyond. Refer to the initial and
stabilized occupancy years under “New Class A/A+ development and redevelopment properties: current projects” in the Supplemental Information for details.
Alexandria Real Estate Equities, Inc. All Rights Reserved. © 2024 | 34 |
Investments in Real Estate | |
September 30, 2024 | |
(Dollars in thousands) | |
Investments in real estate
Development and Redevelopment | |||||||||||||||
Active and Near-Term Construction | Future Opportunities Subject to Market Conditions and Leasing | ||||||||||||||
Operating | Under Construction 55% Leased/ Negotiating | Committed Near Term 51% Leased/ Negotiating(1) | Priority Anticipated | Future | Subtotal | Total | |||||||||
Square footage | |||||||||||||||
Operating | 40,512,020 | — | — | — | — | — | 40,512,020 | ||||||||
New Class A/A+ development and redevelopment properties | — | 4,975,327 | 492,570 | 2,163,784 | 27,582,766 | 35,214,447 | 35,214,447 | ||||||||
Future development and redevelopment square feet currently included in rental properties(2) | — | — | (159,884) | (258,596) | (2,957,559) | (3,376,039) | (3,376,039) | ||||||||
Total square footage, excluding properties held for sale | 40,512,020 | 4,975,327 | 332,686 | 1,905,188 | 24,625,207 | 31,838,408 | 72,350,428 | ||||||||
Properties held for sale | 1,261,387 | — | — | — | — | — | 1,261,387 | ||||||||
Total square footage | 41,773,407 | 4,975,327 | 332,686 | 1,905,188 | 24,625,207 | 31,838,408 | 73,611,815 | (3) | |||||||
Investments in real estate | |||||||||||||||
Gross book value as of September 30, 2024(4) | $29,235,994 | $4,335,573 | $69,521 | $578,694 | $4,356,637 | $9,340,425 | $38,576,419 | ||||||||
(1)Represents one committed near-term project expected to commence construction during the next two years after September 30, 2024.
(2)Refer to “Investments in real estate” under “Definitions and reconciliations” in the Supplemental Information for additional details, including future development and redevelopment square feet currently included in rental properties.
(3)We expect to continue pursuing our strategy to fund a significant portion of our capital requirements for the year ending December 31, 2024 with dispositions primarily focused on sales of properties and land parcels not integral to our
mega campus strategy.
(4)Balances exclude accumulated depreciation and our share of the cost basis associated with our properties held by our unconsolidated real estate joint ventures, which is classified as investments in unconsolidated real estate joint
ventures in our consolidated balance sheets. Refer to “Investments in real estate” under “Definitions and reconciliations” in the Supplement al Information for additional details.
Alexandria Real Estate Equities, Inc. All Rights Reserved. © 2024 | 35 |
New Class A/A+ Development and Redevelopment Properties: Recent Deliveries | |
September 30, 2024 | |
500 North Beacon Street and 4 Kingsbury Avenue(1) | 651 Gateway Boulevard | 1150 Eastlake Avenue East | ||
Greater Boston/ Cambridge/Inner Suburbs | San Francisco Bay Area/ South San Francisco | Seattle/Lake Union | ||
138,537 RSF | 67,017 RSF | 311,631 RSF | ||
100% Occupancy | 100% Occupancy | 100% Occupancy | ||
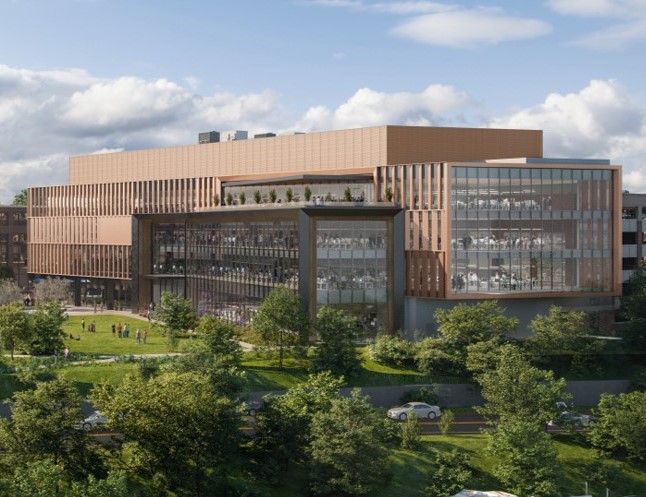 |  | 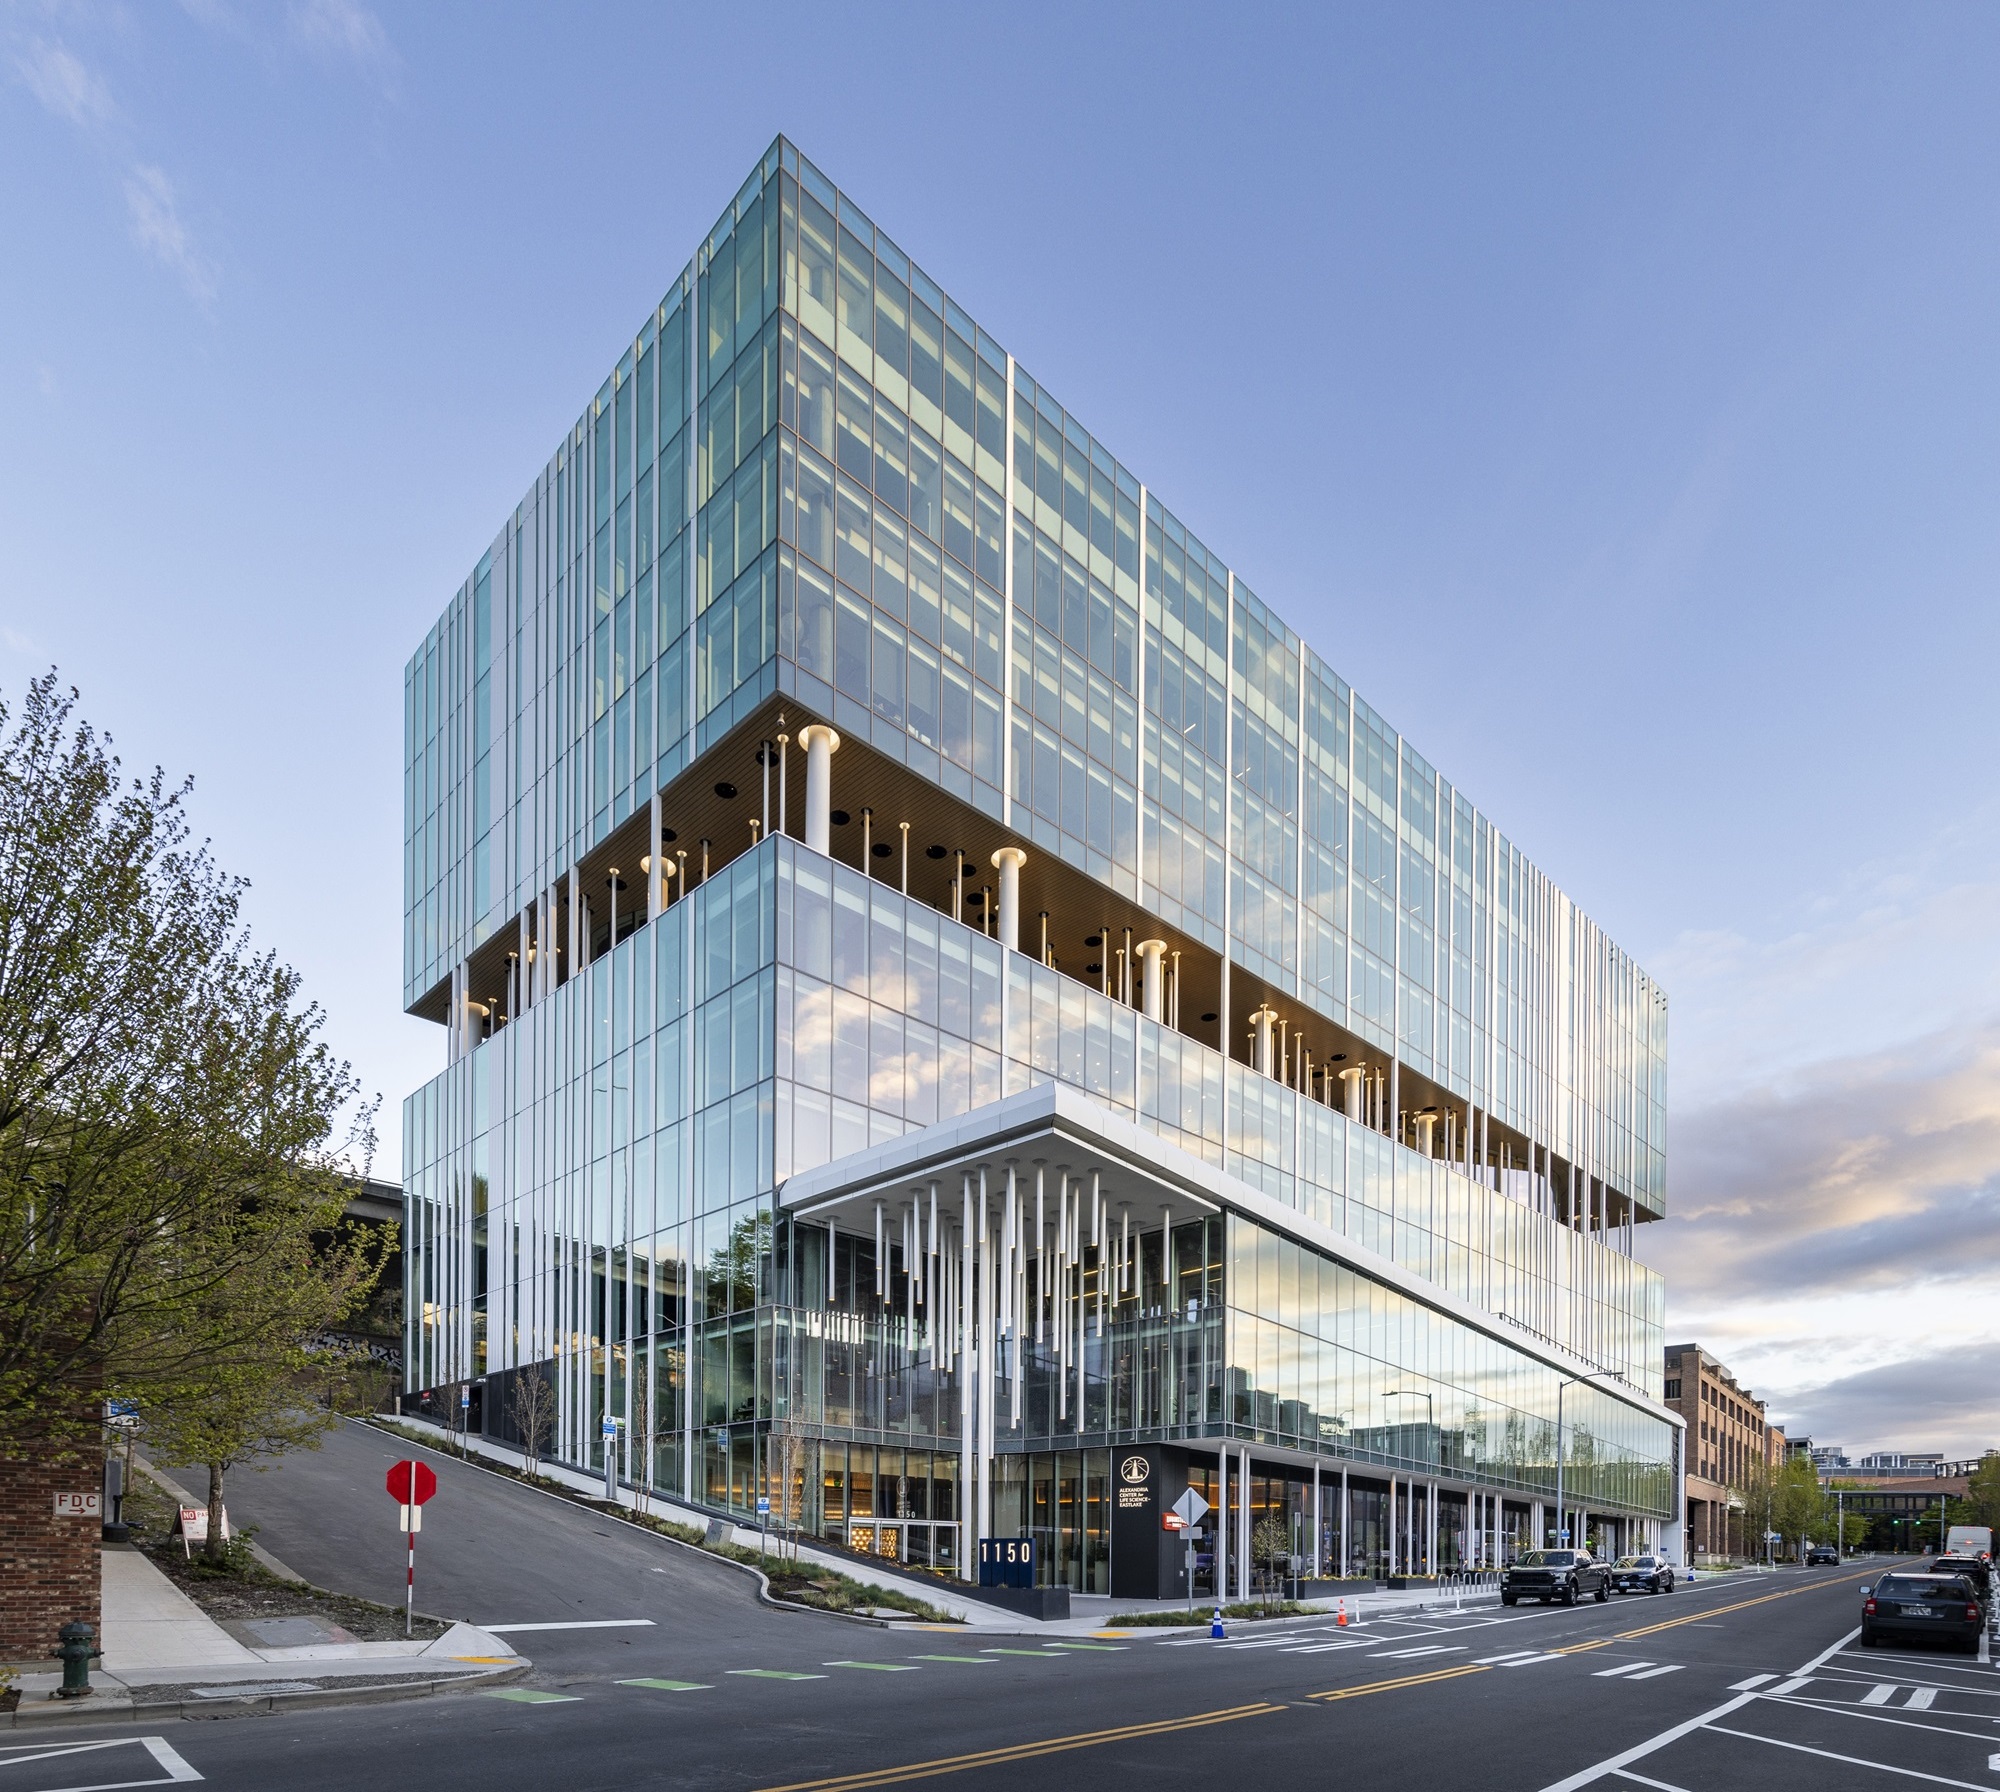 |
9810 Darnestown Road | 9820 Darnestown Road | 9808 Medical Center Drive | ||
Maryland/Rockville | Maryland/Rockville | Maryland/Rockville | ||
195,435 RSF | 250,000 RSF | 65,171 RSF | ||
100% Occupancy | 100% Occupancy | 100% Occupancy | ||
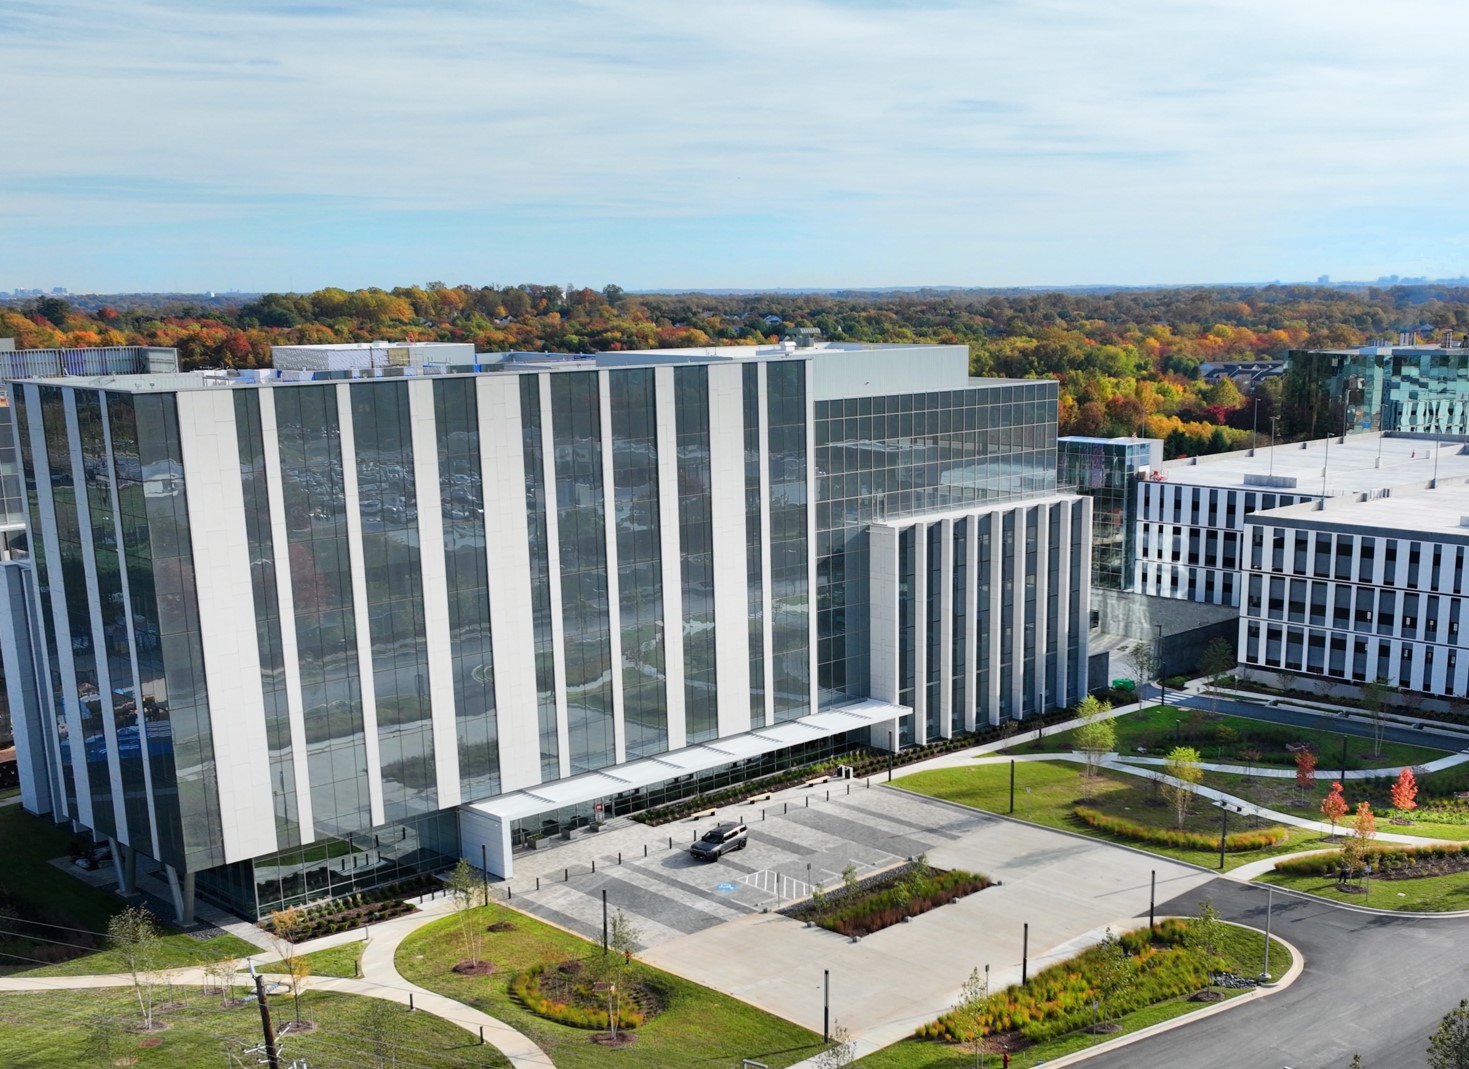 | 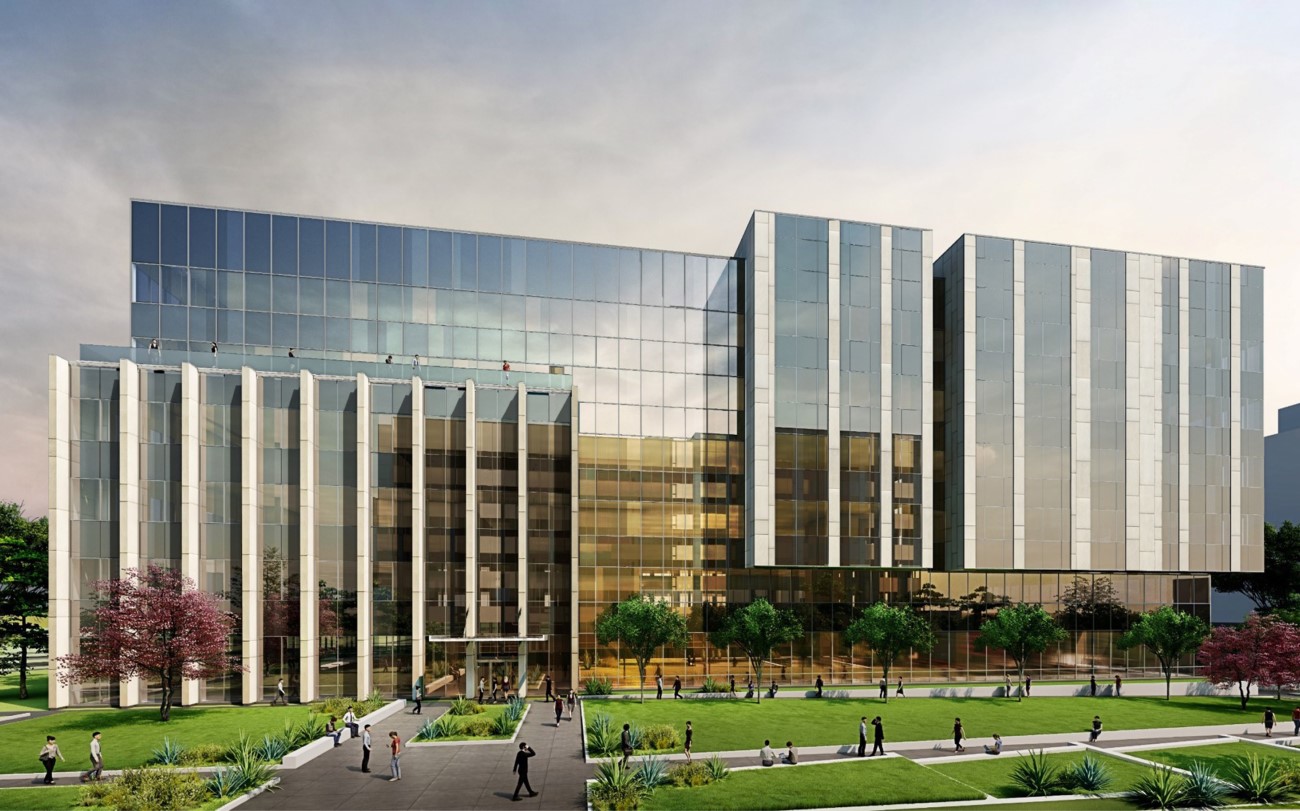 | 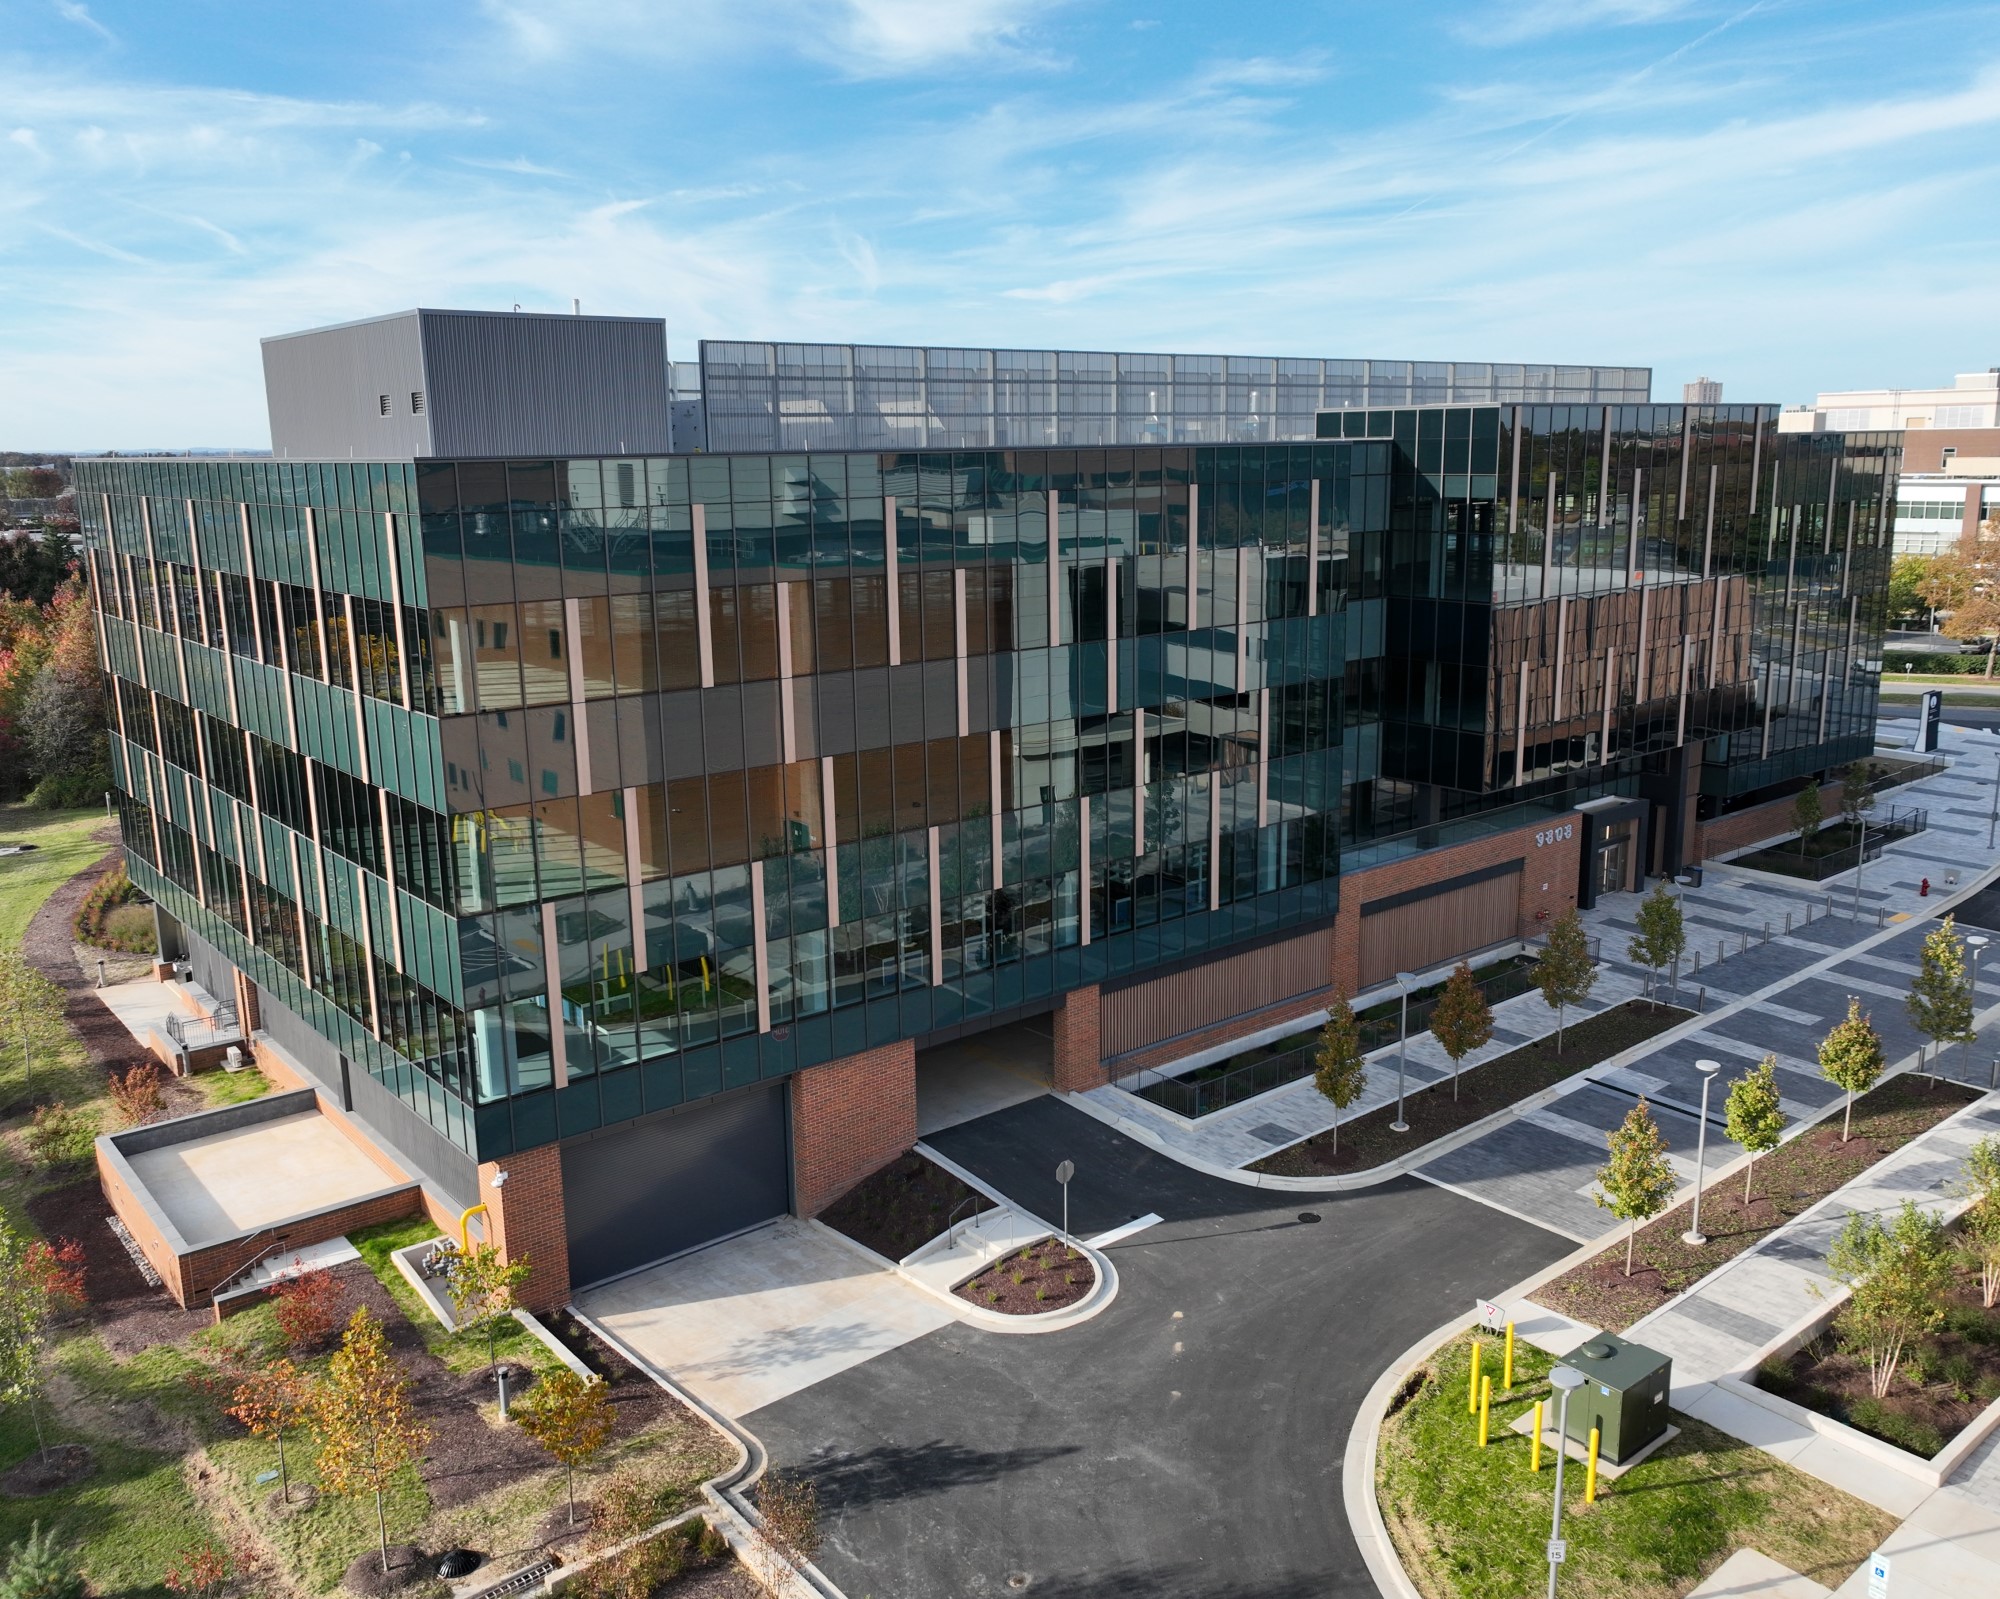 |
(1)Image represents 500 North Beacon Street on The Arsenal on the Charles mega campus.
Alexandria Real Estate Equities, Inc. All Rights Reserved. © 2024 | 36 |
New Class A/A+ Development and Redevelopment Properties: Recent Deliveries (continued) | |
September 30, 2024 | |
(Dollars in thousands) | |
Incremental Annual Net Operating Income Generated From YTD 3Q24 Deliveries
Aggregated $63 Million, Including $21 Million in 3Q24
Property/Market/Submarket | Our Ownership Interest | RSF Placed in Service | Occupancy Percentage(2) | Total Project | Unlevered Yields | |||||||||||||||||||||||||
3Q24 Delivery Date(1) | Prior to 1/1/24 | 1Q24 | 2Q24 | 3Q24 | Total | Initial Stabilized | Initial Stabilized (Cash Basis) | |||||||||||||||||||||||
RSF | Investment | |||||||||||||||||||||||||||||
Development projects | ||||||||||||||||||||||||||||||
99 Coolidge Avenue/Greater Boston/Cambridge/ Inner Suburbs | N/A | 75.0% | 43,568 | 72,846 | — | — | 116,414 | 100% | 320,809 | $468,000 | 7.1% | 7.0% | ||||||||||||||||||
500 North Beacon Street and 4 Kingsbury Avenue/ Greater Boston/Cambridge/Inner Suburbs | N/A | 100% | — | 100,624 | 37,913 | — | 138,537 | 100% | 248,018 | 427,000 | 6.2 | 5.5 | ||||||||||||||||||
1150 Eastlake Avenue East/Seattle/Lake Union | 7/16/24 | 100% | 278,282 | — | 2,079 | 31,270 | 311,631 | 100% | 311,631 | 442,000 | 6.6 | 6.7 | ||||||||||||||||||
9810 Darnestown Road/Maryland/Rockville | N/A | 100% | — | — | 195,435 | — | 195,435 | 100% | 195,435 | 135,000 | 7.1 | 6.2 | ||||||||||||||||||
9820 Darnestown Road/Maryland/Rockville | 8/21/24 | 100% | — | — | — | 250,000 | 250,000 | 100% | 250,000 | 177,000 | 8.7 | 5.6 | ||||||||||||||||||
9808 Medical Center Drive/Maryland/Rockville | 7/25/24 | 100% | 26,460 | — | 25,655 | 13,056 | 65,171 | 100% | 95,061 | 115,000 | 5.4 | 5.4 | ||||||||||||||||||
Redevelopment projects | ||||||||||||||||||||||||||||||
651 Gateway Boulevard/San Francisco Bay Area/ South San Francisco | 7/12/24 | 50.0% | — | 44,652 | — | 22,365 | 67,017 | 100% | 326,706 | 487,000 | 5.0 | 5.1 | ||||||||||||||||||
Alexandria Center® for Advanced Technologies – Monte Villa Parkway/Seattle/Bothell | N/A | 100% | 65,086 | 115,598 | — | — | 180,684 | 100% | 460,934 | 229,000 | 6.3 | 6.2 | ||||||||||||||||||
Canada | N/A | 100% | 44,862 | 9,725 | 23,900 | — | 78,487 | 100% | 250,790 | 113,000 | 6.4 | 6.3 | ||||||||||||||||||
Weighted average/total | 8/11/24 | 458,258 | 343,445 | 284,982 | 316,691 | 1,403,376 | 2,459,384 | $2,593,000 | 6.4% | 6.0% | ||||||||||||||||||||
Refer to “New Class A/A+ development and redevelopment properties: current projects” in the Supplemental Information for details on the square footage in service and under construction, if applicable.
(1)Represents the average delivery date for deliveries that occurred during the current quarter, weighted by annual rental revenue.
(2)Occupancy relates to total operating RSF placed in service as of the most recent delivery.
Alexandria Real Estate Equities, Inc. All Rights Reserved. © 2024 | 37 |
New Class A/A+ Development and Redevelopment Properties: Current Projects | |
September 30, 2024 | |
99 Coolidge Avenue | 500 North Beacon Street and 4 Kingsbury Avenue(1) | 311 Arsenal Street | 201 Brookline Avenue | 401 Park Drive | ||||
Greater Boston/ Cambridge/Inner Suburbs | Greater Boston/ Cambridge/Inner Suburbs | Greater Boston/ Cambridge/Inner Suburbs | Greater Boston/Fenway | Greater Boston/Fenway | ||||
204,395 RSF | 109,481 RSF | 308,446 RSF | 58,149 RSF | 159,959 RSF | ||||
40% Leased/Negotiating | 92% Leased | 21% Leased | 100% Leased | 14% Leased | ||||
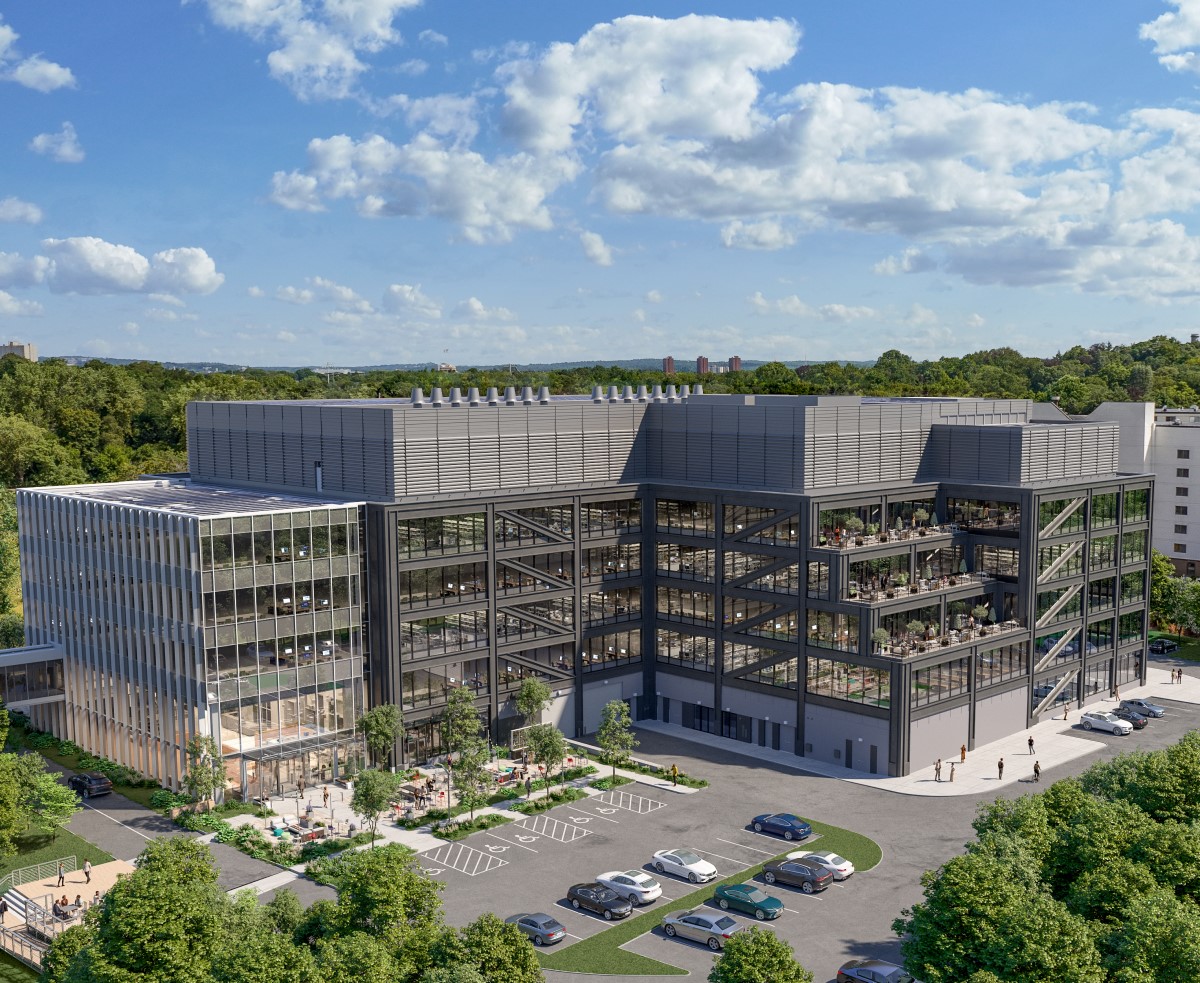 | | 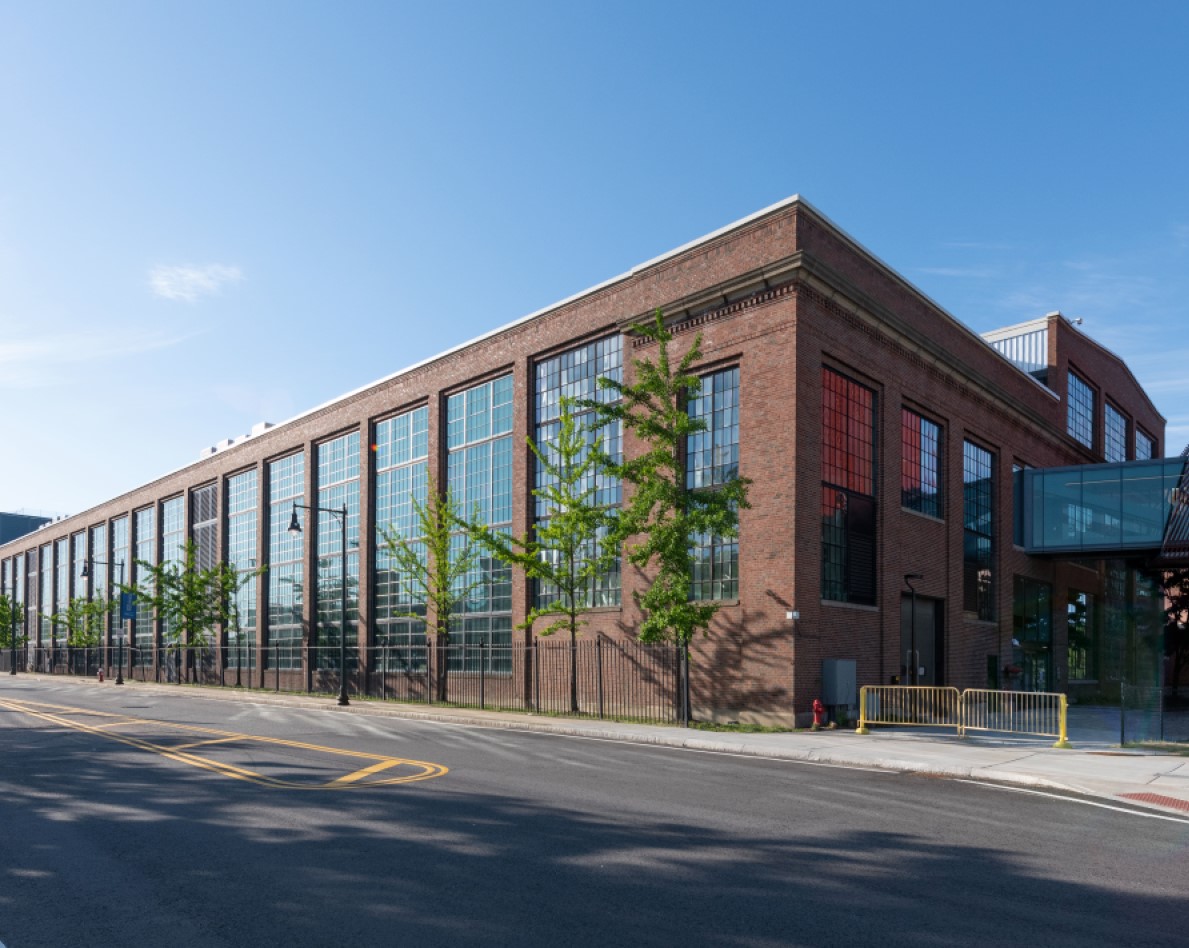 | 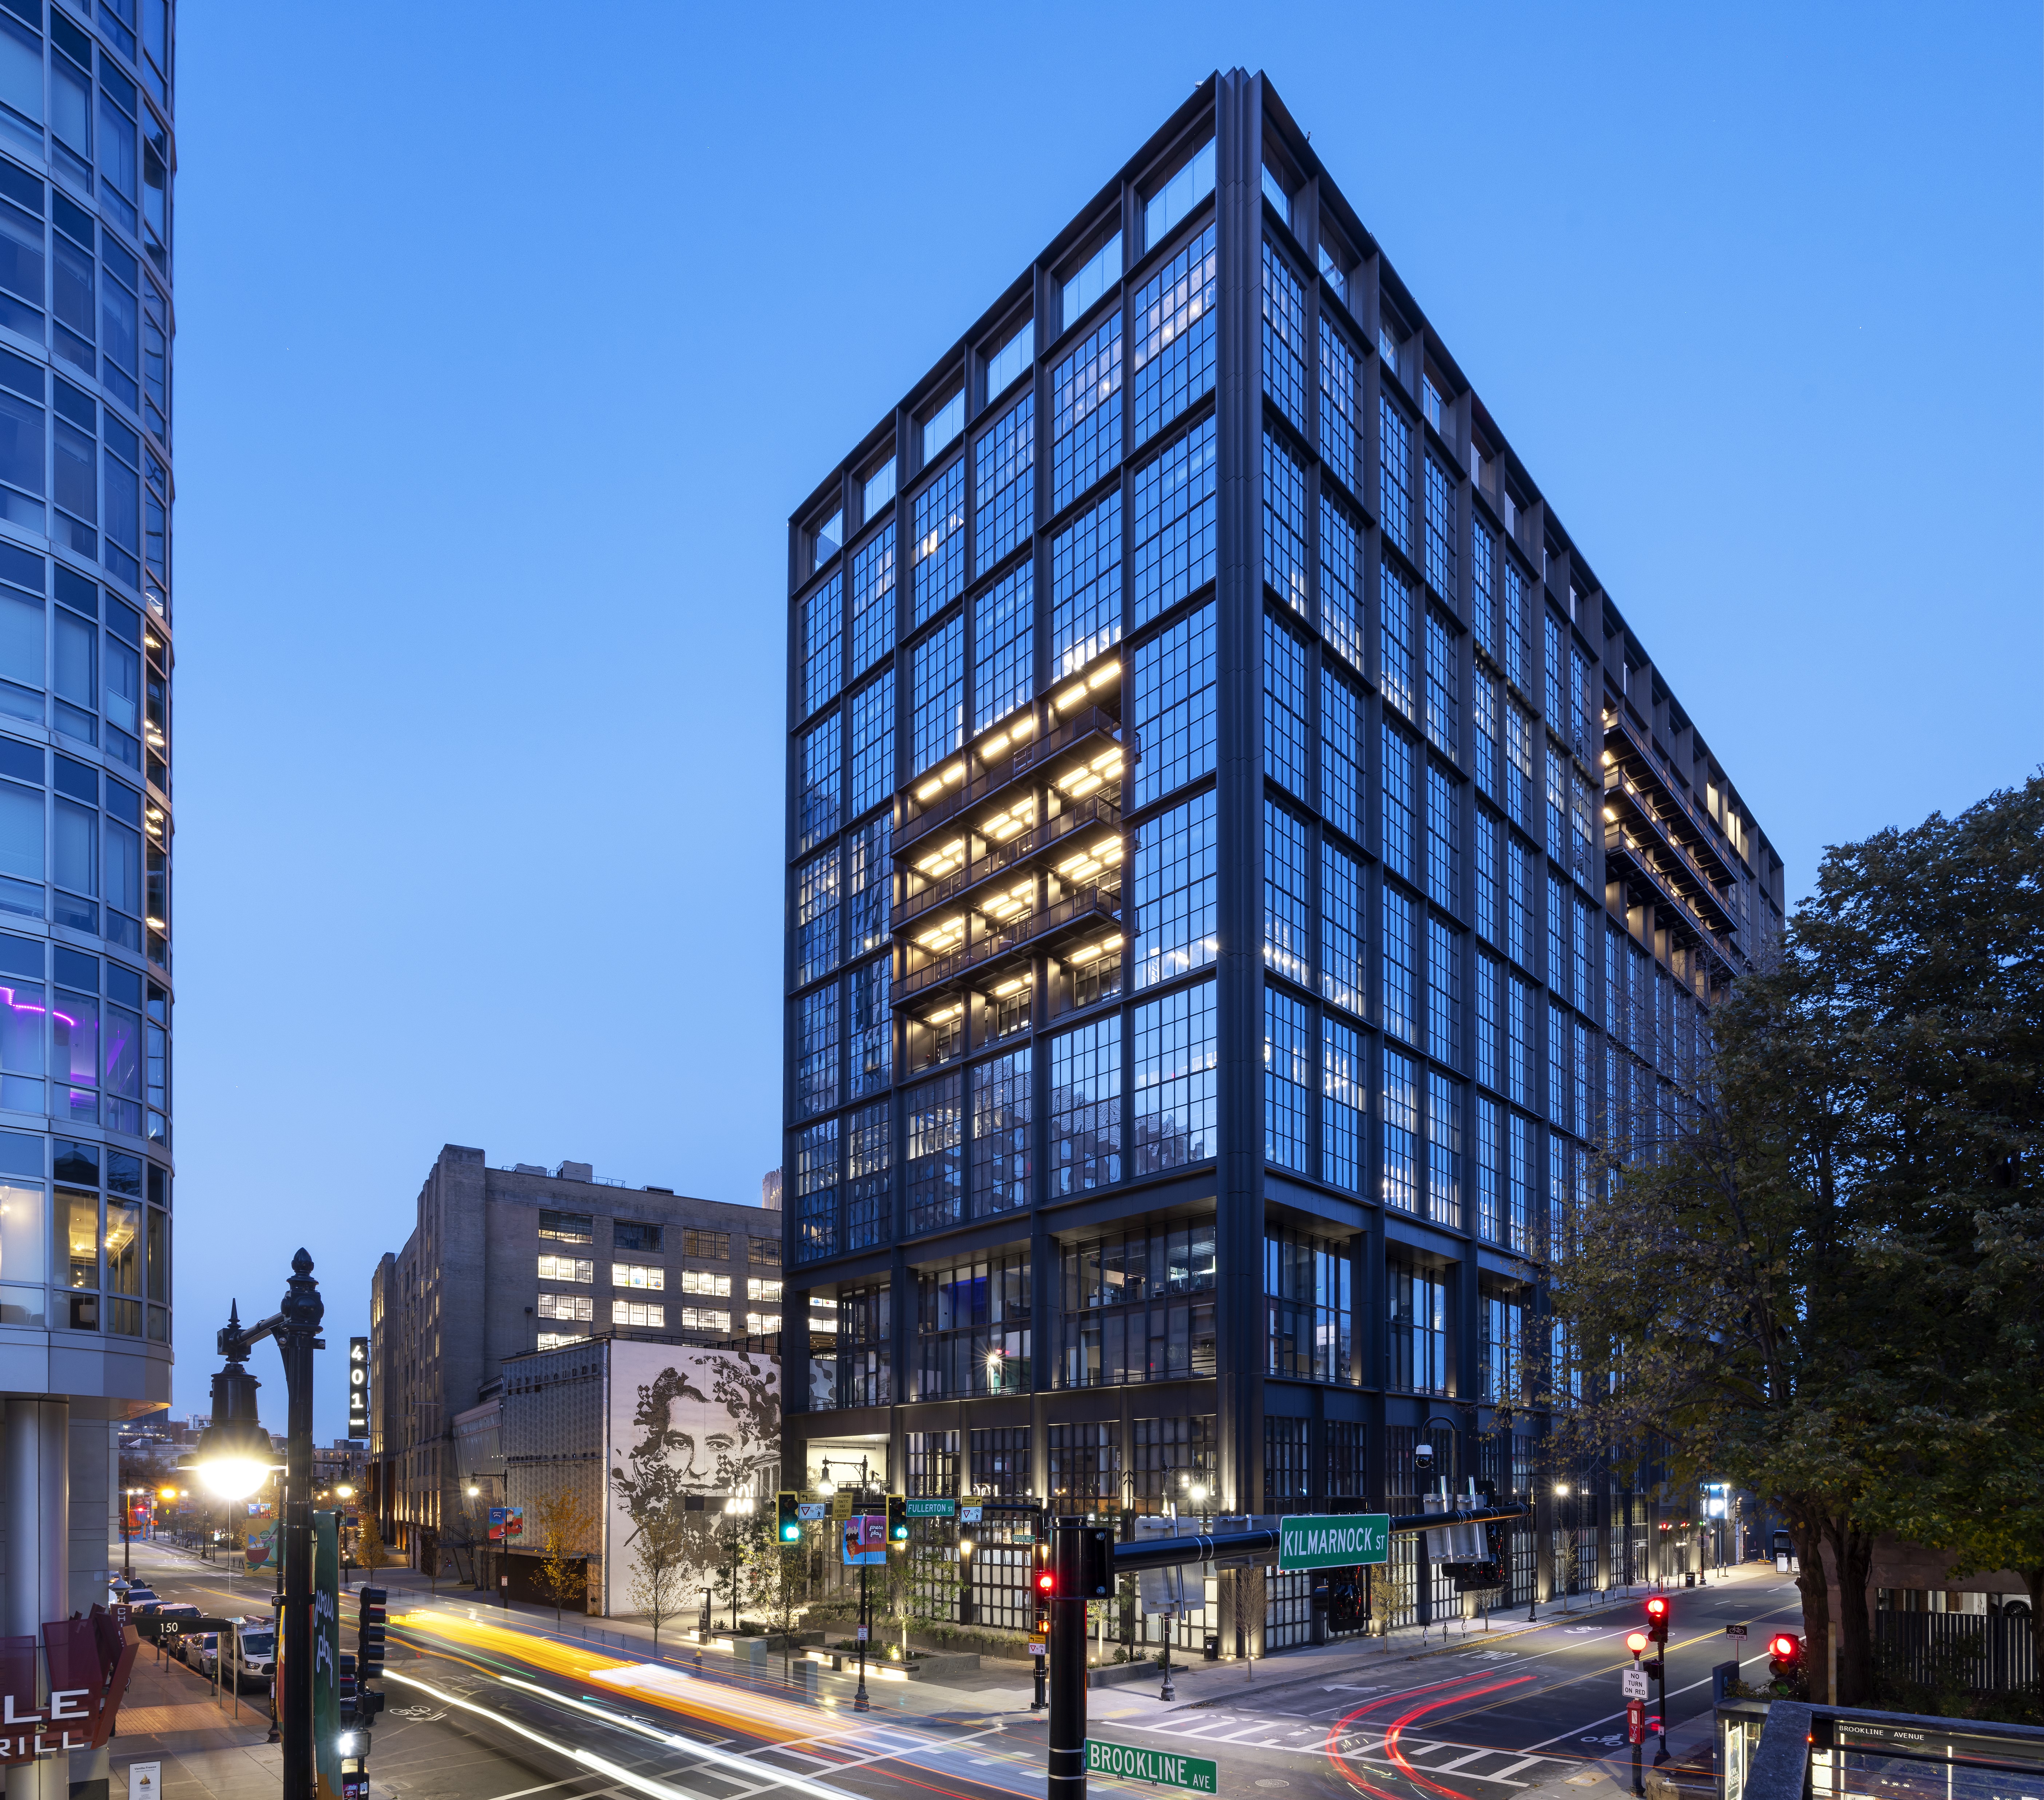 | 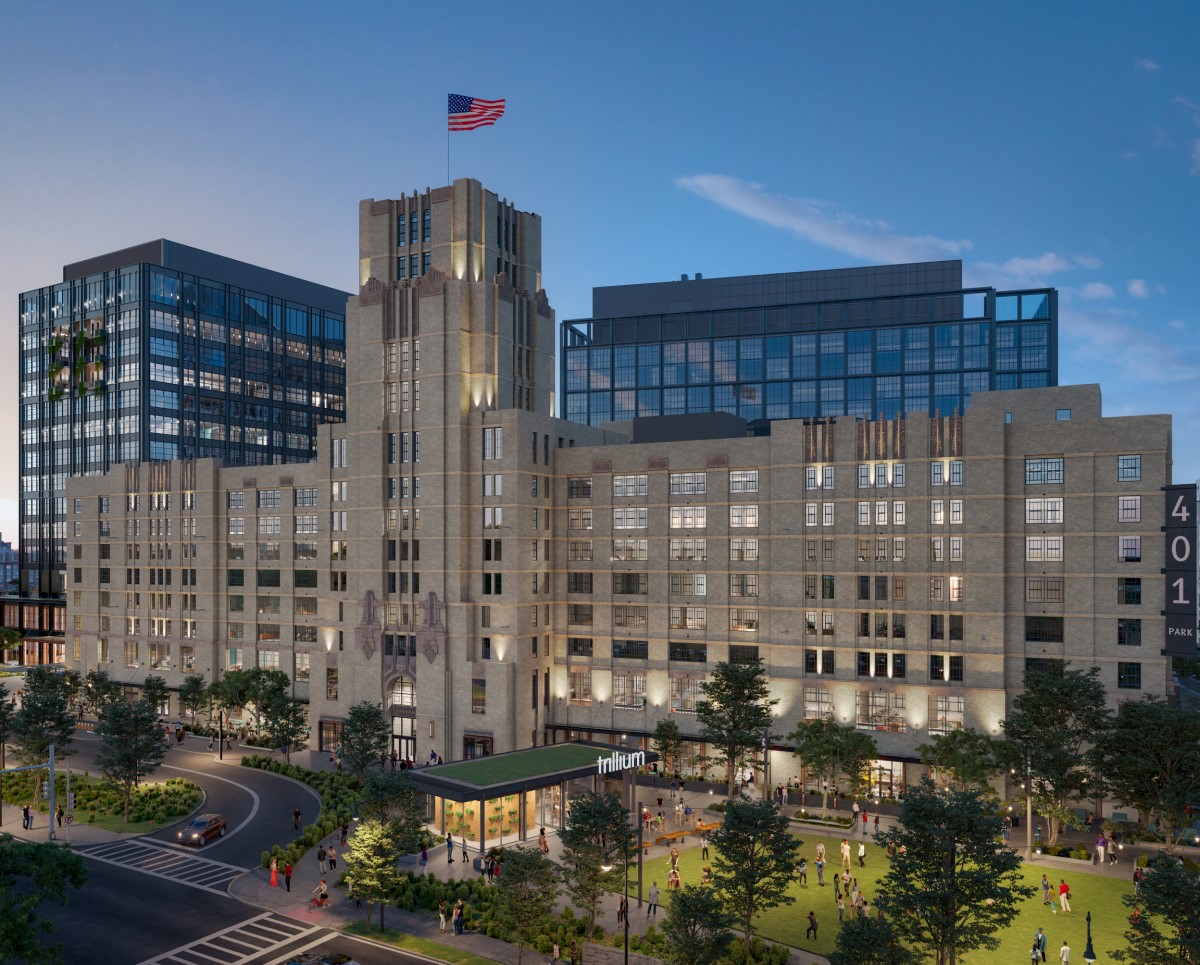 |
421 Park Drive | 40, 50, and 60 Sylvan Road(2) | 840 Winter Street | 1450 Owens Street(3) | 651 Gateway Boulevard | ||||
Greater Boston/Fenway | Greater Boston/Route 128 | Greater Boston/Route 128 | San Francisco Bay Area/ Mission Bay | San Francisco Bay Area/ South San Francisco | ||||
392,011 RSF | 596,064 RSF | 139,680 RSF | 212,796 RSF | 259,689 RSF | ||||
13% Leased | 31% Leased | 100% Leased | —% Leased/Negotiating | 25% Leased/Negotiating | ||||
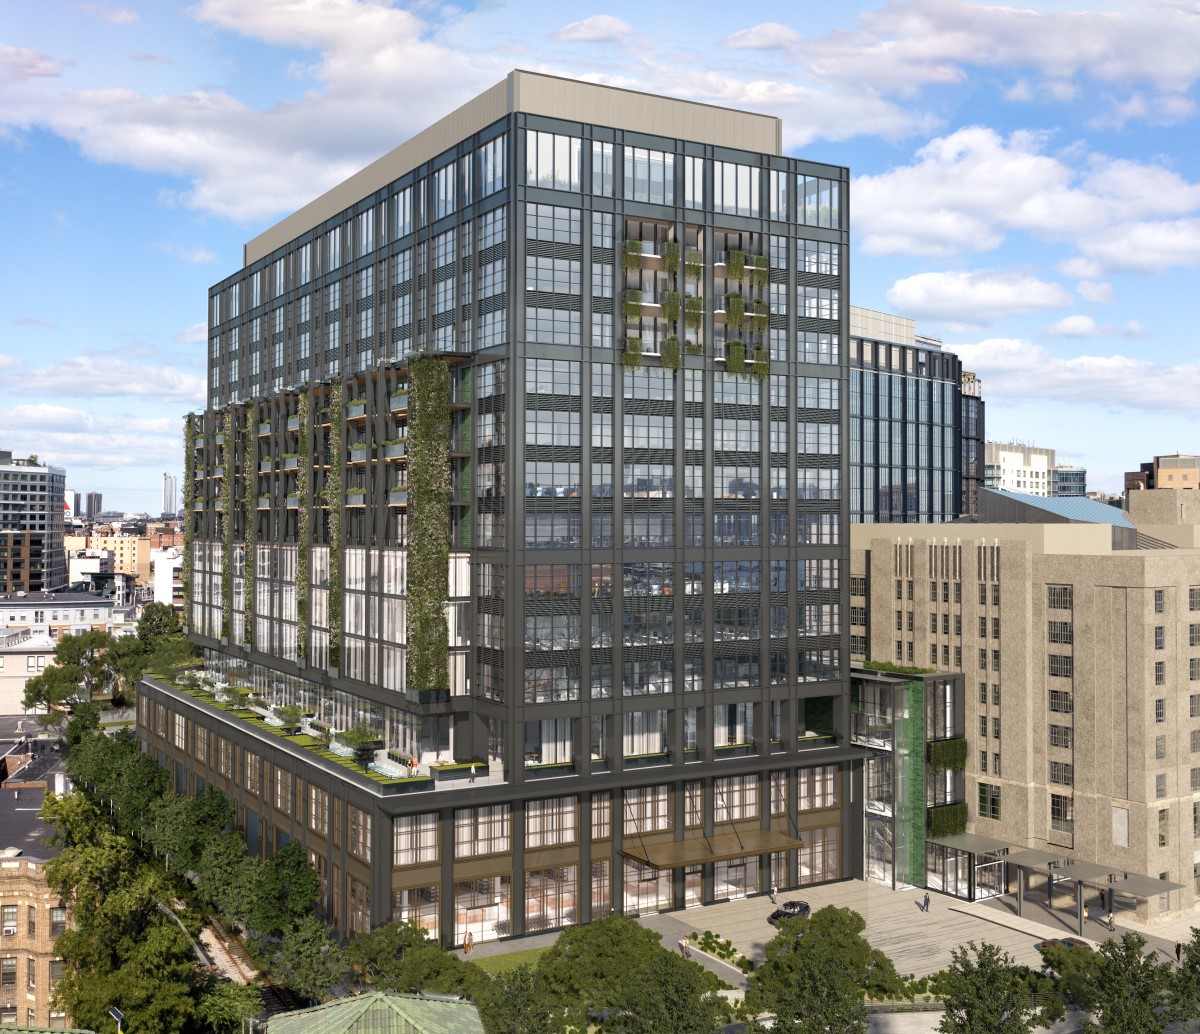 |  | 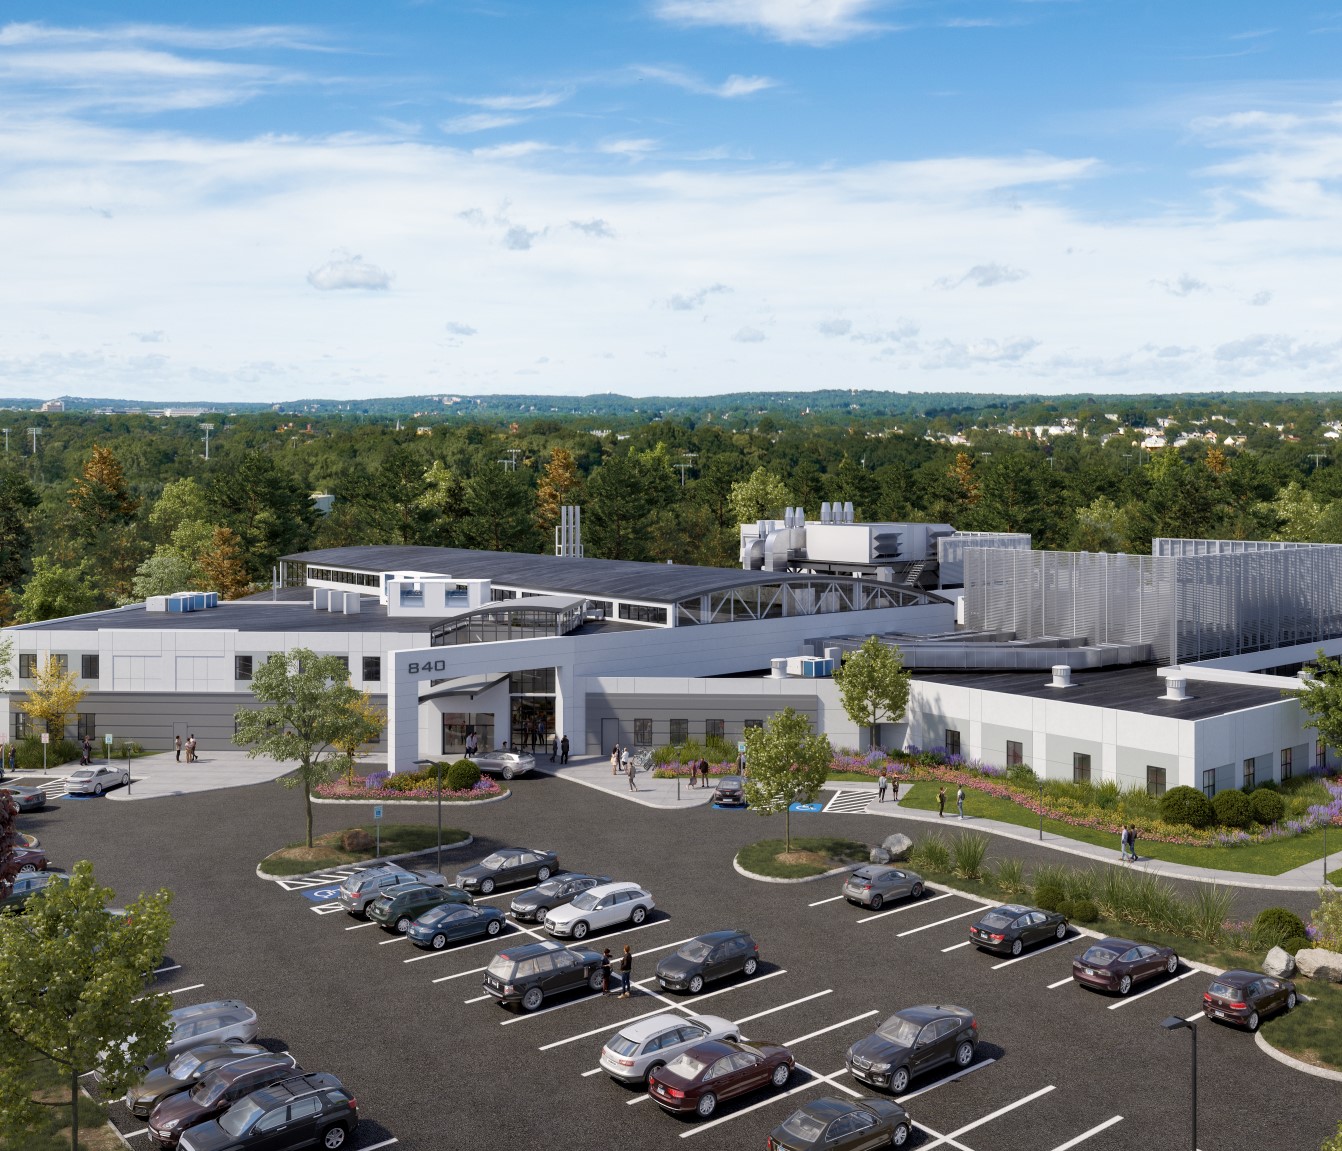 | 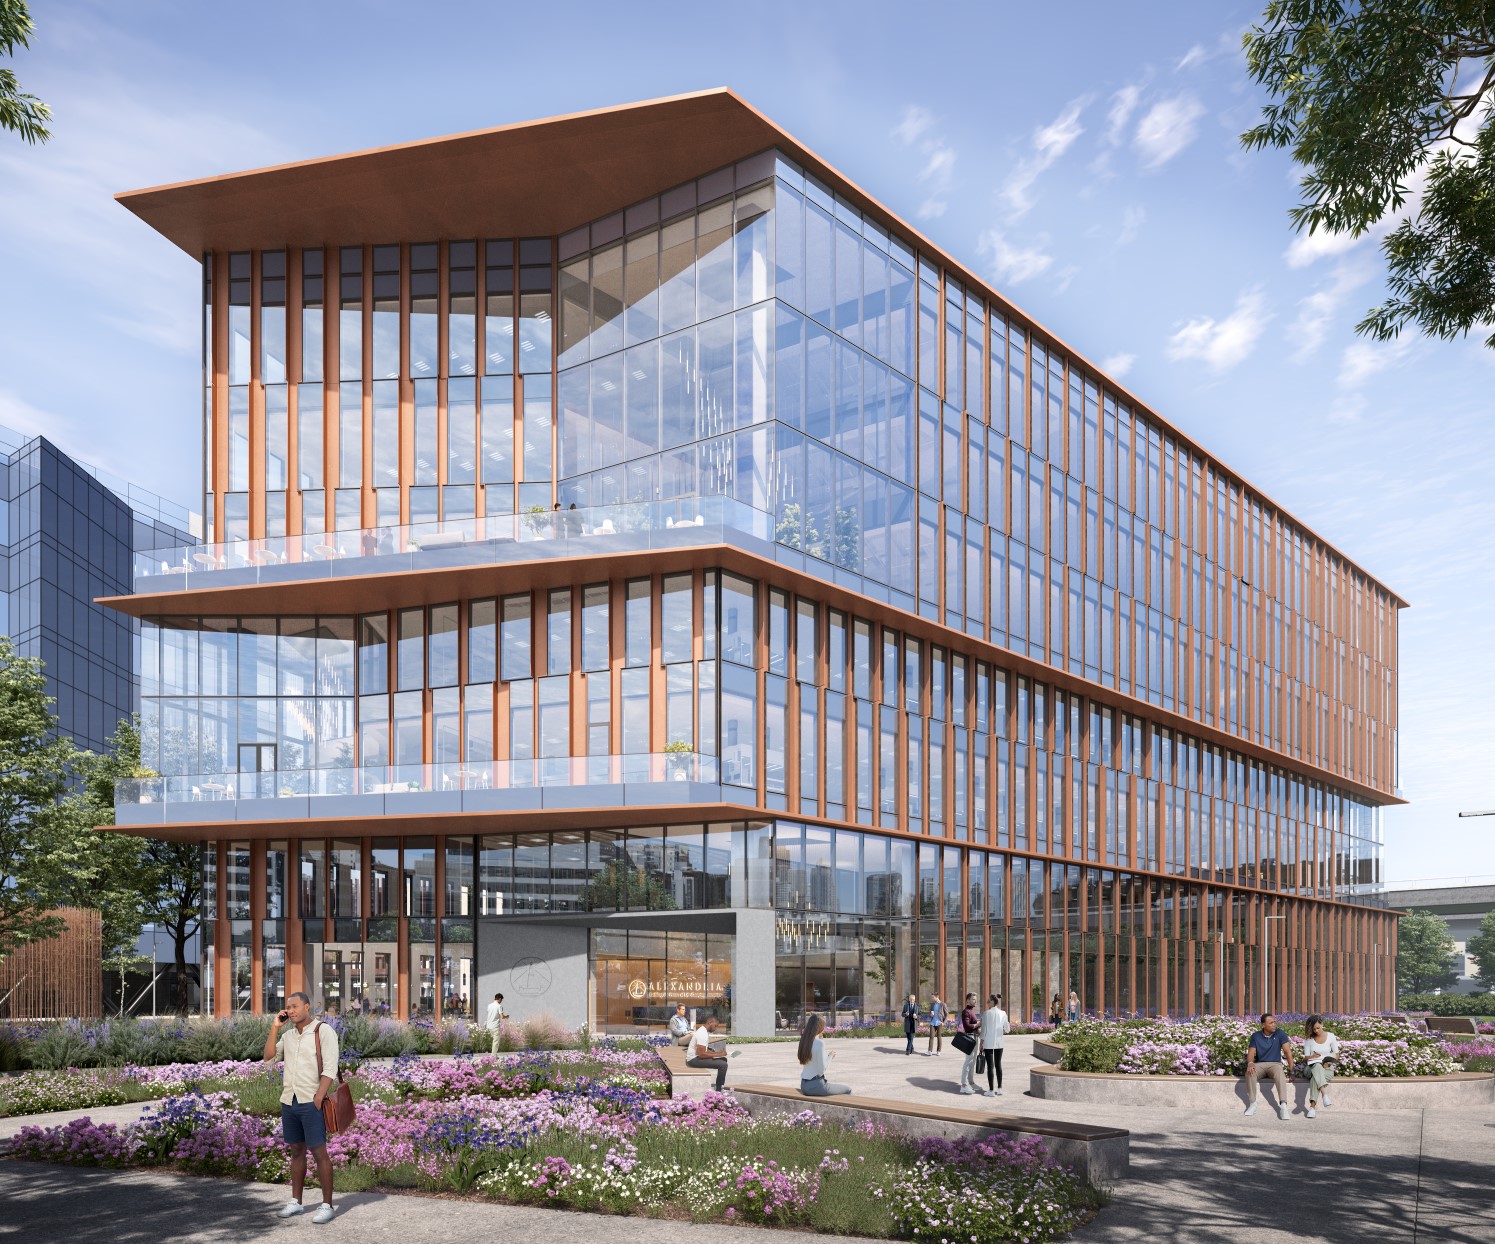 | |
(1)Image represents 500 North Beacon Street on The Arsenal on the Charles mega campus.
(2)Image represents 60 Sylvan Road on the Alexandria Center® for Life Science – Waltham mega campus. The project is expected to capture demand in our Route 128 submarket.
(3)Image represents a multi-tenant project expanding our existing Alexandria Center® for Science and Technology – Mission Bay mega campus, where our joint venture partner will fund 100% of the construction cost until it attains an
ownership interest of 75%, after which it will contribute its respective share of additional capital. We are in negotiations with a biomedical institution for the sale of a 50% condominium interest in this property.
Alexandria Real Estate Equities, Inc. All Rights Reserved. © 2024 | 38 |
New Class A/A+ Development and Redevelopment Properties: Current Projects (continued) | |
September 30, 2024 | |
230 Harriet Tubman Way | 10935, 10945, and 10955 Alexandria Way(1) | 4135 Campus Point Court | 4155 Campus Point Court | |||
San Francisco Bay Area/ South San Francisco | San Diego/Torrey Pines | San Diego/ University Town Center | San Diego/ University Town Center | |||
285,346 RSF | 334,996 RSF | 426,927 RSF | 171,102 RSF | |||
100% Leased | 100% Leased | 100% Leased | 100% Leased | |||
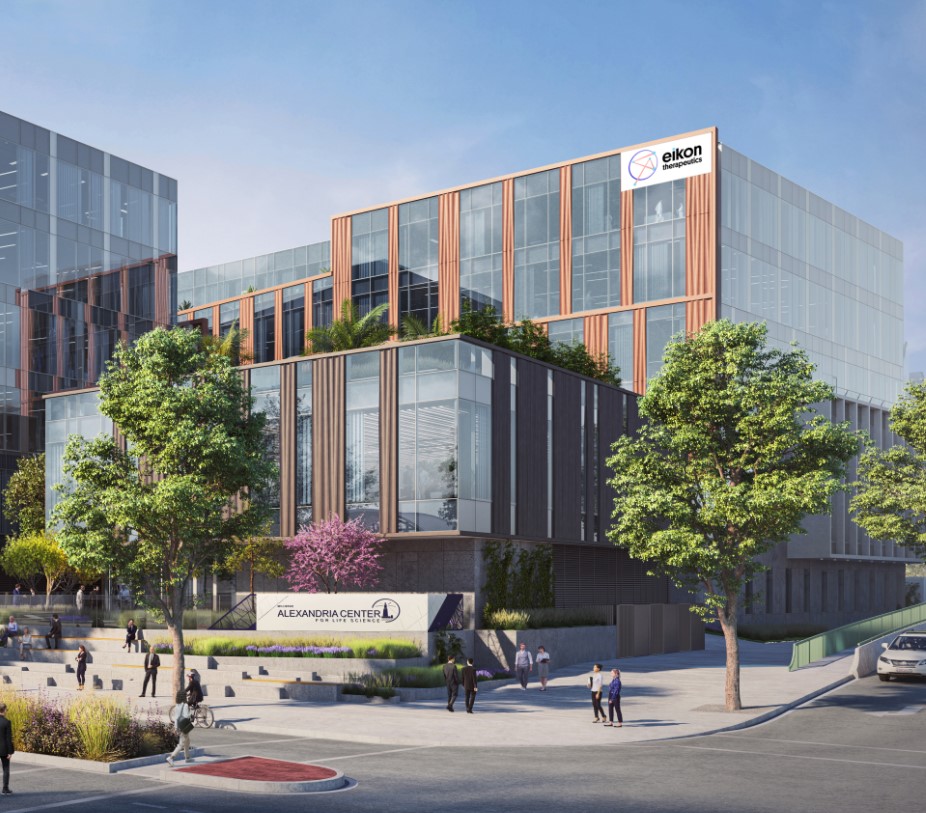 | 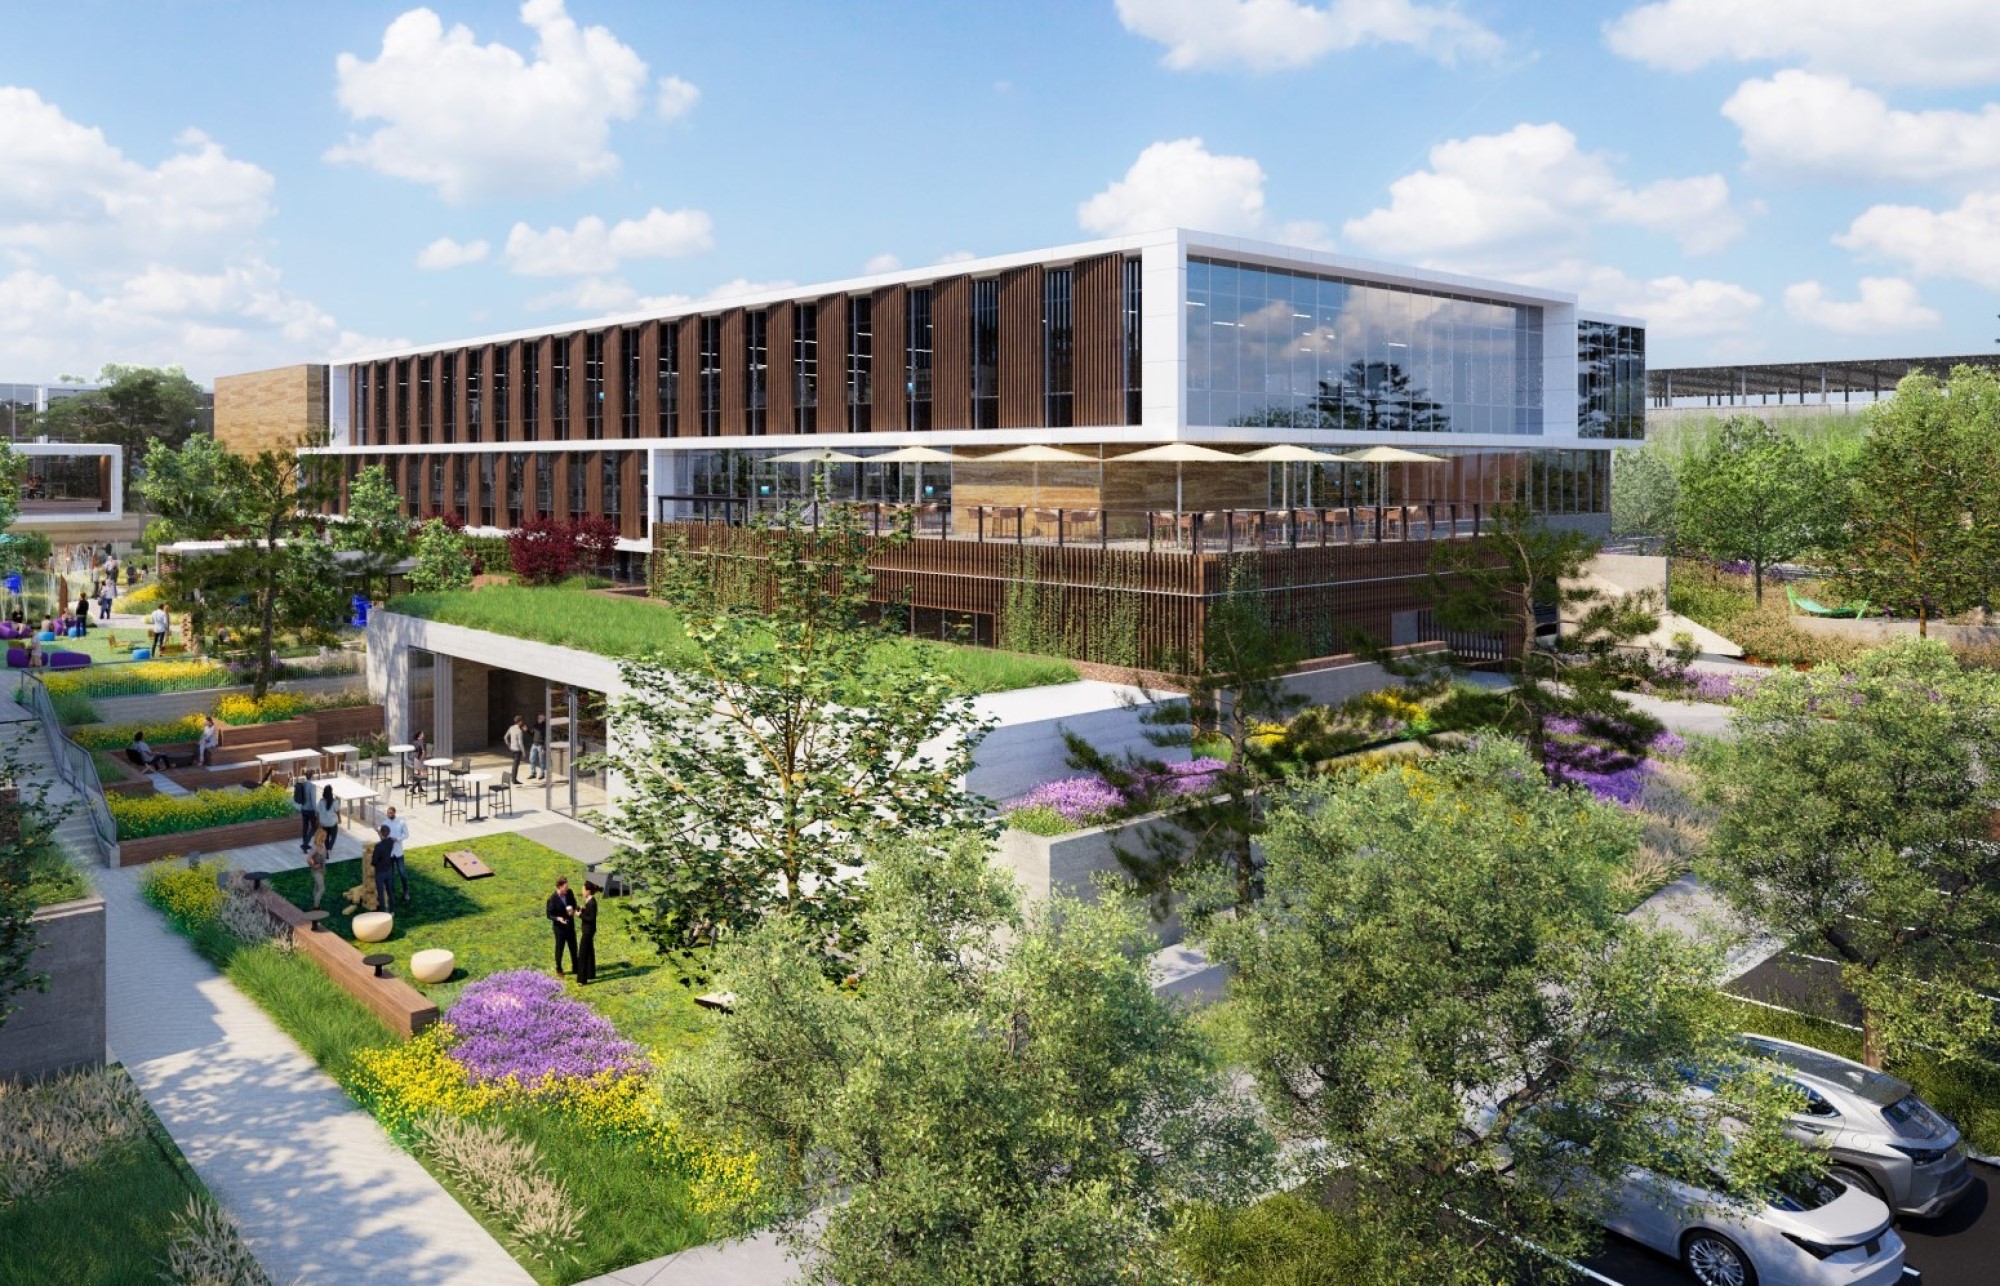 | 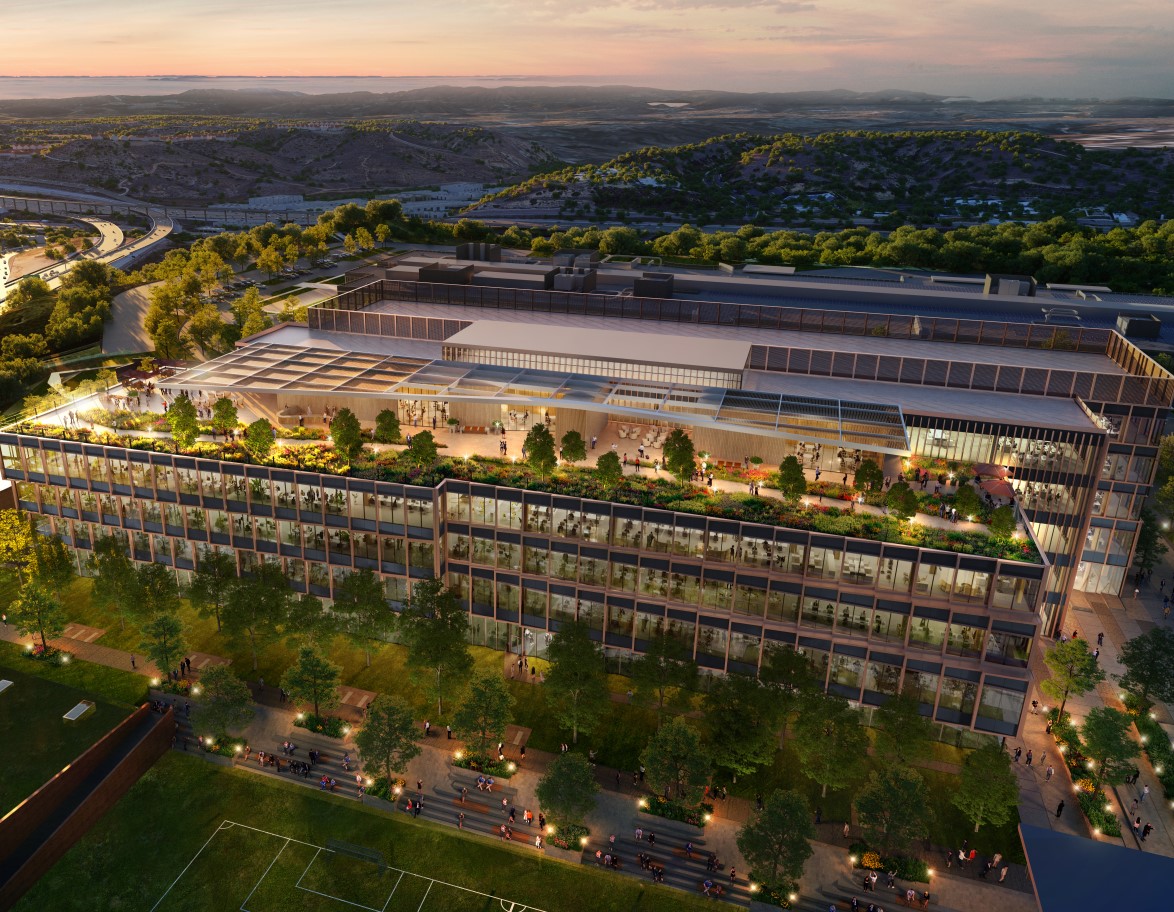 | 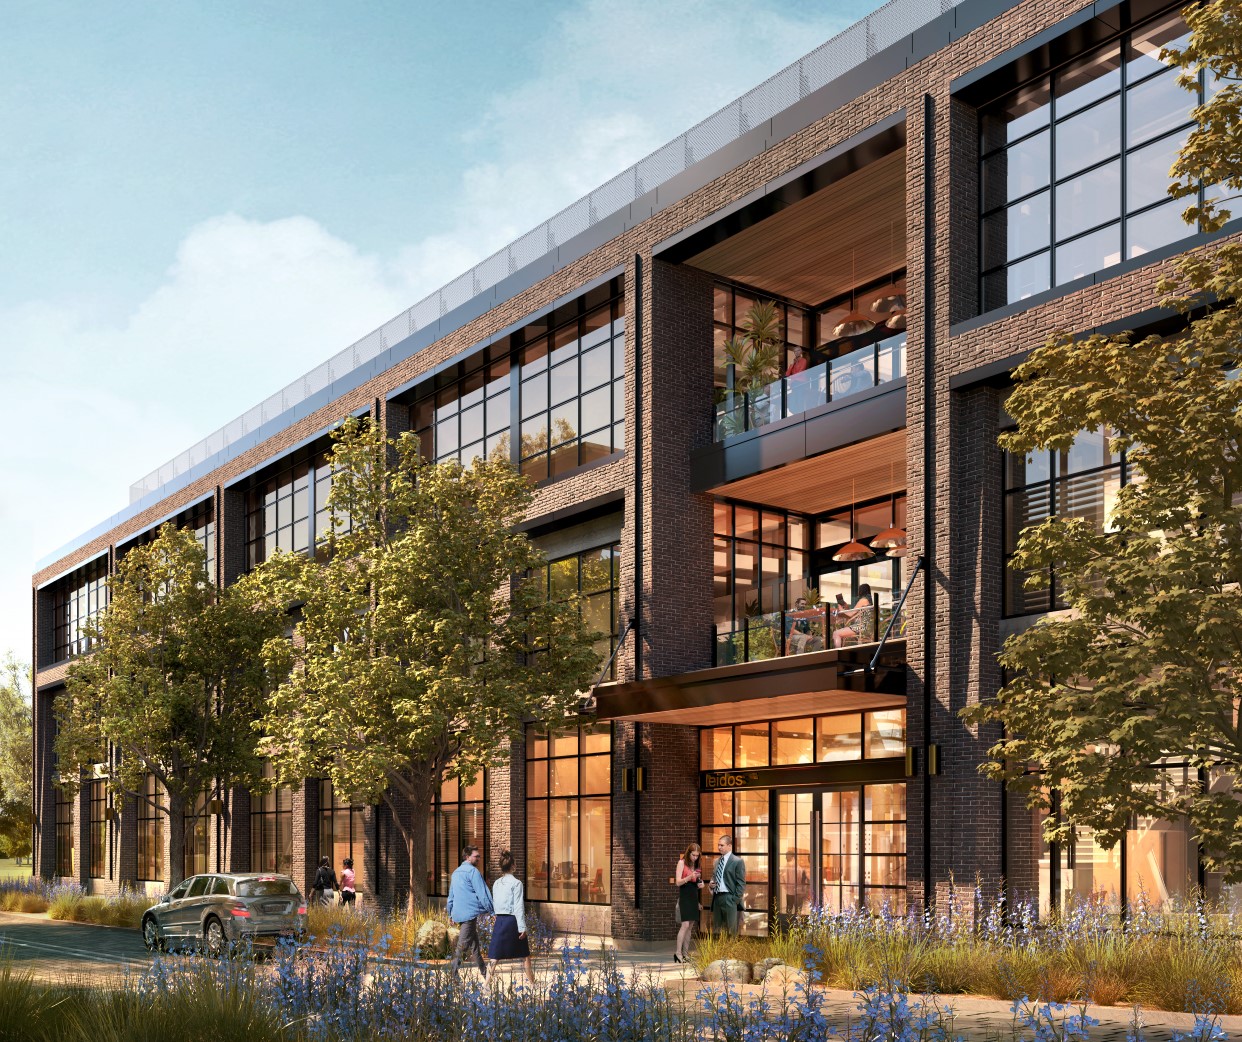 |
10075 Barnes Canyon Road | 701 Dexter Avenue North(2) | Alexandria Center® for Advanced Technologies – Monte Villa Parkway(3) | 9808 Medical Center Drive | 8800 Technology Forest Place | ||||
San Diego/Sorrento Mesa | Seattle/Lake Union | Seattle/Bothell | Maryland/Rockville | Texas/Greater Houston | ||||
253,079 RSF | 227,577 RSF | 34,306 RSF | 29,890 RSF | 73,298 RSF | ||||
70% Leased | —% Leased/Negotiating | 98% Leased | 76% Leased/Negotiating | 41% Leased | ||||
 | 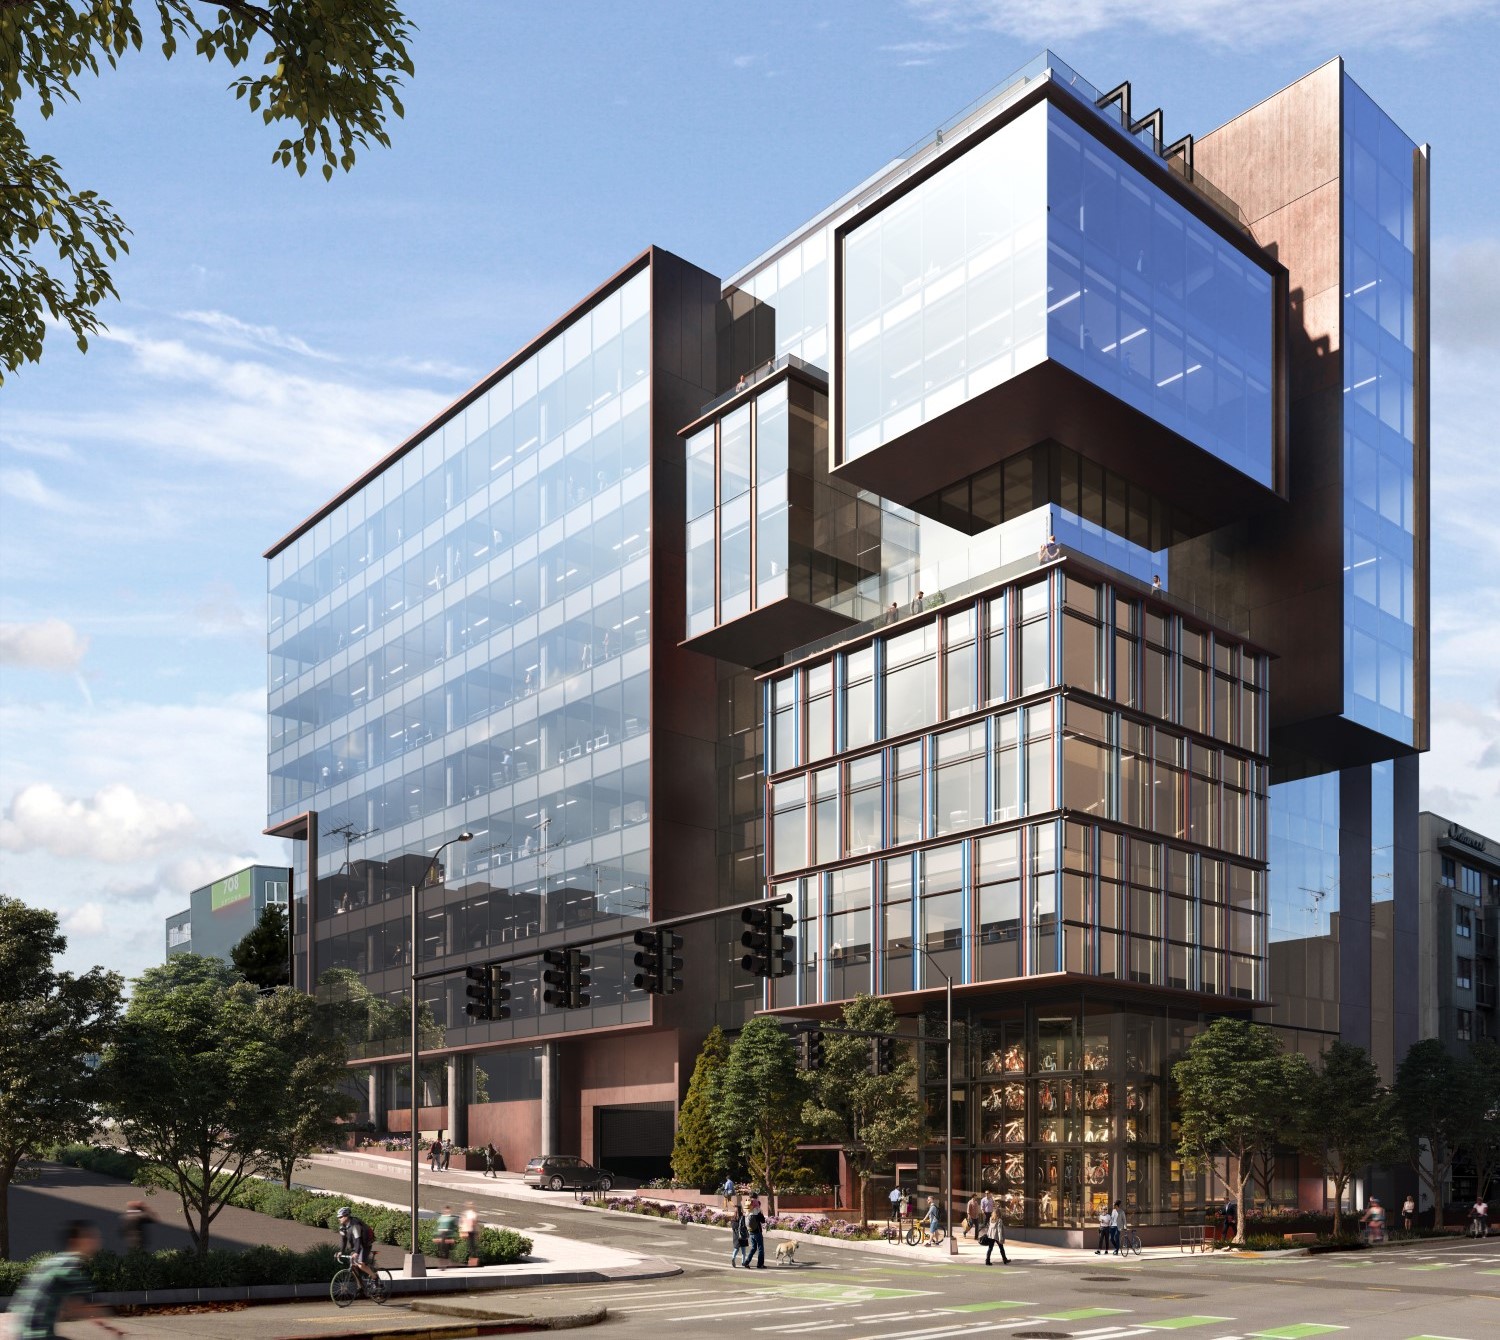 | 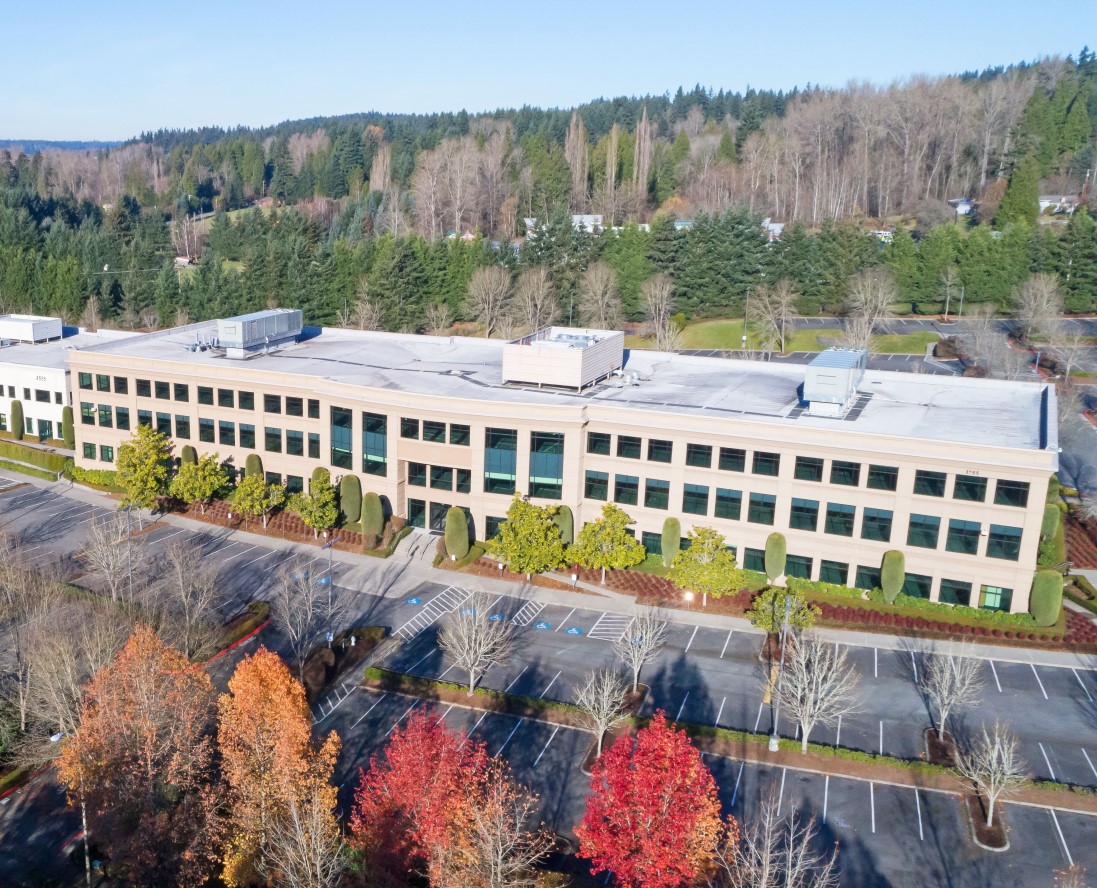 | | 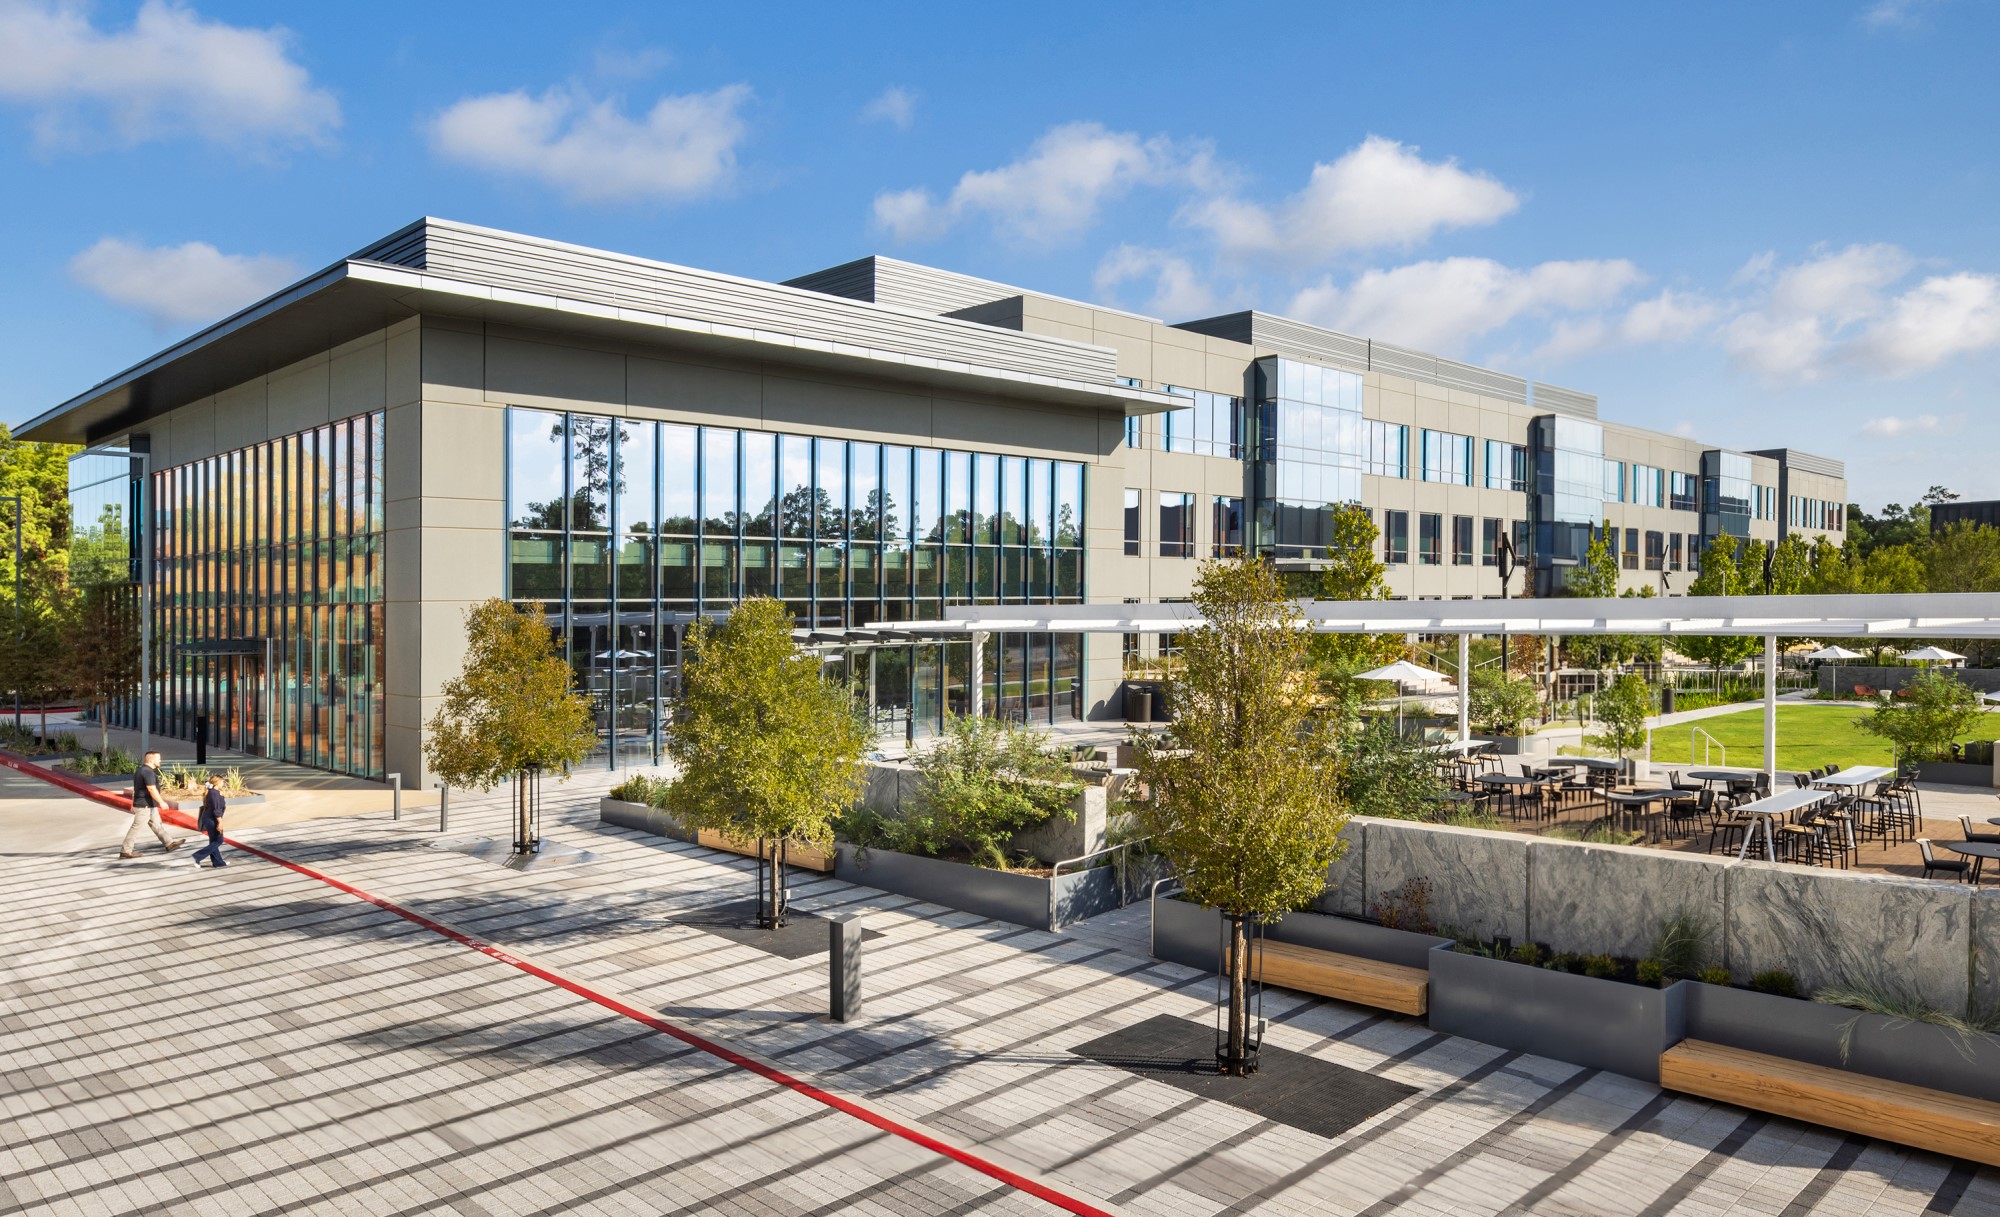 |
(1)Image represents 10955 Alexandria Way on the One Alexandria Square mega campus.
(2)We initially started this project due to strong demand from neighboring tenants but strategically paused in the first quarter of 2023. We have resumed construction activities at this project in order to maintain our existing entitlements and
permits. We have interest from various prospective tenants, including from multinational pharmaceutical companies. Beyond this purpose-built life science asset, there is no competitive supply expected to be delivered in 2025 or 2026 in
our Lake Union submarket. As of September 30, 2024, we are 95.3% occupied in our Lake Union submarket.
(3)Image represents 3755 Monte Villa Parkway.
Alexandria Real Estate Equities, Inc. All Rights Reserved. © 2024 | 39 |
New Class A/A+ Development and Redevelopment Properties: Current Projects (continued) | |
September 30, 2024 | |
Property/Market/Submarket | Square Footage | Percentage | Occupancy(1) | |||||||||||||||||
Dev/Redev | In Service | CIP | Total | Leased | Leased/ Negotiating | Initial | Stabilized | |||||||||||||
Under construction | ||||||||||||||||||||
2024 and 2025 stabilization | ||||||||||||||||||||
500 North Beacon Street and 4 Kingsbury Avenue/Greater Boston/ Cambridge/Inner Suburbs | Dev | 138,537 | 109,481 | 248,018 | 92% | 92% | 1Q24 | 2025 | ||||||||||||
201 Brookline Avenue/Greater Boston/Fenway | Dev | 451,967 | 58,149 | 510,116 | 100 | 100 | 3Q22 | 4Q24 | ||||||||||||
840 Winter Street/Greater Boston/Route 128 | Redev | 28,534 | 139,680 | 168,214 | 100 | 100 | 4Q24 | 2025 | ||||||||||||
230 Harriet Tubman Way/San Francisco Bay Area/South San Francisco | Dev | — | 285,346 | 285,346 | 100 | 100 | 1Q25 | 1Q25 | ||||||||||||
4155 Campus Point Court/San Diego/University Town Center | Dev | — | 171,102 | 171,102 | 100 | 100 | 4Q24 | 4Q24 | ||||||||||||
Alexandria Center® for Advanced Technologies – Monte Villa Parkway/Seattle/Bothell | Redev | 426,628 | 34,306 | 460,934 | 98 | 98 | 1Q23 | 4Q24 | ||||||||||||
9808 Medical Center Drive/Maryland/Rockville | Dev | 65,171 | 29,890 | 95,061 | 69 | 76 | 3Q23 | 4Q24 | ||||||||||||
8800 Technology Forest Place/Texas/Greater Houston | Redev | 50,094 | 73,298 | 123,392 | 41 | 41 | 2Q23 | 2025 | ||||||||||||
Canada | Redev | 111,479 | 139,311 | 250,790 | 73 | 73 | 3Q23 | 2025 | ||||||||||||
1,272,410 | 1,040,563 | 2,312,973 | 91 | 92 | ||||||||||||||||
2026 and beyond stabilization | ||||||||||||||||||||
One Hampshire Street/Greater Boston/Cambridge | Redev | — | 104,956 | 104,956 | — | — | 2027 | 2028 | ||||||||||||
311 Arsenal Street/Greater Boston/Cambridge/Inner Suburbs | Redev | 82,216 | (2) | 308,446 | 390,662 | 21 | 21 | 2027 | 2027 | |||||||||||
99 Coolidge Avenue/Greater Boston/Cambridge/Inner Suburbs | Dev | 116,414 | 204,395 | 320,809 | 40 | 40 | 4Q23 | 2026 | ||||||||||||
401 Park Drive/Greater Boston/Fenway | Redev | — | 159,959 | 159,959 | 14 | 14 | 2024 | 2026 | ||||||||||||
421 Park Drive/Greater Boston/Fenway | Dev | — | 392,011 | 392,011 | 13 | 13 | 2026 | 2027 | ||||||||||||
40, 50, and 60 Sylvan Road/Greater Boston/Route 128 | Redev | — | 596,064 | 596,064 | 31 | 31 | 2025 | 2027 | ||||||||||||
Other/Greater Boston | Redev | — | 453,869 | 453,869 | — | — | (3) | 2027 | 2027 | |||||||||||
1450 Owens Street/San Francisco Bay Area/Mission Bay | Dev | — | 212,796 | 212,796 | — | — | (4) | 2025 | 2026 | |||||||||||
651 Gateway Boulevard/San Francisco Bay Area/South San Francisco | Redev | 67,017 | 259,689 | 326,706 | 21 | 25 | 1Q24 | 2026 | ||||||||||||
10935, 10945, and 10955 Alexandria Way/San Diego/Torrey Pines | Dev | — | 334,996 | 334,996 | 100 | 100 | 4Q24 | 2026 | ||||||||||||
4135 Campus Point Court/San Diego/University Town Center | Dev | — | 426,927 | 426,927 | 100 | 100 | 2026 | 2026 | ||||||||||||
10075 Barnes Canyon Road/San Diego/Sorrento Mesa | Dev | — | 253,079 | 253,079 | 70 | 70 | 2025 | 2026 | ||||||||||||
701 Dexter Avenue North/Seattle/Lake Union | Dev | — | 227,577 | 227,577 | — | — | (5) | 2026 | 2027 | |||||||||||
265,647 | 3,934,764 | 4,200,411 | 35 | 36 | ||||||||||||||||
1,538,057 | 4,975,327 | 6,513,384 | 55 | 55 | ||||||||||||||||
Committed near-term project expected to commence construction in the next two years | ||||||||||||||||||||
4165 Campus Point Court/San Diego/University Town Center | Dev | — | 492,570 | 492,570 | — | 51 | ||||||||||||||
Total | 1,538,057 | 5,467,897 | 7,005,954 | 51% | 55% | |||||||||||||||
(1)Initial occupancy dates are subject to leasing and/or market conditions. Stabilized occupancy may vary depending on single tenancy versus multi-tenancy. Multi-tenant projects may increase in occupancy over a period of time. (2)We expect to redevelop an additional 25,312 RSF of space occupied as of September 30, 2024 into laboratory space upon expiration of the existing leases through 1H25. Refer to “Investments in real estate” under “Definitions and reconciliations” in the Supplemental Information for additional details. (3)Represents a project focused on demand from our existing tenants in our adjacent properties/campuses that will address demand from other non-Alexandria properties/campuses. (4)Represents a multi-tenant project expanding our existing mega campus, where our joint venture partner will fund 100% of the construction cost until it attains an ownership interest of 75%, after which it will contribute its respective share of additional capital. We are in negotiations with a biomedical institution for the sale of a 50% condominium interest in this property. (5)We initially started this project due to strong demand from neighboring tenants but strategically paused in the first quarter of 2023. We have resumed construction activities at this project in order to maintain our existing entitlements and permits. We have interest from various prospective tenants, including from multinational pharmaceutical companies. Beyond this purpose-built life science asset, there is no competitive supply expected to be delivered in 2025 or 2026 in our Lake Union submarket. As of September 30, 2024, we are 95.3% occupied in our Lake Union submarket. | ||||||||||||||||||||
Alexandria Real Estate Equities, Inc. All Rights Reserved. © 2024 | 40 |
New Class A/A+ Development and Redevelopment Properties: Current Projects (continued) | |
| |
September 30, 2024 | |
(Dollars in thousands) | |
Our Ownership Interest | At 100% | Unlevered Yields | |||||||||||||||||
Property/Market/Submarket | In Service | CIP | Cost to Complete | Total at Completion | Initial Stabilized | Initial Stabilized (Cash Basis) | |||||||||||||
Under construction | |||||||||||||||||||
2024 and 2025 stabilization | |||||||||||||||||||
500 North Beacon Street and 4 Kingsbury Avenue/Greater Boston/ Cambridge/Inner Suburbs | 100% | $284,645 | $115,506 | $26,849 | $427,000 | 6.2% | 5.5% | ||||||||||||
201 Brookline Avenue/Greater Boston/Fenway | 99.0% | 665,877 | 91,610 | 17,513 | 775,000 | 7.2% | 6.5% | ||||||||||||
840 Winter Street/Greater Boston/Route 128 | 100% | 13,653 | 187,366 | 35,981 | 237,000 | 7.6% | 6.5% | ||||||||||||
230 Harriet Tubman Way/San Francisco Bay Area/South San Francisco | 47.9% | — | 350,231 | 159,769 | 510,000 | 7.4% | 6.4% | ||||||||||||
4155 Campus Point Court/San Diego/University Town Center | 55.0% | — | 140,300 | 43,700 | 184,000 | 8.0% | 6.4% | ||||||||||||
Alexandria Center® for Advanced Technologies – Monte Villa Parkway/Seattle/Bothell | 100% | 193,823 | 11,977 | 23,200 | 229,000 | 6.3% | 6.2% | ||||||||||||
9808 Medical Center Drive/Maryland/Rockville | 100% | 79,320 | 33,018 | 2,662 | 115,000 | 5.4% | 5.4% | ||||||||||||
8800 Technology Forest Place/Texas/Greater Houston | 100% | 57,315 | 46,202 | 8,483 | 112,000 | 6.3% | 6.0% | ||||||||||||
Canada | 100% | 50,219 | 50,044 | 12,737 | 113,000 | 6.4% | 6.3% | ||||||||||||
1,344,852 | 1,026,254 | ||||||||||||||||||
2026 and beyond stabilization(1) | |||||||||||||||||||
One Hampshire Street/Greater Boston/Cambridge | 100% | — | 161,328 | TBD | |||||||||||||||
311 Arsenal Street/Greater Boston/Cambridge/Inner Suburbs | 100% | 60,625 | 233,563 | ||||||||||||||||
99 Coolidge Avenue/Greater Boston/Cambridge/Inner Suburbs | 75.0% | 136,527 | 192,432 | 139,041 | 468,000 | 7.1% | 7.0% | ||||||||||||
401 Park Drive/Greater Boston/Fenway | 100% | — | 194,421 | TBD | |||||||||||||||
421 Park Drive/Greater Boston/Fenway | 99.7% | — | 422,278 | ||||||||||||||||
40, 50, and 60 Sylvan Road/Greater Boston/Route 128 | 100% | — | 437,356 | ||||||||||||||||
Other/Greater Boston | 100% | — | 148,804 | ||||||||||||||||
1450 Owens Street/San Francisco Bay Area/Mission Bay | 25.4% | — | 234,665 | ||||||||||||||||
651 Gateway Boulevard/San Francisco Bay Area/South San Francisco | 50.0% | 87,357 | 256,413 | 143,230 | 487,000 | 5.0% | 5.1% | ||||||||||||
10935, 10945, and 10955 Alexandria Way/San Diego/Torrey Pines | 100% | — | 359,926 | 143,074 | 503,000 | 6.2% | 5.8% | ||||||||||||
4135 Campus Point Court/San Diego/University Town Center | 55.0% | — | 292,913 | 231,087 | 524,000 | 6.6% | 6.2% | ||||||||||||
10075 Barnes Canyon Road/San Diego/Sorrento Mesa | 50.0% | — | 168,582 | 152,418 | 321,000 | 5.5% | 5.7% | ||||||||||||
701 Dexter Avenue North/Seattle/Lake Union | 100% | — | 206,638 | TBD | |||||||||||||||
284,509 | 3,309,319 | ||||||||||||||||||
1,629,361 | 4,335,573 | ||||||||||||||||||
Committed near-term project expected to commence construction in the next two years | |||||||||||||||||||
4165 Campus Point Court/San Diego/University Town Center | 55.0% | — | 69,521 | TBD | |||||||||||||||
Total | $1,629,361 | $4,405,094 | $3,780,000 | (2) | $9,820,000 | (2) | |||||||||||||
Our share of investment(2)(3) | $1,550,000 | $3,570,000 | $3,030,000 | $8,150,000 | |||||||||||||||
Refer to “Initial stabilized yield (unlevered)” under “Definitions and reconciliations” in the Supplemental Information for additional details. (1)We expect to provide total estimated costs and related yields for each project with estimated stabilization in 2026 and beyond over the next several quarters. (2)Represents dollar amount rounded to the nearest $10 million and includes preliminary estimated amounts for projects listed as TBD. (3)Represents our share of investment based on our ownership percentage upon completion of development or redevelopment projects. | |||||||||||||||||||
Alexandria Real Estate Equities, Inc. All Rights Reserved. © 2024 | 41 |
New Class A/A+ Development and Redevelopment Properties: Summary of Pipeline | |
September 30, 2024 | |
(Dollars in thousands) | |
69% of Our Total Development and Redevelopment Pipeline RSF Is Within Our Mega Campuses
Market Property/Submarket | Our Ownership Interest | Book Value | Square Footage | |||||||||||||
Development and Redevelopment | ||||||||||||||||
Active and Near-Term Construction | Future Opportunities Subject to Market Conditions and Leasing | |||||||||||||||
Under Construction | Committed Near Term | Priority Anticipated | Future | Total(1) | ||||||||||||
Greater Boston | ||||||||||||||||
Mega Campus: Alexandria Center® at One Kendall Square/ Cambridge | 100% | $161,328 | 104,956 | — | — | — | 104,956 | |||||||||
One Hampshire Street | ||||||||||||||||
Mega Campus: The Arsenal on the Charles/Cambridge/Inner Suburbs | 100% | 360,538 | 417,927 | — | 25,312 | 34,157 | 477,396 | |||||||||
311 Arsenal Street, 500 North Beacon Street, and 4 Kingsbury Avenue | ||||||||||||||||
Mega Campus: 480 Arsenal Way and 446, 458, 500, and 550 Arsenal Street, and 99 Coolidge Avenue/Cambridge/Inner Suburbs | (2) | 279,763 | 204,395 | — | — | 902,000 | 1,106,395 | |||||||||
446, 458, 500, and 550 Arsenal Street, and 99 Coolidge Avenue | ||||||||||||||||
Mega Campus: Alexandria Center® for Life Science – Fenway/ Fenway | (3) | 708,309 | 610,119 | — | — | — | 610,119 | |||||||||
201 Brookline Avenue and 401 and 421 Park Drive | ||||||||||||||||
Mega Campus: Alexandria Center® for Life Science – Waltham/ Route 128 | 100% | 687,346 | 735,744 | — | — | 515,000 | 1,250,744 | |||||||||
40, 50, and 60 Sylvan Road, 35 Gatehouse Drive, and 840 Winter Street | ||||||||||||||||
Mega Campus: Alexandria Center® at Kendall Square/ Cambridge | 100% | 126,688 | — | — | — | 216,455 | 216,455 | |||||||||
100 Edwin H. Land Boulevard | ||||||||||||||||
Mega Campus: Alexandria Technology Square®/Cambridge | 100% | 7,881 | — | — | — | 100,000 | 100,000 | |||||||||
Mega Campus: 285, 299, 307, and 345 Dorchester Avenue/ Seaport Innovation District | 60.0% | 286,300 | — | — | — | 1,040,000 | 1,040,000 | |||||||||
10 Necco Street/Seaport Innovation District | 100% | 105,111 | — | — | — | 175,000 | 175,000 | |||||||||
Mega Campus: One Moderna Way/Route 128 | 100% | 26,052 | — | — | — | 1,085,000 | 1,085,000 | |||||||||
215 Presidential Way/Route 128 | 100% | 6,816 | — | — | — | 112,000 | 112,000 | |||||||||
Other development and redevelopment projects | (4) | 310,381 | 453,869 | — | — | 1,323,541 | 1,777,410 | |||||||||
$3,066,513 | 2,527,010 | — | 25,312 | 5,503,153 | 8,055,475 | |||||||||||
Refer to “Mega campus” under “Definitions and reconciliations” in the Supplemental Information for additional details. (1)Represents total square footage upon completion of development or redevelopment of one or more new Class A/A+ properties. Square footage presented includes the RSF of buildings currently in operation at properties that also have future development or redevelopment opportunities. Upon expiration of existing in-place leases, we have the intent to demolish or redevelop the existing property subject to market conditions and leasing. Refer to “Investments in real estate” under “Definitions and reconciliations” in the Supplemental Information for additional details, including development and redevelopment square feet currently included in rental properties. (2)We have a 75.0% interest in 99 Coolidge Avenue aggregating 204,395 RSF and 100.0% interest in 446, 458, 500, and 550 Arsenal Street aggregating 902,000 RSF. (3)We have a 99.0% interest in 201 Brookline Avenue aggregating 58,149 RSF, a 100% interest in 401 Park Drive aggregating 159,959 RSF, and a 99.7% interest in 421 Park Drive aggregating 392,011 RSF. (4)Includes a property in which we own a partial interest through a real estate joint venture. | ||||||||||||||||
Alexandria Real Estate Equities, Inc. All Rights Reserved. © 2024 | 42 |
New Class A/A+ Development and Redevelopment Properties: Summary of Pipeline (continued) | |
September 30, 2024 | |
(Dollars in thousands) | |
Market Property/Submarket | Our Ownership Interest | Book Value | Square Footage | |||||||||||||
Development and Redevelopment | ||||||||||||||||
Active and Near-Term Construction | Future Opportunities Subject to Market Conditions and Leasing | |||||||||||||||
Under Construction | Committed Near Term | Priority Anticipated | Future | Total(1) | ||||||||||||
San Francisco Bay Area | ||||||||||||||||
Mega Campus: Alexandria Center® for Science and Technology – Mission Bay/Mission Bay | 25.4% | $234,665 | 212,796 | — | — | — | 212,796 | |||||||||
1450 Owens Street | ||||||||||||||||
Alexandria Center® for Life Science – Millbrae/South San Francisco | 47.9% | 510,162 | 285,346 | — | 198,188 | 150,213 | 633,747 | |||||||||
230 Harriet Tubman Way, 201 and 231 Adrian Road, and 6 and 30 Rollins Road | ||||||||||||||||
Mega Campus: Alexandria Technology Center® – Gateway/ South San Francisco | 50.0% | 283,002 | 259,689 | — | — | 291,000 | 550,689 | |||||||||
651 Gateway Boulevard | ||||||||||||||||
Mega Campus: Alexandria Center® for Advanced Technologies – Tanforan/South San Francisco | 100% | 397,159 | — | — | 150,000 | 1,780,000 | 1,930,000 | |||||||||
1122, 1150, and 1178 El Camino Real | ||||||||||||||||
Mega Campus: Alexandria Center® for Advanced Technologies – South San Francisco/South San Francisco | 100% | 6,655 | — | — | 107,250 | 90,000 | 197,250 | |||||||||
211(2) and 269 East Grand Avenue | ||||||||||||||||
Mega Campus: Alexandria Center® for Life Science – San Carlos/Greater Stanford | 100% | 446,892 | — | — | 105,000 | 1,392,830 | 1,497,830 | |||||||||
960 Industrial Road, 987 and 1075 Commercial Street, and 888 Bransten Road | ||||||||||||||||
3825 and 3875 Fabian Way/Greater Stanford | 100% | 154,174 | — | — | — | 478,000 | 478,000 | |||||||||
2100, 2200, 2300, and 2400 Geng Road/Greater Stanford | 100% | 36,509 | — | — | — | 240,000 | 240,000 | |||||||||
901 California Avenue/Greater Stanford | 100% | 19,770 | — | — | — | 56,924 | 56,924 | |||||||||
Mega Campus: 88 Bluxome Street/SoMa | 100% | 392,785 | — | — | — | 1,070,925 | 1,070,925 | |||||||||
Other development and redevelopment projects | 100% | — | — | — | — | 25,000 | 25,000 | |||||||||
$2,481,773 | 757,831 | — | 560,438 | 5,574,892 | 6,893,161 | |||||||||||
Refer to “Mega campus” under “Definitions and reconciliations” in the Supplemental Information for additional details. (1)Represents total square footage upon completion of development or redevelopment of one or more new Class A/A+ properties. Square footage presented includes the RSF of buildings currently in operation at properties that also have future development or redevelopment opportunities. Upon expiration of existing in-place leases, we have the intent to demolish or redevelop the existing property subject to market conditions and leasing. Refer to “Investments in real estate” under “Definitions and reconciliations” in the Supplemental Information for additional details, including development and redevelopment square feet currently included in rental properties. (2)Includes a property in which we own a partial interest through a real estate joint venture. Refer to “Joint venture financial information” in the Supplemental Information for additional details. | ||||||||||||||||
Alexandria Real Estate Equities, Inc. All Rights Reserved. © 2024 | 43 |
New Class A/A+ Development and Redevelopment Properties: Summary of Pipeline (continued) | |
September 30, 2024 | |
(Dollars in thousands) | |
Market Property/Submarket | Our Ownership Interest | Book Value | Square Footage | |||||||||||||
Development and Redevelopment | ||||||||||||||||
Active and Near-Term Construction | Future Opportunities Subject to Market Conditions and Leasing | |||||||||||||||
Under Construction | Committed Near Term | Priority Anticipated | Future | Total(1) | ||||||||||||
San Diego | ||||||||||||||||
Mega Campus: One Alexandria Square/Torrey Pines | 100% | $417,621 | 334,996 | — | — | 125,280 | 460,276 | |||||||||
10935, 10945, and 10955 Alexandria Way and 10975 and 10995 Torreyana Road | ||||||||||||||||
Mega Campus: Campus Point by Alexandria/University Town Center | 55.0% | 671,303 | 598,029 | 492,570 | — | 650,000 | 1,740,599 | |||||||||
10010(2), 10140(2), and 10260 Campus Point Drive and 4135, 4155, 4161, 4165, and 4275(2) Campus Point Court | ||||||||||||||||
Mega Campus: SD Tech by Alexandria/Sorrento Mesa | 50.0% | 317,172 | 253,079 | — | 250,000 | 243,845 | 746,924 | |||||||||
9805 Scranton Road and 10065 and 10075 Barnes Canyon Road | ||||||||||||||||
11255 and 11355 North Torrey Pines Road/Torrey Pines | 100% | 150,187 | — | — | 153,000 | 62,000 | 215,000 | |||||||||
Costa Verde by Alexandria/University Town Center | 100% | 138,107 | — | — | — | 537,000 | 537,000 | |||||||||
8410-8750 Genesee Avenue and 4282 Esplanade Court | ||||||||||||||||
Mega Campus: 5200 Illumina Way/University Town Center | 51.0% | 17,441 | — | — | — | 451,832 | 451,832 | |||||||||
ARE Towne Centre/University Town Center | 100% | 19,869 | — | — | — | 230,000 | 230,000 | |||||||||
9363, 9373, and 9393 Towne Centre Drive | ||||||||||||||||
9625 Towne Centre Drive/University Town Center | 30.0% | 837 | — | — | — | 100,000 | 100,000 | |||||||||
Mega Campus: Sequence District by Alexandria/Sorrento Mesa | 100% | 46,323 | — | — | — | 1,798,915 | 1,798,915 | |||||||||
6260, 6290, 6310, 6340, 6350, and 6450 Sequence Drive | ||||||||||||||||
Scripps Science Park by Alexandria/Sorrento Mesa | 100% | 120,941 | — | — | — | 598,349 | 598,349 | |||||||||
10048, 10219, 10256, and 10260 Meanley Drive and 10277 Scripps Ranch Boulevard | ||||||||||||||||
Pacific Technology Park/Sorrento Mesa | 50.0% | 23,857 | — | — | — | 149,000 | 149,000 | |||||||||
9444 Waples Street | ||||||||||||||||
4025, 4031, 4045, and 4075 Sorrento Valley Boulevard/Sorrento Valley | 100% | 43,641 | — | — | — | 247,000 | 247,000 | |||||||||
Other development and redevelopment projects | (3) | 75,716 | — | — | — | 475,000 | 475,000 | |||||||||
$2,043,015 | 1,186,104 | 492,570 | 403,000 | 5,668,221 | 7,749,895 | |||||||||||
Refer to “Mega campus” under “Definitions and reconciliations” in the Supplemental Information for additional details. (1)Represents total square footage upon completion of development or redevelopment of one or more new Class A/A+ properties. Square footage presented includes the RSF of buildings currently in operation at properties that also have future development or redevelopment opportunities. Upon expiration of existing in-place leases, we have the intent to demolish or redevelop the existing property subject to market conditions and leasing. Refer to “Investments in real estate” under “Definitions and reconciliations” in the Supplemental Information for additional details, including development and redevelopment square feet currently included in rental properties. (2)We have a 100% interest in this property. (3)Includes a property in which we own a partial interest through a real estate joint venture. | ||||||||||||||||
Alexandria Real Estate Equities, Inc. All Rights Reserved. © 2024 | 44 |
New Class A/A+ Development and Redevelopment Properties: Summary of Pipeline (continued) | |
September 30, 2024 | |
(Dollars in thousands) | |
Market Property/Submarket | Our Ownership Interest | Book Value | Square Footage | |||||||||||||
Development and Redevelopment | ||||||||||||||||
Active and Near-Term Construction | Future Opportunities Subject to Market Conditions and Leasing | |||||||||||||||
Under Construction | Committed Near Term | Priority Anticipated | Future | Total(1) | ||||||||||||
Seattle | ||||||||||||||||
Mega Campus: Alexandria Center® for Life Science – South Lake Union/Lake Union | (2) | $485,628 | 227,577 | — | 869,000 | 188,400 | 1,284,977 | |||||||||
601 and 701 Dexter Avenue North and 800 Mercer Street | ||||||||||||||||
Alexandria Center® for Advanced Technologies – Monte Villa Parkway/Bothell | 100% | 11,977 | 34,306 | — | — | — | 34,306 | |||||||||
3301 Monte Villa Parkway | ||||||||||||||||
830 and 1010 4th Avenue South/SoDo | 100% | 59,262 | — | — | — | 597,313 | 597,313 | |||||||||
410 West Harrison Street/Elliott Bay | 100% | — | — | — | — | 91,000 | 91,000 | |||||||||
Mega Campus: Alexandria Center® for Advanced Technologies – Canyon Park/Bothell | 100% | 17,439 | — | — | — | 230,000 | 230,000 | |||||||||
21660 20th Avenue Southeast | ||||||||||||||||
Other development and redevelopment projects | 100% | 142,484 | — | — | — | 706,087 | 706,087 | |||||||||
716,790 | 261,883 | — | 869,000 | 1,812,800 | 2,943,683 | |||||||||||
Maryland | ||||||||||||||||
Mega Campus: Alexandria Center® for Life Science – Shady Grove/Rockville | 100% | 54,904 | 29,890 | — | — | 296,000 | 325,890 | |||||||||
9808 Medical Center Drive and 9830 Darnestown Road | ||||||||||||||||
54,904 | 29,890 | — | — | 296,000 | 325,890 | |||||||||||
Research Triangle | ||||||||||||||||
Mega Campus: Alexandria Center® for Advanced Technologies and AgTech – Research Triangle/Research Triangle | 100% | 103,653 | — | — | 180,000 | 990,000 | 1,170,000 | |||||||||
4 and 12 Davis Drive | ||||||||||||||||
Mega Campus: Alexandria Center® for Life Science – Durham/ Research Triangle | 100% | 176,524 | — | — | — | 2,210,000 | 2,210,000 | |||||||||
41 Moore Drive | ||||||||||||||||
Mega Campus: Alexandria Center® for NextGen Medicines/ Research Triangle | 100% | $108,035 | — | — | — | 1,055,000 | 1,055,000 | |||||||||
3029 East Cornwallis Road | ||||||||||||||||
Refer to “Mega campus” under “Definitions and reconciliations” in the Supplemental Information for additional details. (1)Represents total square footage upon completion of development or redevelopment of one or more new Class A/A+ properties. Square footage presented includes the RSF of buildings currently in operation at properties that also have future development or redevelopment opportunities. Upon expiration of existing in-place leases, we have the intent to demolish or redevelop the existing property subject to market conditions and leasing. Refer to “Investments in real estate” under “Definitions and reconciliations” in the Supplemental Information for additional details, including development and redevelopment square feet currently included in rental properties. (2)We have a 100% interest in 601 and 701 Dexter Avenue North aggregating 415,977 RSF and a 60% interest in the priority anticipated development project at 800 Mercer Street aggregating 869,000 RSF. | ||||||||||||||||
Alexandria Real Estate Equities, Inc. All Rights Reserved. © 2024 | 45 |
New Class A/A+ Development and Redevelopment Properties: Summary of Pipeline (continued) | |
September 30, 2024 | |
(Dollars in thousands) | |
Market Property/Submarket | Our Ownership Interest | Book Value | Square Footage | |||||||||||||
Development and Redevelopment | ||||||||||||||||
Active and Near-Term Construction | Future Opportunities Subject to Market Conditions and Leasing | |||||||||||||||
Under Construction | Committed Near Term | Priority Anticipated | Future | Total(1) | ||||||||||||
Research Triangle (continued) | ||||||||||||||||
Mega Campus: Alexandria Center® for Sustainable Technologies/Research Triangle | 100% | $53,326 | — | — | — | 750,000 | 750,000 | |||||||||
120 TW Alexander Drive, 2752 East NC Highway 54, and 10 South Triangle Drive | ||||||||||||||||
100 Capitola Drive/Research Triangle | 100% | — | — | — | — | 65,965 | 65,965 | |||||||||
Other development and redevelopment projects | 100% | 4,185 | — | — | — | 76,262 | 76,262 | |||||||||
445,723 | — | — | 180,000 | 5,147,227 | 5,327,227 | |||||||||||
New York City | ||||||||||||||||
Mega Campus: Alexandria Center® for Life Science – New York City/New York City | 100% | 165,061 | — | — | — | 550,000 | (2) | 550,000 | ||||||||
165,061 | — | — | — | 550,000 | 550,000 | |||||||||||
Texas | ||||||||||||||||
Alexandria Center® for Advanced Technologies at The Woodlands/ Greater Houston | 100% | 49,034 | 73,298 | — | — | 116,405 | 189,703 | |||||||||
8800 Technology Forest Place | ||||||||||||||||
1001 Trinity Street and 1020 Red River Street/Austin | 100% | 10,177 | — | — | 126,034 | 123,976 | 250,010 | |||||||||
Other development and redevelopment projects | 100% | 136,980 | — | — | — | 1,694,000 | 1,694,000 | |||||||||
196,191 | 73,298 | — | 126,034 | 1,934,381 | 2,133,713 | |||||||||||
Canada | 100% | 50,044 | 139,311 | — | — | 371,743 | 511,054 | |||||||||
Other development and redevelopment projects | 100% | 120,411 | — | — | — | 724,349 | 724,349 | |||||||||
Total pipeline as of September 30, 2024 | $9,340,425 | (3) | 4,975,327 | 492,570 | 2,163,784 | 27,582,766 | 35,214,447 | |||||||||
Refer to “Mega campus” under “Definitions and reconciliations” in the Supplemental Information for additional details.
(1)Total square footage includes 3,376,039 RSF of buildings currently in operation that we expect to demolish or redevelop and commence future construction subject to market conditions and leasing. Refer to “Investments in real estate”
under “Definitions and reconciliations” in the Supplemental Information for additional details, including development and redevelopment square feet currently included in rental properties.
(2)During the three months ended September 30, 2024, we filed a lawsuit against the New York City Health + Hospitals Corporation and the New York City Economic Development Corporation for fraud and breach of contract concerning our
option to ground lease a land parcel to develop a future world-class life science building within the Alexandria Center® for Life Science – New York City campus. Refer to our Form 8-K filed with the Securities and Exchange Commission on
August 7, 2024 for additional details.
(3)Includes $4.3 billion of projects that are currently under construction and are 55% leased/negotiating. We also expect to commence construction on one committed near-term project aggregating $69.5 million, which is 51% leased/
negotiating, in the next two years after September 30, 2024.
Alexandria Real Estate Equities, Inc. All Rights Reserved. © 2024 | 46 |
Construction Spending and Capitalization of Interest | |
September 30, 2024 | |
(Dollars in thousands) | |
Construction spending | Nine Months Ended September 30, 2024 | Projected Midpoint for the Year Ending December 31, 2024 | |||||||
Construction of Class A/A+ properties: | |||||||||
Active construction projects | |||||||||
Under construction and committed near-term projects(1) and projects expected to commence active construction in 4Q24(2) | $ | 1,448,736 | $ | 1,913,000 | |||||
Future pipeline pre-construction | |||||||||
Primarily mega campus expansion pre-construction work (entitlement, design, and site work) | 349,082 | 652,000 | |||||||
Revenue- and non-revenue-enhancing capital expenditures | 158,229 | 250,000 | |||||||
Construction spend (before contributions from noncontrolling interests or tenants) | 1,956,047 | 2,815,000 | |||||||
Contributions from noncontrolling interests (consolidated real estate joint ventures) | (272,072) | (430,000) | (3) | ||||||
Tenant-funded and -built landlord improvements | (107,562) | (135,000) | |||||||
Total construction spending | $ | 1,576,413 | $ | 2,250,000 | |||||
2024 guidance range for construction spending | $1,950,000 – $2,550,000 | ||||||||
Projected capital contributions from partners in consolidated real estate joint ventures to fund construction | |||||
Timing | Amount(3) | ||||
4Q24 | $157,928 | ||||
2025 through 2027 | 885,526 | ||||
Total | $1,043,454 | ||||
Average real estate basis used for capitalization of interest | |||||||
Key Categories of Real Estate Basis Capitalized During YTD 3Q24 | Average Real Estate Basis Capitalized During YTD 3Q24 | Percentage of Total Average Real Estate Basis Capitalized | |||||
Construction of Class A/A+ properties: | |||||||
Active construction projects | |||||||
Under construction and committed near-term projects(1) | $2,849,742 | 35% | |||||
Future pipeline pre-construction | |||||||
Priority anticipated projects | 559,815 | (4) | 7 | ||||
Primarily mega campus expansion pre-construction work (entitlement, design, and site work) | 3,692,497 | (4) | 45 | ||||
Smaller redevelopments and repositioning capital projects | 1,025,019 | 13 | |||||
$8,127,073 | 100% | ||||||
Refer to “Definitions and reconciliations” in the Supplemental Information for additional details.
(1)Includes projects under construction aggregating 5.0 million RSF and one committed near-term project aggregating 492,570 RSF expected to commence construction during the next two years after September 30, 2024, which are 55%
leased/negotiating and expected to generate $510 million in annual incremental net operating income primarily commencing from 4Q24 through 1Q28.
(2)Includes certain priority anticipated development and redevelopment projects expected to commence active construction in 4Q24, subject to market conditions and leasing. Refer to “Investments in real estate” under “Definitions and
reconciliations” in the Supplemental Information for additional details, including development and redevelopment square feet currently included in rental properties.
(3)Represents contractual capital commitments from existing consolidated real estate joint venture partners to fund construction.
(4)Average real estate basis capitalized related to our future pipeline pre-construction activities includes 31% from four key active and future development and redevelopment projects on mega campuses. Refer to the next page for additional
details.
Alexandria Real Estate Equities, Inc. All Rights Reserved. © 2024 | 47 |
| |
Construction Spending and Capitalization of Interest (continued) | |
September 30, 2024 | |
Key Active and Future Development and Redevelopment Projects on Mega Campuses | ||
Alexandria Center® for Advanced Technologies – Tanforan | Alexandria Center® for Life Science – San Carlos | |
San Francisco Bay Area/South San Francisco | San Francisco Bay Area/Greater Stanford | |
1.9 million future SF | 1.5 million future SF | |
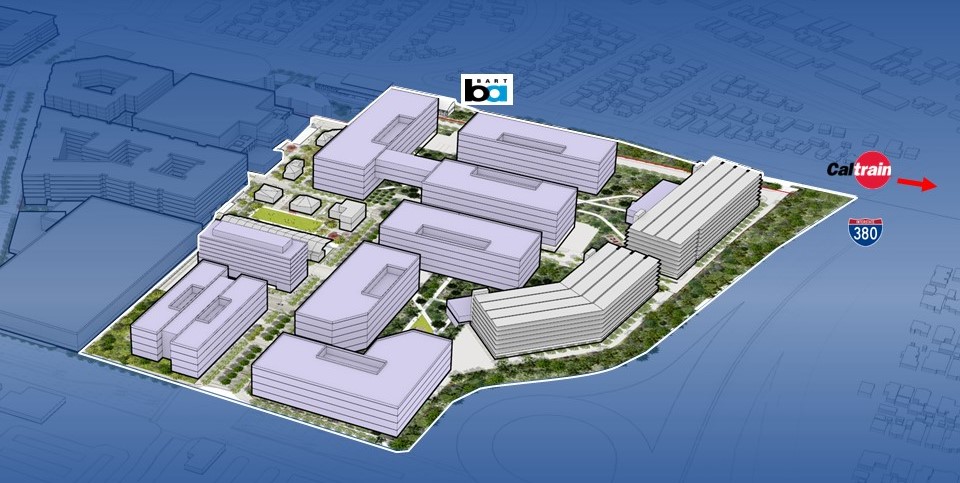 | 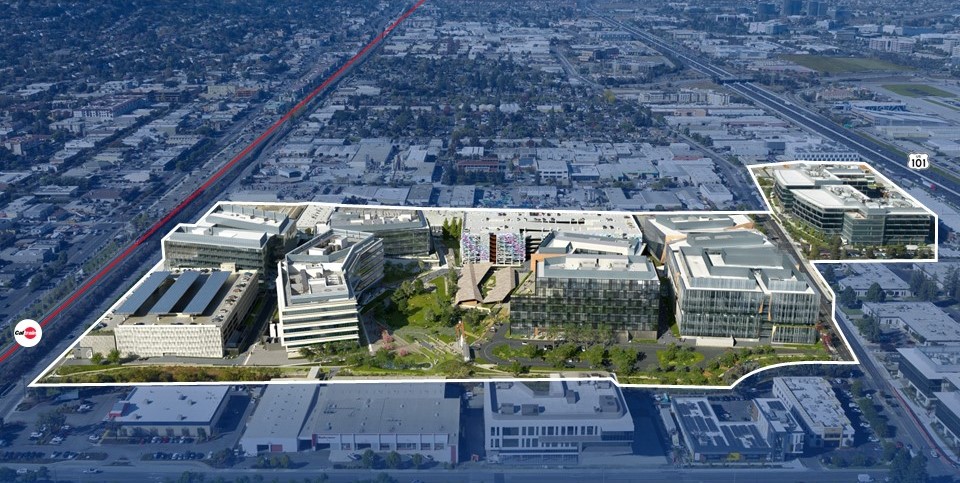 | |
Campus Point by Alexandria | Alexandria Center® for Life Science – South Lake Union | |
San Diego/University Town Center | Seattle/Lake Union | |
1.7 million active and future SF | 1.3 million active and future SF | |
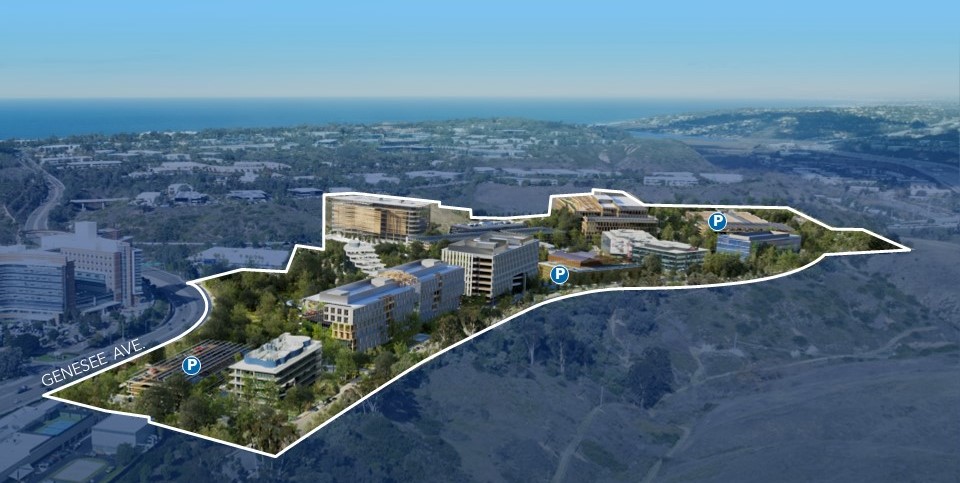 | 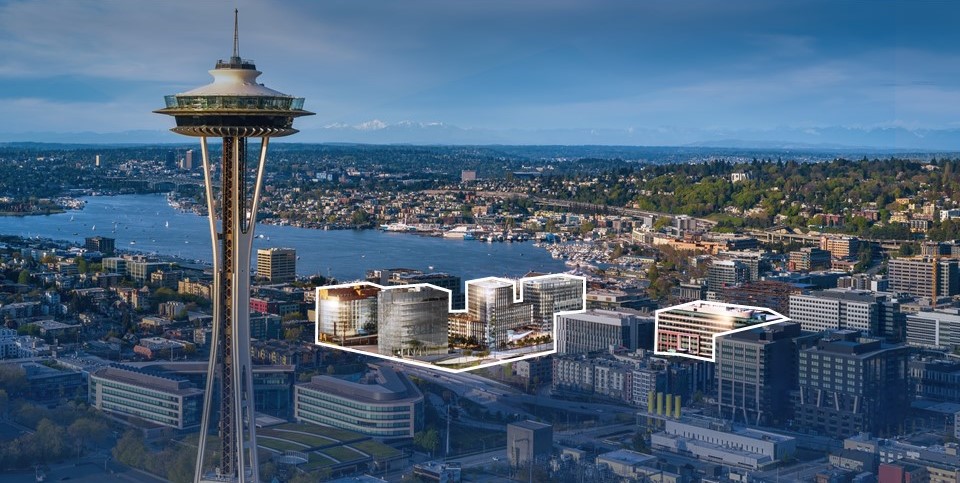 | |
Refer to “Mega campus” under “Definitions and reconciliations” in the Supplemental Information for additional details.
Alexandria Real Estate Equities, Inc. All Rights Reserved. © 2024 | 48 |
| |
Joint Venture Financial Information | |
September 30, 2024 | |
Consolidated Real Estate Joint Ventures | ||||||||||||
Property | Market | Submarket | Noncontrolling Interest Share(1) | Operating RSF at 100% | ||||||||
50 and 60 Binney Street | Greater Boston | Cambridge/Inner Suburbs | 66.0% | 532,395 | ||||||||
75/125 Binney Street | Greater Boston | Cambridge/Inner Suburbs | 60.0% | 388,270 | ||||||||
100 and 225 Binney Street and 300 Third Street | Greater Boston | Cambridge/Inner Suburbs | 70.0% | 870,106 | ||||||||
99 Coolidge Avenue | Greater Boston | Cambridge/Inner Suburbs | 25.0% | 116,414 | (2) | |||||||
15 Necco Street | Greater Boston | Seaport Innovation District | 43.3% | 345,996 | ||||||||
285, 299, 307, and 345 Dorchester Avenue | Greater Boston | Seaport Innovation District | 40.0% | — | (2) | |||||||
Alexandria Center® for Science and Technology – Mission Bay(3) | San Francisco Bay Area | Mission Bay | 75.0% | 996,181 | ||||||||
1450 Owens Street | San Francisco Bay Area | Mission Bay | 74.6% | (4) | — | (2) | ||||||
601, 611, 651(2), 681, 685, and 701 Gateway Boulevard | San Francisco Bay Area | South San Francisco | 50.0% | 853,794 | ||||||||
751 Gateway Boulevard | San Francisco Bay Area | South San Francisco | 49.0% | 230,592 | ||||||||
211(2) and 213 East Grand Avenue | San Francisco Bay Area | South San Francisco | 70.0% | 300,930 | ||||||||
500 Forbes Boulevard | San Francisco Bay Area | South San Francisco | 90.0% | 155,685 | ||||||||
Alexandria Center® for Life Science – Millbrae | San Francisco Bay Area | South San Francisco | 52.1% | — | (2) | |||||||
3215 Merryfield Row | San Diego | Torrey Pines | 70.0% | 170,523 | ||||||||
Campus Point by Alexandria(5) | San Diego | University Town Center | 45.0% | 1,342,164 | ||||||||
5200 Illumina Way | San Diego | University Town Center | 49.0% | 792,687 | ||||||||
9625 Towne Centre Drive | San Diego | University Town Center | 70.0% | 163,648 | ||||||||
SD Tech by Alexandria(6) | San Diego | Sorrento Mesa | 50.0% | 798,858 | ||||||||
Pacific Technology Park | San Diego | Sorrento Mesa | 50.0% | 544,352 | ||||||||
Summers Ridge Science Park(7) | San Diego | Sorrento Mesa | 70.0% | 316,531 | ||||||||
1201 and 1208 Eastlake Avenue East | Seattle | Lake Union | 70.0% | 207,774 | ||||||||
199 East Blaine Street | Seattle | Lake Union | 70.0% | 115,084 | ||||||||
400 Dexter Avenue North | Seattle | Lake Union | 70.0% | 290,754 | ||||||||
800 Mercer Street | Seattle | Lake Union | 40.0% | — | (2) | |||||||
Unconsolidated Real Estate Joint Ventures | ||||||||||||
Property | Market | Submarket | Our Ownership Share(8) | Operating RSF at 100% | ||||||||
1655 and 1725 Third Street | San Francisco Bay Area | Mission Bay | 10.0% | 586,208 | ||||||||
1401/1413 Research Boulevard | Maryland | Rockville | 65.0% | (9) | (10) | |||||||
1450 Research Boulevard | Maryland | Rockville | 73.2% | (9) | 42,679 | |||||||
101 West Dickman Street | Maryland | Beltsville | 58.2% | (9) | 135,423 | |||||||
Refer to “Joint venture financial information” under “Definitions and reconciliations” in the Supplemental Information for additional details.
(1)In addition to the consolidated real estate joint ventures listed, various joint venture partners hold insignificant noncontrolling interests in three other real estate joint ventures in North America.
(2)Represents a property currently under construction or in our development and redevelopment pipeline. Refer to the sections under “New Class A/A+ development and redevelopment properties” in the Supplemental Information for
additional details.
(3)Includes 409 and 499 Illinois Street, 1500 and 1700 Owens Street, and 455 Mission Bay Boulevard South.
(4)The noncontrolling interest share of our joint venture partner is anticipated to increase to 75% as our partner contributes equity to fund the construction of the project over time.
(5)Includes 10210, 10260, 10290, and 10300 Campus Point Drive and 4110, 4135, 4155, 4161, 4165, 4224, and 4242 Campus Point Court.
(6)Includes 9605, 9645, 9675, 9725, 9735, 9805, 9808, 9855, and 9868 Scranton Road and 10055, 10065, and 10075 Barnes Canyon Road.
(7)Includes 9965, 9975, 9985, and 9995 Summers Ridge Road.
(8)In addition to the unconsolidated real estate joint ventures listed, we hold an interest in one insignificant unconsolidated real estate joint venture in North America.
(9)Represents a joint venture with a local real estate operator in which our joint venture partner manages the day-to-day activities that significantly affect the economic performance of the joint venture.
(10)Represents a joint venture with a distinguished retail real estate developer for a retail shopping center aggregating 84,837 RSF.
Alexandria Real Estate Equities, Inc. All Rights Reserved. © 2024 | 49 |
Joint Venture Financial Information (continued) | |
September 30, 2024 | |
(In thousands) | |
As of September 30, 2024 | ||||||||
Noncontrolling Interest Share of Consolidated Real Estate JVs | Our Share of Unconsolidated Real Estate JVs | |||||||
Investments in real estate | $ | 4,211,942 | $ | 125,029 | ||||
Cash, cash equivalents, and restricted cash | 164,756 | 3,346 | ||||||
Other assets | 425,293 | 13,411 | ||||||
Secured notes payable | (36,103) | (95,603) | ||||||
Other liabilities | (280,069) | (6,013) | ||||||
Redeemable noncontrolling interests | (16,510) | — | ||||||
$ | 4,469,309 | $ | 40,170 | |||||
Noncontrolling Interest Share of Consolidated Real Estate JVs | Our Share of Unconsolidated Real Estate JVs | ||||||||||||||
September 30, 2024 | September 30, 2024 | ||||||||||||||
Three Months Ended | Nine Months Ended | Three Months Ended | Nine Months Ended | ||||||||||||
Total revenues | $ | 113,479 | $ | 335,786 | $ | 3,141 | $ | 9,472 | |||||||
Rental operations | (34,697) | (97,009) | (965) | (2,984) | |||||||||||
78,782 | 238,777 | 2,176 | 6,488 | ||||||||||||
General and administrative | (586) | (2,268) | (10) | (80) | |||||||||||
Interest | (284) | (753) | (952) | (2,807) | |||||||||||
Depreciation and amortization of real estate assets | (32,457) | (94,725) | (1,075) | (3,177) | |||||||||||
Fixed returns allocated to redeemable noncontrolling interests(1) | 201 | 603 | — | — | |||||||||||
$ | 45,656 | $ | 141,634 | $ | 139 | $ | 424 | ||||||||
Straight-line rent and below-market lease revenue | $ | 54 | $ | 15,588 | $ | 213 | $ | 743 | |||||||
Funds from operations(2) | $ | 78,113 | $ | 236,359 | $ | 1,214 | $ | 3,601 | |||||||
Refer to “Joint venture financial information” under “Definitions and reconciliations” in the Supplemental Information for additional details.
(1)Represents an allocation of joint venture earnings to redeemable noncontrolling interests primarily in one property in our South San Francisco submarket. These redeemable noncontrolling interests earn a fixed return on their
investment rather than participate in the operating results of the property.
(2)Refer to “Funds from operations and funds from operations per share” in the Earnings Press Release and “Definitions and reconciliations” in the Supplemental Information for additional details.
Alexandria Real Estate Equities, Inc. All Rights Reserved. © 2024 | 50 |
Investments | |
September 30, 2024 | |
(Dollars in thousands) | |
We hold investments in publicly traded companies and privately held entities primarily involved in the life science industry. The tables below summarize components of our investment income
(loss) and non-real estate investments. Refer to “Investments” under “Definitions and reconciliations” in the Supplemental Information for additional details.
September 30, 2024 | Year Ended December 31, 2023 | ||||||||
Three Months Ended | Nine Months Ended | ||||||||
Realized gains | $12,632 | (1) | $47,336 | (1) | $6,078 | (2) | |||
Unrealized gains (losses) | 2,610 | (3) | (32,470) | (4) | (201,475) | (5) | |||
Investment income (loss) | $15,242 | $14,866 | $(195,397) | ||||||
September 30, 2024 | December 31, 2023 | |||||||||
Investments | Cost | Unrealized Gains | Unrealized Losses | Carrying Amount | Carrying Amount | |||||
Publicly traded companies | $187,085 | $50,933 | $(85,592) | $152,426 | $159,566 | |||||
Entities that report NAV | 527,042 | 160,608 | (31,225) | 656,425 | 671,532 | |||||
Entities that do not report NAV: | ||||||||||
Entities with observable price changes | 93,982 | 72,862 | (1,337) | 165,507 | 174,268 | |||||
Entities without observable price changes | 407,261 | — | — | 407,261 | 368,654 | |||||
Investments accounted for under the equity method | N/A | N/A | N/A | 137,708 | 75,498 | |||||
September 30, 2024 | $1,215,370 | (6) | $284,403 | $(118,154) | $1,519,327 | $1,449,518 | ||||
December 31, 2023 | $1,177,072 | $320,445 | $(123,497) | $1,449,518 | ||||||
Public/Private Mix (Cost) | Tenant/Non-Tenant Mix (Cost) | |


14%
Public
27%
Tenant
86%
Private
73%
Non-Tenant
(1)Consists of realized gains of $23.0 million and $85.2 million, partially offset by impairment charges of $10.3 million and $37.8 million during the three and nine months ended September 30, 2024, respectively.
(2)Consists of realized gains of $80.6 million, offset by impairment charges of $74.6 million during the year ended December 31, 2023.
(3)Consists of unrealized gains of $25.8 million primarily resulting from the increase in fair values of our investments in publicly traded entities and $23.2 million resulting from accounting reclassifications of unrealized gains recognized in
prior periods into realized gains upon our realization of investments during the three months ended September 30, 2024.
(4)Primarily relates to the accounting reclassifications of unrealized gains recognized in prior periods into realized gains upon our realization of investments during the nine months ended September 30, 2024.
(5)Consists of unrealized losses of $111.6 million primarily resulting from the decrease in the fair value of our investments in privately held entities that report NAV and $89.9 million resulting from accounting reclassifications of unrealized
gains recognized in prior periods into realized gains upon our sales of investments during the year ended December 31, 2023.
(6)Represents 2.8% of gross assets as of September 30, 2024. Refer to “Gross assets” under “Definitions and reconciliations” in the Supplemental Information for additional details.
Alexandria Real Estate Equities, Inc. All Rights Reserved. © 2024 | 51 |
| |
Key Credit Metrics | |
September 30, 2024 | |
Liquidity | Minimal Outstanding Borrowings and Significant Availability on Unsecured Senior Line of Credit | |||||||
(in millions) | ||||||||
$5.4B |  | |||||||
(in millions) | ||||||||
Availability under our unsecured senior line of credit, net of amounts outstanding under our commercial paper program | $4,545 | |||||||
Outstanding forward equity sales agreements(1) | 28 | |||||||
Cash, cash equivalents, and restricted cash | 580 | |||||||
Availability under our secured construction loan | 51 | |||||||
Investments in publicly traded companies | 152 | |||||||
Liquidity as of September 30, 2024 | $5,356 | |||||||
Net Debt and Preferred Stock to Adjusted EBITDA(2) | Fixed-Charge Coverage Ratio(2) | |||||||
Refer to “Definitions and reconciliations” in the Supplemental Information for additional details.
(1)Represents expected net proceeds from the future settlement of 230 thousand shares of common stock under forward equity sales agreements after underwriter discounts.
(2)Quarter annualized.
Alexandria Real Estate Equities, Inc. All Rights Reserved. © 2024 | 52 |
Summary of Debt | |
September 30, 2024 | |
(In millions) | |
Weighted-Average Remaining Term of 12.6 Years
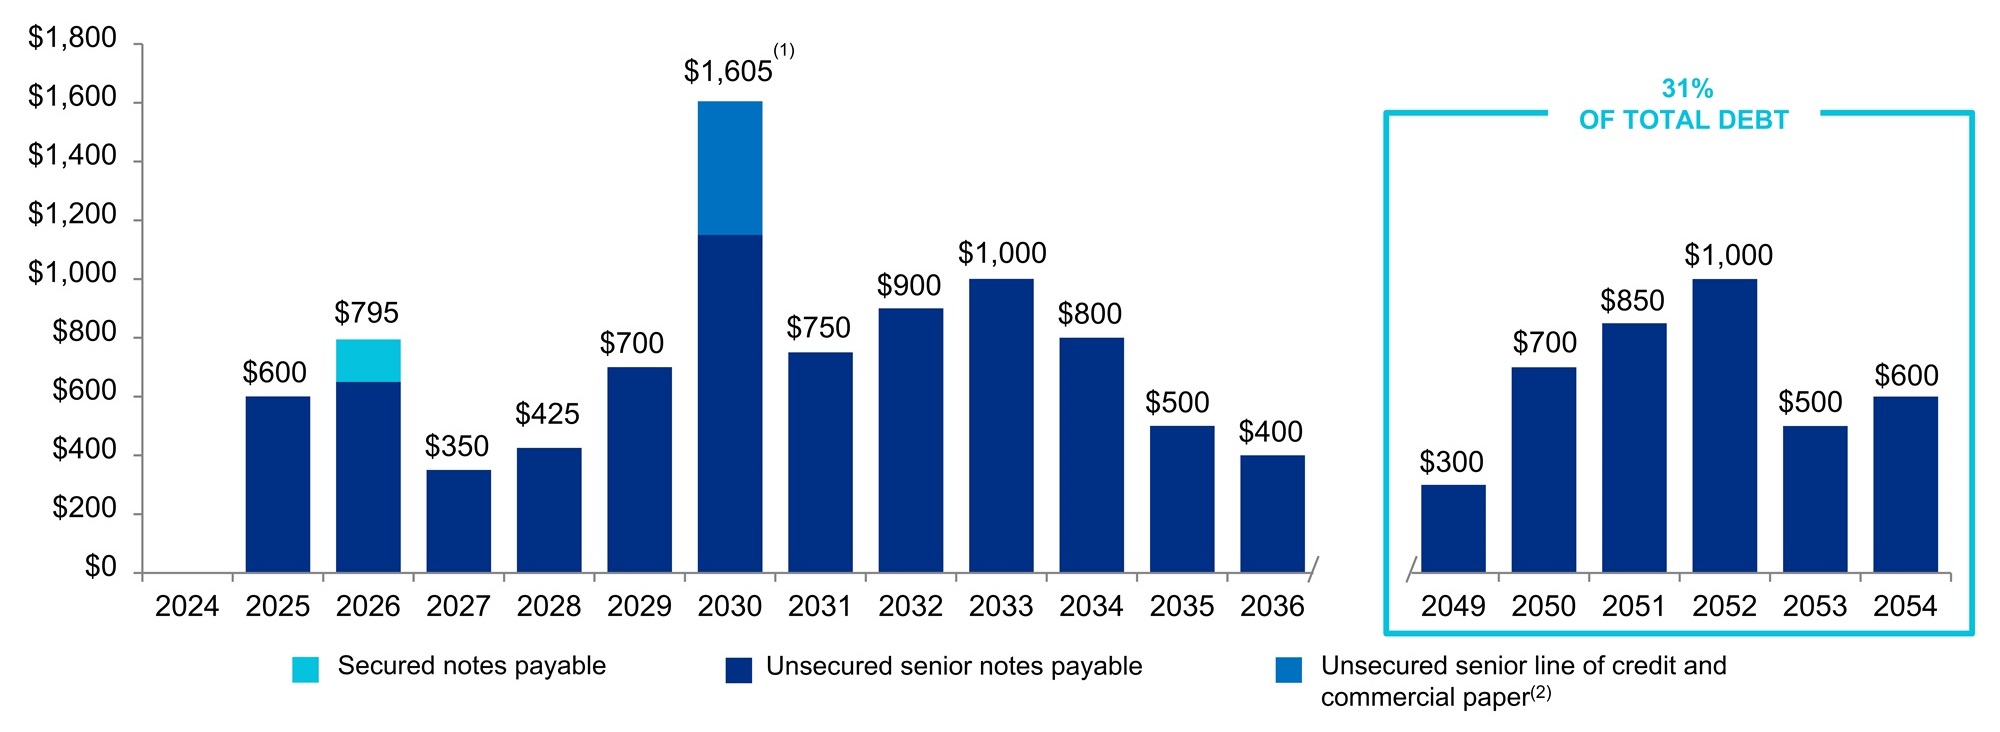 | ||
(1)In September 2024, we amended and restated our unsecured senior line of credit to, among other changes, extend the maturity date from January 22, 2028 to January 22, 2030, including extension options that we control. We
anticipate further extending the maturity date in the next two to three years. Additionally, we have two unsecured senior notes payable maturing six months apart on July 1, 2030 and December 15, 2030.
(2)Refer to footnotes 2 through 4 on the next page under “Fixed-rate and variable-rate debt” for additional details.
Alexandria Real Estate Equities, Inc. All Rights Reserved. © 2024 | 53 |
Summary of Debt (continued) | |
September 30, 2024 | |
(Dollars in thousands) | |
Fixed-rate and variable-rate debt | Fixed-Rate Debt | Variable-Rate Debt | Total | Percentage | Weighted-Average | |||||||
Interest Rate(1) | Remaining Term (in years) | |||||||||||
Secured notes payable | $587 | $144,413 | $145,000 | 1.1% | 8.39% | 2.2 | ||||||
Unsecured senior notes payable | 12,092,012 | — | 12,092,012 | 95.3 | 3.81 | 13.0 | ||||||
Unsecured senior line of credit(2) and commercial paper program(3) | — | 454,589 | 454,589 | 3.6 | 5.05 | 5.3 | (4) | |||||
Total/weighted average | $12,092,599 | $599,002 | $12,691,601 | 100.0% | 3.91% | 12.6 | (4) | |||||
Percentage of total debt | 95.3% | 4.7% | 100.0% | |||||||||
(1)Represents the weighted-average interest rate as of the end of the applicable period, including expense/income related to the amortization of loan fees, amortization of debt premiums (discounts), and other bank fees.
(2)As of September 30, 2024, we had no outstanding balance on our unsecured senior line of credit.
(3)The commercial paper program provides us with the ability to issue up to $2.5 billion of commercial paper notes that bear interest at short-term fixed rates and can generally be issued with a maturity of 30 days or less and with a
maximum maturity of 397 days from the date of issuance. Borrowings under the program are used to fund short-term capital needs and are backed by our unsecured senior line of credit. In the event we are unable to issue
commercial paper notes or refinance outstanding borrowings under terms equal to or more favorable than those under our unsecured senior line of credit, we expect to borrow under the unsecured senior line of credit at
SOFR+0.855%. As of September 30, 2024, we had $454.6 million of commercial paper notes outstanding with a weighted-average interest rate of 5.05%.
(4)We calculate the weighted-average remaining term of our commercial paper notes by using the maturity date of our unsecured senior line of credit. Using the maturity date of our outstanding commercial paper notes, the
consolidated weighted-average maturity of our debt is 12.5 years. The commercial paper notes sold during the nine months ended September 30, 2024 were issued at a weighted-average yield to maturity of 5.55% and had a
weighted-average maturity term of 17 days.
Average Debt Outstanding | Weighted-Average Interest Rate | ||||||||
September 30, 2024 | September 30, 2024 | ||||||||
Three Months Ended | Nine Months Ended | Three Months Ended | Nine Months Ended | ||||||
Long-term fixed-rate debt | $12,171,936 | $12,008,857 | 3.79% | 3.76% | |||||
Short-term variable-rate unsecured senior line of credit and commercial paper program debt | 545,848 | 471,070 | 5.48 | 5.57 | |||||
Blended average interest rate | 12,717,784 | 12,479,927 | 3.86 | 3.83 | |||||
Loan fee amortization and annual facility fee related to unsecured senior line of credit | N/A | N/A | 0.12 | 0.13 | |||||
Total/weighted average | $12,717,784 | $12,479,927 | 3.98% | 3.96% | |||||
Alexandria Real Estate Equities, Inc. All Rights Reserved. © 2024 | 54 |
Summary of Debt (continued) | |
September 30, 2024 | |
(Dollars in thousands) | |
Debt covenants | Unsecured Senior Notes Payable | Unsecured Senior Line of Credit | ||||||
Debt Covenant Ratios(1) | Requirement | September 30, 2024 | Requirement | September 30, 2024 | ||||
Total Debt to Total Assets | ≤ 60% | 30% | ≤ 60.0% | 29.7% | ||||
Secured Debt to Total Assets | ≤ 40% | 0.3% | ≤ 45.0% | 0.3% | ||||
Consolidated EBITDA to Interest Expense | ≥ 1.5x | 12.3x | ≥ 1.50x | 3.95x | ||||
Unencumbered Total Asset Value to Unsecured Debt | ≥ 150% | 326% | N/A | N/A | ||||
Unsecured Interest Coverage Ratio | N/A | N/A | ≥ 1.75x | 12.55x | ||||
(1)All covenant ratio titles utilize terms as defined in the respective debt and credit agreements. The calculation of consolidated EBITDA is based on the definitions contained in our loan agreements and is not directly comparable to
the computation of EBITDA as described in Exchange Act Release No. 47226.
Unconsolidated real estate joint ventures’ debt | At 100% | |||||||||||||||||
Unconsolidated Joint Venture | Maturity Date | Stated Rate | Interest Rate(1) | Aggregate Commitment | Debt Balance(2) | Our Share | ||||||||||||
1401/1413 Research Boulevard(3) | 12/23/24 | 2.70% | 3.31% | $28,500 | $28,461 | 65.0% | ||||||||||||
1655 and 1725 Third Street(4) | 3/10/25 | 4.50% | 4.57% | 600,000 | 599,823 | 10.0% | ||||||||||||
101 West Dickman Street | 11/10/26 | SOFR+1.95% | (5) | 7.39% | 26,750 | 18,565 | 58.2% | |||||||||||
1450 Research Boulevard | 12/10/26 | SOFR+1.95% | (5) | 7.45% | 13,000 | 8,616 | 73.2% | |||||||||||
$668,250 | $655,465 | |||||||||||||||||
(1)Includes interest expense and amortization of loan fees.
(2)Represents outstanding principal, net of unamortized deferred financing costs, as of September 30, 2024.
(3)We have executed a purchase and sale agreement to sell the unconsolidated real estate joint venture and expect to complete the sale in 4Q24. Our net proceeds from the sale are expected to exceed our share of the
outstanding debt balance and the carrying amount of this investment as of September 30, 2024.
(4)The unconsolidated real estate joint venture is in the process of working with prospective lenders to refinance this debt. In the event that all or a portion of the debt cannot be refinanced, we may consider contributing additional
equity into this unconsolidated real estate joint venture. As of September 30, 2024, our investment in this unconsolidated real estate joint venture was $10.8 million.
(5)This loan is subject to a fixed SOFR floor of 0.75%.
Alexandria Real Estate Equities, Inc. All Rights Reserved. © 2024 | 55 |
Summary of Debt (continued) | |
September 30, 2024 | |
(Dollars in thousands) | |
Debt | Stated Rate | Interest Rate(1) | Maturity Date(2) | Principal Payments Remaining for the Periods Ending December 31, | Principal | Unamortized (Deferred Financing Cost), (Discount)/ Premium | Total | |||||||||||||||||||
2024 | 2025 | 2026 | 2027 | 2028 | Thereafter | |||||||||||||||||||||
Secured notes payable | ||||||||||||||||||||||||||
Greater Boston(3) | SOFR+2.70% | 8.40% | 11/19/26 | $— | $— | $144,527 | $— | $— | $— | $144,527 | $(114) | $144,413 | ||||||||||||||
San Francisco Bay Area | 6.50% | 6.50 | 7/1/36 | — | 34 | 36 | 38 | 41 | 438 | 587 | — | 587 | ||||||||||||||
Secured debt weighted-average interest rate/ subtotal | 8.39 | — | 34 | 144,563 | 38 | 41 | 438 | 145,114 | (114) | 145,000 | ||||||||||||||||
Unsecured senior line of credit and commercial paper program(4) | (4) | 5.05 | (4) | 1/22/30 | (4) | — | — | — | — | — | 455,000 | 455,000 | (411) | 454,589 | ||||||||||||
Unsecured senior notes payable | 3.45% | 3.62 | 4/30/25 | — | 600,000 | — | — | — | — | 600,000 | (518) | 599,482 | ||||||||||||||
Unsecured senior notes payable | 4.30% | 4.50 | 1/15/26 | — | — | 300,000 | — | — | — | 300,000 | (655) | 299,345 | ||||||||||||||
Unsecured senior notes payable | 3.80% | 3.96 | 4/15/26 | — | — | 350,000 | — | — | — | 350,000 | (776) | 349,224 | ||||||||||||||
Unsecured senior notes payable | 3.95% | 4.13 | 1/15/27 | — | — | — | 350,000 | — | — | 350,000 | (1,194) | 348,806 | ||||||||||||||
Unsecured senior notes payable | 3.95% | 4.07 | 1/15/28 | — | — | — | — | 425,000 | — | 425,000 | (1,418) | 423,582 | ||||||||||||||
Unsecured senior notes payable | 4.50% | 4.60 | 7/30/29 | — | — | — | — | — | 300,000 | 300,000 | (1,082) | 298,918 | ||||||||||||||
Unsecured senior notes payable | 2.75% | 2.87 | 12/15/29 | — | — | — | — | — | 400,000 | 400,000 | (2,167) | 397,833 | ||||||||||||||
Unsecured senior notes payable | 4.70% | 4.81 | 7/1/30 | — | — | — | — | — | 450,000 | 450,000 | (2,149) | 447,851 | ||||||||||||||
Unsecured senior notes payable | 4.90% | 5.05 | 12/15/30 | — | — | — | — | — | 700,000 | 700,000 | (4,926) | 695,074 | ||||||||||||||
Unsecured senior notes payable | 3.375% | 3.48 | 8/15/31 | — | — | — | — | — | 750,000 | 750,000 | (4,509) | 745,491 | ||||||||||||||
Unsecured senior notes payable | 2.00% | 2.12 | 5/18/32 | — | — | — | — | — | 900,000 | 900,000 | (7,198) | 892,802 | ||||||||||||||
Unsecured senior notes payable | 1.875% | 1.97 | 2/1/33 | — | — | — | — | — | 1,000,000 | 1,000,000 | (7,326) | 992,674 | ||||||||||||||
Unsecured senior notes payable | 2.95% | 3.07 | 3/15/34 | — | — | — | — | — | 800,000 | 800,000 | (7,425) | 792,575 | ||||||||||||||
Unsecured senior notes payable | 4.75% | 4.88 | 4/15/35 | — | — | — | — | — | 500,000 | 500,000 | (5,071) | 494,929 | ||||||||||||||
Unsecured senior notes payable | 5.25% | 5.38 | 5/15/36 | — | — | — | — | — | 400,000 | 400,000 | (4,195) | 395,805 | ||||||||||||||
Unsecured senior notes payable | 4.85% | 4.93 | 4/15/49 | — | — | — | — | — | 300,000 | 300,000 | (2,900) | 297,100 | ||||||||||||||
Unsecured senior notes payable | 4.00% | 3.91 | 2/1/50 | — | — | — | — | — | 700,000 | 700,000 | 10,017 | 710,017 | ||||||||||||||
Unsecured senior notes payable | 3.00% | 3.08 | 5/18/51 | — | — | — | — | — | 850,000 | 850,000 | (11,322) | 838,678 | ||||||||||||||
Unsecured senior notes payable | 3.55% | 3.63 | 3/15/52 | — | — | — | — | — | 1,000,000 | 1,000,000 | (13,782) | 986,218 | ||||||||||||||
Unsecured senior notes payable | 5.15% | 5.26 | 4/15/53 | — | — | — | — | — | 500,000 | 500,000 | (7,647) | 492,353 | ||||||||||||||
Unsecured senior notes payable | 5.625% | 5.71 | 5/15/54 | — | — | — | — | — | 600,000 | 600,000 | (6,745) | 593,255 | ||||||||||||||
Unsecured debt weighted-average interest rate/ subtotal | 3.85 | — | 600,000 | 650,000 | 350,000 | 425,000 | 10,605,000 | 12,630,000 | (83,399) | 12,546,601 | ||||||||||||||||
Weighted-average interest rate/total | 3.91% | $— | $600,034 | $794,563 | $350,038 | $425,041 | $10,605,438 | $12,775,114 | $(83,513) | $12,691,601 | ||||||||||||||||
Balloon payments | $— | $600,000 | $794,527 | $350,000 | $425,000 | $10,605,068 | $12,774,595 | $— | $12,774,595 | |||||||||||||||||
Principal amortization | — | 34 | 36 | 38 | 41 | 370 | 519 | (83,513) | (82,994) | |||||||||||||||||
Total debt | $— | $600,034 | $794,563 | $350,038 | $425,041 | $10,605,438 | $12,775,114 | $(83,513) | $12,691,601 | |||||||||||||||||
Fixed-rate debt | $— | $600,034 | $650,036 | $350,038 | $425,041 | $10,150,438 | $12,175,587 | $(82,988) | $12,092,599 | |||||||||||||||||
Variable-rate debt | — | — | 144,527 | — | — | 455,000 | 599,527 | (525) | 599,002 | |||||||||||||||||
Total debt | $— | $600,034 | $794,563 | $350,038 | $425,041 | $10,605,438 | $12,775,114 | $(83,513) | $12,691,601 | |||||||||||||||||
Weighted-average stated rate on maturing debt | N/A | 3.45% | 3.79% | 3.95% | 3.95% | 3.74% | ||||||||||||||||||||
(1)Represents the weighted-average interest rate as of the end of the applicable period, including amortization of loan fees, amortization of debt premiums (discounts), and other bank fees.
(2)Reflects any extension options that we control.
(3)Represents a secured construction loan held by our consolidated real estate joint venture for 99 Coolidge Avenue, of which we own a 75.0% interest. As of September 30, 2024, this joint venture has $50.8 million available under existing
lender commitments. The interest rate shall be reduced from SOFR+2.70% to SOFR+2.10% over time upon the completion of certain leasing, construction, and financial covenant milestones.
(4)Refer to footnotes 2 through 4 under “Fixed-rate and variable-rate debt” in “Summary of Debt” for additional details. In September 2024, we amended and restated our unsecured senior line of credit to, among other changes, extend the
maturity date from January 22, 2028 to January 22, 2030, including extension options that we control.
Alexandria Real Estate Equities, Inc. All Rights Reserved. © 2024 | 56 |
| |
Definitions and Reconciliations | |
September 30, 2024 | |
This section contains additional details for sections throughout the Supplemental Information and the accompanying Earnings Press Release, as well as explanations and reconciliations of certain non-
GAAP financial measures and the reasons why we use these supplemental measures of performance and believe they provide useful information to investors. Additional detail can be found in our most recent
annual report on Form 10-K and subsequent quarterly reports on Form 10-Q, as well as other documents filed with or furnished to the SEC from time to time.
Adjusted EBITDA and Adjusted EBITDA margin
The following table reconciles net income (loss), the most directly comparable financial
measure calculated and presented in accordance with GAAP, to Adjusted EBITDA and calculates the
Adjusted EBITDA margin:
Three Months Ended | |||||||||
(Dollars in thousands) | 9/30/24 | 6/30/24 | 3/31/24 | 12/31/23 | 9/30/23 | ||||
Net income (loss) | $213,603 | $94,049 | $219,176 | $(42,658) | $68,254 | ||||
Interest expense | 43,550 | 45,789 | 40,840 | 31,967 | 11,411 | ||||
Income taxes | 1,877 | 1,182 | 1,764 | 1,322 | 1,183 | ||||
Depreciation and amortization | 293,998 | 290,720 | 287,554 | 285,246 | 269,370 | ||||
Stock compensation expense | 15,525 | 14,507 | 17,125 | 34,592 | 16,288 | ||||
Gain on sales of real estate | (27,114) | — | (392) | (62,227) | — | ||||
Unrealized (gains) losses on non-real estate investments | (2,610) | 64,238 | (29,158) | (19,479) | 77,202 | ||||
Impairment of real estate | 5,741 | 30,763 | — | 271,890 | 20,649 | ||||
Impairment of non-real estate investments | 10,338 | 12,788 | 14,698 | 23,094 | 28,503 | ||||
Adjusted EBITDA | $554,908 | $554,036 | $551,607 | $523,747 | $492,860 | ||||
Total revenues | $791,607 | $766,734 | $769,108 | $757,216 | $713,788 | ||||
Adjusted EBITDA margin | 70% | 72% | 72% | 69% | 69% | ||||
We use Adjusted EBITDA as a supplemental performance measure of our operations, for
financial and operational decision-making, and as a supplemental means of evaluating period-to-period
comparisons on a consistent basis. Adjusted EBITDA is calculated as earnings before interest, taxes,
depreciation, and amortization (“EBITDA”), excluding stock compensation expense, gains or losses on
early extinguishment of debt, gains or losses on sales of real estate, impairments of real estate, and
significant termination fees. Adjusted EBITDA also excludes unrealized gains or losses and significant
realized gains or losses and impairments that result from our non-real estate investments. These non-
real estate investment amounts are classified in our consolidated statements of operations outside of
total revenues.
We believe Adjusted EBITDA provides investors with relevant and useful information as it
allows investors to evaluate the operating performance of our business activities without having to
account for differences recognized because of investing and financing decisions related to our real
estate and non-real estate investments, our capital structure, capital market transactions, and variances
resulting from the volatility of market conditions outside of our control. For example, we exclude gains or
losses on the early extinguishment of debt to allow investors to measure our performance independent
of our indebtedness and capital structure. We believe that adjusting for the effects of impairments and
gains or losses on sales of real estate, significant impairments and realized gains or losses on non-real
estate investments, and significant termination fees allows investors to evaluate performance from
period to period on a consistent basis without having to account for differences recognized because of
investing and financing decisions related to our real estate and non-real estate investments or other
corporate activities that may not be representative of the operating performance of our properties.
In addition, we believe that excluding charges related to stock compensation and unrealized
gains or losses facilitates for investors a comparison of our business activities across periods without the
volatility resulting from market forces outside of our control. Adjusted EBITDA has limitations as a
measure of our performance. Adjusted EBITDA does not reflect our historical expenditures or future
requirements for capital expenditures or contractual commitments. While Adjusted EBITDA is a relevant
measure of performance, it does not represent net income (loss) or cash flows from operations
calculated and presented in accordance with GAAP, and it should not be considered as an alternative to
those indicators in evaluating performance or liquidity.
In order to calculate the Adjusted EBITDA margin, we divide Adjusted EBITDA by total
revenues as presented in our consolidated statements of operations. We believe that this supplemental
performance measure provides investors with additional useful information regarding the profitability of
our operating activities.
We are not able to forecast fourth quarter net income without unreasonable effort and
therefore do not provide a reconciliation for Adjusted EBITDA on a forward-looking basis. This is due to
the inherent difficulty of forecasting the timing and/or amount of items that depend on market conditions
outside of our control, including the timing of dispositions, capital events, and financing decisions, as
well as quarterly components such as gain on sales of real estate, unrealized gains or losses on non-
real estate investments, impairment of real estate, and impairment of non-real estate investments. Our
attempt to predict these amounts may produce significant but inaccurate estimates, which would be
potentially misleading for our investors.
Alexandria Real Estate Equities, Inc. All Rights Reserved. © 2024 | 57 |
| |
Definitions and Reconciliations (continued) | |
September 30, 2024 | |
Annual rental revenue
Annual rental revenue represents the annualized fixed base rental obligations, calculated in
accordance with GAAP, including the amortization of deferred revenue related to tenant-funded and -
built landlord improvements, for leases in effect as of the end of the period, related to our operating
RSF. Annual rental revenue is presented using 100% of the annual rental revenue from our consolidated
properties and our share of annual rental revenue for our unconsolidated real estate joint ventures.
Annual rental revenue per RSF is computed by dividing annual rental revenue by the sum of 100% of
the RSF of our consolidated properties and our share of the RSF of properties held in unconsolidated
real estate joint ventures. As of September 30, 2024, approximately 93% of our leases (on an annual
rental revenue basis) were triple net leases, which require tenants to pay substantially all real estate
taxes, insurance, utilities, repairs and maintenance, common area expenses, and other operating
expenses (including increases thereto) in addition to base rent. Annual rental revenue excludes these
operating expenses recovered from our tenants. Amounts recovered from our tenants related to these
operating expenses, along with base rent, are classified in income from rentals in our consolidated
statements of operations.
Capitalization rates
Capitalization rates are calculated based on net operating income and net operating income
(cash basis) annualized, excluding lease termination fees, on stabilized operating assets for the quarter
preceding the date on which the property is sold, or near-term prospective net operating income.
Capitalized interest
We capitalize interest cost as a cost of a project during periods for which activities necessary
to develop, redevelop, or reposition a project for its intended use are ongoing, provided that
expenditures for the asset have been made and interest cost has been incurred. Activities necessary to
develop, redevelop, or reposition a project include pre-construction activities such as entitlements,
permitting, design, site work, and other activities preceding commencement of construction of
aboveground building improvements. The advancement of pre-construction efforts is focused on
reducing the time required to deliver projects to prospective tenants. These critical activities add
significant value for future ground-up development and are required for the vertical construction of
buildings. If we cease activities necessary to prepare a project for its intended use, interest costs related
to such project are expensed as incurred.
Cash interest
Cash interest is equal to interest expense calculated in accordance with GAAP plus
capitalized interest, less amortization of loan fees and debt premiums (discounts). Refer to the definition
of fixed-charge coverage ratio for a reconciliation of interest expense, the most directly comparable
financial measure calculated and presented in accordance with GAAP, to cash interest.
Class A/A+ properties and AAA locations
Class A/A+ properties are properties clustered in AAA locations that provide innovative
tenants with highly dynamic and collaborative environments that enhance their ability to successfully
recruit and retain world-class talent and inspire productivity, efficiency, creativity, and success. Class A/
A+ properties generally command higher annual rental rates than other classes of similar properties.
AAA locations are in close proximity to concentrations of specialized skills, knowledge, institutions, and
related businesses.
Development, redevelopment, and pre-construction
A key component of our business model is our disciplined allocation of capital to the
development and redevelopment of new Class A/A+ properties, and property enhancements identified
during the underwriting of certain acquired properties, located in collaborative mega campuses in AAA
life science innovation clusters. These projects are generally focused on providing high-quality, generic,
and reusable spaces that meet the real estate requirements of a wide range of tenants. Upon
completion, each development and redevelopment project is expected to generate increases in rental
income, net operating income, and cash flows. Our development and redevelopment projects are
generally in locations that are highly desirable to high-quality entities, which we believe results in higher
occupancy levels, longer lease terms, higher rental income, higher returns, and greater long-term asset
value.
Development projects generally consist of the ground-up development of generic and
reusable laboratory facilities. Redevelopment projects consist of the permanent change in use of
acquired office, warehouse, or shell space into laboratory space. We generally will not commence new
development projects for aboveground construction of new Class A/A+ laboratory space without first
securing significant pre-leasing for such space, except when there is solid market demand for high-
quality Class A/A+ properties.
Priority anticipated projects are those most likely to commence future ground-up development
or first-time conversion from non-laboratory space to laboratory space prior to our other future projects,
pending market conditions and leasing negotiations.
Pre-construction activities include entitlements, permitting, design, site work, and other
activities preceding commencement of construction of aboveground building improvements. The
advancement of pre-construction efforts is focused on reducing the time required to deliver projects to
prospective tenants. These critical activities add significant value for future ground-up development and
are required for the vertical construction of buildings. Ultimately, these projects will provide high-quality
facilities and are expected to generate significant revenue and cash flows.
Development, redevelopment, and pre-construction spending also includes the following
costs: (i) amounts to bring certain acquired properties up to market standard and/or other costs identified
during the acquisition process (generally within two years of acquisition) and (ii) permanent conversion
of space for highly flexible, move-in-ready laboratory space to foster the growth of promising early- and
growth-stage life science companies.
Revenue-enhancing and repositioning capital expenditures represent spending to reposition
or significantly change the use of a property, including through improvement in the asset quality from
Class B to Class A/A+.
Non-revenue-enhancing capital expenditures represent costs required to maintain the current
revenues of a stabilized property, including the associated costs for renewed and re-leased space.
Dividend payout ratio (common stock)
Dividend payout ratio (common stock) is the ratio of the absolute dollar amount of dividends
on our common stock (shares of common stock outstanding on the respective record dates multiplied by
the related dividend per share) to funds from operations attributable to Alexandria’s common
stockholders – diluted, as adjusted.
Alexandria Real Estate Equities, Inc. All Rights Reserved. © 2024 | 58 |
| |
Definitions and Reconciliations (continued) | |
September 30, 2024 | |
Dividend yield
Dividend yield for the quarter represents the annualized quarter dividend divided by the
closing common stock price at the end of the quarter.
Fixed-charge coverage ratio
Fixed-charge coverage ratio is a non-GAAP financial measure representing the ratio of
Adjusted EBITDA to cash interest and fixed charges. We believe that this ratio is useful to investors as a
supplemental measure of our ability to satisfy fixed financing obligations and preferred stock dividends.
Cash interest is equal to interest expense calculated in accordance with GAAP plus capitalized interest,
less amortization of loan fees and debt premiums (discounts).
The following table reconciles interest expense, the most directly comparable financial
measure calculated and presented in accordance with GAAP, to cash interest and computes fixed-
charge coverage ratio:
Three Months Ended | |||||||||
(Dollars in thousands) | 9/30/24 | 6/30/24 | 3/31/24 | 12/31/23 | 9/30/23 | ||||
Adjusted EBITDA | $554,908 | $554,036 | $551,607 | $523,747 | $492,860 | ||||
Interest expense | $43,550 | $45,789 | $40,840 | $31,967 | $11,411 | ||||
Capitalized interest | 86,496 | 81,039 | 81,840 | 89,115 | 96,119 | ||||
Amortization of loan fees | (4,222) | (4,146) | (4,142) | (4,059) | (4,059) | ||||
Amortization of debt discounts | (330) | (328) | (318) | (309) | (306) | ||||
Cash interest and fixed charges | $125,494 | $122,354 | $118,220 | $116,714 | $103,165 | ||||
Fixed-charge coverage ratio: | |||||||||
– quarter annualized | 4.4x | 4.5x | 4.7x | 4.5x | 4.8x | ||||
– trailing 12 months | 4.5x | 4.6x | 4.7x | 4.7x | 4.9x | ||||
We are not able to forecast fourth quarter net income without unreasonable effort and
therefore do not provide a reconciliation for fixed-charge coverage ratio on a forward-looking basis. This
is due to the inherent difficulty of forecasting the timing and/or amount of items that depend on market
conditions outside of our control, including the timing of dispositions, capital events, and financing
decisions, as well as quarterly components such as gain on sales of real estate, unrealized gains or
losses on non-real estate investments, impairment of real estate, and impairment of non-real estate
investments. Our attempt to predict these amounts may produce significant but inaccurate estimates,
which would be potentially misleading for our investors.
Funds from operations and funds from operations, as adjusted, attributable to Alexandria’s
common stockholders
GAAP-basis accounting for real estate assets utilizes historical cost accounting and assumes
that real estate values diminish over time. In an effort to overcome the difference between real estate
values and historical cost accounting for real estate assets, the Nareit Board of Governors established
funds from operations as an improved measurement tool. Since its introduction, funds from operations
has become a widely used non-GAAP financial measure among equity REITs. We believe that funds
from operations is helpful to investors as an additional measure of the performance of an equity
REIT. Moreover, we believe that funds from operations, as adjusted, allows investors to compare our
performance to the performance of other real estate companies on a consistent basis, without having to
account for differences recognized because of real estate acquisition and disposition decisions,
financing decisions, capital structure, capital market transactions, variances resulting from the volatility
of market conditions outside of our control, or other corporate activities that may not be representative of
the operating performance of our properties.
The 2018 White Paper published by the Nareit Board of Governors (the “Nareit White Paper”)
defines funds from operations as net income (computed in accordance with GAAP), excluding gains or
losses on sales of real estate, and impairments of real estate, plus depreciation and amortization of
operating real estate assets, and after adjustments for our share of consolidated and unconsolidated
partnerships and real estate joint ventures. Impairments represent the write-down of assets when fair
value over the recoverability period is less than the carrying value due to changes in general market
conditions and do not necessarily reflect the operating performance of the properties during the
corresponding period.
We compute funds from operations, as adjusted, as funds from operations calculated in
accordance with the Nareit White Paper, excluding significant gains, losses, and impairments realized
on non-real estate investments, unrealized gains or losses on non-real estate investments, impairment
of real estate primarily consisting of pre-acquisition costs incurred in connection with acquisitions we
decided to no longer pursue, gains or losses on early extinguishment of debt, significant termination
fees, acceleration of stock compensation expense due to the resignations of executive officers, deal
costs, the income tax effect related to such items, and the amount of such items that is allocable to our
unvested restricted stock awards. We compute the amount that is allocable to our unvested restricted
stock awards using the two-class method. Under the two-class method, we allocate net income (after
amounts attributable to noncontrolling interests) to common stockholders and to unvested restricted
stock awards by applying the respective weighted-average shares outstanding during each quarter-to-
date and year-to-date period. This may result in a difference of the summation of the quarter-to-date and
year-to-date amounts. Neither funds from operations nor funds from operations, as adjusted, should be
considered as alternatives to net income (determined in accordance with GAAP) as indications of
financial performance, or to cash flows from operating activities (determined in accordance with GAAP)
as measures of liquidity, nor are they indicative of the availability of funds for our cash needs, including
our ability to make distributions.
Alexandria Real Estate Equities, Inc. All Rights Reserved. © 2024 | 59 |
| |
Definitions and Reconciliations (continued) | |
September 30, 2024 | |
Funds from operations and funds from operations, as adjusted, attributable to Alexandria’s
common stockholders (continued)
The following table reconciles net income to funds from operations for the share of
consolidated real estate joint ventures attributable to noncontrolling interests and our share of
unconsolidated real estate joint ventures:
Noncontrolling Interest Share of Consolidated Real Estate JVs | Our Share of Unconsolidated Real Estate JVs | ||||||
September 30, 2024 | September 30, 2024 | ||||||
(In thousands) | Three Months Ended | Nine Months Ended | Three Months Ended | Nine Months Ended | |||
Net income | $45,656 | $141,634 | $139 | $424 | |||
Depreciation and amortization of real estate assets | 32,457 | 94,725 | 1,075 | 3,177 | |||
Funds from operations | $78,113 | $236,359 | $1,214 | $3,601 | |||
Gross assets
Gross assets are calculated as total assets plus accumulated depreciation:
(In thousands) | 9/30/24 | 6/30/24 | 3/31/24 | 12/31/23 | 9/30/23 | ||||
Total assets | $38,488,128 | $37,847,865 | $37,699,046 | $36,771,402 | $36,783,293 | ||||
Accumulated depreciation | 5,624,642 | 5,457,414 | 5,216,857 | 4,985,019 | 4,856,436 | ||||
Gross assets | $44,112,770 | $43,305,279 | $42,915,903 | $41,756,421 | $41,639,729 | ||||
Initial stabilized yield (unlevered)
Initial stabilized yield is calculated as the estimated amounts of net operating income at
stabilization divided by our investment in the property. For this calculation, we exclude any tenant-
funded and -built landlord improvements from our investment in the property. Our initial stabilized yield
excludes the benefit of leverage. Our cash rents related to our development and redevelopment projects
are generally expected to increase over time due to contractual annual rent escalations. Our estimates
for initial stabilized yields, initial stabilized yields (cash basis), and total costs at completion represent
our initial estimates at the commencement of the project. We expect to update this information upon
completion of the project, or sooner if there are significant changes to the expected project yields or
costs.
•Initial stabilized yield reflects rental income, including contractual rent escalations and any rent
concessions over the term(s) of the lease(s), calculated on a straight-line basis, and any
amortization of deferred revenue related to tenant-funded and -built landlord improvements.
•Initial stabilized yield (cash basis) reflects cash rents at the stabilization date after initial rental
concessions, if any, have elapsed and our total cash investment in the property.
Investment-grade or publicly traded large cap tenants
Investment-grade or publicly traded large cap tenants represent tenants that are investment-
grade rated or publicly traded companies with an average daily market capitalization greater than $10
billion for the twelve months ended September 30, 2024, as reported by Bloomberg Professional
Services. Credit ratings from Moody’s Ratings and S&P Global Ratings reflect credit ratings of the
tenant’s parent entity, and there can be no assurance that a tenant’s parent entity will satisfy the tenant’s
lease obligation upon such tenant’s default. We monitor the credit quality and related material changes
of our tenants. Material changes that cause a tenant’s market capitalization to decrease below $10
billion, which are not immediately reflected in the twelve-month average, may result in their exclusion
from this measure.
Investments
We hold investments in publicly traded companies and privately held entities primarily
involved in the life science industries. We recognize, measure, present, and disclose these investments
as follows:
Statements of Operations | ||||||
Balance Sheet | Gains and Losses | |||||
Carrying Amount | Unrealized | Realized | ||||
Difference between proceeds received upon disposition and historical cost | ||||||
Publicly traded companies | Fair value | Changes in fair value | ||||
Privately held entities without readily determinable fair values that: | ||||||
Report NAV | Fair value, using NAV as a practical expedient | Changes in NAV, as a practical expedient to fair value | ||||
Do not report NAV | Cost, adjusted for observable price changes and impairments(1) | Observable price changes(1) | Impairments to reduce costs to fair value, which result in an adjusted cost basis and the differences between proceeds received upon disposition and adjusted or historical cost | |||
Equity method investments | Contributions, adjusted for our share of the investee’s earnings or losses, less distributions received, reduced by other-than-temporary impairments | Our share of unrealized gains or losses reported by the investee | Our share of realized gains or losses reported by the investee, and other-than- temporary impairments | |||
(1)An observable price is a price observed in an orderly transaction for an identical or similar investment of the same
issuer. Observable price changes result from, among other things, equity transactions for the same issuer with
similar rights and obligations executed during the reporting period, including subsequent equity offerings or other
reported equity transactions related to the same issuer.
Alexandria Real Estate Equities, Inc. All Rights Reserved. © 2024 | 60 |
| |
Definitions and Reconciliations (continued) | |
September 30, 2024 | |
Investments in real estate
The following table reconciles our investments in real estate as of September 30, 2024:
(In thousands) | Investments in Real Estate | ||
Gross investments in real estate | $38,576,419 | ||
Less: accumulated depreciation | (5,624,642) | ||
Investments in real estate | $32,951,777 |
The following table presents our new Class A/A+ development and redevelopment pipeline,
excluding properties held for sale, as a percentage of gross assets and as a percentage of annual rental
revenue as of September 30, 2024:
Percentage of | ||||||
(Dollars in thousands) | Book Value | Gross Assets | Annual Rental Revenue | |||
Under construction projects and one committed near-term project expected to commence construction in the next two years (55% leased/negotiating) | $4,405,094 | 10% | —% | |||
Income-producing/potential cash flows/covered land play(1) | 2,861,653 | 6 | 2 | |||
Land | 2,073,678 | 5 | — | |||
$9,340,425 | 21% | 2% | ||||
(1)Includes projects with existing buildings that are generating or can generate operating cash flows. Also includes
development rights associated with existing operating campuses.
Space Intentionally Blank | |
The square footage presented in the table below is classified as operating as of
September 30, 2024. These lease expirations or vacant space at recently acquired properties represent
future opportunities for which we have the intent, subject to market conditions and leasing, to commence
first-time conversion from non-laboratory space to laboratory space, or to commence future ground-up
development:
Dev/ Redev | RSF of Lease Expirations Targeted for Development and Redevelopment | |||||||||
Property/Submarket | 2024 | 2025 | Thereafter(1) | Total | ||||||
Committed near-term project: | ||||||||||
4161 Campus Point Court/University Town Center | Dev | — | 159,884 | — | 159,884 | |||||
Priority anticipated projects: | ||||||||||
311 Arsenal Street/Cambridge/Inner Suburbs | Redev | — | 25,312 | — | 25,312 | |||||
269 East Grand Avenue/South San Francisco | Redev | 107,250 | — | — | 107,250 | |||||
1020 Red River Street/Austin | Redev | — | 126,034 | — | 126,034 | |||||
107,250 | 151,346 | — | 258,596 | |||||||
Future projects: | ||||||||||
100 Edwin H. Land Boulevard/Cambridge | Dev | 104,500 | — | — | 104,500 | |||||
446, 458, 500, and 550 Arsenal Street/Cambridge/ Inner Suburbs | Dev | — | — | 375,898 | 375,898 | |||||
Other/Greater Boston | Redev | — | — | 167,549 | 167,549 | |||||
1122 and 1150 El Camino Real/South San Francisco | Dev | — | — | 375,232 | 375,232 | |||||
3875 Fabian Way/Greater Stanford | Dev | — | — | 228,000 | 228,000 | |||||
2100, 2200, and 2400 Geng Road/Greater Stanford | Dev | — | — | 78,501 | 78,501 | |||||
960 Industrial Road/Greater Stanford | Dev | — | — | 112,590 | 112,590 | |||||
Campus Point by Alexandria/University Town Center | Dev | — | 109,164 | 226,144 | (2) | 335,308 | ||||
Sequence District by Alexandria/Sorrento Mesa | Dev/ Redev | — | — | 686,290 | 686,290 | |||||
830 4th Avenue South/SoDo | Dev | — | — | 45,615 | 45,615 | |||||
410 West Harrison Street/Elliott Bay | Dev | — | — | 17,205 | 17,205 | |||||
Other/Seattle | Dev | — | — | 75,663 | 75,663 | |||||
100 Capitola Drive/Research Triangle | Dev | — | — | 34,527 | 34,527 | |||||
1001 Trinity Street/Austin | Dev | — | 72,938 | — | 72,938 | |||||
Canada | Redev | — | — | 247,743 | 247,743 | |||||
104,500 | 182,102 | 2,670,957 | 2,957,559 | |||||||
211,750 | 493,332 | 2,670,957 | 3,376,039 | |||||||
(1)Includes vacant square footage as of September 30, 2024.
(2)Represents 226,144 RSF of month-to-month leases in our University Town Center submarket primarily related to
space being temporarily held over by an expiring tenant at buildings that are targeted for the future development
of laboratory space, subject to market conditions and leasing.
Alexandria Real Estate Equities, Inc. All Rights Reserved. © 2024 | 61 |
| |
Definitions and Reconciliations (continued) | |
September 30, 2024 | |
Joint venture financial information
We present components of balance sheet and operating results information related to our real
estate joint ventures, which are not presented, or intended to be presented, in accordance with GAAP.
We present the proportionate share of certain financial line items as follows: (i) for each real estate joint
venture that we consolidate in our financial statements, which are controlled by us through contractual
rights or majority voting rights, but of which we own less than 100%, we apply the noncontrolling interest
economic ownership percentage to each financial item to arrive at the amount of such cumulative
noncontrolling interest share of each component presented; and (ii) for each real estate joint venture that
we do not control and do not consolidate, and are instead controlled jointly or by our joint venture
partners through contractual rights or majority voting rights, we apply our economic ownership
percentage to each financial item to arrive at our proportionate share of each component presented.
The components of balance sheet and operating results information related to our real estate
joint ventures do not represent our legal claim to those items. For each entity that we do not wholly own,
the joint venture agreement generally determines what equity holders can receive upon capital events,
such as sales or refinancing, or in the event of a liquidation. Equity holders are normally entitled to their
respective legal ownership of any residual cash from a joint venture only after all liabilities, priority
distributions, and claims have been repaid or satisfied.
We believe that this information can help investors estimate the balance sheet and operating
results information related to our partially owned entities. Presenting this information provides a
perspective not immediately available from consolidated financial statements and one that can
supplement an understanding of the joint venture assets, liabilities, revenues, and expenses included in
our consolidated results.
The components of balance sheet and operating results information related to our real estate
joint ventures are limited as an analytical tool as the overall economic ownership interest does not
represent our legal claim to each of our joint ventures’ assets, liabilities, or results of operations. In
addition, joint venture financial information may include financial information related to the
unconsolidated real estate joint ventures that we do not control. We believe that in order to facilitate for
investors a clear understanding of our operating results and our total assets and liabilities, joint venture
financial information should be examined in conjunction with our consolidated statements of operations
and balance sheets. Joint venture financial information should not be considered an alternative to our
consolidated financial statements, which are presented and prepared in accordance with GAAP.
Space Intentionally Blank | |
Key items included in net income attributable to Alexandria’s common stockholders
We present a tabular comparison of items, whether gain or loss, that may facilitate a high-
level understanding of our results and provide context for the disclosures included in this Supplemental
Information, our most recent annual report on Form 10-K, and our subsequent quarterly reports on Form
10-Q. We believe that such tabular presentation promotes a better understanding for investors of the
corporate-level decisions made and activities performed that significantly affect comparison of our
operating results from period to period. We also believe that this tabular presentation will supplement for
investors an understanding of our disclosures and real estate operating results. Gains or losses on sales
of real estate and impairments of assets classified as held for sale are related to corporate-level
decisions to dispose of real estate. Gains or losses on early extinguishment of debt are related to
corporate-level financing decisions focused on our capital structure strategy. Significant realized and
unrealized gains or losses on non-real estate investments, impairments of real estate and non-real
estate investments, and acceleration of stock compensation expense due to the resignation of an
executive officer are not related to the operating performance of our real estate assets as they result
from strategic, corporate-level non-real estate investment decisions and external market conditions.
Impairments of non-real estate investments are not related to the operating performance of our real
estate as they represent the write-down of non-real estate investments when their fair values decrease
below their respective carrying values due to changes in general market or other conditions outside of
our control. Significant items, whether a gain or loss, included in the tabular disclosure for current
periods are described in further detail in this Supplemental Information and accompanying Earnings
Press Release.
Mega campus
Mega campuses are cluster campuses that consist of approximately 1 million RSF or more,
including operating, active development/redevelopment, and land RSF less operating RSF expected to
be demolished. The following table reconciles our annual rental revenue and development and
redevelopment pipeline RSF as of September 30, 2024:
(Dollars in thousands) | Annual Rental Revenue | Development and Redevelopment Pipeline RSF | ||
Mega campus | $1,666,759 | 21,957,791 | ||
Non-mega campus | 517,316 | 9,880,617 | ||
Total | $2,184,075 | 31,838,408 | ||
Mega campus as a percentage of annual rental revenue and of total development and redevelopment pipeline RSF | 76% | 69% |
Net cash provided by operating activities after dividends
Net cash provided by operating activities after dividends includes the deduction for
distributions to noncontrolling interests. For purposes of this calculation, changes in operating assets
and liabilities are excluded as they represent timing differences.
Alexandria Real Estate Equities, Inc. All Rights Reserved. © 2024 | 62 |
| |
Definitions and Reconciliations (continued) | |
September 30, 2024 | |
Net debt and preferred stock to Adjusted EBITDA
Net debt and preferred stock to Adjusted EBITDA is a non-GAAP financial measure that we
believe is useful to investors as a supplemental measure of evaluating our balance sheet leverage. Net
debt and preferred stock is equal to the sum of total consolidated debt less cash, cash equivalents, and
restricted cash, plus preferred stock outstanding as of the end of the period. Refer to the definition of
Adjusted EBITDA and Adjusted EBITDA margin for further information on the calculation of Adjusted
EBITDA.
The following table reconciles debt to net debt and preferred stock and computes the ratio to
Adjusted EBITDA:
(Dollars in thousands) | 9/30/24 | 6/30/24 | 3/31/24 | 12/31/23 | 9/30/23 | |||||
Secured notes payable | $145,000 | $134,942 | $130,050 | $119,662 | $109,110 | |||||
Unsecured senior notes payable | 12,092,012 | 12,089,561 | 12,087,113 | 11,096,028 | 11,093,725 | |||||
Unsecured senior line of credit and commercial paper | 454,589 | 199,552 | — | 99,952 | — | |||||
Unamortized deferred financing costs | 79,610 | 81,942 | 84,198 | 76,329 | 78,496 | |||||
Cash and cash equivalents | (562,606) | (561,021) | (722,176) | (618,190) | (532,390) | |||||
Restricted cash | (17,031) | (4,832) | (9,519) | (42,581) | (35,321) | |||||
Preferred stock | — | — | — | — | — | |||||
Net debt and preferred stock | $12,191,574 | $11,940,144 | $11,569,666 | $10,731,200 | $10,713,620 | |||||
Adjusted EBITDA: | ||||||||||
– quarter annualized | $2,219,632 | $2,216,144 | $2,206,428 | $2,094,988 | $1,971,440 | |||||
– trailing 12 months | $2,184,298 | $2,122,250 | $2,064,904 | $1,997,518 | $1,935,505 | |||||
Net debt and preferred stock to Adjusted EBITDA: | ||||||||||
– quarter annualized | 5.5x | 5.4x | 5.2x | 5.1x | 5.4x | |||||
– trailing 12 months | 5.6x | 5.6x | 5.6x | 5.4x | 5.5x | |||||
We are not able to forecast fourth quarter net income without unreasonable effort and
therefore do not provide a reconciliation for net debt and preferred stock to Adjusted EBITDA on a
forward-looking basis. This is due to the inherent difficulty of forecasting the timing and/or amount of
items that depend on market conditions outside of our control, including the timing of dispositions,
capital events, and financing decisions, as well as quarterly components such as gain on sales of real
estate, unrealized gains or losses on non-real estate investments, impairment of real estate, and
impairment of non-real estate investments. Our attempt to predict these amounts may produce
significant but inaccurate estimates, which would be potentially misleading for our investors.
Net operating income, net operating income (cash basis), and operating margin
The following table reconciles net income (loss) to net operating income and net operating
income (cash basis) and computes operating margin:
Three Months Ended | Nine Months Ended | |||||||
(Dollars in thousands) | 9/30/24 | 9/30/23 | 9/30/24 | 9/30/23 | ||||
Net income | $213,603 | $68,254 | $526,828 | $323,652 | ||||
Equity in earnings of unconsolidated real estate joint ventures | (139) | (242) | (424) | (617) | ||||
General and administrative expenses | 43,945 | 45,987 | 135,629 | 140,065 | ||||
Interest expense | 43,550 | 11,411 | 130,179 | 42,237 | ||||
Depreciation and amortization | 293,998 | 269,370 | 872,272 | 808,227 | ||||
Impairment of real estate | 5,741 | 20,649 | 36,504 | 189,224 | ||||
Gain on sales of real estate | (27,114) | — | (27,506) | (214,810) | ||||
Investment (income) loss | (15,242) | 80,672 | (14,866) | 204,051 | ||||
Net operating income | 558,342 | 496,101 | 1,658,616 | 1,492,029 | ||||
Straight-line rent revenue | (29,087) | (29,805) | (125,676) | (92,331) | ||||
Amortization of deferred revenue related to tenant-funded and -built landlord improvements | (329) | — | (329) | — | ||||
Amortization of acquired below-market leases | (17,312) | (23,222) | (70,167) | (69,647) | ||||
Net operating income (cash basis) | $511,614 | $443,074 | $1,462,444 | $1,330,051 | ||||
Net operating income (cash basis) – annualized | $2,046,456 | $1,772,296 | $1,949,925 | $1,773,401 | ||||
Net operating income (from above) | $558,342 | $496,101 | $1,658,616 | $1,492,029 | ||||
Total revenues | $791,607 | $713,788 | $2,327,449 | $2,128,483 | ||||
Operating margin | 71% | 70% | 71% | 70% | ||||
Net operating income is a non-GAAP financial measure calculated as net income (loss), the
most directly comparable financial measure calculated and presented in accordance with GAAP,
excluding equity in the earnings of our unconsolidated real estate joint ventures, general and
administrative expenses, interest expense, depreciation and amortization, impairments of real estate,
gains or losses on early extinguishment of debt, gains or losses on sales of real estate, and investment
income or loss. We believe net operating income provides useful information to investors regarding our
financial condition and results of operations because it primarily reflects those income and expense
items that are incurred at the property level. Therefore, we believe net operating income is a useful
measure for investors to evaluate the operating performance of our consolidated real estate assets. Net
operating income on a cash basis is net operating income adjusted to exclude the effect of straight-line
rent, amortization of acquired above- and below-market lease revenue, and amortization of deferred
revenue related to tenant-funded and -built landlord improvements adjustments required by GAAP. We
believe that net operating income on a cash basis is helpful to investors as an additional measure of
operating performance because it eliminates straight-line rent revenue and the amortization of acquired
above- and below-market leases and tenant-funded and -built landlord improvements.
Alexandria Real Estate Equities, Inc. All Rights Reserved. © 2024 | 63 |
| |
Definitions and Reconciliations (continued) | |
September 30, 2024 | |
Net operating income, net operating income (cash basis), and operating margin (continued)
Furthermore, we believe net operating income is useful to investors as a performance
measure of our consolidated properties because, when compared across periods, net operating income
reflects trends in occupancy rates, rental rates, and operating costs, which provide a perspective not
immediately apparent from net income or loss. Net operating income can be used to measure the initial
stabilized yields of our properties by calculating net operating income generated by a property divided by
our investment in the property. Net operating income excludes certain components from net income in
order to provide results that are more closely related to the results of operations of our properties. For
example, interest expense is not necessarily linked to the operating performance of a real estate asset
and is often incurred at the corporate level rather than at the property level. In addition, depreciation and
amortization, because of historical cost accounting and useful life estimates, may distort comparability of
operating performance at the property level. Impairments of real estate have been excluded in deriving
net operating income because we do not consider impairments of real estate to be property-level
operating expenses. Impairments of real estate relate to changes in the values of our assets and do not
reflect the current operating performance with respect to related revenues or expenses. Our
impairments of real estate represent the write-down in the value of the assets to the estimated fair value
less cost to sell. These impairments result from investing decisions or a deterioration in market
conditions. We also exclude realized and unrealized investment gain or loss, which results from
investment decisions that occur at the corporate level related to non-real estate investments in publicly
traded companies and certain privately held entities. Therefore, we do not consider these activities to be
an indication of operating performance of our real estate assets at the property level. Our calculation of
net operating income also excludes charges incurred from changes in certain financing decisions, such
as losses on early extinguishment of debt, as these charges often relate to corporate strategy. Property
operating expenses included in determining net operating income primarily consist of costs that are
related to our operating properties, such as utilities, repairs, and maintenance; rental expense related to
ground leases; contracted services, such as janitorial, engineering, and landscaping; property taxes and
insurance; and property-level salaries. General and administrative expenses consist primarily of
accounting and corporate compensation, corporate insurance, professional fees, rent, and supplies that
are incurred as part of corporate office management. We calculate operating margin as net operating
income divided by total revenues.
We believe that in order to facilitate for investors a clear understanding of our operating
results, net operating income should be examined in conjunction with net income or loss as presented in
our consolidated statements of operations. Net operating income should not be considered as an
alternative to net income or loss as an indication of our performance, nor as an alternative to cash flows
as a measure of our liquidity or our ability to make distributions.
Operating statistics
We present certain operating statistics related to our properties, including number of
properties, RSF, occupancy percentage, leasing activity, and contractual lease expirations as of the end
of the period. We believe these measures are useful to investors because they facilitate an
understanding of certain trends for our properties. We compute the number of properties, RSF,
occupancy percentage, leasing activity, and contractual lease expirations at 100%, excluding RSF at
properties classified as held for sale, for all properties in which we have an investment, including
properties owned by our consolidated and unconsolidated real estate joint ventures. For operating
metrics based on annual rental revenue, refer to the definition of annual rental revenue herein.
Same property comparisons
As a result of changes within our total property portfolio during the comparative periods
presented, including changes from assets acquired or sold, properties placed into development or
redevelopment, and development or redevelopment properties recently placed into service, the
consolidated total income from rentals, as well as rental operating expenses in our operating results, can
show significant changes from period to period. In order to supplement an evaluation of our results of
operations over a given quarterly or annual period, we analyze the operating performance for all
consolidated properties that were fully operating for the entirety of the comparative periods presented,
referred to as same properties. We separately present quarterly and year-to-date same property results
to align with the interim financial information required by the SEC in our management’s discussion and
analysis of our financial condition and results of operations. These same properties are analyzed
separately from properties acquired subsequent to the first day in the earliest comparable quarterly or
year-to-date period presented, properties that underwent development or redevelopment at any time
during the comparative periods, unconsolidated real estate joint ventures, properties classified as held
for sale, and corporate entities (legal entities performing general and administrative functions), which are
excluded from same property results. Additionally, termination fees, if any, are excluded from the results
of same properties.
Space Intentionally Blank | |
Alexandria Real Estate Equities, Inc. All Rights Reserved. © 2024 | 64 |
| |
Definitions and Reconciliations (continued) | |
September 30, 2024 | |
Same property comparisons (continued)
The following table reconciles the number of same properties to total properties for the nine
months ended September 30, 2024:
Redevelopment – placed into | |||||||
Development – under construction | Properties | service after January 1, 2023 | Properties | ||||
201 Brookline Avenue | 1 | 20400 Century Boulevard | 1 | ||||
99 Coolidge Avenue | 1 | 140 First Street | 1 | ||||
500 North Beacon Street and 4 Kingsbury Avenue | 2 | 2400 Ellis Road, 40 Moore Drive, and 14 TW Alexander Drive | 3 | ||||
9808 Medical Center Drive | 1 | 9601 and 9603 Medical Center Drive | 2 | ||||
1450 Owens Street | 1 | 7 | |||||
230 Harriet Tubman Way | 1 | Acquisitions after January 1, 2023 | Properties | ||||
4155 Campus Point Court | 1 | Other | 5 | ||||
10935, 10945, and 10955 Alexandria Way | 3 | 5 | |||||
Unconsolidated real estate JVs | 4 | ||||||
10075 Barnes Canyon Road | 1 | Properties held for sale | 9 | ||||
421 Park Drive | 1 | Total properties excluded from same properties | 67 | ||||
4135 Campus Point Court | 1 | ||||||
701 Dexter Avenue North | 1 | Same properties | 339 | ||||
15 | Total properties in North America as of September 30, 2024 | 406 | |||||
Development – placed into | |||||||
service after January 1, 2023 | Properties | ||||||
751 Gateway Boulevard | 1 | ||||||
15 Necco Street | 1 | ||||||
325 Binney Street | 1 | ||||||
9810 Darnestown Road | 1 | ||||||
9820 Darnestown Road | 1 | ||||||
1150 Eastlake Avenue East | 1 | ||||||
6 | |||||||
Redevelopment – under construction | Properties | ||||||
840 Winter Street | 1 | ||||||
40, 50, and 60 Sylvan Road | 3 | ||||||
Alexandria Center® for Advanced Technologies – Monte Villa Parkway | 6 | ||||||
651 Gateway Boulevard | 1 | ||||||
401 Park Drive | 1 | ||||||
8800 Technology Forest Place | 1 | ||||||
311 Arsenal Street | 1 | ||||||
One Hampshire Street | 1 | ||||||
Canada | 4 | ||||||
Other | 2 | ||||||
21 |
Stabilized occupancy date
The stabilized occupancy date represents the estimated date on which the project is expected
to reach occupancy of 95% or greater.
Tenant recoveries
Tenant recoveries represent revenues comprising reimbursement of real estate taxes,
insurance, utilities, repairs and maintenance, common area expenses, and other operating expenses
and earned in the period during which the applicable expenses are incurred and the tenant’s obligation
to reimburse us arises.
We classify rental revenues and tenant recoveries generated through the leasing of real
estate assets within revenues in income from rentals in our consolidated statements of operations. We
provide investors with a separate presentation of rental revenues and tenant recoveries in “Same
property performance” in this Supplemental Information because we believe it promotes investors’
understanding of our operating results. We believe that the presentation of tenant recoveries is useful to
investors as a supplemental measure of our ability to recover operating expenses under our triple net
leases, including recoveries of utilities, repairs and maintenance, insurance, property taxes, common
area expenses, and other operating expenses, and of our ability to mitigate the effect to net income for
any significant variability to components of our operating expenses.
The following table reconciles income from rentals to tenant recoveries:
Three Months Ended | Nine Months Ended | ||||||||||||
(In thousands) | 9/30/24 | 6/30/24 | 3/31/24 | 12/31/23 | 9/30/23 | 9/30/24 | 9/30/23 | ||||||
Income from rentals | $775,744 | $755,162 | $755,551 | $742,637 | $707,531 | $2,286,457 | $2,099,819 | ||||||
Rental revenues | (579,569) | (576,835) | (581,400) | (561,428) | (526,352) | (1,737,804) | (1,582,543) | ||||||
Tenant recoveries | $196,175 | $178,327 | $174,151 | $181,209 | $181,179 | $548,653 | $517,276 | ||||||
Total equity capitalization
Total equity capitalization is equal to the outstanding shares of common stock multiplied by the
closing price on the last trading day at the end of each period presented.
Total market capitalization
Total market capitalization is equal to the sum of total equity capitalization and total debt.
Alexandria Real Estate Equities, Inc. All Rights Reserved. © 2024 | 65 |
| |
Definitions and Reconciliations (continued) | |
September 30, 2024 | |
Unencumbered net operating income as a percentage of total net operating income
Unencumbered net operating income as a percentage of total net operating income is a non-
GAAP financial measure that we believe is useful to investors as a performance measure of the results
of operations of our unencumbered real estate assets as it reflects those income and expense items that
are incurred at the unencumbered property level. Unencumbered net operating income is derived from
assets classified in continuing operations, which are not subject to any mortgage, deed of trust, lien, or
other security interest, as of the period for which income is presented.
The following table summarizes unencumbered net operating income as a percentage of total
net operating income:
Three Months Ended | |||||||||
(Dollars in thousands) | 9/30/24 | 6/30/24 | 3/31/24 | 12/31/23 | 9/30/23 | ||||
Unencumbered net operating income | $553,589 | $544,268 | $546,830 | $533,382 | $495,012 | ||||
Encumbered net operating income | 4,753 | 5,212 | 3,964 | 1,108 | 1,089 | ||||
Total net operating income | $558,342 | $549,480 | $550,794 | $534,490 | $496,101 | ||||
Unencumbered net operating income as a percentage of total net operating income | 99.1% | 99.1% | 99.3% | 99.8% | 99.8% | ||||
Weighted-average interest rate for capitalization of interest
The weighted-average interest rate required for calculating capitalization of interest pursuant
to GAAP represents a weighted-average rate as of the end of the applicable period, based on the rates
applicable to borrowings outstanding during the period, including expense/income related to interest rate
hedge agreements, amortization of loan fees, amortization of debt premiums (discounts), and other bank
fees. A separate calculation is performed to determine our weighted-average interest rate for
capitalization for each month. The rate will vary each month due to changes in variable interest rates,
outstanding debt balances, the proportion of variable-rate debt to fixed-rate debt, the amount and terms
of interest rate hedge agreements, and the amount of loan fee and premium (discount) amortization.
Space Intentionally Blank | |
Weighted-average shares of common stock outstanding – diluted
From time to time, we enter into capital market transactions, including forward equity sales
agreements (“Forward Agreements”), to fund acquisitions, to fund construction of our development and
redevelopment projects, and for general working capital purposes. We are required to consider the
potential dilutive effect of our Forward Agreements under the treasury stock method while the Forward
Agreements are outstanding. As of September 30, 2024, we had Forward Agreements outstanding to
sell an aggregate of 230 thousand shares of common stock.
The weighted-average shares of common stock outstanding used in calculating EPS – diluted,
FFO per share – diluted, and FFO per share – diluted, as adjusted, during each period are calculated as
follows. Also shown are the weighted-average unvested shares associated with restricted stock awards
used in calculating amounts allocable to unvested stock award holders pursuant to the two-class method
for each of the respective periods presented below:
Three Months Ended | Nine Months Ended | ||||||||||||
(In thousands) | 9/30/24 | 6/30/24 | 3/31/24 | 12/31/23 | 9/30/23 | 9/30/24 | 9/30/23 | ||||||
Basic shares for earnings per share | 172,058 | 172,013 | 171,949 | 171,096 | 170,890 | 172,007 | 170,846 | ||||||
Forward Agreements | — | — | — | — | — | — | — | ||||||
Diluted shares for earnings per share | 172,058 | 172,013 | 171,949 | 171,096 | 170,890 | 172,007 | 170,846 | ||||||
Basic shares for funds from operations per share and funds from operations per share, as adjusted | 172,058 | 172,013 | 171,949 | 171,096 | 170,890 | 172,007 | 170,846 | ||||||
Forward Agreements | — | — | — | — | — | — | — | ||||||
Diluted shares for funds from operations per share and funds from operations per share, as adjusted | 172,058 | 172,013 | 171,949 | 171,096 | 170,890 | 172,007 | 170,846 | ||||||
Weighted-average unvested restricted shares used in calculating the allocations of net income, funds from operations, and funds from operations, as adjusted | 2,838 | 2,878 | 2,987 | 2,734 | 2,124 | 2,901 | 2,187 | ||||||