United States
Securities and Exchange Commission
Washington, D.C. 20549
FORM 6-K
Report of Foreign Private Issuer
Pursuant to Rule 13a-16 or 15d-16
of the
Securities Exchange Act of 1934
For the month of
October 2024
Vale S.A.
Praia de Botafogo nº 186, 18º andar,
Botafogo
22250-145 Rio de Janeiro, RJ, Brazil
(Address of principal executive office)
(Indicate by check mark whether the registrant files or will file annual reports under cover of Form 20-F or Form 40-F.)
(Check One) Form 20-F x Form 40-F ¨
| · | Vale’s Q3 performance was marked by record iron ore output since 4Q18 and an increase in the production guidance for 2024. In copper, ore processed at Salobo 1 & 2 increased by 30% y/y supported by stronger mill performance. In nickel, performance of the Sudbury mines drove a 20% increase in mill throughput y/y. |
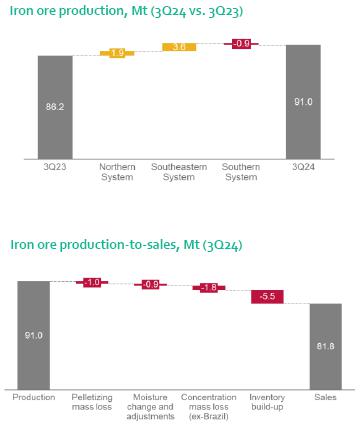
| · | Iron ore production reached 91.0 Mt, 4.7 Mt (+5%) higher y/y, driven by improved performance at S11D, Itabira and Brucutu. As previously announced, Vale has revised its production guidance upward to 323-330 Mt (from 310-320 Mt), reflecting continued improvements on operational stability and asset reliability. Pellets production totaled 10.4 Mt, 1.2 Mt (+13%) higher y/y. Iron ore sales were 81.8 Mt, up 1.3 Mt (+2%) y/y. |
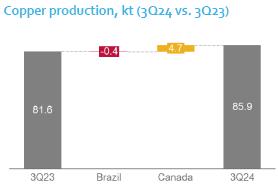
| · | Copper production totaled 85.9 kt, 4.3 kt (+5%) higher y/y, reflecting stronger performance across all operations, which was partially offset by the impact of an incident in a conveyor belt at the Salobo 3 plant in June. |
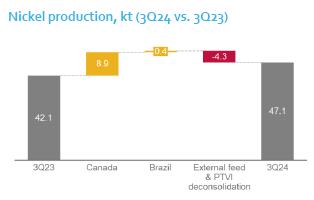
| · | Nickel production totaled 47.1 kt, 5.0 kt (+12%) higher y/y, mainly reflecting stronger asset performance in Sudbury and the continued ramp-up of Voisey’s Bay underground mines. |
 | Highlights |
Production Summary |
|||||||||||||||||
| 000’ metric tons | 3Q24 | 2Q24 | ∆ q/q | 3Q23 | ∆ y/y | 9M24 | 9M23 | Δ y/y | 2024 guidance | ||||||||
| Iron ore1 | 90,971 | 80,598 | 12.9% | 86,238 | 5.5% | 242,395 | 231,755 | 4.6% | 323-330 Mt | ||||||||
| Pellets | 10,363 | 8,895 | 16.5% | 9,175 | 12.9% | 27,724 | 26,604 | 4.2% | 38-42 Mt2 | ||||||||
| Copper | 85.9 | 78.6 | 9.3% | 81.6 | 5.3% | 246.3 | 227.5 | 8.3% | 320-355 kt | ||||||||
| Nickel | 47.1 | 27.9 | 68.8% | 42.1 | 11.9% | 114.4 | 120.0 | -4.7% | 153-168 kt3 | ||||||||
1 Including third-party purchases, run-of-mine and feed for pelletizing plants.
2 Iron ore agglomerates guidance, including iron ore pellets and briquettes.
3 Nickel guidance was updated on September 11, 2024, to reflect the impact of PTVI deconsolidation, following the partial divestment completed in June 2024.
Sales Summary |
|||||||||||||||
| 000’ metric tons | 3Q24 | 2Q24 | ∆ q/q | 3Q23 | ∆ y/y | 9M24 | 9M23 | Δ y/y | |||||||
| Iron ore | 81,838 | 79,792 | 2.6% | 80,559 | 1.6% | 225,456 | 210,591 | 7.1% | |||||||
| Fines1 | 69,344 | 68,512 | 1.2% | 69,714 | -0.5% | 190,402 | 178,904 | 6.4% | |||||||
| Pellets | 10,143 | 8,864 | 14.4% | 8,613 | 17.8% | 28,232 | 25,556 | 10.5% | |||||||
| ROM | 2,351 | 2,416 | -2.7% | 2,232 | 5.3% | 6,822 | 6,132 | 11.3% | |||||||
| Copper | 75.2 | 76.1 | -1.2% | 73.8 | 1.9% | 228.1 | 210.3 | 8.5% | |||||||
| Nickel | 40.7 | 34.3 | 18.7% | 39.2 | 3.8% | 108.1 | 119.6 | -9.6% | |||||||
1 Including third-party purchases.
Price Realization Summary |
|||||||||||||
| US$/t | 3Q24 | 2Q24 | ∆ q/q | 3Q23 | ∆ y/y | 9M24 | 9M23 | Δ y/y | |||||
| Iron ore fines (CFR/FOB, wmt) | 90.6 | 98.2 | -7.7% | 105.1 | -13.8% | 96.1 | 103.7 | -7.3% | |||||
| Iron ore pellets (CFR/FOB, wmt) | 148.2 | 157.2 | -5.7% | 161.2 | -8.1% | 158.7 | 161.3 | -1.6% | |||||
| Copper1 | 9,016 | 9,202 | -2.0% | 7,731 | 16.6% | 8,651 | 7,969 | 8.6% | |||||
| Nickel | 17,012 | 18,638 | -8.7% | 21,237 | -19.9% | 17,477 | 23,203 | -24.7% | |||||
1 Average realized price for copper operations only (Salobo and Sossego). Average realized copper price for all operations, including copper sales originated from nickel operations, was US$ 9,053/t in 3Q24.
Iron ore and pellets operations
| · | Southern System: production was 0.9 Mt lower y/y, primarily due to (i) lower third-party purchases and (ii) reduced high-silica products output at the Vargem Grande complex due to market conditions. These effects were partially offset by increased production at Viga, following maintenance works in the 3Q23. In September, the commissioning of wet processing operations in the Vargem Grande 1 Project started. This will allow the Vargem Grande complex to resume approximately 15 Mtpa of iron ore production and improve the average quality by approximately 2% of contained iron. |
| · | Pellets: production was 1.2 Mt higher y/y, achieving its highest quarterly production since 2018, driven by higher pellet feed availability from the Brucutu and Itabira mines, increasing pellet production at the Tubarão site. |
| · | Iron ore sales were 1.3 Mt higher y/y, totaling 81.8 Mt, supported by 18% higher pellet sales. Considering the higher pellet production and healthy demand in the quarter, pellet sales increased to 10.1 Mt (+18% y/y), supporting overall iron ore sales, which totaled 81.8 Mt (+2% y/y). The 5.5 Mt inventory build-up was mainly due to cargos in transit along the supply chain as production seasonally increased in Q3. These inventories will be converted into sales in Q4. |
| · | The all-in premium improved by US$ 1.8/t q/q, totaling US$ 1.7/t[1], driven by higher average quality of the product portfolio. This improvement is a result of the increased availability of high-quality products, mainly from the Northern System, allowing for higher BRBF sales and the proactive decision to reduce direct sales of high-silica products, due to market conditions. |
| · | The average realized iron ore fines price was US$ 90.6/t, US$ 7.6/t lower q/q despite iron ore reference prices having decreased by US$ 12.0/t in the period. The lower decline vs. the reference price is attributed to an enhanced product portfolio and the positive effect from provisional pricing adjustments, given higher-than-average forward prices in the last day of the quarter. The average realized iron ore pellet price was US$ 148.2/t, US$ 9.0/t lower q/q, due to lower iron ore prices. |
[1] Iron ore fines premium of US$ -1.9/t and the weighted average contribution of the pellet business of US$ 3.6/t.
- 2 - |  |
Copper operations
| · | Canada: copper production increased by 4.7 kt y/y, mainly reflecting improved mining performance in Sudbury and shorter mine and mill maintenance periods y/y. Also, production was positively impacted by the ramp-up of VBME and higher copper precipitates output in Thompson. |
| · | Payable copper sales[2] totaled 75.2 kt in the quarter, up 1.4 kt y/y, mainly reflecting higher production. Sales in the quarter were lower than production, mainly due to in-transit volumes and Vale Base Metals’ commercial strategy. |
| · | The average copper realized price was US$ 9,016/t, 2.0% lower q/q, mainly due to lower LME reference prices. |
[2] Sales volumes are lower than production volumes due to payable copper vs. contained copper: part of the copper contained in the concentrates is lost in the smelting and refining process, hence payable quantities of copper are approximately 3.5% lower than contained volumes.
- 3 - | |
Nickel operations
| · | Voisey’s Bay-sourced ore: finished nickel production increased by 2.2 kt y/y, driven by the availability of Voisey’s Bay-sourced feed at Long Harbour, as higher nickel grade from underground mines continued to ramp-up, as well as higher availability of the Long Harbour refinery. |
| · | Onça Puma: nickel production increased by 0.4 kt y/y, as in 3Q23 the furnace was operating at a lower rate in preparation for the furnace rebuild. The operation has been running steadily since the conclusion of the furnace rebuild. The plant has experienced a power disruption after a severe windstorm has damaged the local utility company’s transmission line on October 5th. |
| · | External feed: finished nickel production from external feed was 19.3 kt in the quarter. Third-party feed decreased by 2.5 kt y/y, as planned. PTVI-sourced production decreased by 1.9 kt y/y, mainly reflecting the deconsolidation[3] of PTVI, partially offset by higher nickel production at the Matsusaka refinery. |
| · | Nickel sales totaled 40.7 kt, 1.5 kt higher y/y, driven by higher production. In the quarter, nickel sales were 6.4 kt lower than production due to an inventory build-up, as well as due to Vale Base Metals’ sales strategy. |
| · | The average nickel realized price was US$ 17,012/t, down 9% q/q, due to lower LME reference prices, partially offset by higher realized premiums. |
[3] Starting from 3Q24, PTVI sourced production is reported as “External feed” and reflects solely the 80%-offtake attributable to Vale Base Metals processed at downstream facilities. Before, PTVI production was 100% consolidated by Vale.
- 4 - | |

Annex 1: Production and sales summary
Iron ore
| 000’ metric tons | 3Q24 | 2Q24 | ∆ q/q | 3Q23 | ∆ y/y | 9M24 | 9M23 | Δ y/y |
| Northern System | 50,137 | 39,534 | 26.8% | 48,187 | 4.0% | 125,600 | 124,115 | 1.2% |
| Serra Norte and Serra Leste | 28,044 | 20,012 | 40.1% | 28,833 | -2.7% | 66,273 | 69,283 | -4.3% |
| S11D | 22,094 | 19,522 | 13.2% | 19,355 | 14.2% | 59,327 | 54,832 | 8.2% |
| Southeastern System | 24,000 | 21,228 | 13.1% | 20,350 | 17.9% | 64,779 | 60,748 | 6.6% |
| Itabira (Cauê, Conceição and others) | 9,492 | 8,003 | 18.6% | 7,619 | 24.6% | 25,094 | 23,185 | 8.2% |
| Minas Centrais (Brucutu and others) | 7,250 | 6,152 | 17.8% | 5,939 | 22.1% | 19,799 | 18,071 | 9.6% |
| Mariana (Alegria, Timbopeba and others) | 7,258 | 7,073 | 2.6% | 6,791 | 6.9% | 19,886 | 19,492 | 2.0% |
| Southern System | 16,833 | 19,836 | -15.1% | 17,701 | -4.9% | 52,016 | 46,892 | 10.9% |
| Paraopeba (Mutuca, Fábrica and others) | 7,103 | 7,970 | -10.9% | 8,214 | -13.5% | 21,598 | 19,982 | 8.1% |
| Vargem Grande (VGR, Pico and others) | 9,730 | 11,866 | -18.0% | 9,488 | 2.6% | 30,418 | 26,910 | 13.0% |
| Iron Ore Production1 | 90,971 | 80,598 | 12.9% | 86,238 | 5.5% | 242,395 | 231,755 | 4.6% |
| Own production | 84,063 | 73,282 | 14.7% | 79,073 | 6.3% | 222,358 | 215,584 | 3.1% |
| Third-party purchases | 6,908 | 7,316 | -5.6% | 7,165 | -3.6% | 20,037 | 16,171 | 23.9% |
| Iron Ore Sales | 81,838 | 79,792 | 2.6% | 80,559 | 1.6% | 225,456 | 210,591 | 7.1% |
| Fine Sales2 | 69,344 | 68,512 | 1.2% | 69,714 | -0.5% | 190,402 | 178,904 | 6.4% |
| IOCJ | 11,709 | 13,180 | -11.2% | 14,758 | -20.7% | 34,290 | 39,599 | -13.4% |
| BRBF | 34,797 | 30,528 | 14.0% | 36,454 | -4.5% | 91,018 | 89,134 | 2.1% |
| Pellet feed – China (PFC1)3 | 3,328 | 3,337 | -0.3% | 4,234 | -21.4% | 9,201 | 10,056 | -8.5% |
| Lump | 1,971 | 1,782 | 10.6% | 2,367 | -16.7% | 5,562 | 5,626 | -1.1% |
| High-silica products | 8,050 | 11,3724 | -29.2% | 6,131 | 31.3% | 26,5844 | 18,090 | 47.0% |
| Other fines (60-62% Fe) | 9,489 | 8,3134 | 14.1% | 5,770 | 64.5% | 8,2564 | 16,399 | -49.7% |
| Pellet Sales | 10,143 | 8,864 | 14.4% | 8,613 | 17.8% | 28,232 | 25,556 | 10.5% |
| Rom Sales | 2,351 | 2,416 | -2.7% | 2,232 | 5.3% | 6,822 | 6,132 | 11.3% |
| Sales from 3rd party purchase | 7,118 | 7,122 | -0.1% | 6,646 | 7.1% | 19,888 | 15,764 | 26.2% |
1
Including third party purchases, run-of-mine and feed for pelletizing plants. Vale’s product portfolio Fe content reached
62.3%, alumina 1.4% and silica 5.9% in 3Q24.
2 Including third-party purchases.
3 Products concentrated in Chinese facilities.
4 Restated from historical figures.
Pellets
| ‘000 metric tons | 3Q24 | 2Q24 | ∆ q/q | 3Q23 | ∆ y/y | 9M24 | 9M23 | Δ y/y |
| Northern System | 818 | 489 | 67.3% | 1,037 | -21.1% | 2,074 | 2,486 | 16.6% |
| São Luis | 818 | 489 | 67.3% | 1,037 | -21.1% | 2,074 | 2,486 | 16.6% |
| Southeastern System | 5,978 | 4,789 | 24.8% | 4,403 | 35.8% | 15,620 | 13,705 | 14.0% |
| Itabrasco (Tubarão 3) | 908 | 761 | 19.3% | 801 | 13.4% | 2,227 | 2,756 | -19.2% |
| Hispanobras (Tubarão 4) | 531 | 729 | -27.2% | 720 | -26.3% | 1,948 | 777 | 150.7% |
| Nibrasco (Tubarão 5 and 6) | 1,935 | 1,261 | 53.4% | 837 | 131.2% | 4,350 | 3,175 | 37.0% |
| Kobrasco (Tubarão 7) | 1,071 | 489 | 119.0% | 557 | 92.3% | 2,412 | 2,305 | 4.6% |
| Tubarão 8 | 1,532 | 1,549 | -1.1% | 1,488 | 3.0% | 4,682 | 4,692 | -0.2% |
| Southern System | 1,238 | 1,058 | 17.0% | 1,107 | 11.8% | 3,515 | 3,454 | 1.8% |
| Fábrica | - | - | - | - | - | - | - | - |
| Vargem Grande | 1,238 | 1,058 | 17.0% | 1,107 | 11.8% | 3,515 | 3,454 | 1.8% |
| Oman | 2,328 | 2,557 | -9.0% | 2,628 | -11.4% | 6,515 | 6,960 | -6.4% |
| Pellet Production | 10,363 | 8,895 | 16.5% | 9,175 | 12.9% | 27,724 | 26,604 | 4.2% |
| Pellet Sales | 10,143 | 8,864 | 14.4% | 8,613 | 17.8% | 28,232 | 25,556 | 10.5% |
- 5 - | |
Copper - Finished production by source
| 000’ metric tons | 3Q24 | 2Q24 | ∆ q/q | 3Q23 | ∆ y/y | 9M24 | 9M23 | Δ y/y |
| Brazil | 66.3 | 61.3 | 8.2% | 66.7 | -0.6% | 188.2 | 170.5 | 10.4% |
| Salobo | 46.6 | 46.0 | 1.3% | 49.6 | -6.0% | 140.9 | 125.1 | 12.6% |
| Sossego | 19.7 | 15.3 | 28.8% | 17.1 | 15.2% | 47.3 | 45.4 | 4.2% |
| Canada | 19.6 | 17.3 | 13.3% | 14.9 | 31.5% | 58.1 | 57.0 | 1.9% |
| Sudbury | 11.6 | 13.9 | -16.5% | 9.4 | 23.4% | 42.3 | 42.4 | -0.2% |
| Thompson | 3.2 | - | n.a. | 1.6 | 100.0% | 3.7 | 1.8 | 105.6% |
| Voisey's Bay | 3.6 | 2.7 | 33.3% | 2.7 | 33.3% | 9.1 | 7.0 | 30.0% |
| Feed from third parties1 | 1.1 | 0.7 | 57.1% | 1.2 | -8.3% | 3.0 | 5.8 | -48.3% |
| Copper Production | 85.9 | 78.6 | 9.3% | 81.6 | 5.3% | 246.3 | 227.5 | 8.3% |
| Copper Sales | 75.2 | 76.1 | -1.2% | 73.8 | 1.9% | 228.1 | 210.3 | 8.5% |
| Copper Sales Brazil | 61.3 | 58.2 | 5.3% | 61.8 | -0.8% | 175.9 | 157.7 | 11.5% |
| Copper Sales Canada | 13.9 | 18.0 | -22.8% | 12.0 | 15.8% | 52.2 | 52.5 | -0.6% |
1
External feed purchased from third parties and processed into copper in our Canadian operation.
Nickel
| ‘000 metric tons | 3Q24 | 2Q24 | ∆ q/q | 3Q23 | ∆ y/y | 9M24 | 9M23 | Δ y/y |
| Finished Production by Source | ||||||||
| Canada | 21.5 | 7.3 | 194.5% | 12.6³ | 70.6% | 45.7 | 43.0³ | 6.3% |
| Sudbury | 12.3 | 3.1 | 296.8% | 6.7³ | 83.6% | 25.6 | 26.2³ | -2.3% |
| Thompson | 3.1 | 1.8 | 72.2% | 2.0³ | 55.0% | 7.3 | 6.8³ | 7.4% |
| Voisey's Bay | 6.1 | 2.4 | 154.2% | 3.9 | 56.4% | 12.9 | 10.0 | 29.0% |
| Brazil | 6.2 | 3.0 | 106.7% | 5.8 | 6.9% | 9.2 | 16.4 | -43.9% |
| Indonesia | - | 16.2 | -100.0% | 17.1 | -100.0% | 34.9 | 44.3 | -21.2% |
| External feed | 19.3 | 1.4 | 1.278.6% | 6.6 | 192.4% | 9.4 | 16.3 | -42.3% |
| Feed from third-parties¹ | 4.1 | 1.4 | 192.9% | 6.6³ | -37.9% | 9.4 | 16.3³ | -42.3% |
| PTVI offtake4 | 15.2 | - | n.a. | - | n.a. | 15.2 | - | n.a. |
| Finished Production by Site | ||||||||
| Sudbury | 17.4 | 4.6 | 278.3% | 12.8 | 35.9% | 35.8 | 41.4 | -13.5% |
| Voisey’s Bay & Long Harbour | 9.5 | 4.2 | 126.2% | 6.9 | 37.7% | 21.3 | 19.4 | 9.8% |
| Onça Puma | 6.2 | 3.0 | 106.7% | 5.8 | 6.9% | 9.2 | 16.4 | -43.9% |
| Clydach | 8.0 | 5.5 | 45.5% | 8.6 | -7.0% | 23.7 | 20.9 | 13.4% |
| Matsusaka | 5.5 | 6.3 | -12.7% | 4.0 | 37.5% | 15.1 | 11.4 | 32.5% |
| Others2 | 0.5 | 4.3 | -88.4% | 4.0 | -87.5% | 9.3 | 10.5 | -11.4% |
| Nickel Production | 47.1 | 27.9 | 68.8% | 42.1 | 11.9% | 114.4 | 120.0 | -4.7% |
| Nickel Sales | 40.7 | 34.3 | 18.7% | 39.2 | 3.8% | 108.1 | 119.6 | -9.6% |
1 External feed purchased from third parties and processed into finished nickel in our Canadian operations. It does not include
feed purchased from PTVI.
2 Includes intermediates produced in Thompson and PTVI, tolling and others.
3 Restated from historical figures.
4 Starting from 3Q24, PTVI sourced production is reported as “External feed” and reflects solely the 80%-offtake attributable to Vale Base Metals processed at downstream facilities. Before, PTVI production was 100% consolidated by Vale.
Energy Transition Metals by-products - Finished production
| 3Q24 | 2Q24 | ∆ q/q | 3Q23 | ∆ y/y | 9M24 | 9M23 | Δ y/y | |
| Cobalt (metric tons) | 714 | 189 | 277.8% | 452 | 58.0% | 1,384 | 1,410 | -1.8% |
| Platinum (000’ oz troy) | 23 | 17 | 35.3% | 24 | -4.2% | 71 | 94 | -24.5% |
| Palladium (000’ oz troy) | 20 | 24 | -16.7% | 24 | -16.7% | 82 | 110 | -25.5% |
| Gold (000’ oz troy)1 | 103 | 102 | 1.0% | 117 | -12.0% | 309 | 287 | 7.7% |
| Total by-Products (000’ metric tons Cu eq.)2 3 | 35 | 31 | 12.9% | 38 | -7.9% | 104 | 111 | -6.3% |
1 Includes Gold from Copper and Nickel operations.
2 Includes Iridium, Rhodium, Ruthenium and Silver.
3 Copper equivalent tons calculated using
average market metal prices for each quarter. Market reference prices: for copper and cobalt: LME spot; for Gold, Silver, Platinum, and
Palladium: Bloomberg; for other PGMs: Johnson Matthey.
- 6 - | |
Annex 2: Energy Transition
Metals:
Maintenance scheduled in 2024
| Q1 | Q2 | Q3 | Q4 | |
| Copper operations | ||||
| Salobo | ||||
| Salobo I & II | < 1 week | 1 week | 1 week | 1 week |
| Salobo III | < 1 week | 3 weeks | 2.5 weeks | <1 week |
| Sossego | ||||
| Sossego | 4.5 weeks | 4 weeks | 1.5 weeks | 1 week |
| Nickel operations | ||||
| Sudbury | ||||
| Coleman | 4.5 weeks | |||
| Creighton | 1 week | 5.5 weeks | ||
| Copper Cliff North | 4 weeks | |||
| Copper Cliff South | 2 weeks | |||
| Garson | 4 weeks | |||
| Totten | 2 weeks | |||
| Clarabelle mill | 1 week | 3 weeks | ||
| Sudbury Smelter | 7 weeks | |||
| Sudbury Refinery | 6 weeks | |||
| Port Colborne (Ni, Co & PGMs) | 6 weeks | |||
| Thompson | ||||
| Thompson mine | 4.5 weeks | |||
| Thompson mill | 4.5 weeks | |||
| Voisey’s Bay & Long Harbour | ||||
| Voisey’s Bay | 2.5 weeks | 1 week | ||
| Long Harbour Refinery | 4.5 weeks | |||
| Standalone Refineries | ||||
| Clydach | 5.5 weeks | |||
| Matsusaka | 6.5 weeks | |||
| Brazil | ||||
| Onça Puma | 11 weeks1 | <1 week | <1 week | <1 week |
| Indonesia | ||||
| PTVI (furnaces/kilns only) | 0 weeks | 1.5 weeks | n.a. | n.a |
¹ Refers to the furnace rebuild. The ramp up after maintenance is not included in the number of weeks.
Note: The maintenance schedule may be deliberately adjusted if it proves beneficial for operations and the overall business.
The number of weeks is rounded to 0.0 or 0.5 and may involve more than one maintenance activity within the quarter.
- 7 - | |

|
Investor Relations
Thiago
Lofiego
Mariana
Rocha
Luciana
Oliveti
Pedro
Terra
Patricia
Tinoco |
This press release may include statements about Vale's current expectations about future events or results (forward-looking statements), including in particular expectations for production and sales of iron ore, nickel and copper on pages 1, 2, 3 and 4. Many of those forward-looking statements can be identified by the use of forward-looking words such as "anticipate," "believe," "could," "expect," "should," "plan," "intend," "estimate" “will” and "potential," among others. All forward-looking statements involve various risks and uncertainties. Vale cannot guarantee that these statements will prove correct. These risks and uncertainties include, among others, factors related to: (a) the countries where Vale operates, especially Brazil and Canada; (b) the global economy; (c) the capital markets; (d) the mining and metals prices and their dependence on global industrial production, which is cyclical by nature; and (e) global competition in the markets in which Vale operates. Vale cautions you that actual results may differ materially from the plans, objectives, expectations, estimates and intentions expressed in this presentation. Vale undertakes no obligation to publicly update or revise any forward-looking statement, whether as a result of new information or future events or for any other reason. To obtain further information on factors that may lead to results different from those forecast by Vale, please consult the reports that Vale files with the U.S. Securities and Exchange Commission (SEC), the Brazilian Comissão de Valores Mobiliários (CVM) and, in particular, the factors discussed under “Forward-Looking Statements” and “Risk Factors” in Vale’s annual report on Form 20-F. |
- 8 - | |
Signatures
Pursuant to the requirements of the Securities Exchange Act of 1934, the registrant has duly caused this report to be signed on its behalf by the undersigned, thereunto duly authorized.
| Vale S.A. (Registrant) | ||
| By: | /s/ Thiago Lofiego | |
| Date: October 15, 2024 | Director of Investor Relations | |