AngioDynamics Reports Fiscal Year 2025 First Quarter Financial Results
LATHAM, N.Y.--(BUSINESS WIRE)— Oct. 3, 2024-- AngioDynamics, Inc. (NASDAQ: ANGO), a leading and transformative medical technology company focused on restoring healthy
blood flow in the body’s vascular system, expanding cancer treatment options, and improving quality of life for patients, today announced financial results for the first quarter of fiscal year 2025, which ended August 31, 2024.
Fiscal Year 2025 First Quarter Highlights
| |
Quarter Ended
August 31, 2024
|
Pro Forma* YoY Growth
|
|
Net Sales
|
$67.5 million
|
1.1%
|
|
Med Tech Net Sales
|
$28.0 million
|
8.7%
|
|
Med Device Net Sales
|
$39.5 million
|
(3.6)%
|
|
• |
GAAP gross margin of 54.4%
|
|
• |
GAAP loss per share of $0.31
|
|
• |
Adjusted loss per share of $0.11
|
|
• |
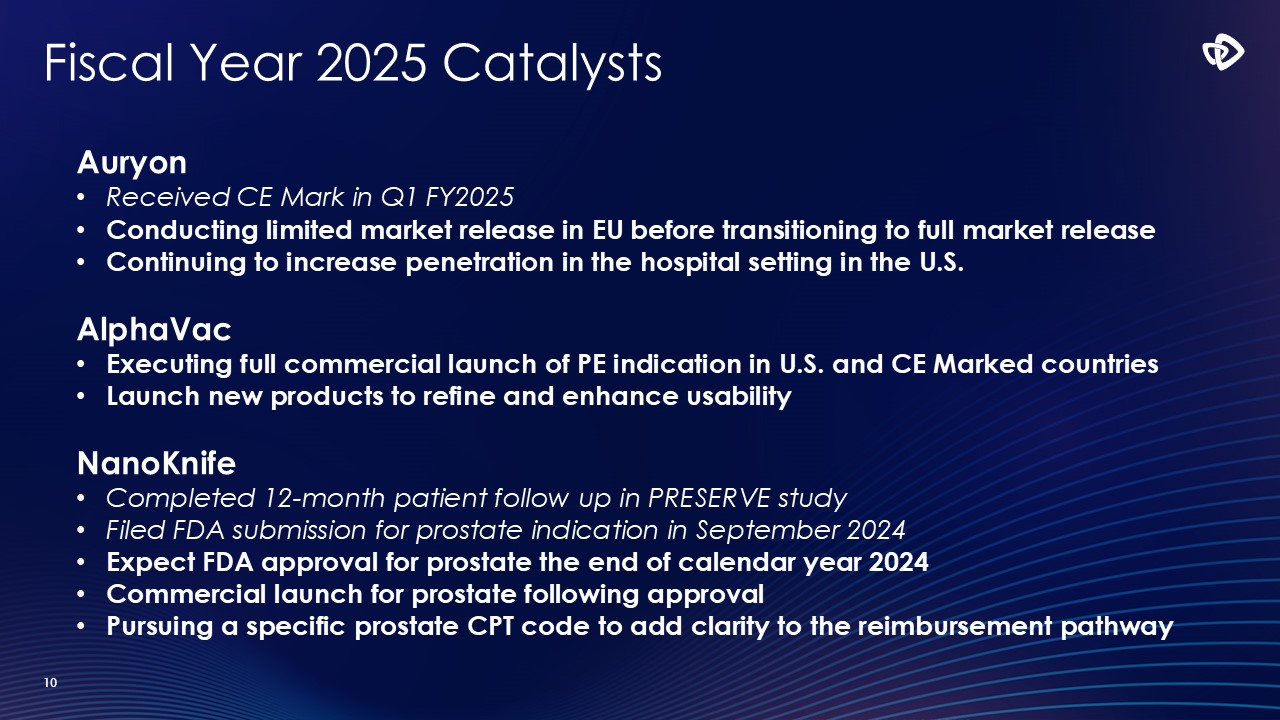
Submitted for FDA 510(k) clearance for Prostate Tissue indication for NanoKnife
|
|
• |
Received CE Mark Approval in Europe for the Auryon System
|
|
• |
Initiated RECOVER-AV Clinical Trial in Europe for AlphaVac
|
*Pro forma results exclude the Dialysis and BioSentry businesses divested in June 2023 and the PICC and Midline product portfolios divested in
February 2024, as well as the discontinued Radiofrequency and Syntrax products in February 2024.
"We are pleased with our strong start to fiscal year 2025, particularly in our Med Tech segment, with Auryon and AlphaVac both delivering over
20% growth in the quarter," commented Jim Clemmer, President and Chief Executive Officer of AngioDynamics, Inc. "We continue to view 2025 as an inflection point in the trajectory of our business. We expect to continue to deliver strong revenue
growth within our Med Tech business as we execute on key commercial initiatives. We remain focused on executing our growth strategy and advancing our innovative product portfolio."
Fiscal Year 2025 First Quarter Financial Results
Unless otherwise noted, all financial metrics and growth rates presented below are
on a pro forma basis.
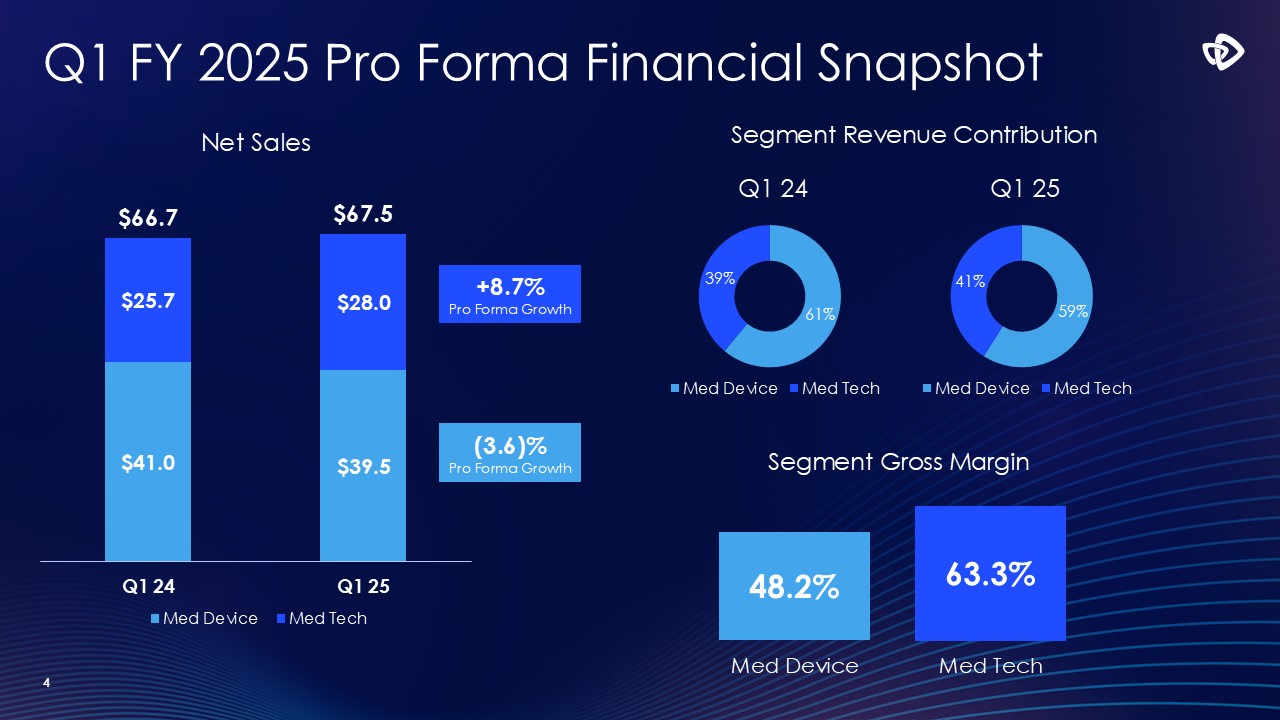
Net sales for the first quarter of fiscal year 2025 were $67.5 million, an increase of 1.1% compared to the prior-year quarter.
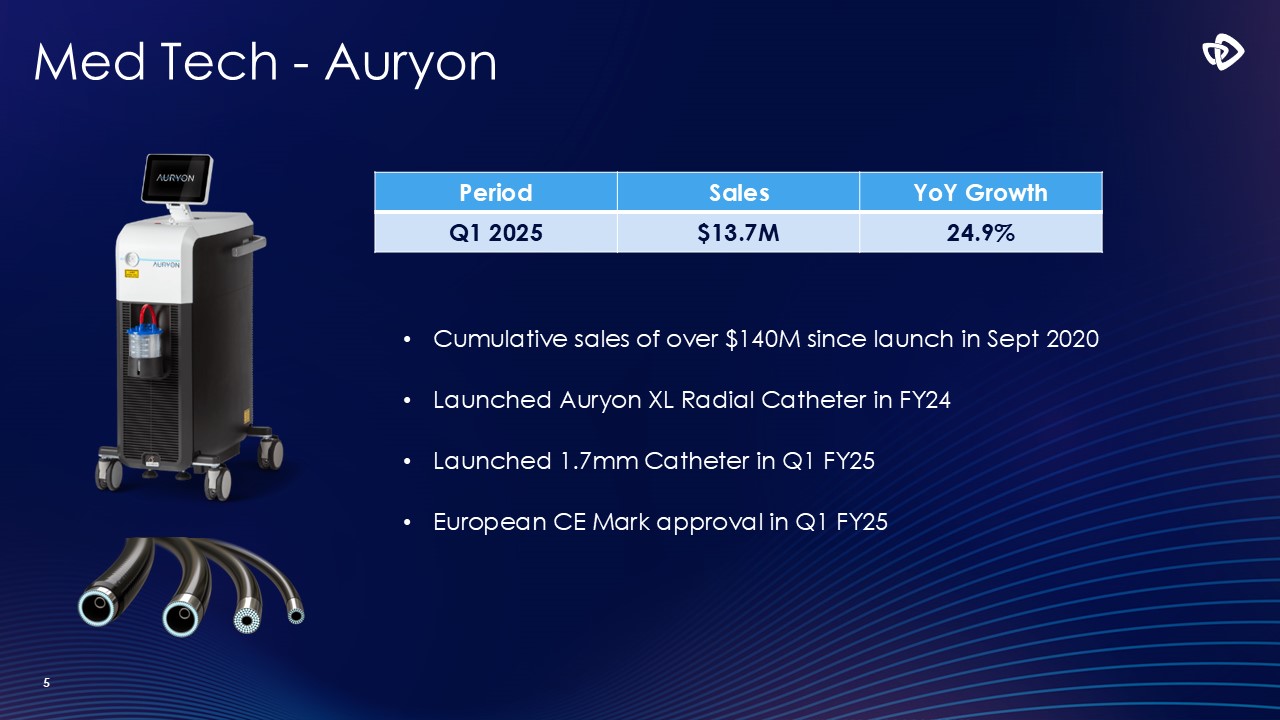
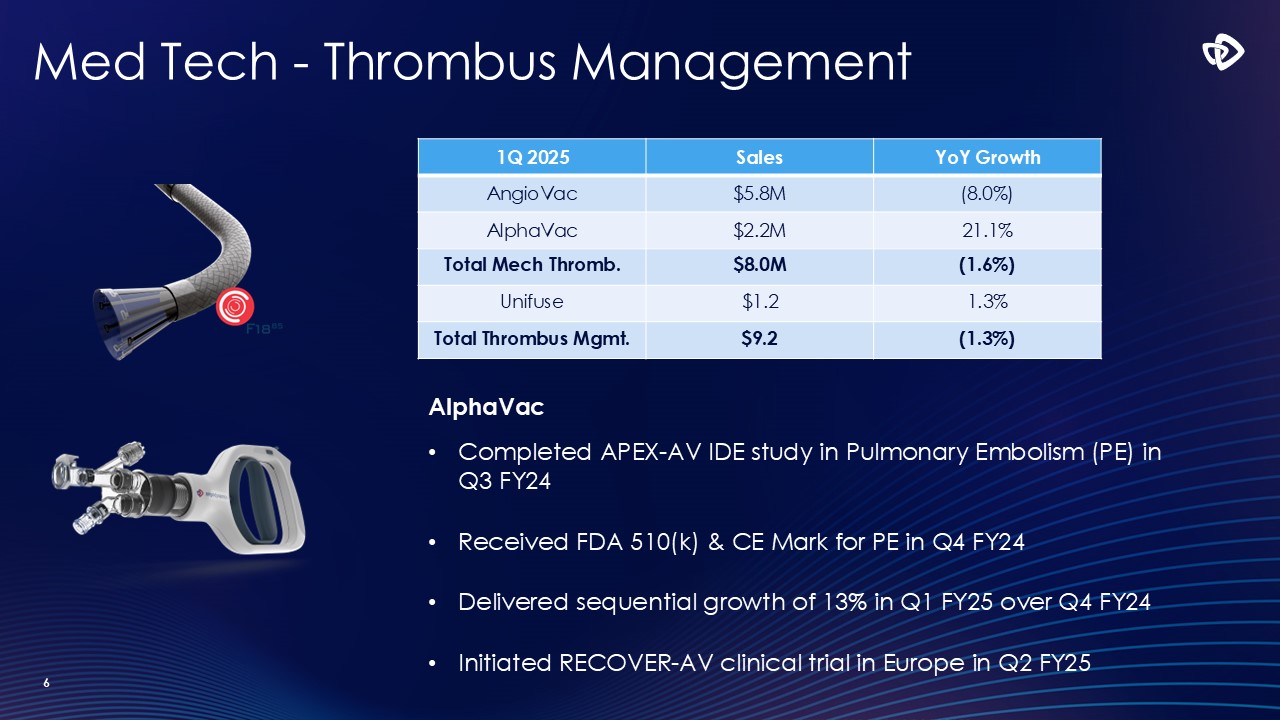
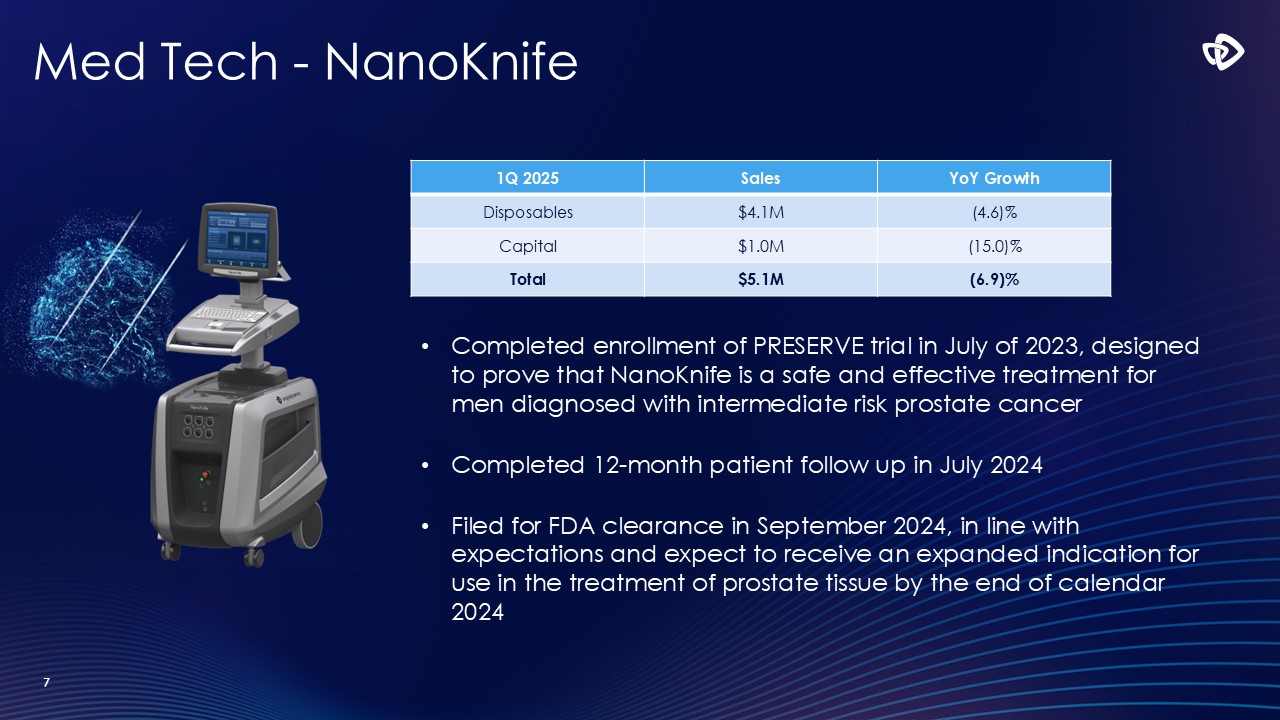
Med Tech net sales were $28.0 million, an 8.7% increase from $25.7 million in the prior-year period. Med Tech includes the Auryon peripheral
atherectomy platform, the thrombus management platform, which includes the AlphaVac and AngioVac mechanical thrombectomy systems, and the NanoKnife irreversible electroporation platform.
Growth was driven by Auryon sales during the quarter of $13.7 million, which increased 24.9% and AlphaVac sales of $2.2 million, an increase of
21.1% over the prior year. NanoKnife sales were $5.1 million during the quarter, a decrease of 6.9% compared to the prior year period, primarily due to the timing of international orders during last year.
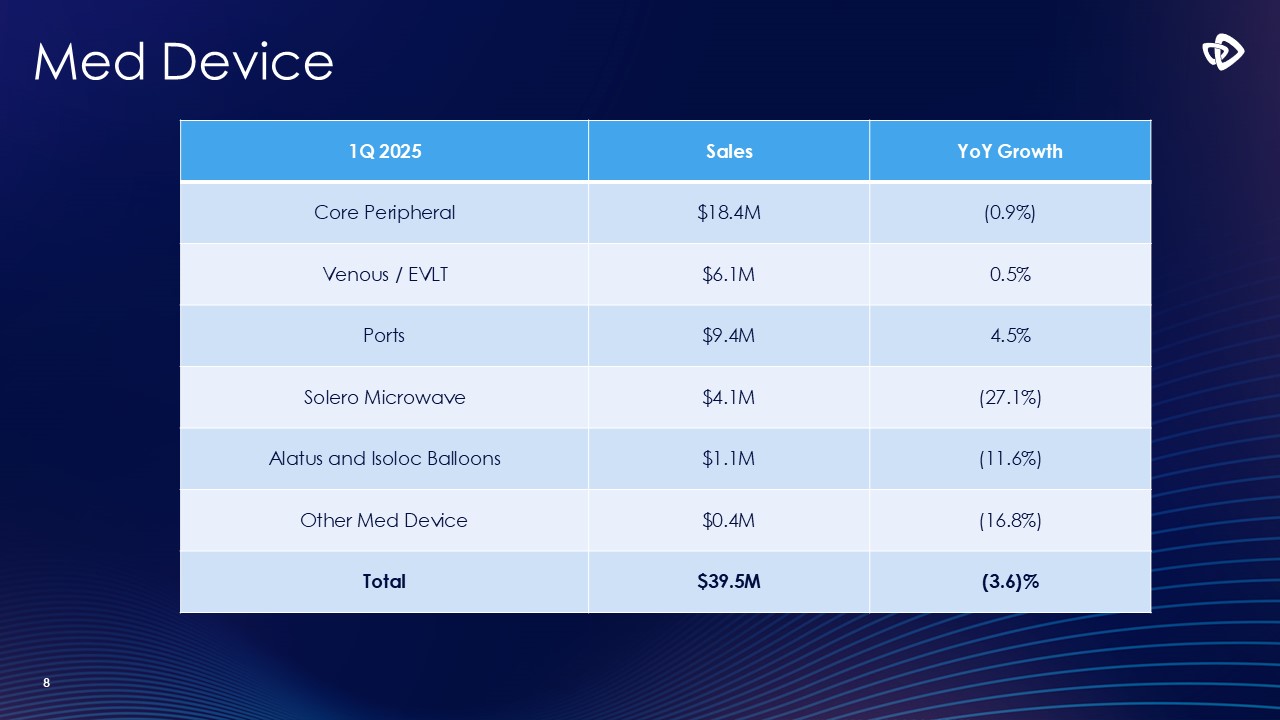
Med Device net sales were $39.5 million, a decrease of 3.6% compared to $41.0 million in the prior-year period. U.S. net sales of Med Device
products grew 2.1% during the first quarter compared to last year.
U.S. net sales in the first quarter of fiscal 2025 were $59.5 million, an increase of 6.2% from $56.0 million a year ago. International net
sales were $8.0 million, a decrease of 25.4%, compared to $10.7 million a year ago, primarily due to the timing of international orders during last year.
Gross margin for the first quarter of fiscal 2025 was 54.4%, which was 40 basis points down compared to the first quarter of fiscal 2024, and 10
basis points sequentially up from 54.3% in the fourth quarter of fiscal 2024.
Gross margin for the Med Tech business was 63.3%, a decrease of 160 basis points from the first quarter of fiscal 2024 due to increased capital
placements and inflationary costs. Gross margin for the Med Device business was 48.2%, a decrease of 40 basis points compared to the first quarter of fiscal 2024 due to inflationary pressures and costs associated with the transition to outsourced
manufacturing.
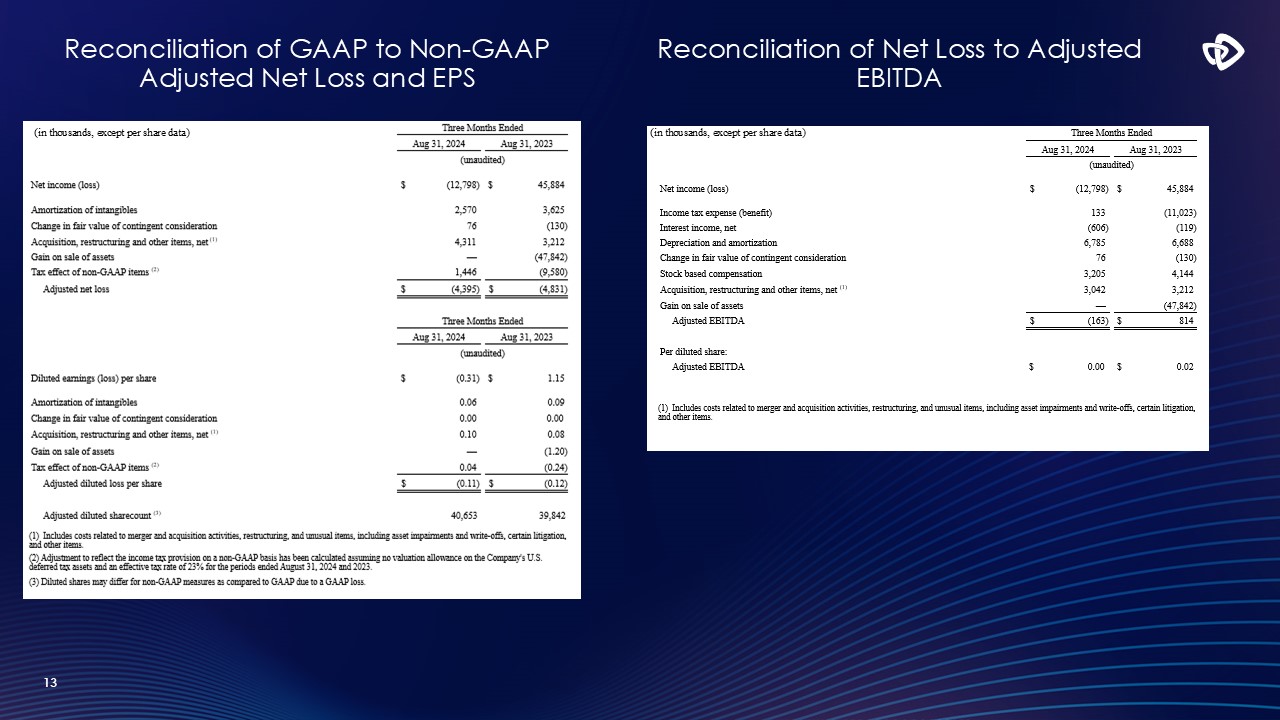
The Company recorded a GAAP net loss of $12.8 million, or a loss per share of $0.31, in the first quarter of fiscal 2025. Excluding the items
shown in the non-GAAP reconciliation table below, adjusted net loss for the first quarter of fiscal 2025 was $4.4 million, or a loss per share of $0.11. This compares to an adjusted net loss during the fiscal first quarter of 2024 of $6.2
million, or a loss per share of $0.16.
Adjusted EBITDA in the first quarter of fiscal 2025, excluding the items shown in the non-GAAP reconciliation table below, was $(0.2) million,
compared to $(1.1) million in the first quarter of fiscal 2024.
In the first quarter of fiscal 2025, the Company used $18.3 million in operating cash. The Company’s first fiscal quarter has historically
exhibited the highest utilization of cash and the first quarter of fiscal 2025 was in line with the Company’s expectations.
At August 31, 2024, the Company had $55.0 million in cash and cash equivalents compared to $76.1 million in cash and cash equivalents at May 31,
2024.
NanoKnife System's PRESERVE Study Results Submitted for FDA 510(k) Clearance
In September, the Company submitted results from its Pivotal Study of the NanoKnife System for Ablation of Prostate Tissue in an
Intermediate-Risk Patient Population (PRESERVE) to the U.S. Food and Drug Administration (FDA) for 510(k) indication of its NanoKnife System in the ablation of prostate tissue in an intermediate-risk population. The comprehensive study enrolled
and treated 121 patients across 17 facilities throughout the United States.
CE Mark Approval in Europe for the Auryon System
Prior to the end of the quarter AngioDynamics received European CE Mark approval for its Auryon Atherectomy System. This regulatory approval
allows AngioDynamics to market the Auryon System in Europe for the treatment of Peripheral Artery Disease (PAD), including Critical Limb Ischemia (CLI) and In-Stent Restenosis (ISR). The Auryon System uses solid-state laser technology to treat
PAD lesions and occlusions. It has been cleared by the FDA since 2020 and has treated over 50,000 patients in the United States. The system is designed to treat lesions of various types, lengths, and locations, both above and below the knee. This
CE Mark approval expands AngioDynamics' potential market reach, as the global PAD market is valued at $1.1 billion.
RECOVER-AV Clinical Trial
Subsequent to the end of the first fiscal quarter, the Company initiated its RECOVER-AV clinical trial, marking a significant step in evaluating
the AlphaVac F18⁸⁵ System for treating acute, intermediate-risk pulmonary embolism (PE) in the European market. This multi-center, multi-national study will assess the efficacy, safety, and long-term functional outcomes of the system across up to
20 hospital sites in Europe. Following the successful APEX-AV study in the United States, RECOVER-AV aims to further demonstrate the system's capabilities in a region where PE prevalence is notably higher. The trial will track patient outcomes
over a 12-month period, focusing on key efficacy and safety endpoints.
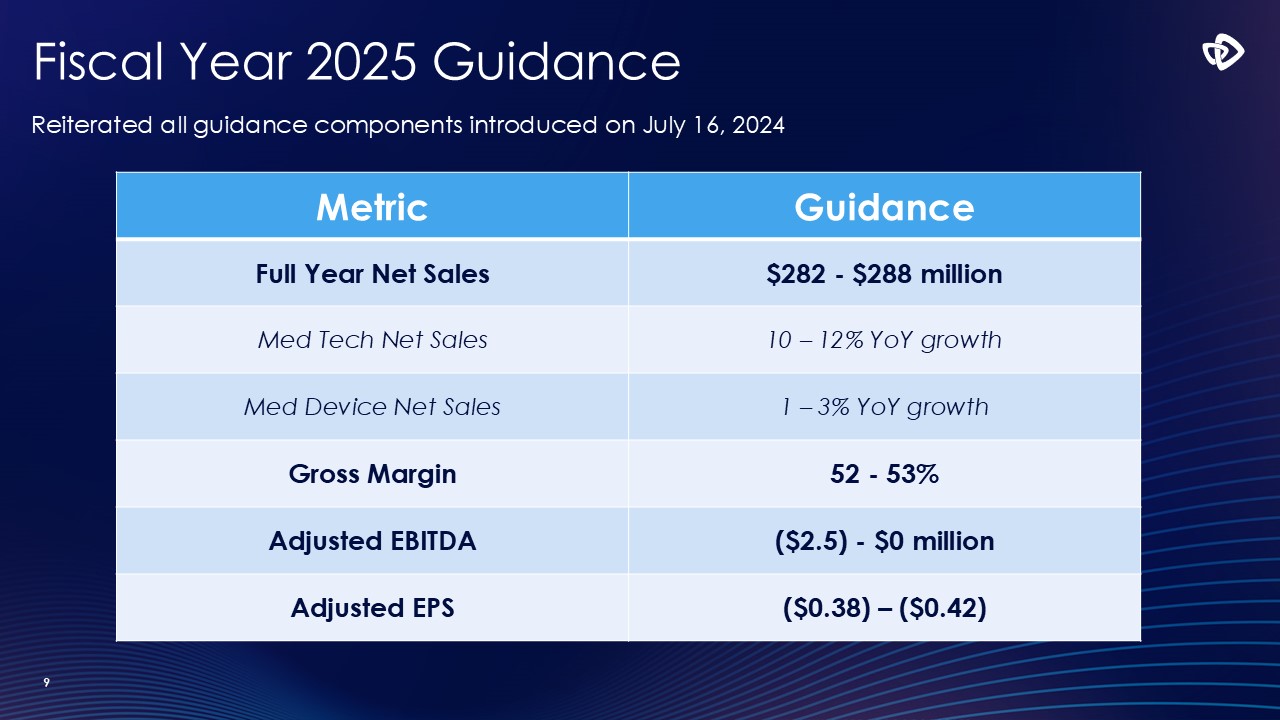
Fiscal Year 2025 Financial Guidance
For fiscal year 2025, the Company continues to expect:
|
• |
Net sales to be in the range of $282 to $288 million, representing growth of between 4.2% – 6.4% over fiscal 2024 pro forma revenue of $270.7 million
|
|
• |
Med Tech net sales are expected to grow in the range of 10% to 12%
|
|
• |
Med Device net sales are expected to grow in the range of 1% to 3%
|
|
• |
Gross margin to be approximately 52% to 53%
|
|
• |
Adjusted EBITDA loss of $2.5 million to $0, compared to a pro forma adjusted EBITDA loss of $3.2 million in fiscal year 2024
|
|
• |
Adjusted loss per share in the range of $0.38 to $0.42, compared to pro forma adjusted loss per share of $0.45 in fiscal year 2024
|
Conference Call
The Company’s management will host a conference call at 8:00 a.m. ET the same day to discuss the results. To participate in the conference call,
dial 1-877-407-0784 (domestic) or +1-201-689-8560 (international).
This conference call will also be webcast and can be accessed from the
“Investors” section of the AngioDynamics website at www.angiodynamics.com.
The webcast replay of the call will be available at the same site approximately one hour after the end of the call.
A recording of the call will also be available, until Thursday, October 10, 2024 at 11:59 PM ET. To hear this recording, dial 1-844-512-2921
(domestic) or +1-412-317-6671 (international) and enter the passcode 13748896.
Use of Non-GAAP Measures
Management uses non-GAAP measures to establish operational goals and believes that non-GAAP measures may assist investors in analyzing the
underlying trends in AngioDynamics' business over time. Investors should consider these non-GAAP measures in addition to, not as a substitute for or as superior to, financial reporting measures prepared in accordance with GAAP. In this news
release, AngioDynamics has reported pro forma results, adjusted EBITDA, adjusted net income and adjusted earnings per share. Management uses these measures in its internal analysis and review of operational performance. Management believes that
these measures provide investors with useful information in comparing AngioDynamics' performance over different periods. By using these non-GAAP measures, management believes that investors get a better picture of the performance of
AngioDynamics' underlying business. Management encourages investors to review AngioDynamics' financial results prepared in accordance with GAAP to understand AngioDynamics' performance taking into account all relevant factors, including those
that may only occur from time to time but have a material impact on AngioDynamics' financial results. Please see the tables that follow for a reconciliation of non-GAAP measures to measures prepared in accordance with GAAP.
About AngioDynamics, Inc.
AngioDynamics is a leading and transformative medical technology company focused on restoring healthy blood flow in the body’s vascular system,
expanding cancer treatment options and improving quality of life for patients.
The Company’s innovative technologies and devices are chosen by talented physicians in fast-growing
healthcare markets to treat unmet patient needs. For more information, visit www.angiodynamics.com.
Safe Harbor
This release contains forward-looking statements within the meaning of the Private Securities Litigation Reform Act of 1995. All statements
regarding AngioDynamics' expected future financial position, results of operations, cash flows, business strategy, budgets, projected costs, capital expenditures, products, competitive positions, growth opportunities, plans and objectives of
management for future operations, as well as statements that include the words such as "expects," "reaffirms," "intends," "anticipates," "plans," "believes," "seeks," "estimates," "projects," "optimistic," or variations of such words and similar
expressions, are forward-looking statements. These forward-looking statements are not guarantees of future performance and are subject to risks and uncertainties. Investors are cautioned that actual events or results may differ materially from
AngioDynamics' expectations, expressed or implied. Factors that may affect the actual results achieved by AngioDynamics include, without limitation, the scale and scope of the COVID-19 global pandemic, the ability of AngioDynamics to develop its
existing and new products, technological advances and patents attained by competitors, infringement of AngioDynamics' technology or assertions that AngioDynamics' technology infringes the technology of third parties, the ability of AngioDynamics
to effectively compete against competitors that have substantially greater resources, future actions by the FDA or other regulatory agencies, domestic and foreign health care reforms and government regulations, results of pending or future
clinical trials, overall economic conditions (including inflation, labor shortages and supply chain challenges including the cost and availability of raw materials), the results of on-going litigation, challenges with respect to third-party
distributors or joint venture partners or collaborators, the results of sales efforts, the effects of product recalls and product liability claims, changes in key personnel, the ability of AngioDynamics to execute on strategic initiatives, the
effects of economic, credit and capital market conditions, general market conditions, market acceptance, foreign currency exchange rate fluctuations, the effects on pricing from group purchasing organizations and competition, the ability of
AngioDynamics to obtain regulatory clearances or approval of its products, or to integrate acquired businesses, as well as the risk factors listed from time to time in AngioDynamics' SEC filings, including but not limited to its Annual Report on
Form 10-K for the year ended May 31, 2024. AngioDynamics does not assume any obligation to publicly update or revise any forward-looking statements for any reason.
In the United States, the NanoKnife System has received a 510(k) clearance by the Food and Drug Administration for use in the surgical ablation
of soft tissue and is similarly approved for commercialization in Canada, the European Union and Australia. The NanoKnife System has not been cleared for the treatment or therapy of a specific disease or condition.
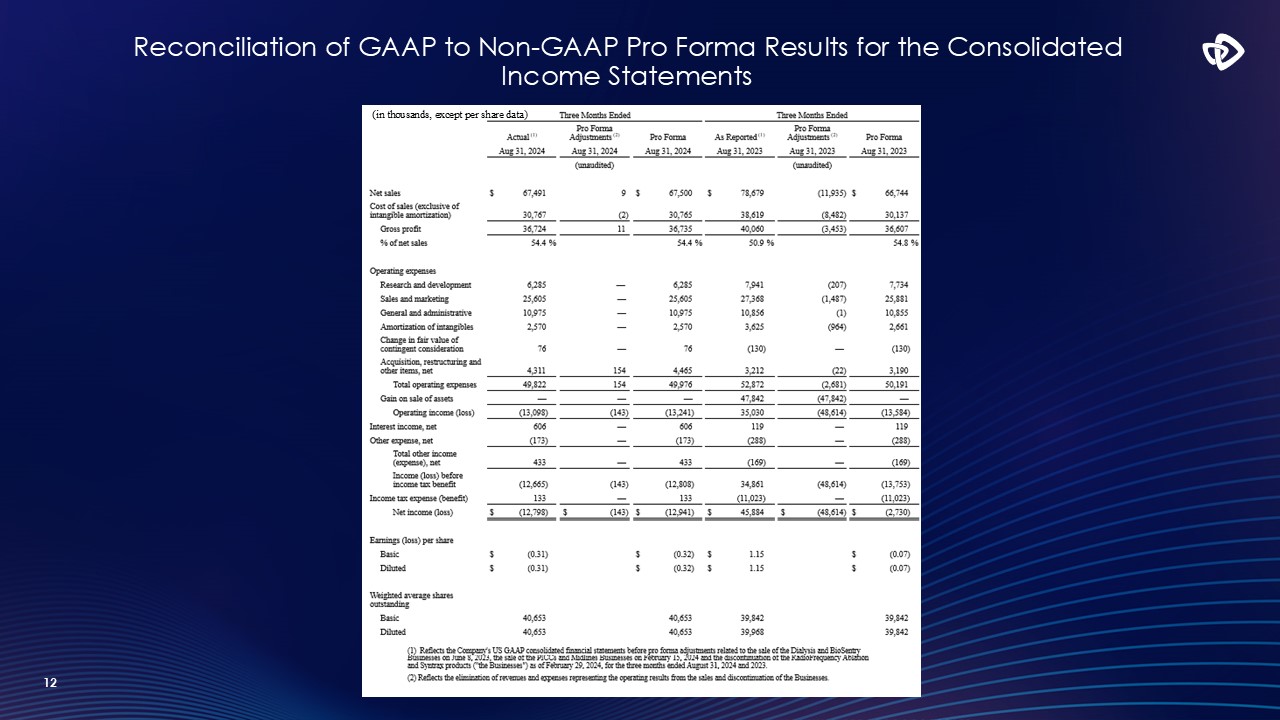
ANGIODYNAMICS, INC. AND SUBSIDIARIES
CONSOLIDATED INCOME STATEMENTS
(in thousands, except per share data)
| |
|
Three Months Ended
|
|
|
Three Months Ended
|
|
| |
|
Actual (1)
|
|
|
Pro Forma
Adjustments (2)
|
|
|
Pro Forma
|
|
|
As Reported (1)
|
|
|
Pro Forma
Adjustments (2)
|
|
|
Pro Forma
|
|
| |
|
Aug 31, 2024
|
|
|
Aug 31, 2024
|
|
|
Aug 31, 2024
|
|
|
Aug 31, 2023
|
|
|
Aug 31, 2023
|
|
|
Aug 31, 2023
|
|
| |
|
|
|
|
(unaudited)
|
|
|
|
|
|
|
|
|
(unaudited)
|
|
|
|
|
| |
|
|
|
|
|
|
|
|
|
|
|
|
|
|
|
|
|
|
|
Net sales
|
|
$
|
67,491
|
|
|
|
9
|
|
|
$
|
67,500
|
|
|
$
|
78,679
|
|
|
|
(11,935
|
)
|
|
$
|
66,744
|
|
|
Cost of sales (exclusive of intangible amortization)
|
|
|
30,767
|
|
|
|
(2
|
)
|
|
|
30,765
|
|
|
|
38,619
|
|
|
|
(8,482
|
)
|
|
|
30,137
|
|
|
Gross profit
|
|
|
36,724
|
|
|
|
11
|
|
|
|
36,735
|
|
|
|
40,060
|
|
|
|
(3,453
|
)
|
|
|
36,607
|
|
|
% of net sales
|
|
|
54.4
|
%
|
|
|
|
|
|
|
54.4
|
%
|
|
|
50.9
|
%
|
|
|
|
|
|
|
54.8
|
%
|
| |
|
|
|
|
|
|
|
|
|
|
|
|
|
|
|
|
|
|
|
|
|
|
|
|
|
Operating expenses
|
|
|
|
|
|
|
|
|
|
|
|
|
|
|
|
|
|
|
|
|
|
|
|
|
|
Research and development
|
|
|
6,285
|
|
|
|
—
|
|
|
|
6,285
|
|
|
|
7,941
|
|
|
|
(207
|
)
|
|
|
7,734
|
|
|
Sales and marketing
|
|
|
25,605
|
|
|
|
—
|
|
|
|
25,605
|
|
|
|
27,368
|
|
|
|
(1,487
|
)
|
|
|
25,881
|
|
|
General and administrative
|
|
|
10,975
|
|
|
|
—
|
|
|
|
10,975
|
|
|
|
10,856
|
|
|
|
(1
|
)
|
|
|
10,855
|
|
|
Amortization of intangibles
|
|
|
2,570
|
|
|
|
—
|
|
|
|
2,570
|
|
|
|
3,625
|
|
|
|
(964
|
)
|
|
|
2,661
|
|
|
Change in fair value of contingent consideration
|
|
|
76
|
|
|
|
—
|
|
|
|
76
|
|
|
|
(130
|
)
|
|
|
—
|
|
|
|
(130
|
)
|
|
Acquisition, restructuring and other items, net
|
|
|
4,311
|
|
|
|
154
|
|
|
|
4,465
|
|
|
|
3,212
|
|
|
|
(22
|
)
|
|
|
3,190
|
|
|
Total operating expenses
|
|
|
49,822
|
|
|
|
154
|
|
|
|
49,976
|
|
|
|
52,872
|
|
|
|
(2,681
|
)
|
|
|
50,191
|
|
|
Gain on sale of assets
|
|
|
—
|
|
|
|
—
|
|
|
|
—
|
|
|
|
47,842
|
|
|
|
(47,842
|
)
|
|
|
—
|
|
|
Operating income (loss)
|
|
|
(13,098
|
)
|
|
|
(143
|
)
|
|
|
(13,241
|
)
|
|
|
35,030
|
|
|
|
(48,614
|
)
|
|
|
(13,584
|
)
|
|
Interest income, net
|
|
|
606
|
|
|
|
—
|
|
|
|
606
|
|
|
|
119
|
|
|
|
—
|
|
|
|
119
|
|
|
Other expense, net
|
|
|
(173
|
)
|
|
|
—
|
|
|
|
(173
|
)
|
|
|
(288
|
)
|
|
|
—
|
|
|
|
(288
|
)
|
|
Total other income (expense), net
|
|
|
433
|
|
|
|
—
|
|
|
|
433
|
|
|
|
(169
|
)
|
|
|
—
|
|
|
|
(169
|
)
|
|
Income (loss) before income tax benefit
|
|
|
(12,665
|
)
|
|
|
(143
|
)
|
|
|
(12,808
|
)
|
|
|
34,861
|
|
|
|
(48,614
|
)
|
|
|
(13,753
|
)
|
|
Income tax expense (benefit)
|
|
|
133
|
|
|
|
—
|
|
|
|
133
|
|
|
|
(11,023
|
)
|
|
|
—
|
|
|
|
(11,023
|
)
|
|
Net income (loss)
|
|
$
|
(12,798
|
)
|
|
$
|
(143
|
)
|
|
$
|
(12,941
|
)
|
|
$
|
45,884
|
|
|
$
|
(48,614
|
)
|
|
$
|
(2,730
|
)
|
| |
|
|
|
|
|
|
|
|
|
|
|
|
|
|
|
|
|
|
|
|
|
|
|
|
|
Earnings (loss) per share
|
|
|
|
|
|
|
|
|
|
|
|
|
|
|
|
|
|
|
|
|
|
|
|
|
|
Basic
|
|
$
|
(0.31
|
)
|
|
|
|
|
|
$
|
(0.32
|
)
|
|
$
|
1.15
|
|
|
|
|
|
|
$
|
(0.07
|
)
|
|
Diluted
|
|
$
|
(0.31
|
)
|
|
|
|
|
|
$
|
(0.32
|
)
|
|
$
|
1.15
|
|
|
|
|
|
|
$
|
(0.07
|
)
|
| |
|
|
|
|
|
|
|
|
|
|
|
|
|
|
|
|
|
|
|
|
|
|
|
|
|
Weighted average shares outstanding
|
|
|
|
|
|
|
|
|
|
|
|
|
|
|
|
|
|
|
|
|
|
|
|
|
|
Basic
|
|
|
40,653
|
|
|
|
|
|
|
|
40,653
|
|
|
|
39,842
|
|
|
|
|
|
|
|
39,842
|
|
|
Diluted
|
|
|
40,653
|
|
|
|
|
|
|
|
40,653
|
|
|
|
39,968
|
|
|
|
|
|
|
|
39,842
|
|
(1) Reflects the Company's US GAAP consolidated financial statements before pro forma adjustments related to the sale of the Dialysis and BioSentry Businesses on June 8,
2023, the sale of the PICCs and Midlines Businesses on February 15, 2024 and the discontinuation of the RadioFrequency Ablation and Syntrax products ("the Businesses") as of February 29, 2024, for the three months ended August 31, 2024 and 2023.
(2) Reflects the elimination of revenues and expenses representing the operating results from the sales and discontinuation of the Businesses.
ANGIODYNAMICS, INC. AND SUBSIDIARIES
GAAP TO NON-GAAP RECONCILIATION
(in thousands, except per share data)
|
Reconciliation of Net Income (Loss) to non-GAAP Adjusted Net Loss:
|
|
| |
|
|
|
| |
|
Three Months Ended
|
|
| |
|
Aug 31, 2024
|
|
|
Aug 31, 2023
|
|
| |
|
(unaudited)
|
|
| |
|
|
|
|
|
|
|
Net income (loss)
|
|
$
|
(12,798
|
)
|
|
$
|
45,884
|
|
| |
|
|
|
|
|
|
|
|
|
Amortization of intangibles
|
|
|
2,570
|
|
|
|
3,625
|
|
|
Change in fair value of contingent consideration
|
|
|
76
|
|
|
|
(130
|
)
|
|
Acquisition, restructuring and other items, net (1)
|
|
|
4,311
|
|
|
|
3,212
|
|
|
Gain on sale of assets
|
|
|
—
|
|
|
|
(47,842
|
)
|
|
Tax effect of non-GAAP items (2)
|
|
|
1,446
|
|
|
|
(9,580
|
)
|
|
Adjusted net loss
|
|
$
|
(4,395
|
)
|
|
$
|
(4,831
|
)
|
|
Reconciliation of Diluted Earnings (Loss) Per Share to non-GAAP Adjusted Diluted Loss Per Share:
|
|
| |
|
|
|
| |
|
Three Months Ended
|
|
| |
|
Aug 31, 2024
|
|
|
Aug 31, 2023
|
|
| |
|
(unaudited)
|
|
| |
|
|
|
|
|
|
|
Diluted earnings (loss) per share
|
|
$
|
(0.31
|
)
|
|
$
|
1.15
|
|
| |
|
|
|
|
|
|
|
|
|
Amortization of intangibles
|
|
|
0.06
|
|
|
|
0.09
|
|
|
Change in fair value of contingent consideration
|
|
|
0.00
|
|
|
|
0.00
|
|
|
Acquisition, restructuring and other items, net (1)
|
|
|
0.10
|
|
|
|
0.08
|
|
|
Gain on sale of assets
|
|
|
—
|
|
|
|
(1.20
|
)
|
|
Tax effect of non-GAAP items (2)
|
|
|
0.04
|
|
|
|
(0.24
|
)
|
|
Adjusted diluted loss per share
|
|
$
|
(0.11
|
)
|
|
$
|
(0.12
|
)
|
|
|
|
|
|
|
|
|
|
|
Adjusted diluted sharecount (3)
|
|
|
40,653
|
|
|
|
39,842
|
|
(1) Includes costs related to merger and acquisition activities, restructuring, and unusual items, including asset impairments and write-offs,
certain litigation, and other items.
(2) Adjustment to reflect the income tax provision on a non-GAAP basis has been calculated assuming no valuation allowance on the Company's U.S. deferred tax assets and
an effective tax rate of 23% for the periods ended August 31, 2024 and 2023.
(3) Diluted shares may differ for non-GAAP measures as compared to GAAP due to a GAAP loss.
ANGIODYNAMICS, INC. AND SUBSIDIARIES
GAAP TO NON-GAAP RECONCILIATION (Continued)
(in thousands, except per share data)
|
Reconciliation of Net Income (Loss) to Adjusted EBITDA:
|
|
|
|
|
|
|
| |
|
|
|
| |
|
Three Months Ended
|
|
| |
|
Aug 31, 2024
|
|
|
Aug 31, 2023
|
|
| |
|
(unaudited)
|
|
| |
|
|
|
|
|
|
|
Net income (loss)
|
|
$
|
(12,798
|
)
|
|
$
|
45,884
|
|
| |
|
|
|
|
|
|
|
|
|
Income tax expense (benefit)
|
|
|
133
|
|
|
|
(11,023
|
)
|
|
Interest income, net
|
|
|
(606
|
)
|
|
|
(119
|
)
|
|
Depreciation and amortization
|
|
|
6,785
|
|
|
|
6,688
|
|
|
Change in fair value of contingent consideration
|
|
|
76
|
|
|
|
(130
|
)
|
|
Stock based compensation
|
|
|
3,205
|
|
|
|
4,144
|
|
|
Acquisition, restructuring and other items, net (1)
|
|
|
3,042
|
|
|
|
3,212
|
|
|
Gain on sale of assets
|
|
|
—
|
|
|
|
(47,842
|
)
|
|
Adjusted EBITDA
|
|
$
|
(163
|
)
|
|
$
|
814
|
|
| |
|
|
|
|
|
|
|
|
|
Per diluted share:
|
|
|
|
|
|
|
|
|
|
Adjusted EBITDA
|
|
$
|
0.00
|
|
|
$
|
0.02
|
|
(1) Includes costs related to merger and acquisition activities, restructuring, and unusual items, including asset impairments
and write-offs, certain litigation, and other items.
ANGIODYNAMICS, INC. AND SUBSIDIARIES
GAAP TO NON-GAAP RECONCILIATION
(in thousands, except per share data)
|
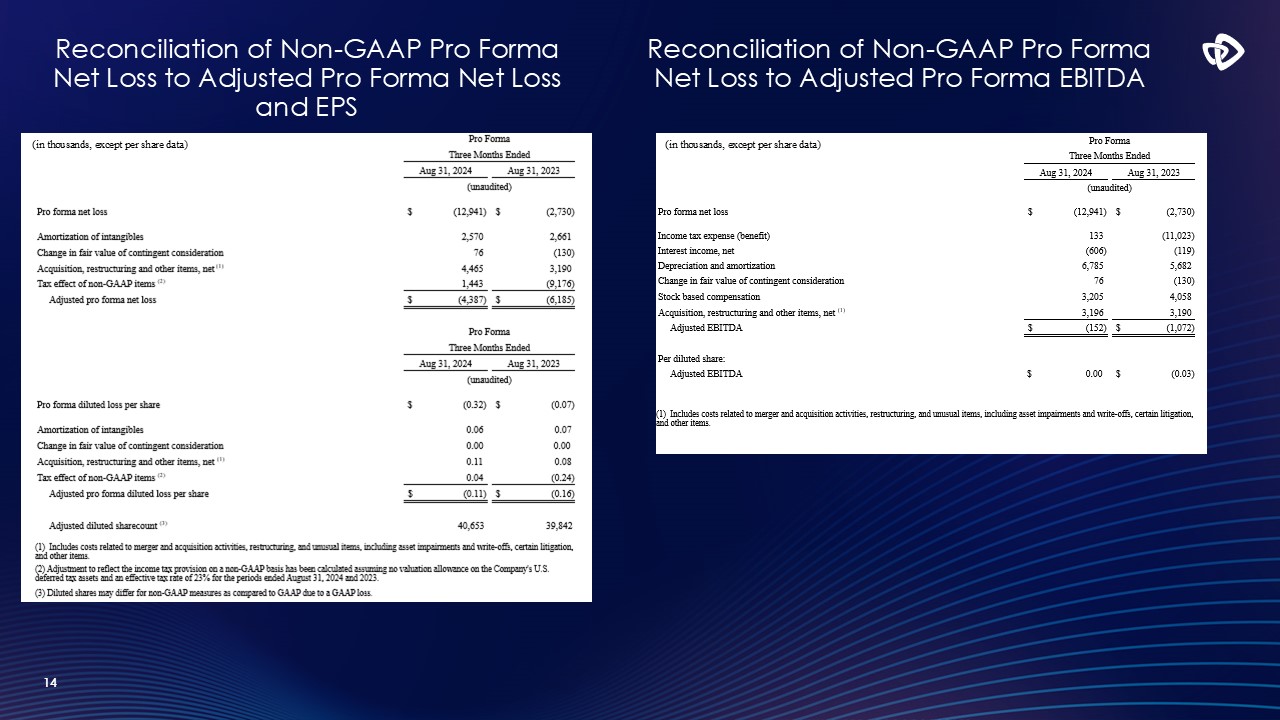
Reconciliation of Pro Forma Net Loss to Pro Forma Adjusted Net Loss:
|
|
| |
|
Pro Forma
|
|
| |
|
Three Months Ended
|
|
| |
|
Aug 31, 2024
|
|
|
Aug 31, 2023
|
|
| |
|
(unaudited)
|
|
| |
|
|
|
|
|
|
|
Pro forma net loss
|
|
$
|
(12,941
|
)
|
|
$
|
(2,730
|
)
|
| |
|
|
|
|
|
|
|
|
|
Amortization of intangibles
|
|
|
2,570
|
|
|
|
2,661
|
|
|
Change in fair value of contingent consideration
|
|
|
76
|
|
|
|
(130
|
)
|
|
Acquisition, restructuring and other items, net (1)
|
|
|
4,465
|
|
|
|
3,190
|
|
|
Tax effect of non-GAAP items (2)
|
|
|
1,443
|
|
|
|
(9,176
|
)
|
|
Adjusted pro forma net loss
|
|
$
|
(4,387
|
)
|
|
$
|
(6,185
|
)
|
|
Reconciliation of Pro Forma Diluted Loss Per Share to Pro Forma Adjusted Diluted Loss Per Share:
|
|
| |
|
Pro Forma
|
|
| |
|
Three Months Ended
|
|
| |
|
Aug 31, 2024
|
|
|
Aug 31, 2023
|
|
| |
|
(unaudited)
|
|
| |
|
|
|
|
|
|
|
Pro forma diluted loss per share
|
|
$
|
(0.32
|
)
|
|
$
|
(0.07
|
)
|
| |
|
|
|
|
|
|
|
|
|
Amortization of intangibles
|
|
|
0.06
|
|
|
|
0.07
|
|
|
Change in fair value of contingent consideration
|
|
|
0.00
|
|
|
|
0.00
|
|
|
Acquisition, restructuring and other items, net (1)
|
|
|
0.11
|
|
|
|
0.08
|
|
|
Tax effect of non-GAAP items (2)
|
|
|
0.04
|
|
|
|
(0.24
|
)
|
|
Adjusted pro forma diluted loss per share
|
|
$
|
(0.11
|
)
|
|
$
|
(0.16
|
)
|
|
|
|
|
|
|
|
|
|
|
Adjusted diluted sharecount (3)
|
|
|
40,653
|
|
|
|
39,842
|
|
(1) Includes costs related to merger and acquisition activities, restructuring, and unusual items, including asset impairments and write-offs,
certain litigation, and other items.
(2) Adjustment to reflect the income tax provision on a non-GAAP basis has been calculated assuming no valuation allowance on the Company's U.S. deferred tax assets and
an effective tax rate of 23% for the periods ended August 31, 2024 and 2023.
(3) Diluted shares may differ for non-GAAP measures as compared to GAAP due to a GAAP loss.
ANGIODYNAMICS, INC. AND SUBSIDIARIES
GAAP TO NON-GAAP RECONCILIATION (Continued)
(in thousands, except per share data)
|
Reconciliation of Pro Forma Net Loss to Pro Forma Adjusted EBITDA:
|
|
|
|
|
|
|
| |
|
Pro Forma
|
|
| |
|
Three Months Ended
|
|
| |
|
Aug 31, 2024
|
|
|
Aug 31, 2023
|
|
| |
|
(unaudited)
|
|
| |
|
|
|
|
|
|
|
Pro forma net loss
|
|
$
|
(12,941
|
)
|
|
$
|
(2,730
|
)
|
| |
|
|
|
|
|
|
|
|
|
Income tax expense (benefit)
|
|
|
133
|
|
|
|
(11,023
|
)
|
|
Interest income, net
|
|
|
(606
|
)
|
|
|
(119
|
)
|
|
Depreciation and amortization
|
|
|
6,785
|
|
|
|
5,682
|
|
|
Change in fair value of contingent consideration
|
|
|
76
|
|
|
|
(130
|
)
|
|
Stock based compensation
|
|
|
3,205
|
|
|
|
4,058
|
|
|
Acquisition, restructuring and other items, net (1)
|
|
|
3,196
|
|
|
|
3,190
|
|
|
Adjusted EBITDA
|
|
$
|
(152
|
)
|
|
$
|
(1,072
|
)
|
| |
|
|
|
|
|
|
|
|
|
Per diluted share:
|
|
|
|
|
|
|
|
|
|
Adjusted EBITDA
|
|
$
|
0.00
|
|
|
$
|
(0.03
|
)
|
(1) Includes costs related to merger and acquisition activities, restructuring, and unusual items, including asset impairments and write-offs,
certain litigation, and other items.
ANGIODYNAMICS, INC. AND SUBSIDIARIES
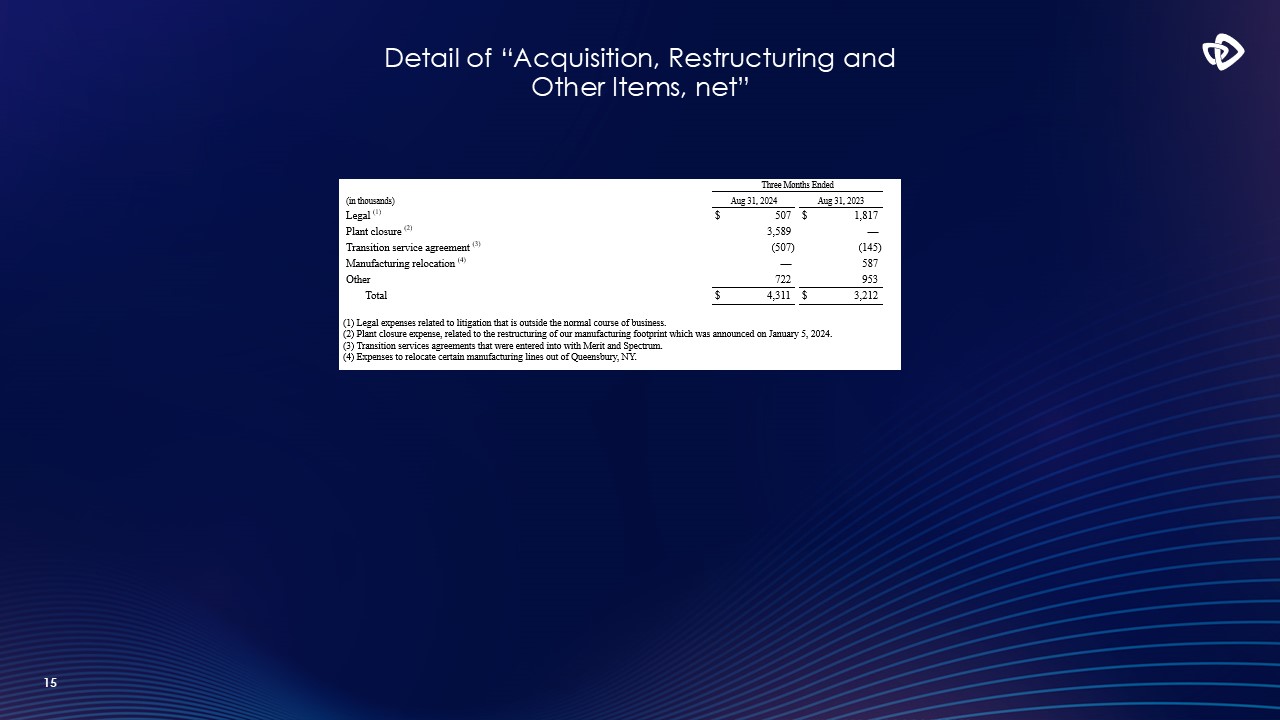
ACQUISITION, RESTRUCTURING, AND OTHER ITEMS, NET DETAIL
(in thousands)
| |
|
Three Months Ended
|
|
|
(in thousands)
|
|
Aug 31, 2024
|
|
|
Aug 31, 2023
|
|
|
Legal (1)
|
|
$
|
507
|
|
|
$
|
1,817
|
|
|
Plant closure (2)
|
|
|
3,589
|
|
|
|
—
|
|
|
Transition service agreement (3)
|
|
|
(507
|
)
|
|
|
(145
|
)
|
|
Manufacturing relocation (4)
|
|
|
—
|
|
|
|
587
|
|
|
Other
|
|
|
722
|
|
|
|
953
|
|
|
Total
|
|
$
|
4,311
|
|
|
$
|
3,212
|
|
(1) Legal expenses related to litigation that is outside the normal course of business.
(2) Plant closure expense, related to the restructuring of our manufacturing footprint which was announced on January 5, 2024.
(3) Transition services agreements that were entered into with Merit and Spectrum.
(4) Expenses to relocate certain manufacturing lines out of Queensbury, NY.
ANGIODYNAMICS, INC. AND SUBSIDIARIES
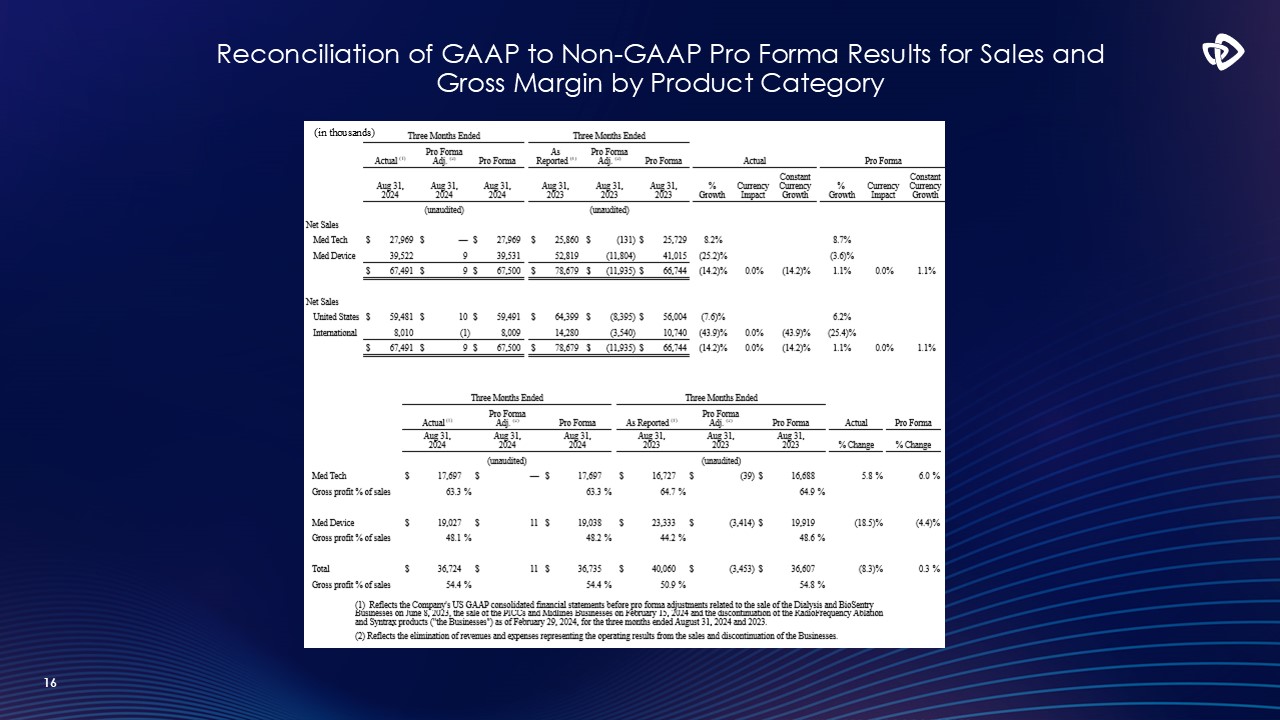
NET SALES BY PRODUCT CATEGORY AND BY GEOGRAPHY
(in thousands)
| |
|
Three Months Ended
|
|
|
Three Months Ended
|
|
|
|
|
|
|
|
|
|
|
|
|
|
|
|
|
|
|
|
| |
|
Actual (1)
|
|
|
Pro Forma
Adj. (2)
|
|
|
Pro Forma
|
|
|
As
Reported (1)
|
|
|
Pro Forma
Adj. (2)
|
|
|
Pro Forma
|
|
|
Actual
|
|
|
Pro Forma
|
|
| |
|
Aug 31,
2024
|
|
|
Aug 31,
2024
|
|
|
Aug 31,
2024
|
|
|
Aug 31,
2023
|
|
|
Aug 31,
2023
|
|
|
Aug 31,
2023
|
|
|
%
Growth
|
|
|
Currency
Impact
|
|
|
Constant
Currency
Growth
|
|
|
%
Growth
|
|
|
Currency
Impact
|
|
|
Constant
Currency
Growth
|
|
| |
|
|
|
|
(unaudited)
|
|
|
|
|
|
|
|
|
(unaudited)
|
|
|
|
|
|
|
|
|
|
|
|
|
|
|
|
|
|
|
|
|
|
|
|
Net Sales
|
|
|
|
|
|
|
|
|
|
|
|
|
|
|
|
|
|
|
|
|
|
|
|
|
|
|
|
|
|
|
|
|
|
|
|
|
|
Med Tech
|
|
$
|
27,969
|
|
|
$
|
—
|
|
|
$
|
27,969
|
|
|
$
|
25,860
|
|
|
$
|
(131
|
)
|
|
$
|
25,729
|
|
|
|
8.2
|
%
|
|
|
|
|
|
|
|
|
8.7
|
%
|
|
|
|
|
|
|
|
Med Device
|
|
|
39,522
|
|
|
|
9
|
|
|
|
39,531
|
|
|
|
52,819
|
|
|
|
(11,804
|
)
|
|
|
41,015
|
|
|
|
(25.2
|
)%
|
|
|
|
|
|
|
|
|
(3.6
|
)%
|
|
|
|
|
|
|
| |
|
$
|
67,491
|
|
|
$
|
9
|
|
|
$
|
67,500
|
|
|
$
|
78,679
|
|
|
$
|
(11,935
|
)
|
|
$
|
66,744
|
|
|
|
(14.2
|
)%
|
|
|
0.0
|
%
|
|
|
(14.2
|
)%
|
|
|
1.1
|
%
|
|
|
0.0
|
%
|
|
|
1.1
|
%
|
| |
|
|
|
|
|
|
|
|
|
|
|
|
|
|
|
|
|
|
|
|
|
|
|
|
|
|
|
|
|
|
|
|
|
|
|
|
|
|
|
|
|
|
|
|
|
|
|
|
|
Net Sales
|
|
|
|
|
|
|
|
|
|
|
|
|
|
|
|
|
|
|
|
|
|
|
|
|
|
|
|
|
|
|
|
|
|
|
|
|
|
|
|
|
|
|
|
|
|
|
|
|
|
United States
|
|
$
|
59,481
|
|
|
$
|
10
|
|
|
$
|
59,491
|
|
|
$
|
64,399
|
|
|
$
|
(8,395
|
)
|
|
$
|
56,004
|
|
|
|
(7.6
|
)%
|
|
|
|
|
|
|
|
|
|
|
6.2
|
%
|
|
|
|
|
|
|
|
|
|
International
|
|
|
8,010
|
|
|
|
(1
|
)
|
|
|
8,009
|
|
|
|
14,280
|
|
|
|
(3,540
|
)
|
|
|
10,740
|
|
|
|
(43.9
|
)%
|
|
|
0.0
|
%
|
|
|
(43.9
|
)%
|
|
|
(25.4
|
)%
|
|
|
|
|
|
|
|
|
| |
|
$
|
67,491
|
|
|
$
|
9
|
|
|
$
|
67,500
|
|
|
$
|
78,679
|
|
|
$
|
(11,935
|
)
|
|
$
|
66,744
|
|
|
|
(14.2
|
)%
|
|
|
0.0
|
%
|
|
|
(14.2
|
)%
|
|
|
1.1
|
%
|
|
|
0.0
|
%
|
|
|
1.1
|
%
|
(1) Reflects the Company's US GAAP consolidated financial statements before pro forma adjustments related to the sale of the Dialysis and BioSentry Businesses on June 8,
2023, the sale of the PICCs and Midlines Businesses on February 15, 2024 and the discontinuation of the RadioFrequency Ablation and Syntrax products ("the Businesses") as of February 29, 2024, for the three months ended August 31, 2024 and 2023.
(2) Reflects the elimination of revenues and expenses representing the operating results from the sales and discontinuation of the Businesses.
GROSS PROFIT BY PRODUCT CATEGORY
(in thousands)
| |
|
Three Months Ended
|
|
|
Three Months Ended
|
|
|
|
|
|
|
|
| |
|
Actual (1)
|
|
|
Pro Forma
Adj. (2)
|
|
|
Pro Forma
|
|
|
As Reported (1)
|
|
|
Pro Forma
Adj. (2)
|
|
|
Pro Forma
|
|
|
Actual
|
|
|
Pro Forma
|
|
| |
|
Aug 31,
2024
|
|
|
Aug 31,
2024
|
|
|
Aug 31,
2024
|
|
|
Aug 31,
2023
|
|
|
Aug 31,
2023
|
|
|
Aug 31,
2023
|
|
|
% Change
|
|
|
% Change
|
|
| |
|
(unaudited)
|
|
|
(unaudited)
|
|
|
|
|
|
|
|
|
Med Tech
|
|
$
|
17,697
|
|
|
$
|
—
|
|
|
$
|
17,697
|
|
|
$
|
16,727
|
|
|
$
|
(39
|
)
|
|
$
|
16,688
|
|
|
|
5.8
|
%
|
|
|
6.0
|
%
|
|
Gross profit % of sales
|
|
|
63.3
|
%
|
|
|
|
|
|
|
63.3
|
%
|
|
|
64.7
|
%
|
|
|
|
|
|
|
64.9
|
%
|
|
|
|
|
|
|
|
|
| |
|
|
|
|
|
|
|
|
|
|
|
|
|
|
|
|
|
|
|
|
|
|
|
|
|
|
|
|
|
|
|
|
|
Med Device
|
|
$
|
19,027
|
|
|
$
|
11
|
|
|
$
|
19,038
|
|
|
$
|
23,333
|
|
|
$
|
(3,414
|
)
|
|
$
|
19,919
|
|
|
|
(18.5
|
)%
|
|
|
(4.4
|
)%
|
|
Gross profit % of sales
|
|
|
48.1
|
%
|
|
|
|
|
|
|
48.2
|
%
|
|
|
44.2
|
%
|
|
|
|
|
|
|
48.6
|
%
|
|
|
|
|
|
|
|
|
| |
|
|
|
|
|
|
|
|
|
|
|
|
|
|
|
|
|
|
|
|
|
|
|
|
|
|
|
|
|
|
|
|
|
Total
|
|
$
|
36,724
|
|
|
$
|
11
|
|
|
$
|
36,735
|
|
|
$
|
40,060
|
|
|
$
|
(3,453
|
)
|
|
$
|
36,607
|
|
|
|
(8.3
|
)%
|
|
|
0.3
|
%
|
|
Gross profit % of sales
|
|
|
54.4
|
%
|
|
|
|
|
|
|
54.4
|
%
|
|
|
50.9
|
%
|
|
|
|
|
|
|
54.8
|
%
|
|
|
|
|
|
|
|
|
(1) Reflects the Company's US GAAP consolidated financial statements before pro forma adjustments related to the sale of the Dialysis and BioSentry Businesses on June 8,
2023, the sale of the PICCs and Midlines Businesses on February 15, 2024 and the discontinuation of the RadioFrequency Ablation and Syntrax products ("the Businesses") as of February 29, 2024, for the three months ended August 31, 2024 and 2023.
(2) Reflects the elimination of revenues and expenses representing the operating results from the sales and discontinuation of the Businesses.
ANGIODYNAMICS, INC. AND SUBSIDIARIES
CONSOLIDATED BALANCE SHEETS
(in thousands)
| |
|
Aug 31, 2024
|
|
|
May 31, 2024
|
|
| |
|
(unaudited)
|
|
|
(audited)
|
|
|
Assets
|
|
|
|
|
|
|
|
Current assets:
|
|
|
|
|
|
|
|
Cash and cash equivalents
|
|
$
|
55,005
|
|
|
$
|
76,056
|
|
|
Accounts receivable, net
|
|
|
39,563
|
|
|
|
43,610
|
|
|
Inventories
|
|
|
64,700
|
|
|
|
60,616
|
|
|
Prepaid expenses and other
|
|
|
13,326
|
|
|
|
12,971
|
|
|
Total current assets
|
|
|
172,594
|
|
|
|
193,253
|
|
|
Property, plant and equipment, net
|
|
|
34,377
|
|
|
|
35,666
|
|
|
Other assets
|
|
|
10,883
|
|
|
|
11,369
|
|
|
Intangible assets, net
|
|
|
75,774
|
|
|
|
77,383
|
|
|
Total assets
|
|
$
|
293,628
|
|
|
$
|
317,671
|
|
|
Liabilities and stockholders' equity
|
|
|
|
|
|
|
|
|
|
Current liabilities:
|
|
|
|
|
|
|
|
|
|
Accounts payable
|
|
$
|
31,272
|
|
|
$
|
37,751
|
|
|
Accrued liabilities
|
|
|
34,108
|
|
|
|
41,098
|
|
|
Current portion of contingent consideration
|
|
|
4,804
|
|
|
|
4,728
|
|
|
Other current liabilities
|
|
|
6,515
|
|
|
|
7,578
|
|
|
Total current liabilities
|
|
|
76,699
|
|
|
|
91,155
|
|
|
Deferred income taxes
|
|
|
4,626
|
|
|
|
4,852
|
|
|
Other long-term liabilities
|
|
|
15,721
|
|
|
|
16,078
|
|
|
Total liabilities
|
|
|
97,046
|
|
|
|
112,085
|
|
|
Stockholders' equity
|
|
|
196,582
|
|
|
|
205,586
|
|
|
Total Liabilities and Stockholders' Equity
|
|
$
|
293,628
|
|
|
$
|
317,671
|
|
ANGIODYNAMICS, INC. AND SUBSIDIARIES
CONSOLIDATED STATEMENTS OF CASH FLOWS
(in thousands)
| |
|
Three Months Ended
|
|
| |
|
Aug 31, 2024
|
|
|
Aug 31, 2023
|
|
| |
|
(unaudited)
|
|
|
Cash flows from operating activities:
|
|
|
|
|
|
|
|
Net income (loss)
|
|
$
|
(12,798
|
)
|
|
$
|
45,884
|
|
|
Adjustments to reconcile net income (loss) to net cash used in operating activities:
|
|
|
|
|
|
|
|
|
|
Depreciation and amortization
|
|
|
6,785
|
|
|
|
6,688
|
|
|
Non-cash lease expense
|
|
|
494
|
|
|
|
476
|
|
|
Stock based compensation
|
|
|
3,205
|
|
|
|
4,144
|
|
|
Gain on disposal of assets
|
|
|
—
|
|
|
|
(47,842
|
)
|
|
Transaction costs for disposition
|
|
|
—
|
|
|
|
(2,427
|
)
|
|
Change in fair value of contingent consideration
|
|
|
76
|
|
|
|
(130
|
)
|
|
Deferred income taxes
|
|
|
(339
|
)
|
|
|
(11,415
|
)
|
|
Change in accounts receivable allowances
|
|
|
270
|
|
|
|
(78
|
)
|
|
Fixed and intangible asset impairments and disposals
|
|
|
20
|
|
|
|
65
|
|
|
Write-off of other assets
|
|
|
—
|
|
|
|
869
|
|
|
Other
|
|
|
121
|
|
|
|
(9
|
)
|
|
Changes in operating assets and liabilities:
|
|
|
|
|
|
|
|
|
|
Accounts receivable
|
|
|
3,784
|
|
|
|
3,157
|
|
|
Inventories
|
|
|
(4,053
|
)
|
|
|
(4,574
|
)
|
|
Prepaid expenses and other
|
|
|
(836
|
)
|
|
|
(4,168
|
)
|
|
Accounts payable, accrued and other liabilities
|
|
|
(14,982
|
)
|
|
|
(16,539
|
)
|
|
Net cash used in operating activities
|
|
|
(18,253
|
)
|
|
|
(25,899
|
)
|
|
Cash flows from investing activities:
|
|
|
|
|
|
|
|
|
|
Additions to property, plant and equipment
|
|
|
(1,092
|
)
|
|
|
(791
|
)
|
|
Additions to placement and evaluation units
|
|
|
(1,313
|
)
|
|
|
(767
|
)
|
|
Proceeds from sale of assets
|
|
|
—
|
|
|
|
100,000
|
|
|
Net cash (used in) provided by investing activities
|
|
|
(2,405
|
)
|
|
|
98,442
|
|
|
Cash flows from financing activities:
|
|
|
|
|
|
|
|
|
|
Repayment of long-term debt
|
|
|
—
|
|
|
|
(50,000
|
)
|
|
Payment of acquisition related contingent consideration
|
|
|
—
|
|
|
|
(10,000
|
)
|
|
Repurchase of common stock
|
|
|
(552
|
)
|
|
|
—
|
|
|
Proceeds from exercise of stock options and employee stock purchase plan
|
|
|
43
|
|
|
|
410
|
|
|
Net cash used in financing activities
|
|
|
(509
|
)
|
|
|
(59,590
|
)
|
|
Effect of exchange rate changes on cash and cash equivalents
|
|
|
116
|
|
|
|
13
|
|
|
Increase (decrease) in cash and cash equivalents
|
|
|
(21,051
|
)
|
|
|
12,966
|
|
|
Cash and cash equivalents at beginning of period
|
|
|
76,056
|
|
|
|
44,620
|
|
|
Cash and cash equivalents at end of period
|
|
$
|
55,005
|
|
|
$
|
57,586
|
|