 | Results Report 2Q24 |
SECURITIES AND EXCHANGE COMMISSION
Washington, D.C. 20549
FORM 6-K
REPORT OF FOREIGN
ISSUER
PURSUANT TO RULE 13a-16 OR 15d-16 OF THE
SECURITIES EXCHANGE ACT OF 1934
For the month of August 2024
(Commission File No. 001-32221)
GOL LINHAS AÉREAS INTELIGENTES S.A.
(Exact name of registrant as specified in its charter)
GOL INTELLIGENT AIRLINES INC.
(Translation of registrant’s name into English)
Praça Comandante
Linneu Gomes, Portaria 3, Prédio 24
Jd. Aeroporto
04630-000 São Paulo, São Paulo
Federative Republic of Brazil
(Address of registrant’s principal executive offices)
Indicate by check mark
whether the registrant files or will file
annual reports under cover Form 20-F or Form 40-F.
Form 20-F ___X___ Form 40-F ______
Indicate by check
mark whether the registrant by furnishing the
information contained in this Form is also thereby furnishing the
information to the Commission pursuant to Rule 12g3-2(b) under
the Securities Exchange Act of 1934.
Yes ______ No ___X___
| | Results Report 2Q24 |
GOL announces 2Q24 Earnings
Result
São Paulo, August 14, 2024 – GOL Linhas Aéreas Inteligentes S.A. (B3: GOLL4), one of the leading airlines in Brazil and part of the ABRA Group, announced today its consolidated results for the second quarter of 2024 (2Q24). All information herein is presented in Reais (R$), in accordance with international accounting standards (IFRS) and with adjusted metrics, made available to enable comparison of this quarter with the same period of the previous year (2Q23 & 2H23).
Highlights
GOL – Passenger Business
| · | GOL was the most on-time airline in Brazil in the 2Q24, and was also recognized in June 2024 as the most on-time airline in Latin America and the number one “Low-Cost Carrier” in the world on punctuality, with an on-time performance index (OTP) of 90.5%. |
| · | Announcement of GOL's 16th codeshare agreement, a partnership for exclusive domestic routes with Azul. GOL also reinstated the codeshare agreement with South African Airways. |
| · | Announcement of two new international routes (Guarulhos-San Jose and Guarulhos-Aruba) and resumption of two other routes interrupted during the pandemic (Fortaleza-Orlando and Brasília-Cancun), with operations scheduled to begin by the end of 2024. GOL also announced its intention to establish the new Brasília-Bogotá route which, if approved, is scheduled to begin in the 4Q24. |
| · | 21.1% increase in the seat kilometers flown (ASK) on the international market in the first half of 2024, compared to the same period in 2023. |
Smiles – Loyalty Program
| · | Smiles achieved the second-best quarterly revenue in its history in the 2Q24, with 8.4% growth when compared to the same period of the previous year. |
| · | Number of Smiles customers increased by 6.5% in the 1H24, with a 54.6% increase in the customer base in the Diamond, Gold and Silver categories, reinforcing Smiles as the largest loyalty program among Brazilian airlines. |
| · | 11.5% increase in the Clube Smiles’ customer base in the 1H24 compared to the same period in 2023. |
GOLLOG – Cargo Business
| · | 41.0% increase in GOLLOG revenue in the 1H24, compared to the same period in 2023. |
| · | 39.5% increase in total tons transported in the 1H24, compared to the same period in 2023. |
| · | In the 1H24, GOLLOG transported 84.3% more tons related to its cargo operation dedicated to Mercado Livre, compared to the same period in 2023. |
GOL Linhas Aéreas Inteligentes S.A. | 1 |
| | Results Report 2Q24 |
1. Operating Results
GOL – Passenger Transport
In May 2024, GOL and Azul announced a commercial cooperation agreement that will connect their exclusive domestic routes through a codeshare. Sales related to this agreement began on July 3, 2024. The demand for markets that connect large centers to regional markets is significant and the agreement will create more than 2,700 travel opportunities with just one connection for GOL customers.
In the international market, GOL continued to focus on its diversification and sustainable growth process with the opening of new airport stations. During the 2Q24, the Company announced two new international routes. The first, a new operation between São Paulo International Airport (GRU) and the Costa Rica capital, San Jose (SJO), connecting both cities directly for the first time, will begin in November 2024. The second new route, Guarulhos (GRU) - Aruba (AUA), will provide a direct flight on a route that currently does not have direct flights to Brazil, from December onwards. The two new routes will be served by non-stop flights, meeting GOL's purpose of increasingly integrating countries in the region and promoting tourism/business travel in the Americas. A third new international route, Brasília (BSB) – Bogotá (BOG), was also announced in the 2Q24 with services beginning by the 4Q24. In addition to the two new routes, GOL resumed operations on two other routes interrupted during the pandemic. The first, Fortaleza (FOR) – Orlando (MCO), resumed its operation on June 27, 2024. The second, Brasilia (BSB) – Cancun (CUN) is scheduled to begin flying on December, 2024.
The quarter was challenging due to the closure of Salgado Filho International Airport in the state of Rio Grande do Sul, which resulted in cancellations of scheduled flights departing/arriving in Porto Alegre. To mitigate the impacts of flights supply and meet the Porto Alegre clients’ demand, GOL began flying to the Canoas military base, in addition to increasing the frequency of flights to the cities of Caxias do Sul (CXJ) and Pelotas (PET). GOL continues to closely monitor the situation and is working in close collaboration with airport and aviation authorities to resume operations as soon as safely possible.
Added to the effects of reduced supply in Porto Alegre, the total available seat kilometer (ASK) supply was lower by 7.2% compared to the second quarter of 2023 (2Q23). Despite these effects, GOL increased its international ASK by 14.4% in the quarter (21.1% in the semester) compared to the same period of the previous year.
GOL remains dedicated to offering the best customer service experience and continues to enhance its digital channels. During 2Q24 GOL achieved a 13.2% increase (vs 2Q23) in ticket sales made through its direct channels (website and app), further solidifying GOL's presence and focus on digital.
The Company reached a Load Factor of 80.6% in the quarter, 3.8 p.p. higher compared to 2Q23, with an 8.7 p.p. increase in the international occupancy rate (vs 2Q23), further reinforcing the attractiveness of GOL's services not only to domestic customers. The result was an increase of 6.5% (vs 2Q23) in the number of passengers per departure (19.6% for international departures).
Reinforcing our commitment to customer service, GOL reaches the end of the second quarter of 2024 as the most on-time airline in Latin America, with an on-time performance index (OTP) of 90.5% in June (average of 90.7 % in the quarter). June was the fourth consecutive month in which the Company led the on-time performance in the Brazilian air market.
GOL Linhas Aéreas Inteligentes S.A. | 2 |
| | Results Report 2Q24 |
| Operational Indicators | Passengers | 2Q24 | 2Q23 | D | 6H24 | 6H23 | D | |
| Average Dollar | R$/US$ | 5.22 | 4.95 | 5.4% | 5.09 | 5.07 | 0.2% |
| Aviation Kerosene (QAV) Medium | R$ | 4.54 | 4.69 | (3.2%) | 4.43 | 5.18 | (14.5%) |
| Sales | R$ billions | 3.7 | 3.7 | (1.1%) | 7.2 | 7.7 | (6.3%) |
| Punctuality | % | 90.7 | 86.4 | 4.2 p.p. | 87.0 | 81.8 | 5.2 p.p. |
| Operational Fleet | # | 103 | 115 | (12) | 105 | 116 | (11) |
| Operational Utilization Rate (Block Hour)¹ | hours/day | 10.4 | 10.3 | 1.1% | 10.7 | 10.6 | 0.4% |
| Total ASK | billions | 9.5 | 10.3 | (7.2%) | 20.3 | 21.5 | (5.5%) |
| National ASK | billions | 8.4 | 9.3 | (9.6%) | 17.6 | 19.3 | (8.5%) |
| International ASK | billions | 1.2 | 1.0 | 14.4% | 2.7 | 2.2 | 21.1% |
| Departures | thousand | 49.0 | 54.6 | (10.2%) | 100.7 | 111.6 | (9.8%) |
| Stage Length | Km | 1,088 | 1,067 | 2.0% | 1,129 | 1,091 | 3.4% |
| Load Factor | % | 80.6 | 76.9 | 3.8 p.p. | 82.0 | 80.4 | 1.7 p.p. |
| National Load Factor | % | 80.5 | 77.3 | 3.2 p.p. | 81.7 | 80.8 | 0.9 p.p. |
| International Load Factor | % | 81.8 | 73.1 | 8.7 p.p. | 83.9 | 75.6 | 8.3 p.p. |
| Pax on board | millions | 6.7 | 7.0 | (4.5%) | 13.9 | 14.9 | (6.5%) |
| Domestic Passengers | millions | 6.3 | 6.7 | (5.8%) | 13.0 | 14.3 | (8.4%) |
| International Passengers | millions | 0.4 | 0.3 | 25.9% | 0.9 | 0.6 | 35.3% |
(1) Calculated based on the number of operational aircraft.
Smiles - Loyalty Program
Smiles customer base increased by 6.5% in the 1H24, with an 11.5% increase in the customer base subscribed to Clube Smiles. The growth of the program in the quarter yielded a 14.0% increase in miles redemption transactions in the 1H24 (vs 1H23), and a 2.8% increase in the number of miles redeemed in the same period. This significant result for Smiles can be attributed to the growth of the loyalty market and the expansion of the products and services available. Furthermore, the penetration of Smiles on GOL and its international partners flights contributed to this growth.
The number of customers in the Silver, Gold and Diamond categories increased significantly in 2Q24 (54.6% compared to 2Q23). This increase in the higher tier costumers was driven by changes to the Loyalty program rules that came into force in December 2023, aiming to offer more benefits and recognition to the frequent customers of GOL and its partners.
In addition to the growth in the customer base and mile redemptions, Smiles recorded an 8.4% increase in quarterly revenue, highlighting its financial efficiency and ability to generate value for both members and GOL.
In July, Smiles launched a new function to allow express transfer of miles between partner programs, simplifying the process for our customers. With this innovation, it is possible to quickly transfer miles between different loyalty programs, improving flexibility and rewards management. The change aims to optimize the customer experience, allowing them to make better use of their points accumulated in different programs.
Operational Indicators | Smiles |
2Q24 | 2Q23 | D | 1H24 | 1H23 | D | |
| Revenue | R$ billion | 1.3 | 1.2 | 8.4% | 2.6 | 2.5 | 3.7% |
| Customers | million | 23.2 | 21.8 | 6.5% | 23.2 | 21.8 | 6.5% |
| Miles Redemption Transactions | million | 2.5 | 2.3 | 8.0% | 5.0 | 4.4 | 14.0% |
| Redeemed Miles | billion | 61.9 | 60.6 | 2.1% | 120.9 | 117.6 | 2.8% |
GOL Linhas Aéreas Inteligentes S.A. | 3 |
| | Results Report 2Q24 |
GOLLOG - Cargo Unit
In the 1H24, GOLLOG achieved relevant growth in weight transported, with an increase of 39.5% compared to the first half of 2023. This performance was driven by the increase in Mercado Livre operations, with the addition of two aircraft dedicated freighters in relation to the second quarter of the previous year. GOLLOG recorded a significant increase of 27.1% in quarterly revenue and a 41.0% increase in half-yearly revenue (vs 2023).
This growth was achieved despite the impact from the stoppage of operations at Porto Alegre airport, an important cargo operation, due to the climate crisis that affected Rio Grande do Sul leading to rerouting of some cargo to a multimodal transportation through other airports in conjunction with trucks.
| Operational Indicators | GOLLOG | 2Q24 | 2Q23 | D | 1H24 | 1H23 | D | |
| Revenue | R$ millions | 315 | 248 | 27.1% | 610 | 433 | 41.0% |
| Weight Carried | # mil | 32.8 | 26.6 | 23.3% | 64.3 | 46.1 | 39.5% |
| Cargo Aircraft | # | 6 | 4 | 2 | 6 | 4 | 2 |
| 2. | Consolidated Financial Result |
Revenue
Despite the 7.2% drop in the supply of available seats per kilometer (ASK) in passenger operations, the growth of the GOLLOG and Smiles business units and efficient sales management resulted in an increase in unit revenue per seat kilometer (RASK) of 2.4% in 2Q24 compared to 2Q23, with a reduction in net revenue of 5.0% in the quarter. GOL estimates that the closure of Salgado Filho International Airport (POA) was responsible for revenue losses amounting to approximately R$120 million. Excluding this impact, net revenue for the quarter would have been reduced by just 2.1%.
The Smiles loyalty program and the GOLLOG cargo operation contributed positively
to the quarter's revenue, with a 7.8% increase in other revenues compared to 2Q23.
| Income Statement (Revenue) | 2Q24 | 2Q23 | D | 1H24 | 1H23 | D | |
| Net Revenue | R$ millions | 3,937 | 4,146 | (5.0%) | 8,651 | 9,066 | (4.6%) |
| Passenger Transport | R$ millions | 3,478 | 3,720 | (6.5%) | 7,799 | 8,257 | (5.5%) |
| Other Income | R$ millions | 459 | 426 | 7.8% | 852 | 809 | 5.3% |
| Revenue Indicators | 2Q24 | 2Q23 | D | 1H24 | 1H23 | D | |
| RASK | R$ cents | 41.3 | 40.3 | 2.4% | 42.6 | 42.2 | 1.0% |
| PRASK | R$ cents | 36.5 | 36.2 | 0.8% | 38.4 | 38.4 | (0.1%) |
| Yield | R$ cents | 45.2 | 47.1 | (3.9%) | 46.8 | 47.9 | (2.2%) |
| Average Fare | R$ cents | 503.5 | 530.8 | (5.1%) | 541.9 | 534.9 | 1.3% |
GOL Linhas Aéreas Inteligentes S.A. | 4 |
| | Results Report 2Q24 |
Cost
GOL incurred non-recurring costs in 2Q24, of which R$336 million related to the Chapter 11 process, which were adjusted in the 2Q24 for comparability with 2Q23.
The Company presented a significant drop of 5.9% in the total accumulated cost of the 1H24. This reduction was mainly driven by the 14.3% drop in QAV for the period, in addition to the 22.7% drop in spending on passengers in the semester, reflecting the reduction in costs in following the end of the end of the partnership with a regional airline last year.
Despite progress in certain cost lines, lower ASK hindered the Company’s ability to dilute fixed costs and reduce its CASK in the periods presented.
| Income Statement (Recurring Costs) | 2Q24 | 2Q23 | D | 1H24 | 1H23 | D | |
| Operating costs and expenses | R$ millions | 3,612 | 3,609 | 0.2% | 7,328 | 7,688 | (5.9%) |
| Personnel | R$ millions | 692 | 593 | 16.8% | 1,370 | 1.176 | 16.5% |
| Aviation Fuel | R$ millions | 1,214 | 1,357 | (10.6%) | 2,509 | 3,124 | (19.7%) |
| Landing Fees | R$ millions | 229 | 219 | 4.7% | 478 | 454 | 5.3% |
| Passenger Costs | R$ millions | 179 | 207 | (13.5%) | 374 | 484 | (22.7%) |
| Services | R$ millions | 270 | 309 | (12.7%) | 560 | 549 | 1.9% |
| Sales and Marketing | R$ millions | 180 | 190 | (5.6%) | 400 | 416 | (3.8%) |
| Maintenance material and Repairs | R$ millions | 310 | 289 | 7.0% | 575 | 517 | 11.1% |
| Depreciation and Amortization | R$ millions | 421 | 410 | 2.6% | 851 | 806 | 5.5% |
| Others | R$ millions | 118 | 34 | NM | 211 | 160 | 31.4% |
| Recurring Cost Indicators | 2Q24 | 2Q23 | D | 1H24 | 1H23 | D | |
| CASK | R$ cents | 37.9 | 35.1 | 7.9% | 36.1 | 35.7 | 0.9% |
| CASK Fuel | R$ cents | 12.7 | 13.2 | (3.6%) | 12.3 | 14.5 | (15.0%) |
| CASK Ex-Fuel | R$ cents | 25.1 | 21.9 | 14.9% | 23.7 | 21.2 | 11.7% |
EBITDA
Despite the lower cost dilution in light of the reduction in ASK, and other challenges endured in the quarter, the Company delivered a recurring EBITDA margin of 18.9% in the quarter.
It is estimated that the flood in the state of Rio Grande do Sul (RS) reduced the operating result by around R$100 million, by a combination of R$ 120 million reduction in revenues and around R$ 20 million in reduced costs due to the lower number of flights operated. This translated into a reduction of 1.9 p.p. in the margin for the quarter.
| 2T24 | 2T23 | D | 6M24 | 6M23 | D | ||
| Recurring EBITDA | R$ millions | 745 | 947 | (21.3%) | 2,174 | 2,185 | (0.5%) |
| Recurring EBITDA Margin | % | 18.9% | 22.8% | (3.9 p.p.) | 25,1% | 24.1% | 1.0 p.p. |
GOL Linhas Aéreas Inteligentes S.A. | 5 |
| | Results Report 2Q24 |
Net income
In 2Q24, the Company recorded a net loss of R$3.9 billion and an adjusted net loss of R$1.0 billion, excluding gains from net exchange variation of R$2.7 billion, loss of R$166 million related to Exchangeable Notes and Capped Calls, in addition to non-recurring expenses of R$336 million from Chapter 11.
| Net Financial Result (R$ million) | 2Q24 | 2Q23 | D | 1H24 | 1H23 | D | |
| Net Profit (loss) | (3,908) | 556 | NM | (121) | 1,176 | NM | |
| (-) ESN Results and Capped Calls | (166) | (9) | NM | (5,041) | (20) | NM | |
| (-) Exchange Rate Changes | 2,694 | (963) | NM | 3,461 | (1,480) | NM | |
| (-) Non-recurring expenses and income, Net | 336 | - | NM | 526 | 45 | NM | |
| Adjusted Net Profit (loss) | (1,045) | 416 | NM | (1,174) | (279) | NM |
(1) Considers mark-to-market of the ESSN derivative depending on the variation in the share price (2) The difference between the value presented and the value disclosed in the income statement of the quarterly information – ITR for the period ended December 31, 2021, to ESN results and limited calls. (3) Earnings per share excludes the results of (i) net exchange rate variation; (ii) Interchangeable and limited calls; and (iii) excludes non-recurring results.
| 3. | Cash Flow |
In the second quarter of 2024, the Company used approximately R$0.5billion for its operations, mainly reflecting the business decision to temporarily reduce the amount of receivables factoring. In terms of CAPEX, GOL invested around R$626 million, a large part of which was in the engines undergoing heavy maintenance, restoring green life on these assets. Finally, the Company's financial cash flow reached R$1.4 billion in the quarter, due to the disbursement of the last tranche of the DIP in the amount of US$450 million, offset by payments of financial and leasing debts.
| Cash Flow (R$ millions) | 2Q24 | 2Q23 | D | 1H24 | 1H23 | D | |
| (+) Recurring EBITDA | 745 | 947 | (21.3%) | 2,174 | 2,185 | (0.5%) | |
| (+) Working Capital Variation | (1,222) | (330) | NM | (3,498) | (1,160) | NM | |
| (=) Operating Cash Flow | (477) | 617 | NM | (1,324) | 1,024 | NM | |
| (+) CAPEX | (626) | (233) | NM | (756) | (411) | 84.2% | |
| (+) Financial Flow | 1,435 | (450) | NM | 3,624 | (454) | NM | |
| New Funding | 2,293 | 223 | NM | 5,035 | 959 | NM | |
| Interest, Amortizations and Others | (857) | (673) | (27.4%) | (1,411) | (1.413) | (0.2%) | |
| (=) Cash Generation/Consumption (w/o D cambial) | 333 | (66) | NM | 1,544 | 160 | NM | |
| (+) Exchange Variation on Cash Balance | 249 | (26) | NM | 267 | (39) | NM | |
| (=) Cash Generation/Consumption | 582 | (92) | NM | 1,811 | 121 | NM | |
| Initial Cash of the Period | 2,011 | 806 | NM | 783 | 592 | 32.1% | |
| Final Cash of the Period | 2,593 | 714 | NM | 2,593 | 714 | NM | |
GOL Linhas Aéreas Inteligentes S.A. | 6 |
| | Results Report 2Q24 |
4. Cash and Debt
The Company's total cash (which includes cash, cash equivalents and financial investments) reached R$2.6 billion. On June 30, 2024, total cash plus accounts receivable amounted to R$5.5 billion, representing 30.1% of revenue in the last twelve months.
On June 30, 2024, GOL's Loans and Financing totaled R$19 billion, of which R$5.5 billion relates to the DIP Loan. Total lease liabilities amounted to R$10.2 billion.
Total gross debt in 2Q24 was R$29.2 billion, representing an increase of 33.3% when compared to 2Q23. The depreciation of the Brazilian Real in the period increased the gross debt by R$2.7 billion. Adjusted net debt/LDM EBITDA reached 5.1x on June 30, 2024.
| Debt (R$ millions) | 2Q24 | 2Q23 | D 2Q23 | 1Q24 | D 1Q24 | ||
| Loans and Financing | 19,050 | 12,253 | 55.5% | 14,181 | 55.5% | ||
| Leases Payable | 10,170 | 9,665 | 5.2% | 9,515 | 5.2% | ||
| Gross Debt | 29,220 | 21,917 | 33.3% | 23,695 | 33.3% | ||
| Cash and Equivalents | (2,593) | (714) | NM | (2,011) | 28,9% | ||
| Perpetual Bonus (-) | (775) | (682) | NM | (697) | NM | ||
| Net Debt¹ | 25,852 | 20,522 | 26.0% | 20,987 | 26.0% | ||
| Net debt/EBITDA LTM | 5.1x | 5.0x | NM | 4.0x | (1.0x) |
(1) Excludes perpetual bonus and total cash.
(2) Excludes effects of non-recurring items.
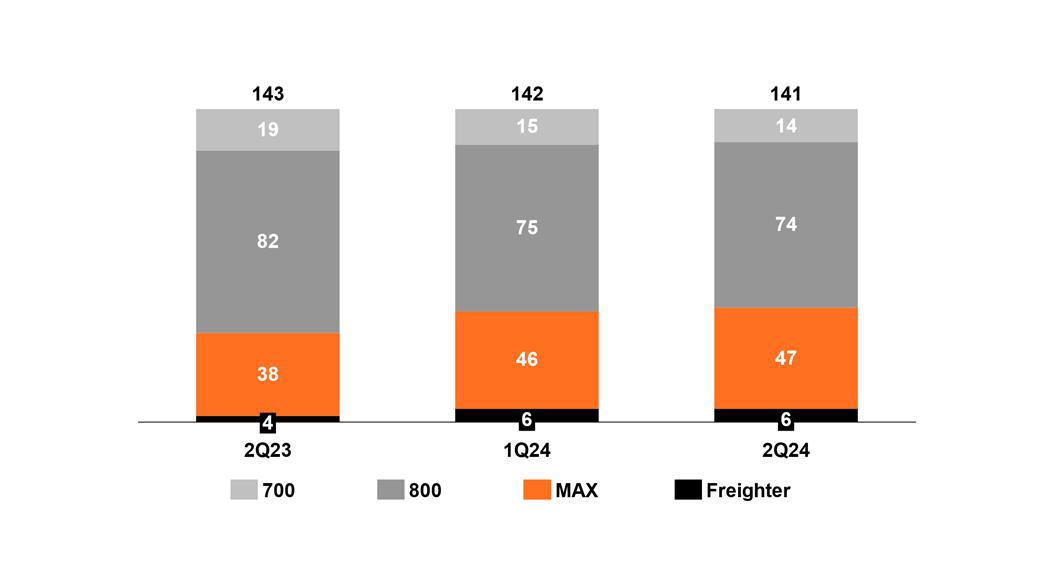
5. Fleet
This quarter, GOL added one new Boeing 737-MAX 8 aircraft to its fleet. As part of the fleet renewal and operational efficiency plan, the Company returned two Boeing 737-NG aircraft.
As of June 30, 2024, GOL had a total fleet of 141 Boeing aircraft, of which 47 737-MAX, 88 737-NG and 6 737-800BCF freighters. The Company's fleet is 100% made up of Boeing 737 family narrowbody aircraft, all financed via operating leases.
GOL Linhas Aéreas Inteligentes S.A. | 7 |
| | Results Report 2Q24 |
6. Chapter 11 Updates
The Company currently expects that any proposed plan of reorganization will include, among other things, mechanisms for the resolution of claims against the Company and treatment of the Company's current creditors and shareholders.
Any proposed plan of reorganization will be subject to negotiation before submission to the Bankruptcy Court, based on discussions with the Company's creditors and other interested parties, and subsequently, in response to interested party objections and the confirmation requirements of the Bankruptcy Code and the Bankruptcy Court’s confirmation. There is no guarantee that the Bankruptcy Court will confirm the reorganization plan.
Throughout the Chapter 11 cases, certain stipulations with the Company’s aircraft lessors were submitted to and approved by Bankruptcy Court. The respective lease agreements are being renegotiated under the terms of the global Chapter 11 restructuring and certain contractual terms have been modified in accordance with the stipulations approved by the Bankruptcy Court. In June 2024, the Company began signing some contractual amendments with aircraft lessors, which involved, among other things, changes in lease payment flows, supplementary leases (maintenance reserve, maintenance deposits, guarantee deposits, among others), exchange of engines, engine rejection and negotiation of unguaranteed aircraft and engine liabilities, as detailed in explanatory note nº 17 and nº 18 of quarterly financial information.
On June 3, 2024, the Bankruptcy Court approved extensions of the Company’s exclusive periods to file and solicit votes on a plan of reorganization to October 21, 2024, and December 20, 2024, respectively. The Company may require further extensions of these exclusive periods prior to its emergence from Chapter 11.
On August 2, 2024, the Bankruptcy Court approved a stipulation with Banco Santander S.A. (Brasil), Banco do Brasil S.A., and Banco Bradesco S.A., providing for, among other things, a guaranteed line for the factoring of receivables.
GOL Linhas Aéreas Inteligentes S.A. | 8 |
| | Results Report 2Q24 |
7. Appendixes
Income Statement
| Income Statements in IFRS (R$ Millions) | 2Q24 | 2Q23 | % Var. | 1H24 | 1H23 | % Var. |
| Net Revenue | 3,937 | 4,146 | (5.0%) | 8,651 | 9,066 | (4.6%) |
| Passenger Net Revenue | 3,478 | 3,720 | (6.5%) | 7,799 | 8,257 | (5.5%) |
| Ancillary Net Revenue | 459 | 426 | 7.8% | 852 | 809 | 5.3% |
| Operating Costs and Expenses | (3,948) | (3,609) | 9.4% | (7,854) | (7,732) | 1.6% |
| Personnel Costs | (696) | (593) | 17.5% | (1,376) | (1,176) | 17.0% |
| Fuel Costs | (1,214) | (1,357) | (10.6%) | (2,509) | (3,124) | (19.7%) |
| Landing Fees Costs | (229) | (219) | 4.7% | (478) | (454) | 5.3% |
| Passenger Costs | (180) | (207) | (13.3%) | (374) | (484) | (22.7%) |
| Services Costs | (499) | (309) | 61.5% | (883) | (549) | NM |
| Sales and Marketing Costs | (179) | (190) | (5.8%) | (400) | (416) | (3.8%) |
| Maintenance Material and Repairs | (366) | (289) | 26.4% | (706) | (562) | 25.6% |
| Depreciation and Amortization Costs (D&A) | (421) | (410) | 2.6% | (851) | (807) | 5.5% |
| Others | (164) | (34) | NM | (276) | (160) | NM |
| Operating Result (EBIT) | (11) | 537 | NM | 797 | 1,333 | (40.2%) |
| Operating Margin | -0.3% | 13.0% | (13.2 p,p,) | 9.2% | 14.7% | (12.3 p.p.) |
| Other Financial Income (Expenses) | (3,861) | (3) | NM | (880) | (162) | NM |
| Interest on Loans and Financing | (755) | (752) | 0.3% | (1,359) | (1,081) | 25.7% |
| Gains from Financial Investments | 47 | (12) | NM | 87 | 30 | NM |
| Monetary and Foreign Exchange Variations | (2,694) | 963 | NM | (3,461) | 1,480 | NM |
| Net Result from Derivatives | (7) | (12) | (38.6%) | (10) | (25) | NM |
| ESN and Capped Calls results | 166 | 9 | NM | 5,041 | 20 | NM |
| Other Net Expenses (Income) | (91) | (199) | (54.1%) | (144) | (48) | N/M |
| Profit (Loss) Before IR/CS | (3,873) | 535 | NM | (83) | 1,172 | NM |
| Income Tax | (36) | 22 | NM | (38) | 4,0 | N/M |
| Current Income Tax | (1) | (8) | NM | (1) | (16) | N/M |
| Deferred Income Tax | (35) | 29 | NM | (37) | 20 | N/M |
| Profit (Loss) for the Period | (3,908) | 556 | NM | (121) | 1,176 | N |
| Net Margin | -99.3% | 13.4% | NM | -1.4% | 13.0% | (14.4 p.p.) |
| EBITDA | 410 | 947 | (56.8%) | 1,648 | 2,140 | (23.0%) |
| EBITDA Margin | 10.4% | 22.8% | (12.4 p,p,) | 19.1% | 23.6% | (4.6 p.p.) |
GOL Linhas Aéreas Inteligentes S.A. | 9 |
| | Results Report 2Q24 |
Non-recurring items reconciliation
The operating results presented in this release include items related to the company's restructuring process, which we consider non-recurring, and which should not be considered for comparison with previous or future periods. In 2Q24, adjustments to non-recurring items totaled R$336 million.
The table below presents a reconciliation of our reported values with the adjusted values, excluding non-recurring items:
| (R$ millions) | Reported | Non-Recurring | Adjusted |
| Net Revenue | 3,937 | - | - |
| Operating costs and expenses | 3,948 | (336) | 3,612 |
| Personnel | 696 | (4) | 692 |
| Maintenance | 366 | (56) | 309 |
| Services Provision | 499 | (229) | 270 |
| Other Expenses | 164 | (46) | 118 |
| Operating Margin | -0.3% | 8.6 p.p | 8.3% |
| EBITDA | 410 | 336 | 745 |
| EBITDA Margin | 10.4% | 8.5 p.p | 18.9% |
Glossary
https://ri.voegol.com.br/en/information-for-investors/glossary/
GOL Linhas Aéreas Inteligentes S.A. | 10 |
| | Results Report 2Q24 |
Balance Sheet – IFRS
| (R$ milhões) | 2Q24 | 2Q23 | % Var. |
| Assets | 21,791 | 16,430 | 32.6% |
| Current Assets | 7,457 | 2,941 | NM |
| Cash and Cash Equivalents | 2,207 | 253 | NM |
| Investments | 198 | 419 | (52.7%) |
| Trade Receivables | 2,935 | 841 | NM |
| Inventories | 429 | 392 | 9.3% |
| Deposits | 533 | 312 | 70.8% |
| Advance to Suppliers and Third Parties | 602 | 339 | 77.6% |
| Recoverable Taxes | 113 | 131 | (13.7%) |
| Rights from Derivative Transactions | 0 | 4 | NM |
| Other Credits | 440 | 249 | (76.7%) |
| Non-Current Assets | 14,335 | 13,506 | 6.1% |
| Long Term Investments | 189 | 41 | NM |
| Deposits | 2,709 | 2,199 | 23.2% |
| Advance to Suppliers and Third Parties | 99 | 89 | 11.2% |
| Taxes to Recover | 14 | 30 | (53.3%) |
| Deferred Taxes | 0 | 76 | NM |
| Other Credits | 15 | 26 | (42.3%) |
| Rights from Derivative Transactions | - | 17 | NM |
| Fixed Assets | 9,315 | 9,137 | 1.9% |
| Intangible Assets | 1,994 | 1,891 | 5.4% |
| Liabilities and Equity | 21,791 | 16,447 | 32.5% |
| Current Liabilities | 22,807 | 13,759 | NM |
| Loans and Financing | 9,885 | 1,449 | NM |
| Leases to Pay | 1,932 | 1,745 | 10.7% |
| Suppliers | 2,338 | 2,259 | 3.5% |
| Suppliers - risk | 19 | 20 | (5.0%) |
| Labor Obligations | 657 | 582 | 12.9% |
| Taxes and Contributions to Collect | 187 | 196 | (4.4%) |
| Airport Fees | 1,043 | 1,370 | (23.9%) |
| Advance Ticket Sales | 2,956 | 3,236 | (8.7%) |
| Frequent-Flyer Program | 1,960 | 1,578 | 24.2% |
| Advances from Ticket Sales | 62 | 464 | NM |
| Provisions | 1,288 | 517 | NM |
| Liabilities with Derivative Transactions | 10 | 3 | NM |
| Other Liabilities | 471 | 341 | 38.0% |
| Non-Current Liabilities | 22,203 | 23,103 | (3.9%) |
| Loans and Financing | 9,165 | 10,803 | (15.2%) |
| Leases to Pay | 8,238 | 7,919 | 4.0% |
| Suppliers | 115 | 124 | (6.5%) |
| Labor Obligations | 418 | 460 | (9.1%) |
| Taxes and Contributions to Collect | 294 | 272 | 8.1% |
| Airport Fees | 557 | 183 | NM |
| Frequent-Flyer Program | 224 | 198 | 13.1% |
| Lp Provisions | 2,734 | 3.2 | (1.8%) |
| Deferred Taxes | 235 | 15 | NM |
| Obligations with Derivative Transactions | 60 | - | NM |
| Other Liabilities | 163 | 651 | (52.6%) |
| Equity | (23,219) | (20,415) | 9.6% |
| Share Capital | 4,045 | 4,040 | 0.1% |
| Treasury Shares | 0 | (19) | NM |
| Capital Reserve | 397 | 765 | (48.1%) |
| Equity Valuation Adjustments | (550) | (609) | (9.7%) |
| Accumulated losses | (27,112) | (24,593) | 10.2% |
GOL Linhas Aéreas Inteligentes S.A. | 11 |
| | Results Report 2Q24 |
Cash Flow – IFRS
| (R$ millions) | 2Q24 | 2Q23 | % Var. | 1H24 | 1H23 | % Var. |
| Net profit (loss) for the period | (3,908) | 556 | NM | (121) | 1,176 | NM |
| Depreciation - aeronautical right of use | 225 | 223 | 1.0% | 459 | 449 | 2.2% |
| Depreciation and amortization - other | 196 | 186 | 4.7% | 390 | 358 | 8.9% |
| Provision for doubtful accounts | 1 | (4) | NM | 2 | (3) | NM |
| Constitution (reversal) of provision | 305 | 324 | (5.9%) | 475 | 487 | (2.5%) |
| Provision for inventory obsolescence | 0 | 0 | NM | 1 | 0 | NM |
| Provision for impairment of deposits | (36) | - | NM | 5 | - | NM |
| Provision for loss on advance from suppliers | - | 3 | NM | 0 | - | NM |
| Adjustment to present value of provisions | 70 | 47 | 47.7% | 134 | 97 | 38.1% |
| Deferred taxes | 35 | (29) | NM | 37 | (20) | NM |
| Write-off of fixed and intangible assets | - | (13) | NM | - | 21 | NM |
| Sale-leaseback - Retroleases | (15) | (72) | (79.0%) | (119) | (72) | 65.3% |
| Contractual changes to leases | (49) | (1) | NM | (49) | (68) | (27.9%) |
| Financial results on debt | 108 | - | NM | 108 | - | NM |
| Exchange and monetary variations, net | 2,493 | (1,157) | NM | 3,207 | (1,567) | NM |
| Interest on loans and leases and amortization of costs, premiums and goodwill | 1,123 | 709 | 58.5% | 2,044 | 1,391 | 46.9% |
| Goodwill on financing operations | - | - | NM | - | - | NM |
| Result of transactions with fixed and intangible assets | 84 | 21 | NM | 53 | 21 | NM |
| Negative goodwill on repurchase of securities | - | 47 | NM | - | (183) | NM |
| Results of derivatives recognized in profit or loss | (189) | 139 | NM | (5,031) | 92 | NM |
| Share-based remuneration | 2 | 4 | (54.4%) | 5 | 8 | (28.6%) |
| Other provisions | (3) | (3) | 4.3% | (8) | (12) | (33.3%) |
| Adjusted net income (loss) | 441 | 983 | (55.2%) | 1,592 | 2,153 | (26.1%) |
| Changes in operating assets and liabilities: | NM | NM | ||||
| Financial investments | 34 | 19 | 82,6% | 238 | (113) | NM |
| Accounts receivable | (889) | 197 | NM | (2,112) | 45 | NM |
| Inventories | (27) | 16 | NM | (51) | 47 | NM |
| Deposits | (163) | 67 | NM | (326) | 51 | NM |
| Advances to suppliers and third parties | (5) | (8) | (43.1%) | (114) | (56) | NM |
| Recoverable taxes | (11) | 33 | NM | 52 | 87 | (40.2%) |
| Variable leases | 2 | (1) | NM | 12 | 4 | NM |
| Suppliers | (15) | 116 | NM | 230 | 17 | NM |
| Suppliers - Drawn risk | - | (10) | NM | (21) | (10) | NM |
| Transportation to be conducted | 429 | 108 | NM | (175) | (266) | (34.2%) |
| Mileage program | 106 | (93) | NM | 179 | (93) | NM |
| Customer advances | (102) | (78) | 29.4% | (87) | 61 | NM |
| Labor obligations | (91) | 8 | NM | (68) | 155 | NM |
| Airport taxes and fees | 2 | 46 | (96,4%) | (25) | 161 | NM |
| Taxes payable | (25) | 15 | NM | (63) | (57) | 10.5% |
| Obligations with derivative operations | 61 | (5) | NM | 59 | (2) | NM |
| Provisions | (255) | (516) | (50.6%) | (394) | (619) | (36.3%) |
| Other credits (obligations) | 164 | (6) | NM | 88 | (49) | NM |
| Interest paid | (212) | (211) | 0.3% | (266) | (521) | (48.9%) |
| Net cash generated by operating activities | (557) | 676 | NM | (1,252) | 987 | NM |
| Acquisition of fixed assets | (596) | (185) | NM | (689) | (340) | NM |
| Acquisition of intangible assets | (30) | (49) | (38.4%) | (68) | (71) | (4.2%) |
| Receipts from sale-leaseback operations | - | 0 | NM | - | 0 | NM |
| Net cash used in investment activities | (626) | (233) | 22.4% | (756) | (411) | 43,3% |
| Borrowings from loans and financing | 2,290 | 223 | NM | 5,032 | 960 | NM |
| Loan repayments | (124) | (148) | (15.9%) | (210) | (249) | (15.7%) |
| Lease payments - aeronautical | (718) | (513) | 39.9% | (1,177) | (1,142) | 3.1% |
| Lease payments - other | (12) | (12) | 4,0% | (24) | (22) | 9.1% |
| Capital increase | - | - | NM | 3 | - | NM |
| Net cash used in financing activities | 1,435 | (450) | NM | 3,624 | (454) | NM |
| Exchange variation in cash of subsidiaries abroad | 249 | (26) | NM | 267 | (39) | NM |
| Cash and cash equivalents at the beginning of the period | 2,099 | 286 | NM | 324 | 169 | 91.7% |
| Cash and cash equivalents at the end of the period | 2,207 | 253 | NM | 2,207 | 253 | NM |
GOL Linhas Aéreas Inteligentes S.A. | 12 |
| | Results Report 2Q24 |
About GOL Linhas Aéreas Inteligentes S.A
GOL is a leading domestic airline in Brazil and part of Abra Group. Since it was founded in 2001, the Company has the lowest unit cost in Latin America, democratizing air transportation. The Company has alliances with American Airlines and Air France-KLM and provides eighteen codeshares and interline agreements to its Customers, bringing more convenience and simple connections to any place served by these partnerships. With the purpose of “Being the First for All,” GOL offers the best travel experience to its passengers, including: the largest number of seats and more space between seats; the greatest platform with internet, movies, and live TV; and the best frequent-flyer program, Smiles. In cargo transportation, Gollog delivers orders to different regions in Brazil and abroad. The Company has a team of 13,700 highly qualified aviation professionals focused on Safety. GOL’s #1 value and operates a standardized fleet of 141 Boeing 737 aircraft. The Company's shares are traded on the B3 (GOLL4). For further information, go to www.voegol.com.br/ir.
Investor Relations
ri@voegol.com.br
www.voegol.com.br/ri
GOL Linhas Aéreas Inteligentes S.A. | 13 |
SIGNATURE
Pursuant to the requirements of the Securities Exchange Act of 1934, the registrant has duly caused this report to be signed on its behalf by the undersigned, thereunto duly authorized.
Date: August 14, 2024
| GOL LINHAS AÉREAS INTELIGENTES S.A. | ||
| By: | /s/ Eduardo Guardiano Leme Gotilla | |
|
Name: Eduardo Guardiano Leme Gotilla Title: Chief Financial and IR Officer | ||