
(State or Other Jurisdiction of Incorporation) | (Commission File Number) | (IRS Employer Identification No.) | ||||||
| (Address of Principal Executive Offices) | (Zip Code) | |||||||
| Written communications pursuant to Rule 425 under the Securities Act (17 CFR 230.425) | |||||
| Soliciting material pursuant to Rule 14a-12 under the Exchange Act (17 CFR 240.14a-12) | |||||
| Pre-commencement communications pursuant to Rule 14d-2(b) under the Exchange Act (17 CFR 240.14d-2(b)) | |||||
| Pre-commencement communications pursuant to Rule 13e-4(c) under the Exchange Act (17 CFR 240.13e-4(c)) | |||||
| Title of each class | Trading Symbol | Name of each exchange on which registered | ||||||
| Exhibit Number | Description | |||||||
| 99.1 | ||||||||
| 99.2 | ||||||||
| 104 | Cover Page Interactive Data File (embedded within the Inline XBRL document). | |||||||
| Park Hotels & Resorts Inc. | ||||||||
Date: July 31, 2024 | By: | /s/ Sean M. Dell’Orto | ||||||
| Sean M. Dell’Orto | ||||||||
| Executive Vice President, Chief Financial Officer and Treasurer | ||||||||
| Investor Contact | 1775 Tysons Boulevard, 7th Floor | ||||
| Ian Weissman | Tysons, VA 22102 | ||||
| + 1 571 302 5591 | www.pkhotelsandresorts.com | ||||
| Three Months Ended June 30, | Six Months Ended June 30, | ||||||||||||||||||||||||||||||||||
| 2024 | 2023 | Change(1) | 2024 | 2023 | Change(1) | ||||||||||||||||||||||||||||||
| Comparable RevPAR | $ | 194.90 | $ | 191.03 | 2.0 | % | $ | 185.28 | $ | 177.05 | 4.6 | % | |||||||||||||||||||||||
| Comparable Occupancy | 77.1 | % | 77.0 | % | 0.1 | % pts | 74.0 | % | 72.2 | % | 1.8 | % pts | |||||||||||||||||||||||
| Comparable ADR | $ | 252.90 | $ | 248.33 | 1.8 | % | $ | 250.51 | $ | 245.38 | 2.1 | % | |||||||||||||||||||||||
| Comparable Total RevPAR | $ | 311.32 | $ | 301.74 | 3.2 | % | $ | 300.50 | $ | 286.81 | 4.8 | % | |||||||||||||||||||||||
Net income (loss) | $ | 67 | $ | (146) | 145.9 | % | $ | 96 | $ | (113) | 185.0 | % | |||||||||||||||||||||||
Net income (loss) attributable to stockholders | $ | 64 | $ | (150) | 142.7 | % | $ | 92 | $ | (117) | 178.6 | % | |||||||||||||||||||||||
| Operating income (loss) | $ | 121 | $ | (98) | 223.0 | % | $ | 213 | $ | (18) | 1,315.2 | % | |||||||||||||||||||||||
| Operating income (loss) margin | 17.5 | % | (13.7 | %) | 3,120 | bps | 16.1 | % | (1.3 | %) | 1,740 | bps | |||||||||||||||||||||||
| Comparable Hotel Adjusted EBITDA | $ | 199 | $ | 192 | 3.4 | % | $ | 367 | $ | 337 | 8.8 | % | |||||||||||||||||||||||
| Comparable Hotel Adjusted EBITDA margin | 29.9 | % | 29.8 | % | 10 | bps | 28.6 | % | 27.7 | % | 90 | bps | |||||||||||||||||||||||
| Adjusted EBITDA | $ | 193 | $ | 187 | 3.2 | % | $ | 355 | $ | 333 | 6.6 | % | |||||||||||||||||||||||
| Adjusted FFO attributable to stockholders | $ | 137 | $ | 129 | 6.2 | % | $ | 248 | $ | 221 | 12.2 | % | |||||||||||||||||||||||
Earnings (loss) per share - Diluted(1) | $ | 0.30 | $ | (0.70) | 142.9 | % | $ | 0.44 | $ | (0.54) | 181.5 | % | |||||||||||||||||||||||
Adjusted FFO per share – Diluted(1) | $ | 0.65 | $ | 0.60 | 8.3 | % | $ | 1.18 | $ | 1.01 | 16.8 | % | |||||||||||||||||||||||
| Weighted average shares outstanding – Diluted | 211 | 215 | (4) | 211 | 218 | (7) | |||||||||||||||||||||||||||||
| (unaudited) | Comparable ADR | Comparable Occupancy | Comparable RevPAR | ||||||||||||||||||||||||||||||||||||||||||||||||||||||||||||||
| Hotels | Rooms | 2Q24 | 2Q23 | Change(1) | 2Q24 | 2Q23 | Change | 2Q24 | 2Q23 | Change(1) | |||||||||||||||||||||||||||||||||||||||||||||||||||||||
| Hawaii | 2 | 3,507 | $ | 304.25 | $ | 300.71 | 1.2 | % | 86.9 | % | 93.1 | % | (6.2 | % pts) | $ | 264.54 | $ | 280.11 | (5.6 | %) | |||||||||||||||||||||||||||||||||||||||||||||
| Orlando | 3 | 2,325 | 239.96 | 231.00 | 3.9 | 68.3 | 68.4 | (0.1) | 164.01 | 158.12 | 3.7 | ||||||||||||||||||||||||||||||||||||||||||||||||||||||
| New York | 1 | 1,878 | 314.23 | 308.51 | 1.9 | 88.7 | 86.8 | 1.9 | 278.70 | 267.78 | 4.1 | ||||||||||||||||||||||||||||||||||||||||||||||||||||||
| New Orleans | 1 | 1,622 | 218.36 | 214.74 | 1.7 | 66.4 | 73.3 | (6.9) | 145.06 | 157.46 | (7.9) | ||||||||||||||||||||||||||||||||||||||||||||||||||||||
| Boston | 3 | 1,536 | 279.37 | 264.23 | 5.7 | 85.9 | 82.4 | 3.5 | 239.91 | 217.79 | 10.2 | ||||||||||||||||||||||||||||||||||||||||||||||||||||||
| Southern California | 5 | 1,773 | 224.55 | 239.42 | (6.2) | 81.8 | 77.8 | 4.0 | 183.69 | 186.29 | (1.4) | ||||||||||||||||||||||||||||||||||||||||||||||||||||||
| Key West | 2 | 461 | 555.43 | 516.68 | 7.5 | 77.0 | 42.8 | 34.2 | 427.75 | 221.08 | 93.5 | ||||||||||||||||||||||||||||||||||||||||||||||||||||||
| Chicago | 3 | 2,467 | 246.98 | 248.86 | (0.8) | 70.7 | 70.3 | 0.4 | 174.63 | 174.93 | (0.2) | ||||||||||||||||||||||||||||||||||||||||||||||||||||||
| Puerto Rico | 1 | 652 | 288.67 | 287.33 | 0.5 | 74.8 | 82.1 | (7.3) | 216.03 | 235.92 | (8.4) | ||||||||||||||||||||||||||||||||||||||||||||||||||||||
| Washington, D.C. | 2 | 1,085 | 212.73 | 197.56 | 7.7 | 81.7 | 80.8 | 0.9 | 173.88 | 159.66 | 8.9 | ||||||||||||||||||||||||||||||||||||||||||||||||||||||
| Denver | 1 | 613 | 204.90 | 209.98 | (2.4) | 69.4 | 75.0 | (5.6) | 142.28 | 157.53 | (9.7) | ||||||||||||||||||||||||||||||||||||||||||||||||||||||
| Miami | 1 | 393 | 252.49 | 245.71 | 2.8 | 84.0 | 81.6 | 2.4 | 212.07 | 200.52 | 5.8 | ||||||||||||||||||||||||||||||||||||||||||||||||||||||
| Seattle | 2 | 1,246 | 165.56 | 167.61 | (1.2) | 78.8 | 69.8 | 9.0 | 130.47 | 117.06 | 11.5 | ||||||||||||||||||||||||||||||||||||||||||||||||||||||
| San Francisco | 2 | 660 | 227.67 | 245.53 | (7.3) | 75.6 | 70.9 | 4.7 | 172.13 | 174.15 | (1.2) | ||||||||||||||||||||||||||||||||||||||||||||||||||||||
| Other | 10 | 3,210 | 182.36 | 181.43 | 0.5 | 68.3 | 69.7 | (1.4) | 124.62 | 126.41 | (1.4) | ||||||||||||||||||||||||||||||||||||||||||||||||||||||
| All Markets | 39 | 23,428 | $ | 252.90 | $ | 248.33 | 1.8 | % | 77.1 | % | 77.0 | % | 0.1 | % pts | $ | 194.90 | $ | 191.03 | 2.0 | % | |||||||||||||||||||||||||||||||||||||||||||||
| Three Months Ended June 30, | Six Months Ended June 30, | ||||||||||
| 2024 vs 2023 | 2024 vs 2023 | ||||||||||
| Resort | 2.2 | % | 5.2 | % | |||||||
| Urban | (0.1) | 3.1 | |||||||||
| Airport | 6.5 | 6.0 | |||||||||
| Suburban | 5.5 | 6.9 | |||||||||
| All Types | 2.0 | 4.6 | |||||||||
| (unaudited, dollars in millions) | ||||||||||||||||||||||||||
| Debt | Collateral | Interest Rate | Maturity Date | As of June 30, 2024 | ||||||||||||||||||||||
| Fixed Rate Debt | ||||||||||||||||||||||||||
| Mortgage loan | Hilton Denver City Center | 4.90% | September 2024(1) | $ | 53 | |||||||||||||||||||||
| Mortgage loan | Hyatt Regency Boston | 4.25% | July 2026 | 127 | ||||||||||||||||||||||
| Mortgage loan | DoubleTree Hotel Spokane City Center | 3.62% | July 2026 | 14 | ||||||||||||||||||||||
| Mortgage loan | Hilton Hawaiian Village Beach Resort | 4.20% | November 2026 | 1,275 | ||||||||||||||||||||||
| Mortgage loan | Hilton Santa Barbara Beachfront Resort | 4.17% | December 2026 | 158 | ||||||||||||||||||||||
| Mortgage loan | DoubleTree Hotel Ontario Airport | 5.37% | May 2027 | 30 | ||||||||||||||||||||||
| 2028 Senior Notes | 5.88% | October 2028 | 725 | |||||||||||||||||||||||
| 2029 Senior Notes | 4.88% | May 2029 | 750 | |||||||||||||||||||||||
| 2030 Senior Notes | 7.00% | February 2030 | 550 | |||||||||||||||||||||||
| Finance lease obligations | 7.66% | 2024 to 2028 | 1 | |||||||||||||||||||||||
| Total Fixed Rate Debt | 5.10%(2) | 3,683 | ||||||||||||||||||||||||
| Variable Rate Debt | ||||||||||||||||||||||||||
Revolver(3) | Unsecured | SOFR + 1.80%(4) | December 2026 | — | ||||||||||||||||||||||
| 2024 Term Loan | Unsecured | SOFR + 1.75%(4) | May 2027 | 200 | ||||||||||||||||||||||
| Total Variable Rate Debt | 7.18% | 200 | ||||||||||||||||||||||||
| Add: unamortized premium | — | |||||||||||||||||||||||||
| Less: unamortized deferred financing costs and discount | (27) | |||||||||||||||||||||||||
Total Debt(5)(6) | 5.21%(2) | $ | 3,856 | |||||||||||||||||||||||
| (dollars in millions) | ||||||||||||||||||||||||||
Projects & Scope of Work | Estimated Start Date | Estimated Completion Date | Budget | |||||||||||||||||||||||
| Hilton Hawaiian Village Waikiki Beach Resort | ||||||||||||||||||||||||||
Phase 1: Renovation of 392 guestrooms and the addition of 12 guestrooms through the conversion of suites to increase room count at the Rainbow Tower to 808 | Q3 2024 | Q1 2025 | $ | 44 | ||||||||||||||||||||||
Phase 2: Renovation of 404 guestrooms and the addition of 14 guestrooms through the conversion of suites to increase room count at the Rainbow Tower to 822 | Q3 2025 | Q1 2026 | $ | 43 | ||||||||||||||||||||||
Lobby renovation: Renovation of the Rainbow Tower lobby | Q3 2025 | Q1 2026 | $ | 1 | ||||||||||||||||||||||
| Hilton Waikoloa Village | ||||||||||||||||||||||||||
Phase 1: Renovation of 197 guestrooms and the addition of 6 guestrooms through the conversion of suites to increase room count at the Palace Tower to 406 | Q3 2024 | Q4 2024 | $ | 32 | ||||||||||||||||||||||
Phase 2: Renovation of 203 guestrooms and the addition of 5 guestrooms through the conversion of suites to increase room count at the Palace Tower to 411 | Q3 2025 | Q4 2025 | $ | 33 | ||||||||||||||||||||||
Lobby renovation: Renovation of the Palace Tower lobby | Q3 2025 | Q4 2025 | $ | 3 | ||||||||||||||||||||||
| Hilton New Orleans Riverside | ||||||||||||||||||||||||||
Phase 1: Renovation of 250 guestrooms at the 1,167-room Main Tower | Q3 2024 | Q4 2024 | $ | 16 | ||||||||||||||||||||||
Phase 2: Renovation of 437 guestrooms at the 1,167-room Main Tower | Q2 2025 | Q4 2025 | $ | 32 | ||||||||||||||||||||||
(unaudited, dollars in millions, except per share amounts and RevPAR) | ||||||||||||||||||||||||||||||||
Full-Year 2024 Outlook as of July 31, 2024 | Full-Year 2024 Outlook as of April 30, 2024 | Change at Midpoint | ||||||||||||||||||||||||||||||
| Metric | Low | High | Low | High | ||||||||||||||||||||||||||||
| Comparable RevPAR | $ | 185 | $ | 187 | $ | 186 | $ | 188 | $ | (1) | ||||||||||||||||||||||
| Comparable RevPAR change vs. 2023 | 3.5 | % | 4.5 | % | 4.0 | % | 5.5 | % | (75) | bps | ||||||||||||||||||||||
| Net income | $ | 155 | $ | 185 | $ | 151 | $ | 191 | $ | (1) | ||||||||||||||||||||||
| Net income attributable to stockholders | $ | 144 | $ | 174 | $ | 140 | $ | 180 | $ | (1) | ||||||||||||||||||||||
Earnings per share – Diluted(1) | $ | 0.69 | $ | 0.83 | $ | 0.66 | $ | 0.85 | $ | 0.01 | ||||||||||||||||||||||
| Operating income | $ | 410 | $ | 441 | $ | 407 | $ | 446 | $ | (1) | ||||||||||||||||||||||
| Operating income margin | 15.6 | % | 16.5 | % | 15.4 | % | 16.6 | % | — | bps | ||||||||||||||||||||||
| Adjusted EBITDA | $ | 660 | $ | 690 | $ | 655 | $ | 695 | $ | — | ||||||||||||||||||||||
Comparable Hotel Adjusted EBITDA margin(1) | 27.3 | % | 28.1 | % | 27.1 | % | 28.1 | % | 10 | bps | ||||||||||||||||||||||
Comparable Hotel Adjusted EBITDA margin change vs. 2023(1) | (50) | bps | 30 | bps | (70) | bps | 30 | bps | 10 | bps | ||||||||||||||||||||||
Adjusted FFO per share – Diluted(1) | $ | 2.10 | $ | 2.26 | $ | 2.07 | $ | 2.27 | $ | 0.01 | ||||||||||||||||||||||
| June 30, 2024 | December 31, 2023 | ||||||||||
| (unaudited) | |||||||||||
| ASSETS | |||||||||||
| Property and equipment, net | $ | 7,422 | $ | 7,459 | |||||||
| Contract asset | 789 | 760 | |||||||||
| Intangibles, net | 42 | 42 | |||||||||
| Cash and cash equivalents | 449 | 717 | |||||||||
| Restricted cash | 35 | 33 | |||||||||
Accounts receivable, net of allowance for doubtful accounts of $4 and $3 | 133 | 112 | |||||||||
| Prepaid expenses | 75 | 59 | |||||||||
| Other assets | 40 | 40 | |||||||||
| Operating lease right-of-use assets | 181 | 197 | |||||||||
TOTAL ASSETS (variable interest entities – $237 and $236) | $ | 9,166 | $ | 9,419 | |||||||
| LIABILITIES AND EQUITY | |||||||||||
| Liabilities | |||||||||||
| Debt | $ | 3,856 | $ | 3,765 | |||||||
| Debt associated with hotels in receivership | 725 | 725 | |||||||||
| Accrued interest associated with hotels in receivership | 64 | 35 | |||||||||
| Accounts payable and accrued expenses | 230 | 210 | |||||||||
| Dividends payable | 58 | 362 | |||||||||
| Due to hotel managers | 111 | 131 | |||||||||
| Other liabilities | 171 | 200 | |||||||||
| Operating lease liabilities | 215 | 223 | |||||||||
Total liabilities (variable interest entities – $217 and $218) | 5,430 | 5,651 | |||||||||
| Stockholders' Equity | |||||||||||
Common stock, par value $0.01 per share, 6,000,000,000 shares authorized, 209,770,362 shares issued and 208,917,170 shares outstanding as of June 30, 2024 and 210,676,264 shares issued and 209,987,581 shares outstanding as of December 31, 2023 | 2 | 2 | |||||||||
| Additional paid-in capital | 4,133 | 4,156 | |||||||||
| Accumulated deficit | (355) | (344) | |||||||||
| Total stockholders' equity | 3,780 | 3,814 | |||||||||
| Noncontrolling interests | (44) | (46) | |||||||||
| Total equity | 3,736 | 3,768 | |||||||||
| TOTAL LIABILITIES AND EQUITY | $ | 9,166 | $ | 9,419 | |||||||
| Three Months Ended June 30, | Six Months Ended June 30, | ||||||||||||||||||||||
| 2024 | 2023 | 2024 | 2023 | ||||||||||||||||||||
| Revenues | |||||||||||||||||||||||
| Rooms | $ | 416 | $ | 442 | $ | 790 | $ | 824 | |||||||||||||||
| Food and beverage | 182 | 178 | 364 | 359 | |||||||||||||||||||
| Ancillary hotel | 66 | 72 | 128 | 137 | |||||||||||||||||||
| Other | 22 | 22 | 43 | 42 | |||||||||||||||||||
| Total revenues | 686 | 714 | 1,325 | 1,362 | |||||||||||||||||||
| Operating expenses | |||||||||||||||||||||||
| Rooms | 105 | 117 | 207 | 224 | |||||||||||||||||||
| Food and beverage | 121 | 128 | 244 | 255 | |||||||||||||||||||
| Other departmental and support | 155 | 165 | 300 | 323 | |||||||||||||||||||
| Other property | 57 | 63 | 109 | 123 | |||||||||||||||||||
| Management fees | 33 | 34 | 63 | 64 | |||||||||||||||||||
| Impairment and casualty loss | 7 | 203 | 13 | 204 | |||||||||||||||||||
| Depreciation and amortization | 64 | 64 | 129 | 128 | |||||||||||||||||||
| Corporate general and administrative | 18 | 16 | 35 | 32 | |||||||||||||||||||
| Other | 20 | 22 | 41 | 42 | |||||||||||||||||||
| Total expenses | 580 | 812 | 1,141 | 1,395 | |||||||||||||||||||
| Gain on sale of assets, net | — | — | — | 15 | |||||||||||||||||||
| Gain on derecognition of assets | 15 | — | 29 | — | |||||||||||||||||||
| Operating income (loss) | 121 | (98) | 213 | (18) | |||||||||||||||||||
| Interest income | 5 | 10 | 10 | 20 | |||||||||||||||||||
| Interest expense | (54) | (52) | (107) | (104) | |||||||||||||||||||
| Interest expense associated with hotels in receivership | (15) | (9) | (29) | (17) | |||||||||||||||||||
| Equity in earnings from investments in affiliates | 1 | 3 | 1 | 7 | |||||||||||||||||||
| Other (loss) gain, net | (3) | 3 | (3) | 4 | |||||||||||||||||||
| Income (loss) before income taxes | 55 | (143) | 85 | (108) | |||||||||||||||||||
| Income tax benefit (expense) | 12 | (3) | 11 | (5) | |||||||||||||||||||
| Net income (loss) | 67 | (146) | 96 | (113) | |||||||||||||||||||
| Net income attributable to noncontrolling interests | (3) | (4) | (4) | (4) | |||||||||||||||||||
| Net income (loss) attributable to stockholders | $ | 64 | $ | (150) | $ | 92 | $ | (117) | |||||||||||||||
| Earnings (loss) per share: | |||||||||||||||||||||||
| Earnings (loss) per share - Basic | $ | 0.31 | $ | (0.70) | $ | 0.44 | $ | (0.54) | |||||||||||||||
| Earnings (loss) per share - Diluted | $ | 0.30 | $ | (0.70) | $ | 0.44 | $ | (0.54) | |||||||||||||||
| Weighted average shares outstanding – Basic | 209 | 215 | 209 | 217 | |||||||||||||||||||
| Weighted average shares outstanding – Diluted | 211 | 215 | 211 | 218 | |||||||||||||||||||
| (unaudited, in millions) | Three Months Ended June 30, | Six Months Ended June 30, | |||||||||||||||||||||
| 2024 | 2023 | 2024 | 2023 | ||||||||||||||||||||
| Net income (loss) | $ | 67 | $ | (146) | $ | 96 | $ | (113) | |||||||||||||||
| Depreciation and amortization expense | 64 | 64 | 129 | 128 | |||||||||||||||||||
| Interest income | (5) | (10) | (10) | (20) | |||||||||||||||||||
| Interest expense | 54 | 52 | 107 | 104 | |||||||||||||||||||
Interest expense associated with hotels in receivership(1) | 15 | 9 | 29 | 17 | |||||||||||||||||||
| Income tax (benefit) expense | (12) | 3 | (11) | 5 | |||||||||||||||||||
| Interest expense, income tax and depreciation and amortization included in equity in earnings from investments in affiliates | 2 | 2 | 5 | 5 | |||||||||||||||||||
| EBITDA | 185 | (26) | 345 | 126 | |||||||||||||||||||
| Gain on sales of assets, net | — | — | — | (15) | |||||||||||||||||||
Gain on derecognition of assets(1) | (15) | — | (29) | — | |||||||||||||||||||
Gain on sale of investments in affiliates(2) | — | (3) | — | (3) | |||||||||||||||||||
| Share-based compensation expense | 5 | 5 | 9 | 9 | |||||||||||||||||||
| Impairment and casualty loss | 7 | 203 | 13 | 204 | |||||||||||||||||||
| Other items | 11 | 8 | 17 | 12 | |||||||||||||||||||
| Adjusted EBITDA | $ | 193 | $ | 187 | $ | 355 | $ | 333 | |||||||||||||||
| (unaudited, dollars in millions) | Three Months Ended June 30, | Six Months Ended June 30, | |||||||||||||||||||||
| 2024 | 2023 | 2024 | 2023 | ||||||||||||||||||||
| Adjusted EBITDA | $ | 193 | $ | 187 | $ | 355 | $ | 333 | |||||||||||||||
| Less: Adjusted EBITDA from investments in affiliates | (8) | (8) | (16) | (15) | |||||||||||||||||||
Add: All other(1) | 14 | 13 | 29 | 26 | |||||||||||||||||||
| Hotel Adjusted EBITDA | 199 | 192 | 368 | 344 | |||||||||||||||||||
| Less: Adjusted EBITDA from hotels disposed of | — | (1) | (1) | (3) | |||||||||||||||||||
| Less: Adjusted EBITDA from the Hilton San Francisco Hotels | — | 1 | — | (4) | |||||||||||||||||||
| Comparable Hotel Adjusted EBITDA | $ | 199 | $ | 192 | $ | 367 | $ | 337 | |||||||||||||||
| Three Months Ended June 30, | Six Months Ended June 30, | ||||||||||||||||||||||
| 2024 | 2023 | 2024 | 2023 | ||||||||||||||||||||
| Total Revenues | $ | 686 | $ | 714 | $ | 1,325 | $ | 1,362 | |||||||||||||||
| Less: Other revenue | (22) | (22) | (43) | (42) | |||||||||||||||||||
| Less: Revenues from hotels disposed of | — | (3) | — | (10) | |||||||||||||||||||
| Less: Revenues from the Hilton San Francisco Hotels | — | (46) | — | (94) | |||||||||||||||||||
| Comparable Hotel Revenues | $ | 664 | $ | 643 | $ | 1,282 | $ | 1,216 | |||||||||||||||
| Three Months Ended June 30, | Six Months Ended June 30, | ||||||||||||||||||||||||||||||||||
| 2024 | 2023 | Change(2) | 2024 | 2023 | Change(2) | ||||||||||||||||||||||||||||||
| Total Revenues | $ | 686 | $ | 714 | (4.0) | % | $ | 1,325 | $ | 1,362 | (2.7) | % | |||||||||||||||||||||||
| Operating income (loss) | $ | 121 | $ | (98) | 223.0 | % | $ | 213 | $ | (18) | 1,315.2 | % | |||||||||||||||||||||||
Operating income (loss) margin(2) | 17.5 | % | (13.7 | %) | 3,120 | bps | 16.1 | % | (1.3 | %) | 1,740 | bps | |||||||||||||||||||||||
| Comparable Hotel Revenues | $ | 664 | $ | 643 | 3.2 | % | $ | 1,282 | $ | 1,216 | 5.4 | % | |||||||||||||||||||||||
| Comparable Hotel Adjusted EBITDA | $ | 199 | $ | 192 | 3.4 | % | $ | 367 | $ | 337 | 8.8 | % | |||||||||||||||||||||||
Comparable Hotel Adjusted EBITDA margin(2) | 29.9 | % | 29.8 | % | 10 | bps | 28.6 | % | 27.7 | % | 90 | bps | |||||||||||||||||||||||
| Three Months Ended June 30, | Six Months Ended June 30, | ||||||||||||||||||||||
| 2024 | 2023 | 2024 | 2023 | ||||||||||||||||||||
| Net income (loss) attributable to stockholders | $ | 64 | $ | (150) | $ | 92 | $ | (117) | |||||||||||||||
| Depreciation and amortization expense | 64 | 64 | 129 | 128 | |||||||||||||||||||
| Depreciation and amortization expense attributable to noncontrolling interests | (1) | (1) | (2) | (2) | |||||||||||||||||||
| Gain on sales of assets, net | — | — | — | (15) | |||||||||||||||||||
Gain on derecognition of assets(1) | (15) | — | (29) | — | |||||||||||||||||||
Gain on sale of investments in affiliates(2) | — | (3) | — | (3) | |||||||||||||||||||
| Impairment loss | 7 | 202 | 12 | 202 | |||||||||||||||||||
| Equity investment adjustments: | |||||||||||||||||||||||
| Equity in earnings from investments in affiliates | (1) | (3) | (1) | (7) | |||||||||||||||||||
| Pro rata FFO of investments in affiliates | 4 | 5 | 5 | 10 | |||||||||||||||||||
| Nareit FFO attributable to stockholders | 122 | 114 | 206 | 196 | |||||||||||||||||||
| Casualty loss | — | 1 | 1 | 2 | |||||||||||||||||||
| Share-based compensation expense | 5 | 5 | 9 | 9 | |||||||||||||||||||
Interest expense associated with hotels in receivership(1) | 15 | — | 29 | — | |||||||||||||||||||
Other items | (5) | 9 | 3 | 14 | |||||||||||||||||||
| Adjusted FFO attributable to stockholders | $ | 137 | $ | 129 | $ | 248 | $ | 221 | |||||||||||||||
Nareit FFO per share – Diluted(3) | $ | 0.58 | $ | 0.53 | $ | 0.98 | $ | 0.90 | |||||||||||||||
Adjusted FFO per share – Diluted(3) | $ | 0.65 | $ | 0.60 | $ | 1.18 | $ | 1.01 | |||||||||||||||
| Weighted average shares outstanding – Diluted | 211 | 215 | 211 | 218 | |||||||||||||||||||
| (unaudited, in millions) | |||||
June 30, 2024 | |||||
| Debt | $ | 3,856 | |||
| Add: unamortized deferred financing costs and discount | 27 | ||||
| Less: unamortized premium | — | ||||
| Debt, excluding unamortized deferred financing cost, premiums and discounts | 3,883 | ||||
Add: Park's share of unconsolidated affiliates debt, excluding unamortized deferred financing costs(1) | 157 | ||||
| Less: cash and cash equivalents | (449) | ||||
| Less: restricted cash | (35) | ||||
| Net Debt | $ | 3,556 | |||
| (unaudited, in millions) | Year Ending | ||||||||||
| December 31, 2024 | |||||||||||
Low Case | High Case | ||||||||||
| Net income | $ | 155 | $ | 185 | |||||||
| Depreciation and amortization expense | 258 | 258 | |||||||||
| Interest income | (21) | (21) | |||||||||
| Interest expense | 213 | 213 | |||||||||
| Interest expense associated with hotels in receivership | 60 | 60 | |||||||||
| Income tax expense | (10) | (10) | |||||||||
| Interest expense, income tax and depreciation and amortization included in equity in earnings from investments in affiliates | 12 | 12 | |||||||||
| EBITDA | 667 | 697 | |||||||||
| Gain on derecognition of assets | (60) | (60) | |||||||||
| Share-based compensation expense | 18 | 18 | |||||||||
| Impairment and casualty loss | 13 | 13 | |||||||||
| Other items | 22 | 22 | |||||||||
| Adjusted EBITDA | 660 | 690 | |||||||||
| Less: Adjusted EBITDA from investments in affiliates | (21) | (21) | |||||||||
| Add: All other | 56 | 57 | |||||||||
| Comparable Hotel Adjusted EBITDA | $ | 695 | $ | 726 | |||||||
| Year Ending | |||||||||||
| December 31, 2024 | |||||||||||
| Low Case | High Case | ||||||||||
| Total Revenues | $ | 2,634 | $ | 2,670 | |||||||
| Less: Other revenue | (92) | (92) | |||||||||
| Comparable Hotel Revenues | $ | 2,542 | $ | 2,578 | |||||||
| Year Ending | |||||||||||
| December 31, 2024 | |||||||||||
| Low Case | High Case | ||||||||||
| Total Revenues | $ | 2,634 | $ | 2,670 | |||||||
| Operating income | $ | 410 | $ | 441 | |||||||
Operating income margin(1) | 15.6 | % | 16.5 | % | |||||||
| Comparable Hotel Revenues | $ | 2,542 | $ | 2,578 | |||||||
| Comparable Hotel Adjusted EBITDA | $ | 695 | $ | 726 | |||||||
Comparable Hotel Adjusted EBITDA margin(1) | 27.3 | % | 28.1 | % | |||||||
| (unaudited, in millions except per share data) | Year Ending | ||||||||||
| December 31, 2024 | |||||||||||
| Low Case | High Case | ||||||||||
| Net income attributable to stockholders | $ | 144 | $ | 174 | |||||||
| Depreciation and amortization expense | 258 | 258 | |||||||||
| Depreciation and amortization expense attributable to noncontrolling interests | (5) | (5) | |||||||||
| Gain on derecognition of assets | (60) | (60) | |||||||||
| Impairment loss | 12 | 12 | |||||||||
| Equity investment adjustments: | |||||||||||
| Equity in earnings from investments in affiliates | — | — | |||||||||
| Pro rata FFO of equity investments | 8 | 8 | |||||||||
| Nareit FFO attributable to stockholders | 357 | 387 | |||||||||
| Casualty loss | 1 | 1 | |||||||||
| Share-based compensation expense | 18 | 18 | |||||||||
| Interest expense associated with hotels in receivership | 60 | 60 | |||||||||
| Other items | 7 | 9 | |||||||||
| Adjusted FFO attributable to stockholders | $ | 443 | $ | 475 | |||||||
Adjusted FFO per share – Diluted(1) | $ | 2.10 | $ | 2.26 | |||||||
| Weighted average diluted shares outstanding | 210 | 210 | |||||||||
| About Park and Safe Harbor Disclosure | ||||||||
2 |  | |||||||
 | ||||||||||||||
| Table of Contents | ||||||||||||||
3. Outlook and Assumptions | ||||||||||||||
3 | | |||||||
| Financial Statements | |||||
4 | | |||||||
| Financial Statements | ||||||||
Condensed Consolidated Balance Sheets | ||||||||
| (in millions, except share and per share data) | June 30, 2024 | December 31, 2023 | |||||||||
| (unaudited) | |||||||||||
| ASSETS | |||||||||||
| Property and equipment, net | $ | 7,422 | $ | 7,459 | |||||||
| Contract asset | 789 | 760 | |||||||||
| Intangibles, net | 42 | 42 | |||||||||
| Cash and cash equivalents | 449 | 717 | |||||||||
| Restricted cash | 35 | 33 | |||||||||
Accounts receivable, net of allowance for doubtful accounts of $4 and $3 | 133 | 112 | |||||||||
| Prepaid expenses | 75 | 59 | |||||||||
| Other assets | 40 | 40 | |||||||||
| Operating lease right-of-use assets | 181 | 197 | |||||||||
TOTAL ASSETS (variable interest entities – $237 and $236) | $ | 9,166 | $ | 9,419 | |||||||
| LIABILITIES AND EQUITY | |||||||||||
| Liabilities | |||||||||||
| Debt | $ | 3,856 | $ | 3,765 | |||||||
| Debt associated with hotels in receivership | 725 | 725 | |||||||||
| Accrued interest associated with hotels in receivership | 64 | 35 | |||||||||
| Accounts payable and accrued expenses | 230 | 210 | |||||||||
| Dividends payable | 58 | 362 | |||||||||
| Due to hotel managers | 111 | 131 | |||||||||
| Other liabilities | 171 | 200 | |||||||||
| Operating lease liabilities | 215 | 223 | |||||||||
Total liabilities (variable interest entities – $217 and $218) | 5,430 | 5,651 | |||||||||
| Stockholders' Equity | |||||||||||
Common stock, par value $0.01 per share, 6,000,000,000 shares authorized, 209,770,362 shares issued and 208,917,170 shares outstanding as of June 30, 2024 and 210,676,264 shares issued and 209,987,581 shares outstanding as of December 31, 2023 | 2 | 2 | |||||||||
| Additional paid-in capital | 4,133 | 4,156 | |||||||||
| Accumulated deficit | (355) | (344) | |||||||||
| Total stockholders' equity | 3,780 | 3,814 | |||||||||
| Noncontrolling interests | (44) | (46) | |||||||||
| Total equity | 3,736 | 3,768 | |||||||||
| TOTAL LIABILITIES AND EQUITY | $ | 9,166 | $ | 9,419 | |||||||
5 | | |||||||
| Financial Statements (continued) | ||||||||
Condensed Consolidated Statements of Operations | ||||||||
| (unaudited, in millions, except per share data) | ||||||||
| Three Months Ended June 30, | Six Months Ended June 30, | ||||||||||||||||||||||
| 2024 | 2023 | 2024 | 2023 | ||||||||||||||||||||
| Revenues | |||||||||||||||||||||||
| Rooms | $ | 416 | $ | 442 | $ | 790 | $ | 824 | |||||||||||||||
| Food and beverage | 182 | 178 | 364 | 359 | |||||||||||||||||||
| Ancillary hotel | 66 | 72 | 128 | 137 | |||||||||||||||||||
| Other | 22 | 22 | 43 | 42 | |||||||||||||||||||
| Total revenues | 686 | 714 | 1,325 | 1,362 | |||||||||||||||||||
| Operating expenses | |||||||||||||||||||||||
| Rooms | 105 | 117 | 207 | 224 | |||||||||||||||||||
| Food and beverage | 121 | 128 | 244 | 255 | |||||||||||||||||||
| Other departmental and support | 155 | 165 | 300 | 323 | |||||||||||||||||||
| Other property | 57 | 63 | 109 | 123 | |||||||||||||||||||
| Management fees | 33 | 34 | 63 | 64 | |||||||||||||||||||
| Impairment and casualty loss | 7 | 203 | 13 | 204 | |||||||||||||||||||
| Depreciation and amortization | 64 | 64 | 129 | 128 | |||||||||||||||||||
| Corporate general and administrative | 18 | 16 | 35 | 32 | |||||||||||||||||||
| Other | 20 | 22 | 41 | 42 | |||||||||||||||||||
| Total expenses | 580 | 812 | 1,141 | 1,395 | |||||||||||||||||||
| Gain on sale of assets, net | — | — | — | 15 | |||||||||||||||||||
| Gain on derecognition of assets | 15 | — | 29 | — | |||||||||||||||||||
| Operating income (loss) | 121 | (98) | 213 | (18) | |||||||||||||||||||
| Interest income | 5 | 10 | 10 | 20 | |||||||||||||||||||
| Interest expense | (54) | (52) | (107) | (104) | |||||||||||||||||||
| Interest expense associated with hotels in receivership | (15) | (9) | (29) | (17) | |||||||||||||||||||
| Equity in earnings from investments in affiliates | 1 | 3 | 1 | 7 | |||||||||||||||||||
| Other (loss) gain, net | (3) | 3 | (3) | 4 | |||||||||||||||||||
| Income (loss) before income taxes | 55 | (143) | 85 | (108) | |||||||||||||||||||
| Income tax benefit (expense) | 12 | (3) | 11 | (5) | |||||||||||||||||||
| Net income (loss) | 67 | (146) | 96 | (113) | |||||||||||||||||||
| Net income attributable to noncontrolling interests | (3) | (4) | (4) | (4) | |||||||||||||||||||
| Net income (loss) attributable to stockholders | $ | 64 | $ | (150) | $ | 92 | $ | (117) | |||||||||||||||
| Earnings (loss) per share: | |||||||||||||||||||||||
| Earnings (loss) per share – Basic | $ | 0.31 | $ | (0.70) | $ | 0.44 | $ | (0.54) | |||||||||||||||
| Earnings (loss) per share – Diluted | $ | 0.30 | $ | (0.70) | $ | 0.44 | $ | (0.54) | |||||||||||||||
| Weighted average shares outstanding – Basic | 209 | 215 | 209 | 217 | |||||||||||||||||||
| Weighted average shares outstanding – Diluted | 211 | 215 | 211 | 218 | |||||||||||||||||||
6 | | |||||||
| Supplementary Financial Information | |||||

7 | | |||||||
| Supplementary Financial Information | ||||||||
| EBITDA and Adjusted EBITDA | ||||||||
| (unaudited, in millions) | Three Months Ended June 30, | Six Months Ended June 30, | |||||||||||||||||||||
| 2024 | 2023 | 2024 | 2023 | ||||||||||||||||||||
| Net income (loss) | $ | 67 | $ | (146) | $ | 96 | $ | (113) | |||||||||||||||
| Depreciation and amortization expense | 64 | 64 | 129 | 128 | |||||||||||||||||||
| Interest income | (5) | (10) | (10) | (20) | |||||||||||||||||||
| Interest expense | 54 | 52 | 107 | 104 | |||||||||||||||||||
Interest expense associated with hotels in receivership(1) | 15 | 9 | 29 | 17 | |||||||||||||||||||
| Income tax (benefit) expense | (12) | 3 | (11) | 5 | |||||||||||||||||||
Interest expense, income tax and depreciation and amortization included in equity in earnings from investments in affiliates | 2 | 2 | 5 | 5 | |||||||||||||||||||
| EBITDA | 185 | (26) | 345 | 126 | |||||||||||||||||||
| Gain on sale of assets, net | — | — | — | (15) | |||||||||||||||||||
Gain on derecognition of assets(1) | (15) | — | (29) | — | |||||||||||||||||||
Gain on sale of investments in affiliates(2) | — | (3) | — | (3) | |||||||||||||||||||
| Share-based compensation expense | 5 | 5 | 9 | 9 | |||||||||||||||||||
| Impairment and casualty loss | 7 | 203 | 13 | 204 | |||||||||||||||||||
| Other items | 11 | 8 | 17 | 12 | |||||||||||||||||||
| Adjusted EBITDA | $ | 193 | $ | 187 | $ | 355 | $ | 333 | |||||||||||||||
8 | | |||||||
| Supplementary Financial Information (continued) | ||||||||
Comparable Hotel Adjusted EBITDA and Comparable Hotel Adjusted EBITDA Margin | ||||||||
| (unaudited, dollars in millions) | |||||||||||||||||||||||
| Three Months Ended June 30, | Six Months Ended June 30, | ||||||||||||||||||||||
| 2024 | 2023 | 2024 | 2023 | ||||||||||||||||||||
| Adjusted EBITDA | $ | 193 | $ | 187 | $ | 355 | $ | 333 | |||||||||||||||
| Less: Adjusted EBITDA from investments in affiliates | (8) | (8) | (16) | (15) | |||||||||||||||||||
Add: All other(1) | 14 | 13 | 29 | 26 | |||||||||||||||||||
| Hotel Adjusted EBITDA | 199 | 192 | 368 | 344 | |||||||||||||||||||
| Less: Adjusted EBITDA from hotels disposed of | — | (1) | (1) | (3) | |||||||||||||||||||
| Less: Adjusted EBITDA from the Hilton San Francisco Hotels | — | 1 | — | (4) | |||||||||||||||||||
Comparable Hotel Adjusted EBITDA | $ | 199 | $ | 192 | $ | 367 | $ | 337 | |||||||||||||||
| Three Months Ended June 30, | Six Months Ended June 30, | ||||||||||||||||||||||
| 2024 | 2023 | 2024 | 2023 | ||||||||||||||||||||
| Total Revenues | $ | 686 | $ | 714 | $ | 1,325 | $ | 1,362 | |||||||||||||||
| Less: Other revenue | (22) | (22) | (43) | (42) | |||||||||||||||||||
| Less: Revenues from hotels disposed of | — | (3) | — | (10) | |||||||||||||||||||
| Less: Revenue from the Hilton San Francisco Hotels | — | (46) | — | (94) | |||||||||||||||||||
Comparable Hotel Revenues | $ | 664 | $ | 643 | $ | 1,282 | $ | 1,216 | |||||||||||||||
| Three Months Ended June 30, | Six Months Ended June 30, | ||||||||||||||||||||||||||||||||||
| 2024 | 2023 | Change(2) | 2024 | 2023 | Change(2) | ||||||||||||||||||||||||||||||
| Total Revenues | $ | 686 | $ | 714 | (4.0) | % | $ | 1,325 | $ | 1,362 | (2.7) | % | |||||||||||||||||||||||
| Operating income (loss) | $ | 121 | $ | (98) | 223.0 | % | $ | 213 | $ | (18) | 1,315.2 | % | |||||||||||||||||||||||
Operating income (loss) margin(2) | 17.5 | % | (13.7 | %) | 3,120 | bps | 16.1 | % | (1.3 | %) | 1,740 | bps | |||||||||||||||||||||||
Comparable Hotel Revenues | $ | 664 | $ | 643 | 3.2 | % | $ | 1,282 | $ | 1,216 | 5.4 | % | |||||||||||||||||||||||
Comparable Hotel Adjusted EBITDA | $ | 199 | $ | 192 | 3.4 | % | $ | 367 | $ | 337 | 8.8 | % | |||||||||||||||||||||||
Comparable Hotel Adjusted EBITDA margin(2) | 29.9 | % | 29.8 | % | 10 | bps | 28.6 | % | 27.7 | % | 90 | bps | |||||||||||||||||||||||
9 | | |||||||
| Supplementary Financial Information (continued) | ||||||||
| Nareit FFO and Adjusted FFO | ||||||||
(unaudited, in millions, except per share data) | Three Months Ended June 30, | Six Months Ended June 30, | |||||||||||||||||||||
| 2024 | 2023 | 2023 | 2022 | ||||||||||||||||||||
| Net income (loss) attributable to stockholders | $ | 64 | $ | (150) | $ | 92 | $ | (117) | |||||||||||||||
| Depreciation and amortization expense | 64 | 64 | 129 | 128 | |||||||||||||||||||
Depreciation and amortization expense attributable to noncontrolling interests | (1) | (1) | (2) | (2) | |||||||||||||||||||
| Gain on sale of assets, net | — | — | — | (15) | |||||||||||||||||||
Gain on derecognition of assets(1) | (15) | — | (29) | — | |||||||||||||||||||
Gain on sale of investments in affiliates(2) | — | (3) | — | (3) | |||||||||||||||||||
| Impairment loss | 7 | 202 | 12 | 202 | |||||||||||||||||||
| Equity investment adjustments: | |||||||||||||||||||||||
| Equity in earnings from investments in affiliates | (1) | (3) | (1) | (7) | |||||||||||||||||||
| Pro rata FFO of investments in affiliates | 4 | 5 | 5 | 10 | |||||||||||||||||||
| Nareit FFO attributable to stockholders | 122 | 114 | 206 | 196 | |||||||||||||||||||
| Casualty loss | — | 1 | 1 | 2 | |||||||||||||||||||
| Share-based compensation expense | 5 | 5 | 9 | 9 | |||||||||||||||||||
Interest expense associated with hotels in receivership(1) | 15 | — | 29 | — | |||||||||||||||||||
| Other items | (5) | 9 | 3 | 14 | |||||||||||||||||||
| Adjusted FFO attributable to stockholders | $ | 137 | $ | 129 | $ | 248 | $ | 221 | |||||||||||||||
Nareit FFO per share – Diluted(3) | $ | 0.58 | $ | 0.53 | $ | 0.98 | $ | 0.90 | |||||||||||||||
Adjusted FFO per share – Diluted(3) | $ | 0.65 | $ | 0.60 | $ | 1.18 | $ | 1.01 | |||||||||||||||
Weighted average shares outstanding – Diluted(4) | 211 | 215 | 211 | 218 | |||||||||||||||||||
10 | | |||||||
| Supplementary Financial Information (continued) | ||||||||
| General and Administrative Expenses | ||||||||
| (unaudited, in millions) | Three Months Ended June 30, | Six Months Ended June 30, | |||||||||||||||||||||
| 2024 | 2023 | 2024 | 2023 | ||||||||||||||||||||
| Corporate general and administrative expenses | $ | 18 | $ | 16 | $ | 35 | $ | 32 | |||||||||||||||
| Less: | |||||||||||||||||||||||
| Share-based compensation expense | 5 | 5 | 9 | 9 | |||||||||||||||||||
| Other items | 2 | 1 | 2 | 2 | |||||||||||||||||||
| G&A, excluding expenses not included in Adjusted EBITDA | $ | 11 | $ | 10 | $ | 24 | $ | 21 | |||||||||||||||
11 | | |||||||
| Supplementary Financial Information (continued) | ||||||||
Net Debt and Net Debt to Comparable Adjusted EBITDA Ratio(1) | ||||||||
| (unaudited, in millions) | |||||||||||
June 30, 2024 | December 31, 2023 | ||||||||||
| Debt | $ | 3,856 | $ | 3,765 | |||||||
| Add: unamortized deferred financing costs and discount | 27 | 22 | |||||||||
| Less: unamortized premium | — | (1) | |||||||||
Debt, excluding unamortized deferred financing cost, premiums and discounts | 3,883 | 3,786 | |||||||||
Add: Park's share of unconsolidated affiliates debt, excluding unamortized deferred financing costs(1) | 157 | 147 | |||||||||
Less: cash and cash equivalents(2) | (449) | (555) | |||||||||
| Less: restricted cash | (35) | (33) | |||||||||
| Net Debt | $ | 3,556 | $ | 3,345 | |||||||
TTM Comparable Adjusted EBITDA(3) | $ | 677 | $ | 649 | |||||||
| Net Debt to TTM Comparable Adjusted EBITDA ratio | 5.25x | 5.15x | |||||||||
12 | | |||||||
| Outlook and Assumptions | |||||

13 | | |||||||
| Outlook and Assumptions | ||||||||
| Full-Year 2024 Outlook | ||||||||
Park has revised its full-year 2024 operating results to be as follows: | ||||||||||||||||||||||||||||||||
| (unaudited, dollars in millions, except per share amounts and RevPAR) | ||||||||||||||||||||||||||||||||
Full-Year 2024 Outlook as of July 31, 2024 | Full-Year 2024 Outlook as of April 30, 2024 | Change at Midpoint | ||||||||||||||||||||||||||||||
| Metric | Low | High | Low | High | ||||||||||||||||||||||||||||
| Comparable RevPAR | $ | 185 | $ | 187 | $ | 186 | $ | 188 | $ | (1) | ||||||||||||||||||||||
| Comparable RevPAR change vs. 2023 | 3.5 | % | 4.5 | % | 4.0 | % | 5.5 | % | (75) | bps | ||||||||||||||||||||||
| Net income | $ | 155 | $ | 185 | $ | 151 | $ | 191 | $ | (1) | ||||||||||||||||||||||
| Net income attributable to stockholders | $ | 144 | $ | 174 | $ | 140 | $ | 180 | $ | (1) | ||||||||||||||||||||||
Earnings per share – Diluted(1) | $ | 0.69 | $ | 0.83 | $ | 0.66 | $ | 0.85 | $ | 0.01 | ||||||||||||||||||||||
| Operating income | $ | 410 | $ | 441 | $ | 407 | $ | 446 | $ | (1) | ||||||||||||||||||||||
| Operating income margin | 15.6 | % | 16.5 | % | 15.4 | % | 16.6 | % | — | bps | ||||||||||||||||||||||
| Adjusted EBITDA | $ | 660 | $ | 690 | $ | 655 | $ | 695 | $ | — | ||||||||||||||||||||||
Comparable Hotel Adjusted EBITDA margin(1) | 27.3 | % | 28.1 | % | 27.1 | % | 28.1 | % | 10 | bps | ||||||||||||||||||||||
Comparable Hotel Adjusted EBITDA margin change vs. 2023(1) | (50) | bps | 30 | bps | (70) | bps | 30 | bps | 10 | bps | ||||||||||||||||||||||
Adjusted FFO per share – Diluted(1) | $ | 2.10 | $ | 2.26 | $ | 2.07 | $ | 2.27 | $ | 0.01 | ||||||||||||||||||||||
14 | | |||||||
| Outlook and Assumptions (continued) | ||||||||
| EBITDA, Adjusted EBITDA, Comparable Hotel Adjusted EBITDA and Comparable Hotel Adjusted EBITDA Margin | ||||||||
| Year Ending | |||||||||||
| (unaudited, in millions) | December 31, 2024 | ||||||||||
| Low Case | High Case | ||||||||||
| Net income | $ | 155 | $ | 185 | |||||||
| Depreciation and amortization expense | 258 | 258 | |||||||||
| Interest income | (21) | (21) | |||||||||
| Interest expense | 213 | 213 | |||||||||
| Interest expense associated with hotels in receivership | 60 | 60 | |||||||||
| Income tax expense | (10) | (10) | |||||||||
| Interest expense, income tax and depreciation and amortization included in equity in earnings from investments in affiliates | 12 | 12 | |||||||||
| EBITDA | 667 | 697 | |||||||||
| Gain on derecognition of assets | (60) | (60) | |||||||||
| Share-based compensation expense | 18 | 18 | |||||||||
| Impairment and casualty loss | 13 | 13 | |||||||||
| Other items | 22 | 22 | |||||||||
| Adjusted EBITDA | 660 | 690 | |||||||||
| Less: Adjusted EBITDA from investments in affiliates | (21) | (21) | |||||||||
| Add: All other | 56 | 57 | |||||||||
| Comparable Hotel Adjusted EBITDA | $ | 695 | $ | 726 | |||||||
| Year Ending | |||||||||||
| December 31, 2024 | |||||||||||
| Low Case | High Case | ||||||||||
| Total Revenues | $ | 2,634 | $ | 2,670 | |||||||
| Less: Other revenue | (92) | (92) | |||||||||
| Comparable Hotel Revenues | $ | 2,542 | $ | 2,578 | |||||||
| Year Ending | |||||||||||
| December 31, 2024 | |||||||||||
| Low Case | High Case | ||||||||||
| Total Revenues | $ | 2,634 | $ | 2,670 | |||||||
| Operating income | $ | 410 | $ | 441 | |||||||
Operating income margin(1) | 15.6 | % | 16.5 | % | |||||||
| Comparable Hotel Revenues | $ | 2,542 | $ | 2,578 | |||||||
| Comparable Hotel Adjusted EBITDA | $ | 695 | $ | 726 | |||||||
Comparable Hotel Adjusted EBITDA margin(1) | 27.3 | % | 28.1 | % | |||||||
15 | | |||||||
| Outlook and Assumptions (continued) | ||||||||
| Nareit FFO and Adjusted FFO | ||||||||
| Year Ending | |||||||||||
| (unaudited, in millions except per share data) | December 31, 2024 | ||||||||||
| Low Case | High Case | ||||||||||
| Net income attributable to stockholders | $ | 144 | $ | 174 | |||||||
| Depreciation and amortization expense | 258 | 258 | |||||||||
| Depreciation and amortization expense attributable to noncontrolling interests | (5) | (5) | |||||||||
| Gain on derecognition of assets | (60) | (60) | |||||||||
| Impairment loss | 12 | 12 | |||||||||
| Equity investment adjustments: | |||||||||||
| Equity in earnings from investments in affiliates | — | — | |||||||||
| Pro rata FFO of equity investments | 8 | 8 | |||||||||
| Nareit FFO attributable to stockholders | 357 | 387 | |||||||||
| Casualty loss | 1 | 1 | |||||||||
| Share-based compensation expense | 18 | 18 | |||||||||
| Interest expense associated with hotels in receivership | 60 | 60 | |||||||||
Other items | 7 | 9 | |||||||||
| Adjusted FFO attributable to stockholders | $ | 443 | $ | 475 | |||||||
Adjusted FFO per share – Diluted(1) | $ | 2.10 | $ | 2.26 | |||||||
| Weighted average diluted shares outstanding | 210 | 210 | |||||||||
16 | | |||||||
Portfolio and Operating Metrics | |||||
17 | | |||||||
| Portfolio and Operating Metrics | ||||||||
Hotel Portfolio as of July 31, 2024 | ||||||||
| Hotel Name | Total Rooms | Market | Meeting Space (square feet) | Ownership | Equity Ownership | Debt (in millions) | |||||||||||||||||||||||||||||
| Comparable Portfolio | |||||||||||||||||||||||||||||||||||
| Hilton Hawaiian Village Waikiki Beach Resort | 2,860 | Hawaii | 150,000 | Fee Simple | 100% | $ | 1,275 | ||||||||||||||||||||||||||||
| New York Hilton Midtown | 1,878 | New York | 151,000 | Fee Simple | 100% | — | |||||||||||||||||||||||||||||
| Hilton New Orleans Riverside | 1,622 | New Orleans | 158,000 | Fee Simple | 100% | — | |||||||||||||||||||||||||||||
| Hilton Chicago | 1,544 | Chicago | 234,000 | Fee Simple | 100% | — | |||||||||||||||||||||||||||||
| Signia by Hilton Orlando Bonnet Creek | 1,009 | Orlando | 234,000 | Fee Simple | 100% | — | |||||||||||||||||||||||||||||
| DoubleTree Hotel Seattle Airport | 850 | Seattle | 41,000 | Leasehold | 100% | — | |||||||||||||||||||||||||||||
| Hilton Orlando Lake Buena Vista | 814 | Orlando | 86,000 | Leasehold | 100% | — | |||||||||||||||||||||||||||||
| Caribe Hilton | 652 | Puerto Rico | 65,000 | Fee Simple | 100% | — | |||||||||||||||||||||||||||||
| Hilton Waikoloa Village | 647 | Hawaii | 241,000 | Fee Simple | 100% | — | |||||||||||||||||||||||||||||
| DoubleTree Hotel Washington DC – Crystal City | 627 | Washington, D.C. | 36,000 | Fee Simple | 100% | — | |||||||||||||||||||||||||||||
| Hilton Denver City Center | 613 | Denver | 50,000 | Fee Simple | 100% | $ | 53 | ||||||||||||||||||||||||||||
| Hilton Boston Logan Airport | 604 | Boston | 30,000 | Leasehold | 100% | — | |||||||||||||||||||||||||||||
| W Chicago – Lakeshore | 520 | Chicago | 20,000 | Fee Simple | 100% | — | |||||||||||||||||||||||||||||
| DoubleTree Hotel San Jose | 505 | Other U.S. | 48,000 | Fee Simple | 100% | — | |||||||||||||||||||||||||||||
| Hyatt Regency Boston | 502 | Boston | 30,000 | Fee Simple | 100% | $ | 127 | ||||||||||||||||||||||||||||
| Waldorf Astoria Orlando | 502 | Orlando | 62,000 | Fee Simple | 100% | — | |||||||||||||||||||||||||||||
| Hilton Salt Lake City Center | 500 | Other U.S. | 24,000 | Leasehold | 100% | — | |||||||||||||||||||||||||||||
| DoubleTree Hotel Ontario Airport | 482 | Southern California | 27,000 | Fee Simple | 67% | $ | 30 | ||||||||||||||||||||||||||||
| Hilton McLean Tysons Corner | 458 | Washington, D.C. | 28,000 | Fee Simple | 100% | — | |||||||||||||||||||||||||||||
| Hyatt Regency Mission Bay Spa and Marina | 438 | Southern California | 24,000 | Leasehold | 100% | — | |||||||||||||||||||||||||||||
| Boston Marriott Newton | 430 | Boston | 34,000 | Fee Simple | 100% | — | |||||||||||||||||||||||||||||
| W Chicago – City Center | 403 | Chicago | 13,000 | Fee Simple | 100% | — | |||||||||||||||||||||||||||||
| Hilton Seattle Airport & Conference Center | 396 | Seattle | 40,000 | Leasehold | 100% | — | |||||||||||||||||||||||||||||
| Royal Palm South Beach Miami, a Tribute Portfolio Resort | 393 | Miami | 11,000 | Fee Simple | 100% | — | |||||||||||||||||||||||||||||
| DoubleTree Hotel Spokane City Center | 375 | Other U.S. | 21,000 | Fee Simple | 10% | $ | 14 | ||||||||||||||||||||||||||||
| Hilton Santa Barbara Beachfront Resort | 360 | Southern California | 62,000 | Fee Simple | 50% | $ | 158 | ||||||||||||||||||||||||||||
Hilton Oakland Airport(2) | 360 | Other U.S. | 15,000 | Leasehold | 100% | — | |||||||||||||||||||||||||||||
| JW Marriott San Francisco Union Square | 344 | San Francisco | 12,000 | Leasehold | 100% | — | |||||||||||||||||||||||||||||
| Hyatt Centric Fisherman's Wharf | 316 | San Francisco | 19,000 | Fee Simple | 100% | — | |||||||||||||||||||||||||||||
| Hilton Short Hills | 314 | Other U.S. | 21,000 | Fee Simple | 100% | — | |||||||||||||||||||||||||||||
| Casa Marina Key West, Curio Collection | 311 | Key West | 53,000 | Fee Simple | 100% | — | |||||||||||||||||||||||||||||
18 | | |||||||
| Portfolio and Operating Metrics (continued) | ||||||||
Hotel Portfolio as of July 31, 2024 | ||||||||
| Hotel Name | Total Rooms | Market | Meeting Space (square feet) | Ownership | Equity Ownership | Debt(1) (in millions) | |||||||||||||||||||||||||||||
| Comparable Portfolio (continued) | |||||||||||||||||||||||||||||||||||
| DoubleTree Hotel San Diego – Mission Valley | 300 | Southern California | 24,000 | Leasehold | 100% | — | |||||||||||||||||||||||||||||
| Embassy Suites Kansas City Plaza | 266 | Other U.S. | 11,000 | Leasehold | 100% | — | |||||||||||||||||||||||||||||
| Embassy Suites Austin Downtown South Congress | 262 | Other U.S. | 2,000 | Leasehold | 100% | — | |||||||||||||||||||||||||||||
| DoubleTree Hotel Sonoma Wine Country | 245 | Other U.S. | 27,000 | Leasehold | 100% | — | |||||||||||||||||||||||||||||
| Juniper Hotel Cupertino, Curio Collection | 224 | Other U.S. | 5,000 | Fee Simple | 100% | — | |||||||||||||||||||||||||||||
| Hilton Checkers Los Angeles | 193 | Southern California | 3,000 | Fee Simple | 100% | — | |||||||||||||||||||||||||||||
| DoubleTree Hotel Durango | 159 | Other U.S. | 7,000 | Leasehold | 100% | — | |||||||||||||||||||||||||||||
| The Reach Key West, Curio Collection | 150 | Key West | 18,000 | Fee Simple | 100% | — | |||||||||||||||||||||||||||||
| Total Comparable Portfolio (39 Hotels) | 23,428 | 2,137,000 | $ | 1,657 | |||||||||||||||||||||||||||||||
| Unconsolidated Joint Venture Portfolio | |||||||||||||||||||||||||||||||||||
| Hilton Orlando | 1,424 | Orlando | 236,000 | Fee Simple | 20% | $ | 105 | ||||||||||||||||||||||||||||
| Capital Hilton | 559 | Washington, D.C. | 30,000 | Fee Simple | 25% | $ | 27 | ||||||||||||||||||||||||||||
| Embassy Suites Alexandria Old Town | 288 | Washington, D.C. | 11,000 | Fee Simple | 50% | $ | 25 | ||||||||||||||||||||||||||||
| Total Unconsolidated Joint Venture Portfolio (3 Hotels) | 2,271 | 277,000 | $ | 157 | |||||||||||||||||||||||||||||||
| Grand Total (42 Hotels) | 25,699 | 2,414,000 | $ | 1,814 | |||||||||||||||||||||||||||||||
19 | | |||||||
| Portfolio and Operating Metrics (continued) | ||||||||
Comparable Hotels by Market: Q2 2024 vs. Q2 2023 | ||||||||
| (unaudited) | Comparable ADR | Comparable Occupancy | Comparable RevPAR | Comparable Total RevPAR | |||||||||||||||||||||||||||||||||||||||||||||||||||||||||||||||||||||||||||||||
| Hotels | Rooms | 2Q24 | 2Q23 | Change(1) | 2Q24 | 2Q23 | Change | 2Q24 | 2Q23 | Change(1) | 2Q24 | 2Q23 | Change(1) | ||||||||||||||||||||||||||||||||||||||||||||||||||||||||||||||||||||||
| Hawaii | 2 | 3,507 | $ | 304.25 | $ | 300.71 | 1.2 | % | 86.9 | % | 93.1 | % | (6.2) | % pts | $ | 264.54 | $ | 280.11 | (5.6) | % | $ | 450.10 | $ | 489.84 | (8.1) | % | |||||||||||||||||||||||||||||||||||||||||||||||||||||||||
| Orlando | 3 | 2,325 | 239.96 | 231.00 | 3.9 | 68.3 | 68.4 | (0.1) | 164.01 | 158.12 | 3.7 | 376.66 | 325.89 | 15.6 | |||||||||||||||||||||||||||||||||||||||||||||||||||||||||||||||||||||
| New York | 1 | 1,878 | 314.23 | 308.51 | 1.9 | 88.7 | 86.8 | 1.9 | 278.70 | 267.78 | 4.1 | 439.12 | 401.60 | 9.3 | |||||||||||||||||||||||||||||||||||||||||||||||||||||||||||||||||||||
| New Orleans | 1 | 1,622 | 218.36 | 214.74 | 1.7 | 66.4 | 73.3 | (6.9) | 145.06 | 157.46 | (7.9) | 254.33 | 287.28 | (11.5) | |||||||||||||||||||||||||||||||||||||||||||||||||||||||||||||||||||||
| Boston | 3 | 1,536 | 279.37 | 264.23 | 5.7 | 85.9 | 82.4 | 3.5 | 239.91 | 217.79 | 10.2 | 310.09 | 284.19 | 9.1 | |||||||||||||||||||||||||||||||||||||||||||||||||||||||||||||||||||||
| Southern California | 5 | 1,773 | 224.55 | 239.42 | (6.2) | 81.8 | 77.8 | 4.0 | 183.69 | 186.29 | (1.4) | 293.98 | 296.42 | (0.8) | |||||||||||||||||||||||||||||||||||||||||||||||||||||||||||||||||||||
Key West(2) | 2 | 461 | 555.43 | 516.68 | 7.5 | 77.0 | 42.8 | 34.2 | 427.75 | 221.08 | 93.5 | 683.16 | 336.75 | 102.9 | |||||||||||||||||||||||||||||||||||||||||||||||||||||||||||||||||||||
| Chicago | 3 | 2,467 | 246.98 | 248.86 | (0.8) | 70.7 | 70.3 | 0.4 | 174.63 | 174.93 | (0.2) | 262.67 | 252.35 | 4.1 | |||||||||||||||||||||||||||||||||||||||||||||||||||||||||||||||||||||
| Puerto Rico | 1 | 652 | 288.67 | 287.33 | 0.5 | 74.8 | 82.1 | (7.3) | 216.03 | 235.92 | (8.4) | 338.77 | 361.44 | (6.3) | |||||||||||||||||||||||||||||||||||||||||||||||||||||||||||||||||||||
| Washington, D.C. | 2 | 1,085 | 212.73 | 197.56 | 7.7 | 81.7 | 80.8 | 0.9 | 173.88 | 159.66 | 8.9 | 250.47 | 229.62 | 9.1 | |||||||||||||||||||||||||||||||||||||||||||||||||||||||||||||||||||||
| Denver | 1 | 613 | 204.90 | 209.98 | (2.4) | 69.4 | 75.0 | (5.6) | 142.28 | 157.53 | (9.7) | 218.64 | 230.64 | (5.2) | |||||||||||||||||||||||||||||||||||||||||||||||||||||||||||||||||||||
| Miami | 1 | 393 | 252.49 | 245.71 | 2.8 | 84.0 | 81.6 | 2.4 | 212.07 | 200.52 | 5.8 | 282.14 | 271.05 | 4.1 | |||||||||||||||||||||||||||||||||||||||||||||||||||||||||||||||||||||
| Seattle | 2 | 1,246 | 165.56 | 167.61 | (1.2) | 78.8 | 69.8 | 9.0 | 130.47 | 117.06 | 11.5 | 176.89 | 158.14 | 11.9 | |||||||||||||||||||||||||||||||||||||||||||||||||||||||||||||||||||||
| San Francisco | 2 | 660 | 227.67 | 245.53 | (7.3) | 75.6 | 70.9 | 4.7 | 172.13 | 174.15 | (1.2) | 219.83 | 228.84 | (3.9) | |||||||||||||||||||||||||||||||||||||||||||||||||||||||||||||||||||||
| Other | 10 | 3,210 | 182.36 | 181.43 | 0.5 | 68.3 | 69.7 | (1.4) | 124.62 | 126.41 | (1.4) | 167.83 | 172.16 | (2.5) | |||||||||||||||||||||||||||||||||||||||||||||||||||||||||||||||||||||
| All Markets | 39 | 23,428 | $ | 252.90 | $ | 248.33 | 1.8 | % | 77.1 | % | 77.0 | % | 0.1 | % pts | $ | 194.90 | $ | 191.03 | 2.0 | % | $ | 311.32 | $ | 301.74 | 3.2 | % | |||||||||||||||||||||||||||||||||||||||||||||||||||||||||
20 | | |||||||
| Portfolio and Operating Metrics (continued) | ||||||||
Comparable Hotels by Market: Q2 2024 vs. Q2 2023 | ||||||||
| (unaudited, dollars in millions) | Comparable Hotel Adjusted EBITDA | Comparable Hotel Revenue | Comparable Hotel Adjusted EBITDA Margin | |||||||||||||||||||||||||||||||||||||||||||||||||||||||||||||||||
| Hotels | Rooms | 2Q24 | 2Q23 | Change(1) | 2Q24 | 2Q23 | Change(1) | 2Q24 | 2Q23 | Change | ||||||||||||||||||||||||||||||||||||||||||||||||||||||||||
| Hawaii | 2 | 3,507 | $ | 56 | $ | 62 | (10.2) | % | $ | 144 | $ | 156 | (8.1) | % | 38.7 | % | 39.6 | % | (90) | bps | ||||||||||||||||||||||||||||||||||||||||||||||||
| Orlando | 3 | 2,325 | 25 | 20 | 25.5 | 80 | 69 | 15.6 | 31.6 | 29.1 | 250 | |||||||||||||||||||||||||||||||||||||||||||||||||||||||||
| New York | 1 | 1,878 | 14 | 12 | 13.5 | 75 | 69 | 9.3 | 18.3 | 17.6 | 70 | |||||||||||||||||||||||||||||||||||||||||||||||||||||||||
| New Orleans | 1 | 1,622 | 13 | 17 | (25.1) | 38 | 42 | (11.5) | 34.3 | 40.6 | (630) | |||||||||||||||||||||||||||||||||||||||||||||||||||||||||
| Boston | 3 | 1,536 | 16 | 14 | 9.5 | 43 | 40 | 9.1 | 36.5 | 36.4 | 10 | |||||||||||||||||||||||||||||||||||||||||||||||||||||||||
| Southern California | 5 | 1,773 | 15 | 16 | (7.0) | 47 | 48 | (0.8) | 31.1 | 33.2 | (210) | |||||||||||||||||||||||||||||||||||||||||||||||||||||||||
Key West(2) | 2 | 461 | 12 | 3 | 272.5 | 29 | 14 | 102.9 | 42.2 | 23.0 | 1,920 | |||||||||||||||||||||||||||||||||||||||||||||||||||||||||
| Chicago | 3 | 2,467 | 15 | 13 | 20.5 | 59 | 57 | 4.1 | 26.1 | 22.5 | 360 | |||||||||||||||||||||||||||||||||||||||||||||||||||||||||
| Puerto Rico | 1 | 652 | 5 | 6 | (17.2) | 20 | 21 | (6.3) | 25.6 | 29.0 | (340) | |||||||||||||||||||||||||||||||||||||||||||||||||||||||||
| Washington, D.C. | 2 | 1,085 | 8 | 7 | 17.1 | 25 | 23 | 9.1 | 33.4 | 31.1 | 230 | |||||||||||||||||||||||||||||||||||||||||||||||||||||||||
| Denver | 1 | 613 | 5 | 5 | (11.3) | 12 | 13 | (5.2) | 37.5 | 40.1 | (260) | |||||||||||||||||||||||||||||||||||||||||||||||||||||||||
| Miami | 1 | 393 | 4 | 3 | 13.6 | 10 | 10 | 4.1 | 36.4 | 33.3 | 310 | |||||||||||||||||||||||||||||||||||||||||||||||||||||||||
| Seattle | 2 | 1,246 | 3 | 2 | 11.1 | 20 | 18 | 11.9 | 13.5 | 13.6 | (10) | |||||||||||||||||||||||||||||||||||||||||||||||||||||||||
| San Francisco | 2 | 660 | — | 2 | (69.6) | 13 | 14 | (3.9) | 3.7 | 11.6 | (790) | |||||||||||||||||||||||||||||||||||||||||||||||||||||||||
| Other | 10 | 3,210 | 8 | 10 | (5.0) | 49 | 49 | (2.5) | 17.3 | 17.8 | (50) | |||||||||||||||||||||||||||||||||||||||||||||||||||||||||
| All Markets | 39 | 23,428 | $ | 199 | $ | 192 | 3.4 | % | $ | 664 | $ | 643 | 3.2 | % | 29.9 | % | 29.8 | % | 10 | bps | ||||||||||||||||||||||||||||||||||||||||||||||||
21 | | |||||||
| Portfolio and Operating Metrics (continued) | ||||||||
Comparable Hotels by Market: YTD Q2 2024 vs. YTD Q2 2023 | ||||||||
| (unaudited) | Comparable ADR | Comparable Occupancy | Comparable RevPAR | Comparable Total RevPAR | |||||||||||||||||||||||||||||||||||||||||||||||||||||||||||||||||||||||||||||||
| Hotels | Rooms | 2024 | 2023 | Change(1) | 2024 | 2023 | Change | 2024 | 2023 | Change(1) | 2024 | 2023 | Change(1) | ||||||||||||||||||||||||||||||||||||||||||||||||||||||||||||||||||||||
| Hawaii | 2 | 3,507 | $ | 307.75 | $ | 299.53 | 2.7 | % | 88.6 | % | 90.7 | % | (2.1) | % pts | $ | 272.53 | $ | 271.50 | 0.4 | % | $ | 465.40 | $ | 480.13 | (3.1) | % | |||||||||||||||||||||||||||||||||||||||||||||||||||||||||
| Orlando | 3 | 2,325 | 262.69 | 253.21 | 3.7 | 71.3 | 70.4 | 0.9 | 187.23 | 178.16 | 5.1 | 415.81 | 366.33 | 13.5 | |||||||||||||||||||||||||||||||||||||||||||||||||||||||||||||||||||||
| New York | 1 | 1,878 | 287.08 | 281.81 | 1.9 | 81.7 | 77.9 | 3.8 | 234.53 | 219.63 | 6.8 | 381.58 | 341.36 | 11.8 | |||||||||||||||||||||||||||||||||||||||||||||||||||||||||||||||||||||
| New Orleans | 1 | 1,622 | 223.29 | 221.61 | 0.8 | 70.7 | 69.5 | 1.2 | 157.90 | 154.01 | 2.5 | 276.99 | 284.10 | (2.5) | |||||||||||||||||||||||||||||||||||||||||||||||||||||||||||||||||||||
| Boston | 3 | 1,536 | 238.39 | 228.43 | 4.4 | 80.1 | 76.5 | 3.6 | 190.88 | 174.72 | 9.3 | 253.74 | 232.75 | 9.0 | |||||||||||||||||||||||||||||||||||||||||||||||||||||||||||||||||||||
| Southern California | 5 | 1,773 | 212.46 | 224.70 | (5.5) | 78.2 | 75.6 | 2.6 | 166.17 | 169.80 | (2.1) | 267.27 | 271.46 | (1.5) | |||||||||||||||||||||||||||||||||||||||||||||||||||||||||||||||||||||
Key West(2) | 2 | 461 | 615.78 | 554.41 | 11.1 | 80.6 | 60.9 | 19.7 | 496.19 | 337.35 | 47.1 | 740.77 | 488.45 | 51.7 | |||||||||||||||||||||||||||||||||||||||||||||||||||||||||||||||||||||
| Chicago | 3 | 2,467 | 216.97 | 217.87 | (0.4) | 56.2 | 54.6 | 1.6 | 122.04 | 119.10 | 2.5 | 191.83 | 185.20 | 3.6 | |||||||||||||||||||||||||||||||||||||||||||||||||||||||||||||||||||||
| Puerto Rico | 1 | 652 | 319.94 | 298.92 | 7.0 | 79.3 | 83.9 | (4.6) | 253.67 | 250.65 | 1.2 | 377.87 | 383.26 | (1.4) | |||||||||||||||||||||||||||||||||||||||||||||||||||||||||||||||||||||
| Washington, D.C. | 2 | 1,085 | 198.61 | 184.94 | 7.4 | 74.3 | 72.7 | 1.6 | 147.60 | 134.47 | 9.8 | 217.13 | 196.26 | 10.6 | |||||||||||||||||||||||||||||||||||||||||||||||||||||||||||||||||||||
| Denver | 1 | 613 | 188.51 | 190.99 | (1.3) | 66.5 | 67.8 | (1.3) | 125.28 | 129.45 | (3.2) | 189.86 | 192.84 | (1.5) | |||||||||||||||||||||||||||||||||||||||||||||||||||||||||||||||||||||
| Miami | 1 | 393 | 302.23 | 292.64 | 3.3 | 85.2 | 84.6 | 0.6 | 257.63 | 247.75 | 4.0 | 333.48 | 327.28 | 1.9 | |||||||||||||||||||||||||||||||||||||||||||||||||||||||||||||||||||||
| Seattle | 2 | 1,246 | 151.27 | 157.95 | (4.2) | 73.3 | 64.1 | 9.2 | 110.80 | 101.13 | 9.6 | 155.68 | 143.31 | 8.6 | |||||||||||||||||||||||||||||||||||||||||||||||||||||||||||||||||||||
| San Francisco | 2 | 660 | 267.19 | 282.12 | (5.3) | 70.4 | 66.3 | 4.1 | 187.99 | 186.87 | 0.6 | 250.47 | 257.42 | (2.7) | |||||||||||||||||||||||||||||||||||||||||||||||||||||||||||||||||||||
| Other | 10 | 3,210 | 179.04 | 179.31 | (0.1) | 64.3 | 63.4 | 0.9 | 115.16 | 113.72 | 1.3 | 158.36 | 156.70 | 1.1 | |||||||||||||||||||||||||||||||||||||||||||||||||||||||||||||||||||||
| All Markets | 39 | 23,428 | $ | 250.51 | $ | 245.38 | 2.1 | % | 74.0 | % | 72.2 | % | 1.8 | % pts | $ | 185.28 | $ | 177.05 | 4.6 | % | $ | 300.50 | $ | 286.81 | 4.8 | % | |||||||||||||||||||||||||||||||||||||||||||||||||||||||||
22 | | |||||||
| Portfolio and Operating Metrics (continued) | ||||||||
Comparable Hotels by Market: YTD Q2 2024 vs. YTD Q2 2023 | ||||||||
| (unaudited, dollars in millions) | Comparable Hotel Adjusted EBITDA | Comparable Hotel Revenue | Comparable Hotel Adjusted EBITDA Margin | |||||||||||||||||||||||||||||||||||||||||||||||||||||||||||||||||
| Hotels | Rooms | 2024 | 2023 | Change(1) | 2024 | 2023 | Change(1) | 2024 | 2023 | Change | ||||||||||||||||||||||||||||||||||||||||||||||||||||||||||
Hawaii(2) | 2 | 3,507 | $ | 120 | $ | 121 | (0.6) | % | $ | 297 | $ | 305 | (2.5) | % | 40.4 | % | 39.6 | % | 80 | bps | ||||||||||||||||||||||||||||||||||||||||||||||||
| Orlando | 3 | 2,325 | 62 | 53 | 17.2 | 176 | 154 | 14.1 | 35.2 | 34.3 | 90 | |||||||||||||||||||||||||||||||||||||||||||||||||||||||||
| New York | 1 | 1,878 | 11 | 9 | 32.2 | 130 | 116 | 12.4 | 8.8 | 7.5 | 130 | |||||||||||||||||||||||||||||||||||||||||||||||||||||||||
| New Orleans | 1 | 1,622 | 30 | 34 | (13.4) | 82 | 83 | (2.0) | 36.4 | 41.2 | (480) | |||||||||||||||||||||||||||||||||||||||||||||||||||||||||
Boston(3) | 3 | 1,536 | 26 | 19 | 38.9 | 71 | 65 | 9.6 | 36.3 | 28.6 | 770 | |||||||||||||||||||||||||||||||||||||||||||||||||||||||||
| Southern California | 5 | 1,773 | 24 | 25 | (6.8) | 86 | 87 | (1.0) | 27.4 | 29.1 | (170) | |||||||||||||||||||||||||||||||||||||||||||||||||||||||||
Key West(4) | 2 | 461 | 28 | 15 | 87.4 | 62 | 41 | 52.5 | 44.9 | 36.5 | 840 | |||||||||||||||||||||||||||||||||||||||||||||||||||||||||
| Chicago | 3 | 2,467 | 5 | 2 | 127.5 | 86 | 83 | 4.2 | 6.1 | 2.8 | 330 | |||||||||||||||||||||||||||||||||||||||||||||||||||||||||
| Puerto Rico | 1 | 652 | 14 | 14 | (2.4) | 45 | 45 | (0.9) | 30.2 | 30.7 | (50) | |||||||||||||||||||||||||||||||||||||||||||||||||||||||||
| Washington, D.C. | 2 | 1,085 | 12 | 10 | 23.6 | 43 | 39 | 11.2 | 27.8 | 25.0 | 280 | |||||||||||||||||||||||||||||||||||||||||||||||||||||||||
| Denver | 1 | 613 | 7 | 7 | 0.2 | 21 | 21 | (1.0) | 34.0 | 33.6 | 40 | |||||||||||||||||||||||||||||||||||||||||||||||||||||||||
| Miami | 1 | 393 | 10 | 10 | 6.2 | 24 | 23 | 2.5 | 43.2 | 41.7 | 150 | |||||||||||||||||||||||||||||||||||||||||||||||||||||||||
| Seattle | 2 | 1,246 | 2 | 2 | (0.1) | 35 | 32 | 9.2 | 6.4 | 7.0 | (60) | |||||||||||||||||||||||||||||||||||||||||||||||||||||||||
| San Francisco | 2 | 660 | 4 | 5 | (23.3) | 30 | 31 | (2.2) | 12.5 | 15.9 | (340) | |||||||||||||||||||||||||||||||||||||||||||||||||||||||||
| Other | 10 | 3,210 | 12 | 11 | 2.9 | 94 | 91 | 1.6 | 13.2 | 13.0 | 20 | |||||||||||||||||||||||||||||||||||||||||||||||||||||||||
| All Markets | 39 | 23,428 | $ | 367 | $ | 337 | 8.8 | % | $ | 1,282 | $ | 1,216 | 5.4 | % | 28.6 | % | 27.7 | % | 90 | bps | ||||||||||||||||||||||||||||||||||||||||||||||||
23 | | |||||||
| Portfolio and Operating Metrics (continued) | ||||||||
Core Hotels: Q2 2024 vs. Q2 2023 | ||||||||
| (unaudited) | ADR | Occupancy | RevPAR | Total RevPAR | ||||||||||||||||||||||||||||||||||||||||||||||||||||||||||||||||||||||
| 2Q24 | 2Q23 | Change(1) | 2Q24 | 2Q23 | Change | 2Q24 | 2Q23 | Change(1) | 2Q24 | 2Q23 | Change(1) | |||||||||||||||||||||||||||||||||||||||||||||||||||||||||||||||
| Core Hotels | ||||||||||||||||||||||||||||||||||||||||||||||||||||||||||||||||||||||||||
| 1 | Hilton Hawaiian Village Waikiki Beach Resort | $ | 303.17 | $ | 295.10 | 2.7 | % | 89.4 | % | 95.8 | % | (6.4) | % pts | $ | 271.06 | $ | 282.80 | (4.2) | % | $ | 432.46 | $ | 465.15 | (7.0) | % | |||||||||||||||||||||||||||||||||||||||||||||||||
| 2 | Hilton Waikoloa Village | 309.83 | 329.94 | (6.1) | 76.1 | 81.3 | (5.2) | 235.74 | 268.23 | (12.1) | 528.08 | 598.96 | (11.8) | |||||||||||||||||||||||||||||||||||||||||||||||||||||||||||||
| 3 | Signia by Hilton Orlando Bonnet Creek | 226.90 | 217.89 | 4.1 | 74.1 | 70.8 | 3.3 | 168.05 | 154.25 | 8.9 | 460.07 | 352.58 | 30.5 | |||||||||||||||||||||||||||||||||||||||||||||||||||||||||||||
| 4 | Waldorf Astoria Orlando | 379.85 | 335.99 | 13.1 | 61.1 | 62.3 | (1.2) | 232.18 | 209.25 | 11.0 | 448.38 | 403.51 | 11.1 | |||||||||||||||||||||||||||||||||||||||||||||||||||||||||||||
| 5 | Hilton Orlando Lake Buena Vista | 177.96 | 189.43 | (6.1) | 65.7 | 69.3 | (3.6) | 116.96 | 131.37 | (11.0) | 229.05 | 244.95 | (6.5) | |||||||||||||||||||||||||||||||||||||||||||||||||||||||||||||
| 6 | New York Hilton Midtown | 314.23 | 308.51 | 1.9 | 88.7 | 86.8 | 1.9 | 278.70 | 267.78 | 4.1 | 439.12 | 401.60 | 9.3 | |||||||||||||||||||||||||||||||||||||||||||||||||||||||||||||
| 7 | Hilton New Orleans Riverside | 218.36 | 214.74 | 1.7 | 66.4 | 73.3 | (6.9) | 145.06 | 157.46 | (7.9) | 254.33 | 287.28 | (11.5) | |||||||||||||||||||||||||||||||||||||||||||||||||||||||||||||
| 8 | Hilton Boston Logan Airport | 284.44 | 266.78 | 6.6 | 93.8 | 93.1 | 0.7 | 266.78 | 248.36 | 7.4 | 329.56 | 310.55 | 6.1 | |||||||||||||||||||||||||||||||||||||||||||||||||||||||||||||
| 9 | Hyatt Regency Boston | 315.26 | 299.12 | 5.4 | 89.0 | 81.7 | 7.3 | 280.48 | 244.38 | 14.8 | 356.24 | 310.91 | 14.6 | |||||||||||||||||||||||||||||||||||||||||||||||||||||||||||||
| 10 | Boston Marriott Newton | 217.58 | 210.59 | 3.3 | 71.1 | 68.2 | 2.9 | 154.81 | 143.80 | 7.7 | 228.86 | 215.97 | 6.0 | |||||||||||||||||||||||||||||||||||||||||||||||||||||||||||||
| 11 | Hilton Santa Barbara Beachfront Resort | 341.50 | 368.53 | (7.3) | 71.9 | 69.2 | 2.7 | 245.56 | 254.96 | (3.7) | 391.52 | 419.93 | (6.8) | |||||||||||||||||||||||||||||||||||||||||||||||||||||||||||||
| 12 | Hyatt Regency Mission Bay Spa and Marina | 247.73 | 287.03 | (13.7) | 83.8 | 72.8 | 11.0 | 207.70 | 209.06 | (0.6) | 371.56 | 373.46 | (0.5) | |||||||||||||||||||||||||||||||||||||||||||||||||||||||||||||
| 13 | Hilton Checkers Los Angeles | 196.18 | 217.93 | (10.0) | 69.9 | 75.2 | (5.3) | 137.18 | 163.85 | (16.3) | 172.93 | 192.50 | (10.2) | |||||||||||||||||||||||||||||||||||||||||||||||||||||||||||||
| 14 | Casa Marina Key West, Curio Collection(2) | 568.30 | 499.05 | 13.9 | 75.6 | 27.4 | 48.2 | 429.69 | 136.57 | 214.6 | 703.76 | 215.23 | 227.0 | |||||||||||||||||||||||||||||||||||||||||||||||||||||||||||||
| 15 | The Reach Key West, Curio Collection | 530.19 | 530.07 | — | 79.9 | 74.7 | 5.2 | 423.73 | 396.29 | 6.9 | 640.44 | 588.70 | 8.8 | |||||||||||||||||||||||||||||||||||||||||||||||||||||||||||||
| 16 | Hilton Chicago | 233.97 | 238.60 | (1.9) | 72.0 | 69.2 | 2.8 | 168.55 | 165.10 | 2.1 | 283.71 | 262.89 | 7.9 | |||||||||||||||||||||||||||||||||||||||||||||||||||||||||||||
| 17 | W Chicago – City Center | 319.52 | 306.79 | 4.1 | 67.0 | 70.8 | (3.8) | 213.92 | 216.94 | (1.4) | 260.19 | 262.90 | (1.0) | |||||||||||||||||||||||||||||||||||||||||||||||||||||||||||||
| 18 | W Chicago – Lakeshore | 232.92 | 234.28 | (0.6) | 69.7 | 73.3 | (3.6) | 162.25 | 171.55 | (5.4) | 202.13 | 212.90 | (5.1) | |||||||||||||||||||||||||||||||||||||||||||||||||||||||||||||
| 19 | DoubleTree Hotel Washington DC – Crystal City | 209.15 | 193.59 | 8.0 | 85.9 | 83.5 | 2.4 | 179.69 | 161.59 | 11.2 | 242.41 | 228.07 | 6.3 | |||||||||||||||||||||||||||||||||||||||||||||||||||||||||||||
| 20 | Hilton Denver City Center | 204.90 | 209.98 | (2.4) | 69.4 | 75.0 | (5.6) | 142.28 | 157.53 | (9.7) | 218.64 | 230.64 | (5.2) | |||||||||||||||||||||||||||||||||||||||||||||||||||||||||||||
| 21 | Royal Palm South Beach Miami | 252.49 | 245.71 | 2.8 | 84.0 | 81.6 | 2.4 | 212.07 | 200.52 | 5.8 | 282.14 | 271.05 | 4.1 | |||||||||||||||||||||||||||||||||||||||||||||||||||||||||||||
| 22 | Hyatt Centric Fisherman's Wharf | 184.85 | 196.85 | (6.1) | 81.4 | 73.5 | 7.9 | 150.51 | 144.71 | 4.0 | 196.65 | 202.62 | (2.9) | |||||||||||||||||||||||||||||||||||||||||||||||||||||||||||||
| 23 | JW Marriott San Francisco Union Square | 273.24 | 293.48 | (6.9) | 70.3 | 68.6 | 1.7 | 192.00 | 201.19 | (4.6) | 241.13 | 252.92 | (4.7) | |||||||||||||||||||||||||||||||||||||||||||||||||||||||||||||
| 24 | DoubleTree Hotel San Jose | 178.36 | 167.38 | 6.6 | 59.1 | 60.6 | (1.5) | 105.36 | 101.37 | 3.9 | 148.51 | 151.46 | (1.9) | |||||||||||||||||||||||||||||||||||||||||||||||||||||||||||||
| 25 | Juniper Hotel Cupertino, Curio Collection | 202.22 | 186.65 | 8.3 | 76.0 | 67.1 | 8.9 | 153.72 | 125.25 | 22.7 | 172.52 | 144.67 | 19.3 | |||||||||||||||||||||||||||||||||||||||||||||||||||||||||||||
| Total Core Hotels | 271.62 | 265.05 | 2.5 | 77.6 | 77.6 | — | 210.83 | 205.63 | 2.5 | 343.84 | 332.01 | 3.6 | ||||||||||||||||||||||||||||||||||||||||||||||||||||||||||||||
| All Other Hotels | 191.77 | 193.41 | (0.8) | 75.3 | 74.8 | 0.5 | 144.44 | 144.76 | (0.2) | 208.28 | 205.77 | 1.2 | ||||||||||||||||||||||||||||||||||||||||||||||||||||||||||||||
| Total Comparable Hotels | $ | 252.90 | $ | 248.33 | 1.8 | % | 77.1 | % | 77.0 | % | 0.1 | % pts | $ | 194.90 | $ | 191.03 | 2.0 | % | $ | 311.32 | $ | 301.74 | 3.2 | % | ||||||||||||||||||||||||||||||||||||||||||||||||||
24 | | |||||||
| Portfolio and Operating Metrics (continued) | ||||||||
Core Hotels: Q2 2024 vs. Q2 2023 | ||||||||
| (unaudited, dollars in millions) | Hotel Adjusted EBITDA | Hotel Revenue | Hotel Adjusted EBITDA Margin | ||||||||||||||||||||||||||||||||||||||||||||||||||||||||
| 2Q24 | 2Q23 | Change(1) | 2Q24 | 2Q23 | Change(1) | 2Q24 | 2Q23 | Change | |||||||||||||||||||||||||||||||||||||||||||||||||||
| Core Hotels | |||||||||||||||||||||||||||||||||||||||||||||||||||||||||||
| 1 | Hilton Hawaiian Village Waikiki Beach Resort | $ | 46 | $ | 49 | (7.5) | % | $ | 113 | $ | 121 | (7.0) | % | 40.5 | % | 40.7 | % | (20) | bps | ||||||||||||||||||||||||||||||||||||||||
| 2 | Hilton Waikoloa Village | 10 | 12 | (20.6) | 31 | 35 | (11.8) | 31.9 | 35.4 | (350) | |||||||||||||||||||||||||||||||||||||||||||||||||
| 3 | Signia by Hilton Orlando Bonnet Creek | 15 | 11 | 44.4 | 42 | 32 | 30.5 | 36.5 | 33.0 | 350 | |||||||||||||||||||||||||||||||||||||||||||||||||
| 4 | Waldorf Astoria Orlando | 5 | 4 | 52.5 | 20 | 18 | 11.1 | 26.1 | 19.0 | 710 | |||||||||||||||||||||||||||||||||||||||||||||||||
| 5 | Hilton Orlando Lake Buena Vista | 4 | 6 | (25.1) | 17 | 18 | (6.5) | 25.8 | 32.2 | (640) | |||||||||||||||||||||||||||||||||||||||||||||||||
| 6 | New York Hilton Midtown | 14 | 12 | 13.5 | 75 | 69 | 9.3 | 18.3 | 17.6 | 70 | |||||||||||||||||||||||||||||||||||||||||||||||||
| 7 | Hilton New Orleans Riverside | 13 | 17 | (25.1) | 38 | 42 | (11.5) | 34.3 | 40.6 | (630) | |||||||||||||||||||||||||||||||||||||||||||||||||
| 8 | Hilton Boston Logan Airport | 6 | 6 | (0.8) | 18 | 18 | 6.1 | 32.2 | 34.4 | (220) | |||||||||||||||||||||||||||||||||||||||||||||||||
| 9 | Hyatt Regency Boston | 7 | 6 | 20.8 | 16 | 14 | 14.6 | 43.5 | 41.2 | 230 | |||||||||||||||||||||||||||||||||||||||||||||||||
| 10 | Boston Marriott Newton | 3 | 3 | 7.1 | 9 | 8 | 6.0 | 32.5 | 32.2 | 30 | |||||||||||||||||||||||||||||||||||||||||||||||||
| 11 | Hilton Santa Barbara Beachfront Resort | 6 | 6 | (6.3) | 13 | 14 | (6.8) | 46.2 | 46.0 | 20 | |||||||||||||||||||||||||||||||||||||||||||||||||
| 12 | Hyatt Regency Mission Bay Spa and Marina | 4 | 5 | (26.7) | 15 | 15 | (0.5) | 24.9 | 33.8 | (890) | |||||||||||||||||||||||||||||||||||||||||||||||||
| 13 | Hilton Checkers Los Angeles | — | — | 816.1 | 3 | 3 | (10.2) | 13.8 | (1.7) | 1,550 | |||||||||||||||||||||||||||||||||||||||||||||||||
| 14 | Casa Marina Key West, Curio Collection(2) | 9 | — | 6474.3 | 20 | 6 | 227.0 | 43.5 | 2.2 | 4,130 | |||||||||||||||||||||||||||||||||||||||||||||||||
| 15 | The Reach Key West, Curio Collection | 3 | 3 | 10.0 | 9 | 8 | 8.8 | 39.2 | 38.8 | 40 | |||||||||||||||||||||||||||||||||||||||||||||||||
| 16 | Hilton Chicago | 10 | 9 | 14.2 | 40 | 37 | 7.9 | 24.9 | 23.5 | 140 | |||||||||||||||||||||||||||||||||||||||||||||||||
| 17 | W Chicago – City Center | 3 | 2 | 20.1 | 10 | 10 | (1.0) | 30.9 | 25.5 | 540 | |||||||||||||||||||||||||||||||||||||||||||||||||
| 18 | W Chicago – Lakeshore | 2 | 2 | 54.7 | 9 | 10 | (5.1) | 26.3 | 16.1 | 1,020 | |||||||||||||||||||||||||||||||||||||||||||||||||
| 19 | DoubleTree Hotel Washington DC – Crystal City | 5 | 5 | 12.9 | 14 | 13 | 6.3 | 37.9 | 35.7 | 220 | |||||||||||||||||||||||||||||||||||||||||||||||||
| 20 | Hilton Denver City Center | 5 | 5 | (11.3) | 12 | 13 | (5.2) | 37.5 | 40.1 | (260) | |||||||||||||||||||||||||||||||||||||||||||||||||
| 21 | Royal Palm South Beach Miami | 4 | 3 | 13.6 | 10 | 10 | 4.1 | 36.4 | 33.3 | 310 | |||||||||||||||||||||||||||||||||||||||||||||||||
| 22 | Hyatt Centric Fisherman's Wharf | — | 1 | (42.8) | 6 | 6 | (2.9) | 10.5 | 17.8 | (730) | |||||||||||||||||||||||||||||||||||||||||||||||||
| 23 | JW Marriott San Francisco Union Square | — | 1 | (119.6) | 7 | 8 | (4.7) | (1.4) | 7.1 | (850) | |||||||||||||||||||||||||||||||||||||||||||||||||
| 24 | DoubleTree Hotel San Jose | 1 | — | 27.6 | 6 | 7 | (1.9) | 7.6 | 5.8 | 180 | |||||||||||||||||||||||||||||||||||||||||||||||||
| 25 | Juniper Hotel Cupertino, Curio Collection | 1 | 1 | 95.3 | 4 | 3 | 19.3 | 28.4 | 17.3 | 1,110 | |||||||||||||||||||||||||||||||||||||||||||||||||
| Total Core Hotels | 176 | 169 | 4.5 | 557 | 538 | 3.6 | 31.6 | 31.3 | 30 | ||||||||||||||||||||||||||||||||||||||||||||||||||
| All Other Hotels | 23 | 23 | (4.6) | 107 | 105 | 1.2 | 21.2 | 22.5 | (130) | ||||||||||||||||||||||||||||||||||||||||||||||||||
| Total Comparable Hotels | $ | 199 | $ | 192 | 3.4 | % | $ | 664 | $ | 643 | 3.2 | % | 29.9 | % | 29.8 | % | 10 | bps | |||||||||||||||||||||||||||||||||||||||||
25 | | |||||||
| Portfolio and Operating Metrics (continued) | ||||||||
| Core Hotels: YTD Q2 2024 vs. YTD Q2 2023 | ||||||||
| (unaudited) | ADR | Occupancy | RevPAR | Total RevPAR | ||||||||||||||||||||||||||||||||||||||||||||||||||||||||||||||||||||||
| 2024 | 2023 | Change(1) | 2024 | 2023 | Change | 2024 | 2023 | Change(1) | 2024 | 2023 | Change(1) | |||||||||||||||||||||||||||||||||||||||||||||||||||||||||||||||
| Core Hotels | ||||||||||||||||||||||||||||||||||||||||||||||||||||||||||||||||||||||||||
| 1 | Hilton Hawaiian Village Waikiki Beach Resort | $ | 303.45 | $ | 292.74 | 3.7 | % | 90.6 | % | 92.6 | % | (2.0) | % pts | $ | 274.88 | $ | 270.98 | 1.4 | % | $ | 441.99 | $ | 447.09 | (1.1) | % | |||||||||||||||||||||||||||||||||||||||||||||||||
| 2 | Hilton Waikoloa Village | 329.38 | 333.35 | (1.2) | 79.6 | 82.1 | (2.5) | 262.16 | 273.81 | (4.3) | 568.91 | 626.16 | (9.1) | |||||||||||||||||||||||||||||||||||||||||||||||||||||||||||||
| 3 | Signia by Hilton Orlando Bonnet Creek | 251.56 | 236.06 | 6.6 | 75.8 | 71.5 | 4.3 | 190.77 | 168.81 | 13.0 | 496.90 | 395.26 | 25.7 | |||||||||||||||||||||||||||||||||||||||||||||||||||||||||||||
| 4 | Waldorf Astoria Orlando | 412.39 | 388.20 | 6.2 | 60.6 | 61.9 | (1.3) | 249.91 | 240.42 | 3.9 | 476.86 | 459.23 | 3.8 | |||||||||||||||||||||||||||||||||||||||||||||||||||||||||||||
| 5 | Hilton Orlando Lake Buena Vista | 199.70 | 204.17 | (2.2) | 72.2 | 74.1 | (1.9) | 144.20 | 151.36 | (4.7) | 277.64 | 273.16 | 1.6 | |||||||||||||||||||||||||||||||||||||||||||||||||||||||||||||
| 6 | New York Hilton Midtown | 287.08 | 281.81 | 1.9 | 81.7 | 77.9 | 3.8 | 234.53 | 219.63 | 6.8 | 381.58 | 341.36 | 11.8 | |||||||||||||||||||||||||||||||||||||||||||||||||||||||||||||
| 7 | Hilton New Orleans Riverside | 223.29 | 221.61 | 0.8 | 70.7 | 69.5 | 1.2 | 157.90 | 154.01 | 2.5 | 276.99 | 284.10 | (2.5) | |||||||||||||||||||||||||||||||||||||||||||||||||||||||||||||
| 8 | Hilton Boston Logan Airport | 241.62 | 229.51 | 5.3 | 93.0 | 91.6 | 1.4 | 224.61 | 210.04 | 6.9 | 283.25 | 268.34 | 5.6 | |||||||||||||||||||||||||||||||||||||||||||||||||||||||||||||
| 9 | Hyatt Regency Boston | 260.87 | 250.18 | 4.3 | 80.8 | 75.0 | 5.8 | 210.84 | 187.71 | 12.3 | 273.52 | 243.92 | 12.1 | |||||||||||||||||||||||||||||||||||||||||||||||||||||||||||||
| 10 | Boston Marriott Newton | 196.75 | 192.62 | 2.1 | 61.1 | 57.1 | 4.0 | 120.21 | 109.93 | 9.4 | 189.21 | 169.71 | 11.5 | |||||||||||||||||||||||||||||||||||||||||||||||||||||||||||||
| 11 | Hilton Santa Barbara Beachfront Resort | 299.23 | 321.91 | (7.0) | 70.1 | 66.7 | 3.4 | 209.83 | 214.66 | (2.3) | 335.83 | 356.67 | (5.8) | |||||||||||||||||||||||||||||||||||||||||||||||||||||||||||||
| 12 | Hyatt Regency Mission Bay Spa and Marina | 235.34 | 268.69 | (12.4) | 77.3 | 67.4 | 9.9 | 181.81 | 180.95 | 0.5 | 331.76 | 322.59 | 2.8 | |||||||||||||||||||||||||||||||||||||||||||||||||||||||||||||
| 13 | Hilton Checkers Los Angeles | 199.30 | 219.08 | (9.0) | 66.9 | 70.1 | (3.2) | 133.31 | 153.54 | (13.2) | 166.07 | 180.03 | (7.8) | |||||||||||||||||||||||||||||||||||||||||||||||||||||||||||||
| 14 | Casa Marina Key West, Curio Collection(2) | 630.71 | 538.63 | 17.1 | 78.9 | 51.6 | 27.3 | 497.55 | 277.92 | 79.0 | 752.23 | 410.66 | 83.2 | |||||||||||||||||||||||||||||||||||||||||||||||||||||||||||||
| 15 | The Reach Key West, Curio Collection | 586.75 | 575.51 | 2.0 | 84.1 | 80.0 | 4.1 | 493.36 | 460.58 | 7.1 | 717.01 | 649.74 | 10.4 | |||||||||||||||||||||||||||||||||||||||||||||||||||||||||||||
| 16 | Hilton Chicago | 205.03 | 206.26 | (0.6) | 57.9 | 54.4 | 3.5 | 118.77 | 112.18 | 5.9 | 213.04 | 200.09 | 6.5 | |||||||||||||||||||||||||||||||||||||||||||||||||||||||||||||
| 17 | W Chicago – City Center | 288.33 | 278.17 | 3.7 | 52.8 | 54.1 | (1.3) | 152.23 | 150.59 | 1.1 | 184.57 | 183.08 | 0.8 | |||||||||||||||||||||||||||||||||||||||||||||||||||||||||||||
| 18 | W Chicago – Lakeshore | 200.93 | 206.13 | (2.5) | 53.9 | 55.9 | (2.0) | 108.36 | 115.26 | (6.0) | 134.48 | 142.60 | (5.7) | |||||||||||||||||||||||||||||||||||||||||||||||||||||||||||||
| 19 | DoubleTree Hotel Washington DC – Crystal City | 194.06 | 179.33 | 8.2 | 77.4 | 75.6 | 1.8 | 150.20 | 135.63 | 10.7 | 206.56 | 191.86 | 7.7 | |||||||||||||||||||||||||||||||||||||||||||||||||||||||||||||
| 20 | Hilton Denver City Center | 188.51 | 190.99 | (1.3) | 66.5 | 67.8 | (1.3) | 125.28 | 129.45 | (3.2) | 189.86 | 192.84 | (1.5) | |||||||||||||||||||||||||||||||||||||||||||||||||||||||||||||
| 21 | Royal Palm South Beach Miami | 302.23 | 292.64 | 3.3 | 85.2 | 84.6 | 0.6 | 257.63 | 247.75 | 4.0 | 333.48 | 327.28 | 1.9 | |||||||||||||||||||||||||||||||||||||||||||||||||||||||||||||
| 22 | Hyatt Centric Fisherman's Wharf | 185.78 | 195.41 | (4.9) | 72.5 | 68.4 | 4.1 | 134.75 | 133.74 | 0.8 | 177.71 | 188.16 | (5.6) | |||||||||||||||||||||||||||||||||||||||||||||||||||||||||||||
| 23 | JW Marriott San Francisco Union Square | 346.52 | 367.03 | (5.6) | 68.4 | 64.2 | 4.2 | 236.90 | 235.67 | 0.5 | 317.31 | 321.04 | (1.2) | |||||||||||||||||||||||||||||||||||||||||||||||||||||||||||||
| 24 | DoubleTree Hotel San Jose | 186.58 | 171.26 | 8.9 | 60.5 | 59.6 | 0.9 | 112.94 | 102.20 | 10.5 | 163.84 | 158.47 | 3.4 | |||||||||||||||||||||||||||||||||||||||||||||||||||||||||||||
| 25 | Juniper Hotel Cupertino, Curio Collection | 205.92 | 195.94 | 5.1 | 72.5 | 59.5 | 13.0 | 149.39 | 116.58 | 28.1 | 169.42 | 135.79 | 24.8 | |||||||||||||||||||||||||||||||||||||||||||||||||||||||||||||
| Total Core Hotels | 268.78 | 261.70 | 2.7 | 74.8 | 72.9 | 1.9 | 200.93 | 190.65 | 5.4 | 333.01 | 316.07 | 5.4 | ||||||||||||||||||||||||||||||||||||||||||||||||||||||||||||||
| All Other Hotels | 189.91 | 191.48 | (0.8) | 71.4 | 69.9 | 1.5 | 135.66 | 133.93 | 1.3 | 197.49 | 194.08 | 1.8 | ||||||||||||||||||||||||||||||||||||||||||||||||||||||||||||||
| Total Comparable Hotels | $ | 250.51 | $ | 245.38 | 2.1 | % | 74.0 | % | 72.2 | % | 1.8 | % pts | $ | 185.28 | $ | 177.05 | 4.6 | % | $ | 300.50 | $ | 286.81 | 4.8 | % | ||||||||||||||||||||||||||||||||||||||||||||||||||
26 | | |||||||
| Portfolio and Operating Metrics (continued) | ||||||||
| Core Hotels: YTD Q2 2024 vs. YTD Q2 2023 | ||||||||
| (unaudited, dollars in millions) | Hotel Adjusted EBITDA | Hotel Revenue | Hotel Adjusted EBITDA Margin | ||||||||||||||||||||||||||||||||||||||||||||||||||||||||
| 2024 | 2023 | Change(1) | 2024 | 2023 | Change(1) | 2024 | 2023 | Change | |||||||||||||||||||||||||||||||||||||||||||||||||||
| Core Hotels | |||||||||||||||||||||||||||||||||||||||||||||||||||||||||||
| 1 | Hilton Hawaiian Village Waikiki Beach Resort(2) | $ | 96 | $ | 93 | 3.3 | % | $ | 230 | $ | 231 | (0.6) | % | 41.9 | % | 40.3 | % | 160 | bps | ||||||||||||||||||||||||||||||||||||||||
| 2 | Hilton Waikoloa Village(2) | 24 | 28 | (13.8) | 67 | 73 | (8.6) | 35.3 | 37.4 | (210) | |||||||||||||||||||||||||||||||||||||||||||||||||
| 3 | Signia by Hilton Orlando Bonnet Creek | 36 | 27 | 31.0 | 91 | 72 | 26.4 | 39.1 | 37.7 | 140 | |||||||||||||||||||||||||||||||||||||||||||||||||
| 4 | Waldorf Astoria Orlando | 13 | 11 | 13.6 | 44 | 42 | 4.4 | 29.1 | 26.7 | 240 | |||||||||||||||||||||||||||||||||||||||||||||||||
| 5 | Hilton Orlando Lake Buena Vista | 13 | 14 | (6.3) | 41 | 40 | 2.2 | 32.8 | 35.8 | (300) | |||||||||||||||||||||||||||||||||||||||||||||||||
| 6 | New York Hilton Midtown | 11 | 9 | 32.2 | 130 | 116 | 12.4 | 8.8 | 7.5 | 130 | |||||||||||||||||||||||||||||||||||||||||||||||||
| 7 | Hilton New Orleans Riverside | 30 | 34 | (13.4) | 82 | 83 | (2.0) | 36.4 | 41.2 | (480) | |||||||||||||||||||||||||||||||||||||||||||||||||
| 8 | Hilton Boston Logan Airport(3) | 10 | 8 | 25.4 | 31 | 30 | 6.1 | 32.1 | 27.2 | 490 | |||||||||||||||||||||||||||||||||||||||||||||||||
| 9 | Hyatt Regency Boston(3) | 10 | 8 | 41.5 | 25 | 22 | 12.8 | 42.1 | 33.5 | 860 | |||||||||||||||||||||||||||||||||||||||||||||||||
| 10 | Boston Marriott Newton(3) | 5 | 3 | 66.7 | 15 | 13 | 12.1 | 35.5 | 23.8 | 1,170 | |||||||||||||||||||||||||||||||||||||||||||||||||
| 11 | Hilton Santa Barbara Beachfront Resort | 9 | 9 | (6.1) | 22 | 23 | (5.3) | 39.0 | 39.3 | (30) | |||||||||||||||||||||||||||||||||||||||||||||||||
| 12 | Hyatt Regency Mission Bay Spa and Marina | 6 | 7 | (10.8) | 26 | 26 | 3.4 | 22.7 | 26.3 | (360) | |||||||||||||||||||||||||||||||||||||||||||||||||
| 13 | Hilton Checkers Los Angeles | 1 | — | 78.3 | 6 | 6 | (7.2) | 10.9 | 5.7 | 520 | |||||||||||||||||||||||||||||||||||||||||||||||||
| 14 | Casa Marina Key West, Curio Collection(4) | 20 | 7 | 164.7 | 42 | 24 | 84.2 | 46.0 | 32.0 | 1,400 | |||||||||||||||||||||||||||||||||||||||||||||||||
| 15 | The Reach Key West, Curio Collection | 8 | 7 | 11.1 | 20 | 18 | 11.0 | 42.6 | 42.5 | 10 | |||||||||||||||||||||||||||||||||||||||||||||||||
| 16 | Hilton Chicago | 5 | 3 | 71.5 | 59 | 56 | 7.1 | 8.4 | 5.2 | 320 | |||||||||||||||||||||||||||||||||||||||||||||||||
| 17 | W Chicago – City Center | 1 | 1 | 44.3 | 14 | 13 | 1.4 | 8.2 | 5.7 | 250 | |||||||||||||||||||||||||||||||||||||||||||||||||
| 18 | W Chicago – Lakeshore | (1) | (1) | 36.1 | 13 | 13 | (5.2) | (7.0) | (10.4) | 340 | |||||||||||||||||||||||||||||||||||||||||||||||||
| 19 | DoubleTree Hotel Washington DC – Crystal City | 8 | 7 | 13.3 | 24 | 22 | 8.3 | 32.1 | 30.7 | 140 | |||||||||||||||||||||||||||||||||||||||||||||||||
| 20 | Hilton Denver City Center | 7 | 7 | 0.2 | 21 | 21 | (1.0) | 34.0 | 33.6 | 40 | |||||||||||||||||||||||||||||||||||||||||||||||||
| 21 | Royal Palm South Beach Miami | 10 | 10 | 6.2 | 24 | 23 | 2.5 | 43.2 | 41.7 | 150 | |||||||||||||||||||||||||||||||||||||||||||||||||
| 22 | Hyatt Centric Fisherman's Wharf | 1 | 1 | (44.4) | 10 | 11 | (5.0) | 6.0 | 10.3 | (430) | |||||||||||||||||||||||||||||||||||||||||||||||||
| 23 | JW Marriott San Francisco Union Square | 3 | 4 | (17.1) | 20 | 20 | (0.6) | 15.8 | 18.9 | (310) | |||||||||||||||||||||||||||||||||||||||||||||||||
| 24 | DoubleTree Hotel San Jose | 2 | 1 | 68.4 | 15 | 15 | 4.0 | 12.4 | 7.6 | 480 | |||||||||||||||||||||||||||||||||||||||||||||||||
| 25 | Juniper Hotel Cupertino, Curio Collection | 2 | 1 | 139.0 | 7 | 6 | 25.5 | 27.6 | 14.5 | 1,310 | |||||||||||||||||||||||||||||||||||||||||||||||||
| Total Core Hotels | 330 | 299 | 10.4 | 1,079 | 1,019 | 5.9 | 30.6 | 29.4 | 120 | ||||||||||||||||||||||||||||||||||||||||||||||||||
| All Other Hotels | 37 | 38 | (3.1) | 203 | 197 | 2.3 | 18.3 | 19.3 | (100) | ||||||||||||||||||||||||||||||||||||||||||||||||||
| Total Comparable Hotels | $ | 367 | $ | 337 | 8.8 | % | $ | 1,282 | $ | 1,216 | 5.4 | % | 28.6 | % | 27.7 | % | 90 | bps | |||||||||||||||||||||||||||||||||||||||||
27 | | |||||||
| Properties Acquired and Sold | |||||

28 | | |||||||
| Properties Acquired and Sold | ||||||||
| Properties Acquired | ||||||||
| Hotel | Location | Room Count | ||||||
| 2019 Acquisitions: | ||||||||
Chesapeake Lodging Trust Acquisition(1) | ||||||||
| Hilton Denver City Center | Denver, CO | 613 | ||||||
| W Chicago – Lakeshore | Chicago, IL | 520 | ||||||
| Hyatt Regency Boston | Boston, MA | 502 | ||||||
| Hyatt Regency Mission Bay Spa and Marina | San Diego, CA | 438 | ||||||
| Boston Marriott Newton | Newton, MA | 430 | ||||||
Le Meridien New Orleans(2) | New Orleans, LA | 410 | ||||||
| W Chicago – City Center | Chicago, IL | 403 | ||||||
| Royal Palm South Beach Miami, a Tribute Portfolio Resort | Miami Beach, FL | 393 | ||||||
Le Meridien San Francisco(3) | San Francisco, CA | 360 | ||||||
| JW Marriott San Francisco Union Square | San Francisco, CA | 344 | ||||||
| Hyatt Centric Fisherman’s Wharf | San Francisco, CA | 316 | ||||||
Hotel Indigo San Diego Gaslamp Quarter(4) | San Diego, CA | 210 | ||||||
Courtyard Washington Capitol Hill/Navy Yard(4) | Washington, DC | 204 | ||||||
Homewood Suites by Hilton Seattle Convention Center Pike Street(5) | Seattle, WA | 195 | ||||||
| Hilton Checkers Los Angeles | Los Angeles, CA | 193 | ||||||
Ace Hotel Downtown Los Angeles(2) | Los Angeles, CA | 182 | ||||||
Hotel Adagio, Autograph Collection(6) | San Francisco, CA | 171 | ||||||
W New Orleans – French Quarter(7) | New Orleans, LA | 97 | ||||||
| 5,981 | ||||||||
29 | | |||||||
| Properties Acquired and Sold (continued) | ||||||||
| Properties Sold | ||||||||
| Hotel | Location | Month Sold | Room Count | Gross Proceeds | ||||||||||||||||||||||
| (in millions) | ||||||||||||||||||||||||||
| 2018 Total Sales (13 Hotels) | 3,193 | $ | 519.0 | |||||||||||||||||||||||
| 2019 Total Sales (8 Hotels) | 2,597 | $ | 496.9 | |||||||||||||||||||||||
| 2020 Total Sales (2 Hotels) | 700 | $ | 207.9 | |||||||||||||||||||||||
| 2021 Total Sales (5 Hotels) | 1,042 | $ | 476.6 | |||||||||||||||||||||||
| 2022 Sales: | ||||||||||||||||||||||||||
| Hampton Inn & Suites Memphis – Shady Grove | Memphis, Tennessee | April 2022 | 131 | $ | 11.5 | |||||||||||||||||||||
| Hilton Chicago/Oak Brook Suites | Chicago, Illinois | May 2022 | 211 | 10.3 | ||||||||||||||||||||||
| Homewood Suites by Hilton Seattle Convention Center Pike Street | Seattle, Washington | June 2022 | 195 | 80.0 | ||||||||||||||||||||||
Hilton San Diego Bayfront(1) | San Diego, California | June 2022 | 1,190 | 157.0 | ||||||||||||||||||||||
| Hilton Garden Inn Chicago/Oakbrook Terrace | Chicago, Illinois | July 2022 | 128 | 9.4 | ||||||||||||||||||||||
| Hilton Garden Inn LAX/El Segundo | El Segundo, California | September 2022 | 162 | 37.5 | ||||||||||||||||||||||
DoubleTree Hotel Las Vegas Airport(2) | Las Vegas, Nevada | October 2022 | 190 | 11.2 | ||||||||||||||||||||||
| 2022 Total (7 Hotels) | 2,207 | $ | 316.9 | |||||||||||||||||||||||
| 2023 Sales: | ||||||||||||||||||||||||||
| Hilton Miami Airport | Miami, Florida | February 2023 | 508 | $ | 118.3 | |||||||||||||||||||||
| 2023 Total (1 Hotel) | 508 | $ | 118.3 | |||||||||||||||||||||||
| 2024 Sales: | ||||||||||||||||||||||||||
Hilton La Jolla Torrey Pines(3) | La Jolla, California | July 2024 | 394 | $ | 41.3 | |||||||||||||||||||||
| 2024 Total (1 Hotel) | 394 | $ | 41.3 | |||||||||||||||||||||||
Grand Total(4) (37 Hotels) | 10,641 | $ | 2,176.9 | |||||||||||||||||||||||
30 | | |||||||
| Comparable Supplementary Financial Information | |||||
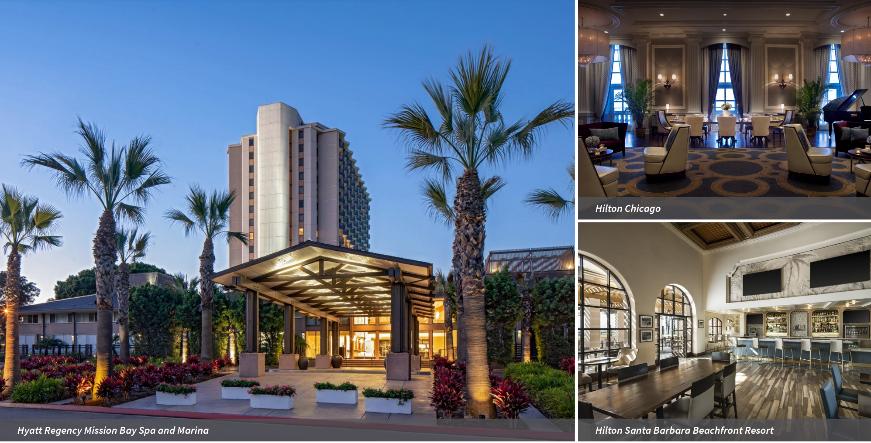
31 | | |||||||
| Comparable Supplementary Financial Information | ||||||||
Historical Comparable TTM Hotel Metrics | ||||||||
| (unaudited, dollars in millions) | ||||||||||||||||||||||||||||||||
| Three Months Ended | TTM | |||||||||||||||||||||||||||||||
| September 30, | December 31, | March 31, | June 30, | June 30, | ||||||||||||||||||||||||||||
| 2023 | 2023 | 2024 | 2024 | 2024 | ||||||||||||||||||||||||||||
| Comparable RevPAR | $ | 182.08 | $ | 178.25 | $ | 175.65 | $ | 194.90 | $ | 182.71 | ||||||||||||||||||||||
| Comparable Occupancy | 75.3 | % | 71.0 | % | 70.9 | % | 77.1 | % | 73.6 | % | ||||||||||||||||||||||
| Comparable ADR | $ | 241.74 | $ | 250.93 | $ | 247.91 | $ | 252.90 | $ | 248.36 | ||||||||||||||||||||||
| Total Revenues | $ | 679 | $ | 657 | $ | 639 | $ | 686 | $ | 2,661 | ||||||||||||||||||||||
| Operating income | $ | 85 | $ | 276 | $ | 92 | $ | 121 | $ | 574 | ||||||||||||||||||||||
Operating income margin(1) | 12.5 | % | 42.0 | % | 14.5 | % | 17.5 | % | 21.5 | % | ||||||||||||||||||||||
| Comparable Hotel Revenues | $ | 606 | $ | 619 | $ | 618 | $ | 664 | $ | 2,507 | ||||||||||||||||||||||
| Comparable Hotel Adjusted EBITDA | $ | 172 | $ | 171 | $ | 168 | $ | 199 | $ | 710 | ||||||||||||||||||||||
Comparable Hotel Adjusted EBITDA margin(1) | 28.4 | % | 27.5 | % | 27.3 | % | 29.9 | % | 28.3 | % | ||||||||||||||||||||||
| Three Months Ended | Full-Year | |||||||||||||||||||||||||||||||
| March 31, | June 30, | September 30, | December 31, | December 31, | ||||||||||||||||||||||||||||
| 2023 | 2023 | 2023 | 2023 | 2023 | ||||||||||||||||||||||||||||
| Comparable RevPAR | $ | 162.91 | $ | 191.03 | $ | 182.08 | $ | 178.25 | $ | 178.62 | ||||||||||||||||||||||
| Comparable Occupancy | 67.4 | % | 77.0 | % | 75.3 | % | 71.0 | % | 72.7 | % | ||||||||||||||||||||||
| Comparable ADR | $ | 241.96 | $ | 248.33 | $ | 241.74 | $ | 250.93 | $ | 245.80 | ||||||||||||||||||||||
| Total Revenues | $ | 648 | $ | 714 | $ | 679 | $ | 657 | $ | 2,698 | ||||||||||||||||||||||
| Operating income (loss) | $ | 80 | $ | (98) | $ | 85 | $ | 276 | $ | 343 | ||||||||||||||||||||||
Operating income (loss) margin(1) | 12.4 | % | (13.7) | % | 12.5 | % | 42.0 | % | 12.7 | % | ||||||||||||||||||||||
| Comparable Hotel Revenues | $ | 573 | $ | 643 | $ | 606 | $ | 619 | $ | 2,441 | ||||||||||||||||||||||
| Comparable Hotel Adjusted EBITDA | $ | 145 | $ | 192 | $ | 172 | $ | 171 | $ | 680 | ||||||||||||||||||||||
Comparable Hotel Adjusted EBITDA margin(1) | 25.4 | % | 29.8 | % | 28.4 | % | 27.5 | % | 27.8 | % | ||||||||||||||||||||||
| Three Months Ended | Full-Year | |||||||||||||||||||||||||||||||
| March 31, | June 30, | September 30, | December 31, | December 31, | ||||||||||||||||||||||||||||
| 2019 | 2019 | 2019 | 2019 | 2019 | ||||||||||||||||||||||||||||
| Comparable RevPAR | $ | 164.00 | $ | 188.52 | $ | 182.97 | $ | 173.93 | $ | 177.40 | ||||||||||||||||||||||
| Comparable Occupancy | 76.2 | % | 84.8 | % | 83.4 | % | 79.6 | % | 81.1 | % | ||||||||||||||||||||||
| Comparable ADR | $ | 215.36 | $ | 222.26 | $ | 219.29 | $ | 218.44 | $ | 218.94 | ||||||||||||||||||||||
| Total Revenues | $ | 659 | $ | 703 | $ | 672 | $ | 810 | $ | 2,844 | ||||||||||||||||||||||
| Operating income | $ | 129 | $ | 111 | $ | 38 | $ | 148 | $ | 426 | ||||||||||||||||||||||
Operating income margin(1) | 19.5 | % | 15.8 | % | 5.8 | % | 18.2 | % | 15.0 | % | ||||||||||||||||||||||
| Comparable Hotel Revenues | $ | 578 | $ | 655 | $ | 619 | $ | 637 | $ | 2,489 | ||||||||||||||||||||||
| Comparable Hotel Adjusted EBITDA | $ | 154 | $ | 205 | $ | 178 | $ | 190 | $ | 727 | ||||||||||||||||||||||
Comparable Hotel Adjusted EBITDA margin(1) | 26.7 | % | 31.4 | % | 28.7 | % | 29.8 | % | 29.2 | % | ||||||||||||||||||||||
32 | | |||||||
| Comparable Supplementary Financial Information (continued) | ||||||||
Historical Comparable Hotel Adjusted EBITDA – TTM | ||||||||
| Three Months Ended | TTM | |||||||||||||||||||||||||||||||
| (unaudited, in millions) | September 30, | December 31, | March 31, | June 30, | June 30, | |||||||||||||||||||||||||||
| 2023 | 2023 | 2024 | 2024 | 2024 | ||||||||||||||||||||||||||||
| Net income | $ | 31 | $ | 188 | $ | 29 | $ | 67 | $ | 315 | ||||||||||||||||||||||
| Depreciation and amortization expense | 65 | 94 | 65 | 64 | 288 | |||||||||||||||||||||||||||
| Interest income | (9) | (9) | (5) | (5) | (28) | |||||||||||||||||||||||||||
| Interest expense | 51 | 52 | 53 | 54 | 210 | |||||||||||||||||||||||||||
| Interest expense associated with hotels in receivership | 14 | 14 | 14 | 15 | 57 | |||||||||||||||||||||||||||
| Income tax expense (benefit) | — | 33 | 1 | (12) | 22 | |||||||||||||||||||||||||||
| Interest expense, income tax and depreciation and amortization included in equity in earnings from investments in affiliates | 2 | 1 | 3 | 2 | 8 | |||||||||||||||||||||||||||
| EBITDA | 154 | 373 | 160 | 185 | 872 | |||||||||||||||||||||||||||
Gain on derecognition of assets(1) | — | (221) | (14) | (15) | (250) | |||||||||||||||||||||||||||
| Share-based compensation expense | 5 | 4 | 4 | 5 | 18 | |||||||||||||||||||||||||||
| Impairment and casualty loss | — | — | 6 | 7 | 13 | |||||||||||||||||||||||||||
| Other items | 4 | 7 | 6 | 11 | 28 | |||||||||||||||||||||||||||
| Adjusted EBITDA | 163 | 163 | 162 | 193 | 681 | |||||||||||||||||||||||||||
| Less: Adjusted EBITDA from hotels disposed of | — | — | (1) | — | (1) | |||||||||||||||||||||||||||
| Less: Adjusted EBITDA from investments in affiliates disposed of | (1) | (1) | (1) | (1) | (4) | |||||||||||||||||||||||||||
| Less: Adjusted EBITDA from the Hilton San Francisco Hotels | (1) | 2 | — | — | 1 | |||||||||||||||||||||||||||
| Comparable Adjusted EBITDA | 161 | 164 | 160 | 192 | 677 | |||||||||||||||||||||||||||
| Less: Adjusted EBITDA from investments in affiliates | (3) | (4) | (7) | (7) | (21) | |||||||||||||||||||||||||||
Add: All other(2) | 14 | 11 | 15 | 14 | 54 | |||||||||||||||||||||||||||
| Comparable Hotel Adjusted EBITDA | $ | 172 | $ | 171 | $ | 168 | $ | 199 | $ | 710 | ||||||||||||||||||||||
33 | | |||||||
| Comparable Supplementary Financial Information (continued) | ||||||||
| Historical Comparable Hotel Adjusted EBITDA – Full-Year 2023 | ||||||||
| Three Months Ended | Full-Year | |||||||||||||||||||||||||||||||
| (unaudited, in millions) | March 31, | June 30, | September 30, | December 31, | December 31, | |||||||||||||||||||||||||||
| 2023 | 2023 | 2023 | 2023 | 2023 | ||||||||||||||||||||||||||||
| Net income (loss) | $ | 33 | $ | (146) | $ | 31 | $ | 188 | $ | 106 | ||||||||||||||||||||||
| Depreciation and amortization expense | 64 | 64 | 65 | 94 | 287 | |||||||||||||||||||||||||||
| Interest income | (10) | (10) | (9) | (9) | (38) | |||||||||||||||||||||||||||
| Interest expense | 52 | 52 | 51 | 52 | 207 | |||||||||||||||||||||||||||
| Interest expense associated with hotels in receivership | 8 | 9 | 14 | 14 | 45 | |||||||||||||||||||||||||||
| Income tax expense | 2 | 3 | — | 33 | 38 | |||||||||||||||||||||||||||
Interest expense, income tax and depreciation and amortization included in equity in earnings from investments in affiliates | 3 | 2 | 2 | 1 | 8 | |||||||||||||||||||||||||||
| EBITDA | 152 | (26) | 154 | 373 | 653 | |||||||||||||||||||||||||||
Gain on sales of assets, net | (15) | — | — | — | (15) | |||||||||||||||||||||||||||
Gain on derecognition of assets(1) | — | — | — | (221) | (221) | |||||||||||||||||||||||||||
Gain on sale of investments in affiliates(2) | — | (3) | — | — | (3) | |||||||||||||||||||||||||||
| Share-based compensation expense | 4 | 5 | 5 | 4 | 18 | |||||||||||||||||||||||||||
| Casualty and impairment loss | 1 | 203 | — | — | 204 | |||||||||||||||||||||||||||
| Other items | 4 | 8 | 4 | 7 | 23 | |||||||||||||||||||||||||||
| Adjusted EBITDA | 146 | 187 | 163 | 163 | 659 | |||||||||||||||||||||||||||
| Less: Adjusted EBITDA from hotels disposed of | (2) | (1) | — | — | (3) | |||||||||||||||||||||||||||
Less: Adjusted EBITDA from investments in affiliates disposed of | (1) | (1) | (1) | (1) | (4) | |||||||||||||||||||||||||||
Less: Adjusted EBITDA from the Hilton San Francisco Hotels | (5) | 1 | (1) | 2 | (3) | |||||||||||||||||||||||||||
Comparable Adjusted EBITDA | 138 | 186 | 161 | 164 | 649 | |||||||||||||||||||||||||||
| Less: Adjusted EBITDA from investments in affiliates | (6) | (7) | (3) | (4) | (20) | |||||||||||||||||||||||||||
Add: All other(3) | 13 | 13 | 14 | 11 | 51 | |||||||||||||||||||||||||||
Comparable Hotel Adjusted EBITDA | $ | 145 | $ | 192 | $ | 172 | $ | 171 | $ | 680 | ||||||||||||||||||||||
34 | | |||||||
| Comparable Supplementary Financial Information (continued) | ||||||||
| Historical Comparable Hotel Adjusted EBITDA – Full-Year 2019 | ||||||||
| Three Months Ended | Full-Year | |||||||||||||||||||||||||||||||
| (unaudited, in millions) | March 31, | June 30, | September 30, | December 31, | December 31, | |||||||||||||||||||||||||||
| 2019 | 2019 | 2019 | 2019 | 2019 | ||||||||||||||||||||||||||||
| Net income | $ | 97 | $ | 84 | $ | 9 | $ | 126 | $ | 316 | ||||||||||||||||||||||
| Depreciation and amortization expense | 62 | 61 | 61 | 80 | 264 | |||||||||||||||||||||||||||
| Interest income | (1) | (2) | (2) | (1) | (6) | |||||||||||||||||||||||||||
| Interest expense | 25 | 26 | 25 | 34 | 110 | |||||||||||||||||||||||||||
| Interest expense associated with hotels in receivership | 7 | 7 | 8 | 8 | 30 | |||||||||||||||||||||||||||
| Income tax expense | 7 | 5 | — | 23 | 35 | |||||||||||||||||||||||||||
| Interest expense, income tax and depreciation and amortization included in equity in earnings from investments in affiliates | 5 | 7 | 7 | 4 | 23 | |||||||||||||||||||||||||||
| EBITDA | 202 | 188 | 108 | 274 | 772 | |||||||||||||||||||||||||||
| (Gain) loss on sales of assets, net | (31) | 12 | (1) | 1 | (19) | |||||||||||||||||||||||||||
Gain on sale of investments in affiliates(1) | — | — | — | (44) | (44) | |||||||||||||||||||||||||||
| Acquisition costs | — | 6 | 59 | 5 | 70 | |||||||||||||||||||||||||||
| Severance expense | 1 | 1 | — | — | 2 | |||||||||||||||||||||||||||
| Share-based compensation expense | 4 | 4 | 4 | 4 | 16 | |||||||||||||||||||||||||||
| Casualty loss (gain) and impairment loss, net | — | — | 8 | (26) | (18) | |||||||||||||||||||||||||||
| Other items | — | (4) | 2 | 9 | 7 | |||||||||||||||||||||||||||
| Adjusted EBITDA | 176 | 207 | 180 | 223 | 786 | |||||||||||||||||||||||||||
| Add: Adjusted EBITDA from hotels acquired | 37 | 53 | 39 | — | 129 | |||||||||||||||||||||||||||
| Less: Adjusted EBITDA from hotels disposed of | (31) | (30) | (19) | (18) | (98) | |||||||||||||||||||||||||||
| Less: Adjusted EBITDA from investments in affiliates disposed of | (4) | (6) | (6) | (4) | (20) | |||||||||||||||||||||||||||
| Less: Adjusted EBITDA from the Hilton San Francisco Hotels | (33) | (27) | (25) | (21) | (106) | |||||||||||||||||||||||||||
Comparable Adjusted EBITDA(2) | 145 | 197 | 169 | 180 | 691 | |||||||||||||||||||||||||||
| Less: Adjusted EBITDA from investments in affiliates | (6) | (6) | (3) | (2) | (17) | |||||||||||||||||||||||||||
Add: All other(3) | 15 | 14 | 12 | 12 | 53 | |||||||||||||||||||||||||||
| Comparable Hotel Adjusted EBITDA | $ | 154 | $ | 205 | $ | 178 | $ | 190 | $ | 727 | ||||||||||||||||||||||
35 | | |||||||
| Comparable Supplementary Financial Information (continued) | ||||||||
Historical Comparable TTM Hotel Revenues – 2024, 2023 and 2019 | ||||||||
| Three Months Ended | TTM | |||||||||||||||||||||||||||||||
| (unaudited, in millions) | September 30, 2023 | December 31, 2023 | March 31, 2024 | June 30, 2024 | June 30, 2024 | |||||||||||||||||||||||||||
| Total Revenues | $ | 679 | $ | 657 | $ | 639 | $ | 686 | $ | 2,661 | ||||||||||||||||||||||
| Less: Other revenue | (22) | (21) | (21) | (22) | (86) | |||||||||||||||||||||||||||
Less: Revenues from the Hilton San Francisco Hotels | (51) | (17) | — | — | (68) | |||||||||||||||||||||||||||
| Comparable Hotel Revenues | $ | 606 | $ | 619 | $ | 618 | $ | 664 | $ | 2,507 | ||||||||||||||||||||||
| Three Months Ended | Full-Year | |||||||||||||||||||||||||||||||
| March 31, 2023 | June 30, 2023 | September 30, 2023 | December 31, 2023 | December 31, 2023 | ||||||||||||||||||||||||||||
| Total Revenues | $ | 648 | $ | 714 | $ | 679 | $ | 657 | $ | 2,698 | ||||||||||||||||||||||
| Less: Other revenue | (20) | (22) | (22) | (21) | (85) | |||||||||||||||||||||||||||
| Less: Revenues from hotels disposed of | (7) | (3) | — | — | (10) | |||||||||||||||||||||||||||
Less: Revenues from the Hilton San Francisco Hotels | (48) | (46) | (51) | (17) | (162) | |||||||||||||||||||||||||||
| Comparable Hotel Revenues | $ | 573 | $ | 643 | $ | 606 | $ | 619 | $ | 2,441 | ||||||||||||||||||||||
| Three Months Ended | Full-Year | |||||||||||||||||||||||||||||||
| March 31, 2019 | June 30, 2019 | September 30, 2019 | December 31, 2019 | December 31, 2019 | ||||||||||||||||||||||||||||
| Total Revenues | $ | 659 | $ | 703 | $ | 672 | $ | 810 | $ | 2,844 | ||||||||||||||||||||||
| Less: Other revenue | (18) | (19) | (22) | (18) | (77) | |||||||||||||||||||||||||||
| Add: Revenues from hotels acquired | 130 | 151 | 125 | — | 406 | |||||||||||||||||||||||||||
| Less: Revenues from hotels disposed of | (98) | (92) | (70) | (70) | (330) | |||||||||||||||||||||||||||
Less: Revenues from the Hilton San Francisco Hotels | (95) | (88) | (86) | (85) | (354) | |||||||||||||||||||||||||||
| Comparable Hotel Revenues | $ | 578 | $ | 655 | $ | 619 | $ | 637 | $ | 2,489 | ||||||||||||||||||||||
36 | | |||||||
| Capital Structure | |||||

37 | | |||||||
| Capital Structure | ||||||||
| Fixed and Variable Rate Debt | ||||||||
| (unaudited, dollars in millions) | ||||||||||||||||||||||||||
| Debt | Collateral | Interest Rate | Maturity Date | As of June 30, 2024 | ||||||||||||||||||||||
| Fixed Rate Debt | ||||||||||||||||||||||||||
| Mortgage loan | Hilton Denver City Center | 4.90% | September 2024(1) | $ | 53 | |||||||||||||||||||||
| Mortgage loan | Hyatt Regency Boston | 4.25% | July 2026 | 127 | ||||||||||||||||||||||
| Mortgage loan | DoubleTree Hotel Spokane City Center | 3.62% | July 2026 | 14 | ||||||||||||||||||||||
| Mortgage loan | Hilton Hawaiian Village Beach Resort | 4.20% | November 2026 | 1,275 | ||||||||||||||||||||||
| Mortgage loan | Hilton Santa Barbara Beachfront Resort | 4.17% | December 2026 | 158 | ||||||||||||||||||||||
| Mortgage loan | DoubleTree Hotel Ontario Airport | 5.37% | May 2027 | 30 | ||||||||||||||||||||||
| 2028 Senior Notes | 5.88% | October 2028 | 725 | |||||||||||||||||||||||
| 2029 Senior Notes | 4.88% | May 2029 | 750 | |||||||||||||||||||||||
| 2030 Senior Notes | 7.00% | February 2030 | 550 | |||||||||||||||||||||||
| Finance lease obligations | 7.66% | 2024 to 2028 | 1 | |||||||||||||||||||||||
| Total Fixed Rate Debt | 5.10%(2) | 3,683 | ||||||||||||||||||||||||
| Variable Rate Debt | ||||||||||||||||||||||||||
Revolver(3) | Unsecured | SOFR + 1.80%(4) | December 2026 | — | ||||||||||||||||||||||
| 2024 Term Loan | Unsecured | SOFR + 1.75%(4) | May 2027 | 200 | ||||||||||||||||||||||
| Total Variable Rate Debt | 7.18% | 200 | ||||||||||||||||||||||||
| Add: unamortized premium | — | |||||||||||||||||||||||||
| Less: unamortized deferred financing costs and discount | (27) | |||||||||||||||||||||||||
Total Debt(5)(6) | 5.21%(2) | $ | 3,856 | |||||||||||||||||||||||
38 | | |||||||
| Definitions | |||||

39 | | |||||||
| Definitions | ||||||||
40 | | |||||||
| Definitions (continued) | ||||||||
41 | | |||||||
| Definitions (continued) | ||||||||
42 | | |||||||
| Definitions (continued) | ||||||||
43 | | |||||||
| Analyst Coverage | ||||||||
| Analyst | Company | Phone | |||||||||
| Dany Asad | Bank of America | (646) 855-5238 | dany.asad@bofa.com | ||||||||
| Ari Klein | BMO Capital Markets | (212) 885-4103 | ari.klein@bmo.com | ||||||||
| Smedes Rose | Citi Research | (212) 816-6243 | smedes.rose@citi.com | ||||||||
| Floris Van Dijkum | Compass Point | (646) 757-2621 | fvandijkum@compasspointllc.com | ||||||||
| Chris Woronka | Deutsche Bank | (212) 250-9376 | chris.woronka@db.com | ||||||||
| Duane Pfennigwerth | Evercore ISI | (212) 497-0817 | duane.pfennigwerth@evercoreisi.com | ||||||||
| Christopher Darling | Green Street | (949) 640-8780 | cdarling@greenstreet.com | ||||||||
| Meredith Jensen | HSBC Global Research | (212) 525-6858 | meredith.jensen@us.hsbc.com | ||||||||
| David Katz | Jefferies | (212) 323-3355 | dkatz@jefferies.com | ||||||||
| Joe Greff | JP Morgan | (212) 622-0548 | joseph.greff@jpmorgan.com | ||||||||
| Stephen Grambling | Morgan Stanley | (212) 761-1010 | stephen.grambling@morganstanley.com | ||||||||
| Bill Crow | Raymond James | (727) 567-2594 | bill.crow@raymondjames.com | ||||||||
| Patrick Scholes | Truist Securities | (212) 319-3915 | patrick.scholes@research.Truist.com | ||||||||
| Robin Farley | UBS | (212) 713-2060 | robin.farley@ubs.com | ||||||||
| Richard Anderson | Wedbush Securities Inc. | (212) 938-9949 | richard.anderson@wedbush.com | ||||||||
| Dori Kesten | Wells Fargo | (617) 603-4262 | dori.kesten@wellsfargo.com | ||||||||
| Keegan Carl | Wolfe Research | (646) 582-9251 | kcarl@wolferesearch.com | ||||||||
44 | | |||||||