0000102729false00001027292024-07-242024-07-24

UNITED STATES

SECURITIES AND EXCHANGE COMMISSION

Washington, D.C. 20549

FORM 8-K

CURRENT REPORT

Pursuant to Section 13 OR 15(d) of The Securities Exchange Act of 1934

July 24, 2024

Date of Report (Date of earliest event reported)

Valmont Industries, Inc.

(Exact name of registrant as specified in its charter)

Delaware

(State or other jurisdiction of incorporation)

1-31429

47-0351813

(Commission File Number)

(IRS Employer Identification No.)

15000 Valmont Plaza

68154

Omaha, Nebraska

(Address of principal executive offices)

(Zip Code)

(402) 963-1000

Registrant's telephone number, including area code

N/A

(Former name or former address, if changed since last report.)

Check the appropriate box below if the Form 8-K filing is intended to simultaneously satisfy the filing obligation of the registrant under any of the following provisions (see General Instruction A.2. below):

      Written communications pursuant to Rule 425 under the Securities Act (17 CFR 230.425)

      Soliciting material pursuant to Rule 14a-12 under the Exchange Act (17 CFR 240.14a-12)

      Pre-commencement communications pursuant to Rule 14d-2(b) under the Exchange Act (17 CFR 240.14d-2(b))

      Pre-commencement communications pursuant to Rule 13e-4(c) under the Exchange Act (17 CFR 240.13e-4(c))

Securities registered pursuant to Section 12(b) of the Act:

Title of each class


Trading Symbol(s)


Name of each exchange on which registered

Common Stock, $1.00 par value

VMI

New York Stock Exchange

Indicate by check mark whether the registrant is an emerging growth company as defined in Rule 405 of the Securities Act of 1933 (§230.405 of this chapter) or Rule 12b-2 of the Securities Exchange Act of 1934 (§240.12b-2 of this chapter).

Emerging growth company    

If an emerging growth company, indicate by check mark if the registrant has elected not to use the extended transition period for complying with any new or revised financial accounting standards provided pursuant to Section 13(a) of the Exchange Act.

Item 2.02. Results of Operations and Financial Condition.

Valmont Industries, Inc. issued a press release on July 24, 2024 announcing its financial results for its fiscal quarter ended June 29, 2024. The press release, along with the presentation to be used during its earnings call on July 25, 2024, are furnished with this Form 8-K as Exhibit 99.1 and Exhibit 99.2, respectively.

The information in this Item 2.02 is being furnished and shall not be deemed “filed” for the purpose of Section 18 of the Securities Exchange Act of 1934, as amended, or otherwise subject to the liabilities of that section. The information in this Item 2.02 shall not be incorporated by reference into any registration statement or other document pursuant to the Securities Act of 1933, as amended.

Item 9.01. Financial Statements and Exhibits.

(d)    Exhibits.

Exhibit No.


Description

99.1

Press Release dated July 24, 2024

99.2

Presentation Slides for earnings call on July 25, 2024

104

Cover Page Interactive File (the cover page XBRL tags are embedded in the Inline XBRL document)

SIGNATURES

Pursuant to the requirements of the Securities Exchange Act of 1934, the registrant has duly caused this report to be signed on its behalf by the undersigned hereunto duly authorized.

Valmont Industries, Inc.

Date:

July 24, 2024

By:

/s/ TIMOTHY P. FRANCIS

Name:

Timothy P. Francis

Title:

Interim Chief Financial Officer

Graphic

Exhibit 99.1

FOR IMMEDIATE RELEASE

Contact:

Renee Campbell

Email:

renee.campbell@valmont.com

Date:

July 24, 2024

Valmont Reports Second Quarter 2024 Results and
Raises Full-Year 2024 Diluted Earnings per Share Guidance

OMAHA, Neb.-- Valmont® Industries, Inc. (NYSE: VMI), a global leader that provides vital infrastructure and advances agricultural productivity while driving innovation through technology, today reported financial results for the second quarter ended June 29, 2024.

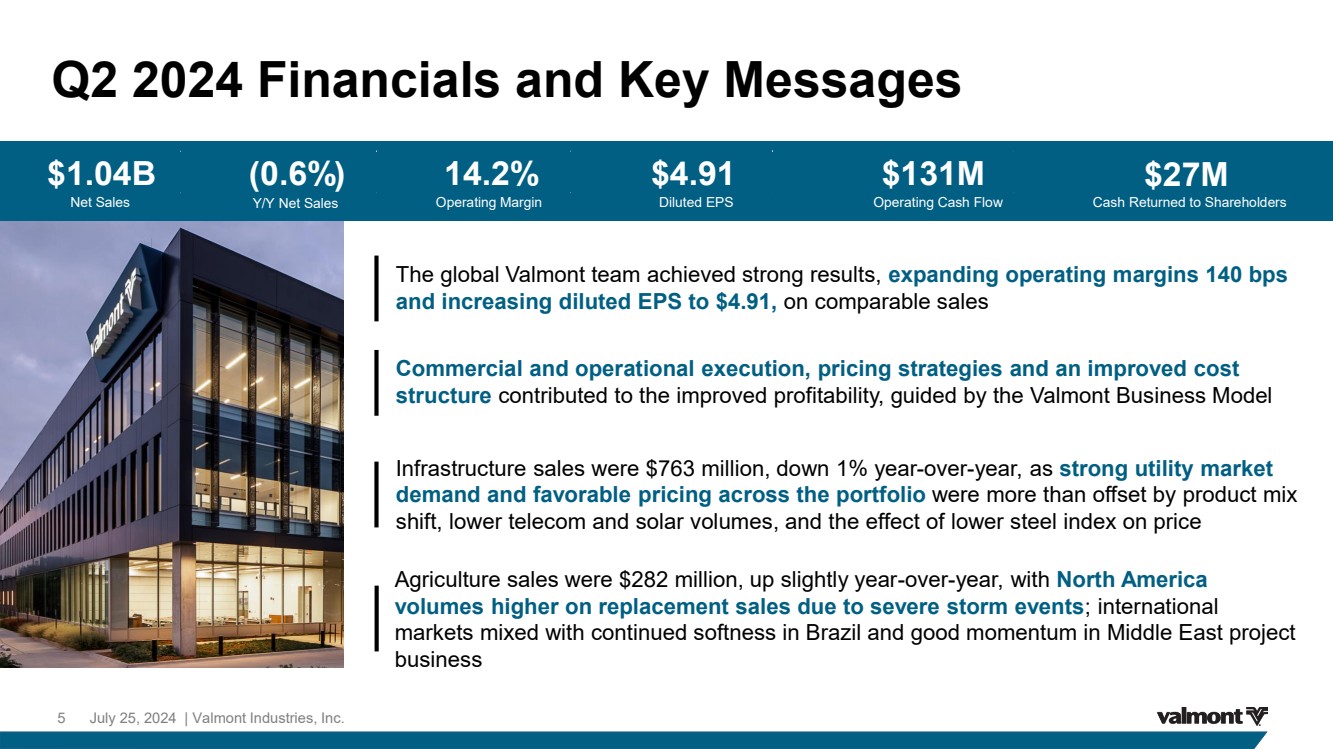
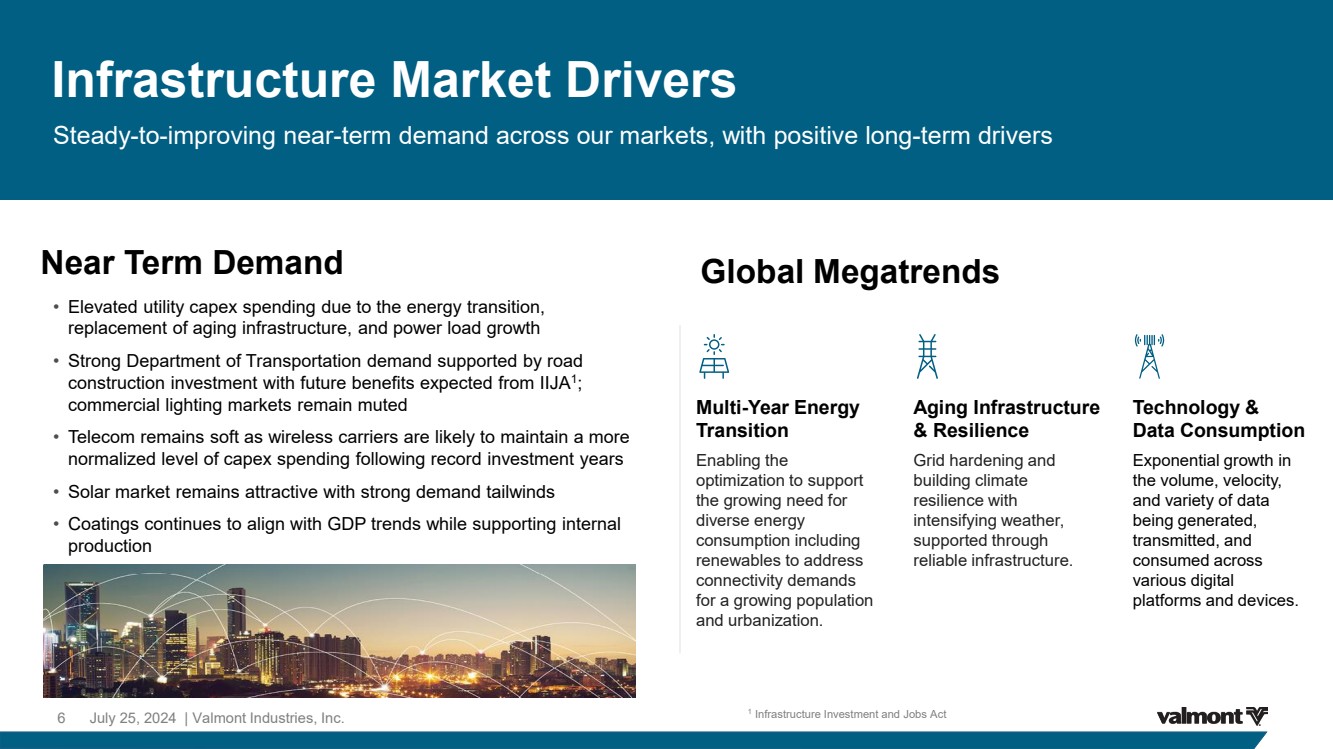
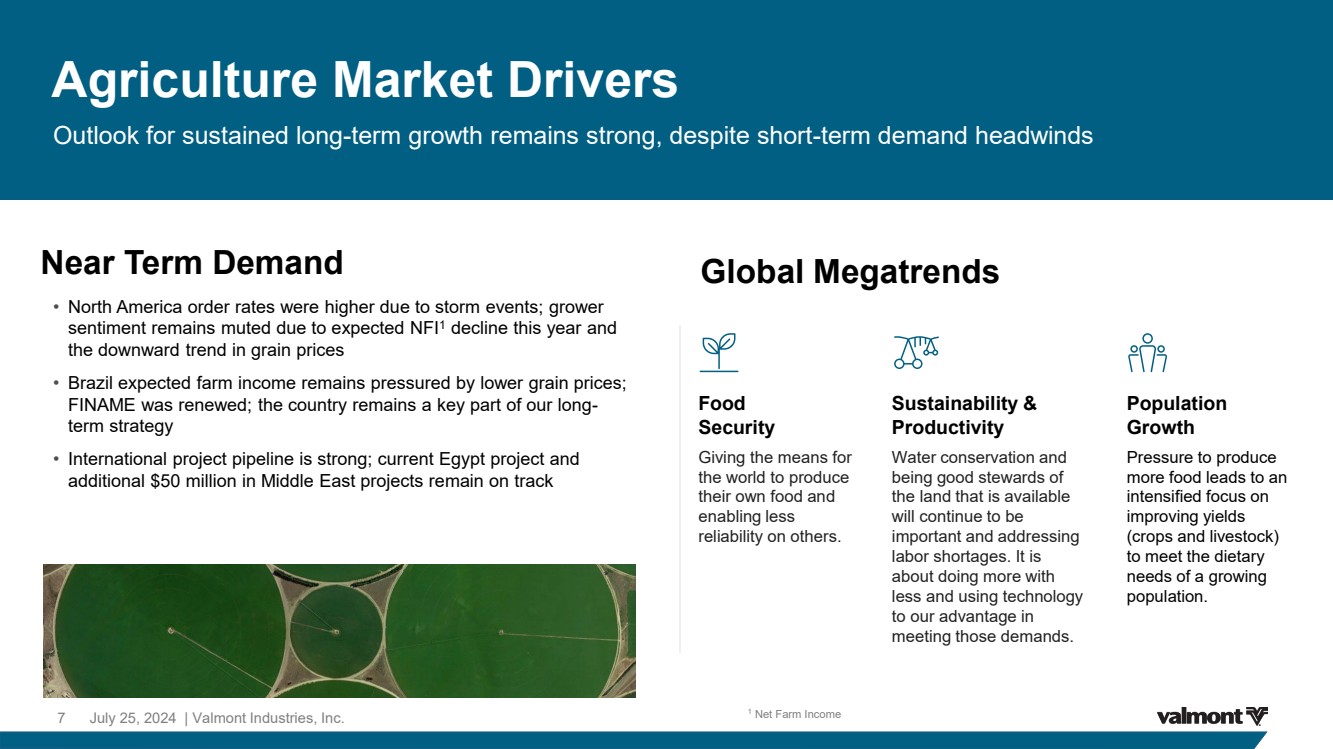
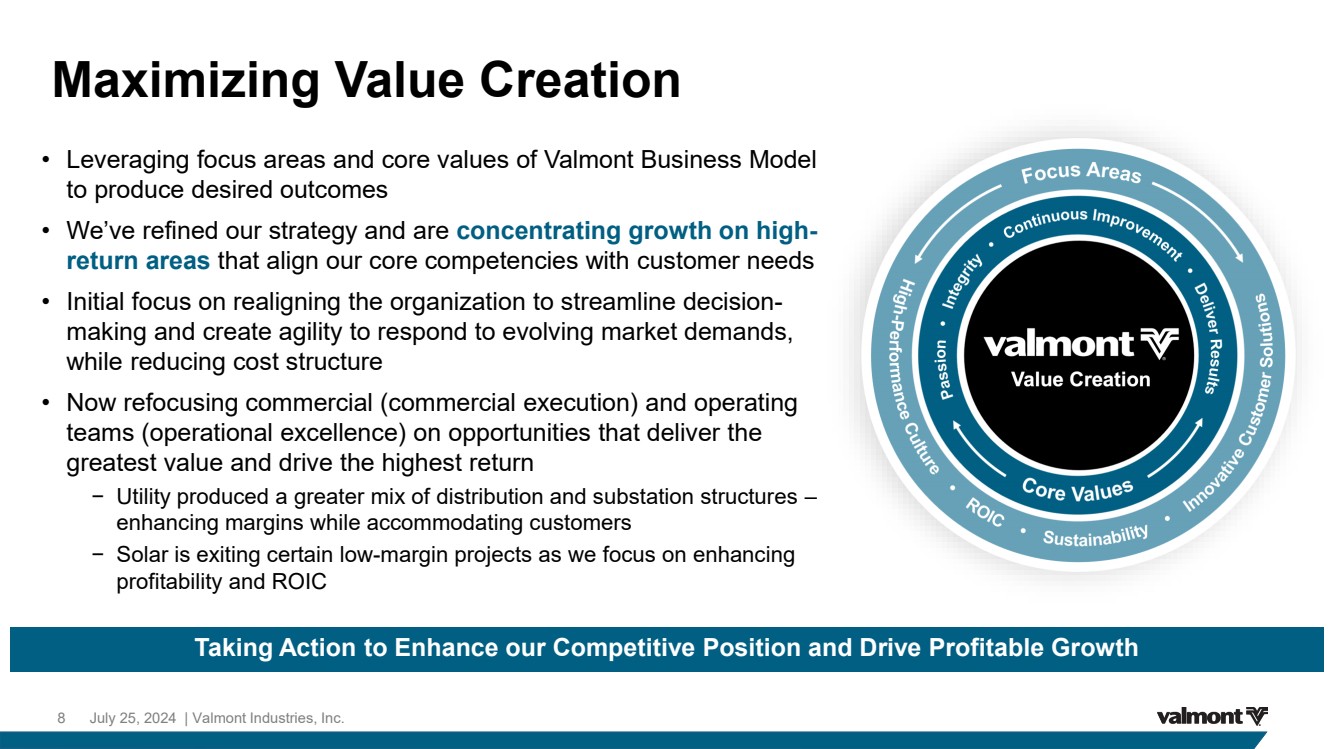
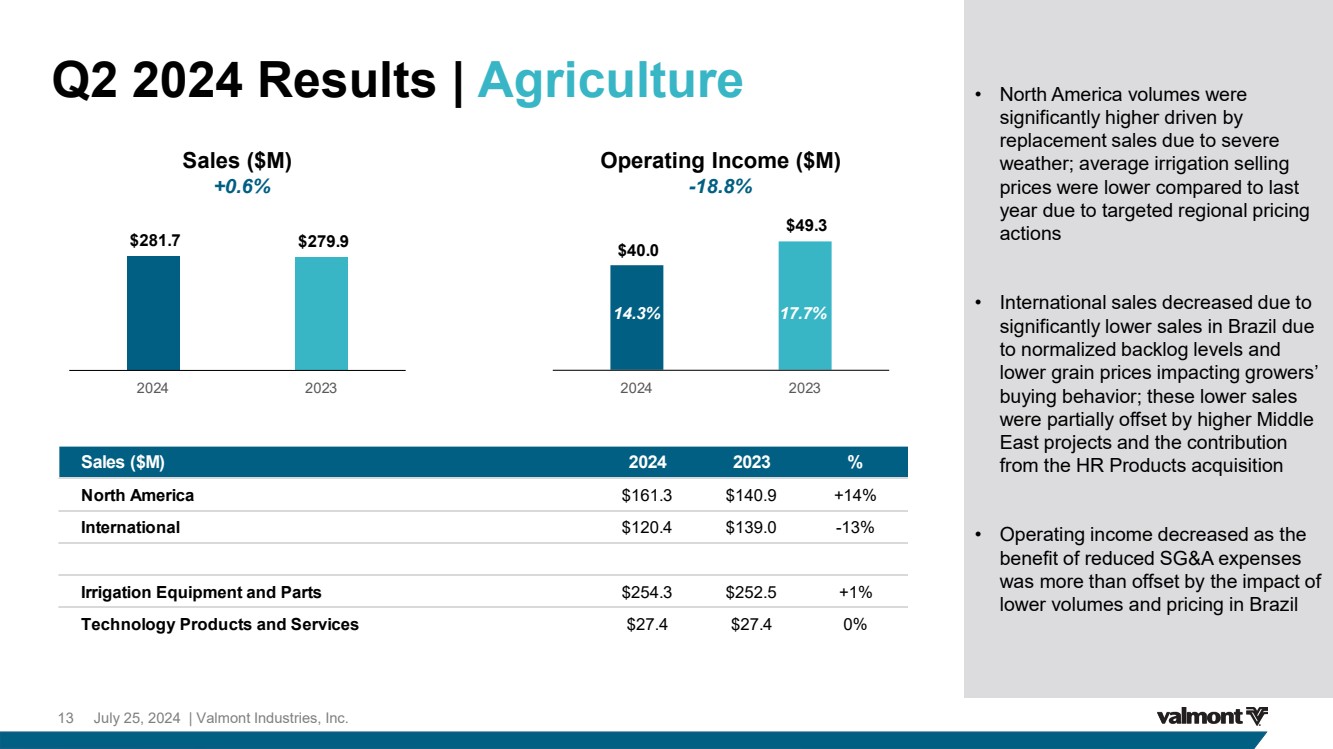
President and Chief Executive Officer Avner M. Applbaum commented, “Our team demonstrated their dedication to enhancing shareholder value by delivering another quarter of operating margin expansion and earnings per share growth. Second quarter results in both segments were driven by commercial and operational execution, pricing strategies, and a fundamentally improved cost structure. Additionally, our Infrastructure segment benefited from declining steel costs, contributing to higher profitability. We are steadily progressing in adjusting and expanding our factory output, creating flexibility to meet the evolving needs of our customers, a strategy that will continue to yield benefits in future quarters. In Agriculture, severe weather in the U.S. led to a large increase in replacement sales. Brazil remains soft as lower grain prices are impacting growers’ buying behavior, while Middle East projects are on track. We strengthened our balance sheet, with earnings growth and effective working capital management driving strong cash generation. This enables us to advance our capital allocation strategy and drive higher returns on invested capital. I am very pleased with our progress towards our strategic priorities which are grounded in the Valmont Business Model, helping us consistently create value and deliver outstanding results.”

Second Quarter 2024 Highlights (all metrics compared to Second Quarter 2023 unless otherwise noted)
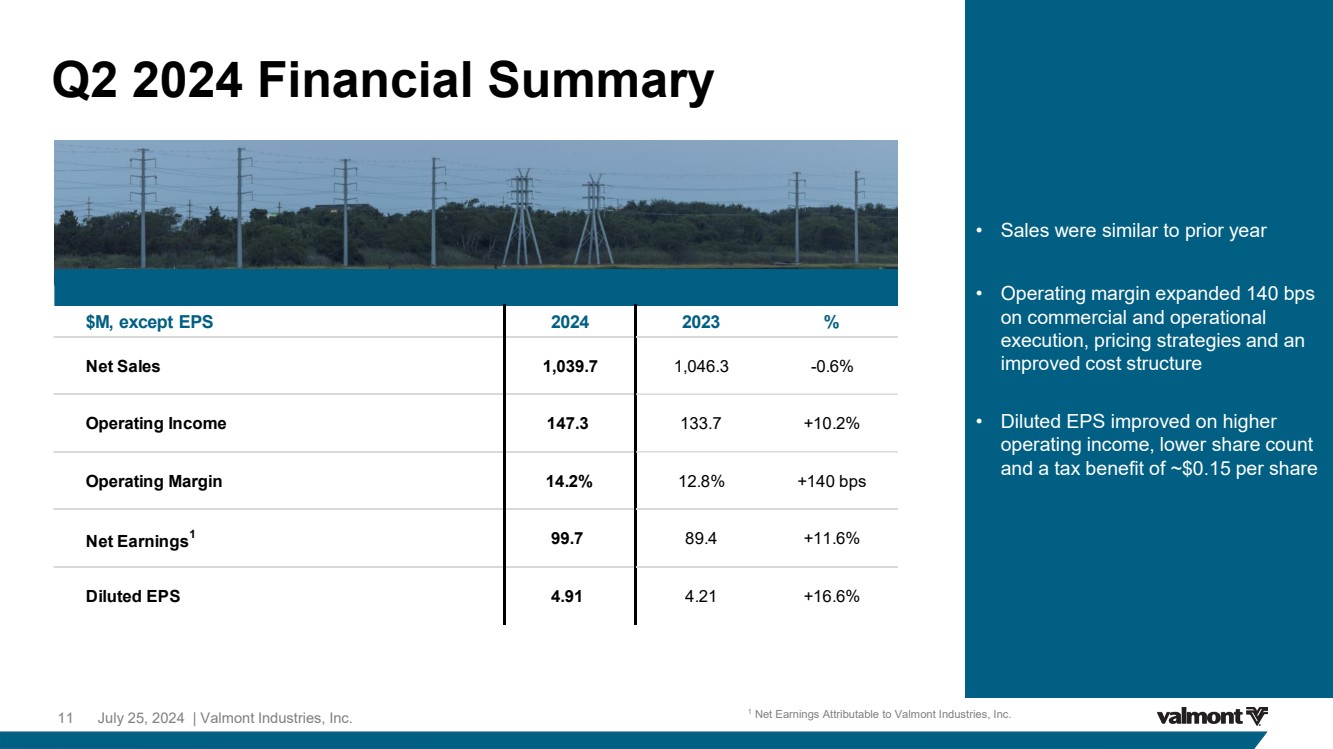
Net Sales of $1.0 billion were similar to prior year
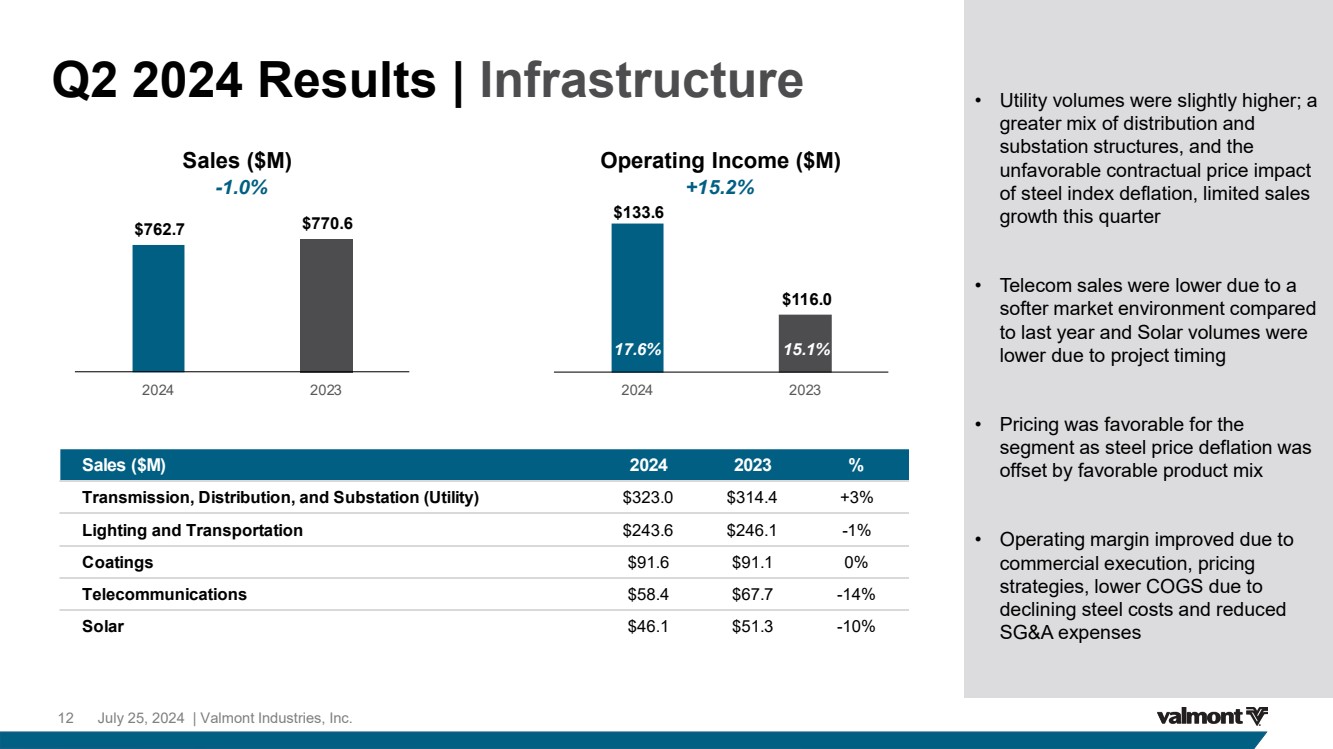
Operating Income increased 10.2% to $147.3 million or 14.2% of net sales compared to $133.7 million or 12.8% of net sales
Diluted Earnings per Share (EPS) grew 16.6% to $4.91 compared to $4.21; second quarter 2024 EPS includes a tax benefit of approximately $3.0 million or $0.15 per share
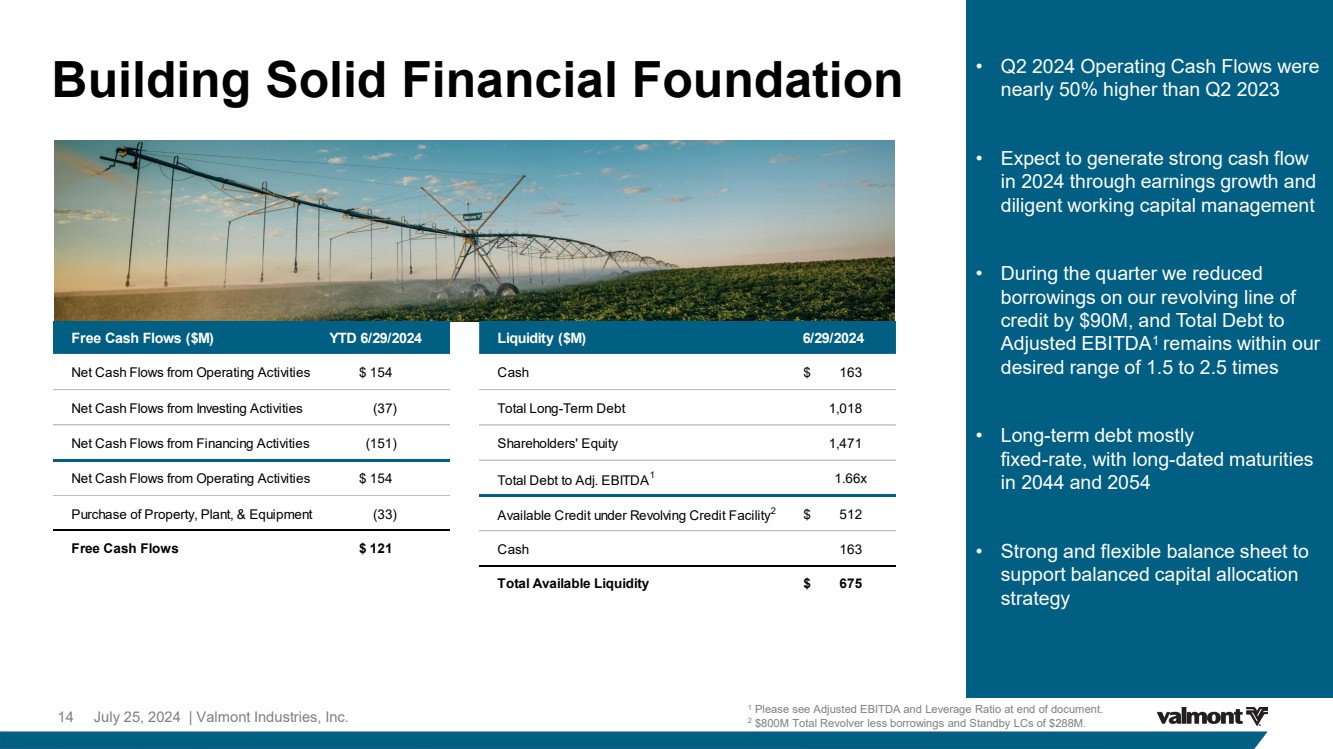
Generated operating cash flows of $130.8 million; cash and cash equivalents at the end of the second quarter were $163.1 million
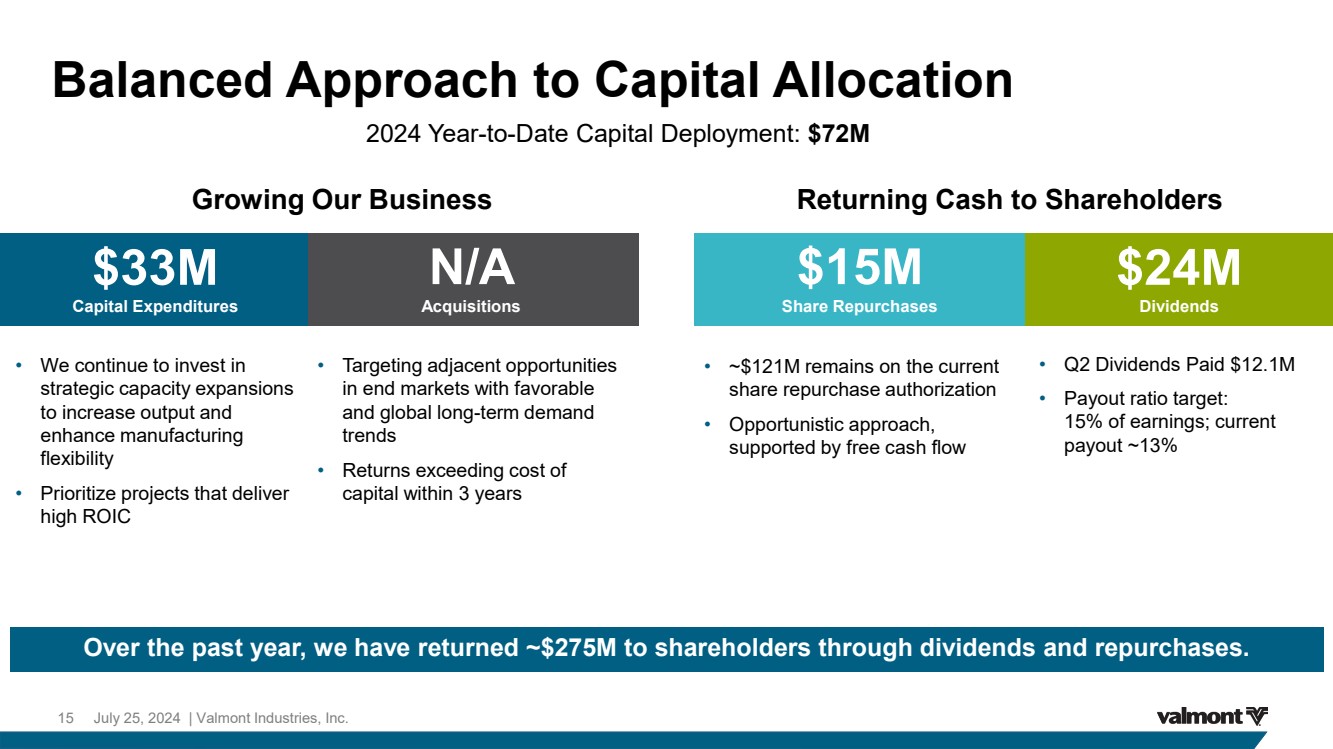
Returned $27.1 million to shareholders through share repurchases and dividends, and reduced borrowings on the revolving credit facility by approximately $90.0 million
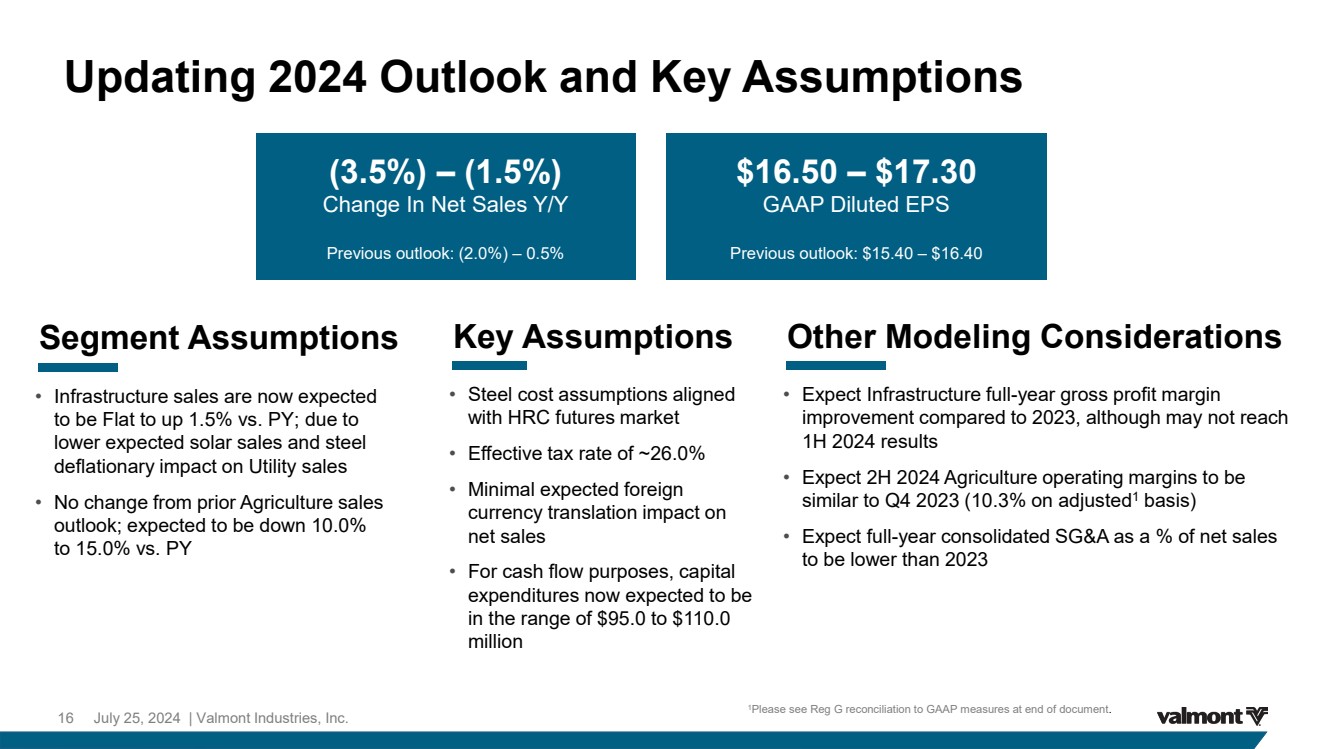
Raising full-year 2024 diluted EPS guidance to $16.50 to $17.30; previously $15.40 to $16.40

Key Financial Metrics

Second Quarter 2024

(000s except per share amounts)


6/29/2024


7/1/2023


Q2 2024

Q2 2023

vs. Q2 2023

Net Sales

$

1,039,737

$

1,046,296

(0.6)

%  

Gross Profit

320,282

329,397

(2.8)

%  

Gross Profit as a % of Net Sales

30.8

%  

31.5

%  

Operating Income

147,308

133,733

10.2

%  

Operating Income as a % of Net Sales

14.2

%  

12.8

%  

Net Earnings Attributable to Valmont Industries, Inc.1

99,716

89,376

11.6

%  

Diluted Earnings per Share1

4.91

4.21

16.6

%  

Weighted Average Shares Outstanding

20,292

21,229

Year-to-Date 2024

(000s except per share amounts)


6/29/2024


7/1/2023


FY 2024

FY 2023

vs. FY 2023

Net Sales

$

2,017,565

$

2,108,777

(4.3)

%  

Gross Profit

626,498

637,982

(1.8)

%  

Gross Profit as a % of Net Sales

31.1

%  

30.3

%  

Operating Income

278,861

252,199

10.6

%  

Operating Income as a % of Net Sales

13.8

%  

12.0

%  

Net Earnings Attributable to Valmont Industries, Inc.1

187,538

163,916

14.4

%  

Diluted Earnings per Share1

9.24

7.67

20.5

%  

Weighted Average Shares Outstanding

20,307

21,370

1Q2 2024 includes a tax benefit of approximately $3.0 million or $0.15 per share due to the reduction of a valuation allowance on a tax loss carryforward in a foreign subsidiary

Second Quarter 2024 Segment Review

Infrastructure (73.1% of Net Sales)

Products and solutions to serve the infrastructure markets of utility, solar, lighting and transportation, and telecommunications, along with coatings services to protect metal products

Sales of $762.7 million decreased 1.0% year-over-year. Volumes in the Transmission, Distribution, and Substation (Utility) product line were slightly higher. A greater mix of distribution and substation structures and the unfavorable contractual price impact from steel index deflation limited sales growth this quarter. Telecommunications volumes were much lower due to a softer market environment compared to last year. Solar volumes were also lower due to project timing. Pricing was favorable for the segment as steel index deflation was offset by favorable mix.

Operating Income increased to $133.6 million or 17.6% of net sales compared to $116.0 million or 15.1% of net sales in the second quarter of 2023 driven by improved commercial execution, pricing strategies, lower cost of goods sold due to declining steel costs, and reduced SG&A expenses.

Agriculture (26.9% of Net Sales)

Center pivot and linear irrigation equipment components for agricultural markets, including aftermarket parts and tubular products, and advanced technology solutions for precision agriculture

Sales of $281.7 million grew slightly year-over-year. In North America, irrigation equipment volumes were significantly higher driven by a large increase in replacement sales due to severe weather impacts in the midwestern and southern United States. Average irrigation selling prices were lower compared to last year, primarily due to targeted regional pricing actions.

International sales decreased compared to last year. Sales were significantly lower in Brazil due to normalizing backlog levels and lower grain prices impacting growers’ buying behavior. These lower sales were partially offset by higher Middle East project sales and the contribution from the HR Products acquisition.


Operating Income was $40.0 million or 14.3% of net sales compared to $49.3 million or 17.7% of net sales in the second quarter of 2023. The benefit of reduced SG&A expenses was more than offset by the impact of lower volumes and pricing in Brazil.

Balance Sheet, Liquidity, and Capital Allocation

The Company generated operating cash flows of $130.8 million, and cash and cash equivalents at the end of the second quarter were $163.1 million. During the quarter, Valmont repurchased $14.9 million of Company stock, and $121.2 million remains on the authorized share repurchase program.

Updating 2024 Full-Year Financial Outlook and Key Assumptions

The Company is reaffirming its commitment to focus on strategic areas to enhance profitability and return on invested capital. As a result, we are exiting certain low-margin Solar projects leading to an expected decrease of approximately $40.0 million in Solar sales from the previous outlook. Additionally, the contractual price impact from steel index deflation is leading us to adjust our expected increase in Utility sales downward from the previous outlook. These two factors contribute to an approximate $80.0 million decrease in the Infrastructure segment net sales growth projections for the year, with minimal impact on segment profitability. The Company is also raising its 2024 full-year diluted earnings per share outlook from the previous guidance provided last quarter and updating key assumptions for the year.

Metric

Previous Outlook

Current Outlook

Net Sales Change (vs. PY)

(2.0%) to 0.5%

(3.5%) to (1.5%)

Infrastructure Net Sales
(vs. PY)

Growth Approaching Mid-Single Digits

Flat to 1.5%

Agriculture Net Sales

(vs. PY)

(15.0%) to (10.0%)

No Change from Previous Outlook

Diluted Earnings per Share

$15.40 to $16.40

$16.50 to $17.30

Steel cost assumptions aligned with hot rolled coil futures market
Effective tax rate of approximately 26.0%
Minimal expected foreign currency translation impact on net sales
For cash flow purposes, capital expenditures now expected to be in the range of $95.0 to $110.0 million to support strategic growth initiatives

Applbaum added, “I am pleased that we are increasing our diluted earnings per share outlook for the year even as we are decreasing our net sales guidance. We are improving operating margins as we meet evolving customer needs and are driving toward profitable growth. We remain committed to increasing our output to capitalize on market opportunities as the long-term demand for our products remains strong. Our broad exposure to infrastructure and agriculture markets helps us effectively manage market cycles and share resources across businesses, improving efficiency and returns on investment. We believe these advantages will become increasingly important as the energy transition accelerates and agriculture markets recover. I am confident in our ability to strengthen our core businesses, deliver strong returns on invested capital and enhance shareholder value.”

A live audio discussion with Avner M. Applbaum, President and Chief Executive Officer, and Timothy P. Francis, Interim Chief Financial Officer, will be accessible by telephone on Thursday, July 25, 2024 at 8:00 a.m. CT by dialing +1 877.407.6184 or +1 201.389.0877 (no Conference ID needed), or via webcast by pointing browsers to this link: Valmont Industries 2Q 2024 Earnings Conference Call. A slide presentation will simultaneously be available for download on the Investors page of valmont.com. A replay of the event can be accessed three hours after the call at the above link or by telephone at +1 877.660.6853 or +1 201.612.7415. Please use access code 13742905. The replay will be available through 10:59 p.m. CT on Thursday, August 1, 2024.


About Valmont Industries, Inc.

For nearly 80 years, Valmont has been a global leader in creating vital infrastructure and advancing agricultural productivity. Today, we remain committed to doing more with less by innovating through technology. Learn more about how we’re Conserving Resources. Improving Life.® at valmont.com.

Concerning Forward-Looking Statements

This release contains forward-looking statements, within the meaning of the Private Securities Litigation Reform Act of 1995. These forward-looking statements are based on assumptions that management has made in light of experience in the industries in which Valmont operates, as well as management’s perceptions of historical trends, current conditions, expected future developments, and other factors believed to be appropriate under the circumstances. As you read and consider this release, you should understand that these statements are not guarantees of performance or results. They involve risks, uncertainties (some of which are beyond Valmont’s control), and assumptions. Although management believes that these forward-looking statements are based on reasonable assumptions, you should be aware that many factors could affect Valmont’s actual financial results and cause them to differ materially from those anticipated in the forward-looking statements. These factors include, among other things, risk factors described from time to time in Valmont’s reports to the Securities and Exchange Commission, as well as future economic and market circumstances, industry conditions, company performance and financial results, operating efficiencies, availability and price of raw materials, availability and market acceptance of new products, product pricing, domestic and international competitive environments, geopolitical risks, and actions and policy changes of domestic and foreign governments. The Company cautions that any forward-looking statement included in this press release is made as of the date of this press release and the Company does not undertake to update any forward-looking statement.

Website and Social Media Disclosure

The Company uses its website and social media channels identified on its website as channels of distribution of Company information. The information that the Company posts through these channels may be deemed material. Accordingly, investors should monitor these channels, in addition to following the Company’s press releases, Securities and Exchange Commission filings, and public conference calls and webcasts. The contents of the Company’s website and social media channels are not part of this press release.

###


VALMONT INDUSTRIES, INC. AND SUBSIDIARIES

CONDENSED CONSOLIDATED STATEMENTS OF EARNINGS

(Dollars and shares in thousands, except per share amounts)

(Unaudited)

Thirteen weeks ended

Twenty-six weeks ended

June 29,

July 1,

June 29,

July 1,

2024


2023


2024


2023

Net sales

$

1,039,737

$

1,046,296

$

2,017,565

$

2,108,777

Cost of sales

719,455

716,899

1,391,067

1,470,795

Gross profit

320,282

329,397

626,498

637,982

Selling, general, and administrative expenses

172,974

195,664

347,637

385,783

Operating income

147,308

133,733

278,861

252,199

Other income (expenses):


Interest expense

(15,846)

(14,917)

(32,067)

(28,022)

Interest income

1,499

563

3,278

1,393

Gain on deferred compensation investments

525

941

1,956

2,135

Gain on divestiture

2,994

2,994

Other

(1,250)

(2,382)

(1,355)

(4,758)

Total other income (expenses)

(15,072)

(12,801)

(28,188)

(26,258)

Earnings before income taxes and equity in loss of nonconsolidated subsidiaries

132,236

120,932

250,673

225,941

Income tax expense

31,067

31,935

61,055

63,778

Equity in loss of nonconsolidated subsidiaries

(19)

(199)

(39)

(1,020)

Net earnings

101,150

88,798

189,579

161,143

Loss (earnings) attributable to redeemable noncontrolling interests

(1,434)

578

(2,041)

2,773

Net earnings attributable to Valmont Industries, Inc.

$

99,716

$

89,376

$

187,538

$

163,916

Weighted average shares outstanding - Basic

20,175

21,029

20,182

21,149

Earnings per share - Basic

$

4.94

$

4.25

$

9.29

$

7.75

Weighted average shares outstanding - Diluted

20,292

21,229

20,307

21,370

Earnings per share - Diluted

$

4.91

$

4.21

$

9.24

$

7.67

Cash dividends per share

$

0.60

$

0.60

$

1.20

$

1.20


VALMONT INDUSTRIES, INC. AND SUBSIDIARIES

SUMMARY OPERATING RESULTS

(Dollars in thousands)

(Unaudited)

Thirteen weeks ended

Twenty-six weeks ended

June 29,

July 1,

June 29,

July 1,

2024


2023


2024


2023

Infrastructure

Net sales

$

760,430

$

768,158

$

1,481,163

$

1,500,298

Gross profit

232,403

224,876

450,020

425,271

as a percent of net sales

30.6

%

29.3

%

30.4

%

28.3

%

Selling, general, and administrative expenses

98,822

108,926

198,575

214,969

as a percent of net sales

13.0

%

14.2

%

13.4

%

14.3

%

Operating income

133,581

115,950

251,445

210,302

as a percent of net sales

17.6

%

15.1

%

17.0

%

14.0

%

Agriculture

Net sales

$

279,307

$

278,138

$

536,402

$

608,479

Gross profit

87,879

104,521

176,478

212,711

as a percent of net sales

31.5

%

37.6

%

32.9

%

35.0

%

Selling, general, and administrative expenses

47,908

55,270

95,534

110,137

as a percent of net sales

17.2

%

19.9

%

17.8

%

18.1

%

Operating income

39,971

49,251

80,944

102,574

as a percent of net sales

14.3

%

17.7

%

15.1

%

16.9

%

Corporate

Selling, general, and administrative expenses

$

26,244

$

31,468

$

53,528

$

60,677

Operating loss

(26,244)

(31,468)

(53,528)

(60,677)


VALMONT INDUSTRIES, INC. AND SUBSIDIARIES

SUMMARY OPERATING RESULTS

(Dollars in thousands)

(Unaudited)

Thirteen weeks ended June 29, 2024


Infrastructure


Agriculture

Intersegment


Consolidated

Geographical Market:

North America

$

582,143

$

161,310

$

(4,686)

$

738,767

International

180,599

120,393

(22)

300,970

Total sales

$

762,742

$

281,703

$

(4,708)

$

1,039,737

Product Line:


Transmission, Distribution, and Substation

$

323,087

$

$

$

323,087

Lighting and Transportation

243,562

243,562

Coatings

91,574

(2,294)

89,280

Telecommunications

58,400

58,400

Solar

46,119

(18)

46,101

Irrigation Equipment and Parts

254,310

(2,396)

251,914

Technology Products and Services

27,393

27,393

Total sales

$

762,742

$

281,703

$

(4,708)

$

1,039,737

Thirteen weeks ended July 1, 2023


Infrastructure


Agriculture

Intersegment


Consolidated

Geographical Market:

North America

$

587,313

$

140,981

$

(3,613)

$

724,681

International

183,282

138,952

(619)

321,615

Total sales

$

770,595

$

279,933

$

(4,232)

$

1,046,296

Product Line:

Transmission, Distribution, and Substation

$

314,307

$

$

$

314,307

Lighting and Transportation

246,123

246,123

Coatings

91,120

(1,818)

89,302

Telecommunications

67,738

67,738

Solar

51,307

(619)

50,688

Irrigation Equipment and Parts

252,457

(1,795)

250,662

Technology Products and Services

27,476

27,476

Total sales

$

770,595

$

279,933

$

(4,232)

$

1,046,296


VALMONT INDUSTRIES, INC. AND SUBSIDIARIES

SUMMARY OPERATING RESULTS

(Dollars in thousands)

(Unaudited)

Twenty-six weeks ended June 29, 2024


Infrastructure


Agriculture

Intersegment


Consolidated

Geographical Market:

North America

$

1,150,715

$

321,225

$

(9,152)

$

1,462,788

International

335,641

219,213

(77)

554,777

Total sales

$

1,486,356

$

540,438

$

(9,229)

$

2,017,565

Product Line:

Transmission, Distribution, and Substation

$

648,343

$

$

$

648,343

Lighting and Transportation

465,658

465,658

Coatings

178,664

(5,120)

173,544

Telecommunications

112,361

112,361

Solar

81,330

(73)

81,257

Irrigation Equipment and Parts

487,430

(4,036)

483,394

Technology Products and Services

53,008

53,008

Total sales

$

1,486,356

$

540,438

$

(9,229)

$

2,017,565

Twenty-six weeks ended July 1, 2023


Infrastructure


Agriculture

Intersegment


Consolidated

Geographical Market:

North America

$

1,171,396

$

323,850

$

(8,987)

$

1,486,259

International

335,305

288,246

(1,033)

622,518

Total sales

$

1,506,701

$

612,096

$

(10,020)

$

2,108,777

Product Line:


Transmission, Distribution, and Substation

$

629,127

$

$

$

629,127

Lighting and Transportation

475,259

475,259

Coatings

181,234

(5,370)

175,864

Telecommunications

135,875

135,875

Solar

85,206

(1,033)

84,173

Irrigation Equipment and Parts

551,638

(3,617)

548,021

Technology Products and Services

60,458

60,458

Total sales

$

1,506,701

$

612,096

$

(10,020)

$

2,108,777


VALMONT INDUSTRIES, INC. AND SUBSIDIARIES

CONDENSED CONSOLIDATED BALANCE SHEETS

(Dollars in thousands)

(Unaudited)

June 29,

December 30,

2024


2023

ASSETS

Current assets:

Cash and cash equivalents

$

163,142

$

203,041

Receivables, net

703,255

657,960

Inventories

633,232

658,428

Contract assets

191,846

175,721

Prepaid expenses and other current assets

92,560

92,479

Total current assets

1,784,035

1,787,629

Property, plant, and equipment, net

604,326

617,394

Goodwill and other non-current assets

1,068,841

1,072,425

Total assets

$

3,457,202

$

3,477,448

LIABILITIES, REDEEMABLE NONCONTROLLING INTERESTS,


AND SHAREHOLDERS' EQUITY

Current liabilities:


Current installments of long-term debt

$

569

$

719

Notes payable to banks

1,876

3,205

Accounts payable

353,729

358,311

Accrued expenses

247,524

277,764

Contract liabilities

68,811

70,978

Income taxes payable

20,427

Dividends payable

12,098

12,125

Total current liabilities

705,034

723,102

Long-term debt, excluding current installments

1,017,543

1,107,885

Operating lease liabilities

154,247

162,743

Other non-current liabilities

62,648

66,646

Total liabilities

1,939,472

2,060,376

Redeemable noncontrolling interests

46,249

62,792

Shareholders' equity

1,471,481

1,354,280

Total liabilities, redeemable noncontrolling interests, and shareholders' equity

$

3,457,202

$

3,477,448


VALMONT INDUSTRIES, INC. AND SUBSIDIARIES

CONDENSED CONSOLIDATED STATEMENTS OF CASH FLOWS

(Dollars in thousands)

(Unaudited)

Twenty-six weeks ended

June 29,

July 1,

2024


2023

Cash flows from operating activities:

Net earnings

$

189,579

$

161,143

Depreciation and amortization

46,526

48,792

Contribution to defined benefit pension plan

(18,009)

(15,259)

Gain on divestiture

(2,994)

Change in working capital

(78,305)

(98,979)

Other

14,352

16,843

Net cash flows from operating activities

154,143

109,546

Cash flows from investing activities:


Purchase of property, plant, and equipment

(33,328)

(45,393)

Proceeds from divestiture, net of cash divested

6,369

Proceeds from property damage insurance claims

4,844

Other

(3,176)

134

Net cash flows from investing activities

(36,504)

(34,046)

Cash flows from financing activities:


Net payments on short-term borrowings

(1,275)

(4,693)

Proceeds from long-term borrowings

15,009

165,012

Principal payments on long-term borrowings

(105,349)

(84,105)

Dividends paid

(24,239)

(24,376)

Purchase of redeemable noncontrolling interests

(17,745)

Purchase of treasury shares

(14,941)

(135,115)

Other

(2,335)

(10,877)

Net cash flows from financing activities

(150,875)

(94,154)

Effect of exchange rates on cash and cash equivalents

(6,663)

155

Net change in cash and cash equivalents

(39,899)

(18,499)

Cash and cash equivalents—beginning of period

203,041

185,406

Cash and cash equivalents—end of period

$

163,142

$

166,907


Exhibit 99.2

GRAPHIC

Valmont® © 2024 Industries, Inc. Q2 2024 Earnings Presentation July 25, 2024

GRAPHIC

• Q2 2024 Results • Current Market Dynamics and Long-term Megatrends • Strategic Priorities • Updated 2024 Outlook and Guidance • Q&A Today’s Agenda 2 July 25, 2024 | Valmont Industries, Inc.

GRAPHIC

These slides contain (and the accompanying oral discussion will contain) “forward-looking statements” within the meaning of the Private Securities Litigation Reform Act of 1995. Such statements involve known and unknown risks, uncertainties and other factors that could cause the actual results of the Company to differ materially from the results expressed or implied by such statements, including general economic and business conditions, conditions affecting the industries served by the Company and its subsidiaries, the overall market acceptance of such products and services, the integration of acquisitions and other factors disclosed in the Company’s periodic reports filed with the Securities and Exchange Commission, as well as future economic and market circumstances, industry conditions, company performance and financial results, operating efficiencies, availability and price of raw materials, availability and market acceptance of new products, product pricing, domestic and international competitive environments, geopolitical risks and actions and policy changes of domestic and foreign governments. Consequently, such forward-looking statements should be regarded as the Company’s current plans, estimates, and beliefs. The Company does not undertake and specifically declines any obligation to publicly release the results of any revisions to these forward-looking statements that may be made to reflect any future events or circumstances after the date of such statements or to reflect the occurrence of anticipated or unanticipated events. Disclosure Regarding Forward-Looking Statements 3 July 25, 2024 | Valmont Industries, Inc.

GRAPHIC

CEO Opening Comments Avner Applbaum, President & CEO 4 July 25, 2024 | Valmont Industries, Inc.

GRAPHIC

Q2 2024 Financials and Key Messages 5 July 25, 2024 | Valmont Industries, Inc. The global Valmont team achieved strong results, expanding operating margins 140 bps and increasing diluted EPS to $4.91, on comparable sales Commercial and operational execution, pricing strategies and an improved cost structure contributed to the improved profitability, guided by the Valmont Business Model Infrastructure sales were $763 million, down 1% year-over-year, as strong utility market demand and favorable pricing across the portfolio were more than offset by product mix shift, lower telecom and solar volumes, and the effect of lower steel index on price Agriculture sales were $282 million, up slightly year-over-year, with North America volumes higher on replacement sales due to severe storm events; international markets mixed with continued softness in Brazil and good momentum in Middle East project business Net Sales Y/Y Net Sales Operating Margin Diluted EPS Operating Cash Flow Cash Returned to Shareholders $1.04B (0.6%) 14.2% $4.91 $131M $27M

GRAPHIC

Infrastructure Market Drivers Steady-to-improving near-term demand across our markets, with positive long-term drivers • Elevated utility capex spending due to the energy transition, replacement of aging infrastructure, and power load growth • Strong Department of Transportation demand supported by road construction investment with future benefits expected from IIJA1 ; commercial lighting markets remain muted • Telecom remains soft as wireless carriers are likely to maintain a more normalized level of capex spending following record investment years • Solar market remains attractive with strong demand tailwinds • Coatings continues to align with GDP trends while supporting internal production Near Term Demand 1 Infrastructure Investment and Jobs Act Multi-Year Energy Transition Enabling the optimization to support the growing need for diverse energy consumption including renewables to address connectivity demands for a growing population and urbanization. Aging Infrastructure & Resilience Grid hardening and building climate resilience with intensifying weather, supported through reliable infrastructure. Technology & Data Consumption Exponential growth in the volume, velocity, and variety of data being generated, transmitted, and consumed across various digital platforms and devices. Global Megatrends 6 July 25, 2024 | Valmont Industries, Inc.

GRAPHIC

Food Security Giving the means for the world to produce their own food and enabling less reliability on others. Sustainability & Productivity Water conservation and being good stewards of the land that is available will continue to be important and addressing labor shortages. It is about doing more with less and using technology to our advantage in meeting those demands. Population Growth Pressure to produce more food leads to an intensified focus on improving yields (crops and livestock) to meet the dietary needs of a growing population. 7 July 25, 2024 | Valmont Industries, Inc. Agriculture Market Drivers Outlook for sustained long-term growth remains strong, despite short-term demand headwinds • North America order rates were higher due to storm events; grower sentiment remains muted due to expected NFI1 decline this year and the downward trend in grain prices • Brazil expected farm income remains pressured by lower grain prices; FINAME was renewed; the country remains a key part of our long-term strategy • International project pipeline is strong; current Egypt project and additional $50 million in Middle East projects remain on track Near Term Demand Global Megatrends 1 Net Farm Income

GRAPHIC

• Leveraging focus areas and core values of Valmont Business Model to produce desired outcomes • We’ve refined our strategy and are concentrating growth on high-return areas that align our core competencies with customer needs • Initial focus on realigning the organization to streamline decision-making and create agility to respond to evolving market demands, while reducing cost structure • Now refocusing commercial (commercial execution) and operating teams (operational excellence) on opportunities that deliver the greatest value and drive the highest return − Utility produced a greater mix of distribution and substation structures – enhancing margins while accommodating customers − Solar is exiting certain low-margin projects as we focus on enhancing profitability and ROIC Maximizing Value Creation Taking Action to Enhance our Competitive Position and Drive Profitable Growth 8 July 25, 2024 | Valmont Industries, Inc.

GRAPHIC

2024 Sustainability Report Highlights: • Notable improvements in 2023 safety metrics, including a 13.5% TRIR reduction • A record global response rate of 87% on our most recent employee engagement survey • Indapur Taluka Galvanizing facility in India was awarded The Valmont Sustainability Award • Earned multiple honors and awards for ESG initiatives Recommitted to our 2025 environmental goals1 : Released 9th Sustainability Report, Demonstrating Dedication to Sustainable Practices and Solutions 10% Reduction in Scope I/II Carbon Intensity 19% Reduction in Scope I Mobile Source Combustion Fuel Carbon Emissions 12% Additional Reduction in Normalized Global Electrical Usage 100% of global manufacturing facilities to adopt low-flow water fixtures for nonproduction areas Conserving Resources. Improving Life. ® ESG is a core focus area: It creates efficiencies and cost savings, improves safety, manages risks, and fosters innovation, enhancing our resilience and competitive edge 9 July 25, 2024 | Valmont Industries, Inc. 1 Based on 2018 Baseline Data

GRAPHIC

Financial Results and Outlook Tim Francis, Interim CFO 10 July 25, 2024 | Valmont Industries, Inc.

GRAPHIC

Q2 2024 Financial Summary 11 July 25, 2024 | Valmont Industries, Inc. • Sales were similar to prior year • Operating margin expanded 140 bps on commercial and operational execution, pricing strategies and an improved cost structure • Diluted EPS improved on higher operating income, lower share count and a tax benefit of ~$0.15 per share $M, except EPS 2024 2023 % Net Sales 1,039.7 1,046.3 -0.6% Operating Income 147.3 133.7 +10.2% Operating Margin 14.2% 12.8% +140 bps Net Earnings1 99.7 89.4 +11.6% Diluted EPS 4.91 4.21 +16.6% 1 Net Earnings Attributable to Valmont Industries, Inc.

GRAPHIC

Q2 2024 Results | Infrastructure 12 July 25, 2024 | Valmont Industries, Inc. Sales ($M) Operating Income ($M) • Utility volumes were slightly higher; a greater mix of distribution and substation structures, and the unfavorable contractual price impact of steel index deflation, limited sales growth this quarter • Telecom sales were lower due to a softer market environment compared to last year and Solar volumes were lower due to project timing • Pricing was favorable for the segment as steel price deflation was offset by favorable product mix • Operating margin improved due to commercial execution, pricing strategies, lower COGS due to declining steel costs and reduced SG&A expenses $762.7 $770.6 2024 2023 -1.0% +15.2% $133.6 $116.0 2024 2023 17.6% 15.1% Sales ($M) 2024 2023 % Transmission, Distribution, and Substation (Utility) $323.0 $314.4 +3% Lighting and Transportation $243.6 $246.1 -1% Coatings $91.6 $91.1 0% Telecommunications $58.4 $67.7 -14% Solar $46.1 $51.3 -10%

GRAPHIC

Q2 2024 Results | Agriculture 13 July 25, 2024 | Valmont Industries, Inc. • North America volumes were significantly higher driven by replacement sales due to severe weather; average irrigation selling prices were lower compared to last year due to targeted regional pricing actions • International sales decreased due to significantly lower sales in Brazil due to normalized backlog levels and lower grain prices impacting growers’ buying behavior; these lower sales were partially offset by higher Middle East projects and the contribution from the HR Products acquisition • Operating income decreased as the benefit of reduced SG&A expenses was more than offset by the impact of lower volumes and pricing in Brazil Sales ($M) Operating Income ($M) Sales ($M) 2024 2023 % North America $161.3 $140.9 +14% International $120.4 $139.0 -13% Irrigation Equipment and Parts $254.3 $252.5 +1% Technology Products and Services $27.4 $27.4 0% +0.6% -18.8% $281.7 $279.9 2024 2023 $40.0 $49.3 2024 2023 14.3% 17.7%

GRAPHIC

Building Solid Financial Foundation 14 July 25, 2024 | Valmont Industries, Inc. • Q2 2024 Operating Cash Flows were nearly 50% higher than Q2 2023 • Expect to generate strong cash flow in 2024 through earnings growth and diligent working capital management • During the quarter we reduced borrowings on our revolving line of credit by $90M, and Total Debt to Adjusted EBITDA1 remains within our desired range of 1.5 to 2.5 times • Long-term debt mostly fixed-rate, with long-dated maturities in 2044 and 2054 • Strong and flexible balance sheet to support balanced capital allocation strategy Free Cash Flows ($M) YTD 6/29/2024 Liquidity ($M) 6/29/2024 Net Cash Flows from Operating Activities $ 154 Cash $ 163 Net Cash Flows from Investing Activities (37) Total Long-Term Debt 1,018 Net Cash Flows from Financing Activities (151) Shareholders' Equity 1,471 Net Cash Flows from Operating Activities $ 154 Total Debt to Adj. EBITDA1 1.66x Purchase of Property, Plant, & Equipment (33) Available Credit under Revolving Credit Facility2 $ 512 Free Cash Flows $ 121 Cash 163 Total Available Liquidity $ 675 1 Please see Adjusted EBITDA and Leverage Ratio at end of document. 2 $800M Total Revolver less borrowings and Standby LCs of $288M.

GRAPHIC

Balanced Approach to Capital Allocation 2024 Year-to-Date Capital Deployment: $72M 15 July 25, 2024 | Valmont Industries, Inc. Growing Our Business Returning Cash to Shareholders • Targeting adjacent opportunities in end markets with favorable and global long-term demand trends • Returns exceeding cost of capital within 3 years • We continue to invest in strategic capacity expansions to increase output and enhance manufacturing flexibility • Prioritize projects that deliver high ROIC • Q2 Dividends Paid $12.1M • Payout ratio target: 15% of earnings; current payout ~13% • ~$121M remains on the current share repurchase authorization • Opportunistic approach, supported by free cash flow Capital Expenditures Acquisitions Share Repurchases Dividends $33M N/A $15M $24M Over the past year, we have returned ~$275M to shareholders through dividends and repurchases.

GRAPHIC

Segment Assumptions Updating 2024 Outlook and Key Assumptions • Infrastructure sales are now expected to be Flat to up 1.5% vs. PY; due to lower expected solar sales and steel deflationary impact on Utility sales • No change from prior Agriculture sales outlook; expected to be down 10.0% to 15.0% vs. PY 16 July 25, 2024 | Valmont Industries, Inc. (3.5%) – (1.5%) Change In Net Sales Y/Y Previous outlook: (2.0%) – 0.5% $16.50 – $17.30 GAAP Diluted EPS Previous outlook: $15.40 – $16.40 Key Assumptions • Steel cost assumptions aligned with HRC futures market • Effective tax rate of ~26.0% • Minimal expected foreign currency translation impact on net sales • For cash flow purposes, capital expenditures now expected to be in the range of $95.0 to $110.0 million Other Modeling Considerations • Expect Infrastructure full-year gross profit margin improvement compared to 2023, although may not reach 1H 2024 results • Expect 2H 2024 Agriculture operating margins to be similar to Q4 2023 (10.3% on adjusted1 basis) • Expect full-year consolidated SG&A as a % of net sales to be lower than 2023 1Please see Reg G reconciliation to GAAP measures at end of document.

GRAPHIC

Valmont Team Is Executing Our Strategy and Performing Well in Dynamic Market 17 July 25, 2024 | Valmont Industries, Inc. Actively managing our business to maximize returns Driving commercial execution and operational excellence Leveraging competitive advantages and core competencies Streamlining administrative functions and enhancing productivity Building resiliency as we make progress on our strategic initiatives Structurally reducing cost structure, improving margins and cash flows to generate sustainable shareholder value Achieving strong financial results in dynamic markets Delivering innovative solutions to customers in attractive growing markets that address vital megatrends Creating a high-performance culture that is positioned for sustained financial success Well-positioned to achieve long-term financial targets

GRAPHIC

Q&A 18 July 25, 2024 | Valmont Industries, Inc.

GRAPHIC

Appendix 19 July 25, 2024 | Valmont Industries, Inc.

GRAPHIC

Long-Term Financial Targets MSD+ Net Sales Growth1 Approaching Mid-Teens Operating Margin 100% Net Earnings FCF Conversion High-Teens Return on Invested Capital Serving markets with positive growth outlook aligned with megatrends Innovation and market expansion to grow above markets Strategic pricing to align with value we deliver Streamlined organization aligned with strategy Operational efficiencies & focus on the outliers A disciplined and efficient capital allocation strategy Internal investments and acquisitions are evaluated based on financial and strategic criteria Managing net working capital to maximize cash flow Supply chain and inventory optimization 1 VMI sales growth through the Agriculture cycle; organic sales growth only Delivering reliable growth while expanding operating margins and ROIC to consistently create shareholder value 20 July 25, 2024 | Valmont Industries, Inc.

GRAPHIC

Steel Material Index Trends • The contractual price impact from steel index deflation is leading us to adjust our expected increase in Utility sales downward • Steel cost changes impact Utility the most because of the contractual pricing mechanisms and strong backlog 21 July 25, 2024 | Valmont Industries, Inc. AMM Steel Material Index National Mills Carbon Grade Cut to Length and Coiled / Hot Rolled Plate Average 2020 through 2024 YTD

GRAPHIC

Actual and Projected Transmission Investment 22 July 25, 2024 | Valmont Industries, Inc. Source: Edison Electric Institute Business Analytics Group Updated January 2024 Investment of investor-owned electric companies and stand-alone transmission companies. Actual Investment figures were obtained from the EEI Property & Plant Capital Investment Survey supplemented with FERC Form 1 data. Projected investment figures were obtained from the EEI Transmission Capital Investment Forecast Survey supplemented with data obtained from company 10-k reports and investor presentations.

GRAPHIC

Utility Industry Capital Expenditures 23 July 25, 2024 | Valmont Industries, Inc. Source: EEI Finance Department, member company reports, and S&P Global Market Intelligence Updated July 2024 Chart represents total company spending of U.S. Investor-Owned Electric Utilities, consolidated at the parent or appropriate holding company. At the industry level, CapEx tends to be overestimated for the current, or first, year’s projection and underestimated for the two following years. We expect a continued level of elevated spending after accounting for the historical trend of over- and underestimation.

GRAPHIC

Infrastructure Investment and Jobs Act (IIJA) 24 July 25, 2024 | Valmont Industries, Inc. Source: Grassley.senate.gov Infrastructure Investment and Jobs Act Spending Breakdown (In Order - Most to Least) Previously-Passed Transportation Funding | $650B Roads, Bridges and Related Programs | $111B Energy, Power and Electric Grid Reliability | $107.5B Freight and Passenger Rail | $66B Broadband | $65B Water and Wastewater Infrastructure | $55B Public Transportation | $39.2B Airports | $25B Natural Disaster Prevention and Mitigation | $23.3B Cleaning-Up Abandoned Sites | $21B Army Corps of Engineers | $16.7B Highway and Pedestrian Safety | $11B Ports and Coast Guard | $7.8B Cybersecurity and other Infrastructure Programs | $10.11B

GRAPHIC

Wireless Carrier Spending 0 20 40 60 80 100 120 140 2019 2020 2021 2022 2023 2024e 2025e 2026e 0 20 40 60 80 100 120 140 2019 2020 2021 2022 2023 2024e 2025e 2026e Auction 105: 3.5 GHz Band Auction 107: C-Band (3.7 GHz) Auction 110: 3.45 GHz Band Auction 108: 2.5 GHz Band The data does not include investments in fiber or other digital infrastructure, or expenditures for private networks. Also not included is the tower companies’ capex to acquire, build, or augment existing sites. Funding from BEAD or other government programs is not included in the projections. All of this activity is additive to planned network investments and construction US Wireless CapEx & 5G Auction Spend (US$ billions, 2019-2026E) Source: Inside Towers Updated: March 2024 25 July 25, 2024 | Valmont Industries, Inc.

GRAPHIC

Single Family Housing Starts Market Forecast $0 $50 $100 $150 $200 $250 $300 $350 2012 2013 2014 2015 2016 2017 2018 2019 2020 2021 2022 2023 2024 2025 2026 2027 2028 Billions Actual Starts Current Forecast Previous Forecast Source: CMD Forecast Data Updated February 2024 26 July 25, 2024 | Valmont Industries, Inc.

GRAPHIC

U.S. Net Cash Farm Income by Year 27 July 25, 2024 | Valmont Industries, Inc. Source: USDA Updated February 7, 2024

GRAPHIC

U.S. Drought Condition 28 July 25, 2024 | Valmont Industries, Inc. Source: Drought Monitor Updated July 18, 2024

GRAPHIC

The non-GAAP table below discloses the impacts of the realignment charges and non-recurring charges associated with major scope changes for two strategic projects initiated by departed senior leadership on the fourth quarter of fiscal 2023 results. Amounts may be impacted by rounding. We believe it is useful when considering company performance for the non-GAAP adjusted operating income (loss) to be taken into consideration by management and investors with the related reported GAAP measures. Reconciliation of Non-GAAP Financial Measures to Reported Financial Measures Dollars in thousands 29 July 25, 2024 | Valmont Industries, Inc.

GRAPHIC

1Adjusted net earnings for purposes of calculating free cash flow conversion may not agree to the adjusted net earnings. The difference is due to non-recurring expenses which were settled in cash in the year of occurrence as part of net cash flows from operating activities. 2We use the non-GAAP measure of free cash flow, which we define as GAAP net cash flows from operating activities reduced by the purchase of property, plant, and equipment. We believe that free cash flow is a useful performance measure for management and useful to investors as the basis for comparing our performance with other companies. Our measure of free cash flow may not be directly comparable to similar measures used by other companies. Historical Free Cash Flow1,2 (2014 – 2023) Dollars in millions 30 July 25, 2024 | Valmont Industries, Inc. 2014 2015 2016 2017 2018 2019 2020 2021 2022 2023 Net cash flows from operating activities $ 174.1 $ 272.3 $ 232.8 $ 133.1 $ 153.0 $ 307.6 $ 316.3 $ 65.9 $ 326.3 $ 306.8 Net cash flows from investing activities (256.9) (48.2) (53.0) (49.6) (155.4) (168.1) (104.0) (417.3) (132.1) (115.3) Net cash flows from financing activities (136.8) (32.0) (95.2) (32.0) (162.1) (98.9) (173.8) 133.5 (181.9) (176.4) Net cash flows from operating activities $ 174.1 $ 272.3 $ 232.8 $ 133.1 $ 153.0 $ 307.6 $ 316.3 $ 65.9 $ 326.3 $ 306.8 Purchase of plant, property, and equipment (73.0) (45.5) (57.9) (55.3) (72.0) (97.4) (106.7) (107.8) (93.3) (96.8) Free cash flows 101.1 226.8 174.9 77.8 81.0 210.2 209.6 (41.9) 233.0 210.0 Net earnings attributable to Valmont Industries, Inc. $ 183.9 $ 40.1 $ 175.5 $ 120.5 $ 101.8 $ 146.4 $ 140.7 $ 195.6 $ 250.9 $ 150.8 Adjusted free cash flow net earnings attributable to Valmont Industries, Inc. $ 187.7 $ 131.7 $ 139.9 $ 162.7 $ 130.4 $ 146.4 $ 159.8 $ 222.3 $ 284.2 $ 291.6 Free Cash Flow Conversion - GAAP 0.55 5.66 1.00 0.65 0.80 1.44 1.49 (0.21) 0.93 1.39 Free Cash Flow Conversion - Adjusted 0.53 1.71 1.25 0.48 0.62 1.44 1.31 (0.19) 0.82 0.72 Reconciliation of Net Earnings to Adjusted Figures Net earnings attributed to Valmont Industries, Inc. $ 183.9 $ 40.1 $ 175.5 $ 120.5 $ 101.8 $ 146.4 $ 140.7 $ 195.6 $ 250.9 $ 150.8 Loss from divestiture of offshore wind energy structures business - - - - - - - - 33.3 - Change in valuation allowance against deferred tax assets - 7.1 (20.7) 41.9 - - - 5.0 - - Impairment of long-lived assets - 61.8 1.1 - 28.6 - 19.1 21.7 - 140.8 Reversal of contingent liability - - (16.6) - - - - - - - Other non-recurring expenses (non-cash) - 18.1 - - - - - - - - Noncash loss from Delta EMD shares 3.8 4.6 0.6 0.2 - - - - - - Adjusted free cash flow net earnings attributable to Valmont Industries, Inc. $ 187.7 $ 131.7 $ 139.9 $ 162.7 $ 130.4 $ 146.4 $ 159.8 $ 222.3 $ 284.2 $ 291.6

GRAPHIC

1We use the non-GAAP measure of free cash flow, which we define as GAAP net cash flows from operating activities reduced by the purchase of property, plant, and equipment. We believe that free cash flow is a useful performance measure for management and useful to investors as the basis for comparing our performance with other companies. Our measure of free cash flow may not be directly comparable to similar measures used by other companies. Free Cash Flow Throughout the Cycle Dollars in millions 31 July 25, 2024 | Valmont Industries, Inc. 101 227 175 78 81 210 210 (42) 233 210 148 (100) (50) - 50 100 150 200 250 300 350 2014 2015 2016 2017 2018 2019 2020 2021 2022 2023 10 Year Avg GAAP 0.55X 5.66X 1.00X 0.65X 0.80X 1.44X 1.49X (0.21X) 0.93X 1.39X Adj. 0.53X 1.71X 1.25X 0.48X 0.62X 1.44X 1.31X (0.19X) 0.82X 0.72X Historical FCF Conversion by Year1 2014 – 2023 Free Cash Flow1 10-yr Avg. $148M GAAP 1.37X Adj. 0.87X Years of rapid raw material cost inflation

GRAPHIC

Certain of our debt agreements contain covenants that require us to maintain certain coverage ratios. Our Debt to Adjusted EBITDA may not exceed 3.5X Adjusted EBITDA (or 3.75X Adjusted EBITDA after certain material acquisitions) of the prior four fiscal quarters. See “Leverage Ratio” below. Calculation of Adjusted EBITDA and Leverage Ratio Dollars in thousands 32 July 25, 2024 | Valmont Industries, Inc. Net earnings attributable to Valmont Industries, Inc. $ 174,471 Interest expense 60,853 Income tax expense 87,398 Depreciation and amortization expense 95,325 Stock-based compensation 33,471 EBITDA 451,518 Impairment of long-lived assets 140,844 Realignment charges 35,210 Proforma acquisition adjustment 1,130 Adjusted EBITDA $ 628,702 Interest-bearing debt, excluding origination fees and discounts of $25,965 $ 1,045,953 Less: cash and cash equivalents in excess of $50,000 113,142 Net indebtedness $ 932,811 Net indebtedness $ 932,811 Leverage ratio 1.48 Interest-bearing debt, excluding origination fees and discounts of $25,965 $ 1,045,953 Total debt to adjusted EBITDA 1.66 Four fiscal quarters ended June 29, 2024