UNITED STATES OF AMERICA
SECURITIES AND EXCHANGE COMMISSION
Washington, D.C. 20549
FORM
CURRENT REPORT
PURSUANT TO SECTION 13 OR 15(d) OF THE SECURITIES EXCHANGE ACT OF 1934
Date of Report (Date
of earliest event reported):
(Exact name of registrant as specified in its charter)
| (State or other jurisdiction of incorporation) | (Commission File Number) | (IRS Employer Identification No.) |
(Address of principal executive offices) (Zip Code)
(Registrant’s telephone number, including area code)
Securities registered pursuant to Section 12(b) of the Exchange Act:
| Title of each class | Trading symbol | Name of exchange on which registered | ||
Check the appropriate box below if the Form 8-K filing is intended to simultaneously satisfy the filing obligation of the registrant under any of the following provisions:
Indicate
by check mark whether the registrant is an emerging growth company as defined in Rule 405 of the Securities Act of 1933 (17 CFR §230.405)
or Rule 12b-2 of the Securities Exchange Act of 1934 (17 CFR §240.12b-2). Emerging growth company
If an emerging growth company, indicate by check mark if the registrant has elected not to use the extended transition period for complying with any new or revised financial accounting standards provided pursuant to Section 13(a) of the Exchange Act. ☐
| ITEM 7.01 | Regulation FD Disclosure |
On June 4, 2024, Chemung Financial Corporation (the “Corporation”) (Nasdaq: CHMG) provided copies of slides containing financial and other information in preparation for its upcoming Annual Meeting of Shareholders, scheduled for Tuesday, June 4, 2024 at 2:00 p.m., at its headquarters at One Chemung Canal Plaza in Elmira, New York.
A copy of the presentation is attached as Exhibit 99.1 to this report and is being furnished to the Securities and Exchange Commission and shall not be deemed filed for any purpose.
| ITEM 9.01 | Financial Statements and Exhibits | |
| (d) | Exhibits | |
| Exhibit No. | ||
| 99.1 | Advance copy of the presentation to be given at the 2024 Annual Meeting of Shareholders of Chemung Financial Corporation at One Chemung Plaza, Elmira, NY dated June 4, 2024. | |
| 104 | Cover Page Interactive Data File (embedded within the Inline XBRL document) | |
SIGNATURES
Pursuant to the requirements of the Securities Exchange Act of 1934, the registrant has duly caused this report to be signed on its behalf by the undersigned, hereunto duly authorized.
| CHEMUNG FINANCIAL CORPORATION | ||
| June 4, 2024 | By: | /s/ Dale M. McKim, III |
| Dale M. McKim, III | ||
| Chief Financial Officer and Treasurer | ||
Exhibit 99.1
ANNUAL SHAREHOLDERS MEETING TUESDAY, JUNE 4 , 2024
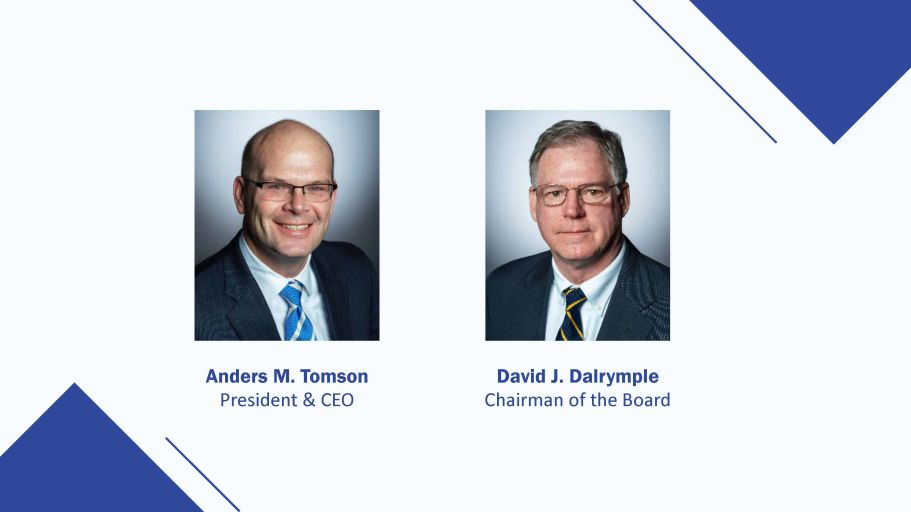
Anders M. Tomson President & CEO David J. Dalrymple Chairman of the Board
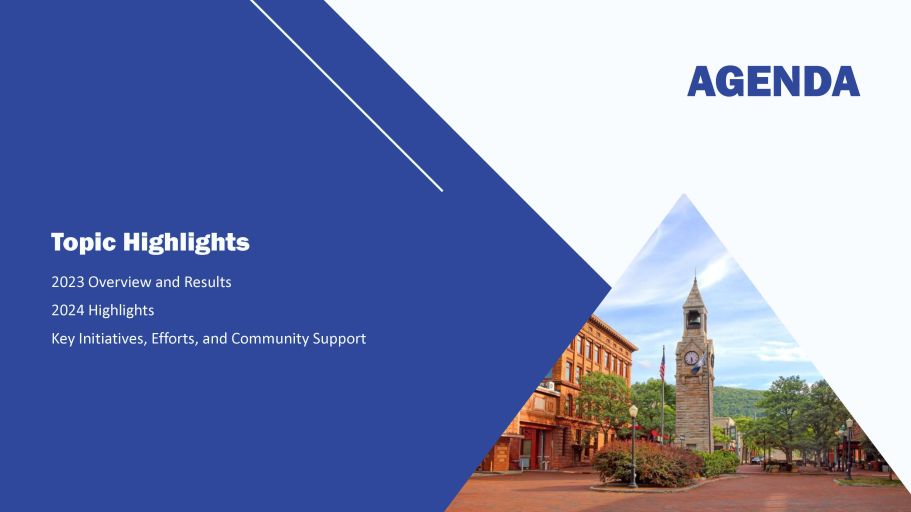
AGENDA Topic Highlights 2023 Overview and Results 2024 Highlights Key Initiatives, Efforts, and Community Support
FORWARD - LOOKING STATEMENTS This discussion contains forward - looking statements within the meaning of Section 27A of the Securities Act, Section 21E of the Exchange Act, and the Private Securities Litigation Reform Act of 1995. The Corporation intends its forward - looking statements to be covered by the safe harbor provisions for forward - looking statements in these sections. All statements regarding the Corporation’s expected financial position and operating results, the Corporation’s business strategy, the Corporation’s financial plans, forecasted demographic and economic trends relating to the Corporation’s industry and similar matters are forward - looking statements. These statements can sometimes be identified by the Corporation’s use of forward - looking words such as “may,” “will,” “anticipate,” “estimate,” “expect,” or “intend.” The Corporation cannot promise that its expectations in such forward - looking statements will turn out to be correct. The Corporation’s actual results could be materially different from expectations because of various factors, including changes in economic conditions or interest rates, credit risk, inflation, cybersecurity risks, difficulties in managing the Corporation’s growth, recent bank failures, changes in FDIC assessments, public health issues, geopolitical conflicts, competition, changes in law or the regulatory environment, and changes in general business and economic trends. Information concerning these and other factors can be found in the Corporation’s periodic filings with the SEC, including the discussion under the heading “Item 1A. Risk Factors” in the Corporation’s 2023 Annual Report on Form 10 - K. These filings are available publicly on the SEC’s website at www.sec.gov, on the Corporation’s website at www.chemungcanal.com or upon request from the Corporate Secretary at (607) 737 - 3746. Except as otherwise required by law, the Corporation undertakes no obligation to publicly update or revise its forward - looking statements, whether as a result of new information, future events or otherwise.
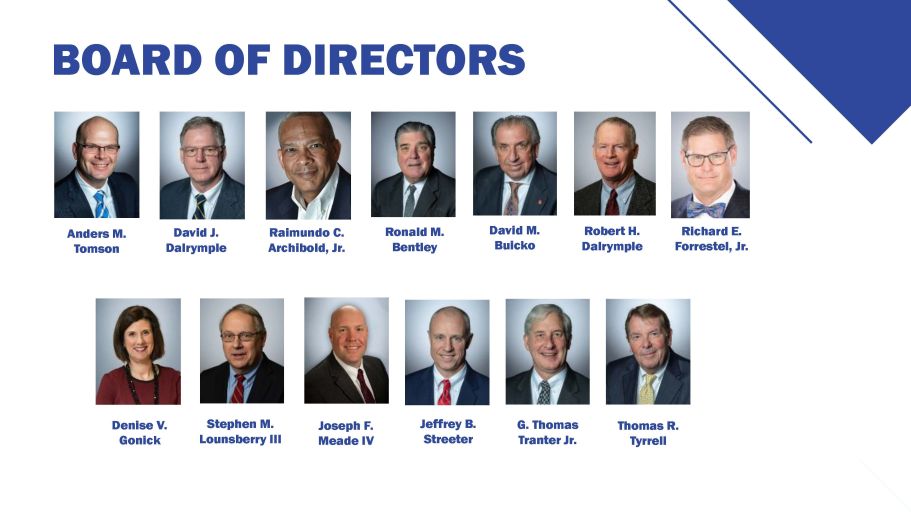
BOARD OF DIRECTORS David J. Dalrymple Ronald M. Bentley Richard E. Forrestel, Jr. Raimundo C. Archibold, Jr. David M. Buicko Robert H. Dalrymple Anders M. Tomson Stephen M. Lounsberry III Denise V. Gonick G. Thomas Tranter Jr. Jeffrey B. Streeter Thomas R. Tyrrell Joseph F. Meade IV

2023 Challenges • Financial Sector Turmoil • Interest Rate Environment • Balance Sheet Impact • Margin Compression
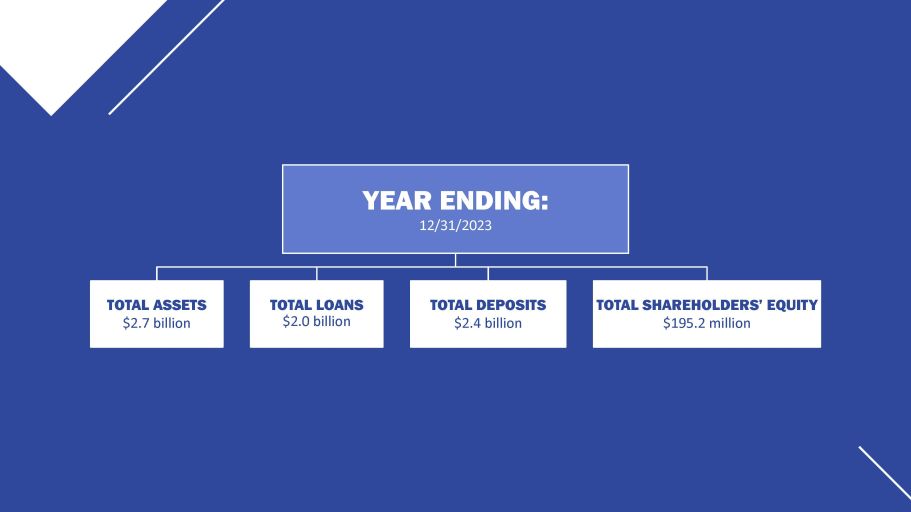
YEAR ENDING: 12/31/2023 TOTAL ASSETS $2.7 billion TOTAL LOANS $2.0 billion TOTAL DEPOSITS $2.4 billion TOTAL SHAREHOLDERS’ EQUITY $195.2 million
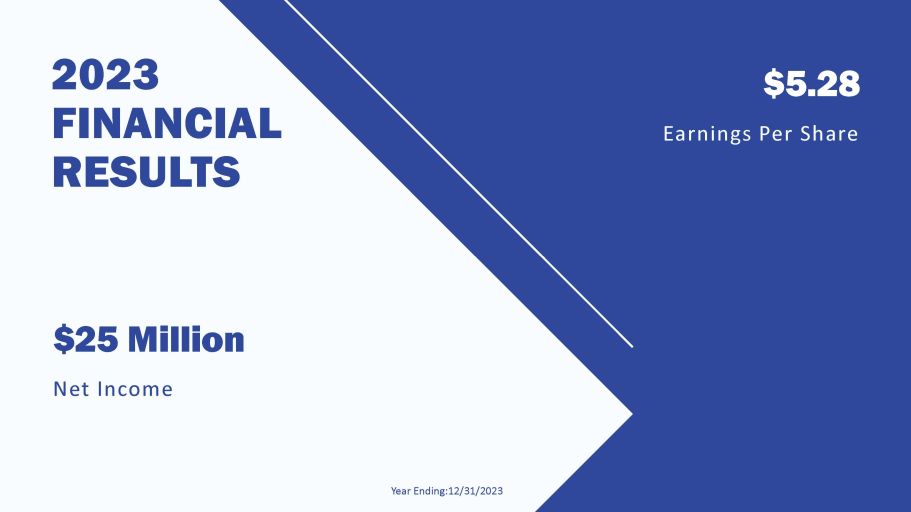
$25 Million Net Income $5.28 Earnings Per Share 2023 FINANCIAL RESULTS Year Ending:12/31/2023
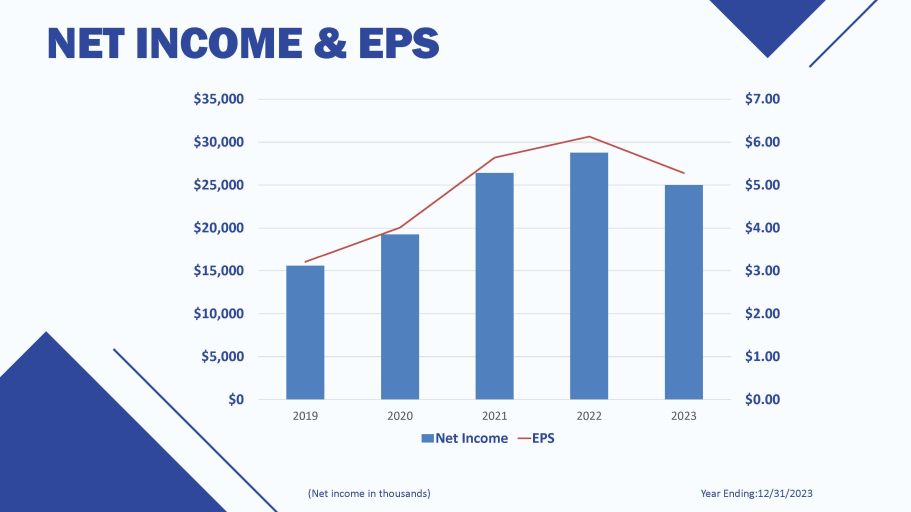
NET INCOME & EPS Year Ending:12/31/2023 (Net income in thousands) $0.00 $1.00 $2.00 $3.00 $4.00 $5.00 $6.00 $7.00 $0 $5,000 $10,000 $15,000 $20,000 $25,000 $30,000 $35,000 2019 2020 2022 2023 2021 Net Income EPS

RETURN ON AVERAGE ASSETS: 0.94% RETURN ON AVERAGE EQUITY: 14.11% Year Ending:12/31/2023
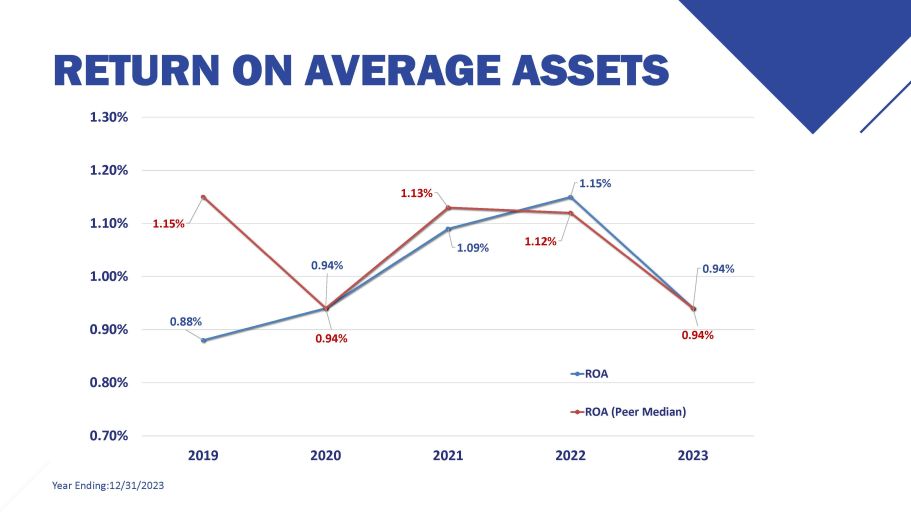
RETURN ON AVERAGE ASSETS Year Ending:12/31/2023 0.88% 0.94% 1.09% 1.15% 0.94% 1.15% 0.94% 1.13% 1.12% 0.94% 0.70% 0.80% 0.90% 1.00% 1.10% 1.30% 1.20% 2019 2020 2021 2022 2023 ROA ROA (Peer Median)
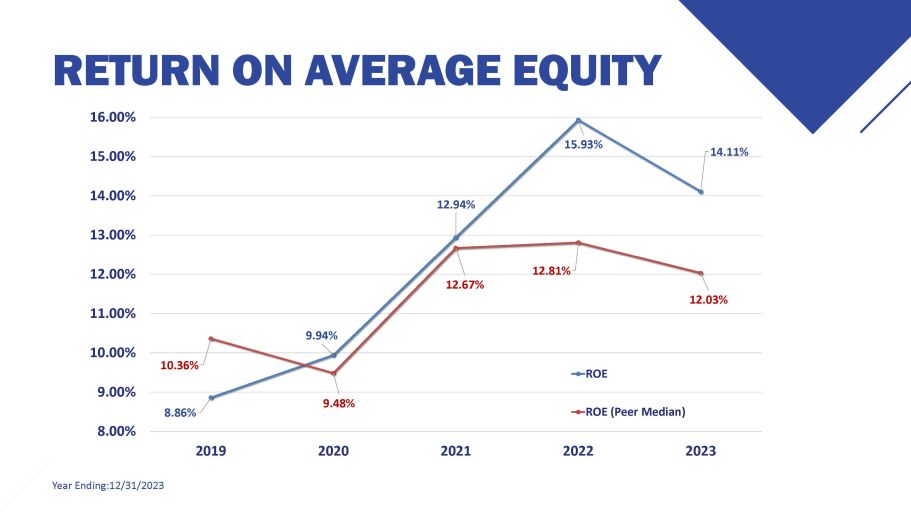
RETURN ON AVERAGE EQUITY Year Ending:12/31/2023 8.86% 9.94% 12.94% 15.93% 14.11% 10.36% 9.48% 12.67% 12.81% 12.03% 8.00% 9.00% 10.00% 11.00% 12.00% 13.00% 14.00% 15.00% 16.00% 2019 2020 2021 2022 2023 ROE ROE (Peer Median)
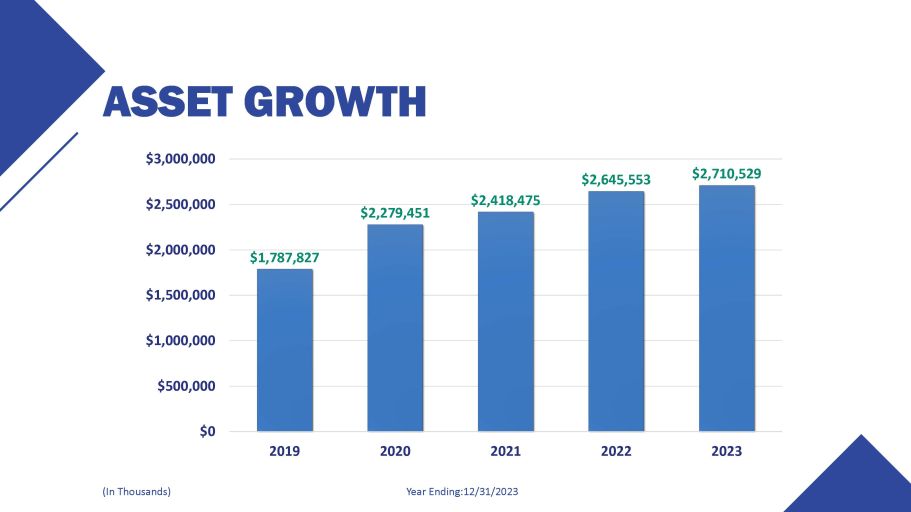
ASSET GROWTH 2020 2021 Year Ending:12/31/2023 (In Thousands) $1,787,827 $2,279,451 $2,418,475 $2,645,553 $2,710,529 $1,500,000 $1,000,000 $500,000 $0 $2,000,000 $2,500,000 $3,000,000 2019 2022 2023
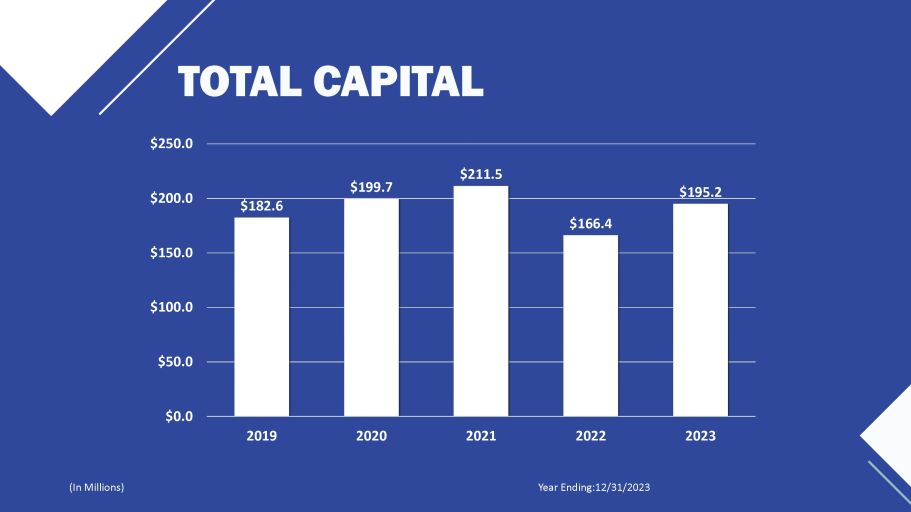
TOTAL CAPITAL Year Ending:12/31/2023 (In Millions) $182.6 $199.7 $211.5 $166.4 $195.2 $150.0 $100.0 $50.0 $0.0 $200.0 $250.0 2019 2020 2021 2022 2023
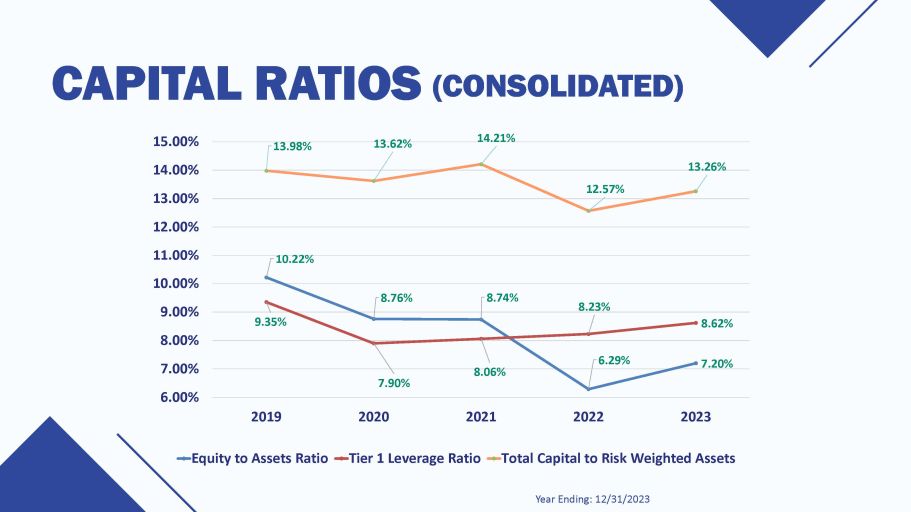
CAPITAL RATIOS (CONSOLIDATED) Year Ending: 12/31/2023 10.22% 8.76% 8.74% 6.29% 7.20% 9.35% 7.90% 8.06% 8.23% 8.62% 13.98% 13.62% 14.21% 12.57% 13.26% 6.00% 7.00% 8.00% 9.00% 10.00% 11.00% 12.00% 13.00% 14.00% 15.00% 2019 Equity to Assets Ratio 2020 2021 Tier 1 Leverage Ratio 2022 2023 Total Capital to Risk Weighted Assets
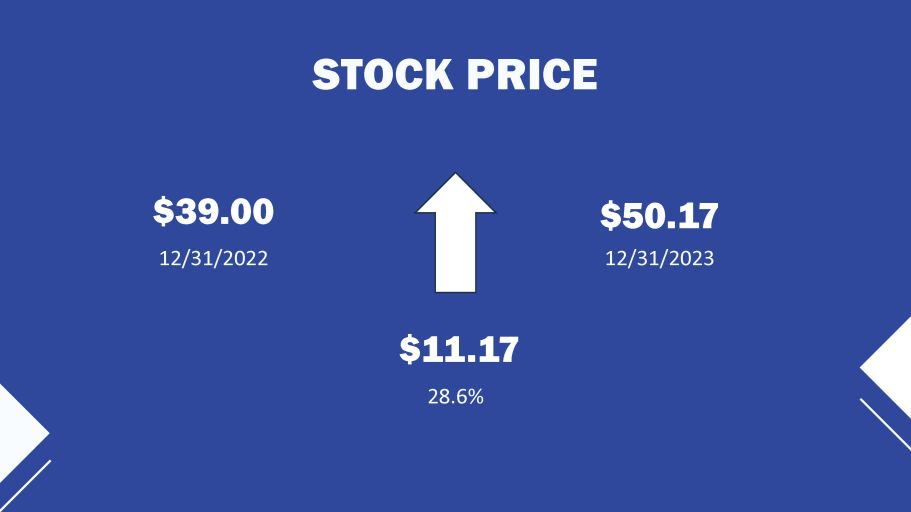
STOCK PRICE $39.00 12/31/2022 $11.17 28.6% $50.17 12/31/2023
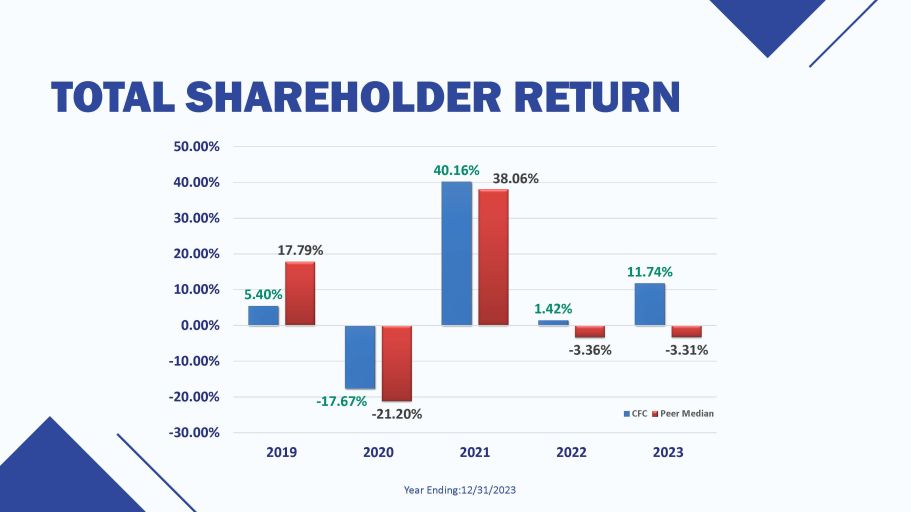
TOTAL SHAREHOLDER RETURN Year Ending:12/31/2023 5.40% 40.16% 1.42% 11.74% 17.79% - 17.67% - 21.20% 38.06% - 3.36% - 3.31% - 30.00% - 20.00% - 10.00% 0.00% 10.00% 20.00% 30.00% 40.00% 50.00% 2019 2020 2021 2022 2023 CFC Peer Median
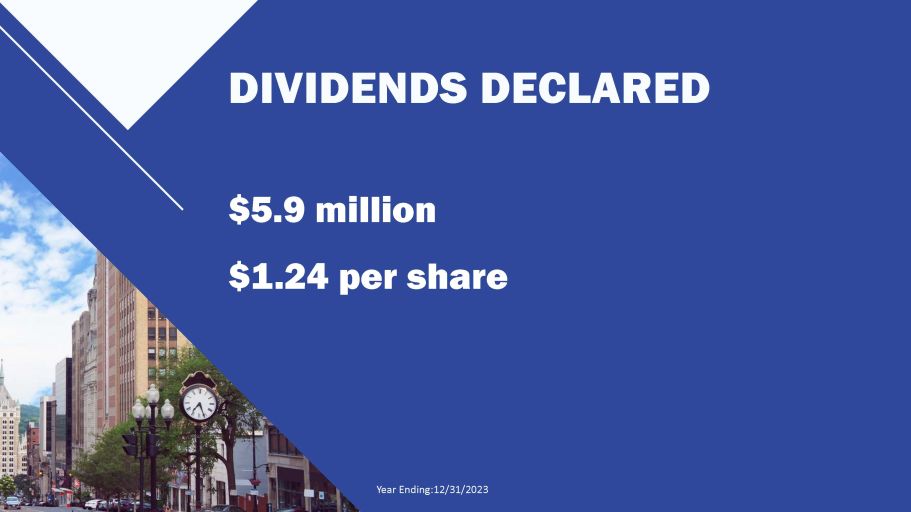
DIVIDENDS DECLARED Year Ending:12/31/2023 $5.9 million $1.24 per share

LENDING & DEPOSIT ACTIVITY
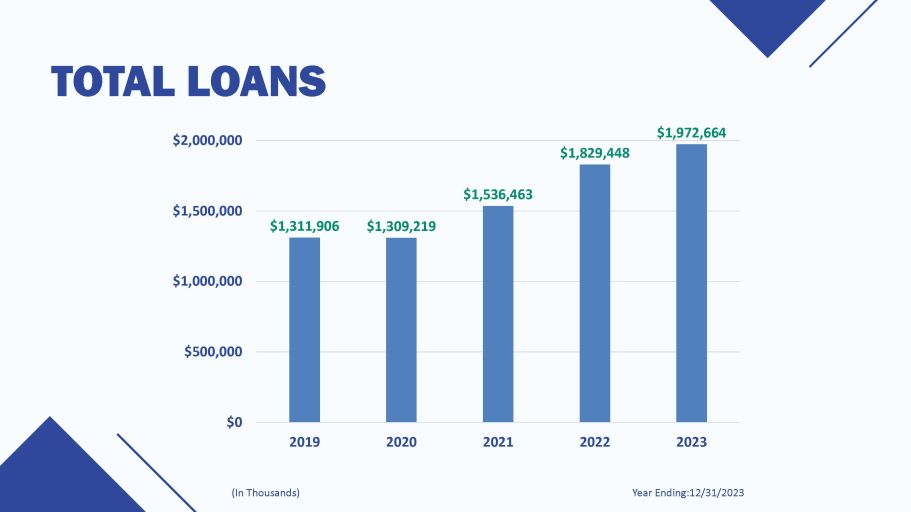
TOTAL LOANS Year Ending:12/31/2023 (In Thousands) $1,311,906 $1,309,219 $1,829,448 $1,536,463 $1,972,664 $0 $500,000 $1,000,000 $1,500,000 $2,000,000 2019 2020 2021 2022 2023
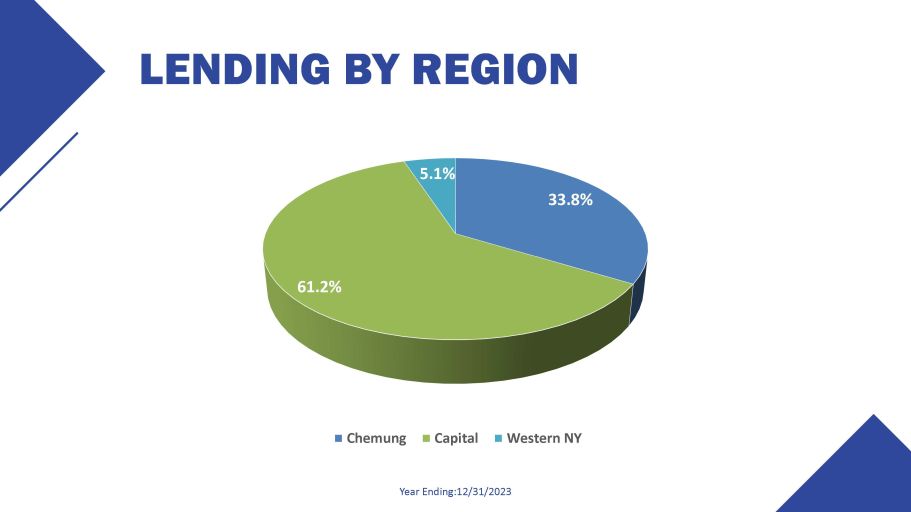
LENDING BY REGION Year Ending:12/31/2023 61.2% 5.1% 33.8% Chemung Capital Western NY
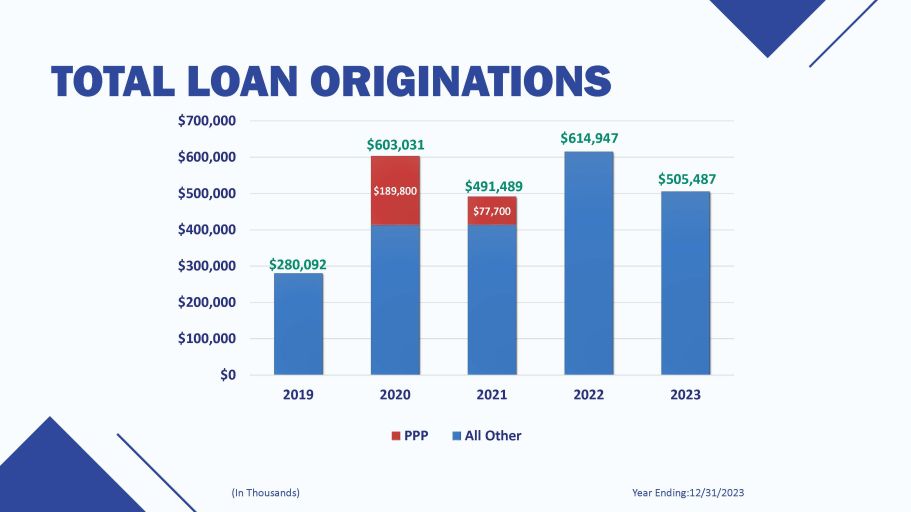
TOTAL LOAN ORIGINATIONS Year Ending:12/31/2023 (In Thousands) $280,092 $614,947 $491,489 $603,031 $505,487 $189,800 $77,700 $200,000 $100,000 $0 $300,000 $400,000 $500,000 $600,000 $700,000 2019 2020 2021 2022 2023 PPP All Other
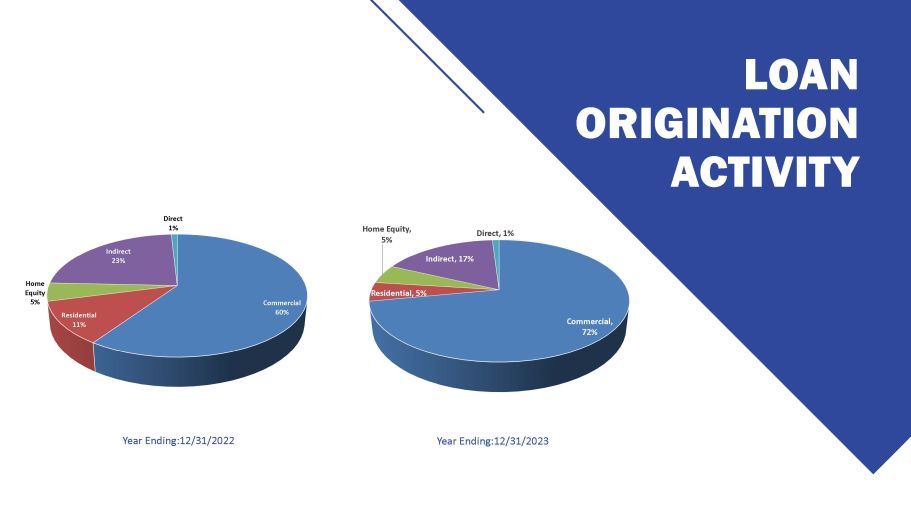
LOAN ORIGINATION ACTIVITY Year Ending:12/31/2022 Year Ending:12/31/2023 Commercial 60% Residential 11% Home Equity 5% Indirect 23% Direct 1% Commercial, 72% Residential, 5% Home Equity, 5% Indirect, 17% Direct, 1%
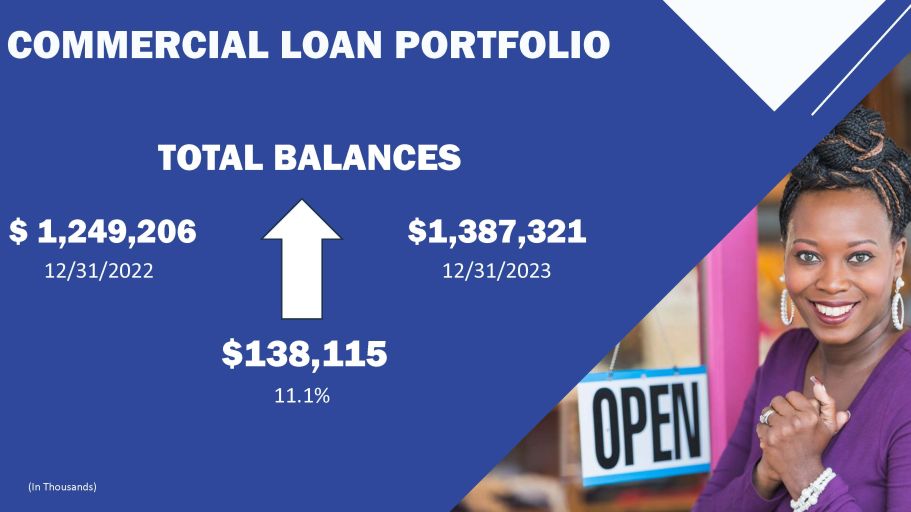
COMMERCIAL LOAN PORTFOLIO $ 1,249,206 12/31/2022 $138,115 11.1% $1,387,321 12/31/2023 TOTAL BALANCES (In Thousands)
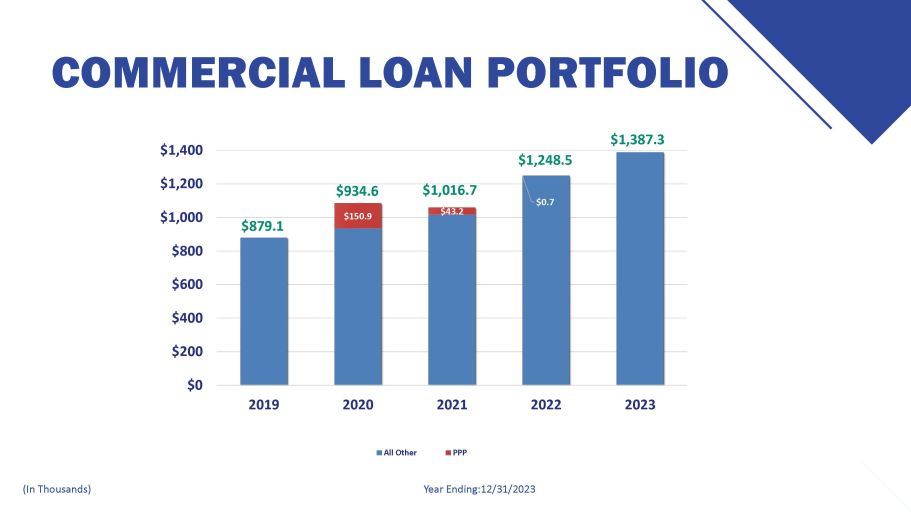
COMMERCIAL LOAN PORTFOLIO Year Ending:12/31/2023 (In Thousands) $879.1 $1,248.5 $1,387.3 $934.6 $150.9 $1,016.7 $43.2 $0.7 $800 $600 $400 $200 $0 $1,000 $1,200 $1,400 2019 2020 2021 2022 2023 All Other PPP
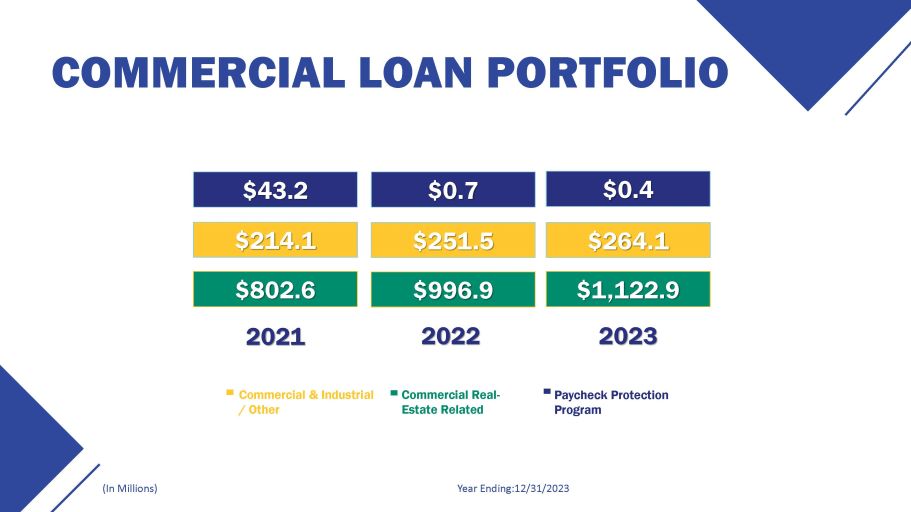
COMMERCIAL LOAN PORTFOLIO Year Ending:12/31/2023 (In Millions) 2021 2022 2023 $996.9 $251.5 $0.7 $0.4 $264.1 $1,122.9 $43.2 $802.6 $214.1 Commercial & Industrial / Other Commercial Real - Estate Related Paycheck Protection Program
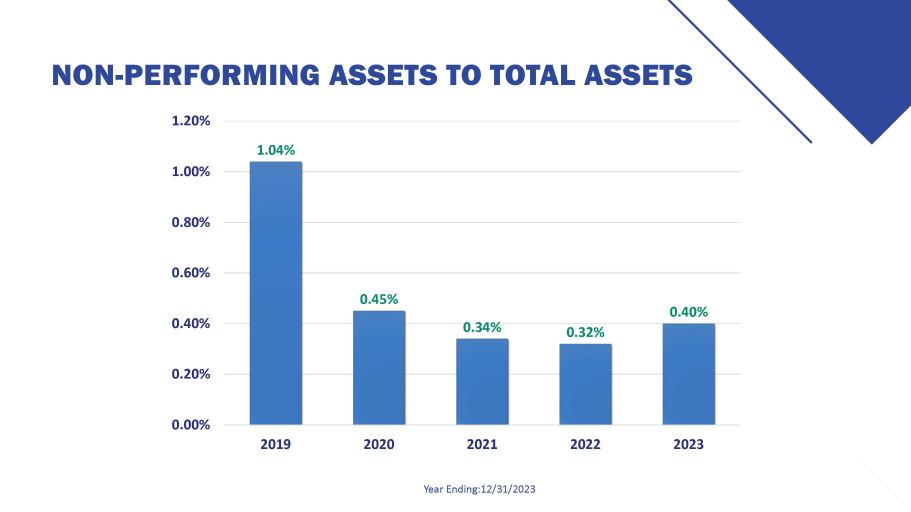
NON - PERFORMING ASSETS TO TOTAL ASSETS Year Ending:12/31/2023 0.45% 0.34% 0.32% 0.40% 1.20% 1.04% 1.00% 0.80% 0.60% 0.20% 0.00% 0.40% 2019 2020 2021 2022 2023

DEPOSIT GROWTH $102,200 4.4% Year Ending:12/31/2023 (In Thousands)
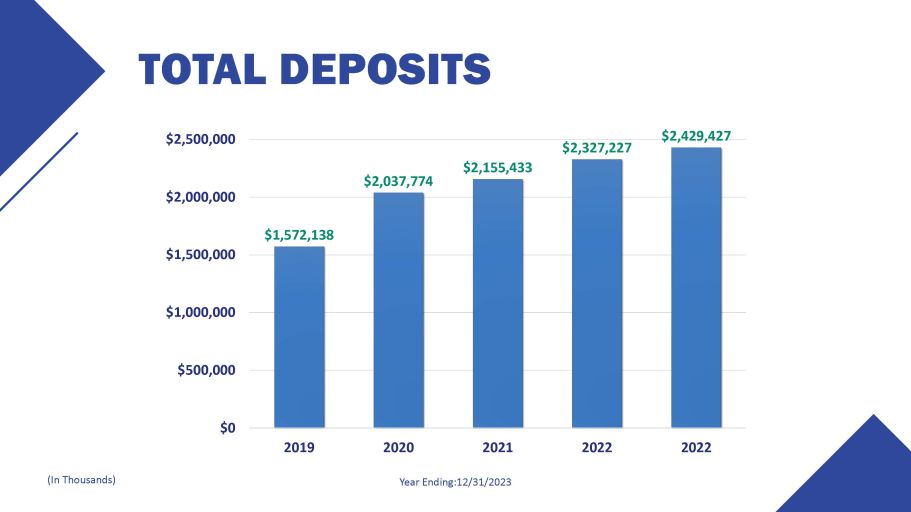
TOTAL DEPOSITS 2020 2021 Year Ending:12/31/2023 (In Thousands) $2,155,433 $2,037,774 $2,327,227 $2,429,427 $2,000,000 $1,572,138 $1,500,000 $1,000,000 $500,000 $0 $2,500,000 2019 2022 2022
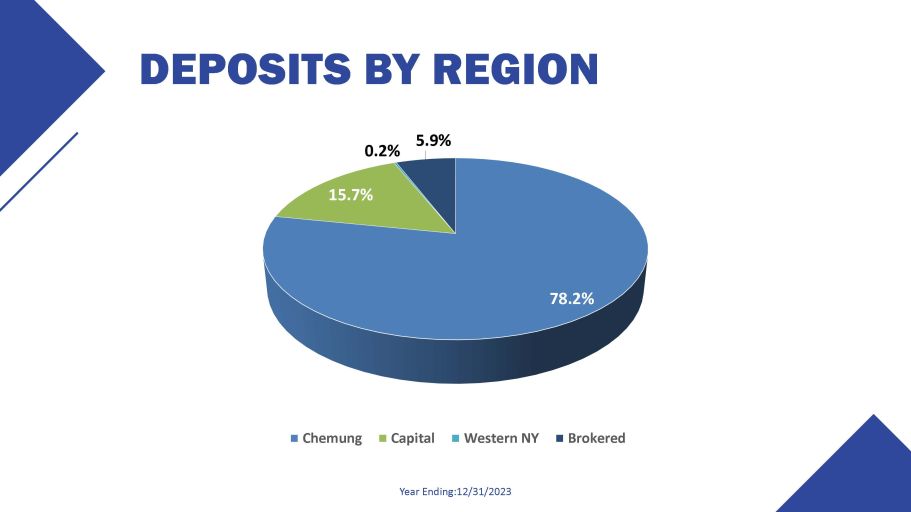
DEPOSITS BY REGION Year Ending:12/31/2023 78.2% 15.7% 0.2% 5.9% Chemung Capital Western NY Brokered
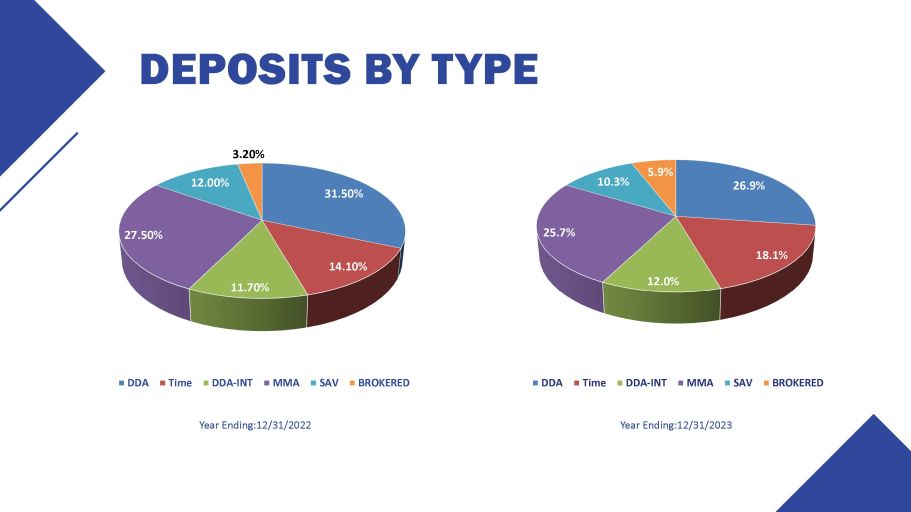
DEPOSITS BY TYPE 26.9% 18.1% 12.0% 25.7% 10.3% 5.9% DDA Time DDA - INT MMA SAV BROKERED Year Ending:12/31/2023 31.50% 14.10% 3.20% 12.00% 27.50% 11.70% DDA Time DDA - INT MMA SAV BROKERED Year Ending:12/31/2022
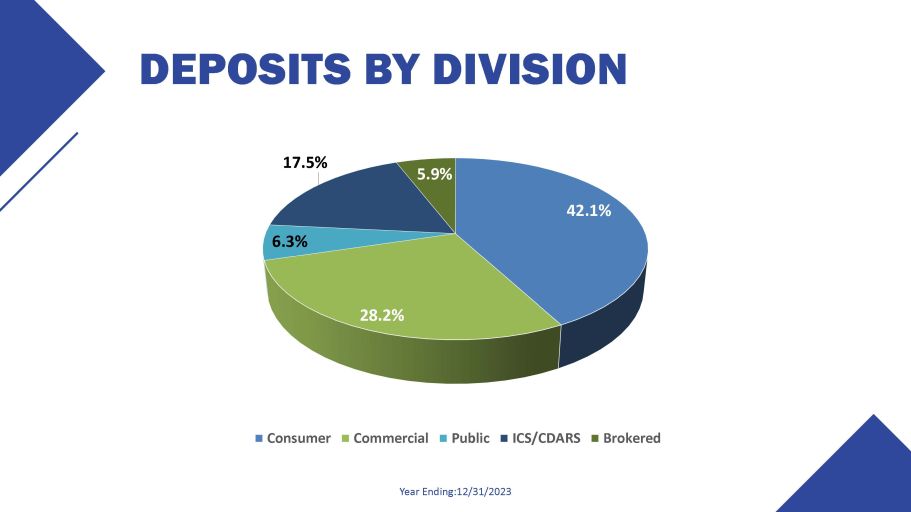
DEPOSITS BY DIVISION Year Ending:12/31/2023 42.1% 28.2% 6.3% 17.5% 5.9% Consumer Commercial Public ICS/CDARS Brokered
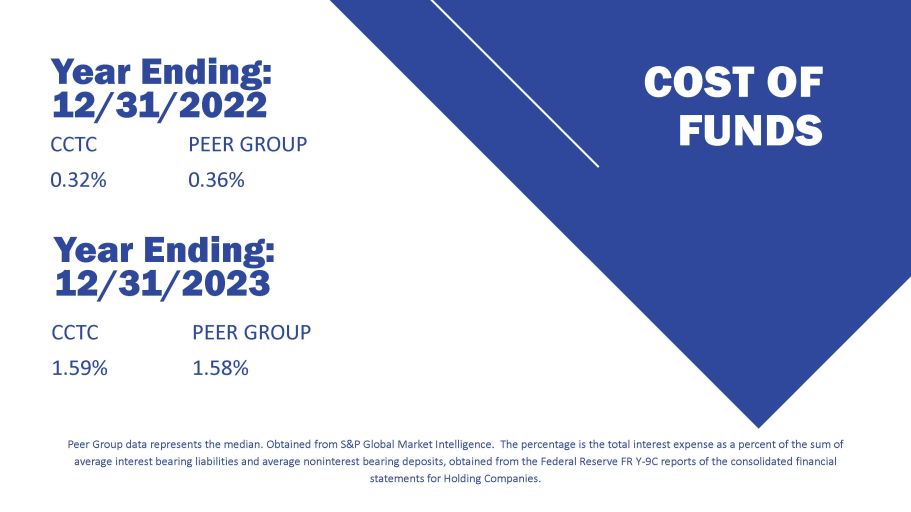
COST OF FUNDS CCTC 0.32% PEER GROUP 0.36% Year Ending: 12/31/2022 CCTC 1.59% PEER GROUP 1.58% Year Ending: 12/31/2023 Peer Group data represents the median. Obtained from S&P Global Market Intelligence. The percentage is the total interest expense as a percent of the sum of average interest bearing liabilities and average noninterest bearing deposits, obtained from the Federal Reserve FR Y - 9C reports of the consolidated financial statements for Holding Companies.
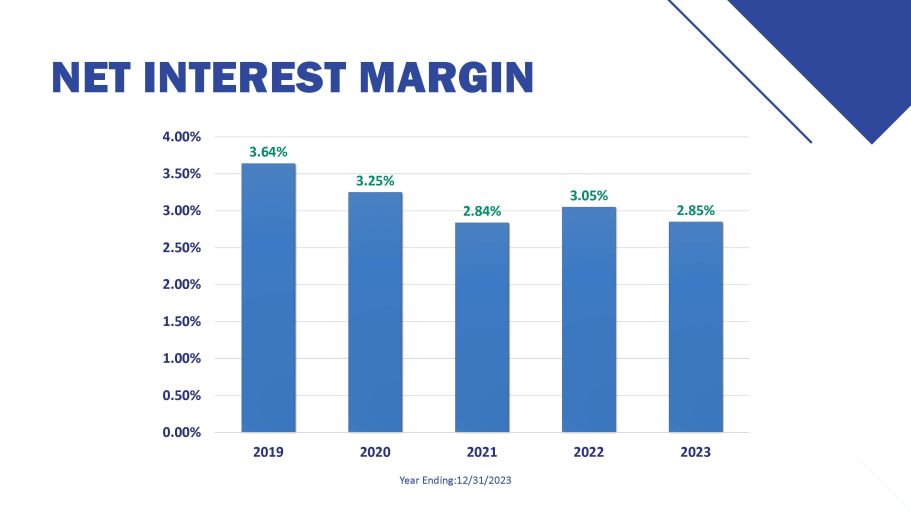
NET INTEREST MARGIN Year Ending:12/31/2023 4.00% 3.64% 3.25% 2.84% 3.05% 2.85% 2.50% 2.00% 1.50% 1.00% 0.50% 0.00% 3.00% 3.50% 2019 2020 2021 2022 2023
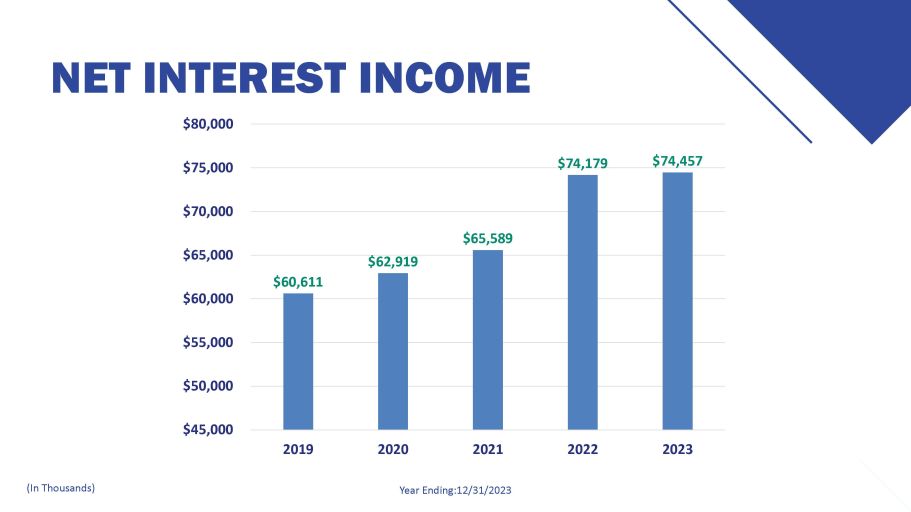
NET INTEREST INCOME 2020 2021 Year Ending:12/31/2023 (In Thousands) $62,919 $65,589 $60,611 $60,000 $55,000 $50,000 $45,000 $74,179 $74,457 $65,000 $70,000 $75,000 $80,000 2019 2022 2023
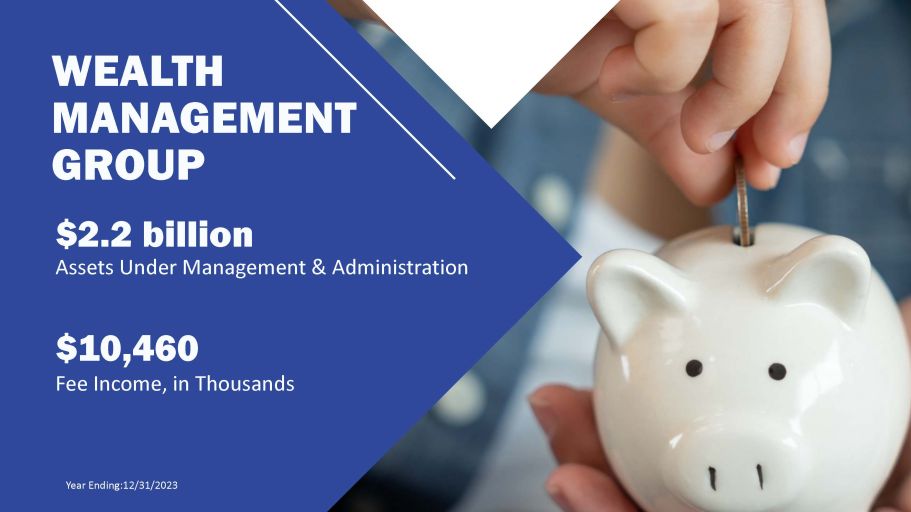
WEALTH MANAGEMENT GROUP $2.2 billion Assets Under Management & Administration $10,460 Fee Income, in Thousands Year Ending:12/31/2023
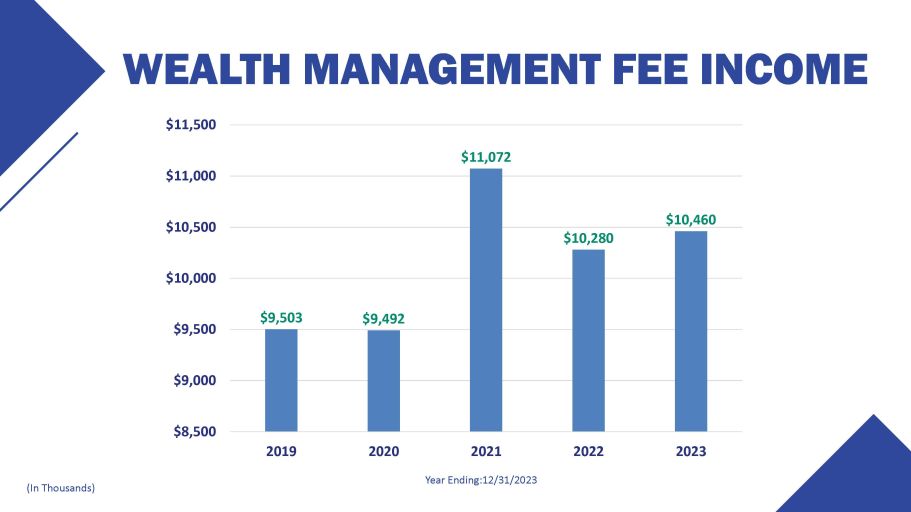
WEALTH MANAGEMENT FEE INCOME Year Ending:12/31/2023 (In Thousands) $9,503 $9,492 $11,072 $10,280 $10,460 $9,000 $8,500 $9,500 $10,000 $10,500 $11,000 $11,500 2019 2020 2021 2022 2023
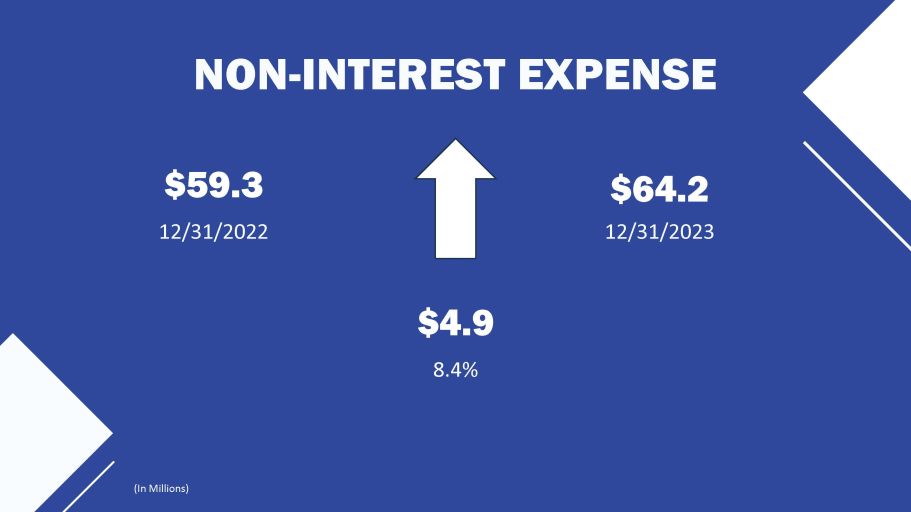
NON - INTEREST EXPENSE $59.3 12/31/2022 $4.9 8.4% $64.2 12/31/2023 (In Millions)
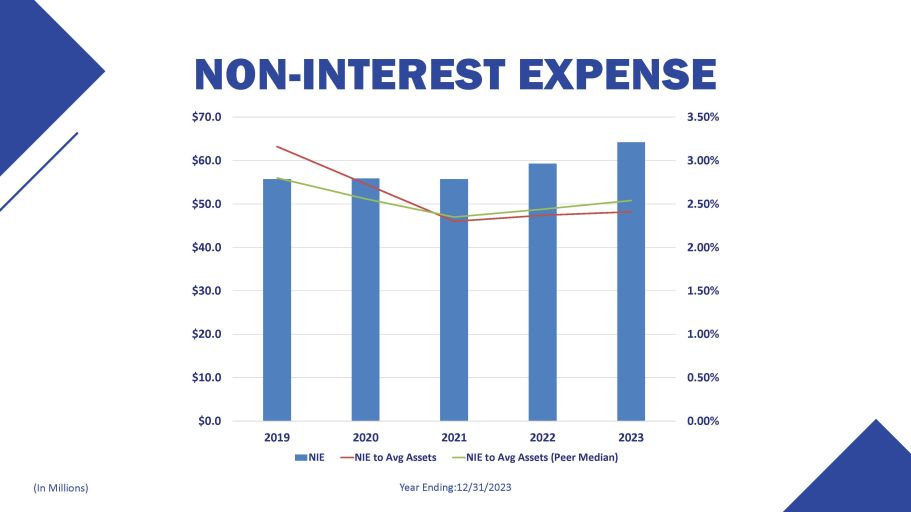
Year Ending:12/31/2023 (In Millions) NON - INTEREST EXPENSE $70.0 3.50% 0.00% 0.50% 1.00% 1.50% 2.00% 2.50% 3.00% $0.0 $10.0 $20.0 $30.0 $40.0 $50.0 $60.0 2019 2023 NIE 2020 NIE to Avg Assets 2021 2022 NIE to Avg Assets (Peer Median)
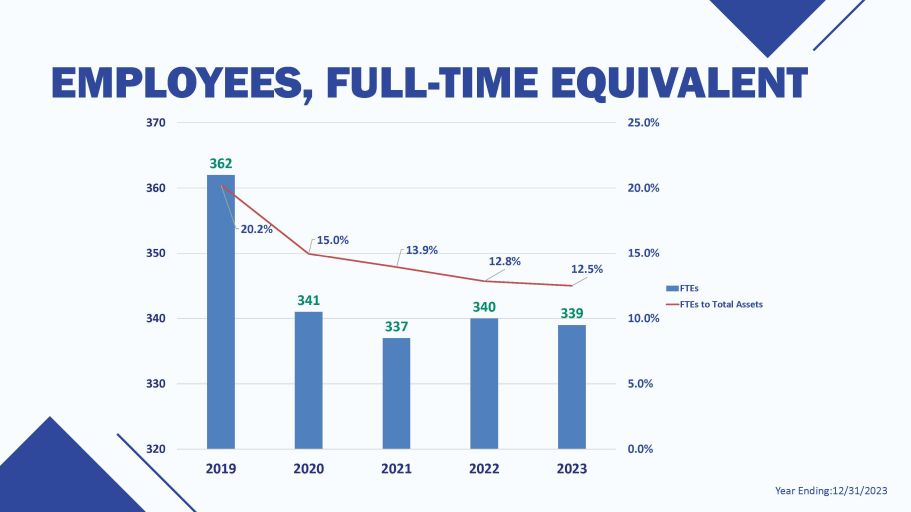
Year Ending:12/31/2023 362 341 337 340 339 20.2% 15.0% 13.9% 12.8% 12.5% 0.0% 5.0% 10.0% 15.0% 20.0% 320 330 340 350 360 EMPLOYEES, FULL - TIME EQUIVALENT 370 25.0% 2019 2020 2021 2022 2023 FTEs FTEs to Total Assets
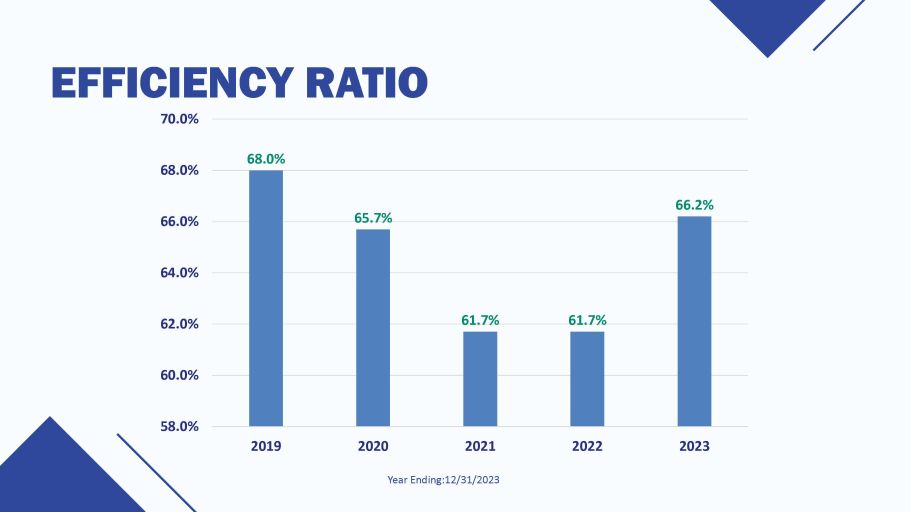
EFFICIENCY RATIO 68.0% 65.7% 61.7% 61.7% 66.2% 60.0% 58.0% 62.0% 64.0% 66.0% 68.0% 70.0% 2019 2020 2021 Year Ending:12/31/2023 2022 2023
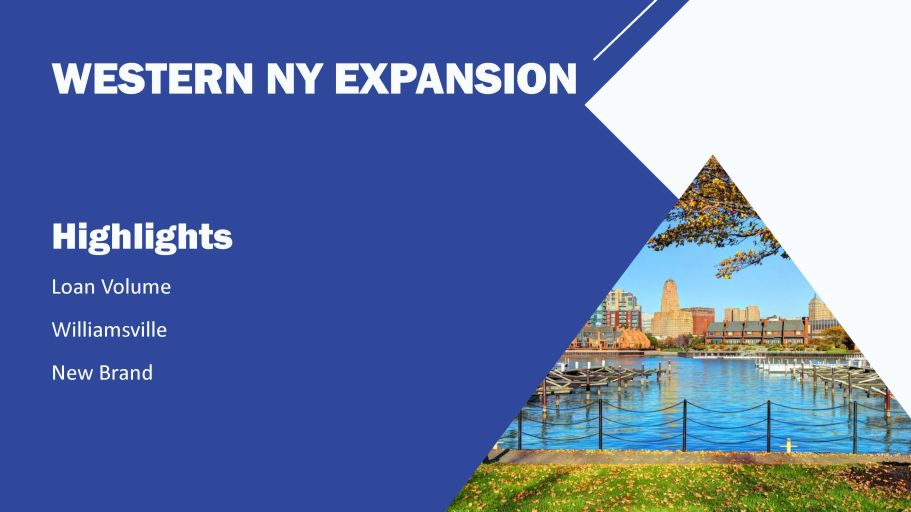
WESTERN NY EXPANSION Highlights Loan Volume Williamsville New Brand
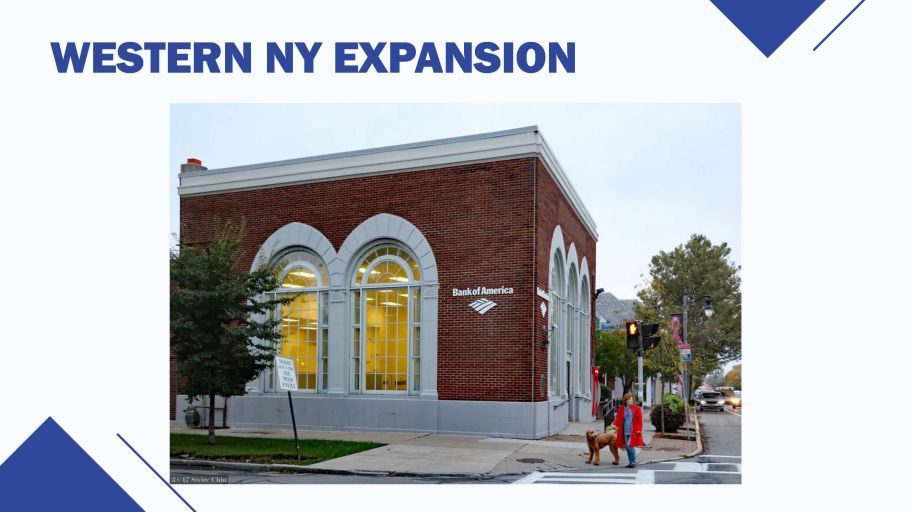
WESTERN NY EXPANSION
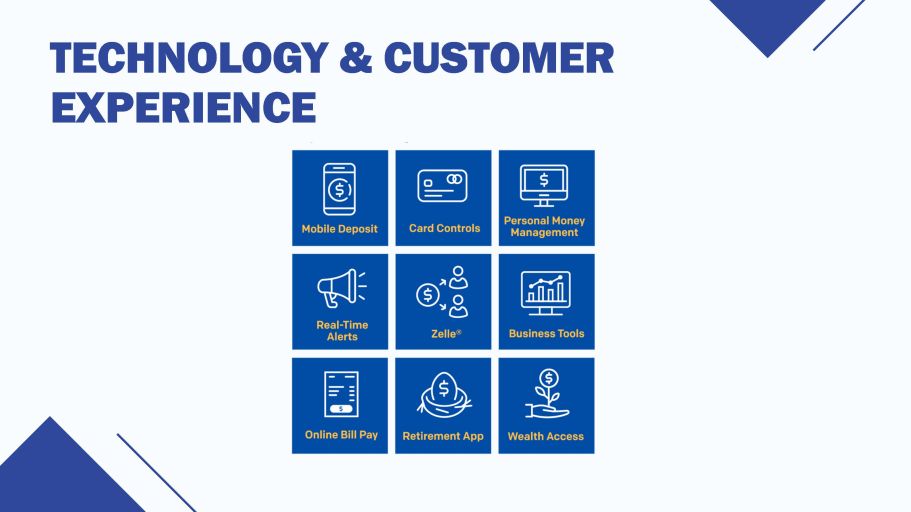
TECHNOLOGY & CUSTOMER EXPERIENCE
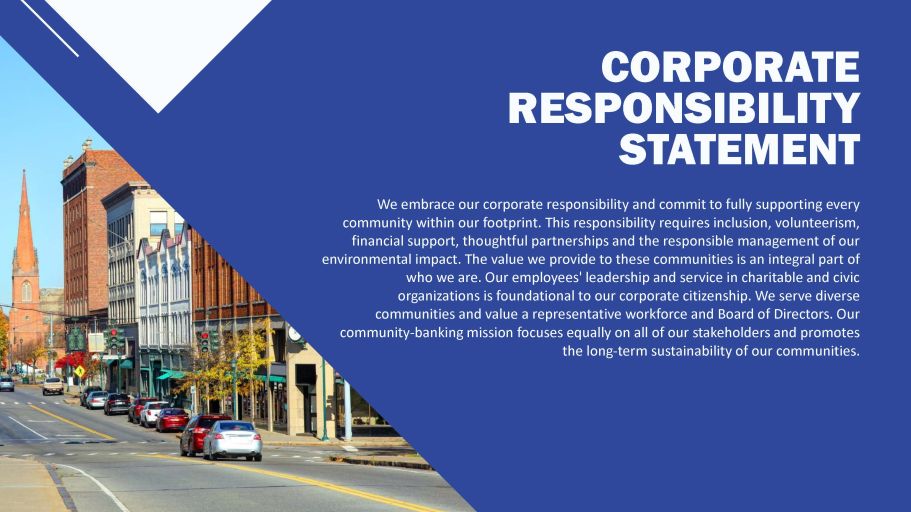
CORPORATE RESPONSIBILITY STATEMENT We embrace our corporate responsibility and commit to fully supporting every community within our footprint. This responsibility requires inclusion, volunteerism, financial support, thoughtful partnerships and the responsible management of our environmental impact. The value we provide to these communities is an integral part of who we are. Our employees' leadership and service in charitable and civic organizations is foundational to our corporate citizenship. We serve diverse communities and value a representative workforce and Board of Directors. Our community - banking mission focuses equally on all of our stakeholders and promotes the long - term sustainability of our communities.
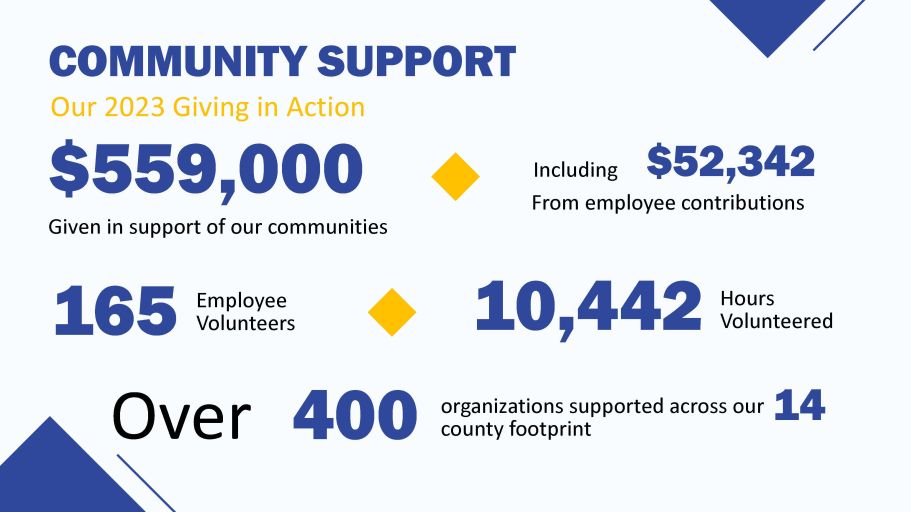
COMMUNITY SUPPORT Our 2023 Giving in Action $559,000 Given in support of our communities $52,342 Including From employee contributions Hours Volunteered 10,442 Employee Volunteers 165 county footprint Over 400 organizations supported across our 14

COMMUNITY SUPPORT IN ACTION

SUPPORTING OUR COMMUNITY
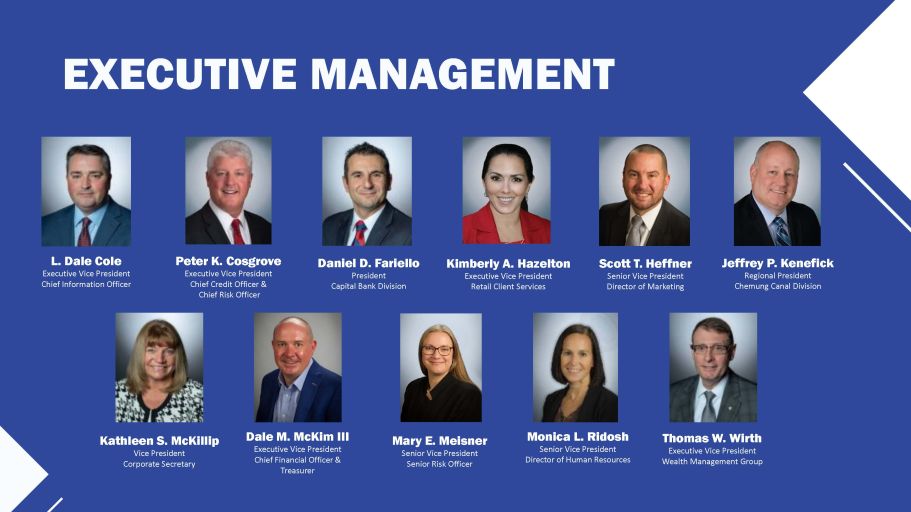
EXECUTIVE MANAGEMENT L. Dale Cole Executive Vice President Chief Information Officer Daniel D. Fariello President Capital Bank Division Kimberly A. Hazelton Executive Vice President Retail Client Services Scott T. Heffner Senior Vice President Director of Marketing Kathleen S. McKillip Vice President Corporate Secretary Dale M. McKim III Executive Vice President Chief Financial Officer & Treasurer Thomas W. Wirth Executive Vice President Wealth Management Group Peter K. Cosgrove Executive Vice President Chief Credit Officer & Chief Risk Officer Mary E. Meisner Senior Vice President Senior Risk Officer Jeffrey P. Kenefick Regional President Chemung Canal Division Monica L. Ridosh Senior Vice President Director of Human Resources
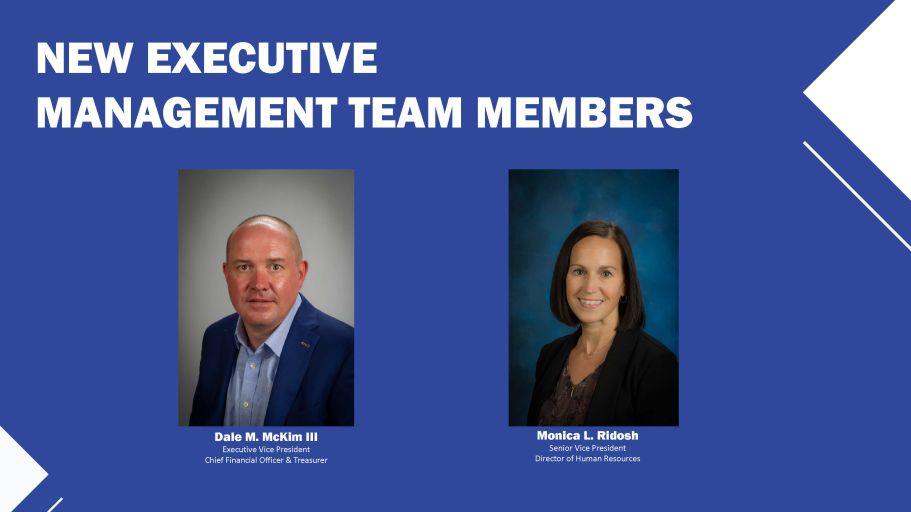
NEW EXECUTIVE MANAGEMENT TEAM MEMBERS Dale M. McKim III Executive Vice President Chief Financial Officer & Treasurer Monica L. Ridosh Senior Vice President Director of Human Resources
KEY STRATEGIES • Revenue Growth • Operating Efficiencies • Customer Experience • Colleague & Community Support

Thank You