UNITED STATES
SECURITIES AND EXCHANGE COMMISSION
Washington, D.C. 20549
FORM
CURRENT REPORT
PURSUANT TO SECTION 13 OR 15(d) OF THE
SECURITIES EXCHANGE ACT OF 1934
Date
of Report (Date of earliest event reported):
(Exact name of registrant as specified in its charter)
(State or other jurisdiction of incorporation) |
(Commission File Number) |
(IRS Employer Identification No.) |
(Address of principal executive offices, including zip code)
Registrant’s
telephone number, including area code:
Not Applicable
(Former name or former address, if changed since last report)
Check the appropriate box below if the Form 8-K filing is intended to simultaneously satisfy the filing obligation of the registrant under any of the following provisions:
| Written communications pursuant to Rule 425 under the Securities Act (17 CFR 230.425) | ||
| Soliciting material pursuant to Rule 14a-12 under the Exchange Act (17 CFR 240.14a-12) | ||
| Pre-commencement communications pursuant to Rule 14d-2(b) under the Exchange Act (17 CFR 240.14d-2(b)) | ||
| Pre-commencement communications pursuant to Rule 13e-4(c) under the Exchange Act (17 CFR 240.13e-4(c)) |
Securities registered pursuant to Section 12(b) of the Act:
| Title of each class | Trading Symbol(s) |
Name of each exchange on which registered | ||
Indicate by check mark whether the registrant is an emerging growth company as defined in Rule 405 of the Securities Act of 1933 (§230.405 of this chapter) or Rule 12b-2 of the Securities Exchange Act of 1934 (§240.12b-2 of this chapter).
Emerging
growth company
If an emerging growth company, indicate by check mark if the registrant has elected not to use the extended transition period for complying with any new or revised financial accounting standards provided pursuant to Section 13(a) of the Exchange Act. ☐
| Item 2.02 | Results of Operations and Financial Condition |
Press Release
On May 14, 2024, Presidio Property Trust, Inc. (the “Company”) issued a press release announcing its financial results for the thee months ended March 31, 2024, and made the press release available on its website, www.PresidioPT.com. A copy of the press release is attached hereto as Exhibit 99.1 and is incorporated by reference herein.
The Company also made available on its website a financial supplement containing financial data of the Company (“Supplemental Financial Information”) for the quarter ended March 31, 2024, and such Supplemental Financial Information is attached hereto as Exhibit 99.2 and is incorporated by reference herein.
The information in this Item 2.02 of this Current Report on Form 8-K, including the information contained in the exhibits, shall not be deemed “filed” for the purposes of Section 18 of the Securities Exchange Act of 1934, as amended (the “Exchange Act”), or otherwise subject to the liabilities of that section and shall not be incorporated by reference into any registration statement or other document filed under the Securities Act of 1933, as amended, or the Exchange Act, except as shall be expressly set forth by specific reference in such filing.
| Item 7.01 | Regulation FD Disclosure. |
The Supplemental Financial Information furnished by the Company and posted to its website as described above under Item 2.02 is hereby incorporated by reference into this Item 7.01.
| Item 9.01 | Financial Statements and Exhibits. |
| (d) | Exhibits | |
| 99.1 | Press Release dated May 14, 2024 | |
| 99.2 | Supplemental Financial Information for the quarter ended March 31, 2024 | |
| 104 | Cover Page Interactive Data File (embedded with the inline XBRL document) |
SIGNATURES
Pursuant to the requirements of the Securities Exchange Act of 1934, the registrant has duly caused this report to be signed on its behalf by the undersigned hereunto duly authorized.
| Date: May 14, 2024 | PRESIDIO PROPERTY TRUST, INC. | |
| By: | /s/ Ed Bentzen | |
| Name: | Ed Bentzen | |
| Title: | Chief Financial Officer | |
Exhibit 99.1
Presidio Property Trust, Inc. Announces Earnings for
the First Quarter Ended March 31, 2024
San Diego, California, May 14, 2024 – Presidio Property Trust, Inc. (Nasdaq: SQFT, SQFTP, SQFTW) (the “Company”), an internally managed, diversified real estate investment trust (“REIT”), today reported earnings for its quarter ended March 31, 2024.
“During the first quarter of 2024, we have signed leasing transactions totaling 24,476 sf, including new leases and renewals. We believe 2024 is off to a good start. With currently scheduled lease expirations during 2024 at a level nearly one-half of that during 2023, there is good reason to anticipate that our rent roll will be more stable through the end of the year, even considering this period of uncertainty in the commercial real estate markets, “ said Gary Katz, the Company’s Chief Investment Officer
Three Months Ended March 31, 2024, Financial Results
Net loss attributable to the Company’s common stockholders for the three months ended March 31, 2024 was approximately $5.8 million, or ($0.47) per basic and diluted share, compared to a net loss of approximately $1.5 million, or $(0.13) per basic and diluted share for the three months ended March 31, 2023. The change in net income attributable to the Company’s common stockholders was a result of:
| ● | Total revenues were approximately $4.8 million for the three months ended March 31, 2024, compared to approximately $4.1 million for the same period in 2023. As of March 31, 2024, we had approximately $135.3 million in net real estate assets including 88 model homes, compared to approximately $133.9 million in net real estate assets including 98 model homes at March 31, 2023. The average number of model homes held during the three months ended March 31, 2024 and 2023 was 99 and 95, respectively. The change in revenue is directly related to the average real estate assets held during the period, new commercial real estate leases, and model home transaction fees earned by the Company during the current period. | |
| ● | During the three months ended March 31, 2024, we recognized a non-cash impairment charge of approximately $0.1 million related to four model homes, three of which already had an impairment as of December 31, 2023. The new impairment charges for the four model homes reflects the estimated sales prices for these specific model homes in April and May 2024. These homes had an abnormally short hold period, less than two years, where the builder changed their product style in the neighborhoods where our model homes are located, in Texas, after we had purchased the homes. We do not believe these losses are indicative of our overall model home portfolio. | |
| ● | Model home transactions fees were up $95k in Q1 2024 as compared to Q1 2023 related to the number of model home sales during the first quarter of 2024. There were 27 model home sales in 2024, compared to three during the first quarter in 2023. In connection with those sales, we recorded a gain of $2.0 million and $0.4 million during Q1 2024 and Q1 2023, respectively. |
| ● | Our investments in the common stock and warrants of Conduit Pharmaceuticals Inc. presented in the consolidated balance sheets were measured at fair value using Level 1 market prices, taking into account the adoption of ASU 2022-03 Fair Value Measurement of Equity Securities Subject to Contractual Sale Restrictions, and totaled approximately $14.5 million and $18.3 million as of March 31, 2024 and December 31, 2023, respectively, with a cost basis of approximately $7.5 million. For the three months ended March 31, 2024, the fair value remeasure resulted in a loss on marketable securities totaling approximately $3.9 million. As of March 31, 2024, our investments in in these securities presented in the consolidated balance sheets were measured at fair value using Level 1 market prices, which closed at $3.59 per share and $0.06 per warrant. |
FFO (non-GAAP) decreased by approximately $0.7 million to approximately $(971,367) from $(228,914) for the three months ended March 31, 2024 and 2023, respectively. A reconciliation of FFO to net income, the most directly comparable GAAP financial measure, is attached to this press release. However, because FFO excludes depreciation and amortization as well as the changes in the value of the Company’s properties that result from use or market conditions, each of which have real economic effects and could materially impact the Company’s results from operations, the utility of FFO as a measure of the Company’s performance is limited.
We believe Core FFO (non-GAAP) provides a useful metric in comparing operations between reporting periods and in assessing the sustainability of our ongoing operating performance. Core FFO decreased by about $0.4 million, from approximately $31,932 for the three months ended March 31, 2023, to approximately $(429,445) for the three months ended March 31, 2024. A reconciliation of Core FFO to net income, the most directly comparable GAAP financial measure, is attached to this press release.
Acquisitions and Dispositions for the three months ended March 31, 2024:
| ● | The Company acquired five model homes for approximately $2.2 million. The purchase price was paid through cash payments of approximately $0.6 million and mortgage notes of approximately $1.6 million. |
| ● | The Company sold 27 model homes for approximately $14.0 million and recognized a gain of approximately $2.0 million. |
Dividends paid during the three months ended March 31, 2024:
The following is a summary of distributions declared per share of our Series A Common Stock and for our Series D Preferred Stock for the three months ended March 31, 2024 and 2023.
Series A Common Stock
| Quarter Ended | 2024 | 2023 | ||||||
| Distributions Declared | Distributions Declared | |||||||
| March 31 | $ | - | $ | 0.022 | ||||
| Total | $ | - | $ | 0.022 | ||||
Series D Preferred Stock
| Month | 2024 | 2023 | ||||||
| Distributions Declared | Distributions Declared | |||||||
| January | $ | 0.19531 | $ | 0.19531 | ||||
| February | 0.19531 | 0.19531 | ||||||
| March | 0.19531 | 0.19531 | ||||||
| Total | $ | 0.58593 | $ | 0.58593 | ||||
About Presidio Property Trust
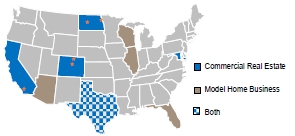
Presidio is an internally managed, diversified REIT with holdings in model home properties which are triple-net leased to homebuilders, office, industrial, and retail properties. Presidio’s model homes are leased to homebuilders located in Arizona, Illinois, Texas, Wisconsin, and Florida. Our office, industrial and retail properties are located primarily in Colorado, with properties also located in Maryland, North Dakota, Texas, and Southern California. While geographical clustering of real estate enables us to reduce our operating costs through economies of scale by servicing several properties with less staff, it makes us susceptible to changing market conditions in these discrete geographic areas, including those that have developed as a result of COVID-19. Presidio owns approximately 6.5% of the outstanding common stock of Conduit Pharmaceuticals Inc., a disease agnostic multi-asset clinical-stage disease-agnostic life science company providing an efficient model for compound development. For more information on Presidio, please visit the Company’s website at https://www.PresidioPT.com.
Definitions
Non-GAAP Financial Measures
Funds from Operations (“FFO”) – The Company evaluates performance based on Funds From Operations, which we refer to as FFO, as management believes that FFO represents the most accurate measure of activity and is the basis for distributions paid to equity holders. The Company defines FFO as net income or loss (computed in accordance with GAAP), excluding gains (or losses) from sales of property, hedge ineffectiveness, acquisition costs of newly acquired properties that are not capitalized and lease acquisition costs that are not capitalized plus depreciation and amortization, including amortization of acquired above and below market lease intangibles and impairment charges on properties or investments in non-consolidated REITs, and after adjustments to exclude equity in income or losses from, and, to include the proportionate share of FFO from, non-consolidated REITs.
However, because FFO excludes depreciation and amortization as well as the changes in the value of the Company’s properties that result from use or market conditions, each of which have real economic effects and could materially impact the Company’s results from operations, the utility of FFO as a measure of the Company’s performance is limited. In addition, other REITs may not calculate FFO in accordance with the NAREIT definition as the Company does, and, accordingly, the Company’s FFO may not be comparable to other REITs’ FFO. Accordingly, FFO should be considered only as a supplement to net income as a measure of the Company’s performance.
Core Funds from Operations (“Core FFO”) – We calculate Core FFO by using FFO as defined by NAREIT and adjusting for certain other non-core items. We exclude from our Core FFO calculation acquisition costs, loss on early extinguishment of debt, changes in the fair value of the earn-out, changes in fair value of contingent consideration, non-cash warrant dividends and the amortization of stock-based compensation.
We believe Core FFO provides a useful metric in comparing operations between reporting periods and in assessing the sustainability of our ongoing operating performance. Other equity REITs may calculate Core FFO differently or not at all, and, accordingly, the Company’s Core FFO may not be comparable to such other REITs’ Core FFO.
Cautionary Note Regarding Forward-Looking Statements
This press release contains statements that are “forward-looking statements” within the meaning of the Private Securities Litigation Reform Act of 1995, Section 27A of the Securities Act of 1933, as amended, and Section 21E of the Securities Exchange Act of 1934, as amended, and other federal securities laws. Forward-looking statements are statements that are not historical, including statements regarding management’s intentions, beliefs, expectations, representations, plans or predictions of the future, and are typically identified by such words as “believe,” “expect,” “anticipate,” “intend,” “estimate,” “may,” “will,” “should” and “could.” Because such statements include risks, uncertainties and contingencies, actual results may differ materially from those expressed or implied by such forward-looking statements. Forward-looking statements also include statements relating to the closing of the business combination with Conduit within a certain timeframe or at all. These forward-looking statements are based upon the Company’s present expectations, but these statements are not guaranteed to occur. Except as required by law, the Company disclaims any obligation to publicly update or revise any forward-looking statement to reflect changes in underlying assumptions or factors, of new information, data or methods, future events or other changes. Investors should not place undue reliance upon forward-looking statements. For further discussion of the factors that could affect outcomes, please refer to the “Risk Factors” section of the Company’s documents filed with the SEC, copies of which are available on the SEC’s website, www.sec.gov.
Investor Relations Contact:
Presidio Property Trust, Inc.
Lowell Hartkorn, Investor Relations
LHartkorn@presidiopt.com
Telephone: (760) 471-8536 x1244
Presidio Property Trust, Inc. and Subsidiaries
Consolidated Balance Sheets
| March 31, | December 31, | |||||||
| 2024 | 2023 | |||||||
| (Unaudited) | ||||||||
| ASSETS | ||||||||
| Real estate assets and lease intangibles: | ||||||||
| Land | $ | 19,716,839 | $ | 21,660,644 | ||||
| Buildings and improvements | 126,800,920 | 133,829,416 | ||||||
| Tenant improvements | 18,695,226 | 17,820,948 | ||||||
| Lease intangibles | 3,776,654 | 4,110,139 | ||||||
| Real estate assets and lease intangibles held for investment, cost | 168,989,639 | 177,421,147 | ||||||
| Accumulated depreciation and amortization | (38,983,073 | ) | (38,725,356 | ) | ||||
| Real estate assets and lease intangibles held for investment, net | 130,006,566 | 138,695,791 | ||||||
| Real estate assets held for sale, net | 5,254,952 | 5,459,993 | ||||||
| Real estate assets, net | 135,261,518 | 144,155,784 | ||||||
| Other assets: | ||||||||
| Cash, cash equivalents and restricted cash | 7,159,432 | 6,510,428 | ||||||
| Deferred leasing costs, net | 1,563,551 | 1,657,055 | ||||||
| Goodwill | 1,574,000 | 1,574,000 | ||||||
| Investment in Conduit Pharmaceuticals marketable securities (see Notes 2 & 9) | 14,457,288 | 18,318,521 | ||||||
| Deferred tax asset | 346,762 | 346,762 | ||||||
| Other assets, net (see Note 6) | 3,115,782 | 3,400,088 | ||||||
| Total other assets | 28,216,815 | 31,806,854 | ||||||
| TOTAL ASSETS | $ | 163,478,333 | $ | 175,962,638 | ||||
| LIABILITIES AND EQUITY | ||||||||
| Liabilities: | ||||||||
| Mortgage notes payable, net | $ | 98,599,984 | $ | 103,685,444 | ||||
| Mortgage notes payable related to properties held for sale, net | 3,692,713 | 4,027,829 | ||||||
| Mortgage notes payable, total net | 102,292,697 | 107,713,273 | ||||||
| Accounts payable and accrued liabilities | 4,076,683 | 4,792,034 | ||||||
| Accrued real estate taxes | 1,252,289 | 1,953,087 | ||||||
| Dividends payable | 174,011 | 174,011 | ||||||
| Lease liability, net | 8,090 | 16,086 | ||||||
| Below-market leases, net | 12,022 | 13,266 | ||||||
| Total liabilities | 107,815,792 | 114,661,757 | ||||||
| Equity: | ||||||||
| Series D Preferred Stock, $0.01 par value per share; 1,000,000 shares authorized; 890,946 shares issued and outstanding (liquidation preference $25.00 per share) as of March 31, 2024 and 890,946 shares issued and outstanding as of December 31, 2023 | 8,909 | 8,909 | ||||||
| Series A Common Stock, $0.01 par value per share, shares authorized: 100,000,000; 12,429,139 shares and 12,265,061 shares were issued and outstanding at March 31, 2024 and December 31, 2023, respectively | 124,291 | 122,651 | ||||||
| Additional paid-in capital | 182,533,423 | 182,310,219 | ||||||
| Dividends and accumulated losses | (137,272,480 | ) | (131,508,785 | ) | ||||
| Total stockholders’ equity before noncontrolling interest | 45,394,143 | 50,932,994 | ||||||
| Noncontrolling interest | 10,268,398 | 10,367,887 | ||||||
| Total equity | 55,662,541 | 61,300,881 | ||||||
| TOTAL LIABILITIES AND EQUITY | $ | 163,478,333 | $ | 175,962,638 | ||||
Presidio Property Trust, Inc. and Subsidiaries
Consolidated Statements of Operations
| For the Three Months Ended March 31, | ||||||||
| 2024 | 2023 | |||||||
| Revenues: | ||||||||
| Rental income | $ | 4,419,106 | $ | 3,942,053 | ||||
| Fees and other income | 370,955 | 179,438 | ||||||
| Total revenue | 4,790,061 | 4,121,491 | ||||||
| Costs and expenses: | ||||||||
| Rental operating costs | 1,563,577 | 1,574,990 | ||||||
| General and administrative | 2,084,450 | 1,964,620 | ||||||
| Depreciation and amortization | 1,351,018 | 1,333,574 | ||||||
| Impairment of real estate assets | 95,548 | — | ||||||
| Total costs and expenses | 5,094,593 | 4,873,184 | ||||||
| Other income (expense): | ||||||||
| Interest expense - mortgage notes | (1,515,206 | ) | (867,767 | ) | ||||
| Interest and other income, net | 4,646 | 742,117 | ||||||
| Gain on sales of real estate, net | 2,018,095 | 417,337 | ||||||
| Loss on Conduit Pharmaceuticals marketable securities (see footnote 9) | (3,861,233 | ) | — | |||||
| Income expense | (79,565 | ) | (148,453 | ) | ||||
| Total other (expense) income, net | (3,433,263 | ) | 143,234 | |||||
| Net loss | (3,737,795 | ) | (608,459 | ) | ||||
| Less: Income attributable to noncontrolling interests | (1,503,868 | ) | (387,081 | ) | ||||
| Net loss attributable to Presidio Property Trust, Inc. stockholders | $ | (5,241,663 | ) | $ | (995,540 | ) | ||
| Less: Preferred Stock Series D dividends | (522,032 | ) | (535,448 | ) | ||||
| Net loss attributable to Presidio Property Trust, Inc. common stockholders | $ | (5,763,695 | ) | $ | (1,530,988 | ) | ||
| Net loss per share attributable to Presidio Property Trust, Inc. common stockholders: | ||||||||
| Basic & Diluted | $ | (0.47 | ) | $ | (0.13 | ) | ||
| Weighted average number of common shares outstanding - basic & dilutive | 12,293,190 | 11,834,656 | ||||||
FFO AND CORE FFO RECONCILIATION
| For the Three Months Ended March 31, | ||||||||
| 2024 | 2023 | |||||||
| Net loss attributable to Presidio Property Trust, Inc. common stockholders | $ | (5,763,695 | ) | $ | (1,530,988 | ) | ||
| Adjustments: | ||||||||
| Income attributable to noncontrolling interests | 1,503,868 | 387,081 | ||||||
| Depreciation and amortization | 1,351,018 | 1,333,574 | ||||||
| Amortization of above and below market leases, net | (1,244 | ) | (1,244 | ) | ||||
| Impairment of real estate assets | 95,548 | - | ||||||
| Loss on Conduit Pharma marketable securities | 3,861,233 | - | ||||||
| Loss (Gain) on sale of real estate assets | (2,018,095 | ) | (417,337 | ) | ||||
| FFO | $ | (971,367 | ) | $ | (228,914 | ) | ||
| Stock Based Compensation | 541,921 | 260,845 | ||||||
| Core FFO | $ | (429,445 | ) | $ | 31,932 | |||
| Weighted average number of common shares outstanding - basic | 12,293,190 | 11,834,656 | ||||||
| Core FFO / Wgt Avg Share | $ | (0.035 | ) | $ | 0.003 | |||
Exhibit 99.2


SUPPLEMENTAL FINANCIAL INFORMATION
As of March 31, 2024?
| FORWARD-LOOKING STATEMENTS |  |
This presentation contains “forward-looking statements” within the meaning of the federal securities laws that involve risks and uncertainties, many of which are beyond our control. Our actual results could differ materially and adversely from those anticipated in such forward-looking statements as a result of certain factors, including those set forth in the Quarterly Report on Form 10-Q. Forward-looking statements relate to matters such as our industry, business strategy, goals and expectations concerning our market position, future operations, margins, profitability, capital expenditures, financial condition, liquidity, capital resources, cash flows, dividends, results of operations and other financial and operating information. When used in this presentation, the words “will,” “may,” “believe,” “anticipate,” “intend,” “estimate,” “expect,” “should,” “project,” “plan,” and similar expressions are intended to identify forward-looking statements, although not all forward-looking statements contain such identifying words.
The forward-looking statements contained in this presentation are based on historical performance and management’s current plans, estimates and expectations in light of information currently available to it and are subject to uncertainty and changes in circumstances. There can be no assurance that future developments affecting us will be those that we have anticipated. Actual results may differ materially from these expectations due to the factors, risks and uncertainties described in the Company’s Annual Report on Form 10-K for the fiscal year ended December 31, 2023, as amended to date (“Annual Report”) and the Company’s Quarterly Report on Form 10-Q filed with the SEC on the date hereof (“Quarterly Report”), changes in global, regional or local political, economic, business, competitive, market, regulatory and other factors described in the “Risk Factors” section of the Annual Report and the Quarterly Report, many of which are beyond our control. Should one or more of these risks or uncertainties materialize or should any of our assumptions prove to be incorrect, our actual results may vary in material respects from what we may have expressed or implied by these forward-looking statements. We caution that you should not place undue reliance on any of our forward-looking statements. Any forward-looking statement made by us in this presentation speaks only as of the date on which we make it. Factors or events that could cause our actual results to differ may emerge from time to time, and it is not possible for us to predict all of them. We undertake no obligation to publicly update any forward-looking statement, whether as a result of new information, future developments or otherwise, except as may be required by applicable securities laws.
| COMPANY OVERVIEW | |
|
|
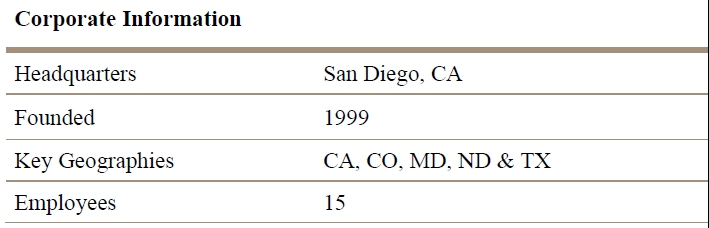
| ● | Presidio Property Trust, Inc. (“Presidio” or the “Company”) was founded in 1999 as NetREIT | ||
| ● | Presidio is an internally managed real estate company focused on commercial real estate opportunities in often overlooked and regionally dominant markets | 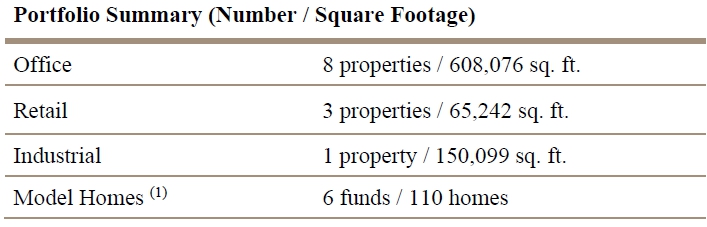 | |
| ● | The Company acquires, owns, and manages office and industrial real estate assets in markets with strong demographic and economic drivers with attractive going-in cap rates | ||
| ● | Presidio’s commercial portfolio currently includes 12 commercial properties with a book value of approximately $92 million | ||
| ● | In addition to its commercial real estate holdings, Presidio generates fees and rental income from affiliated entities, which manage and/or own a portfolio of model homes (1) |  |
| (1) | The Company holds partial ownership interests in several entities which own model home properties | |
| (2) | Includes book value of model homes |
 |
 |
| COMMERCIAL PORTFOLIO | |
| ($ in000’s) Property Location | Sq., Ft. | Date Acquired | Year Property Constructed | Purchase Price (1) | Occupancy | Percent Ownership | Mortgage On property | ||||||||||||||||||||
| Office/Industrial Properties: | |||||||||||||||||||||||||||
| Genesis Plaza, San Diego, CA (2) | 57,807 | 08/10 | 1989 | $ | 10,000 | 100.0 | % | 76.4 | % | $ | 5,907 | ||||||||||||||||
| Dakota Center, Fargo, ND | 119,554 | 05/11 | 1982 | 9,575 | 46.1 | % | 100.0 | % | 9,134 | ||||||||||||||||||
| Grand Pacific Center, Bismarck, ND (3) | 94,943 | 03/14 | 1976 | 5,350 | 88.3 | % | 100.0 | % | 6,259 | ||||||||||||||||||
| Arapahoe Center, Colorado Springs, CO | 79,023 | 12/14 | 2000 | 11,850 | 88.0 | % | 100.0 | % | 7,381 | ||||||||||||||||||
| West Fargo Industrial, West Fargo, ND | 150,099 | 08/15 | 1998/2005 | 7,900 | 100.0 | % | 100.0 | % | 3,902 | ||||||||||||||||||
| 300 N.P., West Fargo, ND | 34,517 | 08/15 | 1922 | 3,850 | 66.4 | % | 100.0 | % | - | ||||||||||||||||||
| One Park Centre, Westminster CO | 69,174 | 08/15 | 1983 | 9,150 | 81.1 | % | 100.0 | % | 6,013 | ||||||||||||||||||
| Shea Center II, Highlands Ranch, CO | 121,306 | 12/15 | 2000 | 25,325 | 67.1 | % | 100.0 | % | 16,879 | ||||||||||||||||||
| Baltimore, Baltimore, MD | 31,752 | 12/21 | 2006 | 8,892 | 100.0 | % | 100.0 | % | 5,670 | ||||||||||||||||||
| Total Office/Industrial Properties | 758,175 | $ | 91,892 | 80.3 | % | $ | 61,145 | ||||||||||||||||||||
| Retail Properties: | |||||||||||||||||||||||||||
| Union Town Center, Colorado Springs, CO | 44,042 | 12/14 | 2003 | 11,212 | 82.3 | % | 100.0 | % | 7,830 | ||||||||||||||||||
| Research Parkway, Colorado Springs, CO | 10,700 | 08/15 | 2003 | 2,850 | 100.0 | % | 100.0 | % | 1,573 | ||||||||||||||||||
| Mandolin, Houston, TX (4) | 10,500 | 08/21 | 2021 | 4,892 | 100.0 | % | 61.3 | % | 3,557 | ||||||||||||||||||
| Total Retail Properties | 65,242 | $ | 18,954 | 88.0 | % | $ | 12,960 | ||||||||||||||||||||
| 823,417 | 110,846 | 80.9 | % | $ | 74,105 | ||||||||||||||||||||||
| (1) | Prior to January 1, 2009, “Purchase Price” includes our acquisition related costs and expenses for the purchase of the property. After January 1, 2009, acquisition related costs and expenses were expensed when incurred. |
| (2) | Genesis Plaza is owned by two tenants-in-common, each of which own 57% and 43%, respectively, and we beneficially own an aggregate of 76.4%, based on our ownership percentages of each tenant-in-common. |
| (3) | Grand Pacific Center, Bismarck, ND, signed a major lease with KLJ Engineering on December 7, 2022 for approximately 33,296 usable square feet, a term of 122 months, and starting annualized rent of $532,736. KLJ Engineering moved into the building during December 2023, with rent commencing on February 28, 2024. |
| (4) | Mandolin is owned by NetREIT Palm Self-Storage LP, through its wholly owned subsidiary NetREIT Highland LLC, and the Company is the sole general partner and owns 61.3% of NetREIT Palm Self-Storage LP. |
| MODEL HOMES PORTFOLIO | |
| Geographic Region | No. of Properties | Aggregate Square Feet | Approximate % of Square Feet | Current Base Annual Rent | Approximate of Aggregate % Annual Rent | |||||||||||||||
| Midwest | 2 | 6,154 | 2.3 | % | $ | 101,904 | 2.8 | % | ||||||||||||
| Southeast | 4 | 9,875 | 3.7 | % | 172,428 | 4.8 | % | |||||||||||||
| Southwest | 82 | 252,615 | 94.0 | % | 3,327,756 | 92.4 | % | |||||||||||||
| Total | 88 | 268,644 | 100.0 | % | $ | 3,602,088 | 100.0 | % | ||||||||||||
| CONSOLIDATED BALANCE SHEET | |
Presidio Property Trust, Inc. and Subsidiaries
Consolidated Balance Sheets
| March 31, | December 31, | |||||||
| 2024 | 2023 | |||||||
| (Unaudited) | ||||||||
| ASSETS | ||||||||
| Real estate assets and lease intangibles: | ||||||||
| Land | $ | 19,716,839 | $ | 21,660,644 | ||||
| Buildings and improvements | 126,800,920 | 133,829,416 | ||||||
| Tenant improvements | 18,695,226 | 17,820,948 | ||||||
| Lease intangibles | 3,776,654 | 4,110,139 | ||||||
| Real estate assets and lease intangibles held for investment, cost | 168,989,639 | 177,421,147 | ||||||
| Accumulated depreciation and amortization | (38,983,073 | ) | (38,725,356 | ) | ||||
| Real estate assets and lease intangibles held for investment, net | 130,006,566 | 138,695,791 | ||||||
| Real estate assets held for sale, net | 5,254,952 | 5,459,993 | ||||||
| Real estate assets, net | 135,261,518 | 144,155,784 | ||||||
| Other assets: | ||||||||
| Cash, cash equivalents and restricted cash | 7,159,432 | 6,510,428 | ||||||
| Deferred leasing costs, net | 1,563,551 | 1,657,055 | ||||||
| Goodwill | 1,574,000 | 1,574,000 | ||||||
| Investment in Conduit Pharmaceuticals marketable securities (see Notes 2 & 9) | 14,457,288 | 18,318,521 | ||||||
| Deferred tax asset | 346,762 | 346,762 | ||||||
| Other assets, net (see Note 6) | 3,115,782 | 3,400,088 | ||||||
| Total other assets | 28,216,815 | 31,806,854 | ||||||
| TOTAL ASSETS | $ | 163,478,333 | $ | 175,962,638 | ||||
| LIABILITIES AND EQUITY | ||||||||
| Liabilities: | ||||||||
| Mortgage notes payable, net | $ | 98,599,984 | $ | 103,685,444 | ||||
| Mortgage notes payable related to properties held for sale, net | 3,692,713 | 4,027,829 | ||||||
| Mortgage notes payable, total net | 102,292,697 | 107,713,273 | ||||||
| Accounts payable and accrued liabilities | 4,076,683 | 4,792,034 | ||||||
| Accrued real estate taxes | 1,252,289 | 1,953,087 | ||||||
| Dividends payable | 174,011 | 174,011 | ||||||
| Lease liability, net | 8,090 | 16,086 | ||||||
| Below-market leases, net | 12,022 | 13,266 | ||||||
| Total liabilities | 107,815,792 | 114,661,757 | ||||||
| Equity: | ||||||||
| Series D Preferred Stock, $0.01 par value per share; 1,000,000 shares authorized; 890,946 shares issued and outstanding (liquidation preference $25.00 per share) as of March 31, 2024 and 890,946 shares issued and outstanding as of December 31, 2023 | 8,909 | 8,909 | ||||||
| Series A Common Stock, $0.01 par value per share, shares authorized: 100,000,000; 12,429,139 shares and 12,265,061 shares were issued and outstanding at March 31, 2024 and December 31, 2023, respectively | 124,291 | 122,651 | ||||||
| Additional paid-in capital | 182,533,423 | 182,310,219 | ||||||
| Dividends and accumulated losses | (137,272,480 | ) | (131,508,785 | ) | ||||
| Total stockholders’ equity before noncontrolling interest | 45,394,143 | 50,932,994 | ||||||
| Noncontrolling interest | 10,268,398 | 10,367,887 | ||||||
| Total equity | 55,662,541 | 61,300,881 | ||||||
| TOTAL LIABILITIES AND EQUITY | $ | 163,478,333 | $ | 175,962,638 | ||||
| CONSOLIDATED STATEMENT OF OPERATIONS | |
Presidio Property Trust, Inc. and Subsidiaries
Consolidated Statements of Operations
| For the Three Months Ended March 31, | ||||||||
| 2024 | 2023 | |||||||
| Revenues: | ||||||||
| Rental income | $ | 4,419,106 | $ | 3,942,053 | ||||
| Fees and other income | 370,955 | 179,438 | ||||||
| Total revenue | 4,790,061 | 4,121,491 | ||||||
| Costs and expenses: | ||||||||
| Rental operating costs | 1,563,577 | 1,574,990 | ||||||
| General and administrative | 2,084,450 | 1,964,620 | ||||||
| Depreciation and amortization | 1,351,018 | 1,333,574 | ||||||
| Impairment of real estate assets | 95,548 | — | ||||||
| Total costs and expenses | 5,094,593 | 4,873,184 | ||||||
| Other income (expense): | ||||||||
| Interest expense - mortgage notes | (1,515,206 | ) | (867,767 | ) | ||||
| Interest and other income, net | 4,646 | 742,117 | ||||||
| Gain on sales of real estate, net | 2,018,095 | 417,337 | ||||||
| Loss on Conduit Pharmaceuticals marketable securities (see footnote 9) | (3,861,233 | ) | — | |||||
| Income expense | (79,565 | ) | (148,453 | ) | ||||
| Total other (expense) income, net | (3,433,263 | ) | 143,234 | |||||
| Net loss | (3,737,795 | ) | (608,459 | ) | ||||
| Less: Income attributable to noncontrolling interests | (1,503,868 | ) | (387,081 | ) | ||||
| Net loss attributable to Presidio Property Trust, Inc. stockholders | $ | (5,241,663 | ) | $ | (995,540 | ) | ||
| Less: Preferred Stock Series D dividends | (522,032 | ) | (535,448 | ) | ||||
| Net loss attributable to Presidio Property Trust, Inc. common stockholders | $ | (5,763,695 | ) | $ | (1,530,988 | ) | ||
| Net loss per share attributable to Presidio Property Trust, Inc. common stockholders: | ||||||||
| Basic & Diluted | $ | (0.47 | ) | $ | (0.13 | ) | ||
| Weighted average number of common shares outstanding - basic & dilutive | 12,293,190 | 11,834,656 | ||||||
| CONSOLIDATED STATEMENT OF CASH FLOWS |
|
Presidio Property Trust, Inc. and Subsidiaries
Consolidated Statements of Cash Flows
| For the Three Months Ended March 31, | ||||||||
| 2024 | 2023 | |||||||
| Cash flows from operating activities: | ||||||||
| Net loss | $ | (3,737,795 | ) | $ | (608,459 | ) | ||
| Adjustments to reconcile net loss to net cash used in operating activities: | ||||||||
| Depreciation and amortization | 1,351,018 | 1,333,574 | ||||||
| Stock compensation | 541,921 | 260,845 | ||||||
| Bad debt expense | — | 54,493 | ||||||
| Gain on sale of real estate assets, net | (2,018,095 | ) | (417,337 | ) | ||||
| Net change in Conduit Pharmaceuticals fair value marketable securities | 3,861,233 | (72,738 | ) | |||||
| Net change in fair value marketable securities | 560 | — | ||||||
| Net change in fair value SPAC Trust Account | — | (664,232 | ) | |||||
| Impairment of real estate assets | 95,548 | — | ||||||
| Amortization of financing costs | 90,080 | 72,879 | ||||||
| Amortization of below-market leases | (1,244 | ) | (1,243 | ) | ||||
| Straight-line rent adjustment | (91,806 | ) | (157,194 | ) | ||||
| Changes in operating assets and liabilities: | ||||||||
| Other assets | 347,695 | 219,199 | ||||||
| Accounts payable and accrued liabilities | (872,512 | ) | (764,077 | ) | ||||
| Accounts payable and accrued liabilities for the SPAC | — | (137,300 | ) | |||||
| Accrued real estate taxes | (700,798 | ) | (746,539 | ) | ||||
| Net cash used in operating activities | (1,134,195 | ) | (1,628,129 | ) | ||||
| Cash flows from investing activities: | ||||||||
| Real estate acquisitions | (2,238,497 | ) | (5,039,455 | ) | ||||
| Additions to buildings and tenant improvements | (1,032,447 | ) | (597,873 | ) | ||||
| Investment in marketable securities | — | (1,586,042 | ) | |||||
| Proceeds from sale of marketable securities | 44,602 | 1,437,717 | ||||||
| Investment of SPAC IPO proceeds into Trust Account | — | (155,403 | ) | |||||
| Withdrawals from Trust Account for SPAC taxes | — | 200,050 | ||||||
| Withdrawals from Trust Account for Redemption of SPAC Shares | — | 113,831,930 | ||||||
| Deletions / (additions) to deferred leasing costs | 1,936 | 1,936 | ||||||
| Proceeds from sales of real estate, net | 12,642,264 | 1,458,822 | ||||||
| Net cash provided by investing activities | 9,417,858 | 109,551,682 | ||||||
| Cash flows from financing activities: | ||||||||
| Proceeds from mortgage notes payable, net of issuance costs | 2,367,949 | 3,518,981 | ||||||
| Repayment of mortgage notes payable | (7,860,474 | ) | (886,707 | ) | ||||
| Payment of deferred offering costs | (16,745 | ) | — | |||||
| Distributions to noncontrolling interests, net | (1,603,357 | ) | (518,642 | ) | ||||
| Redemption of SPAC shares | — | (113,831,930 | ) | |||||
| Repurchase of Series D Preferred Stock, at cost | — | (6,947 | ) | |||||
| Dividends paid to Series D Preferred Stockholders | (522,032 | ) | (535,448 | ) | ||||
| Dividends paid to Series A Common Stockholders | — | (287,655 | ) | |||||
| Net cash used in financing activities | (7,634,659 | ) | (112,548,348 | ) | ||||
| Net change in cash, cash equivalents and restricted cash | 649,004 | (4,624,795 | ) | |||||
| Cash, cash equivalents and restricted cash - beginning of period | 6,510,428 | 16,516,725 | ||||||
| Cash, cash equivalents and restricted cash - end of period | $ | 7,159,432 | $ | 11,891,930 | ||||
| Supplemental disclosure of cash flow information: | ||||||||
| Interest paid-mortgage notes payable | $ | 1,432,639 | $ | 1,119,189 | ||||
| Non-cash financing activities: | ||||||||
| Deferred offering cost SPAC, underwriting commission payable | $ | — | $ | 4,628,750 | ||||
| Accrued excise tax on January 24, 2023 SPAC redemptions | $ | — | $ | 1,140,683 | ||||
| Dividends payable - Preferred Stock Series D | $ | 174,011 | $ | 178,435 | ||||
| EBITDAre RECONCILIATION | |
| For the Three Months Ended March 31, | ||||||||
| 2023 | 2023 | |||||||
| Net (loss) income attributable to Presidio Property Trust, Inc. common stockholders | $ | (5,763,695 | ) | $ | (1,530,988 | ) | ||
| Adjustments | ||||||||
| Interest Expense | 1,515,206 | 867,767 | ||||||
| Depreciation and Amortization | 1,349,774 | 1,332,330 | ||||||
| Asset Impairment | 95,548 | - | ||||||
| Net loss (gain) on sale of real estate | (2,018,095 | ) | (417,337 | ) | ||||
| Loss on Conduit Pharma marketable securities | 3,861,233 | - | ||||||
| Income Taxes | 79,565 | 148,453 | ||||||
| EBITDAre | $ | (880,464 | ) | $ | 400,225 | |||
| FFO AND CORE FFO RECONCILIATION | |
| For the Three Months Ended March 31, | ||||||||
| 2024 | 2023 | |||||||
| Net loss attributable to Presidio Property Trust, Inc. common stockholders | $ | (5,763,695 | ) | $ | (1,530,988 | ) | ||
| Adjustments: | ||||||||
| Income attributable to noncontrolling interests | 1,503,868 | 387,081 | ||||||
| Depreciation and amortization | 1,351,018 | 1,333,574 | ||||||
| Amortization of above and below market leases, net | (1,244 | ) | (1,244 | ) | ||||
| Impairment of real estate assets | 95,548 | - | ||||||
| Loss on Conduit Pharma marketable securities | 3,861,233 | - | ||||||
| Loss (Gain) on sale of real estate assets | (2,018,095 | ) | (417,337 | ) | ||||
| FFO | $ | (971,367 | ) | $ | (228,914 | ) | ||
| Stock Based Compensation | 541,921 | 260,845 | ||||||
| Core FFO | $ | (429,445 | ) | $ | 31,932 | |||
| Weighted average number of common shares outstanding - basic | 12,293,190 | 11,834,656 | ||||||
| Core FFO / Wgt Avg Share | $ | (0.035 | ) | $ | 0.003 | |||
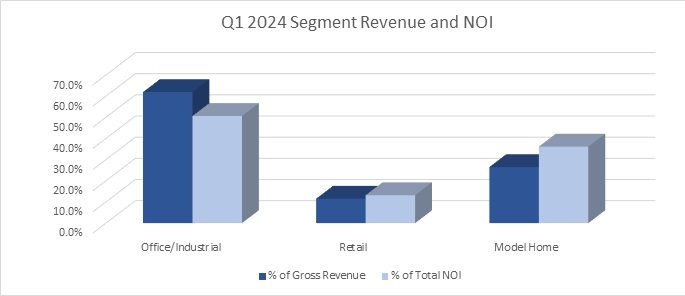
| SEGMENT DATA |
| March 31, | December 31, | |||||||
| Assets by Reportable Segment: | 2024 | 2023 | ||||||
| Office/Industrial Properties: | ||||||||
| Land, buildings and improvements, net (1) | $ | 77,519,538 | $ | 77,472,724 | ||||
| Total assets (2) | $ | 77,409,048 | $ | 78,140,372 | ||||
| Model Home Properties: | ||||||||
| Land, buildings and improvements, net (1) | $ | 41,813,015 | $ | 50,790,147 | ||||
| Total assets (2) | $ | 43,872,416 | $ | 51,456,292 | ||||
| Retail Properties: | ||||||||
| Land, buildings and improvements, net (1) | $ | 15,918,011 | $ | 15,877,190 | ||||
| Total assets (2) | $ | 16,624,792 | $ | 16,539,399 | ||||
| Reconciliation to Total Assets: | ||||||||
| Total assets for reportable segments | $ | 137,906,256 | $ | 146,136,063 | ||||
| Other unallocated assets: | ||||||||
| Cash, cash equivalents and restricted cash | 342,033 | 277,143 | ||||||
| Other assets, net | 25,230,044 | 29,549,432 | ||||||
| Total Assets | $ | 163,478,333 | $ | 175,962,638 | ||||
| (1) | Includes lease intangibles and the land purchase option related to property acquisitions. |
| (2) | Includes land, buildings and improvements, cash, cash equivalents, and restricted cash, current receivables, deferred rent receivables and deferred leasing costs and other related intangible assets, all shown on a net basis. |
| DEFINITIONS – NON-GAAP MEASUREMENTS | |
EBITDAre - EBITDAre is defined by NAREIT as earnings before interest, taxes, depreciation, and amortization, gain or loss on disposal of depreciated assets, and impairment write-offs.
Funds from Operations (“FFO”) – The Company evaluates performance based on Funds From Operations, which we refer to as FFO, as management believes that FFO represents the most accurate measure of activity and is the basis for distributions paid to equity holders. The Company defines FFO, a non-GAAP measure, as net income or loss (computed in accordance with GAAP), excluding gains (or losses) from sales of property, hedge ineffectiveness, acquisition costs of newly acquired properties that are not capitalized and lease acquisition costs that are not capitalized plus depreciation and amortization, including amortization of acquired above and below market lease intangibles and impairment charges on properties or investments in non-consolidated REITs, and after adjustments to exclude equity in income or losses from, and, to include the proportionate share of FFO from, non-consolidated REITs.
However, because FFO excludes depreciation and amortization as well as the changes in the value of the Company’s properties that result from use or market conditions, each of which have real economic effects and could materially impact the Company’s results from operations, the utility of FFO as a measure of the Company’s performance is limited. In addition, other REITs may not calculate FFO in accordance with the NAREIT definition as the Company does, and, accordingly, the Company’s FFO may not be comparable to other REITs’ FFO. Accordingly, FFO should be considered only as a supplement to net income as a measure of the Company’s performance.
Core Funds from Operations (“Core FFO”) – We calculate Core FFO, a non-GAAP measure, by using FFO as defined by NAREIT and adjusting for certain other non-core items. We also exclude from our Core FFO calculation acquisition costs, loss on early extinguishment of debt, changes in the fair value of the earn-out, changes in fair value of contingent consideration, non-cash warrant dividends and the amortization of stock-based compensation.
We believe Core FFO provides a useful metric in comparing operations between reporting periods and in assessing the sustainability of our ongoing operating performance. Other equity REITs may calculate Core FFO differently or not at all, and, accordingly, the Company’s Core FFO may not be comparable to such other REITs’ Core FFO.