UNITED STATES
SECURITIES AND EXCHANGE COMMISSION
Washington, D.C. 20549
FORM
| | REGISTRATION STATEMENT PURSUANT TO SECTION 12(b) OR (g) OF THE SECURITIES EXCHANGE ACT OF 1934 |
| OR | |
| | ANNUAL REPORT PURSUANT TO SECTION 13 OR 15(d) OF THE SECURITIES EXCHANGE ACT OF 1934 |
| For the fiscal year ended | |
| OR | |
| | TRANSITION REPORT PURSUANT TO SECTION 13 OR 15(d) OF THE SECURITIES EXCHANGE ACT OF 1934 |
| OR | |
| | SHELL COMPANY REPORT PURSUANT TO SECTION 13 OR 15(d) OF THE SECURITIES EXCHANGE ACT OF 193 |
| Date of event requiring this shell company report …………………………………………… | |
| For the transition period from ……………………………… to ……………………………… |
Commission file number
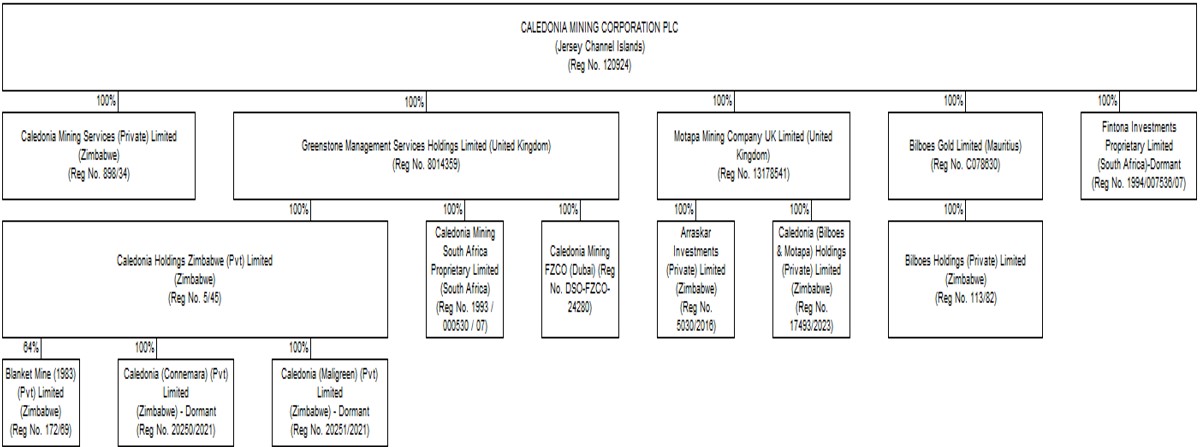
Caledonia Mining Corporation Plc
(Exact name of Registrant as specified in its charter)
(Jurisdiction of incorporation or organization)
Caledonia Mining Corporation Plc
(Address of principal executive offices)
(Name, telephone, email and/or facsimile number and address of Company Contact Person)
Securities registered or to be registered pursuant to Section 12(b) of the Act:
| Title of Class | Trading Symbol(s) | Name of Each Exchange on Which Registered |
| | | |
Securities registered or to be registered pursuant to Section 12(g) of the Act: None
Securities for which there is a reporting obligation pursuant to Section 15(d) of the Act: None
Indicate the number of outstanding shares of each of the issuer’s classes of capital or stock as of the closing of the period covered by the annual report:
Indicate by check mark if the registration is a well-known seasoned issuer, as defined in Rule 405 of the Securities Act.
☐Yes ☒
If this report is an annual or transition report, indicate by check mark if the registrant is not required to file reports pursuant to Section 13 or 15(d) of the Securities Exchange Act of 1934.
☐Yes ☒
Indicate by check mark whether the Registrant (1) has filed all reports required to be filed by Section 13 or 15(d) of the Securities Exchange Act of 1934 during the preceding 12 months (or for such shorter period that the Registrant was required to file such reports) and (2) has been subject to such filing requirements for the past 90 days.
☒
Indicate by check mark whether the registrant has submitted electronically every Interactive Data File required to be submitted pursuant to Rule 405 of Regulation S-T (§232.405 of this chapter) during the preceding 12 months (or for such shorter period that the registrant was required to submit such files).
☒
Indicate by check mark whether the registrant is a large accelerated filer, an accelerated filer, a non-accelerated filer, and/or an emerging growth company. See definition of “large accelerated filer,” “accelerated filer,” and “emerging growth company” in Rule 12b-2 of the Exchange Act:
| Large accelerated filer ☐ | |
| Non-accelerated filer ☐ | Emerging growth company |
If an emerging growth company that prepares its financial statements in accordance with U.S. GAAP, indicate by check mark if the registrant has elected not to use the extended transition period for complying with any new or revised financial accounting standards† provided pursuant to Section 13(a) of the Exchange Act.
† The term “new or revised financial accounting standard” refers to any update issued by the Financial Accounting Standards Board to its Accounting Standards Codification after April 5, 2012.
Indicate by check mark whether the registrant has filed a report on and attestation to its management’s assessment of the effectiveness of its internal control over financial reporting under Section 404(b) of the Sarbanes-Oxley Act (15 U.S.C. 7262(b)) by the registered public accounting firm that prepared or issued its audit report.
If securities are registered pursuant to Section 12(b) of the Act, indicate by check mark whether the financial statements of the registrant included in the filing reflect the correction of an error to previously issued financial statements
Indicate by check mark whether any of those error corrections are restatements that required a recovery analysis of incentive-based compensation received by any of the registrant’s executive officers during the relevant recovery period pursuant to §240.10D-1(b). ☐
Indicate by check mark which basis of accounting the registrant has used to prepare the financial statements included in this filing:
| U.S. GAAP | ☐ | | ☒ | Other | ☐ |
If “Other” has been checked in response to the previous question, indicate by check mark which financial statement item the registrant has elected to follow:
Item 17 ☐ Item 18 ☐
If this is an annual report, indicate by check mark whether the registrant is a shell company (as defined in Rule 12b-2 of the Exchange Act).
TABLE OF CONTENTS
CAUTIONARY NOTE REGARDING FORWARD-LOOKING STATEMENTS
This Annual Report on Form 20-F ("Annual Report") and the exhibits attached hereto contain "forward-looking information" and “forward-looking statements” within the meaning of the United States Private Securities Litigation Reform Act of 1995 and applicable Canadian securities legislation that involve risks and uncertainties relating, but not limited to, the Company’s current expectations, intentions, plans, and beliefs. Forward-looking information can often be identified by forward-looking words such as “anticipate”, “believe”, “expect”, “goal”, “plan”, “target”, “intend”, “estimate”, “could”, “should”, “may” and “will” or the negative of these terms or similar words suggesting future outcomes, or other expectations, beliefs, plans, objectives, assumptions, intentions or statements about future events or performance. Examples of forward-looking information in this Annual Report include: our mineral reserve and mineral resource calculations with underlying assumptions, production guidance, estimates of future/targeted production rates, planned mill capacity increases, estimates of future metallurgical recovery rates and the ability to maintain high metallurgical recovery rates, Caledonia Mining Corporation Plc and subsidiaries (“Caledonia” or “Company” or “Group”) plans and timing regarding further exploration, drilling and development, the prospective nature of exploration and development targets, the ability to upgrade and convert mineral reserves and mineral resources, capital costs, our intentions with respect to financial position and third party financing and future dividend payments. This forward-looking information is based, in part, on assumptions and factors that may change or prove to be incorrect, thus causing actual results, performance or achievements to be materially different from those expressed or implied by forward-looking information. Such factors and assumptions include, but are not limited to: failure to establish estimated mineral reserves and mineral resources, the grade and recovery of ore which is mined varying from estimates, success of future exploration and drilling programs, reliability of drilling, sampling and assay data, assumptions regarding the representativeness of mineralization being inaccurate, success of planned metallurgical test-work, capital and operating costs varying significantly from estimates, delays in obtaining or failures to obtain required governmental, environmental or other project approvals, changes in government regulations, legislation and rates of taxation, inflation, changes in exchange rates and the availability of foreign exchange, fluctuations in commodity prices, delays in the development of projects and other factors.
Shareholders, potential shareholders and other prospective investors should be aware that these statements are subject to known and unknown risks, uncertainties and other factors that could cause actual results to differ materially from those suggested by the forward-looking statements. Such factors include, but are not limited to: risks relating to estimates of mineral reserves and mineral resources proving to be inaccurate, fluctuations in gold price, risks and hazards associated with the business of mineral exploration, development and mining (including environmental hazards, industrial accidents, unusual or unexpected geological or structural formations, pressures, power outages, explosions, landslides, cave-ins and flooding), risks relating to the credit worthiness or financial condition of suppliers, refiners and other parties with whom the Company does business; inadequate insurance, or inability to obtain insurance, to cover these risks and hazards, employee relations; relationships with and claims by local communities and indigenous populations; political risk; risks related to natural disasters, terrorism, civil unrest, public health concerns (including health epidemics or outbreaks of communicable diseases such as the coronavirus); availability and increasing costs associated with mining inputs and labor; the speculative nature of mineral exploration and development, including the risks of obtaining or maintaining necessary licenses and permits, diminishing quantities or grades of mineral reserves and mineral resources as mining occurs; global financial condition, the actual results of current exploration activities, changes to conclusions of economic evaluations, and changes in project parameters to deal with un-anticipated economic or other factors, risks of increased capital and operating costs, environmental, safety or regulatory risks, expropriation, the Company’s title to properties including ownership thereof, increased competition in the mining industry for properties, equipment, qualified personnel and their costs, risks relating to the uncertainty of timing of events including targeted production rate increase and currency fluctuations. Shareholders, potential shareholders and other prospective investors are cautioned not to place undue reliance on forward-looking information. By its nature, forward-looking information involves numerous assumptions, inherent risks and uncertainties, both general and specific, that contribute to the possibility that the predictions, forecasts, projections and various future events will not occur. Caledonia reviews forward-looking information for the purposes of preparing each annual report, however Caledonia undertakes no obligation to update publicly or otherwise revise any forward-looking information whether as a result of new information, future events or other such factors which affect this information, except as required by law. For the reasons set forth above, investors should not place undue reliance on forward-looking statements.
STATUS AS AN EMERGING GROWTH COMPANY
We are an “emerging growth company” as defined in Section 3(a) of the United States Securities Exchange Act of 1934, as amended (the “Exchange Act”) by the Jumpstart Our Business Startups Act of 2012 (the "JOBS Act"), and we may take advantage of certain exemptions from various reporting requirements that are applicable to other public companies that are not emerging growth companies. We will continue to qualify as an "emerging growth company" until the earliest to occur of: (a) the last day of the fiscal year during which we had total annual gross revenues of US$1,235,000,000 (as such amount is indexed for inflation every 5 years by the United States Securities and Exchange Commission (“SEC”) or more; (b) the last day of our fiscal year following the fifth anniversary of the date of the first sale of equity securities pursuant to an effective registration statement under the United States Securities Act of 1933, as amended (the “Securities Act”); (c) the date on which we have, during the previous 3-year period, issued more than US$1,000,000,000 in non-convertible debt; or (d) the date on which we are deemed to be a "large accelerated filer", as defined in Exchange Act Rule 12b-2. We expect to continue to be an emerging growth company for the immediate future. During 2020 Caledonia completed the first sale of equity securities under the Securities Act and may no longer qualify as an emerging growth company in 2026. Refer to note 25 in the Consolidated Financial Statements for detail on the sales of equity securities.
Generally, a registrant that registers any class of its securities under Section 12 of the Exchange Act is required to include in the second and all subsequent annual reports filed by it under the Exchange Act a management report on internal control over financial reporting and, subject to an exemption available to registrants that are neither an "accelerated filer" or a "larger accelerated filer" (as those terms are defined in Exchange Act Rule 12b-2), an auditor attestation report on management's assessment of internal control over financial reporting. However, for so long as we continue to qualify as an emerging growth company, we will be exempt from the requirement to include an auditor attestation report on management’s assessment of internal controls over financial reporting in its annual reports filed under the Exchange Act, even if we were to qualify as an "accelerated filer" or a "larger accelerated filer". In addition, Section 103(a)(3) of the Sarbanes-Oxley Act of 2002 (the “Sarbanes-Oxley Act”) has been amended by the JOBS Act to provide that, among other things, auditors of an emerging growth company are exempt from any rules of the Public Company Accounting Oversight Board requiring a supplement to the auditor’s report in which the auditor would be required to provide additional information about the audit and the financial statements of the company.
SPECIAL NOTE REGARDING LINKS TO EXTERNAL WEBSITES
Links to external, or third-party websites, are provided solely for convenience. We take no responsibility whatsoever for any third-party information contained in such third-party websites, and we specifically disclaim adoption or incorporation by reference of such information into this report.
NON-IFRS FINANCIAL INFORMATION
This Annual Report contains financial statements of the Company prepared in accordance with International Financial Reporting Standards as issued by the International Accounting Standards Board (“IFRS”). In addition, this Annual Report also contains non-IFRS financial measures (“Non-IFRS Measures”) including “on-mine cost per ounce”, “all-in sustaining cost per ounce”, “all-in cost per ounce”, “average realized gold price” and “adjusted earnings per share” as we believe these are useful metrics for measuring our performance. However, these Non-IFRS Measures do not have any standardized meaning prescribed by IFRS and are not necessarily comparable to similar measures presented by other publicly traded entities. These measures should be considered as supplemental in nature and not as a substitute for related financial information prepared in accordance with IFRS.
CURRENCY
Unless otherwise indicated, all references to “$”, “US dollars”. “USD”, or "US$" are to United States of America dollars.
FOREIGN PRIVATE ISSUER FILINGS
We are considered a “foreign private issuer” pursuant to Rule 405 promulgated under the Securities Act. In our capacity as a foreign private issuer, we are exempt from certain rules under the Exchange Act that impose certain disclosure obligations and procedural requirements for proxy solicitations under Section 14 of the Exchange Act. In addition, our officers, directors and principal shareholders are exempt from the reporting and “short-swing” profit recovery provisions of Section 16 of the Exchange Act and the rules under the Exchange Act with respect to their purchases and sales of our shares. Moreover, we are not required to file periodic reports and financial statements with the SEC as frequently or as promptly as United States companies whose securities are registered under the Exchange Act. In addition, we are not required to comply with Regulation FD, which restricts the selective disclosure of material information.
For as long as we are a “foreign private issuer” we intend to file our annual financial statements on Form 20-F and furnish our quarterly financial statements on Form 6-K to the SEC for so long as we are subject to the reporting requirements of Section 13(g) or 15(d) of the Exchange Act. However, the information we file or furnish may not be the same as the information that is required in annual and quarterly reports on Form 10-K or Form 10-Q for U.S. domestic issuers. Accordingly, there may be less information publicly available concerning us than there is for a company that files as a domestic issuer.
We may take advantage of these exemptions until such time as we are no longer a foreign private issuer. We are required to determine our status as a foreign private issuer on an annual basis at the end of our second fiscal quarter. We would cease to be a foreign private issuer at such time as more than 50% of our outstanding voting securities are held by United States residents and any of the following three circumstances applies: (1) the majority of our executive officers or directors are United States citizens or residents; (2) more than 50% of our assets are located in the United States; or (3) our business is administered principally in the United States. If we lose our “foreign private issuer status” we would be required to comply with Exchange Act reporting and other requirements applicable to U.S. domestic issuers, which are more detailed and extensive than the requirement for “foreign private issuers”.
| ITEM 1 - IDENTITY OF DIRECTORS, SENIOR MANAGEMENT AND ADVISERS |
| Not applicable. |
| Not applicable. |
| Not applicable. |
| Not applicable. |
An investment in our shares involves a high degree of risk and should be considered speculative. You should carefully consider the following risks set out below and other information before investing in our shares. If any event arising from these risks occurs, our business, prospects, financial condition, results of operations or cash flows could be adversely affected, the trading price of our shares could decline and all or part of any investment may be lost.
Our operations are highly speculative due to the high-risk nature of our business, which include the acquisition, financing, exploration, development of mineral infrastructure and operation of mines. The risks and uncertainties set out below are not the only ones we face. Additional risks and uncertainties not currently known to us or that we currently deem immaterial may also impair our operations. If any of the risks actually occur, our business, financial condition and operating results could be adversely affected. As a result, the trading price of our shares could decline and investors could lose part or all of their investment. Our business is subject to significant risks and past performance is no guarantee of future performance.
Our shares may not continue to be listed on the NYSE American LLC (“NYSE American”)
Failure to meet the applicable maintenance requirements of the NYSE American could result in our shares being delisted from the NYSE American. If we are delisted from the NYSE American, our shares may be eligible for trading on an over-the-counter market in the United States. In the event that we are not able to obtain a listing on another U.S. stock exchange or quotation service for our shares, it may be extremely difficult or impossible for shareholders to sell their shares in the United States. Moreover, if we are delisted from the NYSE American, but obtain a substitute listing for our shares in the United States, it may be on a market with less liquidity, and therefore potentially more price volatility, than the NYSE American. Shareholders may not be able to sell their shares on any such substitute U.S. market in the quantities, at the times, or at the prices that could potentially be available on a more liquid trading market. As a result of these factors, if our shares are delisted from the NYSE American, the price of our shares is likely to decline. In addition, a decline in the price of our shares will impair our ability to obtain financing in the future.
Future sales of our shares into the public market by holders of our options may lower the market price, which may result in losses to our shareholders.
As of April 26, 2024, we had 19,194,860 shares issued and outstanding. In addition, as of April 28, 2024, 20,000 shares were issuable upon exercise of outstanding stock options, all of which may be exercised in the future resulting in dilution to our shareholders. Awards under the incentive plan made to executives and certain other senior members of management on January 24, 2022, April 7, 2023 and April 8, 2024, consisting of a target of 113,693,80,7732 and 125,433 Equity-settled Performance Units (“EPUs”) respectively, are only to be settled in shares. The EPUs that vest will be subject to a performance multiplier and a maximum amount of 150% of target EPUs could vest. Accordingly, providing for such a maximum amount, Caledonia could grant options on a further 1,419,638 shares as at the date of this Annual Report on the assumption that all other outstanding awards (other than the options mentioned above) are settled in cash at the request of the holders. As of April 28, 2024, our senior officers and directors beneficially owned or had an interest in, as a group, 2,861,550 shares (14.91% of our issued share capital). Sales of substantial amounts of our shares into the public market, by our officers or directors or pursuant to the exercise of options, or even the perception by the market that such sales may occur, may lower the market price of our shares.
The price of gold is subject to volatility and may have a significant effect on our future activities and profitability.
The economic viability of our revenues, operations and exploration and development projects is, and is expected to be, heavily dependent on the price of gold, which is particularly subject to fluctuation and has fluctuated significantly in recent years. The price of gold is affected by numerous factors beyond our control including, but not limited to: international economic and political conditions; expectations of inflation; international currency exchange rates; interest rates; global or regional consumption patterns; speculative activities; levels of supply and demand; increased production due to new mine developments and improved mining and production methods; availability and costs of metal substitutes; and inventory carrying costs. The effect of these factors on the price of gold, and therefore the economic viability of our operations, cannot be accurately predicted. As required by Zimbabwean legislation, Blanket Mine (1983) (Private) Limited (“Blanket”), the company which owns the Blanket mine (“Blanket Mine”), Caledonia Holdings Zimbabwe (Private) Limited (“CHZ”), as agent, and Bilboes Holdings (Private) Limited (“Bilboes Holdings”) deliver their production to Fidelity Printers and Refiners Limited (“Fidelity”), which refines the gold to a purity of 99.5%. 75% of the gold delivered to Fidelity is refined on a toll-treatment basis. For the 75% portion Caledonia retains ownership of the gold that is then exported by Caledonia to a refiner of its choice outside Zimbabwe which undertakes further processing and sells the resulting gold on the international market.
75% of the portion of unrefined metals produced by Blanket and exported by Caledonia to Al Etihad Gold Refinery DMCC (“AEG”),from April of 2023 on the toll refinement basis, is transported by Ferrari Logistics Southern Africa (Proprietary) Limited to AEG in Dubai, UAE and further refined and sold by AEG at a cost of $7 per ounce. Gold transported throughout this process is fully insured. The sales to AEG are priced at the London Bullion Market Association (“LBMA”) post-delivery price less refining fee and the quantities are determined on the lodgment date. Settlement occurs within 2 days from AEG.
25% of Blanket's gold is sold to Fidelity at a price which reflects the prevailing LBMA price and the official Zimbabwe Gold (“ZiG”) or Zimbabwean real-time gross settlement, bond notes or bond coins (“RTGS$”)/USD exchange rate on the date of sale. Fidelity charges a 1.24% toll refining fee from the gross export proceeds. Fidelity collects a 5% royalty of which 50% is remitted to the Government of Zimbabwe in physical gold. The royalty is deducted from USD and RTG$ revenues proportionately. Settlement occurs within 14 days of delivery from Fidelity.
To hedge against negative gold prices, Caledonia hedges by way of purchasing out of the money put options. During 2023 and to the date of this Annual Report, the following hedges were purchased:
| Purchase date |
Ounces hedged |
Strike price |
Period of hedge |
| December 22, 2022 |
16,672 oz |
$1,750 |
December 2022 - May 2023 |
| May 22, 2023 |
28,000 oz |
$1,900 |
June - December 2023 |
| December 19, 2023 |
12,000 oz |
$1,950 |
January - March 2024 |
| March 7, 2024 |
12,000 oz |
$2,050 |
April to June 2024 |
| April 1, 2024 |
12,000oz |
$2,100 |
July – September 2024 |
Hedged ounces entered approximates the cash flow effect of Caledonia’s attributable share of the production.
Our Business Operations and/or Activities could be impacted by the spread of contagious diseases, such as the Coronavirus.
Our business could be significantly adversely affected by the effects of a widespread global outbreak of contagious diseases, including the recent outbreak of respiratory illness caused by a novel coronavirus (“COVID-19”). We cannot accurately predict the impact that contagious diseases, such as COVID-19, will have on third parties’, including our employees’ ability to fulfil their obligations to the Company, including due to uncertainties relating to the ultimate geographic spread of the virus, the severity of the disease, the duration of the outbreak, and the length of travel and quarantine restrictions imposed by governments of affected countries. In addition, a significant outbreak of contagious diseases in the human population could result in a widespread health crisis that could adversely affect the economies and financial markets of many countries (including those countries we rely on to conduct our business operations), resulting in an economic downturn that could negatively impact our operating results.
Currently there are no concerns over the valuation of our assets as disclosed in the Consolidated Financial Statements and the Company does not foresee any changes in the cost of capital, cash requirements or any covenant defaults in our credit agreements. At the date of the authorisation of this document management is of the opinion that the effects of COVID-19 have been considered in making significant judgements and estimates, valuations and evaluating our going concern principle. However, it must be recognised that the duration and effects of pandemics are uncertain and can affect our forecasting accuracy. As of the date of this Annual Report, the severity of the effects of COVID-19 appear to be diminishing in the jurisdictions where the Company operates.
We cannot guarantee that there will not be an increase in input costs affecting our results of operations and financial performance.
Mining companies could experience higher costs of steel, reagents, labor, electricity, government levies, fees, royalties and other direct and indirect taxes. Our investment in a solar plant and efficiencies at existing operations should assist in curbing cost increases. However, there can be no assurance that we will be able to control such input costs and any increase in input costs above our expectations may have a negative result on our results of operations and financial performance.
Our operations may be subject to increased costs or even suspended or terminated as a result of any loss of required infrastructure in our operations.
Infrastructure, including water and electricity supplies, that is currently available and used by us may, as a result of adverse climatic conditions, natural disaster, incorrect or inadequate maintenance, sabotage or for other reasons, be destroyed or made unavailable or available in a reduced capacity. Were this to occur, operations at our properties may become more costly or have to be curtailed or even terminated, potentially having serious adverse consequences to our financial condition and viability that could, in turn, have a material adverse effect on our business, results of operations or financial performance.
Our operations may be subject to inadequate water supply.
Blanket uses water in the metallurgical process, some of which is pumped from the deeper levels of the mine but most of which is obtained from the “Blanket dam” (which, despite its name, is neither owned nor managed by Blanket Mine) which also supplies water to the nearby town of Gwanda. Blanket Mine is situated in a semi-arid region and rainfall typically only occurs in the period November to February. Management believes that there is enough water in the Blanket Mine dam to maintain normal operations until the next rainy season. During dry periods as a precautionary measure, Blanket intends to resuscitate existing boreholes and determine their yield; conduct hydrological surveys to identify potential new boreholes; recycle water from the lower levels of unused workings and construct a pond to store water that is pumped from current workings. If, however, there is inadequate water supply, operations at Blanket Mine may become more costly or have to be curtailed, suspended or even terminated which may have serious adverse consequences to the viability of gold production from Blanket Mine that could, in turn, have a material adverse effect on our business, results of operations or financial performance.
Our operations may be subject to inadequate electricity supply.
Zimbabwe’s electricity generation is mainly from the Kariba hydro station on the Zambezi river, the Hwange coal-fired station and several other much smaller coal-fired power stations. Even if Zimbabwe’s installed generating capacity is fully operational, it cannot generate enough electricity to meet its requirements and therefore Zimbabwe imports electricity from Mozambique and South Africa. Blanket Mine has a supply agreement with the Zimbabwe Electricity Supply Authority (“ZESA”) in terms of which it pays a premium rate in return for uninterrupted power.
The generating capacity at the Kariba hydro generating station fluctuates at times when the water levels are low. In addition, the export of electricity from South Africa to Zimbabwe is also interrupted due to a lack of generating capacity in South Africa and therefore interruptions to the Blanket supply do occur. The combined effect of these are severe electricity shortages that lead to “load-shedding” or low voltage occurrences.
Power surges as experienced at Blanket, if not controlled, can cause severe damage to Blanket’s electrical equipment. Blanket’s use of diesel for generating electricity decreased from approximately 3,827 kilo liters for the year in 2022 to 1,488 kilo liters in 2023.
Blanket has addressed the issue of interrupted power supply by installing stand-by generators. These generators can supply the whole mine with electricity but is a costly and environmentally unfriendly electricity source that is reliant on fuel imports that may from time to time be in shortage in Zimbabwe.
To mitigate against the current electricity situation, Caledonia has constructed a 12.2MWac solar plant at a cost of approximately $14.2 million (including construction costs and other project planning, structuring, funding and administration costs) supplying the Blanket operations. The solar plant was fully commissioned early February 2023 and provides approximately 24% of Blanket Mine’s average daily electricity demand. The plant has been providing power to Blanket from its initial connection to the Blanket grid in November 2022. The solar plant was classified as held for sale on September 28, 2023. Refer to note 24 of the Consolidated Financial Statements. The primary amount of electricity produced by the solar plant, after sale, will be sold to Blanket.
In April 2023 Blanket entered into a power supply agreement with the Intensive Energy Users Group (“IEUG”) and the Zimbabwean power utility to allow the IEUG to obtain power outside of Zimbabwe and strengthen the Zimbabwean power grid. As a result of this arrangement, Blanket has paid a lower tariff for IEUG supplied energy from April 2023, but it has not improved the power quality received at Blanket due to the continued difficulty with the Zimbabwe grid.
If an electricity shortage or outage persists, operations at the mines may become more costly or have to be curtailed, suspended or even terminated which may have serious adverse consequences to the viability of production from the mines that could, in turn, have a material adverse effect on our business, results of operations or financial performance.
We do business in countries and jurisdictions outside of the United States where different economic, cultural, regulatory, monetary and political environments could adversely impact our business, results of operations and financial condition.
The jurisdictions in which we operate are unpredictable. Assets and investments in these foreign jurisdictions are subject to risks that are usually associated with operating in a foreign country and any of these could result in a material adverse effect on our business, results of operations or financial performance. These risks include, but are not limited to, access to assets, labor disputes and unrest; arbitrary revocation of government orders, approvals, licenses and permits; corruption; uncertain political and economic environments; bribery; war; civil disturbances and terrorist actions; sudden and arbitrary changes to laws and regulations; delays in obtaining government permits; limitations on foreign ownership; more onerous foreign exchange controls; currency devaluations; import and export regulations; inadequate, damaged or poorly maintained infrastructure; and endemic illnesses. There can be no guarantee that governments in these jurisdictions will not unilaterally expropriate the property of companies that are involved in mining.
Caledonia’s mining operations are conducted in Zimbabwe and, as such, these operations are exposed to various levels of political, economic and other risks and uncertainties in addition to those set out above. These risks and uncertainties include, but are not limited to, expropriation and nationalization, or mandatory levels of Zimbabwean ownership beyond currently mandated levels; renegotiation, nullification or partisan terms of existing concessions, licenses, permits and contracts; illegal mining; changes in monetary and taxation policies; restrictions on foreign exchange and repatriation; and changing political conditions, currency controls and governmental regulations that favor or require the awarding of contracts to local contractors or require foreign contractors to employ citizens of, or purchase supplies from, a particular jurisdiction.
The current monetary situation in Zimbabwe can be summarized as follows:
| ● |
Blanket produces ore gold that it is obliged to deliver to Fidelity, a subsidiary of the Reserve Bank of Zimbabwe (“RBZ”), which refines the gold to a purity of 99.5% on a toll-treatment basis. With effect from April 2023, 25% of the resultant gold is sold to Fidelity and the remaining 75% is exported by Caledonia to a refiner of its choice outside Zimbabwe which undertakes further processing and sells the resulting gold on the international market. During 2023 all gold exports were sent to AEG in Dubai. The sale proceeds for the gold exported and sold via the offshore refiner is paid to Blanket’s commercial bankers in Zimbabwe within 48 hours of delivery. Management believes this new sales mechanism reduces the risk associated with selling and receiving payment from a single refining source in Zimbabwe. It also creates the opportunity to use more competitive offshore refiners and it may allow for the Company to raise debt funding secured against offshore gold sales. 25% of Blanket's gold is sold to Fidelity at a price which reflects the prevailing LBMA price and the official RTGS$/USD exchange rate on the date of sale. Payment is made by Fidelity to Blanket in RTGS$ or ZiG from April 5, 2024 within 14 days of the sale. Fidelity charges a refining fee of 1.24% of the USD export proceeds; Fidelity collects half of the 5% royalty which is payable to the Government of Zimbabwe in physical gold which is deducted from the amount exported and the balance is paid in USD and RTGS$ or ZiG proportionately to the 75:25 revenue split between USD and RTGS$ or ZiG. |
|
| ● |
The interbank RTGS$ or ZiG/USD exchange rates at each quarter end and at the latest practicable date prior to the publication of this Annual Report are set out below. |
| Interbank Exchange Rates |
(RTGS$:US$1) |
(ZiG:US$1) |
||
| February 20, 2019 |
2.50 |
|||
| March 31, 2019 |
3.00 |
|||
| June 30, 2019 |
6.54 |
|||
| September 30, 2019 |
15.09 |
|||
| December 31, 2019 |
16.77 |
|||
| March 31, 2020 |
25.00 |
|||
| June 30, 2020 |
57.36 |
|||
| September 30, 2020 |
81.44 |
|||
| December 31, 2020 |
81.79 |
|||
| March 31, 2021 |
84.40 |
|||
| June 30, 2021 |
85.42 |
|||
| September 30, 2021 |
87.67 |
|||
| December 31, 2021 |
108.66 |
|||
| March 31, 2022 |
142.42 |
|||
| June 30, 2022 |
370.96 |
|||
| September 30, 2022 |
621.89 |
|||
| December 31, 2022 |
684.33 |
|||
| March 31, 2023 |
929.86 |
|||
| June 30, 2023 |
5,739.80 |
|||
| September 30, 2023 |
5,466.75 |
|||
| December 31, 2023 |
6,104.72 |
|||
| March 31, 2024 |
22,055.47 |
|||
| April 8 , 2024 |
13.56 |
|||
| May 10, 2024 | 13.52 |
| ● |
Devaluation of the RTGS$ means that net monetary assets held in RTGS$ will devalue in USD terms. In the ordinary course of its business, Caledonia has net RTGS$-denominated assets comprising RTGS$-denominated cash and receivables (primarily for the 25% of gold sold to Fidelity and VAT receivables) and RTGS$ liabilities (mainly comprising taxes payable). During the first quarter of 2024, due to the increase in the rate of RTGS$ devaluation, management engaged more aggressively in RTGS$-denominated procurement to reduce its RTGS$-denominated cash. In the first quarter of 2024 to the date of this Annual Report, Blanket made prepayments of approximately $2 million in respect of consumables and supplies denominated in RTGS$. |
|
| ● |
RTGS$ cash balances at December 31, 2023 amounted to a USD equivalent of $539,115 and $360,541 at March 8, 2024. |
|
| ● |
On April 5, 2024 the Reserve Bank of Zimbabwe issued a Monetary Statement policy that introduced a structured currency (which is generally defined as a currency that is pegged to a specific exchange rate or currency basket and backed by a bundle of foreign exchange assets (including gold).). The structured currency called the ZiG replaced the RTGS$ from the said date. Banks were instructed to convert the RTGS$ balances into the new currency to foster simplicity, certainty, and predictability in monetary and financial affairs. The new currency will co-circulate with other foreign currencies in the economy. The retention threshold remained unchanged. |
Investors should recognize that Caledonia’s ability to implement its investment and operational strategies, Caledonia’s ability to sustain its operations outside Zimbabwe and pay future dividends depends, inter alia, on the ability to continue to externalize cash from Zimbabwe and receive payments for the sale of its gold proceeds.
On June 27, 2023 the U.S. Department of State together with other U.S. government agencies issued an advisory in light of reports related to the role of illicit actors in the gold trade to (i) highlight the opportunities and specific risks raised by the gold trade across sub-Saharan Africa and (ii) encourage industry participants to adopt and apply strengthened due diligence practices to ensure that such malign actors are unable to exploit and benefit from the sector, which remains essential to the livelihoods of millions of people across sub-Saharan Africa. Caledonia acknowledges and concurs with the U.S. Department of State’s warning that without adequate due diligence and appropriate mitigating measures, an industry participant may inadvertently contribute to one or more of these risks, including conflict and terror financing, money laundering activities, sanctions evasion, human rights and labor rights abuses and environmental degradation. Caledonia has robust policies in place to counter such risks including, amongst other things: a Code of Business Conduct, Ethics and Anti-Bribery Policy, a Human Rights Policy and Customer AML/KYC Policy, and it encourages whistleblowing and grievance reporting in order to monitor compliance. Caledonia performs enhanced due diligence on significant suppliers and other counterparties (including, but not limited to, sanctions and political exposure checks), has established new and robust routes to market for its gold production (none of which, for the avoidance of doubt, is artisanal) and has scrutinized the new refineries to which it now sells its gold. The Company reports its environmental, social and governance (“ESG”) performance annually, disclosing key environmental data, supports artisanal miners in the form of tributing of gold claims (as well as the local community generally) and has adopted best practice in the construction of its new tailings storage facility (“TSF”) at Blanket. For more information in all of these areas, please refer to Caledonia’s ESG reports.
Our operations are subject to various government approvals, permits, licenses and legal regulation for which no assurance can be provided that such approvals, permits or licenses will be obtained or if obtained will not be revoked or suspended.
Government approvals, permits and licenses are required in connection with a number of our activities and additional approvals, permits and licenses may be required in the future. The duration and success of our efforts to obtain approvals, permits and licenses are contingent upon many variables outside of our control. Obtaining governmental approvals, permits and licenses can increase costs and cause delays depending on the nature of the activity and the interpretation of applicable requirements implemented by the relevant authority. While we and our affiliates currently hold the necessary licenses to conduct operations there can be no assurance that all necessary approvals, permits and licenses will be maintained or obtained or that the costs involved will not exceed our estimates or that we will be able to maintain such permits or licenses. To the extent such approvals, permits and licenses are not obtained or maintained, we may be prohibited from proceeding with planned drilling, exploration, development or operation of properties which could have a material adverse effect on our business, results of operations and financial performance.
In addition, failure to comply with applicable laws, regulations and requirements in the countries in which we operate may result in enforcement action, including orders calling for the curtailment or termination of operations on our property, or calling for corrective or remedial measures requiring considerable capital investment. Although we believe that our activities are currently carried out in all material respects in accordance with applicable rules and regulations, no assurance can be given that new rules and regulations will not be enacted or that existing rules and regulations will not be applied in a manner that could limit or curtail production or development of our properties or otherwise have a material adverse effect on our business, results of operations and financial performance.
We face risks related to mining, exploration and mine construction on potential properties.
Our level of profitability, if any, in future years will depend on whether our mines produce at forecasted rates and whether any exploration and development stage properties can be brought into production. The mining, exploration and development of mineral deposits involves significant risks. It is impossible to ensure that any current and future exploration programs will establish mineral reserves or mineral resources. Whether a mineral ore body will be commercially viable depends on several factors, and the exact effect of these factors cannot be accurately predicted. The exploration, development and production activities are subject to political, economic and other risks, including:
| ● |
cancellation or renegotiation of contracts; |
|
| ● |
changes in local and foreign laws and regulations; |
|
| ● |
changes in tax laws; |
|
| ● |
delays or refusal in granting prospecting permissions, mining authorizations and work permits for foreign management staff; |
|
| ● |
environmental controls and permitting; |
|
| ● |
expropriation or nationalization of property or assets; |
|
| ● |
foreign exchange controls and the availability of foreign exchange; |
|
| ● |
government mandated social expenditures; |
|
| ● |
import and export regulation, including restrictions on the sale of production in foreign currencies; |
|
| ● |
inflation of costs that is not compensated for by a currency devaluation; |
|
| ● |
requirement that a foreign subsidiary or operating unit has a domestic joint venture partner, which, possibly, the foreign company must subsidize; |
|
| ● |
restrictions on the ability of local operating companies to hold foreign currencies in offshore and/or local bank accounts; |
|
| ● |
restrictions on the ability of a foreign company to have management control of exploration and/or development and/or mining operations; |
| ● |
restrictions on the remittance of dividend and interest payments offshore; |
|
| ● |
retroactive tax or royalty claims; |
|
| ● |
risks of loss due to civil strife, acts of war, guerrilla activities, insurrection and terrorism; |
|
| ● |
royalties and tax increases or claims by governmental entities; |
|
| ● |
unreliable local infrastructure and services such as power, water, communications and transport links; |
|
| ● |
demands or actions by native or indigenous groups; |
|
| ● |
other risks arising out of foreign sovereignty over the areas in which operations are conducted; and |
|
| ● |
lack of investment funding. |
Such risks could potentially arise in any country in which we operate.
As a result of the foregoing, our exploration, development and production activities in Zimbabwe may be substantially affected by factors beyond our control, any of which could materially adversely affect our financial position or results from operations. Furthermore, in the event of a dispute arising from such activities, we may be subject to exclusive jurisdiction of courts outside North America or may not be successful in subjecting persons to the jurisdiction of the courts in North America, which could adversely affect the outcome of a dispute.
We will need to identify new mineral reserves to replace mineral reserves that have been depleted by mining activities and to commence new projects. No assurance can be given that exploration activities by us will be successful in identifying sufficient mineral reserves of an adequate grade and suitable metallurgical characteristics suitable for further development or production.
Refer to section 4.B – “Business Overview” for more information on our mining properties and projects.
Further development and commercial production at Blanket Mine, Bilboes and acquired exploration and evaluation assets cannot be assured.
We are engaged in further development activities at Blanket Mine, exploration and evaluation activities at Blanket’s satellite properties, the Bilboes gold project in Zimbabwe (“Bilboes” or the “Bilboes Project”) (oxides and sulphides) and the Maligreen project (“Maligreen”). Mining activities commenced at the Bilboes oxide mine in December 2022 and due to operating losses mining activities were placed on care and maintenance at the end of September 2023.
The estimates for future production, at Blanket Mine and the Bilboes Project, are based on mining plans and are subject to change. Production estimates are subject to risk and no assurance can be given that future production estimates will be achieved. Actual production may vary from estimated production for a variety of reasons including un-anticipated variations in grades, mined tonnages and geological conditions, accident and equipment breakdown, changes in metal prices and the cost and supply of inputs and changes to government regulations. Construction and development of projects are subject to numerous risks including, but not limited to: obtaining equipment, permits and services; changes in regulations; currency rate changes; labor shortages; fluctuations in metal prices; and the loss of community support.
Substantial expenditures are required to establish reserves through drilling, to develop metallurgical processes to extract gold from ore and to develop the mining, processing facilities and infrastructure at any site chosen for mining. Although substantial benefits may be derived from the discovery of a major mineralized deposit, no assurance can be given that minerals will be capable of economic extraction by metallurgical process, or discovered in sufficient quantities or grades, or the estimated operating costs of the mining venture are sufficient, to justify development of the deposit, or that the funds required for development can be obtained on a timely and economically acceptable basis.
The marketability of any minerals acquired or discovered may be affected by numerous factors which are beyond our control and which cannot be predicted, such as metal price and market fluctuations, the proximity and capacity of milling facilities, mineral markets and processing equipment, and such other factors as government regulations, including regulations relating to royalties, allowable production, importing and exporting of minerals, and environmental protection. Depending on the price of minerals produced, the Company may determine that it is not commercially feasible to commence or continue commercial production.
Refer to capital investments under Item 4.A – “History and Development of the Company”, for detail on development activities at Blanket and the Bilboes Project and exploration and evaluation assets.
We face credit risk exposure from counterparties to certain contractual obligations and there is no assurance that any such counterparty may not default in such obligation causing us to incur a financial loss.
Credit risk is the risk that a party with a contractual obligation with us will default causing a loss. New regulations introduced by the Zimbabwean Ministry of Finance in January 2014 required that all gold produced in Zimbabwe must be sold to Fidelity, a company which is controlled by the Zimbabwean authorities. Accordingly, all of our production from Blanket Mine and the Bilboes oxide mine was sold to Fidelity until April 26, 2023 when production began to be sold to both Fidelity and AEG (see above). This mechanism means that the Company is no longer fully exposed to credit risk from Fidelity in respect of the US dollar component of its sales. This arrangement introduces a credit risk, beyond our control, that receivables and contractual performance due from Fidelity will not be paid or performed in a timely manner, or at all. If Fidelity, the Zimbabwean government or AEG were unable or unwilling to conduct business with us, or satisfy obligations to us, we could experience a material adverse effect upon our operations and financial performance. All payments due from Fidelity or AEG at year end have been received in full and on time.
The mining industry is highly competitive and there is no guarantee we will always be able to compete effectively.
The mining industry is a highly diverse and competitive international business. The selection of geographic areas of interest are only limited by the degree of risk a company is willing to accept by the acquisition of properties in emerging or developed markets and/or prospecting in explored or virgin territory. Mining, by its nature, is a competitive business with the search for fresh ground with good exploration potential and the raising of the requisite capital to move projects forward to production. There is aggressive competition within the mining industry for the discovery and acquisition of properties considered to have commercial potential. We will compete with other interests, many of which have greater financial resources than we will have, for the opportunity to participate in promising projects. Such competition may have better access to potential resources, more developed infrastructure, more available capital, have better access to necessary financing, and more knowledgeable and available employees than us. We may encounter competition in acquiring mineral properties, hiring mining professionals, obtaining mining resources, such as manpower, drill rigs, and other mining equipment. Such competitors could outbid us for potential projects or produce gold at lower costs. Increased competition could also affect our ability to attract necessary capital funding or acquire suitable properties or prospects for gold exploration or production in the future. Significant capital investment is required to achieve commercial production from successful exploration and development efforts. Globally, the mining industry is prone to cyclical variations in the price of the commodities produced by it, as dictated by supply and demand factors, speculative factors and industry-controlled marketing cartels. Nature provides the ultimate uncertainty with geological and occasionally climatic surprises. Commensurate with the acceptance of this risk profile is the potential for high rewards. If we are unable to successfully compete for properties, capital, customers or employees it could have a materially adverse effect on our results of operations.
We were required to facilitate the economic participation of certain indigenous groups in our business and there can be no assurance that such required participation was at fair market value or that the terms of the agreements can be amended.
The government of Zimbabwe introduced legislation in 2012 requiring companies to facilitate participation in their shareholdings and business enterprises by the indigenous population (typically referred to as indigenization). It is not assured that such interests were paid for at full fair value. As reported, Blanket Mine complied with the requirements of the Indigenization and Economic Empowerment Act in Zimbabwe whereby indigenous shareholders legally owned 51% of Blanket Mine since September 2012 (until 2020 – see below).
Pronouncements from the Zimbabwe Government following the appointment of the new President in late 2017 announced a relaxation in the indigenization policy which, amongst other things, included the removal of an indigenization requirement for gold mining companies. These pronouncements were passed into law in March 2018.
We currently do not depend on our ability to successfully access the capital and financial markets. However, should our financial position change any inability to access the capital or financial markets may limit our ability to execute our business plan or pursue investments that we may rely on for future growth.
Depending on our ability to generate income from our operations, we may require further financing for current and future exploration and development. Should our projections for fiscal years 2024 through to 2026 prove incorrect, to finance our working capital needs, we may have to raise funds through the issuance of additional equity or debt securities. Depending on the type and the terms of any financing we pursue, shareholders’ rights and the value of their investment in our shares could be reduced. Any additional equity financing will dilute shareholdings, and new or additional debt financing, if available, may involve restrictions on financing and operating activities. In addition, if we issue secured debt securities, the holders of the debt would have a claim to our assets that would be prior to the rights of shareholders until the debt is paid. Interest on these debt securities would increase costs and negatively impact operating results.
If we are unable to obtain additional financing, as needed, at competitive rates, our ability to implement our business plan and strategy may be affected, and we may be required to reduce the scope of our operations and scale back our exploration and development programs as the case may be. There is, however, no guarantee that we will be able to secure any additional funding or be able to secure funding which will provide us with sufficient funds to meet our objectives, which may adversely affect our business and financial position.
Our share price has been and is likely to continue to be volatile and an investment in our shares could suffer a decline in value.
Market prices for mining company securities, by their nature, are volatile. Factors, such as rapidly changing commodity prices, political unrest globally and in countries where we operate, speculative interest in mining stocks etc. are but a few factors affecting the volatility of the share price. Our shares are listed in the U.S. on the NYSE American, depositary interests representing our shares are admitted to trading on AIM of the London Stock Exchange (“AIM”), and depositary receipts representing our shares were listed on the VFEX in December 2021 raising gross proceeds of approximately $7.8m (the use of the term “share” in this Annual Report also, where the context requires, extends to a depositary interest or depositary receipt representing a share). The Company voluntarily delisted its shares from the Toronto Stock Exchange (“TSX”) on June 19, 2020. After the delisting the Company remains a Canadian reporting issuer and has to comply with Canadian securities laws unless and until it can demonstrate that less than 2% of its beneficial shareholders are Canadian residents. During 2023 gross proceeds of $10.8m and $5.9m were raised by issuing depository interests on AIM and depository receipts on the VFEX respectively.
The market price of our shares may be highly volatile and subject to wide fluctuations. In addition, the trading volume of our shares may fluctuate and cause significant price variations to occur. If the market price of our shares declines significantly, you may be unable to resell your shares at or above the purchase price, if at all. We cannot assure you that the market price of our shares will not fluctuate or significantly decline in the future.
Factors affecting our share price include but are not limited to:
| ● |
actual or expected fluctuations in our operating results; |
|
| ● |
actual or expected changes in our growth rates or our competitors’ growth rates; |
|
| ● |
changes in the market price of gold; |
|
| ● |
changes in the demand for gold; |
|
| ● |
high extraction costs; |
|
| ● |
accidents; |
|
| ● |
changes in market valuations of similar companies; |
| ● |
additions to or departures of our key personnel; |
|
| ● |
actual or anticipated fluctuations in our quarterly operating results or those of our competitors; |
|
| ● |
publication of research reports by securities analysts about us or our competitors in the industry; |
|
| ● |
our failure or the failure of our competitors to meet analysts’ projections or guidance that we or our competitors may give to the market; |
|
| ● |
fluctuations of exchange rates between the US$, GBP, CAD, RTGS$, ZiG and ZAR; |
|
| ● |
changes or proposed changes in laws and regulations affecting the gold mining industry; |
|
| ● |
changes in trading volume of our shares on the NYSE American, AIM or VFEX; |
|
| ● |
sales or perceived potential sales of our shares by us, our directors, senior management or our shareholders in the future; |
|
| ● |
short selling or other market manipulation activities; |
|
| ● |
announcement or expectation of additional financing efforts; |
|
| ● |
terrorist acts, acts of war or periods of widespread civil unrest; |
|
| ● |
natural disasters and other calamities; |
|
| ● |
litigation involving us, including: shareholder litigation, investigations or audits by regulators into our operations; or proceedings initiated by our competitors or clients; |
|
| ● |
strategic decisions by us or our competitors, such as acquisitions, divestitures, spin-offs, joint ventures, strategic investments or changes in business strategy; |
|
| ● |
the passage of legislation or other regulatory developments affecting us or our industry; |
|
| ● |
fluctuations in the valuation of companies perceived by investors to be comparable to us; and |
|
| ● |
conditions in the U.S., United Kingdom and Zimbabwe financial markets or changes in general economic conditions. |
The Company conducted equity raises by way of placings in the first two quarters of 2023 which targeted institutional investors in the UK, Europe, South Africa and Zimbabwe. The equity raises were over-subscribed: depositary interests in respect of 781,749 shares were issued to institutional investors in the UK, Europe and South Africa on March 30, 2023 and Zimbabwe depositary receipts in respect of 425,765 shares were issued to investors in Zimbabwe on April 14, 2023. The placing price was $13.74 and the placings raised $16.6 million before expenses. Mark Learmonth, Chief Executive Officer, and Toziyana Resources Limited, a company affiliated with Victor Gapare, an executive Director of the Company, subscribed for 3,587 shares and 11,000 shares respectively in the equity raise before the start of the Quarter. The proceeds of the equity raises were or are expected to be used for the Bilboes pre-feasibility study (refer to Exhibit 15.6), a shared services centre in Zimbabwe, the establishment of an international procurement arm to supply future operations, and exploration drilling at Motapa.
We are dependent on key management employees.
Our success depends (i) on the continued contributions of our directors, executive officers, management and consultants; and (ii) on our ability to attract new personnel whenever we seek to implement our business strategy. The loss of the services of any of these persons could have a materially adverse effect on our business, prospects, results of operations and financial performance. The limited availability of mining and other technical skills and experience in Zimbabwe and the difficulty of attracting appropriately skilled employees to Zimbabwe creates a risk that appropriate skills may not be available if, for whatever reason, the current skills base at the mines are depleted. There is no assurance that we will always be able to locate and hire all the personnel that we may require. Where appropriate, we engage with consulting and service companies to undertake some of the work functions. The Caledonia and Blanket management teams have been augmented so that it could provide appropriate support to Blanket if this is required.
Our mineral rights may be subject to defects in title.
We are not currently aware of any significant competing ownership claims or encumbrances respecting title to our properties. However, the ownership and validity or title of unpatented mining claims and concessions are often uncertain and may be contested. We also may not have, or may not be able to obtain, all necessary surface rights to develop a property. Although we have taken reasonable measures to ensure proper title to our properties, there is no guarantee of title to our properties or that competing ownership claims or encumbrances respecting our properties will not be made in the future. Title insurance is generally not available for mineral properties and our ability to ensure that we have obtained secure claims to individual mineral properties or mining concessions may be severely constrained. Our mineral properties may be subject to prior unregistered agreements, transfers or claims, and title may be affected by, among other things, undetected defects. We may incur significant costs related to defending the title to our properties. A successful claim contesting our title to a property may cause us to compensate other persons or perhaps reduce our interest in the affected property or lose our rights to explore and, if warranted, develop that property. This could result in us not being compensated for our prior expenditures relating to the property. Also, in any such case, the investigation and resolution of title issues would divert our management’s time from ongoing exploration and, if warranted, development programs. Any impairment or defect in title could have a negative impact on us.
We are subject to operational hazards and risks that could have a material adverse effect on our business, results of operations and financial performance.
We are subject to risks typical in the mining business. These include, but are not limited to, operational issues such as unexpected geological conditions or earthquakes causing unanticipated increases in the costs of extraction or leading to falls of ground and rock bursts, particularly as mining moves into deeper levels. Major cave-ins, flooding or fires could also occur under extreme conditions. Although equipment is monitored and maintained and all staff receive safety training, accidents caused by equipment failure or human error could occur. Such occurrences could result in damage to, or destruction of, mineral properties or production facilities, personal injury or death, environmental damage, delays in mining, monetary losses and possible legal liability. As a result, we may incur significant liabilities and costs that could have a material adverse effect upon our business, results of operations and financial performance.
Lawsuits may be filed against us and an adverse ruling in any such lawsuit could have a material adverse effect on our business, results of operations and financial performance.
We may become party to legal claims arising in the ordinary course of business. There can be no assurance that unforeseen circumstances resulting in legal claims will not result in significant costs or losses. The outcome of outstanding, pending or future proceedings cannot be predicted with certainty and may be determined adversely to us and as a result, could have a material adverse effect on our assets, liabilities, business, financial condition and results of operations. Even if we prevail in any such legal proceedings, the proceedings could be costly and time-consuming and may divert the attention of management and key personnel from our business operations, which could adversely affect our financial condition. In the event of a dispute arising in respect of our foreign operations, we may be subject to the exclusive jurisdiction of foreign courts or may not be successful in subjecting foreign persons to the jurisdiction of courts in the United States of America, South Africa, Zimbabwe, Canada, the United Kingdom, Jersey Channel Islands or international arbitration. The legal and political environments in which we operate may make it more likely that laws will not be enforced and that judgments will not be upheld. If we are unsuccessful in enforcing our rights under the agreements to which we are party to or judgments that have been granted, or if laws are not appropriately enforced, it could have a material adverse effect on our business, results of operations and financial performance.
We face risks related to illegal mining and no assurance can be provided that such illegal mining will not have an adverse effect on our business, results of operations and financial performance.
Illegal mining activities on properties controlled by the business have been identified. This gives rise to increased security costs and an increased risk of theft and damage to equipment. The business has received adequate support and assistance from the Zimbabwean police in investigating such cases but there can be no guarantee that the support from the Zimbabwean police will continue and whether their support will stop illegal mining activities.
Most of our employees are members of the Associated Mine Workers Union of Zimbabwe and any work stoppage or industrial action implemented by the union may affect our business, results of operations and financial performance.
Most of the employees are members of either the Associated Mine Workers Union of Zimbabwe or Zimbabwe Diamond and Allied Minerals Workers Union. Pay rates for all wage-earning staff are negotiated on a Zimbabwe industry-wide basis between the union and representatives of the mine owners. Any industrial action called by the union may affect our operations even though our operations may not be at the root cause of the action. Strikes, lockouts or other work stoppages could have a material adverse effect on our business, results of operations and financial performance. In addition, any work stoppage or labor disruption at key customers or service providers could impede our ability to supply products, to receive critical equipment and supplies for our operations or to collect payment from customers encountering labor disruptions. Work stoppages or other labor disruptions could increase our costs or impede our ability to operate.
There can be no assurance that changes to any environmental, health and safety laws to which we are currently subject would not adversely affect our exploration and development programs.
Our exploration, development and operations are subject to environment, health and safety (“EH&S”) laws and regulations in the countries in which the relevant activity is being conducted.
In 2018, a training facility (called the Nyanzvi initiative) was established at Blanket using dedicated facilities and specially trained facilitators. The entire Blanket workforce participated in the program which resulted in the general improvement in safety in the first two quarters of 2020. The Nyanzvi program was suspended from late March 2020 due to the need to observe social distancing because of COVID-19 which contributed to the increase in reportable events. The Nyanzvi initiative was resumed in the last quarter of 2021 as COVID-19 restrictions were relaxed; management believes this will help to increase general safety awareness.
During 2023 102 employees trained on Nyanzvi 2. Co-creation training of the engineering leadership, which comprise 17 section engineers, manager, foremen and charge hands. An engineering pilot team of 11 employees was trained. Team rankings for the best performers for all departments continued in the fourth quarter of 2024.
Safety training is an ongoing exercise and it will remain an area of focus for the Company. There is no assurance, however, that future changes in EH&S, if any, will not adversely affect our exploration and development programs or our operations. There are no assurances that regulatory and environmental approvals required under EH&S will be obtained on a timely basis or if at all. A breach of EH&S may result in the temporary suspension of operations, the imposition of fines, other penalties (including administrative penalties and regulatory prosecution), and government orders, which could potentially have a material adverse effect on operations.
Due to the nature of our business, our operations face extensive EH&S risks.
Gold mining is exposed to numerous risks and events, the occurrence of which may result in the death of, or personal injury to, employees. EH&S legislation applicable to us could suspend part or all of our operations. EH&S incidents could therefore lead to increased unit production costs or lower production which could negatively affect our business, operating and/or financial results.
Regrettably, a fatality occurred on February 16, 2023. The fatality occurred as a result of a secondary blasting accident. The directors and management of Caledonia and Blanket express their sincere condolences to the family and colleagues of the deceased. Management has provided the necessary assistance to the Ministry of Mines Inspectorate Department in its enquiries into the incident. Caledonia takes the safety of its employees very seriously and, accordingly, measures have been taken to reinforce adherence to prescribed safety procedures.
In August, 2023 Caledonia reported that an employee of a company contracted to Blanket died of injuries sustained in an accident at Blanket.
We are exposed to the risk of onerous environmental legislation which could potentially result in significant cost and liabilities
The environment, including water streams, land, habitat and environments near the mining sites can be impacted by our mining and other operational activities. With an increasing global focus and public sensitivity to environmental sustainability and environmental regulation becoming more stringent, we could be subject to further environmental related responsibilities and associated liability. Environmental legislation and permitting requirements are likely to evolve in a manner which will require stricter standards and enforcement, increased fines and penalties for non-compliance, more stringent environmental assessments of proposed projects, an increase in capital expenditure and a heightened degree of responsibility for companies and their directors and employees.
Closure of mining operations, without sufficient financial provision for the funding of rehabilitation liabilities may result in our directors becoming subject to prosecution, litigation and potentially significant liabilities.
Future expenditure on rehabilitation might not be complete or accurately provided for due to higher than expected cost increases, changes in legislation, unidentified factors or other factors out of our control. Annual in-house reviews and rehabilitation costs and footprint estimation are done to control this risk. Every third year external experts review our footprint and cost estimations. At December 31, 2023 our total consolidated rehabilitation provision amounted to $11.0m as stated in note 29 of the Consolidated Financial Statements.
We may enter into acquisitions or other material transactions at any time.
We continually seek to replace and expand our reserves through the exploration of our existing properties and may expand through acquisitions of interests in new properties or interests in properties such as the Bilboes Project, Maligreen and Motapa. Acquisitions involve a number of risks, including: the possibility that we, as a successor owner, may be legally and financially responsible for liabilities of prior owners; the possibility that we may pay more than the acquired company or assets are worth; the additional expenses associated with completing an acquisition and amortizing any acquired intangible assets; the difficulty of integrating the operations and personnel of an acquired business; the challenge of implementing uniform standards, controls, procedures and policies throughout an acquired business; the inability to integrate, train, retain and motivate key personnel of an acquired business; and the potential disruption of our ongoing business and the distraction of management from its day-to-day operations. These risks and difficulties, if they materialize, could disrupt our ongoing business, distract management, result in the loss of key personnel, increase expenses and may have a material adverse effect on our business, results of operations and financial performance.
As a foreign private issuer, we are permitted to file less information with the SEC than a company that is not a foreign private issuer or that files as a domestic issuer.
As a foreign private issuer, we are exempt from certain rules under the Exchange Act that impose disclosure requirements as well as procedural requirements for proxy solicitations under Section 14 of the Exchange Act. In addition, our officers, directors and principal shareholders are exempt from the reporting and “short-swing” profit recovery provisions of Section 16 of the Exchange Act. Moreover, we are not required to file periodic reports and financial statements with the SEC as frequently or as promptly as a company that files as a domestic issuer whose securities are registered under the Exchange Act, nor are we generally required to comply with the SEC’s Regulation FD, which restricts the selective disclosure of material non-public information. For as long as we are a “foreign private issuer” we intend to file our annual financial statements on Form 20-F and furnish our quarterly financial statements on Form 6-K to the SEC for so long as we are subject to the reporting requirements of Section 13(g) or 15(d) of the Exchange Act. However, the information we file or furnish is not the same as the information that is required in annual and quarterly reports on Form 10-K or Form 10-Q for U.S. domestic issuers. Accordingly, there may be less information publicly available concerning us than there is for a company that files as a domestic issuer.
We may lose our foreign private issuer status, which would then require us to comply with the Exchange Act’s domestic reporting regime and cause us to incur additional legal, accounting and other expenses.
We are required to determine our status as a foreign private issuer on an annual basis at the end of our second fiscal quarter. In order to maintain our current status as a foreign private issuer, either (1) a majority of our shares must be either directly or indirectly owned of record by non-residents of the United States or (2) (a) a majority of our executive officers or directors must not be U.S. citizens or residents, (b) more than 50 percent of our assets cannot be located in the United States and (c) our business must be administered principally outside the United States. If we lost this status, we would be required to comply with the Exchange Act reporting and other requirements applicable to U.S. domestic issuers, which are more detailed and extensive than the requirements for foreign private issuers. We would also be subject to additional restrictions on offers and sales of securities outside the United States and would have to comply with the generally more restrictive Regulation S requirements under the Securities Act that apply to U.S. domestic issuers, which could limit our ability to access capital markets in the future. The regulatory and compliance costs to us under U.S. securities laws if we are required to comply with the reporting requirements applicable to a U.S. domestic issuer may be higher than the cost we would incur as a foreign private issuer. As a result, we expect that a loss of foreign private issuer status would increase our legal and financial compliance costs.
We are an emerging growth company and we cannot be certain if the reduced disclosure requirements applicable to emerging growth companies may make our shares less attractive to investors and, as a result, adversely affect the price of our shares and result in a less active trading market for our shares.
We are an “emerging growth company” as defined in the JOBS Act, and we may take advantage of certain exemptions from various reporting requirements that apply to other public companies that are not emerging growth companies. For example, we have qualified for an exemption from the auditor attestation requirements of Section 404 of the Sarbanes-Oxley Act relating to internal control over financial reporting, and we will not require such an attestation from our auditors.
We may avail ourselves of these disclosure exemptions until we are no longer an emerging growth company. We cannot predict whether investors will find our shares less attractive because of our reliance on some or all these exemptions. If investors find our shares less attractive, it may adversely impact the price of our shares and there may be a less active trading market for our shares.
We will cease to be an emerging growth company upon the earliest of:
| ● |
the last day of the fiscal year during which we have total annual gross revenues of $1,235,000,000 (as such amount is indexed for inflation every five years by the SEC or more); |
| ● |
the last day of our fiscal year following the fifth anniversary of the completion of our first sale of equity securities pursuant to an effective registration statement under the Securities Act; |
| ● |
the date on which we have, during the previous three-year period, issued more than $1,000,000,000 in non- convertible debt; or |
| ● |
the date on which we are deemed to be a “large accelerated filer”, as defined in Rule 12b–2 of the Exchange Act, which would occur if the market value of our shares that are held by non-affiliates exceeds $700,000,000 as of the last day of our most recently-completed second fiscal quarter. |
During 2020, the Company sold its first equity securities under the Securities Act. This means that the Company may no longer qualify as an emerging growth company following the fifth anniversary of the completion of the equity raise. The Company may instead thereafter have to comply with Section 404(b) of the Sarbanes-Oxley Act where our registered public accountant will be required to attest to management’s assessment of its internal controls over financial reporting as presented under Item 15B of Form 20-F.
If we fail to establish and maintain proper internal controls, our ability to produce accurate financial statements or comply with applicable regulations could be impaired.
Section 404(a) of the Sarbanes-Oxley Act requires that our management assess and report annually on the effectiveness of our internal controls over financial reporting and identify any material weaknesses in our internal controls over financial reporting. Although Section 404(b) of the Sarbanes-Oxley Act requires our independent registered public accounting firm to issue an annual report that addresses the effectiveness of our internal controls over financial reporting, we have opted to rely on the exemptions provided to us by virtue of being a foreign private issuer and an emerging growth company, and consequently will not be required to comply with SEC rules that implement Section 404(b) of the Sarbanes-Oxley Act until we lose our emerging growth company status.
If either we are unable to conclude that we have effective internal controls over financial reporting or, at the appropriate time, our independent auditors are unwilling or unable to provide us with an unqualified report on the effectiveness of our internal controls over financial reporting as required by Section 404(b) of the Sarbanes-Oxley Act, investors may lose confidence in our operating results, the price of our shares could decline and we may be subject to litigation or regulatory enforcement actions.
The Company’s management, including the Chief Executive Officer and the Chief Financial Officer, are responsible for implementing measures to make sure all internal controls are in place and will comply with the requirements of Section 404(b) of the Sarbanes-Oxley Act when it becomes effective from the 2026 financial reporting period.
There is uncertainty with our mineral reserve and mineral resource estimates.
Our mineral reserve and mineral resource estimates described in this document are estimated in accordance with the requirements of Subpart 1300 of Regulation S-K (“Subpart 1300”). We believe these estimates also comply with Canada’s National Instrument 43-101 (“NI 43-101”). These estimates may not reflect actual mineral reserves and, mineral resources, or future production. Should we encounter mineralization or formations different from those predicted by past drilling, sampling and similar examinations, mineral reserve and mineral resource estimates may have to be adjusted and mining plans may have to be altered in a way that might ultimately cause our mineral reserve and mineral resource estimates to decline. Our mineral resource estimates may never be upgraded to mineral reserves. Moreover, if the gold price declines, or if our labor, consumable, electricity and other production costs increase or recovery rates decrease, it may become uneconomical to recover our mineral reserves. Under these circumstances, we would be required to re-evaluate our mineral reserves and mineral resources. Mineral reserve and mineral resource estimates are based on drilling results and because unforeseen conditions may occur, the actual results may vary from the initial estimates. These factors could result in reductions in our mineral reserve and mineral resource estimates, which could in turn adversely impact the total value of our business.
U.S. investors may not be able to enforce their civil liabilities against us or our directors and officers.
It may be difficult to bring and enforce suits against us, because we were amalgamated and exist under the laws of Jersey, Channel Islands and are situated in Jersey, Channel Islands and do not have assets located in the United States.
All our assets are located outside the United States and most of our directors and all of our officers are residents of countries other than the United States. As a result, it may be difficult for investors to effect service of process on us or these non-United States resident persons within the United States or to rely in the United States upon judgments obtained in the United States based on the civil liability provisions of the U.S. federal securities laws against us or our officers and non-United States resident directors. In addition, our U.S. shareholders should not assume that the courts of Jersey, Channel Islands (i) would enforce judgments of U.S. courts obtained in actions against us, our officers or directors predicated upon the civil liability provisions of the U.S. federal securities laws or other laws of the United States, or (ii) would enforce, in original actions, liabilities against us, our officers or directors predicated upon the U.S. federal securities laws or other laws of the United States.
We are incorporated under the laws of Jersey, Channel Islands and our principal offices are located outside of the United States which could have negative tax consequences for U.S. investors.
We are incorporated under the laws of Jersey, Channel Islands and are located outside of the United States. Accordingly, U.S. investors could be subject to negative tax consequences. If we choose to make an offering of securities in the United States, the applicable prospectus is expected to include a discussion of the material United States tax consequences relating to the purchase, ownership and disposition of any securities offered thereby, to the extent not set out in this Annual Report; however, investors should consult their own tax advisors as to the consequences of investing in Caledonia.
There is uncertainty as a result of the conflict in Ukraine and Israel-Gaza
The conflict in Ukraine which began in February 2022, and the accompanying international response including economic sanctions, has been extremely disruptive to the world economy, with increased volatility in commodity markets, including higher oil and gasoline prices, international trade and financial markets, all of which have a trickle-down effect on supply chains, equipment and construction. There is substantial uncertainty about the extent to which this conflict will continue to impact economic and financial affairs, as the numerous issues arising from the conflict are in flux and there is the potential for escalation of the conflict both within Europe and globally. There is a risk of substantial market and financial turmoil arising from the conflict which could have a material adverse effect on the economics of the Company’s projects, and the Company’s ability to operate its business and advance project development.
Even though we do not have any operations or direct suppliers located in Israel, tensions in the Middle East centred around the Israel-Gaza conflict could result in disruptions to our business and operations, adversely affect our anticipated unit and production costs, increase raw material costs, increase inflationary pressures, impacting our ability to successfully contract with suppliers, and could have other adverse impacts on our anticipated costs. We have not experienced any direct impacts from the conflicts thus far.
We rely on the use of technology and information systems, which may become subject to cyber-terrorism or other compromises and shut-downs, and any failures or interruptions of these systems could adversely affect our businesses operations.
We operate businesses that are dependent on information systems and other technology, such as computer systems used for information storage, processing and administrative functions. We rely heavily on our financial, accounting, communications and other data processing systems.
Our systems could be breached or damaged by computer viruses and systems attacks, natural or man-made incidents, disasters or unauthorized physical or electronic access, despite the measures that we have in place, including those related to cyber security. Cyber incidents may remain undetected for an extended period, which could exacerbate these consequences.
System failures, security breaches or accidents could give rise to potential theft, loss, business disruption, corruption, exposure or other damage to proprietary business data or employee or other personal data. The result can be significant remediation and other costs, fines, litigation and regulatory actions against us by various regulatory organizations or exchanges, governments or affected individuals due to non-compliance with our contractual or other legal obligations regarding data or intellectual property or violating our privacy and security policies. Significant reputational harm and/or financial loss can occur. We cannot predict what effects these attacks, compromises or shut-downs would have, and the consequences could be material.
A prolonged global failure of cloud services provided by a variety of cloud services providers that we engage could result in cascading systems failures for us, and we can provide no assurance that our efforts or those of third parties with whom we conduct business will be successful in protecting our systems and preventing or limiting damages from a cyber incident.
Caledonia continues to develop precautionary measures to ensure the integrity of our system and that we remain subject to additional known or unknown threats. Occasionally we implement updates to our information technology systems and software. In addition, our employees also receive regular training on cyber- and/ or other information technology threats.
Theft or hijacking of gold may arise on site or during deliveries
Theft of gold can impact on our profitability and increase costs, e.g. insurance, security, etc. Security measures are put in place to prevent theft of gold on site and during deliveries. Insurance is also taken out for gold on site and during deliveries. Management is continuously being made aware of any incidents and precautionary measures are reviewed on a regular basis. Caledonia has changed the delivery of gold to helicoptering instead of by road to decrease the risk of theft during deliveries. Extra security was also added at the metallurgical plant.
ITEM 4 - INFORMATION ON THE COMPANY
A. History and Development of the Company
Caledonia Mining Corporation Plc (previously Caledonia Mining Corporation) was incorporated, effective February 5, 1992, by the amalgamation of three predecessor companies and was registered at the time under the Canada Business Corporations Act.
Following the creation of Caledonia its shares were listed on the TSX and quoted on the NASDAQ small caps market. On October 16, 1998, Caledonia announced that NASDAQ would no longer quote its securities for trading. Caledonia’s stock commenced trading on the OTCQX in June 2005.
Effective April 1, 2006 the Company purchased 100% of the issued shares of the Zimbabwean company, CHZ, that held 100% of the shares of Blanket Mine. The purchase consideration was $1,000,000 and 20,000,000 shares of Caledonia. The Company acquired all the assets and assumed all the liabilities of CHZ.
The Company re-domiciled from Canada to Jersey using a legal process called “Continuance” on March 19, 2016. The Company operates under the Companies (Jersey) Law 1991, as amended, (the “Companies Law”). The Continuance had no effect on the Company’s listing on the TSX or on the trading facilities on AIM in London or on the OTCQX in the United States of America.
On July 24, 2017, the Company announced that its shares would be listed on the NYSE American and trading began on July 27, 2017. The trading of the Company’s shares on the OTCQX ceased upon the commencement of trading on the NYSE American.
Caledonia voluntary delisted its shares from the TSX on June 19, 2020. After the delisting, the Company remains a Canadian reporting issuer and has to comply with Canadian securities laws unless and until it can demonstrate that less than 2% of its beneficial shareholders are Canadian residents. On December 2, 2021, Caledonia issued and listed 619,783 depositary receipts representing an equivalent number of shares on the VFEX raising gross proceeds of $7.8 million.
On January 6, 2023, Caledonia completed the acquisition of Bilboes Gold Limited (“Bilboes Gold”), further details of which can be found in Section 4.B “Business overview” of this report.
During the first two quarters of 2023 gross proceeds of $10.8 million were raised by issuing 781,749 depository interests which were subsequently listed on AIM and gross proceeds of $5.9 million were raised by issuing 425,765 depository receipts which were subsequently listed on the VFEX.
As at the date of this report Caledonia’s securities trade on the NYSE American, AIM and VFEX under the ticker “CMCL”.
The addresses and telephone numbers of Caledonia’s principal offices are:
| Registered and Head Office |
African Office - South African Subsidiaries |
| Caledonia Mining Corporation Plc |
Caledonia Mining South Africa Proprietary Limited |
| B006 Millais House, Castle Quay, St Helier |
4th Floor, 1 Quadrum office park |
| Jersey, Channel Islands |
Johannesburg, Gauteng, 2198 |
| JE2 3EF |
South Africa |
| (44) 1534 679 800 |
(27) 11 447 2499 |
Indigenization of Blanket Mine
On February 20, 2012 certain companies within Caledonia’s group of companies (the “Group”) announced that they had signed a Memorandum of Understanding (“MoU”) with the Minister of Youth, Development, Indigenization and Empowerment of the Government of Zimbabwe pursuant to which the Group agreed that indigenous Zimbabweans would acquire an effective 51% ownership interest in the Blanket Mine for a transactional value of $30.09 million. Pursuant to the above, the Group entered into agreements with each indigenous shareholder to transfer 51% of the Group’s ownership interest in Blanket Mine whereby it:
| ● |
sold a 16% interest to the National Indigenization and Economic Empowerment Fund (“NIEEF”) for $11.74 million; |
| ● |
sold a 15% interest to Fremiro Investments (Private) Limited (“Fremiro”), which is owned by indigenous Zimbabweans, for $11.01 million; |
| ● |
sold a 10% interest to Blanket Employee Trust Services (Private) Limited (“BETS”) for the benefit of present and future managers and employees for $7.34 million. The shares in BETS are held by the Blanket Mine Employee Trust (“Employee Trust”) with Blanket Mine’s employees holding participation units in the Employee Trust; and |
| ● |
donated a 10% ownership interest to the Gwanda Community Share Ownership Trust (“Community Trust”). In addition, Blanket Mine paid a non-refundable donation of $1 million to the Community Trust. |
In anticipation of completing the underlying subscription agreements, advances were made to NIEEF and the Community Trust against their rights to receive dividends declared by Blanket Mine on their shareholdings as follows:
| ● |
a $2 million payment to the Community Trust on or before September 30, 2012; |
| ● |
a $1 million payment to the Community Trust on or before February 28, 2013; and |
| ● |
a $1 million payment to the Community Trust on or before April 30, 2013. |
Advances made to NIEEF as an advanced dividend loan were settled through dividend repayments in 2014. The final payment to settle the advance dividend loan to the Community Trust was made on September 22, 2021. Future dividends to the Community Trust are unencumbered from the date the loan was settled in full.
The Group facilitated the vendor funding of these transactions and the advanced dividend loans which were repaid by way of dividends from Blanket Mine. 100% of dividends declared by Blanket Mine as payable to the Community Trust were used to repay its advanced dividend loan until the beginning of 2020 when Blanket agreed that 80% of dividends declared by Blanket Mine would be used to repay such loan and the remaining 20% would unconditionally accrue to the Community Trust, which was the same arrangement that applied to the other indigenous shareholders (see below). The timing of the repayment of the loans depends on the future financial performance of Blanket Mine and the extent of future dividends declared by Blanket Mine. Subsequent to the indigenization transactions the facilitation loans relating to the Group were transferred as a dividend in specie to the Company.
Pronouncements from the Zimbabwe Government following the appointment of the new President in late 2017 declared a relaxation in the indigenization policy which, amongst other things, included the removal of an indigenization requirement for gold mining companies. These pronouncements were passed into law in March 2018. In light of the changed legislation, on November 6, 2018, the Company announced that it had entered into a sale agreement with Fremiro to purchase Femiro’s 15% shareholding in Blanket for a gross consideration of $16.667 million to be settled through a combination of the cancellation of the loan between the two entities (which stood at $11.467 million as at June 30, 2018) and the issue of 727,266 new shares in Caledonia at an issue price of $7.15 per share. On completion of the transaction on January 20, 2020, Caledonia owned 64% in Blanket and Fremiro held approximately 6.3% of Caledonia’s shares.
On February 27, 2020, the Company, Blanket Mine and the indigenous shareholders of Blanket Mine reached an agreement to change the repayment terms of the advance dividend loan to the Community Trust. The amendment allowed that 20% of the Community Trust’s share of the Blanket dividend would accrue to it on declaration of the dividend and that the remaining 80% be applied to the advance dividend loan from February 27, 2020. The modification was not considered beneficial to the other indigenous shareholders.
Blanket Mine - Capital Investment
The main capital development project is the infrastructure which will allow for three new production levels (26, 30 and 34 levels); a fourth level (38 level) is to be added in due course via a twin decline that commenced construction in February 2024.
Work on the key development areas in 2023 are detailed below:
| ● |
30 and 34 level development: the 30 level and 34 level northern and southern haulages had a total advance of 384.3m. Part of the northern haulage development included the take off to the 30 level Eroica extraction haulage, developed for 34.6m which development had to be reviewed pending evaluation work in the area. Development north on 30 level subsequently included additional evaluation cubbies. |
| ● |
Eroica decline 3: the Eroica decline had a total of 108m developed. The expected completion was deferred to the start of the first quarter of 2024 due to the slow rate of development owing to logistical challenges. 900m will be the last level in the development of the decline and there will be up dip development from 990m to 900m. |
| ● |
930m 2 Orebody Hanging Wall Haulage: the total advance for the haulage was 159.9m. The haulage serves to expose the Blanket southern orebodies on 930m for production. The haulage is also important for the establishment of an access crosscut to link 6 Shaft on 930m.34 – 38 level twin declines: the twin declines had slow progress during the fourth quarter of 2023 with a total of 190.5m achieved. The poor progress was due to waste handling challenges. The twin declines will serve as access to Blanket orebodies below 34 level where shaft infrastructure does not reach. The decline establishment will be for both access and production through subsequent installation of a chairlift and conveyor system, respectively. |
| ● |
35 level Central Shaft: the 34 and 35 level construction of clear and dirty water dams was completed, and installation of the water management system will be complete in the second quarter of 2024. Support installation was completed in the fourth quarter of 2023. |
| ● |
35 level conveyor: the transition from compressed air operated loading system to hydraulics was successfully completed in the fourth quarter of 2023. |
| ● |
The existing TSF is reaching the end of its life; accordingly, a new TSF is required to allow production to continue. The design parameters for the new facility include: |
| o |
capacity of 13 million tonnes which is anticipated to be adequate for 14 years of production at current deposition rate; |
|
| o |
“upstream” design, due to the limited space; |
|
| o |
clear water dam and TSF will be lined with a double lining (geotextile and clay liner) and polyurethane liner respectively to avoid contamination of ground water; |
|
| o |
the design includes new piping and new pumps for a gland service water and return water system with instrumentation; |
|
| o |
new boreholes for monitoring around the facility; and |
|
| o |
a waste embankment between the TSF and the mine village for dust prevention. |
The anticipated cost of the new TSF is $25.1 million which will be incurred over a period of 3 years (2023: $11.4 million, 2024: $5.4 million and 2025: $8.3 million). Work on the TSF commenced in March 2023 and the first phase of the project was completed at the end of February 2024. The project was behind schedule due to resourcing by the contractor and changes in the design by an external consultant. The contractor had to change the program slightly to re-focus on the lowest areas of the TSF basin to allow limited deposition on the new TSF by end of October 2023 in parallel with further deposition onto the existing TSF until it reaches its maximum capacity. Limited deposition on the new TSF commenced on October 30, 2023, which has subsequently increased to 100% of Blanket’s tailings in 2024. Limited capacity remains on the old TSF, to provide a buffer in the event that there are delays in the completion of further phases in the construction of the new TSF.
Capital expenditure at Blanket in 2023 amounted to $28.1 million (inclusive of Caledonia Mining South Africa Proprietary Ltd’s (“CMSA”) mark-up). Planned 2023 capital expenditures of $2.2 million were postponed to 2024. Capital expenditure for 2023 included:
| ● |
New TSF (first phase) - $11.1 million; |
| ● |
Capital development at 30 and 34 levels - $9.5 million; |
| ● |
Utilities for the Central Shaft infrastructure - $1.9 million; |
| ● |
Information technology infrastructure - $0.5 million; |
| ● |
Electrical engineering - $0.6 million; |
| ● |
Mill and surface engineering - $2.4 million; and |
| ● |
Staff housing - $365,000. |
Capital expenditure at Blanket in 2024 is estimated at $30.8 million (inclusive of CMSA’s mark-up and postponements).
Solar Investment
In 2020, the Company raised $13 million (before commission and expenses) through the sale of 597,963 shares at an average price of $21.74 per share to construct a solar plant. Caledonia initiated a tender process to identify parties to submit proposals for a solar project that would reduce Blanket’s reliance on grid and generator power and provided notice to proceed with construction in 2021. The 12.2 MWac solar plant was connected to the Blanket grid in November, 2022 and fully commissioned in early February 2023. The solar plant provides approximately 24% of Blanket’s electricity demand during daylight hours, reduces Blanket’s reliance on the utility and generator use and cost $14.2 million to complete.
Blanket continues to rely on the grid and generators to provide additional power during daylight hours and at night. Completion of the solar plant coincided with an improvement in the supply of power from the grid which has substantially reduced the amount of diesel consumed. In January 2024 and February 2024 Blanket consumed on average 82,000 litres of diesel per month for 2024 compared to an average of 124,000 litres per month for the whole of 2023. Whilst it is uncertain that this level of improvement will be maintained, the successful implementation of the solar plant is expected to result in a meaningful reduction in diesel usage.
In December 2022, the Caledonia board of directors (the “Board of Directors”) approved a proposal for Caledonia Mining Services (Private) Limited (“CMS”), which owns the solar plant, to issue loan notes (“solar bonds”). This decision was taken to optimise the capital structure of the Group and provide additional debt instruments to the Zimbabwean financial market. The bonds had an interest rate of 9.5% payable bi-annually and had a tenor of 3 years from the date of issue. The bond repayments are guaranteed by the Company and $7 million of bonds were issued to Zimbabwean commercial entities by CMS. The issuer of the solar bonds was changed from CMS to CHZ during the fourth quarter of 2023 in anticipation of the proposed sale (see below) and in order that Caledonia can maintain and develop the relationship with the Zimbabwean institutional holders of the bonds. $2 million of further bonds were issued to Zimbabwean commercial entities by CHZ in the second quarter of 2024.
Due to the unique operating environment in Zimbabwe and Caledonia’s significant in-country expertise, Caledonia opted to build the solar plant using its own resources rather than relying on an external party to build, operate and own the solar plant using its financial resources and selling the resultant power to Blanket on a long-term contract. Accordingly, Caledonia constructed the solar plant using its own financial resources at a cost of $14.2m. As the solar plant is now fully commissioned and is working as planned, Caledonia no longer needs to own the solar project, provided it retains long term access to the power it produces.
In the second quarter of 2023 management embarked on a process to sell the solar plant. Various offers were received, and a bidder has been given exclusivity to conduct due diligence and further negotiate the sale of the plant after proving their ability to operate and fund solar plants of similar size and complexity. Management is in an advanced stage of finalising the contractual arrangements to sell the solar plant whereby the new owners will exclusively supply Blanket with electricity. This transaction is expected to realise a profit on Caledonia's investment in the plant and release cash for reinvestment in Caledonia’s core business of gold mining that should yield higher returns to our shareholders.
The solar asset was re-classified as held for sale as at December 31, 2023 in the Consolidated Financial Statements.
Capital projects and expenditures are further analyzed in notes 17 and 18 of the Consolidated Financial Statements and under Item 4.B – “Business Overview”.
Available Information
The SEC maintains an internet site (http://www.sec.gov) that contains report, proxy and information statements and other information regarding issuers that file electronically with the SEC. Such information can also be found on the Company’s website (http://www.caledoniamining.com).
Description of Our Business
Blanket Mine
Caledonia’s primary focus is the operation of a gold mine and the exploration and development of mineral properties for precious metals. Caledonia’s activities are focused on Zimbabwe. The Company’s business during the last three completed fiscal years has been focused primarily on increasing production to 80,000 oz. of gold from 2023 onward through its investment plan at Blanket Mine.
Total gold production at Blanket Mine for 2023 was 75,416 oz. (2022: 80,775 oz.; 2021: 67,476 oz.). Gold producers compete globally based on their operating and capital costs. Certain gold producers benefit from their ability to produce other minerals in commercial quantities as by-products. Caledonia derives approximately 0.1% of its revenues from silver, which is insignificant. Over the last three years, 100% of Blanket’s revenues was derived from its operations in Zimbabwe.
The underground drilling program at Blanket targeted the Eroica, Blanket and AR south ore bodies and yielded encouraging results, which were published on July 10, 2023 and January 30, 2024. The total drilling for 2023 was 13,280 meters, and the results indicate that the existing Blanket, Eroica and AR South ore bodies have grades and widths that are generally better than expected. Refer to Exhibit 15.4 for the updated technical report of Blanket, which reflects this new information in a revised resource statement taking into account the increased life of mine.
Bilboes Project
On July 21, 2022 Caledonia announced that it had signed an agreement (the “Bilboes Agreement”) to purchase Bilboes Gold Limited (“Bilboes Gold”), the parent company which owns, through its Zimbabwe subsidiary, Bilboes Holdings, the Bilboes Project for a total consideration of 5,123,044 Caledonia shares representing approximately 26.8% of Caledonia's fully diluted equity as at today’s date and a 1% net smelter royalty ("NSR") on the Bilboes Project's revenues.
Bilboes is a large, high grade gold deposit located approximately 75 km north of Bulawayo, Zimbabwe. Historically, it has been subject to a limited amount of open pit mining.
The Company understands that the project has produced approximately 291,000 ounces of gold since 1989.
In the fourth quarter of 2022, a small operation was started to mine and process oxide mineralization at Bilboes prior to the declaration of a Subpart 1300 compliant mineral reserve. The oxide mining activities were restarted predominantly with the objective to generate cash flows to pay for the existing cost structures at Bilboes Holdings, the operating company for Bilboes, and this would have an added benefit of reducing the waste-stripping required for the later planned sulphide project. The oxide mine was expected to produce between 12,500 and 17,000 ounces of gold in 2023 at an on-mine cost of between $1,200 and $1,320 per ounce.
On January 6, 2023 Caledonia announced that it had satisfied the conditions precedent to purchase Bilboes Gold. The total consideration was agreed at 5,123,044 Caledonia shares, representing approximately 26.8% of Caledonia's fully diluted equity as at today’s date and a 1% NSR. Following completion of the transaction in January 2023, Caledonia commissioned its own pre-feasibility study to identify the most judicious way to commercialize the Bilboes sulphide project and optimize shareholder returns. One approach that is being considered is a phased development which would minimize the initial capital investment and reduce the need for third party funding.
The target mineralization area (for the oxide mining project) which had been identified using old information obtained from the previous owners (i.e. not the vendors from whom Caledonia purchased the project) was found to have interpreted the oxide / sulphide boundary incorrectly. Mining activity moved to other target areas in the thirdquarter of 2023 where the target oxide mineralization is based on relatively recent drill data for the oxide mineralization. However, the large amount of waste-stripping that needed to be done to access the oxide production areas proved too costly. Accordingly, to prevent further operating losses, the oxide mining activities were placed on care and maintenance at the end of September 2023. Mining activities will exploit remnant oxides once mining production commences for the larger sulphide project with oxides being loaded onto the oxide heap leach pads and suphides fed to the sulphide processing plant. Leaching of ore placed on the heap leach continued in the fourth quarter of 2023 and had no material effect on Caledonia's financial performance. Production and cost guidance for the oxide mining activities was withdrawn in the third quarter of 2023.
Refer to note 5 in the Consolidated Financial Statements for more detail on the Bilboes Gold acquisition and tribute transaction.
On May 15, 2024, 2024, Caledonia announced a Subpart 1300 compliant pre-feasibility study, containing a mineral reserve and mineral resource estimate for the Bilboes Project. The pre-feasibility study, entitled “Bilboes Gold Project Technical Report Summary”, was prepared by DRA Projects (Pty) Ltd with an effective date of December 31, 2023, and is attached as Exhibit 15.6 hereto. We consider the Bilboes Project to be a development stage property for purposes of Subpart 1300, because it contains a Subpart 1300 mineral reserve but does not currently have material mineral extraction.
Motapa-Project
On November 1, 2022 Caledonia acquired from Bulawayo Mining Company Limited (“Bulawayo Mining”) all the shares in Motapa Mining Company UK Limited (“Motapa”), which wholly owns Arraskar Investments (Private) Limited (“Arraskar”), the holder of the registered mining lease over Motapa, for $8.25 million.
Caledonia considers Motapa to be highly prospective and strategically important to its growth ambitions in Zimbabwe in terms of both location and scale. Motapa is a large exploration property which is contiguous to Caledonia’s Bilboes gold project. Motapa was formerly owned and explored by Anglo American Zimbabwe prior to its exit from the Zimbabwean gold sector in the late 1990s and is approximately 75km north of Bulawayo with a mining lease covering approximately 2,200 hectares. Motapa has been mined throughout most of the second half of the 20th century; Caledonia understands that during this period the region produced as much as 300,000 ounces of gold. Whilst none of the mining infrastructure remains, the evidence of historical mining will provide guidance to our exploration team in best understanding the prospectivity of the region.
Caledonia’s exploration activities are focused on Blanket Mine, Motapa and Maligreen. Motapa and Maligreen are exploration stage projects.
Refer to note 18 of the Consolidated Financial Statements for more detail on Motapa.
Maligreen Project
On September 23, 2021, Caledonia announced that it had entered into an agreement to purchase the mining claims over Maligreen, a property situated in the Gweru mining district in the Zimbabwe Midlands, from Pan African Mining (Private) Limited, a privately-owned Zimbabwean company, for a total cash consideration of US$4 million. The transfer of the claims to Caledonia and the payment of the purchase price was completed during the fourth quarter of 2021.
Maligreen is a brownfield gold exploration project situated on the Nkayi-Silobela Greenstone Belt that has historically been exploited via open pit mining. The total land area of Maligreen is approximately 550 hectares comprising two historic open pit mining operations that produced approximately 20,000 ounces of gold mined from oxides between 2000 and 2002 after which the operation was closed.
Significant historical exploration and evaluation work has been conducted on the property over the last 30 years including regional geochemical and geophysical (aeromagnetic and ground) surveys and 5 tonnes of bulk metallurgical test work. A total of 755 holes, of which 113 were diamond holes, have been drilled at the property over a combined 63,463 metres. These were completed in the period 1995 to 2001.
During 2022 the Company completed a re-logging and re-sampling exercise of a representative sample of previously drilled core which have satisfied the QAQC requirements for upgrading the original Inferred Mineral Resources estimate to Measured, Indicated and Inferred Mineral Resources. Future exploration activities may be considered to further understand the strike and depth extension potential and assess the potential for a mining operation.
A Tribute Agreement was in place with Silobela Youth in Mining Syndicate for the Maligreen claims from 1 October 2020 to 30 September 2023, in terms of which Silobela Youth in Mining Syndicate could undertake mining activities over the claims. Silobela Youth in Mining Syndicate was obliged to pay CHZ 5% of the value of minerals mined or a rental amount. The Silobela Youth in Mining Syndicate is currently engaged in renewing the Tribute Agreement
Refer to note 18 of the Consolidated Financial Statements for more detail on Maligreen.
Other Information
There is no assurance that our mineral exploration activities will result in any discoveries of commercial bodies of mineral reserves. The long-term profitability of our operations will, in part, be directly related to the costs and success of our exploration programs, which may be affected by several factors.
There can be no assurance, even when an economic deposit of minerals is located, that any of our property interests can be commercially mined. The exploration and development of mineral deposits involve a high degree of financial risk over a significant period which a combination of careful evaluation, experience and knowledge of management may not eliminate. While the discovery of additional ore-bearing structures may result in substantial rewards, few properties which are explored are ultimately developed into producing mines. Major expenses may be required to establish reserves by drilling and to construct mining and processing facilities at a particular site. It is impossible to ensure that our current exploration programs will result in profitable commercial mining operations. The profitability of our operations will be, in part, directly related to the cost and success of its exploration and development programs which may be affected by several factors. Additional expenditures are required to establish reserves that are sufficient to commercially mine and to construct, complete and install mining and processing facilities in those properties that are actually mined and developed.
Mining Operations
Blanket Mine
On November 3, 2014 Caledonia announced the revised investment plan (“Revised Plan”) and production projections for the Blanket Mine. The objectives of the investment plan were to improve the underground infrastructure and logistics to allow efficient and sustainable production build-up. The infrastructure improvements included the continuation of the No. 6 Winze, the development of a “Tramming Loop” and the sinking of a new 6-meter diameter Central Shaft from surface to 1,080 meters (which was eventually extended to 1,204 meters).
Caledonia’s Board of Directors and Management have completed a review of alternative expansion and diversification plans for Caledonia. Both the Board of Directors and Management have also addressed the revised production projections for the Blanket Mine and the possible benefits of diversifying Caledonia’s production base. Caledonia has concluded its best returns on investment remain at the Blanket Mine in Zimbabwe, which continues to be cash generative.
Exploration at Blanket Mine’s portfolio of satellite properties was suspended in 2016 so that resources could be re-deployed at Blanket. Since then, the Company has evaluated other investment opportunities in Zimbabwe and has concluded that the satellite properties other than GG are unattractive due to their relatively small size, low grade, limited exploration potential, operating complexity and metallurgical incompatibility with the existing Blanket Mine plant. The GG satellite property remains on care and maintenance.
Metallurgical Process
Metallurgical plant – Blanket Mine
The Blanket gold plant established on the Blanket Mine site consists of crushing, milling, carbon-in-leach and batch elution electro-winning circuits. Recoveries in 2023 were 93.8%, the same as in 2022.
The installation of ball mill BM10 and repairs increased the metallurgical production capacity to 2,400 tonnes per day. The increased milling capacity enabled Blanket to increase tonnage milled from 1,976 tonnes per day during June 2022 to 2,379 tonnes per day on August 23, 2022. The record 770,440 tonnes milled for 2023 was 2.4% higher than the 752,033 tonnes milled in 2022.
During the fourth quarter of 2022, Blanket finished construction of a conveyor and crushing system to feed ore from the Central Shaft to a primary crusher from which it will be transported to the metallurgical plant which is located approximately 800 metres away, close to the No. 4 Shaft. The project was commissioned in November 2022.
Safety, Health and Environment
The following safety statistics have been recorded for the year 2023 and the preceding two years.
| Classification |
2021 |
2022 |
2023 |
| Fatal |
- |
1 |
1 |
| Lost time injury |
3 |
4 |
9 |
| Restricted work activity |
6 |
4 |
18 |
| First aid |
1 |
5 |
1 |
| Medical aid |
21 |
12 |
7 |
| Occupational illness |
- |
- |
0 |
| Total |
31 |
26 |
36 |
| Incidents |
62 |
39 |
37 |
| Near misses |
22 |
18 |
19 |
| Disability Injury Frequency Rate |
0.26 |
0.23 |
0.74 |
| Total Injury Frequency Rate |
1.05 |
0.75 |
0.95 |
| Man-hours worked (thousands) |
6,199 |
6,947 |
7,531 |
The number of incidents as reflected in the Total Injury Frequency Rate increased in 2023 compared to 2022 and was similar to 2021. Blanket’s safety performance compares favourably with other deep level underground gold mines; however, management believes the safety performance at Blanket should be seen as a continuous focus area. The Nyanzvi 2 initiative (discussed below) is designed to increase safety awareness and reinforce strict adherence to prescribed safety procedures.
Nyanzvi Initiative
During 2023 102 employees trained on Nyanzvi 2 training. Co-creation training of the engineering leadership comprise 17 section engineers, manager, foremen and charge hands. An engineering pilot team of 11 employees was trained. Team rankings for the best performers for all departments continued in the fourth quarter of 2023.
Sources and Availability of Raw Materials
All of the raw materials the Company requires to carry on its business are available through normal supply or business contracting channels. The Company has not experienced a shortage of availability of raw materials or significant price volatility.
Exchange Controls, Social Investment and Contribution to the Zimbabwean Economy
Exchange control approvals from the RBZ and the Reserve Bank of South Africa are required on the flow of funds in and out of Zimbabwe and South Africa. The Company obtained necessary approvals from both the RBZ and the Reserve Bank of South Africa to transfer foreign currency during the fiscal year ended December 31, 2023.
Additionally, Blanket Mine’s investment in community and social projects which are not directly related to the operation of the mine or the welfare of Blanket Mine’s employees, the payments made to the Community Trust in terms of Blanket Mine’s indigenization, and payments of royalties, taxation and other non-taxation charges to the Zimbabwe government and its agencies are set out in the table below.
| Payments to the Community and the Zimbabwe Government ($’000’s) |
||||||
| Community and Social Investment |
Payments to GCSOT |
Payments to Zimbabwe Government (excl. royalties) |
Royalties |
Total |
||
| Year 2021 |
1,163 |
948 |
16,426 |
6,083 |
24,620 |
|
| Year 2022 |
888 |
1,200 |
12,060 |
7,124 |
21,272 |
|
| Year 2023 |
1,491 |
550 |
11,871 |
7,316 |
21,228 |
|
Community and social responsibility (“CSR”) initiatives fall under seven pillars of education, health, women empowerment and agriculture, environment, charity, youth empowerment and conservation.
The main CSR programme at Blanket relates to the refurbishment of the maternity clinic, the primary and secondary schools, and the youth centre at Sitezi, which is located approximately 17km from Blanket. Activities in respect of this project during 2023 included:
| ● |
Completing renovations of five classrooms, three offices, one computer laboratory, and one science laboratory at Sitezi Secondary School. The renovations included tubing and wiring of electricals and putting up ceilings. Renovation of the secondary school administration block also commenced in the fourth quarter of 2023. |
| ● |
Construction of the waiting mothers’ shelter began and was at slab level by end of the fourth quarter of 2023; completion is expected in the first quarter of 2024. Repairs to the clinic buildings such as doors, windows, painting walls, and roof repairs were also done. |
| ● |
The bulk of materials, such as batteries and other accessories, for the solar plant to supply the clinic, secondary school and primary school with power, was procured in the fourth quarter of 2023 and installation is expected to start in the first quarter of 2024. The solar power will help maintain cold chains for medical supplies and samples at the clinic and provide lighting and energy supply to the clinic and the two schools for powering IT equipment such as computers and interactive boards. |
| ● |
To ensure a secure and stable supply of water for the Gwakwe Garden irrigation scheme, Blanket continued supplying irrigation water to the garden from Smiler shaft. The water augmentation project to connect four boreholes to the garden which began during the second quarter continued in the current quarter. Pipes for the pipeline were laid out, and connection to the national electricity grid was completed in the fourth quarter of 2023. |
| ● |
Work on upgrading the Sabiwa Stadium to meet the requirements of the Zimbabwe Football Association for Division 1/Premier Soccer League stadia in the country continued with the extension of the pitch and running tracks. Material for building changing rooms and ablution facilities was delivered on site with construction set for the first quarter of 2024. The stadium, which had been used exclusively by Sabiwa High School, will cater for footballing activities for the entire local community. |
Blanket undertook road repairs of the old Gwanda Road, patching the potholes on the road which had become a hazard.
Under the conservation pillar, Dambari Wildlife Trust was granted $113,000 to carry out its work on conserving black and white rhinos in the Matopos Hills areas. The last disbursements of the grant were made in the fourth quarter of 2023. Dambari Trust is working with Victoria Falls Wildlife Trust as its subgrantee.
A dividend of $550,000 was paid to the Community Trust in 2023 and $450,000 in March, 2024. GCSOT has a 10% shareholding in Blanket, donated by Caledonia.
General Comments
Caledonia’s activities are centered on Zimbabwe and occur year-round. Caledonia is not dependent, to any material extent, on patents, licenses, contracts, specialized equipment or new manufacturing processes at this time. However, there may be occasions that Caledonia may wish to adopt such patents, licenses, specialized equipment, etc. if these are economically beneficial to its operations. All mining and exploration activities are conducted under the various economic, mining and environmental regulations of the country where the operations are being carried out. It is always Caledonia’s standard that these regulations are complied with by Blanket Mine. Caledonia has not experienced a shortage of availability of raw materials or significant price volatility.
Refer to note 4(b)(i) of the Consolidated Financial Statements and Item 3.D – “Risk Factors”, under the subheading “We do business in countries and jurisdictions outside of the United States where different economic, cultural, regulatory, monetary and political environments could adversely impact our business, results of operations and financial condition” where the material effects of government regulations of the Company’s business are disclosed.
Investors should recognize that Blanket’s ability to implement its investment plans at its properties and interests and Caledonia’s ability to sustain its operations outside Zimbabwe and pay future dividends depends, inter alia, on the ability to externalize cash from Zimbabwe.
Revenue from the sale of precious metals is recognized when the unrefined metal is accepted at the refinery (“Local lodgment date”) by Fidelity, except for the portion earmarked for export to a refiner outside of Zimbabwe. Control is transferred and the receipt of proceeds is substantially assured at point of delivery at the end refiner with the responsibility to pay. Revenue for each delivery to Fidelity is measured at the LBMA price post-delivery less 1.25% and the quantities are determined on Local lodgment date. On average, settlement occurs within 14 days of delivery from Fidelity and within 2 days from AEG.
A portion of unrefined metals produced by Blanket is exported by Caledonia to AEG, an accredited Dubai Good Delivery refinery, which makes payment to Caledonia's bank account in Zimbabwe in USD. The exported unrefined gold continues to be processed at Fidelity, a subsidiary of the RBZ, on a toll-treatment basis, in accordance with requirements of the Zimbabwe government for in-country refining and to allow the Zimbabwe authorities full visibility over the gold produced and exported by Caledonia. The resultant gold is exported under the gold dealing license that is held by Fidelity to a refinery outside Zimbabwe (i.e. AEG) which undertakes the final refining process. Caledonia receives the proceeds of the gold which it exports in its bank account in Zimbabwe within a few days of delivery to the final refiner. This arrangement in respect of production from Blanket complies with the current requirements to pay a 5% royalty on gold sales and 1.25% of gross sales which is payable to the Zimbabwean Government and deducted from USD and RTGS$ or ZiG revenues proportionately. The retention threshold remained unchanged after the introduction of the ZiG.
For deliveries exported and for deliveries that are paid by Fidelity, Blanket continues to receive 75% of its revenues in US Dollars and the balance in local currency. Revenue for the unrefined metals exported to a refiner outside Zimbabwe from the sale of precious metals is recognized when the refiner outside of Zimbabwe receives the unrefined metals (“Export lodgment date”). Control is transferred and the receipt of proceeds is substantially assured at the point of delivery. Export lodgment date revenue for each delivery is measured at the LBMA price post-delivery less a refining fee and the quantities are determined on Export lodgment date. On average settlement occurs within two days of delivery.
Revenue from the sale of precious metals at Bilboes is recognized on the Local lodgment date by Fidelity. Control is transferred and the receipt of proceeds is substantially assured at point of delivery at the end refiner with the responsibility to pay. Revenue for each delivery to Fidelity is measured at the LBMA price post-delivery less 1.25% and the quantities are determined on Local lodgment date. Part of the Bilboes revenue during the year was recognized from sales to Fidelity as a “small-scale producer”, measured at the previous day’s 6pm LBMA price less a 5% discount. The revenue was received 100% in USD and settlement occurred immediately after depositing of the bullion.
The Company has the following organizational structure as at April 26, 2024:
D. Property, Plant and Equipment and Exploration and evaluation assets
Overview
The Company is engaged in the exploration, development and production of gold and other precious metals from its mineral properties. The Company’s four material mineral properties, all located in Zimbabwe, are:
| ● |
the production stage Blanket Mine (64% interest); |
| ● |
the exploration stage Maligreen project (100% interest); |
| ● |
the development stage (sulphides) at Bilboes Project (100% interest), at which minor oxide gold production occurred during the period; and |
| ● |
the exploration stage Motapa (100% interest). |
The Blanket Mine and its satellite operations are located in the Matabeleland South province, the Maligreen project is located in the Midlands province and Motapa and the Bilboes is in the Bulawayo province as illustrated below.
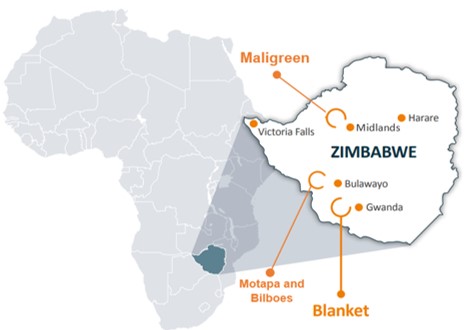
The Company does not have interests in any other mineral properties, following the disposition of the Company’s interests in Connemara North, Glen Hume, Eagle Vulture, Mascot and Penzance, and Eersteling.
Certain of the information set forth in this annual report is derived from the following:
| ● |
For the Blanket Mine, the Subpart 1300 pre-feasibility study entitled “S-K 1300 Technical Report Summary on the Blanket Gold Mine, Zimbabwe”, with an effective date of December 31, 2023, prepared by Qualified Persons Mr. Craig Harvey and Mr. Marthinus van Staden. Refer to Exhibit 15.4 and Exhibit 15.8 in this report; and |
| ● |
For the Maligreen project, the Subpart 1300 initial assessment entitled “S-K 1300 Technical Report Summary on the Maligreen Gold Project, Zimbabwe”, with an effective date of December 31, 2022, prepared by Qualified Person Mr. Uwe Engelmann. Refer to Exhibit 15.5 in this report. |
| ● |
For the Bilboes Project the Subpart 1300 pre-feasibility study entitled “Bilboes Gold Project Technical Report Summary”, with an effective date of December 31, 2023, prepared by Qualified Person DRA Projects (Pty) Ltd. Refer to Exhibit 15.6 in this report. |
Mr. Craig Harvey and Mr. Marthinus van Staden, have been full-time employees of the Company as from 1 March 2023 and November 1, 2021 respectively. Mr. Engelmann is not an employee of the Company. Mr. Engelmann is employed by Minxcon (Pty) Ltd. None of Mr. Engelmann or DRA Projects (Pty) Ltd is affiliated with Caledonia or another entity that has an ownership, royalty or other interest in the property that is the subject of the respective technical report summary.
Three Year Production History
The Blanket Mine is the Company’s only property with current mineral extraction. Minor oxide extraction occurred at Bilboes in 2023. The Bilboes oxide extraction was curtailed during 2023 favor of focusing on the larger sulphide feasibilty study. Aggregate annual production information for our properties for the years ended December 31, 2023, 2022 and 2021 is provided below on a 100% project basis, rather than an attributable basis.
| Property |
Ounces produced |
||
| 2023 |
2022 |
2021 |
|
| Blanket |
75,416 |
80,775 |
67,476 |
| Bilboes |
3,050 |
- |
- |
| Total |
78,466 |
80,775 |
67,476 |
Mineral Resources
Mineral resources are stated as exclusive of mineral reserves and as attributed values. Ordinary kriging and inverse distance estimation methodology was employed and confined to the property boundaries to which we have legal rights to explore and mine.
The Blanket Mine mineral resources occur as underground resources and estimates have been depleted for mining. Measured, indicated and inferred mineral resources are declared due to the continuity of the geology and grade as well as a history of proven historical mining. The inferred mineral resources show geological continuity, while grade continuity requires improvement through additional drilling. A cut-off of 1.5 g/t was utilized for Blanket Mine based on an average real term gold price of US$2,150/oz based on a 10-to-15 year view for precious metals. Geological losses of 2.5% were applied to the Blanket Mine measured mineral resources, while a 5% loss was applied to the indicated mineral resource and 10% to the inferred mineral resource category.
There has been no change year on year for the mineral resources at Maligreen. All mineral resources are reported at surface (all mineral resources <220 m from surface) and underground (>220 m from surface). The mineral resources have been depleted by means of topography and mining voids. Following confirmatory re-logging and re-sampling of historical core along with the robust geological mode, the data previous inferred mineral resources can now be declared as a measured, indicated and inferred mineral resources. A cut-off of 0.4 g/t was applied to the surface resources, while a cut-off of 1.5 g/t was applied to the underground portion based on a gold price of US$1,800/oz based on a 10-to-15 year view for precious metals. Discounts applied to the mineral resources include geological losses of 5% for measured, 10% for indicated and 15% for inferred mineral resources to account for geological, data and estimation uncertainty.
The Bilboes Mine mineral resources occur as surface resources constrained by an optimised open pit shell at a fixed gold price of US$2,400/oz in order to eliminate possible future sterlization of mineral resources due placement of surface infrastructure. All estimates have been depleted for mining and current topographical surface. Measured, indicated and inferred mineral resources are declared due to the continuity of the geology and grade as well as a history of proven historical mining. A cut-off of 0.9 g/t was utilized for Bilboes based on a gold price of US$2,400/ oz. Geological losses of 5% were applied to the measured, indicated and inferred mineral resources..
|
|
December 31, 2023 |
|||||||
| In Situ Mineral Resources Exclusive of Mineral Reserves | Tonnes |
Grade |
Gold |
|||||
| (Mt) |
(g/t) |
(koz) |
||||||
| Zimbabwe |
Blanket Mine |
Measured |
2.70 |
3.72 |
323 |
|||
|
|
Underground |
Indicated |
2.73 |
3.23 |
283 |
|||
|
|
(64% attributable) |
Measured + Indicated |
5.43 |
3.47 |
606 |
|||
|
|
|
Inferred |
5.65 |
3.74 |
679 |
|||
|
|
Maligreen |
Measured |
1.65 |
2.38 |
126 |
|||
|
|
Surface |
Indicated |
6.29 |
1.53 |
310 |
|||
|
|
(100% attributable) |
Measured + Indicated |
7.94 |
1.70 |
434 |
|||
|
|
|
Inferred |
4.58 |
1.55 |
229 |
|||
|
|
Maligreen |
Measured |
- |
- |
- |
|||
|
|
Underground |
Indicated |
0.09 |
2.76 |
8 |
|||
|
|
(100% attributable) |
Measured + Indicated |
0.09 |
2.89 |
8 |
|||
|
|
|
Inferred |
1.59 |
3.75 |
192 |
|||
| Bilboes |
Measured |
0.24 |
1.85 |
14 |
||||
| Surface |
Indicated |
8.48 |
1.79 |
488 |
||||
| (100% attributable) |
Measured + Indicated |
8.72 |
1.79 |
502 |
||||
| Inferred |
9.12 |
1.91 |
560 |
|||||
| Total Measured |
4.59 |
3.13 |
463 |
|||||
| Total Indicated |
17.59 |
1.93 |
1 089 |
|||||
| Total Measured + Indicated |
22.18 |
2.18 |
1 552 |
|||||
| Total Inferred |
20.94 |
2.47 |
1 660 |
|||||
| Grand total |
43.11 |
2.32 |
3 212 |
|||||
Mineral Reserves
Mineral Reserves are stated as fully diluted, delivered to the processing plant and are backed by detailed planning such as a Life of Mine plan. Only Measured and Indicated Mineral Resources have been converted to Mineral Reserves.
At Blanket Mine, the Mineral Reserve is based on a discounted cash flow analysis, the result of which is positive over an eleven year period until 2034 and utilises only Measured and Indicated Mineral Resources. The gold price is based on commodity forecasts from a number of institutions and the average gold price over the eleven year life of mine is $1,877 per ounce. The first three years gold price is derived from the median forecast of various institutions and ends in a long term gold price of US$1,731/oz. Mineral Reserves are stated at a cut-off grade of 2.10 g/t. Production costs utilise the production history from the mine together with required capital expenditure to execute the life of mine plan. All mineral reserves at Blanket mine are from underground sources.
At Bilboes, the Mineral Reserve is based on an independent economic analysis conducted by external consultants. A production plan has been executed using a Whittle analysis with a long term gold price of $1,800 per ounce, based on a 24-month (2022-2023) trailing average gold price of US$ 1,875/oz, at a cut-off grade of 0.9 g/t. All mineral reserves from Bilboes are declared as surface reserves derived from open pit mining.
| Diluted Mineral Reserves (delivered to plant)
|
December 31, 2023 |
|||
| Tonnes (Mt) |
Grade |
Gold |
||
| Zimbabwe |
Blanket Mine |
|||
| Proven |
1.36 |
3.21 |
141 |
|
|
|
Underground Probable (64% attributable) |
3.56 |
3.31 |
379 |
|
|
Proven + Probable |
4.92 |
3.29 |
519 |
| Bilboes |
||||
| Proven |
5.90 |
2.42 |
455 |
|
| Surface Probable (100% attributable) |
19.10 |
2.31 |
1 418 |
|
| Proven + Probable |
24.90 |
2.34 |
1 873 |
|
| Total Proven |
7.26 |
2.55 |
596 |
|
| Total Probable |
22.66 |
2.47 |
1 797 |
|
| Total Proven + Probable |
29.82 |
2.50 |
2 392 |
|
Regional Geological Setting
Zimbabwe’s known gold mineralization occurs in host rocks of the Zimbabwe Craton, which is made up of Archaean rocks. The geology of the Craton is characterized by deformed and metamorphosed rocks which include high-grade metamorphic rocks, gneisses, older granitoids, greenstone belts, intrusive complexes, younger granites and the Great Dyke. The Chingezi gneiss, Mashaba tonalite and Shabani gneiss form part of a variety of tonalities and gneisses of varying ages. Three major sequences of slightly younger gold-bearing greenstone belt supracrustal rocks exist:
| ● |
Older greenstones called the Sebakwian Group, which are mostly metamorphosed to amphibolite facies. They comprise komatiitic and basaltic volcanic rocks, some banded iron formation (“BIF”), as well as clastic sediments. |
| ● |
The Lower Bulawayan Group, which comprises basalts, high-Mg basalts, felsic volcanic rocks and mixed chemical and clastic sediments. The Lower Bulawayan Group forms the Belingwe (Mberengwa) greenstones. |
| ● |
The Upper Bulawayan (upper greenstones) and Shamvaian groups, which comprise a succession of sedimentary and komatiitic to tholeiitic to calc-alkaline rocks. |
Three metamorphic belts surround the Zimbabwe Craton:
| ● |
Archaean Limpopo Mobile Belt to the south; |
| ● |
Magondi Mobile Belt on the north-western margin of the Craton; and |
| ● |
Zambezi Mobile Belt to the north and northeast of the Zimbabwe Craton. |
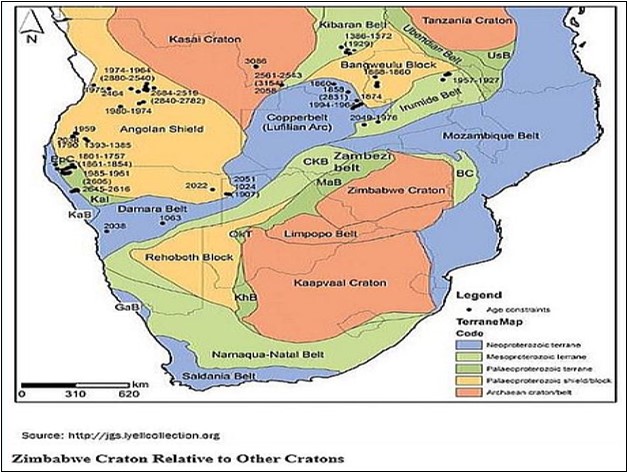
Material Properties
Blanket Mine
Property Description and Ownership
The Blanket Mine is an operating underground gold mine situated on the Gwanda Greenstone Belt (“GGB”) targeting shear zone hosted gold mineralization. The Mine complex comprises a cluster of mines extending from Lima in the north, through Eroica, Sheet, AR Main, AR South, the currently defunct Feudal, Blanket Section (Blanket 1 to Blanket 6) and Jethro over a total strike length of some 3 km. Gold has been commercially mined at the project area from several closely-spaced orebodies defining a mineralized trend via several shafts since the early 1900s. The Mine covers the operating claims of Jethro, Blanket, Feudal, Harvard, Mbudzane Rock, Oqueil, Sabiwa, Sheet, Eroica and Lima, largely encompassed in a 2,120ha Mining Lease. Ore is processed at an on-site plant. As at December 31, 2023 the net assets of Blanket Mine is $200 million. Refer to note 28 of the Consolidated Financial Statements.
The Company indirectly owns 64% of the shares of Blanket Mine, the operator of which is Blanket Mine (1983) (Private) Limited, after the purchase of Fremiro’s 15% shareholding became effective in January of 2020. The Blanket Mine is fully equipped with all the necessary plant and equipment to conduct mining operations and the production of gold from the ore mined from the mine.
As illustrated below, the Mine is located in the southwest of Zimbabwe, approximately 15 km northwest of Gwanda, the provincial capital of Matabeleland South. Gwanda is located 120 km southeast of Bulawayo, 200 km northwest of the Beitbridge Border post with South Africa, and 560 km from Harare, Zimbabwe's capital city. The Mine is centered on the coordinates (WGS84 system) 20°52' S, 28°54' E.
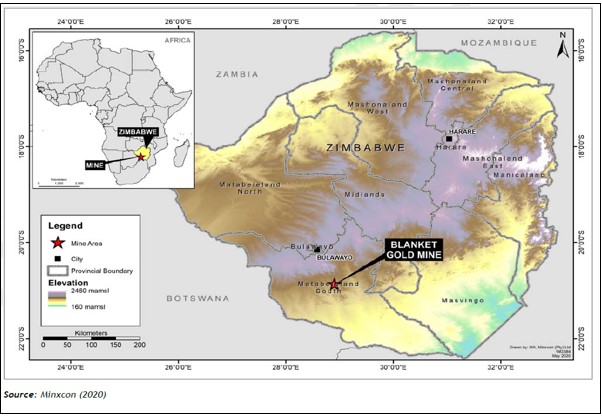
The table below indicates the aggregate annual production from Blanket in the last three fiscal years on a 100% project basis:
| Blanket Production Statistics |
||||
| Year |
Tonnes Milled (t) |
Gold Head (Feed) Grade (g/t Au) |
Gold Recovery (%) |
Gold Produced (oz) |
| 2021 |
665,628 |
3.36 |
93.9 |
67,476 |
| 2022 |
752,033 |
3.56 |
93.8 |
80,775 |
| 2023 |
770,440 |
3.25 |
93.8 |
75,416 |
The table below indicates the aggregate annual production from Blanket in the last three fiscal years on a 64% attributable project basis:
| Blanket Production Statistics |
||||
| Year |
Tonnes Milled (t) |
Gold Head (Feed) Grade (g/t Au) |
Gold Recovery (%) |
Gold Produced (oz) |
| 2021 |
426,002 |
3.36 |
93.9 |
43,179 |
| 2022 |
481,301 |
3.56 |
93.8 |
51,696 |
| 2023 |
493,082 |
3.25 |
93.8 |
48,266 |
Blanket Mine employs two mining methods that are well suited to the nature of the mineral deposits. The extreme variation within the Blanket Mine mineral deposits necessitates modification of the exact mining methods that suit the specific characteristics of each deposit. The general practice on the mine is to implement one of two tailored mining methods, determined mainly by the width of the mineral deposit.
The two mining methods utilised are:
| ● |
Long-hole stoping in wider mineral deposits (orebody widths generally more than 3 m); and |
| ● |
Underhand stoping in narrow mineral deposits (orebody widths generally less than 3 m). |
The planned thrust in development is aimed at opening up ground below 750 m Level which will be the primary production areas, as well as create the necessary exploration drilling platforms. In the Lima, ARS, Blanket and Blanket Feudal areas some mining activities will take place above 750 m Level.
Infrastructure at Blanket Mine as well as power and water supply are well-established infrastructure to support and sustain mining and processing operations. To date, in excess of 1 million ounces of gold have been produced from the property.
The Blanket Gold Plant established on the Blanket Mine site consists of crushing, milling, carbon-in-leach and batch elution electro-winning circuits. The plant treats an average of 62,000 tonnes per month at a recovery of approximately 94%. The recovery performance is expected to continue, while the processing rate could be increased once planned milling upgrade has been completed. Construction of phase 1A of a new tailings storage facility was completed in 2024, with a design to ensure international best practice is met whilst enabling uninterrupted production.
For a detailed breakdown of the property, plant and equipment and encumbrances thereon refer to note 17 of the Consolidated Financial Statements. The property, plant and equipment of the Group is predominantly held in Zimbabwe and the continued implementation of the investment plan is expected to increase the property, plant and equipment of the Group. Refer to note 18 of the Consolidated Financial Statements for a detailed breakdown on the exploration and evaluation properties of the Company and encumbrances thereon, as well as Item 4.A - “History and Development of the Company”.
The issuing and control of mineral rights in Zimbabwe is regulated by the Mines and Minerals Act (Chapter 21:05) of 1961 (“MMA”), administered by the Mining Commissioner of the regional mining district. The mineral resources are vested in the State through the President of Zimbabwe.
The Government of Zimbabwe does not participate in managing the projects of local or foreign firms in the private sector. Presently, government participation in mining is through Zimbabwe Mining Development Corporation (“ZMDC”) and through the Minerals Marketing Corporation of Zimbabwe (“MMCZ”). The ZMDC was formed in 1982 for government to participate in the mining sector and to save companies that were being threatened to close. It is active in exploration, mining and giving assistance to cooperatives and small-scale miners. The MMCZ was formed in 1992 and is responsible for marketing all the country's minerals and metal products except gold and silver which are sold through the Reserve Bank. It finances its operations by a commission charge of 0.875% on sales conducted for its clients.
In Zimbabwe, mining and mine development may be conducted with a mining claim, mining lease, special mining lease and special grant. A mining claim covers a small area, thus usually several claims are grouped to form a block of claims. The claim confers on the holder the exclusive right to mine the mineral resource for which the claim was registered. Mining claims are dependent on the claim holder applying to the Mining Commissioner for and obtaining an inspection certificate on an annual basis; failure to do so may result in the forfeiture of the relevant claim. A block of claims may be transformed into a mining lease for simplicity of administration.
The Blanket Mine's interests in Zimbabwe include a mining lease, operating claims (i.e., on-mine), non-operating claims and a portfolio of brownfields exploration projects (satellite projects). Blanket Mine operates under a mining lease issued by the Mining Affairs Board of Zimbabwe with registered number 40 (“ML40”) which was issued under the MMA to Blanket Mine (1983) (Private) Ltd, a 64% held indirect subsidiary of the Company, on May 24, 2019 and is annually renewed. The mine’s claims under the lease cover an area of 2,120 ha.
A copy of ML40 is attached hereto as Exhibit 4.9.
Blanket Mine also has several registered claims, not incorporated under the lease. The 90 claims contiguous to the mining lease comprise a total area of approximately 998 ha. In addition, Blanket Mine holds several non-operating claims located away from ML40 and the adjoining claims described above, that form a portion of the Gwanda portfolio. These non-producing claims (satellite projects) consist of 184 blocks of registered base metal (Ni, Cu and As) and precious metal claims covering a total area of 2,433 ha. A number of claims are subject to active tribute agreements between the Mine and local small scale miners as part of the CSR.
History
The Blanket Mine is part of the Sabiwa group of mines within the Gwanda Greenstone Belt from which gold was first extracted in the 19th century. The Blanket Mine is a cluster of mines extending some 3 km from Jethro in the south through Blanket itself, Feudal, AR South, AR Main, Sheet, and Eroica, to Lima in the north. Blanket Mine has produced over a million ounces of gold during its lifetime.
Following sporadic artisanal working, the Blanket Mine was acquired in 1904 by the Matabele Reefs and Estate Company. Mining and metallurgical operations commenced in 1906 and between then and 1911, 128,000 t were mined. From 1912 to 1916 mining was conducted by the Forbes Rhodesia Syndicate who achieved 23,000 t. There are no reliable records of mining for the period between 1917 and 1941 and it is possible that operations were adversely affected by political instability during World Wars I and II. In 1941 F.D.A. Payne produced some 214,000 t before selling the property to Falconbridge in 1964 (Blanket Mine, 2009). Under Falconbridge, production increased to 45 kg per month and the property yielded some 4 Mt of ore up until September 1993. Kinross Gold Corporation (“Kinross”) then took over the property and constructed a larger Carbon-in-Leach plant with a capacity of 3,800 tpd. This was designed to treat both run of mine (“RoM”) ore and an old tailings dump.
The Blanket Mine is currently 64% indirectly owned and operated by Caledonia, which initially completed the purchase of the mine from Kinross on 1 April 2006. The Blanket Mine re-started production in April 2009 after a temporary shut-down due to the economic difficulties in Zimbabwe.
Present Condition and Infrastructure
The Blanket Mine consists of a series of small shafts providing access to the underground workings of the various orebodies that are being mined. The main access and draw points are accessed by the shafts indicated in the table below.
| Name |
Description |
| Jethro Shaft |
The shaft has dimensions of 3 m x 2 m and is mainly utilised for the transport of men and material from surface to 7 Level. The shaft is equipped with a single drum winder with a 22 mm rope and capacity of 10 men. |
| 5 Winze (Sub-Shaft) |
5 Winze has dimensions of 3 m x 2 m and is a sub-shaft and is mainly used to transport men and materials between 7 Level and 22 Level. This shaft is similarly to Jethro shaft equipped with a single drum winder with a 20 mm rope and a capacity of 10 men. |
| 6 Winze (Sub-Shaft) |
6 Winze has dimensions of 3 m diameter and is a sub-shaft used mainly for the hoisting of ore from 26 Level to 22 Level from where ore is transported to No. 4 Shaft for hoisting to surface. This shaft is equipped with a 112 kW single drum winder with a 24 mm rope and a capacity of 3 t per skip or 500 tpd. At the bottom of 6 Winze shaft is a 12kW spillage pump. |
| Blanket Shaft (No. 4 Shaft) |
No. 4 Shaft was historically the main production shaft of Blanket Mine. No. 4 Shaft has dimensions of 4 m x 2 m with two compartments. This shaft is mainly used for the hoisting of ore and waste rock from 22 Level to surface. The shaft is equipped with a 560kW thyristor driven double drum winder with a 34 mm rope and capacity of 5t per skip or 2,000 tpd. |
| Central Shaft |
The new CMS is not lined and has a four-compartment, 6 m diameter layout, equipped with a 2 x 3,132 kW double-drum winders, one rock and the other men and material. The shaft is used as the main route for the transport of men, material, and rock.
The shaft reaches a depth of 1,201.3 meters. The man compartment has a double deck and can transport 40 persons per deck. |
The Blanket Mine is an underground mine in the production stage, and a number of expansion projects have either been completed or are planned for the Blanket mining operations in order to increase production. The majority of the expansion projects will consist of the below 750 m Level (22 Level) expansion projects.
The first project included the sinking and construction of the Central Shaft in-between the AR Main and AR South/ Blanket orebodies from surface to 1,204 m (just above 38 Level) and its associated infrastructure. Sinking and equipping of the shaft, the associated ore pass system and loading station development have all been completed. Currently the water handling system is being finalized..
Further projects include the development of various decline shaft infrastructure targeting specific mining areas in order to increase production.
Surface infrastructure comprises mine offices, change houses, mine headgears, workshops, storerooms, a processing plant, hospital, tailings facility and an assay laboratory. Production shafts on surface consist of the No. 4 Shaft and the Jethro Shaft. Sub-shaft infrastructure in the form of the No 5 Winze connects Jethro to the underground workings. Other shafts and raise bore holes on surface, primarily used for ventilation purposes, include Lima, Eroica and Sheet. A total of 11 hoists are installed at the mine, three of which are used for ore handling (No. 2 incline shaft, the sub-vertical shaft and 6 Winze shaft).
The existing infrastructure at Blanket will be utilized in parallel with new infrastructure which is specifically aimed at targeting the below 22 Level mining areas. The extensions entailed the sinking of the Central Shaft from surface down to 1,201.3 m (just above 38 Level). 6 Winze sub-shaft located close to 5 Winze sub-shaft is used to access the Blanket complex below 22 Level and will provide secondary access to the Central Shaft.
The Central Shaft is not lined and has a four-compartment, 6 m diameter layout, equipped with 2 x 3,142 kW double-drum winders, one for rock and the other for men and material.
On surface, a 1050 mm wide, 152 m long overland ore conveyor will transport the hoisted rock at CMS to the primary crusher and then to an ore dump.
Additional supporting surface infrastructure will include shaft offices, change rooms, lamp rooms, etc. New housing for both senior and junior staff is also planned in anticipation of the increased production profile.
A TSF is also located near the project area. The labour force and their families reside within a kilometre of the mine in accommodation provided by the mine.
Underground drilling is conducted with Seco 23, Seco 25, Seco 215 rock drills and Seco 36 (Konkola) drifters. The rock drills are used mainly for development and the drifters for production, i.e. long-hole drilling.
Similar to the underground rail-bound fleet, the same mining equipment utilized at the operational sections of Blanket Mine will be utilized once the expansion projects of the Central Shaft have been completed with some additional quantities to allow for the planned increase in production.
ZESA supplies power to Blanket Mine from their main Eagle Vulture 132KV/33KV substation about 17km out of Gwanda. The main supplies are the 33 kV and the 11 kV overhead lines. The 33 kV supply feeds Lima, Reclamation, the main substation at No. 4 Shaft (and adjacent to the processing plant) and Central Shaft and New Compressors. The 11 kV supply feeds slimes dam, Smiler shaft and the village. The 11 kV is further transformed to 550 V supply at Smiler and at Slimes dam. The ZESA power allocation to No. 4 Shaft, Central Shaft, Jethro Shaft, 5 Winze and 6 Winze Complex is 18MVA with a current nominal maximum demand (“NMD”) of 18MVA. An additional (Mtshabezi line) feeder is installed with a current nominal maximum demand (“NMD”) of 7 MVA.
Blanket Mine has investigated and approved the option of employing a solar power plant to supplement existing power supply to the Blanket Mine. The solar plant was installed and commissioned in February 2023. The solar plant supplies 12 MW AC to the Blanket Mine power supply during daytime.
Blanket also has 4 x 2.5 MVA generators at No. 4 Shaft with total installed capacity of 10 MVA. Additional standalone diesel generators with suitable switchgear, transformers, and controls were also installed at CMS to ensure that the mine can stay operational during power interruptions. This additional installation has a total installed capacity of 8 MVA. Total installed generator capacity at Blanket is 18 MVA
The following initiatives have been implemented or are planned to alleviate the power issues:
| ● |
Increased Blanket’s diesel generating capacity to 18MW of installed capacity which was sufficient to maintain all operations and capital projects but only on a stand-by basis. |
| ● |
On the incoming ZESA supply line at the No. 4 Shaft, Blanket installed two 10MVA auto tap transformers to protect equipment at No. 4 Shaft and the main metallurgical plant from voltage fluctuations on the incoming grid supply. Following the installation of these transformers, Blanket has used less diesel in the production of gold. |
| ● |
On the incoming ZESA supply line at the Central Shaft, two 10MVA autotap transformers were installed in the fourth quarter of 2022 at a cost of $0.9 million. This installation reduced the voltage fluctuations and reduced the power cost and diesel usage allocated to capital projects during the fourth quarter of 2023 and thereafter should reduce operational expenditure when the Central Shaft starts to hoist ore. |
| ● |
Caledonia’s 12.2 MWac solar plant, fully commissioned early February 2023, provides approximately 27% of Blanket’s average daily electricity demand. The plant has been providing power to Blanket from its initial connection to the Blanket grid in November 2022. The project was completed at a cost of $14.2 million in 2023 (including construction costs and other project planning, structuring, funding and administration costs). |
| ● |
Management is in discussion with the Zimbabwean power utility to obtain an improved supply of electricity. This may include an additional supply line that will result in fewer outages and a power supply that has a higher power factor. Blanket may potentially pay a different KWh rate for this supply line. At the date of approval of this document no agreement with ZESA had been concluded. Management continues to engage with the Intensive Energy User Group regarding the import of electricity from power producers in Zambia and Mozambique and for this power to be wheeled via the Zimbabwe grid to Blanket. If these discussions are successful, it is expected that Blanket’s continuity of electricity supply will improve. |
The district is serviced by telecommunication services, and Blanket provides its own Wi-Fi and communication systems.
The A6 highway, forming part of the Trans-African Highway network, is orientated roughly northwest-southeast and links Bulawayo with the Beitbridge border post and Musina in South Africa. The highway runs through the town of Gwanda. A major sealed road, the Old Gwanda Road, branches off from the A6 in Gwanda and runs directly through the ML 40 area to Bulawayo. Blanket’s mining claims are all located along these major roads and are thus easily accessible. The roads are sealed and although potholing is frequent, the surfaces are navigable by all vehicles. The Beitbridge Bulawayo Railway runs roughly parallel to the A6 through Gwanda Town.
An airstrip and informal airport building are located in Gwanda along the A6. The Joshua Mqabuko Nkomo International Airport is located in Bulawayo. The mine can be accessed either via the Beitbridge-Bulawayo road, or by flying into Bulawayo and driving two hours via the Old Gwanda Road or the A6 to the site.
Permitting, Licenses and Encumbrances
The mine is compliant in terms of authorizations and adheres to all government protocols and regulations as required.
Water for the operations is sourced from the Blanket Dam that is situated on the Mtshabezi River and owned by the Zimbabwe National Water Authority (“ZINWA”). The use of this water is authorized through a contract agreement between Blanket Mine and ZINWA in terms of the Zimbabwe National Water Authority Act (Chapter 20:251).
The agreement is valid for one-year periods and is renewed annually. ZINWA sends the renewable agreement for signing to Blanket on an annual basis. Blanket continues to extract water in at a rate of USD $0.17/m3.
In accordance with paragraph 178(2)(a)(b)(c) of the MMA, the owners of claims possess the right to use of any surface within the boundaries for all necessary mining purposes; the right to use, free of charge, soil, waste rock or indigenous grass situated within the claims boundaries for all necessary mining purposes; and the right to sell or dispose of recovered waste rock. The MMA Amendment Bill makes instruction for landowner compensation in case of land loss due to mining activities in the form of land reallocation or outright purchase. The activities of the Company have not triggered this compensation.
The Indigenization and Economic Empowerment Act, which was enacted in 2007, required that 51% of the equity of all commercial enterprises in Zimbabwe must be owned by indigenous Zimbabweans. Following the implementation of indigenization, Caledonia received the Certificate of Compliance from the Government of Zimbabwe which confirmed that Blanket was fully compliant with the Indigenization and Economic Empowerment Act. The requirement for gold mining companies to be indigenized was removed by a change in legislation with effect from March 2018. A 36% share of Blanket is currently held by indigenous parties.
In Zimbabwean mining legislation, an Environmental Impact Assessment (“EIA”) is not required in order to issue a mining license, and in terms of the EM Act and its First Schedule is only required prior to commencement of mining and forms part of the planning process. Blanket Mine was established in the early 1900s, long prior to the implementation of governing mining and environmental laws. As such, it appears that an EIA is not required for the Blanket Mine. However, the Company is in constant communication with the Environmental Management Agency (“EMA”) regarding environmental permitting requirements and an EIA was completed for the Mine in 1995. Should the EMA communicate that an EIA certificate for the Mine be obtained, the Company will submit all relevant and associated applications to obtain such and remain fully compliant.
Blanket Mine holds EIA certificates as issued by the EMA for the solar plant, both the old and new TSFs. The new TSF is currently operating under the authorisation granted through the approval of the Environmental Impact Assessment, and a licence will be issued by the Zimbabwean EMA.
In order for operations to continue, the EMA has issued a number of additional environmental licences to Blanket as listed in the table below. The certificates are valid for 1 year and renewed annually. Applications for hazardous waste generation (oils, chemicals, etc.) licences have been submitted and are pending EMA review. New environmental disturbances will require additional permits further to those listed below, and currently no further disturbances have been identified.
Environmental Permits
In order for operations to continue, the EMA has issued a number of additional environmental licences to Blanket, including:
| ● |
five for air emissions (clinic incinerator, blacksmith shop, laboratory, smelter house and power plant generators); |
| ● |
four for solid waste (landfill and tailings); |
| ● |
three for effluent disposal (sewerage and car wash bay); |
| ● |
three for hazardous substances (importation, transportation and storage); and |
| ● |
one for hazardous waste generation (oils and clinical waste). |
Geological Setting, Mineralization and Deposit
The Blanket Mine is situated on the north-western limb of the Archaean Gwanda Greenstone Belt. Several other gold deposits are situated along the same general strike as the mine. Approximately 268 mines operated in this greenstone belt at one stage; however, the Blanket Mine is one of the few remaining operational mines. At Blanket Mine, the rock units strike north−south, and generally dip steeply to the west.
The local geology consists of the Felsic Unit made up of, largely, quartz and quartz-sericite schists overlain by the Mafic Unit. The lower zone of the Mafic Unit comprises ultramafic and banded iron formations which host the orebodies of the Vubachikwe mine, that is located south of Blanket Mine. The upper zone of the Mafic Unit is made up of massive to pillowed basaltic lavas with intercalations of interflow sediments now showing as cherty argillites (locally commonly referred to as Black Markers) and this hosts the Blanket Mine complex orebodies. The Blanket Mine orebodies are in an orogenic setting with hydrothermal mineralization hosted in selected shears of country basaltic metavolcanics. This package is intruded by a younger and seemingly barren olivine-gabbro sheet. The sequence is capped by an Intermediate Unit comprising andesitic lavas with amphibole feldspar schists.
The generalized stratigraphic column for the area is shown below.
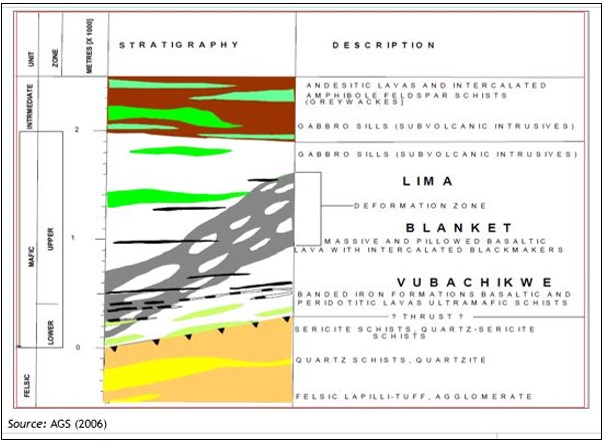
The Blanket Mine complex orebodies together with those of the Vubachikwe complex comprise the north-western Mining Camp, also called the Sabiwa group of mines. Blanket Mine complex is a cluster of deposits that extend from Jethro in the south, through Blanket Mine, Feudal, AR South, AR Main, Sheet, Eroica and Lima to the north.
The local geology at Blanket Mine is depicted below including the infrastructure locations.
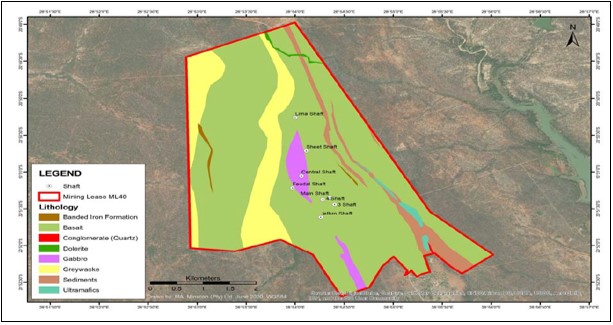
The Long Section of Blanket Mine showing Stopes, Drives, Haulages and Shafts is shown below.
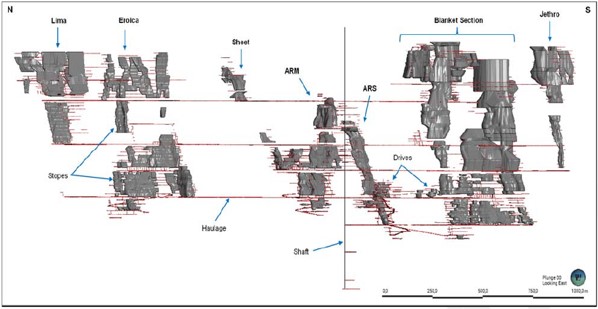
In greenstone belts, gold mineralization occurs mainly as vein type or shear zone hosted disseminations. Most of the larger deposits are found within the greenstone belts or their contacts with the granitoids. All mineralization is hydrothermally emplaced and associated with the regionally developed D2 deformation characterised (at the Blanket Mine) by areas of high strain wrapping around relatively undeformed remnants of the original basaltic flows. It is within the more ductile tensional high strain areas that the wider of the orebodies are located.
These orogenic gold deposits are commonly associated with late syntectonic intermediate to felsic magmatism. Vein systems occur as a system of echelon veins on all scales. The Blanket mineralization is hydrothermally emplaced and associated with the regionally developed D2 deformation characterised by areas of high strain wrapping around relatively undeformed remnants of the original basaltic flows. Wider orebodies occur within the more ductile tensional high strain areas. The localisation of the mineralised shears conforms to a Riedel pattern.
Two main types of mineralization are recognized at Blanket Mine, namely disseminated sulphide reefs (“DSR”) and quartz-filled reefs and shears. A third type of mineralization may be evidenced in the form of auriferous sulphide minerals as a replacement of the iron-rich minerals along the hinges of the folds in BIF, as is present at the neighboring Vubachikwe Mine.
Disseminated Sulphide Replacement Reefs
DSRs host the best grades and comprise the majority of the ore shoots. The zones have a silicified core with finely-disseminated arsenopyrite. Relatively high grades are found in a package of silicified biotite chlorite schist with irregular quartz stringers and disseminated and stringer arsenopyrite in the fabric planes. Due to lesser silicification, abundant biotite characterizes the margins of these mineralized zones and as a result they have a lower gold content. Disseminated sulphide-replacement orebodies range up to 50 m in width with a strike of 60 m to 90 m. Free-milling gold constitutes up to 50% of the total metal content with the remainder locked in the arsenopyrite. The ore is not refractory despite its association with arsenopyrite. Generally, plant recoveries of 85% to 90% are achieved.
Quartz-Filled Reefs and Shears
Two quartz shears are mined at the Blanket Mine, namely the BQR and the Eroica Reef. These reefs have long strikes; however, they are not uniformly mineralized. Continuous pay shoots of over 100 m on strike are present. The Quartz Reef has a surface strike of approximately 500 m, but economic mineralization is restricted to three 90 m long shoots.
Quartz-filled reefs display a much wider grade range compared to the DSR deposits. On average, these shears are of a higher grade and are used in blending the ore to the mill. Dominant ore minerals are native gold and galena although arsenopyrite becomes more prevalent below 470 m. Increasing levels of arsenopyrite association with depth confirm that the quartz shears represent higher level offshoots and splays with brittle deformation relative to the more ductile DSR-type core zone mineralized bodies.
Mineral Resource and Mineral Reserve Estimates
The mineral resources reported here are estimated by the QP as at December 31, 2023 and presented in other disclosures and utilised for the updated 2023 mineral reserve estimation. The QP has updated the mineral resource estimate based on the incorporation of significant new drilling data obtained for Blanket Mine. Refer to Exhibit 15.4 or the technical report summary titled “S-K 1300 Technical Report Summary on the Blanket Gold Mine, Zimbabwe”, with an effective date of December 31, 2023, for key assumptions, parameters, and methods used to estimate the mineral resources and risks that could materially affect the mineral resource.
The measured and indicated mineral resource estimates for 2023 are reported in compliance with Subpart 1300, in situ as at December 31, 2023 and exclusive of mineral reserves.
| Mineral Resource Classification |
Orebody |
Tonnes |
Au Grade |
Au Content |
| Kt |
g/t |
Koz |
||
|
|
ARM |
653 |
3.12 |
66 |
| ARS |
329 |
3.70 |
39 |
|
| ARS_Ext |
11 |
1.83 |
1 |
|
| BF |
89 |
3.58 |
10 |
|
| BLK1 |
136 |
3.74 |
16 |
|
| Measured (2.5% Geological Loss) | BLK2 |
148 |
3.66 |
17 |
| BLK3 |
109 |
3.44 |
12 |
|
| BLK4_5 |
194 |
3.85 |
24 |
|
| BLK6 |
48 |
3.79 |
6 |
|
| BQR |
482 |
4.31 |
67 |
|
| ERC |
208 |
4.93 |
33 |
|
| Jethro |
53 |
3.11 |
5 |
|
| Lima |
151 |
3.64 |
18 |
|
| Sheet |
88 |
2.99 |
9 |
|
| Measured Total |
2,700 |
3.72 |
323 |
|
|
|
ARM |
475 |
2.68 |
41 |
| ARS |
337 |
3.13 |
34 |
|
| ARS_Ext |
50 |
2.31 |
4 |
|
| BF |
103 |
3.04 |
10 |
|
| BLK1 |
232 |
3.19 |
24 |
|
| BLK2 |
228 |
3.86 |
28 |
|
| BLK3 |
66 |
2.45 |
5 |
|
| Indicated (5% Geological Loss) | BLK4_5 |
70 |
2.99 |
7 |
| BLK6 |
17 |
4.17 |
2 |
|
| BQR |
711 |
3.45 |
79 |
|
| ERC |
144 |
4.69 |
22 |
|
| Jethro |
177 |
2.82 |
16 |
|
| Lima |
74 |
3.44 |
8 |
|
| Sheet |
41 |
2.60 |
3 |
|
| Indicated Total |
2,726 |
3.23 |
283 |
|
| Measured + Indicated Total |
5,426 |
3.47 |
606 |
|
Notes:
| 1. |
Cut-off applied 1.5 g/t. |
| 2. |
Geological loss applied: Measured 2.5%, Indicated 5%, Inferred 10%. |
| 3. |
Commodity price utilised: USD2,150/oz |
| 4. |
Mineral resources are stated exclusive of mineral reserves. |
| 5. |
Mineral resources are reported as 64% attributable to Caledonia. |
| 6. |
All orebodies are depleted for mining. |
| 7. |
Plant recovery factor of 94% applied. |
In situ inferred mineral resource tabulation for Blanket Mine as at December 31, 2023:
| Mineral Resource Classification |
Orebody |
Tonnes |
Au Grade |
Au Content |
| Kt |
g/t |
Koz |
||
|
|
ARM |
299 |
2.87 |
28 |
| ARS |
170 |
3.88 |
21 |
|
| ARS_Ext |
68 |
3.48 |
8 |
|
| BF |
150 |
3.05 |
15 |
|
| BLK1 |
871 |
3.20 |
90 |
|
| BLK2 |
584 |
4.91 |
92 |
|
| BLK3 |
73 |
3.33 |
8 |
|
| Inferred (10% Geological Loss) | BLK4_5 |
269 |
3.32 |
29 |
| BLK6 |
83 |
3.57 |
10 |
|
| BQR |
1,900 |
3.71 |
227 |
|
| ERC |
928 |
4.30 |
128 |
|
| Jethro |
108 |
3.28 |
11 |
|
| Lima |
95 |
3.41 |
10 |
|
| Sheet |
47 |
2.52 |
4 |
|
| Inferred Total |
5,646 |
3.74 |
679 |
|
Notes:
| 1. |
Cut-off applied 1.5 g/t. |
| 2. |
Geological loss applied: Measured 2.5%, Indicated 5%, Inferred 10%. |
| 3. |
Commodity price utilised: USD2,150/oz. |
| 4. |
Mineral resources are stated exclusive of mineral reserves. |
| 5. |
Mineral resources are reported as 64% attributable to Caledonia. |
| 6. |
All orebodies are depleted for mining. |
| 7. |
Plant recovery factor of 94% applied. |
A comparison of the measured, indicated and inferred mineral resource estimates as at 31 December 2023 with those of 31 December 2022 are shown below. The most significant reasons for the changes are as a result of:
| ● |
Updates to domain orebody wireframes due to the deep drilling and short hole drilling campaigns, additional sampling information; and continuous geological modelling. |
| ● |
57,465 sampling data points added since the 2022 estimates (32% increase). |
| ● |
Geological losses of 2.5% applied to 2023 measured mineral resource estimate (2022: 0%), 5.0% applied to indicated mineral resource estimate (2022: 5.0%) and 10.0% applied to inferred mineral resource estimate (2022: 5%) |
| ● |
The commodity price used was USD2,150/oz in 2023 and USD1,800 in 2022, with no change to the cut-off of 1.5g/t. |
| ● |
The inferred resources have diminished due to upgrading mineral resources to the indicated category. |
|
|
December 31, 2023 |
December 31, 2022 |
% Variance |
||||||
| Mineral Resource Classification |
Tonnes |
Au |
Ounces |
Tonnes |
Au |
Ounces |
Tonnes |
Au |
Ounces |
| kt |
g/t |
koz |
kt |
g/t |
koz |
kt |
g/t |
koz |
|
| Measured Total |
2,700 |
3.72 |
323 |
1,855 |
3.10 |
185 |
45% |
20% |
74% |
| Indicated Total |
2,726 |
3.23 |
283 |
2,363 |
2.89 |
220 |
15% |
12% |
29% |
| M&I Total |
5,426 |
3.47 |
606 |
4,218 |
2.98 |
405 |
29% |
16% |
50% |
| Inferred Total |
5,646 |
3.74 |
679 |
5,748 |
2.92 |
539 |
-2% |
-28% |
26% |
| Grand total |
11,071 |
3.61 |
1,285 |
9,967 |
2.94 |
944 |
11% |
23% |
36% |
Notes:
| 1. |
Cut-off applied 1.5 g/t . |
| 2. |
2022 - No geological loss applied for measured, 5% for indicated and inferred |
| 3. |
2023 – Measured 2.5%, Indicated 5%, Inferred 10% |
| 4. |
2022 - Commodity price of $1,800/oz |
| 5. |
2023 – Commodity price of $2,150/oz |
| 6. |
Mineral resources are reported as 64% attributable to Caledonia |
| 7. |
All orebodies are depleted for mining. |
| 8. |
Mineral resources are stated exclusive of Mineral Reserves. |
| 9. | Plant recovery factor of 94% applied. |
Refer to Exhibit 15.4 or the technical report summary titled “S-K 1300 Technical Report Summary on the Blanket Gold Mine, Zimbabwe”, with an effective date of December 31, 2023 for further key assumptions, parameters, and methods giving rise to the changes above.
Mineral reserve estimates in this Annual Report are reported in accordance with the requirements of Subpart 1300. Accordingly mineral resources in the measured and indicated categories have been converted to proven and probable mineral reserves respectively, by applying applicable modifying factors and are planned to be mined out under the life of mine plan within the period of our existing rights to mine, or within the time period of assured renewal periods of our rights to mine.
In addition, as of the date of this Annual Report, all mineral reserves are covered by required permits and governmental approvals. The updated mineral reserve estimation as of December 31, 2023, is detailed in the table below. Mineral reserves are stated as delivered to plant.
| Mineral Reserve Classification |
Tonnes |
Grade |
Au Content |
|
| Kt |
g/t |
Kg |
Koz |
|
| Proven |
1,363 |
3.21 |
4,377 |
141 |
| Probable |
3,555 |
3.31 |
11,782 |
379 |
| Total |
4,918 |
3.29 |
16,158 |
519 |
Notes:
| 1. |
Mineral reserve cut-off of 2.1 g/t applied. |
| 2. |
The gold price that has been utilised in the economic analysis (as included in the S-K 1300 Technical Report Summary on the Blanket Gold Mine (refer to Exhibit 15.4) to convert diluted measured and indicated mineral resources in the life of mine plan to mineral reserves is an average real term price of USD1,877/oz over the life of mine, using the forecast prices as per economic analysis included in the S-K 1300 Technical Report |
| 3. |
Metallurgical recovery of 94% applied. |
| 4. |
The mineral reserve estimation utilises the 2023 mineral resource with the December 31, 2023 mine design and life of mine plan. |
| 5. |
Mineral reserves are reported as 64% attributable to Caledonia. |
An uneconomical tail containing 212.5 koz of gold has been excluded from the mineral reserve, since it is not economical on its own.
The mineral reserves for the estimate as of 31 December 2023 compared with that of 31 December 2022 is presented below.
| December 31, 2023 |
December 31, 2022 |
% Variance |
||||||||||
| Mineral Reserve Classification |
Tonnes |
Grade |
Au Content |
Tonnes |
Grade |
Au Content |
Tonnes |
Grade |
Au Content |
|||
| kt |
g/t |
kg |
oz |
kt |
g/t |
kg |
oz |
kt |
g/t |
kg |
oz |
|
| Proven |
1,363 |
3.21 |
4,377 |
141 |
1,191 |
3.23 |
3,842 |
124 |
14% |
-1% |
14% |
14% |
| Probable |
3,555 |
3.31 |
11,782 |
379 |
1,300 |
2.92 |
3,801 |
122 |
173% |
13% |
211% |
211% |
| Total |
4,918 |
3.29 |
16,158 |
519 |
2,491 |
3.07 |
7,643 |
246 |
97% |
7% |
111% |
111% |
On a total mineral reserve basis, there is a material change in the estimates. The reason for this is as follows:
| ● |
The results of ongoing deep exploration drilling at Blanket has resulted in a substantial amount of previously inferred mineral resources being converted to indicated mineral resources, while maintaining similar levels of inferred mineral resources. On mine drilling has targeted previously indicated or inferred mineral resources in proximity to current mine workings and drilled this to increase the confidence levels. |
| ● |
Results of the long hole exploration drilling, published on July 10, 2023 and January 30, 2024, intersected wider orebodies with better grade than initially expected. These expectations were derived from the 2022 resource modelling as targets for the drilling programs. |
Our mineral reserve figures are estimates, which may not reflect actual reserves or future production. These figures are prepared in accordance with industry practice, converting mineral deposits to reserves through the preparation of a mining plan. The mineral reserve estimates contained herein inherently include a degree of uncertainty and depend to some extent on statistical inferences. Reserve estimates require revisions based on actual production experience or new information. Should we encounter mineralization or formations different from those predicted by past drilling, sampling and similar examinations, mineral reserve estimates may have to be adjusted and mining plans may have to be altered in a way that might adversely affect our operations. Moreover, if the price of gold declines, stabilizes at a price that is lower than break-even level, if our production costs increase or recovery rates decrease, it may become uneconomical to recover mineral reserves with lower grades of mineralization.
Exploration and Planned Work
The Blanket Mine is a producing operation. Ordinarily, exploration activities are carried out both on and off the mine. Mine exploration takes place mostly underground on the producing claims and is aimed at expanding the lateral and depth extension of the known ore bodies which are being mined, as well as searching for potential additional orebodies.
The ongoing underground drilling program at Blanket targeted the Eroica, Blanket and AR south ore bodies and has yielded encouraging results which were published on July 10, 2023 and January 30, 2024. Total drilling for 2023 was 13,280 metres and the results indicate that the existing Blanket, Eroica and AR South ore bodies have grades and widths which are generally better than expected.
The appropriate QAQC procedures were applied to satisfy best practice guidelines including the use of blanks, standards and duplicates. These procedures with respect to sample preparation, analyses, security and data validation and verification are detailed in Exhibit 15.4 titled “S-K 1300 Technical Report Summary on the Blanket Gold Mine, Zimbabwe”, with an effective date of December 31, 2023.
Bilboes
Property Description and Ownership
Bilboes owns three groups of claims that consists of four open pit mining properties in Matabeleland North Province of Zimbabwe. These open pits are referred to as Isabela North; Isabela South; McCays and Bubi (“Isabella McCays-Bubi”), as shown in the location map below. The first three are situated 80 km due north of Bulawayo whilst Bubi is 100 km due north east of Bulawayo and about 32 km northeast of Isabella. The Isabella McCays-Bubi properties comprise 131 claim blocks covering an area of 3,114.7 ha. A summary for each of the three groups of claims is contained in the table below. Additional ground is held at When, Sandy, Eastnor and Ferroro (3,935 ha). Collectively, these properties are referred to as the Bilboes Project.
The Bilboes Project is considered a development stage property because the company has identified a Subpart 1300 mineral reserve, but has not commenced material extraction. Caledonia acquired the Bilboes Project on January 6, 2023 by issuing shares to the value of $65.7 million. As at December 31, 2023, the net assets of the Bilboes Project is $73.6 million.
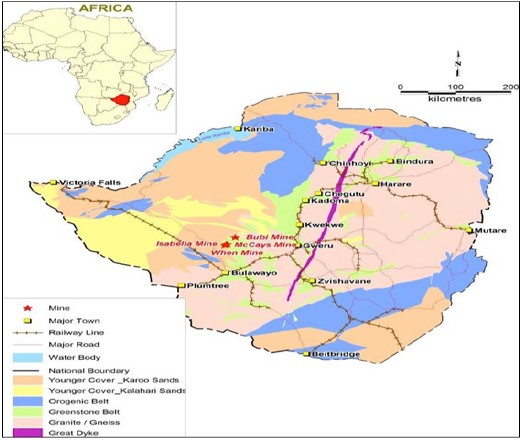
Location Map of Bilboes Properties
Source: DRA Projects (Pty) Ltd
Bilboes claims:
| Group of Claims |
Mining District |
Province |
No. of Blocks |
Area (ha) |
Coordinate X1 |
Coordinate Y1 |
| Calcite and Kerry (Isabella Mine) |
Bulawayo |
Matabeleland North |
49 |
1,894.4 |
662,106 |
7,846,712 |
| Ruswayi (McCays Mine) |
Bulawayo |
Matabeleland North |
3 |
330 |
666,339 |
7,849,975 |
| Chikosi (Bubi Mine) |
Bulawayo |
Matabeleland North |
48 |
507.2 |
684,838 |
7,865,515 |
| Total |
130 |
2,731.6 |
||||
Isabella McCays-Bubi are approximately 80 km and 100 km directly north and north east of Bulawayo, the second largest city of Zimbabwe with an approximate population of 655,675 (2013). All the mines are accessed via public roads and although these are of variable quality, they are accessible by all types of vehicles. Isabella is 110 km (1.5 hours) whilst Bubi is 140 km (2 hours) by road from Bulawayo. Bubi can also be accessed by road from Isabella (70 km in 1 hour).
Average daily temperatures range from 24°C in June to 32°C in October and apart from the occasional heavy downpour in the rainy season, there are no climatic conditions that prevent all year-round exploration and mining.
The properties lie between 1,150 m and 1,200 m above sea level and are covered by red and grey soils of the greenstone rocks in the area. The area is generally flat and covered by woodland interspersed with scrubby vegetation. Agricultural activities are mainly small-scale ranching.
History
Anglo American Corporation of Zimbabwe Ltd (“AMZIM”), a company that formed Bilboes Holdings, held the Isabella, McCays and Bubi claims. AMZIM acquired the Isabella claims in 1982.
Initial exploration allowed the estimation of a small oxide resource and an open-pit; a heap leach mine was commissioned in 1989. Subsequent exploration extended Isabella and new discoveries were made at Bubi and McCays, which yielded 8,592 kg of gold (276,256 oz) over the past 26 years, 78,497 oz of this being produced since the management buyout of Bilboes Holdings in 2003. All mining has been from open pit oxide ore utilizing the heap leach extraction processing method.
Exploration for sulphide mineral resources began in 1994/95, with a sum of 17,650 m of exploratory drilling being completed by 1999, covering a strike length of 3,440 m. A maiden mineral resource estimate for the sulphide mineral resources was completed by SRK Consulting in 2009.
On January 6, 2023 Caledonia announced that it had satisfied the conditions precedent to purchase Bilboes Gold.
The table below indicates the aggregate annual production from Bilboes in the last three fiscal years on a 100% project basis:
| Bilboes Production Statistics |
||||
| Year |
Tonnes Milled (t) |
Gold Head (Feed) Grade (g/t Au) |
Gold Recovery (%) |
Gold Produced (oz) |
| 2021 |
- | - | - | - |
| 2022 |
- | - | - | - |
| 2023 |
154,054 |
1.15 |
54.0 |
3,050 |
Present Conditions and Infrastructure
The overall site plan is shown in the figure below (“Overall site plan”) and includes major facilities of the Project including the Isabella North and South, McCays and Bubi open pit mines, gold processing plan, TSF, Waste Stockpiles, demarcated areas for mine buildings and accommodation facilities, main power line internal mine roads and access public roads.
Grid power will be supplied from the Zimbabwe National Grid by constructing a 70 km 132 kV Lynx line from Shangani Substation. To feed the line, a line bay will be constructed at Shangani. A mine substation will be constructed at Isabella. The estimate received is for a 132kV substation, equipped with a 50 MVA 132/33 kV step-down transformer.
Raw water will be provided from open pit dewatering and the wellfield boreholes located across the mine license area.
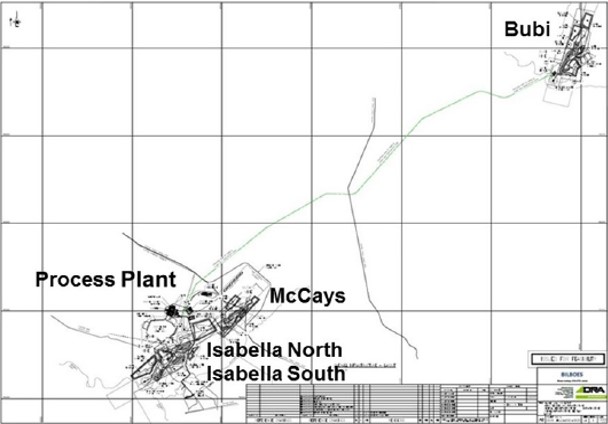
Overall site plan
Source: DRA Projects (Pty) Ltd
Permitting, Licenses and Encumbrances
Bilboes is compliant in terms of authorizations and adheres to all government protocols and regulations as required.
Bilboes has been operating in Matabeleland since 1989. It holds the necessary mining permits and complies with the terms of the Mines and Minerals Act and allied regulations with respect to all of their claims and in particular that all of the registration certificates are valid, and the protection certificates are up to date. Bilboes thus requires no further permits to explore or produce from the current operational areas, but further permits will be required for the proposed haul road between Bubi and Isabella plant.
Further exploration outside the current claims will require approvals by the EMA who may request an EIA study.
SLR Consulting based in South Africa in partnership with the local GryinOva Environmental Consultants conducted an ESIA study for the project and an EIA certificate of approval was issued by EMA in February 2021 and the certificate was valid for 2 years and subject to renewal on an annual basis for the duration of the operations. The current EIA certificate expires in March 202554. The conditions of renewal are notification to the agency of any changes in the project, compliance to the approved environmental plan and submission of progress report on the project. There is no reason that the renewal will not be granted.
Bilboes also hold 3,935 ha of additional claims and 51,900 ha of exploration licenses referred to as Exclusive Prospecting Orders (EPOs) around Isabella-McCays-Bubi and the Gweru area. These claims and EPOs have highly prospective targets which offer Bilboes excellent prospects for organic growth. The company has applied for an extension of the EPOs tenure for a further 3 years after the initial 3-year tenure expired in July 2021. The decision on the EPO applications is pending.
Geological setting, Mineralization and Deposit
The Bubi Greenstone Belt covering the Bilboes Properties consists of volcanic rocks of the Upper Bulawayan Group capped by sedimentary sequences of the Shamvaian Group locally represented by Mdutjana and Dagmar Formations respectively as shown in the figure below (“Regional Geological Map showing Bilboes Properties”). The deposits occur within the meta-volcanic and meta-sediments close to the contact between these two stratigraphic units.
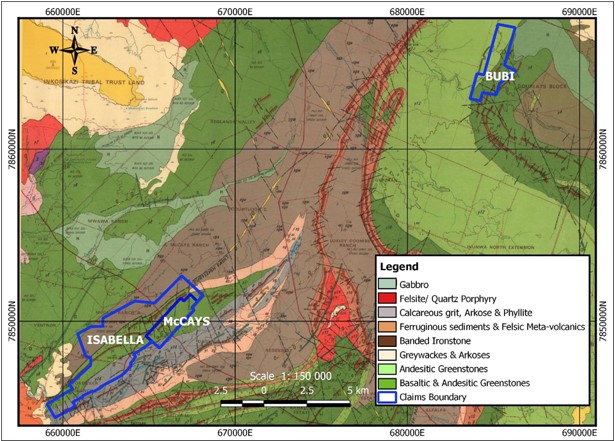
Regional Geological Map showing Bilboes Properties
Source: Ngilazi and Martin ’17
Stratigraphy
The Bilboes stratigraphic presentation is depicted in the figure below:
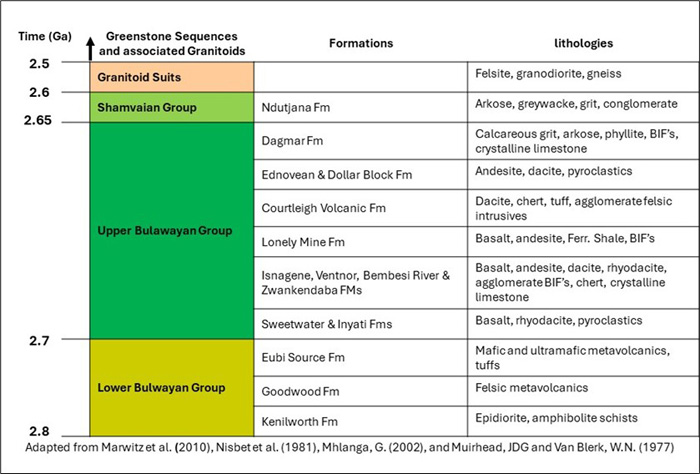
Bilboes Site Stratigraphy
Deposit Types
Mineralization at Bilboes’ four properties are Archaean lode, structurally controlled deposits. It consists of silicified stock-works/veins. The veins comprise pyrite and arsenopyrite. Gold is disseminated within the sulfide mineralization and is refractory. The mineralized zones are often subparallel to each other and are hosted in a much broader shear zone. The best mineralized zones are associated with brecciation and silicification.
Mineral Resource and Mineral Reserve Estimates
The mineral resources reported here are estimated by the QP as at December 31, 2023 and presented in other disclosures and utilised for the updated 2023 mineral reserve estimation. Refer to Exhibit 15.6 or the technical report summary titled “Bilboes Gold Project Technical Report Summary”, with an effective date of December 31, 2023, for key assumptions, parameters, and methods used to estimate the mineral resources and risks that could materially affect the mineral resource.
The measured and indicated mineral resource estimates for 2023 are reported in compliance with Subpart 1300, in situ as at December 31, 2023 and exclusive of mineral reserves.
| Mineral Resource |
Orebody |
Tonnes |
Au Grade |
Au Content |
| Classification | Kt |
g/t |
Koz |
|
|
|
Isabella South |
34 |
1.80 |
2 |
| Measured | Isabella North |
82 |
2.40 |
6 |
| Bubi |
59 |
1.22 |
2 |
|
| McKays |
66 |
1.77 |
4 |
|
| Measured Total |
241 |
1.85 |
14 |
|
|
|
Isabella South |
1,043 |
2.07 |
69 |
| Indicated | Isabella North |
1,734 |
2.29 |
127 |
| Bubi |
4,437 |
1.51 |
215 |
|
| McKays |
1,261 |
1.85 |
75 |
|
| Indicated Total |
8,475 |
1.79 |
487 |
|
| Measured + Indicated Total |
8,716 |
1.79 |
502 |
|
Notes:
| 1. |
S-K 1300 definitions observed for classification of Mineral Resources. |
| 2. |
Mineral Resources are reported exclusive of Mineral Reserves |
| 3. |
Block bulk density interpolated from specific gravity measurements taken from core samples. |
| 4. |
Resources are constrained by a Lerchs-Grossman (LG) optimized pit shell using Whittle software at a gold price of US$2,400/oz and a 0.9 g/t cut-off grade. |
| 5. |
Mineral Resources are not Mineral Reserves and have no demonstrated economic viability. The estimate of Mineral Resources may be materially affected by mining, processing, metallurgical, infrastructure, economic, marketing, legal, environmental, social, and governmental factors (Modifying Factors). |
| 6. |
Numbers may not add due to rounding. |
| 7. |
The Mineral Resource Estimate has been depleted to reflect mining up to 31 December 2023 |
| 8. |
Effective Date of Resource Estimate is 31 December 2023. |
| Mineral Resource Classification |
Orebody |
Tonnes |
Au Grade |
Au Content |
| Kt |
g/t |
Koz |
||
|
|
Isabella South |
1,335 |
1.80 |
77 |
| Inferred | Isabella North |
1,613 |
2.18 |
113 |
| Bubi |
5,116 |
1.80 |
296 |
|
| McKays |
1,054 |
2.16 |
73 |
|
| Inferred Total |
9,118 |
1.91 |
559 |
|
Notes:
| 1. |
S-K 1300 definitions observed for classification of Mineral Resources. |
| 2. |
Mineral Resources are reported exclusive of Mineral Reserves |
| 3. |
Block bulk density interpolated from specific gravity measurements taken from core samples. |
| 4. |
Resources are constrained by a Lerchs-Grossman (LG) optimized pit shell using Whittle software at a gold price of US$2,400/oz and a 0.9 g/t cut-off grade. |
| 5. |
Mineral Resources are not Mineral Reserves and have no demonstrated economic viability. The estimate of Mineral Resources may be materially affected by mining, processing, metallurgical, infrastructure, economic, marketing, legal, environmental, social, and governmental factors (Modifying Factors). |
| 6. |
Numbers may not add due to rounding. |
| 7. |
The Mineral Resource Estimate has been depleted to reflect mining up to 31 December 2023 |
| 8. |
Effective Date of Resource Estimate is 31 December 2023. |
No S-K 1300 compliant mineral resources had been identified at Bilboes as of the previous year end, December 31, 2022. Accordingly, the Company has omitted a comparison of the mineral resources between December 31, 2023 and 2022.
Mineral reserve estimates in this Annual Report are reported in accordance with the requirements of Subpart 1300. Accordingly mineral resources in the measured and indicated categories have been converted to proven and probable mineral reserves respectively, by applying applicable modifying factors and are planned to be mined out under the life of mine plan within the period of our existing rights to mine, or within the time period of assured renewal periods of our rights to mine. Mineral reserves are stated as delivered to plant.
| Mineral Reserve Classification |
Tonnes |
Grade |
Au Content |
|
| Mt |
g/t |
Kg |
Koz |
|
| Proven |
5.9 |
2.42 |
14,152 |
455 |
| Probable |
19.1 |
2.31 |
44,104 |
1,418 |
| Total |
24.9 |
2.34 |
58,256 |
1,873 |
Notes:
| 1. |
S-K 1300 definitions observed for classification of Mineral Reserves. |
| 2. |
All tonnes quoted are dry tonnes |
| 3. |
Mineral Reserves are reported fully diluted delivered to plant |
| 4. |
Mineral Reserves are reported as constrained by an optimal pit shell at a gold price of US$1,800/ox and a 0.9 g/t cut-off grade. |
| 5. |
5% Ore loss and 4% dilution applied |
| 6. |
Gold recovery ranges between 83.62% to 88.88% dependent on mining area and ore type being processed |
| 7. |
Numbers may not add due to rounding. |
| 8. |
No metal equivalents are reported. |
| 9. |
Effective Date of Mineral Reserve Estimate is 31 December 2023. |
No S-K 1300 compliant mineral reserves had been identified at Bilboes as of the previous year end, December 31, 2022. Accordingly, the Company has omitted a comparison of the mineral reserves between December 31, 2023 and 2022.
Exploration and Planned Work
Plans are commissioned to complete the Caledonia feasibility study on the Bilboes sulphide project to estimate the funding requirements and commence development of the sulphides project.
Maligreen
Property Description and Ownership
On September 23, 2021, Caledonia announced that it had entered into an agreement to purchase 100% ownership of mining claims over Maligreen, a property situated in the Gweru mining district in the Zimbabwe Midlands, for a total cash consideration of US$4 million. The claims were purchased to further explore and the exploration and evaluation asset is disclosed in note 17 of the Consolidated Financial Statements. No production activities have taken place while under the control of the Company. As at December 31, 2023, the exploration and evaluation cost, as included in note 17 of the Consolidated Financial Statements, is $6.0 million.
Maligreen is a brownfield gold exploration project situated on the Nkayi-Silobela Greenstone Belt that has historically been exploited via open pit mining. The Maligreen property is envisioned as a combination open pit and underground operation. Appropriate work has to be completed to determine the extent and economic viability of an underground operation. This will be informed by future exploration drilling.
Maligreen is located in central Zimbabwe, approximately 73 km due west-southwest of Kwekwe, Midlands Province. Zimbabwe's capital city, Harare, lies 235 km northeast of Maligreen. The town of Nkayi lies 25 km west of the project along the Kwekwe-Lupane Highway. The location of the project is indicated below.
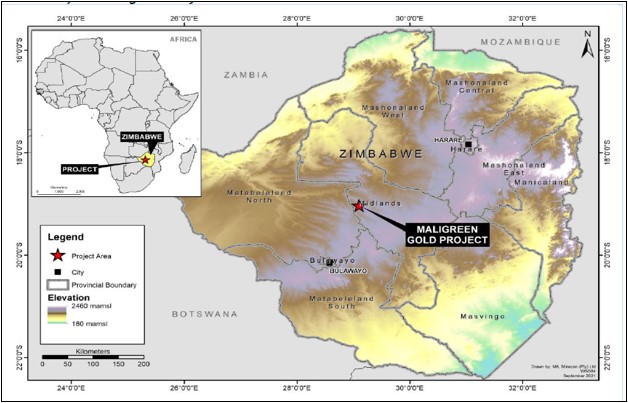
Source: Minxcon (2022)
Maligreen is centered on the following coordinates:
| ● |
Latitude 19°1'51"S |
| ● |
Longitude 29°6'5"E |
Maligreen is held under a portfolio of 41 adjacent mining claims in the Midlands Mining District. Of these, 40 encompass an area of 10 ha each and are issued for gold. Claim AMT 97 (claim number 11219BM) encompasses 150 ha and is issued for copper. This latter claim has not been the focus of exploration to date. Should future exploration reveal substantial gold mineralization, application will be made to include gold ore in the claim. The claims are all up to date, with next inspections due in 2023. The claims were all held in the name of Maligreen Mining Company (Pvt) Ltd, which entered into an Agreement of Sale with |CHZ on September 22, 2021 to acquire the claims.
The total land area of Maligreen is approximately 550 hectares comprising two historic open pit mining operations that produced approximately 20,000 ounces of gold mined from oxides between 2000 and 2002 after which the operation was closed. No exploration activities are currently active at the project, but the Company is planning to undertake additional exploration to fully understand the strike extension and depth extension potential.
History
The Maligreen deposit was discovered by Reunion Mining (Zimbabwe) Limited (“Reunion”) in October 1995 over a number of Exclusive Prospecting Orders. The property was purchased by Cluff Mineral Resources Limited (“Cluff”) in April 1998. In December 1999, Pan African (Pvt) Ltd (“Pan African”) entered into an agreement with Cluff to acquire a 50% interest in Maligreen. The acquisition was completed in April 2000 and a new joint-venture company MMC was registered (Trashliev, 2007).
As described by Trashliev (2007), four years of integrated regional geochemical and geophysical exploration led to the discovery of the Maligreen mineralization by Reunion in 1995. A north-south, 3.3 km long geochemical signature along structural targets was identified. For the next two and a half years, Reunion drilled 107 diamond drillholes over 28,272 m and 526 percussion drillholes over 29,110 m, the results of which were utilised to define a gold mineral resource. Only the southern 1 km of the geochemical anomaly has been drilled. Limited geochemical data is however available. The area has been mapped and geological data relogged. No further exploration work was undertaken under Cluff ownership, but the company did revise the mineral resources to quantify the potential and guide mine planning.
Work commenced in January 2000 under MMC ownership to develop two open pits (North Pit and South Pit) to exploit the orebody. A crushing, sizing and floatation plant was also constructed. Pan African completed 35 reverse circulation (“RC”) drillholes over 1,038 m to guide mine planning at North Pit. The first bullion was poured in July 2000. All available data for the project area was consolidated in 2003 and all 107 diamond drillholes were relogged. Mining ceased in September 2002, but the reason for this is uncertain. It is however assumed that they were targeting the oxides only.
Present Condition and Infrastructure
Infrastructure on site is minimal. There are two open pits, namely North Pit and South Pit, that were historically mined, as well as the heap leach pad and possible elution room that serviced the operations. An office block is occupied and maintains the care and maintenance of the historic operation. A basic process plant is erected and utilised by the Syndicate for their mining activities. All required infrastructure for exploration activities is in place.
The Maligreen project is in the exploration phase and the area is accessible by car via the Kwekwe-Lupane Road, approximately 80 km west of Kwekwe. From this road, the Mahlathini Road can be taken southwards for some 3.8 km, from which point a westwards gravel road provides direct access to the project area after 1.8 km. The journey from Kwekwe takes approximately 2 hours by car.
Permitting, Licensing, and Encumbrances
The Maligreen mineral resource occurs within a claims area covering a total of 550 ha. The project is held under a portfolio of 41 adjacent mining claims in the Midlands Mining District. Of these, 40 encompass an area of 10 ha each and are issued for gold. Claim AMT 97 (claim number 11219BM) encompasses 150 ha and is issued for copper. A conversion application to convert Claim AMT 97 to gold was accepted and registered on August 5, 2022 by the office of the Provincial Mining Director, Gweru. The claims are all up to date, with next inspections due in 2023.
Location of the existing claims are shown below.
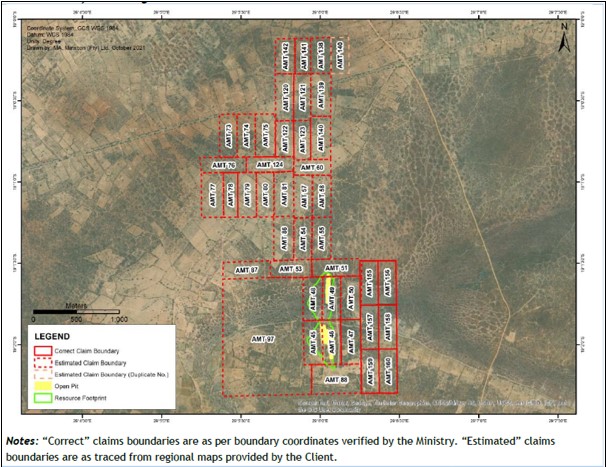
Source: Minxcon (2022)
Caledonia Holdings Zimbabwe (Private) Limited is in possession of a Mining Lease No.44 over Silobela Communal Land (SR 67/2024), issued January 12, 2024 by the Mining Affairs Board following the gazette of the mining lease for objections on October 20, 2023. As per the Mines and Mineral bill, 2022 Section 137 (5) and (6), an approved plan of 110, 9903 ha (diagram GS No. 84/2024) was submitted and filled at the Surveyors General’s Office, dated April 24, 2024.
Geological Setting, Mineralization and Deposit
The Maligreen gold deposit occurs in a northeast-trending section of greenstone near the convergence (triple junction) of the Midlands, Bubi and Silobela greenstone belts. The Shangani granite-gneiss terrain occurs to the southeast of the project.
Although the area and its immediate surroundings are covered by a thin layer (0-40 m) of surface deposits that include Kalahari sands, the position of the area within the regional stratigraphy and structure can be deduced from aeromagnetic data linked to outcrops SW and NE of the area. On this basis it is assumed that the Maligreen deposit is hosted in rocks assigned to the Maliyami Formation of the Upper Bulawayan Group (Harrison, 1981).
Maliyami Formation rocks comprise andesitic lava flows that are locally amygdaloidal or porphyritic, and interbedded with basalt, volcaniclastic rocks (tuff, agglomerate, ignimbrite), felsic volcanic material and porphyry intrusions, as well as phyllitic rocks and chert. All units have been intruded by metadolerite and gabbro bodies (Harrison, 1981). To the southeast the Maliyami Formation rocks are assumed to stratigraphically overlie older rocks belonging to the Upper Bulawayan Group (Leo Hurst Formation andesitic and dacitic flows; Ntobe Formation basalt) and Lower Bulawayan and Sebakwean Groups (dacite and serpentinite). Contacts between most units are strongly sheared. The greenstone pile in the Maligreen area was intruded by a number of tonalitic bodies with narrow contact metamorphic aureoles, assigned to the Sesombi Suite.
The regional structural trend around Maligreen is northeast, parallel to the contact between the greenstone pile and the Shangani granite-gneiss terrain to the southeast. Two major northeast trending shear zones have been described to the southeast of the project using Landsat TM data (Campbell and Pitfield, 1994). These shears are positioned near formational contacts between the Leo Hurst and Ntobe Formations (the Leo Hurst shear zone) and the Ntobe Formation and Lower Bulawayan rocks respectively. They have been interpreted as large dextral shear systems and linked to the Munyati Shear Zone in the Midlands Greenstone Belt (Campbell and Pitfield, 1994).
A stratigraphic column depicting the regional lithological units is provided in figure below.
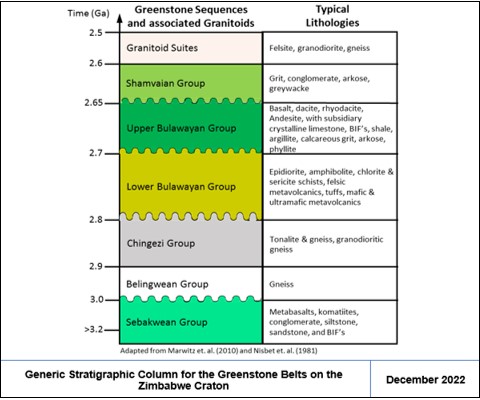
Source: Minxcon (2022)
Numerous small gold workings occur in the area around Maligreen. Larger mines (>500 kg production) include the Jena Group of mines to the north-northeast of Maligreen and the Turtle Mine and associated reefs to the northwest.
The country rocks at Maligreen consist of metamorphosed andesitic pyroclastics (grading from lapilli tuff to agglomerate), intermediate lavas (dacite/andesite) and mafic lavas (basalt/gabbro). The pyroclastics are interbedded with quartz-eye-porphyry (“QEP”) and intruded by feldspar porphyry (“FP”) dykes. Andesitic volcanics are porphyritic and amygdaloidal in places. A mafic (“marker”) dyke has intruded along the contact between pyroclastics and dacitic volcanics, within a broad shear zone. The strongly altered and sheared zone known as the quartz-sericite-zone (“QSZ”), forms the core of deformation and alteration at Maligreen (Mtetwa, 2007).
The andesitic-dacitic lava is a fine to medium grained, grey green rock. Amygdaloidal and porphyroidal textures are found in places. Quartz-porphyry is characterised by sparse, whitish calcite (after feldspar) amygdales with rectangular (feldspar pseudomorph) shape, in fine grained siliceous matrix. Pyroclastics grade from very fine grained, grey green lapilli tuff to coarse grained agglomerates with large, usually felsic, bombs up to a few centimetres across. The bombs are often amygdaloidal. Quartz and carbonate veining is common. QEP is massive, brittle, grey green (seldom pink) rock with siliceous matrix and spheroidal quartz porphyroblasts, usually 2-3 mm across. It is sericitized and deformed into strongly developed S-C fabric and mineralised in places pressure shadows around the quartz porphyroblasts often indicate the sense of movement during deformation. QSZ is a strongly deformed and intensely altered unit composed of white quartz with yellow sericite and/or green chlorite bands usually forming S-C fabric along the chlorite/sericite bands. When the chlorite rather than sericite is dominant, it is called the quartz-chlorite-zone. Fuchsite and epidote are sometimes present.
The mafic dyke has a green medium grained matrix with dark green hornblende phenocrysts up to 5mm across. It has chilled margins and is found within or on the margin of the QSZ. The FP is pale grey to pink felsic unit with white subhedral to euhedral feldspar phenocrysts up to 5mm across. It is often intensely sheared, altered (sericite after feldspar) and mineralised. The FP in the main shear zone, to the north, has QSZ xenoliths in it, suggesting that it is post Phase 1 deformation. In addition, the FP is often found unsheared within the QSZ. The same applies to the mafic dyke. Basalt is fine grained green to dark green and fairly brittle. It has black magnetite rich patches which are very magnetic. Patchy siliceous and epidote alteration associated with specks of pyrite is common. Dolerite is medium to coarse gained rock with a pale green matrix and dark green hornblende phenocrysts. It is weak to strongly magnetic. The gabbro has very pale green matrix with large dark green phenocrysts which give it a coarse-grained texture. Minor sericite alteration is found in places. Kalahari sands, Karoo sediments and black hydromorphic clays 3m to 7m thick cover the Maligreen deposit.
The low-grade greenschist facies metamorphism of the country rock is marked by the assemblage of chlorite-epidote-actinolite-plagioclase. Three different types of alteration are recognised. The first type of alteration is observed in the intensely sericitized and silicified QSZ and is related to the phase 1 deformation. Epidote and minor fuchsite are also present. Low temperature Na-micas (illite and paragonite) were picked up by Pima spectral analysis. The second type of alteration (related to phase 2 deformation) is found in gold mineralised zones, which are also intensely sericitized and silicified. Other alteration minerals present are carbonate, tourmaline, chlorite and leucoxene. Fuchsite and epidote are seldom present. The Pima spectral analysis on core from diamond drill hole MG45 suggests that gold mineralization is associated with K-mica (muscovite) introduced by “high” temperature hydrothermal fluids. The third type of alteration is pervasive silicification and carbonatization of the country rock. It has a bleaching effect on the wall rocks, forming a broad envelope to mineralization (Mtetwa, 2007). The alteration minerals are usually associated with shear zones and pyrite mineralization.
The deposit lies in a major north-south structure interpreted from the aeromagnetic data and observed in the core as the 50 m wide QSZ. This dominant structure (phase 1 deformation) is usually barren of gold. Narrow shears splay-off the QSZ (phase 2) deformation and are associated with gold mineralization. A NW oblique trend appears to belong to phase 2 deformation as it has brittle fractures and hosts grey sulphide with gold mineralization. Silicified ENE trending faults are barren of gold and are probably post mineralization.
Detailed mapping and structural measurements were taken by Professor Paul Dirks (2001).
The calculated stress field indicates that during the formation of the shear zones;
| ● |
WNW and NW trending sinistral shears formed within a tensional field, |
| ● |
NE trending dextral shears formed in a compressional field, |
| ● |
N trending sinistral shears formed close to the boundary of the compressional and tensional fields. |
This suggests that maximum fluid infiltration can be expected along the NW and WNW trending shears, and especially along the intersections of WNW, NW and N trending shears. The intensity of infiltration is partly dependent on the fluid pressure at the time of mineralization.
The widest zones of wall rock alteration in the South Pit occur in areas where NW, WNW and N shear zones merge into each other. Where such zones coincide with quartz porphyry rock, extensive stock works of quartz-sulphide veinlets have developed within the porphyry.
This is especially the case along the massive porphyry exposed at the bottom of the South Pit as indicated in the Local Geology of the Maligreen South Area figure below.
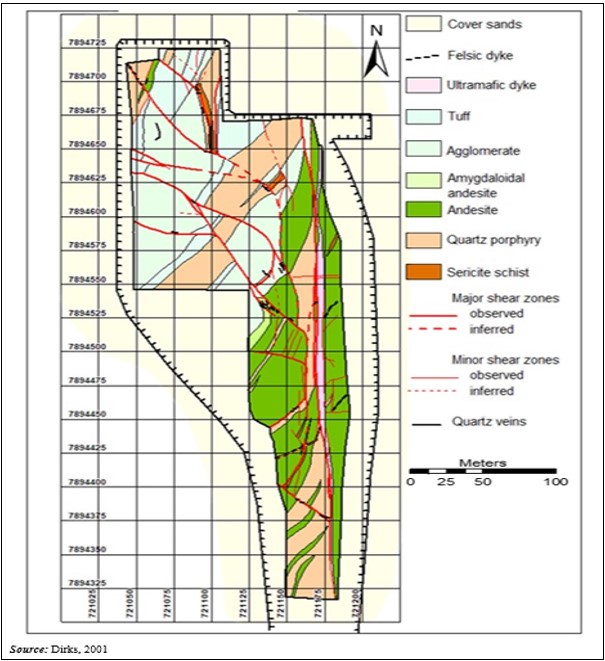
N-S trending shears away from intersections with NW trending shears, and SW trending shears parallel to S1 show less alteration and are not associated with significant mineralization although a narrow mineralised zone can be traced along the main N-trending shear zone to the N of the pit.
It is clear that the main zones of fluid infiltration occur along the intersection points of N-, NW- and WNW-trending shears within a sinistral shear system. Within such a system, these areas are clearly dilatant allowing more effective fluid impregnation. The intersection lineation between the three shear zone sets plunges steeply to the south. This orientation is near parallel to the L1 mineral lineation, this suggests that the mineralization plunges steeply S to SSW.
Where fault intersections coincide with quartz porphyry rocks, better mineralization occurs. This appears to happen because, the porphyry undergoes extensive, stock-work like fracturing with associated sulphide impregnation, a feature not observed to be as well developed in other lithologies. All quartz porphyries in the South Pit contain S1 and therefore were emplaced before gold was introduced along the younger brittle-ductile shear zones. A direct genetic relationship between the porphyries and mineralization is therefore not expected.
The feldspar porphyry observed in drill core below the N-pit intruded after the development of D1 and before or during the mineralising events in an N-S trend and may have a genetic relationship with the gold. The same may be true for the mafic dyke that has intruded into the main shear zone after D1, but before shearing associated with mineralization, which locally affects the dyke.
The figure below shows a schematic cross section of the geology at the project.
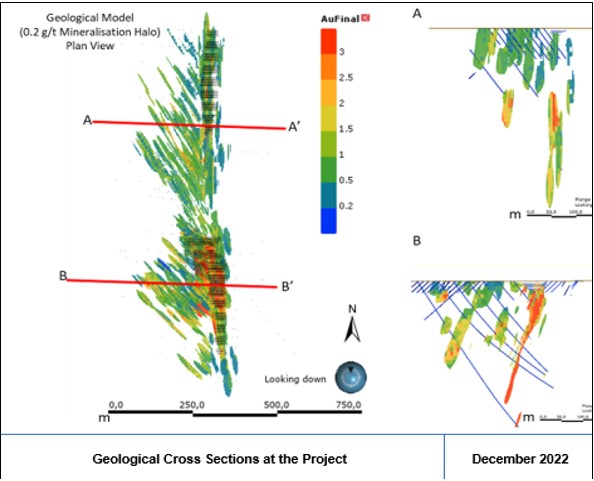
Source: Minxcon (2022)
Gold mineralization at Maligreen is generally associated with pyrite. Pyrite occurs mainly in association with argillic and quartz-sericite hydrothermal alteration and occasionally with propylitic and mylonitic style of hydrothermal alteration. Although the pyrite content increases towards the ore channel, gold and pyrite are not sympathetically related. Both stockwork and breccia pipe-type mineralization have been recognised. The breccia type is very limited and consists of rock fragments cemented with silicates and ore minerals.
Pyrite generally occurs as fracture filling, or as vein, veinlets, and dissemination. Dissemination of pyrite with visible fractures and healed micro cracks implies that some of the mineralization is a result of wall rock alteration by permeating fluids.
Based on the textural appearance, early clean pyrite and late “dirty” pyrite are the two dominant pyrite at Maligreen. The dirty pyrite is most likely “contaminated” by abundant magnetite due to the superimposed deep argillic alteration. However, the black colour could also be a result of the presence of molybdenite, arsenopyrite or sphalerite. Nevertheless, it is believed that the dirty pyrite is a result of late supergene enrichment due to the pervasive argillic alteration marked by the introduction of clay and magnetite (Mtetwa, 2007).
The relative proportion of dirty pyrite and clean pyrite varies significantly, but total pyrite content within the ore zones can reach 20-25%. Pyritised zones within the pyroclastic unit show clean pyrite as veins and veinlets which are always parallel to the bedding of the bedded tuff. Some of them are auriferous but generally do not show extreme grades. This could represent the formation of an early exhalative mineralization (Mtetwa, 2007).
The possible mechanism for the Maligreen gold deposition is likely a fluid flow, aided and abetted by high level rhyolitic intrusions, and redistributed through permeable secondary shear zones due to late dextral duplex-like segmentation.
Mineral Resources Estimate
Refer to Exhibit 15.5 or the technical report summary titled “S-K 1300 Technical Report Summary on the Maligreen Gold Project, Zimbabwe”, with an effective date of December 31, 2022, for key assumptions, parameters, and methods used to estimate the mineral resources and risks that could materially affect the mineral resource. This technical report summary estimated the mineral resources at the Maligreen Gold Project as at December 31, 2022. Qualified Person Uwe Engelmann has confirmed that there was no change in the mineral resource estimate between December 31, 2022 and December 31, 2023.
The mineral resources have been depleted by means of the topography and mining voids. Discounts applied to the mineral resources include geological losses of 5% for Measured, 10% for Indicated and 15% for Inferred mineral resources to account for geological, data as well as estimation uncertainty. The gold content conversion calculations utilise a conversion of 1 kg = 32.15076 oz and all tonnages are reported in metric tonnes. Inferred mineral resources have a low level of confidence and while it would be reasonable to expect that the majority of Inferred mineral resources would upgrade to Indicated mineral resources with continued exploration, due to the uncertainty of Inferred mineral resources, it should not be assumed that such upgrading will occur.
The mineral resources are declared as the portion of the Resource that is potentially mineable from open pit as well as from underground, as part of the reasonable prospects for eventual economic extraction. An optimised pit was generated to evaluate the depth to which surface mining could occur. Based on this analysis a depth of 220 m was defined as the level to which surface mining can occur and is reported at a 0.4 g/t cut-off (Table: Surface Mineral Resource for Maligreen Gold Mine as at December 31, 2023). Below this all mineral resources are declared as underground, with a 1.5 g/t cut-off.
Surface Mineral Resource Tabulation for Maligreen as at December 31, 2023.
| Domain |
Mineral Resource Category |
Tonnes (Less Geological Losses) |
Gold Grade |
Gold Content |
| Mt |
g/t |
koz |
||
|
|
Measured |
0.30 |
0.87 |
8.3 |
| North | Indicated |
3.01 |
1.38 |
133.1 |
| Total Measured and Indicated |
3.30 |
1.33 |
141.4 |
|
| Inferred |
1.01 |
1.09 |
35.5 |
|
|
|
Measured |
1.35 |
2.70 |
117.2 |
| South | Indicated |
0.75 |
4.17 |
101.9 |
| Total Measured and Indicated |
2.10 |
3.23 |
218.2 |
|
| Inferred |
0.49 |
6.05 |
95.3 |
|
|
|
Indicated |
1.68 |
0.80 |
43.1 |
| SplayNW | Total Measured and Indicated |
1.68 |
0.80 |
43.1 |
| Inferred |
2.08 |
0.81 |
54.0 |
|
|
|
Indicated |
0.85 |
1.15 |
31.4 |
| SplaySW | Total Measured and Indicated |
0.85 |
1.15 |
31.4 |
| Inferred |
1.00 |
1.37 |
44.0 |
|
| Total Measured and Indicated |
7.94 |
1.70 |
434.1 |
|
| Total Inferred |
4.58 |
1.55 |
228.8 |
|
Notes:
| 1. |
Mineral resource Cut-off of 0.4 g/t Au applied. |
| 2. |
A gold price of USD1,800/oz was used for the cut-offs. |
| 3. |
Columns may not add up due to rounding. |
| 4. |
Mineral resources are reported as total Mineral resources and 100% attributable to Caledonia. |
| 5. |
Plant recovery factor of 80% applied. |
Underground Mineral Resource Tabulation for Maligreen as at December 31, 2023.
| Domain |
Mineral Resource Category |
Tonnes (Less Geological Losses) |
Gold Grade |
Gold Content |
| Mt |
g/t |
koz |
||
|
|
Indicated |
0.09 |
2.88 |
8.2 |
| North | Total Measured and Indicated |
0.09 |
2.88 |
8.2 |
| Inferred |
1.13 |
2.42 |
87.7 |
|
|
|
Indicated |
0.00 |
12.57 |
0.0 |
| South | Total Measured and Indicated |
0.00 |
12.57 |
0.0 |
| Inferred |
0.33 |
8.69 |
93.5 |
|
| SplayNW |
Inferred |
0.13 |
2.51 |
10.3 |
| SplaySW |
Inferred |
0.00 |
1.58 |
0.0 |
| Total Measured and Indicated |
0.09 |
2.89 |
8.2 |
|
| Total Inferred |
1.59 |
3.75 |
191.5 |
|
Notes:
| 1. |
Mineral resource Cut-off of 1.5 g/t Au applied. |
| 2. |
A gold price of USD1,800/oz was used for the cut-offs. |
| 3. |
Columns may not add up due to rounding. |
| 4. |
Mineral resources are reported as total mineral resources and 100% attributable to Caledonia. |
| 5. |
Plant recovery factor of 80% applied. |
The combined surface and underground mineral resource is shown in the below table, this shown at 0.4 g/t and 1.5 g/t for surface and underground respectively.
Total Mineral Resource Tabulation for Maligreen as at December 31, 2023.
| Domain |
Mineral Resource Category |
Tonnes (Less Geological Losses) |
Gold Grade |
Gold Content |
| Mt |
g/t |
koz |
||
|
|
Measured |
0.30 |
0.87 |
8.3 |
| North | Indicated |
3.09 |
1.42 |
141.3 |
| Total Measured and Indicated |
3.39 |
1.37 |
149.6 |
|
| Inferred |
2.14 |
1.79 |
123.2 |
|
|
|
Measured |
1.35 |
2.70 |
117.2 |
| South | Indicated |
0.75 |
4.17 |
101.0 |
| Total Measured and Indicated |
2.10 |
3.23 |
218.2 |
|
| Inferred |
0.82 |
7.12 |
188.8 |
|
| SplayNW |
Indicated |
1.68 |
0.80 |
43.1 |
| Total Measured and Indicated |
1.68 |
0.80 |
43.1 |
|
| Inferred |
2.21 |
0.91 |
64.3 |
|
| SplaySW |
Indicated |
0.85 |
1.15 |
31.4 |
| Total Measured and Indicated |
0.85 |
1.15 |
31.4 |
|
| Inferred |
1.00 |
1.37 |
44.0 |
|
| Total Measured |
1.65 |
2.37 |
125.5 |
|
| Total Indicated |
6.37 |
1.55 |
316.8 |
|
| Total Measured and Indicated |
8.03 |
1.71 |
442.3 |
|
| Total Inferred |
6.17 |
2.12 |
420.3 |
|
Notes:
| 1. |
Mineral resource Cut-off of 0.4 g/t Au for surface and 1.5 g/t Au for underground applied. |
| 2. |
A gold price of USD1,800/oz was used for the cut-offs. |
| 3. |
Columns may not add up due to rounding. |
| 4. |
Mineral resources are reported as total mineral resources and 100% attributable to Caledonia. |
| 5. |
Plant recovery factor of 80% applied. |
Exploration and Planned Work
There has been no further exploration activities at the Maligreen property during 2023.
Any future work will be conducted in line with QAQC protocols as described in the Technical Report Summary for Maligreen, Exhibit 15.5.
Motapa
Property Description and Ownership
The Motapa project is an exploration stage project at which no Subpart 1300 mineral reserves or mineral resources have been identified. The registered mining lease held by Arraskar (the “Motapa Mining Lease”) covers an area of 2,224 ha located in a brownfield exploration and mining area in the Inkosikazi resettlement area, Matabeleland North. The Motapa Mining Lease covers a geological strike close to 5 km. Motapa is accessed by wide tar road from Bulawayo for the first 40 km followed by a poorly maintained narrow-width tarred section for 65 km. An extensive gravel road network links various sites at the Motapa Mining Lease area. As at December 31, 2023, the exploration and evaluation cost of the Motapa project was $10.6 million. Refer to note 17 of the Consolidated Financial Statements for more information.
Three lineament zones have been identified namely the Northern, Central and Southern zones, commonly referred to as Motapa North, Motapa Central and Motapa South, respectively. Several pits have been mined in each zone. The regional strike and lithological contacts trend north-east to south-west and are dominated by the Peter Pan and the Courtleigh fault systems.
When Motapa was acquired by Metallon Corporation in December 2003 no mining activities had taken place since the year 2000 and its closure by Anglo American Corporation. At the time of acquisition, mining activities had ceased and remnant infrastructure included two shafts and a residential compound.
Below is the location of Motapa on the Zimbabwean Map.
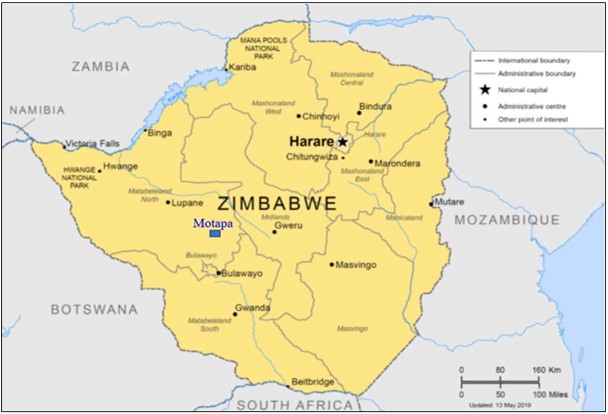
The figure below illustrates the open pits, oxide targets, core holes and infrastructure.
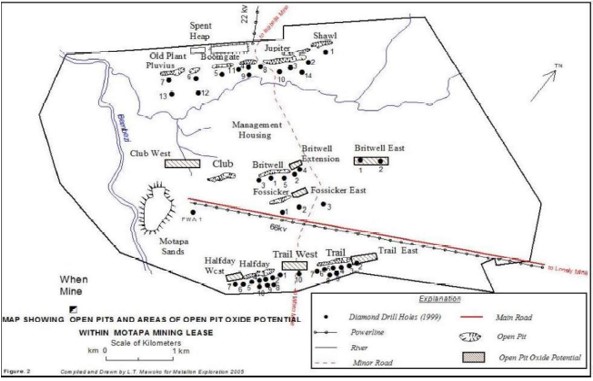
The oxides are amenable to heap-leach extraction of gold. However, the arsenical sulphide ore is refractory. Several bench-scale and laboratory tests at Bilboes’ Isabella and Bubi before the year 2000 showed that good recoveries (90+%) are likely from bio-oxidation of a sulphide concentrate.
However, some of the work initiated by AMZIM (the gold operating subsidiary of Anglo American Corporation in Zimbabwe) was not completed and a priority will be to finalize potential extraction routes for the sulphides while exploiting the remaining oxides.
History
Historically, we understand that over 3 million tonnes were mined from underground operations down to 11 level and processed through a 25,000 tonnes per month plant between 1949-1959. Total gold production for the mine until 1990 was approximately 300,000 ounces from 2.4 million tonnes of ore, averaging 5.4 g/t.
When Motapa mine was acquired by Metallon Corporation in December 2003 no mining activities had taken place since the year 2000 closure by Anglo American Corporation.
On November 2, 2022 Caledonia announced that it had purchased Motapa Mining Company UK Limited, the parent company of a Zimbabwe subsidiary (Arraskar) which holds the Motapa Mining Lease.
Present Conditions and Infrastructure
The area is generally flat and covered by woodland interspersed with patches of grass and a major river (Mdutshana) flows through the property. The direction of flow is NE to SW. The location is at an altitude of about 1,148m above sea level.
The erratic and low rainfall makes the area unsuitable for cultivation and agricultural activities are restricted to ranching.
There are no obvious topographic, climatic, land use or other constraints that could materially affect production or exploration activities.
The property is accessible from Bulawayo by a tarred road, and by gravel roads within the Mining Mining Lease area. It is connected to the national power grid and obtains sufficient water from old pits and boreholes.
Permitting, Licenses and Encumbrances
Motapa is compliant in terms of authorizations and adheres to all government protocols and regulations as required.
The Motapa Mining Lease is registered with Number 22, issued on October 13, 1994, and covers 2,224 ha and is current. The lease is renewed annually and an inspection must be performed by the Ministry of Mines and requisite fees paid. A mining lease comprises claims consolidated into one mining unit. The Company ensures that the lease is up to date.
Geological Setting, Mineralization and Deposit
The Motapa deposit comprises three identified discrete, parallel shear-hosted mineralized zones, namely:
| 1. |
Motapa North: with four sub-zones Pluvius and Jupiter. Pluvius is split into two named Pluvius123 and Pluvius5 with an information gap between them that assumes the possible existence of Pluvius4. |
| 2. |
Motapa Central: with three subzones Club, Britwell and Britwell East. There is Fossicker sub- parallel to Club and Britwell, but no data is available for evaluation, except that its existence is evidenced by a historical pit. |
| 3. |
Motapa South: with two subzones Halfday and Trail. |
Exploration and Planned Work
Substantive exploration work at Motapa can commence after an Environmental Impact Assessment (“EIA”) has been approved by the Zimbabwe authorities. An EIA report was submitted in July 2023 and certification was received in August 2023 paving way for exploration work to commence.
The Motapa exploration program entails the exploration of the deeper lying sulphide mineralisation at Motapa and will be achieved through a combination of reverse circulation and diamond drilling. It is planned to commence at a later date still to be determined.
Not applicable.
The following Operating and Financial Review and Prospects section is intended to help the reader understand the factors that have affected the Company's financial condition and results of operations for the historical period covered by the financial statements and management's assessment of factors and trends which are anticipated to have a material effect on the Company's financial condition and results in future periods. This section is provided as a supplement to, and should be read in conjunction with, our Consolidated Financial Statements and the other financial information contained elsewhere in this document. Our Consolidated Financial Statements have been prepared in accordance with IFRS. Our discussion contains forward-looking information based on current expectations that involve risks and uncertainties, such as our plans, objectives and intentions. Our actual results may differ from those indicated in such forward-looking statements.
The key drivers of our operating results and principal activities are:
| ● |
revenue, which is influenced by: |
| o |
the price of gold, which fluctuates in terms of the realized USD gold price obtained; and |
|
| o |
our production tonnages and gold content thereof, impacting on the amount of gold we produce at our operations; |
| ● |
our cost of producing gold; and |
| ● |
other significant matters affecting profitability. |
Revenue
Revenue increased to $146,314,000 in fiscal year 2023 from $142,082,000 in fiscal year 2022, (2021: $121,329,000). Gold produced was 78,466 oz. (2022: 80,775 oz.; 2021: 67,476 oz). The increase in revenue was due to an increase in the average realized gold price received to $1,910 per oz. (2022: $1,772 per oz.; 2021: $1,766 per oz.), offset by lower ounces sold in 2023 compared to 2022 (see below).
Gold price
Average realized gold price per ounce is a non-IFRS measure which management believes assists the stakeholders in understanding the average price obtained for an ounce of gold.
Our revenues are primarily derived from the sale of gold produced by Blanket Mine. As a result, our revenues are directly influenced by the average realized gold price obtained from the sale of gold. The gold prices obtained may fluctuate widely and are influenced by factors beyond the control of the Company. The table below indicates the average realized gold price per ounce obtained for the 2023, 2022 and 2021 fiscal years.
| $’000 |
2021 |
2022 |
2023 |
|||||||||
| Revenue (IFRS) |
121,329 | 142,082 | 146,314 | |||||||||
| Revenue from silver sales |
(122 | ) | (116 | ) | (118 | ) | ||||||
| Revenue from gold sales |
121,207 | 141,966 | 146,196 | |||||||||
| Gold ounces sold |
68,617 | 80,094 | 76,532 | |||||||||
| Average realized gold price per ounce |
1,766 | 1,772 | 1,910 | |||||||||
Gold produced
Tonnes milled, average grades, recoveries and gold produced are shown in the table below.
| Blanket Mine Production Statistics |
|||||
| Year |
Tonnes Milled (t) |
Gold Head (Feed) Grade (g/t Au) |
Gold Recovery (%) |
Gold Produced (oz.) |
|
| Quarter 1 |
2021 |
148,513 |
2.98 |
93.0 |
13,197 |
| Quarter 2 |
2021 |
165,760 |
3.34 |
93.8 |
16,710 |
| Quarter 3 |
2021 |
179,577 |
3.48 |
94.2 |
18,965 |
| Quarter 4 |
2021 |
171,778 |
3.57 |
94.3 |
18,604 |
| Year |
2021 |
665,628 |
3.36 |
93.9 |
67,476 |
| Quarter 1 |
2022 |
165,976 |
3.69 |
94.1 |
18,515 |
| Quarter 2 |
2022 |
179,118 |
3.71 |
93.9 |
20,091 |
| Quarter 3 |
2022 |
198,495 |
3.53 |
93.6 |
21,120 |
| Quarter 4 |
2022 |
208,444 |
3.37 |
93.7 |
21,049 |
| Year |
2022 |
752,033 |
3.56 |
93.8 |
80,775 |
| Quarter 1 |
2023 |
170,721 |
3.11 |
93.8 |
16,036 |
| Quarter 2 |
2023 |
179,087 |
3.22 |
94.0 |
17,436 |
| Quarter 3 |
2023 |
208,902 |
3.46 |
93.7 |
21,772 |
| Quarter 4 |
2023 |
211,730 |
3.17 |
93.6 |
20,172 |
| Year |
2023 |
770,440 |
3.25 |
93.8 |
75,416 |
| Quarter 1 |
2024 |
175,101 |
3.23 |
93.9 |
17,050 |
Ounces produced decreased by 6.6% from 2022 to 2023. Tonnes milled in the year were 2.5% higher than 2022. Recoveries in the year remained the same as in 2022.
Production cost
Production cost includes salaries and wages, on mine administration, consumable materials and electricity and other related costs incurred in the production of gold. Production cost for 2023, 2022 and 2021 is summarized below.
| $ ‘000 |
2023 |
2022 |
2021 |
||||||||||
| Blanket Mine |
69,591 | 62,998 | 53,126 | ||||||||||
| Salaries and wages |
23,227 | 23,037 | 20,609 | ||||||||||
| Consumable materials |
26,017 | 23,601 | 17,375 | ||||||||||
| Consumable materials – COVID-19 |
– | 311 | 297 | ||||||||||
| Electricity costs |
13,496 | 9,634 | 10,407 | ||||||||||
| Safety |
1,155 | 998 | 774 | ||||||||||
| Cash-settled share-based expense |
637 | 853 | 692 | ||||||||||
| On mine administration |
2,669 | 2,736 | 1,806 | ||||||||||
| Security |
1,020 | 1,093 | 826 | ||||||||||
| Solar operations and maintenance services |
647 | – | – | ||||||||||
| Obsolete inventory |
282 | 563 | 36 | ||||||||||
| Pre-feasibility exploration costs |
441 | 172 | 304 | ||||||||||
| Bilboes |
13,118 | – | – | ||||||||||
| Salaries and wages |
2,796 | – | – | ||||||||||
| Consumable materials |
8,402 | – | – | ||||||||||
| Electricity costs |
553 | – | – | ||||||||||
| Cash-settled share-based expense |
23 | – | – | ||||||||||
| On mine administration |
1,344 | – | – | ||||||||||
| 82,709 | 62,998 | 53,126 | |||||||||||
On-mine cost, all-in sustaining cost (“AISC”) and all-in cost per ounce
On-mine cost, AISC and all-in cost per ounce are non-IFRS cost measures which management believes assist the stakeholders in understanding the cost structures of the Company. The table below reconciles production cost as stated in terms of IFRS to these cost measures.
A narrow focus on the direct costs of production (mainly labour, electricity and consumables) does not fully reflect the total cost of gold production. Accordingly, cost per ounce data for the fiscal year and previous fiscal years has been prepared in accordance with the Guidance Note issued by the World Gold Council on June 23, 2013 and is set out in the table below on the following bases:
| i. |
On-mine cost per ounce, which shows the on-mine costs of producing an ounce of gold and includes direct labour, electricity, consumables and other costs that are incurred at the mine including insurance, security and on-mine administration; |
| ii. |
All-in sustaining cost (“AISC”) per ounce, which shows the on-mine cost per ounce plus royalty paid, additional costs incurred outside the producing mines (i.e. at offices in Harare, Johannesburg, London and Jersey), costs associated with maintaining the operating infrastructure and reserve base that are required to maintain production at the current levels (sustaining capital investment), the share-based expense (or credit) arising from the long-term incentive plan awards (the “LTIPs”) less silver by-product revenue. |
| iii. |
All-in cost per ounce, which shows AISC per ounce plus the additional costs associated with activities that are undertaken to increase production (expansion capital investment). |
| Reconciliation of IFRS Production Cost to Non-IFRS Costs per ounce For 12 months ended December 31 |
||||||||||||||||||||||||
| ($’000’s, unless otherwise indicated) |
||||||||||||||||||||||||
| Bilboes Oxides |
Blanket |
Consolidated |
||||||||||||||||||||||
| 2023 |
2022 |
2023 |
2022 |
2023 |
2022 |
|||||||||||||||||||
| Production cost (IFRS) |
13,094 | - | 69,615 | 62,998 | 82,709 | 62,998 | ||||||||||||||||||
| COVID-19 labour and consumable expenses |
- | - | - | (311 | ) | - | (311 | ) | ||||||||||||||||
| Cash-settled share-based expense |
(10 | ) | - | (650 | ) | (853 | ) | (660 | ) | (853 | ) | |||||||||||||
| Less exploration and safety costs |
- | - | (1,155 | ) | (998 | ) | (1,155 | ) | (998 | ) | ||||||||||||||
| On-mine admin costs, employee incentives and intercompany adjustments |
- | - | (797 | ) | (1,970 | ) | (797 | ) | (1,970 | ) | ||||||||||||||
| On-mine production cost* |
13,084 | - | 67,013 | 58,866 | 80,097 | 58,866 | ||||||||||||||||||
| Gold sales (oz) |
3,050 | - | 73,482 | 80,094 | 76,532 | 80,094 | ||||||||||||||||||
| On-mine cost per ounce ($/oz) |
4,290 | - | 912 | 735 | 1,047 | 735 | ||||||||||||||||||
| Royalty |
319 | - | 7,318 | 7,124 | 7,637 | 7,124 | ||||||||||||||||||
| Exploration, remediation and permitting cost |
- | - | 55 | 146 | 55 | 146 | ||||||||||||||||||
| Sustaining capital expenditure# |
154 | - | 17,199 | 1,880 | 17,353 | 1,880 | ||||||||||||||||||
| Sustaining administrative expenses& |
- | - | 8,485 | 3,191 | 8,485 | 3,191 | ||||||||||||||||||
| Inventory write-down |
- | - | (283 | ) | (563 | ) | (283 | ) | (563 | ) | ||||||||||||||
| Silver by-product credit |
(4 | ) | - | (114 | ) | (116 | ) | (118 | ) | (116 | ) | |||||||||||||
| Cash-settled share-based payment expense included in production cost |
- | - | 660 | 853 | 660 | 853 | ||||||||||||||||||
| Cash-settled share-based payment expense |
- | - | 463 | 609 | 463 | 609 | ||||||||||||||||||
| Equity-settled share-based payment expense |
- | - | 640 | 484 | 640 | 484 | ||||||||||||||||||
| Procurement margin included in on-mine cost* |
- | - | (4,422 | ) | (2,163 | ) | (4,422 | ) | (2,163 | ) | ||||||||||||||
| All-in sustaining cost |
13,553 | - | 97,014 | 70,311 | 110,567 | 70,311 | ||||||||||||||||||
| Gold sales (oz) |
3,050 | - | 73,482 | 80,094 | 76,532 | 80,094 | ||||||||||||||||||
| AISC per ounce ($/oz) |
4,444 | - | 1,320 | 878 | 1,445 | 878 | ||||||||||||||||||
| Non-sustaining administrative expenses& |
- | - | 6,044 | 10,918 | 8,944 | 10,918 | ||||||||||||||||||
| Permitting and exploration expenses |
- | - | 32 | 59 | 32 | 59 | ||||||||||||||||||
| Covid 19 expenses |
- | - | - | 311 | - | 311 | ||||||||||||||||||
| Non-sustaining capital expenditure# |
- | 12,253 | 45,555 | 12,253 | 45,555 | |||||||||||||||||||
| Total all-in cost |
16,453 | - | 115,343 | 127,154 | 131,796 | 127,154 | ||||||||||||||||||
| Gold sales (oz) |
3,050 | - | 73,482 | 80,094 | 76,532 | 80,094 | ||||||||||||||||||
| All-in cost per ounce ($/oz) |
5,394 | - | 1,570 | 1,588 | 1,722 | 1,588 | ||||||||||||||||||
| * |
The on-mine cost reflects the cost incurred on-mine to produce gold. The procurement margin on consumable sales between CMSA and Blanket is not deducted from on-mine cost as the cost represents a fair value that Blanket would pay for consumables if they were sourced from a third party. The procurement margin on these sales is deducted from all-in sustaining costs and all-in costs as these numbers represent the consolidated costs at a group level, excluding intercompany profit margins. |
| & |
Administrative expenses relate to costs incurred by the Group to provide services for mining and related activities. From quarter four in 2022 administrative expenses have been allocated between AISC and all-in cost. |
| # |
Non-sustaining costs are primarily those costs incurred at ‘new operations’ and costs related to ‘major projects at existing operations’ where these projects will materially benefit the operation. All other costs related to existing operations are considered sustaining. |
On-mine cost
On-mine cost comprises labour, electricity, consumables, and other costs such as security and insurance which are directly related to production. Production costs are detailed in note 9 to the Consolidated Financial Statements. On-mine costs include the procurement margin paid to CMSA. CMSA purchasing represents a fair value that Blanket would pay for consumables if they were sourced from a third party and intercompany margins are not eliminated to calculate on-mine cost.
On-mine cost per ounce for the year was 42.5% higher than the previous year due to Bilboes costs being included.
The increase in on-mine cost per ounce compared to the comparative fourth quarter for 2023 is illustrated in the graph below.
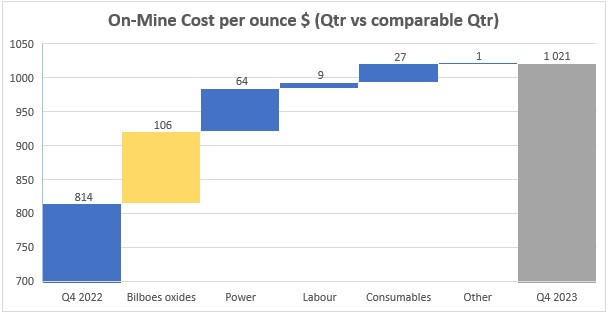
The cost of oxide mining at Bilboes contributed $106 per ounce to the overall increase in the on-mine cost per ounce. The large amount of waste that was moved to access the oxide mineralization proved costly and Bilboes had an on-mine cost of $3,106 per ounce in the fourth quarter of 2023. Due to the oxide mining activities incurring losses, it was placed on care and maintenance at the end of September 2023. Leaching activities related to the heap leach pad will continue as long as it contributes to the care and maintenance cost of the Bilboes oxide mine. The net book value of the Bilboes oxide mine of $851,000 was impaired in the second quarter of 2023, as the oxide mine could not be run economically without including the sulphide project. Waste removal when designing the pit for the sulphide project will allow access to the oxide ounces and the sulphide ounces and justify the cost over more ounces.
Production costs at Blanket increased from 2022 due to the higher than anticipated use of electricity due to the continued heavy use of infrastructure such as the No. 4 Shaft and Jethro Shaft which will be used more sparingly following the commissioning of the Central Shaft. The electricity usage is expected to reduce over the next 2 years as Blanket transitions from the old mine infrastructure and mining activities become more centralised in areas that the Central Shaft provides access to. Management is reviewing the timing of closing down other shafts and machinery or using the infrastructure more efficiently, thereby reducing power consumption in the future.
In April 2023 Blanket concluded a power supply agreement with the Intensive Energy Users Group (“IEUG") and the Zimbabwean power utility to allow the IEUG to obtain power outside Zimbabwe which is "wheeled” to the IEUG members. During the fourth quarter of 2023 Blanket paid less for IEUG sourced energy but the incidences of power outages and low voltage occurrences did not reduce due to the poor condition of the Zimbabwe grid which meant that diesel costs were incurred to supplement the low voltage occurrences. Management is conducting a study on how to alleviate the effect of the low voltage occurrences in the most economical manner.
The benefit of the solar plant is not recognised in on-mine cost because the solar plant (which is 100% owned by Caledonia) sells power to Blanket at a price per kilowatt/hour which reflects Blanket's historic blended cost per unit of power. The economic benefit of the solar plant is therefore recognised by Caledonia, rather than by Blanket, and the benefit ($38 per ounce of gold produced in 2023) is reflected in the AISC rather than the on-mine cost. The solar plant had the added benefit of stabilising the Blanket electrical grid by improving the power factor and in turn reducing generator usage to supplement reactive power.
Labour costs at Blanket increased during the fourth quarter of 2023 due to increased overtime hours, increased employment numbers at Blanket and inflationary increases. Management is investigating measures to utilise its workforce more efficiently and reduce overtime in future quarters.
Consumable costs per ounce at Blanket in 2023 increased compared to 2022 due to the cost to truck ore from the Central shaft to the metallurgical plant which is located close to the No. 4 Shaft area and increased explosive costs. Management is performing a cost study to assess the benefit of installing a conveyor to transport ore from Central Shaft to the metallurgical plant; an investigation has started to improve blasting techniques.
The on-mine cost per ounce at Blanket in 2023 was $912 which is within the guidance range of $860 to $950 per ounce. Guidance for cost per ounce at the Bilboes oxide mine was withdrawn in April 2023 when production guidance was also withdrawn.
All-in sustaining cost
All-in sustaining cost includes inter alia administrative expenses incurred outside Zimbabwe and excludes the intercompany procurement margin and the benefits of solar power as this reflects the consolidated cost incurred at the Group level. Accordingly, the all-in sustaining cost can only be calculated at a consolidated level and not at the level of individual operations.
During 2023 capital development cost of $9.5m was classified as sustaining capital expenditure due to the capital development cost incurred in the run of mine processes with no increase in production. In 2022 the capital development cost was classified as non-sustaining capital expenditure. This was mitigated somewhat by an increase in the intercompany procurement margin (which is deducted from on-mine cost for the purposes of calculating the consolidated AISC).
The AISC per ounce in 2023 increased by 64.6% compared to 2022, predominantly due to the higher on-mine cost per ounce and an increase in sustaining capital expenditure.
The increase in AISC per ounce in the fourth quarter of 2023 compared to the comparative quarter is illustrated in the graph below:
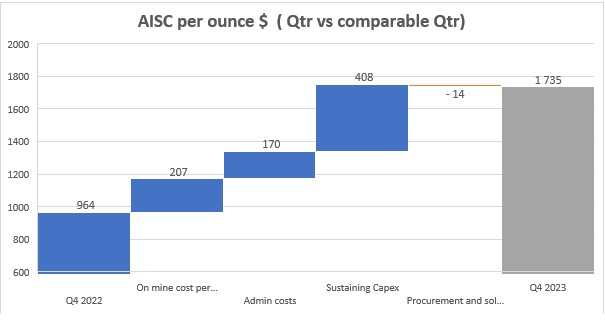
All-in cost
All-in cost includes investment in expansion projects at Blanket and Bilboes which remained at a high level due to the continued investments in the Group. All-in cost does not include pre-feasibility investment in exploration and evaluation projects.
Other significant matters affecting profitability
Administrative expenses
Administrative expenses include the costs of Caledonia’s offices and personnel in Harare, Johannesburg, Bulawayo, the UK and Jersey which provide the following functions: technical services, finance, procurement, investor relations, corporate development, legal and company secretarial.
Administrative expenses in 2023 include a once-off $3.1 million paid to advisors on the successful conclusion of the Bilboes Gold Limited acquisition in January 2023. Wages and salaries in 2023 further increased following the absorption of certain administrative and executive functions following the completion of the Bilboes transaction and these resources have been deployed to working on the Bilboes feasibility study and have provided an enhanced degree of executive support in Harare. There has also been an increase in headcount in the Mineral Resource Management team in Johannesburg to support the implementation of a digital resource modelling and mine planning system. The digital mine planning tools allow for more flexible mine planning which has already resulted in real-time amendments to the mine plan which has reduced expenditure on capital development planned for 2024 and may result in further efficiencies in future years. An individual has also been recruited to improve the monitoring and reporting of the group’s environmental footprint in recognition of the increased stakeholder scrutiny in this area.
Administrative expenses are further analyzed in note 11 of the Consolidated Financial Statements.
Other expenses
Other expenses are detailed in note 10 to the Consolidated Financial Statements and include an impairment expense on property, plant and equipment of $877,000. Included in this amount is the impairment loss that was recognised amounted to a carrying value of $851,000 on impairing the Bilboes oxide asset classified under mine development, infrastructure and other. On June 27, 2023 the decision was taken to place the Bilboes oxide mine on care and maintenance as the cost related to removing the waste and accessing the orebody could exceed the benefit from the gold revenues to be received. Mining and metallurgical processing continued at the Bilboes oxide mine until the end of September 2023 when the contract miner's notice period came to an end. Leaching of material that has already been deposited on the leach pad will continue while the revenue from these activities contributes to the cost of the asset. Oxide mining and processing will resume when the stripping of the waste for the sulphide project commences and can be economically justified.
Other expenses also include CSR expenses of $1,504,000 and impairment of $720,000 for the Solar VAT and duty receivable. Intermediated monetary transaction tax (“IMTT”) charged by the Zimbabwean government increased to $1,266,000 for 2023. IMTT is levied at a rate of 2% on RTGS$ denominated transactions and 1% on local foreign currency denominated transactions and outbound foreign payments.
Foreign exchange gains
On October 1, 2018 the RBZ issued a directive to Zimbabwean banks to separate foreign currency from RTGS$ in the accounts held by their clients and pegged the RTGS$ at 1:1 to the US Dollar. On February 20, 2019 the RBZ issued a further monetary policy statement, which allowed inter-bank trading between RTGS$ and foreign currency. The interbank rate was introduced at 2.5 RTGS$ to 1 US Dollar and traded at 6,104.72 RTGS$ to 1 US Dollar as at December 31, 2023 (December 31, 2022: 684.33 RTGS$). The US dollar has remained the primary currency in which the Group’s Zimbabwean entities operate and the functional currency of these entities.
In June 2021 the RBZ announced that companies that are listed on the VFEX will receive 100% of the revenue arising from incremental production in US Dollars. Blanket has subsequently received confirmation that the “baseline” level of production for the purposes of calculating incremental production is 148.38 Kg per month (approximately 57,000 ounces per annum). The payment of the increased US Dollars proceeds for incremental production was applied from July 1, 2021. In December 2021, Caledonia obtained a secondary listing on the VFEX and Blanket received all amounts due in terms of that revised policy. The CMCL listing on the VFEX enabled Blanket to receive approximately 72.74% of its total revenue in US Dollars and the balance in RTGS$.
On February 3, 2023, the RBZ issued Exchange control directive RY002/2023 stating that with effect from February 6, 2023, the US$ export retention threshold across all sectors, including companies listed on the VFEX, had been standardized to 75% of export proceeds. The incremental export incentive scheme was also discontinued with effect from February 1, 2023. On April 5, 2024, the Zimbabwean government introduced the ZiG and confirmed that the retention threshold will remain unchanged.
The table below illustrates the effect the weakening of the RTGS$ and other foreign currencies had on the consolidated statement of profit or loss and other comprehensive income.
| ‘$000 |
2023 |
2022 |
2021 |
|||||||||
| Unrealised foreign exchange gain |
4,217 | 12,736 | 2,755 | |||||||||
| Realised foreign exchange loss |
(6,767 | ) | (8,325 | ) | (1,571 | ) | ||||||
| Net foreign exchange gain |
(2,550 | ) | 4,411 | 1,184 | ||||||||
Put Options
From December 2022 to the date of this Annual Report the Company had the following put options to hedge our gold price risk:
| Purchase date |
Ounces hedged |
Strike price |
Period of hedge |
||
| December 22, 2022 |
16,672 oz |
$1,750 | December 2022 - May 2023 |
||
| May 22, 2023 |
28,000 oz |
$1,900 | June - December 2023 |
||
| December 19, 2023 |
12,000 oz |
$1,950 | January - March 2024 |
||
| March 7, 2024 |
12,000 oz |
$2,050 | April to June 2024 |
||
| April 10, 2024 |
12,000 oz |
$2,100 | July – September 2024 |
Restricted Share Units and cash-settled Performance Units
Certain management and employees within the Group are granted Restricted Share Units (“RSUs”) and Performance Units (”PUs”) pursuant to provisions of the 2015 Omnibus Equity Incentive Compensation Plan (“OEICP”). All RSUs and PUs were granted and approved at the discretion of the Compensation Committee of the Board of Directors.
RSUs vest three years after grant date given that the service conditions of the relevant employees have been fulfilled. The value of the vested RSUs is the number of RSUs vested multiplied by the fair market value of the Company’s shares, as specified by the OEICP, on the date of settlement.
PUs have a performance condition based on gold production and, in recent awards, average normalised controllable cost per ounce of gold and a performance period of one to three years. The number of PUs that vest will be the relevant portion of the PUs granted multiplied by the performance multiplier, which will reflect the actual performance in terms of the performance conditions compared to expectations on the date of the award.
RSU holders are entitled to receive dividends over the vesting period. Such dividends will be reinvested in additional RSUs at the then applicable share price. PUs have rights to dividends only after they have vested.
RSUs and PUs allow for settlement of the vesting date value in cash or, subject to conditions, shares issuable at fair market value or a combination of both at the discretion of the unitholder.
Refer to note 12.1 of the Consolidated Financial Statements for more information on the share-based payment awards.
During 2023 an aggregate of 327,086 PUs were awarded respectively to executives as well as to certain senior management and certain employees within the companies in the Group. An example of the award agreements are attached hereto as Exhibits 4.20, and 4.21. Refer to note 12.1(a) of the Consolidated Financial Statement for a further analysis of cash-settled share-based payments granted and vested.
Equity-settled Performance Units
PUs which are classified as equity-settled (i.e. there is no option to vest in cash) (“EPUs”) have a performance condition based on gold production, average normalized controllable cost per ounce of gold and a performance period of three years. The number of EPUs that vest will be the relevant portion of the EPUs granted multiplied by the performance multiplier, which will reflect the actual performance in terms of the performance conditions compared to expectations on the date of the award.
EPUs have rights to dividends only after they have vested.
The shares issued are subject to a minimum holding period of until at least the first anniversary of the EPUs vesting date.
194,466 EPUs remain outstanding as at December 31, 2023, where 80,773 were granted to certain employees within the Group during 2023. An example of the award agreement is attached hereto as Exhibits 4.21. Refer to note 12.2(a) of the Consolidated Financial Statement for a further analysis of equity-settled share-based payments granted.
Adjusted earnings per share
“Adjusted earnings per share” is a non-IFRS measure which management believes assists investors to understand the Company’s underlying performance. The table below reconciles “adjusted earnings per share” to the profit/loss attributable to owners of the Company shown in the financial statements which have been prepared under IFRS. Adjusted earnings per share is calculated by deducting payments to BETS (the company that owns 10% of Blanket’s shares on behalf of an employee trust), foreign exchange gains and losses, impairments, deferred tax and inventory write-downs from the profit attributable to the owners of the Company.
| Reconciliation of Adjusted Earnings per Share (“Adjusted EPS”) to IFRS Profit Attributable to Owners of the Company |
||||||||||||
| ($’000’s, unless otherwise indicated) |
||||||||||||
| 2023 |
2022 |
2021 |
||||||||||
| Profit for the period (IFRS) |
(618 | ) | 22,866 | 23,142 | ||||||||
| Non-controlling interest share of profit for the period |
(3,580 | ) | (4,963 | ) | (4,737 | ) | ||||||
| Profit attributable to owners of the Company |
(4,198 | ) | 17,903 | 18,405 | ||||||||
| Blanket Mine Employee Trust adjustment |
(346 | ) | (517 | ) | (326 | ) | ||||||
| Earnings (IFRS) |
(4,544 | ) | 17,386 | 18,079 | ||||||||
| Weighted average shares in issue (thousands) |
18,626 | 12,831 | 12,170 | |||||||||
| IFRS EPS (cents) |
(24.4 | ) | 135.5 | 148.6 | ||||||||
| Add back/(deduct) amounts in respect of foreign exchange movements |
||||||||||||
| Realised net foreign exchange losses |
6,767 | 8,325 | 1,571 | |||||||||
| - less tax |
(1,666 | ) | (2,056 | ) | (381 | ) | ||||||
| - less non-controlling interest |
(670 | ) | (827 | ) | (153 | ) | ||||||
| Unrealised net foreign exchange gains |
(4,217 | ) | (12,736 | ) | (2,755 | ) | ||||||
| - less tax |
810 | 3,042 | 567 | |||||||||
| - less non-controlling interest |
349 | 1,265 | 270 | |||||||||
| Adjusted IFRS profit excl. foreign exchange |
(3,171 | ) | 14,399 | 17,198 | ||||||||
| Weighted average shares in issue (thousands) |
18,626 | 12,831 | 12,170 | |||||||||
| Adjusted IFRS EPS excl. foreign exchange (cents) |
(17.0 | ) | 112.2 | 141.3 | ||||||||
| Add back/(deduct) amounts in respect of: |
||||||||||||
| Reversal of Blanket Mine Employee Trust adjustment |
346 | 517 | 326 | |||||||||
| Impairment of property, plant and equipment |
877 | 8,209 | 497 | |||||||||
| Impairment of E&E assets |
- | 467 | 3,837 | |||||||||
| Expected credit losses on deferred consideration on the disposal of subsidiary |
- | - | 761 | |||||||||
| Bilboes pre-operational expenses |
- | 830 | - | |||||||||
| Deferred tax |
4,358 | 3,796 | 5,240 | |||||||||
| Non-controlling interest portion deferred tax and impairment |
(555 | ) | (1,629 | ) | (602 | ) | ||||||
| Inventory write-down |
283 | 563 | - | |||||||||
| - less tax |
(70 | ) | (139 | ) | - | |||||||
| Fair value losses on derivative financial instruments |
1,119 | 1,198 | 240 | |||||||||
| Adjusted profit |
3,187 | 28,211 | 27,497 | |||||||||
| Weighted average shares in issue (thousands) |
18,626 | 12,831 | 12,170 | |||||||||
| Adjusted EPS (cents) |
17.1 | 219.9 | 225.9 | |||||||||
Cash and cash equivalents
| $’000 |
2023 |
2022 |
||||||
| Bank balances |
4,252 | 4,737 | ||||||
| Restricted cash * |
2,456 | 1,998 | ||||||
| Cash and cash equivalents |
6,708 | 6,735 | ||||||
| Bank overdrafts used for cash management purposes @ |
(17,740 | ) | (5,239 | ) | ||||
| Net cash and cash equivalents |
(11,032 | ) | 1,496 | |||||
| * |
Cash of $2,456 (denominated in RTGS$) held by Blanket Mine was earmarked by Stanbic Bank Zimbabwe as a letter of credit in favor of CMSA. The letter of credit was issued by Stanbic Bank Zimbabwe on November 28, 2023 and settled in January, 2024. The cash on maturity was transferred to CMSA’s bank account, denominated in South African Rands. |
||
| @ |
Interest paid on bank overdraft was $1,657 (2022: $192). |
||
Blanket Mine has arranged unsecured overdraft facilities with the following banks and terms.
| Overdraft facilities and term loans |
Date drawn |
Expiry |
Repayment terms |
Principal value |
Balance drawn at December 31, 2023 |
| Stanbic Bank - RTGS$ denomination |
September 2023 |
March 2024 |
On demand |
RTGS$300 million |
$Nil |
| Stanbic Bank - USD denomination |
September 2023 |
March 2024 |
On demand |
$4 million |
$3.8 million |
| Ecobank - USD denomination |
November 2022 |
December 2024 |
On demand |
$5 million |
$5 million |
| Nedbank Zimbabwe - USD denomination |
December 2022 |
April 2024 |
On demand |
$3.5 million |
$3.4 million |
| Nedbank Zimbabwe term loan - USD denomination |
April 2023 |
April 2024 |
On demand |
$3.5 million |
$3.5 million |
| CABS – USD denomination |
August 2023 |
July 2024 |
On demand |
$2 million |
$2 million |
The distribution of the consolidated cash across the jurisdictions where the Group operates as at year end was as follows:
| Geographical location of cash ($’000) |
||||||||
| 2023 |
2022 |
|||||||
| Jersey, Channel Islands/ United Kingdom |
1,668 | 2,962 | ||||||
| South Africa |
1,051 | 694 | ||||||
| Zimbabwe (net of overdraft) |
(13,751 | ) | (2,160 | ) | ||||
| Total net cash and cash equivalents |
(11,032 | ) | 1,496 | |||||
An analysis of the sources and uses of Caledonia’s cash is set out in the Consolidated Statements of Cash Flows in the Consolidated Financial Statements.
As of December 31, 2023, Caledonia had a working capital surplus of $14,096,000 (2022: 5,986,000; 2021: $35,245,000). As of December 31, 2023, Caledonia had potential liabilities for rehabilitation work on Blanket (2023 and prior), Motapa, Maligreen (2023 and prior) and Bilboes – if and when those mines permanently close – at an estimated present value cost of $10,985,000 ($2,958,000; 2020: $3,294,000). The Company’s objectives when managing capital are to safeguard its ability to continue as a going concern in order to pursue its mining operations and exploration activities.
The Company’s primary objective with respect to its capital management is to ensure that it has enough cash resources to maintain its ongoing operations, to provide returns for shareholders, complete the investment plan and accommodate any asset retirement obligation. Refer to note 33 of the Consolidated Financial Statements for information on the type of financial instruments used and the maturity profiles thereof. Management believes that the current working capital and future production cash proceeds will be enough to meet its capital requirements.
As at December 31, 2023, the Company had the following contractual obligations:
| Payments due by Period ($’000) |
||||||||||||||||||||
| Falling due |
Within 1 year |
1-3 years |
4-5 years |
After 5 years |
Total |
|||||||||||||||
| Trade and other payables |
20,503 | - | - | - | 20,503 | |||||||||||||||
| Provisions |
45 | 381 | 325 | 10,234 | 10,985 | |||||||||||||||
| Capital expenditure commitments |
2,035 | - | - | - | 2,035 | |||||||||||||||
| Lease liabilities |
167 | 41 | - | - | 208 | |||||||||||||||
| Cash-settled share-based payments |
920 | 374 | - | - | 1,294 | |||||||||||||||
| Loan notes (solar bonds) |
665 | 6,447 | - | - | 7,112 | |||||||||||||||
Except for capital expenditure commitments, the contractual obligations in the table above are based on the classification requirements under IFRS.
The capital expenditure commitments relate to materials and equipment which have been ordered by CMSA and which will be sold to Blanket.
Other than the proposed investment in the exploration properties, the committed and uncommitted investment will be used to maintain Blanket’s existing operations and implement the final development relating to the Central Shaft and the further stages of the new TSF.
Committed and uncommitted purchase obligations are expected to be met from the cash generated from Blanket’s existing operations and Blanket’s existing borrowing facilities. The Group leases property for its administrative offices in Jersey, Harare and Johannesburg; following the implementation of IFRS 16 the Group recognises the liabilities for these leases. As of December 31, 2023, the Group had liabilities for rehabilitation work on Blanket – if the mine is permanently closed – at an estimated discounted cost of $4.8 million (December 31, 2022: $2.8 million), Motapa’s liability amounted to $1.4 million (December 31, 2022: $Nil), Maligreen’s liability amounted to $287,000 (December 31, 2022: $135,000), and Bilboes’ liability amounted to $4.4 million (December 31, 2022: $Nil).
Blanket foreign exchange approval requirements
Approval from the RBZ is required for the remittance of dividends declared from Zimbabwe, for the repayment of loans and advances from Blanket Mine to Caledonia and the repayment of capital and consumables purchased from CMSA. During 2023 Caledonia obtained the necessary approvals from the RBZ to obtain foreign currency to conduct normal business operations. This remained the case until the date of this Annual Report.
Equity Raise
During March and April 2023, the Company conducted a placing of depositary interests and depositary receipts in its shares in the UK, South Africa and Zimbabwe. A total of 1,207,514 common shares were placed in the form of depositary interests and depositary receipts raising in total approximately US$16.62 million before expenses.
C. Research and development, patents and licenses, etc.
The Company is an exploration, development and mining company and does not carry on any research and development activities.
Production Guidance
Blanket production for 2023 was 75,416 ounces, which was over the lower end of the revised guidance range of 75,000 – 80,000 ounces. Refer to Item 5.A – “Operating Results”, for further discussion and detail of actual production.
Production guidance for Blanket for 2024 is between 74,000 and 78,000 ounces.
Production guidance for the oxide mining activities was withdrawn in the third quarter of 2023.
Cost Guidance
The estimated on-mine cost for 2023 was in the range of $860 to $950 per ounce and the estimated AISC for 2023 was in the range of $1,130 to $1,230 per ounce. The actual on-mine cost per ounce for 2023 was $945 and actual AISC per ounce for 2023 was $1,320.
The Group’s consolidated on-mine cost per ounce guidance for 2024 is in the range of $870 to $970 per ounce; guidance for consolidated AISC is $1,370 to $1,470 per ounce (excluding CSR costs). This is forward looking information. Refer to “CAUTIONARY NOTE REGARDING FORWARD-LOOKING STATEMENTS” of this report for further information on forward looking statements.
Cost guidance for the oxide mining activities was withdrawn in the third quarter of 2023.
E. Critical Accounting Estimates
Not applicable.
ITEM 6 - DIRECTORS, SENIOR MANAGEMENT AND EMPLOYEES
A. Directors and Senior Management
The following is a list of our current directors and the Group’s senior management as of April 26, 2024.
| Name, Office Held and Municipality of Residence |
Principal Occupations During Past Five Years |
Director Since and Independence Status |
Number of Common Shares* As of April 26, 2024 |
| John Kelly Non-Executive Director Chairperson New Canaan, Connecticut USA |
Managing Partner of Active Capital Partners Chairman and Independent Trustee, The Victory Funds Non-Executive Member of Kellys Family Foods LLC |
2012 Independent |
16,317 |
| Mark Learmonth Chief Executive Officer Director Jersey, Channel Islands |
Chief Financial Officer of the Company (until June 30, 2022) Chief Executive Officer of the Company (from July 1, 2022) Director of the Company |
2014 Non-Independent |
184,984 |
| Steven Curtis Non-Executive Director Johannesburg, South Africa |
Chief Executive Officer of the Company (until June 30, 2022) Director of the Company |
2008 Non-Independent |
189,566 |
| Caxton Mangezi Vice-president Zimbabwe operations Zimbabwe, Gwanda |
Blanket General Manager (until July 2021) Vice-president Zimbabwe operations (from July 2021) |
1993 Non-Independent |
2,605 |
| Johan Holtzhausen Non-Executive Director Western Cape, South Africa |
Business consultant and Independent Director of DRDGOLD Limited |
2013 Independent |
23,250 |
| Nick Clarke Non-Executive Director Falmouth, Cornwall, United Kingdom |
Chairman and formerly Chief Executive Officer of Central Asia Metals Plc |
2019 Independent |
Nil |
| Geralda Wildschutt Non-Executive Director Johannesburg, South Africa |
Founder and CEO of Maisha Social Solutions Pty Ltd Member of Sasol Climate Change Advisory Panel Board member of SAICA ED Pty Ltd |
2021 Independent |
Nil |
| Gordon Wylie Non-Executive Director Malta |
Non-executive director of Chaarat Gold Holdings Limited Former non-executive director of Silverton Metals Corp Former chairman of Lydian International Limited |
2022 Independent |
Nil |
| Name, Office Held and Municipality of Residence |
Principal Occupations During Past Five Years |
Director Since and Independence Status |
Number of Common Shares* As of April 26, 2024 |
| Victor Gapare Executive Director Harare, Zimbabwe |
Director of the Company Former chief executive officer of Bilboes Holdings (Private) Limited |
2023 Non-Independent |
**2,411,186 |
| Maurice Mason Vice-president Corporate Development London, United Kingdom |
Vice-president Corporate Development |
Not a Director |
Nil |
| Adam Chester General Counsel, Company Secretary and Head of Risk and Compliance Jersey, Channel Islands |
General Counsel, Company Secretary and Head of Risk and Compliance |
Not a Director |
28,386 |
| Chester Goodburn Chief Financial Officer Johannesburg, South Africa |
Chief Financial Officer of the Company (from July 1, 2022) |
Not a Director |
7,861 |
| Tariro Gadzikwa Non-Executive Director Johannesburg, South Africa |
Founder and Chief Executive Officer of MWJ Consulting Proprietary Limited |
2024 Non-Independent |
Nil |
| J Mufara Chief Operating Officer Johannesburg, South Africa |
Chief Operating Officer of the Company (from May 1, 2024) |
Not a Director |
Nil |
| * |
The information in this Circular as to shares beneficially owned or controlled or directed not being within the knowledge of the Company has been furnished by the respective nominees individually. |
| ** |
Mr Gapare is interested in the Common Shares held by Toziyana Resources Limited as the settlor of a discretionary trust which ultimately owns Toziyana Resources Limited. |
No family relationships exist between any of the Directors or senior management.
A brief profile of each of the Directors and senior managers is given below:
John Kelly - Non-Executive Director and Chairperson
Mr. John Lawson Kelly has over 39 years of experience in the financial services industry in the U.S and international markets including emerging markets in Asia. Mr. Kelly is currently Managing Partner of Active Capital Partners LLC, Charmain and Independent Trustee of the Victory Funds and a non-executive Member of Kellys Family Foods LLC. Mr. Kelly is a graduate of Yale University and the Yale School of Management.
Mr. Kelly was appointed to the Caledonia board as an independent non-executive director in May 2012 and became Chairperson in 2023.
Mark Learmonth – Director and Chief Executive Officer
Mr. John Mark Learmonth joined Caledonia in July 2008. Prior to this, he was a Division Director of Investment Banking at Macquarie First South in South Africa and has over 18 years of experience in corporate finance and investment banking, predominantly in the resources sector. Mr. Learmonth graduated from Oxford University and is a chartered accountant. He was previously a member of the Executive Committee of the Chamber of Mines, Zimbabwe and a member of the Gold Producers Sub-Committee.
Mr. Learmonth was appointed Vice-President Finance, Chief Financial Officer of the Company in November 2014. Mr. Learmonth was responsible for Investor Relations and Corporate Development of the Company until the appointments of Mr. Maurice Mason (VP Corporate Development) and Ms. Camilla Horsfall (VP Investor Relations and VP Group Communications) in 2016 and 2020, respectively. Mr. Learmonth was appointed as Chief Executive Officer with effect from July 1, 2023.
Steven Curtis, CA (SA) – Director
Mr. Steven Roy Curtis is a Chartered Accountant with over 38 years of experience and has held a number of senior financial positions in the manufacturing industry. Before joining Caledonia in April 2006, he was Director Finance and Supply Chain for Avery Dennison SA and, prior to this, Financial Director and then Managing Director of Jackstadt GmbH South African operation. Mr. Curtis is a member of the South African Institute of Chartered Accountants and graduated from the University of Cape Town.
Mr. Curtis was appointed Vice-President Finance and Chief Financial Officer in April 2006 and served in the position until Dec 2014 when he was appointed as President and Chief Executive Officer. Mr Curtis resigned as Chief Executive Officer with effect from June 30, 2022. From that date until December 31, 2025 he is retained by the Company pursuant to aconsultancy agreement and remained a director in a non-executive capacity. Given his past role with the Company, he is not considered independent.
Johan Holtzhausen - Non-Executive Director
Mr. Johan Andries Holtzhausen is a retired partner of KPMG South Africa with 43 years of audit experience, of which 36 years were as a partner focused on the mining sector. Mr. Holtzhausen chaired the Mining Interest Group at KPMG South Africa and his clients included major listed mining companies operating in Africa and elsewhere, which operated across a broad range of commodities. In addition to his professional qualifications, Mr. Holtzhausen holds a B.Sc. from the University of Stellenbosch, majoring in chemistry and geology. Mr. Holtzhausen is a business consultant and independent director of DRDGOLD Limited.
Mr. Holtzhausen is chairman of the Audit Committee and a member of the Remuneration Committee and Nomination Committee of DRDGOLD Limited.
Nick Clarke - Non-Executive Director
Mr. Nick Clarke joined the Company’s board as a Non-Executive Director on September 23, 2019. Mr. Clarke, who is Chairman of Central Asia Metals PLC (AIM: CAML), is a highly experienced Chartered Engineer (CEng) with 48 years in the mining industry. He has held senior positions in several resource companies and is well known as a successful executive in the sector having been involved in the construction of major mining projects and conducted several fundraisings on AIM and TSX.
He has an extensive background in managing AIM and TSX listed minerals companies including his current position as Chairman of Central Asia Metals PLC, where he was CEO from 2009 until 2016. Between 2004 and 2008 he was Managing Director of Oriel Resources plc (AIM: ORI) and from 2006 to 2008 he was President and CEO of Lero Gold Corporation (TSX: LER). Mr. Clarke has significant experience as a non-executive director of a number of AIM and TSX listed resource companies having previously held non-executive directorships on the boards of Afcan Mining Corp. (TSX: AFK), Caledon Resources plc (AIM: CDN), Obtala Resources plc (AIM: OBT), Columbus Copper Corp (TSX: CCU) and Sunkar Resources plc (AIM: SKR).
Mr. Clarke is an Associate of Camborne School of Mines (ACSM). He is a trustee of the Camborne School of Mines Trust and is a member of the Institution of Materials Minerals & Mining (MIMMM).
Geralda Wildschutt – Non-Executive Director
Geralda has over 27 years’ experience in stakeholder engagement, corporate social responsibility, ESG risk management and the just energy transition. She has worked in mining, renewable energy, banking and the social sector, across Africa, Latin America, Australia and Canada.
In mining, she has been a consultant to Anglo American, Gold Fields, Ivanhoe Mines and Debswana on a range of ESG topics. She has held senior positions at Anglo American, Gold Fields, ABSA/ Barclays Group and Ashoka: Innovators for the Public. She also serves as a non-executive director of JSE listed Northam Holdings Limited.
Geralda hold a Masters degree in Psychology from the University of Cape Town, an MBA from the Business School of the Netherlands and a post-graduate Certificate in Cross-sector Partnerships from Cambridge University’s Sustainability Insititute.
Geralda was appointed to the Caledonia board as an independent non-executive director in 2021.
Gordon Wylie – Non-Executive Director
Mr. Wylie holds a bachelor’s degree with Honours in Geology from the University of Glasgow, a Management Diploma from UNISA South Africa and a Postgraduate Diploma in Mining Engineering and Mineral Economics from Wits University, South Africa.
Mr. Wylie has over 47 years’ experience in the mining industry in both mining and exploration geology. Between 1997 and 2005, Mr. Wylie was part of AngloGold Ashanti Limited’s senior management team where he was responsible for the company’s global exploration programs, mining geology and associated technical services, covering around 40 countries and 5 continents.
Since leaving AngloGold Ashanti, Gordon has accumulated 17 years’ board experience as a non- executive director, of which 12 were as chairman at Lydian International Limited. He is currently a non-executive director of Chaarat Gold Holdings Limited, which is listed on AIM (symbol: CGH), and a former non-executive director of Silverton Metals Corp., which is listed on TSX-V (symbol: SVTN).
Victor Gapare – Executive Director
Mr. Victor Gapare is a prominent Zimbabwean mining entrepreneur and, following the acquisition of Bilboes, is interested in approximately 12.56% of the shares in Caledonia through Toziyana Resources Limited which is ultimately owned by a family trust of which Mr. Gapare is the settlor.
Mr. Gapare was previously the Director responsible for the gold and pyrites business of Anglo American Corporation Zimbabwe Limited when Bilboes was part of its portfolio, prior to a management buyout in which he was involved, and is a former President of the Chamber of Mines Zimbabwe.
Mr. Gapare was appointed to the Caledonia board as an executive director in January 2023 on completion of the acquisition of Bilboes Gold.
Adam Chester – General Counsel, Company Secretary and Head of Risk and Compliance
In January 2017 Mr. Adam Chester joined the management team as General Counsel, Company Secretary and Head of Risk and Compliance. Mr. Chester is a dual qualified lawyer (England and Jersey, Channel Islands) and previously worked as a solicitor of the Supreme Court of England and Wales at international law firms in the City of London and, more recently, as an advocate of the Royal Court of Jersey at an international offshore law firm in which he was a partner. He has extensive experience advising businesses and individuals on a variety of commercial and corporate legal issues.
Caxton Mangezi – Vice-president Zimbabwe operations
Mr. Caxton Mangezi is a qualified miner and mine manager. He has worked at Blanket since 1969 in a range of roles including geological technician, overseer miner and underground manager.
Mr. Mangezi has been General Manager of Blanket Mine since 1993 in full time and interim capacities, with full responsibility for day-to-day operations. Mr. Mangezi was appointed as the Vice President Zimbabwe Operations during 2021. Mr. Mangezi also serves as director on certain Zimbabwean subsidiary companies.
Maurice Mason – Vice-president Corporate Development
Maurice is an engineer with an MBA from Henley Reading University. Before joining Caledonia, Maurice was a securities analyst at Stifel, a US Investment bank, where he focused on the mining sector.
Prior to working as a securities analyst Maurice worked for six years with Anglo American in their platinum and coal operations based in both the Johannesburg and London offices.
Chester Goodburn – Chief Financial Officer
Mr. Goodburn is a qualified Chartered Accountant with 15 years’ experience in the energy and natural resources sector. He worked as a senior manager at KPMG South Africa where he was seconded to several clients providing audit, tax and advisory services to several JSE, NYSE, AIM and TSX listed clients.
Mr. Goodburn was the Group Financial Manager from September 1, 2014 to June 30, 2022 and Chief Information Officer until April 30, 2022. Mr. Goodburn was appointed as Chief Financial Officer on July 1, 2022.
Tariro Gadzikwa – Non-Executive Director
Tariro is a Chartered Accountant and the Founder and Chief Executive Officer of MWJ Consulting Proprietary Limited, an advisory firm specializing in financial reporting and due diligence for listed and private equity clients within the mining, oil and gas and energy sectors.
Prior to founding MWJ, she was Group Chief Financial Officer of Efora Energy Ltd ("Efora", formerly SacOil Holdings) at which she held various executive roles in the finance team over eight years. She started her career at PwC in Zimbabwe and subsequently worked in the Johannesburg, Baltimore and London offices, where she provided audit and financial advisory services including financial due diligence and strategy development to medium and large corporates in Zimbabwe, South Africa, the US and UK.
She has held a number of board positions, including most recently at Efora and several of its subsidiaries in South Africa, Seychelles, Nigeria and Botswana, and currently serves on the board of Structured Risk Solutions where she chairs the Nominations Committee.
She graduated from Rhodes University, South Africa with a B.Com in accounting in 2001.
Tariro was appointed to the Caledonia board as an independent non-executive director during March 2024.
James Mufara – Chief Operating Officer
James Mufara was previously at Harmony Gold Mining Company Limited where, as Regional General Manager, he headed a complex portfolio of operations consisting of five mines and 15,000 staff, mining 450koz of gold per annum.
James has over 25 years' experience in the mining sector in Southern Africa, including 13 years in leadership roles. His career has been primarily gold focused, but also with exposure to nickel, copper, and chrome mining. His experience includes deep-level underground mining and open-pit operations, which is relevant to the existing underground operation at Blanket mine and Caledonia's development projects at Bilboes and Motapa which will be open-pit. He holds a BSc in Mining Engineering and an MBA.
Arrangements, Understandings, etc.
Caledonia has no arrangements or understanding with any major shareholders, customers, suppliers or others, pursuant to which any person referred to above was selected as a director or member of senior management other than Mr. Gapare who was appointed as a director pursuant to the sale and purchase agreement for the acquisition of Bilboes Gold.
Summary Compensation Table
| Name and principal position |
Year |
Salary ($) |
Share-based awards ($)(1) |
Option-based awards |
Non‑equity incentive plan compensation ($) |
Pension value ($) |
All other compensation ($) |
Total compensation ($) |
|
| (a) |
(b) |
(c) |
(d) |
(e) |
(f) |
(g) |
(h)(2) (3)(4) |
(i) |
|
| Annual incentive plans (1) |
Long term incentive plans |
||||||||
| Mark Learmonth Chief Financial Officer (until June 30, 2022) Chief Executive Officer (from July 1, 2022) |
2023 2022 2021 |
517,500 494,315 480,011 |
263,304 94,692 89,645 |
- - - |
- - - |
- - - |
- - - |
- 175,000 235,000 |
780,804 764,007 804,656 |
| Dana Roets Chief Operating Officer |
2023 2022 2021 |
518,381 500,851 489,590 |
(9,281) 95,397 80,564 |
- - - |
- - - |
- - - |
- - - |
1,588,108 160,000 170,000 |
2,097,208 756,248 740,154 |
| Caxton Mangezi Vice President Operations Zimbabwe |
2023 2022 2021 |
568,235 463,960 429,478 |
179,167 175,116 123,250 |
- - - |
- - - |
- - - |
- - - |
580,507 734,730 211,615 |
1,327,909 1,373,806 764,343 |
| Chester Goodburn Chief Financial Officer (from July 1, 2022) |
2023 2022 |
336,375 309,123 |
59,374 31,010 |
- |
- |
- |
- |
- 70,000 |
395,749 410,133 |
| Victor Gapare Executive Director |
2023 |
478,654 |
43,368 |
- |
- |
- |
- |
89,505 |
611,527 |
| Maurice Mason VP Corporate Development |
2023 2022 2021 |
337,261 325,856 222,123 |
84,883 53,335 56,624 |
- - - |
- - - |
- - - |
- - - |
-- 130,000 111,061 |
422,144 509,191 389,808 |
| Adam Chester General Counsel, Company Secretary and Head of Risk and Compliance |
2023 2022 2021 |
337,874 313,038 228,891 |
99,161 65,769 119,103 |
- - - |
- - - |
- - - |
- - - |
70,000 160,000 114,445 |
507,035 538,807 462,439 |
| (1) |
Awards are considered to be share based awards. The amounts stated are the expenses for the year to revalue the liability to the amount that is expected to vest at the applicable year end. Refer to table below for the awards outstanding as at December 31, 2023. |
| (2) |
The amounts shown in (h) relate to bonuses paid to normal executive officers (”NEOs”) and, for Mr Caxton and Mr Gapare it also include other employee benefits. No fees for acting as a Director were paid to NEOs. The amount for Mr Roets include his severance package provided for in 2023 but which were paid in January 2024 and February 2024. |
| (3) |
The amounts shown in (h) for the NEOs for 2023 relate to bonuses provided for in 2023 but were paid in April 2024. |
Non-executive director fees were paid in equal quarterly instalments in arrears during 2023. From January 1, 2023 to December 31, 2023 the approved non-executive director fees amounted to $90,000 p.a. payable to each non-executive director other than Leigh Wilson (resigned in May 2023), who received a pro-rata amount of $30,907 for his services in 2023.
Long term incentive plan
The following key management members were granted RSUs, PUs and EPUs, pursuant to the provisions of the OEICP. The outstanding RSUs and PUs as at December 31, 2023 were as follows:
| Key management member |
Vesting date |
RSUs |
PUs |
EPUs |
| Steve Curtis |
2024/01/11 2025/01/11 |
- - |
8,769 - |
- 39,689 |
| Mark Learmonth |
2024/01/11 2025/01/11 2026/04/01 |
- - - |
5,422 - - |
- 36,812 27,542 |
| Caxton Mangezi |
2024/01/11 2025/01/11 2026/04/01 |
- - - |
4,657 - - |
- 15,458 13,441 |
| Chester Goodburn* |
2024/01/11 2025/01/11 2026/04/01 |
- - - |
564 1,759 - |
- - 10,890 |
| Adam Chester |
2024/01/11 2025/01/11 2026/04/01 |
- - - |
3,509 - - |
- 10,877 7,992 |
| Maurice Mason |
2024/01/11 2025/01/11 2026/04/01 |
- - - |
2,459 - - |
- 10,857 7,977 |
| Victor Gapare** |
2026/04/01 |
- |
- |
11,506 |
| Total |
- |
27,139 |
193,041 |
* Chester Goodburn was appointed as a key management member from July 1, 2022 when he became CFO.
** Victor Gapare was appointed as key management from January 6, 2023.
For further detail on the RSUs, PUs and EPUs refer to note 12 of the Consolidated Financial Statements.
125,433 EPUs were awarded to key management staff on April 8, 2024.
No director equity options were outstanding at December 31, 2023.
Caledonia does not have a pension, retirement or similar benefits scheme for directors.
The directors all hold their positions for an indefinite term, subject to re-election at each annual general meeting of the shareholders. The officers hold their positions subject to being removed by resolution of the Board of Directors. The term of office of each director expires as of the date that an annual general meeting of the shareholders is held, subject to the re-election of a director at such annual general meeting. The following persons comprise the following committees:
| Audit |
Compensation |
Nomination and Corporate Governance |
Technical |
Disclosure |
| J Holtzhausen |
J Kelly |
J Kelly |
M Learmonth |
M Learmonth |
| G Wylie |
J Holtzhausen |
J Holtzhausen |
J Holtzhausen |
C Goodburn |
| G Wildschutt |
G Wylie |
N Clarke |
N Clarke |
A Chester |
| T Gadzikwa |
T Gadzikwa |
G Wildschutt |
G Wylie |
C Horsfall |
| G Wylie |
V Gapare |
J Mufara |
||
| T Gadzikwa |
S Curtis |
|||
| C Mangezi |
||||
| Strategic Planning |
ESG |
J Mufara |
||
| J Kelly |
G Wildschutt |
|||
| S Curtis |
A Chester |
|||
| J Holtzhausen |
C Horsfall |
|||
| M Learmonth |
J Kelly |
|||
| N Clarke |
M Learmonth |
|||
| G Wildschutt |
S Curtis |
|||
| G Wylie |
N Clarke |
|||
| V Gapare |
V Gapare |
|||
| M Mason |
||||
| C Goodburn T Gadzikwa J Mufara |
The Audit Committee is comprised of Mr. Holtzhausen, Mr. Wylie, Ms. Wildschutt and Ms. Gadzikwa and is chaired by Mr. Holtzhausen. Each member of the Audit Committee is considered independent as defined under NI 52-110 and as defined under Section 803 of the NYSE American LLC Company Guide and Exchange Act Rule 10A-3 and considered to be financially literate as such terms are defined under NI 52-110 Audit Committees. Mr. Holtzhausen is an ex-audit partner of KPMG Inc., Mr. Wylie has significant experience operating at the most senior levels in mining companies, Ms. Wildschutt has relevant experience as a board member and trustee for various organizations and Ms. Gadzikwa is a chartered accountant and previous Chief Financial Officer of a listed company.
The Audit Committee is responsible for assisting the Board in:
| 1. |
Opening an avenue of communication between Caledonia’s management, the independent auditors and the Board and to assist the Board in its oversight of the: |
| ● |
integrity, adequacy and timeliness of Caledonia’s financial reporting and disclosure practices; |
|
| ● |
processes for identifying the principal financial risks of Caledonia and the control systems in place to monitor them; |
|
| ● |
compliance with legal and regulatory requirements related to financial reporting; |
|
| ● |
independence and performance of the independent auditors; |
|
| ● |
processes implemented by management to ensure effective internal controls over financial reporting; |
|
| ● |
enterprise risk management; |
|
| ● |
fraud risks related to financial reporting; |
|
| ● |
other risks related to financial reporting; and |
|
| ● |
integrated reporting. |
| 2. |
Performing any other activities consistent with the charter of the Audit Committee to ensure that Caledonia’s articles of association, governing and regulatory laws as required by the SEC, Sarbanes-Oxley Act and NYSE American LLC and AIM requirements are monitored by management. |
| 3. |
The role of oversight. Compilation of financial statements is the responsibility of management. The auditors are responsible for performing an audit and expressing an opinion on the fair presentation of Caledonia’s financial statements in accordance with IFRS. |
| 4. |
Ensuring that a combined assurance model is developed and implemented to provide a coordinated approach to all assurance activities. |
The purpose of the Compensation Committee is to discharge the Board’s responsibilities relating to:
| 1. |
Compensation of the executive officers and the directors; |
| 2. |
Establishment and administration of policies, programs and procedures for compensating and incentivizing its executive officers; |
| 3. |
Oversight of the compensation structure and benefit plans and programs; |
| 4. |
Executive compensation disclosure and compliance with compensation policies; and |
| 5. |
Administration and application of the Company’s Incentive Compensation Recovery Policy (as defined herin). |
Terms of reference of the Audit Committee are given in the charter of the Audit Committee, and the terms of reference of the Compensation Committee are given in the charter of the Compensation Committee. All charters of committees are available on the Company’s website (www.caledoniamining.com) or, on request, from the Company’s offices listed in this report.
Benefits upon termination are disclosed in note 36 of the Consolidated Financial Statements.
The average, approximate number of employees, their categories and geographic locations for each of the last three years are summarized in the table below:
| Geographic Location and Number of Employees: |
||||||||||||
| 2023 |
2022 |
2021 |
||||||||||
| Total Employees |
||||||||||||
| London, United Kingdom - Management and administration |
3 | 2 | 2 | |||||||||
| Jersey, Channel Islands - Management and administration |
4 | 3 | 3 | |||||||||
| South Africa - Management, procurement, administration and technical |
31 | 23 | 21 | |||||||||
| Zimbabwe - Mine operations, management and administration |
2,294 | 2,119 | 1,923 | |||||||||
| Total Employees at all Locations |
2,332 | 2,147 | 1,949 | |||||||||
| Management and Administration: |
||||||||||||
| Employee Locations: |
2023 |
2022 |
2021 |
|||||||||
| London, United Kingdom - Management and administration |
3 | 2 | 2 | |||||||||
| Jersey, Channel Islands - Management and administration |
4 | 3 | 3 | |||||||||
| Zimbabwe - Mine operations, management and administration |
105 | 54 | 55 | |||||||||
| South Africa - Management, procurement, administration and technical |
30 | 22 | 20 | |||||||||
| Total Management and Administration |
142 | 81 | 80 | |||||||||
| (a) |
The direct and indirect shareholdings of the Company’s directors, officers and senior management as at April 26, 2024 were as follows: |
| Number of shares |
Percentage share holding |
||||||||
| J Kelly |
16,317 | 0.09 | % | ||||||
| S Curtis |
189,566 | 0.99 | % | ||||||
| M Learmonth |
184,984 | 0.96 | % | ||||||
| J Holtzhausen |
23,250 | 0.12 | % | ||||||
| A Chester |
28,386 | 0.15 | % | ||||||
| C Goodburn |
7,861 | 0.04 | % | ||||||
| V Gapare |
*2,411,186 | 12.56 | % | ||||||
| C Mangezi |
2,605 | 0.01 | % | ||||||
| N Clarke |
- | 0.00 | % | ||||||
| G Wildschutt |
- | 0.00 | % | ||||||
| G Wylie |
- | 0.00 | % | ||||||
| M Mason |
- | 0.00 | % | ||||||
| T Gadzikwa |
- | 0.00 | % | ||||||
| J Mafura |
- | 0.00 | % | ||||||
| Total |
2,864,155 | 14.92 | % | ||||||
| * |
Mr Gapare is interested in the Common Shares held by Toziyana Resources Limited as the settlor of a discretionary trust which ultimately owns Toziyana Resources Limited. |
Refer to Item 6.A – “Directors and Senior Management” for a list of the Company’s directors, officers and senior management and number of shares held.
All of the shares held above are voting shares and do not have any different voting or other rights than the other outstanding shares of the Company.
The information as to shares beneficially owned or controlled or directed, not being within the knowledge of the Company, has been furnished by the respective directors, officers and senior management members individually.
| (b) | Share purchase options outstanding as of April 26, 2024: |
| Name |
Role |
Exercise Price CAD |
Expiry Date |
Number of Options |
| P Chidley |
Consultant |
*7.35 9.49 |
August 25, 2024 September 30, 2029 |
5,000 5,000 |
| P Durham |
Consultant |
*7.35 9.49 |
August 25, 2024 September 30, 2029 |
5,000 5,000 |
| TOTAL |
20,000 |
|||
| * |
The exercise price of CAD$9.30 per share was converted into a USD amount of $7.35 at the prevailing USD/CAD exchange rate at the date of grant (August 25, 2017). |
In terms of the OEICP, the expiry of the options that expire in a closed period will be extended by 10 days from the cessation of the closed period.
F. Disclosure of Registrant’s Action to Recover Erroneously Awarded Compensation
The Company has adopted an incentive compensation recovery policy effective October 2, 2023 (“Incentive Compensation Recovery Policy”) as required by NYSE American listing rules and pursuant to Rule 10D-1 of the Exchange Act. The Incentive Compensation Recovery Policy is filed as Exhibit 97.1 to this Annual Report. At no time during or after the fiscal year ended December 31, 2023 (as of the date of this Annual Report), was the Company required to prepare an accounting restatement that required recovery of erroneously awarded compensation pursuant to the Incentive Compensation Recovery Policy and, as of December 31, 2023, there was no outstanding balance of erroneously awarded compensation to be recovered from the application of the Incentive Compensation Recovery Policy to a prior restatement.
ITEM 7 - MAJOR SHAREHOLDERS AND RELATED PARTY TRANSACTIONS
To the best of Caledonia's knowledge, as at April 26, 2024, we are aware of the following beneficial owners that directly or indirectly exercise control or direction over more than 5% of the voting rights to our shares.
|
|
2021 |
2022 |
2023 |
|||
| Beneficial owner name | Number of Shares Held |
Percentage of Issued Shares |
Number of Shares Held |
Percentage of Issued Shares |
Number of Shares Held |
Percentage of Issued Shares |
| Toziyana Resource Limited |
- |
- |
2,411,186 |
12.56% |
2,411,186 |
12.56% |
| Shining Capital Holding II L.P. |
- |
- |
1,922,858 |
10.02% |
1,922,858 |
10.02% |
| Allan Gray (through two of its funds) |
1,957,391 |
15.34% |
2,180,070 |
11.36% |
1,149,945 |
5.99% |
All shareholders have the same voting rights as all other shareholders of Caledonia.
There are no restrictions on the transfer of Caledonia’s issued shares.
According to our share register and information received from our registrar on April 26, 2024 the shares of Caledonia (including those represented by depositary interests and receipts) were held in the following geographic locations:
| Geographic Location based on the share register only |
Number of Shares Held |
Percentage of Issued Shares |
||||||
| United Kingdom |
10,194 | 0.02 | % | |||||
| USA |
17,065,645 | 84.45 | % | |||||
| Canada |
4,819 | 0.03 | % | |||||
| Zimbabwe |
1,049,554 | 5.46 | % | |||||
| Other |
1,064,648 | 10.04 | % | |||||
| 19,194,860 | 100 | % | ||||||
19,194,860 shares of the Company, as on April 26, 2024, are held by a total of 74 registered shareholders, including 46 registered holders in the United States.
Caledonia is not aware of any arrangement which may at some subsequent date result in a change of control of Caledonia.
No related party transactions exist, other than disclosed in note 36 of the Consolidated Financial Statements.
C. Interests of Experts and Counsel
Not applicable.
ITEM 8 - FINANCIAL INFORMATION
A. Consolidated Statements and Other Financial Information
This Annual Report contains the audited Consolidated Financial Statements which comprise of the consolidated statements of financial position as at December 31, 2023 and December 31, 2022 and the related consolidated statements of profit or loss and other comprehensive income, consolidated statements of changes in equity and consolidated statements of cash flows for the years ended December 31, 2023, December 31, 2022 and December 31, 2021.
Reference is made to the Consolidated Financial Statements, including the report of the independent registered public accounting firm, BDO South Africa Inc. (PCAOB ID 1368), that are filed as part of this Annual Report on pages F1 – F78
Legal Proceedings and Regulatory Actions
To our knowledge, there are no legal proceedings material to us to which we are or were a party to or of which any of our properties are or were the subject of during the financial year ended December 31, 2023 nor are there any such proceedings known to us to be contemplated which would materially impact our financial position or ability to continue as a going concern.
During the twelve months ended December 31, 2023, there were no (i) penalties or sanctions imposed against us by a court relating to securities legislation or by a securities regulatory authority; (ii) penalties or sanctions imposed by a court or regulatory body against us that would likely be considered important to a reasonable investor in making an investment decision, or (iii) settlement agreements we entered into before a court relating to securities legislation or with a securities regulatory authority.
Dividend policy
From 2014, the Company has paid a quarterly dividend (payable at the end of January, April, July and October each year, except for the dividend expected to be paid in April 2020 which was delayed by a month due to uncertainties related to the COVID-19 pandemic and dividends declared on December 30, 2022). The quarterly dividend declared from 2021 is set out below:
| Declaration date |
cents per share |
| January 14, 2021 |
11.0 |
| April 15, 2021 |
12.0 |
| July 15, 2021 |
13.0 |
| October 14, 2021 |
14.0 |
| January 13, 2022 |
14.0 |
| April 18, 2022 |
14.0 |
| July 14, 2022 |
14.0 |
| October 13, 2022 |
14.0 |
| December 30, 2022 |
14.0 |
| April 3, 2023 |
14.0 |
| June 29, 2023 |
14.0 |
| September 28, 2023 |
14.0 |
| January 2, 2023 |
14.0 |
| March 27, 2024 |
14.0 |
We have not experienced any significant changes since the date of the Consolidated Financial Statements included with this Annual Report except as disclosed in this Annual Report.
ITEM 9 - THE OFFERING AND LISTING
A. Offering and Listing Details
The Company’s shares trade on the NYSE American, AIM (in the form of depositary interests) and VFEX (in the form of depositary receipts) under the trading symbol “CMCL”. Caledonia voluntary delisted its shares from the TSX on June 19, 2020. After the delisting the Company remains a Canadian reporting issuer and has to comply with Canadian securities laws unless and until it can demonstrate that less than 2% of its beneficial shareholders are Canadian residents.
Not applicable.
Not applicable.
Not applicable.
ITEM 10 - ADDITIONAL INFORMATION
Not applicable.
B. Memorandum and Articles of Association
Securities Registrar
Computershare Inc. is the transfer agent and registrar for the shares at its principal office in Massachusetts. Computershare Investor Services PLC at its principal office in Bristol, United Kingdom is the transfer agent for the depositary interests. Corpserve Registrars (Pvt) Limited at its principal office in Harare, Zimbabwe is the registrar for the depositary receipts.
Director’s power to vote on a proposal, arrangement or contract in which the director is materially interested.
An interested director must disclose to the Company the nature and extent of any interest in a transaction with the Company, or one of its subsidiaries, which to a material extent conflicts or may conflict with its interests and of which the director is aware. Failure to disclose an interest entitles the Company or a shareholder to apply to the court for an order setting aside the transaction concerned and directing that the director account to the Company for any profit.
A transaction is not voidable and a director is not accountable notwithstanding a failure to disclose an interest if the transaction is confirmed by special resolution and the nature and extent of the director’s interest in the transaction are disclosed in reasonable detail in the notice calling the meeting at which the resolution is passed.
Although it may still order that a director account for any profit, a court will not set aside a transaction unless it is satisfied that the interests of third parties who have acted in good faith would not thereby be unfairly prejudiced and the transaction was not reasonable and fair in the Company’s interests at the time it was entered into.
Except as otherwise provided in the Articles (as defined below) and save in respect of a limited number of instances as set out in the Articles, a director shall not vote on, or be counted in the quorum in relation to, any resolution of the board or of a committee of the board concerning any matter in which he has to his knowledge, directly or indirectly, an interest (other than his interest in shares or debentures or other securities of, or otherwise in or through, the Company) or duty which (together with any interest of a person connected with him) is material and, if he shall do so, his vote shall not be counted.
Directors’ power, in the absence of an independent quorum, to vote compensation to themselves or any members of their body.
The compensation of the directors is decided by the directors unless the Board of Directors specifically requests approval of the compensation from the shareholders. If the issuance of compensation to the directors is decided by the directors, a quorum is the majority of the directors in office. The Articles do not require that the compensation of any director be approved by disinterested directors.
The Company has a compensation committee that is currently composed of three independent directors. The compensation committee makes recommendations to the board with respect to compensation, including bonuses, incentive stock options and securities of directors and executive officers.
Borrowing powers exercisable by the directors and how such borrowing powers may be varied.
The board may exercise all the Company’s powers to borrow money, to guarantee, to indemnify and to mortgage or charge all or any part of the Company’s undertaking, property and assets (present and future) and uncalled capital and, subject to the Companies Law to issue debentures and other securities, whether outright or as collateral security, for any debt, liability or obligation of the Company or of any third party.
The board shall restrict the Company’s borrowings and exercise all voting and other rights or powers of control exercisable by the Company in relation to its subsidiary undertakings (if any) to secure (but as regards subsidiary undertakings only in so far as by the exercise of such rights or powers of control the board can secure) that the aggregate principal amount from time to time outstanding of all borrowings by the Company’s group (exclusive of borrowings owing by one member of the Company’s group to another member of the Company’s group) shall not at any time without the previous sanction of an ordinary resolution of the Company exceed an amount equal to three times the Adjusted Capital and Reserves (as defined in the Articles). The borrowing powers may be varied by amendment to the Articles which requires approval of the Company’s shareholders by special resolution, being a resolution passed by at least 2/3 majority of the votes cast on the resolution.
Retirement and non-retirement of directors under an age limit requirement.
There are no such provisions applicable to the Company under the Articles or the Companies Law.
Number of shares required for a director’s qualification.
Under the Articles, the directors are not required to hold any shares as qualification for service on the board.
Place of Incorporation and Purpose
The Company was incorporated, effective February 5, 1992, by the amalgamation of three predecessor companies. It was registered in terms of the Canada Business Corporations Act. The company re-domiciled to Jersey, Channel Islands, effective March 19, 2016 through the Continuance process. The Continuance had no appreciable effect on the Company’s listing in Toronto, the admission of its depositary interests to trading on AIM in London or the trading facility on the OTCQX (from July 27, 2017 the OTCQX trading ceased and shares commenced trading on NYSE American) and the Company’s securities continued to be traded on these listing and trading platforms after the Continuance process was completed. Caledonia voluntary delisted its shares from the TSX on June 19, 2020. It subsequently listed depositary receipts on the Victoria Falls Stock Exchange on December 2, 2021.
Neither the Company’s memorandum of association nor the Articles stipulate any objects or purposes of the Company and no objects or purposes are required to be stated by the Companies Law.
Articles of Association
At a special meeting of shareholders held on February 18, 2016, Caledonia’s shareholders voted in favor of a resolution to approve the Continuance. This resolution, inter alia, included provisions to replace Caledonia’s by-laws with new articles of association (the “Articles”). The Articles do not place any restrictions on the Company’s business.
The holders of the shares are entitled to one vote per share at all meetings of the shareholders of the Company. The holders of shares are also entitled to dividends, if and when declared, and the distribution of the residual assets of the Company in the event of a liquidation, dissolution or winding up of the Company. The Company's shares do not have pre-emptive rights to purchase additional shares.
No preference shares are currently issued and outstanding. Preference shares may be issued from time to time in one or more series composed of such number of shares with such preference, deferred or other special rights, privileges, restrictions and conditions as specified in the Articles or as fixed before such issuance by a resolution passed by the directors and confirmed and declared by shareholders by a special resolution. The preference shares shall be entitled to preference over shares in respect of the payment of dividends and shall have priority over other shares in the event of a distribution of residual assets of the Company in the event of a liquidation, dissolution or winding up of the Company. The rights attached to the shares or the preference shares can only be modified by the affirmative vote of at least two-thirds of the votes cast at a meeting of the relevant shareholders called for that purpose.
Meetings of Shareholders
The Articles require the Company to call an annual general meeting of shareholders within 13 months after holding the last preceding annual general meeting and permits the Company to call any other meeting of shareholders at any time. The Company is required to mail a notice of meeting and management information circular to registered shareholders not less than 21 clear days and not more than 60 days prior to the date of any annual or other general meeting of shareholders, although it currently utilizes the notice and access method under Canadian law. These materials must also be filed with Canadian securities regulatory authorities. The Articles provide that a quorum of two shareholders in person or represented by proxy holding or representing by proxy not less than 5% of the Company’s issued shares carrying the right to vote at the meeting is required to transact business at a general meeting. Shareholders, and their duly appointed proxies and corporate representatives, as well as the Company's auditors, are entitled to be admitted to the Company's annual and other general meetings of shareholders.
Limitations on the Right to Own Securities
There are no limitations on the rights to own securities in the Company.
Limitations on Restructuring
There is no provision in the Articles that would have the effect of placing any limitations on any corporate restructuring in addition to what would otherwise be required by applicable law.
Disclosure of Share Ownership
The Articles permit the Company to give a disclosure notice to any person that the Company has reasonable cause to believe is/was interested in the Company’s shares within the preceding three years; such notice may require the person to inform the Company whether that person holds/has held an interest in the Company’s shares. The Articles also incorporate by reference certain of the disclosure guidance and transparency rules (“DTR”) published by the UK's Financial Conduct Authority. The DTR include, inter alia, a requirement that a shareholder must notify the Company of the percentage of its voting rights (held directly and indirectly) if the percentage of those voting rights reaches, exceeds or falls below 3% of the Company’s issued voting securities and each 1% threshold above 3%.
Differences in Corporate Law between United States (Delaware) and Jersey, Channel Islands
Set forth below is a comparison of certain shareholder rights and corporate governance matters under Delaware law and Jersey law:
| Corporate Law Issue |
Delaware Law |
Jersey Law |
| Special Meetings of Shareholders |
Shareholders generally do not have the right to call meetings of shareholders unless that right is granted in the certificate of incorporation or by-laws. However, if a corporation fails to hold its annual meeting within a period of 30 days after the date designated for the annual meeting, or if no date has been designated for a period of 13 months after its last annual meeting, the Delaware Court of Chancery may order a meeting to be held upon the application of a shareholder. |
Shareholders holding 10% or more of the company’s voting rights and entitled to vote at the relevant meeting may legally require directors to call a meeting of shareholders. Under the Articles, the percentage required to requisition a meeting is reduced to 5%.
The Jersey Financial Services Commission, or JFSC, may, at the request of any officer, secretary or shareholder, call or direct the calling of an annual general meeting. Failure to call an annual general meeting in accordance with the requirements of the Companies Law is a criminal offense on the part of a Jersey company and its directors and secretary. |
| Interested Director Transactions |
Interested director transactions are permissible and may not be legally voided if: ● either a majority of disinterested directors, or a majority in interest of holders of shares of the corporation’s capital stock entitled to vote upon the matter, approves the transaction upon disclosure of all material facts; or ● the transaction is determined to have been fair as to the corporation as of the time it is authorized, approved or ratified by the board of directors, a committee thereof or the shareholders. |
An interested director must disclose to the company the nature and extent of any interest in a transaction with the company, or one of its subsidiaries, which to a material extent conflicts or may conflict with the interests of the company and of which the director is aware. Failure to disclose an interest entitles the company or a shareholder to apply to the court for an order setting aside the transaction concerned and directing that the director account to the company for any profit.
A transaction is not voidable and a director is not accountable notwithstanding a failure to disclose an interest if the transaction is confirmed by special resolution and the nature and extent of the director’s interest in the transaction are disclosed in reasonable detail in the notice calling the meeting at which the resolution is passed.
Although it may still order that a director account for any profit, a court will not set aside a transaction unless it is satisfied that the interests of third parties who have acted in good faith would not thereby be unfairly prejudiced and the transaction was not reasonable and fair in the interests of the company at the time it was entered into.
The Articles set out a limited number of transactions and matters in which a director may be interested and in which he may vote and be counted in the quorum in relation to a resolution on the matter. |
| Corporate Law Issue |
Delaware Law |
Jersey Law |
| Cumulative Voting |
The certificate of incorporation of a Delaware corporation may provide that shareholders of any class or classes or of any series may vote cumulatively either at all elections or at elections under specified circumstances. |
There are no provisions in the Companies Law relating to cumulative voting. |
| Approval of Corporate Matters by Written Consent |
Unless otherwise specified in a corporation’s certificate of incorporation, shareholders may take action permitted to be taken at an annual or special meeting, without a meeting, notice or a vote, if consents, in writing, setting forth the action, are signed by shareholders with not less than the minimum number of votes that would be necessary to authorize the action at a meeting. All consents must be dated and are only effective if the requisite signatures are collected within 60 days of the earliest dated consent delivered. |
If permitted by the articles of association of a company, a written consent signed and passed by the specified majority of members may affect any matter that otherwise may be brought before a shareholders’ meeting, except for the removal of a company’s auditors. Such consent shall be deemed effective when the instrument, or the last of several instruments, is signed by the specified majority of members or on such later date as is specified in the resolution.
The Articles do not contain provisions regarding shareholder resolutions in writing. |
| Business Combinations |
With certain exceptions, a merger, consolidation or sale of all or substantially all of the assets of a Delaware corporation must be approved by the board of directors and a majority of the outstanding shares entitled to vote thereon. |
A sale or disposal of all or substantially all the assets of a Jersey company must be approved by the board of directors and, only if the articles of association of the company require, by the shareholders in general meeting. A merger involving a Jersey company must be generally documented in a merger agreement which must be approved by special resolution of that company. |
| Corporate Law Issue |
Delaware Law |
Jersey Law |
| Limitations on Director’s Liability and Indemnification of Directors and Officers |
A Delaware corporation may indemnify a director or officer of the corporation against expenses (including attorneys’ fees), judgments, fines and amounts paid in settlement actually and reasonably incurred in defense of an action, suit or proceeding by reason of his or her position if (i) the director or officer acted in good faith and in a manner he or she reasonably believed to be in or not opposed to the best interests of the corporation and (ii) with respect to any criminal action or proceeding, the director or officer had no reasonable cause to believe his or her conduct was unlawful. |
The Companies Law does not contain any provision permitting Jersey companies to limit the liabilities of directors for breach of fiduciary duty.
However, a Jersey company may exempt from liability, and indemnify directors and officers, for liabilities: ● incurred in defending any civil or criminal legal proceedings where: ● the person is either acquitted or receives a judgment in their favor; ● where the proceedings are discontinued other than by reason of such person (or someone on their behalf) giving some benefit or suffering some detriment; or ● where the proceedings are settled on terms that such person (or someone on their behalf) gives some benefit or suffers some detriment but in the opinion of a majority of the disinterested directors, the person was substantially successful on the merits in the person’s resistance to the proceedings; ● incurred to anyone other than to the company if the person acted in good faith with a view to the best interests of the company; ● incurred in connection with an application made to the court for relief from liability for negligence, default, breach of duty or breach of trust under Article 212 of the Companies Law in which relief is granted to the person by the court; or ● incurred in a case in which the company normally maintains insurance for persons other than directors. |
| Corporate Law Issue |
Delaware Law |
Jersey Law |
| Appraisal Rights |
A shareholder of a Delaware corporation participating in certain major corporate transactions may, under certain circumstances, be entitled to appraisal rights under which the shareholder may receive cash in the amount of the fair value of the shares held by that shareholder (as determined by a court) in lieu of the consideration the shareholder would otherwise receive in the transaction. |
There are no appraisal rights under the Companies Law but the Articles include dissent rights of shareholders, based on Canadian law, whereby shareholders who dissent to certain transactions of the Company may apply to have the Company buy their shares for fair value. |
| Shareholder Suits |
Class actions and derivative actions generally are available to the shareholders of a Delaware corporation for, among other things, breach of fiduciary duty, corporate waste and actions not taken in accordance with applicable law. In such actions, the court has discretion to permit the winning party to recover attorneys’ fees incurred in connection with such action. |
Under Article 141 of the Companies Law, a shareholder may apply to court for relief on the ground that the conduct of a company’s affairs, including a proposed or actual act or omission by a company, is “unfairly prejudicial” to the interests of shareholders generally or of some part of shareholders, including at least the shareholder making the application.
There may also be customary law personal actions available to shareholders. Under Article 143 of the Companies Law (which sets out the types of relief a court may grant in relation to an action brought under Article 141 of the Companies Law), the court may make an order regulating the affairs of a company, requiring a company to refrain from doing or continuing to do an act complained of, authorizing civil proceedings and providing for the purchase of shares by a company or by any of its other shareholders. |
| Inspection of Books and Records |
All shareholders of a Delaware corporation have the right, upon written demand, to inspect or obtain copies of the corporation’s shares ledger and its other books and records for any purpose reasonably related to such person’s interest as a shareholder. |
The register of shareholders and books containing the minutes of general meetings or of meetings of any class of shareholders of a Jersey company must during business hours be open to the inspection of a shareholder of the company without charge. The register of directors and secretaries must during business hours (subject to such reasonable restrictions as the company may by its articles of association or in general meeting impose, but so that not less than two hours in each business day be allowed for inspection) be open to the inspection of a shareholder or director of the company without charge. |
| Corporate Law Issue |
Delaware Law |
Jersey Law |
| Amendments to Charter |
Amendments to the certificate of incorporation of a Delaware corporation generally require the affirmative vote of the holders of a majority of the outstanding shares entitled to vote thereon or such greater vote as is provided for in the certificate of incorporation, subject to certain exceptions under Delaware law. A provision in the certificate of incorporation requiring the vote of a greater number or proportion of the directors or of the holders of any class of shares than is required by Delaware corporate law may not be amended, altered or repealed except by such greater vote. |
The memorandum of association and the articles of association of a Jersey company may only be amended by special resolution (being a two-thirds majority if the articles of association of the company do not specify a greater majority) passed by shareholders in general meeting or by written resolution signed by all the shareholders entitled to vote. |
| Blank Check Preferred Stock/Shares |
Under Delaware law, the certificate of incorporation of a corporation may give the board the right to issue new classes of preferred shares with voting, conversion, dividend distribution, and other rights to be determined by the board at the time of issuance, which could prevent a takeover attempt and thereby preclude shareholders from realizing a potential premium over the market value of their shares.
In addition, Delaware law does not prohibit a corporation from adopting a shareholder rights plan, or “poison pill,” which could prevent a takeover attempt and also preclude shareholders from realizing a potential premium over the market value of their shares. |
The UK’s Takeover Code requires a target company shareholders' consent in general meeting before the target company can take any action (other than seeking alternative bids) that may result in the frustration of a takeover bid. Moreover, the Takeover Code provides that the board of directors of an offeree company must act in the interests of the company as a whole and must not deny the holders of securities the opportunity to decide on the merits of a takeover bid. |
| Corporate Law Issue |
Delaware Law |
Jersey Law |
| Distributions and Dividends; Repurchases and Redemptions |
Under Delaware law, subject to any restrictions contained in the certificate of incorporation, a corporation may pay dividends out of capital surplus or, if there is no surplus, out of net profits for the current and/or the preceding fiscal year in which the dividend is declared, as long as the amount of capital of the corporation following the declaration and payment of the dividend is not less than the aggregate amount of the capital represented by issued and outstanding shares having a preference upon the distribution of assets. Surplus is defined in Delaware law as the excess of the net assets over capital, as such capital may be adjusted by the board.
A Delaware corporation may purchase or redeem shares of any class except when its capital is impaired or would be impaired by the purchase or redemption, and it may not purchase, for more than the price at which they may be redeemed, any of its shares which are redeemable at the option of the corporation. A corporation may, however, purchase or redeem out of capital shares that are entitled upon any distribution of its assets to a preference over another class or series of its shares if the shares are to be retired and the capital reduced. |
Under the Companies Law, a Jersey company may make a distribution at any time and out of any source provided that the directors of the company who authorize the distribution make an immediate and 12 month forward looking cash-flow solvency statement.
Likewise, authorizing directors must also make a solvency statement in the event of redeeming or purchasing the company’s shares.
The Companies Law allows a Jersey company to purchase its own shares, whether they are redeemable or not, provided that the purchase is sanctioned by a special resolution. The monies payable on the redemption of redeemable shares or on the purchase of its own shares by a Jersey company may be funded from any source, including capital, provided that such shares are fully paid.
If shares are to be purchased other than on a stock exchange, they may only be purchased pursuant to a contract approved in advance by an ordinary resolution of the company and they shall not carry the right to vote on the resolution sanctioning the purchase or approving the contract. If shares are to be purchased on a stock exchange, the resolution authorizing the purchase must specify the maximum number of shares to be purchased; the maximum and minimum prices which may be paid; and the date (not being later than 5 years after the passing of the resolution) on which the authority to purchase is to expire. |
Material contracts include the documents at exhibits 4.13 to 4.15 (agreement for the sale and purchase of the share capital of Bilboes Gold Limited (as amended) and net smelter returns royalty deed in respect of the acquisition of Bilboes Gold Limited), exhibits 4.16 to 4.17 (share purchase agreement between Bulawayo Mining Company Limited and the Company in respect of the acquisition of Motapa Mining Company UK Limited and related loan note instrument) and 4.19 (placing agreement in respect of the recent placing of 1,207,514 new securities during March and April 2023). For further details of the contracts, please refer to the exhibits and the disclosures in this Annual Report relating to the acquisitions of Bilboes and Motapa and the recent placing.
There are no governmental laws, decrees or regulations existing in Jersey, Channel Islands, which restrict the export or import of capital, or the remittance of dividends, interest or other payments to non-resident holders of Caledonia's securities, nor does Jersey, Channel Islands have foreign exchange currency controls. Exchange control approvals from the RBZ and the Reserve Bank of South Africa are required on the flow of funds in and out of Zimbabwe and South Africa; Caledonia obtained the necessary approvals from the RBZ and the Reserve Bank of South Africa to transfer foreign currency during 2023.
Certain United States Federal Income Tax Considerations
The following is a general summary of certain material U.S. federal income tax considerations applicable to a U.S. Holder (as defined below) arising from and relating to the acquisition, ownership, and disposition of shares. This summary is for general information purposes only and does not purport to be a complete analysis or listing of all potential U.S. federal income tax considerations that may apply to a U.S. Holder arising from and relating to the acquisition, ownership, and disposition of shares. In addition, this summary does not take into account the individual facts and circumstances of any particular U.S. Holder that may affect the U.S. federal income tax consequences to such U.S. Holder, including without limitation specific tax consequences to a U.S. Holder under an applicable income tax treaty. Accordingly, this summary is not intended to be, and should not be construed as, legal or U.S. federal income tax advice with respect to any U.S. Holder. This summary does not address the U.S. federal net investment income, U.S. federal alternative minimum, U.S. federal estate and gift, U.S. state and local, and non-U.S. tax consequences to U.S. Holders of the acquisition, ownership, and disposition of shares. In addition, except as specifically set forth below, this summary does not discuss applicable tax reporting requirements. Each prospective U.S. Holder should consult its own tax advisor regarding the U.S. federal, U.S. federal net investment income, U.S. federal alternative minimum, U.S. federal estate and gift, U.S. state and local, and non-U.S. tax consequences relating to the acquisition, ownership, and disposition of shares. No legal opinion from U.S. legal counsel or ruling from the Internal Revenue Service (the “IRS”) has been requested, or will be obtained, regarding the U.S. federal income tax consequences of the acquisition, ownership, and disposition of shares. This summary is not binding on the IRS, and the IRS is not precluded from taking a position that is different from, and contrary to, the positions taken in this summary. In addition, because the authorities on which this summary is based are subject to various interpretations, the IRS and the U.S. courts could disagree with one or more of the conclusions described in this summary.
Scope of this Summary
Authorities
This summary is based on the Internal Revenue Code of 1986, as amended (the “Code”), Treasury Regulations (whether final, temporary, or proposed), published rulings of the IRS, published administrative positions of the IRS, and U.S. court decisions that are applicable and, in each case, as in effect and available, as of the date of this document. Any of the authorities on which this summary is based could be changed in a material and adverse manner at any time, and any such change could be applied on a retroactive or prospective basis which could affect the U.S. federal income tax considerations described in this summary. This summary does not discuss the potential effects, whether adverse or beneficial, of any proposed legislation that, if enacted, could be applied on a retroactive, current or prospective basis.
U.S. Holders
For purposes of this summary, the term "U.S. Holder" means a beneficial owner of shares that is for U.S. federal income tax purposes:
| ● |
an individual who is a citizen or resident of the U.S.; |
| ● |
a corporation (or other entity taxable as a corporation for U.S. federal income tax purposes) organized under the laws of the U.S., any state thereof or the District of Columbia; |
| ● |
an estate whose income is subject to U.S. federal income taxation regardless of its source; or |
| ● |
a trust that (1) is subject to the primary supervision of a court within the U.S. and the control of one or more U.S. persons for all substantial decisions or (2) has a valid election in effect under applicable Treasury Regulations to be treated as a U.S. person. |
U.S. Holders Subject to Special U.S. Federal Income Tax Rules Not Addressed
This summary does not address the U.S. federal income tax considerations applicable to U.S. Holders that are subject to special provisions under the Code, including, but not limited to, the following U.S. Holders that: (a) are tax-exempt organizations, qualified retirement plans, individual retirement accounts, or other tax-deferred accounts; (b) are financial institutions, underwriters, insurance companies, real estate investment trusts, or regulated investment companies; (c) are broker-dealers, dealers, or traders in securities or currencies that elect to apply a mark-to-market accounting method; (d) have a “functional currency” other than the USD; (e) own shares as part of a straddle, hedging transaction, conversion transaction, constructive sale, or other integrated transaction; (f) acquired shares in connection with the exercise of employee stock options or otherwise as compensation for services; (g) hold shares other than as a capital asset within the meaning of Section 1221 of the Code (generally, property held for investment purposes); (h) are subject to the alternative minimum tax; (i) are partnerships and other pass-through entities (and investors in such partnerships and entities); (j) are S corporations (and shareholders or investors in such S corporations); (k) own, have owned or will own (directly, indirectly, or by attribution) 10% or more of the total combined voting power or value of the outstanding shares of the Company; (l) U.S. expatriates or former long-term residents of the U.S., (m) holds shares in connection with a trade or business, permanent establishment, or fixed base outside the United States, or (n) are subject to special tax accounting rules with respect to shares. U.S. Holders that are subject to special provisions under the Code, including, but not limited to, U.S. Holders described immediately above, should consult their own tax advisor regarding the U.S. federal, U.S. federal net investment income, U.S. federal alternative minimum, U.S. federal estate and gift, U.S. state and local, and non-U.S. tax consequences relating to the acquisition, ownership and disposition of shares.
If an entity or arrangement that is classified as a partnership (or other “pass-through” entity) for U.S. federal income tax purposes holds shares, the U.S. federal income tax consequences to such entity and the partners (or other owners) of such entity generally will depend on the activities of the entity and the status of such partners (or owners). This summary does not address the tax consequences to any such owner. Partners (or other owners) of entities or arrangements that are classified as partnerships or as “pass-through” entities for U.S. federal income tax purposes should consult their own tax advisors regarding the U.S. federal income tax consequences arising from and relating to the acquisition, ownership, and disposition of shares.
Ownership and Disposition of shares
The following discussion is subject in its entirety to the rules described below under the heading “Passive Foreign Investment Company Rules”.
Taxation of Distributions
A U.S. Holder that receives a distribution, including a constructive distribution, with respect to a share will be required to include the amount of such distribution in gross income as a dividend (without reduction for any foreign income tax withheld from such distribution) to the extent of the current or accumulated “earnings and profits” of the Company, as computed for U.S. federal income tax purposes. A dividend generally will be taxed to a U.S. Holder at ordinary income tax rates if the Company is a Passive Foreign Investment Company (“PFIC”) for the tax year of such distribution or the preceding year. To the extent that a distribution exceeds the current and accumulated “earnings and profits” of the Company, such distribution will be treated first as a tax-free return of capital to the extent of a U.S. Holder's tax basis in the shares and thereafter as gain from the sale or exchange of such shares (see “Sale or Other Taxable Disposition of Shares” below). However, the Company may not maintain the calculations of its earnings and profits in accordance with U.S. federal income tax principles, and each U.S. Holder may have to assume that any distribution by the Company with respect to the shares will constitute ordinary dividend income. Dividends received on shares by corporate U.S. Holders generally will not be eligible for the “dividends received deduction”. Subject to applicable limitations and provided the shares are readily tradable on a United States securities market, dividends paid by the Company to non-corporate U.S. Holders, including individuals, generally will be eligible for the preferential tax rates applicable to long-term capital gains for dividends, provided certain holding period and other conditions are satisfied, including that the Company not be classified as a PFIC (as defined below) in the tax year of distribution or in the preceding tax year. The dividend rules are complex, and each U.S. Holder should consult its own tax advisor regarding the application of such rules.
Sale or Other Taxable Disposition of Shares
A U.S. Holder will generally recognize gain or loss on the sale or other taxable disposition of shares in an amount equal to the difference, if any, between (a) the amount of cash plus the fair market value of any property received and (b) such U.S. Holder’s tax basis in such shares sold or otherwise disposed of. Any such gain or loss recognized on such sale or other disposition generally will be capital gain or loss, which will be long-term capital gain or loss if, at the time of the sale or other disposition, such shares are held for more than one year.
Preferential tax rates apply to long-term capital gains of a U.S. Holder that is an individual, estate, or trust. There are currently no preferential tax rates for long-term capital gains of a U.S. Holder that is a corporation. Deductions for capital losses are subject to significant limitations under the Code.
Passive Foreign Investment Company (“PFIC”) Rules
If the Company were to constitute a PFIC for any year during a U.S. Holder’s holding period, then certain potentially adverse rules would affect the U.S. federal income tax consequences to a U.S. Holder resulting from the acquisition, ownership and disposition of shares. The Company believes that it was not a PFIC for its most recently completed tax year. No opinion of legal counsel or ruling from the IRS concerning the status of the Company as a PFIC has been obtained or is currently planned to be requested. However, PFIC classification is fundamentally factual in nature, generally cannot be determined until the close of the tax year in question and is determined annually. Additionally, the analysis depends, in part, on the application of complex U.S. federal income tax rules, which are subject to differing interpretations. Consequently, there can be no assurance that the Company has never been and will not become a PFIC for any tax year during which U.S. Holders hold shares.
In addition, in any year in which the Company is classified as a PFIC, a U.S. Holder will be required to file an annual report with the IRS containing such information as Treasury Regulations and/or other IRS guidance may require. A failure to satisfy such reporting requirements may result in an extension of the time period during which the IRS can assess a tax. U.S. Holders should consult their own tax advisors regarding the requirements of filing such information returns under these rules, including the requirement to file an IRS Form 8621 annually.
The Company generally will be a PFIC under Section 1297 of the Code if, after the application of certain “look-through” rules with respect to subsidiaries in which the Company holds at least 25% of the value of such subsidiary, for a tax year, (a) 75% or more of the gross income of the Company for such tax year is passive income (the “income test”) or (b) 50% or more of the value of the Company’s assets either produce passive income or are held for the production of passive income (the “asset test”), based on the quarterly average of the fair market value of such assets. “Gross income” generally includes all sales revenues less the cost of goods sold, plus income from investments and incidental or outside operations or sources, and “passive income” generally includes, for example, dividends, interest, certain rents and royalties, certain gains from the sale of stock and securities, and certain gains from commodities transactions. Active business gains arising from the sale of commodities generally are excluded from passive income if substantially all of a foreign corporation’s commodities are stock in trade or inventory, depreciable property used in a trade or business or supplies regularly used or consumed in the ordinary course of its trade or business, and certain other requirements are satisfied.
If the Company were a PFIC in any tax year during which a U.S. Holder held shares, such holder generally would be subject to special rules with respect to “excess distributions” made by the Company on the shares and with respect to gain from the disposition of shares. An “excess distribution” generally is defined as the excess of distributions with respect to the shares received by a U.S Holder in any tax year over 125% of the average annual distributions such U.S. Holder has received from the Company during the shorter of the three preceding tax years, or such U.S. Holder’s holding period for the shares. Generally, a U.S. Holder would be required to allocate any excess distribution or gain from the disposition of the shares ratably over its holding period for the shares. Such amounts allocated to the year of the disposition or excess distribution would be taxed as ordinary income, and amounts allocated to prior tax years would be taxed as ordinary income at the highest tax rate in effect for each such year and an interest charge at a rate applicable to underpayments of tax would apply.
While there are U.S. federal income tax elections that sometimes can be made to mitigate these adverse tax consequences (including the “QEF Election” under Section 1295 of the Code and the “Mark-to-Market Election” under Section 1296 of the Code), such elections are available in limited circumstances and must be made in a timely manner.
U.S. Holders should be aware that, for each tax year, if any, that the Company is a PFIC, the Company can provide no assurances that it will satisfy the record-keeping requirements of a PFIC, or that it will make available to U.S. Holders the information such U.S. Holders require to make a QEF Election with respect to the Company or any subsidiary that also is classified as a PFIC.
Certain additional adverse rules may apply with respect to a U.S. Holder if the Company is a PFIC, regardless of whether the U.S. Holder makes a QEF Election. These rules include special rules that apply to the amount of foreign tax credit that a U.S. Holder may claim on a distribution from a PFIC. Subject to these special rules, foreign taxes paid with respect to any distribution in respect of stock in a PFIC are generally eligible for the foreign tax credit. U.S. Holders should consult their own tax advisors regarding the potential application of the PFIC rules to the ownership and disposition of shares, and the availability of certain U.S. tax elections under the PFIC rules.
Additional Considerations
Receipt of Foreign Currency
The amount of any distribution paid to a U.S. Holder in foreign currency, or payment received on the sale, exchange or other taxable disposition of shares, generally will be equal to the USD value of such foreign currency based on the exchange rate applicable on the date of receipt (regardless of whether such foreign currency is converted into USD at that time). A U.S. Holder will have a basis in the foreign currency equal to its USD value on the date of receipt. Any U.S. Holder who converts or otherwise disposes of the foreign currency after the date of receipt may have a foreign currency exchange gain or loss that would be treated as ordinary income or loss, and generally will be U.S. source income or loss for foreign tax credit purposes. Different rules apply to U.S. Holders who use the accrual method with respect to foreign currency received upon the sale, exchange or other taxable disposition of the shares. Each U.S. Holder should consult its own U.S. tax advisor regarding the U.S. federal income tax consequences of receiving, owning, and disposing of foreign currency.
Foreign Tax Credit
Dividends paid on the shares will be treated as foreign-source income, and generally will be treated as “passive category income” or “general category income” for U.S. foreign tax credit purposes. The Code applies various complex limitations on the amount of foreign taxes that may be claimed as a credit by U.S. taxpayers. In addition, Treasury Regulations that apply to taxes paid or accrued (the “Foreign Tax Credit Regulations”) impose additional requirements for non-U.S. withholding taxes to be eligible for a foreign tax credit, and there can be no assurance that those requirements will be satisfied. The Treasury Department has released guidance temporarily pausing the application of certain of the Foreign Tax Credit Regulations.
Subject to the PFIC rules and the Foreign Tax Credit Regulations, each as discussed above, a U.S. Holder that pays (whether directly or through withholding) foreign income tax with respect to dividends paid on the shares generally will be entitled, at the election of such U.S. Holder, to receive either a deduction or a credit for such foreign income tax. Generally, a credit will reduce a U.S. Holder’s U.S. federal income tax liability on a dollar-for-dollar basis, whereas a deduction will reduce a U.S. Holder’s income subject to U.S. federal income tax. This election is made on a year-by-year basis and applies to all foreign taxes paid (whether directly or through withholding) by a U.S. Holder during a year. The foreign tax credit rules are complex and involve the application of rules that depend on a U.S. Holder’s particular circumstances. Each U.S. Holder should consult its own U.S. tax advisor regarding the foreign tax credit rules.
Backup Withholding and Information Reporting
Under U.S. federal income tax law and Treasury Regulations, certain categories of U.S. Holders must file information returns with respect to their investment in, or involvement in, a foreign corporation. For example, U.S. return disclosure obligations (and related penalties) are imposed on individuals who are U.S. Holders that hold certain specified foreign financial assets in excess of certain threshold amounts. The definition of specified foreign financial assets includes not only financial accounts maintained in foreign financial institutions, but also, unless held in accounts maintained by a financial institution, any stock or security issued by a non-U.S. person, any financial instrument or contract held for investment that has an issuer or counterparty other than a U.S. person and any interest in a foreign entity. U.S. Holders may be subject to these reporting requirements unless their shares are held in an account at certain financial institutions. Penalties for failure to file certain of these information returns are substantial. U.S. Holders should consult their own tax advisors regarding the requirements of filing information returns, including the requirement to file an IRS Form 8938.
Payments made within the U.S. or by a U.S. payor or U.S. middleman, of dividends on, and proceeds arising from the sale or other taxable disposition of, shares will generally be subject to information reporting and backup withholding tax, currently at the rate of 24%, if a U.S. Holder (a) fails to furnish such U.S. Holder’s correct U.S. taxpayer identification number (generally on IRS Form W-9), (b) furnishes an incorrect U.S. taxpayer identification number, (c) is notified by the IRS that such U.S. Holder has previously failed to properly report items subject to backup withholding tax, or (d) fails to certify, under penalty of perjury, that such U.S. Holder has furnished its correct U.S. taxpayer identification number and that the IRS has not notified such U.S. Holder that it is subject to backup withholding tax. However, certain exempt persons generally are excluded from these information reporting and backup withholding rules. Backup withholding is not an additional tax. Any amounts withheld under the U.S. backup withholding tax rules will be allowed as a credit against a U.S. Holder’s U.S. federal income tax liability, if any, or will be refunded, if such U.S. Holder furnishes required information to the IRS in a timely manner.
The discussion of reporting requirements set forth above is not intended to constitute a complete description of all reporting requirements that may apply to a U.S. Holder. A failure to satisfy certain reporting requirements may result in an extension of the time period during which the IRS can assess a tax, and under certain circumstances, such an extension may apply to assessments of amounts unrelated to any unsatisfied reporting requirement. Each U.S. Holder should consult its own tax advisor regarding the information reporting and backup withholding rules.
THE ABOVE SUMMARY IS NOT INTENDED TO CONSTITUTE A COMPLETE ANALYSIS OF ALL TAX CONSIDERATIONS APPLICABLE TO U.S. HOLDERS WITH RESPECT TO THE ACQUISITION, OWNERSHIP, AND DISPOSITION OF SHARES. U.S. HOLDERS SHOULD CONSULT THEIR OWN TAX ADVISORS AS TO THE TAX CONSIDERATIONS APPLICABLE TO THEM IN LIGHT OF THEIR OWN PARTICULAR CIRCUMSTANCES.
F. Dividends and Paying Agents
Not applicable.
Not applicable.
Any statement in this Annual Report about any of our contracts or other documents is not necessarily complete. If the contract or document is filed as an exhibit to this Annual Report, the contract or document is deemed to modify the description contained in this Annual Report. Readers must review the exhibits themselves for a complete description of the contract or document.
We are subject to the informational requirements of the Exchange Act and file reports and other information with the SEC. The SEC maintains a website that contains reports, proxy and information statements and other information regarding registrants that file electronically with the SEC at http://www.sec.gov.
We are required to file reports and other information with the securities commissions in Canada. You are invited to read and copy any reports, statements or other information, other than confidential filings, that we file with the provincial securities commissions. These filings are also electronically available from the Canadian System for Electronic Document Analysis and Retrieval ("SEDAR") (www.sedar.com), the Canadian equivalent of the SEC's electronic document gathering and retrieval system.
Copies of our material contracts are kept at our registered office.
Not applicable.
J. Annual Report to Security Holders
Not applicable
ITEM 11 - QUANTITATIVE AND QUALITATIVE DISCLOSURES ABOUT MARKET RISK
The Company is exposed in varying degrees to a variety of financial instrument related risks by virtue of its activities. The overall financial risk management program focuses on preservation of capital and protecting current and future Company assets and cash flows by reducing exposure to risks posed by the uncertainties and volatilities of financial markets.
The Board of Directors of the Company has a responsibility to ensure that an adequate financial risk management policy is established and to approve the policy. The Company’s Audit Committee oversees management’s compliance with the Company’s financial risk management policy.
The fair value of the Company’s financial instruments approximates their carrying value unless otherwise noted. The types of risk exposure and the way in which such exposures are managed are as follows:
The Group is exposed to currency risk on inter-company sales and purchases that are denominated in a currency other than the respective functional currencies of Group entities. The Group does not use financial instruments to hedge its exposure to currency risk. To reduce exposure to currency transaction risk, the Group regularly reviews the currency (i.e. RTGS$ or foreign currency) in which it spends its cash to identify and avoid specific expenditures in currencies that experience inflationary pressures. The Group aims to maintain cash and cash equivalents in US Dollars to manage foreign exchange exposure. The operating results and financial position of the Group are reported in USD in the Consolidated Financial Statements.
The availability of foreign exchange and the fluctuation of the USD in relation to other currencies that entities, within the Group, may transact in will consequently have an impact upon the profitability of the Group and may also affect the value of the Group’s assets and liabilities. As noted below, the Group has certain financial assets and liabilities denominated in currencies other than the functional currency of the Company. To reduce exposure to currency transaction risk, the Group regularly reviews the currency in which it spends its cash to identify and avoid specific expenditures in currencies that experience inflationary pressures. Further the Group aims to maintain cash and cash equivalents in USD to avoid foreign exchange exposure and to meet short‐term liquidity requirements.
As a result of the Group’s monetary assets and liabilities denominated in foreign currencies which is different to the functional currency of the underlying entities, the profit or loss and equity in the underlying entities could be affected by movements between the functional currency and the foreign currency. The table below indicates consolidated monetary assets/ (liabilities) in the Group that have a different functional currency and foreign currency.
| 2023 |
2022 |
2021 |
||||||||||||||||||||||
| $'000 |
$'000 |
$'000 |
||||||||||||||||||||||
| Functional currency |
Functional currency |
Functional currency |
||||||||||||||||||||||
| ZAR |
$ |
ZAR |
$ |
ZAR |
$ |
|||||||||||||||||||
| Cash and cash equivalents |
62 | 4,706 | 62 | 3,443 | 62 | 1,414 | ||||||||||||||||||
| USD denominated |
61 | - | 62 | - | 61 | - | ||||||||||||||||||
| ZAR denominated |
- | 989 | - | 631 | - | 573 | ||||||||||||||||||
| RTGS$ denominated |
- | 3,424 | - | 2,502 | - | 259 | ||||||||||||||||||
| GBP denominated |
1 | 293 | - | 235 | 1 | 426 | ||||||||||||||||||
| CAD denominated |
- | - | - | 75 | - | 156 | ||||||||||||||||||
| Trade and other receivables - RTGS$ denominated |
- | 3,118 | - | 2,607 | - | 2,293 | ||||||||||||||||||
| Trade and other payables - RTGS$ denominated |
- | (106 | ) | - | (130 | ) | - | (166 | ) | |||||||||||||||
| Overdraft and term loans - RTGS$ denominated |
- | - | - | - | - | - | ||||||||||||||||||
| 62 | 7,718 | 62 | 5,920 | 62 | 3,541 | |||||||||||||||||||
A reasonably possible strengthening or weakening of 5% of the various functional currencies against the foreign currencies would have the following equal or opposite effect on profit or loss before tax for the Group:
| 2023 $’000 |
2022 $’000 |
2021 $’000 |
||||||||||||||||||||||
| Functional currency |
Functional currency |
Functional currency |
||||||||||||||||||||||
| ZAR |
USD |
ZAR |
USD |
ZAR |
USD |
|||||||||||||||||||
| Cash and cash equivalents |
3 | 177 | 3 | 134 | 3 | 67 | ||||||||||||||||||
| Trade and other receivables |
- | 148 | - | 124 | - | 109 | ||||||||||||||||||
| Trade and other payables |
- | (5 | ) | - | (6 | ) | - | (8 | ) | |||||||||||||||
| Overdraft |
- | - | - | - | - | - | ||||||||||||||||||
| 3 | 320 | 3 | 252 | 3 | 168 | |||||||||||||||||||
C. Concentration of Credit Risk
Credit risk is the risk of a financial loss to the Company if a debtor fails to meet its contractual obligation. From 2014, gold sales were made to Fidelity in Zimbabwe and the payment terms stipulated in the service delivery contract have been adhered to in all instances. 75% of the portion of unrefined metals produced by Blanket and exported by Caledonia to AEG, from April of 2023 on the toll refinement basis. Trade and other receivables are detailed in note 21 to the Consolidated Financial Statements and include $5.4 million (December 31, 2022: $7.4 million, December 31, 2021: $4.5 million) due from Fidelity and AEG in respect of the RTGS$ and USD components respectively of the revenues arising on gold deliveries prior to the close of business on December 31, 2023. All outstanding amounts due from Fidelity and AEG were received in full after the end of the 2023 year. $3.8 million (December 31, 2022: $1 million, December 31, 2021: $3.2 million) was due from the Zimbabwe Government in respect of VAT refunds. The amount due in respect of VAT refunds mainly comprises RTGS$-denominated VAT refunds. Increased delays in the processing of VAT refunds by the Government of Zimbabwe has resulted in an increase in the amount receivable in RTGS$ terms. The long-outstanding balances have either been repaid after the end of the Year or have been recovered by way of offset against other tax payables due to the Government of Zimbabwe.
Liquidity risk is the risk that the Group will not be able to meet its financial obligations as they fall due. The Group manages its liquidity risk by ensuring that there is enough cash to meet its likely cash requirements, after taking into account cash flows from operations and the Group’s holdings of cash and cash equivalents. The Group believes that these sources will be enough to cover the anticipated cash requirements. Senior management is also actively involved in the review and approval of planned expenditures by regularly monitoring cash flows from operations and anticipated investing and financing activities.
E. Market Risk - Interest Rate Risk
The Group's interest rate risk arises from loans and borrowings, overdraft facility and cash held. The loans and borrowings, overdraft facility and cash held have variable interest rate borrowings. Variable-rate borrowings expose the Group to cash flow interest rate risk. The Group has not entered into interest rate swap agreements and mitigates the interest rate risk by remaining in a positive consolidated net cash position.
The Group’s assets and (liabilities) exposed to interest rate fluctuations as at year-end are summarized as follows:
| 2023 |
2022 |
2021 |
||||||||||
| Cash and cash equivalents |
6,709 | 6,735 | 17,152 | |||||||||
| Overdraft |
(17,740 | ) | (5,239 | ) | (887 | ) | ||||||
Interest rate risk arising is offset by available cash and cash equivalents. The table below summarizes the effect of a change in finance cost on the Group’s profit or loss and equity for the year, had the rates charged differed.
| 2023 |
2022 |
2021 |
||||||||||
| Sensitivity analysis – cash and cash equivalents |
||||||||||||
| Increase in 100 basis points |
67 | 67 | 172 | |||||||||
| Decrease in 100 basis points |
(67 | ) | (67 | ) | (172 | ) | ||||||
| Sensitivity analysis – overdraft |
||||||||||||
| Increase in 100 basis points |
177 | 52 | 9 | |||||||||
| Decrease in 100 basis points |
(177 | ) | (52 | ) | (9 | ) | ||||||
The value of the Company’s mineral properties is related to the price of gold and the outlook for these minerals. In addition, adverse changes in the price of certain key or high cost operating consumables can significantly impair the Company’s cash flows.
Gold prices historically have fluctuated widely and are affected by numerous factors outside of the Company's control, including, but not limited to, industrial and retail demand, central bank lending, forward sales by producers and speculators, levels of worldwide production, short-term changes in supply and demand because of speculative hedging activities, and macro-economic variables, and certain other factors related specifically to gold.
The Group regularly monitors its market risk and evaluates the options available.
Sensitivity analysis
A reasonably possible strengthening (weakening) of the gold price will have an impact on the revenue of the Group and the fair value of the gold loan and call option at December 31, 2023. This would have affected the measurement of financial instruments by the amounts as indicated below. This analysis assumes that all other variables remain constant.
An increase or decrease of 5% of the gold price would have the following equal or opposite effect on the derivative financial instruments on December 31:
| 2023 |
2022 |
2021 |
||||||||||
| Consolidated statement of financial position: |
||||||||||||
| Derivative financial liabilities - Gold loan |
||||||||||||
| Increase by 5% of the gold price |
- | - | 143 | |||||||||
| Decrease by 5% of the gold price |
- | - | (143 | ) | ||||||||
| Derivative financial liabilities - call option |
||||||||||||
| Increase in 100 basis points |
- | - | 11 | |||||||||
| Decrease in 100 basis points |
- | - | (11 | ) | ||||||||
| Derivative financial liabilities – put option |
||||||||||||
| Increase in 100 basis points |
- | - | - | |||||||||
| Decrease in 100 basis points |
4 | 22 | - | |||||||||
| 2023 |
2022 |
2021 |
||||||||||
| Consolidated statement of profit or loss and other comprehensive income: |
||||||||||||
| Derivative financial liabilities - Gold loan |
||||||||||||
| Increase by 5% of the gold price |
- | - | 143 | |||||||||
| Decrease by 5% of the gold price |
- | - | (143 | ) | ||||||||
| Derivative financial liabilities - call option |
||||||||||||
| Increase in 100 basis points |
- | - | 11 | |||||||||
| Decrease in 100 basis points |
- | - | (11 | ) | ||||||||
| Derivative financial liabilities – put option |
||||||||||||
| Increase in 100 basis points |
- | - | - | |||||||||
| Decrease in 100 basis points |
4 | 22 | - | |||||||||
The Group’s revenues had full exposure to the gold price up to March 2024 when the gold put option agreement was concluded (refer note 14.1 of the Consolidated Financial Statements). New put options were purchased in March 2024 to hedge 12,000 ounces of gold over a period of three months from January to March 2024 at a strike price of $1,950.
ITEM 12 - DESCRIPTION OF SECURITIES OTHER THAN EQUITY SECURITIES
Not Applicable.
The Company does not have securities registered as American Depository Receipts.
ITEM 13 - DEFAULTS, DIVIDEND ARREARS AND DELINQUENCIES
There has not been a material default in the payment of principal, interest, a sinking or purchase fund installment, or any other material default not cured within thirty days, relating to indebtedness of the Company or any of its significant subsidiaries. There are no payments of dividends by the Company in arrears, nor has there been any other material delinquency relating to any class of preference shares of the Company.
ITEM 14 - MATERIAL MODIFICATIONS TO THE RIGHTS OF SECURITY HOLDERS AND USE OF PROCEEDS
None.
Not applicable.
ITEM 15 - CONTROLS AND PROCEDURES
A. Disclosure Controls and Procedures
The Company’s Chief Executive Officer (“CEO”) and Chief Financial Officer (“CFO”) have evaluated the effectiveness of the design and operation of the Company’s disclosure controls and procedures and assessed the design of the Company’s internal control over financial reporting as of December 31, 2023. As required by Rule 13(a)-15 under the Exchange Act, in connection with this Annual Report on Form 20-F, under the direction of our CEO and CFO, we have evaluated our disclosure controls and procedures as of December 31, 2023, and we have concluded our disclosure controls and procedures were effective as at December 31, 2023.
B. Management’s annual report on internal control over financial reporting
Management is responsible for establishing and maintaining adequate internal control over financial reporting as defined in Rules 13a-15(f) and 15d-15(f) under the Exchange Act. Internal control over financial reporting has been designed to provide reasonable assurance with respect to the reliability of financial reporting and the presentation of financial statements for external purposes in accordance with IFRS. A control system, no matter how well designed and operated, can provide only reasonable, not absolute, assurance that the control system’s objectives will be met. Further, the design of a control system must reflect the fact that there are resource constraints. Because of the inherent limitations in all control systems, no evaluation of controls can provide absolute assurance that all control issues and instances of fraud, if any, within our Company have been detected.
As of the date of this filing, we have in place controls and procedures to maintain appropriate segregation of duties in our manual and computer-based business processes that we believe are appropriate for a company of our size and extent of business transactions. Under the supervision and with the participation of the CEO and CFO, management assessed the effectiveness of the Company’s internal control over financial reporting as of December 31, 2023. In making their assessment, management used the control objectives established in the 2013 Committee of Sponsoring Organizations of the Treadway Commission (“COSO”) framework. Based upon that assessment and those criteria, management concluded that the Company’s internal control over financial reporting was effective as of December 31, 2023.
C. Attestation report of registered public accounting firm
This Annual Report does not include an attestation report of our registered public accounting firm regarding internal control over financial reporting. Management's report was not subject to attestation by our registered public accounting firm as we qualify as an "emerging growth company" under section 3(a) of the Exchange Act (as amended by the JOBS Act, enacted on April 5, 2012), and are therefore exempt from the attestation requirement.
D. Changes in internal controls over financial reporting
There were no changes in the Company’s internal controls over financial reporting identified in connection with the evaluation required by paragraph (d) of 17 CFR 240.13a-15 or 240.15d-15 that occurred during the period covered by this Annual Report that has materially affected, or is reasonably likely to materially affect, the issuer’s internal control over financial reporting.
ITEM 16A - AUDIT COMMITTEE FINANCIAL EXPERT
The Board of Directors has determined that all four members of its Audit Committee are considered independent as defined under Canadian National Instrument 52-110 and as defined under Section 803 of the NYSE American LLC Company Guide and Exchange Act Rule 10A-3 (as such definitions may be modified or supplemented) and considered to be financially literate as such terms are defined under Canadian National Instrument 52-110, and two of the members can be considered to be financial experts as defined in Item 407(d)(5) of Regulation S-K under the Exchange Act. The financial experts serving on the Audit Committee are Mr. J. Holtzhausen and Ms. T. Gadzikwa, whose experience is disclosed in this Annual Report under Item 6.A “Directors and Senior Management”. Mr. J. Holtzhausen, Mr. G. Wylie, Ms. G. Wildschutt and Ms. T. Gadzikwa are all independent directors under the applicable rules.
The SEC has indicated that the designation of an audit committee financial expert does not make that person an "expert" for any purpose, impose any duties, obligations, or liability on that person that are greater than those imposed on members of the Audit Committee and Board of Directors who do not carry this designation, or affect the duties, obligations, or liabilities of any other member of the Audit Committee.
On November 8, 2016 the registrant’s Board of Directors approved in principle, and the Company formally adopted on March 7, 2017, a revised code of business conduct, ethics and anti-bribery policy that applies to the registrant’s directors, CEO, CFO, principal accounting officer or controller, or persons performing similar functions, and all other employees and contractors. The code was further revised and the most recent updated version was adopted on November 10, 2020.
The text of this code is available on the Company’s website: (www.caledoniamining.com/index.php/aboutus/corporate-governance).
The Company has not granted any waiver from the Code of Ethics to the CEO, CFO, principal accounting officer or controller, or persons performing similar functions during the fiscal year ended December 31, 2023.
ITEM 16C - PRINCIPAL ACCOUNTANT FEES AND SERVICES
The following table sets forth the aggregate fees billed by our external auditors,
| (1)(2)2023 | (1)(2)2022 | (1)(2)2021 | ||||||||||
| Audit fees | 353,152 | 254,772 | 282,888 | |||||||||
| Audit – related fees | - | - | - | |||||||||
| Tax fees | - | - | - | |||||||||
| All other fees | - | 4,172 | 12,715 | |||||||||
| Total | 353,152 | 258,944 | 295,603 | |||||||||
Notes:
| (1) | Prior to the start of the audit process, Caledonia’s Audit Committee receives an estimate of the costs from its auditors and reviews such costs for their reasonableness. After their review and pre-approval of the fees, the Audit Committee recommends to the Board of Directors whether to accept the estimated audit fees given by the auditors. |
| (2) | Represents fees billed by BDO South Africa Incorporated |
ITEM 16D - EXEMPTIONS FROM THE LISTING STANDARDS FOR AUDIT COMMITTEES
Not applicable.
ITEM 16E - PURCHASES OF EQUITY SECURITIES BY THE ISSUER AND AFFILIATED PURCHASERS
Not applicable.
ITEM 16F - CHANGE IN REGISTRANT'S CERTIFYING ACCOUNTANT
None.
ITEM 16G - CORPORATE GOVERNANCE
Because our securities are listed on NYSE American, being a national securities exchange in the United States, we are subject to the corporate governance requirements set out in the NYSE American LLC Company Guide. We are also subject to a variety of corporate governance guidelines and requirements enacted by the jurisdictions and exchanges in which we operate our business and on which our securities are traded. We incorporate a mix of corporate governance best practices to ensure that our corporate governance complies in all material respects with the requirements of the jurisdictions in which we operate and the exchanges on which our securities are traded. The Company has also adopted the UK’s Quoted Companies Alliance Corporate Governance Code and discloses on its website how it satisfies the ten principles of the Code.
Section 110 of the NYSE American Company Guide permits NYSE American to consider the laws, customs and practices of foreign issuers, and to grant exemptions from NYSE American listing criteria based on these considerations. A company seeking relief under these provisions is required to provide a written certification from independent local counsel that the non-complying practice is not prohibited by home country law. A description of the significant ways in which the Company’s governance practices differ from those followed by domestic companies pursuant to NYSE American standards is as follows:
Shareholder Meeting Quorum Requirement: the NYSE American Company Guide specifies a quorum requirement of at least 33-1/3% of the shares issued and outstanding and entitled to vote for meetings of a listed company's shareholders. The Company's quorum requirements for shareholder meetings, as set forth in the Articles, are two members entitled to vote at the meeting present in person or by proxy together holding or representing by proxy not less than five percent of the issued shares of the Company. The Company's quorum requirement as set forth in the Articles is not prohibited by, and does not contravene, the Companies Law.
Proxy Delivery Requirement: the NYSE American requires the solicitation of proxies and delivery of proxy statements for all shareholder meetings and requires that these proxies be solicited pursuant to a proxy statement that conforms to SEC proxy rules. The Company is a “foreign private issuer” as defined in Rule 3b-4 under the Exchange Act, and the equity securities of the Company are accordingly exempt from the proxy rules set forth in Sections 14(a), 14(b), 14(c) and 14(f) of the Exchange Act. The Company complies with the applicable rules and regulations in Jersey.
Shareholder Approval of Certain Transactions: Section 712(b) of the NYSE American Company Guide provides that shareholder approval is required for approval of applications to list additional shares when additional shares will be issued in connection with a transaction where the present or potential issuance of common stock, or securities convertible into common stock, could result in an increase in outstanding common shares of 20% or more. There is no equivalent Jersey statutory legal requirement for shareholder approval where the present or potential issuance of common stock, or securities convertible into common stock, could result in an increase in outstanding common shares of 20% or more, nor is an equivalent requirement imposed by the Company's articles of association. The Company complies with the applicable rules and regulations in Jersey.
In addition, the Company may from time-to-time seek relief from NYSE American corporate governance requirements on specific transactions under Section 110 of the NYSE American Company Guide by providing written certification from independent local counsel that the non-complying practice is not prohibited by our home country law, in which case, the Company shall make the disclosure of such transactions available on its website at http://www.caledoniamining.com. Information contained on the Company’s website is not part of this Form 20-F.
ITEM 16H - MINE SAFETY DISCLOSURE
Pursuant to Section 1503(a) of the Dodd-Frank Wall Street Reform and Consumer Protection Act of 2010, issuers that are operators, or that have a subsidiary that is an operator, of a coal or other mine in the United States are required to disclose in their periodic reports filed with the SEC information regarding specified health and safety violations, orders and citations, related assessments and legal actions, and mining-related fatalities with respect to mining operations and properties in the United States that are subject to regulation by the Federal Mine Safety and Health Administration ("MSHA") under the Federal Mine Safety and Health Act of 1977 (the "Mine Act"). During the year ended December 31, 2023, the Company had no mines in the United States that were subject to regulation by the MSHA under the Mine Act.
ITEM 16I - DISCLOSURE REGARDING FOREIGN JURISDICTIONS THAT PREVENT INSPECTIONS
Not applicable.
ITEM 16J – INSIDER TRADING POLICIES
Not applicable.
Risk management and strategy
The Company has an integrated cybersecurity risk management program for assessing, identifying, and managing risk from cybersecurity threats. Reporting on progress and performance of the cybersecurity risk management program is done regularly to the IT Steering Committee (comprised of senior management) and quarterly to the Board of Directors. The Chief Information Officer (“CIO”) is responsible for maintaining this program along with a skilled team of IT professionals. The Company’s policies and procedures related to the cybersecurity risk management program include the following:
| ● |
Disaster recovery plan (including a step-by-step data restore process). This includes disaster classification, critical systems and response times, recovery team and escalation procedures. The CIO is responsible for declaring an I.T. disaster in consultation with the CEO, COO or CFO, and will be required to instruct the IT team to implement recovery procedures. Recovery efforts will be led by the IT team in South Africa and Zimbabwe with the use of consultants where necessary. |
All decisions are to be made by CIO, after consulting CEO, CFO and COO. Any formal communications to go through the Company’s formal PR process. The IT team in South Africa and Zimbabwe have the authority to make emergency decisions should the CIO not be reachable after consulting either the CEO, CFO or COO with regards to the matter. If a Cybersecurity Incident takes place, the Company’s Incident Response Plan (as defined below) will be implemented.
| ● |
Incident response plan (“Incident Response Plan”) which sets out the following cybersecurity incident phases |
| o |
IDENTIFY |
|
| o |
ASSESS - INCIDENT RESPONSE TEAM ESTABLISHED |
|
| o |
RESPOND |
|
| o |
REMEDY AND RECOVERY |
|
| o |
REVIEW AND IMPROVEMENT |
|
| o |
CONFIDENTIALITY |
| ● |
Access control policy addressing physical and logical security requirements. This is implemented through formalized controls which are performed according to the control frequencies and tested regularly by internal and external assurance providers. |
| ● |
Isometrix system to report any cybersecurity incidents, materiality, impact, and sign off. This system is used to document any cybersecurity incidents and assess the impact thereof. The impact assessment includes qualitative and quantitative factors and external providers will be utilized to assist with the assessment should this be deemed necessary. This system will also drive escalations based on materiality and the incident will be reported accordingly. All incidents are reported to the IT Steering Committee immediately. After the assessment is performed, these will be reported to the Board if material. On a quarterly basis, Cybersecurity matters are reported to the Board with regards to controls and processes in place, any new developments, and also any actions to be taken to improve the environment. |
Cybersecurity controls and procedures are formally documented using guidance from the National Institute of Standards and Technology Cybersecurity Framework and are assessed by third parties, external audits and internal audits on a regular basis. Examples of the Company’s cybersecurity controls and procedures include the following:
| ● |
Bitdefender Gravity Zone to manage malware and vulnerabilities, including automated patch management. |
| ● |
Company-wide use of VPN for all remote access, multifactor authentication for all privileged accounts and firewalls with restricted access. |
| ● |
Cybersecurity training, awareness and phishing campaigns using the KNOWBE4 platform. |
| ● |
Review of all Active Directory accounts (Network accounts), including admin password changes, restricting of guest accounts, restricting access to use external storage devices (USB access) and restricting email access on mobile devices. |
| ● |
Outdated IT hardware is replaced frequently and detailed asset and network diagrams maintained. |
| ● |
Monitoring of privileged activities on AD and failed logins for administrative accounts and administrative activities on all SQL databases via the LOG360 Management Tool. |
| ● |
Third party access to all systems is restricted and strictly monitored as required. All third party activities are subject to the Company’s ITGC controls framework. Segregation of duties between Applications, Databases and Operating Systems for privileged users is strictly monitored. |
| ● |
The IT risk register is updated on a regular basis. |
| ● |
Reporting to the IT Steering Committee on all key IT related matters with quarterly reporting to the Board of Directors. |
While Caledonia has not, as of the date of this Annual Report, experienced a “cybersecurity threat” (as defined in Item 106(a) of Regulation S-K) or “cybersecurity incident” (as defined in Item 106(a) of Regulation S-K) that has materially affected or was reasonably likely to materially affect the Company, including our business strategy, results of operations, or financial condition, there can be no guarantee that we will not experience such a cybersecurity threat or cybersecurity incident in the future.
Governance
Board Oversight
Cybersecurity is a focus risk area for the Company, and the Board of Directors provides oversight on risks from cybersecurity threats. Key cybersecurity matters are discussed at a weekly senior management meeting and in regular IT Steering Committee meetings attended by the CEO, COO, CFO and CIO.
Cybersecurity, as part of the general IT ecosystem, is also reported quarterly to the Board of Directors, and, should a cybersecurity incident occur, the reporting of such cybersecurity incident will be in line with the Company’s Incident Response Plan.
Management’s Role
The CEO, CFO, CIO and COO, as part of the IT Steering Committee, and the General Counsel, as Head of Risk, are responsible for assessing and managing the Company’s cybersecurity risk, along with external advisors if necessary, and reporting to the Board of Directors.
The IT Steering Committee members have sufficient expertise (Finance, IT and Operational) to assess the risk related to a cybersecurity matter, along with experts in the IT team that will provide analysis on any security matters.
The CIO and her team are responsible for updating the Isometrix system which is used to record all cybersecurity incidents. Quarterly updates on cybersecurity are provided to the Board of Directors.
Engaging the Board on a cybersecurity incident:
The Board of Directors is notified once a cybersecurity incident is deemed material by the IT Steering Committee or the CIO.
Communication of cybersecurity performance to stakeholders:
Only material cybersecurity incidents are communicated to stakeholders in accordance with applicable rules (including SEC rules) and requirements. Any potentially material cybersecurity incidents are reported to the IT Steering Committee as required.
Quantification of our cybersecurity risk in financial terms is performed so that we can make informed decisions about risk mitigation and risk transfer as follows: cybersecurity quantification is performed as part of the Incident Response Plan – respond phase (qualitative and quantitative factors are taken into consideration bearing in mind, in particular, information that a reasonable investor would consider important in making an investment decision, and information that would alter the total mix of information made available).
As part of the quantification of our Cybersecurity risk, and in addition to financial impact, the Company evaluates the extent of potential damage in the event of a Cybersecurity incident and the risk to systems and privileged accounts in particular. The Company audits which privileged accounts are being used, whether any passwords have been changed, and what applications are being used. Any risks identified are assessed for materiality, including the consideration of qualitative factors, such as effects on reputation, customer relationships, vendor relationships and regulatory compliance. A third party assurance provider will be used to assist Caledonia with the quantification should this be deemed necessary by the IT Steering Committee.
Measurements to determine whether our investments in cybersecurity are reducing our risk in a cost-effective manner include: bi-annual cybersecurity risk assessments and penetration tests are performed by third party assurance providers.
ITEM 17 - FINANCIAL STATEMENTS
See Item 18.
ITEM 18 - FINANCIAL STATEMENTS
The Consolidated Financial Statements and schedules appear on pages F-1 through F-78 of this Annual Report and are incorporated herein by reference. Our audited financial statements as prepared by our management and approved by the Board of Directors include:
Consolidated Statements of Profit or Loss and Other Comprehensive Income
Consolidated Statements of Financial Position
Consolidated Statements of Changes in Equity
Consolidated Statements of Cash Flows
Notes to the Consolidated Financial Statements
All the above statements are available on the Company’s website at www.caledoniamining.com or under the Company’s profile on the System for Electronic Document Analysis and Retrieval (“SEDAR”) at www.sedar.com
Financial Statements
| Description |
Page |
|
| Consolidated Financial Statements and Notes |
F-1- F-78 |
Exhibit List
| Exhibit No. |
Name |
| 15.5 |
S-K 1300 Technical Report Summary on the Maligreen Gold Project, Zimbabwe, with an effective date of December 31, 2022 (incorporated herein by reference to Exhibit 15.5 to the Registrant’s Annual Report on Form 20-F filed with the SEC on April 28, 2023) |
| 15.6 |
Bilboes Gold Project Technical Report Summary, with an effective date December 31, 2023 |
| 15.7 | Consent of Uwe Engelmann |
| 15.8 | Consent of Marthinus van Staden |
| 97.1 |
|
| 101.INS |
Inline XBRL Instance Document |
| 101.SCH |
Inline XBRL Taxonomy Extension Schema Document |
| 101.CAL |
Inline XBRL Taxonomy Extension Calculation Linkbase Document |
| 101.DEF |
Inline XBRL Taxonomy Extension Definition Linkbase Document |
| 101.LAB |
Inline XBRL Taxonomy Extension Label Linkbase Document |
| 101.PRE |
Inline XBRL Taxonomy Extension Presentation Linkbase Document |
| 104 |
Cover Page Interactive Data File |
SIGNATURES
The Registrant hereby certifies that it meets all of the requirements for filing on Form 20-F and has duly caused and authorized the undersigned to sight this Annual Report on its behalf.
| CALEDONIA MINING CORPORATION PLC. |
||
| Date: May 15, 2024 |
By: |
/s/ Mark Learmonth |
| Name: Mark Learmonth |
||
| Title: Chief Executive Officer |
 |
Tel: +27 011 488 1700 |
Wanderers Office Park 52 Corlett Drive Illovo, 2196 Private Bag X60500 Houghton, 2041 South Africa |
Report of Independent Registered Public Accounting Firm
Shareholders and Board of Directors
Caledonia Mining Corporation Plc
St Helier, Jersey Channel Islands
Opinion on the Consolidated Financial Statements
We have audited the accompanying consolidated statements of financial position of Caledonia Mining Corporation Plc (the “Company”) as of December 31, 2023 and 2022, the related consolidated statements of profit or loss and other comprehensive income, statements of changes in equity, and cash flows for each of the three years in the period ended December 31, 2023, and the related notes (collectively referred to as the “consolidated financial statements”). In our opinion, the consolidated financial statements present fairly, in all material respects, the financial position of the Company at December 31, 2023 and 2022, and the results of its operations and its cash flows for each of the three years in the period ended December 31, 2023, in conformity with International Financial Reporting Standards as issued by the International Accounting Standards Board.
Basis for Opinion
These consolidated financial statements are the responsibility of the Company’s management. Our responsibility is to express an opinion on the Company’s consolidated financial statements based on our audits. We are a public accounting firm registered with the Public Company Accounting Oversight Board (United States) (“PCAOB”) and are required to be independent with respect to the Company in accordance with the U.S. federal securities laws and the applicable rules and regulations of the Securities and Exchange Commission and the PCAOB.
We conducted our audits in accordance with the standards of the PCAOB. Those standards require that we plan and perform the audit to obtain reasonable assurance about whether the consolidated financial statements are free of material misstatement, whether due to error or fraud. The Company is not required to have, nor were we engaged to perform, an audit of its internal control over financial reporting. As part of our audits, we are required to obtain an understanding of internal control over financial reporting but not for the purpose of expressing an opinion on the effectiveness of the Company’s internal control over financial reporting. Accordingly, we express no such opinion.
Our audits included performing procedures to assess the risks of material misstatement of the consolidated financial statements, whether due to error or fraud, and performing procedures that respond to those risks. Such procedures included examining, on a test basis, evidence regarding the amounts and disclosures in the consolidated financial statements. Our audits also included evaluating the accounting principles used and significant estimates made by management, as well as evaluating the overall presentation of the consolidated financial statements. We believe that our audits provide a reasonable basis for our opinion.

We have served as the Group's auditor since year 2018.
BDO South Africa Incorporated
Wanderers Office Park
52 Corlett Drive
Illovo, 2196
BDO South Africa Incorporated
Registration number: 1995/002310/21
Practice number: 905526
VAT number: 4910148685
Chief Executive Officer: LD Mokoena
A full list of all company directors is available on www.bdo.co.za
The company's principal place of business is at 22 Wellington Road, Parktown, Johannesburg, where a list of directors' names is available for inspection. BDO South Africa Incorporated, a South African personal liability company, is a member of BDO International Limited, a UK company limited by guarantee, and forms part of the international BDO network of independent member firms.
Caledonia Mining Corporation Plc
Consolidated statements of profit or loss and other comprehensive income
(in thousands of United States Dollars, unless indicated otherwise)
| For the years ended December 31 |
| Note | 2023 | 2022 | 2021 | |||||||||||
| Revenue | 8 | |||||||||||||||
| Royalty | ( | ) | ( | ) | ( | ) | ||||||||||
| Production costs | 9 | ( | ) | ( | ) | ( | ) | |||||||||
| Depreciation | 18 | ( | ) | ( | ) | ( | ) | |||||||||
| Gross profit | ||||||||||||||||
| Other income | ||||||||||||||||
| Other expenses | 10 | ( | ) | ( | ) | ( | ) | |||||||||
| Administrative expenses | 11 | ( | ) | ( | ) | ( | ) | |||||||||
| Cash-settled share-based expense | 12.1 | ( | ) | ( | ) | ( | ) | |||||||||
| Equity-settled share-based expense | 12.2 | ( | ) | ( | ) | |||||||||||
| Net foreign exchange (loss) gain | 13 | ( | ) | |||||||||||||
| Net derivative financial instrument expense | 14 | ( | ) | ( | ) | ( | ) | |||||||||
| Operating profit | ||||||||||||||||
| Finance income | 15 | |||||||||||||||
| Finance cost | 15 | ( | ) | ( | ) | ( | ) | |||||||||
| Profit before tax | ||||||||||||||||
| Tax expense | 16 | ( | ) | ( | ) | ( | ) | |||||||||
| (Loss) profit for the period | ( | ) | ||||||||||||||
| Other comprehensive income | ||||||||||||||||
| Items that are or may be reclassified to profit or loss | ||||||||||||||||
| Exchange differences on translation of foreign operations | ( | ) | ( | ) | ( | ) | ||||||||||
| Total comprehensive income for the period | ( | ) | ||||||||||||||
| (Loss) profit attributable to: | ||||||||||||||||
| Owners of the Company | ( | ) | ||||||||||||||
| Non-controlling interests | 28 | |||||||||||||||
| (Loss) profit for the period | ( | ) | ||||||||||||||
| Total comprehensive income attributable to: | ||||||||||||||||
| Owners of the Company | ( | ) | ||||||||||||||
| Non-controlling interests | 28 | |||||||||||||||
| Total comprehensive income for the period | ( | ) | ||||||||||||||
| (Loss) earnings per share | ||||||||||||||||
| Basic (loss) earnings per share ($) | 27 | ( | ) | |||||||||||||
| Diluted (loss) earnings per share ($) | 27 | ( | ) | |||||||||||||
The accompanying notes on pages 7 to 78 are an integral part of these consolidated financial statements.
On behalf of the Board: “J.M. Learmonth”- Chief Executive Officer and “C.O. Goodburn”- Chief Financial Officer.
Caledonia Mining Corporation Plc
Consolidated statements of financial position
(in thousands of United States Dollars, unless indicated otherwise)
| As at December 31 |
| Note | 2023 | 2022 | ||||||||
| Assets | ||||||||||||
| Exploration and evaluation assets | 17 | |||||||||||
| Property, plant and equipment | 18 | |||||||||||
| Deferred tax asset | 16 | |||||||||||
| Total non-current assets | ||||||||||||
| Income tax receivable | 16 | |||||||||||
| Inventories | 20 | |||||||||||
| Derivative financial assets | 14.1 | |||||||||||
| Trade and other receivables | 21 | |||||||||||
| Prepayments | 22 | |||||||||||
| Cash and cash equivalents | 23 | |||||||||||
| Assets held for sale | 24 | |||||||||||
| Total current assets | ||||||||||||
| Total assets | ||||||||||||
| Equity and liabilities | ||||||||||||
| Share capital | 25 | |||||||||||
| Reserves | 26 | |||||||||||
| Retained loss | ( | ) | ( | ) | ||||||||
| Equity attributable to shareholders | ||||||||||||
| Non-controlling interests | 28 | |||||||||||
| Total equity | ||||||||||||
| Liabilities | ||||||||||||
| Deferred tax liabilities | 16 | |||||||||||
| Provisions | 29 | |||||||||||
| Loan notes - long term portion | 30 | |||||||||||
| Cash-settled share-based payment - long term portion | 12.1 | |||||||||||
| Lease liabilities - long term portion | 19 | |||||||||||
| Total non-current liabilities | ||||||||||||
| Cash-settled share-based payment - short term portion | 12.1 | |||||||||||
| Income tax payable | 16 | |||||||||||
| Lease liabilities - short term portion | 19 | |||||||||||
| Loan notes - short term portion | 30 | |||||||||||
| Trade and other payables | 31 | |||||||||||
| Overdraft and term loans | 23 | |||||||||||
| Liabilities associated with assets held for sale | 24 | |||||||||||
| Total current liabilities | ||||||||||||
| Total liabilities | ||||||||||||
| Total equity and liabilities | ||||||||||||
The accompanying notes on pages 7 to 78 are an integral part of these consolidated financial statements.
Caledonia Mining Corporation Plc
Consolidated statements of changes in equity
For the years ended December 31,
(in thousands of United States Dollars, unless indicated otherwise)
| Note | Share capital | Foreign currency translation reserve | Contributed surplus | Equity-settled share-based payment reserve | Retained loss | Total | Non-controlling interests (NCI) | Total equity | ||||||||||||||||||||||||||||
| Balance January 1, 2021 | ( | ) | ( | ) | ||||||||||||||||||||||||||||||||
| Transactions with owners: | ||||||||||||||||||||||||||||||||||||
| Dividends declared | 34 | ( | ) | ( | ) | ( | ) | ( | ) | |||||||||||||||||||||||||||
| Shares issued: | ||||||||||||||||||||||||||||||||||||
| - Options exercised | ||||||||||||||||||||||||||||||||||||
| - Equity raise (net of transaction cost) | 25 | |||||||||||||||||||||||||||||||||||
| Total comprehensive income: | ||||||||||||||||||||||||||||||||||||
| Profit for the year | ||||||||||||||||||||||||||||||||||||
| Other comprehensive income for the year | ( | ) | ( | ) | ( | ) | ||||||||||||||||||||||||||||||
| Balance December 31, 2021 | ( | ) | ( | ) | ||||||||||||||||||||||||||||||||
| Transactions with owners: | ||||||||||||||||||||||||||||||||||||
| Dividends declared | 34 | ( | ) | ( | ) | ( | ) | ( | ) | |||||||||||||||||||||||||||
| Share-based payments: | ||||||||||||||||||||||||||||||||||||
| - Shares issued on settlement of incentive plan awards | 12.1 | |||||||||||||||||||||||||||||||||||
| - Equity-settled share-based expense | 12.2 | |||||||||||||||||||||||||||||||||||
| Total comprehensive income: | ||||||||||||||||||||||||||||||||||||
| Profit for the year | ||||||||||||||||||||||||||||||||||||
| Other comprehensive income for the year | ( | ) | ( | ) | ( | ) | ||||||||||||||||||||||||||||||
| Balance at December 31, 2022 | ( | ) | ( | ) | ||||||||||||||||||||||||||||||||
Caledonia Mining Corporation Plc
Consolidated statements of changes in equity (continued)
For the years ended December 31,
(in thousands of United States Dollars, unless indicated otherwise)
| Note | Share capital | Foreign currency translation reserve | Contributed surplus | Equity-settled share-based payment reserve | Retained loss | Total | Non-controlling interests (NCI) | Total equity | ||||||||||||||||||||||||||||
| Balance December 31, 2022 | ( | ) | ( | ) | ||||||||||||||||||||||||||||||||
| Transactions with owners: | ||||||||||||||||||||||||||||||||||||
| Dividends declared | 34 | ( | ) | ( | ) | ( | ) | ( | ) | |||||||||||||||||||||||||||
| Share-based payments: | ||||||||||||||||||||||||||||||||||||
| - Shares issued on settlement of incentive plan awards | 12.1 | |||||||||||||||||||||||||||||||||||
| - Equity-settled share-based expense | 12.2 | |||||||||||||||||||||||||||||||||||
| Shares issued: | ||||||||||||||||||||||||||||||||||||
| - Equity raise (net of transaction cost) | 25 | |||||||||||||||||||||||||||||||||||
| - Bilboes acquisition | 5 | |||||||||||||||||||||||||||||||||||
| Total comprehensive income: | ||||||||||||||||||||||||||||||||||||
| (Loss) profit for the year | ( | ) | ( | ) | ( | ) | ||||||||||||||||||||||||||||||
| Other comprehensive income for the year | ( | ) | ( | ) | ( | ) | ||||||||||||||||||||||||||||||
| Balance at December 31, 2023 | ( | ) | ( | ) | ||||||||||||||||||||||||||||||||
| Note | 25 | 26 | 26 | 26 | 28 | |||||||||||||||||||||||||||||||
The accompanying notes on pages 7 to 78 are an integral part of these consolidated financial statements.
Caledonia Mining Corporation Plc
Consolidated statements of cash flows
For the years ended December 31,
(in thousands of United States Dollars, unless indicated otherwise)
|
| Note | 2023 | 2022 | 2021 | ||||||||||||
| Cash inflow from operations | 32 | |||||||||||||||
| Interest received | ||||||||||||||||
| Finance costs paid | 15 | ( | ) | ( | ) | ( | ) | |||||||||
| Tax paid | 16 | ( | ) | ( | ) | ( | ) | |||||||||
| Net cash inflow from operating activities | ||||||||||||||||
| Cash flows used in investing activities | ||||||||||||||||
| Acquisition of property, plant and equipment | 18 | ( | ) | ( | ) | ( | ) | |||||||||
| Acquisition of exploration and evaluation assets | 17 | ( | ) | ( | ) | ( | ) | |||||||||
| Proceeds from sale of assets held for sale | 24.1 | |||||||||||||||
| Proceeds from derivative financial instruments | 14.2 | |||||||||||||||
| Acquisition of Put options | 14.1 | ( | ) | ( | ) | |||||||||||
| Proceeds from disposal of subsidiary | 24.2 | |||||||||||||||
| Proceeds from call options | 14.2 | |||||||||||||||
| Acquisition of call options | 14.2 | ( | ) | |||||||||||||
| Net cash used in investing activities | ( | ) | ( | ) | ( | ) | ||||||||||
| Cash flows from financing activities | ||||||||||||||||
| Dividends paid | 34 | ( | ) | ( | ) | ( | ) | |||||||||
| Payment of lease liabilities | 19 | ( | ) | ( | ) | ( | ) | |||||||||
| Shares issued – equity raise (net of transaction cost) | 25 | |||||||||||||||
| Repayments of term loans | ( | ) | ||||||||||||||
| Loan notes - Motapa payment | 30.1 | ( | ) | |||||||||||||
| Loan notes - solar bond issue receipts (net of transaction cost) | 30.2 | |||||||||||||||
| Proceeds from gold loan | 14.2 | |||||||||||||||
| Repayment of gold loan | 14.2 | ( | ) | |||||||||||||
| Proceeds from share options exercised | 25 | |||||||||||||||
| Net cash from/ (used in) financing activities | ( | ) | ||||||||||||||
| Net decrease in cash and cash equivalents | ( | ) | ( | ) | ( | ) | ||||||||||
| Effect of exchange rate fluctuations on cash and cash equivalents | ( | ) | ( | ) | ( | ) | ||||||||||
| Net cash and cash equivalents at the beginning of the year | ||||||||||||||||
| Net cash and cash equivalents at the end of the year | 23 | ( | ) | |||||||||||||
The accompanying notes on pages 7 to 78 are an integral part of these consolidated financial statements.
| 1 |
Caledonia Mining Corporation Plc (“Caledonia” or the “Company”) is a company domiciled in Jersey, Channel Islands. The Company’s registered office address is B006 Millais House, Castle Quay, St Helier, Jersey, Channel Islands.
These consolidated financial statements of the Company and its subsidiaries (the “Group”) comprise the consolidated statements of financial position as at December 31, 2023 and 2022, the consolidated statements of profit or loss and other comprehensive income, changes in equity and cash flows for each of the years ended December 31, 2023, 2022 and 2021, disclosure notes, material accounting policies and other explanatory information. The Group’s primary involvement is in the operation of a gold mine and the exploration and development of mineral properties for precious metals.
Caledonia’s shares are listed on the NYSE American LLC stock exchange (symbol – “CMCL”). Depository interests in Caledonia’s shares are admitted to trading on AIM of the London Stock Exchange plc (symbol – “CMCL”). Caledonia listed on the Victoria Falls Stock Exchange (“VFEX”) (symbol – “CMCL”) on December 2, 2021. Caledonia voluntary delisted from the Toronto Stock Exchange (the “TSX”) on June 19, 2020. After the delisting the Company remains a Canadian reporting issuer and has to comply with Canadian securities laws until it demonstrates that Canadian shareholders represent less than 2% of issued share capital.
| 2 | Basis of preparation |
| i) | Statement of compliance |
The consolidated financial statements have been prepared on a going concern basis, in accordance with IFRS Accounting Standards, as issued by the International Accounting Standards Board (“IFRS”).
The consolidated financial statements were approved for issue by the Board of Directors on March 28, 2024.
| ii) | Basis of measurement |
The consolidated financial statements have been prepared on the historical cost basis except for:
| ● | cash-settled share-based payment arrangements measured at fair value on grant and re-measurement dates; |
| ● | equity-settled share-based payment arrangements measured at fair value on the grant date; and |
| ● | derivative financial assets and derivative financial liabilities measured at fair value. |
| iii) | Functional currency |
The consolidated financial statements are presented in United States Dollars (“$” or “US Dollars” or “USD”), which is also the functional currency of the Company. All financial information presented in US Dollars has been rounded to the nearest thousand, unless indicated otherwise. Refer to note 13 for changes to Zimbabwean real-time gross settlement, bond notes or bond coins (“RTGS$”) and its effect on the consolidated statement of profit or loss and other comprehensive income.
| 3 | Use of accounting assumptions, estimates and judgements |
In preparing these consolidated financial statements, management has made accounting assumptions, estimates and judgements that affect the application of the Group’s accounting policies and the reported amounts of assets, liabilities, income and expenses. Actual results may differ from these estimates. Estimates and underlying assumptions are reviewed on an ongoing basis. Changes in estimates are recognised prospectively.
| (a) | Estimation uncertainties |
| i) | Depreciation of property, plant and equipment |
Depreciation on mine development, infrastructure and other assets in the production phase is computed on the units-of-production method over the life-of-mine based on the estimated quantities of reserves (proven and probable) and resources (measured, indicated and inferred), which are planned to be extracted in the future from known mineral deposits. Where mine development, infrastructure and other assets have a shorter useful life than the life-of-mine, they are depreciated over their useful life. Confidence in the existence, commercial viability and economical recovery of reserves and resources included in the life-of-mine may be based on historical experience and available geological information. This is in addition to the drilling results obtained by the Group and management’s knowledge of the geological setting of the surrounding areas, which would enable simulations and extrapolations to be done with a sufficient degree of accuracy. In instances where management is able to demonstrate the economic recovery of resources with a high level of confidence, such additional resources, are included in the calculation of depreciation.
Refer to note 18 for change in estimates to mine development, infrastructure and other assets. Other items of property, plant and equipment are depreciated as described in note 4(j)(iii).
| ii) | Mineral reserves and resources |
Mineral reserves and resources are estimates of the amount of product that can be economically and legally extracted. In order to calculate the reserves and resources, estimates and assumptions are required about a range of geological, technical and economic factors, including but not limited to quantities, grades, production techniques, recovery rates, production costs, transport costs, commodity prices and exchange rates. Estimating the quantity and grade of mineral reserves and resources requires the size, shape and depth of orebodies to be determined by analysing geological data such as the logging and assaying of drill samples. This process may require complex and difficult geological assumptions and calculations to interpret the data. Estimates of mineral reserves and resources may change due to the change in economic assumptions used to estimate mineral reserves and resources and due to additional geological data becoming available during the course of operations.
The Group estimates its reserves (proven and probable) and resources (measured, indicated and inferred) based on information compiled by a Qualified Person in terms of the Canadian National Instrument 43-101 – Standards of Disclosure for Mineral Projects (“NI 43-101”) and the United States Securities and Exchange Commission’s Subpart 1300 of Regulation S-K (“Subpart 1300”) relating to geological and technical data of the size, depth, shape and grade of the ore body and suitable production techniques and recovery rates. Such an analysis requires geological and engineering assumptions to interpret the data. These assumptions include:
| ● | correlation between drill-hole intersections where multiple reefs intersect; |
| ● | continuity of mineralisation between drill-hole intersections within recognised reefs; and |
| ● | appropriateness of the planned mining methods. |
| 3 | Use of accounting assumptions, estimates and judgements (continued) |
| (a) | Assumptions and estimation uncertainties (continued) |
| ii) | Mineral reserves and resources (continued) |
The Group estimates and reports reserves and resources in accordance with Subpart 1300 and NI 43-101 and the Canadian Institute of Mining, Metallurgy and Petroleum (the “CIM”) – CIM Definition Standards for Mineral Resources and Mineral Reserves. Complying with the CIM code, NI 43-101 requires the use of reasonable assumptions to calculate the recoverable resources. These assumptions include:
| ● | the gold price based on current market price and the Group’s assessment of future prices; |
| ● | estimated future on-mine costs, sustaining and non-sustaining capital expenditures; |
| ● | cut-off grade; |
| ● | dimensions and extent, determined both from drilling and mine development, of ore bodies; and |
| ● | planned future production from measured, indicated and inferred resources. |
Changes in reported reserves and resources may affect the Group’s financial results and position in several ways, including the following:
| ● | asset carrying values may be affected due to changes in the estimated cash flows (i.e. Impairment); |
| ● | depreciation and amortisation charges to profit or loss may change as these are calculated on the unit-of production method or where useful lives of an asset change; and |
| ● | decommissioning, site restoration and environmental provisions and resources which may affect expectations about the timing or cost of these activities. |
| iii) | Impairment |
Non-financial assets
At each reporting date, the Group determines if impairment indicators exist and, if present, performs an impairment review of the non-financial assets held in the Group. The exercise is subject to various assumptions and estimates. Refer to note 4(c) for more information.
Non-derivative financial assets
The Group uses a simplified approach in accounting for trade receivables and records the loss allowance as lifetime expected credit losses. When measuring expected credit losses, the Group uses reasonable and supportable forward-looking information, which is based on the assumptions for the future movement of different economic drivers and how these drivers will affect each other. Loss given default is an estimate of the loss arising on default. It is based on the expected shortfalls in contractual cash flows. The Group uses a provision matrix to calculate the probability of default, which includes historical data, assumptions and expectations of future conditions.
| 3 | Use of accounting assumptions, estimates and judgements (continued) |
| (a) | Assumptions and estimation uncertainties (continued) |
| iv) | Share-based payment transactions |
Equity-settled share-based payment arrangements
The Group measures the cost of equity-settled share-based payment transactions with employees, directors and Blanket Mine (1983) (Private) Limited’s (“Blanket Mine” or “Blanket”) indigenous shareholders (refer to note 6) by reference to the fair value of the equity instruments on the date at which they are granted. Estimating fair value for share-based payment transactions requires determining the appropriate valuation model and considering the terms and conditions of the grant. This estimate also requires determining the most appropriate inputs to the valuation model, including the expected life of the share option, volatility and dividend yield.
Where the Company granted the counterparty to a share-based payment award the choice of settlement in cash or shares, the equity component is measured as the difference between the fair value of the goods and services and the fair value of the cash-settled share-based payment liability at the date when the goods and services are received at the measurement date. For transactions with employees, the equity component is zero.
Option pricing models require the input of assumptions, including the expected price volatility. Changes in the subjective input assumptions can materially affect the fair value estimate. Therefore, the existing models may not necessarily provide a reliable single measure of the fair value of the Group’s share options.
Additional information about significant assumptions and estimates used to determine the fair value of equity-settled share-based payment transactions are disclosed in note 12.2.
Cash-settled share-based payment arrangements
The fair value of the amount payable to employees regarding share-based awards that will be settled in cash is recognised as an expense with a corresponding increase in liabilities over the period over which the employee becomes unconditionally entitled to payment. The liability is re-measured at each reporting date. Any change in the fair value of the liability is recognised in profit or loss.
Additional information about significant assumptions and estimates used to determine the fair value of cash-settled share-based payment transactions are disclosed in note 12.1.
| v) | Taxes |
Significant assumptions and estimates are required in determining the provision for income taxes. There are many transactions and calculations undertaken during the ordinary course of business for which the ultimate tax determination is uncertain.
In 2023, the Zimbabwe Revenue Authority (“ZIMRA”) issued Public Notice 20 (“PN20”). PN 20 provided clarity on the interpretation of Section 37AA of the Income Tax Act [Chapter 23:06] of Zimbabwe, which requires taxpayers to submit separate tax returns where any part of the income from trade or investment is earned in foreign currency.
Section 37AA stated that the calculation of taxable income be expressed in the currency of the transaction and that the payment of the tax payable be made proportionately to in which currency the revenue earned. The section further provides that the RTGS$ should be converted to US$ using the average auction rate of exchange for the year of assessment, with the same being applicable to US$ amounts that need to be converted to RTGS$.
| 3 | Use of accounting assumptions, estimates and judgements (continued) |
| (a) | Assumptions and estimation uncertainties (continued) |
| v) | Taxes (continued) |
Management believes they have adequately provided for the probable outcome of tax related matters; however, the final outcome or future outcomes anticipated in calculating the tax liabilities may result in a materially different outcome than the amount included in the tax liabilities. In addition, the Group further makes assumptions and estimates when recognising deferred tax assets relating to tax losses carried forward to the extent that there are sufficient future taxable temporary differences (deferred tax liabilities) relating to the same taxation authority and the same taxable entity against which the unused tax losses may be utilised or sufficient estimated future taxable income against which the losses can be utilised.
| vi) | Blanket Mine’s indigenisation transaction |
The initial indigenisation transaction and modifications to the indigenisation transaction of Blanket Mine required management to make significant assumptions and estimates which are explained in note 6.
| vii) | Exploration and evaluation (“E&E”) assets |
The Group also makes assumptions and estimates regarding the technical feasibility and commercial viability of its mineral projects and the possible impairment of E&E assets by evaluating whether it is likely that future economic benefits will flow to the Group, which may be based on assumptions about future events or circumstances e.g. such as the completion of a feasibility study indicating construction, funding and economic returns that are sufficient. Assumptions and estimates made may change if new information becomes available. If information becomes available suggesting that the recovery of expenditures is unlikely, the amount capitalised is written off in profit or loss in the period the new information becomes available. The recoverability of the carrying amount of exploration and evaluation assets depends on the availability of sufficient funding to bring the properties into commercial production, the price of the products to be recovered and the undertaking of profitable mining operations. As a result of these uncertainties, the actual amount recovered may vary significantly from the carrying amount.
| viii) | Site restoration provision |
A site restoration provision has been calculated for the Blanket Mine and the Bilboes, Maligreen and Motapa projects based on an independent analysis of the rehabilitation costs as performed in 2023. For projects the restoration costs are recognised at the current estimated cost of restoration and is undiscounted. For the Blanket Mine the inflationary effect on current restoration costs are applied and then discounted to arrive at the present value of the provision. Assumptions, based on the current economic environment, have been made that management believes are a reasonable basis for estimating the future liability. These estimates take into account any material changes to the assumptions that occur when reviewed by management. Estimates are reviewed annually and are based on current regulatory requirements. Significant changes in estimates of contamination estimates, restoration standards, and techniques will result in changes to the provision from period to period. Actual rehabilitation costs will ultimately depend on future market prices for the rehabilitation. The final cost of the currently recognised site rehabilitation provision may be higher or lower than currently provided for (refer to note 29).
| 3 | Use of accounting assumptions, estimates and judgements (continued) |
| (a) | Assumptions and estimation uncertainties (continued) |
| viii) | Site restoration provision (continued) |
Also refer to note 29 for how site restoration provisions are estimated for properties in the exploration and evaluation phase.
| (b) | Judgements |
Judgement is required when assessing whether the Group controls an entity or not. Controlled entities are consolidated. Further information is given in notes 4(a) and 6.
For judgement applied to:
| ● | determine functional currency of entities in the Group and the use of the interbank rate of exchange to translate RTGS$, refer to note 13, |
| ● | impairments, refer to note 18 and 17. |
| 4 | Material accounting policies |
The accounting policies set out below have been applied consistently to all periods presented in these consolidated financial statements. In addition, the accounting policies have been applied consistently by the Group.
| a) | Basis of consolidation |
| i) | Subsidiaries and structured entities |
Subsidiaries and certain structured entities are entities controlled by the Group. The Group controls an entity when it is exposed to, or has rights to, variability in returns from its involvement with the entity and has the ability to affect those returns through its power over the entity. The financial statements of subsidiaries are included in the consolidated financial statements from the date on which control commences until the date on which control ceases.
| ii) | Loss of control |
When the Group loses control over a subsidiary, it derecognises the assets and liabilities of the subsidiary, and any related Non-controlling interests (“NCI”) and other components of equity. Any gain or loss is recognised in profit or loss. Any interest retained in the former subsidiary is measured at fair value when control is lost.
| iii) | Non-controlling interests |
NCI is measured at their proportionate share of the carrying amounts of the acquiree’s identifiable net assets at fair value at the acquisition date. Changes in the Group’s interest in a subsidiary that do not result in a loss of control are accounted for as equity transactions.
| iv) | Transactions eliminated on consolidation |
Intra-group balances and transactions arising from intra-group transactions are eliminated.
| 4 | Material accounting policies (continued) |
| (b) | Revenue |
| i) | Fidelity Gold Refinery (Private) Limited (“Fidelity”) and further refinement |
Revenue from the sale of precious metals at Blanket is recognised when the unrefined metal is accepted at the refinery (“Local lodgment date”) by Fidelity, except for the portion earmarked for export to a refiner outside of Zimbabwe. Control is transferred and the receipt of proceeds is substantially assured at point of delivery at the end refiner with the responsibility to pay. Revenue for each delivery to Fidelity is measured at the London Base Metal Association price post-delivery less
A portion of unrefined metals produced by Blanket is exported by Caledonia to Al Etihad Gold Refinery DMCC (“AEG” an accredited Dubai Good Delivery refinery), which makes payment to Caledonia's bank account in Zimbabwe in USD. The exported unrefined gold continues to be processed at Fidelity, a subsidiary of the Reserve Bank of Zimbabwe (“RBZ”), on a toll-treatment basis, in accordance with requirements of the Zimbabwe government for in-country refining and to allow the Zimbabwe authorities full visibility over the gold produced and exported by Caledonia. The resultant gold is exported under the gold dealing licence that is held by Fidelity to a refinery outside Zimbabwe which undertakes the final refining process. Caledonia receives the proceeds of the gold that it exports in its bank account in Zimbabwe within a few days of delivery to the final refiner. This arrangement in respect of production from Blanket complies with the current requirements to pay a
For deliveries exported and for deliveries that are paid by Fidelity, Blanket continues to receive
Revenue from the sale of precious metals at Bilboes is recognised when the unrefined metal is accepted at the refinery (“Local lodgment date”) by Fidelity. Control is transferred and the receipt of proceeds is substantially assured at point of delivery at the end refiner with the responsibility to pay. Revenue for each delivery to Fidelity is measured at the London Base Metal Association price post-delivery less
| 4 | Material accounting policies (continued) |
| (c) | Impairment |
| i) | Expected credit losses on financial assets |
The Group applies the IFRS 9 simplified model and recognises lifetime expected credit losses for all trade receivables as these items do not have a significant financing component. In measuring the expected credit losses, the trade receivables have been assessed individually as they possess different credit risk characteristics. Trade receivables have been assessed based on the days past due. The expected loss rates are based on the payment profile for gold sales over the past 48 months prior to December 31, of each year reported. The historical rates are adjusted to reflect current and forward looking macroeconomic factors i.e. (interest rate, country risk, and risk free rate) affecting the customer’s ability to settle the amount outstanding. The Group considers a trade receivable to be in default when the amount is 90 days past due from lodgment date. Failure to make payments within 90 days from lodgment date and failure to engage with the Group on alternative payment arrangement, amongst others, are considered indicators of no reasonable expectation of recovery. Trade and other receivables are written off (i.e. derecognised) when there is no reasonable expectation of recovery.
| ii) | Non-financial assets |
The carrying amounts of the Group’s non-financial assets, other than inventories and deferred tax assets are reviewed at each reporting date to determine whether there is any indication of impairment. The recoverable amount of an asset or cash-generating unit is the greater of its value in use and its fair value less costs of disposal. In assessing value in use, the estimated future cash flows are discounted to their present value using a pre-tax discount rate that reflects current market assessments of the time value of money and the risks specific to the asset.
For the purpose of impairment testing, assets that cannot be tested individually are grouped together into the smallest group of assets that generate cash inflows from continuing use that are largely independent of the cash inflows of other assets or groups of assets (the “cash-generating unit” or “CGU”). The Group’s corporate assets do not generate separate cash inflows. If there is an indication that a CGU to which a corporate asset is allocated may be impaired, then the recoverable amount is determined for the CGU to which the corporate asset belongs.
An impairment loss is recognised if the carrying amount of a CGU exceeds its estimated recoverable amount. Impairment losses recognised in respect of CGUs are allocated to reduce the carrying amount of assets in the unit (group of units) on a pro rata basis. Impairment losses recognised in prior years are assessed at each reporting date for any indications that the loss has decreased or no longer exists. An impairment loss is reversed if there has been an indication of reversal and a change in the estimates used to determine the recoverable amount. An impairment loss is reversed only to the extent that the asset’s carrying amount does not exceed the carrying amount that would have been determined, net of depreciation or amortisation, if no impairment loss had been recognised.
| 4 | Material accounting policies (continued) |
| (c) | Impairment (continued) |
| iii) | Impairment of Exploration and evaluation (“E&E”) assets |
The test for impairment of E&E assets can combine several CGUs as long as the combination is not larger than a segment. The definition of a CGU does, however, change once development activities have begun. There are specific impairment triggers for E&E assets. Despite certain relief in respect of impairment triggers and the level of aggregation, the impairment standard is applied in measuring the impairment of E&E assets. Reversals of impairment losses are required in the event that the circumstances that resulted in impairment have changed.
E&E assets are assessed for impairment only when facts and circumstances suggest that the carrying amount of an E&E asset may exceed its recoverable amount. Indicators of impairment include the following:
| ● | The entity's right to explore in the specific area has expired or will expire in the near future and is not expected to be renewed. |
| ● | Substantive expenditure on further E&E activities in the specific area is neither budgeted nor planned in future. |
| ● | The entity has not discovered commercially viable quantities of mineral resources as a result of E&E activities in the area to date and has decided to discontinue such activities in the specific area. |
| ● | Even if development is likely to proceed, the entity has sufficient data indicating that the carrying amount of the asset is unlikely to be recovered in full from successful development or by sale. |
| (d) | Share-based payment transactions |
| i) | Equity-settled share-based payments to employees and directors |
The grant date fair value of equity-settled share-based payment awards granted to employees and directors is recognised as an expense, with a corresponding increase in equity, over the vesting period of the award. The amount recognised as an expense is adjusted to reflect the number of awards for which the related service and non-market vesting conditions are expected to be met, such that the amount ultimately recognised as an expense is based on the number of awards that meet the related service and non-market vesting conditions at the vesting date.
Where equity instruments are granted to non-employees, they are recorded at the fair value of the goods or services received in profit or loss.
Additional information about significant judgements, estimates and the assumptions used to estimate the fair value of equity-settled share-based payment transactions are disclosed in note 12.2.
| ii) | Cash-settled share-based payments to employees and directors |
The grant date fair value of cash-settled awards granted to employees and directors is recognised as an expense, with a corresponding increase in the liability, over the vesting period of the awards. At each reporting date the fair value of the awards is re-measured with a corresponding adjustment to profit or loss. Additional information about significant judgements, estimates and the assumptions used to estimate the fair value of cash-settled share-based payment transactions are disclosed in note 12.1.
| 4 | Material accounting policies (continued) |
| |
(e) | Foreign currency |
| i) | Foreign operations |
As stated in note 2(iii) the presentation currency of the Group is the US Dollars. The functional currency of the Company and all its subsidiaries is the US Dollars except for the South African subsidiary that uses the South African Rand (“ZAR”) as its functional currency. Subsidiary financial statements have been translated to the presentation currency as follows:
| ● | assets and liabilities are translated using the exchange rate at year end; and |
| ● | income, expenses and cash flow items are translated using the rate that approximates the exchange rates at the dates of the transactions. |
When the settlement of a monetary item receivable from or payable to a foreign operation is neither planned nor likely in the foreseeable future, foreign exchange gains and losses arising from the item are considered to form part of the net investment in a foreign operation and are recognised in Other Comprehensive Income (“OCI”).
If settlement is planned or likely in the foreseeable future, foreign exchange gains and losses are included in profit or loss. When settlement occurs, the settlement will not be regarded as a partial disposal and accordingly the foreign exchange gain or loss previously recognised in OCI is not reclassified to profit or loss/reallocated to NCI.
When the Group disposes of its entire interest in a foreign operation or loses control over a foreign operation, the foreign currency gains or losses accumulated in OCI related to the foreign operation are reclassified to profit or loss. If the Group disposes of part of an interest in a foreign operation which remains a subsidiary, a proportionate amount of foreign currency gains or losses accumulated in OCI related to the subsidiary are reattributed between controlling and non-controlling interests.
All resulting translation differences are reported in OCI and accumulated in the foreign currency translation reserve.
| ii) | Foreign currency translation |
In preparing the financial statements of the Group entities, transactions in currencies other than the functional currency (foreign currencies) of these Group entities are recorded at the rates of exchange prevailing at the dates of the transactions. At each reporting date, monetary assets and liabilities are translated using the current foreign exchange rate. Non-monetary assets and liabilities are translated using the historical rate on the date of the transaction. All gains and losses on translation of these foreign currency transactions are included in profit or loss for the year.
On October 1, 2018 the Reserve Bank of Zimbabwe (“RBZ) pegged the Zimbabwe dollar (“RTGS$”) at 1:1 to the US Dollar and on February 20, 2019 issued a further monetary policy statement, which allowed inter-bank trading between RTGS$ and foreign currency. The interbank rate was introduced at
| 4 | Material accounting policies (continued) |
| (e) | Foreign currency (continued) |
| ii) | Foreign currency translation (continued) |
Further, the RBZ issued a directive to Zimbabwean banks to separate foreign currency and RTGS$ for bank accounts held by clients on October 1, 2018. Subsequent to the directive, the RBZ announced that
In June 2021 the RBZ announced that companies that are listed on the VFEX will receive
In applying IAS 21, management determined that the US Dollars remained the primary currency in which the Group’s Zimbabwean entities operate, as:
| ● | the majority of revenue is received in US Dollars; |
| ● | the gold price receivable was calculated in US Dollars; |
| ● | the majority of costs are calculated by reference to the US Dollars if denominated in RTGS$ or is paid in US Dollars; and |
| ● | Income tax liabilities calculated in RTGS$ are settled predominantly in US Dollars. |
The application of IAS 21, the advent of Statutory Instrument 142 (issued by Zimbabwean Government) and the devaluation of the RTGS$ against the US Dollars had an impact on the US Dollars value of RTGS$ denominated monetary assets and liabilities such as income and deferred tax liabilities, loans and borrowings, trade and other payables and to a lesser extent monetary asset such as cash held in RTGS$.
| |
(f) | Finance income and finance cost |
Finance income comprises interest income on funds invested. Finance income is recognised as it accrues in profit or loss, using the effective interest method. Finance cost comprise interest expense on the rehabilitation provisions, interest on bank overdraft balances, effective interest on leases, loans and borrowings and also includes commitment costs on overdraft facilities. Finance cost is recognised in profit or loss using the effective interest rate method and excludes borrowing costs capitalised.
| 4 | Material accounting policies (continued) |
| |
(g) | Borrowing costs |
General and specific borrowing costs that are directly attributable to the acquisition, construction or production of a qualifying asset are capitalised during the period of time that is required to complete and prepare the asset for its intended use or sale. Qualifying assets are assets that necessarily take a substantial period of time to get ready for their intended use or sale.
Other borrowing costs are expensed in the period in which they are incurred and recognised as finance cost.
| |
(h) | Taxes |
| i) | Income tax |
Tax expense comprises current and deferred tax. These expenses are recognised in profit or loss except to the extent that it relates to a business combination, or items recognised directly in equity or in other comprehensive income.
| ii) | Current tax |
Current tax is the tax payable or receivable on the taxable income or loss for the year, using tax rates enacted or substantively enacted at the reporting date. Current tax includes withholding tax on management fees and dividends paid between companies within the Group.
| iii) | Deferred tax |
Deferred tax is recognised in respect of temporary differences between the carrying amounts of assets and liabilities for financial reporting purposes and the amounts used for taxation purposes. Deferred tax is not recognised for the following temporary differences: the initial recognition of assets or liabilities in a transaction that is not a business combination and that affects neither accounting nor taxable profit or loss, and differences relating to investments in subsidiaries to the extent that it is probable that they will not reverse in the foreseeable future.
Deferred tax is a monetary item measured at the tax rates and in the currency that are expected to be applied when temporary differences reverse. The tax and exchange rates are based on the laws that have been enacted, substantively enacted or the interbank exchange rates that prevail at the reporting date.
A deferred tax asset is recognised for unused tax losses, tax credits and deductible temporary differences, to the extent that it is probable that future taxable profits will be available against which they can be utilised. Deferred tax assets are reviewed at each reporting date and are reduced to the extent that it is no longer probable that the related tax benefit will be realised. Deferred tax assets and liabilities are offset when there is a legally enforceable right to set off current tax assets against current tax liabilities and when they relate to income taxes levied by the same taxation authority and the Group intends to settle its current tax assets and liabilities on a net basis.
| 4 | Material accounting policies (continued) |
| |
(i) | Earnings per share |
The Group presents basic and diluted earnings per share (“EPS”) data for its shares. Basic EPS is calculated by dividing the adjusted profit or loss attributable to shareholders of the Group (see note 27) by the weighted average number of shares outstanding during the period, adjusted for own shares held. Diluted EPS is determined by adjusting the profit or loss attributable to shareholders and the weighted average number of shares outstanding, adjusted for own shares held, for the effects of all dilutive potential shares, which comprise share options granted to employees and directors.
| (j) | Property, plant and equipment |
| i) | Recognition and measurement |
Items of property, plant and equipment are measured at cost less accumulated depreciation and accumulated impairment losses. Cost includes expenditures that are directly attributable to the acquisition of the asset. The cost of self-constructed assets includes the cost of materials and direct labour, any other costs directly attributable to bringing the assets to a working condition for their intended use, borrowing costs on qualifying assets, the costs of dismantling and removing the items and restoring the site on which they are located. Gains and losses on disposal of an item of property, plant and equipment are determined by comparing the proceeds from disposal with the carrying amount of property, plant and equipment, and are recognised in profit or loss. Refer to note 4(c)(ii) for the impairment of non-financial assets.
| ii) | Subsequent costs |
The cost of replacing a part of an item of property, plant and equipment is recognised in the carrying amount of the item if it is probable that the future economic benefits embodied within the part will flow to the Group, and its cost can be measured reliably. The carrying amount of the replaced part is derecognised. The costs of the day-to-day servicing of property, plant and equipment are recognised in profit or loss as incurred.
| iii) | Depreciation |
Depreciation is calculated to write off the depreciable amount, which is the cost of an asset, or other amount substituted for cost, less its residual value. When the asset is ready for use in the manner intended by management, depreciation of mine development, infrastructure and other assets is calculated on the unit-of-production method using the measured, indicated and estimated economical inferred mineral resources in Blanket’s life-of-mine plan (“LoMP”). Resources that are not included in the LoMP are not included in the calculation of depreciation.
For other categories, depreciation is recognised in profit or loss on a straight-line basis over the estimated useful lives of each part of an item of property, plant and equipment, since this most closely reflects the expected pattern of consumption of the future economic benefits embodied in the asset.
Mineral resources and reserves categorised and reported in compliance with the definitions embodied in the CIM Definition Standards as incorporated into the NI 43-101 are reported inclusive of mineral reserves. Mineral resources and reserves categorised and reported in compliance with Subpart 1300 are reported exclusive of mineral reserves.
Inferred mineral resources are considered in the LoMP to the extent these mineral resources are above the cut-off, economically viable and of sufficient confidence, are expected to be upgraded and form part of eventual extraction and as a result are included in the calculation of depreciation. Refer to note 18 for the evaluation of the cut-off.
| 4 | Material accounting policies (continued) |
| (j) | Property, plant and equipment (continued) |
| iii) | Depreciation (continued) |
Mineral resources are sub-divided, in order of increasing geological confidence, into inferred, indicated and measured categories. An inferred mineral resource has a lower level of confidence than that applied to an indicated mineral resource. An indicated mineral resource has a higher level of confidence than an inferred mineral resource but has a lower level of confidence than a measured mineral resource.
Mineral resources in the measured and indicated mineral resource classifications have been converted into proven and probable mineral reserves respectively, by applying the applicable modifying factors and reasonable prospects of economic extraction.
Land is not depreciated.
The calculation of the production rate units could be affected to the extent that actual production in the future is different from the current forecast production. This would generally result from the extent to which there are significant changes in any of the factors or assumptions used in estimating mineral reserves and resources.
These factors include:
| ● | changes in mineral reserves and resources; |
| ● | differences between actual commodity prices and commodity price assumptions; |
| ● | unforeseen operational issues at mine sites; and |
| ● | changes in capital, operating, mining, processing and reclamation costs, discount rates and foreign exchange rates. |
The estimated useful lives for 2023, 2022 and 2021 are as follows:
| ● | buildings |
| ● | plant and equipment |
| ● | fixtures and fittings including computers |
| ● | motor vehicles |
| ● | right of use assets |
| ● | mine development, infrastructure and other assets in production, units-of-production method. |
Depreciation methods, useful lives and residual values are reviewed each financial year and adjusted if appropriate. When parts of an item of property, plant and equipment have different useful lives, they are accounted for as separate items (major components) of property, plant and equipment. Assets under construction’s useful life and residual values will be assessed once the asset is available for use. Refer to note 18 for the change in estimate in plant and equipment.
| |
(k) | Exploration and evaluation assets |
Qualifying exploration costs are capitalised as incurred. Costs incurred before the legal rights to explore are obtained are recognised in profit or loss. The costs related to speculative drilling on unestablished orebodies at the Blanket Mine, general administrative or overhead costs are expensed as incurred. Exploration and evaluation costs capitalised are disclosed under Exploration and evaluation assets. Qualifying direct expenditures include such costs as mineral rights, options to acquire mineral rights, materials used, surveying costs, drilling costs, payments made to contractors, direct administrative costs and depreciation on property, plant and equipment during the exploration phase.
| 4 | Material accounting policies (continued) |
| (k) | Exploration and evaluation assets (continued) |
Costs not directly attributable to exploration and evaluation activities, including general administrative overhead costs, are expensed in the year they occur.
Once the technical feasibility and commercial viability of extracting the mineral resource have been determined, the property is considered to be a mine under development and moved to the mine development, infrastructure and other asset category within property, plant and equipment. Capitalised direct costs related to the acquisition, exploration and development of mineral properties remain capitalised, at their initial cost, until the properties to which they relate are ready for their intended use, sold, abandoned or management has determined there to be impairment. Exploration and evaluation assets are tested for impairment at least annually, and before the assets are transferred to mine development, infrastructure and other assets or when an indicator of impairment is identified.
Exploration and evaluations assets are not depreciated.
| (l) | Inventories |
Consumable stores are measured at the lower of cost and net realisable value. The cost of consumable stores is based on the weighted average cost principle. It includes expenditure incurred in acquiring the inventories, production or conversion costs and other costs incurred in bringing them to their existing location and condition. Gold in process is measured at the lower of cost and net realisable value. The cost of gold in process includes an appropriate share of production overheads based on normal operating capacity and is valued on the weighted average cost principle. Net realisable value is the estimated selling price in the ordinary course of business, less the estimated costs of completion and selling expenses.
| |
(m) | Cash and cash equivalents |
Cash and cash equivalents comprise cash balances and call deposits with original maturities of three months or less. Bank overdrafts are repayable on demand and form an integral part of the Group’s cash management process. The bank overdraft is included as a component of cash and cash equivalents for the purpose of the statement of cash flows.
| |
(n) | Assets and liabilities associated with assets held for sale |
Non-current assets, or disposal groups comprising assets and liabilities, are classified as held for sale if it is highly probable that they will be recovered primarily through sale rather than through continuing use.
Such assets, or disposal groups, are generally measured at the lower of their carrying amount or fair value less costs to sell. Impairment losses on initial classification as held for sale or held for distribution and subsequent gains and losses on remeasurement are recognised in profit or loss.
Once classified as held for sale property, plant and equipment are no longer depreciated.
| 4 | Material accounting policies (continued) |
| |
(o) | Financial instruments |
| i) | Financial assets |
The Group had the following financial assets:
Financial assets at amortised cost
Financial assets at amortised cost comprise trade receivables. Such assets are recognised initially at fair value plus any directly attributable transaction costs. Subsequent to initial recognition, they are measured at amortised cost using the effective interest method, less any impairment losses. A trade receivable without a significant financing component is initially measured at the transaction price. Refer to note 4(c)(i) for the impairment of receivables.
Fair value through profit or loss
This category comprises the Gold ETF, gold hedge and Put options. These instruments are carried at fair value with changes in fair value recognised in profit or loss as fair value losses on derivative financial instruments. Transaction costs are recognised in profit or loss immediately when incurred. The Group does not have any assets held for trading nor does it voluntarily classify any financial assets as being at fair value through profit or loss. Estimations made and further information is referred to in note 14.
| ii) | Financial liabilities |
The Group classifies its financial liabilities into one of two categories, depending on the purpose for which the liability was acquired.
Fair value through profit or loss
Derivatives are recognised initially at fair value; attributable transaction costs are recognised in profit or loss as incurred. Subsequent to initial recognition, derivatives are measured at fair value. This category comprises the Gold loan, Put options and the Call options. Estimations made and further information is in note 14. All changes in the fair value of derivative instruments are accounted for in profit or loss and all proceeds and acquisitions are classified under investing activities in the consolidated cashflow statement.
Financial liabilities at amortised cost
Non-derivative financial liabilities are recognised initially on the date at which the Group becomes a party to the contractual provisions of the instrument. The Group derecognises a financial liability when its contractual obligations are discharged, cancelled or expire.
Non-derivative financial liabilities consist of bank overdrafts, loans and borrowings and trade and other payables.
Such financial liabilities are recognised initially at fair value plus any directly attributable transaction costs. Subsequent to initial recognition these financial liabilities are measured at amortised cost using the effective interest method.
Offsetting
Financial assets and liabilities are offset and the net amount is presented in the statement of financial position when, and only when, the Group has a legal right to offset the amounts and intends either to settle on a net basis or to realise the asset and settle the liability simultaneously.
| 4 | Material accounting policies (continued) |
| |
(p) | Share capital |
Share capital is classified as equity. Incremental costs directly attributable to the issue, consolidation and repurchase of fractional items of shares and share options are recognised as a deduction from equity, net of any tax effects.
| |
(q) | Provisions |
A provision is a liability of uncertain timing and amount. A liability is recognised if, as a result of a past event, the Group has a present legal or constructive obligation that can be estimated reliably, and it is probable that an outflow of economic benefits will be required to settle the obligation. Provisions are determined by discounting the expected future cash flows at a pre-tax rate that reflects current market assessments of the time value of money and the risks specific to the liability if the time value of money is considered significant. The unwinding of the discount is recognised as a finance cost.
| (r) | Site restoration |
The Group recognises liabilities for statutory, contractual, constructive or legal obligations associated with the retirement of property, plant and equipment and exploration and evaluation assets, when those obligations result from the acquisition, construction, development or normal operation of these assets. Production phase restoration costs are recognised at the net present value of future rehabilitation cost estimates arising from the decommissioning of plant and other site preparation work is capitalised to mineral properties along with a corresponding increase in the rehabilitation provision in the period incurred. Future rehabilitation costs are discounted using a pre-tax risk-free rate that reflects the time-value of money. For assets in the exploration and the evaluation phase the restoration costs are recognised at the undiscounted current cost. The Group’s estimates of rehabilitation costs, which are reviewed annually, could change as a result of changes in regulatory requirements, discount rates, effects of inflation and assumptions regarding the amount and timing of the future expenditures. These changes are recorded directly to mineral properties with a corresponding entry to the rehabilitation provision. The periodic unwinding of the discount shall be recognised in the profit or loss as a finance costs.
| |
(s) | Leases |
The Group recognises a right of use asset and a lease liability at the lease commencement date. The right of use asset is initially measured at cost, which comprises the initial amount of the lease liability adjusted for any lease payments made at or before the commencement date, plus any initial direct costs incurred and an estimate of costs to dismantle and remove the underlying asset or to restore the underlying asset or the site on which it is located, less any lease incentives received.
The right of use asset is subsequently depreciated using the straight-line method from the commencement date to the end of the lease term, unless the lease transfers ownership of the underlying asset to the Group by the end of the lease term or the cost of the right of use asset reflects that the Group will exercise a purchase option. In that case the right of use asset will be depreciated over the useful life of the underlying asset, which is determined on the same basis as property, plant and equipment. Also, the right of use asset is periodically reduced by impairment losses, if any, and adjusted for certain remeasurements of the lease liability.
| 4 | Material accounting policies (continued) |
| (s) | Leases (continued) |
The lease liability is initially measured at the present value of the lease payments that are not paid at the commencement date, discounted using the interest rate implicit in the lease or, if that rate cannot be readily determined, the Group’s incremental borrowing rate. Generally, the Group uses its incremental borrowing rate as the discount rate.
The Group determines its incremental borrowing rate by obtaining interest rates from various external financing sources and makes certain adjustments to reflect the terms of the lease and type of the asset leased.
Lease payments included in the measurement of the lease liability comprise the following:
| ● | fixed payments, including in-substance fixed payments; |
| ● | amounts expected to be payable under a residual value guarantee; and |
| ● | the exercise price under a purchase option that the Group is reasonably certain to exercise, lease payments in an optional renewal period if the Group is reasonably certain to exercise an extension option, and penalties for early termination of a lease unless the Group is reasonably certain not to terminate early. |
The lease liability is measured at amortised cost using the effective interest method. It is remeasured when there is a change in future lease payments arising from a change in an index or rate, if there is a change in the Group’s estimate of the amount expected to be payable under a residual value guarantee, if the Group changes its assessment of whether it will exercise a purchase, extension or termination option or if the lease agreement changes in substance in terms of payment.
When the lease liability is remeasured in this way, a corresponding adjustment is made to the carrying amount of the right of use asset or is recorded in profit or loss if the carrying amount of the right of use asset has been reduced to zero.
The Group presents the right of use assets as property, plant and equipment. Lease liabilities are presented separately in the statement of financial position as current- and non-current lease liabilities.
The Group has elected not to recognise the right of use assets and lease liabilities for leases of low-value assets and short-term leases, including IT equipment.
| 4 | Material accounting policies (continued) |
| (t) | Employee benefits |
| i) | Short-term employee benefits |
Short-term employee benefits are expensed when the related services are provided. A liability is recognised for the amount expected to be paid, in respect of salaries, annual leave, bonusses and severance packages, if the Group has a present legal or constructive obligation to pay this amount as a result of past service provided by the employee and the obligation can be estimated reliably.
| ii) | Defined contribution plans |
A defined contribution plan is a post-employment benefit plan under which an entity pays fixed contributions into a separate entity and will have no legal or constructive obligation to pay further amounts. Obligations for contributions to defined contribution pension plans are recognised as an employee benefit expense in profit or loss in the periods during which services are rendered by employees. Prepaid contributions are recognised as an asset to the extent that a cash refund or a reduction in future payments is available. Contributions to a defined contribution plan that are due more than 12 months after the end of the period in which the employees render the service are discounted to their present value.
| 4 | Material accounting policies (continued) |
| |
(u) | Standards issued but not yet effective |
The following standards, amendments to standards and interpretations to existing standards may possibly have an impact on the Group:
| Standard/ Interpretation | Effective date and expected adoption date* | |||
| Classification of Liabilities as Current or Non-current – Amendments to IAS 1
Non-current Liabilities with Covenants – Amendments to IAS 1 | Amendments made to IAS 1 Presentation of Financial Statements in 2020 and 2022 aim to clarify the requirement on determining whether liabilities are classified as either current or non-current, depending on the rights that exist at the end of the reporting period. Classification is unaffected by the entity’s expectations or events after the reporting date (e.g. the receipt of a waiver or a breach of covenant).
Covenants of loan arrangements will not affect classification of a liability as current or non-current at the reporting date if the entity must only comply with the covenants after the reporting date. However, if the entity must comply with a covenant either before or at the reporting date, this will affect the classification as current or non-current even if the covenant is only tested for compliance after the reporting date. The amendments require disclosures if an entity classifies a liability as non-current and that liability is subject to covenants that the entity must comply with within 12 months of the reporting date. The disclosures include: ● the carrying amount of the liability, ● information about the covenants, and ● facts and circumstances, if any, that indicate that the entity may have difficulty complying with the covenants.
The amendments also clarify what IAS 1 means when it refers to the ‘settlement’ of a liability. Terms of a liability that could, at the option of the counterparty, result in its settlement by the transfer of the entity’s own equity instrument can only be ignored for the purpose of classifying the liability as current or non-current if the entity classifies the option as an equity instrument. However, conversion options that are classified as a liability must be considered when determining the current/non-current classification of a convertible note. The amendments must be applied retrospectively in accordance with the normal requirements in IAS 8 Accounting Policies, Changes in Accounting Estimates and Errors. Special transitional rules apply if an entity had early adopted the 2020 amendments regarding the classification of liabilities as current or non-current.
The Group has completed its assessment of the impact of the above standards and concluded that the standard amendments would not have a material impact on the consolidated financial statements. | January 1, 2024 | ||
| 4 | Material accounting policies (continued) |
| (u) | Standards issued but not yet effective (continued) |
The following standards, amendments to standards and interpretations to existing standards may possibly have an impact on the Group:
| Standard/ Interpretation | Effective date and expected adoption date* | |||
| General requirements for Disclosure of Sustainability-related financial information – IFRS S1
Climate-related Disclosures – IFRS S2 | IFRS S1 sets out overall requirements for sustainability-related financial disclosures with the objective to require an entity to disclose information about its sustainability-related risks and opportunities that is useful to primary users of general purpose financial reports in making decisions relating to providing resources to the entity.
IFRS S2 sets out the requirements for identifying, measuring and disclosing information about climate-related risks and opportunities that is useful to primary users of general purpose financial reports in making decisions relating to providing resources to the entity.
In the first annual reporting period in which an entity applies IFRS S1, the entity is permitted to disclose information on only climate-related risks and opportunities (in accordance with IFRS S2).
The Group has completed its assessment of the impact of the above standards and concluded that the standard amendments would not have a material impact on the consolidated financial statements. | January 1, 2024 | ||
| Lack of exchangeability – IAS 21 | The International Accounting Standards Board has published amendments to IAS 21 that specify how to assess whether a currency is exchangeable and how to determine the exchange rate when it is not.
Applying the amendments, a currency is exchangeable when an entity is able to exchange that currency for the other currency through market or exchange mechanisms that create enforceable rights and obligations without undue delay at the measurement date and for a specified purpose. However, a currency is not exchangeable into the other currency if an entity can only obtain no more than an insignificant amount of the other currency at the measurement date for the specified purpose.
When a currency is not exchangeable at the measurement date, an entity is required to estimate the spot exchange rate as the rate that would have applied to an orderly exchange transaction at the measurement date between market participants under prevailing economic conditions. In that case, an entity is required to disclose information that enables users of its financial statements to evaluate how the currency’s lack of exchangeability affects, or is expected to affect, the entity’s financial performance, financial position and cash flows.
Management is investigating the potential impact of the standard to be amended. | January 1, 2025 | ||
* Annual periods ending on or after.
New standards, amendments to standards and interpretations adopted from January 1, 2023 had no significant effect on the Group’s accounting policies.
| 5 | Tribute Arrangement and Mining Agreement and Bilboes Gold Limited acquisition |
On July 21, 2022 Caledonia Holdings Zimbabwe (Private) Limited (“CHZ”) entered into a Tribute Arrangement, and related Mining Agreement with Bilboes Holdings (Private) Limited (“Bilboes Holdings” or “Bilboes”) to mine its oxide and transitional ore (“tribute agreement”). This tribute agreement was specific to the Bilboes oxide mine and Bilboes Holdings was on care and maintenance at the date of the agreement.
In terms of the tribute agreement, Bilboes Holdings granted CHZ the right to mine the Bilboes oxide mine operations for the purpose of extracting and selling gold. In terms of this right, CHZ could operate the Bilboes oxide mine using a combination of Bilboes’ resources and their own, for CHZ’s account.
Subject to the stipulation in the tribute agreement, CHZ assumed all responsibility in connection with the oxide mining claims as if CHZ were the owner thereof and Bilboes Holdings remained the registered holder of the mining claims until ownership passes in terms of the Sale and Purchase Agreement, mentioned below.
In terms of the tribute agreement, CHZ had the right to provide instructions over the scope of works for the Bilboes oxide mine in terms of an operational plan and also had the right to terminate the tribute agreement. CHZ, therefore, had the ability to affect the variable returns of the Bilboes oxide mine and to ensure its returns were in line with the expectation of recouping its “investment” (all funds provided) at a
The tribute agreement came into effect on August 1, 2022, when the Ministry of Mines’ approval was received, and control was obtained through contractual arrangement.
The Bilboes oxide mine did not have sufficient processes in place to operate the oxide mining operations and was reliant on CHZ to provide instructions on the mining operations to create the necessary outputs. The Bilboes oxide mine was assessed as an asset and liability acquisition and not a business combination in terms of IFRS 3 Business Combinations. Directly attributable costs of bringing the Bilboes oxide mine to the location and condition necessary for it to be capable of operating in the manner intended by CHZ amounted to $
On June 27, 2023 the decision was taken to place the mining tailing activities of the Bilboes oxide mine on care and maintenance as the cost related to removing the waste and accessing the orebody could exceed the benefit from the gold revenues to be received. The impairment loss that was recognised amounted to a carrying value of $
In addition to the tribute arrangement, Caledonia signed a conditional agreement (the “Sale and Purchase Agreement”) to purchase 100% of Bilboes Gold Limited (“Bilboes Gold”) on July 21, 2022. Bilboes Gold is the holding company of Bilboes Holdings that owns high-grade sulphide resources and the mentioned mining claims to the oxide mine deposit. It was agreed that Caledonia would purchase Bilboes Gold for a consideration to be settled by issue to the sellers of
On January 6, 2023, following the satisfaction of conditions precedent, Caledonia completed the acquisition of Bilboes Gold that gave right to further evaluate and exploit the sulphide resources in addition to the oxide mining activities agreed in the tribute agreement.
| 5 | Tribute Arrangement and Mining Agreement and Bilboes Gold Limited acquisition (continued) |
The acquisition of Bilboes Gold was classified as an asset and liability acquisition as there were no inputs, processes and outputs and it was not a business combination in terms of IFRS 3 Business Combinations.
Upon completion of the transaction on January 6, 2023, the initial consideration shares were issued, in the amount of
The escrow consideration shares of
Deferred consideration shares of
| Consideration paid | $'000 | |||
| Equity issued | ||||
| Initial consideration shares issued ( at $ per share) | ||||
| Escrow shares issued ( at $ per share) | ||||
| Deferred consideration shares issued ( at $ per share) | ||||
| Bilboes oxide mine assets (pre-acquisition) | ( | ) | ||
| Prepayments - Bilboes pre-effective date costs | ||||
| Total net consideration | ||||
| Recognised amounts of identifiable assets and liabilities assumed (January 6, 2023) | ||||
| Exploration and evaluation assets (note 17) | ||||
| Inventories | ||||
| Prepayments | ||||
| Trade and other receivables | ||||
| Cash and cash equivalents | ||||
| Provisions | ( | ) | ||
| Trade and other payables - external | ( | ) | ||
| Lease liabilities | ( | ) | ||
| Income tax payable | ( | ) | ||
Acquisition-related costs
Included in administrative costs is an amount of $
| 6 | Blanket Zimbabwe Indigenisation Transaction |
On February 20, 2012 the Group announced it had signed a Memorandum of Understanding (“MoU”) with the Minister of Youth, Development, Indigenisation and Empowerment of the Zimbabwean Government pursuant to which the Group agreed that indigenous Zimbabweans would acquire an effective
| ● | sold a |
| ● | sold a |
| ● | sold a |
| ● | donated a |
The Group facilitated the vendor funding of these transactions which is repaid by way of dividends from Blanket Mine.
Accounting treatment
The directors of Caledonia Holdings Zimbabwe (Private) Limited (“CHZ”), a wholly-owned subsidiary of the Company, performed an assessment using the requirements of IFRS 10: Consolidated Financial Statements (IFRS 10). It was concluded that CHZ should consolidate Blanket Mine after the indigenisation. The subscription agreements with the indigenous shareholders have been accounted for accordingly as a transaction with non-controlling interests and as a share-based payment transaction.
| 6 | Blanket Zimbabwe Indigenisation Transaction (continued) |
Accounting treatment
The subscription agreements, concluded on February 20, 2012, were accounted for as follows:
| ● | Non-controlling interests (“NCI”) were recognised on the portion of shareholding upon which dividends declared by Blanket Mine will accrue unconditionally to equity holders as follows: |
| (a) | |
| (b) | |
| (c) | |
| ● | This effectively means that NCI was initially recognised at |
| ● | The remaining |
| ● | The transaction with BETS is accounted for in accordance with IAS 19 Employee Benefits (profit sharing arrangement) as the ownership of the shares does not ultimately pass to the employees. The employees are entitled to participate in |
| ● | BETS is an entity effectively controlled and consolidated by Blanket Mine. Accordingly, the shares held by BETS are effectively treated as treasury shares in Blanket Mine and no NCI is recognised. |
Fremiro purchase agreement
On November 5, 2018 the Company and Fremiro entered into a sale agreement for Caledonia to purchase Fremiro’s
Blanket Mine’s indigenisation shareholding percentages and facilitation loan balances
|
| Effective | NCI subject to | Balance of facilitation loan # | |||||||||||||||||
| USD | Shareholding | interest & NCI recognised | facilitation loan | December 31, | December 31, | |||||||||||||||
| NIEEF | % | % | % | |||||||||||||||||
| Community Trust | % | % | % | |||||||||||||||||
| BETS ~ | % | -* | -* | |||||||||||||||||
| % | % | % | ||||||||||||||||||
| * | The shares held by BETS are effectively treated as treasury shares (see above). |
| ~ | Accounted for under IAS19 Employee Benefits. |
| # | Facilitation loans are accounted for as equity instruments and are accordingly not recognised as loans receivable. |
| 6 | Blanket Zimbabwe Indigenisation Transaction (continued) |
Accounting treatment (continued)
The balance on the facilitation loans is reconciled as follows:
| 2023 | 2022 | |||||||
| Balance at January 1 | ||||||||
| Interest incurred | ||||||||
| Dividends used to repay loan | ( | ) | ( | ) | ||||
| Balance at December 31 | ||||||||
Advance dividend loans and balances
In anticipation of completing the underlying subscription agreements, Blanket Mine agreed to advance dividend arrangements with NIEEF and the Community Trust. Advances made to the Community Trust against their right to receive dividends declared by Blanket Mine on their shareholding were as follows:
| ● | a $ |
| ● | a $ |
| ● | a $ |
These advance payments were debited to a loan account bearing interest at a rate at the lower of a fixed 7.25% per annum, payable quarterly or the Blanket Mine dividend in the quarter to the advanced dividend loan holder. The loan is repayable by way of set-off of future dividends on the Blanket Mine shares owned by the Community Trust. Advances made to NIEEF as an advanced dividend loan before 2013 have been settled through Blanket Mine dividend repayments in 2014. The advance dividend payments were recognised as distributions to shareholders and they are classified as equity instruments. The loans arising are not recognised as loans receivables, because repayment is by way of uncertain future dividends. The final payment to settle the advance dividend loan to the Community Trust was made on September 22, 2021. Future dividends to the Community Trust are unencumbered from the date the loan was settled in full.
| 7 | Capital management |
When managing capital, the Group’s objectives are to safeguard its ability to continue as a going concern in order to pursue the mining operations and exploration potential of the mineral properties. The Group’s capital includes shareholders’ equity, comprising issued share capital (refer to note 25), reserves (refer to note 26), accumulated other comprehensive income, retained loss, bank financing (refer to note 23) and non-controlling interests (refer to note 28).
| 2023 | 2022 | |||||||
| Total equity | ||||||||
The Group’s primary objective regarding its capital management is to ensure that it has sufficient cash resources to maintain its on-going operations, provide returns for shareholders, accommodate any rehabilitation provisions and pursue growth opportunities. It assesses its short term needs and funds these by available cash, overdrafts and short to medium term loans. Capital requirements for future project are evaluated on a case-by-case basis. As at December 31, 2023, there has been no change with respect to the overall capital risk management strategy.
| 8 | Revenue |
| Blanket | Bilboes | Total | ||||||||||||||||||||||||||
| 2023 | 2022 | 2021 | *2023 | 2023 | 2022 | 2021 | ||||||||||||||||||||||
| Revenue | ||||||||||||||||||||||||||||
| Revenue - silver sales | ||||||||||||||||||||||||||||
| Revenue - gold sales | ||||||||||||||||||||||||||||
| Total ounces gold sold | ||||||||||||||||||||||||||||
| Net work in progress (oz) | ( | ) | ( | ) | ||||||||||||||||||||||||
| Gold produced (oz) | ||||||||||||||||||||||||||||
| Tonnes milled | ||||||||||||||||||||||||||||
| Grade (g/t) | ||||||||||||||||||||||||||||
| Recovery (%) | ||||||||||||||||||||||||||||
| Realised gold price ($/oz) | ||||||||||||||||||||||||||||
| * | Bilboes Holdings was acquired on January 6, 2023. No production for 2022 and 2021. |
| 9 | Production costs |
| 2023 | 2022 | 2021 | ||||||||||
| Blanket Mine | ||||||||||||
| Salaries and wages | ||||||||||||
| Consumable materials | ||||||||||||
| Consumable materials – COVID-19 | ||||||||||||
| Electricity costs | ||||||||||||
| Safety | ||||||||||||
| Cash-settled share-based expense (note 12.1(a)) | ||||||||||||
| On mine administration | ||||||||||||
| Security | ||||||||||||
| Solar operations and maintenance services | ||||||||||||
| Obsolete inventory | ||||||||||||
| Pre-feasibility exploration costs | ||||||||||||
| Bilboes | ||||||||||||
| Salaries and wages | ||||||||||||
| Consumable materials | ||||||||||||
| Electricity costs | ||||||||||||
| Cash-settled share-based expense (note 12.1(a)) | ||||||||||||
| On mine administration | ||||||||||||
| 10 | Other expenses |
| 2023 | 2022 | 2021 | ||||||||||
| Intermediated Money Transaction Tax* | ||||||||||||
| COVID-19 donations | ||||||||||||
| Community and social responsibility cost | ||||||||||||
| Impairment of property, plant and equipment (note 18) | ||||||||||||
| Impairment of exploration and evaluation assets (note 17) | ||||||||||||
| Impairment Solar - VAT and duty receivables (note 21) | ||||||||||||
| Bilboes pre-acquisition cost @ | ||||||||||||
| Expected credit losses on deferred consideration on the disposal of subsidiary | ||||||||||||
| * | Intermediated Money Transfer Tax ("IMTT”) is tax chargeable in Zimbabwe on transfer of physical money, electronically or by any other means, between two or more persons. IMTT is levied at a rate of 2% on RTGS$ denominated transactions and 1% on local foreign currency denominated transactions and outbound foreign payments. |
| @ | Cost incurred by CHZ between the effective date ( August 1, 2022) and the commencement date of the oxide mining operations ( December 1, 2022) relating to administration and other general costs. These costs were incurred to maintain the operational integrity of the oxide mine and do not relate to direct costs of bringing the oxide mine to the location and condition necessary for it to be capable of operating in the manner intended by CHZ. |
| 11 | Administrative expenses |
| 2023 | 2022 | 2021 | ||||||||||
| Investor relations | ||||||||||||
| Audit fee | ||||||||||||
| Advisory services fees | ||||||||||||
| Listing fees | ||||||||||||
| Directors fees – Company | ||||||||||||
| Directors fees – Blanket | ||||||||||||
| Employee costs – salaries and bonusses | ||||||||||||
| Employee costs – settlements | ||||||||||||
| Other office administration cost | ||||||||||||
| Information technology and communication cost – Group related | ||||||||||||
| Management liability insurance | ||||||||||||
| Travel costs | ||||||||||||
| 12 | Share-based payments |
| 12.1 | Cash-settled share-based payments |
| (a) | Restricted Share Units and Performance Units |
Certain management and employees within the Group are granted Restricted Share Units (“RSUs”) and Performance Units (”PUs”) pursuant to provisions of the 2015 Omnibus Equity Incentive Compensation Plan (“OEICP”). All RSUs and PUs were granted and approved at the discretion of the Compensation Committee of the Board of Directors.
RSUs vest years after grant date given that the service conditions of the relevant employees have been fulfilled. The value of the vested RSUs is the number of RSUs vested multiplied by the fair market value of the Company’s shares, as specified by the OEICP, on the date of settlement.
PUs have a performance condition based on gold production and, in recent awards, average normalised controllable cost per ounce of gold and a performance period of to years. The number of PUs that vest will be the relevant portion of the PUs granted multiplied by the performance multiplier, which will reflect the actual performance in terms of the performance conditions compared to expectations on the date of the award.
RSU holders are entitled to receive dividends over the vesting period. Such dividends will be reinvested in additional RSUs at the then applicable share price. PUs have rights to dividends only after they have vested.
RSUs and PUs allow for settlement of the vesting date value in cash or, subject to conditions, shares issuable at fair market value or a combination of both at the discretion of the unitholder.
The fair value of the RSUs at the reporting date was based on the Black Scholes option valuation model less the fair value of the expected dividends during the vesting period multiplied by the performance multiplier expectation. The fair value of the PUs at the reporting date was based on the Black Scholes option valuation model. At the reporting date it was assumed that there is a 93%-100% probability that the performance conditions will be met and therefore a
The liability as at December 31, 2023 amounted to $
| 12 | Share-based payments (continued) |
| 12.1 | Cash-settled share-based payments (continued) |
| (a) | Restricted Share Units and Performance Units (continued) |
The cash-settled share-based expense for PUs for the period amounted to $
The following assumptions were used in estimating the fair value of the cash-settled share-based payment liability on December 31:
| December 31, 2023 | December 31, 2022 | |||||||||||||||
| RSUs | PUs | RSUs | PUs | |||||||||||||
| Risk free rate | % | % | % | |||||||||||||
| Fair value (USD) | ||||||||||||||||
| Share price (USD) | ||||||||||||||||
| Performance multiplier percentage | – | % | – | % | ||||||||||||
| Volatility | ||||||||||||||||
| Share units granted: | RSUs | PUs | RSUs | PUs | ||||||||||||
| Grant - January 11, 2019 | ||||||||||||||||
| Grant - March 23, 2019 | ||||||||||||||||
| Grant - June 8, 2019 | ||||||||||||||||
| Grant - January 11, 2020 | ||||||||||||||||
| Grant - March 31, 2020 | ||||||||||||||||
| Grant - June 1, 2020 | ||||||||||||||||
| Grant - September 9, 2020 | ||||||||||||||||
| Grant - September 14, 2020 | ||||||||||||||||
| Grant - October 5, 2020 | ||||||||||||||||
| Grant - January 11, 2021 | ||||||||||||||||
| Grant - April 1, 2021 | ||||||||||||||||
| Grant - May 14, 2021 | ||||||||||||||||
| Grant - June 1, 2021 | ||||||||||||||||
| Grant - June 14, 2021 | ||||||||||||||||
| Grant - August 13, 2021 | ||||||||||||||||
| Grant - September 1, 2021 | ||||||||||||||||
| Grant - September 6, 2021 | ||||||||||||||||
| Grant - September 20, 2021 | ||||||||||||||||
| Grant - October 1, 2021 | ||||||||||||||||
| Grant - October 11, 2021 | ||||||||||||||||
| Grant - November 12, 2021 | ||||||||||||||||
| Grant - December 1, 2021 | ||||||||||||||||
| Grant - January 11, 2022 | ||||||||||||||||
| Grant - January 12, 2022 | ||||||||||||||||
| Grant - May 13, 2022 | ||||||||||||||||
| Grant - June 1, 2022 | ||||||||||||||||
| Grant - July 1, 2022 | ||||||||||||||||
| Grant - October 1, 2022 | ||||||||||||||||
| Grant - April 7, 2023 | ||||||||||||||||
| Grant - May 15, 2023 | ||||||||||||||||
| Grant - June 1, 2023 | ||||||||||||||||
| Grant - June 7, 2023 | ||||||||||||||||
| Grant - August 10, 2023 | ||||||||||||||||
| Grant - September 1, 2023 | ||||||||||||||||
| Grant - October 3, 2023 | ||||||||||||||||
| RSU dividends reinvested | ||||||||||||||||
| Settlements/terminations | ( | ) | ( | ) | ( | ) | ||||||||||
| Total awards outstanding | ||||||||||||||||
| 12 | Share-based payments (continued) |
| 12.2 | Equity-settled share-based payments |
| (a) | EPUs |
PUs which are classified as equity-settled (i.e. there is no option to vest in cash) (“EPUs”) have a performance condition based on gold production, average normalised controllable cost per ounce of gold and a performance period of years. The number of EPUs that vest will be the relevant portion of the EPUs granted multiplied by the performance multiplier, which will reflect the actual performance in terms of the performance conditions compared to expectations on the date of the award.
EPUs have rights to dividends only after they have vested.
The shares issued are subject to a minimum holding period of until at least the first anniversary of the EPUs vesting date.
The fair value of the EPUs at the reporting date was based on the Black Scholes option valuation model less the fair value of the expected dividends during the vesting period multiplied by the performance percentage. At the reporting date it was assumed that there is a
The following assumptions were used in estimating the fair value of the equity-settled share-based payment on:
| Grant date | January 24, 2022 | April 7, 2023 | ||||||
| Number of units – remaining at reporting date | ||||||||
| Share price (USD) - grant date | ||||||||
| Fair value (USD) - grant date | ||||||||
| Performance multiplier percentage at grant date | % | % | ||||||
| (b) | Share option programs |
The maximum term of the options under the OEICP is years. Equity-settled share-based payments under the OEICP will be settled by physical delivery of shares. Under the OEICP the aggregate number of shares that may be issued pursuant to the grant of options, or under any other share compensation arrangements of the Company, will not exceed
The fair value of share-based payments noted above was estimated using the Black-Scholes valuation model as the fair value of the services could not be estimated reliably. Service and non-market performance conditions attached to the arrangements were not taken into account in measuring fair value.
The equity-settled share-based expense relating to grants amounted to (2022: $
| 13 | Net foreign exchange (loss) gain |
On October 1, 2018 the RBZ issued a directive to Zimbabwean banks to separate foreign currency from RTGS$ in the accounts held by their clients and pegged the RTGS$ at 1:1 to the US Dollar. On February 20, 2019 the RBZ issued a further monetary policy statement, which allowed inter-bank trading between RTGS$ and foreign currency. The interbank rate was introduced at
In June 2021 the RBZ announced that companies that are listed on the Victoria Falls Stock Exchange (“VFEX”) will receive
On February 3, 2023, the RBZ issued Exchange control directive RY002/2023 stating that with effect from February 6, 2023, the US$ export retention threshold across all sectors, including companies listed on the VFEX, had been standardized to
On April 5, 2024 the Reserve Bank of Zimbabwe issued a Monetary Statement policy that introduced a structured currency (which is generally defined as a currency that is pegged to a specific exchange rate or currency basket and backed by a bundle of foreign exchange assets (including gold). The structured currency called the Zimbabwe Gold (“ZiG”) replaced the RTGS$ from the said date. Banks were instructed to convert the RTGS$ balances into the new currency to foster simplicity, certainty, and predictability in monetary and financial affairs. The new currency will co-circulate with other foreign currencies in the economy. The retention threshold remained unchanged.
The table below illustrates the effect the weakening of the RTGS$ and other foreign currencies had on the consolidated statement of profit or loss.
| 2023 | 2022 | 2021 | ||||||||||
| Unrealised foreign exchange gain | ||||||||||||
| Realised foreign exchange loss* | ( | ) | ( | ) | ( | ) | ||||||
| Net foreign exchange (loss) gain | ( | ) | ||||||||||
| * | Realised foreign exchange losses were predominantly recognised on bullion sales receivables, bank balances and RTGS$ VAT. |
| ** | After December 31, 2023 the RTGS$:USD conversion rate devalued from RTGS$ 1 to RTGS$ 1 on March, 25 2024. The devaluation in the exchange rate will devalue RTGS$-denominated monetary assets in quarter 1, of 2024. |
| 14 | Derivative financial instruments |
The fair value of derivative financial instruments not traded in an active market is determined by using valuation techniques. These valuation techniques maximize the use of observable market data where available. The company did not apply hedge accounting to the derivative financial instruments and all fair value losses were recorded in the consolidated statements of profit or loss and other comprehensive income. Transaction costs are recognised in profit or loss as incurred.
| Derivative financial instrument expenses | 2023 | 2022 | 2021 | ||||||||||
| Put options | 14.1(a) | ||||||||||||
| Gold purchase options | 14.2(a) | ||||||||||||
| Gold loan | 14.2(b) | ( | ) | ||||||||||
| Call options (December 13, 2021) | 14.2(b) | ( | ) | ||||||||||
| Cap and collar options and Call options | 14.2(c) | ||||||||||||
| Call options transaction costs (March 9, 2022) | 14.2(c) | ||||||||||||
| Gold exchange-traded fund ("Gold ETF") | |||||||||||||
| Cash flows arising from investing activities | |||||||||||||
| Acquisition of Put options | 14.1(a) | ( | ) | ( | ) | ||||||||
| Proceeds from derivative financial liabilities – Gold purchase options | 14.2(a) | ||||||||||||
| Proceeds from derivative financial assets - Gold ETF | |||||||||||||
| ( | ) | ( | ) | ||||||||||
| Cash flows arising from financing activities | |||||||||||||
| Gold loan (repayment) proceeds | 14.2(b) | ( | ) | ||||||||||
| Call options (December 13, 2021) proceeds | 14.2(b) | ||||||||||||
| Call options (March 9, 2022) acquisition | 14.2(c) | ( | ) | ||||||||||
| Call options (March 9, 2022) proceeds | 14.2(c) | ||||||||||||
| ( | ) | ||||||||||||
| 14.1 | Derivative financial assets |
| 2023 | 2022 | ||||||||
| Put options | 14.1(a) | ||||||||
| (a) | Put options |
On December 19, 2023 the Company purchased put options to hedge
On September 29, 2023 and October 6, 2023 the Company purchased two gold purchase options of
On May 22, 2023 the Company purchased put options to hedge
On December 22, 2022 the Company purchased put options to hedge
| 14 | Derivative financial instruments (continued) |
| 14.1 | Derivative financial assets (continued) |
| (a) | Put options (continued) |
The put options (together “the Put options”) were classified as level 1 in the fair value hierarchy.
On March 7, 2024 the Company purchased put options to hedge
On April 10, 2024 the Company purchased put options to hedge
| 14.2 | Derivative financial liabilities |
| 2023 | 2022 | ||||||||
| Gold purchase options | 14.2(a) | ||||||||
| Gold loan | 14.2(b) | ||||||||
| Call options (December 13, 2021) | 14.2(b) | ||||||||
| Cap and collar options and Call options | 14.2(c) | ||||||||
| – | – | ||||||||
| (a) | Gold purchase options |
On September 29, 2023 and October 6, 2023 the Company purchased two gold purchase options of
| (b) | Gold loan and Call options |
On December 13, 2021 the Company entered into two separate gold loan and option agreements with Auramet International LLC (“Auramet”).
In terms of the agreements the Group:
| ● | received $ |
| ● | is required to make |
| ● | granted call options (the “Call options”) on |
| 14 | Derivative financial instruments (continued) |
| 14.2 | Derivative financial liabilities (continued) |
| (b) | Gold loan and Call options (continued) |
Accounting for the Gold loan and the Call options transactions:
| ● | At inception the fair value of the Gold loan was calculated at the amount received less the fair value of the Call options. |
| ● | As at March 31, 2022 the fair value of the gold loan was calculated by discounting the fair value of the gold deliveries at a forward rate of $ |
| ● | At inception and at March 31, 2022 the Call options were valued at the quoted prices available from the CME Group Inc. at each respective date. |
| ● | Differences in the fair values were accounted for as Fair value losses on derivative financial instruments in the consolidated statement of profit or loss and other comprehensive income. |
| ● | The Call options were classified as level 1 in the fair value hierarchy and the Gold loan as level 2. |
| ● | Derivative liabilities are not designated as hedging instruments. |
Proceeds received under the Gold loan and Call options agreements were allocated as follows:
| December 13, 2021 | ||||
| Net proceeds received | ||||
| Fair value of Call options | ||||
| Fair value of Gold loan |
The Gold loan was settled in full on June 30, 2022. The remaining Call options, outstanding as at September 30, 2022, expired on October 31, 2022 and November 30, 2022.
| (c) | Cap and collar options and Call options |
On February 17, 2022 the Company entered into a zero cost contract to hedge
On March 9, 2022 in response to a very volatile gold price the Company purchased a matching quantity of Call options at a strike price above the cap at a total cost of $
In April, 2022 Auramet and the Company each purchased matching quantities of Call options at a net settlement cost to the Company of $
The Cap and collar options and Call options were classified as level 1 in the fair value hierarchy.
| 15 | Finance income and finance cost |
| 2023 | 2022 | 2021 | ||||||||||
| Finance income received - Bank | ||||||||||||
| Unwinding of rehabilitation provision (note 29) | ||||||||||||
| Finance cost - Leases (note 19) | ||||||||||||
| Zimbabwe Electricity Supply Authority interest | ||||||||||||
| Finance cost – Overdraft and term loans | ||||||||||||
| Finance cost - Motapa loan notes payable (note 30.1) | ||||||||||||
| Finance cost - Solar loan notes payable (note 30.2) | ||||||||||||
| Finance cost - Term loan | ||||||||||||
| Finance cost - Capitalised to property, plant and equipment (note 18) | ( | ) | ||||||||||
Refer to note 23 for finance costs paid on overdrafts and term loans. Refer to note 30 for finance costs paid on loan notes.
| 16 | Tax expense |
| 2023 | 2022 | 2021 | ||||||||||
| Tax recognised in profit or loss | ||||||||||||
| Current tax | ||||||||||||
| Income tax - current year | ||||||||||||
| Income tax - change in tax estimate | ( | ) | ( | ) | ||||||||
| Withholding tax - current year | ||||||||||||
| Acquisition of Bilboes Gold tax liability (note 5) | ||||||||||||
| Deferred tax expense | ||||||||||||
| Origination and reversal of temporary differences | ||||||||||||
| Tax expense – recognised in profit or loss | ||||||||||||
| Tax recognised in other comprehensive income | ||||||||||||
| Income tax - current year | ||||||||||||
| Tax expense | ||||||||||||
| 16 | Tax expense (continued) |
Unrecognised deferred tax assets
| 2023 | 2022 | 2021 | |||||||
| Bilboes Holdings (Private) Limited* | |||||||||
| Caledonia Holdings Zimbabwe (Private) Limited – mining | |||||||||
| Caledonia Holdings Zimbabwe (Private) Limited - services | |||||||||
| Blanket Employee Trust Services (Private) Limited | |||||||||
| Caledonia Mining Services (Private) Limited | |||||||||
| Greenstone Management Services (Pty) Ltd (UK) @ | |||||||||
| Tax losses carried forward |
Taxable losses do not expire for the entities incurring taxable losses within the Group, unless the entities cease trading. Tax losses carried forward relate to Caledonia Holdings Zimbabwe (Private) Limited and Bilboes Holdings (Private) Limited. Deferred tax assets have not been recognised in these entities as future taxable income is not deemed probable to utilise these losses against.
| * | Assessed losses of Bilboes of $ |
| @ | Assessed losses of Greenstone Management Services (Pty) Ltd (UK) are not carried over and reset to zero each year. |
| Tax paid | 2023 | 2022 | 2021 | ||||||
| Net income tax payable at January 1 | ( | ) | ( | ) | ( | ) | |||
| Current tax expense | ( | ) | ( | ) | ( | ) | |||
| Acquisition of Bilboes Gold tax liability (note 5) | ( | ) | |||||||
| Foreign currency movement | |||||||||
| Tax paid | |||||||||
| Net income tax receivable/ (payable) at December 31 | ( | ) | ( | ) |
| 16 | Tax expense (continued) |
| Reconciliation of tax rate | ||||||||||||
| Profit for the year | ( | ) | ||||||||||
| Total tax expense | ||||||||||||
| Profit before tax | ||||||||||||
| Income tax at Company's domestic tax rate (1) | ||||||||||||
| Tax rate differences in foreign jurisdictions (2) | ||||||||||||
| Effect of income tax calculated in RTGS$ as required by PN26 (3) | ||||||||||||
| Management fee – withholding tax on deemed dividend portion | ||||||||||||
| Management fee – non-deductible deemed dividend | ||||||||||||
| Management fee – withholding tax - current year | ||||||||||||
| Withholding tax on intercompany dividends | ||||||||||||
| Non-deductible expenditure | ||||||||||||
| - Donations | ||||||||||||
| - Other non-deductible expenditure | ||||||||||||
| Unrealised foreign exchange gains | ( | ) | ( | ) | ( | ) | ||||||
| Change in tax estimates | ||||||||||||
| - Zimbabwean income tax | ( | ) | ||||||||||
| - South African income tax | ( | ) | ( | ) | ||||||||
| Change in unrecognised tax losses | ||||||||||||
| Tax expense - recognised in profit or loss |
| (1) | The tax rate in Jersey, Channel Islands is |
| (2) | The effective tax rate of |
| (3) | In 2019 ZIMRA issued PN26 that was affected retrospectively from February 22, 2019. The public notice provided clarity on Section 4 (a) of the Finance Act [Chapter 23.04] of Zimbabwe, which required that the calculation of taxable income be performed in RTGS$ and that the payment of the tax be in the ratio of the currency that the taxable income and revenue is earned. The reconciling item reconciled the profit before tax calculated using US Dollars as the functional currency of the Zimbabwean entities to taxable income calculated in RTGS$. PN26 was superseded by Section 37AA of the Income Tax Act [Chapter 23:06] of Zimbabwe, which requires taxpayers to submit separate tax returns where any part of the income from trade or investment is earned in foreign currency. Section 37AA stated that the calculation of taxable income be expressed in foreign currency and RTGS$ and that the payment of the tax payable be made proportionately to reflect the percentage share of income earned in all foreign currencies and the percentage earned in Zimbabwe dollars. The section further provides that the RTGS$ should be converted to US$ using the average auction rate of exchange for the year of assessment, with the same being applicable to US$ amounts that need to be converted to RTGS$. |
On November 30,2023, the Zimbabwean Government announced in the 2024 National Budget Statement that the income tax rate will increase from
The South African Government announced in the 2021 National Budget Statement that the income tax rate will be reduced from
| 16 | Tax expense (continued) |
Recognised deferred tax assets and liabilities
| Assets | Liabilities | Net | ||||||||||||||||
| 2023 | 2022 | 2023 | 2022 | 2023 | 2022 | |||||||||||||
| Property, plant and equipment | ( | ) | ( | ) | ( | ) | ( | ) | ||||||||||
| Exploration and evaluation assets | ( | ) | ( | ) | ( | ) | ( | ) | ||||||||||
| Inventories – obsolete stock | ( | ) | ( | ) | ||||||||||||||
| Prepayments | ( | ) | ( | ) | ( | ) | ( | ) | ||||||||||
| Unrealised foreign exchange | ||||||||||||||||||
| Trade and other payables | ||||||||||||||||||
| Provisions | ||||||||||||||||||
| Other | ||||||||||||||||||
| Tax assets/ (liabilities) | ( | ) | ( | ) | ( | )* | ( | )* | ||||||||||
| * | The net deferred tax liability consists of a deferred tax asset of $ |
Movement in recognised deferred tax assets and liabilities
| Balance January 1, 2023 | Recognised in profit or loss | Foreign exchange movement | Balance December 31, 2023 | |||||||||
| Property, plant and equipment | ( | ) | ( | ) | ( | ) | ||||||
| Exploration and evaluation assets | ( | ) | ( | ) | ( | ) | ||||||
| Inventories – obsolete stock | ( | ) | ||||||||||
| Prepayments | ( | ) | ( | ) | ( | ) | ||||||
| Unrealised foreign exchange | ( | ) | ||||||||||
| Trade and other payables | ( | ) | ( | ) | ||||||||
| Provisions | ( | ) | ||||||||||
| Other | ||||||||||||
| Tax (liabilities)/ assets | ( | ) | ( | ) | ( | ) |
| Balance January 1, 2022 | Recognised in profit or loss | Foreign exchange movement | Balance December 31, 2022 | |||||||||
| Property, plant and equipment | ( | ) | ( | ) | ( | ) | ||||||
| Exploration and evaluation assets | ( | ) | ( | ) | ||||||||
| Inventories - obsolete stock | ( | ) | ( | ) | ||||||||
| Prepayments | ( | ) | ( | ) | ||||||||
| Unrealised foreign exchange | ( | ) | ||||||||||
| Trade and other payables | ( | ) | ||||||||||
| Provisions | ( | ) | ||||||||||
| Tax (liabilities)/ assets | ( | ) | ( | ) | ( | ) |
| 17 | Exploration and evaluation assets |
| Bilboes Gold | Motapa | Maligreen | Connemara North | GG | Sabiwa | Abercorn | Valentine | Total | |||||||||||||||||||
| Balance at January 1, 2022 | |||||||||||||||||||||||||||
| Acquisition costs: | |||||||||||||||||||||||||||
| - Mining claims acquired | |||||||||||||||||||||||||||
| Exploration costs: | |||||||||||||||||||||||||||
| - Consumables and drilling | |||||||||||||||||||||||||||
| - Contractor | |||||||||||||||||||||||||||
| - Labour | |||||||||||||||||||||||||||
| - Power | |||||||||||||||||||||||||||
| Impairment * | ( | ) | ( | ) | |||||||||||||||||||||||
| Balance at December 31, 2022 | |||||||||||||||||||||||||||
| Balance at January 1, 2023 | |||||||||||||||||||||||||||
| Acquisition costs: | |||||||||||||||||||||||||||
| - Bilboes Gold | |||||||||||||||||||||||||||
| Decommissioning asset estimation adjustment | |||||||||||||||||||||||||||
| Exploration costs: | – | – | – | – | – | – | – | – | |||||||||||||||||||
| - Consumables and drilling | |||||||||||||||||||||||||||
| - Contractor | |||||||||||||||||||||||||||
| - Labour | |||||||||||||||||||||||||||
| - Power | |||||||||||||||||||||||||||
| - Other | |||||||||||||||||||||||||||
| Balance at December 31, 2023 |
| * | Caledonia completed sufficient work to establish that the potential orebody at the Connemara North property would not meet Caledonia’s requirements in terms of size, grade and width. Accordingly, Caledonia did not exercise the option to acquire the property. The costs have been impaired to |
Non cash acquisitions of exploration and evaluation assets consist of Bilboes acquisition ($
| 17 | Exploration and evaluation assets (continued) |
| (a) | Bilboes Gold |
Refer to note 5 for more information on the acquisition of the Bilboes Gold sulphide exploration and evaluation project.
| (b) | Motapa |
On November 1, 2022 Caledonia entered into a share purchase agreement with Bulawayo Mining Company Limited (“Bulawayo Mining”) to acquire all the shares of Motapa Mining Company UK Limited (“Motapa”), along with its wholly owned subsidiary Arraskar Investments (Private) Limited (“Arraskar”) (“Share Purchase Agreement”).
Caledonia considers Motapa to be highly prospective and strategically important to its growth ambitions in Zimbabwe in terms of both location and scale. Motapa is a large exploration property which is contiguous to the Bilboes gold project.
The Motapa asset has been mined throughout most of the second half of the 20th century, Caledonia understands that during this period the region produced as much as
The acquisition was accounted for as an asset acquisition as the net assets acquired do not meet the definition of a business. The purchase price of the net assets acquired was allocated to exploration and evaluation assets based on management’s estimation of the fair value at acquisition.
The initial purchase price of $
| (c) | Maligreen |
On November 3, 2021 the mining claims over the Maligreen project (“Maligreen”), a property situated in the Gweru mining district in the Zimbabwe Midlands, were transferred to Caledonia Holdings Zimbabwe (Private) Limited for a total cash consideration of million.
Maligreen is a substantial brownfield exploration opportunity with significant historical exploration and evaluation work having been conducted on the property over the last
| ● | An estimated |
| ● | |
| ● | Aeromagnetic and ground geophysical surveys |
The total land area of Maligreen is approximately
| 17 | Exploration and evaluation assets (continued) |
| (c) | Maligreen (continued) |
On November 7, 2022 the Company published an announcement and an updated technical report on SEDAR updating the estimated mineral resources at Maligreen. The report has an effective date of September 30, 2022 and estimates measured and indicated mineral resources of
| 18 | Property, plant and equipment |
| Cost | Land and Buildings | Right of use assets | Mine development, infrastructure and other | Assets under construction and decommissioning assets | Plant and equipment | Furniture and fittings | Motor vehicles | Solar Plant& | Total | ||||||||||||||||||
| Balance at January 1, 2022 | |||||||||||||||||||||||||||
| Additions* | |||||||||||||||||||||||||||
| Impairments@ | ( | ) | ( | ) | ( | ) | |||||||||||||||||||||
| Reallocations between asset classes | ( | ) | |||||||||||||||||||||||||
| Acquisition of Bilboes oxide assets (Tribute) (note 5) | |||||||||||||||||||||||||||
| Foreign exchange movement | ( | ) | ( | ) | ( | ) | ( | ) | |||||||||||||||||||
| Balance at December 31, 2022 | |||||||||||||||||||||||||||
| Balance at January 1, 2023 | |||||||||||||||||||||||||||
| Additions* | |||||||||||||||||||||||||||
| Impairments~ | ( | ) | ( | ) | ( | ) | |||||||||||||||||||||
| Disposals | ( | ) | ( | ) | |||||||||||||||||||||||
| Reallocations between asset classes | ( | ) | |||||||||||||||||||||||||
| Reallocate to assets held for sale | ( | ) | ( | ) | |||||||||||||||||||||||
| Foreign exchange movement | ( | ) | ( | ) | ( | ) | ( | ) | ( | ) | |||||||||||||||||
| Balance at December 31, 2023 |
| * | Included in additions is the change in estimate for the decommissioning asset of $ |
| @ | Included in the 2022 impairments are development asset costs of $ |
| & | The solar plant was fully commissioned on February 2, 2023 and the sale agreement between Caledonia Mining Corporation Plc and Caledonia Mining Services (Private) Limited was concluded for the sale of the solar plant. Depreciation on the solar plant commenced on February 2, 2023 and the power purchase agreement, between Caledonia Mining Services (Private) Limited and Blanket Mine, became effective. From September 28, 2023 the solar plant is classified as held for sale. In December 2022, the Caledonia board approved a proposal for Caledonia Mining Services (Private) Limited (which owns the solar plant) to issue loan notes pursuant to a loan note instrument (“bonds”) up to a value of $ |
| ~ | On June 27, 2023 the decision was taken to place the Bilboes oxide mine on care and maintenance as the cost related to removing the waste and accessing the orebody could exceed the benefit from the gold revenues to be received. The impairment loss that was recognised amounted to a carrying value of $ |
| 18 | Property, plant and equipment (continued) |
| Accumulated depreciation and Impairment losses | Land and | Right of | Mine | Assets under | Plant and | Furniture | Motor | Solar | Total | |||||||||||||||||||||||||||
| Balance at January 1, 2022 | ||||||||||||||||||||||||||||||||||||
| Depreciation for the year | ||||||||||||||||||||||||||||||||||||
| Accumulated depreciation - impairments | ( | ) | ( | ) | ( | ) | ||||||||||||||||||||||||||||||
| Foreign exchange movement | ( | ) | ( | ) | ( | ) | ( | ) | ||||||||||||||||||||||||||||
| Balance at December 31, 2022 | ||||||||||||||||||||||||||||||||||||
| Balance at January 1, 2023 | ||||||||||||||||||||||||||||||||||||
| Depreciation for the year | ||||||||||||||||||||||||||||||||||||
| Accumulated depreciation for assets reallocated to assets held for sale | ( | ) | ( | ) | ||||||||||||||||||||||||||||||||
| Accumulated depreciation - impairments | ( | ) | ( | ) | ( | ) | ||||||||||||||||||||||||||||||
| Foreign exchange movement | ( | ) | ( | ) | ( | ) | ( | ) | ||||||||||||||||||||||||||||
| Balance at December 31, 2023 | ||||||||||||||||||||||||||||||||||||
| Carrying amounts | ||||||||||||||||||||||||||||||||||||
| At December 31, 2022 | ||||||||||||||||||||||||||||||||||||
| At December 31, 2023 | ||||||||||||||||||||||||||||||||||||
| 18 | Property, plant and equipment (continued) |
| (a) | Impairment considerations |
At year end management identified indicators of impairment at the Blanket CGU. The Blanket CGU excluded the Solar plant that is classified as held for sale at December 31, 2023. No impairment indicators were identified at other CGUs nor at a consolidated level, excluding the Blanket CGU. In calculating the recoverable amount, of the Blanket CGU, the recoverable amount significantly exceeded the carrying value. Management used the following assumptions as their best estimate:
| ● | Gold price per ounce ranging from $ |
| ● | Life of mine (“LoM”) to 2041 (that is inclusive of inferred resources and it based on an internal estimate representing management’s best estimate of the LoM inclusive of the latest drilling results). |
| ● | grade ranging between to |
| ● | Production ounces between |
| ● | On mine cost of between $ |
| ● | Peak capex of $ |
| ● | Weighted average cost of capital of |
| ● | Income tax of |
Items of property, plant and equipment are depreciated over the LoM, which includes planned production from inferred resources. These inferred resources are included in the calculation when the economic recovery thereof is demonstrated by the achieved recovered grade relative to the mine’s pay limit for the period 2006 to 2018. The pay limit is 2.10 g/t (2022: 2.10 g/t) while the recovered grade has ranged from 2.96 g/t to 3.24 g/t over the period. All-in-sustaining-cost has remained consistently below the gold price received over this period resulting in economic recovery of the inferred resources.
| (b) | Change in estimate |
In April 2023 management performed an operational efficiency review of its mining related equipment, which resulted in changes in the expected useful life of some of the assets included under mine, development, infrastructure and other and plant and equipment asset classes.
| (i) | Mine, development, infrastructure and other |
In August 2015 the Blanket Mine announced the construction of a new central shaft going down to 1,200m from surface, providing access for horizontal development in two directions on three levels below 750m. The aim was to increase production to annual levels of
The Company estimates Blanket will produce
| 18 | Property, plant and equipment (continued) |
| (b) | Change in estimate |
| (ii) | Plant and equipment |
In carrying out a comprehensive asset’s useful life assessment, the following factors were considered in determining the useful life of an asset:
| ● | expected physical wear and tear, which depends on operational factors such as the number of shifts for which the asset is to be used, the current repair and maintenance programme, and the care and maintenance of the asset while idle; and |
| ● | the expected usage of the asset. |
An analysis of the various asset categories for which exceptions were identified during the assessment process are generators, load haul dump machines (“LHDs”), dump trucks, rock breakers and drill rigs. Previously estimated with a -year useful life, this plant and equipment is now estimated to have a useful life of years from April 1, 2023.
Notwithstanding any future addition to the above-mentioned assets, the effect of the change in useful life on actual and expected depreciation expense, effective for the year ended December 31, 2023, is as follows:
| Increase in depreciation expense from April 1, 2023 to December 31, 2023 | ||||
| Mine, development, infrastructure and other | ||||
| Plant and equipment | ||||
The above results are a change in estimates and applied prospectively from April 1, 2023.
| (c) | Non-cash items excluded from acquisition of property, plant and equipment: |
| 2023 | 2022 | |||||||
| Net property, plant and equipment included in prepayments | ( | ) | ||||||
| Net property, plant and equipment included in trade and other payables | ( | ) | ||||||
| Bilboes oxide project payable (note 29) | ( | ) | ||||||
| Change in estimate for decommissioning asset - adjustment capitalised in property, plant and equipment (note 18) | ( | ) | ||||||
| ( | ) | ( | ) | |||||
| (d) | Capital commitments |
The amount of contractual commitment for the acquisition of property, plant and equipment at December 31, 2023 amounted to $
| 19 | Leases |
Leases as lessee
The Group leases administrative offices. The leases, which the Group normally enters into, typically run for a period of
Information about leases for which the Group is a lessee is presented below.
| i) | Amounts recognised in the statement of financial position |
Right of use assets
Right of use assets related to leased properties are presented as part of property, plant and equipment (refer to note 18).
| 2023 | 2022 | |||||||
| Balance at January 1 | ||||||||
| Depreciation | ( | ) | ( | ) | ||||
| Foreign currency movement | ( | ) | ( | ) | ||||
| Balance at December 31 | ||||||||
Lease liabilities
| 2023 | 2022 | |||||||
| Balance at January 1 | ||||||||
| Additions to lease liability | ||||||||
| Finance cost | ||||||||
| Lease payments | ( | ) | ( | ) | ||||
| Foreign currency movement | ( | ) | ( | ) | ||||
| Balance at December 31 | ||||||||
| ii) | Amounts recognised in profit or loss |
| 2023 | 2022 | 2021 | ||||||||||
| Finance cost on lease liabilities (note 15) | ||||||||||||
| Unrealised foreign exchange gain | ( | ) | ||||||||||
| Depreciation (note 18) | ||||||||||||
| iii) | Amounts recognised in statement of cash flows |
| 2023 | 2022 | 2021 | ||||||||||
| Total cash outflow for leases - principal | ||||||||||||
| Total cash outflow for leases - finance cost | ||||||||||||
| Total cash outflow for leases - payments | ||||||||||||
| 19 | Leases (continued) |
| iv) | Maturity of lease liabilities |
The maturity of lease liabilities are as follows as at December 31:
| 2023 | 2022 | |||||||
| Less than one year | ||||||||
| One to two years | ||||||||
| Two to three years | ||||||||
| Total lease payments | ||||||||
| Finance cost | ( | ) | ( | ) | ||||
| Present value of lease liabilities | ||||||||
| 20 | Inventories |
| 2023 | 2022 | |||||||
| Consumable stores* | ||||||||
| Gold in progress @ | ||||||||
| * | Included in consumables stores is an amount of ($ |
| @ | Gold work in progress balance as at December 31, 2023 consists of |
| 21 | Trade and other receivables |
| 2023 | 2022 | |||||||
| Bullion sales receivable | ||||||||
| VAT receivables | ||||||||
| Solar - VAT and duty receivables* | ||||||||
| Deposits for stores, equipment and other receivables | ||||||||
The carrying value of trade receivables is considered a reasonable approximation of fair value and are short term in nature. No provision for expected credit losses was recognised in the current or prior period as none of the debtors were past due and there has been no doubtful debt on debtors (refer to note 33). Up to the date of approval of these financial statements all of the outstanding bullion sales receivable were settled in full. The Company offset VAT receivables equating to $
| * | On December 7, 2021 a duty rebate on the importation of capital goods was granted to the Company in terms of the Customs and Excise General Regulations of 2001. However, the customs officials at Forbes Border Post rejected a rebate on solar cables despite presentation of a valid rebate letter. An appeal was made to the Commissioner of Taxes seeking the rebate and the outcome of the appeal was unfavourable. |
| 22 | Prepayments |
| 2023 | 2022 | |||||||
| Caledonia Mining South Africa (Proprietary) Limited (“CMSA”) suppliers | ||||||||
| Blanket Mine third party suppliers | ||||||||
| Bilboes third party suppliers | ||||||||
| Solar prepayments | ||||||||
| Bilboes pre-effective date costs | ||||||||
| Other prepayments | ||||||||
| 23 | Cash and cash equivalents |
| 2023 | 2022 | |||||||
| Bank balances | ||||||||
| Restricted cash * | ||||||||
| Cash and cash equivalents | ||||||||
| Bank overdrafts and short term loans used for cash management purposes @ | ( | ) | ( | ) | ||||
| Net cash and cash equivalents | ( | ) | ||||||
| * | Cash of $ |
| @ | Interest paid on bank overdraft was $ |
| Date drawn | Expiry | Repayment | Principal | Balance drawn at December 31, | |
| Overdraft facilities and term loans | |||||
| Stanbic Bank - RTGS$ denomination | September 2023 | March 2024 | On demand |
| $Nil |
| Stanbic Bank - USD denomination | September 2023 | March 2024 | On demand |
|
|
| Ecobank - USD denomination | November 2022 | December 2024 | On demand |
|
|
| Nedbank Zimbabwe - USD denomination | December 2022 | April 2024 | On demand |
|
|
| Nedbank Zimbabwe term loan - USD denomination | April 2023 | April 2024 | On demand |
|
|
| CABS – USD denomination | August 2023 | July 2024 | On demand |
|
|
| 24 | Assets and liabilities associated with assets held for sale |
| 2023 | 2022 | |||||||
| Non-current assets held for sale | ||||||||
| Solar plant | – | |||||||
| Liabilities associated with assets held for sale | ||||||||
| Site restoration liability | – | |||||||
In the second quarter of 2023 management embarked on a marketing process to locate a buyer for the Company’s solar plant located next to Blanket Mine. Various offers were received and a counterparty with a non-binding offer was given exclusivity to further negotiate the sale of the plant after proving their ability to operate and fund solar plants of similar size and complexity. The offer was received from a reputable global renewable energy operator and management is in an advanced stage of executing agreements to sell the solar plant. It is proposed that the new owners will exclusively supply Blanket with electricity from the plant, on a take-or-pay basis and in doing so secure Blanket’s future power supply. This has the benefit of realising a cash profit on the sale of the plant and generate cash for reinvestment in our gold projects. In addition, management can focus on Caledonia’s core business of gold mining which yields higher returns to our shareholders.
On September 28, 2023 the Board approved management to negotiate the sale of the solar plant with the potential buyer. The assets were available for sale in their condition on September 28, 2023 and therefore met the criteria to be classified as held for sale.
Management determined the value at the carrying amount of $
| 25 | Share capital |
Authorised
Unlimited number of ordinary shares of
Unlimited number of preference shares of
Issued ordinary shares
| Number of | Amount | |||||||
| January 1, 2022 | ||||||||
| Shares issued: | ||||||||
| - share-based payment - employees (note 12.1(a)) | ||||||||
| December 31, 2022 | ||||||||
| Shares issued: | ||||||||
| - share-based payment - employees (note 12.1(a)) | ||||||||
| - equity raise* | ||||||||
| - Bilboes Gold Limited acquisition (note 5) | ||||||||
| December 31, 2023 | ||||||||
| * | Gross proceeds of $ Gross proceeds of $ During quarter one of 2023, Mark Learmonth, Chief Executive Officer, and Toziyana Resources Limited, a company affiliated with Victor Gapare, executive Director of the Company, subscribed for |
| 26 | Reserves |
Foreign currency translation reserve
The translation reserve comprises all foreign currency differences arising from the translation of the financial statements of foreign operations with functional currencies that differ from the presentation currency.
Share-based payment reserve
The share-based payment reserve comprises the fair value of equity instruments granted to employees, directors and service providers under share option plans (refer to note 12) and equity instruments issued to Blanket’s indigenous shareholders under Blanket Mine’s Indigenisation Transaction (refer note 6).
Contributed surplus
The contributed surplus reserve comprises the reduction in stated capital as approved by shareholders at the special general meeting on January 24, 2013 to be able to commence dividend payments.
Reserves
| 2023 | 2022 | |||||||
| Foreign currency translation reserve | ( | ) | ( | ) | ||||
| Contributed surplus | ||||||||
| Equity-settled share-based payment reserve | ||||||||
| Total | ||||||||
| 27 | Earnings per share |
| Weighted average number of shares – Basic earnings per share | ||||||||||||
| (in number of shares) | 2023 | 2022 | 2021 | |||||||||
| Issued shares at the beginning of year (note 25) | ||||||||||||
| Weighted average shares issued | ||||||||||||
| Weighted average number of shares at December 31 | ||||||||||||
| Weighted average number of shares - Diluted earnings per share | ||||||||||||
| (in number of shares) | 2023 | 2022 | 2021 | |||||||||
| Weighted average at December 31 | ||||||||||||
| Effect of dilutive options | ||||||||||||
| Weighted average number of shares (diluted) at December 31 | ||||||||||||
The average market value of the Company’s shares for purposes of calculating the dilutive effect of share options was based on quoted market prices for the year during which the options were outstanding. Options of
The quantity of options outstanding as at year end that were out of the money amounted to (2022: 2021: ) options.
| 27 | Earnings per share (continued) |
The calculation of total basic and diluted earnings per share for the year ended December 31, 2023 was calculated as follows:
| 2023 | 2022 | 2021 | ||||||||||
| Profit for the year attributable to owners of the Company (basic and diluted) | ( | ) | ||||||||||
| Blanket Mine Employee Trust Adjustment | ( | ) | ( | ) | ( | ) | ||||||
| Profit attributable to ordinary shareholders (basic and diluted) | ( | ) | ||||||||||
| Basic earnings per share - $ | ( | ) | ||||||||||
| Diluted earnings per share - $ | ( | ) | ||||||||||
Basic earnings are adjusted for the amounts that accrue to other equity holders of subsidiaries upon the full distribution of post-acquisition earnings to shareholders.
Diluted earnings are calculated on the basis that the unpaid ownership interests of Blanket Mine’s indigenous shareholders are effectively treated as options whereby the weighted average fair value for the period of the Blanket Mine shares issued to the indigenous shareholders and which are subject to settlement of the loan accounts is compared to the balance of the loan accounts and any excess portion is regarded as dilutive. The difference between the number of Blanket Mine shares subject to the settlement of the loan accounts and the number of Blanket Mine shares that would have been issued at the average fair value, is treated as the issue of shares for no consideration and regarded as dilutive shares. The calculated dilution is taken into account with additional earnings attributable to the dilutive shares in Blanket Mine, if any. The interest of the NIEEF shareholding was anti-dilutive (i.e., the value of the options was less than the outstanding loan balance). Accordingly, there was no adjustment to fully diluted earnings attributable to shareholders.
| 28 | Non-controlling interest |
Blanket Mine’s (incorporated in Zimbabwe) NCI share is recognised at an effective share and voting rights of
| 2023 | 2022 | 2021 | ||||||||||
| Current assets | ||||||||||||
| Non-current assets | ||||||||||||
| Current liabilities | ( | ) | ( | ) | ( | ) | ||||||
| Non-current liabilities | ( | ) | ( | ) | ( | ) | ||||||
| Net assets of Blanket Mine (100%) | ||||||||||||
| Carrying amount of NCI of 13.2% (2022: 13.2%, 2021: 13.2%) | ||||||||||||
| Revenue | ||||||||||||
| Profit after tax | ||||||||||||
| Total comprehensive income of Blanket Mine (100%) | ||||||||||||
| Profit allocated to NCI of 13.2% (2022: 13.2%, 2021: 13.2%) | ||||||||||||
| Dividend allocated to NCI of 13.2% (2022: 13.2%, 2021: 13.2%) | ( | ) | ( | ) | ( | ) | ||||||
| Net cash inflow from operating activities | ||||||||||||
| Net cash outflow from investing activities | ( | ) | ( | ) | ( | ) | ||||||
| Net cash outflow from financing activities | ( | ) | ( | ) | ( | ) | ||||||
| Net cash outflow | ( | ) | ( | ) | ( | ) | ||||||
| 29 | Provisions |
Site restoration
Site restoration relates to the estimated cost of closing down the mines and projects and represent the site and environmental restoration costs, estimated to be paid as a result of mining activities or previous mining activities. For the Blanket Mine site restoration costs are capitalsed in property, plant and equipment with an increase in the provision at the net present value of the estimated future and inflated cost of site rehabilitation. Subsequently the capitalized cost are amortised over the life of the mine and the provision is unwound over the period to estimated restoration. For properties in the exploration and evaluation phase, such as the Bilboes, Maligreen and Motapa projects, site restoration costs are capitalised in exploration and evaluation assets with an increase in the provision at the undiscounted value of the estimated cost of site rehabilitation. Subsequently the costs capitalised are not amortised and the provision is not unwound.
| Reconciliation of site restoration provision | 2023 | 2022 | ||||||
| Blanket Mine | ||||||||
| Balance January 1 | ||||||||
| Unwinding of discount (note 17) | ||||||||
| Change in estimate (Blanket Mine) (note 18) | ( | ) | ||||||
| Balance December 31 | ||||||||
| Motapa, Maligreen and Bilboes | ||||||||
| Balance January 1 | ||||||||
| Change in estimate (Motapa) (note 17) | ||||||||
| Change in estimate (Maligreen) (note 17) | ||||||||
| Acquisition - (Bilboes) (note 5) | ||||||||
| Balance December 31 | ||||||||
| Total balance December 31 | ||||||||
| Current | ||||||||
| Non-current | ||||||||
The discount rate in calculating the present value of the Blanket Mine provision is
The undiscounted gross rehabilitation costs for exploration and evaluation assets as at December 31, 2023, amounted to $
| 29 | Provisions (continued) |
| (a) | Change in estimate |
Amounts recorded for restoration and rehabilitation provision require management to estimate the future costs the Group will incur to complete the reclamation and remediation work required to comply with applicable laws and regulations as well as taking into consideration the timing of the reclamation activities and estimated discount rate. Future changes to environmental laws and regulations could increase the extent of reclamation and remediation work required to be performed by the Group. Increases in future costs could materially impact the amounts charged to operations for reclamation and remediation. The provision represents management’s best estimate of the present value of the future reclamation and remediation costs.
| (i) | Motapa and Maligreen |
Management performed a revised rehabilitation liability cost estimate during the fourth quarter of 2023.
The revised provision estimate of Motapa and Maligreen were capitalised as exploration and evaluation assets. The effect of the change in estimation was as follows:
| Increase in provision as at December 31, 2023 | ||||
| Motapa | ||||
| Maligreen | ||||
| 30 | Loan note instruments |
| Loan note instruments - finance costs | 2023 | 2022 | |||||||||
| Motapa loan notes | 30.1 | ||||||||||
| Solar loan notes | 30.2 | ||||||||||
| Loan note instruments - financial liabilities | 2023 | 2022 | |||||||||
| Motapa loan notes | 30.1 | ||||||||||
| Solar loan notes | 30.2 | ||||||||||
| Current | |||||||||||
| Non-current | |||||||||||
| 30 | Loan note instruments (continued) |
| 30.1 | Motapa loan notes payable |
On November 1, 2022 Caledonia, in connection with the Share Purchase Agreement, executed a loan note instrument to issue loan notes (“Loan note” or “Notes”) to Bulawayo Mining to acquire all the shares of Motapa Mining Company UK Limited (“Motapa”), along with its wholly owned subsidiary Arraskar Investments (Private) Limited (“Arraskar”). The shares were purchased with full title guarantee and free from all encumbrances, together with all rights attached or accruing to them. The Loan note certificates were issued by Caledonia on November 1, 2022.
The aggregate principal amount of the Loan notes were limited to million. Interest on the Loan notes was compounded monthly an interest rate of
All Loan notes repaid by Caledonia were immediately cancelled and were not reissued.
The fair value of the Loan notes payable at inception was estimated to be $
A summary of the Loan notes payable was as follows:
| 2023 | 2022 | |||||||
| Balance January 1 | ||||||||
| Fair value November 1, 2022 | ||||||||
| Finance cost accrued | ||||||||
| Repayment - principal | ( | ) | ||||||
| Repayment – finance cost paid | ( | ) | ||||||
| Balance December 31 | ||||||||
| Current | ||||||||
| Non-current | ||||||||
Refer to note 17 for more information on the exploration and evaluation asset acquired.
| 30 | Loan note instruments (continued) |
| 30.2 | Solar loan notes |
Following the commissioning of Caledonia’s wholly owned solar plant on February 2, 2023, the decision was taken to optimise the capital structure of the Group and provide additional debt instruments to the Zimbabwean financial market by way of issuing loan notes pursuant to a loan note instrument (“bonds”). The bonds were issued by the Zimbabwean registered entity owning the solar plant, Caledonia Mining Services (Private) Limited. The bonds carry a fixed interest rate of
A summary of the bonds is as follows:
| 2023 | 2022 | |||||||
| Balance January 1 | – | |||||||
| Amounts received | – | |||||||
| Transaction costs | ( | ) | – | |||||
| Finance cost accrued | – | |||||||
| Repayment - finance cost paid | ( | ) | – | |||||
| Balance December 31 | – | |||||||
| Current | – | |||||||
| Non-current | – | |||||||
| – | ||||||||
In April 2024, Caledonia Holdings Zimbabwe (Private) Limited, a wholly owned subsidiary of the Company, issued loan notes to the value of $
| 31 | Trade and other payables |
| 2023 | 2022 | |||||||
| Trade payables | ||||||||
| Electricity accrual | ||||||||
| Audit fee | ||||||||
| Dividends due | ||||||||
| Solar plant supplier accrual | ||||||||
| Bilboes oxide project payable | ||||||||
| Other payables | ||||||||
| Financial liabilities | ||||||||
| Production and management bonus accrual - Blanket Mine | ||||||||
| Other employee benefits - other | ||||||||
| Other employee benefits - settlements | ||||||||
| Leave pay | ||||||||
| Bonus provision | ||||||||
| Accruals | ||||||||
| Non-financial liabilities | ||||||||
| Total | ||||||||
| 32 | Cash flow information |
Non-cash items and information presented separately on the statements of cash flows statement:
| 2023 | 2022 | 2021 | ||||||||||
| Operating profit | ||||||||||||
| Adjustments for: | ||||||||||||
| Impairment of property, plant and equipment (note 18) | ||||||||||||
| Impairment of exploration and evaluation assets (note 17) | ||||||||||||
| Impairment of solar plant - VAT and duty receivables | ||||||||||||
| Unrealised foreign exchange gains (note 13) | ( | ) | ( | ) | ( | ) | ||||||
| Cash-settled share-based expense (note 12.1) | ||||||||||||
| Cash-settled share-based expense included in production costs (note 12.1) | ||||||||||||
| Cash portion of cash-settled share-based expense | ( | ) | ( | ) | ( | ) | ||||||
| Equity-settled share-based expense (note 11.2) | ||||||||||||
| Depreciation (note 18) | ||||||||||||
| Fair value loss on derivative instruments (note 14) | ||||||||||||
| Profit on disposal of property, plant and equipment (note 18) | ||||||||||||
| Derecognition of property, plant and equipment | ( | ) | ||||||||||
| Write down of inventory | ||||||||||||
| Expected credit losses on deferred consideration on the disposal of subsidiary | ||||||||||||
| Cash generated from operations before working capital changes | ||||||||||||
| Inventories | ( | ) | ( | ) | ||||||||
| Prepayments | ( | ) | ( | ) | ||||||||
| Trade and other receivables | ( | ) | ( | ) | ( | ) | ||||||
| Trade and other payables | ||||||||||||
| Cash generated from operations | ||||||||||||
| 33 | Financial Instruments and risk management |
The Group has exposure to the following risks from its use of financial instruments:
| ● | Credit risk; |
| ● | Liquidity risk; |
| ● | Market risk |
This note present information about the Group’s exposure to each of the above risks and the Group’s objectives, policies and processes for measuring and managing risk. Further quantitative disclosures are included throughout these consolidated financial statements. The Group is exposed in varying degrees to a variety of financial instrument related risks by virtue of its activities. The overall financial risk management program focuses on the preservation of capital and protecting current and future Group assets and cash flows by reducing exposure to risks posed by the uncertainties and volatilities of financial markets.
The Board of Directors has the responsibility to ensure that an adequate financial risk management policy is established and to approve the policy. The Group’s Audit Committee oversees management’s compliance with the Group’s financial risk management policy.
Gold price hedges were entered into to manage the possible effect of gold price fluctuations. The derivative financial instrument was entered into by the Company for economic hedging purposes and not as a speculative investment. The fair value of the Group’s financial instruments approximates their carrying value due to the short period to maturity.
The types of risk exposure and the way in which such exposures are managed are described below:
| (a) | Credit risk |
Exposure to credit risk
Credit risk includes the risk of a financial loss to the Group if a gold sales customer fails to meet its contractual obligation.
The carrying amount of financial assets as disclosed in the statements of financial position and related notes represents the maximum credit exposure. The maximum exposure to credit risk for trade and other receivables at the reporting date by geographic region was:
| Carrying amount | 2023 | 2022 | ||||||
| Zimbabwe | ||||||||
| Jersey, Channel Islands | ||||||||
| Other regions | ||||||||
Of the trade receivables balance at the end of the year, $
| 33 | Financial Instruments and risk management (continued) |
| (b) | Liquidity risk |
Liquidity risk is the risk that the Group does not have sufficient financial resources available to meet its obligations as they fall due. The Group manages its liquidity risk by ensuring sufficient cash availability to meet its likely cash requirements, after taking into account cash flows from operations and the Group’s holdings of cash and cash equivalents. The Group believes that these sources will be sufficient to cover the anticipated cash requirements. Senior management is also actively involved in the reviewing and approving of planned expenditures by regularly monitoring cash flows from operations and anticipated investing and financing activities.
The following are the contractual maturities of financial liabilities, including contractual interest payments.
Non-derivative financial liabilities
| December 31, 2023 | Carrying | Total | 12 months | |||||||||
| Trade and other payables | ||||||||||||
| Loan note payable | ||||||||||||
| Lease liabilities | ||||||||||||
| Overdraft and term loans | ||||||||||||
| December 31, 2022 | Carrying | Total | 12 months | |||||||||
| Trade and other payables | ||||||||||||
| Loan note payable | ||||||||||||
| Lease liabilities | ||||||||||||
| Overdraft and term loans | ||||||||||||
The Group regularly monitors its liquidity risk and evaluates the options available.
Sensitivity analysis
A reasonably possible strengthening (weakening) of the gold price will have an impact on the revenue of the Group and the fair value of the gold options at December 31, 2023. This would have affected the measurement of financial instruments by the amounts as indicated below. This analysis assumes that all other variables remain constant.
| 33 | Financial Instruments and risk management (continued) |
| (b) | Liquidity risk (continued) |
Sensitivity analysis (continued)
An increase or decrease of 5% of the gold price would have the following equal or opposite effect on the derivative financial instruments on December 31:
Consolidated statement of financial position:
| 2023 | 2022 | |||||||
| Derivative financial assets - Put option | ||||||||
| Increase by 5% of the gold price | ||||||||
| Decrease by 5% of the gold price | ||||||||
Consolidated statement of profit or loss and other comprehensive income:
| Fair value loss on derivative financial instruments | 2023 | 2022 | ||||||
| Derivative financial assets - Put option | ||||||||
| Increase by 5% of the gold price | ||||||||
| Decrease by 5% of the gold price | ||||||||
The Group’s revenues had full exposure to the gold price up to December 19, 2023 when the gold put option agreement was concluded (refer note 14.1).
| (c) | Market risk |
| (i) | Currency risk |
The Group is exposed to currency risk on inter-company sales and purchases that are denominated in a currency other than the respective functional currencies of Group entities. The Group does not use financial instruments to hedge its exposure to currency risk. To reduce exposure to currency transaction risk, the Group regularly reviews the currency (i.e. RTGS$ or foreign currency) in which it spends its cash to identify and avoid specific expenditures in currencies that experience inflationary pressures. The Group aims to maintain cash and cash equivalents in US Dollars to manage foreign exchange exposure.
The fluctuation of the US Dollar in relation to other currencies that entities within the Group may transact in will consequently have an effect upon the profitability of the Group and may also effect the value of the Group’s assets and liabilities. As noted below, the Group has certain financial assets and liabilities denominated in currencies other than the functional currency of the Company. To reduce exposure to currency transaction risk, the Group regularly reviews the currency in which it spends its cash to identify and avoid specific expenditures in currencies that experience inflationary pressures. Further, the Group aims to maintain cash and cash equivalents in US Dollars to avoid foreign exchange exposure and to meet short‐term liquidity requirements.
| 33 | Financial Instruments and risk management (continued) |
| (c) | Market risk (continued) |
| (i) | Currency risk (continued) |
Sensitivity analysis
As a result of the Group’s monetary assets and liabilities denominated in foreign currencies which is different to the functional currency of the underlying entities, the profit or loss and equity in the underlying entities could be affected by movements between the functional currency and the foreign currency. The table below indicates consolidated monetary assets/(liabilities) in the Group that have a different functional currency and foreign currency.
| 2023 | 2022 | |||||||||||||||
| $'000 | $'000 | |||||||||||||||
| Functional currency | Functional currency | |||||||||||||||
| ZAR | $ | ZAR | $ | |||||||||||||
| Cash and cash equivalents | ||||||||||||||||
| USD denominated | ||||||||||||||||
| ZAR denominated | ||||||||||||||||
| RTGS$ denominated | ||||||||||||||||
| GBP denominated | ||||||||||||||||
| CAD denominated | ||||||||||||||||
| Trade and other receivables - RTGS$ denominated | ||||||||||||||||
| Trade and other payables - RTGS$ denominated | ( | ) | ( | ) | ||||||||||||
| Overdraft and term loans - RTGS$ denominated | ||||||||||||||||
A reasonably possible strengthening or weakening of 5% of the various functional currencies against the foreign currencies would have the following equal or opposite effect on profit or loss and equity for the Group:
| 2023 | 2022 | |||||||||||||||
| $'000 | $'000 | |||||||||||||||
| Functional currency | Functional currency | |||||||||||||||
| ZAR | $ | ZAR | $ | |||||||||||||
| Cash and cash equivalents | ||||||||||||||||
| Trade and other receivables | ||||||||||||||||
| Trade and other payables | ( | ) | ( | ) | ||||||||||||
| Overdraft and term loans | ||||||||||||||||
| (ii) | Interest rate risk |
The Group's interest rate risk arises from loans and borrowings, overdraft facility, short term loans and cash held. The loans and borrowings, overdraft facility and cash held have variable interest rates. Variable rates expose the Group to cash flow interest rate risk. The Group has not entered into interest rate swap agreements and mitigates the interest rate risk by remaining in a positive consolidated net cash position.
| 33 | Financial Instruments and risk management (continued) |
| (c) | Market risk (continued) |
| (ii) | Interest rate risk (continued) |
The Group’s assets and liabilities exposed to interest rate fluctuations as at year end is summarised as follows:
| 2023 | 2022 | |||||||
| Cash and cash equivalents | ||||||||
| Overdraft and term loans | ( | ) | ( | ) | ||||
| ( | ) | |||||||
Interest rate risk arising from borrowings is offset by interest from available cash and cash equivalents. The table below summarises the effect of a change in finance cost on the Group’s profit or loss and equity, had the rates charged differed.
| Sensitivity analysis - Cash and cash equivalents | 2023 | 2022 | ||||||
| Increase by 100 basis points | ||||||||
| Decrease by 100 basis points | ( | ) | ( | ) | ||||
| Sensitivity analysis - Overdraft | ||||||||
| Increase by 100 basis points | ||||||||
| Decrease by 100 basis points | ( | ) | ( | ) | ||||
| 34 | Dividends |
| 2023 | 2022 | 2021 | ||||||||||
| Dividends declared to owners of the Company | ||||||||||||
| Dividends declared to NCI | ||||||||||||
| Dividends declared and paid to owners of the Company | ||||||||||||
| Dividends declared and paid to NCI | ||||||||||||
| Dividends declared and due to owners of the Company | ||||||||||||
| Dividends declared and due to NCI | ||||||||||||
A dividend was declared and paid in January 2024.
| 34 | Dividends (continued) |
Quarterly dividend per share history:
| Declaration date | cents per share | |
| January 14, 2021 | ||
| April 15, 2021 | ||
| July 15, 2021 | ||
| October 14, 2021 | ||
| January 13, 2022 | ||
| April 18, 2022 | ||
| July 14, 2022 | ||
| October 13, 2022 | ||
| December 30, 2022 | ||
| April 3, 2023 | ||
| June 29, 2023 | ||
| September 28, 2023 |
| 35 | Contingencies |
The Group may be subject to various claims that arise in the normal course of business. Management believes there are
| 36 | Related parties |
Directors of the company, as well as certain executives, are considered key management. For entities within the Group refer to note 37.
Employee contracts between CMSA, CHZ, the Company and key management include an option for respective key management to terminate such employee contracts in the event of a change in control of the Company and to receive a severance payment equal to months’ to years’ compensation. If this was triggered as at December 31, 2023 the severance payment would have amounted to $
| ● | the acquisition of more than 50% of the shares; or |
| ● | the acquisition of the right to exercise the majority of the voting rights of shares; or |
| ● | the acquisition of the right to appoint the majority of the board of directors; or |
| ● | the acquisition of more than 50% of the assets of the Group. |
| 36 | Related parties (continued) |
Key management personnel and director transactions:
A number of related parties transacted with the Group in the reporting period. The aggregate value of transactions and outstanding balances relating to key management personnel and entities over which they have control or significant influence were as follows:
| 2023 | 2022 | 2021 | ||||||||||
| Key management salaries | ||||||||||||
| Share-based awards* @ | ||||||||||||
| All other compensation & | ||||||||||||
| * | Amount inclusive of $ |
| @ | Employees, officers, directors, consultants and other service providers also participate in the OEICP (see note 12.1). |
| & | The Company entered into a consultancy agreement with SR Curtis, a director of the Company, effective July 1, 2022 until December 31, 2023 at a monthly fee of $ |
| Included is an amount of $ | |
| Included is an amount of $ |
$
Group entities are set out in note 37.
Refer to note 6 and note 28 for transactions with NCI.
Refer to note 38 for management fees between CMSA and Blanket Mine.
Refer to note 30 for details of the bonds and the Loan notes which were guaranteed by the Company and by Greenstone Management Services Holdings (UK) Limited respectively.
Refer to note 11 for director fees.
All related party transactions occurred at arm’s length.
| 37 | Group entities |
Intercompany balances with holding company
| Activity of | Functional | Country of | Legal | Intercompany | |||
| 2023 | 2022 | 2023 | 2022 | ||||
| Caledonia Holdings Zimbabwe (Private) Limited | Services | $ | Zimbabwe | | |
|
|
| Caledonia Mining Services (Private) Limited | Solar power provider | $ | Zimbabwe | | | | - |
| Fintona Investments Proprietary Limited | Dormant | ZAR | South Africa | | | | |
| Caledonia Mining South Africa Proprietary Limited | Procurement and services | ZAR | South Africa | | |
|
|
| Greenstone Management Services Holdings Limited | Investment holding | $ | United Kingdom | | |
|
|
| Blanket Mine (1983) (Private) Limited (2) | Mining | $ | Zimbabwe | | |
|
|
| Blanket Employee Trust Services (Private) Limited ("BETS") (1) | Employee trust | $ | Zimbabwe | - | - | - | - |
| Motapa Mining Company UK Limited | Investment holding | $ | United Kingdom | | | - | - |
| Arraskar Investments (Private) Limited | Exploration | $ | Zimbabwe | | | - | - |
| Bilboes Gold Limited | Investment holding | $ | Mauritius | | - | - | - |
| Bilboes Holdings (Private) Limited | Gold project | $ | United Kingdom | | - | | - |
| Caledonia Mining FZCO | Procurement | $ | Dubai | | - | | - |
| Caledonia (Connemara) (Private) Limited | Dormant | $ | Zimbabwe | | | - | - |
| Caledonia (Maligreen) (Private) Limited | Dormant | $ | Zimbabwe | | | - | - |
| Caledonia (Bilboes & Motapa) (Private) Limited | Dormant | $ | Zimbabwe | | - | - | - |
| (1) | BETS and the Community Trust are consolidated as structured entities. |
| (2) | Refer to note 6 for the effective shareholding. NCI has a |
| 37 | Group entities (continued) |
Intercompany transactions with holding company
| Loans advanced/ | Interest received | Foreign exchange | ||||||||||||||||
| 2023 | 2022 | 2023 | 2022 | 2023 | 2022 | |||||||||||||
| Caledonia Holdings Zimbabwe (Private) Limited | ( | ) | ( | ) | ||||||||||||||
| Caledonia Mining Services (Private) Limited | ||||||||||||||||||
| Fintona Investments Proprietary Limited | ||||||||||||||||||
| Caledonia Mining South Africa Proprietary Limited | ( | ) | ( | ) | ( | ) | ||||||||||||
| Greenstone Management Services Holdings Limited | ( | ) | ( | ) | ( | ) | ||||||||||||
| Blanket Mine (1983) (Private) Limited | ( | ) | ( | ) | ( | ) | ||||||||||||
| Blanket Employee Trust Services (Private) Limited ("BETS") | ||||||||||||||||||
| Motapa Mining Company UK Limited | ||||||||||||||||||
| Arraskar Investments (Private) Limited | ||||||||||||||||||
| Bilboes Gold Limited | ||||||||||||||||||
| Bilboes Holdings (Private) Limited | ||||||||||||||||||
| Caledonia Mining FZCO | ||||||||||||||||||
| Caledonia (Connemara) (Private) Limited | ||||||||||||||||||
| Caledonia (Maligreen) (Private) Limited | ||||||||||||||||||
| Caledonia (Bilboes & Motapa) (Private) Limited | ||||||||||||||||||
| ( | ) | ( | ) | ( | ) | |||||||||||||
| 38 | Operating Segments |
The Group's operating segments have been identified based on geographic areas. The strategic business units are managed separately because they require different technology and marketing strategies. For each of the strategic business units, the Group’s CEO reviews internal management reports on at least a quarterly basis. Blanket Mine, Bilboes oxide mine, exploration and evaluation assets (“E&E projects”) and South Africa describe the Group's reportable segments. The Blanket operating segment comprises Caledonia Holdings Zimbabwe (Private) Limited, Blanket Mine (1983) (Private) Limited, Blanket’s satellite projects and Caledonia Mining Services (Private) Limited (“CMS solar”). The Bilboes oxide mine segment comprises the oxide mining activities. The E&E projects segment includes the exploration and evaluation activities of the Bilboes sulphide project as well as the Motapa and Maligreen projects. The South African segment represents the sales made by Caledonia Mining South Africa Proprietary Limited to the Blanket Mine. The holding company (Caledonia Mining Corporation Plc) and Greenstone Management Services Holdings Limited (a UK company) are responsible for corporate administrative functions within the Group and contribute to the strategic decision making process of the CEO and are therefore included in the disclosure below and combined with corporate and other reconciling amounts that do not represent a separate segment. Information regarding the results of each reportable segment is included below.
| 38 | Operating Segments (continued) |
Performance is measured based on profit before income tax, as included in the internal management report that is reviewed by the Group's CEO. Segment profit or exploration and evaluation cost is used to measure performance as management believes that such information is the most relevant in evaluating the results of certain segments relative to other entities that operate within these industries. The accounting policies of the reportable segments are the same as the Group’s accounting policies.
Information about reportable segments
| For the twelve months ended December 31, 2023 | Blanket | South | Bilboes | E&E | Inter-group | Corporate | Total | |||||||||||||||||||||
| Revenue | ||||||||||||||||||||||||||||
| Inter-segmental revenue | ( | ) | ||||||||||||||||||||||||||
| Royalty | ( | ) | ( | ) | ( | ) | ||||||||||||||||||||||
| Production costs | ( | ) | ( | ) | ( | ) | ( | ) | ||||||||||||||||||||
| Depreciation | ( | ) | ( | ) | ( | ) | ( | ) | ||||||||||||||||||||
| Other income | ( | ) | ||||||||||||||||||||||||||
| Other expenses* | ( | ) | ( | ) | ( | ) | ||||||||||||||||||||||
| Administrative expenses | ( | ) | ( | ) | ( | ) | ( | ) | ( | ) | ( | ) | ||||||||||||||||
| Management fee | ( | ) | ( | ) | ||||||||||||||||||||||||
| Cash-settled share-based expense | ( | ) | ( | ) | ||||||||||||||||||||||||
| Equity-settled share-based expense | ( | ) | ( | ) | ||||||||||||||||||||||||
| Net foreign exchange (loss) gain | ( | ) | ( | ) | ( | ) | ( | ) | ||||||||||||||||||||
| Fair value loss on derivative liabilities | ( | ) | ( | ) | ||||||||||||||||||||||||
| Finance income | ||||||||||||||||||||||||||||
| Finance cost | ( | ) | ( | ) | ( | ) | ( | ) | ( | ) | ||||||||||||||||||
| Profit (loss) before tax | ( | ) | ( | ) | ( | ) | ( | ) | ||||||||||||||||||||
| Tax expense | ( | ) | ( | ) | ( | ) | ( | ) | ( | ) | ||||||||||||||||||
| Profit (loss) after tax | ( | ) | ( | ) | ( | ) | ( | ) | ( | ) | ( | ) | ||||||||||||||||
| * | Other expenses include impairment of plant and equipment of $ |
| 38 | Operating Segments (continued) |
| As at December 31, 2023 | Blanket | South | Bilboes | E&E | Inter-group | Corporate | Total | |||||||||||||||||||||
| Segment assets: | ||||||||||||||||||||||||||||
| Current (excluding intercompany, including assets held for sale) | ( | ) | ||||||||||||||||||||||||||
| Non-current (excluding intercompany) | ( | ) | ( | ) | ||||||||||||||||||||||||
| Assets held for sale (note 24) | ||||||||||||||||||||||||||||
| Expenditure on property, plant and equipment (note 18) | ( | ) | ( | ) | ||||||||||||||||||||||||
| Expenditure on evaluation and exploration assets (note 17) | ||||||||||||||||||||||||||||
| Intercompany balances | ( | ) | ( | ) | ||||||||||||||||||||||||
| Segment liabilities: | ||||||||||||||||||||||||||||
| Current (excluding intercompany) | ( | ) | ( | ) | ( | ) | ( | ) | ( | ) | ||||||||||||||||||
| Non-current (excluding intercompany) | ( | ) | ( | ) | ( | ) | ( | ) | ||||||||||||||||||||
| Intercompany balances | ( | ) | ( | ) | ( | ) | ( | ) | ||||||||||||||||||||
| For the twelve months ended December 31, 2022 | Blanket | South Africa | E&E | Inter-group | Corporate | Total | ||||||||||||||||||
| Revenue | – | |||||||||||||||||||||||
| Inter-segmental revenue | – | ( | ) | |||||||||||||||||||||
| Royalty | ( | ) | – | ( | ) | |||||||||||||||||||
| Production costs | ( | ) | ( | ) | – | ( | ) | |||||||||||||||||
| Depreciation | ( | ) | ( | ) | – | ( | ) | ( | ) | |||||||||||||||
| Other income | – | |||||||||||||||||||||||
| Other expenses* | ( | ) | ( | ) | – | ( | ) | ( | ) | |||||||||||||||
| Administrative expenses | ( | ) | ( | ) | – | ( | ) | ( | ) | |||||||||||||||
| Management fee | ( | ) | – | |||||||||||||||||||||
| Cash-settled share-based expense | – | ( | ) | ( | ) | |||||||||||||||||||
| Equity-settled share-based expense | – | ( | ) | ( | ) | |||||||||||||||||||
| Net foreign exchange gain (loss) | ( | ) | – | ( | ) | |||||||||||||||||||
| Fair value loss on derivative liabilities | – | ( | ) | ( | ) | |||||||||||||||||||
| Finance income | – | |||||||||||||||||||||||
| Finance cost | ( | ) | ( | ) | – | ( | ) | |||||||||||||||||
| Profit (loss) before tax | – | ( | ) | |||||||||||||||||||||
| Tax expense | ( | ) | ( | ) | – | ( | ) | ( | ) | |||||||||||||||
| Profit (loss) after tax | – | ( | ) | |||||||||||||||||||||
| * | Other expenses include impairment of plant and equipment of $ |
| 38 | Operating Segments (continued) |
| As at December 31, 2022 | Zimbabwe | South Africa | E&E | Inter-group | Corporate | Total | ||||||||||||||||||
| Segment assets: | ||||||||||||||||||||||||
| Current (excluding intercompany) | ( | ) | ||||||||||||||||||||||
| Non-current (excluding intercompany) | ( | ) | ||||||||||||||||||||||
| Expenditure on property, plant and equipment (note 18) | ( | ) | ( | ) | ||||||||||||||||||||
| Expenditure on evaluation and exploration assets (note 17) | ||||||||||||||||||||||||
| Intercompany balances | ( | ) | ||||||||||||||||||||||
| Segment liabilities: | ||||||||||||||||||||||||
| Current (excluding intercompany) | ( | ) | ( | ) | ( | ) | ( | ) | ||||||||||||||||
| Non-current (excluding intercompany) | ( | ) | ( | ) | ( | ) | ( | ) | ||||||||||||||||
| Intercompany balances | ( | ) | ( | ) | ( | ) | ||||||||||||||||||
Major customer
Revenues received from Fidelity amounted to $
The Group has made $
The Bullion trade receivables outstanding have been paid in full, after the year end.
| 39 | Defined Contribution Plan |
Under the terms of the Mining Industry Pension Fund (“Fund”) in Zimbabwe, eligible employees contribute a fixed percentage of their eligible earnings to the Fund. Blanket Mine makes a matching contribution plus an inflation levy as a fixed percentage of eligible earnings of these employees. The total contribution by Blanket Mine for the year ended December 31, 2023 was $
| 40 | Subsequent events |
There were no significant subsequent events between December 31, 2023 and the date of issue of these financial statements other than included in the preceding notes to the consolidated financial statements.
| 41 | Going concern |
The directors have, at the time of approving these consolidated financial statements, a reasonable expectation that Caledonia has adequate resources to continue in operational existence for the foreseeable future. Thus, they continue to adopt the going concern basis of accounting in preparing these consolidated financial statements.
SIGNATURE
The registrant hereby certifies that it meets all of the requirements for filing on Form 20-F and that it has duly caused and authorized the undersigned to sign this Annual Report on its behalf.
Date: May 15, 2024
| CALEDONIA MINING CORPORATION PLC |
||
| By: |
/s/ Chester Goodburn |
|
| Chester Goodburn Chief Financial Officer |
||
Exhibit 4.1
CALEDONIA MINING CORPORATION
2015 OMNIBUS EQUITY INCENTIVE COMPENSATION PLAN
(as amended by the Board on 8 August 2023)
TABLE OF CONTENTS
|
Page |
||
|
ARTICLE 1 ESTABLISHMENT, PURPOSE AND DURATION |
1 |
|
|
1.1 |
Establishment of the Plan |
1 |
|
1.2 |
Purpose of the Plan |
1 |
|
1.3 |
Duration of the Plan |
1 |
|
1.4 |
Successor Plan |
1 |
|
ARTICLE 2 DEFINITIONS |
1 |
|
|
ARTICLE 3 ADMINISTRATION |
8 |
|
|
3.1 |
General |
8 |
|
3.2 |
Authority of the Committee |
8 |
|
3.3 |
Delegation |
9 |
|
ARTICLE 4 SHARES SUBJECT TO THE PLAN AND MAXIMUM AWARDS |
9 |
|
|
4.1 |
Number of Shares Available for Awards |
9 |
|
4.2 |
Adjustments in Authorized Shares |
9 |
|
ARTICLE 5 ELIGIBILITY AND PARTICIPATION |
10 |
|
|
5.1 |
Eligibility |
10 |
|
5.2 |
Actual Participation |
10 |
|
ARTICLE 6 STOCK OPTIONS |
10 |
|
|
6.1 |
Grant of Options |
10 |
|
6.2 |
Award Agreement |
11 |
|
6.3 |
Option Price |
11 |
|
6.4 |
Duration of Options |
11 |
|
6.5 |
Exercise of Options |
11 |
|
6.6 |
Payment |
11 |
|
6.7 |
Restrictions on Share Transferability |
12 |
|
6.8 |
Death, Retirement and Termination of Employment |
12 |
|
6.9 |
Nontransferability of Options |
13 |
|
ARTICLE 7 SHARE APPRECIATION RIGHTS |
14 |
|
|
7.1 |
Grant of SARs |
14 |
|
7.2 |
SAR Agreement |
14 |
|
7.3 |
Term of SAR |
14 |
|
7.4 |
Exercise of Freestanding SARs |
14 |
|
7.5 |
Exercise of Tandem SARs |
14 |
|
7.6 |
Payment of SAR Amount |
14 |
|
7.7 |
Termination of Employment |
15 |
|
7.8 |
Nontransferability of SARs |
15 |
|
7.9 |
Other Restrictions |
15 |
|
ARTICLE 8 RESTRICTED SHARE AND RESTRICTED SHARE UNITS |
15 |
|
|
8.1 |
Grant of Restricted Shares or Restricted Share Units |
15 |
|
8.2 |
Restricted Share or Restricted Share Unit Agreement |
15 |
|
8.3 |
Nontransferability of Restricted Share and Restricted Share Units |
16 |
|
8.4 |
Other Restrictions |
16 |
|
8.5 |
Certificate Legend |
16 |
|
8.6 |
Voting Rights |
16 |
|
8.7 |
Dividends and Other Distributions |
17 |
|
8.8 |
Death, Retirement and other Termination of Employment |
17 |
|
8.9 |
Payment in Settlement of Restricted Share Units |
19 |
|
ARTICLE 9 DEFERRED SHARES UNITS |
20 |
|
|
9.1 |
Grant of Deferred Share Units |
20 |
|
9.2 |
Deferred Share Unit Agreement |
20 |
|
9.3 |
Nontransferability of Deferred Share Units |
20 |
|
9.4 |
Termination of Employment |
20 |
|
ARTICLE 10 PERFORMANCE SHARES AND PERFORMANCE UNITS |
20 |
|
|
10.1 |
Grant of Performance Shares and Performance Units |
20 |
|
10.2 |
Value of Performance Shares and Performance Units |
20 |
|
10.3 |
Earning of Performance Shares and Performance Units |
21 |
|
10.4 |
Form and Timing of Payment of Performance Shares and Performance Units |
21 |
|
10.5 |
Dividends and Other Distributions |
21 |
|
10.6 |
Death and other Termination of Employment |
21 |
|
10.7 |
Nontransferability of Performance Shares and Performance Units |
24 |
|
ARTICLE 11 FULL VALUE SHARE-BASED AWARDS |
24 |
|
|
11.1 |
Share-Based Awards |
24 |
|
11.2 |
Termination of Employment |
24 |
|
11.3 |
Nontransferability of Share-Based Awards |
24 |
|
ARTICLE 12 BENEFICIARY DESIGNATION |
25 |
|
|
12.1 |
Beneficiary |
25 |
|
12.2 |
Discretion of the Committee |
25 |
|
ARTICLE 13 RIGHTS OF PERSONS ELIGIBLE TO PARTICIPATE |
25 |
|
|
13.1 |
Employment |
25 |
|
13.2 |
Participation |
25 |
|
13.3 |
Rights as a Shareholder |
26 |
|
ARTICLE 14 CHANGE OF CONTROL |
26 |
|
|
14.1 |
Accelerated Vesting and Payment |
26 |
|
14.2 |
Alternative Awards |
26 |
|
ARTICLE 15 AMENDMENT, MODIFICATION, SUSPENSION AND TERMINATION |
26 |
|
|
15.1 |
Amendment, Modification, Suspension and Termination |
26 |
|
15.2 |
Adjustment of Awards Upon the Occurrence of Unusual or Nonrecurring Events |
28 |
|
15.3 |
Awards Previously Granted |
28 |
|
ARTICLE 16 WITHHOLDING |
28 |
|
|
16.1 |
Withholding |
28 |
|
16.2 |
Acknowledgement |
28 |
|
ARTICLE 17 SUCCESSORS |
28 |
|
|
ARTICLE 18 GENERAL PROVISIONS |
29 |
|
|
18.1 |
Forfeiture Events |
29 |
|
18.2 |
Legend |
29 |
|
18.3 |
Delivery of Title |
29 |
|
18.4 |
Investment Representations |
29 |
|
18.5 |
Uncertificated Shares |
30 |
|
18.6 |
Unfunded Plan |
30 |
|
18.7 |
No Fractional Shares |
30 |
|
18.8 |
Other Compensation and Benefit Plans |
30 |
|
18.9 |
No Constraint on Corporate Action |
30 |
|
18.10 |
Compliance with Canadian Securities Laws |
30 |
|
ARTICLE 19 LEGAL CONSTRUCTION |
31 |
|
|
19.1 |
Gender and Number |
31 |
|
19.2 |
Severability |
31 |
|
19.3 |
Requirements of Law |
31 |
|
19.4 |
Governing Law |
31 |
|
19.5 |
Compliance with Section 409A of the Code |
31 |
CALEDONIA MINING CORPORATION
2015 OMNIBUS EQUITY INCENTIVE COMPENSATION PLAN
ARTICLE 1
ESTABLISHMENT, PURPOSE AND DURATION
1.1 Establishment of the Plan. Caledonia Mining Corporation, a Canadian federal corporation (the “Company”), hereby establishes an incentive compensation plan to be known as the 2015 Omnibus Equity Incentive Compensation Plan (the “Plan”). The Plan permits the grant of Stock Options, Share Appreciation Rights, Restricted Shares, Restricted Share Units, Deferred Stock Units, Performance Shares, Performance Units and Share-Based Awards. The Plan shall be adopted and become effective on the date approved by the Board (the “Effective Date”), provided that no Awards may be exercised, paid or settled until the Plan has been approved by the shareholders of the Company and the Toronto Stock Exchange.
1.2 Purpose of the Plan. The purposes of the Plan are: (i) to promote a significant alignment between officers and employees of the Company and its Affiliates (as defined below) and the growth objectives of the Company; (ii) to associate a portion of participating employees’ compensation with the performance of the Company over the long term; and (iii) to attract, motivate and retain the critical employees to drive the business success of the Company.
1.3 Duration of the Plan. The Plan shall commence as of the Effective Date, as described in Section 1.1 herein, and shall remain in effect until terminated by the Board (as defined below) pursuant to Article 15 hereof.
1.4 Successor Plan. This Plan shall in respect of Options (as defined below) serve as the successor to the Company’s current Incentive Stock Option Plan dated April 10, 2007 (the “Predecessor Plan”), and no further awards shall be made under the Predecessor Plan from and after the Effective Date of this Plan. Each Option granted under the Predecessor Plan shall continue to be governed solely by the terms and conditions of the instrument evidencing such grant.
ARTICLE 2
DEFINITIONS
Whenever used in the Plan, the following terms shall have the respective meanings set forth below, unless the context clearly requires otherwise, and when such meaning is intended, such term shall be capitalized.
“Affiliate” means any corporation, partnership or other entity (i) in which the Company, directly or indirectly, has majority ownership interest or (ii) which the Company controls. For the purposes of this definition, the Company is deemed to “control” such corporation, partnership or other entity if the Company possesses, directly or indirectly, the power to direct or cause the direction of the management and policies of such corporation, partnership or other entity, whether through the ownership of voting securities, by contract or otherwise, and includes a corporation which is considered to be a subsidiary for purposes of consolidation under International Financial Reporting Standards.
- 2 -
“Award” means, individually or collectively, a grant under this Plan of Options, SARs, Restricted Shares, Restricted Share Units, Performance Shares, Performance Units or Share-Based Awards, in each case subject to the terms of this Plan.
“Award Agreement” means either (i) a written agreement entered into by the Company or an Affiliate of the Company and a Participant setting forth the terms and provisions applicable to Awards granted under this Plan; or (ii) a written statement issued by the Company or an Affiliate of the Company to a Participant describing the terms and provisions of such Award. All Award Agreements shall be deemed to incorporate the provisions of the Plan. An Award Agreement need not be identical to other Award Agreements either in form or substance.
“Beneficial Ownership” shall have the meaning ascribed to such term in Section 90 of the OSA.
“Blackout Period” means a period of time during which the Participant cannot sell Shares, due to applicable law or policies of the Company in respect of insider trading.
“Board” or “Board of Directors” means the Board of Directors of the Company.
“Cause” means any of:
|
(a) |
dishonesty of the Participant as it relates to the performance of his duties in the course of his employment by, or as an officer or director of, the Company or an Affiliate; |
|
(b) |
fraud committed by the Participant; |
|
(c) |
willful disclosure of confidential or private information regarding the Company or an Affiliate by the Participant; |
|
(d) |
the Participant aiding a competitor of the Company or an Affiliate; |
|
(e) |
misappropriation of a business opportunity of the Company or an Affiliate by the Participant; |
|
(f) |
willful misconduct or gross negligence in the performance of the Participant’s duties under his or her employment agreement; |
|
(g) |
a breach by the Participant of a material provision of his or her employment agreement or the Code of Business Conduct and Ethics adopted by the Company from time to time; |
|
(h) |
the willful and continued failure on the part of the Participant to substantially perform duties in the course of his employment by, or as an officer of, the Company or an Affiliate, unless such failure results from an incapacity due to mental or physical illness; |
|
(i) |
willfully engaging in conduct that is demonstrably and materially injurious to the Company or an Affiliate, monetarily or otherwise; or |
- 3 -
|
(j) |
any other act or omission by the Participant which would amount to just cause for termination at common law. |
“Change of Control” shall occur if any of the following events occur:
|
(a) |
the acquisition, directly or indirectly and by any means whatsoever, by any person, or by a group of persons acting jointly or in concert, of beneficial ownership or control or direction over that number of Voting Securities which is greater than 50% of the total issued and outstanding Voting Securities immediately after such acquisition, unless such acquisition arose as a result of or pursuant to: |
|
(i) |
an acquisition or redemption by the Company of Voting Securities which, by reducing the number of Voting Securities outstanding, increases the proportionate number of Voting Securities beneficially owned by such person to 50% or more of the Voting Securities then outstanding; |
|
(ii) |
acquisitions of Voting Securities which were made pursuant to a dividend reinvestment plan of the Company; |
|
(iii) |
the receipt or exercise of rights issued by the Company to all the holders of Voting Securities to subscribe for or purchase Voting Securities or securities convertible into Voting Securities, provided that such rights are acquired directly from the Company and not from any other person; |
|
(iv) |
a distribution by the Company of Voting Securities or securities convertible into Voting Securities for cash consideration made pursuant to a public offering or by way of a private placement by the Company ("Exempt Acquisitions"); |
|
(v) |
a stock-dividend, a stock split or other event pursuant to which such person receives or acquires Voting Securities or securities convertible into Voting Securities on the same pro rata basis as all other holders of securities of the same class ("Pro-Rata Acquisitions"); or |
|
(vi) |
the exercise of securities convertible into Voting Securities received by such person pursuant to an Exempt Acquisition or a Pro-Rata Acquisition ("Convertible Security Acquisitions"); |
provided, however, that if a person shall acquire 50% or more of the total issued and outstanding Voting Securities by reason of any one or a combination of (1) acquisitions or redemptions of Voting Shares by the Company, (2) Exempt Acquisitions, (3) Pro-Rata Acquisitions, or (4) Convertible Security Acquisitions and, after such share acquisitions or redemptions by the Company or Exempt Acquisitions or Pro-Rata Acquisitions or Convertible Security Acquisitions, acquires additional Voting Securities exceeding one per cent of the Voting Securities outstanding at the date of such acquisition other than
- 4 -
pursuant to any one or a combination of Exempt Acquisitions, Convertible Security Acquisitions or Pro-Rata Acquisitions, then as of the date of such acquisitions such acquisition shall be deemed to be a "Change of Control";
|
(b) |
the replacement by way of election or appointment at any time of one-half or more of the total number of the then incumbent members of the Board of Directors, unless such election or appointment is approved by 50% or more of the Board of Directors in office immediately preceding such election or appointment in circumstances where such election or appointment is to be made other than as a result of a dissident public proxy solicitation, whether actual or threatened; and |
|
(c) |
any transaction or series of transactions, whether by way of reorganization, consolidation, amalgamation, arrangement, merger, transfer, sale or otherwise, whereby all or substantially all of the shares or assets of the Company become the property of any other person (the “Successor Entity”), (other than a subsidiary of the Company) unless: |
|
(i) |
individuals who were holders of Voting Securities immediately prior to such transaction hold, as a result of such transaction, in the aggregate, more than 50% of the voting securities of the Successor Entity; |
|
(ii) |
a majority of the members of the board of directors of the Successor Entity is comprised of individuals who were members of the Board of Directors immediately prior to such transaction; and |
|
(iii) |
after such transaction, no person or group of persons acting jointly or in concert, holds more than 50% of the voting securities of the Successor Entity unless such person or group of persons held securities of the Company in the same proportion prior to such transaction. |
“Change of Control Price” means (i) the highest price per Share offered in conjunction with any transaction resulting in a Change of Control (as determined in good faith by the Committee if any part of the offered price is payable other than in cash), or (ii) in the case of a Change of Control occurring solely by reason of a change in the composition of the Board, the highest Fair Market Value of the Shares on any of the thirty (30) trading days immediately preceding the date on which a Change of Control occurs, except if the relevant participant is subject to taxation under the ITA such Change of Control price shall be deemed to be a price determined by the Committee based on the closing price of a Share on the TSX on the trading day preceding the Change of Control date or based on the volume weighted average trading price of the Shares on the TSX for the five trading days immediately preceding the Change of Control date.
“Code” means the U.S. Internal Revenue Code of 1986, as amended from time to time, or any successor thereto.
“Committee” means the Board of Directors or if so delegated in whole or in part by the Board, the Compensation Committee of the Board of Directors, or any other duly authorized committee of the Board appointed by the Board to administer the Plan or.
- 5 -
“Company” means Caledonia Mining Corporation, a Canadian federal corporation, and any successor thereto as provided in Article 17 herein.
“Consultant” means a Person that:
|
(i) |
is engaged to provide services to the Company or an Affiliate other than services provided in relation to a distribution of securities of the Company or an Affiliate; |
|
(ii) |
provides the services under a written contract with the Company or an Affiliate; and |
|
(iii) |
spends or will spend a significant amount of time and attention on the affairs and business of the Company or an Affiliate; |
provided that with respect to Consultants who are U.S. Persons, such Consultants shall be granted Awards under this Plan only if:
|
(i) |
they are natural persons; |
|
(ii) |
they provide bona fide services to the Company or its majority-owned subsidiaries; and |
|
(iii) |
such services are not in connection with the offer or sale of securities in a capital-raising transaction, and do not directly or indirectly promote or maintain a market for the Company’s securities. |
“Deferred Share Unit” means an Award denominated in units that provides the holder thereof with a right to receive Shares or cash or a combination thereof upon settlement of the Award, granted under Article 9 herein and subject to the terms of this Plan.
“Director” means any individual who is a member of the Board of Directors of the Company.
“Disability” means the Participant’s inability to substantially fulfil his or her duties on behalf of the Company or an Affiliate for a continuous period of six (6) months or more or the Participant’s inability to substantially fulfil his or her duties on behalf of the Company or an Affiliate for an aggregate period of six (6) months or more during any consecutive twelve (12) month period; and if there is any disagreement between the Company or an Affiliate and the Participant as to the Participant’s Disability or as to the date any such Disability began or ended, the same shall be determined by a physician mutually acceptable to the Company and the Participant whose determination shall be conclusive evidence of any such Disability and of the date any such Disability began or ended.
“Dividend Equivalent” means a right with respect to an Award to receive cash, Shares or other property equal in value and form to dividends declared by the Board and paid with respect to outstanding Shares. Dividend Equivalents shall not apply to an Award unless specifically provided for in the Award Agreement, and if specifically provided for in the Award Agreement
- 6 -
shall be subject to such terms and conditions set forth in the Award Agreement as the Committee shall determine.
“Employee” means any employee of the Company or an Affiliate. Directors who are not otherwise employed by the Company or an Affiliate shall not be considered Employees under this Plan.
“Fair Market Value” or “FMV” means, unless otherwise required by any applicable provision of the Code or any regulations thereunder or by any applicable accounting standard for the Company’s desired accounting for Awards or by the rules of the TSX, a price that is determined by the Committee, provided that such price cannot be less than the greater of (i) the volume weighted average trading price of the Shares for the five trading days immediately prior to the grant date or (ii) the closing price of the Shares on the trading day immediately prior to the grant date in each case as quoted on either the TSX, NYSE American or AIM as specified in the applicable Award Agreement.
“Fiscal Year” means the Company’s fiscal year commencing on January 1 and ending on December 31 or such other fiscal year as approved by the Board.
“Freestanding SAR” means a SAR that is not a Tandem SAR, as described in Article 7 herein.
“Grant Price” means the price against which the amount payable is determined upon exercise of a SAR.
“Insider” shall have the meaning ascribed thereto in Section 1(1) of the OSA.
“ITA” means the Income Tax Act (Canada).
“Non-Employee Director” means a Director who is not an Employee.
“Notice Period” means any period of contractual notice or reasonable notice that the Company or the Affiliate may be required at law, by contract or otherwise agrees to provide to a Participant upon termination of employment, whether or not the Company or Affiliate elects to pay severance in lieu of providing notice to the Participant, provided that where a Participant’s employment contract provides for an increased severance or termination payment in the event of termination following a Change of Control, the Notice Period for the purposes of the Plan shall be the Notice Period under such contract applicable to a termination which does not follow a Change of Control.
“Option” means the conditional right to purchase Shares at a stated Option Price for a specified period of time subject to the terms of this Plan.
“Option Price” means the price at which a Share may be purchased by a Participant pursuant to an Option, as determined by the Committee.
“OSA” means the Securities Act (Ontario), as may be amended from time to time.
- 7 -
“Participant” means an Employee, Non-Employee Director or Consultant who has been selected to receive an Award, or who has an outstanding Award granted under the Plan.
“Performance-Based Compensation” means compensation under an Award that is granted in order to provide remuneration solely on account of the attainment of one or more Performance Goals under circumstances that satisfy the requirements of Section 162(m) of the Code.
“Performance Goal” means a performance criterion selected by the Committee for a given Award.
“Performance Period” means the period of time during which the assigned performance criteria must be met in order to determine the degree of payout and/or vesting with respect to an Award.
“Performance Share” means an Award granted under Article 10 herein and subject to the terms of this Plan, denominated in Shares, the value of which at the time it is payable is determined as a function of the extent to which corresponding performance criteria have been achieved.
“Performance Unit” means an Award granted under Article 10 herein and subject to the terms of this Plan, denominated in units, the value of which at the time it is payable is determined as a function of the extent to which corresponding performance criteria have been achieved.
“Period of Restriction” means the period when an Award of Restricted Share or Restricted Share Units is subject to forfeiture based on the passage of time, the achievement of performance criteria, and/or upon the occurrence of other events as determined by the Committee, in its discretion.
“Person” shall have the meaning ascribed to such term in Section 1(1) of the OSA.
“Restricted Share” means an Award of Shares subject to a Period of Restriction, granted under Article 8 herein and subject to the terms of this Plan.
“Restricted Share Unit” means an Award denominated in units subject to a Period of Restriction, with a right to receive Shares or cash or a combination thereof upon settlement of the Award, granted under Article 8 herein and subject to the terms of this Plan.
“Retirement” or “Retire” means a Participant’s permanent withdrawal from employment or office with the Company or Affiliate on terms and conditions accepted and determined by the Board.
“Shares” means common shares of the Company.
“Share Appreciation Right” or “SAR” means the conditional right to receive the difference between the FMV of a Share on the date of exercise over the Grant Price, pursuant to the terms of Article 7 herein and subject to the terms of this Plan.
“Share-Based Award” means an equity-based or equity-related Award granted under Article 11 herein and subject to the terms of this Plan, and not otherwise described by the terms of this Plan.
- 8 -
“Successor Entity” has the meaning ascribed thereto under subsection (c) of the definition of Change of Control.
“Tandem SAR” means a SAR that the Committee specifies is granted in connection with a related Option pursuant to Article 7 herein and subject to the terms of this Plan, the exercise of which shall require forfeiture of the right to purchase a Share under the related Option (and when a Share is purchased under the Option, the Tandem SAR shall similarly be cancelled) or a SAR that is granted in tandem with an Option but the exercise of such Option does not cancel the SAR, but rather results in the exercise of the related SAR. Regardless of whether an Option is granted coincident with a SAR, a SAR is not a Tandem SAR unless so specified by the Committee at the time of grant.
“Total Share Authorization” has the meaning ascribed thereto under Section 4.1.
“TSX” means the Toronto Stock Exchange and at any time the Shares are not listed and posted for trading on the TSX, shall be deemed to mean such other stock exchange or trading platform upon which the Shares trade and which has been designated by the Committee.
“Voting Power” shall mean such number of Voting Securities as shall enable the holders thereof to cast all the votes which could be cast in an annual election of directors of a company.
“Voting Securities” shall mean any securities of the Company ordinarily carrying the right to vote at elections of directors and any securities immediately convertible into or exchangeable for such securities.
ARTICLE 3
ADMINISTRATION
3.1 General. The Committee shall be responsible for administering the Plan. The Committee may employ attorneys, consultants, accountants, agents and other individuals, any of whom may be an Employee, and the Committee, the Company, and its officers and Directors shall be entitled to rely upon the advice, opinions or valuations of any such persons. All actions taken and all interpretations and determinations made by the Committee shall be final, conclusive and binding upon the Participants, the Company, and all other interested parties.
3.2 Authority of the Committee. The Committee shall have full and exclusive discretionary power to interpret the terms and the intent of the Plan and any Award Agreement or other agreement ancillary to or in connection with the Plan, to determine eligibility for Awards, and to adopt such rules, regulations and guidelines for administering the Plan as the Committee may deem necessary or proper. Such authority shall include, but not be limited to, selecting Award recipients, establishing all Award terms and conditions, including grant, exercise price, issue price and vesting terms, determining Performance Goals applicable to Awards and whether such Performance Goals have been achieved, and, subject to Article 15, adopting modifications and amendments, or subplans to the Plan or any Award Agreement, including, without limitation, any that are necessary or appropriate to comply with the laws or compensation practices of the jurisdictions in which the Company and Affiliates operate.
- 9 -
3.3 Delegation. The Committee may delegate to one or more of its members any of the Committee’s administrative duties or powers as it may deem advisable; provided, however, that any such delegation must be permitted under applicable corporate law.
ARTICLE 4
SHARES SUBJECT TO THE PLAN AND MAXIMUM AWARDS
4.1 Number of Shares Available for Awards. Subject to adjustment as provided in Section 4.2 herein, the number of Shares hereby reserved for issuance to Participants under the Plan, together with Shares reserved for issue under any other share compensation arrangements of the Company, shall not exceed the number which represents 10% of the issued and outstanding Shares from time to time (the “Total Share Authorization”). Subject to applicable law, the requirements of the TSX and any shareholder or other approval which may be required, the Board may in its discretion amend the Plan to increase such limit without notice to any Participants.
The number of Shares reserved for issue to Insiders pursuant to this Plan, together with Shares reserved for issue to Insiders under any other share compensation arrangements of the Company, shall not exceed 10% of the aggregate outstanding Shares of the Company. Within any one-year period, the number of Shares issued to Insiders pursuant to this Plan and all other share compensation arrangements of the Company shall not exceed 10% of the aggregate outstanding Shares of the Company. If the number of Shares shall be increased or decreased as a result of a stock split, consolidation reclassification or recapitalization and not as a result of the issuance of Shares for additional consideration or by way of a stock dividend in the ordinary course, the Company may make appropriate adjustments to the maximum number of Shares which may be issued from the treasury of the Company under the Plan.
This Plan is an “evergreen” plan whereby the number of Shares equivalent to the number of Awards and securities of any other share compensation arrangements that have been issued, exercised, terminated, cancelled, redeemed, repurchased or expired, at any time, are immediately re-reserved for issuance under the Plan and available for future issuances subject to the limits contained herein.
4.2 Adjustments in Authorized Shares. In the event of any corporate event or transaction (collectively, a “Corporate Reorganization”) (including, but not limited to, a change in the Shares of the Company or the capitalization of the Company) such as a merger, arrangement, amalgamation, consolidation, reorganization, recapitalization, separation, stock dividend, extraordinary dividend, stock split, reverse stock split, split up, spin-off or other distribution of stock or property of the Company, combination of securities, exchange of securities, dividend in kind, or other like change in capital structure or distribution (other than normal cash dividends) to shareholders of the Company, or any similar corporate event or transaction, the Committee shall make or provide for such adjustments or substitutions, as applicable, in the number and kind of Shares that may be issued under the Plan, the number and kind of Shares subject to outstanding Awards, the Option Price or Grant Price applicable to outstanding Awards, the Total Share Authorization, the limit on issuing Awards other than Options granted with an Option Price equal to at least the FMV of a Share on the date of grant or Share Appreciation Rights with a Grant Price equal to at least the FMV of a Share on the date of
- 10 -
grant, and any other value determinations applicable to outstanding Awards or to this Plan, as are equitably necessary to prevent dilution or enlargement of Participants’ rights under the Plan that otherwise would result from such corporate event or transaction. In connection with a Corporate Reorganization, the Committee shall have the discretion to permit a holder of Options to purchase (at the times, for the consideration, and subject to the terms and conditions set out in this Plan) and the holder will then accept on the exercise of such Option, in lieu of the Shares that such holder would otherwise have been entitled to purchase, the kind and amount of shares or other securities or property that such holder would have been entitled to receive as a result of the Corporate Reorganization if, on the effective date thereof, that holder had owned all Shares that were subject to the Option. Such adjustments shall be made automatically, without the necessity of Committee action, on the customary arithmetical basis in the case of any stock split, including a stock split effected by means of a stock dividend, and in the case of any other dividend paid in Shares.
The Committee shall also make appropriate adjustments in the terms of any Awards under the Plan as are equitably necessary to reflect such corporate event or transaction and may modify any other terms of outstanding Awards, including modifications of performance criteria and changes in the length of Performance Periods. The determination of the Committee as to the foregoing adjustments, if any, shall be conclusive and binding on Participants under the Plan, provided that any such adjustments must comply with Section 409A of the Code with respect to any U.S. Participants.
Subject to the provisions of Article 13 and any applicable law or regulatory requirement, without affecting the number of Shares reserved or available hereunder, the Committee may authorize the issuance, assumption, substitution or conversion of Awards under this Plan in connection with any such corporate event or transaction, upon such terms and conditions as it may deem appropriate. Additionally, the Committee may amend the Plan, or adopt supplements to the Plan, in such manner as it deems appropriate to provide for such issuance, assumption, substitution or conversion as provided in the previous sentence.
ARTICLE 5
ELIGIBILITY AND PARTICIPATION
5.1 Eligibility. Individuals eligible to participate in the Plan include all Employees, Non-Employee Directors and Consultants.
5.2 Actual Participation. Subject to the provisions of the Plan, the Committee may, from time to time, in its sole discretion select from among eligible Employees, Non-Employee Directors and Consultants, those to whom Awards shall be granted under the Plan, and shall determine in its discretion the nature, terms, conditions and amount of each Award.
ARTICLE 6
STOCK OPTIONS
6.1 Grant of Options. Subject to the terms and provisions of the Plan, Options may be granted to Participants in such number, and upon such terms, and at any time and from time to time as shall be determined by the Committee in its discretion.
- 11 -
6.2 Award Agreement. Each Option grant shall be evidenced by an Award Agreement that shall specify the Option Price, the duration of the Option, the number of Shares to which the Option pertains, the conditions upon which an Option shall become vested and exercisable, and any such other provisions as the Committee shall determine.
6.3 Option Price. The Option Price for each grant of an Option under this Plan shall be determined by the Committee and shall be specified in the Award Agreement. The Option Price for an Option shall be not less than the FMV of the Shares on the date of grant.
6.4 Duration of Options. Each Option granted to a Participant shall expire at such time as the Committee shall determine at the time of grant; provided, however, that no Option shall be exercisable later than the tenth (10th) anniversary date of its grant. Notwithstanding the foregoing, the expiry date of any Option shall be extended to the tenth business day following the last day of a Blackout Period if the expiry date would otherwise occur in a Blackout Period or within five days of the end of the Blackout Period.
6.5 Exercise of Options. Options granted under this Article 6 shall be exercisable at such times and on the occurrence of such events, and be subject to such restrictions and conditions, as the Committee shall in each instance approve, which need not be the same for each grant or for each Participant.
6.6 Payment. Options granted under this Article 6 shall be exercised by the delivery of a notice of exercise to the Company or an agent designated by the Company in a form specified or accepted by the Committee, or by complying with any alternative procedures which may be authorized by the Committee, setting forth the number of Shares with respect to which the Option is to be exercised, accompanied by full payment for the Shares (subject to the application of any cashless exercise procedures accepted by the Committee.
The Option Price upon exercise of any Option shall be payable to the Company in full either: (a) in cash, certified cheque or wire transfer; or (b) by any other method approved or accepted by the Committee in its sole discretion subject to the rules of the TSX and such rules and regulations as the Committee may establish. Such methods may include cashless exercise and settlement.
Subject to Section 6.7 and any governing rules or regulations, as soon as practicable after receipt of a notification of exercise and full payment for the Shares, the Shares in respect of which the Option has been exercised shall be issued as fully-paid and non-assessable shares of the Company. As of the business day the Company receives such notice and such payment, the Participant (or the person claiming through him, as the case may be) shall be entitled to be entered on the share register of the Company as the holder of the number of Shares in respect of which the Option was exercised and to receive as promptly as possible thereafter a certificate or evidence of book entry representing the said number of Shares. The Company shall cause to be delivered to or to the direction of the Participant Share certificates or evidence of book entry Shares in an appropriate amount based upon the number of Shares purchased under the Option(s), but in any event, on or before the 15th day of the third month of the year following the year in which the Option was exercised.
- 12 -
6.7 Restrictions on Share Transferability. The Committee may impose such restrictions on any Shares acquired pursuant to the exercise of an Option granted pursuant to this Plan as it may deem advisable, including, without limitation, requiring the Participant to hold the Shares acquired pursuant to exercise for a specified period of time, or restrictions under applicable laws or under the requirements of any stock exchange or market upon which such Shares are listed and/or traded.
6.8 Death, Retirement and Termination of Employment.
|
(a) |
Death: If a Participant dies while an Employee, Director of, or Consultant to, the Company or an Affiliate: |
|
(i) |
the executor or administrator of the Participant’s estate may exercise Options of the Participant equal to the number of Options that were exercisable at the Termination Date (as defined at Section 6.8(d) below); |
|
(ii) |
the right to exercise such Options terminates on the earlier of: (i) the date that is 12 months after the Termination Date; and (ii) the date on which the exercise period of the particular Option expires. Any Options held by the Participant that are not yet vested at the Termination Date immediately expire and are cancelled and forfeited to the Company on the Termination Date; and |
|
(iii) |
such Participant’s eligibility to receive further grants of Options under the Plan ceases as of the Termination Date. |
|
(b) |
Retirement: If a Participant voluntarily Retires then: |
|
(i) |
any Options held by the Participant that are exercisable at the Termination Date continue to be exercisable by the Participant until the earlier of: (i) the date that is six months after the Termination Date; and (ii) the date on which the exercise period of the particular Option expires. Any Options held by the Participant that are not yet vested at the Termination Date immediately expire and are cancelled and forfeited to the Company on the Termination Date, |
|
(ii) |
the eligibility of a Participant to receive further grants under the Plan ceases as of the date that the Company or an Affiliate, as the case may be, provides the Participant with written notification that the Participant’s employment or term of office or engagement, is terminated, notwithstanding that such date may be prior to the Termination Date, and |
|
(iii) |
notwithstanding (b)(i) and (ii) above, unless the Committee, in its sole discretion, otherwise determines, at any time and from time to time, Options are not affected by a change of employment arrangement within or among the Company or an Affiliate for so long as the Participant continues to be an employee of the Company or an Affiliate. |
- 13 -
|
(c) |
Termination of Employment: Where a Participant’s employment or term of office or engagement terminates (for any reason other than death or voluntary Retirement (whether such termination occurs with or without any or adequate notice or reasonable notice, or with or without any or adequate compensation in lieu of such notice)), then: |
|
(i) |
any Options held by the Participant that are exercisable at the Termination Date continue to be exercisable by the Participant until the earlier of: (i) the date that is three months after the Termination Date; and (ii) the date on which the exercise period of the particular Option expires. Any Options held by the Participant that are not yet vested at the Termination Date immediately expire and are cancelled and forfeited to the Company on the Termination Date, |
|
(ii) |
the eligibility of a Participant to receive further grants under the Plan ceases as of the date that the Company or an Affiliate, as the case may be, provides the Participant with written notification that the Participant’s employment or term of office or engagement, is terminated, notwithstanding that such date may be prior to the Termination Date, and |
|
(iii) |
notwithstanding (c)(i) and (ii) above, unless the Committee, in its sole discretion, otherwise determines, at any time and from time to time, Options are not affected by a change of employment arrangement within or among the Company or an Affiliate for so long as the Participant continues to be an employee of the Company or an Affiliate. |
|
(d) |
For purposes of section 6.8, the term, “Termination Date” means, in the case of a Participant whose employment or term of office or engagement with the Company or an Affiliate terminates: |
|
(i) |
by reason of the Participant’s death, the date of death; |
|
(ii) |
for any reason whatsoever other than death, the date of the Participant’s last day actively at work for or actively engaged by the Company or the Affiliate, as the case may be; and for greater certainty “Termination Date” in any such case specifically does not mean the date on which any period of contractual notice or reasonable notice that the Company or the Affiliate, as the case may be, may be required at law to provide to a Participant would expire; and |
|
(iii) |
the resignation of a director shall be considered to be a Retirement whereas the expiry of a director’s term on the Board without re-election (or nomination for election) shall be considered to be a termination of his or her term of office. |
6.9 Nontransferability of Options. Except as otherwise provided in a Participant’s Award Agreement at the time of grant or thereafter by the Committee, an Option granted under
- 14 -
this Article 6 may not be sold, transferred, pledged, assigned, or otherwise alienated or hypothecated, other than by will or by the laws of descent and distribution. Further, except as otherwise provided in a Participant’s Award Agreement at the time of grant or thereafter by the Committee, all Options granted to a Participant under this Article 6 shall be exercisable during such Participant’s lifetime only by such Participant.
ARTICLE 7
SHARE APPRECIATION RIGHTS
7.1 Grant of SARs. Subject to the terms and conditions of the Plan, SARs may be granted to Participants at any time and from time to time and upon such terms as shall be determined by the Committee in its discretion. The Committee may grant Freestanding SARs, Tandem SARs, or any combination of these forms of SARs.
The SAR Grant Price for each grant of a Freestanding SAR shall be determined by the Committee and shall be specified in the Award Agreement. The SAR Grant Price may include a Grant Price based on one hundred percent (100%) of the FMV of the Shares on the date of grant, a Grant Price that is set at a premium to the FMV of the Shares on the date of grant, or is indexed to the FMV of the Shares on the date of grant, with the index determined by the Committee, in its discretion, provided that the Grant Price may never be less than the FMV of the Shares on the date of Grant. The Grant Price of Tandem SARs shall be equal to the Option Price of the related Option.
7.2 SAR Agreement. Each SAR Award shall be evidenced by an Award Agreement that shall specify the Grant Price, the term of the SAR, and any such other provisions as the Committee shall determine.
7.3 Term of SAR. The term of a SAR granted under the Plan shall be determined by the Committee, in its sole discretion, and except as determined otherwise by the Committee and specified in the SAR Award Agreement, no SAR shall be exercisable later than the tenth (10th) anniversary date of its grant. Notwithstanding the foregoing, the expiry date of any SAR shall be extended to the tenth business day following the last day of a Blackout Period if the expiry date would otherwise occur in a Blackout Period or within five days of the end of the Blackout Period.
7.4 Exercise of Freestanding SARs. Freestanding SARs may be exercised upon whatever terms and conditions the Committee, in its sole discretion, imposes.
7.5 Exercise of Tandem SARs. With respect to Participants who are not subject to taxation under the ITA, Tandem SARs may be exercised for all or part of the Shares subject to the related Option upon the surrender of the right to exercise the equivalent portion of the related Option. With respect to Participants subject to taxation under the ITA, prior to exercising a Tandem SAR the Participant must elect to receive the Tandem SAR in consideration for the disposition of that Participant’s right to receive shares under the Option. A Tandem SAR may be exercised only with respect to the Shares for which its related Option is then exercisable.
7.6 Payment of SAR Amount. Upon the exercise of a SAR, a Participant shall be entitled to receive payment from the Company in an amount representing the difference between
- 15 -
the FMV of the underlying Shares on the date of exercise over the Grant Price. At the discretion of the Committee, the payment upon SAR exercise may be in cash, Shares of equivalent value (based on the FMV on the date of exercise of the SAR, as defined in the Award Agreement or otherwise defined by the Committee thereafter), in some combination thereof, or in any other form approved by the Committee at its sole discretion. Payment shall be made no earlier than the date of exercise nor later than 2½ months after the close of the year in which the SAR is exercised. The Committee’s determination regarding the form of SAR payout shall be set forth or reserved for later determination in the Award Agreement for the grant of the SAR.
7.7 Termination of Employment. Each Award Agreement shall set forth the extent to which the Participant shall have the right to exercise the SAR following termination of the Participant’s employment or other relationship with the Company or Affiliates. Such provisions shall be determined in the sole discretion of the Committee, need not be uniform among all SARs issued pursuant to the Plan, and may reflect distinctions based on the reasons for termination.
7.8 Nontransferability of SARs. Except as otherwise provided in a Participant’s Award Agreement at the time of grant or thereafter by the Committee, a SAR granted under the Plan may not be sold, transferred, pledged, assigned or otherwise alienated or hypothecated, other than by will or by the laws of descent and distribution. Further, except as otherwise provided in a Participant’s Award Agreement at the time of grant or thereafter by the Committee, all SARs granted to a Participant under the Plan shall be exercisable during such Participant’s lifetime only by such Participant.
7.9 Other Restrictions. Without limiting the generality of any other provision of this Plan, the Committee may impose such other conditions and/or restrictions on any Shares received upon exercise of a SAR granted pursuant to the Plan as it may deem advisable. This includes, but is not limited to, requiring the Participant to hold the Shares received upon exercise of a SAR for a specified period of time.
ARTICLE 8
RESTRICTED SHARE AND RESTRICTED SHARE UNITS
8.1 Grant of Restricted Shares or Restricted Share Units. Subject to the terms and conditions of the Plan, the Committee, at any time and from time to time, may grant Restricted Shares and/or Restricted Share Units to Participants in such amounts and upon such terms as the Committee shall determine.
8.2 Restricted Share or Restricted Share Unit Agreement. Each Restricted Share and/or Restricted Share Unit grant shall be evidenced by an Award Agreement that shall specify the Period(s) of Restriction, the number of Restricted Shares or the number of Restricted Share Units granted, the settlement date for Restricted Share Units, and any such other provisions as the Committee shall determine, provided that unless otherwise determined by the Committee or as set out in any Award Agreement, no Restricted Share Unit shall vest later than three years after the date of grant.
- 16 -
8.3 Nontransferability of Restricted Share and Restricted Share Units. Except as otherwise provided in this Plan or the Award Agreement, the Restricted Shares and/or Restricted Share Units granted herein may not be sold, transferred, pledged, assigned or otherwise alienated or hypothecated until the end of the applicable Period of Restriction specified in the Award Agreement (and in the case of Restricted Share Units until the date of settlement through delivery or other payment), or upon earlier satisfaction of any other conditions, as specified by the Committee in its sole discretion and set forth in the Award Agreement at the time of grant or thereafter by the Committee. All rights with respect to the Restricted Shares and/or Restricted Share Units granted to a Participant under the Plan shall be available during such Participant’s lifetime only to such Participant, except as otherwise provided in the Award Agreement at the time of grant or thereafter by the Committee.
8.4 Other Restrictions. The Committee shall impose, in the Award Agreement at the time of grant or anytime thereafter, such other conditions and/or restrictions on any Restricted Shares or Restricted Share Units granted pursuant to this Plan as it may deem advisable, including, without limitation, a requirement that Participants pay a stipulated purchase price for each Restricted Share or each Restricted Share Unit, restrictions based upon the achievement of specific performance criteria, time-based restrictions on vesting following the attainment of the performance criteria, time-based restrictions, restrictions under applicable laws or under the requirements of any stock exchange or market upon which such Shares are listed or traded, or holding requirements or sale restrictions placed on the Shares by the Company upon vesting of such Restricted Shares or Restricted Share Units.
To the extent deemed appropriate by the Committee, the Company may retain the certificates representing Restricted Shares, or Shares delivered in settlement of Restricted Share Units, in the Company’s possession until such time as all conditions and/or restrictions applicable to such Shares have been satisfied or lapse.
Except as otherwise provided in this Article 8, Restricted Shares covered by each Restricted Share Award shall become freely transferable by the Participant after all conditions and restrictions applicable to such Shares have been satisfied or lapse, and Restricted Share Units shall be settled through payment in cash, Shares, or a combination of cash and Shares as the Committee, in its sole discretion, shall determine.
8.5 Certificate Legend. In addition to any legends placed on certificates pursuant to Section 8.4 herein, each certificate representing Restricted Shares granted pursuant to the Plan may bear a legend such as the following:
“The sale or other transfer of the shares of stock represented by this certificate, whether voluntary, involuntary or by operation of law, is subject to certain restrictions on transfer as set forth in the 2015 Omnibus Equity Incentive Compensation Plan and in the associated Award Agreement. A copy of the Plan and such Award Agreement may be obtained from the Chief Financial Officer of Caledonia Mining Corporation.”
8.6 Voting Rights. To the extent required by law, Participants holding Restricted Shares granted hereunder shall have the right to exercise full voting rights with respect to those
- 17 -
Shares during the Period of Restriction. A Participant shall have no voting rights with respect to any Restricted Share Units granted hereunder.
8.7 Dividends and Other Distributions. During the Period of Restriction, Participants holding Restricted Shares or Restricted Share Units granted hereunder may, if the Committee so determines, be credited with dividends paid with respect to the underlying Shares or Dividend Equivalents while they are so held in a manner determined by the Committee in its sole discretion. Dividend Equivalents shall not apply to an Award unless specifically provided for in the Award Agreement. The Committee may apply any restrictions to the dividends or Dividend Equivalents that the Committee deems appropriate. The Committee, in its sole discretion, may determine the form of payment of dividends or Dividend Equivalents, including cash, Shares, Restricted Shares or Restricted Share Units.
8.8 Death, Retirement and other Termination of Employment.
|
(a) |
Death: If a Participant dies while an Employee, Director of, or Consultant to, the Company or an Affiliate: |
|
(i) |
any Restricted Share or Restricted Share Units held by the Participant that have not vested as at the Termination Date (as defined at Section 8.8(e) below) shall vest immediately; |
|
(ii) |
any Restricted Shares and Restricted Share Units held by the Participant that have vested (including Restricted Shares and Restricted Share Units vested in accordance with Section 8.8(a)(i)) as at the Termination Date (as defined at Section 8.8(e) below), shall be paid to the Participant's estate in accordance with the terms of the Plan and Award Agreement; and |
|
(iii) |
such Participant's eligibility to receive further grants of Restricted Share Units or Restricted Shares under the Plan ceases as of the Termination Date. |
|
(b) |
Disability: If a Participant suffers a Disability while an Employee, Director of, or Consultant to, the Company or an Affiliate and, as a result, his or her employment or engagement with the Company or an Affiliate is terminated: |
|
(i) |
the number of Restricted Shares or Restricted Share Units held by the Participant and that have not vested (collectively referred to in this Section 8.8 as the "Unvested Awards") shall be reduced to be equal to the product of (A) the number of Unvested Awards; and (B) the fraction obtained when dividing (x) the number of calendar days from the date of the award of the Unvested Awards to the Termination Date (as defined at Section 8.8(e) below) and (x) the number of calendar days from the date of the award of the Unvested Awards to the original vesting date set out in the Award Agreement; |
- 18 -
|
(ii) |
the number of Unvested Awards, as calculated pursuant to Section 8.8(b)(i), shall continue to vest in accordance with the terms of the Plan and Award Agreement; and |
|
(iii) |
such Participant's eligibility to receive further grants of Restricted Share Units or Restricted Shares under the Plan ceases as of the Termination Date. |
|
(c) |
Retirement: If a Participant voluntarily Retires then: |
|
(i) |
any Restricted Share Units held by the Participant that have vested before the Termination Date (as defined at Section 8.8(e) below) shall be paid to the Participant; |
|
(ii) |
any Unvested Awards held by the Participant at the Termination Date (as defined at Section 8.8(e) below) shall continue to vest in accordance with the terms of the Plan and Award Agreement following the Termination Date (as defined at Section 8.8(e) below) until the earlier of: (i) the date determined by the Committee, in its sole discretion; and (ii) the date on which the Restricted Share Units vest pursuant to the original Award Agreement in respect of such Unvested Awards; and |
|
(iii) |
such Participant's eligibility to receive further grants of Restricted Share Units or Restricted Shares under the Plan ceases as of the Termination Date. |
|
(d) |
Termination other than Death, Disability or Retirement: Unless determined otherwise by the Committee, where a Participant’s employment or term of office or engagement terminates for any reason other than death, Disability or Retirement (whether such termination occurs with or without any or adequate notice or reasonable notice, or with or without any or adequate compensation in lieu of such notice), then: |
|
(i) |
any Restricted Share Units held by the Participant that have vested before the Termination Date (as defined at Section 8.8(e) below) shall be paid to the Participant. Any Restricted Share Units or Restricted Shares held by the Participant that are not yet vested at the Termination Date (as defined at Section 8.8(e) below) will be immediately cancelled and forfeited to the Company on the Termination Date; |
|
(ii) |
the eligibility of a Participant to receive further grants under the Plan ceases as of the date that the Company or an Affiliate provides the Participant with written notification that the Participant's employment or term of office or engagement, is terminated, notwithstanding that such date may be prior to the Termination Date; and |
|
(iii) |
notwithstanding Sections 8.8(d)(i) and (ii) above, unless the Committee, in its sole discretion, otherwise determines, at any time and from time to |
- 19 -
time, Restricted Share Units and Restricted Shares are not affected by a change of employment arrangement within or among the Company or an Affiliate for so long as the Participant continues to be an employee of the Company or an Affiliate.
|
(e) |
For purposes of section 8.8, the term, “Termination Date” means, in the case of a Participant whose employment or term of office or engagement with the Company or an Affiliate terminates: |
|
(i) |
by reason of the Participant’s death, the date of death; |
|
(ii) |
by reason of termination for Cause, resignation by the Participant or Retirement, the Participant's last day actively at work for or actively engaged by the Company or an Affiliate; |
|
(iii) |
by reason of Disability, the date of the Participant's last day actively at work for or actively engaged by the Company or an Affiliate; |
|
(iv) |
for any reason whatsoever other than death, termination for Cause, Retirement or termination by reason of Disability, the later of the (A) date of the Participant's last day actively at work for or actively engaged by the Company or the Affiliate, and (B) the last date of the Notice Period; and |
|
(v) |
the resignation of a director and the expiry of a director's term on the Board without re-election (or nomination for election) shall each be considered to be a termination of his or her term of office. |
|
(f) |
Change of Control: The occurrence of a Change of Control will not result in the vesting of Unvested Awards, provided that: (i) such Unvested Awards will continue to vest in accordance with the Plan and Award Agreement; and (ii) any Successor Entity agrees to assume the obligations of the Company in respect of such Unvested Awards. |
|
(g) |
Termination Following a Change of Control: Where a Participant’s employment or term of office or engagement is terminated for any reason, other than for Cause, during the 24 months following a Change in Control, any Unvested Awards as at the date of such termination shall be deemed to have vested as at the date of such termination and shall become payable as at the date of termination. |
8.9 Payment in Settlement of Restricted Share Units. When and if Restricted Share Units become payable, the Participant issued such units shall be entitled to receive payment from the Company in settlement of such units in cash, Shares (issued from treasury) of equivalent value (based on the FMV, as defined in the Award Agreement at the time of grant or thereafter by the Committee), in some combination thereof, or in any other form, all as determined by the Committee at its sole discretion. The Committee’s determination regarding the form of payout shall be set forth or reserved for later determination in the Award Agreement for the grant of the Restricted Share Units. In the event settlement is made by payment in cash, such payment shall
- 20 -
be made by the earlier of (i) 2½ months after the close of the year in which such conditions or restrictions were satisfied or lapsed and (ii) December 31 of the third year following the year of the grant date.
ARTICLE 9
DEFERRED SHARES UNITS
9.1 Grant of Deferred Share Units. Subject to the terms and conditions of the Plan, the Committee, at any time and from time to time, may grant Deferred Share Units to Participants in such amounts and upon such terms as the Committee shall determine.
9.2 Deferred Share Unit Agreement. Each Deferred Share Unit grant shall be evidenced by an Award Agreement that shall specify the number of Deferred Share Units granted, the settlement date for Deferred Share Units, and any other provisions as the Committee shall determine, including, but not limited to a requirement that Participants pay a stipulated purchase price for each Deferred Share Unit, restrictions based upon the achievement of specific performance criteria, time-based restrictions, restrictions under applicable laws or under the requirements of any stock exchange or market upon which the Shares are listed or traded, or holding requirements or sale restrictions placed on the Shares by the Company upon vesting of such Deferred Share Units.
9.3 Nontransferability of Deferred Share Units. Except as otherwise provided in this Plan or the Award Agreement, the Deferred Share Units granted herein may not be sold, transferred, pledged, assigned or otherwise alienated or hypothecated. All rights with respect to the Deferred Share Units granted to a Participant under the Plan shall be available during such Participant’s lifetime only to such Participant, except as otherwise provided in the Award Agreement at the time of grant or thereafter by the Committee.
9.4 Termination of Employment, Consultancy or Directorship. Each Award Agreement shall set forth the extent to which the Participant shall have the right to retain Deferred Share Units following termination of the Participant’s employment or other relationship with the Company or Affiliates. Such provisions shall be determined in the sole discretion of the Committee, need not be uniform among all Deferred Share Units issued pursuant to the Plan, and may reflect distinctions based on the reasons for termination.
ARTICLE 10
PERFORMANCE SHARES AND PERFORMANCE UNITS
10.1 Grant of Performance Shares and Performance Units. Subject to the terms and conditions of the Plan, the Committee, at any time and from time to time, may grant Performance Shares and/or Performance Units to Participants in such amounts and upon such terms as the Committee shall determine.
10.2 Value of Performance Shares and Performance Units. Each Performance Share and Performance Unit shall have an initial value equal to the FMV of a Share on the date of grant. The Committee shall set performance criteria for a Performance Period in its discretion, which, depending on the extent to which they are met, will determine, in the manner determined
- 21 -
by the Committee and set forth in the Award Agreement, the value and/or number of each Performance Share or Performance Unit that will be paid to the Participant.
10.3 Earning of Performance Shares and Performance Units. Subject to the terms of this Plan and the applicable Award Agreement, after the applicable Performance Period has ended, the holder of Performance Shares/Performance Units shall be entitled to receive payout on the value and number of Performance Shares/Performance Units, determined as a function of the extent to which the corresponding performance criteria have been achieved. Notwithstanding the foregoing, the Company shall have the ability to require the Participant to hold any Shares received pursuant to such Award for a specified period of time.
10.4 Form and Timing of Payment of Performance Shares and Performance Units. Payment of earned Performance Shares/Performance Units shall be as determined by the Committee and as set forth in the Award Agreement. Subject to the terms of the Plan, the Committee, in its sole discretion, may pay earned Performance Shares/Performance Units in the form of cash or in Shares issued from treasury (or in a combination thereof) equal to the value of the earned Performance Shares/Performance Units at the end of the applicable Performance Period. Any Shares may be granted subject to any restrictions deemed appropriate by the Committee. The determination of the Committee with respect to the form of payout of such Awards shall be set forth in the Award Agreement for the grant of the Award or reserved for later determination. In no event will delivery of such Shares or payment of any cash amounts be made later than December 31 of the third year following the year of the grant date.
10.5 Dividends and Other Distributions. The Committee shall determine whether Participants holding Performance Shares will receive Dividend Equivalents with respect to dividends declared with respect to the Shares. Dividends or Dividend Equivalents may be subject to accrual, forfeiture or payout restrictions as determined by the Committee in its sole discretion.
10.6 Death and other Termination of Employment.
|
(a) |
Death: If a Participant dies while an Employee, Director of, or Consultant to, the Company or an Affiliate: |
|
(i) |
the number of Performance Shares or Performance Share Units held by the Participant that have not vested (collectively referred to in this Section 10.6 as “Unvested Awards”) shall be adjusted as set out in the applicable Award Agreement (collectively referred to in this Section 10.6 as “Deemed Awards”); |
|
(ii) |
any Deemed Awards shall vest immediately; |
|
(iii) |
any Performance Shares and Performance Shares Units held by the Participant that have vested (including Deemed Awards vested in accordance with Section 10.6(a)(ii) shall be paid to the Participant’s estate in accordance with the terms of the Plan and Award Agreement; and |
- 22 -
|
(iv) |
such Participant’s eligibility to receive further grants of Performance Shares or Performance Share Units under the Plan ceases as of the Termination Date (as defined at Section 10.6(e) below). |
|
(b) |
Disability: If a Participant suffers a Disability while an Employee, officer or director of or Consultant to the Company or an Affiliate and as a result his or her employment with the company or Affiliate is terminated: |
|
(i) |
Unvested Awards shall be reduced to be equal to the product of (A) the number of Unvested Awards; and (B) the fraction obtained when dividing (x) the number of calendar days from the date of the award of the Unvested Awards to the Termination Date (as defined at Section 10.6(e) below) and (x) the number of calendar days from the date of the award of the Unvested Awards to the original vesting date set out in the Award Agreement; |
|
(ii) |
the number of Unvested Awards, as calculated pursuant to Section 10.6(b)(i), shall continue to vest in accordance with the terms of its Plan and Award Agreement; and |
|
(iii) |
such Participant’s eligibility to receive further grants of Performance Share Units or Performance Shares under the Plan ceases as of the Termination Date. |
|
(c) |
Retirement: If a Participant voluntarily Retires then: |
|
(i) |
any Performance Shares or Performance Share Units held by the Participant that have vested before the Termination Date shall be paid to the Participant; |
|
(ii) |
any Unvested Awards held by the Participant at the Termination Date (as defined at Section 10.6(e) below) shall continue to vest in accordance with the terms of the Plan and Award Agreement following the Termination Date until the earlier of: (i) the date determined by the Committee, in its sole discretion; and (ii) the date on which the Performance Share Units vest pursuant to the original Award Agreement in respect of such Unvested Awards; and |
|
(iii) |
such Participant's eligibility to receive further grants of Performance Shares or Performance Share Units under the Plan ceases as of the Termination Date. |
|
(d) |
Termination other than Death, Disability or Retirement: Unless determined otherwise by the Committee, where a Participant’s employment or term of office or engagement terminates for any reason other than death (whether such termination occurs with or without any or adequate notice or reasonable notice, or with or without any or adequate compensation in lieu of such notice), then: |
- 23 -
|
(i) |
any Performance Share Units or Performance Shares held by the Participant that have vested before the Termination Date shall be paid to the Participant in accordance with the terms of the Plan and Award Agreement. Any Performance Shares Units or Performance Shares held by the Participant that are not yet vested at the Termination Date will be immediately cancelled and forfeited to the Company on the Termination Date; |
|
(ii) |
the eligibility of a Participant to receive further grants under the Plan ceases as of the date that the Company or an Affiliate provides the Participant with written notification that the Participant’s employment or term of office or engagement, is terminated, notwithstanding that such date may be prior to the Termination Date; and |
|
(iii) |
notwithstanding Sections 10.6(c)(i) and (ii) above, unless the Committee, in its sole discretion, otherwise determines, at any time and from time to time, Performance Share Units or Performance Shares are not affected by a change of employment arrangement within or among the Company or an Affiliate for so long as the Participant continues to be an employee of the Company or an Affiliate. |
|
(e) |
For purposes of this Section 10.6, the term, “Termination Date” has the meaning set out in Section 8.8(e). |
|
(f) |
Change of Control: The occurrence of a Change of Control will not result in the vesting of Unvested Awards, provided that: |
|
(i) |
such Unvested Awards will continue to vest in accordance with the Plan and the Award Agreement; |
|
(ii) |
the level of achievement of Performance Goals for Fiscal Years completed prior to the date of the Change of Control shall be based on the actual performance achieved to the date of the Change of Control and the level of achievement of Performance Goals for Fiscal Years completed following the date of the Change of Control shall be based on the assumed achievement of 100% of the Performance Goals; and |
|
(iii) |
any Successor Entity agrees to assume the obligations of the Company in respect of such Unvested Awards. |
|
(g) |
Termination following Change of Control: For the period of 24 months following a Change of Control, where a Participant’s employment or term of office or engagement is terminated for any reason, other than for Cause: |
|
(i) |
any Unvested Awards as at the date of such termination shall be deemed to have vested as at the date of such termination and shall become payable as at the date of termination; and |
- 24 -
|
(ii) |
the level of achievement of Performance Goals for any Unvested Awards that are deemed to have vested pursuant to (i) above, shall be based on the actual performance achieved at the end of the Fiscal Year immediately prior to the date of termination. |
10.7 Nontransferability of Performance Shares and Performance Units. Except as otherwise provided in a Participant’s Award Agreement at the time of grant or thereafter by the Committee, Performance Shares/Performance Units may not be sold, transferred, pledged, assigned or otherwise alienated or hypothecated, other than by will or by the laws of descent and distribution. Further, except as otherwise provided in a Participant’s Award Agreement or otherwise by the Committee at any time, a Participant’s rights under the Plan shall inure during such Participant’s lifetime only to such Participant.
ARTICLE 11
FULL VALUE SHARE-BASED AWARDS
11.1 Share-Based Awards. The Committee may, to the extent permitted by the TSX, grant other types of equity-based or equity-related Awards not otherwise described by the terms of this Plan (including the grant or offer for sale of unrestricted Shares and issuance of unrestricted Shares in satisfaction of compensation (including salary, bonus or other incentive)) in such amounts and subject to such terms and conditions, including, but not limited to, being subject to performance criteria, or in satisfaction of such obligations, as the Committee shall determine; provided that the maximum number of Share-Based Awards issued in any calendar year shall not exceed one per cent (1%) of the issued and outstanding Shares on January 1 of such calendar year. Such Awards may involve the transfer of actual Shares to Participants, or payment in cash or otherwise of amounts based on the value of Shares, subject to applicable corporate law and securities law requirements.
11.2 Termination of Employment. Each Award Agreement shall set forth the extent to which the Participant shall have the right to receive Share-Based Awards following termination of the Participant’s employment or other relationship with the Company or Affiliates. Such provisions shall be determined in the sole discretion of the Committee, need not be uniform among all Share-Based Awards issued pursuant to the Plan, and may reflect distinctions based on the reasons for termination.
11.3 Nontransferability of Share-Based Awards. Except as otherwise provided in a Participant’s Award Agreement at the time of grant or thereafter by the Committee, Share-Based Awards may not be sold, transferred, pledged, assigned or otherwise alienated or hypothecated, other than by will or by the laws of descent and distribution. Further, except as otherwise provided in a Participant’s Award Agreement at the time of grant or thereafter by the Committee, a Participant’s rights under the Plan shall be exercisable during such Participant’s lifetime only by such Participant.
- 25 -
ARTICLE 12
BENEFICIARY DESIGNATION
12.1 Beneficiary. A Participant’s “beneficiary” is the person or persons entitled to receive payments or other benefits or exercise rights that are available under the Plan in the event of the Participant’s death. A Participant may designate a beneficiary or change a previous beneficiary designation at such times as prescribed by the Committee and by using such forms and following such procedures approved or accepted by the Committee for that purpose. If no beneficiary designated by the Participant is eligible to receive payments or other benefits or exercise rights that are available under the Plan at the Participant’s death, the beneficiary shall be the Participant’s estate.
12.2 Discretion of the Committee. Notwithstanding the provisions above, the Committee may, in its discretion, after notifying the affected Participants, modify the foregoing requirements, institute additional requirements for beneficiary designations, or suspend the existing beneficiary designations of living Participants or the process of determining beneficiaries under this Article 12, or both, in favor of another method of determining beneficiaries.
ARTICLE 13
RIGHTS OF PERSONS ELIGIBLE TO PARTICIPATE
13.1 Employment. Nothing in the Plan or an Award Agreement shall interfere with or limit in any way the right of the Company or an Affiliate to terminate any Participant’s employment, consulting or other service relationship with the Company or an Affiliate at any time, nor confer upon any Participant any right to continue in the capacity in which he or she is employed or otherwise serves the Company or an Affiliate.
Neither an Award nor any benefits arising under this Plan shall constitute part of an employment or service contract with the Company or an Affiliate, and, accordingly, subject to the terms of this Plan, this Plan may be terminated or modified at any time in the sole and exclusive discretion of the Committee or the Board without giving rise to liability on the part of the Company or an Affiliate for severance payments or otherwise, except as provided in this Plan.
For purposes of the Plan, unless otherwise provided by the Committee, a transfer of employment of a Participant between the Company and an Affiliate or among Affiliates, shall not be deemed a termination of employment. The Committee may provide in a Participant’s Award Agreement or otherwise the conditions under which a transfer of employment to an entity that is spun off from the Company or an Affiliate shall not be deemed a termination of employment for purposes of an Award.
13.2 Participation. No Employee or other Person eligible to participate in the Plan shall have the right to be selected to receive an Award. No person selected to receive an Award shall have the right to be selected to receive a future Award, or, if selected to receive a future Award, the right to receive such future Award on terms and conditions identical or in proportion in any way to any prior Award.
- 26 -
13.3 Rights as a Shareholder. A Participant shall have none of the rights of a shareholder with respect to Shares covered by any Award until the Participant becomes the record holder of such Shares.
ARTICLE 14
CHANGE OF CONTROL
14.1 Accelerated Vesting and Payment. Subject to the provisions of Section 14.2 or as otherwise provided in the Plan or the Award Agreement, in the event of a Change of Control, the Committee shall have the discretion to unilaterally determine that all outstanding Awards shall be cancelled upon a Change of Control, and that the value of such Awards, as determined by the Committee in accordance with the terms of the Plan and the Award Agreements, shall be paid out in cash in an amount based on the Change of Control Price within a reasonable time subsequent to the Change of Control.
14.2 Alternative Awards. Notwithstanding Section 14.1, no cancellation, acceleration of vesting, lapsing of restrictions, payment of an Award, cash settlement or other payment shall occur with respect to any Award if the Committee reasonably determines in good faith prior to the occurrence of a Change of Control that such Award shall be honored or assumed, or new rights substituted therefor (with such honored, assumed or substituted Award hereinafter referred to as an “Alternative Award”) by any successor to the Company or an Affiliate as described in Article 16; provided, however, that any such Alternative Award must:
|
(a) |
be based on stock which is traded on the TSX and/or an established securities market in London, England or the United States; |
|
(b) |
provide such Participant with rights and entitlements substantially equivalent to or better than the rights, terms and conditions applicable under such Award, including, but not limited to, an identical or better exercise or vesting schedule (including vesting upon termination of employment) and identical or better timing and methods of payment; |
|
(c) |
recognize, for the purpose of vesting provisions, the time that the Award has been held prior to the Change of Control; and |
|
(d) |
have substantially equivalent economic value to such Award (determined prior to the time of the Change of Control). |
ARTICLE 15
AMENDMENT, MODIFICATION, SUSPENSION AND TERMINATION
15.1 Amendment, Modification, Suspension and Termination.
|
(a) |
Except as set out in clauses (b) and (c) below, and as otherwise provided by law, or stock exchange rules, the Committee or Board may, at any time and from time to time, alter, amend, modify, suspend or terminate the Plan or any Award in whole or in part without notice to, or approval from, shareholders, including, but not limited to for the purposes of: |
- 27 -
|
(i) |
making any amendments to the general vesting provisions of any Award; |
|
(ii) |
making any amendments to the general term of any Award provided that no Award held by an Insider may be extended beyond its original expiry date; |
|
(iii) |
making any amendments to add covenants or obligations of the Company for the protection of Participants; |
|
(iv) |
making any amendments not inconsistent with the Plan as may be necessary or desirable with respect to matters or questions which, in the good faith opinion of the Board, it may be expedient to make, including amendments that are desirable as a result of changes in law or as a “housekeeping” matter; or |
|
(v) |
making such changes or corrections which are required for the purpose of curing or correcting any ambiguity or defect or inconsistent provision or clerical omission or mistake or manifest error. |
|
(b) |
Other than as expressly provided in an Award Agreement or as set out herein with respect to a Change of Control, the Committee shall not alter or impair any rights or increase any obligations with respect to an Award previously granted under the Plan without the consent of the Participant. |
|
(c) |
The following amendments to the Plan shall require the prior approval of the Company’s shareholders: |
|
(i) |
A reduction in the Option Price of a previously granted Option or the Grant Price of a previously granted SAR benefitting an Insider of the Company or one of its Affiliates except for adjustments to the Option Price or Grant Price applicable to outstanding Awards pursuant to Section 4.2 hereof. |
|
(ii) |
Any amendment or modification which would increase the total number of Shares available for issuance under the Plan. |
|
(iii) |
An increase to the limit on the number of Shares issued or issuable under the Plan to Insiders of the Company; |
|
(iv) |
An extension of the expiry date of an Option or SAR, other than as otherwise permitted hereunder in relation to a Blackout Period or otherwise; or |
|
(v) |
Any amendment to the amendment provisions of the Plan under this Section 15.1. |
- 28 -
15.2 Adjustment of Awards Upon the Occurrence of Unusual or Nonrecurring Events. The Committee may make adjustments in the terms and conditions of, and the criteria included in, Awards in recognition of unusual or nonrecurring events in addition to the events described in Section 4.2 hereof affecting the Company or the financial statements of the Company or of changes in applicable laws, regulations or accounting principles, whenever the Committee determines that such adjustments are appropriate in order to prevent unintended dilution or enlargement of the benefits or potential benefits intended to be made available under the Plan. The determination of the Committee as to the foregoing adjustments, if any, shall be conclusive and binding on Participants under the Plan.
15.3 Awards Previously Granted. Notwithstanding any other provision of the Plan to the contrary, no termination, amendment, suspension or modification of the Plan shall adversely affect in any material way any Award previously granted under the Plan, without the written consent of the Participant holding such Award.
ARTICLE 16
WITHHOLDING
16.1 Withholding. The Company or any Affiliate shall have the power and the right to deduct or withhold, or require a Participant to remit to the Company or any Affiliate, an amount sufficient to satisfy federal, state and local taxes or provincial, domestic or foreign, required by law or regulation to be withheld with respect to any taxable event arising or as a result of this Plan or any Award hereunder. The Committee may provide for Participants to satisfy withholding requirements by having the Company withhold and sell Shares or the Participant making such other arrangements, including the sale of Shares, in either case on such conditions as the Committee specifies.
16.2 Acknowledgement. Participant acknowledges and agrees that the ultimate liability for all taxes legally payable by Participant is and remains Participant’s responsibility and may exceed the amount actually withheld by the Company. Participant further acknowledges that the Company: (a) makes no representations or undertakings regarding the treatment of any taxes in in connection with any aspect of this Plan; and (b) does not commit to and is under no obligation to structure the terms of this Plan to reduce or eliminate Participant’s liability for taxes or achieve any particular tax result. Further, if Participant has become subject to tax in more than one jurisdiction, Participant acknowledges that the Company may be required to withhold or account for taxes in more than one jurisdiction.
ARTICLE 17
SUCCESSORS
Any obligations of the Company or an Affiliate under the Plan with respect to Awards granted hereunder shall be binding on any successor to the Company or Affiliate, respectively, whether the existence of such successor is the result of a direct or indirect purchase, merger, consolidation or otherwise, of all or substantially all of the businesses and/or assets of the Company or Affiliate, as applicable.
- 29 -
ARTICLE 18
GENERAL PROVISIONS
18.1 Forfeiture Events. Without limiting in any way the generality of the Committee’s power to specify any terms and conditions of an Award consistent with law, and for greater clarity, the Participant’s rights, payments and benefits with respect to an Award shall, at the sole discretion of the Committee, be subject to reduction, cancellation, forfeiture of any vested and unvested Awards or recoupment of any payments or settlements made in the current Fiscal Year or immediately prior Fiscal Year (provided such determination is made within 45 days of the end of that Fiscal Year) upon the occurrence of certain specified events, in addition to any otherwise applicable vesting or performance conditions of an Award. Such specified events shall include, but shall not be limited to, any of: (a) the Participant’s failure to accept the terms of the Award Agreement, violation of material Company and Affiliate policies, breach of noncompetition, confidentiality, nonsolicitation, noninterference, corporate property protection or other agreements that may apply to the Participant, or other conduct by the Participant that is detrimental to the business or reputation of the Company and Affiliates; (b) the Participant’s misconduct, fraud, gross negligence; and (c) the restatement of the financial statements of the Company that resulted in Awards which should not have vested, settled, or been paid had the original financial statements been properly stated. A Participant’s rights, payments and benefits with respect to an Award shall also be subject to recovery in accordance with the Company’s INCENTIVE COMPENSATION RECOVERY POLICY, as it may be amended from time to time. A copy of the effective Policy shall be attached as Annexure 2 of the COMPENSATION COMMITTEE CHARTER.
Except as expressly otherwise provided in this Plan or an Award Agreement, the termination and the expiry of the period within which an Award will vest and may be exercised by a Participant shall be based upon the last day of actual service by the Participant to the Company and specifically does not include any period of notice that the Company may be required to provide to the Participant under applicable employment law.
18.2 Legend. The certificates for Shares may include any legend that the Committee deems appropriate to reflect any restrictions on transfer of such Shares.
18.3 Delivery of Title. The Company shall have no obligation to issue or deliver evidence of title for Shares issued under the Plan prior to:
|
(a) |
Obtaining any approvals from governmental agencies that the Company determines are necessary or advisable; and |
|
(b) |
Completion of any registration or other qualification of the Shares under any applicable law or ruling of any governmental body that the Company determines to be necessary or advisable. |
18.4 Investment Representations. The Committee may require each Participant receiving Shares pursuant to an Award under this Plan to represent and warrant in writing that the Participant is acquiring the Shares for investment and without any present intention to sell or distribute such Shares.
- 30 -
18.5 Uncertificated Shares. To the extent that the Plan provides for issuance of certificates to reflect the transfer of Shares, the transfer of such Shares may be effected on a noncertificated basis to the extent not prohibited by applicable law or the rules of any applicable stock exchange.
18.6 Unfunded Plan. Participants shall have no right, title or interest whatsoever in or to any investments that the Company or an Affiliate may make to aid it in meeting its obligations under the Plan. Nothing contained in the Plan, and no action taken pursuant to its provisions, shall create or be construed to create a trust of any kind, or a fiduciary relationship between the Company or an Affiliate and any Participant, beneficiary, legal representative or any other person. Awards shall be general unsecured obligations of the Company, except that if an Affiliate executes an Award Agreement instead of the Company the Award shall be a general unsecured obligation of the Affiliate and not any obligation of the Company. To the extent that any individual acquires a right to receive payments from the Company or an Affiliate, such right shall be no greater than the right of an unsecured general creditor of the Company or Affiliate, as applicable. All payments to be made hereunder shall be paid from the general funds of the Company or Affiliate, as applicable, and no special or separate fund shall be established and no segregation of assets shall be made to assure payment of such amounts except as expressly set forth in the Plan.
18.7 No Fractional Shares. No fractional Shares shall be issued or delivered pursuant to the Plan or any Award Agreement. In such an instance, unless the Committee determines otherwise, fractional Shares and any rights thereto shall be forfeited or otherwise eliminated.
18.8 Other Compensation and Benefit Plans. Nothing in this Plan shall be construed to limit the right of the Company or an Affiliate to establish other compensation or benefit plans, programs, policies or arrangements. Except as may be otherwise specifically stated in any other benefit plan, policy, program or arrangement, no Award shall be treated as compensation for purposes of calculating a Participant’s rights under any such other plan, policy, program or arrangement.
18.9 No Constraint on Corporate Action. Nothing in this Plan shall be construed (i) to limit, impair or otherwise affect the Company’s or an Affiliate’s right or power to make adjustments, reclassifications, reorganizations or changes in its capital or business structure, or to merge or consolidate, or dissolve, liquidate, sell or transfer all or any part of its business or assets, or (ii) to limit the right or power of the Company or an Affiliate to take any action which such entity deems to be necessary or appropriate.
18.10 Compliance with Canadian Securities Laws. All Awards and the issuance of Shares underlying such Awards issued pursuant to the Plan will be issued pursuant to an exemption from the prospectus requirements of Canadian securities laws where applicable.
- 31 -
ARTICLE 19
LEGAL CONSTRUCTION
19.1 Gender and Number. Except where otherwise indicated by the context, any masculine term used herein also shall include the feminine, the plural shall include the singular, and the singular shall include the plural.
19.2 Severability. In the event any provision of this Plan shall be held illegal or invalid for any reason, the illegality or invalidity shall not affect the remaining parts of the Plan, and the Plan shall be construed and enforced as if the illegal or invalid provision had not been included.
19.3 Requirements of Law. The granting of Awards and the issuance of Shares under the Plan shall be subject to all applicable laws, rules and regulations, and to such approvals by any governmental agencies or securities exchanges as may be required. The Company or an Affiliate shall receive the consideration required by law for the issuance of Awards under the Plan.
The inability of the Company or an Affiliate to obtain authority from any regulatory body having jurisdiction, which authority is deemed by the Company or an Affiliate to be necessary for the lawful issuance and sale of any Shares hereunder, shall relieve the Company or Affiliate of any liability in respect of the failure to issue or sell such Shares as to which such requisite authority shall not have been obtained.
19.4 Governing Law. The Plan and each Award Agreement shall be governed by the laws of the Province of Ontario excluding any conflicts or choice of law rule or principle that might otherwise refer construction or interpretation of the Plan to the substantive law of another jurisdiction.
19.5 Compliance with Section 409A of the Code.
|
(a) |
To the extent the Plan is applicable to a particular Participant subject to the Code, it is intended that this Plan and any Awards made hereunder shall not provide for the payment of “deferred compensation” within the meaning of Section 409A of the Code or shall be structured in a manner and have such terms and conditions that would not cause such a Participant to be subject to taxes and interest pursuant to Section 409A of the Code. This Plan and any Awards made hereunder shall be administrated and interpreted in a manner consistent with this intent. |
|
(b) |
To the extent that any amount or benefit in favour of a Participant who is subject to the Code would constitute “deferred compensation” for purposes of Section 409A of the Code would otherwise be payable or distributable under this Plan or any Award Agreement by reason of the occurrence of a Change of Control or the Participant’s disability or separation from service, such amount or benefit will not be payable or distributable to the Participant by reason of such circumstance unless: (i) the circumstances giving rise to such Change of Control, disability or separation from service meet the description or definition of “change in control event,” “disability,” or “separation from service,” as the case may be, in Section 409A of the Code and applicable proposed or final Treasury regulations |
- 32 -
thereunder, and (ii) the payment or distribution of such amount or benefit would otherwise comply with Section 409A of the Code and not subject the Participant to taxes and interest pursuant to Section 409A of the Code. This provision does not prohibit the vesting of any Award or the vesting of any right to eventual payment or distribution of any amount or benefit under this Plan or any Award Agreement.
|
(c) |
The Committee shall use its reasonable discretion to determine the extent to which the provisions of this Article 19.5 will apply to a Participant who is subject to taxation under the ITA. |
Exhibit 4.20
THE AWARD HAS NOT BEEN REGISTERED UNDER THE U.S. SECURITIES ACT OF 1933, AS AMENDED (THE “ACT”), AND MAY NOT BE OFFERED OR SOLD IN THE UNITED STATES OR TO U.S. PERSONS UNLESS SUCH SECURITIES ARE REGISTERED UNDER THE ACT, OR AN EXEMPTION FROM THE REGISTRATION REQUIREMENTS OF THE ACT ARE AVAILABLE. THE TERMS “UNITED STATES” AND “U.S. PERSON” ARE AS DEFINED IN REGULATION S UNDER THE ACT.
2015 OMNIBUS EQUITY INCENTIVE COMPENSATION PLAN
Award Agreement
Caledonia Mining Corporation Plc (the “Company”) hereby grants the following Performance Units (“PUs”) to the Participant named below (the “Recipient”), in accordance with and subject to the terms, conditions and restrictions of this Agreement, together with the provisions of the 2015 Omnibus Equity Incentive Compensation Plan (the “Plan”) of the Company for services rendered to the Company and its subsidiaries:
|
Name of Recipient: |
[ ] |
Grant of PUs:
|
Date of Grant: |
April 7, 2023 (“PUs Grant Date”). |
|
|
Value of PUs at Date of Grant: |
US$[20% salary] |
|
|
Price Per Share at Date of Grant: |
US$[ ] |
|
|
Target Number of PUs: |
[ ] (“Target PUs”) |
|
|
Vesting Dates of PUs: |
Subject to any reduction, cancellation, forfeiture or acceleration in vesting as provided in the Plan or this Award Agreement, the PUs granted pursuant to this Award Agreement will vest as to one third on each of the first business day in April 2024, 2025 and 2026 (following the publication of annual financial results) provided that if there is a closed period for whatever reason in force at such time the vesting will be the first business day following the end of such closed period (“PUs Vesting Date”). |
______________________
1 The Fair Market Value of a Share underlying a PU shall be equal to the greater of (i) the volume weighted average trading price of the Shares on the NYSE American for the five trading days preceding the relevant date in which such valuation occurs or (ii) the closing price of the Shares on the NYSE American on the trading day immediately prior to such valuation date (i.e., grant date, dividend payment date, settlement date) (the “PU Share Price”).
|
Performance Measures: |
The number of PUs which will vest on each of the PUs Vesting Dates (including an increase or decrease in the Target PUs) will be a third of the Target PUs multiplied by the score determined in accordance with Appendix A (the “Performance Multiplier”) to this Award Agreement. |
|
|
Performance Period: |
January 1, 2023 to December 31, 2023; January 1, 2024 to December 31, 2024; and January 1, 2025 to December 31, 2025 for each third of Target PUs. |
|
|
Dividend Reinvestment: |
The Recipient will be entitled to receive, from and after each of the PUs Vesting Dates until settlement of the relevant PUs, for each vested PU held at the time of payment of a dividend by the Company, the cash equivalent of such dividend declared by the Company on one Share. Such cash equivalents paid by the Company shall, with respect to each vested PU, be automatically reinvested in additional PUs at a price per PU equal to the then applicable PU Share Price. For the avoidance of doubt, all additional PUs accrued to the Recipient through dividend reinvestment shall be subject to the terms, conditions and restrictions of this Agreement and the Plan. No PUs accrued to the Recipient through dividend reinvestment shall be subject to adjustment, either upwards or downwards, by the Performance Multiplier. |
|
|
Settlement: |
The settlement value of vesting PUs shall be an amount equal to a third of the Target PUs (after application of the Performance Multiplier) multiplied by the PU Share Price. Such settlement value may be paid to the Recipient in the same currency and in the same manner that the Recipient receives his or her regular compensation.
Notwithstanding the foregoing, the Recipient may, except in the event of a Change of Control, request that settlement be made in whole or in part in the form of Shares at a value equal to the then applicable PU Share Price at the date of settlement (in other words, equal to the number of vesting PUs) and, in the event that such request is made, the Company shall endeavour to satisfy such request to issue Shares subject to there being, if the Recipient is a resident of Zimbabwe, a current listing of Shares or securities representing them on a Zimbabwe securities exchange or an alternative mechanism satisfactory to the Company and in accordance with and all applicable law and regulations (including, but not limited to, any restrictions on the issue of securities pursuant to the Plan and the Company’s share dealing code in force from time to time and the requirements of any securities exchange upon which the Shares are then listed) and otherwise on such terms and conditions as the Committee may determine. |
|
Death of the Recipient: |
If the Recipient dies while an Employee of the Company or an Affiliate, any PUs held by the Recipient that have not vested will immediately vest and will be settled with the estate of the Recipient as soon as practicable. The Performance Multiplier will be applied to determine the number of PUs that vest as if the applicable Performance Period has been completed. If a Performance Period is in progress at the time of the Recipient’s death or for future Performance Periods, the Performance Multiplier will be calculated on the basis of the Performance Measures achieved at the end of the immediately preceding interim period. The determination of the foregoing will be in the sole and unfettered discretion of the Committee. |
|
1. |
The terms and conditions of the Plan are hereby incorporated by reference as terms and conditions of this Award Agreement and all capitalized terms used in this Award Agreement, unless expressly defined in a different manner, have the meanings given to them in the Plan. Except where the terms and provisions of this Award Agreement specifically state that they supersede the terms or provisions of the Plan, in the event of a conflict between any term or provision contained in this Award Agreement and a term or provision of the Plan, all terms and provisions of the Plan will govern and prevail. |
|
2. |
The Awards granted pursuant to this Award Agreement are recorded in a notional account held by the Company in your name, to which you may refer at any time. |
|
3. |
Nothing contained in this Award Agreement or the Plan will give the Recipient or any other Person any interest or title in or to any Share or any rights as a shareholder of the Company (including, without limitation, any right to receive dividends or other distributions from the Company, voting rights, warrants or rights under any rights offering) or any other legal or equitable right against the Company whatsoever, other than as set forth in this Award Agreement and in the Plan. |
|
4. |
If the Recipient voluntarily Retires, the Committee may, in its sole discretion but will have no obligation to, accelerate the vesting of any unvested Awards granted pursuant to this Award Agreement. In exercising its discretion, the Committee will consider the nature of the Recipient’s withdrawal from employment or office with the Company or Affiliate, including without limitation the notice period given by the Recipient, the transition responsibilities carried out by the Recipient and the Recipient’s adherence to any applicable restrictive covenants. |
|
5. |
The Recipient will not be obligated to settle any Awards granted pursuant to this Award Agreement on the vesting dates of such Awards but may elect to settle at any time after such vesting dates. |
|
6. |
Nothing in the Plan or in this Award Agreement will affect the Company’s right, or that of an Affiliate, to terminate the employment or term of office or engagement of a Recipient at any time for any reason whatsoever. Upon such termination, the Recipient’s rights in respect of the Awards granted under this Award Agreement will be subject to restrictions and time limits, the complete details of which are set out in the Plan. |
|
7. |
Without restriction, and for the avoidance of doubt, the Recipient agrees that the Recipient will not be entitled to any rights to accrue, vest or exercise any Awards during or in respect of any termination notice or severance period under the Recipient’s employment agreement or employment arrangements. |
|
8. |
Each notice relating to the Awards must be in writing. All notices to the Company must be delivered personally or by prepaid registered mail and must be addressed to the Chief Financial Officer of the Company with a copy to the Company Secretary of the Company. All notices to the Recipient will be addressed to the principal address of the Recipient on file with the Company. Either the Company or the Recipient may designate a different address by written notice to the other. Such notices are deemed to be received, if delivered personally, on the date of delivery, and if sent by prepaid, registered mail, on the fifth business day following the date of mailing. Any notice given by either the Recipient or the Company is not binding on the recipient of such notice until received. |
|
9. |
Subject to 8.3 or 10.7 of the Plan, as applicable, any Award granted pursuant to this Award Agreement may only be held during the lifetime of the Recipient by the Recipient personally and no assignment or transfer of an Award, whether voluntary, involuntary, by operation of law or otherwise, vests any interest or right in such Award whatsoever in any assignee or transferee, and immediately upon any assignment or transfer or any attempt to make such assignment or transfer, the Award granted under this Award Agreement terminates and is of no further force or effect. Complete details of this restriction are set out in the Plan. |
|
10. |
In the event of a Change of Control, all PUs granted pursuant to this Award Agreement shall immediately vest and the value of such PUs shall be paid out in cash within 30 days subsequent to the Change of Control in an amount based on the Change of Control Price. For the avoidance of doubt, the Committee shall have no discretion regarding the form of payment and there shall be no Alternative Awards as described in Article 14 of the Plan. |
|
11. |
The Recipient hereby acknowledges and agrees that: |
|
(a) |
any rule, regulation or determination, including the interpretation by the Committee, with respect to the Awards granted under this Award Agreement and, if applicable, its exercise, is final and conclusive for all purposes and binding on all Persons, including the Company and the Recipient; |
|
(b) |
the participation of the Recipient in the Plan is entirely voluntary; and |
|
(c) |
the Recipient has been advised to obtain independent legal and tax advice prior to entering into this Award Agreement and by entering this Agreement the Recipient represents that he or she did obtain whatever independent legal and tax advice he or she considered appropriate and sufficient. |
|
12. |
By signing this Award Agreement, the Recipient represents and warrants that (i) under the terms and conditions of the Plan he is an Eligible Participant (as defined in the Plan) entitled to receive the Award, and (ii) he is not in the United States or a U.S. person, nor is he acquiring the Award for the benefit of a person in the United States or a U.S. person. Furthermore, the Recipient understands that the Award may not be exercised in the United States or by or on behalf of a U.S. person unless the Award has been registered under the Act or is exempt from registration thereunder. The Company may condition the Award upon receiving from the Recipient such representations and warranties and such evidence of registration or exemption under the Act as is satisfactory to the Company, acting in its sole discretion. |
|
13. |
This Award Agreement has been made in and is to be construed under and in accordance with the laws of the Province of Ontario and the laws of Canada applicable in the Province of Ontario. |
|
CALEDONIA MINING CORPORATION PLC |
||
|
By: |
||
I have read the foregoing Award Agreement and hereby accept the Award in accordance with and subject to the terms and conditions of this Award Agreement and the Plan. I understand that I may review the complete text of the Plan by contacting the Company Secretary. I agree to be bound by the terms and conditions of the Plan governing the Award.
|
Date Accepted |
Recipient’s Signature |
|
|
Recipient’s Name |
APPENDIX A
PERFORMANCE MULTIPLIER
The Performance Multiplier will be based on the following metrics and weightings. The number of PUs to vest on the PUs Vesting Date will be determined based on the Performance Multiplier and scorecard, calculated as follows:
|
Metric |
Weighting |
Description |
Threshold |
Below |
Threshold |
Target |
Target |
Stretch |
Max (Stretch |
|
Gold Production (oz) over 3 years |
50% |
||||||||
|
Gold Production (oz) over 3 years at Blanket |
42.5% |
Aggregate vs. guidance gold production |
225 000 (Blanket – 75 000 per year) |
Below Threshold 0% (no PU’s vest) |
50% of PUs vest |
240 000 (Blanket – 80 000 per year) |
100% of PUs vest |
260 000 (Blanket 86 667 per year) |
150% of PUs vest if stretch or more is achieved |
|
Gold Production (oz) over 3 years at Bilboes |
7.5% |
Aggregate vs. guidance gold production annually |
Lower End of Annual Bilboes Guidance |
Below Threshold 0% (no PU’s vest) |
50% of PUs vest |
Mid Point of annual Bilboes Guidance |
100% of PUs vest |
Upper End of Annual Bilboes Guidance |
150% of PUs vest if stretch or more is achieved |
|
Cost Per Ounce |
50% |
||||||||
|
On mine costs at Blanket and Bilboes plus other on mine costs plus head office “G&A” Other costs include: ► procurement margins paid to SA and Dubai ► the profit arising in solar co for electricity sales to Blanket |
50% |
Controllable Cost per ounce of gold produced vs. budgeted number for each Financial Year. Averaged over the 3-year vesting period. |
105% of Target |
Below Threshold 0% (no PU’s vest) |
50% of PUs vest |
x for 2023 (1/3 2023; 1/3 2024; 1/3 2025) |
100% of PUs vest |
95% of target |
150% of PUs vest if stretch or more is achieved |
Notes: Linear interpolation will be applied to vesting between Threshold and Target. Stepped vesting will be applied to vesting between Target and the midpoint between Target and Stretch (“Midpoint”). Linear interpolation will then be applied between the Midpoint and Stretch. The number of PUs vesting at Stretch and above will be capped at 150%. As shown below:
|
Performance attained |
||||||||
|
Less than Threshold |
Threshold |
Between Threshold and Target |
Target |
Between Target and Midpoint |
Midpoint |
Between Midpoint and Stretch |
Stretch or more |
|
|
No. of PUs that will vest |
0% |
50% |
Linear vesting from 50% to 100% |
100% |
100% |
125% |
Linear vesting from 125% to 150% |
150% maximum |
Further Notes:
(1) For the purposes of determining whether a target has been met, reported financial statements will be used.
(2) As per the table above, a performance score less than Threshold will result in zero PUs vesting, and if Threshold is met, 50% of the PUs will vest. Linear interpolation will be applied to vesting between Threshold and Target; Any achievement greater than Target but less than the Midpoint will result in 100% of the PUs vesting. Achievement at the Midpoint will result in 125% of the PUs vesting. Linear interpolation applies between the Midpoint and Stretch, where a maximum of 150% of PUs vest.
Exhibit 4.21
THE AWARD HAS NOT BEEN REGISTERED UNDER THE U.S. SECURITIES ACT OF 1933, AS AMENDED (THE “ACT”), AND MAY NOT BE OFFERED OR SOLD IN THE UNITED STATES OR TO U.S. PERSONS UNLESS SUCH SECURITIES ARE REGISTERED UNDER THE ACT, OR AN EXEMPTION FROM THE REGISTRATION REQUIREMENTS OF THE ACT ARE AVAILABLE. THE TERMS “UNITED STATES” AND “U.S. PERSON” ARE AS DEFINED IN REGULATION S UNDER THE ACT.
2015 OMNIBUS EQUITY INCENTIVE COMPENSATION PLAN
Award Agreement
Caledonia Mining Corporation Plc (the “Company”) hereby grants the following Performance Units (“PUs”) to the Participant named below (the “Recipient”), in accordance with and subject to the terms, conditions and restrictions of this Agreement, together with the provisions of the 2015 Omnibus Equity Incentive Compensation Plan (the “Plan”) of the Company for services rendered to the Company and its subsidiaries:
|
Name of Recipient: |
[ ] |
Grant of PUs:
|
Date of Grant: |
April 7, 2023 (“PUs Grant Date”). |
|
|
Value of PUs at Date of Grant: |
US$[ ] |
|
|
Price Per Share at Date of Grant: |
US$[ ] |
|
|
Target Number of PUs: |
[ ] (“Target PUs”) |
|
|
Vesting Date of PUs: |
Subject to any reduction, cancellation, forfeiture or acceleration in vesting as provided in the Plan or this Award Agreement, the PUs granted pursuant to this Award Agreement will vest on the first business day in April 2026 (following the publication of annual financial results) provided that if there is a closed period for whatever reason in force at such time the vesting will be the first business day following the end of such closed period (“PUs Vesting Date”). |
|
|
Performance Measures: |
The number of PUs which will vest on the PUs Vesting Date (including an increase or decrease in the Target PUs) will be equal to the Target PUs multiplied by the score determined in accordance with Appendix A (the “Performance Multiplier”) which shall be appended to this Award Agreement by way of an addendum. |
|
|
Performance Period: |
January 1, 2023 to December 31, 2025. |
______________________
1 The Fair Market Value of a Share underlying a PU shall be equal to the greater of (i) the volume weighted average trading price of the Shares on the NYSE American for the five trading days preceding the relevant date in which such valuation occurs or (ii) the closing price of the Shares on the NYSE American on the trading day immediately prior to such valuation date (i.e., grant date, dividend payment date, settlement date) (the “PU Share Price”).
|
Dividend Reinvestment: |
The Recipient will be entitled to receive, from and after the PUs Vesting Date until settlement of the PUs, for each vested PU held at the time of payment of a dividend by the Company, the cash equivalent of such dividend declared by the Company on one Share. Such cash equivalents paid by the Company shall, with respect to each vested PU, be automatically reinvested in additional PUs at a price per PU equal to the then applicable PU Share Price. For the avoidance of doubt, all additional PUs accrued to the Recipient through dividend reinvestment shall be subject to the terms, conditions and restrictions of this Agreement and the Plan. No PUs accrued to the Recipient through dividend reinvestment shall be subject to adjustment, either upwards or downwards, by the Performance Multiplier. |
|
|
Settlement: |
The settlement value of the PUs shall be an amount equal to the Target Number of PUs (after application of the Performance Multiplier) multiplied by the PU Share Price. Such settlement value shall, except in the event of a Change of Control whereby the value will be paid in cash, be paid in the form of Shares at a value equal to the then applicable PU Share Price at the date of settlement (in other words, equal to the number of vesting PUs) and in accordance with all applicable law and regulations (including, but not limited to, any restrictions on the issue of securities pursuant to the Plan and the Company’s share dealing code in force from time to time and the requirements of any securities exchange upon which the Shares or securities representing them are then listed) and otherwise on such terms and conditions as the Committee may determine. |
|
Death of the Recipient: |
If the Recipient dies while an Employee of the Company or an Affiliate, any PUs held by the Recipient that have not vested will immediately vest and will be settled with the estate of the Recipient as soon as practicable. The Performance Multiplier will be applied to determine the number of PUs that vest as if the applicable Performance Period has been completed. If a Performance Period is in progress at the time of the Recipient’s death or for future Performance Periods, the Performance Multiplier will be calculated on the basis of the Performance Measures achieved at the end of the immediately preceding quarter period. The determination of the foregoing will be in the sole and unfettered discretion of the Committee. |
|
Minimum Holding Period and Forfeiture: |
The Recipient shall hold any Shares or securities representing them issued pursuant to this Award Agreement until at least the first anniversary of the PUs Vesting Date. During that period, if the Committee exercises its discretion pursuant to article 18.1 of the Plan (and in such an instance “within 45 days” shall instead read “before the first anniversary of the PUs Vesting Date” in article 18.1) and resolves that the Recipient’s award pursuant to this Award Agreement shall be reduced, cancelled or forfeited, the Recipient hereby appoints the Company’s broker to sell such number of Shares or securities representing them as the Committee decides is appropriate to fully or partially compensate the Company for the action or omission of the Recipient or other event which resulted in the Committee’s decision to reduce, cancel or forfeit the award. A cash amount equal to the funds raised shall be paid over to the Company. Should the amount generated from the sale of Shares or securities representing them not be enough to fully compensate the Company in the amount the Committee decides is appropriate, the Recipient shall account to the Company for the remainder in cash by such date as the Committee shall determine, PROVIDED THAT the amount of cash payable by the Recipient, including that realised from the sale of Shares or securities representing them, shall not exceed the gross (i.e. before tax) amount receivable by the Recipient upon settlement. These provisions are without prejudice to article 18.1, other than the amendment referred to herein. |
|
1. |
The terms and conditions of the Plan are hereby incorporated by reference as terms and conditions of this Award Agreement and all capitalized terms used in this Award Agreement, unless expressly defined in a different manner, have the meanings given to them in the Plan. Except where the terms and provisions of this Award Agreement specifically state that they supersede the terms or provisions of the Plan, in the event of a conflict between any term or provision contained in this Award Agreement and a term or provision of the Plan, all terms and provisions of the Plan will govern and prevail. |
|
2. |
The Awards granted pursuant to this Award Agreement are recorded in a notional account held by the Company in your name, to which you may refer at any time. |
|
3. |
Nothing contained in this Award Agreement or the Plan will give the Recipient or any other Person any interest or title in or to any Share or any rights as a shareholder of the Company (including, without limitation, any right to receive dividends or other distributions from the Company, voting rights, warrants or rights under any rights offering) or any other legal or equitable right against the Company whatsoever, other than as set forth in this Award Agreement and in the Plan. |
|
4. |
If the Recipient voluntarily Retires, the Committee may, in its sole discretion but will have no obligation to, accelerate the vesting of any unvested Awards granted pursuant to this Award Agreement. In exercising its discretion, the Committee will consider the nature of the Recipient’s withdrawal from employment or office with the Company or Affiliate, including without limitation the notice period given by the Recipient, the transition responsibilities carried out by the Recipient and the Recipient’s adherence to any applicable restrictive covenants. |
|
5. |
The Recipient will not be obligated to settle any Awards granted pursuant to this Award Agreement on the vesting date of such Awards but may elect to settle at any time after such vesting date. |
|
6. |
Nothing in the Plan or in this Award Agreement will affect the Company’s right, or that of an Affiliate, to terminate the employment or term of office or engagement of a Recipient at any time for any reason whatsoever. Upon such termination, the Recipient’s rights in respect of the Awards granted under this Award Agreement will be subject to restrictions and time limits, the complete details of which are set out in the Plan. |
|
7. |
Without restriction, and for the avoidance of doubt, the Recipient agrees that the Recipient will not be entitled to any rights to accrue, vest or exercise any Awards during or in respect of any termination notice or severance period under the Recipient’s employment agreement or employment arrangements. |
|
8. |
Each notice relating to the Awards must be in writing. All notices to the Company must be delivered personally or by prepaid registered mail and must be addressed to the Chief Financial Officer of the Company with a copy to the Company Secretary of the Company. All notices to the Recipient will be addressed to the principal address of the Recipient on file with the Company. Either the Company or the Recipient may designate a different address by written notice to the other. Such notices are deemed to be received, if delivered personally, on the date of delivery, and if sent by prepaid, registered mail, on the fifth business day following the date of mailing. Any notice given by either the Recipient or the Company is not binding on the recipient of such notice until received. |
|
9. |
Subject to 8.3 or 10.7 of the Plan, as applicable, any Award granted pursuant to this Award Agreement may only be held during the lifetime of the Recipient by the Recipient personally and no assignment or transfer of an Award, whether voluntary, involuntary, by operation of law or otherwise, vests any interest or right in such Award whatsoever in any assignee or transferee, and immediately upon any assignment or transfer or any attempt to make such assignment or transfer, the Award granted under this Award Agreement terminates and is of no further force or effect. Complete details of this restriction are set out in the Plan. |
|
10. |
In the event of a Change of Control, all PUs granted pursuant to this Award Agreement shall immediately vest and the value of such PUs shall be paid out in cash within 30 days subsequent to the Change of Control in an amount based on the Change of Control Price. For the avoidance of doubt, the Committee shall have no discretion regarding the form of payment and there shall be no Alternative Awards as described in Article 14 of the Plan. |
|
11. |
The Recipient hereby acknowledges and agrees that: |
|
(a) |
any rule, regulation or determination, including the interpretation by the Committee, with respect to the Awards granted under this Award Agreement and, if applicable, its exercise, is final and conclusive for all purposes and binding on all Persons, including the Company and the Recipient; |
|
(b) |
the participation of the Recipient in the Plan is entirely voluntary; and |
|
(c) |
the Recipient has been advised to obtain independent legal and tax advice prior to entering into this Award Agreement and by entering this Agreement the Recipient represents that he or she did obtain whatever independent legal and tax advice he or she considered appropriate and sufficient. |
|
12. |
By signing this Award Agreement, the Recipient represents and warrants that (i) under the terms and conditions of the Plan he is an Eligible Participant (as defined in the Plan) entitled to receive the Award, and (ii) he is not in the United States or a U.S. person, nor is he acquiring the Award for the benefit of a person in the United States or a U.S. person. Furthermore, the Recipient understands that the Award may not be exercised in the United States or by or on behalf of a U.S. person unless the Award has been registered under the Act or is exempt from registration thereunder. The Company may condition the Award upon receiving from the Recipient such representations and warranties and such evidence of registration or exemption under the Act as is satisfactory to the Company, acting in its sole discretion. |
|
13. |
This Award Agreement has been made in and is to be construed under and in accordance with the laws of the Province of Ontario and the laws of Canada applicable in the Province of Ontario. |
|
CALEDONIA MINING CORPORATION PLC |
||
|
By: |
||
I have read the foregoing Award Agreement and hereby accept the Award in accordance with and subject to the terms and conditions of this Award Agreement and the Plan. I understand that I may review the complete text of the Plan by contacting the Company Secretary. I agree to be bound by the terms and conditions of the Plan governing the Award.
|
Date Accepted |
Recipient’s Signature |
|
|
Recipient’s Name |
APPENDIX A
APPENDIX A
PERFORMANCE MULTIPLIER
The Performance Multiplier will be based on the following metrics and weightings. The number of PUs to vest on the PUs Vesting Date will be determined based on the Performance Multiplier and scorecard, calculated as follows:
|
Metric |
Weighting |
Description |
Threshold |
Below |
Threshold |
Target |
Target |
Stretch |
Max (Stretch |
|
Gold Production (oz) over 3 years |
50% |
||||||||
|
Gold Production (oz) over 3 years at Blanket |
42.5% |
Aggregate vs. guidance gold production |
225 000 (Blanket – 75 000 per year) |
Below Threshold 0% (no PU’s vest) |
50% of PUs vest |
240 000 (Blanket – 80 000 per year) |
100% of PUs vest |
260 000 (Blanket 86 667 per year) |
150% of PUs vest if stretch or more is achieved |
|
Gold Production (oz) over 3 years at Bilboes |
7.5% |
Aggregate vs. guidance gold production annually |
Lower End of Annual Bilboes Guidance |
Below Threshold 0% (no PU’s vest) |
50% of PUs vest |
Mid Point of annual Bilboes Guidance |
100% of PUs vest |
Upper End of Annual Bilboes Guidance |
150% of PUs vest if stretch or more is achieved |
|
Cost Per Ounce |
50% |
||||||||
|
On mine costs at Blanket and Bilboes plus other on mine costs plus head office “G&A” Other costs include: ► procurement margins paid to SA and Dubai ► the profit arising in solar co for electricity sales to Blanket |
50% |
Controllable Cost per ounce of gold produced vs. budgeted number for each Financial Year. Averaged over the 3-year vesting period. |
105% of Target |
Below Threshold 0% (no PU’s vest) |
50% of PUs vest |
x for 2023 (1/3 2023; 1/3 2024; 1/3 2025) |
100% of PUs vest |
95% of target |
150% of PUs vest if stretch or more is achieved |
Notes: Linear interpolation will be applied to vesting between Threshold and Target. Stepped vesting will be applied to vesting between Target and the midpoint between Target and Stretch (“Midpoint”). Linear interpolation will then be applied between the Midpoint and Stretch. The number of PUs vesting at Stretch and above will be capped at 150%. As shown below:
|
Performance attained |
||||||||
|
Less than Threshold |
Threshold |
Between Threshold and Target |
Target |
Between Target and Midpoint |
Midpoint |
Between Midpoint and Stretch |
Stretch or more |
|
|
No. of PUs that will vest |
0% |
50% |
Linear vesting from 50% to 100% |
100% |
100% |
125% |
Linear vesting from 125% to 150% |
150% maximum |
Further Notes:
(1) For the purposes of determining whether a target has been met, reported financial statements will be used.
(2) As per the table above, a performance score less than Threshold will result in zero PUs vesting, and if Threshold is met, 50% of the PUs will vest. Linear interpolation will be applied to vesting between Threshold and Target; Any achievement greater than Target but less than the Midpoint will result in 100% of the PUs vesting. Achievement at the Midpoint will result in 125% of the PUs vesting. Linear interpolation applies between the Midpoint and Stretch, where a maximum of 150% of PUs vest.
Exhibit 4.22
THE AWARD HAS NOT BEEN REGISTERED UNDER THE U.S. SECURITIES ACT OF 1933, AS AMENDED (THE “ACT”), AND MAY NOT BE OFFERED OR SOLD IN THE UNITED STATES OR TO U.S. PERSONS UNLESS SUCH SECURITIES ARE REGISTERED UNDER THE ACT, OR AN EXEMPTION FROM THE REGISTRATION REQUIREMENTS OF THE ACT ARE AVAILABLE. THE TERMS “UNITED STATES” AND “U.S. PERSON” ARE AS DEFINED IN REGULATION S UNDER THE ACT.
2015 OMNIBUS EQUITY INCENTIVE COMPENSATION PLAN
Award Agreement
Caledonia Mining Corporation Plc (the “Company”) hereby grants the following Performance Units (“PUs”) to the Participant named below (the “Recipient”), in accordance with and subject to the terms, conditions and restrictions of this Agreement, together with the provisions of the 2015 Omnibus Equity Incentive Compensation Plan (the “Plan”) of the Company for services rendered to the Company and its subsidiaries:
|
Name of Recipient: |
[ ] |
Grant of PUs:
|
Date of Grant: |
April 8, 2024 (“PUs Grant Date”). |
|
|
Value of PUs at Date of Grant: |
US$[ ] |
|
|
Price Per Share at Date of Grant: |
US$[ ] |
|
|
Target Number of PUs: |
[ ] (“Target PUs”) |
|
|
Vesting Dates of PUs: |
Subject to any reduction, cancellation, forfeiture or acceleration in vesting as provided in the Plan or this Award Agreement, the PUs granted pursuant to this Award Agreement will vest as to one third on each of the first business day in April 2025, 2026 and 2027 (following the publication of annual financial results) provided that if there is a closed period for whatever reason in force at such time the vesting will be the first business day following the end of such closed period (“PUs Vesting Date”). |
______________________
1 The Fair Market Value of a Share underlying a PU shall be equal to the greater of (i) the volume weighted average trading price of the Shares on the NYSE American for the five trading days preceding the relevant date in which such valuation occurs or (ii) the closing price of the Shares on the NYSE American on the trading day immediately prior to such valuation date (i.e., grant date, dividend payment date, settlement date) (the “PU Share Price”).
|
Performance Measures: |
The number of PUs which will vest on each of the PUs Vesting Dates (including an increase or decrease in the Target PUs) will be a third of the Target PUs multiplied by the score determined in accordance with Appendix A (the “Performance Multiplier”) to this Award Agreement. |
|
|
Performance Period: |
January 1, 2024 to December 31, 2024; January 1, 2025 to December 31, 2025; and January 1, 2026 to December 31, 2026 for each third of Target PUs. |
|
|
Dividend Reinvestment: |
The Recipient will be entitled to receive, from and after each of the PUs Vesting Dates until settlement of the relevant PUs, for each vested PU held at the time of payment of a dividend by the Company, the cash equivalent of such dividend declared by the Company on one Share. Such cash equivalents paid by the Company shall, with respect to each vested PU, be automatically reinvested in additional PUs at a price per PU equal to the then applicable PU Share Price. For the avoidance of doubt, all additional PUs accrued to the Recipient through dividend reinvestment shall be subject to the terms, conditions and restrictions of this Agreement and the Plan. No PUs accrued to the Recipient through dividend reinvestment shall be subject to adjustment, either upwards or downwards, by the Performance Multiplier. |
|
|
Settlement: |
The settlement value of vesting PUs shall be an amount equal to a third of the Target PUs (after application of the Performance Multiplier) multiplied by the PU Share Price. Such settlement value may be paid to the Recipient in the same currency and in the same manner that the Recipient receives his or her regular compensation.
Notwithstanding the foregoing, the Recipient may, except in the event of a Change of Control, request that settlement be made in whole or in part in the form of Shares at a value equal to the then applicable PU Share Price at the date of settlement (in other words, equal to the number of vesting PUs) and, in the event that such request is made, the Company shall endeavour to satisfy such request to issue Shares subject to there being, if the Recipient is a resident of Zimbabwe, a current listing of Shares or securities representing them on a Zimbabwe securities exchange or an alternative mechanism satisfactory to the Company and in accordance with and all applicable law and regulations (including, but not limited to, any restrictions on the issue of securities pursuant to the Plan and the Company’s share dealing code in force from time to time and the requirements of any securities exchange upon which the Shares are then listed) and otherwise on such terms and conditions as the Committee may determine. |
|
|
Death of the Recipient: |
If the Recipient dies while an Employee of the Company or an Affiliate, any PUs held by the Recipient that have not vested will immediately vest and will be settled with the estate of the Recipient as soon as practicable. The Performance Multiplier will be applied to determine the number of PUs that vest as if the applicable Performance Period has been completed. If a Performance Period is in progress at the time of the Recipient’s death or for future Performance Periods, the Performance Multiplier will be calculated on the basis of the Performance Measures achieved at the end of the immediately preceding interim period. The determination of the foregoing will be in the sole and unfettered discretion of the Committee. |
|
1. |
The terms and conditions of the Plan are hereby incorporated by reference as terms and conditions of this Award Agreement and all capitalized terms used in this Award Agreement, unless expressly defined in a different manner, have the meanings given to them in the Plan. Except where the terms and provisions of this Award Agreement specifically state that they supersede the terms or provisions of the Plan, in the event of a conflict between any term or provision contained in this Award Agreement and a term or provision of the Plan, all terms and provisions of the Plan will govern and prevail. |
|
2. |
The Awards granted pursuant to this Award Agreement are recorded in a notional account held by the Company in your name, to which you may refer at any time. |
|
3. |
Nothing contained in this Award Agreement or the Plan will give the Recipient or any other Person any interest or title in or to any Share or any rights as a shareholder of the Company (including, without limitation, any right to receive dividends or other distributions from the Company, voting rights, warrants or rights under any rights offering) or any other legal or equitable right against the Company whatsoever, other than as set forth in this Award Agreement and in the Plan. |
|
4. |
If the Recipient voluntarily Retires, the Committee may, in its sole discretion but will have no obligation to, accelerate the vesting of any unvested Awards granted pursuant to this Award Agreement. In exercising its discretion, the Committee will consider the nature of the Recipient’s withdrawal from employment or office with the Company or Affiliate, including without limitation the notice period given by the Recipient, the transition responsibilities carried out by the Recipient and the Recipient’s adherence to any applicable restrictive covenants. |
|
5. |
The Recipient will not be obligated to settle any Awards granted pursuant to this Award Agreement on the vesting dates of such Awards but may elect to settle at any time after such vesting dates. |
|
6. |
Nothing in the Plan or in this Award Agreement will affect the Company’s right, or that of an Affiliate, to terminate the employment or term of office or engagement of a Recipient at any time for any reason whatsoever. Upon such termination, the Recipient’s rights in respect of the Awards granted under this Award Agreement will be subject to restrictions and time limits, the complete details of which are set out in the Plan. |
|
7. |
Without restriction, and for the avoidance of doubt, the Recipient agrees that the Recipient will not be entitled to any rights to accrue, vest or exercise any Awards during or in respect of any termination notice or severance period under the Recipient’s employment agreement or employment arrangements. |
|
8. |
Each notice relating to the Awards must be in writing. All notices to the Company must be delivered personally or by prepaid registered mail and must be addressed to the Chief Financial Officer of the Company with a copy to the Company Secretary of the Company. All notices to the Recipient will be addressed to the principal address of the Recipient on file with the Company. Either the Company or the Recipient may designate a different address by written notice to the other. Such notices are deemed to be received, if delivered personally, on the date of delivery, and if sent by prepaid, registered mail, on the fifth business day following the date of mailing. Any notice given by either the Recipient or the Company is not binding on the recipient of such notice until received. |
|
9. |
Subject to 8.3 or 10.7 of the Plan, as applicable, any Award granted pursuant to this Award Agreement may only be held during the lifetime of the Recipient by the Recipient personally and no assignment or transfer of an Award, whether voluntary, involuntary, by operation of law or otherwise, vests any interest or right in such Award whatsoever in any assignee or transferee, and immediately upon any assignment or transfer or any attempt to make such assignment or transfer, the Award granted under this Award Agreement terminates and is of no further force or effect. Complete details of this restriction are set out in the Plan. |
|
10. |
In the event of a Change of Control, all PUs granted pursuant to this Award Agreement shall immediately vest and the value of such PUs shall be paid out in cash within 30 days subsequent to the Change of Control in an amount based on the Change of Control Price. For the avoidance of doubt, the Committee shall have no discretion regarding the form of payment and there shall be no Alternative Awards as described in Article 14 of the Plan. |
|
11. |
The Recipient hereby acknowledges and agrees that: |
|
(a) |
any rule, regulation or determination, including the interpretation by the Committee, with respect to the Awards granted under this Award Agreement and, if applicable, its exercise, is final and conclusive for all purposes and binding on all Persons, including the Company and the Recipient; |
|
(b) |
the participation of the Recipient in the Plan is entirely voluntary; and |
|
(c) |
the Recipient has been advised to obtain independent legal and tax advice prior to entering into this Award Agreement and by entering this Agreement the Recipient represents that he or she did obtain whatever independent legal and tax advice he or she considered appropriate and sufficient. |
|
12. |
By signing this Award Agreement, the Recipient represents and warrants that (i) under the terms and conditions of the Plan he is an Eligible Participant (as defined in the Plan) entitled to receive the Award, and (ii) he is not in the United States or a U.S. person, nor is he acquiring the Award for the benefit of a person in the United States or a U.S. person. Furthermore, the Recipient understands that the Award may not be exercised in the United States or by or on behalf of a U.S. person unless the Award has been registered under the Act or is exempt from registration thereunder. The Company may condition the Award upon receiving from the Recipient such representations and warranties and such evidence of registration or exemption under the Act as is satisfactory to the Company, acting in its sole discretion. |
|
13. |
This Award Agreement has been made in and is to be construed under and in accordance with the laws of the Province of Ontario and the laws of Canada applicable in the Province of Ontario. |
|
CALEDONIA MINING CORPORATION PLC |
||
|
By: |
||
I have read the foregoing Award Agreement and hereby accept the Award in accordance with and subject to the terms and conditions of this Award Agreement and the Plan. I understand that I may review the complete text of the Plan by contacting the Company Secretary. I agree to be bound by the terms and conditions of the Plan governing the Award.
|
Date Accepted |
Recipient’s Signature |
|
|
Recipient’s Name |
APPENDIX A
PERFORMANCE MULTIPLIER
The Performance Multiplier will be based on the following metrics and weightings. The number of PUs to vest on the PUs Vesting Date will be determined based on the Performance Multiplier and scorecard, calculated as follows:
|
Metric |
Weighting |
Description |
Threshold |
Below |
Threshold |
Target |
Target |
Stretch |
Max |
|
Gold production (oz) at Blanket |
40% |
Aggregate vs. guidance gold production |
Lower end of production guidance. |
Below threshold 0% (no PU’s vest). |
50% of PUs vest |
Production at target guidance. |
100% of PUs vest |
Upper end of production guidance. |
150% of PUs vest if stretch or more is achieved |
|
Blanket resource development |
20% |
Resource addition at Blanket within current infrastructure |
Maintain resource endowment (measured and indicated) after depletions |
Below threshold 0% (no PU’s vest) |
50% of PUs vest |
5% per annum increase in M&I after depletions |
100% of PUs vest |
10% per annum increase in M&I after depletions |
150% of PUs vest if stretch or more is achieved |
|
Bilboes |
20% |
Financing and construction of Bilboes sulphide project |
Financed and operational by end of Q1 2028 |
Below threshold 0% (no PU’s vest) |
50% of PUs vest |
Financed and operational by end 2027 |
100% of PUs vest |
Financed and operational by mid 2027 |
150% of PUs vest if stretch or more is achieved |
|
Blue sky exploration |
20% |
E.g. exploration below 1,200m; Blanket BIF, Motapa and elsewhere. All subject to funds being made available |
Zero |
Below threshold 0% (no PU’s vest) |
50% of PUs vest |
0.5m ounces (MI and I) each year |
100% of PUs vest |
1m ounces (MI and I) each year |
150% of PUs vest if stretch or more is achieved |
Notes: Linear interpolation will be applied to vesting between Threshold and Target. Stepped vesting will be applied to vesting between Target and the midpoint between Target and Stretch (“Midpoint”). Linear interpolation will then be applied between the Midpoint and Stretch. The number of PUs vesting at Stretch and above will be capped at 150%. As shown below:
|
Performance attained |
||||||||
|
Less than |
Threshold |
Between |
Target |
Between |
Midpoint |
Between |
Stretch or |
|
|
No. of PUs that will vest |
0% |
50% |
Linear vesting from 50% to 100% |
100% |
100% |
125% |
Linear vesting from 125% to 150% |
150% maximum |
Further Notes:
(1) For the purposes of determining whether a target has been met, reported financial statements will be used.
(2) As per the table above, a performance score less than Threshold will result in zero PUs vesting, and if Threshold is met, 50% of the PUs will vest. Linear interpolation will be applied to vesting between Threshold and Target; Any achievement greater than Target but less than the Midpoint will result in 100% of the PUs vesting. Achievement at the Midpoint will result in 125% of the PUs vesting. Linear interpolation applies between the Midpoint and Stretch, where a maximum of 150% of PUs vest.
(3) For the Bilboes metric, the Committee will rely on management’s forecast for Bilboes.
Exhibit 4.23
THE AWARD HAS NOT BEEN REGISTERED UNDER THE U.S. SECURITIES ACT OF 1933, AS AMENDED (THE “ACT”), AND MAY NOT BE OFFERED OR SOLD IN THE UNITED STATES OR TO U.S. PERSONS UNLESS SUCH SECURITIES ARE REGISTERED UNDER THE ACT, OR AN EXEMPTION FROM THE REGISTRATION REQUIREMENTS OF THE ACT ARE AVAILABLE. THE TERMS “UNITED STATES” AND “U.S. PERSON” ARE AS DEFINED IN REGULATION S UNDER THE ACT.
2015 OMNIBUS EQUITY INCENTIVE COMPENSATION PLAN
Award Agreement
Caledonia Mining Corporation Plc (the “Company”) hereby grants the following Performance Units (“PUs”) to the Participant named below (the “Recipient”), in accordance with and subject to the terms, conditions and restrictions of this Agreement, together with the provisions of the 2015 Omnibus Equity Incentive Compensation Plan (the “Plan”) of the Company for services rendered to the Company and its subsidiaries:
|
Name of Recipient: |
[ ] |
Grant of PUs:
|
Date of Grant: |
April 8, 2024 (“PUs Grant Date”). |
|
|
Value of PUs at Date of Grant: |
US$[ ] |
|
|
Price Per Share at Date of Grant: |
US$[ ] |
|
|
Target Number of PUs: |
[ ] (“Target PUs”) |
|
|
Vesting Date of PUs: |
Subject to any reduction, cancellation, forfeiture or acceleration in vesting as provided in the Plan or this Award Agreement, the PUs granted pursuant to this Award Agreement will vest on the first business day in April 2027 (following the publication of annual financial results) provided that if there is a closed period for whatever reason in force at such time the vesting will be the first business day following the end of such closed period (“PUs Vesting Date”). |
|
|
Performance Measures: |
The number of PUs which will vest on the PUs Vesting Date (including an increase or decrease in the Target PUs) will be equal to the Target PUs multiplied by the score determined in accordance with Appendix A (the “Performance Multiplier”) which shall be appended to this Award Agreement by way of an addendum. |
|
|
Performance Period: |
January 1, 2024 to December 31, 2026. |
______________________
1 The Fair Market Value of a Share underlying a PU shall be equal to the greater of (i) the volume weighted average trading price of the Shares on the NYSE American for the five trading days preceding the relevant date in which such valuation occurs or (ii) the closing price of the Shares on the NYSE American on the trading day immediately prior to such valuation date (i.e., grant date, dividend payment date, settlement date) (the “PU Share Price”).
|
Dividend Reinvestment: |
The Recipient will be entitled to receive, from and after the PUs Vesting Date until settlement of the PUs, for each vested PU held at the time of payment of a dividend by the Company, the cash equivalent of such dividend declared by the Company on one Share. Such cash equivalents paid by the Company shall, with respect to each vested PU, be automatically reinvested in additional PUs at a price per PU equal to the then applicable PU Share Price. For the avoidance of doubt, all additional PUs accrued to the Recipient through dividend reinvestment shall be subject to the terms, conditions and restrictions of this Agreement and the Plan. No PUs accrued to the Recipient through dividend reinvestment shall be subject to adjustment, either upwards or downwards, by the Performance Multiplier. |
|
|
Settlement: |
The settlement value of the PUs shall be an amount equal to the Target Number of PUs (after application of the Performance Multiplier) multiplied by the PU Share Price. Such settlement value shall, except in the event of a Change of Control whereby the value will be paid in cash, be paid in the form of Shares at a value equal to the then applicable PU Share Price at the date of settlement (in other words, equal to the number of vesting PUs) and in accordance with all applicable law and regulations (including, but not limited to, any restrictions on the issue of securities pursuant to the Plan and the Company’s share dealing code in force from time to time and the requirements of any securities exchange upon which the Shares or securities representing them are then listed) and otherwise on such terms and conditions as the Committee may determine. |
|
|
Death of the Recipient: |
If the Recipient dies while an Employee of the Company or an Affiliate, any PUs held by the Recipient that have not vested will immediately vest and will be settled with the estate of the Recipient as soon as practicable. The Performance Multiplier will be applied to determine the number of PUs that vest as if the applicable Performance Period has been completed. If a Performance Period is in progress at the time of the Recipient’s death or for future Performance Periods, the Performance Multiplier will be calculated on the basis of the Performance Measures achieved at the end of the immediately preceding quarter period. The determination of the foregoing will be in the sole and unfettered discretion of the Committee. |
|
|
Minimum Holding Period and Forfeiture: |
The Recipient shall hold any Shares or securities representing them issued pursuant to this Award Agreement until at least the first anniversary of the PUs Vesting Date. During that period, if the Committee exercises its discretion pursuant to article 18.1 of the Plan (and in such an instance “within 45 days” shall instead read “before the first anniversary of the PUs Vesting Date” in article 18.1) and resolves that the Recipient’s award pursuant to this Award Agreement shall be reduced, cancelled or forfeited, the Recipient hereby appoints the Company’s broker to sell such number of Shares or securities representing them as the Committee decides is appropriate to fully or partially compensate the Company for the action or omission of the Recipient or other event which resulted in the Committee’s decision to reduce, cancel or forfeit the award. A cash amount equal to the funds raised shall be paid over to the Company. Should the amount generated from the sale of Shares or securities representing them not be enough to fully compensate the Company in the amount the Committee decides is appropriate, the Recipient shall account to the Company for the remainder in cash by such date as the Committee shall determine, PROVIDED THAT the amount of cash payable by the Recipient, including that realised from the sale of Shares or securities representing them, shall not exceed the gross (i.e. before tax) amount receivable by the Recipient upon settlement. These provisions are without prejudice to article 18.1, other than the amendment referred to herein. |
|
1. |
The terms and conditions of the Plan are hereby incorporated by reference as terms and conditions of this Award Agreement and all capitalized terms used in this Award Agreement, unless expressly defined in a different manner, have the meanings given to them in the Plan. Except where the terms and provisions of this Award Agreement specifically state that they supersede the terms or provisions of the Plan, in the event of a conflict between any term or provision contained in this Award Agreement and a term or provision of the Plan, all terms and provisions of the Plan will govern and prevail. |
|
2. |
The Awards granted pursuant to this Award Agreement are recorded in a notional account held by the Company in your name, to which you may refer at any time. |
|
3. |
Nothing contained in this Award Agreement or the Plan will give the Recipient or any other Person any interest or title in or to any Share or any rights as a shareholder of the Company (including, without limitation, any right to receive dividends or other distributions from the Company, voting rights, warrants or rights under any rights offering) or any other legal or equitable right against the Company whatsoever, other than as set forth in this Award Agreement and in the Plan. |
|
4. |
If the Recipient voluntarily Retires, the Committee may, in its sole discretion but will have no obligation to, accelerate the vesting of any unvested Awards granted pursuant to this Award Agreement. In exercising its discretion, the Committee will consider the nature of the Recipient’s withdrawal from employment or office with the Company or Affiliate, including without limitation the notice period given by the Recipient, the transition responsibilities carried out by the Recipient and the Recipient’s adherence to any applicable restrictive covenants. |
|
5. |
The Recipient will not be obligated to settle any Awards granted pursuant to this Award Agreement on the vesting date of such Awards but may elect to settle at any time after such vesting date. |
|
6. |
Nothing in the Plan or in this Award Agreement will affect the Company’s right, or that of an Affiliate, to terminate the employment or term of office or engagement of a Recipient at any time for any reason whatsoever. Upon such termination, the Recipient’s rights in respect of the Awards granted under this Award Agreement will be subject to restrictions and time limits, the complete details of which are set out in the Plan. |
|
7. |
Without restriction, and for the avoidance of doubt, the Recipient agrees that the Recipient will not be entitled to any rights to accrue, vest or exercise any Awards during or in respect of any termination notice or severance period under the Recipient’s employment agreement or employment arrangements. |
|
8. |
Each notice relating to the Awards must be in writing. All notices to the Company must be delivered personally or by prepaid registered mail and must be addressed to the Chief Financial Officer of the Company with a copy to the Company Secretary of the Company. All notices to the Recipient will be addressed to the principal address of the Recipient on file with the Company. Either the Company or the Recipient may designate a different address by written notice to the other. Such notices are deemed to be received, if delivered personally, on the date of delivery, and if sent by prepaid, registered mail, on the fifth business day following the date of mailing. Any notice given by either the Recipient or the Company is not binding on the recipient of such notice until received. |
|
9. |
Subject to 8.3 or 10.7 of the Plan, as applicable, any Award granted pursuant to this Award Agreement may only be held during the lifetime of the Recipient by the Recipient personally and no assignment or transfer of an Award, whether voluntary, involuntary, by operation of law or otherwise, vests any interest or right in such Award whatsoever in any assignee or transferee, and immediately upon any assignment or transfer or any attempt to make such assignment or transfer, the Award granted under this Award Agreement terminates and is of no further force or effect. Complete details of this restriction are set out in the Plan. |
|
10. |
In the event of a Change of Control, all PUs granted pursuant to this Award Agreement shall immediately vest and the value of such PUs shall be paid out in cash within 30 days subsequent to the Change of Control in an amount based on the Change of Control Price. For the avoidance of doubt, the Committee shall have no discretion regarding the form of payment and there shall be no Alternative Awards as described in Article 14 of the Plan. |
|
11. |
The Recipient hereby acknowledges and agrees that: |
|
(a) |
any rule, regulation or determination, including the interpretation by the Committee, with respect to the Awards granted under this Award Agreement and, if applicable, its exercise, is final and conclusive for all purposes and binding on all Persons, including the Company and the Recipient; |
|
(b) |
the participation of the Recipient in the Plan is entirely voluntary; and |
|
(c) |
the Recipient has been advised to obtain independent legal and tax advice prior to entering into this Award Agreement and by entering this Agreement the Recipient represents that he or she did obtain whatever independent legal and tax advice he or she considered appropriate and sufficient. |
|
12. |
By signing this Award Agreement, the Recipient represents and warrants that (i) under the terms and conditions of the Plan he is an Eligible Participant (as defined in the Plan) entitled to receive the Award, and (ii) he is not in the United States or a U.S. person, nor is he acquiring the Award for the benefit of a person in the United States or a U.S. person. Furthermore, the Recipient understands that the Award may not be exercised in the United States or by or on behalf of a U.S. person unless the Award has been registered under the Act or is exempt from registration thereunder. The Company may condition the Award upon receiving from the Recipient such representations and warranties and such evidence of registration or exemption under the Act as is satisfactory to the Company, acting in its sole discretion. |
|
13. |
This Award Agreement has been made in and is to be construed under and in accordance with the laws of the Province of Ontario and the laws of Canada applicable in the Province of Ontario. |
|
CALEDONIA MINING CORPORATION PLC |
||
|
By: |
||
I have read the foregoing Award Agreement and hereby accept the Award in accordance with and subject to the terms and conditions of this Award Agreement and the Plan. I understand that I may review the complete text of the Plan by contacting the Company Secretary. I agree to be bound by the terms and conditions of the Plan governing the Award.
|
Date Accepted |
Recipient’s Signature |
|
|
Recipient’s Name |
APPENDIX A
PERFORMANCE MULTIPLIER
The Performance Multiplier will be based on the following metrics and weightings. The number of PUs to vest on the PUs Vesting Date will be determined based on the Performance Multiplier and scorecard, calculated as follows:
|
Metric |
Weighting |
Description |
Threshold |
Below |
Threshold |
Target |
Target |
Stretch |
Max (Stretch |
|
Gold production (oz) over 3 years at Blanket |
40% |
Aggregate vs. guidance gold production |
Lower end of 3yr production guidance |
Below threshold 0% (no PU’s vest) |
50% of PUs vest |
3yr production at target guidance |
100% of PUs vest |
Upper end of 3yr production guidance |
150% of PUs vest if stretch or more is achieved |
|
Blanket resource development |
20% |
Resource addition at Blanket within current infrastructure |
Maintain resource endowment (measured and indicated) after depletions |
Below threshold 0% (no PU’s vest) |
50% of PUs vest |
5% per annum increase in M&I after depletions |
100% of PUs vest |
10% per annum increase in M&I after depletions |
150% of PUs vest if stretch or more is achieved |
|
Bilboes |
20% |
Financing and construction of Bilboes sulphide project |
Financed and operational by end of Q1 2028 |
Below threshold 0% (no PU’s vest) |
50% of PUs vest |
Financed and operational by end 2027 |
100% of PUs vest |
Financed and operational by mid 2027 |
150% of PUs vest if stretch or more is achieved |
|
Blue sky exploration |
20% |
E.g. exploration below 1,200m; Blanket BIF, Motapa and elsewhere. All subject to funds being made available |
Zero |
Below threshold 0% (no PU’s vest) |
50% of PUs vest |
0.5m ounces (MI and I) |
100% of PUs vest |
1m ounces (MI and I) |
150% of PUs vest if stretch or more is achieved |
Notes: Linear interpolation will be applied to vesting between Threshold and Target. Stepped vesting will be applied to vesting between Target and the midpoint between Target and Stretch (“Midpoint”). Linear interpolation will then be applied between the Midpoint and Stretch. The number of PUs vesting at Stretch and above will be capped at 150%. As shown below:
|
Performance attained |
||||||||
|
Less than |
Threshold |
Between |
Target |
Between |
Midpoint |
Between |
Stretch or |
|
|
No. of PUs that will vest |
0% |
50% |
Linear vesting from 50% to 100% |
100% |
100% |
125% |
Linear vesting from 125% to 150% |
150% maximum |
Further Notes:
(1) For the purposes of determining whether a target has been met, reported financial statements will be used.
(2) As per the table above, a performance score less than Threshold will result in zero PUs vesting, and if Threshold is met, 50% of the PUs will vest. Linear interpolation will be applied to vesting between Threshold and Target; Any achievement greater than Target but less than the Midpoint will result in 100% of the PUs vesting. Achievement at the Midpoint will result in 125% of the PUs vesting. Linear interpolation applies between the Midpoint and Stretch, where a maximum of 150% of PUs vest.
(3) For the Bilboes metric, the Committee will rely on management’s forecast for Bilboes.
Exhibit 8.1
List of Caledonia Mining Corporation Plc group entities
|
Country of incorporation |
Legal shareholding (year end) |
|||
|
2023 |
2022 |
2021 |
||
|
Subsidiaries within the Caledonia Mining Corporation Plc Group |
% |
% |
% |
|
|
Caledonia Holdings Zimbabwe (Private) Limited (1) |
Zimbabwe |
100 |
100 |
100 |
|
Caledonia Mining Services (Private) Limited |
Zimbabwe |
100 |
100 |
100 |
|
Fintona Investments Proprietary Limited |
South Africa |
100 |
100 |
100 |
|
Caledonia Mining South Africa Proprietary Limited (1) |
South Africa |
100 |
100 |
100 |
|
Greenstone Management Services Holdings Limited |
United Kingdom |
100 |
100 |
100 |
|
Blanket Mine (1983) (Private) Limited (2) |
Zimbabwe |
64 |
64 |
64 |
|
Caledonia (Connemara) (Pvt) Limited (2) |
Zimbabwe |
100 |
100 |
100 |
|
Caledonia (Maligreen) (Pvt) Limited (2) |
Zimbabwe |
100 |
100 |
100 |
|
Motapa Mining Company UK Limited |
United Kingdom |
100 |
100 |
- |
|
Arraskar Investments (Private) Limited (3) |
Zimbabwe |
100 |
100 |
- |
|
Bilboes Gold Limited |
Mauritius |
100 |
100 |
- |
|
Bilboes Holdings (Private) Limited (4) |
Zimbabwe |
100 |
100 |
- |
|
Caledonia Mining FZCO (1) |
Dubai |
100 |
100 |
- |
|
Caledonia (Bilboes & Motapa) (Private) Limited (3) |
Zimbabwe |
100 |
- |
|
|
1. |
Direct subsidiary of Greenstone Management Services Holdings Limited (United Kingdom) |
|
2. |
Direct subsidiary of Caledonia Holdings Zimbabwe (Private) Limited |
|
3. |
Direct subsidiary of Motapa Mining Company UK Limited |
|
4. |
Direct subsidiary of Bilboes Gold Limited |
Exhibit 12.1
CERTIFICATION OF CHIEF EXECUTIVE OFFICER PURSUANT TO SECTION 302 OF THE SARBANES-OXLEY ACT OF 2002
I, Mark Learmonth, certify that:
|
1. |
I have reviewed this annual report on Form 20-F of Caledonia Mining Corporation Plc (the “Company”). |
|
2. |
Based on my knowledge, this report does not contain any untrue statement of a material fact or omit to state a material fact necessary to make the statements made, in light of the circumstances under which such statements were made, not misleading with respect to the period covered by this report; |
|
3. |
Based on my knowledge, the financial statements, and other financial information included in this report, fairly present in all material respects the financial condition, results of operations and cash flows of the Company as of, and for, the periods presented in this report; |
|
4. |
The Company’s other certifying officers and I are responsible for establishing and maintaining disclosure controls and procedures (as defined in Exchange Act Rules 13a-15(e)) and 15d-15(e) and internal control over financial reporting (as defined in Exchange Act Rules 13a-15(f) and 15d-15(f) for the Company, and have: |
|
a. |
Designed such disclosure controls and procedures, or caused such disclosure controls and procedures to be designed under our supervision, to ensure that material information relating to the Company, including its consolidated subsidiaries, is made known to us by others within those entities, particularly during the period in which this report is being prepared; |
|
b. |
Designed such internal control over financial reporting, or caused such internal control over financial reporting to be designed under our supervision, to provide reasonable assurance regarding the reliability of financial reporting and the preparation of financial statements for external purposes in accordance with generally accepted accounting principles; |
|
c. |
Evaluated the effectiveness of the Company’s disclosure controls and procedures and presented in this report our conclusions about the effectiveness of the disclosure controls and procedures, as of the end of the period covered by this report based on such evaluation; and |
|
d. |
Disclosed in this report any change in the Company’s internal control over financial reporting that occurred during the period covered by the annual report that has materially affected, or is likely to materially affect, the Company’s internal control over financial reporting. |
|
5. |
The Company’s other certifying officers and I have disclosed, based on our most recent evaluation of internal control over financial reporting, to the Company’s auditors and the Audit Committee of the Company’s board of directors (or persons performing the equivalent function); |
|
a. |
All significant deficiencies and material weaknesses in the design or operation of internal controls over financial reporting which are reasonably likely to adversely affect the Company’s ability to record, process, summarize and report financial information; and |
|
b. |
Any, fraud, whether or not material, that involves management or other employees who have a significant role in the Company’s internal control over financial reporting. |
| Date: May 15, 2024 |
(signed).Mark Learmonth Chief Executive Officer |
Exhibit 12.2
CERTIFICATION OF CHIEF FINANCIAL OFFICER PURSUANT TO SECTION 302 OF THE SARBANES-OXLEY ACT OF 2002
I, Chester Goodburn, certify that:
|
1. |
I have reviewed this annual report on Form 20-F of Caledonia Mining Corporation Plc (the “Company”). |
|
2. |
Based on my knowledge, this report does not contain any untrue statement of a material fact or omit to state a material fact necessary to make the statements made, in light of the circumstances under which such statements were made, not misleading with respect to the period covered by this report; |
|
3. |
Based on my knowledge, the financial statements, and other financial information included in this report, fairly present in all material respects the financial condition, results of operations and cash flows of the Company as of, and for, the periods presented in this report; |
|
4. |
The Company’s other certifying officers and I are responsible for establishing and maintaining disclosure controls and procedures (as defined in Exchange Act Rules 13a-15(e)) and 15d-15(e) and internal control over financial reporting (as defined in Exchange Act Rules 13a-15(f) and 15d-15(f) for the Company, and have: |
|
a. |
Designed such disclosure controls and procedures, or caused such disclosure controls and procedures to be designed under our supervision, to ensure that material information relating to the Company, including its consolidated subsidiaries, is made known to us by others within those entities, particularly during the period in which this report is being prepared; |
|
b. |
Designed such internal control over financial reporting, or caused such internal control over financial reporting to be designed under our supervision, to provide reasonable assurance regarding the reliability of financial reporting and the preparation of financial statements for external purposes in accordance with generally accepted accounting principles; |
|
c. |
Evaluated the effectiveness of the company’s disclosure controls and procedures and presented in this report our conclusions about the effectiveness of the disclosure controls and procedures, as of the end of the period covered by this report based on such evaluation; and |
|
d. |
Disclosed in this report any change in the Company’s internal control over financial reporting that occurred during the period covered by the annual report that has materially affected, or is likely to materially affect, the Company’s internal control over financial reporting. |
|
5. |
The Company’s other certifying officers and I have disclosed, based on our most recent evaluation of internal control over financial reporting, to the company’s auditors and the audit committee of the company’s board of directors (or persons performing the equivalent function); |
|
a. |
All significant deficiencies and material weaknesses in the design or operation of internal controls over financial reporting which are reasonably likely to adversely affect the company’s ability to record, process, summarize and report financial information; and |
|
b. |
Any, fraud, whether or not material, that involves management or other employees who have a significant role in the Company’s internal control over financial reporting. |
| Date: May 15, 2024 |
(signed) Chester Goodburn Chief Financial Officer |
Exhibit 13.1
CERTIFICATION PURSUANT TO 18 U.S.C. SECTION 1350
AS ADOPTED PURSUANT TO SECTION 906 OF
THE SARBANES-OXLEY ACT OF 2002
In connection with the Annual Report on Form 20-F of Caledonia Mining Corporation Plc (the “Company”) for the year ended December 31, 2023 as filed with the Securities and Exchange Commission on the date hereof (the “Report”), that I, Mark Learmonth, Chief Executive Officer of the Company, certify, pursuant to Section 1350 of Chapter 63 of Title 18 of the United States Code 18 U.S.C.1350, as adopted pursuant to Section 906 of the Sarbanes-Oxley Act of 2002, that to the best of my knowledge:
|
1. |
The Report fully complies with the requirements of Rule 13(a) or 15(d) of the Securities Exchange Act of 1934; and |
|
2. |
The information contained in the Report fairly presents, in all material respects, the financial condition and results of operations of the Company as of, and for, the periods presented in the Report. |
|
By: |
(signed) Mark Learmonth Mark Learmonth, Chief Executive Officer Caledonia Mining Corporation Plc |
Date: May 15, 2024
A signed original of this written statement required by Section 906 has been provided by Mark Learmonth and will be retained by Caledonia Mining Corporation Plc and furnished to the Securities and Exchange Commission or its staff upon request.
Exhibit 13.2
CERTIFICATION PURSUANT TO 18 U.S.C. SECTION 1350
AS ADOPTED PURSUANT TO SECTION 906 OF
THE SARBANES-OXLEY ACT OF 2002
In connection with the Annual Report on Form 20-F of Caledonia Mining Corporation Plc (the “Company”) for the year ended December 31, 2023 as filed with the Securities and Exchange Commission on the date hereof (the “Report”), that I, Chester Goodburn, Chief Financial Officer of the Company, certify, pursuant to Section 1350 of Chapter 63 of Title 18 of the United States Code 18 U.S.C.1350, as adopted pursuant to Section 906 of the Sarbanes-Oxley Act of 2002, that to the best of my knowledge:
|
1 |
The Report fully complies with the requirements of Rule 13(a) or 15(d) of the Securities Exchange Act of 1934; and |
|
2. |
The information contained in the Report fairly presents, in all material respects, the financial condition and results of operations of the Company as of, and for, the periods presented in the Report. |
|
By: |
(signed) Chester Goodburn Chester Goodburn, Chief Financial Officer Caledonia Mining Corporation Plc |
Date: May 15, 2024
A signed original of this written statement required by Section 906 has been provided by Chester Goodburn and will be retained by Caledonia Mining Corporation Plc and furnished to the Securities and Exchange Commission or its staff upon request.
Exhibit 15.1
Consent of BDO South Africa Incorporated
 |
Tel: +27 011 488 1700 Fax: +27 010 060 7000 www.bdo.co.za |
Wanderers Office Park 52 Corlett Drive Illovo, 2196 Private Bag X60500 Houghton, 2041 South Africa |
Consent of Independent Registered Public Accounting Firm
Caledonia Mining Corporation, Plc.
We hereby consent to the incorporation by reference in the Registration Statements on Form F‐3 (No. 333-255500) of Caledonia Mining Corporation Plc of our report dated May 15, 2024 relating to the consolidated financial statements, which appears in this Annual Report on Form 20-F.
BDO South Africa Incorporated
Johannesburg
South Africa
May 15, 2024
BDO South Africa Incorporated
Registration number: 1995/002310/21
Practice number: 905526
VAT number: 4910148685
Chief Executive Officer: LD Mokoena
A full list of all company directors is available on www.bdo.co.za
The company's principal place of business is at The Wanderers Office Park, 52 Corlett Drive, Illovo, Johannesburg, where a list of directors' names is available for inspection. BDO South Africa Incorporated, a South African personal liability company, is a member of BDO International Limited, a UK company limited by guarantee, and forms part of the international BDO network of independent member firms.
Exhibit 15.2

// DRA Projects (PTY) LTD
Building 33, Woodlands Office Park, 20 Woodlands Drive, Woodlands, Sandton, 2080 / South Africa
PO Box 3567, Rivonia, Gauteng, 2128 / South Africa
T + 27 11 202 8600 / E info@draglobal.com / W draglobal.com
2024/05/15
I consent to the use of my name, or any quotation from, or summarization of, the technical report summaries entitled “Bilboes Gold Project Technical Report Summary“ with effective date December 31, 2023 and issued on May 15, 2024 prepared by us, and included or incorporated by reference in:
|
(i) |
the Annual Report on Form 20-F for the period ended December 31, 2023 (the “20-F”) of Cale- donia Mining Corporation Plc being filed with the United States Securities and Exchange Com- mission, and any amendments or supplements thereto; and |
|
(ii) |
the Company’s Form F Registration Statement (File No. 333-255500), and any amendments or supplements thereto. |
I further consent to the filing of the technical report summaries as exhibits to the 20-F.
 |
|
|
Tertius van Niekerk |
|
|
Senior Vice President Mining |
Date: May 15, 2024
Reg. No.: 2014/119088/07
Exhibit 15.3

CONSENT OF CRAIG HARVEY
I consent to the use of my name, or any quotation from, or summarization of, the technical report summary entitled “S-K 1300 Technical Report Summary on the Blanket Gold Mine, Zimbabwe”, with effective date of December 31, 2023 and issued on May 15, 2024, included or incorporated by reference in:
|
(i) |
the Annual Report on Form 20-F for the period ended December 31, 2023 of Caledonia Mining Corporation Plc being filed with the United States Securities and Exchange Commission, and any amendments or supplements thereto; and |
|
(ii) |
the Company’s Form F-3 Registration Statement (File No. 333-255500), and any amendments or supplements thereto. |
I further consent to the filing of the technical report summary as an exhibit thereto.
 |
|
| Craig Harvey, NHD Economic Geology | |
| MAIG, MGSSA | |
| Date: May 15, 2024 |
Exhibit 15.4
|
Caledonia Mining Corporation Plc S-K 1300 Technical Report Summary on the Blanket Gold Mine, Zimbabwe |

Caledonia Mining Corporation Plc
S-K 1300 Technical Report Summary on
the Blanket Gold Mine, Zimbabwe
|
QUALIFIED PERSONS: Mr. C Harvey NHD Econ. Geol MAIG, MGSSA
Mr M. Van Staden B. Eng (Mining) Pr. Eng MAMMSA, MSAIMM
Effective Date: 31 December 2023 Version: Final Issue Date: 15 May 2024 |
Caledonia Mining Corporation Plc
S-K 1300 Technical Report Summary on the Blanket Gold Mine, Zimbabwe
DATE AND SIGNATURE PAGE
This Report titled “S-K 1300 Technical Report Summary on the Blanket Gold Mine, Zimbabwe” has been prepared for Caledonia Mining Corporation Plc. The Report is compiled in accordance with the United States Securities and Exchange Commission Part 229 Standard Instructions for Filing Forms Regulation S-K subpart 1300. The effective date of this Report is 31 December 2023.
The Qualified Person (“QP”) responsible for the compilation of this Report is Mr. Craig Harvey who has relied on contributions from various sources.

__________________________________________________________
|
C HARVEY NHD Economic Geology MAIG (5458), MGSSA (966008) VP Technical Services Caledonia Mining |

__________________________________________________________
|
M VAN STADEN B. Eng (Mining) Pr. Eng (20150089). AMMSA (MB3709). SAIMM (20422) Technical Services Manager Caledonia Mining |
Signed at Little Falls, Gauteng, South Africa, on 15 May 2024.
Caledonia Mining Corporation Plc
S-K 1300 Technical Report Summary on the Blanket Gold Mine, Zimbabwe
INFORMATION RISK
This Report was prepared by Craig Harvey, Vice President Technical Services for Caledonia Mining Corporation Plc (“Caledonia”), the QP. Mr Harvey is a full-time employee of the Caledonia group and in the preparation of the Report, has utilised information relating to operational methods and expectations provided by various sources. The QP has, where possible, verified this information from independent sources after making due enquiry of all material issues that are required in order to comply with the requirements of the United States Securities and Exchange Commission Part 229 Standard Instructions for Filing Forms Regulation S-K subpart 1300. No warranty or guarantee, be it express or implied, is made by the QP with respect to the completeness or accuracy of the legal aspects of this document.
OPERATIONAL RISKS
The business of mining and mineral exploration, development and production by their nature contain significant operational risks. The business depends upon, amongst other things, successful prospecting programmes and competent management. Profitability and asset values can be affected by unforeseen changes in operating circumstances and technical issues.
POLITICAL AND ECONOMIC RISK
Factors such as political and industrial disruption, currency fluctuation and interest rates could have an impact on future operations, and potential revenue streams can also be affected by these factors. The majority of these factors are, and will be, beyond the control of any operating entity.
FORWARD LOOKING STATEMENTS
Certain statements contained in this document other than statements of historical fact, contain forward-looking statements regarding the operations, economic performance or financial condition, including, without limitation, those concerning the economic outlook for the mining industry, expectations regarding commodity prices, exchange rates, production, cash costs and other operating results, growth prospects and the outlook of operations, including the completion and commencement of commercial operations of specific production projects, its liquidity and capital resources and expenditure, and the outcome and consequences of any pending litigation or enforcement proceedings.
Although the QP believes that the expectations reflected in such forward-looking statements are reasonable, no assurance can be given that such expectations will prove to be correct. Accordingly, results may differ materially from those set out in the forward-looking statements as a result of, among other factors, changes in economic and market conditions, changes in the regulatory environment and other State actions, success of business and operating initiatives, fluctuations in commodity prices and exchange rates, and business and potential risk management.
Caledonia Mining Corporation Plc
S-K 1300 Technical Report Summary on the Blanket Gold Mine, Zimbabwe
TABLE OF CONTENTS
|
Item 1 |
– Executive Summary |
13 |
|
I. |
Geology and Mineral Deposit |
13 |
|
II. |
Status of Exploration |
13 |
|
III. |
Mineral Resource and Mineral Reserve Estimates |
14 |
|
IV. |
Development and Operations |
16 |
|
V. |
Economic Analysis |
17 |
|
VI. |
Conclusions |
19 |
|
VII. |
Recommendations |
20 |
|
Item 2 |
– Introduction |
21 |
|
Item 2 (a) |
Author |
21 |
|
Item 2 (b) |
– Terms of Reference and Purpose of the Report |
21 |
|
Item 2 (c) |
– Sources of Information and Data Contained in the Report |
21 |
|
Item 2 (d) |
– Qualified Persons’ Personal Inspection of the Property |
22 |
|
Item 3 |
– Property Description and Location |
22 |
|
Item 3 (a) |
– Area of the Property |
22 |
|
Item 3 (b) |
– Location of the Property |
22 |
|
Item 3 (c) |
– Mineral Deposit Tenure |
23 |
|
Item 3 (d) |
– Royalties and Payments |
25 |
|
I. |
Government Royalties |
25 |
|
II. |
Net Smelter Royalties |
26 |
|
Item 3 (e) |
– Environmental Liabilities |
26 |
|
Item 3 (f) |
– Permits to Conduct Work |
26 |
|
I. |
Water Agreement |
27 |
|
II. |
. Environmental Impact Assessment Certificates |
27 |
|
III. |
Additional Environmental Permits |
27 |
|
Item 3 (g) |
– Other Significant Factors and Risks |
28 |
|
Item 4 |
– Accessibility, Climate, Local Resources, Infrastructure and Physiography |
28 |
|
Item 4 (a) |
– Topography, Elevation and Vegetation |
28 |
|
Item 4 (b) |
– Access to the Property |
28 |
|
Item 4 (c) |
– Climate and Length of Operating Season |
29 |
|
Item 4 (d) |
– Infrastructure |
30 |
|
I. |
Regional Infrastructure |
30 |
|
I. |
Mine Infrastructure |
30 |
|
Item 5 |
– History |
30 |
|
Item 5 (a) |
– Prior Ownership and Ownership Changes |
30 |
|
Item 5 (b) |
– Historical Exploration and Development |
30 |
|
Item 6 |
– Geological Setting, Mineralisation and Deposit |
31 |
|
Item 6 (a) |
- Regional Geology |
31 |
|
Item 6 (b) |
- Local and Property Geology |
32 |
|
Item 6 (c) |
– Mineralisation and Deposit Type |
35 |
|
Item 6 (d) |
– Geological Model |
37 |
|
Item 7 |
– Exploration |
44 |
|
Item 7 (a) |
– Non-drilling Work |
44 |
|
I. |
Survey Procedures and Parameters |
44 |
|
II. |
Sampling Methods and Sample Quality |
45 |
|
III. |
Sample Data |
45 |
|
IV. |
Results and Interpretation of Exploration Information |
45 |
|
Item 7 (b) |
– Drilling |
45 |
Caledonia Mining Corporation Plc
S-K 1300 Technical Report Summary on the Blanket Gold Mine, Zimbabwe
|
I. |
Type and Extent of Drilling |
45 |
|
II. |
Factors Influencing the Accuracy of Results |
54 |
|
III. |
Exploration Properties – Drill Hole Details |
54 |
|
Item 7 (c) |
– Hydrogeology |
54 |
|
Item 7 (d) |
– Geotechnical |
54 |
|
Item 8 |
– Sample Preparation, Analyses and Security |
55 |
|
Item 8 (a) |
Sample Handling Prior to Dispatch |
55 |
|
Item 8 (b) |
– Sample Preparation and Analysis Procedures |
55 |
|
Item 8 (c) |
– Quality Assurance and Quality Control |
55 |
|
I. |
Assessment of Results |
56 |
|
Item 8 (d) |
– Adequacy of Sample Preparation, Security and Analytical Procedures |
59 |
|
Item 9 |
– Data Verification |
59 |
|
Item 9 (a) |
– Data Verification Procedures |
59 |
|
Item 9 (b) |
– Limitations on/Failure to Conduct Data Verification |
61 |
|
Item 9 (c) |
– Adequacy of Data |
61 |
|
Item 10 |
– Mineral Processing and Metallurgical Testing |
61 |
|
Item 10 (a) |
– Nature and Extent of Testing and Analytical Procedures |
61 |
|
Item 10 (b) |
Basis off Assumptions Regarding Recovery Estimates |
61 |
|
Item 10 (c) |
– Representativeness of Samples and Adequacy of Data |
62 |
|
Item 10 (d) |
– Deleterious Elements for Extraction |
62 |
|
Item 11 |
– Mineral Resource Estimates |
62 |
|
Item 11 (a) |
– Assumptions, Parameters and Methods Used for Resource Estimates |
62 |
|
I. |
Mineral Resource Estimation Procedures |
62 |
|
II. |
Initial Assessment |
83 |
|
III. |
Mineral Resource Classification |
84 |
|
IV. |
Mineral Resource Statement |
96 |
|
Item 11 (b) |
– Individual Grade of Metals |
99 |
|
Item 11 (c) |
– Factors Affecting Mineral Resource Estimates |
100 |
|
Item 12 |
– Mineral Reserve Estimates |
100 |
|
Item 12 (a) |
- Key Assumptions, Parameters and Methods |
100 |
|
I. |
Stope Design Methodology |
100 |
|
II. |
Cut- Off Grade |
101 |
|
III. |
Modifying Factors |
101 |
|
IV. |
Mineral Resource to Mineral Reserve Conversion |
102 |
|
Item 12 (b) |
- Multiple Commodity Reserve |
103 |
|
Item 12 (c) |
- Factors Affecting Mineral Reserve Estimation |
103 |
|
Item 13 |
– Mining Methods |
103 |
|
Item 13 (a) |
– Parameters Relevant to Mine Design |
108 |
|
I. |
Geotechnical and Hydrological Parameters |
109 |
|
II. |
Ventilation |
111 |
|
Item 13 (b) |
– Production Rates, Expected Mine Life, Mining Unit Dimensions, and Mining Dilution |
112 |
|
I. |
Shift Cycle |
112 |
|
II. |
Production Rates |
112 |
|
|
Life of Mine Plan |
114 |
|
III. |
Mineral Reserve Conversion Factors |
118 |
|
Item 13 (c) |
– Requirements for Stripping, Underground Development and Backfilling |
120 |
|
I. |
Underground Development |
120 |
|
II. |
Backfilling |
122 |
|
Item 13 (d) |
– Required Mining Fleet, Machinery and Personnel |
123 |
|
I. |
Mining Fleet and Machinery |
123 |
Caledonia Mining Corporation Plc
S-K 1300 Technical Report Summary on the Blanket Gold Mine, Zimbabwe
|
II. |
Personnel |
123 |
|
Item 14 |
– Recovery Methods |
126 |
|
Item 14 (a) |
- Flow Sheets and Process Recovery Methods |
126 |
|
Item 14 (b) |
Process Flow and Equipment Specifications. |
128 |
|
Item 14 (c) |
Slurry Deposition. |
133 |
|
Item 15 |
– Project Infrastructure |
135 |
|
Item 15 (a) |
- Mine Layout and Operations |
135 |
|
Item 15 (b) |
– Infrastructure |
137 |
|
I. |
Surface Infrastructure |
137 |
|
II. |
Mining Section |
140 |
|
III. |
Dewatering |
140 |
|
Item 15 (c) |
– Services |
140 |
|
I. |
Power Supply and Reticulation |
140 |
|
II. |
Water Supply and Reticulation |
141 |
|
III. |
Ventilation |
142 |
|
IV. |
Compressed Air |
142 |
|
V. |
Logistics |
143 |
|
Item 16 |
– Market Studies |
143 |
|
Item 16 (a) |
– Commodity Market Assessment |
143 |
|
Item 16 (b) |
– Contracts |
154 |
|
Item 17 |
– Environmental Studies, Permitting and Plans, Negotiations, or Agreements with Local Individuals or Groups |
154 |
|
Item 17 (a) |
– Relevant Environmental Issues and Results of Studies Done |
154 |
|
Item 17 (b) |
– Waste Disposal, Site Monitoring and Water Management |
155 |
|
Item 17 (c) |
– Permit Requirements |
156 |
|
Item 17 (d) |
– Social and Community-Related Requirements |
156 |
|
Item 17 (e) |
– Mine Closure Costs and Requirements |
156 |
|
Item 17 (f) |
- Adequacy of Current Plans |
157 |
|
Item 17 (g) |
– Local Procurement and Hiring |
157 |
|
Item 18 |
– Capital and Operating Costs |
157 |
|
Item 18 (a) |
– Capital Costs |
157 |
|
Item 18 (b) |
– Operating Cost |
159 |
|
VI. |
Financial Costs Indicators |
160 |
|
Item 18 (c) |
– Accuracy of Estimates |
165 |
|
Item 19 |
– Economic Analysis |
165 |
|
Item 19 (a) |
- Principal Assumptions |
166 |
|
I. |
Basis of Evaluation of the Mining Assets |
166 |
|
II. |
Macro-Economic Forecasts |
166 |
|
III. |
Working Capital |
167 |
|
IV. |
Recoveries |
167 |
|
V. |
Discount Rate |
167 |
|
VI. |
Cash Flow Forecast |
168 |
|
Item 19 (b) |
- Net Present Value |
171 |
|
Item 19 (c) |
- Regulatory Items |
171 |
|
I. |
Government Royalties |
171 |
|
VII. |
Corporate Taxes |
171 |
|
Item 19 (d) |
- Sensitivity Analysis |
172 |
|
Item 19 (e) |
– Economic Analysis Conclusions |
175 |
|
Item 20 |
– Adjacent Properties |
175 |
|
Item 20 (a) |
Sources of Information |
177 |
Caledonia Mining Corporation Plc
S-K 1300 Technical Report Summary on the Blanket Gold Mine, Zimbabwe
|
Item 21 |
– Other Relevant Data and Information |
177 |
|
Item 21 (a) |
– Upside Potential |
177 |
|
Item 21 (b) |
– Risk Assessment |
177 |
|
Item 22 |
– Interpretation and Conclusions |
178 |
|
|
Mineral Resources |
178 |
|
|
Mining |
179 |
|
|
Engineering and Infrastructure |
179 |
|
|
Processing |
179 |
|
|
Economic Analysis |
179 |
|
Item 23 |
– Recommendations |
180 |
|
Item 24 |
– References |
180 |
|
Item 25 |
– Reliance on Information Provided by the Registrant |
181 |
FIGURES
|
Figure 1: General Location of Blanket Mine |
22 |
|
Figure 2: Location of Blanket Mining Lease and Claims |
23 |
|
Figure 3: Stratigraphic Column of the Blanket Mine Area |
32 |
|
Figure 4: Local Geology of Blanket Mine |
33 |
|
Figure 5: Geological Cross Section of Blanket Mine at No 4 Shaft |
33 |
|
Figure 6: General Orebody Domain Wireframes and Major Structures |
37 |
|
Figure 7: Blanket Section Orebodies and the Wenlock Fault on 630m Level |
38 |
|
Figure 8: Sectional View of the Blanket Orebodies, Looking North |
39 |
|
Figure 9: Sectional View of Blanket Feudal Hanging Wall in Relation to BQR Hanging Wall, Looking North |
40 |
|
Figure 10: Plan View of the Blanket Feudal, Blanket Orebodies and BQR at 140m Level. |
40 |
|
Figure 11: Plan View of the Blanket, AR South and AR Main Orebodies on 810m Level. |
42 |
|
Figure 12: Plan View of the ERC and Lima Orebodies at the 140m Level. |
42 |
|
Figure 13: Long Section of Blanket Mine Showing the Total Database |
58 |
|
Figure 14: 3-Dimensional view of the AR Main Domain and is Associated Data |
60 |
|
Figure 15: Section View of ARS_EXT and ARS Domains and Data. |
60 |
|
Figure 16: Section View of BLK1, BLK2, BLK3, BLK4_5 and BLK6 Domains and their Data. |
62 |
|
Figure 17: Section View of BF and BQR Domains and their Data. |
64 |
|
Figure 18: Section View of the LIMA and EROICA Domains with their Data. |
65 |
|
Figure 19: Section View of JETHRO and SHEET Domains and their Data. |
65 |
|
Figure 20: ARM Estimates |
68 |
|
Figure 21: ARS Estimates (including ARS_Ext) |
68 |
|
Figure 22: BLK1 Estimates |
69 |
|
Figure 23: BLK2 Estimates |
70 |
|
Figure 24: BLK3 Estimates |
71 |
|
Figure 25: BLK4_5 Estimates |
72 |
|
Figure 26: BLK6 Estimates |
72 |
|
Figure 27: BF Estimates |
73 |
|
Figure 28: BQR Estimates |
74 |
|
Figure 29: LIMA Estimates |
74 |
|
Figure 30: ERC Estimates |
75 |
|
Figure 31: JTH Estimates |
76 |
|
Figure 32: SHT Estimates |
77 |
|
Figure 33: Long Section of Blanket Mine showing Stopes, Drives, Haulages and Shafts |
78 |
|
Figure 34: Swathe Plot of ERCN Domain in X, Y and Z Directions |
79 |
Caledonia Mining Corporation Plc
S-K 1300 Technical Report Summary on the Blanket Gold Mine, Zimbabwe
|
Figure 35: Swathe Plot of ERCN_FW Domain in X, Y and Z Directions |
79 |
|
Figure 36: Swathe Plot of ERCS Domain in X, Y and Z Directions |
79 |
|
Figure 37: ARM Mineral Resource Classification |
83 |
|
Figure 38: ARS Mineral Resource Classification (Including ARS_Ext) |
84 |
|
Figure 39: BLK1 Mineral Resource Classification |
85 |
|
Figure 40: BLK2 Mineral Resource Classification |
86 |
|
Figure 41: BLK3 Mineral Resource Classification |
87 |
|
Figure 42: BLK4_5 Mineral Resource Classification |
88 |
|
Figure 43: BLK6 Mineral Resource Classification |
88 |
|
Figure 44: BF Mineral Resource Classification |
89 |
|
Figure 45: BQR Mineral Resource Classification |
89 |
|
Figure 46: LIMA Mineral Resource Classification |
90 |
|
Figure 47: ERC Mineral Resource Classification |
91 |
|
Figure 48: JTH Mineral Resource Classification |
92 |
|
Figure 49: SHT Mineral Resource Classification |
93 |
|
Figure 50: Diluted Life of Mine Production Schedule by Mineral Resource Classification (2023) |
99 |
|
Figure 51: Extraction Method: LH Mechanized |
101 |
|
Figure 52: Extraction Method: Underhand |
102 |
|
Figure 53: Schematic Representation of Long-hole Stoping Mining Method |
104 |
|
Figure 54: Schematic Representation of Underhand Stoping Mining Method |
105 |
|
Figure 55: Blanket Mine Shaft Infrastructure |
107 |
|
Figure 56: Blanket Mine Simulated Ventilation airflow |
108 |
|
Figure 57: Diluted Life of Mine Production Schedule by Mineral Resource Classification |
111 |
|
Figure 58: Blanket Mine Content Delivered to the Plant |
112 |
|
Figure 59: Monthly Stope Ore Tonne Production |
112 |
|
Figure 60: Monthly Development Ore Tonne Production |
113 |
|
Figure 61: Blanket Mine Design |
115 |
|
Figure 62: Blanket Mine Development Design |
119 |
|
Figure 63: Blanket Mine Development Profile |
119 |
|
Figure 64: Crushing and Milling Process Flow Diagram |
123 |
|
Figure 65: Historic Milled Tonnes Plant Feed Grade against Plant Final Tails from 2014 to 2023 |
124 |
|
Figure 66: Historic Recoveries and Gold Production from June 2014 to May 2023 |
125 |
|
Figure 67: Cone Crusher Building |
126 |
|
Figure 68: Cone Crushers |
126 |
|
Figure 69: Rod Mills |
127 |
|
Figure 70: CIL Circuit |
128 |
|
Figure 71: Elution and Electrowinning Vessels |
129 |
|
Figure 72: Current Shaft Infrastructure – Blanket Mine |
133 |
|
Figure 73: Surface Infrastructure Arrangement |
135 |
|
Figure 74: Surface Infrastructure Arrangement – Central Main Shaft |
136 |
|
Figure 75: Compressors at Blanket |
139 |
|
Figure 76: Compressors at Central Main Shaft |
140 |
|
Figure 77: Global Distribution of Gold Deposits |
141 |
|
Figure 78: Country Listing of Gold Reserves as at End 2023 |
142 |
|
Figure 79: Gold Demand 2022 vs. 2023 |
144 |
|
Figure 80: Gold Price vs Trade Weighted U.S. Dollar Index |
147 |
|
Figure 81: Gold Price vs. Real USD Rate |
148 |
|
Figure 82: Gold Yearly Prices |
149 |
|
Figure 83: Capital Schedule |
155 |
|
Figure 84: Historical Operating Costs |
156 |
Caledonia Mining Corporation Plc
S-K 1300 Technical Report Summary on the Blanket Gold Mine, Zimbabwe
|
Figure 85: Operating Costs vs. Feed Tonnes |
160 |
|
Figure 86: AIC vs. Realised Gold Price |
161 |
|
Figure 87: Inflation Adjusted Historic Gold Price |
163 |
|
Figure 88: Recovered Gold |
164 |
|
Figure 89: Undiscounted Cash Flow |
165 |
|
Figure 90: Project Sensitivity (NPV 15.4%) |
168 |
|
Figure 91: Gold Mines of the Gwanda Greenstone Belt |
172 |
TABLES
|
Table 1: Mining Lease Details |
21 |
|
Table 2: Blanket Mineral Title Areas and Status |
22 |
|
Table 3: Blanket Mineral Title Areas and Ownership |
24 |
|
Table 4: EIA Certificates |
25 |
|
Table 5: Environmental Permits |
26 |
|
Table 6: Description of Deposits at Blanket Mine (after MSA, 2011) |
33 |
|
Table 7: Exploration Holes and Meters by Year |
44 |
|
Table 8: Long Hole Deep Drilling Results at Blanket (2022 - 2023) |
44 |
|
Table 9: Long Hole Deep Drilling Location and Information at Blanket (2022-2023) |
46 |
|
Table 10: Standards Utilised at Blanket Mine with Expected Value and the Number Used |
53 |
|
Table 11: Sample Database Summarised by Year |
55 |
|
Table 12: Sample Database Summarised by Drillhole Type |
56 |
|
Table 13: Hole and Sample Count |
56 |
|
Table 14: Capping Valuers Applied per Domain |
65 |
|
Table 15: SG Samples per Orebody |
67 |
|
Table 16: Cut-off Derivation Factors |
80 |
|
Table 17: Mineral Resource Classification Criteria for Blanket Mine |
81 |
|
Table 18: In Situ Measured and Indicated Mineral Resources for Blanket Mine as at 31 December 2023 (Inclusive of Mineral Reserves) |
93 |
|
Table 19: In Situ Inferred Mineral Resources for Blanket Mine as of 31 December 2023 (Inclusive of Mineral Reserves) |
94 |
|
Table 20: In Situ Measured and Indicated Mineral Resources for Blanket Mine as at 31 December 2023 (Exclusive of Mineral Reserves) |
95 |
|
Table 21: Cut-Off Grade Calculation |
97 |
|
Table 22: Mineral Reserve Conversion Factors Summary |
97 |
|
Table 23: Blanket Mine Mineral Reserve Estimate as at 31 December 2023 |
99 |
|
Table 24: Shaft Utilisation and Hoisting Capacity |
107 |
|
Table 25: Blanket Mine Shift System |
108 |
|
Table 26: Blanket Mine Development Rates |
108 |
|
Table 27: Blanket Mine Production Rates |
109 |
|
Table 28: Development Dimensions |
113 |
|
Table 29: Mine Design Criteria for Blanket Mine |
114 |
|
Table 30: Blanket Mine Average Dilution Calculation |
115 |
|
Table 31: Blanket Mine - Mine Call Factor Calculation 2015 to 2022 |
116 |
|
Table 32: Development Designs Naming Convention |
116 |
|
Table 33: Blanket Mine Current Mining Fleet |
119 |
|
Table 34: Blanket Mine Mining Personnel |
119 |
|
Table 35: Historic Plant Production 2014 – 2023 |
123 |
|
Table 36: Reagent and Consumable Consumptions |
128 |
Caledonia Mining Corporation Plc
S-K 1300 Technical Report Summary on the Blanket Gold Mine, Zimbabwe
|
Table 37: Plant Labour Complement |
129 |
|
Table 38: Blanket Mine Shaft Access |
131 |
|
Table 39: Planned Shaft Infrastructure Development |
133 |
|
Table 40: Top 20 Gold Mining Countries |
142 |
|
Table 41: Official Gold Holdings per Country, 31 December 2023 |
144 |
|
Table 42: Gold Price Forecast (Nominal Terms) |
148 |
|
Table 43: Capital and Infrastructure Development Costs |
152 |
|
Table 44: Capital Summary |
153 |
|
Table 45: Management and shared service costs |
155 |
|
Table 46: Financial Cost Indicators |
155 |
|
Table 47: Project Cost Indicators |
158 |
|
Table 48: Macro-economic Forecasts (Real Terms) |
161 |
|
Table 49: Capital Asset Pricing Model Discount Rate Calculation |
162 |
|
Table 50: Production Breakdown in Life of Mine |
163 |
|
Table 51: Annual Cash Flow – Techno-economic Inputs |
165 |
|
Table 52: Annual Real Cash Flow |
165 |
|
Table 53: Blanket Mine NPV Summary – Real Terms |
166 |
|
Table 54: Profitability Ratios |
166 |
|
Table 55: Sensitivity Analysis of Commodity Prices and Mill Head Grade to NPV15.4% (USDm) |
168 |
|
Table 56: Sensitivity Analysis of Cash Operating Costs and Capital spend to NPV15.4% (USDm) |
169 |
|
Table 57: Blanket Mine Economic Analysis Summary – Real Terms |
170 |
|
Table 58: Risk Assessment |
173 |
Caledonia Mining Corporation Plc
S-K 1300 Technical Report Summary on the Blanket Gold Mine, Zimbabwe
LIST OF UNITS AND ABBREVIATIONS
Units: The following units were used in this Report, and are in metric terms:-
|
Unit |
Definition |
|||
|
% |
Per cent |
ktpm |
Kilo tonnes per month |
|
|
/ |
Per |
kV |
Kilovolt (1,000 volts) |
|
|
± or ~ |
Approximately |
kVA |
Kilovolt ampere |
|
|
° |
Degrees |
kW |
Kilowatt (1,000 W) |
|
|
°C |
Degrees Celsius |
l |
Litre |
|
|
a |
Year |
m |
Metre |
|
|
cm |
Centimetre |
m2 |
Square metres |
|
|
d |
Day |
m3 |
Cubic metres |
|
|
g |
Grammes |
mm |
Millimetre |
|
|
g/cm3 |
Grammes per cubic centimetre |
Moz |
Million ounces (1,000,000 oz) |
|
|
g/t |
Grammes per tonne |
Mt |
Million tonnes (1,000,000 t) |
|
|
Ga |
Billion years (1,000,000,000 years) |
Mtpa |
Million tonnes per annum |
|
|
ha |
Hectares |
MVA |
Megavolt ampere |
|
|
hr |
Hour |
oz |
Troy Ounces |
|
|
kg |
Kilogram (1,000 g) |
t |
Tonne |
|
|
kL |
Kilolitres (1,000 l) |
t/m³ |
Tonnes per cubic meter |
|
|
km |
Kilometre (1,000 m) |
tpd |
Tonnes per day |
|
|
km2 |
Square kilometres |
V |
Volts |
|
|
koz |
Kilo ounces (1,000 oz) |
x |
By / Multiplied by |
|
|
kt |
Kilotonnes (1,000 t) |
Computation: It is noted that throughout the Report, tables may not compute due to rounding.
Abbreviations: The following abbreviations were used in this Report:-
|
Abbreviation |
Description |
|
AC |
Asbestos Cement |
|
amsl |
Above Mean Sea Level |
|
Au |
Gold |
|
BETS |
Employee Trust for the benefit of the present and future employees of Blanket Mine |
|
BIF |
Banded Iron Formation |
|
Blanket Mine Company |
Blanket Mine (1983) (Pvt) Ltd |
|
Blanket or the Mine |
Blanket Gold Mine |
|
BQR |
Blanket Quartz Reef |
|
Caledonia or the Company |
Caledonia Mining Corporation Plc |
|
CAPM |
Capital Asset Pricing Model |
|
CBDZ |
Colleen Bawn Deformation Zone |
|
CIL |
Carbon-in-Leach |
|
CIM |
Canadian Institute of Mining, Metallurgy and Petroleum |
|
CMS |
Central Main Shaft |
|
CPI |
Consumer Price Indices |
|
CRM |
Certified Reference Material |
|
DCF |
Discounted Cash Flow |
|
DSR |
Disseminated Sulphide Reefs |
|
EIA |
Environmental Impact Assessment |
|
EM Act |
Environmental Management Act (Chapter 20:27) No. 13/2002 |
|
EMA |
Environmental Management Agency |
|
Epoch |
Epoch Resources (Pty) Ltd |
|
FCFE |
Free Cash Flow to Equity |
|
FCFF |
Free Cash Flow to Firm |
|
Fidelity |
Fidelity Printers and Refiners Limited |
|
FW |
Footwall |
|
G&A |
General and Administrative |
|
GGB |
Gwanda Greenstone Belt |
|
GMS |
Greenstone Management Services (Pty) Limited |
|
HG |
High Grade |
|
HW |
Hanging Wall |
|
ID2 |
Inverse Distance Squared |
|
IL |
Intensive Leach |
|
Kinross |
Kinross Gold Corporation |
|
KNA |
Kriging Neighbourhood Analysis |
|
LG |
Low Grade |
|
LHDP |
Long Hole Drilling Program |
|
LIMS |
Laboratory Information Management System |
|
LoM |
Life of Mine |
Caledonia Mining Corporation Plc
S-K 1300 Technical Report Summary on the Blanket Gold Mine, Zimbabwe
|
Abbreviation |
Description |
|
Minxcon |
Minxcon (Pty) Ltd |
|
ML40 |
Mining Lease with registered number 40 |
|
MMA |
Mines and Minerals Act (Chapter 21:05) of 1961 |
|
MMCZ |
Minerals Marketing Corporation of Zimbabwe |
|
MSO |
Geovia Stope Shape Optimiser |
|
NIEEF |
National Indigenisation and Economic Empowerment Fund |
|
NIR |
Not-In-Reserve |
|
NMD |
Nominal Maximum Demand |
|
NPV |
Net Present Value |
|
NSR |
Net Smelter Royalty |
|
NWGDZ |
North West Gwanda Deformation Zone |
|
OHL |
Overhead Powerlines |
|
PEM |
Prospectivity Enhancement Multiplier |
|
PPE |
Personal Protective Equipment |
|
PSA |
Pressure Swing Absorption |
|
QAQC |
Quality Assurance and Quality Control |
|
QP |
Qualified Person |
|
RoM |
Run of Mine |
|
RoR |
Rate of Rise |
|
SG |
Specific Gravity |
|
SGDZ |
South Gwanda Deformation Zone |
|
S-K 1300 |
United States Securities and Exchange Commission Part 229 Standard Instructions for Filing Forms Regulation S-K subpart 1300 |
|
SoR |
Slope of Regression |
|
The Act |
Indigenisation and Economic Empowerment Act |
|
TRS |
Technical Report Summary |
|
TSF |
Tailings Storage Facility |
|
WACC |
Weighted Average Cost of Capital |
|
ZESA |
Zimbabwe Electricity Supply Authority |
|
ZINWA |
Zimbabwe National Water Authority |
|
ZMDC |
Zimbabwe Mining Development Corporation |
Caledonia Mining Corporation Plc
S-K 1300 Technical Report Summary on the Blanket Gold Mine, Zimbabwe
ITEM 1 - EXECUTIVE SUMMARY
The Blanket Mine is an operating underground gold mine situated on the Gwanda Greenstone Belt targeting shear zone hosted gold mineralisation. It is located in the southwest of Zimbabwe, approximately 15 km northwest of Gwanda, the provincial capital of Matabeleland South. Gwanda is located 147 km southeast of Bulawayo, 197 km northwest of the Beitbridge Border post with South Africa, and 560 km from Harare.
The Mine complex comprises a cluster of mines extending from Lima in the north, through Eroica, Sheet, AR Main, AR South, the currently defunct Feudal, Blanket Section (Blanket 1 to Blanket 6) and Jethro over a total strike length of some 3 km. Gold has been commercially mined at the Project Area from several closely spaced orebodies, defining a mineralised trend via several shafts since the early 1900s. The Mine covers the operating claims of Jethro, Blanket, Feudal, Harvard, Mbudzane Rock, Oqueil, Sabiwa, Sheet, Eroica and Lima, largely encompassed in a 2,120 ha Mining Lease. Ore is processed at an on-site plant.
The Blanket Mine operates under a mining lease ML40 issued to Blanket Mine (1983) (Pvt) Ltd, which is incorporated in Zimbabwe and a 64% owned, indirect subsidiary of Caledonia. The mine’s claims under the lease cover an area of 2,120 ha.
I. Geology and Mineral Deposit
The Blanket Mine is situated on the north-western limb of the Archaean Gwanda Greenstone Belt along strike from several other gold deposits. In the Blanket Mine area, lithologies comprise non-mineralised basal felsic schists of igneous or sedimentary origin in the east. The felsics are overlain by a metabasaltic ultramafic to mafic unit with pillow basalts remnants.
Mining at Blanket occurs over a 3 km strike that includes from north to south, the deposits of Lima, Eroica, Sheet, AR Main, AR South, Feudal, Blanket Section (Blanket 1 to Blanket 6) and Jethro. The main Blanket underground workings are connected to Lima by a 2 km long haulage which follows the strike of the main fabric. Mineralisation occurs in near vertical shoots aligned along an approximately N-S axis. The ore shoots vary in shape from the tabular-lensoidal quartz reefs to the massive to pipe-like disseminated sulphide reefs (or DSR). Gold is deposited at crustal levels within and near the brittle-ductile transition zone. The deposits may have a vertical extent of up to 2 km, demonstrate extensive down-plunge continuity, and lack pronounced zoning. The ore mineralogy is dominated by gold, pyrite and arsenopyrite.
Two quartz-filled shear zones are mined, namely the Blanket Quartz Reef (or BQR) and the Eroica Reef, which have long strike lengths but are not uniformly mineralised although continuous pay shoots of over 100 m on strike are seen. Gold grade fluctuations are more extreme in the quartz reefs than in the DSR type reefs but on average these quartz shears have higher grades.
II. Status of Exploration
Blanket Mine is continuing with the Long Hole Drilling Program (“LHDP”) which is the down-dip exploration drilling (below 750 m Level) as drilling platforms are established. This drilling will continue to improve the interpretation and confidence in the down-dip continuity of the fourteen current mineralised domains at Blanket. An electromagnetic survey may be considered which could potentially delineate additional structural features and targets. These targets, in conjunction with the structural model and underground observations may be used may be tested with underground drilling and further refine the geological model at Blanket and potentially target areas in the upper levels of the mine between existing orebodies.
Caledonia Mining Corporation Plc
S-K 1300 Technical Report Summary on the Blanket Gold Mine, Zimbabwe
The combination of the exploration drilling, geophysical surveys, conceptual geological model (based on the sampling database) and structural geological modelling may increase the exploration targets and ultimately assist in increasing the Mineral Resource.
III. Mineral Resource and Mineral Reserve Estimates
Measured, Indicated and Inferred Mineral Resources, based on ordinary kriging and inverse distance estimation methods, can be declared for Blanket Mine due to the continuity of the geology and grade as well as a history of proven historical mining. The Inferred resources show geological continuity, while grade continuity requires improvement through additional drilling. The 2023 estimates are complete 3D digital estimates in the form of block models. Previous estimates were a combination of digital estimates and manual block listings above a specific elevation. The in situ Measured, Indicated and Inferred Mineral Resources, inclusive and exclusive of Mineral Reserves are shown in the tables below.
In Situ Measured and Indicated Mineral Resource Tabulation for Blanket Mine as of 31 December 2023 (inclusive of Mineral Reserves)
|
Mineral Resource Classification |
Orebody |
Tonnes |
Au Grade |
Gold Content |
|
Kt |
g/t |
Koz |
||
|
Measured (2.5% Geological Loss) |
ARM |
660 |
3.12 |
66 |
|
ARS |
514 |
3.62 |
60 |
|
|
ARS_Ext |
32 |
2.56 |
3 |
|
|
BF |
176 |
3.43 |
19 |
|
|
BLK1 |
261 |
3.43 |
29 |
|
|
BLK2 |
150 |
3.66 |
18 |
|
|
BLK3 |
180 |
3.41 |
20 |
|
|
BLK4_5 |
490 |
3.26 |
51 |
|
|
BLK6 |
49 |
3.78 |
6 |
|
|
BQR |
785 |
4.36 |
110 |
|
|
ERC |
303 |
5.21 |
51 |
|
|
Jethro |
53 |
3.11 |
5 |
|
|
Lima |
203 |
3.94 |
26 |
|
|
Sheet |
88 |
2.99 |
9 |
|
|
Measured Total |
3 943 |
3.72 |
471 |
|
|
Indicated (5.0% Geological Loss) |
ARM |
630 |
2.78 |
56 |
|
ARS |
437 |
3.48 |
49 |
|
|
ARS_Ext |
189 |
2.93 |
18 |
|
|
BF |
205 |
2.99 |
20 |
|
|
BLK1 |
663 |
3.21 |
68 |
|
|
BLK2 |
442 |
4.98 |
71 |
|
|
BLK3 |
189 |
2.91 |
18 |
|
|
BLK4_5 |
126 |
3.05 |
12 |
|
|
BLK6 |
27 |
3.99 |
4 |
|
|
BQR |
1 888 |
3.61 |
219 |
|
|
ERC |
593 |
4.76 |
91 |
|
|
Jethro |
288 |
3.34 |
31 |
|
|
Lima |
115 |
3.73 |
14 |
|
|
Sheet |
41 |
2.60 |
3 |
|
|
Indicated Total |
5 832 |
3.59 |
673 |
|
|
Measured + Indicated Total |
9 775 |
3.64 |
1 145 |
|
Caledonia Mining Corporation Plc
S-K 1300 Technical Report Summary on the Blanket Gold Mine, Zimbabwe
Notes:
|
1. |
Cut-off applied 1.5 g/t. |
|
2. |
Geological Losses: 2.5% Measured, 5.0% Indicated, 10.0% Inferred |
|
3. |
Commodity price utilised: USD2,150/oz. |
|
4. |
Mineral Resources are stated inclusive of Mineral Reserves. |
|
5. |
Mineral Resources are reported as 64% attributable to Caledonia. |
|
6. |
All orebodies are depleted for mining. |
In Situ Inferred Mineral Resource Tabulation for Blanket Mine as of 31 December 2023 (inclusive of Mineral Reserves)
|
Mineral Resource Classification |
Orebody |
Tonnes |
Au |
Ounces |
|
Kt |
g/t |
Koz |
||
|
Inferred |
ARM |
299 |
2.87 |
28 |
|
ARS |
170 |
3.88 |
21 |
|
|
ARS_Ext |
68 |
3.48 |
8 |
|
|
BF |
150 |
3.05 |
15 |
|
|
BLK1 |
871 |
3.20 |
90 |
|
|
BLK2 |
584 |
4.91 |
92 |
|
|
BLK3 |
73 |
3.33 |
8 |
|
|
BLK4_5 |
269 |
3.32 |
29 |
|
|
BLK6 |
83 |
3.57 |
10 |
|
|
BQR |
1 900 |
3.71 |
227 |
|
|
ERC |
928 |
4.30 |
128 |
|
|
Jethro |
108 |
3.28 |
11 |
|
|
Lima |
95 |
3.41 |
10 |
|
|
Sheet |
47 |
2.52 |
4 |
|
|
Inferred Total |
5 646 |
3.74 |
679 |
|
Notes:
|
1. |
Cut-off applied 1.5 g/t. |
|
2. |
Geological Losses: 2.5% Measured, 5.0% Indicated, 10.0% Inferred |
|
3. |
Commodity price utilised: USD2,150/oz. |
|
4. |
Mineral Resources are stated inclusive of Mineral Reserves. |
|
5. |
Mineral Resources are reported as 64% attributable to Caledonia. |
|
6. |
All orebodies are depleted for mining. |
In Situ Measured and Indicated Mineral Resource Tabulation for Blanket Mine as of 31 December 2023 (exclusive of Mineral Reserves)
|
Mineral Resource Classification |
Orebody |
Tonnes |
Au Grade |
Gold Content |
|
Kt |
g/t |
Koz |
||
|
Measured (2.5% Geological Loss) |
ARM |
653 |
3.12 |
66 |
|
ARS |
329 |
3.70 |
39 |
|
|
ARS_Ext |
11 |
1.83 |
1 |
|
|
BF |
89 |
3.58 |
10 |
|
|
BLK1 |
136 |
3.74 |
16 |
|
|
BLK2 |
148 |
3.66 |
17 |
|
|
BLK3 |
109 |
3.44 |
12 |
|
|
BLK4_5 |
194 |
3.85 |
24 |
|
|
BLK6 |
48 |
3.79 |
6 |
|
|
BQR |
482 |
4.31 |
67 |
|
|
ERC |
208 |
4.93 |
33 |
|
|
Jethro |
53 |
3.11 |
5 |
|
|
Lima |
151 |
3.64 |
18 |
|
|
Sheet |
88 |
2.99 |
9 |
Caledonia Mining Corporation Plc
S-K 1300 Technical Report Summary on the Blanket Gold Mine, Zimbabwe
|
Measured Total |
2 700 |
3.72 |
323 |
|
|
Indicated (5.0% Geological Loss) |
ARM |
475 |
2.68 |
41 |
|
ARS |
337 |
3.13 |
34 |
|
|
ARS_Ext |
50 |
2.31 |
4 |
|
|
BF |
103 |
3.04 |
10 |
|
|
BLK1 |
232 |
3.19 |
24 |
|
|
BLK2 |
228 |
3.86 |
28 |
|
|
BLK3 |
66 |
2.45 |
5 |
|
|
BLK4_5 |
70 |
2.99 |
7 |
|
|
BLK6 |
17 |
4.17 |
2 |
|
|
BQR |
711 |
3.45 |
79 |
|
|
ERC |
144 |
4.69 |
22 |
|
|
Jethro |
177 |
2.82 |
16 |
|
|
Lima |
74 |
3.44 |
8 |
|
|
Sheet |
41 |
2.60 |
3 |
|
|
Indicated Total |
2 726 |
3.23 |
283 |
|
|
Measured + Indicated Total |
5 426 |
3.47 |
606 |
|
Notes:
|
1. |
Cut-off applied 1.5 g/t. |
|
2. |
Geological Losses: 2.5% Measured, 5.0% Indicated, 10.0% Inferred |
|
3. |
Commodity price utilised: USD2,150/oz. |
|
4. |
Mineral Resources are stated exclusive of Mineral Reserves. |
|
5. |
Mineral Resources are reported as 64% attributable to Caledonia. |
|
6. |
All orebodies are depleted for mining. |
Inferred Mineral Resources inclusive and exclusive of Mineral Reserves are the same as there are no inferred Mineral Resources in the Mineral Reserve.
Mineral Resources in the Measured and Indicated Mineral Resource classifications have been converted into Proven and Probable Mineral Reserves respectively, by applying the applicable modifying factors.
The updated Mineral Reserve estimation as of 31 December 2023, is detailed in the table below. Mineral Reserves are stated as delivered to plant, fully diluted with the application of modifying factors.
Diluted Proven and Probable Mineral Reserve Tabulation for Blanket Mine as of 31 December 2023
|
Mineral Reserve Classification |
Tonnes |
Grade |
Au Content |
|
|
Kt |
g/t |
Kg |
Koz |
|
|
Proven |
1 363 |
3.21 |
4 377 |
141 |
|
Probable |
3 555 |
3.31 |
11 782 |
379 |
|
Total |
4 918 |
3.29 |
16 158 |
519 |
Notes:
|
1. |
Mineral Reserve cut-off of 2.1 g/t applied. |
|
2. |
The gold price that has been utilised in the economic analysis to convert diluted Measured and Indicated Mineral Resources in the LoM plan to Mineral Reserves is an average real term price of USD1,877/oz over the LoM, using the forecast prices as per Economic Analysis. |
|
3. |
The Mineral Reserve estimation utilises the depleted 2023 Mineral Resource estimation, the 31 December 2023 mine design and LoM plan. |
|
4. |
Mineral Reserves are reported as 64% attributable to Caledonia. |
An uneconomical tail containing 212.5 koz of gold over a period of 6 years has been excluded from the Mineral Reserve since it is not economical on its own.
IV. Development and Operations
Blanket Mine employs two mining methods that are well suited to the nature of the mineral deposits. The variation within the Blanket Mine mineral deposits necessitates modification of the exact mining methods that suit the specific characteristics of each deposit. The general practice on the Mine is to implement one of two tailored mining methods, determined mainly by the width of the mineral deposit. Long-hole stoping is utilised in wider mineral deposits (orebody widths generally more than 3 m), and underhand stoping is utilised in narrow mineral deposits (orebody widths generally less than 3m).
Caledonia Mining Corporation Plc
S-K 1300 Technical Report Summary on the Blanket Gold Mine, Zimbabwe
The planned thrust in development is aimed at opening up ground below 750 m Level which will be the primary production areas, as well as create the necessary exploration drilling platforms. In the Lima, ARS, Blanket and Blanket Feudal areas some mining activities will take place above 750 m Level. Blanket Mine plans to produce in a range of 75 - 80 koz (recovered) of gold per year.
Blanket Mine is an operational mine with well-established infrastructure and no major modifications or upgrades are necessary to sustain mining and processing operations. Sufficient capital has been allowed for the development, equipment and infrastructure. An upgrade of the ore handling infrastructure between Central Shaft and the Blanket Gold Plant is planned. Power and water supply allocation to the total Blanket operation is deemed to be sufficient to meet current needs although further expansion to the solar plant and efficiency improvements to equipment are under consideration.
The process plant has been operating at a consistent recovery of 93.8%, and this can be expected to continue as long as the ore mineralogy does not change. The average processing rate for the past 12 months was 64.2ktpm, and there are indications that higher processing rates can be achieved with operational improvements, as demonstrated in December 2023 where 85.2 kt was milled.
A new TSF was constructed during 2023 and commissioned in February 2024. Deposition commenced on the phase 1A during December 2023 and is currently in use. Construction on a phase 1B has commenced and is earmarked to be completed during 2024. Phase 2, the final stage of the TSF design is planned for construction during 2025.
V. Economic Analysis
The company performed a mineral asset economic analysis on the Blanket Mine and the diluted Indicated and Measured Resources in the LoM plan, for conversion to Mineral Reserves. The Discounted Cash Flow, or DCF, is based on the production schedule and all costs and capital associated to develop, mine and process the orebody. Relevant taxation and other operating factors, such as recoveries and stay-in-business costs were incorporated into the economic analysis to produce a cash flow over the life cycle of the Mine.
USD commodity prices for the period 2024-2029 have been converted from nominal to real terms. The table below illustrates the forecasts for these six years as well as the long-term forecast used in the financial model. The price forecasts are based on the median of various banks, brokers and analyst forecasts and are in real-terms throughout the life of mine. The average price over the LoM equates to USD1,877/oz. The inflation rate was sourced from the World Economic Outlook.
Gold price forecast (Real Terms)
|
Item |
Unit |
2024 |
2025 |
2026 |
2027 |
2028 |
2029 |
Long-Term |
|
1 |
2 |
3 |
4 |
5 |
6 |
|||
|
Gold |
USD/oz |
2,205 |
2,167 |
2,093 |
1,987 |
1,852 |
1,731 |
1,731 |
Source: Consensus Economic Inc. & World Economic Outlook January 2024.
Caledonia Mining Corporation Plc
S-K 1300 Technical Report Summary on the Blanket Gold Mine, Zimbabwe
Costs reported for the Blanket Mine, which consists of mining, plant and other operating costs, as well as government royalty payments are displayed in the table to follow. Other costs in the Adjusted Operating Costs category include the central and technical services, general and administration, human resources, and other services costs. Other costs for the AISC category include corporate management costs. The costs are displayed per milled tonne as well as per recovered gold ounce.
Project Cost Indicators
|
Item |
Unit |
Blanket Mine |
|
Net Turnover |
USD/Feed tonne |
171 |
|
Mine Cost |
USD/Feed tonne |
31 |
|
Plant Costs |
USD/Feed tonne |
17 |
|
Other Costs |
USD/Feed tonne |
48 |
|
Operating Costs |
USD/Feed tonne |
96 |
|
SIB |
USD/Feed tonne |
18 |
|
Royalties |
USD/Feed tonne |
9 |
|
Reclamation |
USD/Feed tonne |
0 |
|
Other Costs |
USD/Feed tonne |
7 |
|
All-in Sustainable Costs (AISC) |
USD/Feed tonne |
130 |
|
Capital |
USD/Feed tonne |
2 |
|
Other Cash Costs |
USD/Feed tonne |
0 |
|
All-in Costs (AIC) |
USD/Feed tonne |
132 |
|
All-in Cost Margin |
% |
23% |
|
EBITDA1 |
USD/Feed tonne |
76 |
|
EBITDA Margin |
% |
44% |
|
Gold Recovered |
oz |
757 238 |
|
Average Gold Price |
USD/Gold oz |
1,877 |
|
Net Turnover2 |
USD/Gold oz |
1,739 |
|
Mine Cost |
USD/Gold oz |
311 |
|
Plant Costs |
USD/Gold oz |
171 |
|
Other Costs |
USD/Gold oz |
485 |
|
Operating Costs |
USD/Gold oz |
967 |
|
SIB Capex |
USD/Gold oz |
179 |
|
Royalties |
USD/Gold oz |
93 |
|
Reclamation |
USD/Gold oz |
1 |
|
Other Costs |
USD/Gold oz |
72 |
|
All-in Sustainable Costs (AISC) |
USD/Gold oz |
1,312 |
|
Capital |
USD/Gold oz |
18 |
|
Other Cash Costs |
USD/Gold oz |
0 |
|
All-in Costs (AIC) |
USD/Gold oz |
1,330 |
|
EBITDA* |
USD/Gold oz |
771 |
Notes:
|
1. |
*Earnings before interest, tax, depreciation and amortisation (excludes CAPEX). |
The total capital including the sustaining capital amounts to USD149.6 million over the mine life. The Mine has no funding requirement as it has long been in operation.
For the DCF, the gold price and grade have the most significant impact on the sensitivity of the Mine followed by the central services and operating costs. The Mine is least sensitive to capital and plant operating costs.
The value derived for the income approach only reflects the diluted Indicated and Measured Resources in the LoM plan, for conversion to Mineral Reserves. The Mineral Reserve is economically viable with a best estimated NPV of USD107 million (USD83 million attributable to Caledonia) at a real discount rate of 15.4%. No IRR could be calculated as Blanket is already in operation and no initial investment is required. The following table shows a summary of the economic analysis.
Caledonia Mining Corporation Plc
S-K 1300 Technical Report Summary on the Blanket Gold Mine, Zimbabwe
Blanket Mine Economic Analysis Summary – Real Terms
|
Item |
Unit |
Blanket Gold Mine |
Caledonia Attributable* |
|
NPV @ 0% |
USDm |
204 |
158 |
|
NPV @ 2.5% |
USDm |
181 |
140 |
|
NPV @ 5% |
USDm |
161 |
125 |
|
NPV @ 7.5% |
USDm |
145 |
112 |
|
NPV @ 10% |
USDm |
131 |
101 |
|
NPV @ 12.5% |
USDm |
119 |
92 |
|
NPV @ 15.0% |
USDm |
109 |
84 |
|
NPV @ 15.4% |
USDm |
107 |
83 |
|
NPV @ 17% |
USDm |
102 |
79 |
|
IRR |
% |
N/A |
N/A |
|
All-in Cost Margin |
% |
23% |
23% |
|
Break-even Gold Price (AIC) |
USD/oz. |
1 331 |
1 331 |
*Caledonia has a 64% direct equity holding in Blanket and receives dividends, facilitation loan repayments, procurement fees, and management fees.
VI. Conclusions
Over the past few years Blanket Mine have been in the process of upgrading their Mineral Resource estimation system from historical manual block listing methodology to digital estimation processes. Much of the historical sampling database has been captured and can be used for more sophisticated estimation methodologies in the 3D environment. In addition to this, the historical mining voids and development have been captured and can be utilised for the Mineral Resource depletions and mine planning for Mineral Reserve purposes.
The 3D digital environment allows for the scrutiny and review of the geological data in a holistic fashion that was previously not possible. By doing so, geological trends and patterns can be identified for the development of geological concepts that can be utilised in the exploration targeting and the planning of drilling programmes.
This change in Mineral Resource estimation and management systems has resulted in some fluctuations in the Mineral Resource in the short term but these should stabilise and has resulted in an increase in the Blanket Mine Mineral Resources due to improved geological understanding, geological modelling, estimation processes, management and planning systems.
The life of mine plan is logical and the planned production rates are achievable. The mining strategy is focused on a thrust in development to open up ground for planned mining areas below 750 m Level in line with the planned production targets. Blanket mine plans to produce 74 - 80 koz (recovered) of gold per annum.
Existing and planned infrastructure at Blanket are sufficient to sustain the current production profile and the planned increased production.
The process plant has been operating at a consistent recovery of 93.8%, and this can be expected to continue as long as the ore mineralogy does not change. The average processing rate for the past 12 months was 64.2ktpm, and there are indications that higher processing rates can be achieved with operational improvements, as demonstrated in December 2023 where 85.2kt was milled.
Caledonia Mining Corporation Plc
S-K 1300 Technical Report Summary on the Blanket Gold Mine, Zimbabwe
The Blanket Mine plan including only the diluted Indicated and Measured Resources in the LoM plan, for conversion to Mineral Reserves is financially feasible. The updated Mineral Reserve can therefore be declared. The DCF value of USD107 million for the Blanket Mine (USD83 million attributable to Caledonia) was calculated at a real discount rate of 15.4%. No IRR could be calculated since the mine is in operation and no initial investment is required.
Blanket Mine financials are most sensitive to commodity prices, and grade. The Mine financials are least sensitive to capital expenditure and plant operating costs.
The all-in sustaining costs for the Blanket Mine amount to USD130/milled t, which equates to USD1,312/oz. The all-in costs for the Blanket Mine were calculated as USD132/milled t, which equates to USD1,330/oz.
VII. Recommendations
It is recommended that Blanket Mine continue with enhancements to the Mineral Resource estimation process to investigate potential increases in the Mineral Resources in areas above current infrastructure and enhance the planning down-dip. These digital modelling systems should be incorporated into the monthly planning system to ensure the Mineral Resource remains active and updated. The exploration activities, being so successful, should focus along the trends of the main orebodies to determine geological continuity at depths approaching an equivalent 50 level. This will allow the company to obtain a view of longer-term strategies and planning for the mine.
The QAQC data shows an improvement in the QAQC processes for the sampling database but still requires additional focus to ensure accuracy and precision, and to implement remedial action if required, especially for the down dip exploration drilling as this can impact the Mineral Resources significantly and thus requires the highest integrity.
The geotechnical study should be maintained, enhanced and broadened to determine the geotechnical parameters for pillar extraction and the possible changes in support strategy required at depth.
Caledonia Mining Corporation Plc
S-K 1300 Technical Report Summary on the Blanket Gold Mine, Zimbabwe
ITEM 2 - INTRODUCTION
Item 2 (a) – Author
The author of this Technical Report Summary (“TRS”) is Craig Harvey who is a Qualified Person (“QP”). Mr. Harvey was responsible for the compilation of the TRS document with input provided by specialists in relevant sections. Mr Harvey is responsible for the Mineral Resources disclosed in this TRS.
Mr Martiens van Staden is a Qualified Person (“QP”) and is responsible for the Mineral Reserves disclosed in this TRS.
Item 2 (b) – Terms of Reference and Purpose of the Report
This TRS follows the guidelines as prescribed by S-K 1300, and only such terms as defined in §229.1300-1305 have been utilised. The TRS is structured in accordance with the format prescribed in §229.601(b)(96).
Blanket is an operating underground mine with ore processed at an on-site plant. The purpose of this TRS is to present the Mineral Resources and Mineral Reserves of the Mine as at the Company financial year end 31 December 2023. The Mineral Resources and Mineral Reserves are stated at the effective date of 31 December 2023.
The basis for the Mineral Reserves stated in this TRS is a life of mine plan, which constitutes a study with detail and accuracy levels better than the requirements for a pre-feasibility study. The QP has reviewed the life of mine plan and is satisfied that it has demonstrated that, at the time of reporting, the extraction of the Mineral Reserve is economically viable under reasonable investment and market assumptions. The life of mine plan is technically achievable and is the basis of determining the Mineral Reserve.
This TRS updates the previously filed TRS titled S-K 1300 Technical Report Summary on the Blanket Gold Mine, Zimbabwe and dated 31 December 2022, prepared by Minxcon and filed by Caledonia, in terms of S-K 1300.
All monetary figures in this TRS are expressed in United States Dollars (“USD”).
Item 2 (c) – Sources of Information and Data Contained in the Report
The following sources of information, all from Caledonia, were used to compile this TRS:-
|
● |
Legal aspects and tenure: Mr Curtis van Heerden and Mr Patrick Hill; |
|
● |
The Mineral Resource estimate: Mr Craig Harvey, Ms Sego Mashego and Ms Elizabeth van Tubbergh. |
|
● |
The Mineral Reserve estimate: Mr Craig Harvey, Mr Moses Matimba, Mr Ettienne de Villiers and Mr Martiens van Staden. |
|
● |
The life of mine (“LoM”) plan and supporting information that forms the basis of the revised plan: Mr Craig Harvey, Mrs Sego Mashego, Mrs Elizabeth van Tubbergh, Mr Ettienne de Villiers, Mr Martiens van Staden, Mr Elton Gwatidzo and Mr Caxton Mangezi; |
|
● |
Metallurgical information: Mr Gibson Kadzikano; |
|
● |
Engineering information: Mr Deon Niemand and Mr Martiens van Staden, Mr Dirk Bleeker, Mr Nico Spies and Mr Pieter Greyling |
|
● |
Environmental information: Ms Colleen Parkins; and |
|
● |
Financial information: Mr Chester Goodburn, Ms Anja Grobler, Yolandi van den Berg, Mr Darlington Mabvoro and Mr Duncan Mpofu. |
Additional information was sourced from those references listed in Item 24 and is duly referenced in the text where appropriate.
Caledonia Mining Corporation Plc
S-K 1300 Technical Report Summary on the Blanket Gold Mine, Zimbabwe
Item 2 (d) – Qualified Persons’ Personal Inspection of the Property
The Qualified Person (“QP”), term as defined within S-K 1300, responsible for the compilation of this TRS is Mr Craig Harvey. Mr Harvey additionally is QP for the Mineral Resource estimate while Mr Martiens van Staden is QP for the Mineral Reserve estimate.
Mr Harvey is a full-time employee of Caledonia Mining South Africa since 1 March 2023 and has visited the operation on numerous occasions in 2023 to review and assist with the upgrading of the Mineral Resource systems on the operation.
Mr van Staden is a full-time employee of Caledonia Mining South Africa since 2021 and has visited the operation on numerous occasions in 2023 to review and assist with the mining and engineering relating to the underground operations of Blanket.
On visits to the property, time has been spent underground viewing the ore mining operations, including the development operations, the shaft hoisting systems, underground reticulation systems and all aspects relating to the gathering of geological information, underground surveying, and exploration drilling activities. Surface visits have included the new and old TSF’s, the mineral processing plant, on-site analytical laboratory, exploration core logging yard, and the technical service departments.
ITEM 3 – PROPERTY DESCRIPTION AND LOCATION
Item 3 (a) – Area of the Property
The Blanket Mine is an operating underground gold mine situated on the Gwanda Greenstone Belt (“GGB”) targeting shear zone hosted gold mineralisation. The Mine complex comprises a cluster of mines extending from Lima in the north, through Eroica, Sheet, AR Main, AR South, Feudal, Blanket Section (Blanket 1 to Blanket 6) and Jethro over a total strike length of some 3km. Gold has been commercially mined at the Project Area from several closely spaced orebodies defining a mineralised trend via several shafts since the early 1900s. The Mine covers the operating claims of Jethro, Blanket, Feudal, Harvard, Mbudzane Rock, Oqueil, Sabiwa, Sheet, Eroica and Lima, largely encompassed in a 2,120ha mining lease. Ore is processed at an on-site processing plant.
Item 3 (b) – Location of the Property
As illustrated in Figure 1, the Mine is located in the southwest of Zimbabwe, approximately 15 km northwest of Gwanda, the provincial capital of Matabeleland South. Gwanda is located 150 km southeast of Bulawayo, 196 km northwest of the Beitbridge Border post with South Africa, and 560 km from Harare, Zimbabwe's capital city. The Mine is centred on the coordinates (WGS84 system) 20°52' S, 28°54' E.
Caledonia Mining Corporation Plc
S-K 1300 Technical Report Summary on the Blanket Gold Mine, Zimbabwe
Figure 1: General Location of Blanket Mine
|
|
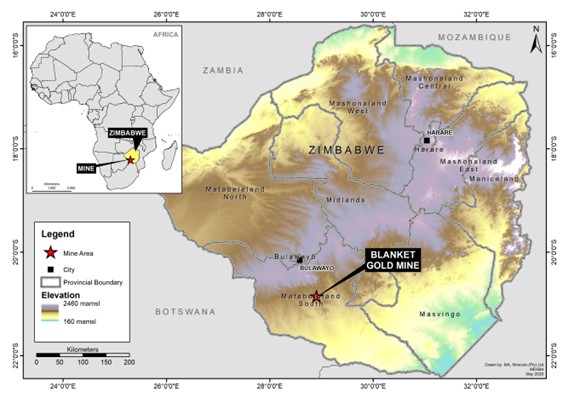
|
|
 |
General Location of Blanket Mine |
December 2023 |
Item 3 (c) – Mineral Deposit Tenure
The Blanket Mine's interests in Zimbabwe include a Mining Lease, operating claims (i.e., on-mine), non- operating claims and a portfolio of brownfields exploration projects (satellite projects), as illustrated in Figure 2 as blocks of claims.
The Blanket Mine operates under a mining lease with registered number 40 (“ML40”) which was issued under the Mines and Minerals Act (Chapter 21:05) of 1961 (“MMA”) as detailed in Table 1. The mine’s claims under the lease cover an area of 2,120 ha, and include Lima, Sheet, Oqueil, Feudal, Sabiwa, Jethro, Harvard, and Blanket claims. The ML40, in which boundaries all current mining activities occur, is issued to Blanket Mine Company.
Table 1: Mining Lease Details
|
Mining Lease Number |
Holder |
Mining District |
Area |
Principal Mineral |
Other Minerals |
Date of Issue |
Validity Period |
|
ha |
|||||||
|
ML40 |
Blanket Mine (1983) (Pvt) Ltd |
Matabeleland South |
2,120.00 |
Gold |
Silver, Copper, Arsenic |
25 May 2023 |
1 year, renewable. Current tenure period expires on 24 May 2024 |
Blanket Mine also has several registered claims not incorporated under the lease. The 90 claims contiguous to the mining lease comprise a total area of approximately 998 ha. The registration numbers, area, number of claims and number of blocks for the individual claims are listed in Appendix 1.
Caledonia Mining Corporation Plc
S-K 1300 Technical Report Summary on the Blanket Gold Mine, Zimbabwe
In addition, Blanket Mine holds several non-operating claims located away from ML40 and the adjoining claims described above, that form a portion of the Gwanda portfolio. The names of each claim, as well as registration numbers and type of minerals are listed in Appendix 2. These non-producing claims (satellite projects) consist of 184 blocks of registered base metal (Ni, Cu and As) and precious metal claims covering a total area of 2,443ha.
Figure 2: Location of Blanket Mining Lease and Claims
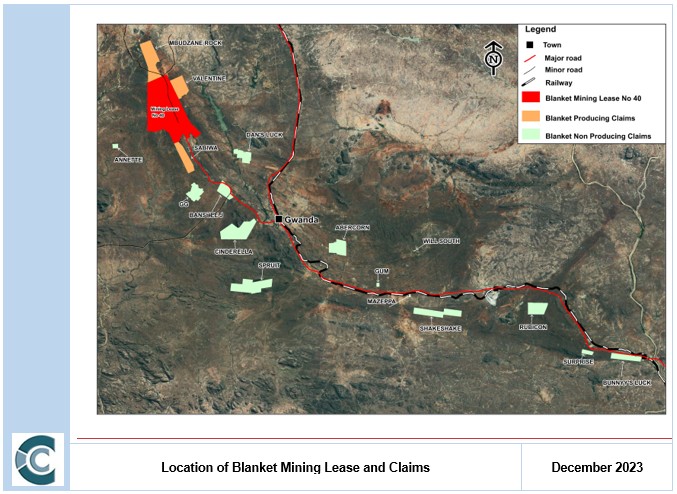
A summary of the Blanket mineral titles is provided in Table 2 and corresponds to the Figure 2.
Table 2: Blanket Mineral Title Areas and Status
|
Claim Block |
Status |
|
ML40 |
Operating |
|
Valentine |
Operating |
|
Sabiwa |
Operating |
|
Mbudzane Rock |
Operating |
|
GG |
Non-operating (was under development for gold mining, currently on hold) |
|
Annette |
Non-operating |
|
Cinderella |
Non-operating |
|
Dan’s Luck |
Non-operating |
|
Gum |
Non-operating |
|
Banshee J |
Non-operating |
Caledonia Mining Corporation Plc
S-K 1300 Technical Report Summary on the Blanket Gold Mine, Zimbabwe
|
Mazeppa |
Non-operating |
|
Will South |
Non-operating |
|
Spruit |
Non-operating |
|
Shakeshake |
Non-operating |
|
Rubicon |
Non-operating |
|
Surprise |
Non-operating |
|
Bunny’s Luck |
Non-operating |
|
Abercorn |
Non-operating |
A number of claims are subject to active tribute agreements between the Mine and local small-scale miners as part of the Company’s Corporate Social Responsibility. This is further discussed in Item 17 (d).
Annual payments (non-material) are due to government authorities for each of the claims and lease areas in order to continue the validity of the licences.
In accordance with paragraph 178(2)(a)(b)(c) of the MMA, the owners of the claims of this project possess the following respective surface rights:-
|
● |
use of any surface within the boundaries for all necessary mining purposes; |
|
● |
the right to use, free of charge, soil, waste rock or indigenous grass situated within the claims boundaries for all necessary mining purposes; |
|
● |
the right to sell or dispose of recovered waste rock. |
It is the belief of Caledonia that this clause provides sufficient rights to use the surfaces of the claim blocks that have been consolidated into the ML40. The MMA Amendment Bill makes instruction for landowner compensation in case of land loss due to mining activities in the form of land reallocation or outright purchase. Blanket Mine activities have not triggered this compensation and are not foreseen to do so.
Blanket Mine (1983) (Pvt) Ltd is held 64% by Caledonia Holdings Zimbabwe (Pvt) Ltd, which is a wholly owned subsidiary of Greenstone Management Services Holdings Limited (“GMS”), which in turn is wholly owned by Caledonia. Blanket Mine Company is incorporated in Zimbabwe and is the owner and operator of the Blanket Mine. 16% Share in Blanket Mine Company is held by the National Indigenisation and Economic Empowerment Fund, 10% by Gwanda Community Share Ownership Trust, and 10% by an Employee Trust for the benefit of the present and future employees of Blanket Mine.
Pursuant to an arrangement agreed in February 2020, the Gwanda Community Share Ownership Trust (“GSCOT”) received 20% of its dividends declared by Blanket and the remaining 80% was set off against the advance dividends. As of September 2023, GSCOT repaid the advance dividends and now receives its full dividend entitlement.
Item 3 (d) – Royalties and Payments
I. Government Royalties
Mining royalties are charged in terms of the MMA. The royalties are collectable from all the minerals or mineral-bearing products obtained from any mining location and disposed of by a miner or on his behalf. The royalties are chargeable whether the disposal is made within or outside Zimbabwe.
In terms of Zimbabwean tax laws, where gold produced exceeds 0.5kg, a 5% royalty is applicable. For primary gold producers a two-tier system that is based on gold prices is applicable. For gold prices below US$1,200/oz, the rate is 3%, and for gold prices above US$1,200/oz, the rate is 5% of the gross revenue from gold mining.
Caledonia Mining Corporation Plc
S-K 1300 Technical Report Summary on the Blanket Gold Mine, Zimbabwe
II. Net Smelter Royalties
Blanket Mine does not have any net smelter royalties applicable to its current operations.
A number of claims were held under option agreements between Blanket Mine Company and the claim holders. Blanket Mine Company has exercised all its options and purchased the claims under conditions outlined in the option agreements. Each of these has a net smelter royalty (“NSR”) associated with it. The remainder of claims are 100% held by Blanket Mine Company. A summary of the ownership of each claims area is provided in Table 3.
Table 3: Blanket Mineral Title Areas and Ownership
|
Claim Block |
Ownership |
Royalty Condition |
|
ML40 |
Blanket Mine (1983) (Pvt) Ltd |
|
|
Valentine |
Blanket Mine (1983) (Pvt) Ltd – Option exercised |
3.0% NSR |
|
Sabiwa |
Blanket Mine (1983) (Pvt) Ltd |
|
|
Mbudzane Rock |
Blanket Mine (1983) (Pvt) Ltd |
|
|
GG |
Blanket Mine (1983) (Pvt) Ltd – Option exercised |
2.5% NSR |
|
Annette |
Blanket Mine (1983) (Pvt) Ltd – Option exercised |
3.0% NSR |
|
Cinderella |
Blanket Mine (1983) (Pvt) Ltd – Option exercised |
3.0% NSR |
|
Dan’s Luck |
Blanket Mine (1983) (Pvt) Ltd – Option exercised |
2.5% NSR |
|
Gum |
Blanket Mine (1983) (Pvt) Ltd – Option exercised |
3.0% NSR |
|
Banshee J |
Blanket Mine (1983) (Pvt) Ltd – Option exercised |
3.0% NSR |
|
Mazeppa |
Blanket Mine (1983) (Pvt) Ltd – Option exercised |
2.5% NSR |
|
Will South |
Blanket Mine (1983) (Pvt) Ltd – Option exercised |
2.5% NSR |
|
Spruit |
Blanket Mine (1983) (Pvt) Ltd |
|
|
Shakeshake |
Blanket Mine (1983) (Pvt) Ltd |
|
|
Rubicon |
Blanket Mine (1983) (Pvt) Ltd |
|
|
Surprise |
Blanket Mine (1983) (Pvt) Ltd |
|
|
Bunny’s Luck |
Blanket Mine (1983) (Pvt) Ltd |
|
|
Abercorn |
Blanket Mine (1983) (Pvt) Ltd |
Item 3 (e) – Environmental Liabilities
Operating mines in Zimbabwe are required to set aside money as part of the closure plan and fulfilment of the provisions of the MMA and Environmental Management Act (Chapter 20:27) (“EM Act”). The Ministry of Mines is working on amendments to the MMA in which there will be conditions for protection of the environment through the Safety, Health and Rehabilitation Fund.
At the time of writing, no statutory instrument has been gazetted implementing an environmental fund as yet, thus no fees are currently due. As such, no environmental rehabilitation trusts and guarantees have been established for Blanket Mine in terms of Zimbabwean law. The closure report for Blanket Mine (which has been undertaken independently by Knight Piesold) was updated at the end of 2023, and closure costs are accounted for as a contingent liability internally in terms of the accounting standard IAS 37 (Provisions, Contingent Liabilities and Contingent Assets).
Item 3 (f) – Permits to Conduct Work
The permits relating to the mining operations at Blanket are described in the sections to follow. The Mine is compliant in terms of authorisations and adheres to all government protocols and regulations as required.
Caledonia Mining Corporation Plc
S-K 1300 Technical Report Summary on the Blanket Gold Mine, Zimbabwe
I. Water Agreement
Water for the operations is sourced from the Blanket Dam that is situated on the Mtshabezi River and owned by the Zimbabwe National Water Authority (“ZINWA”). The use of this water is authorised through a contract agreement between Blanket Mine and ZINWA in terms of the Zimbabwe National Water Authority Act (Chapter 20:251).
In terms of this agreement, Blanket Mine is allowed to extract 1,200,000 m3 of water for the period 1 April 2023 to 31 March 2024. The agreement is valid for one-year periods and is renewed annually. ZINWA sends the renewable agreement for signing to Blanket on an annual basis.
Blanket continues to extract water in the interim at a rate of USD $0.17/m3.
II. Environmental Impact Assessment Certificates
In Zimbabwean mining legislation, an Environmental Impact Assessment (“EIA”) is not required in order to issue a mining licence, and in terms of the EM Act and its First Schedule is only required prior to commencement of mining and forms part of the planning process. Blanket Mine was established in the early 1900s, long prior to the implementation of governing mining and environmental laws. As such, it appears that an EIA is not required for the Blanket Mine. However, the Company is in constant communication with the Environmental Management Agency (“EMA”) regarding environmental permitting requirements and an EIA was completed for the Mine in 1995. Should the EMA communicate that an EIA certificate for the Mine be obtained, the Company will submit all relevant and associated applications to obtain such and remain fully compliant.
Blanket Mine holds EIA certificates as issued by the EMA for the solar plant, both the old and new TSF’s and development of the additional GG and Abercorn gold mines, which do not form subject of this Report but are detailed in Table 4 for completeness.
Table 4: EIA Certificates
|
Licence Number |
Activity |
Valid Period |
|
8000120641 |
EIA Certificate - Abercorn Mine |
15 June 2023 – 14 June 2024 |
|
44GC0094/2020 |
Solar Plant Licence (generation licence) |
25 years (from 2020) |
|
8000120642 |
GG Mine – Gold Mining Development |
15 June 2023 – 14 June 2024 |
|
8000124691 |
EIA Certificate – new TSF |
10 October 2023 – 9 October 2024 |
The new TSF is currently operating under the authorisation granted through the approval of the Environmental Impact Assessment, and a licence will be issued by the Zimbabwean Environmental Management Agency (EMA).
III. Additional Environmental Permits
In order for operations to continue, the EMA has issued a number of additional environmental licences to Blanket Mining Company, including:
|
● |
air emissions (clinic incinerator, blacksmith shop, laboratory, smelter house and power plant generators); |
|
● |
solid waste (landfill and tailings); |
|
● |
effluent disposal (sewerage and car wash bay); |
|
● |
hazardous substances (importation, transportation and storage); and |
|
● |
hazardous waste generation (oils and clinical waste). |
Caledonia Mining Corporation Plc
S-K 1300 Technical Report Summary on the Blanket Gold Mine, Zimbabwe
These licences are listed in Table 5.
Table 5: Environmental Permits
|
Licence Number |
Activity |
Valid Period |
|
L0000010451 |
Diesel generator |
18 Mar 2024 – 31 Dec 2024 |
|
L0000010449 |
Clinic incinerator |
18 Mar 2024 – 31 Dec 2024 |
|
L0000010452 |
Blacksmith Licence |
18 Mar 2024 – 31 Dec 2024 |
|
L0000010453 |
Assay laboratory |
18 Mar 2024 – 31 Dec 2024 |
|
L0000010450 |
Smelter Licence |
18 Mar 2024 – 31 Dec 2024 |
|
L0000010455 |
Washbay effluent disposal |
18 Mar 2024 – 31 Dec 2024 |
|
L0000010454 |
Sewage effluent disposal |
18 Mar 2024 – 31 Dec 2024 |
|
L0000010463 |
Hazardous substance generation |
18 Mar 2024 – 31 Dec 2024 |
|
L0000010457 |
Solid waste Disposal (Landfill) |
18 Mar 2024 – 31 Dec 2024 |
|
L0000010458 |
TSF Licence (old TSF) |
18 Mar 2024 – 31 Dec 2024 |
|
L0000010462 |
TSF Licence (new TSF) |
18 Mar 2024 – 31 Dec 2024 |
|
L0000010456 |
Workshops and oil separators |
18 Mar 2024 – 31 Dec 2024 |
|
L0000010451 |
Diesel generator |
18 Mar 2024 – 31 Dec 2024 |
|
L0000010449 |
Clinic incinerator |
18 Mar 2024 – 31 Dec 2024 |
|
L0000010452 |
Blacksmith Licence |
18 Mar 2024 – 31 Dec 2024 |
The QP is not aware of any past material violations or fines.
Item 3 (g) – Other Significant Factors and Risks
The QP is not aware of any factors or risks that may affect access, title or right or the ability to perform work on the property.
ITEM 4 – ACCESSIBILITY, CLIMATE, LOCAL RESOURCES, INFRASTRUCTURE AND PHYSIOGRAPHY
Item 4 (a) – Topography, Elevation and Vegetation
The area around the Blanket Mine is hilly and lies at an altitude of about 1,000 m to 1,300 m above mean sea level (“amsl”). Drainage is to the northeast, into the Mtshabezi River on which the Sheet Dam and the Blanket Dam are located (some 5 km to the east of the Mine). The main natural water sources include the Tuli River, with its main tributaries (in the east bank running in a north-south direction) being the Mnyabetsi River in the Dibilashaba Communal Area, the Sengezane River in the Garanyemba Communal Area, and the Ntswangu and Pelele Rivers in the Gwanda Bolamba Communal Area.
The indigenous vegetation is dominated by savannah with Marula (Sclerocarya birrea), a variety of Combretum species, Terminalia sericea, Mopane groves and patches of grassland. Around the mine and local settlements, vegetation has been cut down and invaded by secondary thorny scrub dominated by Dichrostachys cinerea. Agriculture is limited to subsistence farming of maize and vegetables.
Caledonia Mining Corporation Plc
S-K 1300 Technical Report Summary on the Blanket Gold Mine, Zimbabwe
Item 4 (b) – Access to the Property
Access to the Blanket Mine is by an all-weather single lane tarred road from Gwanda. Gwanda is linked by national highways to Bulawayo, Harare, and the Beitbridge Border post. Earlier, Zimbabwe had good road infrastructure. However, lack of investment over the past ten to fifteen years resulted in its deterioration; substantial investment is required country wide. The railway line connecting the Zimbabwean national network to South Africa passes through Gwanda. An airstrip for light aircraft is located 5 km to the northwest of the town.
Gwanda Town is the provincial capital of Matabeleland South Province and district capital of Gwanda District. The village of Vubachikwe lies immediately adjacent to the southeast of ML 40. Blanket Mine labourers and their families are accommodated in a mine village about 1 km from the Mine. Gwanda offers a number of lodges and alternative accommodation options. Gwanda offers limited hospitals and medical services, business and financial services, educational facilities, shops, recreational facilities, and amenities. Larger hospitals and establishments are offered in Bulawayo, in addition to more skilled service industries. Neighbouring towns and villages to the Mine provide skilled and unskilled labour.
Major economic activities in the district include gold mining, cement production, livestock production, game ranching and tourism. A number of dams and irrigation schemes are established. The population in the district is mostly rural, with the majority of employed people servicing the agriculture and related industries.
The district is serviced by telecommunication services, and Blanket Mine provides its own Wi-Fi and communication systems.
The A6 highway, forming part of the Trans-African Highway network, is orientated roughly northwest-southeast and links Bulawayo with the Beitbridge border post and Musina in South Africa. The highway runs through the town of Gwanda. A major sealed road, the Old Gwanda Road, branches off from the A6 in Gwanda and runs directly through the ML 40 to Bulawayo. The Blanket claims are all located along these major roads and are thus easily accessible. The roads are sealed and although potholing is frequent, the surfaces are navigable by all vehicles. The Beitbridge Bulawayo Railway runs roughly parallel to the A6 through Gwanda Town.
An airstrip and informal airport building are located in Gwanda along the A6. The Joshua Mqabuko Nkomo International Airport is located in Bulawayo. The Mine can be accessed either via the Beitbridge-Bulawayo Road, or by flying into Bulawayo and driving two hours via the Old Gwanda Road or the A6 to the site.
Item 4 (c) – Climate and Length of Operating Season
The climate in Gwanda is hot and semi-arid, classified as BSh type (extremely hot summers and warm to cool winters, with minimal precipitation) by the Köppen climate classification system. Temperatures are as high as 40ºC during summer months of November to February and average 13ºC during winter (May to August). The climatic conditions make the area vulnerable to meteorological hazards such as droughts, floods, gusty winds, as well as lightening during the wet and hot season.
The region experiences short, variable rainfall seasons (averaging generally below 400 mm per year), and long, dry winter periods. Rainfall is usually associated with thunderstorms, producing rainfall of short duration and high intensity. The rainfall, in general, is less than half of the potential evaporation which has necessitated irrigation development and infield rainwater harvesting to improve crop production which complements animal husbandry as well as reclaims open access areas such as grazing lands. It also induces underground water recharge as part of improving the environment.
Caledonia Mining Corporation Plc
S-K 1300 Technical Report Summary on the Blanket Gold Mine, Zimbabwe
No appreciable mine production downtime is expected owing to unfavourable climatic or weather conditions. The mine is able to operate year-round.
Item 4 (d) – Infrastructure
I. Regional Infrastructure
The Blanket mine area is supplied with power through the national grid operated by the Zimbabwe Electricity Transmission and Distribution Company. Power is supplied from the grid to the operations via three overhead powerlines (“OHLs”) energized at 11 kV and 33 kV supplying 18MVA and Mtshabezi line adding another 7MVA. This totals to a maximum demand supply of 25MVA. The Zimbabwe Electricity Supply Authority (“ZESA”) currently allocates a capacity of 18MVA to the operations.
Water supply to the Blanket Mine area is sourced from the Blanket Dam located 5 km east of the Mine, as well as groundwater. The Blanket Dam has a capacity of 15 Mm³ and all water rights are held by ZINWA. Water users including Blanket Mine purchase all service and domestic / potable water from ZINWA.
Logistics infrastructure in the Blanket Mine area consists mainly of the local road network, national rail network and an airstrip located northwest of the town of Gwanda. All of the above-mentioned infrastructure is easily accessible from Blanket Mine.
I. Mine Infrastructure
Mine infrastructure comprises of underground workings, various shaft with head gear and hoisting facilities, a process plant, workshops and a new tailings storage facility (“TSF”) commenced deposition during December 2023 and was fully commissioned during February 2024. Stores, workshops and offices, as well as an assay laboratory, are located adjacent to the mine shafts. There is adequate surface area for any potential future expansion. With regards to the accessibility to personnel, services and supporting industries refer to Item 4 (b).
ITEM 5 – HISTORY
Item 5 (a) – Prior Ownership and Ownership Changes
The Blanket Mine is part of the Sabiwa group of mines within the GGB from which gold was first extracted in the 19th century. The Blanket Mine is a cluster of mines extending some 3 km from Jethro in the south through Blanket itself, Feudal, AR South, AR Main, Sheet, and Eroica, to Lima in the north. Blanket Mine has produced over a million ounces of gold during its lifetime.
Following sporadic artisanal working, the Blanket Mine was acquired in 1904 by the Matabele Reefs and Estate Company. Mining and metallurgical operations commenced in 1906 and between then and 1911, 128,000 t were mined. From 1912 to 1916 mining was conducted by the Forbes Rhodesia Syndicate who achieved 23,000 t. There are no reliable records of mining for the period between 1917 and 1941 and it is possible that operations were adversely affected by political instability during World Wars I and II. In 1941 F.D.A. Payne produced some 214,000 t before selling the property to Falconbridge in 1964 (Blanket Mine, 2009). Under Falconbridge, production increased to 45 kg per month and the property yielded some 4 Mt of ore up until September 1993. Kinross Gold Corporation (“Kinross”) then took over the property and constructed a larger Carbon-in-Leach (“CIL”) plant with a capacity of 3,800tpd. This was designed to treat both run of mine (“RoM”) ore and an old TSF.
Caledonia Mining Corporation Plc
S-K 1300 Technical Report Summary on the Blanket Gold Mine, Zimbabwe
Item 5 (b) – Historical Exploration and Development
Exploration was conducted between 1997 and 2006 around the GG and Mascot areas with follow-up exploration drilling in 2013 around these same areas. Currently, there are exploration shafts at these two sites.
Caledonia completed the purchase of the Blanket Mine from Kinross on 1 April 2006. The Mine re-started production in April 2009 after a temporary shut-down due to the economic difficulties in Zimbabwe. In late 2010, The Mine successfully completed an expansion project which increased production capacity from 24,000 oz of gold per annum to 40,000 oz of gold per annum. More recently, the Central Shaft was sunk to a depth of 1201.3 metres below surface elevation and the permanent rock handling facilities commissioned during April 2023. Minor infrastructure construction work is continuing the shaft system including the water handling system and spillage loading arrangement before the shaft can be considered to be fully commissioned. The Central Shaft system has allowed Blanket Mine to maintain production between 74koz to 80Koz. Over its life to December 2023, Blanket has produced some 1.78 Moz gold from 14.21 Mt ore milled.
ITEM 6 – GEOLOGICAL SETTING, MINERALISATION AND DEPOSIT
Item 6 (a) - Regional Geology
The majority of Zimbabwe’s known gold mineralisation occurs in host rocks of the Zimbabwe Craton, which is comprised of Archaean-aged basement lithologies. The Archaean basement consists of supracrustal greenstone belts surrounded by granitoid rocks of various ages. The greenstones consist dominantly of meta-basalts with smaller proportions of ultramafic and felsic extrusives and intrusives, and sedimentary rocks. Various combinations of these rock types often occur in association with adjacent granitoid or internal granitoid bodies (Kalbskopf and Nutt, 2003). The Craton is flanked along the northern, eastern, and southern sides by mobile belts of varying ages.
A total of 28 discrete recognised greenstone belts of various ages are hosted on the Zimbabwe Craton. The greenstone belts are subdivided into three main stratigraphic units, namely the Sebakwian, Bulawayan and Shamvaian Groups, with the Bulawayan being further subdivided into Upper and Lower Groups. All of these are bounded by unconformities (Mhlanga, 2002). The stratigraphic units are described as follows:
Older greenstones called the Sebakwian Group (~3.5 Ga), which are mostly metamorphosed to amphibolite facies. They comprise komatiitic and basaltic volcanic rocks, some banded iron formation (“BIF”), as well as clastic sediments.
The Lower Bulawayan Group (~3.1 Ga to 2.9 Ga), which comprises basalts, high-Mg basalts, felsic volcanic rocks and mixed chemical and clastic sediments. The Lower Bulawayan Group forms the Belingwe (Mberengwa) greenstones.
The Upper Bulawayan Group (~2.7 Ga) consists dominantly of meta-basalts with a basal unit of meta-sediments, including BIF, and komatiites overlain by a further sequence of clastic meta-sediments.
The Shamvaian Group (~2.6 Ga) is essentially a sedimentary unit interlayered with felsic volcanic rocks.
The Blanket Mine is situated on the north-western limb of the Archaean Gwanda Greenstone Belt (“GGB”) in south-western Zimbabwe. The GGB is approximately 70 km in length (west to east) and 15 km wide (north to south). The belt is typical of greenstone belts of the Zimbabwe Craton consisting of mafic to felsic volcanics with intercalated sedimentary units.
Caledonia Mining Corporation Plc
S-K 1300 Technical Report Summary on the Blanket Gold Mine, Zimbabwe
Repeated strong deformation affected all lithologies. Structurally, the GGB is dominated by a major periclinal synform, plunging 60° NW in the western half of the belt. It is flanked on both sides by two major deformation zones, namely the Northwest Gwanda Deformation Zone (“NWGDZ”) on the north-western limb and the South Gwanda Deformation Zone (“SGDZ”) along the southern limb. The SDGZ forms part of a regional structure bounding the southern margin of the belt. In the convergence zone of the NWGDZ and the SGDZ, the Colleen Bawn Deformation Zone (“CBDZ”) splays off the SGDZ eastwards, following the north-eastern arm of the belt. The NWGDZ is approximately 2 km wide and 18 km long with a general northwest to north-northwest trend, from the town of Gwanda to the north-western extremity of the belt (Campbell and Pitfield, 1994).
Four phases of deformation have been defined by Fuchter (1990). Repetition of lithological units, particularly in the north-west, is interpreted as evidence of D1 thrusting. The D2 event produced wide zones of intense schistose deformation, considered to be associated with the gold mineralisation. The D1 thrust phase has a coincident trend and may be an early part of the D2 event (AGS, 2006).
The large fold structures of the D3 deformation event dominate the eastern and western ends of the GGB. Blanket Mine mineralisation the lies on the northern limb of the large western fold (the Northwest Mineralised Camp). The final D4 deformation event produced major lineaments which dominate the southern margin of the GGB (Fuchter, 1990). Owing to the close proximity of the GGB to the high-grade metamorphic Limpopo Mobile Belt, GGB metamorphism reaches upper greenschist to amphibolite facies and is higher than in the typical Zimbabwean greenstone belts.
Item 6 (b) - Local and Property Geology
As described by AGS (2006), in the Blanket Mine area, lithologies comprise non-mineralised basal felsic schists of igneous or sedimentary origin in the east. Tailings facilities are generally sited on this Felsic Unit.
The felsics are overlain by a metabasaltic ultramafic to mafic unit with pillow basalts remnants. This Mafic Unit is subdivided into a lower zone and upper zone. Ultramafics and BIFs comprise the lower zone, while massive to pillowed lavas with intercalated interflow sediments (cherty argillites) comprise the upper zone (or Black Markers; MSA, 2011). Mineralisation at the adjacent Vubachikwe Mine is hosted in the BIF unit, while Blanket mineralisation occurs in the overlying mafics. Regionally, the rock is a fine-grained massive amphibolite with localised shear planes. A low angle transgressive shear zone characterised by biotite and a well-developed fabric, cuts through the mafic zone is the locus of the gold ore shoots. The shear zone may be up to 50 m wide (AGS, 2006).
Intruding this package is a younger, barren olivine-gabbro sheet. The entire sequence is capped by andesitic lavas with amphibolite feldspar schists of the Intermediate Unit (MSA, 2011).
The generalised stratigraphic column for the area is shown in Figure 3.
Caledonia Mining Corporation Plc
S-K 1300 Technical Report Summary on the Blanket Gold Mine, Zimbabwe
Figure 3: Stratigraphic Column of the Blanket Mine Area
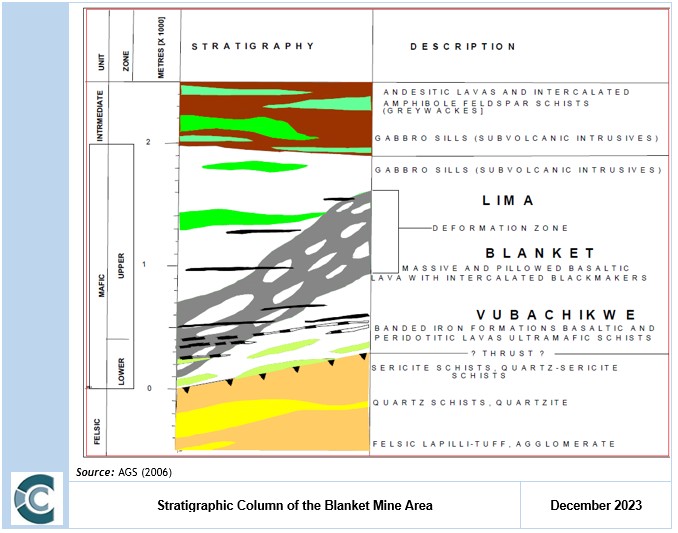
The entire sequence is cut by a regional dolerite sill from the south at Vubachikwe, through the Blanket Mine, to the Smiler deposit which lies approximately 3 km north of the Blanket Mine. Although no significant displacement is caused by the sill, it truncates all the ore shoots, but below the sill continuity of mineralisation is observed (AGS, 2006).
The geology at the Blanket Mine, including the shaft locations, is illustrated in Figure 4. A geological cross section at No 4 shaft is presented in Figure 5.
Caledonia Mining Corporation Plc
S-K 1300 Technical Report Summary on the Blanket Gold Mine, Zimbabwe
Figure 4: Local Geology of Blanket Mine
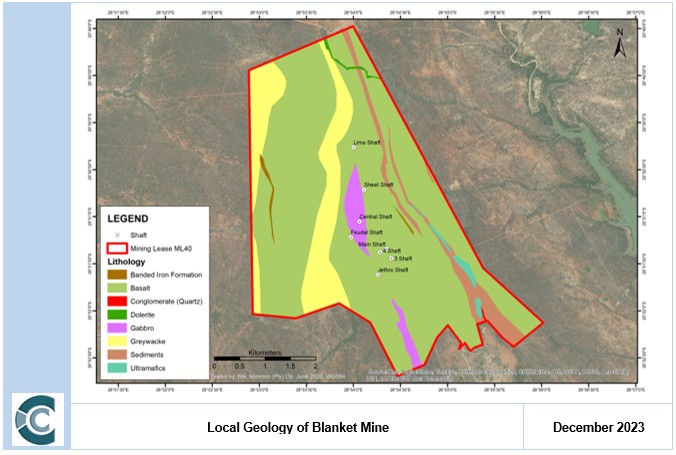
Figure 5: Geological Cross Section of Blanket Mine at No 4 Shaft
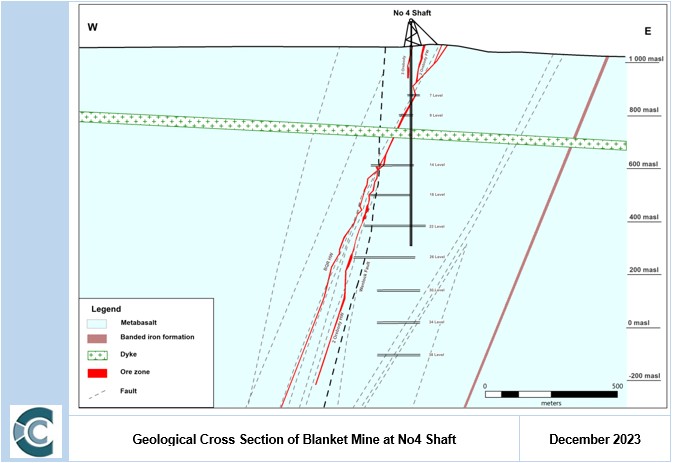
Caledonia Mining Corporation Plc
S-K 1300 Technical Report Summary on the Blanket Gold Mine, Zimbabwe
Item 6 (c) – Mineralisation and Deposit Type
Mining at Blanket occurs over a 3 km strike that includes from north to south, the deposits of Lima, Eroica, Sheet, AR Main, AR South, Feudal, Blanket Section (Blanket 1 to Blanket 6) and Jethro. The main Blanket underground workings are connected to Lima by a 2 km long haulage which follows the strike of the main fabric.
Varying strikes are recorded for the deposits. As described by AGS (2006), mineralisation occurs in near vertical shoots aligned along an approximately N-S axis. The ore shoots vary in shape from the tabular-lensoidal quartz reefs to the massive to pipe-like disseminated sulphide reefs (“DSR”).
Wall rock alteration typically comprises silica−pyrite−muscovite within a broader carbonate alteration halo. Quartz-carbonate altered rock forms the most commonly recognised alteration assemblage. Gold is deposited at crustal levels within and near the brittle-ductile transition zone.
The deposits may have a vertical extent of up to 2 km, demonstrate extensive down-plunge continuity, and lack pronounced zoning. The ore mineralogy is dominated by gold, pyrite and arsenopyrite. Subordinate minerals such as galena, chalcopyrite, pyrrhotite, sphalerite, tellurides, scheelite, bismuth and stibnite also occur. Sulphide mineralogy commonly reflects the litho-geochemistry of the host rock with arsenopyrite being the most common sulphide mineral in metasedimentary host rocks and pyrite or pyrrhotite being more typical in metamorphosed igneous hosts. The gangue and alteration mineralogy are dominated by quartz and carbonate (ferroan dolomite, ankerite, siderite, calcite) with subordinate albite, fuchsite, sericite, muscovite, chlorite, and tourmaline.
Two quartz-filled shear zones are mined, namely the Blanket Quartz Reef (“BQR”) and the Eroica Reef, which have long strike lengths but are not uniformly mineralised although continuous pay shoots of over 100 m on strike are seen. Gold grade fluctuations are more extreme in the quartz reefs than in the DSR type reefs but on average these quartz shears have higher grades and are used as a sweetener of ore to the mill (MSA, 2011).
Table 6 provides a description of the mineralised sections at Blanket.
Table 6: Description of Deposits at Blanket Mine (after MSA, 2011)
|
Name |
Description |
|
Blanket Quartz Reef |
The BQR strikes some 500 m on surface and is up to 5 m wide, diminishing with depth, dipping 55°W. It displaces the DSR type orebodies with an apparent reverse movement of up to 250 m. The reef texture varies from typical quartz reef at depth through sheeted and boudinaged veinlets to ankeritic carbonate in schist and a sulphide replacement ore zone. This is interpreted as a transition from brittle ductile to a more ductile regime with depth. Towards the north of the reef outcrop, a Z-shaped inflection forms the thickest part of the reef, up to 5 m, compared to less than 1 m on the limbs. Similar inflections are found elsewhere in the Northwest Gwanda Shear Zone. Subsequent to mineralisation the reef was displaced by the north-striking vertical Wenlock Fault which has a dextral strike-slip component of about 60 m. Mineralisation in the BQR is not uniform and comprises native gold with galena. Arsenopyrite is more dominant down-dip. Economic mineralisation is restricted to three 90 m pay shoots. |
|
Lima |
Lima is situated 2 km north of the Blanket Section and an underground haulage links the two mines. Like the Blanket Section orebodies, the Lima orebodies developed in very high-strain areas. The main shoots are the Hanging Wall and Interlimb. Mineralisation in the Hanging Wall limb comprises pyrite with subordinate arsenopyrite in cleavage planes within pervasive biotite/chlorite alteration. The Interlimb is characterised by a centrally silicified core with pyrite and arsenopyrite constituting the main sulphides. |
|
Eroica |
The Eroica orebody lies approximately 1,300 m north of the Blanket Section orebodies and renowned for its high native gold content. It dips at 65°W and has a strike length of 300 m in a northerly direction. The Eroica orebody is hosted in a high-strain area where the shear is up to 15 m wide. Brown carbonate alteration characterises the shear in strong association with biotite development. The orebody is defined by thin silicified stringers that develop into swells of up to 5 m in width. The silicification shows pinch and swell both on strike and down-dip, resulting in a series of dismembered silicified pods developed within a particular shear. The biotite and carbonate alteration, together with the silicified stringers, form marker links between the dismembered pods. Finely disseminated arsenopyrite, pyrite and pyrrhotite are associated with the gold mineralisation. |
|
Sheet |
The Sheet orebody lies about 500 m south of Eroica and is a typical example of a fault-controlled mineralisation. It comprises of at least three stepped-out, sinistrally displaced and highly silicified hornblende-chlorite schist fault blocks. The orebody was subjected to both strike and “east-west” dip faulting, resulting in major bifurcation of the orebody up-dip into highly fractured North and South orebodies with variable dips. As with the other DSR orebodies at Blanket Mine, the less disturbed Sheet orebody down-dip extension has a 60-65°W dip and a fabric that is sympathetic to the north-northwest regional shear.
The orebody can attain widths and strike lengths of up to 15 m and 60 m respectively. Mineralisation is associated with finely disseminated arsenopyrite. Pyrite and pyrrhotite occur as accessory minerals and are generally indicative of poor mineralisation. The orebody is encompassed within a ductile metabasalt country rock. The orebody was mined between 230 m Level and 870 m Level on separate dismembered shear zones. Further exploration is ongoing to assess the resource growth potential of the down-dip extension. |
Caledonia Mining Corporation Plc
S-K 1300 Technical Report Summary on the Blanket Gold Mine, Zimbabwe
|
Name |
Description |
|
AR Orebodies |
AR is a “Z”-shaped mineralised zone and consists of two separate orebodies (AR Main and AR South) with widths up to 30 m as a result of tectonic thickening from faulting and folding. The mineralised zone has no known surface expression and appears to form a ‘peak’ under the regional dolerite sill just above 9 Level some 500 m north of the Blanket Section orebodies. From this point the body splits into two the ore shoots of AR Main and AR South, which plunge 55°W and 58°SW respectively.
AR Main AR Main is a DSR-type orebody and occurs within a broad shear envelope in pillowed metabasalts, which is generally irregular in plan and bounded by shears that assist in defining the limits of the mineralisation. At 750 m Level, a shear disrupts the bodies causing the plunge to flatten to the west. The orebody strikes between 40 m and 60 m with an average width of 30 m at the centre of the envelope.
The ore is a silicified amphibolite predominantly comprised of quartz with minor carbonate and chlorite minerals. Gold mineralisation is associated with arsenopyrite and to a much lesser extent pyrrhotite and pyrite. Finely disseminated arsenopyrite occurs within the orebody which form the high grade areas. Sulphide minerals seldom amount to more than 5% of the rock by volume. The orebody is massive and is exploited using the long-hole open stoping method.
AR South AR South plunges southwest, trending towards the Blanket 2 orebody at depth. AR South is also developed within a broad shear zone and is more pipe-like than AR Main. Its maximum thickness is approximately 50 m and high grade sections are defined by silicification and arsenopyrite. |
|
Feudal |
Occurring in the hanging wall of the Blanket-Lima strike about 900 m northwest of Jethro is the almost mined out “outlier” Feudal orebody. The orebody is interpreted to be located at the focal point of two Blanket-Lima strike transgressing shears, namely the Blanket-Feudal and Jethro-Feudal shears. The rocks consist of intermediate to meta-basalt with hornblende chlorite schist hosting the mineralised quartz- sulphide (disseminated arsenopyrite and pyrrhotite) shear zones.
The known orebody (surface outcrop to 7 Level for a 200 m lift) is now mined out. Geological models are being pursued to re-establish the reef down-dip. |
|
Blanket Section |
The Blanket Section comprises six orebodies, namely Blanket 1 to Blanket 6, which occur some 500 m south of the AR orebodies. On average, the orebodies dip 80°SW. Blanket 1 and Blanket 4 are parallel and occur in north-south trending shear segments. Blanket 2 and Blanket 5, which are also parallel, strike northwest southeast. Blanket 3 is cylindrical and lies in a shear segment parallel to Blanket 2 and Blanket 5. On surface, the BQR lies in the footwall of the DSR type orebodies. The reef has a shallower dip than the DSR bodies but plunges in the same direction so that it progressively advances towards them with depth, displacing Blanket 2, 3, 1, 4. Blanket 2 reappears on the footwall of the BQR and is established on the 630 m Level through to the 870 m Level. |
|
Jethro |
The Jethro orebody is located some 400 m south of the Blanket Section. The north-south striking Jethro orebody dips near vertical in a westerly direction and tends to roll over locally. |
In greenstone belts, gold mineralisation occurs mainly as vein type or shear zone hosted disseminations. Most of the larger deposits are found within the greenstone belts or their contacts with the granitoids. All mineralisation is hydrothermally emplaced and associated with the regionally developed D2 deformation characterised (at the Blanket Mine) by areas of high strain wrapping around relatively undeformed remnants of the original basaltic flows. It is within the more ductile tensional high strain areas that the wider of the orebodies are located.
These orogenic gold deposits are commonly associated with late syntectonic intermediate to felsic magmatism. Vein systems occur as a system of echelon veins on all scales. The Blanket orebodies comprise up to 10% of precious metals (AGS, 2006), so that the gold-rich model is applicable. The Blanket mineralisation is hydrothermally emplaced and associated with the regionally developed D2 deformation characterised by areas of high strain wrapping around relatively undeformed remnants of the original basaltic flows. Wider orebodies occur within the more ductile tensional high strain areas. The localisation of the mineralised shears conforms to a Riedel pattern (AGS, 2006).
Two main types of mineralisation are recognised at Blanket, namely DSR and quartz-filled reefs and shears. A third type of mineralisation may be evidenced in the form of auriferous sulphide minerals as a replacement of the iron-rich minerals along the hinges of the folds in BIF, as is present at the neighbouring Vubachikwe Mine.
Caledonia Mining Corporation Plc
S-K 1300 Technical Report Summary on the Blanket Gold Mine, Zimbabwe
Disseminated Sulphide Replacement Reefs
DSRs host the best grades and comprise the majority of the ore shoots. The zones have a silicified core with finely disseminated arsenopyrite. Relatively high grades are found in a package of silicified biotite chlorite schist with irregular quartz stringers and disseminated and stringer arsenopyrite in the fabric planes. Due to lesser silicification, abundant biotite characterises the margins of these mineralised zones and as a result they have a lower gold content. Disseminated sulphide-replacement orebodies range up to 50 m in width with a strike of 60 m to 90 m. Free-milling gold may constitute up to 50% of the total metal content with the remainder locked in the arsenopyrite. The ore is not refractory despite its association with arsenopyrite and plant recoveries in excess of 90% are achievable.
Quartz-Filled Reefs and Shears
Two quartz shears are mined at the Blanket Mine, namely the BQR and the Eroica Reef. These reefs have long strikes; however, they are not uniformly mineralised. Continuous pay shoots of over 100 m on strike are present. The Quartz Reef has a surface strike of approximately 500 m, but economic mineralisation is restricted to three 90 m long shoots.
Quartz-filled reefs display a much wider grade range compared to the DSR deposits. On average, these shears are of a higher grade and are used in blending the ore to the mill. Dominant ore minerals are native gold and galena although arsenopyrite becomes more prevalent below 470 m. Increasing levels of arsenopyrite association with depth confirm that the quartz shears represent higher level offshoots and splays with brittle deformation relative to the more ductile DSR-type core zone mineralised bodies.
Item 6 (d) – Geological Model
Mineralised envelopes are constructed on a 1.5 g/t cut-off grade for each of the individual orebodies. The wireframes are constructed explicitly by manually honouring drillhole intersections and in stope sampling data in Deswik and Datamine Studio RM software. The process of manually creating the wireframes is subjective and can differ based on the user.
The orebodies remained well constrained, with grade confined to specific narrow veins with local changes only to include new samples derived from underground development and drilling activities. Lithological descriptions are only present in the database for the more recent drilling data (post 2022); thus, all modelling done is performed on grade intersections. Modelling was performed from the known into the unknown, where mining activities assist to positively identify orebody intersections, trend and thickness that can be used as a guide for identifying and connecting that same orebody in grade intersections at depth.
All orebodies now have a 3D model and 3D resource estimate generated.
As part of the software upgrades undertaken at Blanket, all geological data observations from underground are now captured using the Deswik Mapping module. This uses the Deswik survey information as the base map upon which all recorded observations can be captured digitally. On a quarterly basis, the mineralised envelopes are formally reviewed to ascertain if they remain representative of the mineralised zones and updated as necessary. This applies to all sources of exploration drilling data where the captured intersections are subject to review for their validity and incorporated into the process of quarterly updates to the mineralised domains. An overview of the orebody domains and major structures is provided in Figure 6.
Caledonia Mining Corporation Plc
S-K 1300 Technical Report Summary on the Blanket Gold Mine, Zimbabwe
These updated 2023 wireframes are detailed in item 11 of this report. Furthermore, digital resource estimates are not restricted to a specific depth but rather generated within the orebody wireframes. The Mineral Resources are classified within these mineralised shells and may comprise Measured, Indicated and Inferred Mineral Resources together with a “target” classification which is used to generate future drilling target areas.
Figure 6: General Orebody Domain Wireframes and Major Structures
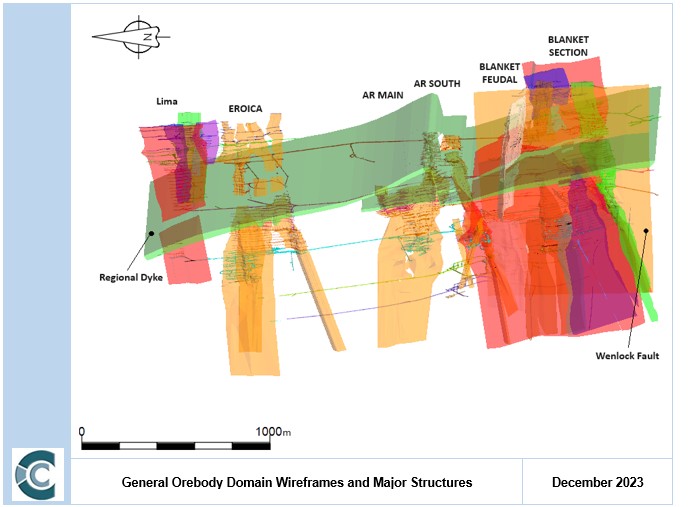
The Blanket Section orebodies consist of several domains extending from north to south, named Blanket 1 through to Blanket 6 (Figure 7). Footwall and hanging wall domains are further named for parts of these orebodies that are displaced in either the footwall or hanging wall of a structural feature. These domains are characterized by disseminated sulphide replacement (DSR) within the same shear zone.
Caledonia Mining Corporation Plc
S-K 1300 Technical Report Summary on the Blanket Gold Mine, Zimbabwe
Figure 7: Blanket Section Orebodies and the Wenlock Fault on 630m Level
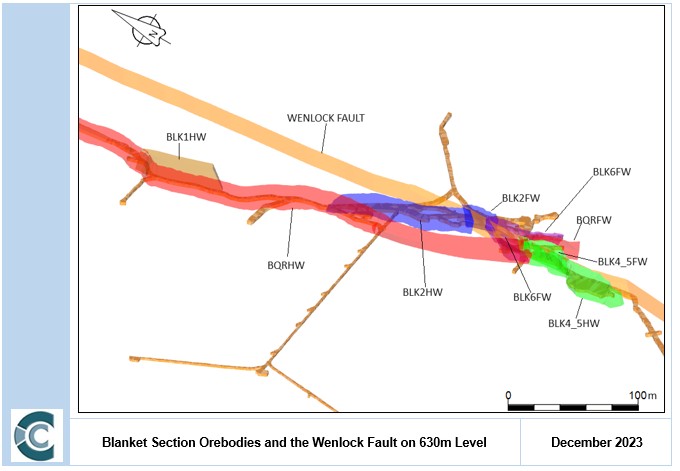
The Wenlock Fault (WF), the youngest fault in the area, exhibits both lateral and vertical displacement of orebodies within the Blanket group. In Figure 1 the lateral displacement between Blanket 2 hanging wall and Blanket 2 footwall on 630m Level is shown, and in this example this displacement measures 30m although this may vary due to differences in rock competency. The general trend of the Wenlock Fault is approximately 345°/84°. Notably, the Wenlock Fault displaces the BQR, which subsequently displaces DSR orebodies (Figure 8).
It was observed that there was a consistent trend in Blanket 2 hanging wall, Blanket 2 footwall and Blanket 3. All these orebodies can also be interpreted to splay off of the BQR orebody.
Caledonia Mining Corporation Plc
S-K 1300 Technical Report Summary on the Blanket Gold Mine, Zimbabwe
Figure 8: Sectional View of the Blanket Orebodies, Looking North
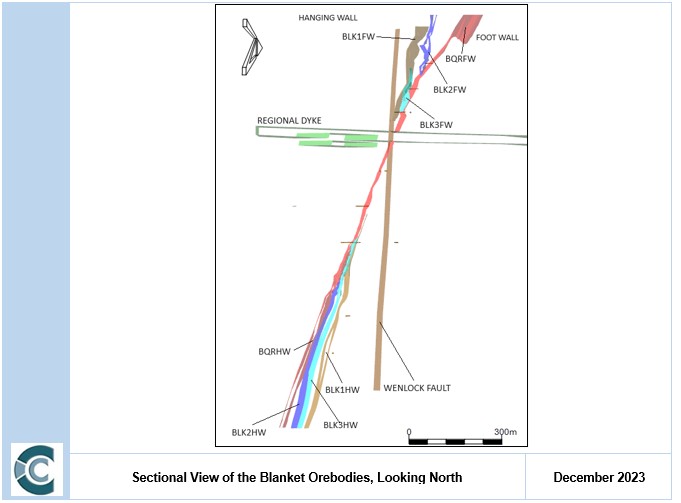
Blanket Feudal
The Blanket Feudal system is characterized as a narrow reef occasionally exhibiting swells, and it consists of a nearly vertical ore body that exhibits rolling characteristics (Figure 9). It shares contact with BQR along a significant strike. Unlike the dominant shear system, the Blanket Feudal system possesses a different strike; it serves as a connection between the primary shear system, which hosts numerous ore bodies, and the Jethro shear. Moving towards the northern direction, the Blanket Feudal system deviates from its predominantly near-vertical orientation and transitions to a shallow eastward dip, which is contrary to the westward dipping observed in most ore bodies.
Caledonia Mining Corporation Plc
S-K 1300 Technical Report Summary on the Blanket Gold Mine, Zimbabwe
Figure 9: Sectional View of Blanket Feudal Hanging Wall in Relation to BQR Hanging Wall, Looking North
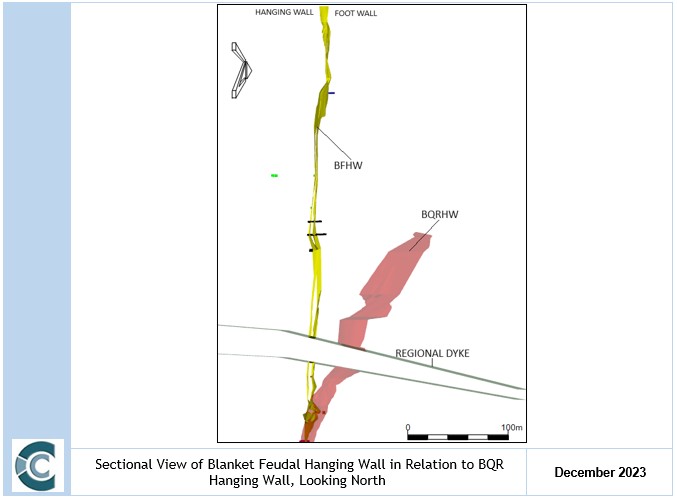
Blanket Quartz Reef
Blanket Quartz Reef is a quartz-filled fault, primarily composed of quartz material. It is situated on the footwall of the Blanket DSR orebodies. Notably, this fault exhibits a shallower dip of 57° compared to 72° of the DSR orebodies.
The consequence of this geological arrangement is that the younger BQR structure intersects and truncates the Blanket orebodies, depicted in Figure 10. Additionally, the DSR orebodies terminate where they meet the BQR structure.
The magnitude of displacement along this fault can vary, as described by Fuchter (1990), although it typically averages around 300 meters. The disparity in displacement across various orebodies can be attributed to variations in intersection angles resulting from differences in the observed strike and dip of the affected orebodies.
BQR has pay shoots that are high grade and punctuated by low-grade waste patches.
Blanket Feudal occurs to the west of the BQR while Blanket 1, 2 and 3 all occur to the east (Figure 10). BQR is a continuous unit running through the Blanket section. It has been interpreted that all other Blanket orebodies are closely associated with the BQR.
Caledonia Mining Corporation Plc
S-K 1300 Technical Report Summary on the Blanket Gold Mine, Zimbabwe
Figure 10: Plan View of the Blanket Feudal, Blanket Orebodies and BQR at 140m Level.
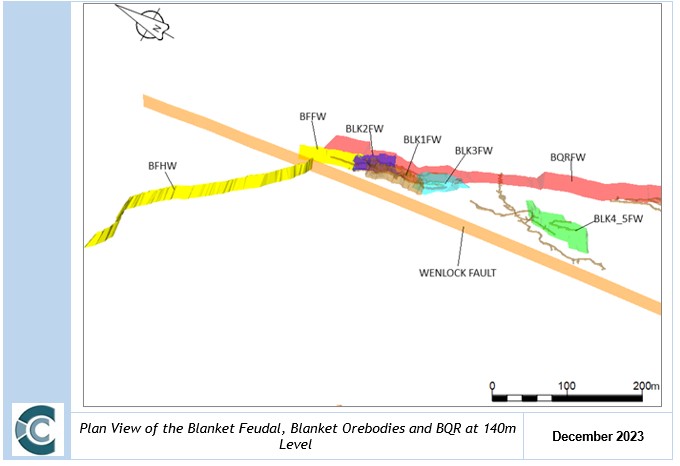
AR Main and AR South
AR Main and AR South occur to the north of the Blanket section. An additional extension to AR South has been modelled that shows a continuous trend with the existing orebody Figure 11. AR South and AR Main are separated by a dyke, the structural controls of this dyke as well as the possible extension of the BQR into the AR Main and AR South sections need to be tested. The samples used to generate AR South extension show a good correlation of the trend that is interpreted to exist over Blanket Mine.
Caledonia Mining Corporation Plc
S-K 1300 Technical Report Summary on the Blanket Gold Mine, Zimbabwe
Figure 11: Plan View of the Blanket, AR South and AR Main Orebodies on 810m Level.
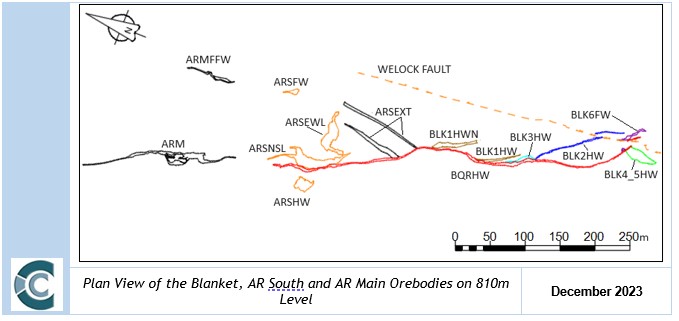
Lima and Eroica
Eroica consists of Eroica South and Eroica North, while Lima consists of the main orebody well as a smaller inter-reef orebody and a smaller foot wall body as depicted in Figure 12.
Figure 12: Plan View of the ERC and Lima Orebodies at the 140m Level.
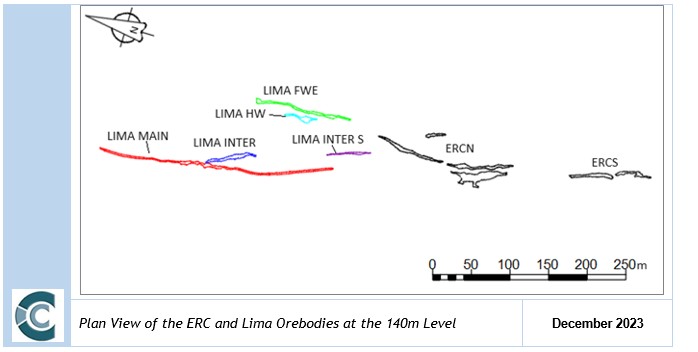
Caledonia Mining Corporation Plc
S-K 1300 Technical Report Summary on the Blanket Gold Mine, Zimbabwe
ITEM 7 – EXPLORATION
Item 7 (a) – Non-drilling Work
I. Survey Procedures and Parameters
No recent trench or soil sampling or geophysics is available or considered during geological modelling or Mineral Resource Estimation.
Channel Sampling and Sludges
Underground channel/chip sampling and sludge sampling procedures are outlined as follows:-
|
● |
The distance from a known survey peg to the first sample section is noted. Subsequent sample sections are marked at 2 m intervals on the roof of the drives along strike. |
|
● |
In the Jethro and Blanket Feudal orebodies, sample sections are taken at 1.5 m intervals along strike. |
|
● |
Sample sections are taken using a chisel and collection dish starting from the hanging wall to the footwall. Samples are generally taken in 0.6 m lengths but may vary depending on geology or the width to be sampled. |
|
● |
In wider mineralised zones where not all the mineralisation is exposed by the primary development, sidewall sludge holes are drilled to a depth of 1.2 m. Sludge holes are drilled into the hanging wall and footwall along the same section line as the channel samples. Drill discharge water is collected in cloth bags and the water seeps out leaving a sludge sample. Samples are taken every 0.6 m. The hole is flushed between each sample to reduce contamination. |
|
● |
A sample weight of about 2 kg is collected in each instance. |
|
● |
A ticket tagging system is used with sketches drawn at the face showing the ticket numbers corresponding to the samples taken. This assists the data capture in that on receipt from the laboratory, results are plotted on the assay plan against the corresponding ticket numbers. |
|
● |
Blanks and CRMs are inserted into the sample sequence. |
|
● |
On receipt of assays, QAQC is carried out. Information for channel and sludge samples is both processed digitally (incorporation of all channel and sludge data into database, plotting in Deswik, 3D modelling, evaluation) and plotted manually on the level plans. |
|
● |
1:250 scale survey plans are generated as ‘base plans’ for assay, stope assay and geology plans for each 15 m sub-level. |
Channel and sludge assay information is plotted manually on 1:250 scale assay plans for every 15 m sub-level. Within all of the mineralised zones, except the AR Main and AR South wider bodies, only 4.2 m is normally sampled (includes 1.8 m wide drive and 1.2 m of sludge sampling into both the hanging wall and the footwall) across the strike and any mineralisation beyond these limits is not included in the Mineral Resource. The unsampled payable sections outside of this width are mined but reported as coming from not-in-reserve (“NIR”) blocks.
While the accuracy of sludge sampling is debatable, it is considered to give a reliable indication of mineralisation. By the nature of the sampling methodologies the roof chip sampling and sampling of the evaluation drillholes would appear to have a higher confidence than the sludge sampling. However, an analysis of the different sample types has shown a minor decrease in grade (per orebody) with the inclusion of the sludge samples. This is expected as the sludge samples are taken at the periphery of the orebodies to tests the limits of the orebody of acceptable grade.
Caledonia Mining Corporation Plc
S-K 1300 Technical Report Summary on the Blanket Gold Mine, Zimbabwe
Exclusion of these sludge samples would result in local over estimation as these sludge samples often record the transition from high grade to low grade and have a further effect on the delineation of the mineralised zones. In the case of the underground chip sampling the high volume of samples reduces the impact of isolated sampling inaccuracies.
Sampling is undertaken underground; thus, a plan view of sampling points is not appropriate for Blanket Mine.
II. Sampling Methods and Sample Quality
Blanket is an operational mine. Only underground Mineral Resource and exploration drilling are currently undertaken.
III. Sample Data
Only ongoing underground drilling and chip sampling is currently undertaken at Blanket Mine.
IV. Results and Interpretation of Exploration Information
The results of the exploration drillholes as described in the section to follow - once checked and validated - were included into the existing database to inform the geological modelling process as well as Mineral Resource estimation.
Item 7 (b) – Drilling
I. Type and Extent of Drilling
Blanket is an operating mine. Underground long-hole exploration drilling and evaluation drilling are undertaken to respectively investigate orebody depth extensions and delineate width of the mineralised body. To this end, a plan view of drilling collars is not appropriate for Blanket Mine. However, Figure 13 illustrates the distribution of the database.
Long-hole Exploration Drilling
There was a hiatus in the amount of drilling defined as exploration drilling in the period 2020 – 2022 as a result of the activities relating to the sinking of Central Shaft. Drilling activities actively recommenced during 2022 and to date, a total of 387 holes have been drilled comprising 117,552 m (Table 7).
Caledonia Mining Corporation Plc
S-K 1300 Technical Report Summary on the Blanket Gold Mine, Zimbabwe
Table 7: Exploration Holes and Meters by Year
|
Year |
Number of Holes |
Metres Drilled |
|
2013 |
10 |
4,228 |
|
2014 |
25 |
8,685 |
|
2015 |
40 |
14,948 |
|
2016 |
58 |
19,768 |
|
2017 |
54 |
19,035 |
|
2018 |
68 |
18,269 |
|
2019 |
42 |
9,456 |
|
2020 |
17 |
3,396 |
|
2021 |
- |
- |
|
2022 |
18 |
5,320 |
|
2023 |
55 |
14,448 |
|
Total |
387 |
117,552 |
The recent drilling phases, which commenced in 2022, were focused on down-dip extensions to the Blanket Section, Eroica, and AR South orebodies. Drilling commenced in mid-June 2022 on 750mL Eroica North chamber 2. Drilling on in Eroica has since been completed at chamber 2 and 3, upgrading inferred into indicated resources down to 990mL and adding inferred down to 1110m Level.
Drilling is planned on 750mL at Eroica on chamber 4 targeting below 1110mL. The second rig will be on 870m Level in Blanket where drilling for Blanket 4-5 and Blanket 6 will cover below 990mL and upgrading inferred into indicated resources. The third rig will be on 1110mL targeting AR South and BQR below 1110m Level. This drilling programme is being done by on-mine Kempe 600 rigs, comprising of 3 rigs, operated by on-mine crews. Two rigs acquired in the early nineties are aged and scrapped. For the long-term drilling, a new rig is being motivated for to bolster the current fleet.
Directional drilling techniques are not employed but holes are planned to incorporate a deviation based on knowledge from previous drilling. While this does not result in a perfectly regular intersection spacing due to irregular and unexpected deviations of holes, the areas are drilled until they are adequately covered.
Drilling is carried out by Blanket personnel. All drilling is currently being carried out by BQ (36.5 mm diameter) core.
Results of the long hole exploration drilling, published on July 10, 2023, and January 30, 2024, intersected wider orebodies with better grade than initially expected. These expectations were derived from the 2022 resource modelling as targets for the drilling programs. The drillhole results are provided in Table 8 and the drillhole information in Table 9.
Table 8: Long Hole Deep Drilling Results at Blanket (2022 - 2023)
|
Holes Identifier |
Orebody Name |
Orebody Intersection |
Core Length (m) |
True width (m) |
Grade (g/t) |
Orebody Intersection depth from surface (m) |
E.O.H (m) |
|
|
From (m) |
To (m) |
|||||||
|
ERC750EX2307 |
ERCN_HW |
330.45 |
332.25 |
1.80 |
1.50 |
0.72 |
1082.25 |
356.25 |
|
ERC750EX2308 |
ERCN_HW |
302.60 |
306.80 |
4.20 |
3.50 |
5.97 |
1056.80 |
392.40 |
|
ERC750EX2308 |
ERCN_FW |
350.00 |
358.40 |
8.40 |
5.80 |
4.95 |
1108.40 |
392.40 |
|
ERC750EX2309 |
ERCN_HW |
304.80 |
307.80 |
3.00 |
1.66 |
3.62 |
1057.80 |
347.40 |
Caledonia Mining Corporation Plc
S-K 1300 Technical Report Summary on the Blanket Gold Mine, Zimbabwe
|
Holes Identifier |
Orebody Name |
Orebody Intersection |
Core Length (m) |
True width (m) |
Grade (g/t) |
Orebody Intersection depth from surface (m) |
E.O.H (m) |
|
|
From (m) |
To (m) |
|||||||
|
ERC750EX2310 |
ERCN_HW |
303.60 |
304.20 |
0.60 |
0.48 |
5.49 |
1054.20 |
324.50 |
|
ERC750EX2312 |
ERC _STH |
Traces |
287.20 |
|||||
|
ERC750EX2313 |
ERC _STH |
Traces |
279.60 |
|||||
|
BLK870EX2301 |
BLK4_5 |
38.20 |
50.20 |
12.00 |
3.58 |
5.10 |
920.20 |
287.40 |
|
BLK870EX2302 |
BLK4_5 |
34.10 |
40.10 |
6.00 |
3.92 |
7.46 |
910.10 |
272.30 |
|
BLK870EX2303 |
BLK4_5 |
28.60 |
39.40 |
10.80 |
4.27 |
8.80 |
909.40 |
272.20 |
|
BLK870EX2303 |
BLK2FW |
241.00 |
242.80 |
1.80 |
1.27 |
4.35 |
1112.80 |
275.50 |
|
BLK870EX2304 |
BLK4_5 |
26.20 |
40.60 |
14.40 |
7.74 |
4.14 |
910.60 |
275.50 |
|
BLK 930EX2301 |
BQR_HW |
148.60 |
152.80 |
4.20 |
5.12 |
2.85 |
1082.80 |
299.20 |
|
BLK 930EX2301 |
BLK3HW |
220.60 |
226.00 |
5.40 |
4.39 |
4.41 |
1156.00 |
299.20 |
|
BLK 930EX2302 |
BQR_HW |
130.60 |
133.00 |
2.40 |
1.86 |
2.42 |
1063.00 |
299.20 |
|
BLK 930EX2303 |
BQR_HW |
134.30 |
139.10 |
4.80 |
3.20 |
2.39 |
1069.10 |
233.30 |
|
BLK 930EX2304 |
BQR_HW |
205.70 |
219.50 |
13.80 |
8.32 |
3.63 |
1149.50 |
251.30 |
|
BLK 930EX2305 |
BQR_HW |
197.90 |
209.30 |
11.40 |
7.69 |
3.99 |
1139.30 |
259.30 |
|
BLK 930EX2305 |
BLK1HW |
230.30 |
255.30 |
25.00 |
16.69 |
3.16 |
1185.30 |
259.30 |
|
BLK 930EX2306 |
BQR_HW |
170.90 |
179.90 |
9.00 |
4.02 |
5.38 |
1109.90 |
275.30 |
|
BLK 930EX2306 |
BLK2HW |
181.10 |
203.30 |
22.20 |
8.18 |
3.75 |
1133.30 |
275.30 |
|
BLK 930EX2307 |
BQR_HW |
157.80 |
169.80 |
12.00 |
6.57 |
4.05 |
1099.80 |
259.30 |
|
BLK 930EX2308 |
BQR_HW |
176.03 |
200.63 |
24.60 |
13.33 |
5.92 |
1130.63 |
304.25 |
|
BLK 930EX2309 |
BQR_HW |
205.00 |
210.40 |
5.40 |
2.24 |
12.44 |
1140.40 |
287.30 |
|
BLK 930EX2310 |
BQR_HW |
165.10 |
170.50 |
5.40 |
3.01 |
10.02 |
1100.50 |
293.50 |
|
BLK 930EX2310 |
BLK2HW |
181.30 |
217.30 |
36.00 |
16.31 |
6.12 |
1147.30 |
293.50 |
|
BLK 930EX2311 |
BQR_HW |
247.90 |
261.10 |
13.20 |
6.97 |
4.28 |
1191.10 |
293.40 |
|
BLK 930EX2313 |
BQR_HW |
152.00 |
159.80 |
7.80 |
4.43 |
2.23 |
1089.80 |
312.95 |
|
BLK 930EX2313 |
BLK2HW |
202.40 |
238.40 |
36.00 |
20.56 |
2.90 |
1168.40 |
312.95 |
|
ARS1110EX2301 |
BQR |
3.00 |
9.00 |
6.00 |
4.16 |
4.23 |
1119.00 |
158.20 |
|
ARS1110EX2301 |
BLK1HW |
104.20 |
106.60 |
2.40 |
1.70 |
4.48 |
1216.60 |
158.30 |
|
ARS1110EX2302 |
BQR |
6.00 |
12.00 |
6.00 |
4.44 |
7.15 |
1122.00 |
158.30 |
|
ARS1110EX2302 |
BLK1HW |
43.80 |
61.20 |
17.40 |
12.37 |
8.76 |
1171.20 |
158.20 |
|
ARS1110EX2303 |
BQR |
6.00 |
9.00 |
3.00 |
2.09 |
8.29 |
1119.00 |
149.00 |
|
ARS1110EX2303 |
BLK1HW |
25.20 |
32.20 |
7.00 |
3.36 |
5.27 |
1142.20 |
149.00 |
|
ARS1110EX2304 |
BQR |
3.00 |
18.00 |
15.00 |
8.22 |
3.62 |
1128.00 |
161.00 |
|
ARS1110EX2304 |
BLK1HW |
65.00 |
78.80 |
13.80 |
7.15 |
6.45 |
1188.80 |
161.00 |
|
ERC750EX2201 |
ERCN_HW |
183.5 |
193.7 |
10.2 |
7.11 |
4.23 |
812.7 |
248.3 |
|
ERC750EX2202 |
ERCN_HW |
170.4 |
177 |
6.6 |
6.29 |
1.96 |
810.1 |
254.4 |
|
ERC750EX2202 |
ERCN_FW |
212.4 |
226.8 |
14.4 |
9.17 |
2.7 |
853.1 |
254.4 |
|
ERC750EX2203 |
ERCN_HW |
204.45 |
221.45 |
17 |
10.36 |
2.82 |
841.4 |
260.3 |
|
ERC750EX2204 |
ERCN_HW |
224.95 |
272.95 |
48 |
30.25 |
2.79 |
896.1 |
308.4 |
|
ERC750EX2205 |
ERCN_HW |
208.3 |
232.9 |
24.6 |
13.48 |
3.63 |
871.1 |
290.5 |
|
ERC750EX2205 |
ERCN_FW |
268.3 |
272.5 |
4.2 |
2.4 |
3.11 |
922.5 |
290.5 |
Caledonia Mining Corporation Plc
S-K 1300 Technical Report Summary on the Blanket Gold Mine, Zimbabwe
|
Holes Identifier |
Orebody Name |
Orebody Intersection |
Core Length (m) |
True width (m) |
Grade (g/t) |
Orebody Intersection depth from surface (m) |
E.O.H (m) |
|
|
From (m) |
To (m) |
|||||||
|
ERC750EX2206 |
ERCN_HW |
203.9 |
246.5 |
42.6 |
22.32 |
4.03 |
870.3 |
281.3 |
|
ERC750EX2206 |
ERCN_FW |
263.9 |
272.3 |
8.4 |
4.37 |
3.5 |
918.5 |
281.3 |
|
ERC750EX2207 |
ERCN_HW |
218.9 |
223.5 |
4.6 |
3.06 |
10.33 |
864.9 |
290.3 |
|
ERC750EX2208 |
ERCN_HW |
200.1 |
214.6 |
14.5 |
8.81 |
9.1 |
852.8 |
278.2 |
|
ERC750EX2209 |
ERCN_HW |
199.5 |
208.3 |
8.8 |
4.49 |
3.64 |
831.0 |
254.1 |
|
ERC750EX2210 |
ERCN_HW |
205.65 |
208.65 |
3 |
1.92 |
3.24 |
837.0 |
269.1 |
|
ERC750EX2211 |
ERCN_HW |
232.1 |
233.9 |
1.8 |
1.26 |
2.17 |
849.4 |
287.1 |
|
ERC750EX2212 |
ERCN_HW |
229.57 |
231.37 |
1.8 |
0.97 |
1.84 |
830.5 |
271.8 |
|
ERC750EX2213 |
ERCN_HW |
221.2 |
221.8 |
0.6 |
0.30 |
4.47 |
825.7 |
271.8 |
|
ERC750EX2214 |
ERCN_HW |
269.13 |
275.73 |
6.6 |
5.78 |
8.18 |
909.1 |
401.3 |
|
ERC750EX2214 |
ERCN_FW |
294.33 |
308.13 |
13.8 |
8 |
7.7 |
933.1 |
401.3 |
|
ERC750EX2215 |
ERCN_HW |
299.57 |
303.77 |
4.2 |
3.6 |
2.57 |
932.3 |
382.1 |
|
ERC750EX2216 |
ERCN_HW |
292.6 |
310.9 |
18.3 |
12.9 |
3.76 |
924.5 |
377.0 |
|
ERC750EX2216 |
ERCN_FW |
318.4 |
329.6 |
11.2 |
9.2 |
3.88 |
964.1 |
377.0 |
|
ERC750EX2301 |
ERCN_HW |
263.8 |
281.2 |
17.4 |
13.44 |
6.62 |
914.9 |
352.2 |
|
ERC750EX2302 |
ERCN_HW |
236.1 |
247.2 |
11.1 |
7.51 |
6.33 |
888.7 |
359.1 |
|
ERC750EX2303 |
ERCN_HW |
262.7 |
278.3 |
15.6 |
8.6 |
15.56 |
891.4 |
356.3 |
|
ERC750EX2305 |
ERCN_HW |
293.8 |
296.2 |
1.8 |
4.01 |
0.37 |
923.9 |
365.6 |
|
ERC750EX2306 |
ERCN_HW |
237.6 |
242.4 |
4.8 |
3.06 |
2.51 |
869.7 |
350.3 |
ERCN_HW - Eroica North Hanging wall, ERCN_FW - Eroica North Footwall, ERC_STH - Eroica South, BQR - Blanket Quartz Reef, BLK1HW - Blanket 1 Hanging wall, BLK2HW - Blanket 2 Hanging wall, BLK2FW - Blanket 2 Footwall, BLK3HW - Blanket 3 Hanging wall, BLK4_5 - Blanket 4 and 5, ARS EXT - AR South Extension
Table 9: Long Hole Deep Drilling Location and Information at Blanket (2022-2023)
|
Hole Identifier |
Azimuth (°) |
Dip (°) |
Drilled Length (m) |
UTM Easting (m) |
UTM Northing (m) |
UTM Elevation (m) |
|
ERC750EX2307 |
31 |
- 75 |
356.3 |
697 206.3 |
7 694 516.0 |
388.1 |
|
ERC750EX2308 |
89 |
- 67 |
392.4 |
697 206.0 |
7 694 516.2 |
388.2 |
|
ERC750EX2309 |
124 |
- 81 |
374.4 |
697 205.5 |
7 694 512.7 |
388.0 |
|
ERC750EX2310 |
118 |
- 65 |
324.5 |
697 206.6 |
7 694 512.0 |
388.0 |
|
ERC750EX2312 |
150 |
- 56 |
287.2 |
697 312.7 |
7 694 284.6 |
387.0 |
|
ERC750EX2313 |
141 |
- 58 |
204.6 |
697 313.2 |
7 694 285.1 |
387.1 |
|
BLK870EX2301 |
65 |
- 71 |
287.4 |
698 043.0 |
7 692 507.8 |
263.6 |
|
BLK870EX2302 |
45 |
- 69 |
272.3 |
698 043.0 |
7 692 508.0 |
263.7 |
|
BLK870EX2303 |
28 |
- 63 |
272.2 |
698 043.0 |
7 692 508.0 |
263.7 |
|
BLK870EX2304 |
12 |
- 63 |
275.2 |
698 042.2 |
7 692 508.7 |
263.6 |
|
BLK930EX2301 |
37 |
- 61 |
299.2 |
697 784.1 |
7 692 827.9 |
206.4 |
|
BLK930EX2302 |
81 |
- 61 |
275.2 |
697 784.0 |
7 692 830.2 |
206.4 |
|
BLK930EX2303 |
76 |
- 72 |
233.3 |
697 784.4 |
7 692 826.4 |
206.5 |
|
BLK930EX2304 |
28 |
- 77 |
251.3 |
697 783.2 |
7 692 829.4 |
206.5 |
|
BLK930EX2305 |
23 |
- 69 |
259.3 |
697 782.9 |
7 692 829.9 |
206.4 |
Caledonia Mining Corporation Plc
S-K 1300 Technical Report Summary on the Blanket Gold Mine, Zimbabwe
|
Hole Identifier |
Azimuth (°) |
Dip (°) |
Drilled Length (m) |
UTM Easting (m) |
UTM Northing (m) |
UTM Elevation (m) |
|
BLK930EX2306 |
127 |
- 74 |
275.3 |
697 784.5 |
7 692 825.4 |
206.5 |
|
BLK930EX2307 |
35 |
- 79 |
272.4 |
697 783.5 |
7 692 828.4 |
206.5 |
|
BLK930EX2308 |
122 |
- 67 |
304.3 |
697 784.8 |
7 692 825.9 |
206.3 |
|
BLK930EX2309 |
133 |
- 76 |
287.3 |
697 784.5 |
7 692 825.7 |
206.5 |
|
BLK930EX2310 |
85 |
- 86 |
293.5 |
697 784.2 |
7 692 825.8 |
206.4 |
|
BLK930EX2311 |
21 |
- 81 |
293.4 |
697 783.4 |
7 692 828.7 |
206.9 |
|
BLK930EX2313 |
25 |
- 76 |
313.0 |
697 783.2 |
7 692 829.4 |
206.5 |
|
ARS1110EX2301 |
93 |
- 64 |
158.2 |
697 765.7 |
7 693 020.3 |
25.4 |
|
ARS1110EX2302 |
54 |
- 65 |
158.3 |
697 761.5 |
7 693 022.4 |
25.2 |
|
ARS1110EX2303 |
10 |
- 46 |
149.0 |
697 765.5 |
7 693 022.3 |
25.0 |
|
ARS1110EX2304 |
125 |
- 44 |
161.0 |
697 765.7 |
7 693 019.1 |
25.8 |
|
ERC750EX2201 |
28.68 |
-65.74 |
248.3 |
697293.97 |
7694520.35 |
387.24 |
|
ERC750EX2202 |
122.15 |
-71.33 |
254.4 |
697294.02 |
7694518.55 |
387.28 |
|
ERC750EX2203 |
134.01 |
-66.13 |
260.25 |
697293.43 |
7694515.39 |
387.22 |
|
ERC750EX2205 |
64.65 |
-82.27 |
290.5 |
697294.22 |
7694518.74 |
387.20 |
|
ERC750EX2206 |
80.24 |
-82.13 |
281.3 |
697294.15 |
7694518.38 |
387.23 |
|
ERC750EX2207 |
25.10 |
-79.18 |
290.3 |
697293.05 |
7694519.71 |
387.15 |
|
ERC750EX2204 |
126.73 |
-81.37 |
308.35 |
697293.68 |
7694518.23 |
387.21 |
|
ERC750EX2208 |
21.35 |
-73.80 |
278.2 |
697292.55 |
7694520.03 |
387.25 |
|
ERC750EX2209 |
16.83 |
-63.62 |
254.1 |
697292.54 |
7694520.35 |
386.94 |
|
ERC750EX2210 |
13.81 |
-64.94 |
269.1 |
697292.47 |
7694520.36 |
386.96 |
|
ERC750EX2211 |
144.29 |
-60.21 |
287.05 |
697292.52 |
7694517.26 |
387.03 |
|
ERC750EX2212 |
151.74 |
-52.44 |
271.8 |
697292.14 |
7694516.75 |
386.99 |
|
ERC750EX2213 |
12.70 |
-53.74 |
304.9 |
697291.26 |
7694521.81 |
387.18 |
|
ERC750EX2214 |
101.48 |
-70.97 |
401.3 |
697206.10 |
7694514.52 |
388.00 |
|
ERC750EX2215 |
119.61 |
-68.33 |
398.1 |
697206.49 |
7694513.08 |
388.04 |
|
ERC750EX2216 |
97.17 |
-76.86 |
377.2 |
697206.09 |
7694514.30 |
387.98 |
|
ERC750EX2301 |
58.43 |
-73.25 |
352.2 |
697205.90 |
7694514.12 |
388.05 |
|
ERC750EX2302 |
63.22 |
-63.51 |
359.1 |
697206.09 |
7694514.99 |
388.10 |
|
ERC750EX2303 |
64.05 |
-64.99 |
356.3 |
697206.37 |
7694517.17 |
388.10 |
|
ERC750EX2304 |
40.08 |
-68.88 |
359.3 |
697205.73 |
7694517.32 |
388.14 |
|
ERC750EX2305 |
39.47 |
-70.26 |
365.5 |
697205.07 |
7694518.30 |
388.22 |
|
ERC750EX2306 |
44.84 |
-56.80 |
350.3 |
697206.27 |
7694517.19 |
388.00 |
Access to Blanket Mine premises is controlled by security personnel on the first gate. On the second gate, in addition to security, entry is gained by biometric entry system. Diamond drilling is performed by qualified diamond drillers under the supervision of a diamond drill foreperson. Drilled core is routinely brought to surface to the core shed where it is received and laid down. A qualified geological technician performs geotechnical logging while a qualified geologist logs the core and marks the portions for splitting. The core is split in half along the core axis using an electric core cutter equipped with a diamond saw cutter. The geologist marks the sample intervals, put tickets, insert standards and blanks. One half of the sample is put into a plastic sample bag and sealed with cable ties. The sampling information is entered into the database. The other half of the core is marked with sample intervals and sample numbers and returned to the core box and retained for future reference. The samples are put in marked grain bags and tied with cable ties.
Caledonia Mining Corporation Plc
S-K 1300 Technical Report Summary on the Blanket Gold Mine, Zimbabwe
Transportation is by road using mine vehicle to a SADCAS accredited testing laboratory (accreditation number TEST-05 0030) in Kwekwe, some 330km from Blanket Mine. A delivery note is signed as proof of dispatch.
Gold is analysed by a 50 grams fire assay with an Atomic Absorption (AA) finish. The laboratory also has internal quality control ("QC") programs that include insertion of reagent blanks, reference materials, and pulp duplicates.
Blanket Mine inserts QC samples (blanks and reference materials) at regular intervals to monitor laboratory performance. When results are received, the assay results are painted against the sample numbers on the core retained.
The management of the drilling process rests with the responsible geologist. A summary of drilling procedures for exploration drilling is outlined as follows:-
|
● |
Planned hole collar set up information is provided by geologist. |
|
● |
Hole azimuth is set up by surveyor. Hole dip is set up using built in rig clinometer. Set up is checked by Blanket Mine geologist or geotechnician. Hole collar is surveyed when rig is established in position and drilling. |
|
● |
Drilling and core are monitored by geologist and geotechnician with checking to ensure core obtained attains a recovery of at least 95%. Hole is stopped based on geological observations. |
|
● |
Downhole survey is carried out using Icefield Multi-shot MI3 instrument. Survey readings are downloaded and checked for validity using quality assurance and quality control (“QAQC”) procedure. If not acceptable, request for resurvey. |
|
● |
Hole is capped with hole number clearly marked on cap. |
Core handling procedures are as follows:-
|
● |
The drillhole identification number and box number are clearly marked onto the upper left side and face of each core tray. |
|
● |
All core is packed into core trays as it is recovered from the hole with blocks indicating the depth placed at the end of each ‘run’ for each 3 m drill rod. Core trays are kept secure and guarded against possible mixing. All core boxes are transported to the core yard at the end of the drilling shift where their receipt is entered into a logbook. |
|
● |
Core boxes are laid out in the correct sequence. |
|
● |
Drill core is checked as orientated and assembled to ensure that all pieces fit, and that orientation lines are consistent. |
|
● |
Core recoveries are measured between drill depth markings by the geologist or geotechnician to record the core recovery. The complete length of the hole is metre marked. |
|
● |
RQD measurements are recorded by the geotechnician. |
|
● |
Core is photographed dry and wet. |
|
● |
Logging of core is carried out by the geologist. |
|
● |
Mineralised zones are identified and selected for sampling. Sample boundaries are marked at 0.6 m intervals in nearly homogeneous mineralised zones. Selective sampling intervals are employed on mineralised units with unique features, e.g. colour, concentration of mineralisation, alteration, and mineralogy. |
|
● |
The core is split into two equal halves with a diamond saw. One half is retained in the core tray. |
|
● |
Specific Gravity (“SG”) measurements are carried out for each sample prior to bagging and submission to mine laboratory for sample preparation and assay (Blanks and Certified Reference Material (“CRMs”) are inserted into the sample sequence at this point). |
Caledonia Mining Corporation Plc
S-K 1300 Technical Report Summary on the Blanket Gold Mine, Zimbabwe
|
● |
Split intersections retained in the core tray are photographed wet. |
|
● |
On receipt of assays, QAQC is carried out. Drilling data is incorporated into the database. Plotting in Deswik, 3D modelling, and evaluation are carried out. |
Evaluation Drilling
In addition to exploration drilling, evaluation drilling is performed within stope. Underground mining infrastructure in the form of development drives at 15 m vertical intervals within the orebody is required in order to achieve the required spacing of 7.5 m along strike by 15 m down-dip for the Measured Mineral Resource category. Evaluation drilling is normally only applicable to wider DSR orebodies, while Quartz Reef orebodies are either fully exposed by the actual development drives or can be fully evaluated with sludge holes where required to check for mineralisation in the immediate hanging wall or footwall.
A summary of evaluation drilling parameters and procedures is as follows:-
Sub-level drives are mined within the orebodies along strike at 15 m vertical intervals. Drill cubbiesare developed every 7.5 m for evaluation drilling.
|
● |
Planned hole collar set up information is provided by the geologist. Holes are drilled into the hanging wall and footwall of the development drive to establish the extent of the mineralisation. Holes are normally horizontal and drilled perpendicular to strike. Holes are drilled using an air driven “meter eater” machine with AXT (30.5 mm diameter) core. |
|
● |
Drilling and core are monitored by the geologist and geotechnician with checking to ensure core obtained attains a recovery of at least 95%. Hole is stopped based on geological observations. |
|
● |
Hole collar coordinates, azimuth and dip is surveyed (usually when hole is completed, and the rig is off the hole using a drill rod inserted into the hole). Hole number is recorded by painting on sidewall. |
|
● |
Handling and processing of core follows a similar procedure as for exploration core as detailed above. However, for evaluation holes whole core is sampled. |
|
● |
Core is packed into 1 m long closable core trays as it is recovered from the hole with blocks indicating the depth placed at the end of each ‘run’ for each 3 m drill rod. Core trays are kept secure and guarded against possible mixing. |
|
● |
All core boxes are transported to the core yard at the end of the drilling shift where their receipt is entered into a log book. |
|
● |
Core is carefully repacked into 1.5 m long core trays. Drill core is checked as orientated and assembled to ensure that all pieces fit, and that orientation lines are consistent. The drillhole identification number and box number are clearly marked onto the upper left side and face of each core tray. |
|
● |
Core boxes are laid out in the correct sequence. |
|
● |
Core recoveries are measured between drill depth markings by the geologist or geotechnician to record the core recovery. The complete length of the hole is metre marked. |
|
● |
RQD measurements are recorded by the geotechnician. |
|
● |
Core is photographed dry and wet. |
|
● |
Logging of core is carried out by the geologist. |
|
● |
Mineralised zones are identified and selected for sampling. Sample boundaries are marked at 0.6 m intervals in nearly homogeneous mineralised zones. Selective sampling intervals are employed on mineralised units with unique features, e.g., colour, concentration of mineralisation, alteration, and mineralogy. |
|
● |
Whole core is sampled. SG measurements are carried out for each sample prior to bagging and submission to mine laboratory for sample preparation and assay (blanks and CRMs are inserted into the sample sequence at this point). |
Caledonia Mining Corporation Plc
S-K 1300 Technical Report Summary on the Blanket Gold Mine, Zimbabwe
|
● |
On receipt of assays, QAQC is carried out. Information for evaluation holes is both processed digitally (incorporation of all drilling data into database, plotting in Deswik, 3D modelling, evaluation) and plotted manually on the level plans. |
|
● |
1:250 scale survey plans are generated as ‘base plans’ for assay, stope assay and geology plans for each 15 m sub-level. |
|
● |
Drill assay information is plotted manually on 1:250 scale assay plans for every 15 m sub-level. Assay plans also record the chip and sludge sampling on the surveyed development and are the basis for orebody delineation in conjunction with the geology plans (stope assay plans are generated to show stoping progress and stope assays). |
|
● |
Geological information for evaluation holes is plotted manually on 1:250 scale geology plans for every 15 m level. Geological plans provide the context of the mineralisation and validation of orebody shapes and structural discontinuities. |
II. Factors Influencing the Accuracy of Results
QAQC data prior to 2014 is not available, and thus data from before this period is subject to some degree of uncertainty. However, more recent samples do cover the areas being considered adequately, thus higher confidence samples are also informing the areas informed by lower confidence samples, this assists in reducing the uncertainty in the database.
III. Exploration Properties – Drill Hole Details
This section is not applicable to the Blanket Mine as it is an operating gold mine with sufficient drillhole data and underground sampling to declare a Measured and Indicated Mineral Resource and Mineral Reserve.
Item 7 (c) – Hydrogeology
According to the Blanket Mine geological personnel no hydrogeological studies have been completed at the Blanket Mine. A hydrological area was intersected at 850 level which halted the development area where 46l/hr was measured and was drained successfully which enabled development to continue.
Item 7 (d) – Geotechnical
Prior to 2020, no previous geotechnical work was completed at the Blanket Mine. An investigation into rock strengths was completed, where core of the different rock types was sent to Rock Lab SA for UCS Brazilian disc test, in order to determine the geomechanical properties of various lithologies and the parameters to be applied in the geotechnical model and mine design going forward.
Subsequently, Point Load index (PLi) assessments were introduced on mine, where core from exploration or run-of-mine drilling can be tested to determine the UCS of the rock and an index that will be used to classify geotechnical areas based on the rock PLi.
Rock Quality Designation (RQD) is being determined to assess the quality of the rock and is used as a criterium in the rock mass classification for mine design and blast designs. No specific joint analyses were done on current core, and this is an area of improvement that could form part of the analysis going forward where joint orientation, joint spacing, joint roughness and infilling would be used for Rock mass classification.
Rock mass conditions are simulated with Flack 3D numerical modelling program on a quarterly basis and were deemed necessary. Rock strength testing that was conducted by Groundwork consulting and laboratory testing done by Rock lab in South Africa to gain a better understanding of the rock mass failure mechanisms. The poisons ratio, Youngs modulus, friction angles and intact rock strengths were tested and is now followed up with intact rock strength and core samples being tested with point load tested on mine to corelate and indicate anomalies for the use in new layouts and designs. New geotechnical information is gained via borehole logging and mapping by the geological department and placed on plans and into the electronic model as a layer within Deswik which provides the base for all plans.
Caledonia Mining Corporation Plc
S-K 1300 Technical Report Summary on the Blanket Gold Mine, Zimbabwe
Rock engineering work has been conducted for the newly targeted mining areas below 1100m Level. The studies and work associated with these parameters will be addressed by the rock engineering department as data is generated and access is obtained through development. This will further inform the geotechnical model which will be constructed as information becomes available and be placed into the electronic model.
Two secondary support crews have been trained by specialist in the installation of wire-mesh, lacing, guniting and mechanical anchors. They are deployed to planned areas where high stresses are expected from the numerical modelling or in life of mine excavations to safeguard the areas for the future accesses.
ITEM 8 – SAMPLE PREPARATION, ANALYSES AND SECURITY
Item 8 (a) Sample Handling Prior to Dispatch
All sample submissions to the laboratory are accompanied with clear instructions on a Sample Submission Sheet regarding sample preparation and assay methodology. The sample submission sheet contains spaces and selections to accommodate all necessary instructions for the laboratory. Each of the items on the Sample Submission Sheet is discussed below.
Quality assurance and quality control (QAQC) procedures are regularly reviewed to ensure that best practices are followed. The sample preparation and analysis procedures outlined below describe the current information handling as sampling and QAQC data are currently captured into a Microsoft Excel workbook. Samples are not released by the Geology department to the assay laboratory that do not satisfy all the required procedures. Each section geologist is responsible for ensuring that this is done for drilling, channel or sludge samples originating from their underground section. Samples are not accepted for assay by the laboratory if they do not satisfy requirements. In the event of such an occurrence, it is reported to the Geology Manager or the Mineral Resource Manager.
Item 8 (b) – Sample Preparation and Analysis Procedures
All samples are analysed by the Blanket Mine on-site Assay laboratory which is not accredited. The process is broadly as follows:-
|
● |
The sample is crushed to -10 mm and riffle split to produce a portion of approximately 400 g. |
|
● |
The 400 g portion is pulverised in a Rocklabs ring mill. Blank samples are run in the pulveriser after every 10 samples for channel chip and sludge samples as per normal laboratory procedure. For evaluation holes after every five samples and for exploration holes after every sample. |
|
● |
Pulp is measured into a crucible. For drill core samples, a new crucible is used for every sample. For other samples, it is acceptable for crucibles to be used multiple times but discarded when cracked or showing signs of absorbed impurities. |
|
● |
A 50 g aliquot is used for all drill core samples. A 25 g aliquot is used for channel chip samples and sludge hole samples. |
|
● |
All samples currently undergo Fire Assay analysis with gravimetric finish. |
Item 8 (c) – Quality Assurance and Quality Control
Blanks
Blanks are inserted according to the sample type. For exploration drilling samples, two blanks are inserted for every 36 samples (the number of samples processed in a “batch” at one time in the laboratory). Exploration holes include deep drillholes. Evaluation Holes are holes which are used to define the limits of the orebody, generally at 7.5m spacing along strike. The mass of a blank sample needs to be only slightly higher than the weight of the aliquot (50g for drill core samples and 25g for all other samples).
Caledonia Mining Corporation Plc
S-K 1300 Technical Report Summary on the Blanket Gold Mine, Zimbabwe
Blanks are prepared in advance in sealable card packets to avoid any contamination. Blanks are inserted into the batch in random positions in the sequence within a mineralised zone. For samples submitted directly to the laboratory by the samplers (sludge and chip samples for both grade control and evaluation), blanks are currently inserted by the laboratory. The blanks utilised are sourced from certified AMIS blank standards. The results for the blanks and standards are monitored on a batch-by-batch basis with the blanks treated separately from the standards.
Standards
Standards are inserted according to the sample type. For exploration drilling samples, three standards are inserted for every 36 samples (the number of samples processed at one time in the laboratory and one batch). The mass of the standard needs to be only slightly higher than the weight of the aliquot (50g for drilling samples and 25g for all other samples). Standards are prepared in advance in sealable card packets to avoid contamination.
The main purpose of Standards is to check the accuracy of the assay procedure. There are generally three groups of standards - very low grade (±0.41g/t), low grade (±1.74g/t) and high grade (± 3.50g/t). All three types of standards are used and are inserted into the batch in logical positions in the sequence within a mineralised zone. The standard is included in the number sequence, is not labelled as a standard and is not recorded as a standard on the sample submission sheet. For sludge and chip samples which are submitted directly to the laboratory by the samplers (samples for both grade control and evaluation), standards are currently inserted by the laboratory. Standards for drillholes are inserted by the samplers. The results for the standards are monitored on a batch-by-batch basis and on a standard-by-standard basis.
Duplicates
Duplicates are split by the laboratory from pulps as per instructions on the sample submission sheet completed by the geologist. Duplicates are requested for exploration drilling samples only. On the sample submission sheet, the sequential number for the duplicate will be excluded from samples submitted on initial submission. In the Sample Source column, the number of the sample from which the duplicate is sourced, is recorded. The splitting of a sample is carried out by the laboratory and the split fraction allocated the new sample number for the duplicate.
I. Assessment of Results
A QAQC report for each batch is completed and saved (with the name of the batch) on the server. This report includes graphs showing the results for blanks, standards and duplicates and a short statement concluding whether the results are satisfactory or whether a re-assay is required. QAQC sample data is monitored monthly to ensure that sample batches with control sample data outside of acceptable limits are re-submitted for analysis in a timely manner.
Blanks
All blanks with values greater than the detection limit are flagged. A decision is then made by the Geology Manager as to whether to re-assay or not. Results for blanks for all batches are compiled into one table on an ongoing basis, so that the general blank results can be monitored. This is done on a quarterly basis and finalised at the end of every quarter. This is done in MS Excel and includes a table indicating Batch No., Sample No. and Grade (Au g/t), together with a graph depicting the results for all the blanks. If more than one type of blank is used, then this is done separately for each blank. The report is given the name of the blank in question followed by the year and the quarter number (e.g., AMIS0577_2023Q4) and saved on the Mine’s computer server.
Caledonia Mining Corporation Plc
S-K 1300 Technical Report Summary on the Blanket Gold Mine, Zimbabwe
For 2023, 20 blanks failed out of 166 total blank samples for this standard. Only blank standards from Amis have been utilised for 2023.
Standards
Standards with values greater than two standard deviations are flagged. A decision can then be made by the Geology Manager as to whether to re-assay or not. For all batches, the results for each standard are compiled into one table on an ongoing basis, so that the trend and accuracy of each standard can be monitored over time. This is done on a quarterly basis and finalised at the end of every quarter. This is done in MS Excel and includes a table together with a graph depicting all the results for that standard. A separate report is done for each standard. The report is given the name of the standard in question followed by the year and the quarter number (e.g., AMIS0797_2023Q4) and saved on the Mine’s computer server. During the period 2023, eleven different standards were utilised (Table 11), the standards used are representative of the grade seen at Blanket and are thus suitable for QAQC purposes.
The standards are sourced from Greenstone belts in South Africa. Care must be taken when selecting samples to ensure the standards relevant to the expected grade is used, particularly as the grade will differ slightly from orebody to orebody.
The standards used on the mine with their expected average values and the number used during 2023 are provided inTable 10.
Table 10: Standards Utilised at Blanket Mine with Expected Value and the Number Used
|
Standards |
Expected value(g/t) |
Count |
|
AMIS0748 |
1.38 |
34 |
|
AMIS0519 |
1.61 |
14 |
|
AMIS0718 |
1.33 |
23 |
|
AMIS0798 |
11.16 |
9 |
|
AMIS0791 |
2.11 |
21 |
|
AMIS0790 |
1.52 |
46 |
|
AMIS0724 |
2.38 |
72 |
|
AMIS0772 |
0.37 |
35 |
|
AMIS0792 |
3.55 |
129 |
|
AMIS0796 |
3.73 |
22 |
|
AMIS0797 |
4.87 |
10 |
The most used standard for the period under review was AMIS0792. This is a high-grade standard with an expected grade of 3.55g/t. A total of 129 standards were used, of which 112 fell within accepted two standard deviation range to make a pass rate of 86.8%.
For AMIS0748, 4 out of 34 samples analysed failed the two-standard deviation (2SD). This represents a 88.2% pass rate. The expected grade for AMIS0748 is 1.38g/t. All the samples that failed were above the limits of 2SD.
For AMIS0772, a total of 35 standards were analysed with an expected value of 0.37g/t during 2023. This is a low-grade standard for which the results were good with 2 out of the 35 samples failing, making a 94.3% pass rate.
Caledonia Mining Corporation Plc
S-K 1300 Technical Report Summary on the Blanket Gold Mine, Zimbabwe
It is recommended that follow up activities are undertaken to identify the source of these failures in the standards, particularly the higher-grade standards, and to determine if this results from laboratory procedures or sampling activities. In addition, duplicates of the various stages of the sampling and analyses process can be taken. Field duplicates (in the core yard), course duplicates (following crushing) as well as pulp duplicates (following pulverisation), this will eliminate any sources of contamination or identify the potential problem areas.
A bias has been noted by previous QP’s in the 2018 data with numerous failures in standards, while the 2019, 2022 and 2023 results are an improvement with acceptable pass rates of standards. However, 2018 results are still included in the database. Where dense sampling exists (Reserve areas), the effect of this is minimised. However, where a larger area is informed by only one or two drillholes (Inferred or Target areas), any uncertainty would have a larger influence. For this reason, QAQC procedures should be stricter for exploration holes and any failures in QAQC followed up with re-assays as well as umpire assays. The mine procedures with regards to inclusion or exclusion of samples due to QAQC results must be implemented to ensure these failures are considered during the course of QAQC.
Due to the high sample density the effects of these inconsistencies in results will be minimised, however this accuracy and repeatability of results and standards is most important for exploration areas where one drillhole informs a large area. A focussed study of the QAQC of these exploration holes is recommended.
Duplicates
Duplicate results are plotted against each other, and poor correlations are flagged by the QAQC geologist. Appropriate action is then taken when failures are identified. Results for all duplicates for all batches are compiled into one table on an ongoing basis, so that the overall repeatability of duplicates can be monitored. This is done on a quarterly basis and finalised at the end of every quarter. This is done in MS Excel and includes a table indicating Batch No., Sample No. and Grade (Au g/t), Duplicate No. and Duplicate Au g/t, together with a XY correlation graph showing all of the results for all the duplicates. The report is given the name "Duplicates" followed by the year and the quarter number and saved on the Mine’s computer server. An example of duplicates for the year 2023 is shown in Figure 34. A good reproducibility of results is seen between the lower grade samples (<4 g/t), with some outliers and a bias towards a higher grade in the original samples above 4 g/t.
Figure 34: Duplicate Results for 2023
Umpire Analyses
Umpire analysis and round robins are being run by the assay lab. For umpire analysis, comparison is being made with Zim Labs. The sample materials comprised plant samples which included plant feed (M1s), C.I.L feed (M3s), and C.I.L tails (RM10), together with geology samples and CRM’s to check Zim Labs accuracy. The method used for assay by Blanket mine lab was Fire assay method with gravimetric finish and Zimlabs used Fire assay method with AAS finish. According to the correlation graph it shows that most of the assays correlated, with a correlation value of 0.94.
Round robins are run among Turk Mine, How Mine, DGL 5 Mine and Blanket Mine. It was noted that the high-grade samples fall outside the confidence limit while the low-grade samples are within range.
Storage of Pulps
According to mine procedure, pulps are retained for all drill core samples (both evaluation holes and exploration holes). They are collected by Geology and stored at the facility at the Exploration department offices. Pulps are stored in strong, sealed boxes clearly labelled with the drillhole name, batch number and sample numbers.
Caledonia Mining Corporation Plc
S-K 1300 Technical Report Summary on the Blanket Gold Mine, Zimbabwe
Storage of Coarse Rejects
Mine procedure is to retain all coarse rejects for all exploration drill core samples. They are collected by Geology and stored at the facility at the Exploration department offices.
Item 8 (d) – Adequacy of Sample Preparation, Security and Analytical Procedures
This section sets out the opinion of the QP regarding the adequacy of sample preparation, security, and analytical procedures.
Even though the mine laboratory is not accredited, a reasonable standard is maintained with good level of housekeeping apparent. Standards and blanks are run as part of the routine procedures. Blind checks are done within a batch of a single sample. If any internal laboratory QC fails, the batch is repeated automatically. However, the laboratory visit undertaken by the QP on 3 November 2021 did highlight some concerns that need to be addressed to ensure there is no contamination and sample weights are measured accurately.
In addition, as part of its external verification process the mine laboratory sends samples away to How Mine, Zimlabs, Turk mine laboratory and Performance Laboratories (accredited), to test their precision and accuracy. The results of the internal laboratory standards were viewed and are within acceptable limits, with minor failures. An in-house system for sample receipt and sample tracking has been implemented on the mine in 2019. This significantly improves the analytical system and improves accuracy and tracking of samples in the laboratory. The sample preparation methodology is considered adequate for Mineral Resource estimation purposes given the good correlation between planned production grades and actual recovered grades in the plant. A further inspection of the mine laboratory by an independent consultant Mr Jeremy Eliot was conducted In June 2016. Conclusions were similar in that improvements could be made, but, overall, the facilities and processes were of a satisfactory standard.
ITEM 9 – DATA VERIFICATION
Item 9 (a) – Data Verification Procedures
The QPs have reviewed available data types from the sampling stage through to the resource estimates which feed into the Mineral Resource statement.
In general, there are five types of samples considered at Blanket:-
|
● |
channel "chip" samples (evaluation and grade control); |
|
● |
sludge hole samples (evaluation and grade control); |
|
● |
grab samples (grade control); |
|
● |
evaluation drill core samples; and |
|
● |
exploration drill core samples. |
Evaluation Holes are holes which are used to define the limits of the orebody, generally at 7.5 m spacing along strike. All other holes are defined as Exploration Holes.
Database Validation
The database validations and checks were performed on all data received to identify and remove errors where identified. The database per year is summarised in Table 11. The Database summarised by sample type is in Table 12.
Caledonia Mining Corporation Plc
S-K 1300 Technical Report Summary on the Blanket Gold Mine, Zimbabwe
Table 11: Sample Database Summarised by Year
|
Year |
Total Number of Hole Identifiers |
|
<1960 |
12 454 |
|
1960-1970 |
123 |
|
1970-1980 |
83 |
|
1980-1990 |
58 |
|
1990-2000 |
228 |
|
2000-2010 |
529 |
|
2010-2020 |
6 152 |
|
2010-2023 |
15 920 |
|
Historical data captured up to 2022 with unknown sampling date |
61 736 |
|
Total |
97 283 |
For the purposes of estimation, stope and trench samples were excluded from the database. All other hole types were used. Illegible assay values in the capture of historical data are marked as such in the database. For resource estimation purposes, all these values were assigned a value equal to half the detection limit (0.0025 g/t). Assigning a 0.0025 g/t value for these intervals is a conservative approach, as the low-grade values form part of the estimation dataset. Alternatively, if these intervals are removed, a possible overestimation may occur from neighbouring high-grade samples.
Table 12: Sample Database Summarised by Drillhole Type
|
Hole Type |
Total Number of Samples |
Total Number of Hole Identifiers |
|
Channel |
222 369 |
54 859 |
|
Evaluation |
211 667 |
5 771 |
|
Sludge |
72 198 |
32 351 |
|
Exploration |
40 224 |
765 |
|
Stope |
30 295 |
3 512 |
|
Trench |
1 473 |
25 |
|
Total |
578 226 |
97 283 |
All samples noted here include the total database within and outside the orebodies. The individual samples used and clipped per domain is addressed in following sections. The total database is shown in Table 13. The total database for Blanket Mine is illustrated in Figure 13. Sludge and channel samples as well as evaluation drillholes are typically located in mining areas, while exploration holes are long, deep drillholes used to inform new areas.
Table 13: Hole and Sample Count
|
Table |
Total Number of Hole Identifiers |
Number of Individual Records |
|
Collar |
97 283 |
97 283 |
|
Survey |
97 283 |
294 110 |
|
Assay |
97 283 |
578 224 |
Caledonia Mining Corporation Plc
S-K 1300 Technical Report Summary on the Blanket Gold Mine, Zimbabwe
Figure 13: Long Section of Blanket Mine Showing the Total Database
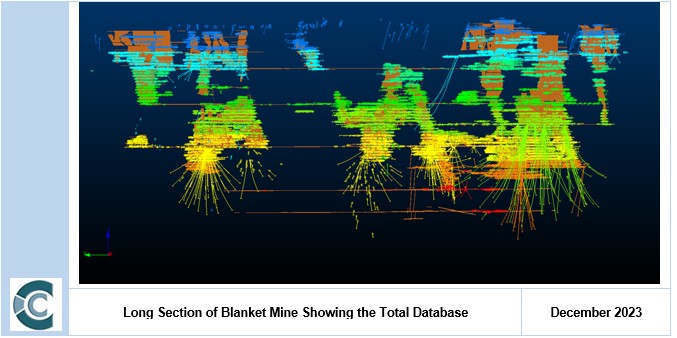
Item 9 (b) – Limitations on/Failure to Conduct Data Verification
The data capturing process has been reviewed on a quarterly basis throughout 2023 by conducting Planned Task Observations (“PTO’s”) at the mine. The data as received from Blanket was accepted as received that all available drillholes have been captured and on-site checks pertaining to data capture on the database were performed. All relevant error checks were performed on the digital data that was available.
Item 9 (c) – Adequacy of Data
The QP deems the data to be adequate for the purposes of conducting meaningful Mineral Resource estimations with appropriate Mineral Resource classification in accordance with the guidance as described by NI 43-101. Proof of this statement is validated by the fact that the mine has operated successfully for several years using the current Mineral Resource with good historical conversion rates for Inferred Mineral Resources to Indicated and then on to Measured. The QP is of the opinion that the sampling database is acceptable for the Mineral Resource estimation methodology being utilised at the Blanket Mine because of the sheer volume of sampling data. In addition, the Mine has been in operation for several years with historical gold recoveries around 3 g/t.
ITEM 10 – MINERAL PROCESSING AND METALLURGICAL TESTING
Item 10 (a) – Nature and Extent of Testing and Analytical Procedures
The plant currently treats RoM from the main orebodies. The ore is free milling, and the mineralogy has not changed to a significant degree. Sufficient information from historic production exists to determine the expected production performance with reasonable confidence.
Item 10 (b) Basis off Assumptions Regarding Recovery Estimates
The expected processing efficiencies are based on historic production, and these are well in line with the budget, with 2023 recovery averaging 93.8% against the 2023 budget of 93.5%. The actual recovery has been higher than the budget recovery year on year since 2020 approaching 94%. The budgeted recovery of 93.8% for 2024 can be assumed to continue, with improvements expected.
Caledonia Mining Corporation Plc
S-K 1300 Technical Report Summary on the Blanket Gold Mine, Zimbabwe
Item 10 (c) – Representativeness of Samples and Adequacy of Data
The samples measured from historic production are considered reliable and representative. As a result, they can be used to adequately predict future performance.
The QP is of the opinion the Blanket Mine plant recoveries are well understood as they are based on the actual historical production figures.
Item 10 (d) – Deleterious Elements for Extraction
The arsenopyrite content of RoM material currently being treated from Blanket Mine is low enough not to pose a risk to economic extraction and deposition of tailings.
Blanket ores are free milling in that 93% of the gold is recovered via direct cyanidation with a further 1% achievable with the use of oxygen pre-treatment injection methods. Arsenic therefore reports to the mine residue deposit in the form of undecomposed arsenopyrite, constituting less than 1% of the ore. The ore contains approximately 35% carbonate minerals which results in the tailings having an alkaline chemistry which inhibits the decomposition of arsenopyrite which is not exposed to the atmosphere. Rainwater run-off from the tailings dam is channelled within bund walls to a sump from where it is returned to the plant as makeup water.
Blanket will be undertaking a pilot plant test work programme on the other more-refractory Mineral Deposits not currently being mined which may have a higher arsenopyrite content. Continuous testing and analysing of arsenic and other potential deleterious elements will be conducted as part of this test programme. Appropriate neutralisation steps will be included in the process design as required.
ITEM 11 – MINERAL RESOURCE ESTIMATES
The Mineral Resources were estimated as of 31 December 2023 based on updated drilling and sampling data, as well as the mining faces received for the Mine as at that date. The QP has depleted the 31 December 2023 Mineral Resources with updated mining faces to the period ending 31 December 2023. In addition, the Mineral Resource was depleted with the LOM planning to derive an updated Mineral Reserve estimate as of 31 December 2023. Extensive exploration drilling was undertaken during the period with a significant number of intersections at depth from the LHDP.
Item 11 (a) – Assumptions, Parameters and Methods Used for Resource Estimates
I. Mineral Resource Estimation Procedures
i. Geological Modelling
The construction of the geological models is comprehensively discussed in Item 6 (d) of this TRS.
ii. Statistical Analysis
An additional 57 990 composite samples were added between 2022 and 2023, representing a 32% increase in data. Data changes affected all orebodies, with major changes being made to BLK1_FW, BLK2_FW, BQR_FW and LIMA_FW. The data changes are due to new exploration drill hole results derived from the LHDP, for which results have been released during 2023, from ongoing ROM drilling, and from new underground sample data derived from underground development activities.
iii. Domaining
Wireframes received from Blanket Mine were checked and imported into Datamine Studio RM for estimation. A requirement for Datamine is that the wireframes are closed and have no cross overs. Fourteen main orebodies are represented, each with a number of separate domains which were estimated separately. A total of 29 domains were estimated in 2022 while 43 domains were estimated in 2023. The increase in volumes is due to an increase in the number of domains based on an increase in data and continuous geological modelling.
Caledonia Mining Corporation Plc
S-K 1300 Technical Report Summary on the Blanket Gold Mine, Zimbabwe
The data update from 2022 to 2023 is illustrated per domain in Figure 3 to Figure 16. Previous 2022 data is shown in black, while new 2023 samples are depicted in red.
ARM and ARS
ARM contains six domains, including an internal waste unit that is clipped out and estimated separately. ARS has four domains: EWL, NSL, HW, and a new FW domain. ARS_Ext includes a 990mL domain which is a target area for further drilling to determine its up and down dip extents.
Figure 14: 3-Dimensional view of the AR Main Domain and is Associated Data
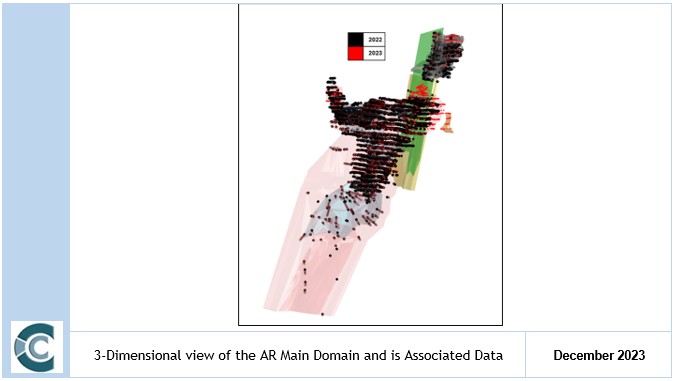
Caledonia Mining Corporation Plc
S-K 1300 Technical Report Summary on the Blanket Gold Mine, Zimbabwe
Figure 15: Section View of ARS_EXT and ARS Domains and Data.
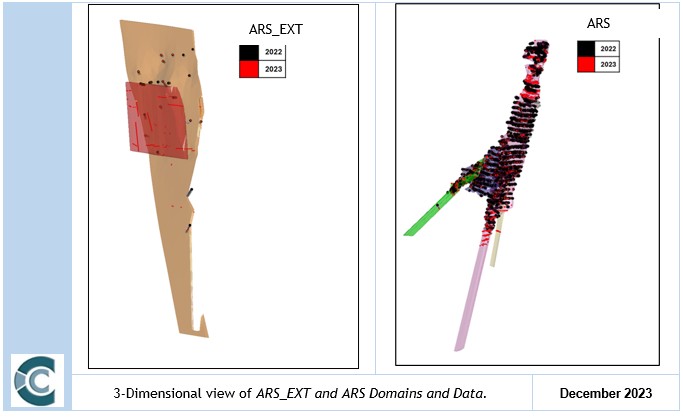
Blanket 1, Blanket 2, Blanket 3, Blanket4_ 5 and Blanket 6
Blanket 1 and Blanket 2 have 3 domains each with Blanket 2 HW sub-domained into a higher and a lower grade section. Blanket 3 has been sub-domained into FW and HW sections for 2023. Blanket 4 and 5 have been merged to create Blanket4_5 with FW and HW sections. Blanket 6 is also sub-domained into FW and HW sections. Blanket 4_5 and Blanket 6 are divided by the Wenlock fault and BQR.
Caledonia Mining Corporation Plc
S-K 1300 Technical Report Summary on the Blanket Gold Mine, Zimbabwe
Figure 16: Section View of BLK1, BLK2, BLK3, BLK4_5 and BLK6 Domains and their Data.
Caledonia Mining Corporation Plc
S-K 1300 Technical Report Summary on the Blanket Gold Mine, Zimbabwe
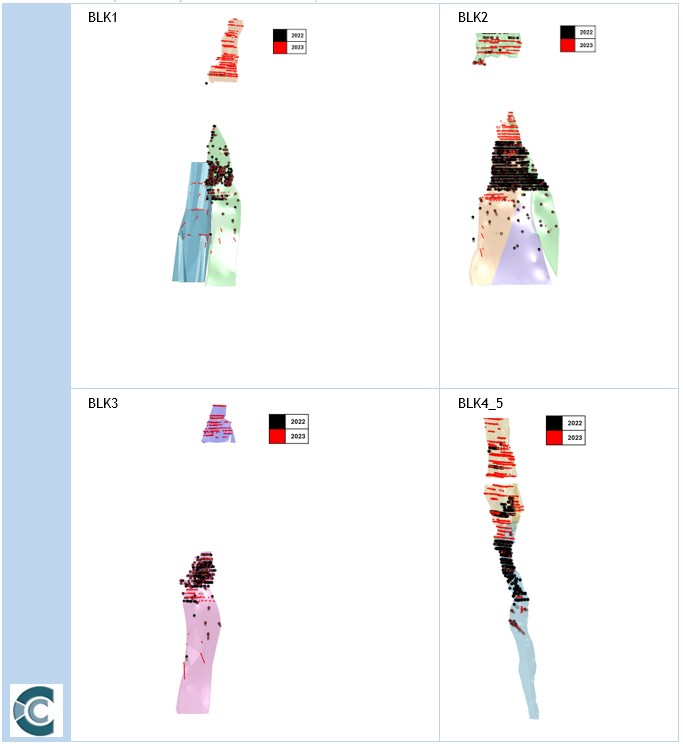
Caledonia Mining Corporation Plc
S-K 1300 Technical Report Summary on the Blanket Gold Mine, Zimbabwe
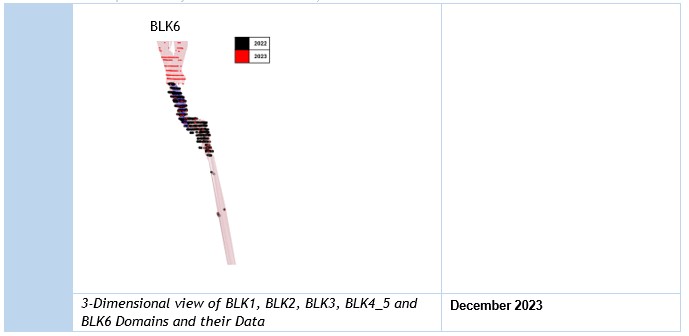
Blanket Feudal and BQR
BQR includes a FW, and the HW is further divided into a Northern and Southern domain based on grade. Blanket Feudal has been sub-domained into a HW and FW for 2023.
Figure 17: Section View of BF and BQR Domains and their Data.
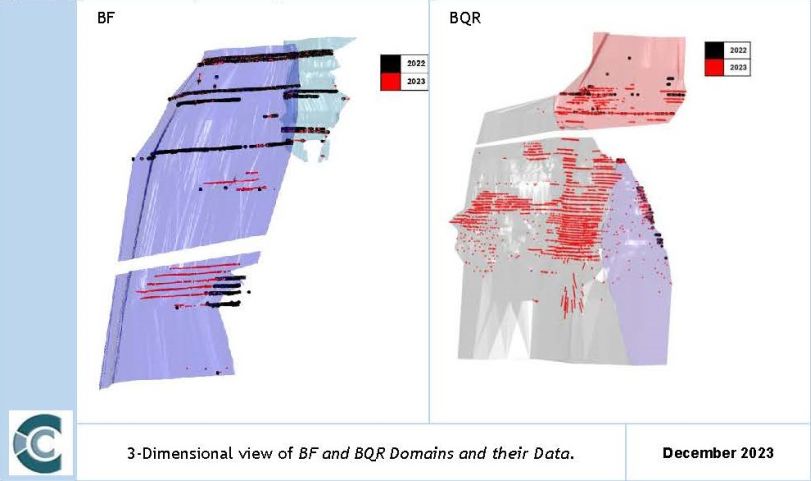
Lima and Eroica
Lima is divided into four domains: Main; Inter-reef; Inter-reef South and FW. Eroica is divided into three domains, ERCN, ERCS and a newly modelled domain ERCN_FW
Caledonia Mining Corporation Plc
S-K 1300 Technical Report Summary on the Blanket Gold Mine, Zimbabwe
Figure 18: Section View of the LIMA and EROICA Domains with their Data.
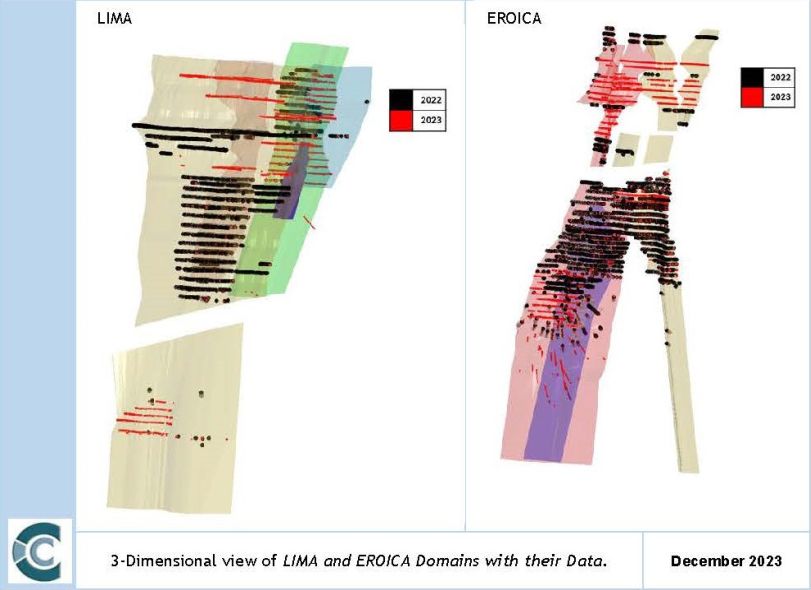
Jethro and Sheet
Jethro was sub-domained into four units for the 2023 estimation and Sheet remains with a Main and a South domain.
Figure 19: Section View of JETHRO and SHEET Domains and their Data.
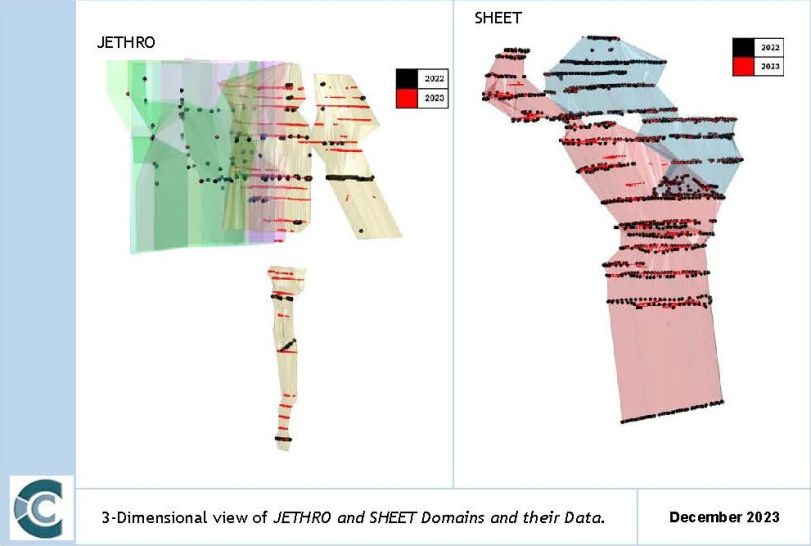
Caledonia Mining Corporation Plc
S-K 1300 Technical Report Summary on the Blanket Gold Mine, Zimbabwe
|
iv. |
Outlier Analysis |
Capping is carried out during the kriging stage to limit the influence that anomalously high grades may have during estimation. A top cap was applied in Datamine for variography and estimation. As a capping strategy, the data was divided into quantiles for each domain. The 90th to 100th quantile was further sub-divided into 0.5% percentiles. The metal content represented by each 0.5% percentile is examined and in conjunction with probability plots and histograms, anomalous values are identified. The capping values per domain are documented in Table 14. The top caps are based on the 99th percentile except for the Eroica orebodies which are capped at the 98th percentile.
Table 14: Capping Valuers Applied per Domain
|
Domain |
2022 Top Capped Value (g/t) |
2023 Top Capped Value (g/t) |
|
ARM_MAIN |
75 |
20.5 |
|
ARM_480_615mL |
- |
13.8 |
|
ARM_ABV_DYK |
- |
21.68 |
|
ARM_FFW1 |
- |
13.8 |
|
ARM_FFW2 |
- |
29.4 |
|
ARM_WASTE |
43.1 |
8.77 |
|
ARS_EWL |
87 |
32.4 |
|
ARS_FW |
- |
34 |
|
ARS_HW |
17 |
16.07 |
|
ARS_NSL |
47 |
19.92 |
|
ARS_EXT |
12 |
28.41 |
|
ARS_EXT_990mL |
- |
12.26 |
|
BF_FW |
- |
28.5 |
|
BF_HW |
- |
27.19 |
|
BLK1_FW |
- |
49.45 |
|
BLK1_HW |
- |
12.63 |
|
BLK1_HWN |
- |
19.86 |
|
BLK2_FW |
- |
32.03 |
|
BLK2_HW |
- |
39.45 |
|
BLK_2HW_LG |
44 |
|
|
BLK3_FW |
- |
20 |
|
BLK3_HW |
- |
20.79 |
|
BLK4_5_FW |
- |
29.08 |
|
BLK4_5_HW |
- |
29.1 |
|
BLANKET_6FW |
28 |
32.81 |
|
BLANKET_6HW |
45 |
30 |
|
BQR_FW |
39 |
97.04 |
|
BQR_HW_NORTH |
76 |
49.1 |
|
BQR_HW_SOUTH |
30 |
48.05 |
|
ERCN |
56.4 |
39.2 |
|
ERCN_FW |
- |
27.4 |
|
ERCS |
56.4 |
26.9 |
|
JET |
- |
16.32 |
|
JTH_CENTRAL |
- |
21.92 |
|
JTH_HW1 |
- |
57.63 |
|
JTH_HW2 |
- |
26.59 |
|
LIMA_FW |
40 |
53.8 |
|
LIMA_HW |
- |
115.09 |
|
LIMA_INTER |
23 |
18.3 |
|
LIMA_INTER_S |
|
15.59 |
|
LIMA_MAIN |
40 |
25.75 |
|
SHT_MAIN |
38 |
20.9 |
|
SHT_SOUTH |
15.8 |
17.5 |
Caledonia Mining Corporation Plc
S-K 1300 Technical Report Summary on the Blanket Gold Mine, Zimbabwe
|
v. |
Data Compositing |
Compositing is performed for all orebodies based on the most common sample length of 0.6m.
|
vi. |
Geostatistical Analysis and Variography |
All variography was carried out in Datamine. All variograms were recalculated in 2023 due to a material change in data. Variogram analysis was done in a transformed normal score space with the variograms being back transformed for resource estimation purposes. Orientations previously determined were generally maintained unless there was a major change to the domain’s wireframes.
Kriging neighbourhood analysis (“KNA”) was undertaken to assess the optimal parameters for estimation in each of the separate domains. Different scenarios of minimum and maximum samples are run, and the results plotted to define the estimation parameters for which the highest quality result can be kriged, this quality is measured by Slope of Regression (“SoR”), and kriging variance. The block sizes utilised for parent cell estimation were 3 m in x, 10 m in y and 10 m in z. This block size was chosen based on the requirements to enable an accurate representation of the data. The smaller block size in x was chosen to capture the variability in the shortest orientation of the orebodies. Sub-celling was allowed to occur to 0.10m in the X direction and 1.25m in the Y and Z directions to allow for the filling of the mining voids at a viable resolution.
At lower search volumes, more samples are available (typically within the mining areas), and a higher minimum and maximum can be used, while further from the well-informed areas, the minimum and maximum samples will decrease to ensure more weighting is applied to nearby samples. An ordinary krige was employed were possible. The distance from samples and search volume used to inform the block model is reflected in the Mineral Resource Classification.
|
vii. |
Block Model Creation and Grade Interpolation |
Parent cell estimation with sub-celling was applied. The parent cell size is 3 m(X) by 10 m(Y) by 10 m(Z). The Y direction is approximately along strike and the Z direction is approximately down-dip, the smallest parent cell size in the X direction (3 m) is orientated along the thinnest direction of the orebody.
The resource interpolation utilised Datamine Studio RM software for running the estimates. Individual orebodies were domained to reflect high and low-grade areas. The domain wireframes were used as hard boundaries during estimation. This ensures that only samples falling within the domain wireframe’s extents were utilised during estimation. Variograms could be generated for most of the domains allowing for ordinary kriging to be performed. An ordinary krige was employed in all domains except for ARM_480_615ml, ARM_FFW1 and ARM_FFW2 which utilised Inverse Distance Squared (“ID2”) as the interpolation technique.
Caledonia Mining Corporation Plc
S-K 1300 Technical Report Summary on the Blanket Gold Mine, Zimbabwe
Bulk Density
Between May 2016 and February 2020, 32 633 SG samples were taken for Blanket Mine. The breakdown per orebody is detailed in Table 15. Only the orebodies being considered, and valid samples are shown. Tonnage for each domain was calculated with the individual applicable density.
Table 15: SG Samples per Orebody
|
Orebody |
Valid Samples |
SG (g/cm3) |
|
ARM |
6,222 |
2.90 |
|
ARS |
8,629 |
2.88 |
|
Feudal |
67 |
2.97 |
|
Blanket |
6,266 |
2.84 |
|
Eroica |
2,849 |
2.87 |
|
Lima |
712 |
2.95 |
|
Sheet |
515 |
2.88 |
|
Grand Total |
25,260 |
2.88 |
|
viii. |
Grade Estimation |
Digital 3D estimates into block models per domain were performed using Datamine Studio RM.
The estimation results were compared visually to the data to confirm continuity between the data and resource block models. The undepleted resource block models are illustrated in Figure 20 through Figure 32.
Figure 20: ARM Estimates
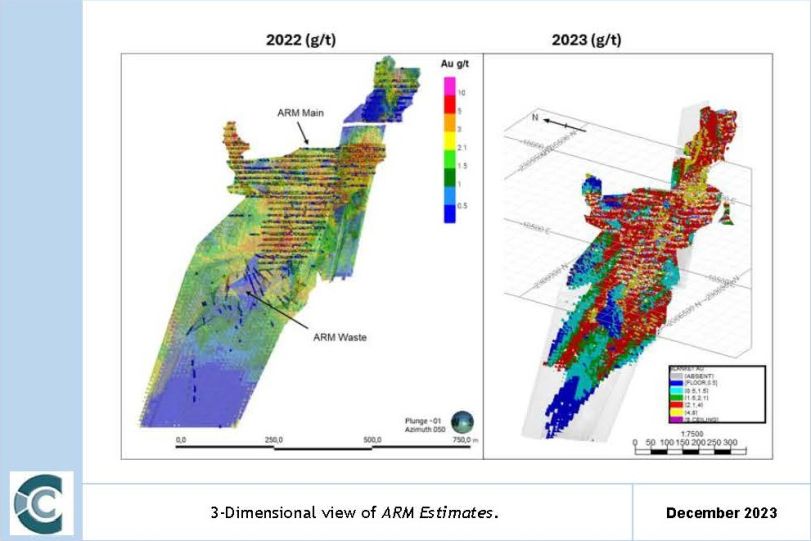
Caledonia Mining Corporation Plc
S-K 1300 Technical Report Summary on the Blanket Gold Mine, Zimbabwe
Figure 21: ARS Estimates (including ARS_Ext)
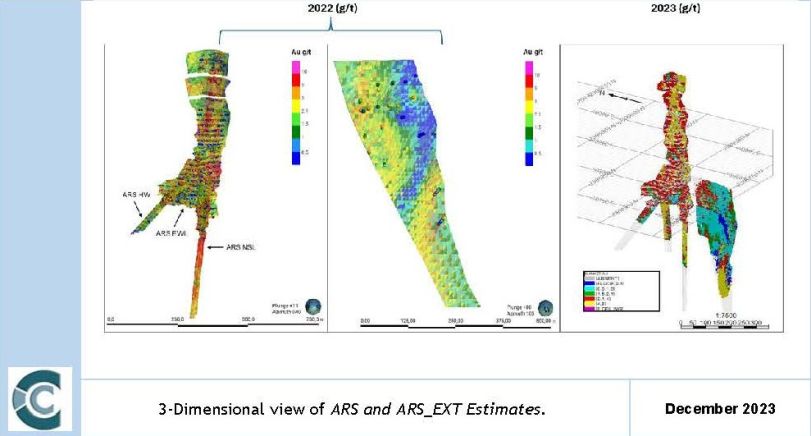
Figure 22: BLK1 Estimates
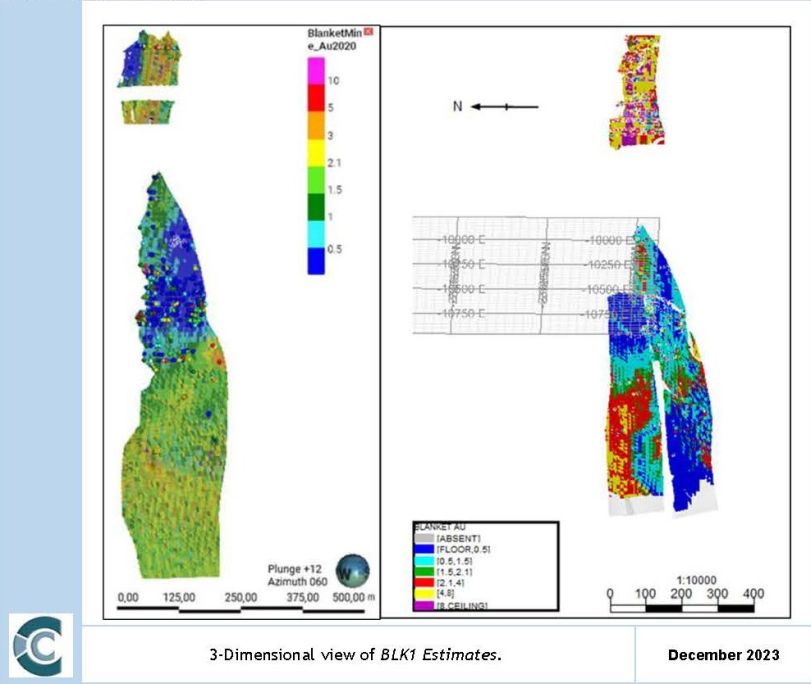
Caledonia Mining Corporation Plc
S-K 1300 Technical Report Summary on the Blanket Gold Mine, Zimbabwe
Figure 23: BLK2 Estimates
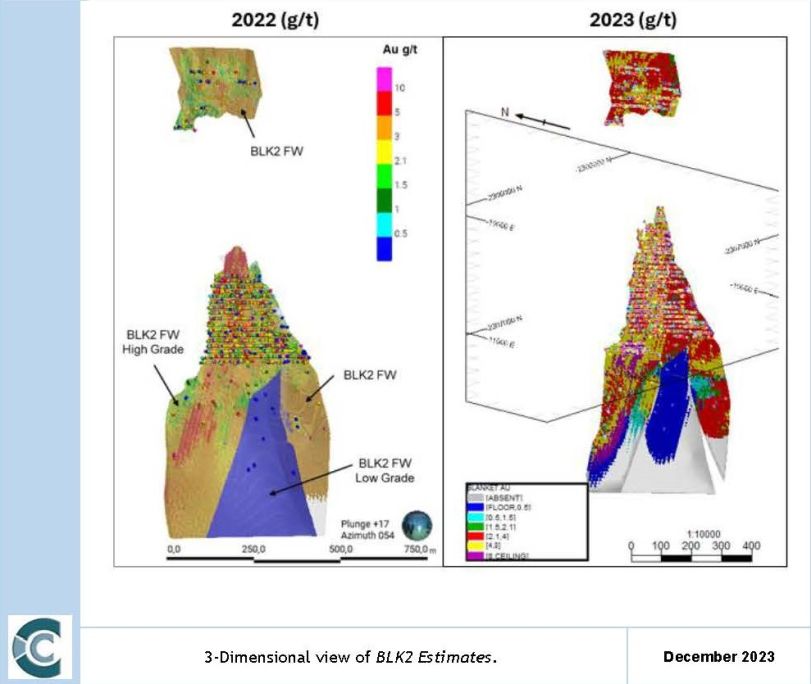
Caledonia Mining Corporation Plc
S-K 1300 Technical Report Summary on the Blanket Gold Mine, Zimbabwe
Figure 24: BLK3 Estimates
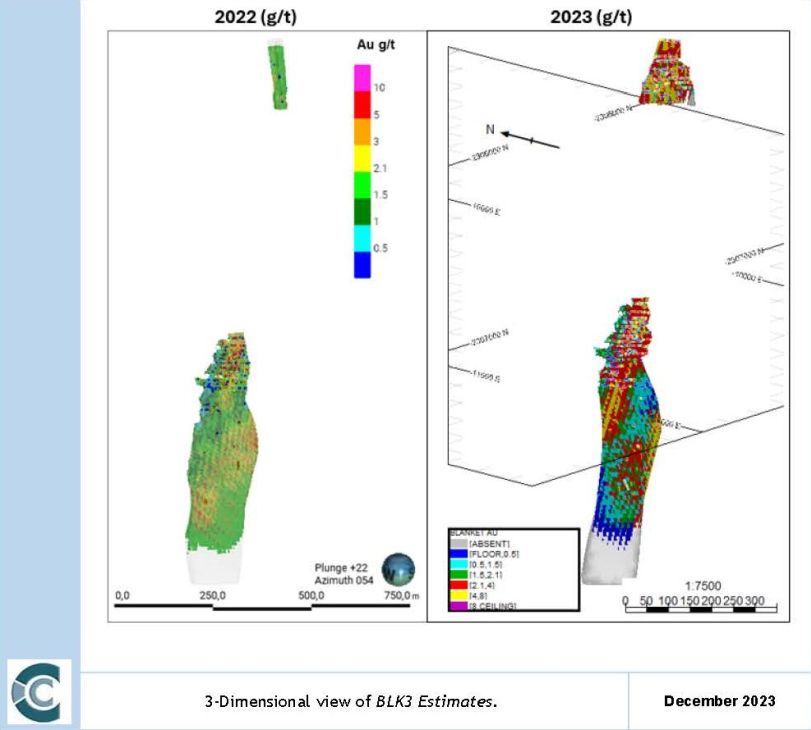
Caledonia Mining Corporation Plc
S-K 1300 Technical Report Summary on the Blanket Gold Mine, Zimbabwe
Figure 25: BLK4_5 Estimates
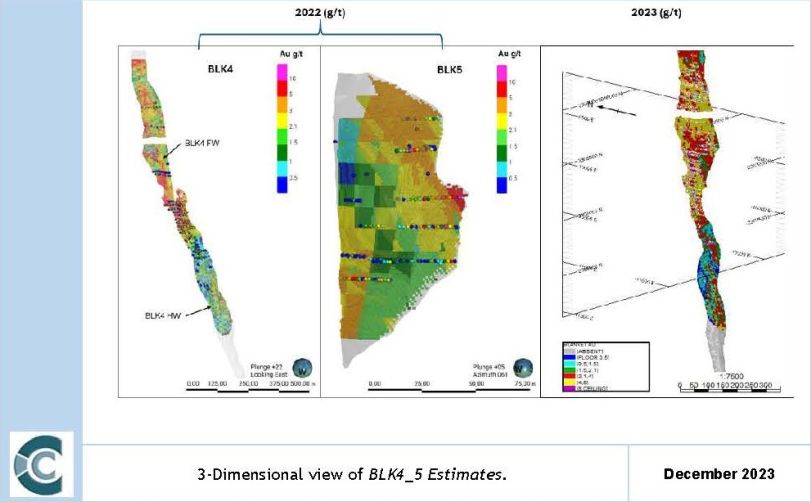
Figure 26: BLK6 Estimates
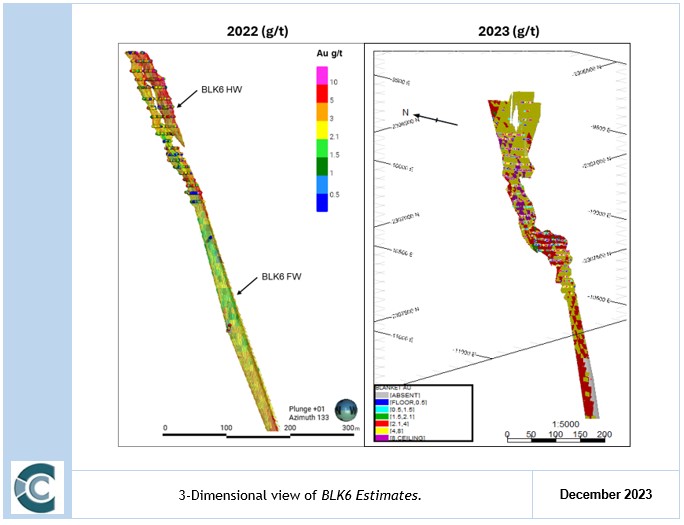
Caledonia Mining Corporation Plc
S-K 1300 Technical Report Summary on the Blanket Gold Mine, Zimbabwe
Figure 27: BF Estimates
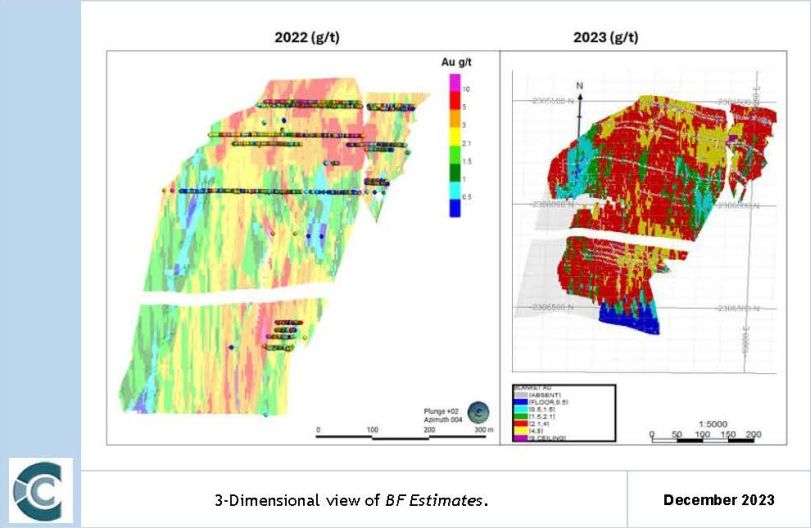
Caledonia Mining Corporation Plc
S-K 1300 Technical Report Summary on the Blanket Gold Mine, Zimbabwe
Figure 28: BQR Estimates
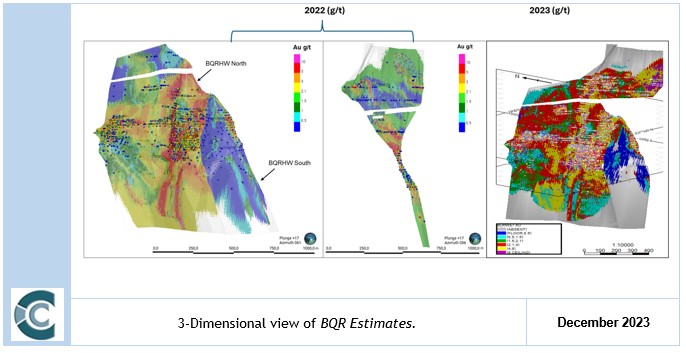
Figure 29: LIMA Estimates
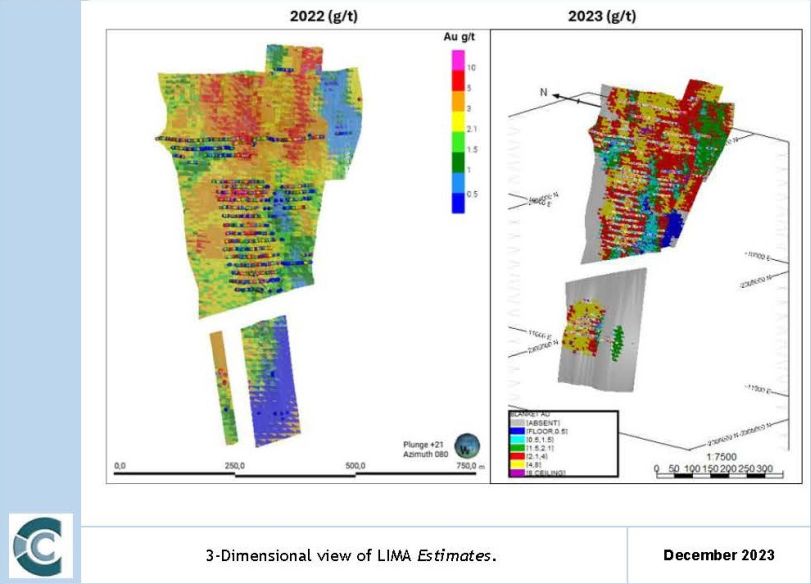
Caledonia Mining Corporation Plc
S-K 1300 Technical Report Summary on the Blanket Gold Mine, Zimbabwe
Figure 30: ERC Estimates
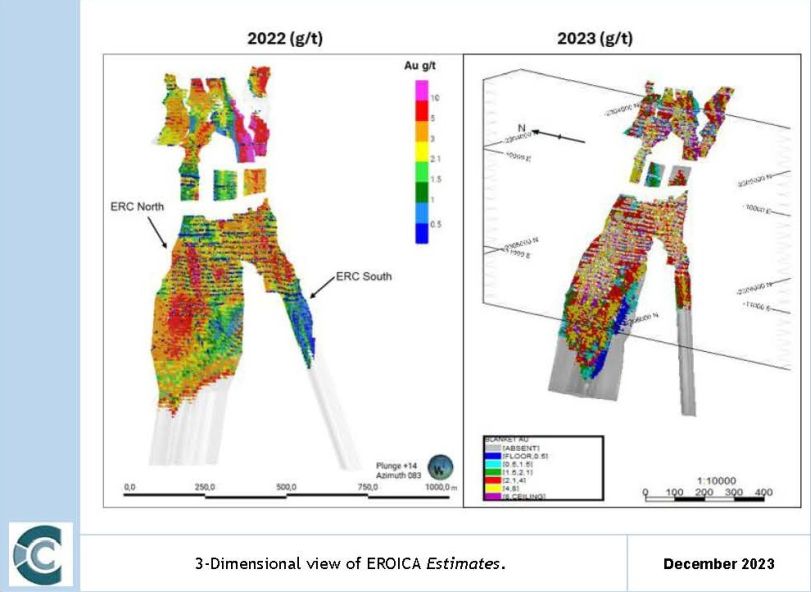
Caledonia Mining Corporation Plc
S-K 1300 Technical Report Summary on the Blanket Gold Mine, Zimbabwe
Figure 31: JTH Estimates
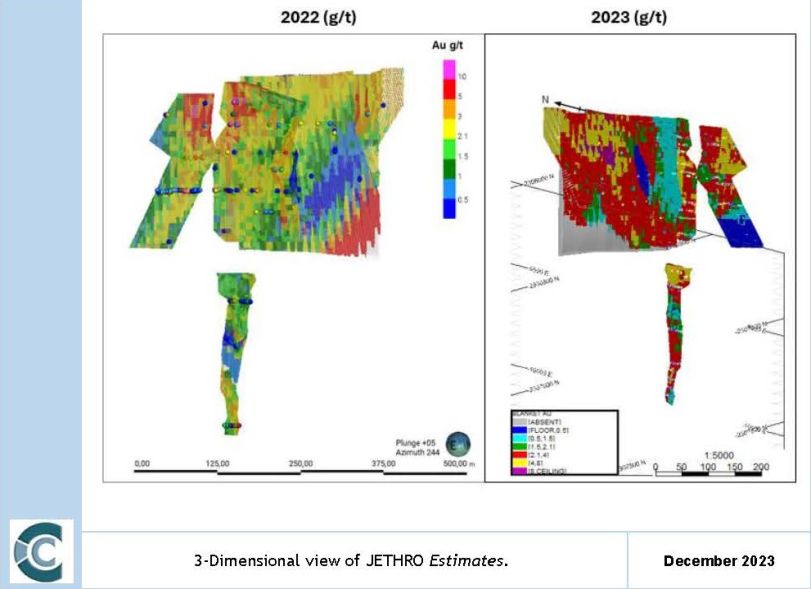
Caledonia Mining Corporation Plc
S-K 1300 Technical Report Summary on the Blanket Gold Mine, Zimbabwe
Figure 32: SHT Estimates
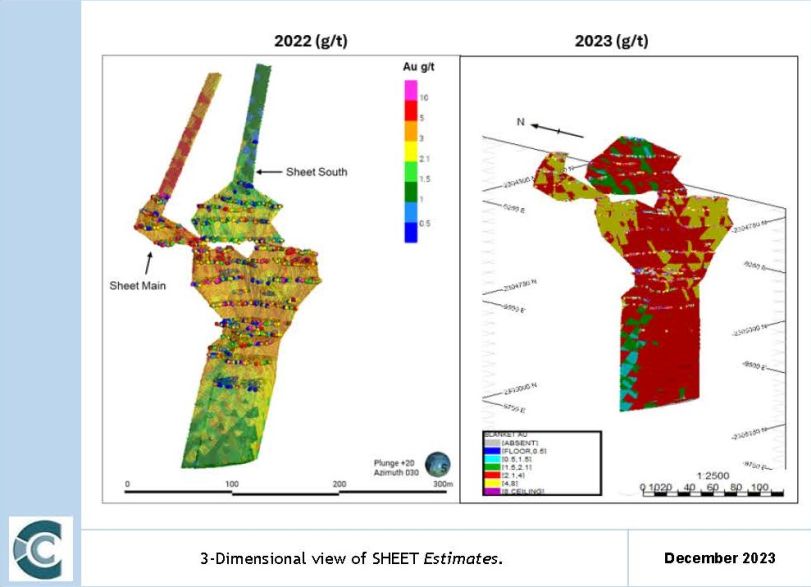
|
ix. |
Mining Depletions |
Depletions are correct as of 31 December 2023. All haulages, development and stoping are accounted for in the block models and the Mineral Resource excluding mining is presented in the Mineral Resource tabulations. An image of all stoping and development is shown in Figure 33.
Caledonia Mining Corporation Plc
S-K 1300 Technical Report Summary on the Blanket Gold Mine, Zimbabwe
Figure 33: Long Section of Blanket Mine showing Stopes, Drives, Haulages and Shafts
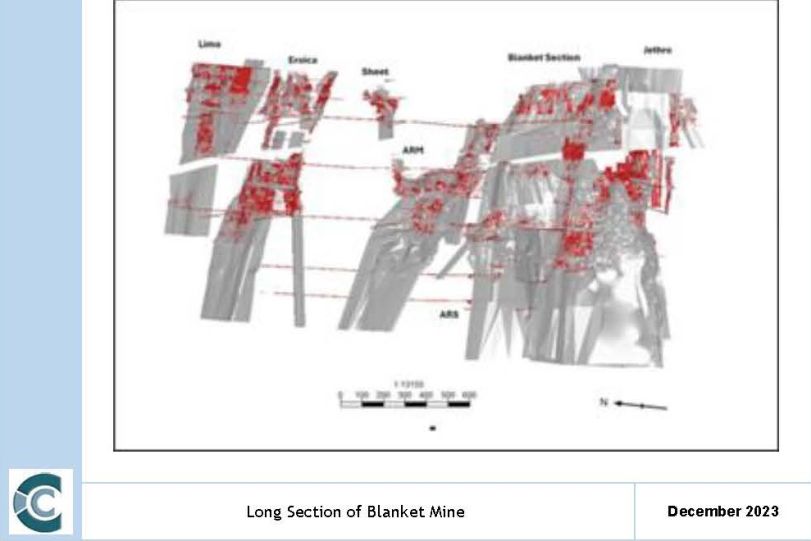
|
x. |
Block Model Validation |
The purpose of swath plots is to verify the estimate versus the original input data. Swath plots show the average of the samples versus the average of the estimate within the same perimeter (swath) that is spaced a regular distance apart. This is repeated in X, Y and Z space to get a representative view of the correlation in all orientations. For Blanket, swaths in Y are generally across strike and swaths in X are along strike, swaths in Z represent the down-dip direction. This is typically displayed with an additional estimation technique, an inverse distance estimate in this instance. This aids in determining if any variance is due to the estimation technique. In all instances, the inverse distance weighting and ordinary kriging estimates compare well.
In addition, all swath plots compare well with the data. Better-informed domains show the best swaths, with sparsely sampled domains less so.
Examples of swath plots for the Eroica domains (ERCN, ERCN_FW and ERCS) are provided in Figure 34 to Figure 36 respectively.
Caledonia Mining Corporation Plc
S-K 1300 Technical Report Summary on the Blanket Gold Mine, Zimbabwe
Figure 34: Swathe Plot of ERCN Domain in X, Y and Z Directions
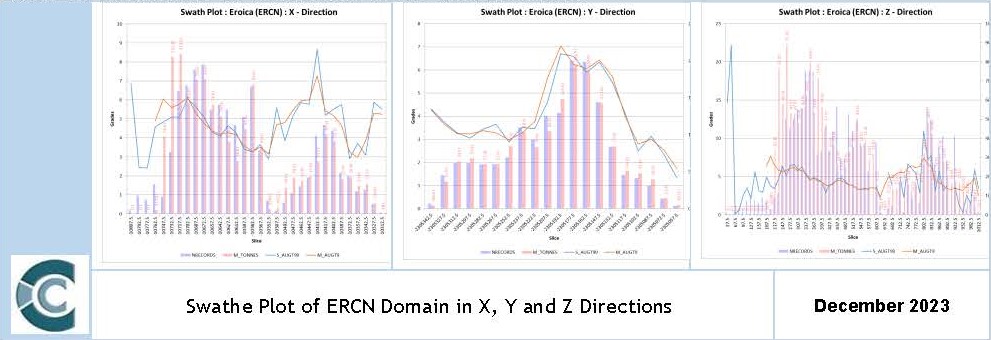
Figure 35: Swathe Plot of ERCN_FW Domain in X, Y and Z Directions
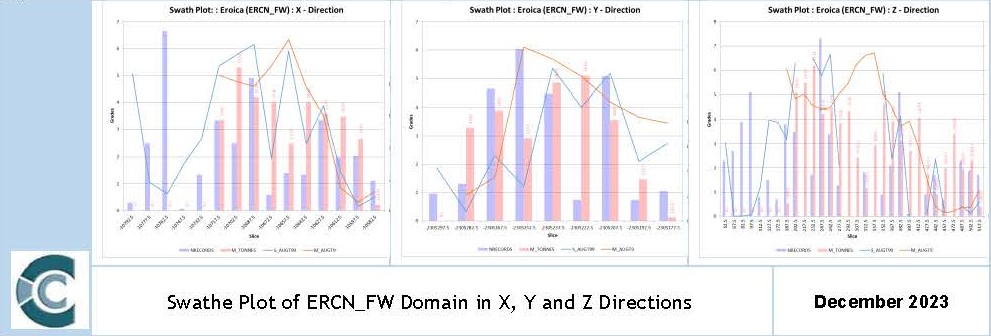
Figure 36: Swathe Plot of ERCS Domain in X, Y and Z Directions
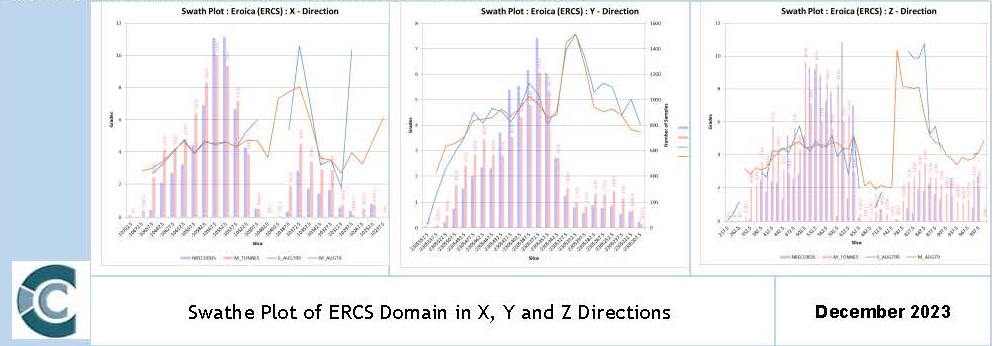
Caledonia Mining Corporation Plc
S-K 1300 Technical Report Summary on the Blanket Gold Mine, Zimbabwe
The following are reflected on the swath plot analysis (SVOL1):
|
● |
Sheet: The swath of the Ordinary Kriged estimates shows a good correlation with the sample data with some degree of smoothing compared to the data. |
|
● |
ERCN domain, the swaths accurately reflect the data, with good correlation in all directions. Some minor smoothing is apparent on the extreme edges. |
|
● |
ERCS domain: A good correlation is seen with the data. |
|
● |
ERN_FW domain: This is a new domain with limited data. Generally, the estimate fits with the data set and additional data will inform the estimate in a better manner. |
|
● |
Lima Orebody: All domains correlate well although in domains LIM_FWE, LIMA_HW and INTERS the edges exhibit some variance due to sparseness of data. |
|
● |
Jethro: The swath plots illustrate smoothing of the Ordinary Kriged estimates relative to the data due to patchy data. Smoothing at the edge of the data limits results in under, or over-estimation relative to the data. Domain 4 shows the best correlation. |
|
● |
ARS Orebody: Swath plots show good correlation in all directions with localised variance around the edges of the orebody limits or data limits relative to SVOL1. The domains interpolated with ID2 exhibit a degree of smoothing due to the sparse data sets. |
|
● |
ARS Extension: ARS has been extensively remodelled with the addition of a ARS_EXT_990 domain. The estimates show moderate correlation with smoothing as a result of low sample data. |
|
● |
The ARM Main domain: The Ordinary Kriged estimates show a good correlation to the data. |
|
● |
The Blanket 1: The Ordinary Kriged show a good correlation with smoothing relative to the data observed for the BLK1_HW and BLK1_FW domains. It is noted in the X and Y swath plots, the BLK1_HWN domain exhibits a degree of over estimation. |
|
● |
The Blanket 2: The Ordinary Kriged show a good correlation with the data. Estimates near the edge of the data show a possible under, or over-estimate compared to the data as the data numbers reduce. |
|
● |
Blanket 3: The Ordinary Kriged estimates observed from the swath plots show correlation to the data. |
|
● |
Blanket 4_5: The previous Blanket 4 and Blanket 5 domains were combined. The Ordinary Kriged estimates observed from the swath plots show a good correlation to the data with a minor bias towards under-estimation. |
|
● |
Blanket 6: A good correlation is observed the estimates and the data. |
|
● |
BQR: Swath plots generally correlate well with the data. For domain BQR_HWN, there appears to be an area of under estimation in the Y direction and less so in the Z direction. |
|
● |
BF: A good correlation is seen from the swath plots. |
II. Initial Assessment
The QP undertook an initial assessment of the mineralised body to determine the reasonable prospects of eventual economic extraction (“RPEEE”).
Economic, metallurgical, and mining parameters were used to derive the cut-offs. The parameters are tabulated in Table 16 below. The gold price used is the gold price as per the annual budget plan increased by 10% while the total operating cost as per on mine budgets is the cost supplied by Blanket Mine (USD96/t) with a 10% improvement, for potential operational improvements, for reasonable prospects of eventual economic extraction. The plant recovery and mine call factor are also based on the Blanket Mine historical production figures. Reasonable prospects of eventual economic extraction are based on a 10-to-15-year view for precious metals.
Caledonia Mining Corporation Plc
S-K 1300 Technical Report Summary on the Blanket Gold Mine, Zimbabwe
Table 16: Cut-off Derivation Factors
|
Parameter |
Unit |
Quantity |
|
Metal price |
USD/oz |
2 150 |
|
Total operating cost (Mining and Processing) |
USD/t |
86.4 |
|
Dilution |
% |
8 |
|
Plant recovery factor |
% |
95 |
|
Mine call factor |
% |
100 |
All underground Mineral Resources are stated at a cut-off grade 1.5 g/t. The QP deems the total Mineral Resource as stated in this TRS to have RPEEE.
III. MINERAL RESOURCE CLASSIFICATION
Mineral Resources have been reported separately in the Measured, Indicated and Inferred Mineral Resource categories. Inferred Mineral Resources have been reported separately and have not been incorporated with the Measured and Indicated Mineral Resources. Inferred Mineral Resources have a lower level of confidence and while it would be reasonable to expect that the majority of the Inferred Mineral Resources would upgrade to Indicated Mineral Resources with continued exploration, due to the uncertainty of Inferred Mineral Resources, it should not be assumed that such upgrading will occur.
For classification of Mineral Resources, variogram ranges and density of sampling were used to define Mineral Resource classification. The classification has been more restrictive when compared to the 2022 classification criteria. The standardised mineral resource classification criteria is summarised in Table 17.
Caledonia Mining Corporation Plc
S-K 1300 Technical Report Summary on the Blanket Gold Mine, Zimbabwe
Table 17: Mineral Resource Classification Criteria for Blanket Mine
|
Domains |
Mineral Resource Categories |
||
|
Measured |
Indicated |
Inferred |
|
|
Blanket 1_HW |
SVOL = 1 : MinD <=20 : SR >=0.5 |
(SVOL = 1 or 2) : MinD<=40 : NSamp>=20 |
(SVOL = 1 or 2 or 3) and MinD<200 |
|
Blanket 1_HWN |
SVOL = 1 : MinD <=20 : SR >=0.5 |
(SVOL = 1 or 2) : MinD<=40 : NSamp>=20 |
(SVOL = 1 or 2 or 3) and MinD<200 |
|
Blanket 1_FW |
SVOL = 1 : MinD <=20 : SR >=0.5 |
(SVOL = 1 or 2) : MinD<=40 : NSamp>=20 |
(SVOL = 1 or 2 or 3) and MinD<200 |
|
Blanket 2 FW |
SVOL = 1 : MinD <=20 : SR >=0.5 |
(SVOL = 1 or 2) : MinD<=40 : NSamp>=20 |
(SVOL = 1 or 2 or 3) and MinD<250 |
|
Blanket 2 HW |
SVOL = 1 : MinD <=20 : SR >=0.5 |
(SVOL = 1 or 2) : MinD<=40 : NSamp>=20 |
(SVOL = 1 or 2 or 3) and MinD<200 |
|
Blanket 2 HW LG |
SVOL = 1 : MinD <=20 : SR >=0.5 |
(SVOL = 1 or 2) : MinD<=40 : NSamp>=20 |
(SVOL = 1 or 2 or 3) and MinD<200 |
|
Blanket 3_FW |
SVOL = 1 and MinD <=20 |
(SVOL = 1 or 2) and MinD<=40 |
(SVOL = 1 or 2 or 3) and MinD<250 |
|
Blanket 3_HW |
SVOL = 1 and MinD <=20 |
(SVOL = 1 or 2) and MinD<=40 |
(SVOL = 1 or 2 or 3) and MinD<175 |
|
Blanket 4_5 HW |
SVOL = 1 : MinD <=20 : SR >=0.7 |
(SVOL = 1 or 2) and MinD<=40 |
(SVOL = 1 or 2 or 3) and MinD<250 |
|
Blanket 4_5 FW |
SVOL = 1 and MinD<=20 |
(SVOL = 1 or 2) : MinD<=40 : SR>=0.5 |
(SVOL = 1 or 2 or 3) and MinD<175 |
|
Blanket 6 HW |
SVOL = 1 : MinD <=20 : SR >=0.7 |
(SVOL = 1 or 2) and MinD<=40 |
(SVOL = 1 or 2 or 3) and MinD<200 |
|
Blanket 6 FW |
SVOL = 1 and MinD<=20 |
(SVOL = 1 or 2) and MinD<=40 |
(SVOL = 1 or 2 or 3) and MinD<200 |
|
BQR FW |
SVOL = 1 : MinD <=20 : SR >=0.7 |
(SVOL = 1 or 2) : MinD<=40 : NSamp>=20 |
(SVOL = 1 or 2 or 3) and MinD<200 |
|
BQR HW NORTH |
SVOL = 1 : MinD <=20 : SR >=0.7 |
(SVOL = 1 or 2) : MinD<=40 : NSamp>=20 |
(SVOL = 1 or 2 or 3) and MinD<250 |
|
BQR HW SOUTH |
SVOL = 1 : MinD <=20 : SR >=0.7 |
(SVOL = 1 or 2) : MinD<=40 : NSamp>=20 |
(SVOL = 1 or 2 or 3) and MinD<200 |
|
ARM Main |
SVOL = 1 : MinD <=20 : NSamp >=80 |
(SVOL = 1 or 2) : MinD<=40 : SR>=0.5 |
(SVOL = 1 or 2 or 3) and MinD<175 |
|
ARM Waste |
SVOL = 1 : MinD <=20 : NSamp >=80 |
(SVOL = 1 or 2) and MinD<=40 |
(SVOL = 1 or 2 or 3) and MinD<175 |
|
ARM_480L |
SVOL=1 and MinD <=20 |
(SVOL = 1 or 2) and MinD<=40 |
(SVOL = 1 or 2 or 3) and MinD<175 |
|
ARS_ABV_DYK |
SVOL = 1 and MinD <=20 |
(SVOL = 1 or 2) and MinD<=40 |
(SVOL = 1 or 2 or 3) and MinD<175 |
|
ARM_FFW1 |
SVOL = 1 : MinD <=20 : NSamp >=40 |
(SVOL = 1 or 2) and MinD<=40 |
(SVOL = 1 or 2 or 3) and MinD<175 |
|
ARM_FFW2 |
SVOL = 1 : MinD <=20 : NSamp >=40 |
(SVOL = 1 or 2) and MinD<=40 |
(SVOL = 1 or 2 or 3) and MinD<175 |
|
BF_FW |
SVOL = 1 : MinD <=20 : NSamp >=80 |
(SVOL = 1 or 2) and MinD<=40 |
(SVOL = 1 or 2 or 3) and MinD<250 |
|
BF_HW |
SVOL = 1 : MinD <=20 : NSamp >=80 |
(SVOL = 1 or 2) and MinD<=40 |
(SVOL = 1 or 2 or 3) and MinD<250 |
|
ERC_N |
SVOL = 1 : MinD <=20 : NSamp >=60 |
(SVOL = 1 or 2) : MinD<=40 : NSamp>=20 |
(SVOL = 1 or 2 or 3) and MinD<175 |
|
ERC_NFW |
SVOL = 1 : MinD <=20 : NSamp >=60 |
(SVOL = 1 or 2) : MinD<=40 : NSamp>=20 |
(SVOL = 1 or 2 or 3) and MinD<175 |
|
ERC_S |
SVOL = 1 : MinD <=20 : NSamp >=60 |
(SVOL = 1 or 2) : MinD<=40 : NSamp>=20 |
(SVOL = 1 or 2 or 3) and MinD<175 |
|
JETHRO_MAIN |
SVOL = 1 : MinD <=20 : NSamp >=80 |
(SVOL = 1 or 2) and MinD<=40 |
(SVOL = 1 or 2 or 3) and MinD<175 |
|
JETHRO_CENTRAL |
SVOL = 1 : MinD <=20 : SR >=0.7 |
(SVOL = 1 or 2) and MinD<=40 |
(SVOL = 1 or 2 or 3) and MinD<175 |
|
JETHRO_HW1 |
SVOL = 1 : MinD <=20 : NSamp >=80 |
(SVOL = 1 or 2) and MinD<=40 |
(SVOL = 1 or 2 or 3) and MinD<175 |
|
JETHRO_HW2 |
SVOL = 1 : MinD <=20 : SR >=0.7 |
(SVOL = 1 or 2) and MinD<=40 |
(SVOL = 1 or 2 or 3) and MinD<175 |
|
LIMA MAIN |
SVOL = 1 and MinD <=20 |
(SVOL = 1 or 2) and MinD<=40 |
(SVOL = 1 or 2 or 3) and MinD<175 |
|
LIMA_FWE |
SVOL = 1 and MinD <=20 |
(SVOL = 1 or 2) and MinD<=40 |
(SVOL = 1 or 2 or 3) and MinD<175 |
|
LIMA _HW |
SVOL = 1 and MinD <=20 |
(SVOL = 1 or 2) and MinD<=40 |
(SVOL = 1 or 2 or 3) and MinD<175 |
|
LIMA INTER |
SVOL = 1 and MinD <=20 |
(SVOL = 1 or 2) and MinD<=40 |
(SVOL = 1 or 2 or 3) and MinD<175 |
|
LIMA INTERS |
SVOL = 1 and MinD <=20 |
(SVOL = 1 or 2) and MinD<=40 |
(SVOL = 1 or 2 or 3) and MinD<175 |
|
SHEET MAIN |
SVOL = 1 : MinD <=20 : NSamp >=40 |
(SVOL = 1 or 2) and MinD<=40 |
(SVOL = 1 or 2 or 3) and MinD<175 |
|
SHEET SOUTH |
SVOL = 1 : MinD <=20 : NSamp >=40 |
(SVOL = 1 or 2) and MinD<=40 |
(SVOL = 1 or 2 or 3) and MinD<175 |
|
ARS EWL |
SVOL = 1 : MinD <=20 : SR >=0.7 |
(SVOL = 1 or 2) and MinD<=40 |
(SVOL = 1 or 2 or 3) and MinD<175 |
|
ARS HW |
SVOL = 1 : MinD <=20 : NSamp >=40 |
(SVOL = 1 or 2) and MinD<=40 |
(SVOL = 1 or 2 or 3) and MinD<175 |
|
ARS_FW |
SVOL = 1 : MinD <=20 : NSamp >=40 |
(SVOL = 1 or 2) and MinD<=40 |
(SVOL = 1 or 2 or 3) and MinD<175 |
|
ARS NSL |
SVOL = 1 : MinD <=20 : NSamp >=40 |
(SVOL = 1 or 2) and MinD<=40 |
(SVOL = 1 or 2 or 3) and MinD<175 |
|
ARS_EXT |
SVOL = 1 and MinD <=20 |
(SVOL = 1 or 2) and MinD<=40 |
(SVOL = 1 or 2 or 3) and MinD<175 |
|
ARS_EXT_990 |
SVOL = 1 and MinD <=20 |
(SVOL = 1 or 2) and MinD<=40 |
(SVOL = 1 or 2 or 3) and MinD<175 |
Caledonia Mining Corporation Plc
S-K 1300 Technical Report Summary on the Blanket Gold Mine, Zimbabwe
The minimum distance to samples measures the minimum distance to the nearest samples for a block being estimated. In mining areas, this distance is typically less than five to ten metres. The distance to samples increasing as you move further away from a mining area. The distance between sub-levels is typically 15.0 meters vertical so for Measured Resources, the area between two sub-levels can be classified as such. Indicated Resources would encompass up to three sub-levels while for Inferred, the criteria was relaxed, and the classification was extended for up to a maximum of 3X the variogram range for Inferred Resources to aid in long term planning. This is considered suitable for the Blanket orebodies as the geological and grade continuity observed from mined-out areas exhibits a strong trend. This is further enhanced by the continuity of the orebodies as evidenced informed by LHDP exploration drillholes. Therefore, there is sufficient confidence in geological continuity for Inferred Resources. No smoothing of the Mineral Resource classification boundaries has been undertaken and are reported as is. Comparative views of the Mineral Resource classification are provided in Figure 37 to Figure 49 below.
Figure 37: ARM Mineral Resource Classification
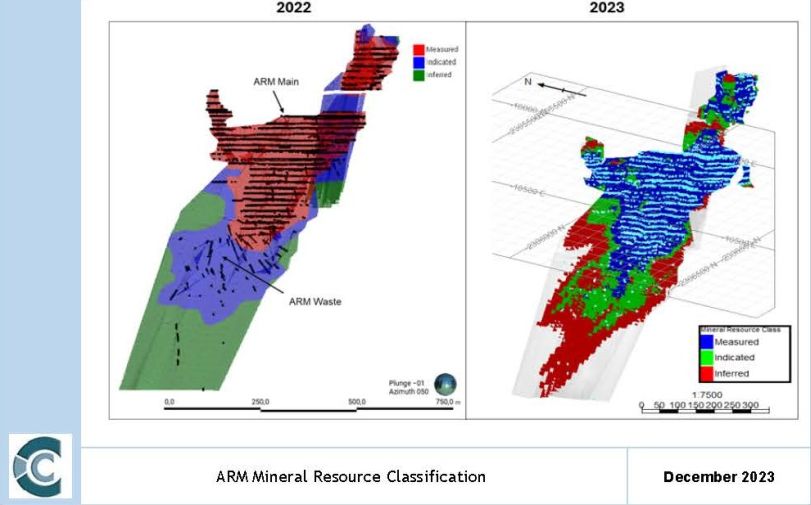
Caledonia Mining Corporation Plc
S-K 1300 Technical Report Summary on the Blanket Gold Mine, Zimbabwe
Figure 38: ARS Mineral Resource Classification (Including ARS_Ext)
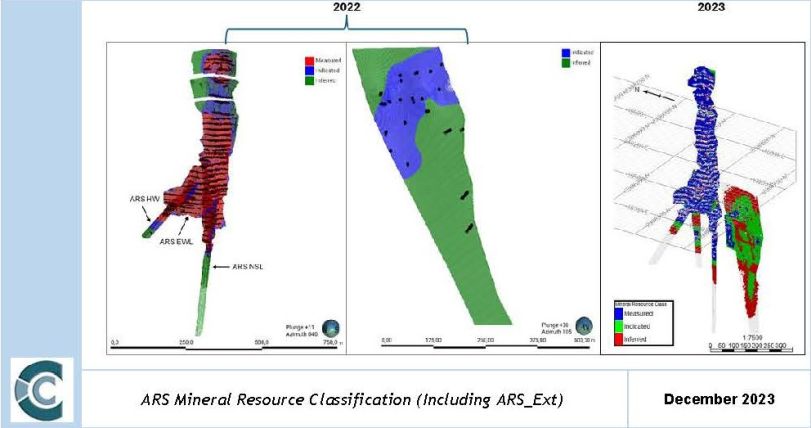
Caledonia Mining Corporation Plc
S-K 1300 Technical Report Summary on the Blanket Gold Mine, Zimbabwe
Figure 39: BLK1 Mineral Resource Classification
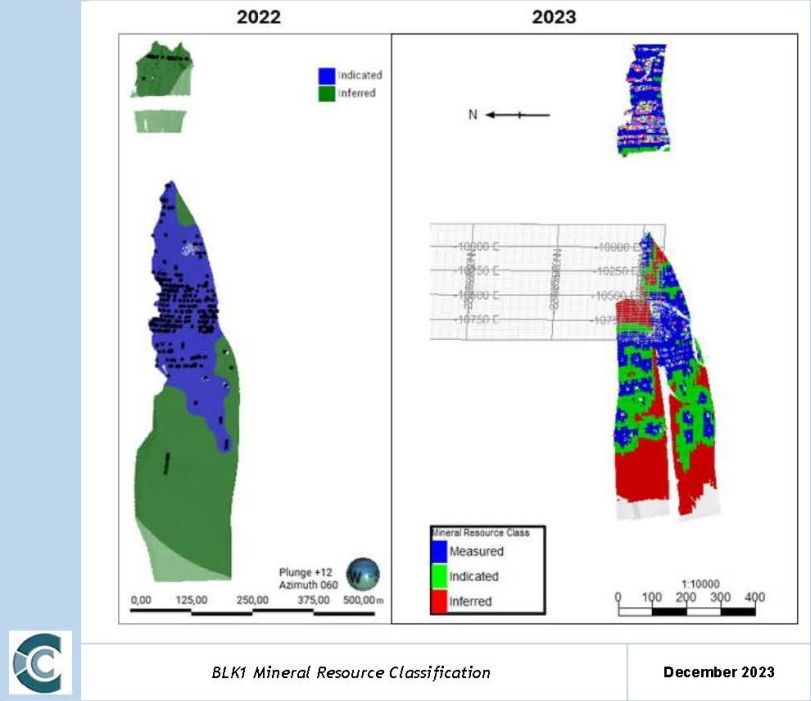
Caledonia Mining Corporation Plc
S-K 1300 Technical Report Summary on the Blanket Gold Mine, Zimbabwe
Figure 40: BLK2 Mineral Resource Classification
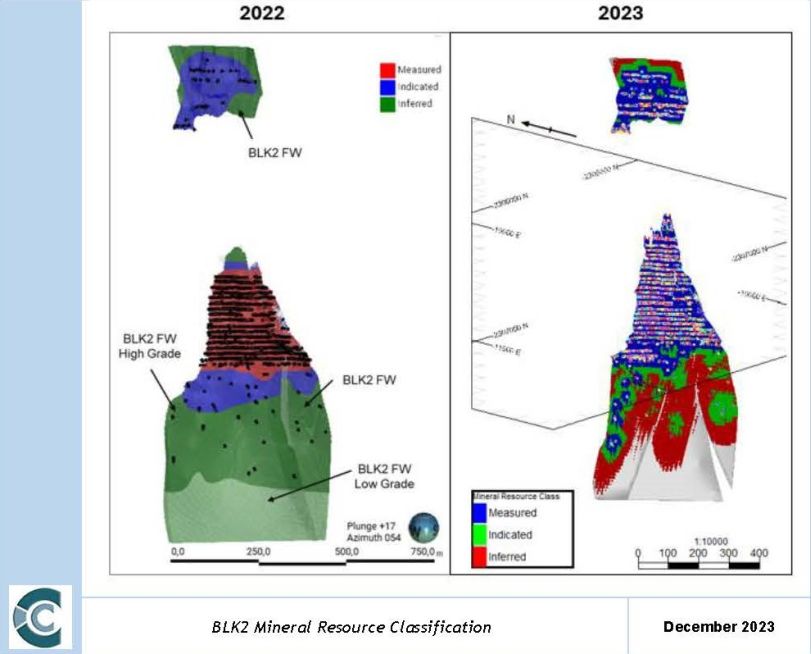
Caledonia Mining Corporation Plc
S-K 1300 Technical Report Summary on the Blanket Gold Mine, Zimbabwe
Figure 41: BLK3 Mineral Resource Classification
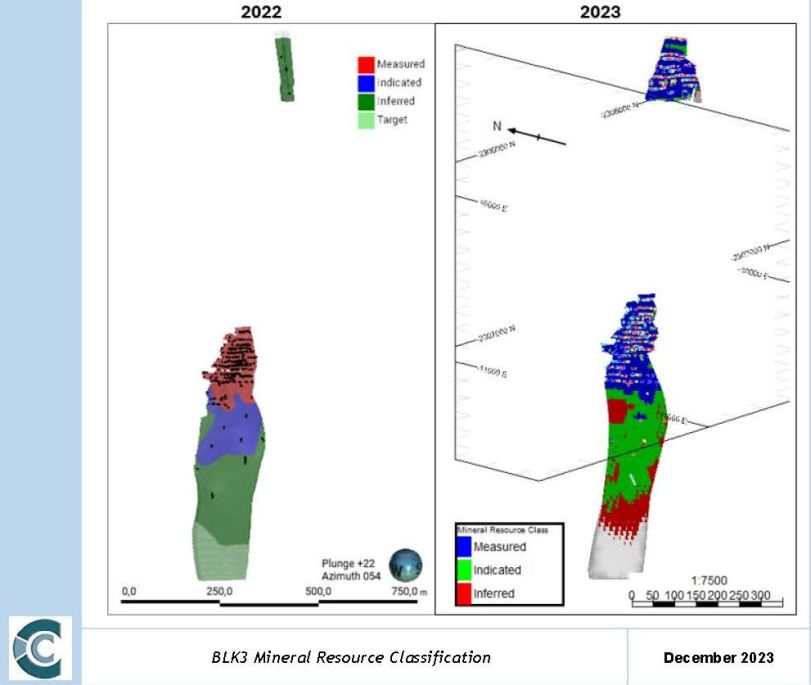
Caledonia Mining Corporation Plc
S-K 1300 Technical Report Summary on the Blanket Gold Mine, Zimbabwe
Figure 42: BLK4_5 Mineral Resource Classification
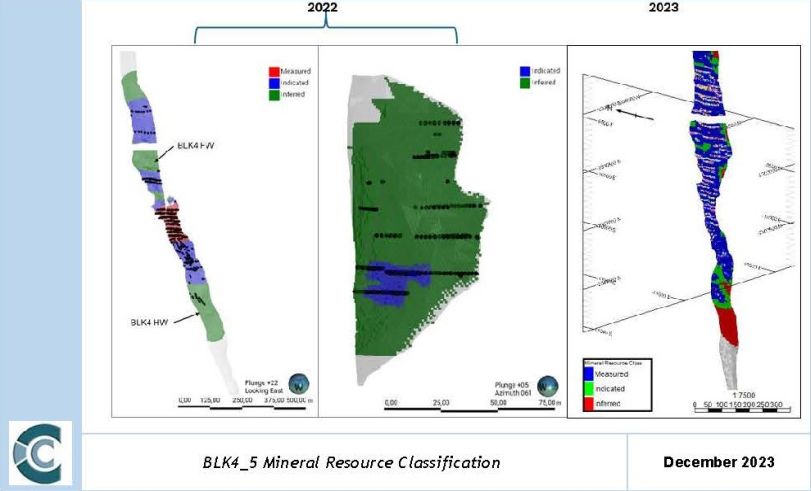
Figure 43: BLK6 Mineral Resource Classification
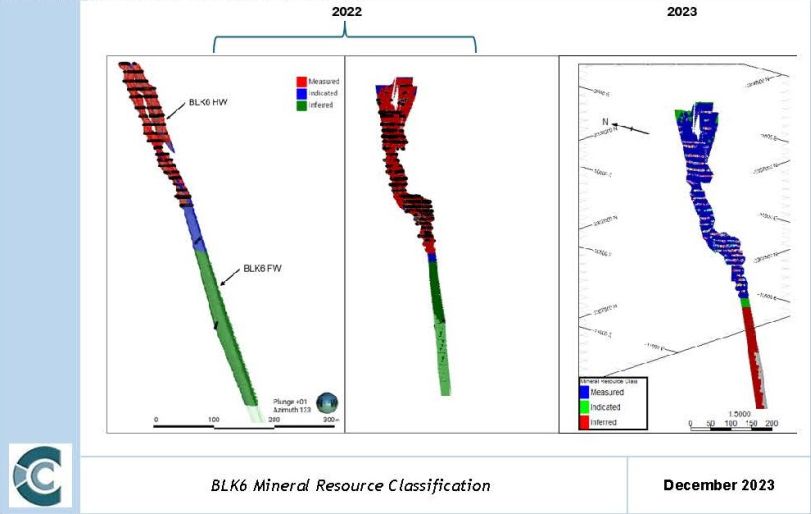
Caledonia Mining Corporation Plc
S-K 1300 Technical Report Summary on the Blanket Gold Mine, Zimbabwe
Figure 44: BF Mineral Resource Classification
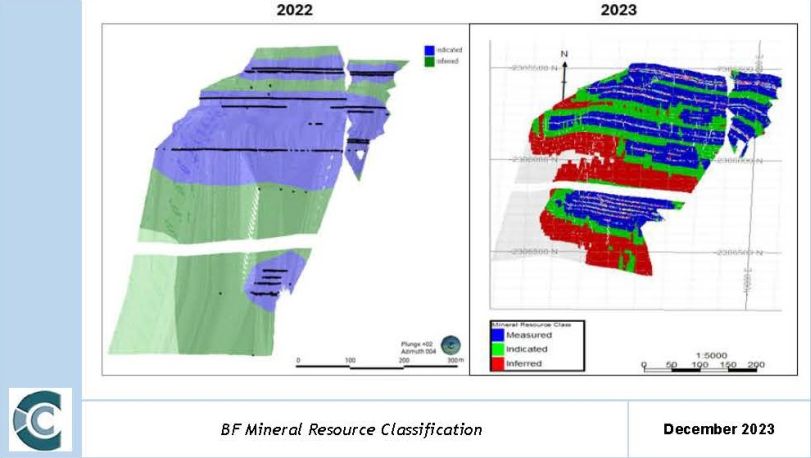
Figure 45: BQR Mineral Resource Classification
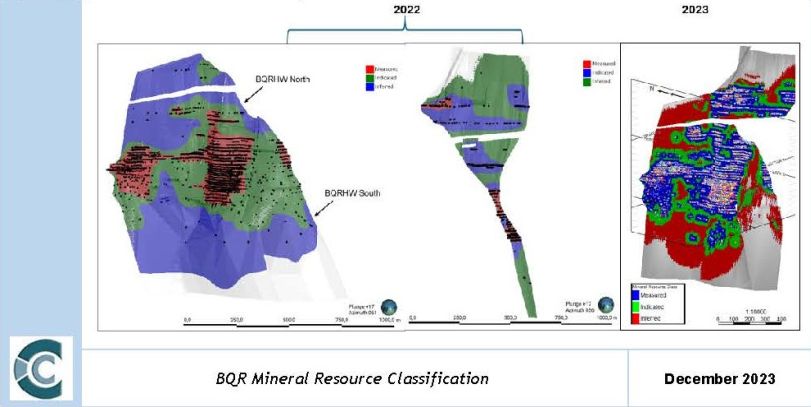
Caledonia Mining Corporation Plc
S-K 1300 Technical Report Summary on the Blanket Gold Mine, Zimbabwe
Figure 46: LIMA Mineral Resource Classification
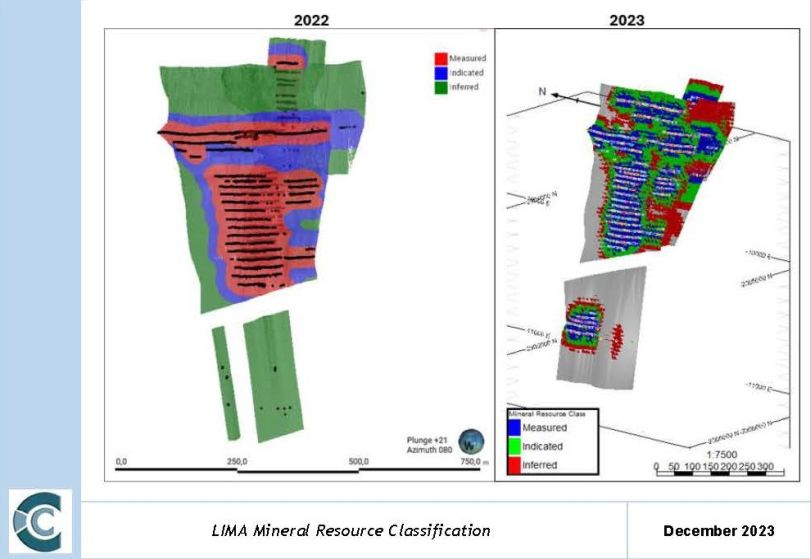
Caledonia Mining Corporation Plc
S-K 1300 Technical Report Summary on the Blanket Gold Mine, Zimbabwe
Figure 47: ERC Mineral Resource Classification
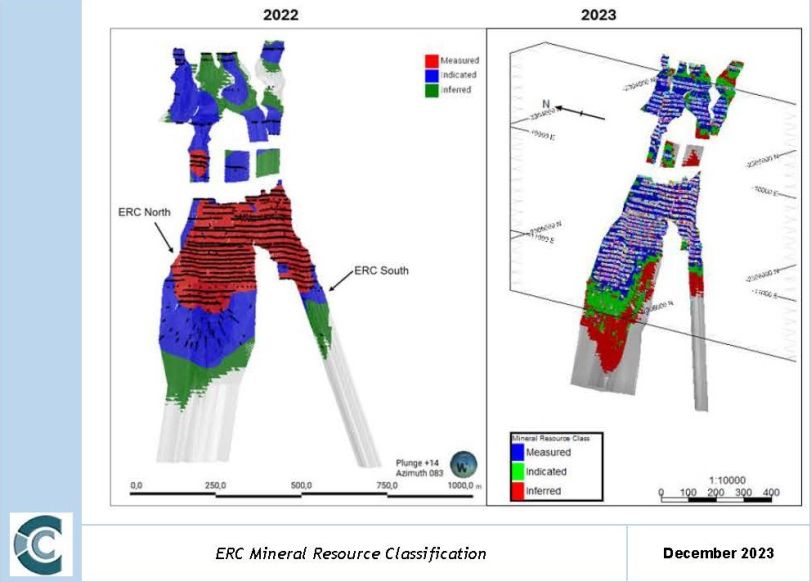
Caledonia Mining Corporation Plc
S-K 1300 Technical Report Summary on the Blanket Gold Mine, Zimbabwe
Figure 48: JTH Mineral Resource Classification
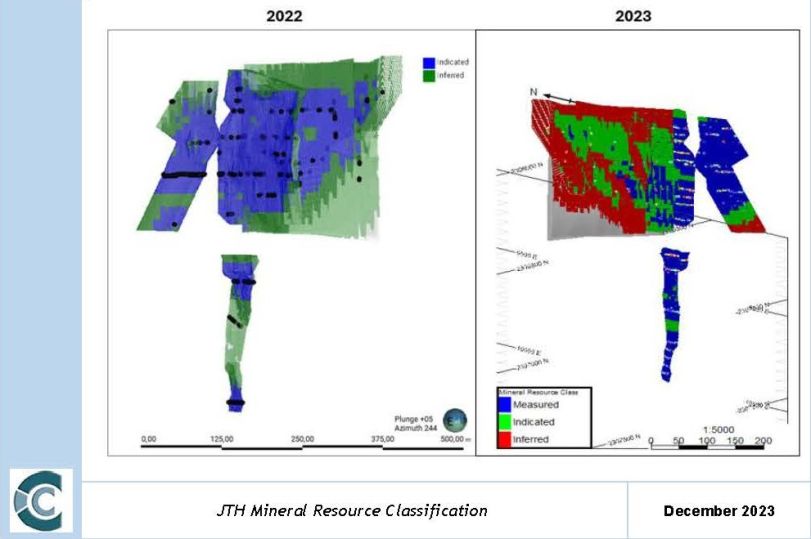
Caledonia Mining Corporation Plc
S-K 1300 Technical Report Summary on the Blanket Gold Mine, Zimbabwe
Figure 49: SHT Mineral Resource Classification
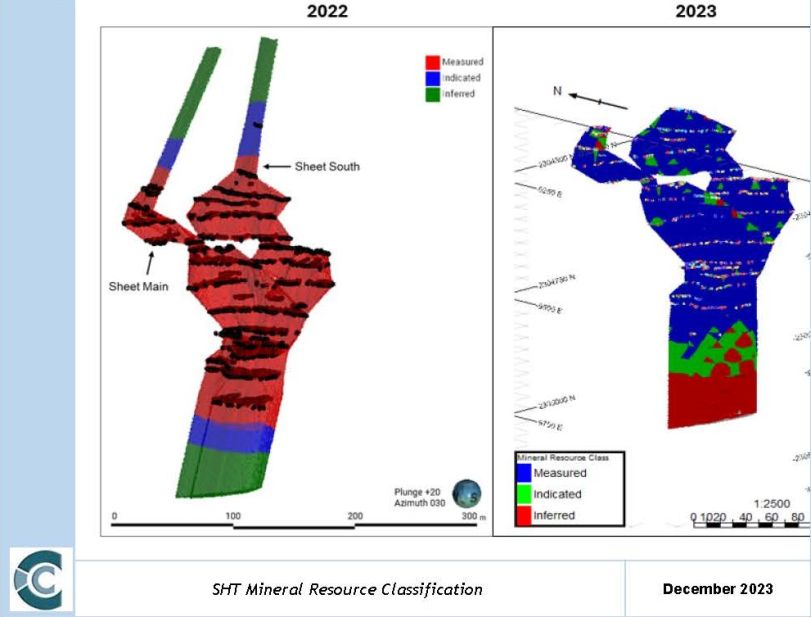
|
IV. |
MINERAL RESOURCE STATEMENT |
The Combined Measured and Indicated Mineral Resources, inclusive of Mineral Reserves, declared for the Blanket operations are shown in Table 18. The Inferred Resources, inclusive of Mineral Reserves, are shown in Table 19. Mineral Resources are stated as in situ.
A cut-off of 1.5 g/t is utilised for all Resource declarations. A geological loss of 0% for Measured and 5% for Indicated and Inferred was applied in 2022. For 2023, this has been modified to 2.5% for Measured, 5% for Indicated and 10% for Inferred respectively. The Measured losses has been added to account for potential survey errors in the mined-out workings, predominantly the older areas which are now inaccessible. The block models were depleted with current mining faces as of 31 December 2023.
Caledonia Mining Corporation Plc
S-K 1300 Technical Report Summary on the Blanket Gold Mine, Zimbabwe
Table 18: In Situ Measured and Indicated Mineral Resources for Blanket Mine as at 31 December 2023 (Inclusive of Mineral Reserves)
|
Mineral Resource Classification |
Orebody |
Tonnes |
Au Grade |
Gold Content |
|
Kt |
g/t |
Koz |
||
|
Measured (2.5% Geological Loss) |
ARM |
660 |
3.12 |
66 |
|
ARS |
514 |
3.62 |
60 |
|
|
ARS_Ext |
32 |
2.56 |
3 |
|
|
BF |
176 |
3.43 |
19 |
|
|
BLK1 |
261 |
3.43 |
29 |
|
|
BLK2 |
150 |
3.66 |
18 |
|
|
BLK3 |
180 |
3.41 |
20 |
|
|
BLK4_5 |
490 |
3.26 |
51 |
|
|
BLK6 |
49 |
3.78 |
6 |
|
|
BQR |
785 |
4.36 |
110 |
|
|
ERC |
303 |
5.21 |
51 |
|
|
Jethro |
53 |
3.11 |
5 |
|
|
Lima |
203 |
3.94 |
26 |
|
|
Sheet |
88 |
2.99 |
9 |
|
|
Measured Total |
3 943 |
3.72 |
471 |
|
|
Indicated (5.0% Geological Loss) |
ARM |
630 |
2.78 |
56 |
|
ARS |
437 |
3.48 |
49 |
|
|
ARS_Ext |
189 |
2.93 |
18 |
|
|
BF |
205 |
2.99 |
20 |
|
|
BLK1 |
663 |
3.21 |
68 |
|
|
BLK2 |
442 |
4.98 |
71 |
|
|
BLK3 |
189 |
2.91 |
18 |
|
|
BLK4_5 |
126 |
3.05 |
12 |
|
|
BLK6 |
27 |
3.99 |
4 |
|
|
BQR |
1 888 |
3.61 |
219 |
|
|
ERC |
593 |
4.76 |
91 |
|
|
Jethro |
288 |
3.34 |
31 |
|
|
Lima |
115 |
3.73 |
14 |
|
|
Sheet |
41 |
2.60 |
3 |
|
|
Indicated Total |
5 832 |
3.59 |
673 |
|
|
Measured + Indicated Total |
9 775 |
3.64 |
1 145 |
|
Notes:
|
1. |
Cut-off applied 1.5 g/t. |
|
2. |
2.5% Geological loss applied for Measured, 5% for Indicated and 10% for Inferred. |
|
3. |
Gold price: USD2,150/oz. |
|
4. |
Mineral Resources are stated inclusive of Mineral Reserves. |
|
5. |
Mineral Resources are reported as 64% attributable to Caledonia. |
|
6. |
All orebodies are depleted for mining. |
Caledonia Mining Corporation Plc
S-K 1300 Technical Report Summary on the Blanket Gold Mine, Zimbabwe
Table 19: In Situ Inferred Mineral Resources for Blanket Mine as of 31 December 2023 (Inclusive of Mineral Reserves)
|
Mineral Resource Classification |
Orebody |
Tonnes |
Au |
Ounces |
|
Inferred |
Kt |
g/t |
Koz |
|
|
ARM |
299 |
2.87 |
28 |
|
|
ARS |
170 |
3.88 |
21 |
|
|
ARS_Ext |
68 |
3.48 |
8 |
|
|
BF |
150 |
3.05 |
15 |
|
|
BLK1 |
871 |
3.20 |
90 |
|
|
BLK2 |
584 |
4.91 |
92 |
|
|
BLK3 |
73 |
3.33 |
8 |
|
|
BLK4_5 |
269 |
3.32 |
29 |
|
|
BLK6 |
83 |
3.57 |
10 |
|
|
BQR |
1 900 |
3.71 |
227 |
|
|
ERC |
928 |
4.30 |
128 |
|
|
Jethro |
108 |
3.28 |
11 |
|
|
Lima |
95 |
3.41 |
10 |
|
|
Sheet |
47 |
2.52 |
4 |
|
|
Inferred Total |
5 646 |
3.74 |
679 |
|
Notes:
|
1. |
Cut-off applied 1.5 g/t. |
|
2. |
2.5% Geological loss applied for Measured, 5% for Indicated and 10% for Inferred. |
|
3. |
Gold price: USD2,150/oz. |
|
4. |
Mineral Resources are stated inclusive of Mineral Reserves. |
|
5. |
Mineral Resources are reported as 64% attributable to Caledonia. |
|
6. |
All orebodies are depleted for mining. |
The Combined Measured and Indicated Mineral Resources, exclusive of Mineral Reserves, declared for the Blanket operations are shown in Table 20.
Caledonia Mining Corporation Plc
S-K 1300 Technical Report Summary on the Blanket Gold Mine, Zimbabwe
Table 20: In Situ Measured and Indicated Mineral Resources for Blanket Mine as at 31 December 2023 (Exclusive of Mineral Reserves)
|
Mineral Resource Classification |
Orebody |
Tonnes |
Au Grade |
Gold Content |
|
Kt |
g/t |
Koz |
||
|
Measured (2.5% Geological Loss) |
ARM |
653 |
3.12 |
66 |
|
ARS |
329 |
3.70 |
39 |
|
|
ARS_Ext |
11 |
1.83 |
1 |
|
|
BF |
89 |
3.58 |
10 |
|
|
BLK1 |
136 |
3.74 |
16 |
|
|
BLK2 |
148 |
3.66 |
17 |
|
|
BLK3 |
109 |
3.44 |
12 |
|
|
BLK4_5 |
194 |
3.85 |
24 |
|
|
BLK6 |
48 |
3.79 |
6 |
|
|
BQR |
482 |
4.31 |
67 |
|
|
ERC |
208 |
4.93 |
33 |
|
|
Jethro |
53 |
3.11 |
5 |
|
|
Lima |
151 |
3.64 |
18 |
|
|
Sheet |
88 |
2.99 |
9 |
|
|
Measured Total |
2 700 |
3.72 |
323 |
|
|
Indicated (5.0% Geological Loss) |
ARM |
475 |
2.68 |
41 |
|
ARS |
337 |
3.13 |
34 |
|
|
ARS_Ext |
50 |
2.31 |
4 |
|
|
BF |
103 |
3.04 |
10 |
|
|
BLK1 |
232 |
3.19 |
24 |
|
|
BLK2 |
228 |
3.86 |
28 |
|
|
BLK3 |
66 |
2.45 |
5 |
|
|
BLK4_5 |
70 |
2.99 |
7 |
|
|
BLK6 |
17 |
4.17 |
2 |
|
|
BQR |
711 |
3.45 |
79 |
|
|
ERC |
144 |
4.69 |
22 |
|
|
Jethro |
177 |
2.82 |
16 |
|
|
Lima |
74 |
3.44 |
8 |
|
|
Sheet |
41 |
2.60 |
3 |
|
|
Indicated Total |
2 726 |
3.23 |
283 |
|
|
Measured + Indicated Total |
5 426 |
3.47 |
606 |
|
Notes:
|
1. |
Cut-off applied 1.5 g/t. |
|
2. |
2.5% Geological loss applied for Measured, 5% for Indicated and 10% for Inferred. |
|
3. |
Gold price: USD2,150/oz. |
|
4. |
Mineral Resources are stated exclusive of Mineral Reserves. |
|
5. |
Mineral Resources are reported as 64% attributable to Caledonia. |
|
6. |
All orebodies are depleted for mining. |
Inferred Mineral Resources inclusive and exclusive of Mineral Reserves are the same as there are no inferred Mineral Resources in the Mineral Reserve.
Caledonia Mining Corporation Plc
S-K 1300 Technical Report Summary on the Blanket Gold Mine, Zimbabwe
Item 11 (b) – INDIVIDUAL GRADE OF METALS
Mineral Resources for gold have been estimated for the Blanket Gold Mine. No other metals or minerals have been estimated for the Project.
Item 11 (c) – FACTORS AFFECTING MINERAL RESOURCE ESTIMATES
No socio-economic, legal, or political modifying factors have been taken into account in the estimation of Mineral Resources for Blanket Mine. QPs are not aware of any known environmental, permitting, legal, title, taxation, socio-economic, marketing, and political or other factors that will materially affect the Mineral Resource estimates.
All underground Mineral Resources are stated at a cut-off grade 1.5 g/t.
Caledonia has operated the Blanket Mine successfully for several years and understands the Zimbabwean mining environment and as such eliminated any risk to a large degree and hence the QPs are of the opinion that the factors affecting the Mineral Resource have been considered.
It is imperative that Blanket Mine proceed with resource conversion drilling to replace the higher grade measured and indicated Mineral Resources that have converted to Mineral Reserves by converting the higher grade Inferred Mineral Resources to Indicated Mineral Resources.
ITEM 12 – MINERAL RESERVE ESTIMATES
Item 12 (a) – KEY ASSUMPTIONS, PARAMETERS AND METHODS
The LoM planning was completed in line with current operational planning to produce in the range of 74 - 80 koz of gold per year. Only diluted Indicated and Measured Resources in the LoM plan were considered for conversion to Mineral Reserves. LoM as referred to in this TRS is as of 31 December 2023.
Inferred Mineral Resources have been excluded from the economic assessment for Mineral Reserve estimates. The LoM plan aims to produce in the range of 68 - 72 koz of gold per year from Measured and Indicated Mineral Resources only.
The LoM plan was developed utilising the 3D Mineral Resource model estimates as reviewed and updated by the QPs. The Mineral Resource classifications were incorporated from the 2023 Mineral Resource estimate. The mine design and scheduling utilise the updated 2023 Mineral Resource model.
|
I. |
STOPE DESIGN METHODOLOGY |
Blanket mine made use of the geological wireframes to create the stope shapes utilised in the LoM design process. Each orebody was segmented horizontally on existing ROM and capital intersecting ends, where no existing ends were found the orebody wireframes were segmented at 15 meters intervals. Along strike these orebody wireframes were segmented at 10 m with the width represented by the full width of the orebody wireframes. Areas where the width of the orebody was less than 1.8 m (width of sub-drives), these stopes were manually modified to a width of 1.8 m.
Evaluation was run on all segmented stopes utilising block models provided by Minxcon, legends were applied to identify stopes above cut-off grade (2.1 g/t), marginal (1.5 g/t - 2.1 g/t) and low grade (<1.5g/t). To identify areas to be mined, each block was investigated on its own merit, where a block consists of the unique lists of orebodies and tramming levels. Marginal stopes were introduced where practical mining dictated necessary.
Caledonia Mining Corporation Plc
S-K 1300 Technical Report Summary on the Blanket Gold Mine, Zimbabwe
|
II. |
CUT-OFF GRADE |
The cut-off grade calculation for the Blanket Mine is detailed in Table 21.
Table 21: Cut-Off Grade Calculation
|
Description |
Unit |
Value |
|
Gold Price |
USD/oz |
1,877 |
|
Dilution |
% |
8 |
|
Mine Call Factor |
% |
100 |
|
Recovery |
% |
93.6 |
|
Metal price |
USD/g |
60.35 |
|
Total Operating Cost |
USD/t |
96 |
|
Cut-off Grade (calculated) |
g/t |
1.62 |
|
Reserve Cut-off Grade (in use) |
g/t |
2.10 |
Blanket Mine utilises a 2.1 g/t planning cut-off grade. The mine design and schedule were completed using the accepted 2.1 g/t cut-off grade.
|
III. |
MODIFYING FACTORS |
Mineral Reserve conversion factors are the consideration of mining factors used to convert Mineral Resources to Mineral Reserves. These factors are applied to adjust the in situ Mineral Resources in the LoM planning to realistic and accurate mill feed, volumes, and grade. The Mineral Reserve conversion factors applied to the Mineral Resources in the LoM plan, are detailed in Table 22.
Table 22: Mineral Reserve Conversion Factors Summary
|
Description |
Unit |
Value |
|
Geological Losses |
||
|
Measured |
% |
2.5 |
|
Indicated |
% |
5 |
|
Inferred |
% |
10 |
|
Other Dilution Factors |
||
|
Pillar Extraction |
% |
50 |
|
Dilution |
% |
8 |
|
Mine Call Factor |
% |
100 |
The following additional factors were considered:
|
● |
Processing and Metallurgical: The conventional CIL recovery method is well proven and has been used consistently on this orebody. The recovery used was 93.6% and no other metallurgical factors are known that may impact the Mineral Reserve. |
|
● |
Infrastructure: Infrastructure required for the planned production is either in place or planned for. Sufficient capital provision has been made for all planned infrastructure required for the planned production. |
|
● |
Economic and Marketing: The gold price that has been utilised for the Mineral Reserve estimate is a real term forecast taken as the median of various bank and analyst forecasts. The average gold price over the LoM is USD1,877/oz. An uneconomical tail has been cut from the first negative cashflow year based Measured and Indicated Mineral Resources and has been excluded from the Mineral Reserve. The tail contains 212.5 koz of gold and runs for 6 years but is not economically viable on its own. |
|
● |
Legal, Environmental, Social and Governmental: There are no legal, environmental, social or governmental factors that are deemed to be classified as modifying factors applied to the Mineral Reserves. |
Caledonia Mining Corporation Plc
S-K 1300 Technical Report Summary on the Blanket Gold Mine, Zimbabwe
|
IV. |
MINERAL RESOURCE TO MINERAL RESERVE CONVERSION |
All Mineral Reserves have been categorised and reported in accordance with the guidelines of §229.1302(e)(2) of S-K 1300. Only Indicated and Measured Resources in the LoM plan were considered for conversion to Mineral Reserves. Inferred Mineral Resources have been excluded from the LoM plan for economic assessment for Mineral Reserve estimates. Only diluted Measured and Indicated Mineral Resources have been converted into Proven and Probable Mineral Reserves, respectively. Mineral Reserves have been reported separately in the Proven and Probable Mineral Reserve categories. Inferred Mineral Resources have not been incorporated with the Proven and Probable Mineral Reserves.
The Mineral Resources as estimated by the QP as of 31 December 2023 were utilised for the updated 2023 Mineral Reserve estimation. The QP has depleted the 31 December 2023 Mineral Resources with updated mining faces to the period ending 31 December 2023.
The depleted Mineral Resources as of 31 December 2023, was utilised with the 2023 LoM plan as detailed in Item 13 (b). The QP utilised the 31 December 2023 LoM plan with the depleted Mineral Resources to conduct an updated Mineral Reserve estimation, which accounts for the mining depletions from 31 December 2023.
A new mine design and schedule was conducted for the Mineral Reserve estimation as of 31 December 2023 as illustrated in Figure 50.
Figure 50: Diluted Life of Mine Production Schedule by Mineral Resource Classification (2023)
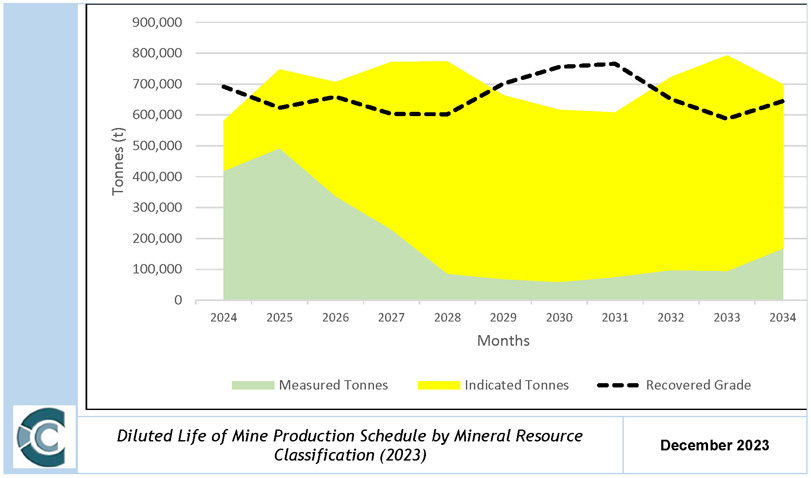
The updated attributable Mineral Reserve estimation as of 31 December 2023, is detailed in Table 23. Mineral Reserves are stated as delivered to plant.
Caledonia Mining Corporation Plc
S-K 1300 Technical Report Summary on the Blanket Gold Mine, Zimbabwe
Table 23: Blanket Mine Mineral Reserve Estimate as at 31 December 2023
|
Mineral Reserve Classification |
Tonnes |
Grade |
Au Content |
|
|
Kt |
g/t |
Kg |
Koz |
|
|
Proven |
1 363 |
3.21 |
4 377 |
141 |
|
Probable |
3 555 |
3.31 |
11 782 |
379 |
|
Total |
4 918 |
3.29 |
16 158 |
519 |
Notes:
|
1. |
Mineral Reserve cut-off of 2.1 g/t applied. |
|
2. |
The gold price that has been utilised in the economic analysis to convert diluted Measured and Indicated Mineral Resources in the LoM plan to Mineral Reserves is an average real term price of USD1,877/oz over the LoM, using the forecast prices as per Economic Analysis. |
|
3. |
The Mineral Reserve estimation utilises the depleted 2023 Mineral Resource estimation and the 2023 mine design and LoM plan. |
|
4. |
Mineral Reserves are reported as 64% attributable to Caledonia. |
|
5. |
Totals may not add due to rounding. |
Mineral Resources from the Measured and Indicated Mineral Resource Classifications were converted into Proven and Probable Mineral Reserves. The attributable Blanket Mine Mineral Reserve estimate consists of 27% Proven and 73% Probable Mineral Reserves on a gold content basis.
Item 12 (b) – MULTIPLE COMMODITY RESERVE
Gold is the only commodity within the Blanket mining areas that is present in significant concentrations.
Item 12 (c) – FACTORS AFFECTING MINERAL RESERVE ESTIMATION
No socio-economic, legal or political modifying factors have been taken into account in the estimation of Mineral Reserves for the Blanket Mine. The QPs are not aware of any known environmental, permitting, legal, title, taxation, socio-economic, marketing, and political or other factors that will materially affect the Mineral Reserve estimates. No material issues have been identified for the Blanket Mine.
The Mineral Reserve conversion factors detailed in Table 22 have been applied to the Mineral Resource for conversion to Mineral Reserves. The classification of Mineral Reserves can be affected by changes in the status of the factors. In particular, the gold price will affect the viability of the mineralised target.
An uneconomical tail has been cut from the first negative cashflow year and has been excluded from the Mineral Reserve. The tail contains 212.5 koz of gold but is not economically viable on its own.
ITEM 13 – MINING METHODS
There are two mining approaches currently employed at Blanket mine namely the Mechanized Mining approach which utilizes the Decline system and trackless mobile machinery, and the Conventional mining method which utilizes track bound equipment. The mechanized mining method utilizes decline development to access lower orebodies in a top-down approach contrary to the normal bottom-up approach which is dependent on shaft sinking. In this method declines are developed at a gradient of –9 degrees in the footwall of the orebody over a 120m lift. At every 15m height interval, access cross-cuts are developed to intersect the orebody.
The subsequent intra-orebody development will be used to define orebody strike extent at each 15m interval. Normal link up raise system will also be developed and will comprise of cut off and ventilation raises serving the Decline area. Main level extraction haulage will be developed at the lowest level of the 120m lift to facilitate draw point crosscut and raise development for subsequent coning and production mining. Mid-level extraction haulage can also be developed on the 4th level of the 120m lift to facilitate draw point crosscut and raise development for subsequent coning and production mining.
Caledonia Mining Corporation Plc
S-K 1300 Technical Report Summary on the Blanket Gold Mine, Zimbabwe
The Decline system utilizes trackless mobile mining equipment such as Dump trucks and LHDs. In Figure 51 below a basic layout of the mechanized mining method is displayed. Stoping is then done on the sublevel above the coning level through the creation of the slot at the ore pass raise immediately above and then subsequently carrying out stoping using either long hole or conventional underhand.
Figure 51: Extraction Method: LH Mechanized
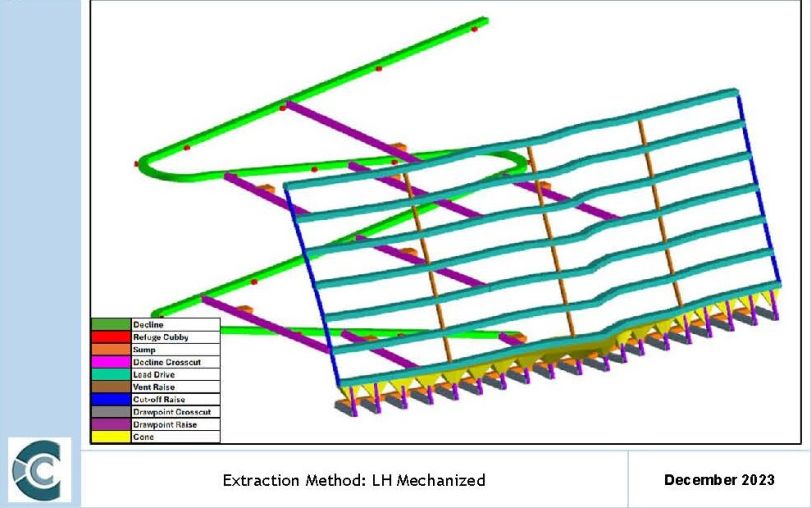
In the conventional mining approach, the bottom-up approach is used and main level development is done at 120m intervals as illustrated Figure 52. The main haulages are developed in the footwall to access the major orebodies of the mine. The orebodies are accessed from the main haulage via extraction haulages which facilitates exploitation of the ore from the respective orebodies.
Most of the extraction haulages are developed to the footwall of the orebody at a minimum distance of 15.0m. Draw point crosscuts at 15m and 20m (depth and rock type dependant) intervals along strike are developed to access the relevant orebody. Draw point raises reaching the next sublevel will be developed to facilitate coning for production. Sublevel drive development in the Blanket mine setup is done within the confines of the orebody. The Sublevel drives are developed at either 10m or 15m intervals and are interlinked by a system of raises namely travelling way, ore pass, slot, and cut off raises. This series of raises is mined to a vertical distance of 120 meters and ultimately provides link between the lower and upper main levels of the respective block.
Each block will be defined by travelling way and ore pass raises separated by 60m while ore pass, and waste pass raise distances will be at 10-15 m depending on sublevel interval distance. Production mining commences through establishment of cones on the sublevel immediately above the main level. Stoping is then done on the sublevel above the coning level through the creation of the slot at the ore pass raise immediately above and then subsequently carrying out stoping using either long hole or conventional underhand.
Caledonia Mining Corporation Plc
S-K 1300 Technical Report Summary on the Blanket Gold Mine, Zimbabwe
Figure 52: Extraction Method: Underhand
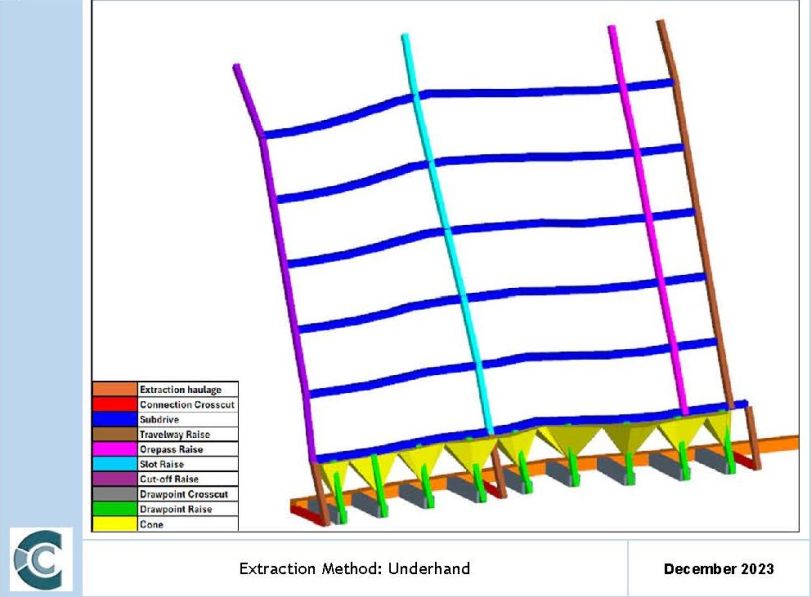
|
a. |
Long-hole Stoping |
Blanket mine uses long-hole stoping in the orebodies with a width greater than 3 m. It can also be applied in instances where the geotechnical challenges such as jointing and faulting are experienced to be mined using conventional underhand stoping method. Long-hole stoping is a selective and highly productive mining method that provides good ore recovery. The method is flexible and allows for practical modifications to the mining sequence and configuration to suit the characteristics of the orebody. A schematic layout is provided in Figure 53.
Long Hole drilling entails using drifter machines to drill holes which cover the full span of the sublevel interval and then blasting them. When the block has been delineated and made ready for production mining cones are created at the lowermost level above the main extraction haulage. These cones will be linked to the draw point system established at the main level. Once the third cone has been established a slot is then created on the sublevel immediately above the coning level, which opens the sub drive face for subsequent drilling and blasting. Holes parallel to the slot face spanning the full length of the sublevel interval are then drilled and depending on the width of the slot will make up what is known as a ring. These holes are then blasted after completion and this cycle will continue until the full strike of the orebody on the sublevel is exhausted. Long hole drilling and blasting is done in a vertical retreat fashion maintaining a lead 72-degree angle between the lower and upper stopes, with lead lags not more than 10m between panels where ground conditions allow.
Caledonia Mining Corporation Plc
S-K 1300 Technical Report Summary on the Blanket Gold Mine, Zimbabwe
It is an overhand, vertical stoping method utilising drifter machines for long-hole drilling and blasting carried out from sub-levels. Mining the orebody creates a void or “open-stope” that is unsupported, however sill pillars are left between tramming haulage levels and Dip pillars along strike for regional support. Figure 94 illustrates a schematic of the long-hole stoping mining method.
To access the orebody, crosscuts are developed from the tramming haulage to the extraction haulage which is located approximately 20 m from the orebody. Draw point crosscuts are developed at 15 m intervals along the extraction haulage at 990m level and above while below 990m level a 20m interval spacing is utilized which provide access to the draw points. A twin raise system is developed upwards to establish a sliping point for the development of the sub-drive. One raise serves as an access raise, while the other serves as an ore pass to handle ore from the sub-drive development. The twin raise system is developed from one sub-drive to the next for the entire 120 m or 60 m lift.
Coning is done from the coning level and can only commence once sufficient raises for access and ore handling have been developed and holed into the sub-drive. Once coning starts, the raise can no longer be used as an access way. As a rule of thumb, three cones are established before any production may commence.
Production drilling is done in a retreat fashion from the orebody limit and drilling is done top down with Seco 36 drifter machines. The use of mechanical props and mesh as a temporary support iare used to safeguards the workers during the drilling process. Depending on production requirements, multiple sub-levels may be mined simultaneously. The orebody width will ultimately determine the width of the stoping panel.
Ore will then be extracted from the stope drawpoints via the lower extraction haulage using mechanical loaders or mechanized machinery. The ore is then loaded onto granby cars or dump trucks for transportation to the station orepasses.
Caledonia Mining Corporation Plc
S-K 1300 Technical Report Summary on the Blanket Gold Mine, Zimbabwe
Figure 53: Schematic Representation of Long-hole Stoping Mining Method
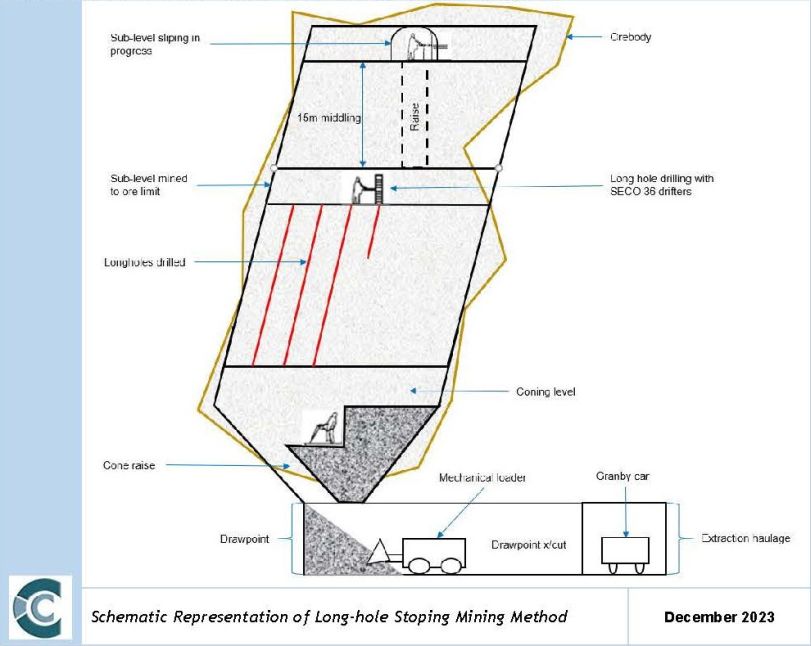
|
b. |
Underhand Stoping |
Conventional underhand stoping is used in orebodies with a width less than 3 m. Underhand stoping is particularly suitable for steeply dipping, narrow orebodies and allows for better control of the stoping width and dilution. The sublevel spacing and coning arrangement is similar to the long hole mining approach, the only difference is that in the conventional underhand the extraction haulage can be established within the orebody.
Box raises are established instead of draw points in instances where the extraction haulage only services a single orebody and will have no interference with tramming from other orebodies. Once box raises have been established coning can take place on the coning sublevel. A slot is created on the sublevel above the coning level once the third cone has been established. Underhand jackhammer drilling and blasting cycle commences once slot has been created and temporary support are installed. Whereas in long hole the holes cover the full span of the sublevel in underhand drilling 2m bench lifts are drilled and blasted at each cycle until the bench holes onto the sublevel below and the sequence continues over the strike of the orebody panel until it is exhausted.
Retreat direction on a panel is dependent on the number of slot -raises established within the panel. In some cases in a 60-70m panel, a slot raise system is established midway which allows for retreat from the central slot is two directions.
Caledonia Mining Corporation Plc
S-K 1300 Technical Report Summary on the Blanket Gold Mine, Zimbabwe
Stoping preparations commence by mining ore handling raises at 15 m intervals along the extraction haulage from the footwall of the orebody. Development within the orebody is the same as in the long-hole stoping sections, with the difference being that boxes can be mined instead of draw points.
Upon establishment of sufficient ore handling raises, production commences with sliping around the ore handling raise to establish faces. Mining is done in both directions on strike with one face leading the other. Extreme end raises are equipped to serve as access raises for men, material and ventilation. The lower level is equipped with boxes at set intervals from which ore will be drawn. A schematic representation of the mining method is illustrated in Figure 54.
Figure 54: Schematic Representation of Underhand Stoping Mining Method
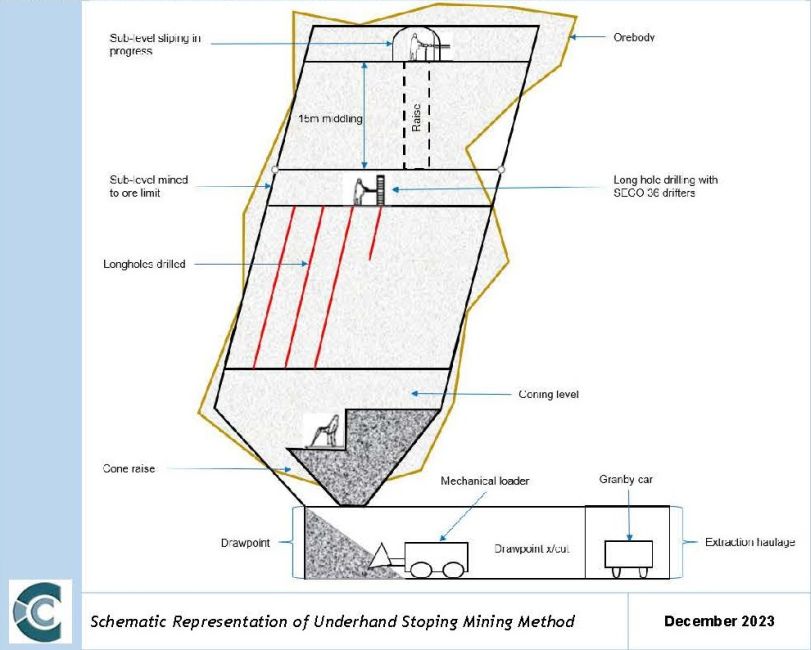
The sequence is repeated and as the stope extends horizontally, new stopes are established to maintain the required production rates. The stope is mined up to the extents of the orebody.
Item 13 (a) – PARAMETERS RELEVANT TO MINE DESIGN
|
I. |
GEOTECHNICAL AND HYDROLOGICAL PARAMETERS |
Rock Engineering, Geotechnical and Hydrological Parameters
Blanket Mine has employed a rock engineering department as of February 2020 for the required geotechnical inspections and designs of the underground workings. All legal appointments pertaining to rock engineering requirements are in place. The geotechnical model for Blanket Mine is being revised & with this in mind support standards are continually reviewed and rock mechanics recommendations for the current mining operations are in place.
Caledonia Mining Corporation Plc
S-K 1300 Technical Report Summary on the Blanket Gold Mine, Zimbabwe
Rock mass conditions are simulated with Flack 3D numerical modelling program on a quarterly basis and were deemed necessary. Rock strength testing that was conducted by Groundwork consulting and laboratory testing done by Rock lab in South Africa to gain a better understanding of the rock mass failure mechanisms. The poisons ratio, Youngs modulus, friction angles and intact rock strengths were tested and is now followed up with intact rock strength and core samples being tested with point load tested on mine to corelate and indicate anomalies for the use in new layouts and designs. New geotechnical information is gained via borehole logging and mapping by the geological department and placed on plans and into the electronic model. A hydrological area was intersected at 850 level which halted the development area where 46l/hr was measured and was drained successfully which enabled development to continue. Rock engineering work has been conducted for the newly targeted mining areas below 1,100m Level. The studies and work associated with these parameters will be addressed by the rock engineering department as data is generated and access is obtained through development. This will further inform the geotechnical model which will be constructed as information become available and be placed into the electronic model.
Two secondary support crews have been trained by specialist in the installation of wire-mesh, lacing, gunniting and mechanical anchors. They are deployed to planned areas where high stresses are expected from the numerical modelling or in life of mine excavations to safeguard the areas for the future accesses.
Underground Access, Ore Flow and Material Handling
The Blanket Mine consists of several small shafts that provide access to the various orebodies in which mining operations take place. With CMS being completed, it now provides access to Mineral Resources from 750 m Level down to 1,110 m Level. Mining activities will be focused on Mineral Resources below 750 m Level. Production below 1110 m Level is planned to be accessed through declines from the respective mining areas. The hoisting capacity and current utilisation of the shafts are detailed in Table 24.
Caledonia Mining Corporation Plc
S-K 1300 Technical Report Summary on the Blanket Gold Mine, Zimbabwe
Figure 55: Blanket Mine Shaft Infrastructure
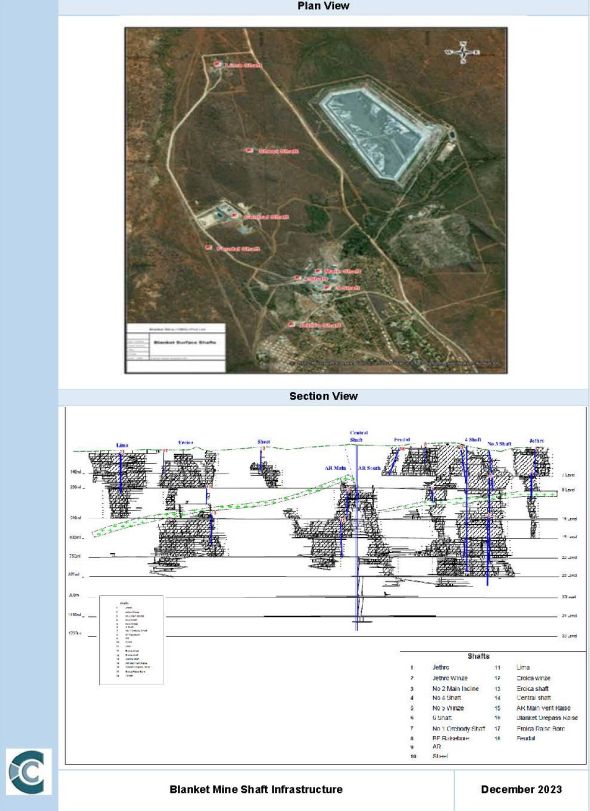
Caledonia Mining Corporation Plc
S-K 1300 Technical Report Summary on the Blanket Gold Mine, Zimbabwe
Table 24: Shaft Utilisation and Hoisting Capacity
|
Shaft |
Access Description |
Utilisation |
Hoisting Capacity |
|
Central Shaft |
Surface to 35 Level |
Ore, men and material |
2 x 10 tonne skips |
|
No. 4 Shaft |
Surface to 22 Level |
Ore and material |
2 x 6 tonne skips |
|
Jethro Shaft |
Surface to 7 Level |
Men and material |
Single deck cage |
|
Lima Shaft |
Surface to 8 Level |
Ore, men and material |
1 x 1 tonne skip |
|
Incline Shaft |
Surface to 7 Level |
Material |
1 x 2 tonne skip |
|
5 Winze |
7 Level to 22 Level |
Men and material |
Double deck cage |
|
Eroica Shaft |
14 Level to 18 Level |
Ore, men and material |
1 x 1.5 tonne skip |
|
No. 6 Shaft |
22 Level to 26 m Level |
Ore, men and material |
2 x 3 tonne skip |
|
II. |
VENTILATION |
Blanket Mine ventilation system is designed with common intakes and several exhaust shafts. Intake air is directed to the lowest active mining workings where the air then ascends along the working faces to the main returns by means of Natural Ventilation Pressure (NVP) and mechanical ventilation.
The majority intake air is through Central Shaft and distributed via 22,26,30,34 and 35 Level to the workings, with additional intakes from Jethro Shaft.
The mechanised decline sections are ventilated mechanically with force exhaust overlap system, and each layout is approved by the ventilation officer, underground manager and general manager.
The ventilation system is constructed and simulated with the use of electronic software (VUMA) to develop a plan to ensure Blanket mine can be ventilated effectively and assist with any major ventilation changeover that can be micro modelled with fan and column selection to ensure compliance. Figure 25 below indicates the simulated ventilation system for Blanket Mine at December 2023.
The Caledonia group employs a full time Group Ventilation Engineer to advise on changes in the ventilation strategy and design.
Figure 56: Blanket Mine Simulated Ventilation airflow
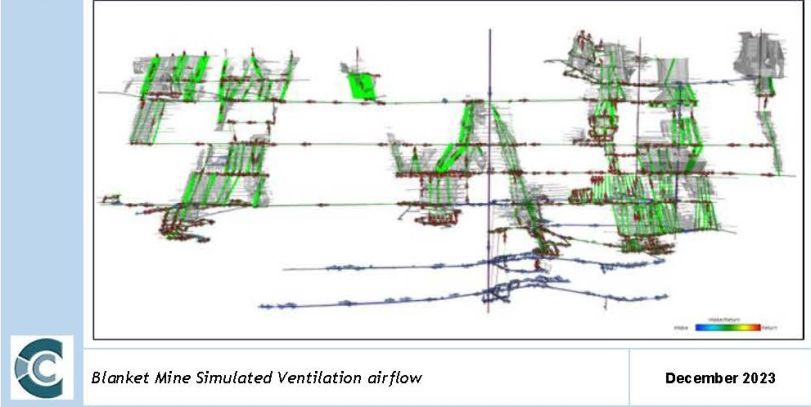
Caledonia Mining Corporation Plc
S-K 1300 Technical Report Summary on the Blanket Gold Mine, Zimbabwe
The current Blanket Mine ventilation system limit is reached with NVP at 26 level. Mechanical ventilation systems installed on 30,34 and 35 Level. To alleviate the limit of the NVP and to reduce the underground ventilation installations, an alternative solution was investigated and determined. The solution coincides with the current ventilation system, which entails several exhaust shafts combined with surface fans. The following shafts are earmarked for a bifurcated fan installation:
|
● |
Blanket 1 Shaft |
|
● |
Blanket 2 Shaft |
|
● |
Eroica 2 Shaft |
|
● |
Sheet Shaft and |
|
● |
Lima 3 Shaft |
The exhaust shaft installations are planned to exhaust volume of 300m³/s when completed. This is a significant investment into the LOM of Blanket Mine.
Item 13 (b) – PRODUCTION RATES, EXPECTED MINE LIFE, MINING UNIT DIMENSIONS, AND MINING DILUTION
|
I. |
SHIFT CYCLE |
The production days may vary from month to month and are dictated by the public holidays in each month. The calendar is shared by the plant manager to all HODs. Drilling and blasting operations are conducted on dayshift while nightshift conducts cleaning operations. The Blanket Mine shift system is detailed in Table 25.
Table 25: Blanket Mine Shift System
|
Shift |
Activity |
Duration |
|
Day Shift |
Drilling and blasting |
8 Hours |
|
Blasting and Re-entry |
Blasting and Re-entry |
4 Hours |
|
Night Shift |
Lashing and cleaning |
12 Hours |
Tramming is conducted on both morning and night shift.
|
II. |
PRODUCTION RATES |
The planned development rates for the Blanket Mine are detailed in Table 26.
Table 26: Blanket Mine Development Rates
|
Development Type |
Unit |
Value |
|
Box Raise |
m/d |
1.3 |
|
Cut off Raise |
m/d |
1.3 |
|
Connection Crosscut |
m/d |
1.3 |
|
DD Cubbies |
m/d |
1.3 |
|
DD Chamber |
m/d |
1.7 |
|
DD Crosscut |
m/d |
1.7 |
|
Decline |
m/d |
1.7 |
|
Decline Connection |
m/d |
1.7 |
|
Decline Crosscut |
m/d |
1.7 |
|
Decline Chairlift |
m/d |
1.7 |
|
Decline Conveyor |
m/d |
1.7 |
|
Drawpoint Raise |
m/d |
1.3 |
|
Drawpoint Crosscut |
m/d |
1.7 |
|
Subdrive |
m/d |
1.3 |
|
Dump Truck Access Bay |
m/d |
1.7 |
|
Extraction Haulage |
m/d |
1.7 |
|
Haulage |
m/d |
1.7 |
Caledonia Mining Corporation Plc
S-K 1300 Technical Report Summary on the Blanket Gold Mine, Zimbabwe
|
Development Type |
Unit |
Value |
|
Laybye |
m/d |
1.7 |
|
Loading Bay |
m/d |
1.7 |
|
Lead Drive |
m/d |
1.7 |
|
LHD Access Bay |
m/d |
1.7 |
|
Muck Bay |
m/d |
1.7 |
|
Orepass Raise |
m/d |
1.3 |
|
Raisebore |
m/d |
1.2 |
|
Refuge Cubby |
m/d |
1.7 |
|
Shunting Bay |
m/d |
1.7 |
|
Sub Station Crosscut |
m/d |
1.7 |
|
Slot Raise |
m/d |
1 |
|
Sump |
m/d |
1.7 |
|
Service Raise |
m/d |
1.3 |
|
TW Raise |
m/d |
1.3 |
|
Vent Raise |
m/d |
1.3 |
Blanket Mine plans to produce 74-80 koz of gold per year. The LoM plan reflects a consistent 70 koz of gold production from Mineral Reserves only over an 11-year period from 2024 until 2034. The planned production rates from the different orebodies are detailed in Table 27.
Table 27: Blanket Mine Production Rates
|
Type |
Unit |
Value |
|
LH Stoping |
tpd |
100 |
|
UH Stoping |
tpd |
40 |
|
Pillar |
tpd |
80 |
|
Draw point |
tpd |
40 |
Caledonia Mining Corporation Plc
S-K 1300 Technical Report Summary on the Blanket Gold Mine, Zimbabwe
LIFE OF MINE PLAN
The Blanket LoM plan commences on the January 1, 2024. The LoM plan includes Measured, Indicated and Inferred Mineral Resources, however only diluted Measured and Indicated Mineral Resources in the LoM plan were considered for conversion to Mineral Reserves.
The mining strategy targets primarily the Mineral Resources below 750 m Level. Mining in the Lima orebody targets Mineral Resources above 750 m Level. In the ARS East West Limb, Blanket and Blanket Feudal orebodies, some mining will take place above 630 m Level.
The diluted production schedule for the Blanket Mine is illustrated in Figure 57.
Figure 57: Diluted Life of Mine Production Schedule by Mineral Resource Classification
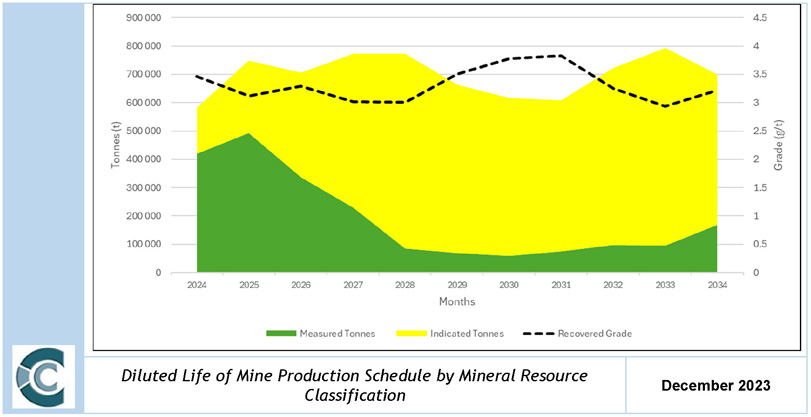
A total of 2,129 kt Measured Mineral Resources at a grade of 3.21 g/t and 5,555 kt Indicated Mineral Resources at a grade of 3.31g/t is included in the LoM plan. A LoM of 11 years is envisaged for the Blanket Mine. Of this 64% is attributable to Caledonia (1,363 kt Measured Mineral Resources and 3,555 kt Indicated Mineral Resources). The content delivered to the plant from the Blanket Mine is illustrated in Figure 58.
Caledonia Mining Corporation Plc
S-K 1300 Technical Report Summary on the Blanket Gold Mine, Zimbabwe
Figure 58: Blanket Mine Content Delivered to the Plant
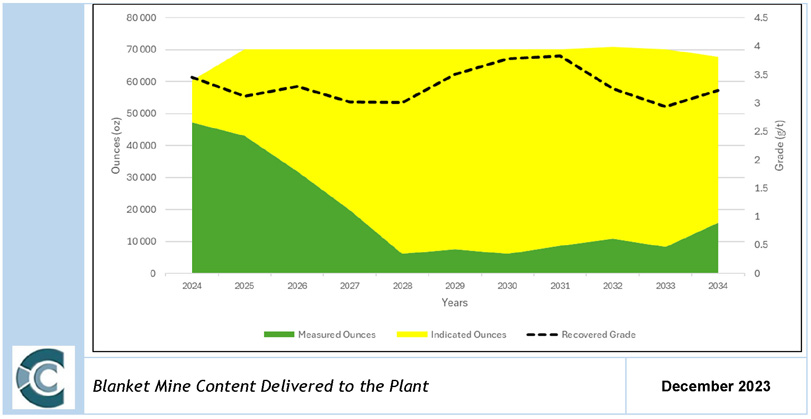
The LoM plan includes a total of 220 koz and 592 koz of gold from the Measured and Indicated Mineral Resource Classifications, respectively. Of this 64% is attributable to Caledonia (141 koz Measured Mineral Resources and 379 koz Indicated Mineral Resources). The monthly ore tonne production is illustrated in Figure 59 and Figure 60.
Figure 59: Monthly Stope Ore Tonne Production
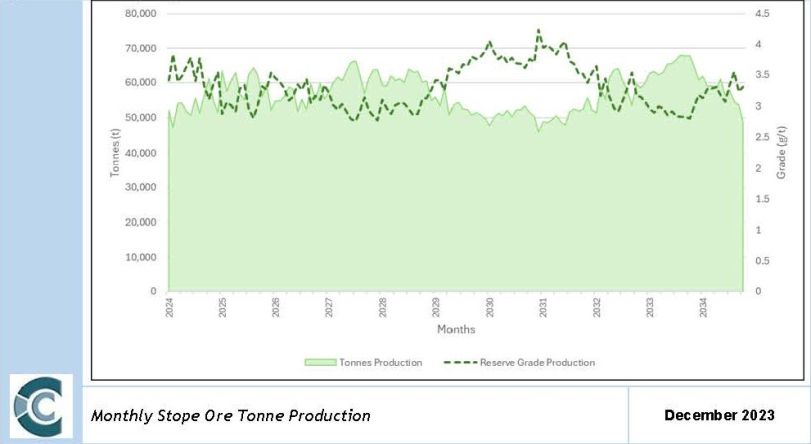
Caledonia Mining Corporation Plc
S-K 1300 Technical Report Summary on the Blanket Gold Mine, Zimbabwe
Figure 60: Monthly Development Ore Tonne Production
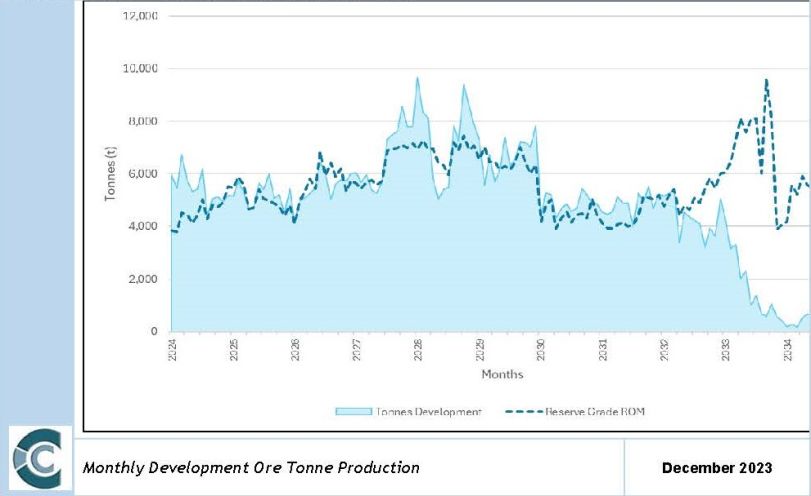
Caledonia Mining Corporation Plc
S-K 1300 Technical Report Summary on the Blanket Gold Mine, Zimbabwe
Mining Unit Dimensions
The planned dimensions for development are detailed in Table 28.
Table 28: Development Dimensions
|
Description |
Width |
Height |
|
m |
m |
|
|
Box Raise |
1.5 |
1.5 |
|
Cut off Raise |
1.5 |
1.5 |
|
Connection Crosscut |
1.6 |
1.8 |
|
DD Cubbies |
1.6 |
1.8 |
|
DD Chamber |
6.0 |
7.0 |
|
DD Crosscut |
2.5 |
2.0 |
|
Decline |
4.0 |
3.0 |
|
Decline Connection |
3.0 |
3.0 |
|
Decline Crosscut |
3.0 |
3.0 |
|
Decline Chairlift |
5.5 |
3.0 |
|
Decline Conveyor |
4.0 |
3.0 |
|
Drawpoint Raise |
1.5 |
1.5 |
|
Drawpoint Crosscut |
3.0 |
3.0 |
|
Subdrive |
1.6 |
1.8 |
|
Dump Truck Access Bay |
4.0 |
3.0 |
|
Extraction Haulage |
3.0 |
3.0 |
|
Haulage |
3.0 |
3.0 |
|
Laybye |
3.0 |
3.0 |
|
Loading Bay |
4.0 |
3.0 |
|
Lead Drive |
4.0 |
3.0 |
|
LHD Access Bay |
4.0 |
3.0 |
|
Muck Bay |
5.5 |
3.0 |
|
Orepass Raise |
1.5 |
1.5 |
|
Raisebore |
2.0 |
2.0 |
|
Refuge Cubby |
2.5 |
2.0 |
|
Shunting Bay |
3.0 |
3.0 |
|
Sub Station Crosscut |
3.0 |
3.0 |
|
Slot Raise |
1.5 |
1.5 |
|
Sump |
5.5 |
3.0 |
|
Service Raise |
1.5 |
1.5 |
|
TW Raise |
1.5 |
1.5 |
|
Vent Raise |
1.5 |
1.5 |
The mine design criteria for the Blanket Mine is detailed in Table 29.
Caledonia Mining Corporation Plc
S-K 1300 Technical Report Summary on the Blanket Gold Mine, Zimbabwe
Table 29: Mine Design Criteria for Blanket Mine
|
Unit |
Unit |
|
|
Level Parameters |
||
|
Main Level Spacing |
m |
120 |
|
Sub-level Spacing (Middling) |
m |
15 |
|
Draw point Crosscut Spacing |
m |
15 |
|
Diamond Drilling Crosscut Spacing (Along sub drives and lead drives) |
m |
7.5 |
|
Extraction Haulage Spacing from Orebody |
m |
15 |
|
Development Lead Angle |
Degrees |
45 |
|
Production Lead Angle |
Degrees |
72 |
|
Pillars |
||
|
Sill Pillar Thickness |
m |
15 |
|
Crown Pillar Thickness |
m |
15 |
|
Sill Pillar Spacing |
m |
90 |
The Blanket Mine design is illustrated in Figure 61.
Figure 61: Blanket Mine Design
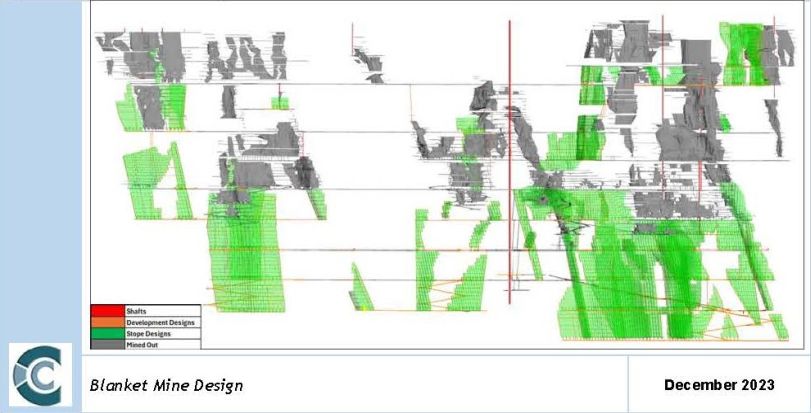
|
III. |
MINERAL RESERVE CONVERSION FACTORS |
Mineral Reserve conversion factors are applied to convert the Mineral Resources to Mineral Reserves. The applied Mineral Reserve conversion factors are detailed as follows:
Geological Losses
Geological loss is applied to account for geological uncertainty associated with different Mineral Resource categories. The mine plan includes Inferred Mineral Resources, Indicated Mineral Resources and Measured Mineral Resources. Geological losses of 2.5% was applied to Measured Mineral Resources, 5.0% to Indicated and 10.0%Inferred Mineral Resources.
Caledonia Mining Corporation Plc
S-K 1300 Technical Report Summary on the Blanket Gold Mine, Zimbabwe
Pillar Extraction
A pillar extraction of 50% has been applied to account for pillars which will be extracted on retreat when a block has been mined out. The pillar extraction accounts for the extraction of sill pillars (including pillars between draw points) which will be extracted.
A detailed rock engineering recommendation, risk assessment involving Mining, MRM, Ventilation is required to determine which pillars are eligible for partial or total extraction.
Mining Losses
Ore losses occur when mined material containing grade, is mixed with waste material, and can be attributed to several different causes. Different ore losses have been applied to account for ore to waste losses during mining of the various orebodies. It was assumed that the entire thickness of the reef is taken out, with negligible ore lost to waste.
Dilution
Dilution is defined as a percentage value representing a certain amount of waste material that is mixed with the ore during the mining process. This results in increased ore tonnages, but due to waste material containing no or very little grade, the overall grade delivered to the plant is decreased.
The thickness of the orebodies mined at the Blanket Mine vary significantly and are in some instances very irregularly shaped. The Blanket Mine applies an accepted dilution of 8.0%, derived from actual production figures.
Dilution of 15 cm in the hanging wall and footwall was applied to orebodies which are mined using the conventional underhand mining method and dilution of 30 cm was applied to orebodies which are mined using long-hole stoping. It has been assumed that drilling with shorter drill steels in conventional mining results in less overbreak than drilling with long drill steels used in long-hole stoping.
The average dilution calculation is detailed in Table 30.
Table 30: Blanket Mine Average Dilution Calculation
|
Orebody |
Mining Method |
Average Orebody Thickness |
HW and FW Dilution |
Dilution |
|
cm |
cm |
% |
||
|
BLK1HW |
Underhand |
300 |
30 |
10.00 |
|
BLK2FW |
Underhand |
270 |
30 |
11.11 |
|
BLK2HW |
Underhand |
800 |
30 |
3.75 |
|
BLK3 |
Underhand |
380 |
30 |
7.89 |
|
BLK45 |
Underhand |
700 |
30 |
4.29 |
|
BLK6FW |
Underhand |
1050 |
30 |
2.86 |
|
BLK6HW |
Underhand |
820 |
30 |
3.66 |
|
BQRHWN |
Long-hole |
700 |
30 |
4.29 |
|
BFHW |
Underhand |
400 |
30 |
7.50 |
|
ARS |
Long-hole |
1500 |
60 |
4.00 |
|
ARS EXTENSION |
Long-hole |
450 |
60 |
13.33 |
|
ARM |
Long-hole |
1200 |
60 |
5.00 |
|
ARMFFW1 |
Underhand |
120 |
30 |
25.00 |
|
LIMA MAIN |
Underhand |
200 |
30 |
15.00 |
|
ERCN |
Underhand |
500 |
30 |
6.00 |
|
Average Dilution |
8.00 |
|||
Caledonia Mining Corporation Plc
S-K 1300 Technical Report Summary on the Blanket Gold Mine, Zimbabwe
|
● |
Mine Call Factor: MCF is the ratio, expressed as a percentage, which the specific product accounted for in recovery plus residues bears to the corresponding product called for by, the Mine's measuring methods. The MCF was calculated from historic and current figures. The MCF calculation from 2015 to 2023 is detailed in Table 31. A MCF of 100% has been used for the Blanket Mine, derived from the actual MCF calculations from 2015 to 2023. A MCF of 100% has been maintained and will need to be monitored for fluctuations due to the move to a fully electronic resource estimation system. |
Table 31: Blanket Mine - Mine Call Factor Calculation 2015 to 2022
|
Year |
Milled Tonnes |
Gold Recovered |
Gold in Tails |
Gold Accounted For |
Total Mined Tonnes |
Mined Grade |
Gold Called For |
MCF |
|
t |
oz |
oz |
oz |
t |
g/t |
oz |
% |
|
|
2015 |
440,057 |
42804 |
3,243 |
46,047 |
442,451 |
3.25 |
42,574 |
108% |
|
2016 |
510,662 |
50,351 |
3,794 |
54,145 |
506,086 |
3.3 |
50,903 |
106% |
|
2017 |
547,060 |
56,133 |
3,941 |
60,074 |
547,060 |
3.41 |
56,826 |
106% |
|
2018 |
560,913 |
54,512 |
4,166 |
58,678 |
545,267 |
3.25 |
56,626 |
104% |
|
2019 |
556,746 |
55,182 |
3,902 |
59,084 |
556,440 |
3.3 |
57,248 |
103% |
|
2020 |
597,962 |
57,899 |
3,845 |
61,744 |
571,061 |
3.21 |
59,854 |
103% |
|
2021 |
665,627 |
67,476 |
4,409 |
73,844 |
667,342 |
3.36 |
72,631 |
102% |
|
2022 |
752,033 |
80,775 |
5,343 |
86,118 |
756,478 |
3.5 |
80,235 |
98% |
|
2023 |
770,421 |
75,416 |
5,003 |
80,419 |
751,087 |
3.25 |
80,272 |
94% |
|
Average MCF |
103% |
|||||||
Notes:
|
1. |
A MCF of 100% has been used for the Blanket Mine, derived from the actual MCF calculations from 2015 to 2023. |
Item 13 (c) – REQUIREMENTS FOR STRIPPING, UNDERGROUND DEVELOPMENT AND BACKFILLING
|
I. |
UNDERGROUND DEVELOPMENT |
The existing development forms part of the mine plan to provide access to the underground workings and the targeted mining areas.
Additional development is required for opening sufficient ground and to provide access to the mining areas below 750 m Level. Different development requirements exist for the orebodies included in this study.
The naming convention used in the development designs are detailed in Table 32.
Table 32: Development Designs Naming Convention
|
Design Naming Convention |
Definition |
|
CON |
Draw point Cone. Refers to the cone that is established for each draw point. |
|
CTO |
Cut off Raise. Refers to the raises developed connection the economic limits of an orebody along strike. |
|
HLG |
Diamond Drill Crosscut. Refers to crosscuts that are developed along declines and haulages from which exploration drilling is typically done. |
|
DXT |
Diamond Drill Chamber. Refers to a cubby that has been slyped to required size for Diamond Drilling activities. |
|
DEC |
Decline. Refers to the development of the declines to provide access to the different areas in the Blanket Mine. |
Caledonia Mining Corporation Plc
S-K 1300 Technical Report Summary on the Blanket Gold Mine, Zimbabwe
|
Design Naming Convention |
Definition |
|
CHL |
Decline Chairlift. Refers to the development of the declines to provide access for Men and material. |
|
CON |
Decline. Refers to the development of the declines to provide exacation for conveyor belt and return air. |
|
DXT |
Decline Crosscut. Refers to the access crosscuts which offramp from the declines to the main haulages and extraction haulages. |
|
HLE |
Drawpoint Crosscut. Provides access from the extraction haulage or main haulage to the draw point. |
|
RSE |
Drawpoint Raise. Refers to the raises developed from the lower main level to the first sub-level as a starting point for coning. |
|
HLE |
Extraction Haulage. Refers to horizontal off-reef development which services tramming activities for individual orebodies. |
|
HLG |
Haulage. Refers to horizontal off-reef development along the strike of the orebody. Also called the tramming haulage. |
|
LDR |
Lead Drive. Refers to the main level drive that are developed first and leads the sub-level development. |
|
OPS |
Orepass Raise. Refers to the raises developed to facilitate ore movement from in-ore development activities. |
|
RBR |
Raisebore. Refers to Raisebore drilling done to support ventilation requirements. |
|
DRV |
Subdrive. Refers to horizontal on-reef development along the strike of the orebody. |
|
TWA |
Travelway Raise. Refers to the raises developed to faciliate initial orebody access per level. |
|
VNT |
Ventilation raises. Refers to the raises that are developed between levels for ventilation purposes. |
The Blanket Mine will focus on key development ends to open ground on 30, 34 and 38 Level. The planned capital development consists of:
|
● |
30 Level North and South to the full extent of the orebody limits |
|
● |
34 Level North and South to the full extent of the orebody limits |
|
● |
Decline from 34 to 38 level |
|
● |
Diamond Drill cross cuts for exploration purposes |
Caledonia Mining Corporation Plc
S-K 1300 Technical Report Summary on the Blanket Gold Mine, Zimbabwe
Figure 62: Blanket Mine Development Design
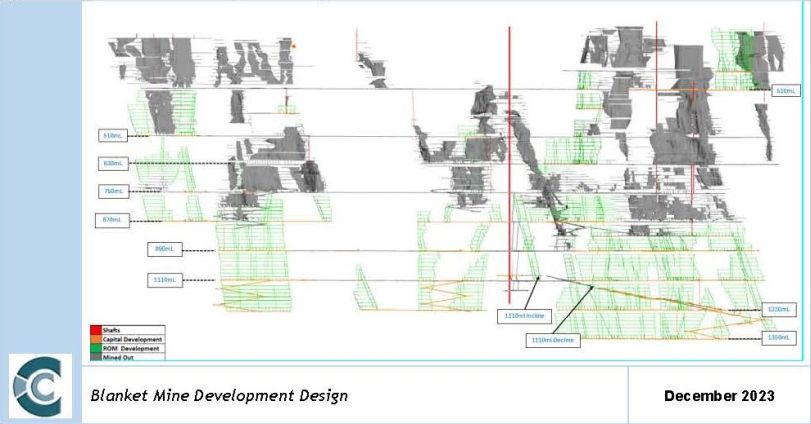
Development meters are high throughout the first 5 years of the LoM plan with the focus on opening up Mineral Resources below 870 m. The development profile for the Blanket Mine is illustrated in Figure 63.
Figure 63: Blanket Mine Development Profile
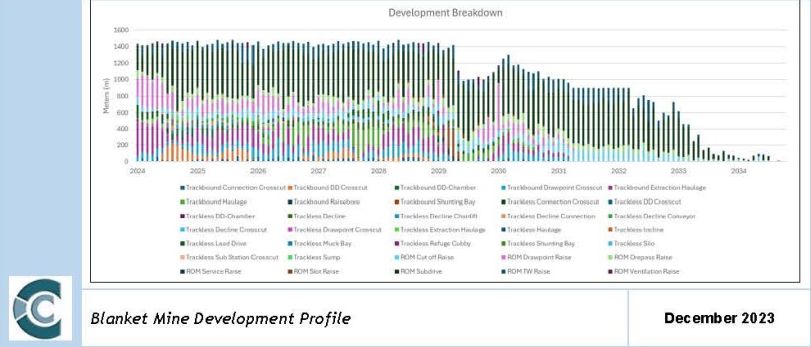
|
II. |
BACKFILLING |
The Blanket Mine currently does not have any requirements for backfilling within any of the mining areas. If future depth extensions are planned, it may require an investigation into backfill requirements.
Caledonia Mining Corporation Plc
S-K 1300 Technical Report Summary on the Blanket Gold Mine, Zimbabwe
Item 13 (d) – REQUIRED MINING FLEET, MACHINERY AND PERSONNEL
|
I. |
MINING FLEET AND MACHINERY |
The underground mining fleet consists of rail-bound and trackless equipment. Production and development drilling is done by using a combination of Seco 25 jackhammers in conventional underhand mining areas while Seco 36 drifters are used in long-hole stoping areas. The underground rail-bound and trackless fleet is detailed in Table 33.
Table 33: Blanket Mine Current Mining Fleet
|
Fleet |
Quantity |
|
Rail-bound Fleet |
|
|
Air loaders |
33 |
|
Battery operated locomotives |
27 |
|
Cars (Material & Hoppers) |
192 |
|
Trackless Fleet |
|
|
Dump trucks |
13 |
|
LHDs |
18 |
|
Bobcat |
1 |
|
Utility vehicles |
1 |
|
Rock breakers |
3 installed (Eroica 740mL, 870mL,990mL) |
|
II. |
PERSONNEL |
The mining personnel for the Blanket mine is detailed in Table 34.
Table 34: Blanket Mine Mining Personnel
|
Positions |
Run Of Mine |
Capital Project |
Total |
|
Executive Vehicle Driver |
1 |
0 |
1 |
|
Heavy Vehicle Driver |
5 |
0 |
5 |
|
Senior Vehicle Driver |
2 |
0 |
2 |
|
Air Loader Driver |
2 |
1 |
3 |
|
Assistant Banksman |
4 |
0 |
4 |
|
Assistant Boilermaker |
24 |
1 |
25 |
|
Assistant Drifter Operator |
7 |
1 |
8 |
|
Assistant Fitter |
39 |
8 |
47 |
|
Assistant Loco driver |
1 |
1 |
2 |
|
Assistant Machine Operator |
58 |
25 |
83 |
|
Assistant Overseer Miner |
2 |
0 |
2 |
|
Assistant Plumbers |
3 |
0 |
3 |
|
Assistant Auto-Electrician |
0 |
4 |
4 |
|
Assistant Diesel Plant Fitter |
1 |
19 |
20 |
|
Assistant Mechanics |
1 |
0 |
1 |
|
Assistant Shaft Timberman |
1 |
0 |
1 |
|
Auto Electrician Class 2 |
1 |
1 |
2 |
|
Bellman |
33 |
0 |
33 |
|
Black Smiths |
2 |
0 |
2 |
|
Boilermaker |
16 |
0 |
16 |
Caledonia Mining Corporation Plc
S-K 1300 Technical Report Summary on the Blanket Gold Mine, Zimbabwe
|
Builder's Assistant |
5 |
0 |
5 |
|
Bus Driver |
1 |
0 |
1 |
|
Carpenter |
3 |
0 |
3 |
|
Carpenter's Assistant |
4 |
0 |
4 |
|
Compressor Attendants |
10 |
0 |
10 |
|
Construction Assistants |
7 |
3 |
10 |
|
Conveyor Attendants |
1 |
0 |
1 |
|
CRANE OPERATOR |
3 |
0 |
3 |
|
Crusher Attendants |
10 |
0 |
10 |
|
Desilting Lashers |
11 |
1 |
12 |
|
Diesel Plant Fitter |
1 |
7 |
8 |
|
Drifter Operator |
26 |
0 |
26 |
|
Drill Rig Operator |
4 |
0 |
4 |
|
Dump Truck Drivers |
7 |
3 |
10 |
|
Electrical Assistants |
28 |
0 |
28 |
|
Electrical Charge Hand |
2 |
0 |
2 |
|
Electrician |
8 |
0 |
8 |
|
Fitter |
19 |
0 |
19 |
|
Gang-leader |
73 |
17 |
90 |
|
General Hand |
8 |
0 |
8 |
|
Graded Boilermaker |
4 |
0 |
4 |
|
Graded Fitter |
6 |
0 |
6 |
|
Hoist Driver |
29 |
0 |
29 |
|
Instrument Technician |
1 |
0 |
1 |
|
Lamp Attendant |
10 |
0 |
10 |
|
Lasher |
452 |
77 |
529 |
|
LHD Driver |
35 |
15 |
50 |
|
Loader Driver |
24 |
1 |
25 |
|
Loco Assistant |
7 |
1 |
8 |
|
Loco driver |
50 |
5 |
55 |
|
Lubricator |
2 |
0 |
2 |
|
Machine Operator |
115 |
25 |
140 |
|
Magazine Attendants |
6 |
1 |
7 |
|
Mahewu brewers |
1 |
0 |
1 |
|
Maintenance Planner |
1 |
0 |
1 |
|
Mechanic |
2 |
0 |
2 |
|
Mobile Crane Driver |
1 |
0 |
1 |
|
Overseer miner |
7 |
1 |
8 |
|
Planned Maintenance Clerk |
2 |
0 |
2 |
|
Planned Maintenance Officer |
1 |
0 |
1 |
|
Plumber |
1 |
0 |
1 |
|
Projects Vehicle Drivers |
2 |
0 |
2 |
|
PTV Assistant |
7 |
4 |
11 |
|
Pump Attendants |
22 |
0 |
22 |
|
Rock Drill Fitter |
4 |
0 |
4 |
|
Rock Drill Fitters Assistant |
4 |
0 |
4 |
|
Rubber Liner Assistant |
1 |
0 |
1 |
Caledonia Mining Corporation Plc
S-K 1300 Technical Report Summary on the Blanket Gold Mine, Zimbabwe
|
Raise Riggers |
14 |
0 |
14 |
|
Rigger's Assistant |
1 |
0 |
1 |
|
Rockbreaker Operators |
2 |
1 |
3 |
|
Rubber Liner |
1 |
0 |
1 |
|
Sanitation Attendant |
4 |
0 |
4 |
|
Scada Attendant |
3 |
0 |
3 |
|
Senior Crusher Attendant |
1 |
0 |
1 |
|
Senior Gang Leader |
8 |
3 |
11 |
|
Senior Hoist Driver |
1 |
0 |
1 |
|
Senior LHD Driver |
1 |
0 |
1 |
|
Senior Magazine man |
1 |
0 |
1 |
|
Senior Overseer Miner |
10 |
3 |
13 |
|
Shaft Assistant |
2 |
0 |
2 |
|
Shaft Clerk |
5 |
0 |
5 |
|
Shaft Timberman |
2 |
0 |
2 |
|
Shaft Timberman Assistant |
7 |
0 |
7 |
|
Shift Boss |
1 |
0 |
1 |
|
Stand-by Vehicle Driver |
3 |
0 |
3 |
|
Tractor Driver |
4 |
0 |
4 |
|
TRAMMER |
18 |
2 |
20 |
|
Tyre Fitter |
0 |
1 |
1 |
|
U/Graded Builder |
4 |
0 |
4 |
|
U/Graded Carpenter |
1 |
0 |
1 |
|
U/Graded Electricians |
3 |
0 |
3 |
|
U/Graded Mechanics |
3 |
0 |
3 |
|
U/Graded Painter |
2 |
0 |
2 |
|
U/Graded Plumber |
1 |
0 |
1 |
|
Upgraded Boilermaker |
8 |
0 |
8 |
|
Upgraded Fitter |
4 |
0 |
4 |
|
Grand Total |
1346 |
232 |
1578 |
Source: Blanket Mine
Caledonia Mining Corporation Plc
S-K 1300 Technical Report Summary on the Blanket Gold Mine, Zimbabwe
ITEM 14 – RECOVERY METHODS
Item 14 (a) – FLOW SHEETS AND PROCESS RECOVERY METHODS
The Blanket gold plant consists of a conventional crushing, milling, CIL, batch elution and smelting configuration current running at 66 ktpm. A process flow diagram is shown in Figure 64.
The plant consists of the following circuits:
|
● |
Primary crushing - jaw crushers |
|
● |
Secondary crushing - cone crushing in closed circuit with a screen. |
|
● |
Primary Milling - rod mills in open circuit |
|
● |
Regrind - ball mills in closed circuit with cyclones. |
|
● |
Gravity Concentration – Knelson concentrators and Gemini table |
|
● |
Intensive leach for gravity concentrate. |
|
● |
Thickening - Dewatering cyclones |
|
● |
Leaching - Carbon in Leach (CIL) |
|
● |
Elution and electrowinning – Combined in batch mode |
|
● |
Casting - smelt house |
|
● |
Carbon regeneration - Re-activation kiln |
|
● |
Tailing Deposition – Tailing Storage Facility (TSF) |
|
● |
Figure 103: Crushing and Milling Process Flow Diagram |
Figure 64: Crushing and Milling Process Flow Diagram
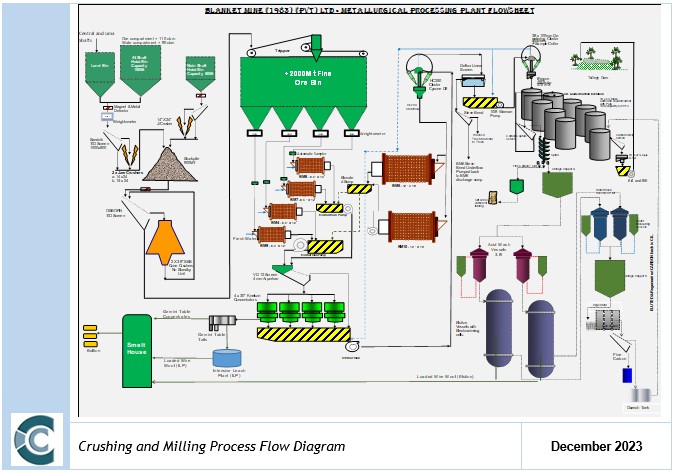
Caledonia Mining Corporation Plc
S-K 1300 Technical Report Summary on the Blanket Gold Mine, Zimbabwe
There was a gradual increase in milled tonnes from 2014 to 2023 at a rate of 42,200 tonnes per year. The tonnes milled in 2023 was the highest at 770,421 tonnes from 390,734 in 2014 as evidenced in Table 35.This gradual ramping up of tonnage saw a corresponding increase in production at a rate of 3,738 ounces per year with the highest in 2022 when 80.8k ounces were achieved.
Table 35: Historic Plant Production 2014 – 2023
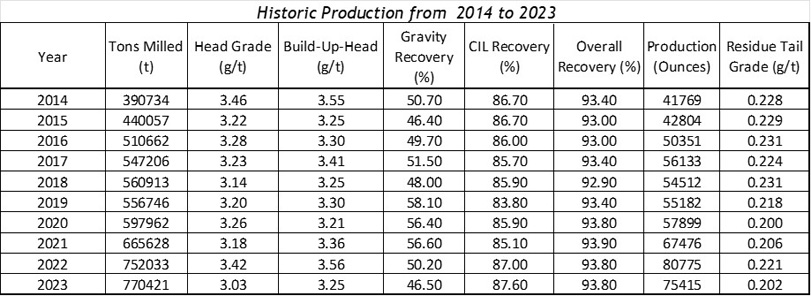
It is worth noting that the use of oxygen improved CIL recovery from an average of 85.0% to 87.6% from the time the Oxygen Plant was commissioned in the fourth quarter of 2019. This has led to an increased overall recovery from 93.0% to the current 93.8%. The gravity gold recovery was varying between 46.50% and 58.10% over the 10-year period with no significant trend pattern.
The plant is expected to achieve a similar recovery in future when treating current Blanket RoM material. RoM material from other sources may be more refractory and will have to be tested before being treated in the Blanket plant.
Figure 65: Historic Milled Tonnes Plant Feed Grade against Plant Final Tails from 2014 to 2023
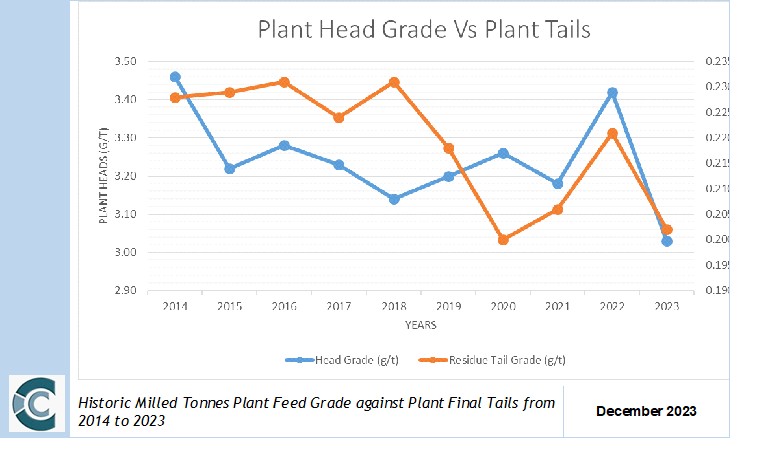
Caledonia Mining Corporation Plc
S-K 1300 Technical Report Summary on the Blanket Gold Mine, Zimbabwe
Figure 66: Historic Recoveries and Gold Production from June 2014 to May 2023
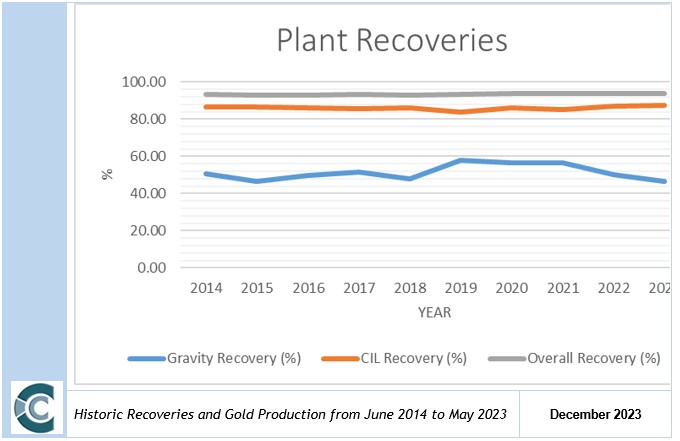
A new TSF has been commissioned on Blanket during February 2024. The engineer of record has been appointed and the latest report will be available after each quarter. The decommissioned TSF, available for use, if necessary, has been equipped with electronic piezometers that can be monitored live. The current phreatic surface does not pose any risk of planar or wedge failure as the dam is relatively dry and well drained. The new TSF was designed as per latest Global Industry Standards of TSF Management.
The new TSF, Phase 1A commenced with deposition during December 2023 as planned and fully commissioned during February 2024. The Phase 1B is currently under construction for completion in by Q4 2024. A final Phase 2 is planned to commence and be completed in 2025. The completion of the new TSF will provide a further 20 years of depositional life at current production rates until 2044, sufficient for the LoM based upon Mineral Reserves. The appropriate liner as per the GSTIM is being used and all the necessary documentation on the design and implementation is available.
Item 14 (b) Process Flow and Equipment Specifications.
The plant was designed and constructed by Kinross Mining Company to treat RoM ore from the Blanket mine. The ore is fed over 14" x 24" jaw crushers to reduce the top size from -300 mm to less than 80 mm. The ore from No. 4 Shaft is crushed to -135 mm underground. Tramp iron magnets (located ahead of the crushers) remove scrap iron before it enters the cone crushers. The crushed ore is stored on a 900-tonne open stockpile from where material is fed to the cone crushers (Figure 67).
Caledonia Mining Corporation Plc
S-K 1300 Technical Report Summary on the Blanket Gold Mine, Zimbabwe
Figure 67: Cone Crusher Building
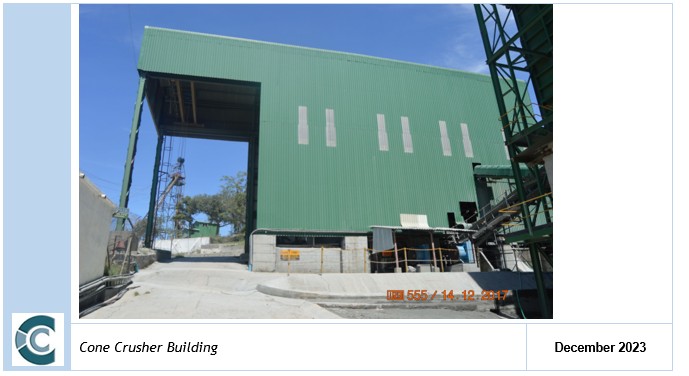
The cone crushers were upgraded recently and replaced with two 38" hydraulically adjusted Nordberg crushers (Figure 68). The crushers can operate independently and feed Osborn vibrating screens. The screened product which is smaller than 10 mm is delivered to the mill feed bin. The equipment quality is good and good maintenance is applied (an observation made during the site visit).
Figure 68: Cone Crushers
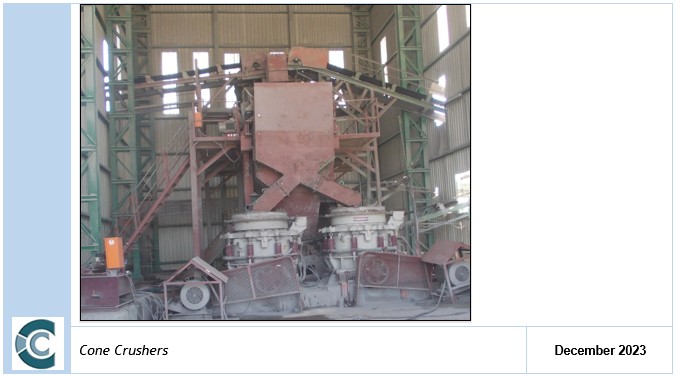
Caledonia Mining Corporation Plc
S-K 1300 Technical Report Summary on the Blanket Gold Mine, Zimbabwe
There are three 6.5 ft. x 12 ft. rod mills which operate in parallel. Each feed belt has a mill feed mass meter which is used to control and measure the mill feed rate. The foundations of the previous mills were in the process of being demolished which leaves adequate space for future expansion. The rod mill feed bin live capacity is small which, in turn, requires that the crushers operate on a three-shift cycle to ensure that the rod mills have adequate feed for continuous operation, Figure 69.
The regrind duty is performed by BM6 (12 ft x 16 ft) and BM3 (6.5 ft x 12 ft) which are operated in parallel and closed circuit. BM3 was originally configured for primary duty in parallel with the primary mills (BM4, BM7 and BM8) but was reconfigured for as a regrind mill early in 2019. Another 12 ft x 16 ft mill has been installed and will be commissioned in April 2021.
Figure 69: Rod Mills
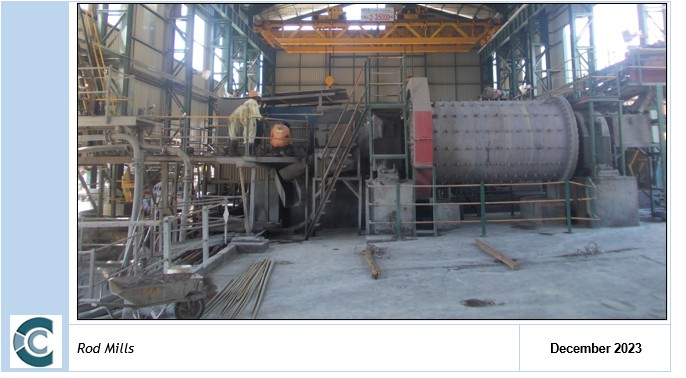
Approximately 50% to 60% of the gold production is recovered as gravity gold. Knelson Gravity Concentrators are fed from the primary mills and their concentrate is stored and processed further on a Gemini shaking table every 24 hours with the tailings recycled back into the circuit. Gemini table concentrates are taken for direct smelting whilst the tailings are sent to an Intensive Leach (“IL”) circuit. The tails from the IL are sent back to milling.
The tails of the Knelson gravity concentrator are pumped to a cyclone cluster with the coarse product (U/F) going for regrind and the fine product (O/F) sent to the Carbon in Leach (CIL) plant. The CIL consists of one pre-aeration tank and seven leach tanks where alkaline-cyanide leaching and simultaneous absorption of dissolved gold onto granular activated carbon takes place (Figure 70).
Caledonia Mining Corporation Plc
S-K 1300 Technical Report Summary on the Blanket Gold Mine, Zimbabwe
Figure 70: CIL Circuit
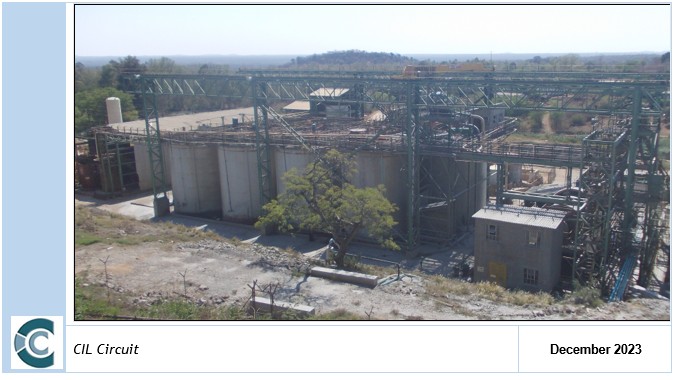
Oxygen generated from a Pressure Swing Absorption (“PSA”) oxygen plant is added into the first CIL tank; liquid oxygen is also available in the event of the oxygen plant being out of circuit for maintenance or breakdowns. There is a TAC 1000 cyanide online analyser which measures and controls cyanide addition. This process control system, in conjunction with oxygen injection, has reduced cyanide consumption.
Elution of the gold from the loaded carbon and subsequent electro-winning is done on site. There are two 2.5 tonne elution columns which operate in parallel. The design of the columns is unique in that the elution and the electro-winning processes take place in the same pressurised vessel. The advantage of this is that there is no circulation of solution outside the vessel which requires heat exchangers for heating and cooling. The overall effect is that the system is very energy efficient and cost effective. During electrowinning (Figure 71) the gold is deposited on steel wool cathodes within the elution column, and the loaded cathodes are removed on a planned cycle and acid digested. The resultant gold solids from acid digestion and the re-dressed gold concentrate from Knelson Concentrators are smelted into bars. The granular activated carbon is regenerated in a kiln before it is recirculated back to the CIL section. Loaded carbon is not acid treated to reduce reagent costs. Carbon reactivation has remained acceptable although the acid treatment can be re-introduced if required. The gold bullion, in the form of doré bars, is delivered, as required by Zimbabwean gold-mining law, to the Government-operated Fidelity Printers and Refiners for sampling and refining.
Caledonia Mining Corporation Plc
S-K 1300 Technical Report Summary on the Blanket Gold Mine, Zimbabwe
Figure 71: Elution and Electrowinning Vessels
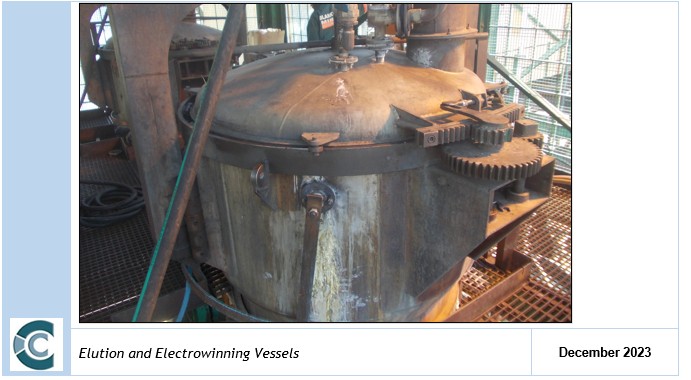
Power is supplied from the national grid, but a fully automated diesel driven power plant is available when power trips occur. The diesel power generation sets have a capacity of 10 Megawatts and can service both the mine and the plant when required.
The plant tailings from CIL are reduced in cyanide content and deposited on two licensed tailing impoundment areas located close to the plant. The maximum amount of tailings water is pumped back to the metallurgical plant for re-use. Daily management and operation of the tailing deposition area is contracted out to the Zimbabwean subsidiary of Fraser Alexander.
Table 36: Reagent and Consumable Consumptions
|
Item Unit Average Past Year |
Item Unit Average Past Year |
Item Unit Average Past Year |
|
Grinding Media and CIL Reagents |
Grinding Media and CIL Reagents |
Grinding Media and CIL Reagents |
|
Rods kg/t 0.68 |
Rods kg/t 0.68 |
Rods kg/t 0.68 |
|
Balls- 40 mm kg/t 0.89 |
Balls- 40 mm kg/t 0.89 |
Balls- 40 mm kg/t 0.89 |
|
Total Steel Media kg/t 1.57 |
Total Steel Media kg/t 1.57 |
Total Steel Media kg/t 1.57 |
|
Lime kg/t 1.68 |
Lime kg/t 1.68 |
Lime kg/t 1.68 |
Some of the higher consumptions of reagents as referred to in Table 36 was due to the high retention times of approximately 72 hours in the CIL circuit. This mainly affects carbon consumption due to the long exposure to agitation and abrasion in the CIL tanks, as well as cyanide consumption.
Caledonia Mining Corporation Plc
S-K 1300 Technical Report Summary on the Blanket Gold Mine, Zimbabwe
The new TSF was designed in accordance with Global Industry Standard of Tailings Management (GISTM). The new TSF is still under construction while deposition is taking place at completed lower ends of the new TSF basin. When completed the new TSF will cover an area of 61 hectares and the Return Water Dam (RWD) footage is 3 hectares. The slurry is pumped to the new TSF using two x 6/4 slurry pumps connected in series. The slurry line when completed would be equipped with a cross-over station that would enable to switch slurry lines using the same series pumps in case there are issues with the running slurry line.
The new TSF construction project commenced in March 2023 after the old TSF reached the end of its life. The construction of the new TSF was divided into three construction phases namely Phase 1A, Phase 1B and Phase 2. Phase 1A commenced with deposition during December 2023 and was fully commissioned at the end of February 2024 and Phase 1B commenced on 4 March 2024. Deposition of slurry at the new TSF commenced on 30 October 2023 and 144,906 tons of solids has been deposited by end of March 2024 and has risen a height of 1.9m at the intermediate penstock. The new TSF is lined with geomembrane and HDPE. Due to no seepage at the new TSF about 78% of the water is now recycled to the Plant opposed to 40% at the old TSF. The increase of recycled water has greatly assisted in reducing dependence on fresh water from the Dam. The construction of the new TSF is expected to be completed in the third quarter of 2025.
Labour Requirements
The current processing plant labour compliment is provided in Table 37.
Table 37: Plant Labour Complement
|
Section Position Number |
Section Position Number |
Section Position Number |
|
Plant Senior Staff Mill Superintendent 1 Asst. Mill Superintendent 1 |
Plant Senior Staff Mill Superintendent 1 Asst. Mill Superintendent 1 |
Plant Senior Staff Mill Superintendent 1 Asst. Mill Superintendent 1 |
|
Plant Staff Plant Metallurgist 1 Plant Foreman 1 Metallurgical Technician 1 Plant Operators 3 Mill Clerk 1 Elution Supervisor 1 Senior Smelting Assistant 1 Senior Lab. Assistant 1 Primary Crusher Senior Crusher Attendants 2 Crusher Attendants 13 Section Position Number Secondary Crusher Senior Crusher Attendants 1 Crusher Attendants 5 Crusher Attendants 1 Gravity &Smelting Assistants 3 |
Plant Staff Plant Metallurgist 1 Plant Foreman 1 Metallurgical Technician 1 Plant Operators 3 Mill Clerk 1 Elution Supervisor 1 Senior Smelting Assistant 1 Senior Lab. Assistant 1 |
Plant Staff Plant Metallurgist 1 Plant Foreman 1 Metallurgical Technician 1 Plant Operators 3 Mill Clerk 1 Elution Supervisor 1 Senior Smelting Assistant 1 Senior Lab. Assistant 1 |
|
Primary Crusher Senior Crusher Attendants 2 Crusher Attendants 13 |
Primary Crusher Senior Crusher Attendants 2 Crusher Attendants 13 |
|
|
Section Position Number |
Section Position Number |
|
|
Secondary Crusher Senior Crusher Attendants 1 Crusher Attendants 5 Crusher Attendants 1 Gravity &Smelting Assistants 3 |
Secondary Crusher Senior Crusher Attendants 1 Crusher Attendants 5 Crusher Attendants 1 Gravity &Smelting Assistants 3 |
Caledonia Mining Corporation Plc
S-K 1300 Technical Report Summary on the Blanket Gold Mine, Zimbabwe
|
Section Position Number |
Section Position Number |
Section Position Number |
| Milling Mill Attendants 4 Mill Attendants 10 |
Milling Mill Attendants 4 Mill Attendants 10 |
Milling Mill Attendants 4 Mill Attendants 10 |
| Elution Senior Elution Assistant 1 Elution Assistants 2 Elution Attendants 3 |
Elution Senior Elution Assistant 1 Elution Assistants 2 Elution Attendants 3 |
Elution Senior Elution Assistant 1 Elution Assistants 2 Elution Attendants 3 |
| Tailings Supervisor 1 Slimes Dam Attendants 3 Pump Attendants 3 |
Tailings Supervisor 1 Slimes Dam Attendants 3 Pump Attendants 3 |
Tailings Supervisor 1 Slimes Dam Attendants 3 Pump Attendants 3 |
|
CIL CIL Attendants 4 CIL Attendants 6 CIL Attendants 1 Water Water Works Attendant 1 Water Works Attendant 2 Water Works Attendant 1 |
CIL CIL Attendants 4 CIL Attendants 6 CIL Attendants 1 |
CIL CIL Attendants 4 CIL Attendants 6 CIL Attendants 1 |
|
Water Water Works Attendant 1 Water Works Attendant 2 Water Works Attendant 1 |
Water Water Works Attendant 1 Water Works Attendant 2 Water Works Attendant 1 |
|
| Metallurgical Lab and Sample |
Metallurgical Lab and Sample |
Metallurgical Lab and Sample |
|
preparation Laboratory Assistants 2 Laboratory Assistants 4 Wet Assay Supervisor 1 Lab Assistants 1 |
preparation Laboratory Assistants 2 Laboratory Assistants 4 |
preparation Laboratory Assistants 2 Laboratory Assistants 4 |
|
Wet Assay Supervisor 1 Lab Assistants 1 |
Wet Assay Supervisor 1 Lab Assistants 1 |
|
| Sub Total 87 |
Sub Total 87 |
Sub Total 87 |
|
Engineering Mechanical Engineer 1 Foreman 1 Fitter 5 B/Maker 4 Plumber 1 Rubber Liner 1 Assistant Fitter 5 B/maker Assistant 4 Lubricator 1 R/Liner Assistant 1 Plumber’s Assistant 1 Electrician 1 Assistant Electricians 1 |
Engineering Mechanical Engineer 1 Foreman 1 Fitter 5 B/Maker 4 Plumber 1 Rubber Liner 1 Assistant Fitter 5 B/maker Assistant 4 Lubricator 1 R/Liner Assistant 1 Plumber’s Assistant 1 Electrician 1 Assistant Electricians 1 |
Engineering Mechanical Engineer 1 Foreman 1 Fitter 5 B/Maker 4 Plumber 1 Rubber Liner 1 Assistant Fitter 5 B/maker Assistant 4 Lubricator 1 R/Liner Assistant 1 Plumber’s Assistant 1 Electrician 1 Assistant Electricians 1 |
|
Sub Total 27 |
Sub Total 27 |
Sub Total 27 |
Electrical Engineering is not included in the above table as he is shared between the plant and the mine. All the plant employees are adequately trained and from observation around the plant, as well as the condition of equipment, management is of a high standard. The higher labour complement is in part due to the manual control nature of the plant.
The laboratory personnel account for an additional ten people. The laboratory is used for plant analysis as well as management of mine and exploration samples. The plant does not have a central process control system, but there are local controls in the important areas such as mill feed control cyanide addition and level controls in relevant areas.
Caledonia Mining Corporation Plc
S-K 1300 Technical Report Summary on the Blanket Gold Mine, Zimbabwe
ITEM 15 – PROJECT INFRASTRUCTURE
Item 15 (a) - Mine Layout and Operations
The Blanket Mine consists of a series of small shafts (Table 38) providing access to the underground workings of the various orebodies that are being mined.
Table 38: Blanket Mine Shaft Access
|
Name |
Description |
|
Jethro Shaft |
The shaft has dimensions of 3 m x 2 m and is mainly utilised for the transport of men and material from surface to 7 Level. The shaft is equipped with a single drum winder with a 22 mm rope and capacity of 10 men. |
|
5 Winze (Sub-Shaft) |
5 Winze has dimensions of 2 m x 2 m and is a sub-shaft which is mainly used to transport men and materials between 7 Level and 22 Level. This shaft is similarly to Jethro shaft equipped with a single drum winder with a 20 mm rope and a capacity of 14 men |
|
6 Winze (Sub-Shaft) |
6 Winze has dimensions of 3 m diameter and is a sub-shaft used mainly for the hoisting of ore from 26 Level to 22 Level from where ore is transported to No. 4 Shaft for hoisting to surface. This shaft is equipped with a 117 kW single drum winder with a 24 mm rope and a capacity of 3 t skip or 500 tpd. At the bottom of 6 Winze shaft is a 12Kw spillage pump. |
|
Blanket Shaft (No. 4 Shaft) |
No. 4 Shaft was historically the main production shaft of Blanket Mine. No. 4 Shaft has dimensions of 4 m x 2 m with two compartments. This shaft is mainly used for the hoisting of ore and waste rock from 22 Level to surface. The shaft is equipped with a 560Kw thyristor driven double drum winder with a 34 mm rope and capacity of 5t per skip or 2,000 tpd. |
|
Central Shaft (CMS) |
The new CMS is not lined and has a four-compartment, 6 m diameter layout, equipped with 2 x 3,132 kW double-drum winders, one rock and the other men and material. The shaft is used as the main route for the transport of men, material, and rock. The shaft reaches a depth of 1,201.3 meters. The man compartment has a double deck and can transport 40 persons per deck. |
The current access infrastructure is detailed in Figure 72.
Caledonia Mining Corporation Plc
S-K 1300 Technical Report Summary on the Blanket Gold Mine, Zimbabwe
Figure 72: Current Shaft Infrastructure – Blanket Mine
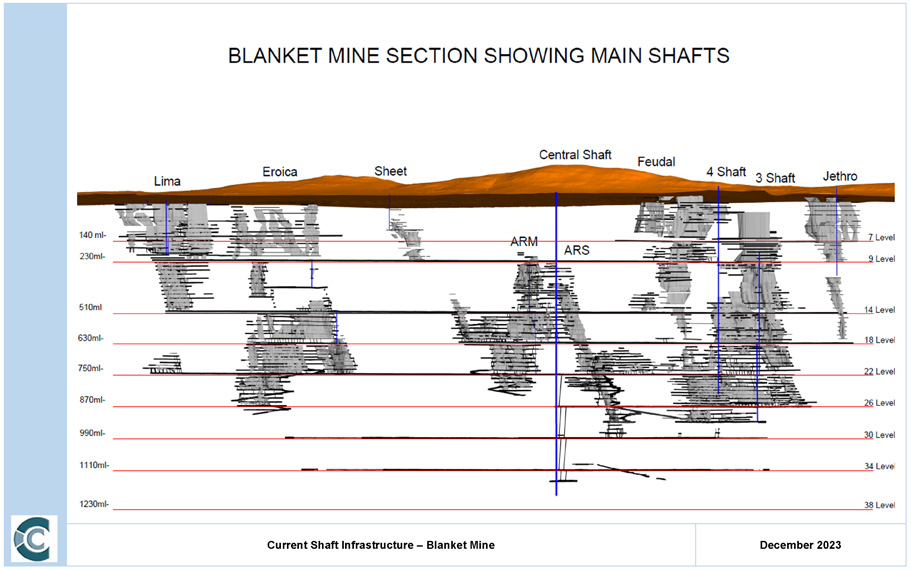
Caledonia Mining Corporation Plc
S-K 1300 Technical Report Summary on the Blanket Gold Mine, Zimbabwe
Several expansion projects have either been completed or are planned for the Blanket mining operations in order to increase production. The majority of the expansion projects will consist of the below 750 m Level (22 Level) expansion projects.
The first project includes the sinking and construction of the new CMS in-between the AR Main and AR South / Blanket orebodies from surface to below 1,201.3 m Level (just above 38 Level) and its associated infrastructure. Sinking and equipping of the shaft has been completed with the construction of the associated ore pass system and loading station currently. The water handling systems are currently in their final stages of completion. Additional projects include the development of various decline shaft infrastructure targeting specific mining areas in order to increase production. The planned shaft infrastructure development declines planned are listed in Table 39.
Table 39: Planned Shaft Infrastructure Development
|
Description |
Target Area |
From (Level / Area) |
To (Level / Area) |
|
Decline 2 |
AR Main |
750 mL / ARM |
Below 870 mL / ARM |
|
Decline 3 |
Eroica |
750 mL / Eroica |
990 mL / Eroica |
|
Decline 4 |
AR South / Blanket |
870 mL / ARS(Blanket) |
930 mL / ARS(Blanket) |
|
Decline 5 |
AR South / Blanket |
885 mL / ARS(BL Blanket) |
930 mL / ARS(Blanket) |
|
Decline 6 |
AR South / Blanket |
930 mL / ARS(Blanket) |
990 ml / ARS(Blanket) |
Item 15 (b) – Infrastructure
I. Surface Infrastructure
Surface infrastructure comprises mine offices, change houses, mine headgears, workshops, storerooms, a processing plant, hospital, tailings facility and an assay laboratory.
Production shafts on surface consist of the No. 4 Shaft, Lima Shaft, Sheet Shaft and the Jethro Shaft. Sub-shaft infrastructure in the form of the No 5 Winze connects Jethro to the underground workings. Other shafts and raise bore holes on surface, primarily used for ventilation purposes, include Blanket 2, Blanket 3, Lima, Eroica and Sheet. A total of 11 hoists are installed at the mine, four of which are used for ore handling (No. 2 Main Incline Shaft, the No. 4 Vertical Shaft, 6 Winze shaft and Lima Shaft). The surface infrastructure at the Blanket Mine is illustrated in Figure 73.
The existing infrastructure at the Blanket mine will be utilised in parallel with new infrastructure which is specifically aimed at targeting the Below 750 m Level mining areas. The extensions entail the sinking of the new CMS from surface down to 1,201.3 m Level (just above 38 Level). 6 Winze sub-shaft located close to 5 Winze sub-shaft is used to access the Blanket complex below 750 m Level and will provide secondary access to the new CMS.
The new CMS is not lined and has a four-compartment, 6 m diameter layout, equipped with 2 x 3,132 kW double-drum winders, one for rock hoisting and the other men and material transportation. Once fully equipped and commissioned, this shaft will be used as the main route for the transport of men, material, and rock.
On surface, a 1050 mm wide, 152 m long overland ore conveyor will transport the hoisted rock at CMS to the primary crusher and then to an ore dump. Additional supporting surface infrastructure will include shaft offices, change rooms, lamp rooms, etc. New housing for both senior and junior staff is also planned in anticipation of the increased production profile.
A TSF is also located near the Project Area. The labour force and their families reside within a kilometre of the mine in accommodation provided by the Mine.
Caledonia Mining Corporation Plc
S-K 1300 Technical Report Summary on the Blanket Gold Mine, Zimbabwe
Figure 73: Surface Infrastructure Arrangement
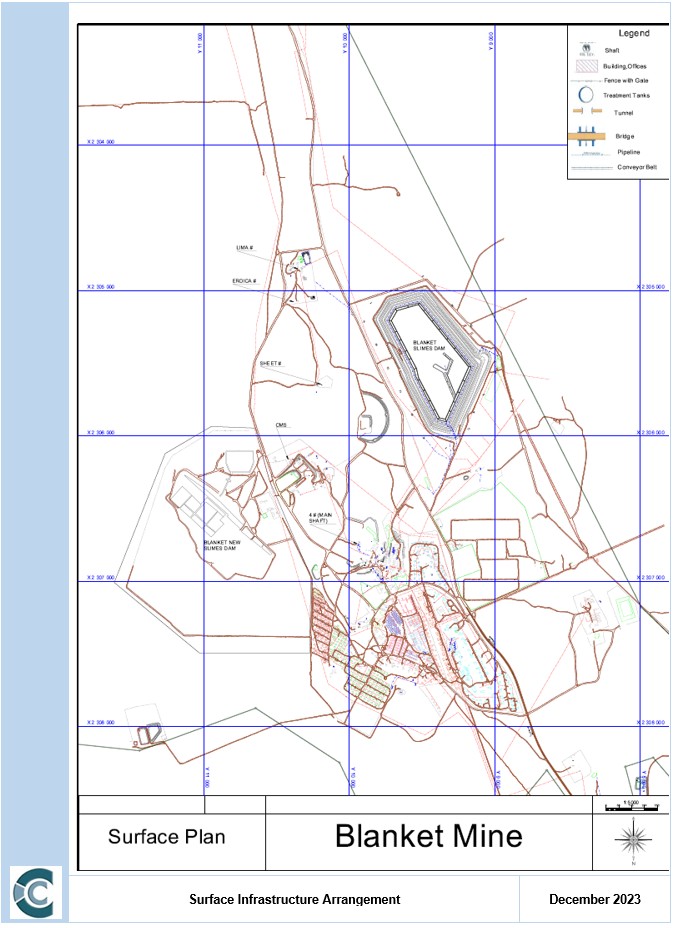
The planned surface infrastructure layout and general arrangement of the CMS is illustrated in Figure 74.
Caledonia Mining Corporation Plc
S-K 1300 Technical Report Summary on the Blanket Gold Mine, Zimbabwe
Figure 74: Surface Infrastructure Arrangement – Central Main Shaft
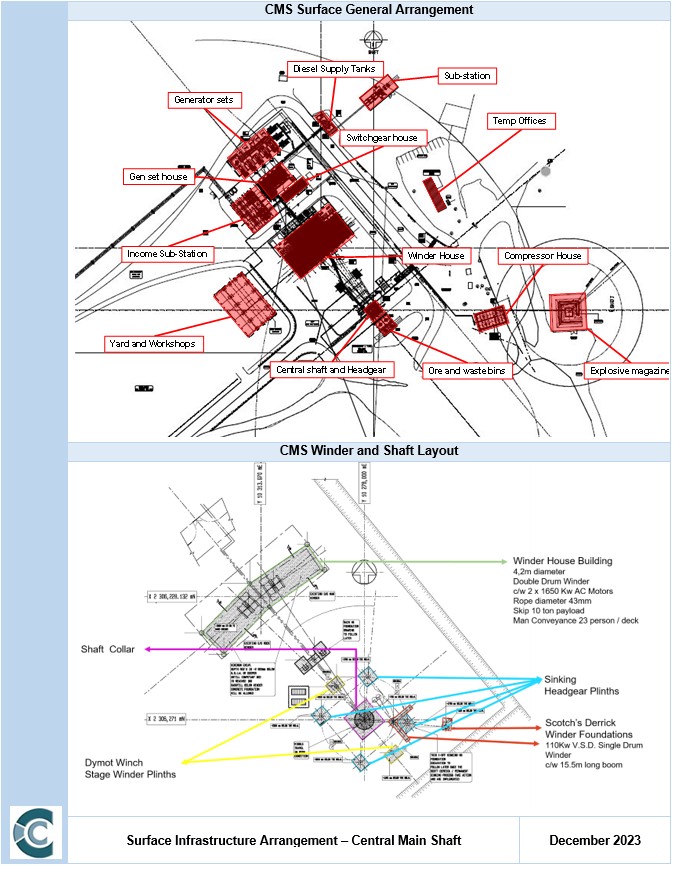
The 5 Winze currently extends from 140 m Level down to the 750 m Level, while 6 Winze currently extends down to 870 m Level. Men and materials are hoisted via the Jethro vertical shaft, 5 Winze and 6 Winze to underground mining areas, as well as through CMS since its commissioning in July 2021.
Caledonia Mining Corporation Plc
S-K 1300 Technical Report Summary on the Blanket Gold Mine, Zimbabwe
Development waste and ore are hoisted with two 5t skips at No. 4 Shaft and two 10 t auto discharging rock skips through the CMS. The loading level at CMS is equipped with a loading station as well as ore bins. The loading arrangement is equipped with loading flasks and spillage bins similar to the current arrangement at 789 - 813 m Level at No. 4 Shaft, which was fully automated by end of 2023.
The CMS loading station included two silos, 1 x waste and 1 x reef with bulkheads on 35 level feeding into the loading bin utilising a 1 050 mm conveyor belt.
II. Mining Section
Underground drilling is conducted with Seco 25, Seco 215 rock drills and Seco 36 (Konkola) drifters. The rock drills are used mainly for development and the drifters for production, i.e. long-hole drilling.
Similar to the underground rail-bound fleet, the same mining equipment utilised at the operational sections of Blanket Mine will be utilised once the expansion projects of CMS have been completed with some additional quantities to allow for the planned increase in production.
III. Dewatering
Currently, underground water is pumped to surface from the 7 Level pump station at a rate of between 70 m³ and 100 m³ per hour. The pump station has a maximum pumping capacity of 150 m³ per hour to handle excess water inflow (especially during the rainy seasons). Pumping is done in stages on different major levels: 7, 9, 14, 22 and 26, and all declines below 22L which include Decline 3, Decline 4 and Decline 5. CMS sections pump from 35L to 34L to 30L to 26L to 22L where all the water is combined before being pumped to 14L. All shafts have submersible pumps at the bottom of the shafts (Jethro, 5 Winze, 6 Winze shaft, No. 4 vertical shaft and CMS) which pump to the nearest major pump station. The pumps and dams throughout the section is listed in Table 58.
The CMS main pump station located at 35Level (belt and pump level) will be equipped with a 5 m diameter high-rate clarifier settler as well as a 7 m diameter vertical dam with a capacity of 1.5 Ml. Clear water will overflow from the settling arrangement into the clear water dam and the settler underflow will be pumped directly to surface with a positive displacement pump.
Item 15 (c) – Services
I. Power Supply and Reticulation
ZESA supplies power to Blanket Mine from their main Eagle Vulture 132KV/33KV substation about 17km out of Gwanda. The main supplies are the 33 kV and the 11 kV overhead lines. The 33 kV supply feeds Lima, Reclamation, the main substation at No. 4 Shaft (and adjacent to the processing plant) and Central Shaft and New Compressors. The 11 kV supply feeds slimes dam, Smiler shaft and the village. The 11 kV is further transformed to 550 V supply at Smiler and at Slimes dam. The ZESA power allocation to No. 4 Shaft, Central Shaft, Jethro Shaft, 5 Winze and 6 Winze Complex is 18MVA with a current nominal maximum demand (“NMD”) of 18MVA. An additional (Mtshabezi line) feeder is installed with a current nominal maximum demand (“NMD”) of 7 MVA.
Caledonia has constructed a solar plant adjacent to Blanket Mine. The solar plant was installed and commissioned by February 2023. The solar plant supplies 12 MW AC to the Blanket Mine power supply during daytime by way of a PPA.
Blanket also has 4 x 2.5 MVA generators located at No. 4 Shaft with total installed capacity of 10 MVA. Additional standalone diesel generators with suitable switchgear, transformers, and controls were also installed at CMS to ensure that the mine can stay operational during power interruptions. This additional installation has a total installed capacity of 8 MVA and is illustrated in Figure 119 Figure 119. Total installed generator capacity at Blanket is 18 MVA and connects by way of a ring feed to the entire mine.
Caledonia Mining Corporation Plc
S-K 1300 Technical Report Summary on the Blanket Gold Mine, Zimbabwe
At the Blanket main substation, the 33 kV line terminates into 2 x 3 MVA and 2 by 6MVA, 33 kV/2.2 kV transformers, and all 4 transformers are active. The 2.2 kV supply from one transformer feeds the main Blanket compressors and the underground reticulation feeder through an 1250A vacuum circuit breaker. The other 2.2 kV supply from the second transformer feeds the ROM section of the processing plant (on 2.2 kV and 550 V supply) through a 1250A vacuum circuit breaker.
The third transformer feeds the 2.2 kV No. 6 Ball Mill, CIL section and elution plant which operates on 400 V supply.
The main substation has a maximum demand of 15MVA at a calculated power factor of 0.85. The acquisition and installation of a power factor correction unit in 2022 improved the power factor to the required 0.99.
All equipment underground, i.e., winders, pumps and fans operate on 550 V. The 2.2 kV underground feeder is therefore transformed at different levels to run the relevant equipment on those levels.
The 33 kV ZESA supply at Lima terminates into a 2.5 MVA 33 kV/550 V transformer which supplies mainly the Lima hoist. The 2 x GA250 and 1 x GA160 screw compressors which used to be at Lima were moved to the new compressor shed at CMS. A power factor correction unit has been installed in this substation.
The 33 kV supply at reclamation terminates into a 1 MVA 33 kV/400 V transformer, which feeds the raw water supply pumps for the Central shaft.
Power to the new CMS complex is supplied via a 2.5 km 33 kV overland powerline leading to the shaft sub-station. Power is distributed through 2 x 6.3 MVA 33 kV/ 6.6 kV/525 V transformers and its associated switchgear. For the underground environment 250 kVA 6.6 kV/550 V transformers are used to drive larger components such as conveyors and larger portions of the production sections. 50 kVA 550 V/110 V transformers are used to step power down from 550 V for lighting purposes.
The expected NMD for CMS is 8MVA. Metering of the actual NMD is only 7.5 MVA, while the current ZESA total allocation to CMS is up to 12 MVA. The additional 4MVA is supplied by the Mtshabezi feeder.
II. Water Supply and Reticulation
ZIMWA holds all water rights in Zimbabwe and Blanket subsequently purchases process and domestic water from ZIMWA. Water for the mine, metallurgical plant and the mine village is obtained from the Blanket dam which is located 5 km east of the Mine. The Blanket Dam has a total capacity of 15 Mm³. In addition to this water source, the mine has equipped several boreholes to alleviate water shortages during the dry season and droughts.
An average of 120,000 m³ per month is pumped from the dam using 2 x 80/250 CEN stork pumps which are installed at the dam.
Two x 80/250 CEN stork pumps are also installed halfway between the dam and the mine. One of the pumps supplies water to the domestic water tanks where the water treatment plant is installed and the other pumps to the processing plant. The domestic water is purified at the water treatment plant, pumped to storage tanks and then gravitated to all the houses on the mine.
Most of the processing plant water is recycled from the new tailings facility and the old slimes dam and underground. However, besides additional water from the Blanket dam, as stated above, five boreholes have been drilled to augment the processing plant supply.
Capital is allowed for new pumps, valves and pipelines to be used for the reticulation of water on surface. Service water will be transported through these pipelines separate from potable water. Water on surface will be used for fire suppression and will service the ablution facilities of the shaft offices and change houses.
Caledonia Mining Corporation Plc
S-K 1300 Technical Report Summary on the Blanket Gold Mine, Zimbabwe
Additional water is pumped through to CMS for cooling the winders and compressors, with a smaller portion treated for potable use at CMS.
There are no material risks associated with the water supply to Blanket.
III. Ventilation
Ventilation at the Blanket Mine is largely natural with the No. 2 Main Incline shaft, Jethro shaft, 5 Winze shaft and 6 Winze sub-vertical shaft down-casting. Shafts such as Lima, Sheet and Jethro Winze are used for up-casting ventilation. A single booster fan as well as several other fans are installed at development ends to aid ventilation.
Once mining operations expand to the below 750 m Level the operation will remain naturally ventilated with the assistance of a number of booster fans, specifically in development ends. Ventilation throughout the workings is deemed to be sufficient for the current and planned production rates.
IV. Compressed Air
Underground drilling and lashing are aided by compressed air. This creates a significant compressed air demand and subsequently a total compressed air capacity of 44 450 cfm is installed on the mine.
Compressed air is fed underground at Blanket via an 12" pipeline with an additional 4" line feeding the plant. The air supply at Lima is fed underground via a 6" pipeline, although currently there is no compressor installed at Lima.
A new compressor shed, complete with a 16t overhead gantry crane, was constructed and commissioned in 2023 at CMS to house the new TA6000 Ingersoll Rand 7000cfm compressor and all the other smaller compressors that were installed at CMS. Provision has been made in the new shed for a second TA6000 compressor to be installed at a later stage. This new battery of compressors supply CMS through a 12-inch column that runs from surface to 35L, branching off at every station from 22L.
This additional compressed air supply complements the existing compressed air infrastructure in order to sustain the increased tonnage profile and subsequent increase in drilling equipment. The compressors available at the Blanket No. 4 Shaft and CMS are listed in Figure 75 and Figure 76 respectively.
Figure 75: Compressors at Blanket
|
Item |
Description |
Voltage |
Rated |
Avg |
Power KW |
CFM |
CFM/KW |
|
1 |
ER8 No. 1 |
550 |
388 |
354 |
380 |
2,200 |
5.79 |
|
2 |
ER8 No. 2 |
2,200 |
105 |
89 |
380 |
2,200 |
5.79 |
|
3 |
Sullair No. 1 |
2,200 |
276 |
223 |
185 |
1,000 |
5.41 |
|
4 |
Sullair No. 2 |
550 |
276 |
220 |
185 |
1,000 |
5.41 |
|
5 |
Sullair No. 3 |
550 |
276 |
217 |
185 |
1,000 |
5.41 |
|
6 |
Centac No. 1 |
2,200 |
328 |
318 |
1,100 |
6,900 |
6.27 |
|
7 |
Centac No. 2 |
2,200 |
328 |
318 |
1,100 |
6,900 |
6.27 |
|
8 |
GA200 |
550 |
325 |
290 |
250 |
1,250 |
5.00 |
|
9 |
GA160 |
550 |
325 |
290 |
250 |
1,000 |
4.00 |
|
10 |
GA250 @ Plant |
380 |
325 |
290 |
250 |
1,500 |
6.00 |
|
11 |
GA250 @ Plant |
380 |
325 |
290 |
250 |
1,500 |
6.00 |
|
12 |
GA250 @ Plant |
380 |
325 |
290 |
250 |
1,500 |
6.00 |
|
Total Installed |
4,765 |
27,950 |
5.87 |
Caledonia Mining Corporation Plc
S-K 1300 Technical Report Summary on the Blanket Gold Mine, Zimbabwe
Figure 76: Compressors at Central Main Shaft
|
Item |
Description |
Voltage |
Rated |
Avg |
Power KW |
CFM |
CFM/KW |
|
1 |
GA250 No. 3 |
550 |
325 |
290 |
250 |
1,500 |
6.00 |
|
2 |
GA250 No. 4 |
550 |
325 |
290 |
250 |
1,500 |
6.00 |
|
3 |
GA250 No. 9 |
550 |
325 |
290 |
250 |
1,500 |
6.00 |
|
4 |
GA250 No. 1 |
550 |
325 |
290 |
250 |
1,500 |
6.00 |
|
5 |
GA250 No. 2 |
550 |
325 |
290 |
250 |
1,500 |
6.00 |
|
6 |
GA160 No. 1 |
550 |
216 |
204 |
250 |
1,000 |
4.00 |
|
7 |
GA160 No. 3 |
550 |
216 |
203 |
250 |
1,000 |
4.00 |
|
8 |
TA6000 No. 1 |
6,600 |
328 |
318 |
1,250 |
7,000 |
5.60 |
|
Total Installed |
3,000 |
16,500 |
5.50 |
V. Logistics
For details on logistics infrastructure (road, rail and means of transport) refer to Item 4 (b) and Item 4 (d).
ITEM 16 – MARKET STUDIES
Item 16 (a) – Commodity Market Assessment
The following sections provide an overview of the gold market. The QPs have reviewed these studies and analyses and are satisfied that the results support the assumptions in the Report.
Gold Commodity Overview - 2023
The following gold market conditions for the year of 2023 have been identified by the World Gold Council, as extracted from their Gold Demands Trends report and other World Gold Council data.
|
● |
Annual gold demand (excluding over-the-counter (“OTC”) demand) fell by 5% year-on-year (“y-o-y”). |
|
● |
Inclusive of significant OTC and stock flows (450t), total gold demand in 2023 was the highest on record at 4,899t. |
|
● |
Global central bank buying maintained a breakneck pace, |
|
● |
Global gold exchange traded finds (“ETFs”) saw a third consecutive annual outflow. |
|
● |
Annual bar and coin investment saw a mild contraction (-3% y/y) as divergent trends in key Western and Eastern markets offset one another. |
|
● |
Annual jewellery consumption held steady at 2,093t, even in the very high gold price environment. |
Caledonia Mining Corporation Plc
S-K 1300 Technical Report Summary on the Blanket Gold Mine, Zimbabwe
|
● |
Despite a Q4 recovery in electronics, the annual volume of gold used in technology fell below 300t for the first time in the data series. |
|
● |
Global central bank gold reserves swell by more than 1,000t for the second successive year. |
|
● |
Total gold supply in 2023 increased by 3% y-o-y as mine supply and recycling both posted growth. |
|
● |
The gold price averaged USD1,941/oz in 2023 compared to 1,825/oz in 2022. The gold price ended the year at USD2,078/oz, a record high year end close. |
World Gold Deposits and Reserves
According to the USGS minerals commodity database, there are almost 66,000 identified deposits in the world where gold features as the primary mineral. The geographical distribution of these is illustrated in Figure 77.
Figure 77: Global Distribution of Gold Deposits
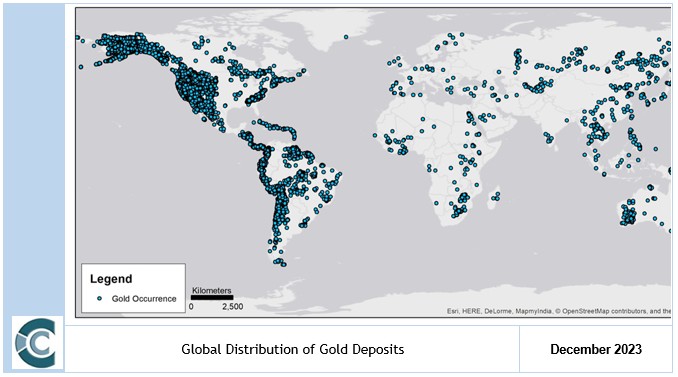
Notes: May be skewed towards availability of North American data
Source: USGC (2022)
From the image it can be seen that the majority of occurrences are concentrated in North America. The global minable gold reserves, however, are dominated by Australia, Russia and South Africa due to the higher-grade deposits found in these regions, with averages generally well above the global average of 1.01 g/t. Africa continues to be home to some of the highest grade (and highest risk) projects in the world. The average grade differs significantly (33%) between producing and undeveloped deposits. This has important implications on future gold production, and at a gold price reaching low levels, many of these projects will simply not be economically feasible.
Gold reserves are distributed globally as graphically portrayed in Figure 78, for some 1,907Moz Au.
Caledonia Mining Corporation Plc
S-K 1300 Technical Report Summary on the Blanket Gold Mine, Zimbabwe
Figure 78: Country Listing of Gold Reserves as at End 2023
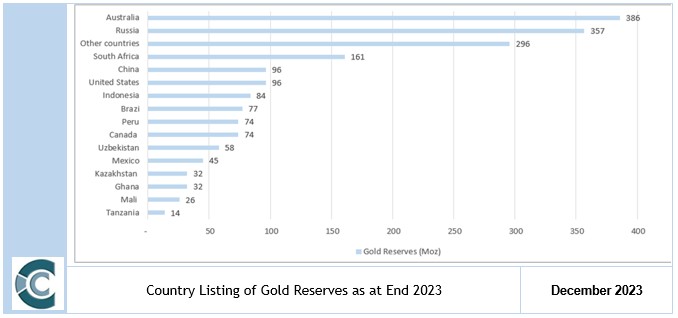
Data Source: US Geological Survey, Gold Data Sheet - Mineral Commodity Summaries 2024, January 2024
Gold Supply and Demand Fundamentals
Gold Supply
Total gold supply increased by 3% to y-o-y in the 2023 to 4,899 t - largely due to an increase in both mine production and recycling.
Mine Production
According to the World Gold Council (2023), mine production posted another gain, up 1% to 3,644 t. This total fell just short of the 3,656t record set in 2018. Table 40 shows the top 20 gold mining countries for the years 2021to 2022. China is the largest producer followed by Russia and Australia. South Arica occupies the 14th position, while Ghana is the largest producer in Africa.
Caledonia Mining Corporation Plc
S-K 1300 Technical Report Summary on the Blanket Gold Mine, Zimbabwe
Table 40: Top 20 Gold Mining Countries
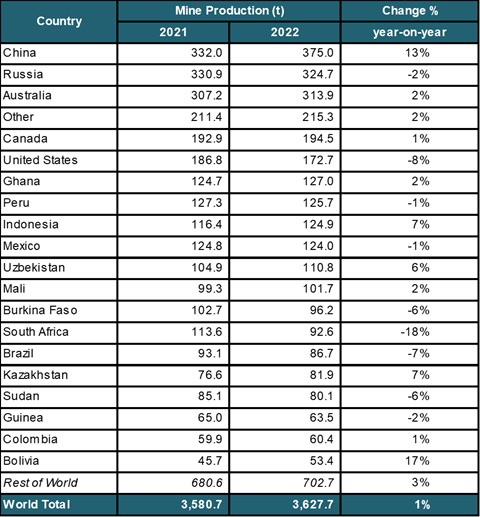
Source: World Gold Council (2023)
Net Producer Hedging
The industry aggregate producer hedge book is estimated to have increased 17t to 190t in 2023 (World Gold Council, 2023). Record high spot gold prices and attractive forward premiums for gold (due to much higher interest rates around the world) have made forward selling appear much more attractive than has been the case over the past decade when interest rates were essentially zero.
Recycling
The supply of recycled gold increased 9% y/y to 1,237t in 2023 as gold moved to record highs in almost every currency. Recycling rose y/y in all four quarters, with the largest increase (+13% y/y) in Q2’23 when the US dollar gold price surged to a new quarterly average high. (World Gold Council, 2023).
Gold Demand
Gold demand dipped 5% y-o-y from a strong 2022 (World Gold Council, 2023).
It has been another year of blistering central bank buying, together with resilient jewellery consumption that offset sizable ETF outflows.
Caledonia Mining Corporation Plc
S-K 1300 Technical Report Summary on the Blanket Gold Mine, Zimbabwe
Central bank buying maintained a breakneck pace. Annual net purchases of 1,037t almost matched the 2022 record, falling just 45t short.
Global gold ETFs saw a third consecutive annual outflow, losing 244t. The pace of outflows slowed markedly into year-end, but October’s hefty outflows dominated the Q4 picture.
Annual bar and coin investment saw a mild contraction (-3% y/y) as divergent trends in key Western and Eastern markets offset one another.
Annual jewellery consumption held steady at 2,093t, even in the very high gold price environment. China’s recovery supported the robust global total.
Despite a Q4 recovery in electronics, the annual volume of gold used in technology fell below 300t for the first time in our data series.
A breakdown of quarterly gold demand by sector is detailed in Figure 79.
Figure 79: Gold Demand 2022 vs. 2023
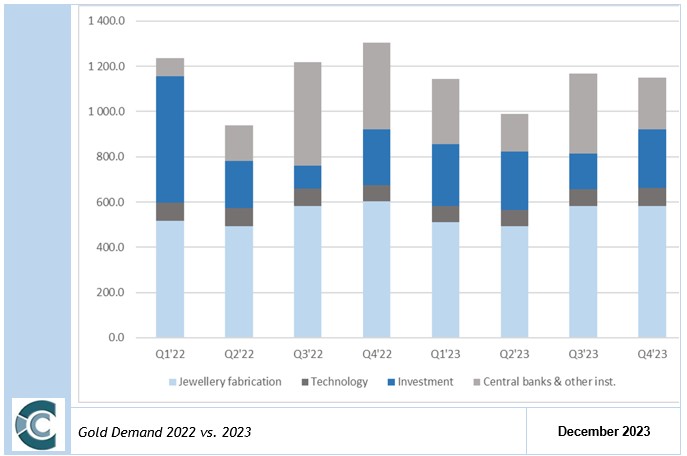
Investment
Gold exchange-traded products are traded on the major global stock exchanges including Zurich, Mumbai, London, Paris and New York and most funds are physically backed by vaulted gold. According to the World Gold Council (2023), total investment demand declined to a 10-year low of 945t in 2023 driven by the ETF outflows and the modest decline in bar and coin demand.
Caledonia Mining Corporation Plc
S-K 1300 Technical Report Summary on the Blanket Gold Mine, Zimbabwe
The 2023 full-year global investment demand (including bars, coins, and ETF’s) was the lowest since 2014. Gold ETFs contributed to much of the decline, as global outflows continued. Holdings of global gold ETFs fell by 244t in 2023 (-7%) with outflows of US$15bn.
Bar and coin demand softened by 3% in 2023, to 1,190t.
Technology
Application of gold in the technology sector remains relatively small. According to the World Gold Council (2023), demand rose by 12% y-o-y to 81t during Q4, driven by a recovery in electronics (+14% y-o-y to 66t). The full-year demand was down 4% to 298t. Consumer electronics demand has suffered throughout the year but there is optimism that the late recovery will continue into 2024.
Jewellery
According to the World Gold Council (2023), the annual gold jewellery consumption was only fractionally higher y-o-y even though the gold price set new records.
Central Banks
Central banks added more than 1,000 t to official gold reserves in 2023. Demand totalled 229 t in Q4, 35% lower q-o-q. This lifted the full year net purchases to 1,073 t, 4% lower than 2022. Sales were primarily from Uzbekistan and Kazakhstan.
Gold is politically independent and bears no credit risk. Some central banks have been pursuing an overt policy of dedollarisation. In response to the pressure of financial sanctions from the West, the Bank of Russia has been actively dedollarising their reserves, purchasing some 274 t of gold in 2019 (slowed sharply in 2020), and equally substantially decreasing the country’s holdings of US Treasuries. Gold is a safe haven as the international monetary system shifting towards multipolarity, thus will continue to be an important reserve asset for central banks. The top 40 countries’ official gold holdings as of December 2023 are displayed in Table 41.
Table 41: Official Gold Holdings per Country, 31 December 2023
|
Rank |
Country |
Tonnes |
Rank |
Country |
Tonnes |
|
|
1 |
United States |
8 133 |
21 |
Lebanon |
287 |
|
|
2 |
Germany |
3 352 |
22 |
Spain |
282 |
|
|
3 |
IMF |
2 814 |
23 |
Austria |
280 |
|
|
4 |
Italy |
2 452 |
24 |
Thailand |
244 |
|
|
5 |
France |
2 437 |
25 |
Singapore |
232 |
|
|
6 |
Russian Federation |
2 330 |
26 |
Belgium |
227 |
|
|
7 |
China, P.R.: Mainland |
2 257 |
27 |
Algeria |
174 |
|
|
8 |
Switzerland |
1 040 |
28 |
Venezuela, Republica Bolivariana de |
161 |
|
|
9 |
Japan |
846 |
29 |
Philippines |
157 |
|
|
10 |
India |
817 |
30 |
Iraq |
143 |
|
|
11 |
Netherlands, The |
612 |
31 |
Brazil |
130 |
|
|
12 |
Turkey |
556 |
32 |
Egypt, Arab Rep. of |
126 |
|
|
13 |
ECB |
507 |
33 |
Sweden |
126 |
|
|
14 |
Taiwan Province of China |
422 |
34 |
South Africa |
125 |
|
|
15 |
Portugal |
383 |
35 |
Mexico |
120 |
|
|
16 |
Uzbekistan, Rep. of |
369 |
36 |
Libya |
117 |
|
|
17 |
Poland, Rep. of |
359 |
37 |
Greece |
114 |
|
|
18 |
Saudi Arabia |
323 |
38 |
Korea, Rep. of |
104 |
|
|
19 |
United Kingdom |
310 |
39 |
Romania |
104 |
|
|
20 |
Kazakhstan, Rep. of |
306 |
40 |
Qatar |
103 |
Source: World Gold Council (2024)
Caledonia Mining Corporation Plc
S-K 1300 Technical Report Summary on the Blanket Gold Mine, Zimbabwe
Currency
As gold is usually traded relative to its USD price, the value of the dollar has a meaningful impact on gold. More importantly, gold is viewed as a natural hedge to the USD as it is not directly linked to the monetary or fiscal policies of a particular government. This characteristic strengthens their inverse relationship. Because the USD is also the primary currency used in global transactions and is seen as a stable and reliable unit of exchange, countries aim to have ample reserves to be able to meet their USD denominated liabilities. As such, the dollar forms the lion’s share of foreign reserve portfolios. However, governments need to manage the concentration risk in their reserves by diversifying into high quality, liquid assets that lack credit risk – like gold.
Gold is often seen as a currency that provides a natural alternative to money. Gold satisfies many criteria that define a currency, including its use as convertibility, store of value and medium of exchange. Through the years gold has the evolving nature of the relationship with the USD, its geological scarcity and its physical/chemical qualities as a non-corrosive, durable metal make it a natural hedge to paper currencies. Because fiat money can be printed as a result of monetary policies, part of gold’s value as a hard asset is derived from its lack of supply growth. Gold is a highly liquid asset, with daily trading volumes comparable to major currency pairs such as the USD-pound sterling and is eclipsed only by USD-Yen and USD-Euro transactions. The trade weighted US dollar index, which compares the US dollar to 23 different world currencies, can be compared to the gold price to demonstrate the relationship between the gold price and world currencies (Figure 80).
Caledonia Mining Corporation Plc
S-K 1300 Technical Report Summary on the Blanket Gold Mine, Zimbabwe
Figure 80: Gold Price vs Trade Weighted U.S. Dollar Index
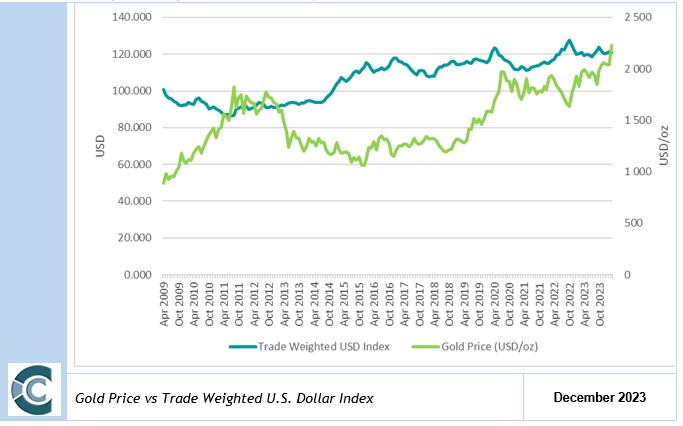
While gold is considered a commodity by many, in practice, its role as a currency stands out. It is used by central banks as part of their foreign reserves, accepted in exchange for goods in parts of the world, and traded alongside other currencies in the financial system. According to the Bank for International Settlements’ 2013 annual report, “gold is to be dealt with as a foreign exchange position rather than a commodity because of its volatility (which is almost consistently lower than commodities) is more in line with foreign currencies, and banks manage it in a similar manner to foreign currencies”.
An allocation to gold, denominated in USD, represents an implicit exposure to a foreign currency, providing international investors with protection against falls in their local currency.
Further, when evaluating a portfolio’s exchange risk in light of its foreign currency denominated holdings, gold can be used as a cost-effective and better-rounded complement to other hedging strategies. For example, for a US investor trying to hedge currency risk stemming from emerging market exposure, gold has been historically less costly than a basket of currencies and including gold as part of the hedging strategy has significantly reduced drawdowns.
Driven by China’s desire to increase its financial influence, the Chinese Renminbi is likely to emerge gradually as a genuine international currency as Beijing eases restrictions on its use in transactions and investments abroad. It is expected that during the coming period of uncertainty and transition between different reserve currencies, official central bank asset managers around the world are likely to increase their interest in gold as a result of doubts about the overall strength of global monetary arrangements. This has been prominent since the economic downturn in 2008.
US Inflation and Interest Rates
A common argument for buying gold is that it is seen as an inflation hedge. Consumer price indices (“CPI”) measure ‘representative’ baskets of goods that may well reflect a general price trend, but these will likely not reflect everyone’s experience of inflation. The reason for the US CPI being the measure most widely used to measure gold’s effectiveness as hedge, is due to the fact that gold is traded by the USD and that real interest rates create an opportunity cost for holding gold make US inflation a logical candidate to use as a reference in long-term pricing.
Caledonia Mining Corporation Plc
S-K 1300 Technical Report Summary on the Blanket Gold Mine, Zimbabwe
Real US rate is the lending interest rate adjusted for inflation, as measured by the gross domestic product deflator. From Figure 81 when the real US rate becomes negative, the gold price increases, which indicates that investors start investing in gold rather than the banks to receive better returns. The change in real interest rates since 2018 has been a supportive driver of the gold price.
Figure 81: Gold Price vs. Real USD Rate
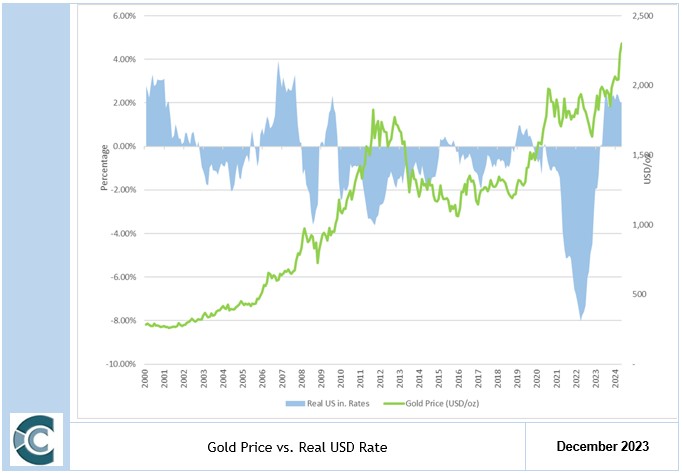
Gold Pricing
Gold was one of the best performing assets in 2023. The gold price ended 2023 at USD2,078/oz – a record high year end close. The average gold price for the year of USD1,941/oz was also a record and 8% higher y-o-y.
The gains were primarily driven by investors turning to gold as a safe-haven investment amid the COVID-19 pandemic uncertainties, the Ukraine and Gaza wars as well as the very low interest rate environment. As economies have started recuperating, gold prices have declined while remaining relatively high.
Gold's price forecast for Q1 2024 at Bloomberg Terminal is between USD1,913.63 - USD2,224.22. Commodity analysts expect the potential upside of the gold price to be closely tied to changes in US interest rates and dollar movements, leading them to raise the gold price target for 2024 to USD2,050 an ounce. Figure 82 shows the gold price since 2000, with the impact of COVID-19 and the various wars clearly reflected in 2020 and 2023.
Caledonia Mining Corporation Plc
S-K 1300 Technical Report Summary on the Blanket Gold Mine, Zimbabwe
Figure 82: Gold Yearly Prices
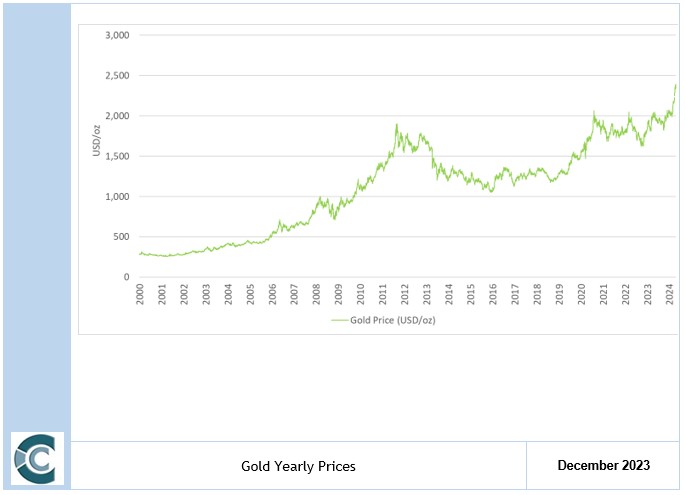
Consensus opinion has the real gold price remaining relatively constant (and high) over the short term and reducing over the medium to long term.
Table 42: Gold Price Forecast (Nominal Terms)
|
Unit |
2024 |
2025 |
2026 |
2027 |
2028 |
2029 |
Long term (Constant) |
|
|
Gold |
USD/oz |
2,205 |
2,195 |
2,054 |
2,024 |
1,852 |
1,982 |
1,982 |
Source: Consensus Economics Inc.
Gold Outlook
The World Gold Council, said in its annual gold outlook research that Central Bank buying and geopolitical tensions may provide support for the gold price in 2024. Their outlook for 2024 presents a variety of scenarios depending on how the economy fares, and how that could affect the gold price. If the economy contracts (recession) gold tends to rise because people look to put their assets in a safe-haven investment while markets are volatile. If the economy grows, gold may coast along with little growth as investors seek returns elsewhere.
Whatever the actual performance of the economy in 2024, the World Gold Council believes there is support for gold from the volatility caused by geopolitical tensions and more Central Bank demand.
Gold's price forecast for Q1 2024 at Bloomberg Terminal is between USD1,913.63 - USD2,224.22. Commodity analysts expect the potential upside of the gold price to be closely tied to changes in US interest rates and dollar movements, leading them to raise the gold price target for 2024 to USD2,050 an ounce.
The Office of Australia’s chief economist (2024) is forecasting gold prices to remain elevated in 2024.
Caledonia Mining Corporation Plc
S-K 1300 Technical Report Summary on the Blanket Gold Mine, Zimbabwe
The latest Energy Quarterly report from the Australian Department of Industry, Science and Resources (DISR) expects gold to average about US$2,020/oz in 2024 – a 6% upward revision to its previous estimate.
It is expected that once monetary easing commences, gold prices are expected to receive a further boost leading into 2025 as the US dollar eases and investors gain greater clarity on the pace and scale of further rate cuts.
Gold prices are forecast to average US$2,030/oz in 2025, supported by monetary easing and continued strength in demand. World gold consumption is forecast to grow by 2.7% a year from 2026 to reach 4,700 tonnes in 2029.
Item 16 (b) – Contracts
On 28 January 2014 Caledonia announced that as a result of new regulations introduced by the Zimbabwe Ministry of Finance, all gold produced in Zimbabwe must now be sold to Fidelity Gold Refinery (Private) Limited ("Fidelity"), a company which is controlled by the Zimbabwean authorities, and which is now responsible for the final refining and marketing of all gold produced in Zimbabwe. Blanket produces oré bullion which is processed at ("Fidelity), a subsidiary of the Reserve Bank of Zimbabwe (“RBZ”). Fidelity processes Blanket’s bullion in accordance with requirements of the Zimbabwe government for in-country refining and to allow the Zimbabwe authorities full visibility over the bullion sold to Fidelity or exported by Caledonia.
25% of the Blanket bullion ounces is sold to Fidelity. A 5% royalty is levied on 100% of bullion ounces sold by Blanket and is collected by Fidelity on behalf of the Zimbabwean government. Fidelity collects half of the 5% royalty in physical bullion and reduces 100% of the bullion proceeds on a 75:25 USD to RTGS$ basis. The remaining 71.25% per cent of the bullion ounces (i.e. 75% of the ounces after deducting the USD royalty portion (75%*5%)) are refined at Fidelity on a toll-treatment basis and then exported by Caledonia using Fidelity’s gold dealing licence to a refiner outside Zimbabwe which undertakes final refining and purchases the bullion.
Revenue for each RTGS$ delivery to Fidelity is measured at the previous day’s London Bullion Market Association afternoon fix of the day of packing for bullion export and the quantities are determined on local lodgement date. Per the contract, settlement on precious metal sales to Fidelity should occur within 14 days.
Revenue for each USD export delivery is measured at the London Bullion Market Association price post-delivery less a refining fee and the quantities are determined on Export lodgement date. On average settlement occurs within two days of delivery.
ITEM 17 – ENVIRONMENTAL STUDIES, PERMITTING AND PLANS, NEGOTIATIONS, OR AGREEMENTS WITH LOCAL INDIVIDUALS OR GROUPS
Item 17 (a) – Relevant Environmental Issues and Results of Studies Done
Information regarding environmental consideration is taken largely from AGS (2006), Fraser Alexander Zimbabwe (Pty) Ltd (March 2010) and Blanket Mine (November 2009).
SRK completed a full EIA in 1995 to identify the major detrimental aspects of the mining operation and recommend remedial measures. It was identified that there is potential to pollute groundwater from the TSF. Per MSA (2011), a risk assessment of the TSF complex was completed in 2002 including safety and environmental aspects of deposition and stability analysis. The dam was not lined prior to deposition, and MSA stated that seepage will decline as the slime level rises. An additional mitigating factor is that the seepage waters are not acidic and established dewatering holes lower the pollution to more acceptable levels.
Caledonia Mining Corporation Plc
S-K 1300 Technical Report Summary on the Blanket Gold Mine, Zimbabwe
No further significant detrimental environmental impacts were identified by that study. No further environmental studies or assessments have been provided to the QPs. The QPs are not aware of environmental issues that could materially impact the issuer’s ability to extract the Mineral Resources or Mineral Reserves.
Caledonia, the owners of the mine from June 2006 to date, developed an Environment Management Plan, which describes the plan followed by the mine staff to ensure continuous environmental improvement and management. An updated Environment Management Plan was registered with the EMA in 2020. This serves as the guideline for all environmental issues at Blanket Mine and deals with new environmental disturbances that requires additional permits and authorisations further to those described in Table 4.
Caledonia endeavours to address any newly identified potential environmental impacts through appropriate study work, and remain transparent and complaint in terms of required authorisations.
Item 17 (b) – Waste Disposal, Site Monitoring and Water Management
Blanket Mine has two tailings storage facilities as described above for disposal of tailings from the gold processing plant. The old TSF has reached capacity, and deposition is being phased out on this dam. A closure plan will be developed and implemented, and the dam continues to be monitored for stability, phreatic levels and groundwater quality. Rehabilitation of the side slopes of the dam has commenced.
The new TSF was commissioned in February 2024, and deposition of tailings is now taking place into this facility. The new TSF has been classified as Type 3 waste, and the recommended barrier system of a 1.5mm HDPE geomembrane placed over a 300mm compacted clay liner has been put in place. According to the SANS 10286 Safety Classification, the facility is classified as a medium hazard. Phase 1A of the new TSF was commissioned in February 2024, and deposition of tailings has been phased over to the new facility.
Fraser Alexander Zimbabwe manages both of the TSFs at Blanket Mine, and the Engineer of Record is Epoch Resources.
The EMA has stipulated water monitoring parameters in the tailings disposal permits for the TSFs. The parameters to be sampled for the old TSF (red licence) are pH, chemical oxygen demand (COD), cyanide (CN), manganese (Mn), iron (Fe), conductivity, arsenic (As), copper (Cu), lead (Pb) and zinc (Zn). Elevated levels of Mn have been detected in the water samples of the old TSF, but these occur in both the control and TSF boreholes, indicating that the elevated Mn levels are a result of local conditions rather than as a result of tailings disposal. Parameters to be sampled for the new TSF (blue licence) are heavy metals, pH, conductivity, phosphates and nitrates.
Similar monitoring of the sewage disposal area shows that all holes are in the acceptable green category. The sewerage ponds are classified in the red category under the EMA as they are not lined.
Environmental monitoring or sampling requirements are stipulated for a number of the environmental permits issued (shown in Table 12), as listed in Table 64.
Table 64: Environmental Permits Monitoring and Sampling Requirements
|
Licence |
Licence Number |
Monitoring/Sampling Requirement |
Period |
|
Air Emissions - Diesel generator |
L0000010451 |
Particulate matter (PM10), NOx, CO, SOx |
Quarterly |
|
Air Emissions - Clinic incinerator |
L0000010449 |
Particulate matter (PM10), NOx, CO, SOx |
Quarterly |
|
Air Emissions - Blacksmith |
L0000010452 |
Particulate matter (PM10), NOx, CO, SOx |
Quarterly |
|
Air Emissions - Assay laboratory |
L0000010453 |
Particulates (lead oxide) |
Quarterly |
|
Air Emissions - Smelter |
L0000010450 |
Particulate matter (PM10), NOx, CO, SOx |
Quarterly |
|
Effluent Disposal - Washbay |
L0000010455 |
EC, pH, Phosphates, Nitrates, Grease & Oils |
Quarterly |
|
Effluent Disposal - Workshop |
L0000010456 |
EC, pH, Phosphates, Nitrates, Grease & Oils |
Quarterly |
|
Effluent Disposal - Sewage ablution |
L0000010454 |
Phosphates, Nitrates, BOD, EC, TSS, TDS |
Quarterly |
|
Solid Waste Disposal - Domestic waste |
L0000010457 |
Heavy metals, pH, Phosphates, Nitrates, Electrical conductivity |
Quarterly |
|
Solid Waste Disposal – old TSF |
L0000010458 |
Heavy metals, pH, Phosphates, Nitrates, Electrical conductivity |
Quarterly |
|
Solid Waste Disposal – new TSF |
L0000010462 |
Heavy metals, pH, Phosphates, Nitrates, Electrical conductivity |
Quarterly |
Caledonia Mining Corporation Plc
S-K 1300 Technical Report Summary on the Blanket Gold Mine, Zimbabwe
Air emissions sampling exercises are completed annually. Blanket Mine has informed the QP that EMA conducts quarterly site inspections and is satisfied with these procedures.
The TSF borehole monitoring, sewage ponds and car wash monitoring are undertaken quarterly.
Item 17 (c) – Permit Requirements
Permit requirements for the Mine are detailed in Item 3 (f). A number of licences are renewed annually; renewal periods are not expected to hinder operations. Blanket Mine remains compliant with legislation and all regulations applicable to the mine site.
Item 17 (d) – Social and Community-Related Requirements
10% of Blanket Mine is owned by the Gwanda Community Share Ownership Trust (GSCOT), whereby local socio-economic development is facilitated through dividends paid to the entity.
In addition to the dividend payments to the GSCOT, Blanket Mine undertakes investment in community and social projects under six pillars, which include education, health, women and youth empowerment, agriculture, environment and charity. Projects undertaken during 2023 included the renovation of and construction of science and computer laboratories at Sitezi Secondary School, upgrading of Sabiwa stadium, upgrades to Sitezi clinic, community boreholes at Gwakwe, funding of attachment students, road repairs, irrigation water supplied to Gwakwe gardens, as well as donations to various charities. Community investment in 2023 was $1,504,000.
Small scale and artisanal gold miners are present within the Project Area. Satellite projects deemed to have limited exploration potential are viewed in terms of their potential to generate goodwill by making them available to local small-scale miners and artisanal groups through 3-year renewable Tribute Agreements as part of the Company’s Corporate Social Responsibility. The claims that are being tributed are Mbudzane Rock, Annette, Dan’s Luck, Banshee J, Cinderella, Gum, Mazeppa, Will South, Rubicon and Bunny’s Luck. Other than for the purpose of the Company’s Corporate’s Social Responsibility, tributing claims provides Blanket Mine with security of tenure against the “Use it or lose it principle”. The tribute agreements do not have any effect on Blanket Mine’s exploration/mining plans.
Item 17 (e) – Mine Closure Costs and Requirements
The closure plan for Blanket Mine was updated by Knight Piésold in December 2023. The purpose of the report was to update the closure plan assessment undertaken in 2021, and to include material changes to the mine’s operations in the closure cost calculation (12.2 MWAC solar plant and the new tailings storage facility). The gross closure cost for Blanket Mine, before discounting, as at the end of 2023 was $5.7 million.
Caledonia Mining Corporation Plc
S-K 1300 Technical Report Summary on the Blanket Gold Mine, Zimbabwe
There are a number of Government of Zimbabwe regulations and guidelines including the Mining General Regulations, the EMA Act and the Waste Disposal Regulations which cover a mine’s closure obligations. These are all addressed and costed in the Knight Piésold report. The closure plan aims to ensure site stability and safety from both a physical and chemical perspective, allowing for a post-closure environment that suits current land uses. The plan envisages concurrent closure obligations being carried out, where possible, with mining operations. Focus is placed on minimisation of environmental damage, protection of stream water quality, decrease in public health and safety hazards and provision for domestic livestock use.
Item 17 (f) - Adequacy of Current Plans
It is the opinion of the QPs that Blanket Mine has adequate plans, protocols and execution strategies in place to remain compliant with social and environmental obligations. No risks have been identified.
Item 17 (g) – Local Procurement and Hiring
The main priority of Blanket Mine Company with respect to procurement of goods and services is to procure such goods and services from within Zimbabwe. However, the cost, quality, and availability of goods and services is considered when a procurement decision is being made. If goods or services are not available within Zimbabwe or there is a significant benefit to buying outside of Zimbabwe, the blanket mine company would buy elsewhere.
All of Blanket Mine Company’s employees at Blanket are Zimbabwean nationals and the company recruits Zimbabwe people with the level of skill and experience required of the relevant position.
ITEM 18 – CAPITAL AND OPERATING COSTS
Item 18 (a) – Capital Costs
The capital cost includes mainly capital expenditure for the completion of the CMS project as well as the sustaining capital associated with existing infrastructure and equipment. Sustaining capital expenditures are capital expenditures resulting from improvements to and major renewals of existing assets. Such expenditures serve to maintain existing operations, but do not generate additional revenue. Sustaining capital for the operation from 2024 has been allowed for and is based on 12% of total OPEX per annum, in line with the previous report.
Off-reef development and infrastructure development has been capitalised from the mining operating cost and is reported as capital development. The capital development is undertaken throughout the LoM and consists mainly of opening-up development and 30 Level, 34 Level and declines to 38 Level infrastructure development. The QPs applied the capital development rates provided by Caledonia in the 2023 budget. The capital development rates are detailed in Table 43.
Table 43: Capital and Infrastructure Development Costs
|
Capital and Infrastructure Development |
Unit |
Cost |
|
Decline |
USD/m |
2,150 |
|
Haulage |
USD/m |
900 |
|
Draw point Crosscut |
USD/m |
900 |
|
Crosscut |
USD/m |
900 |
|
Shaft |
USD/m |
900 |
|
Ventilation Raise |
USD/m |
478 |
|
Access Crosscut |
USD/m |
900 |
Notes: Other development costs have been included in the development operating costs.
Caledonia Mining Corporation Plc
S-K 1300 Technical Report Summary on the Blanket Gold Mine, Zimbabwe
Table 44 details the total capital expenditure over the LoM. Capital expenditure totals USD149.6 million over the LoM, of which USD47.4 million is capital development. No additional contingencies have been applied to the budgeted capital expenditure, with longer terms budgets provided. A sensitivity to inclusion of contingencies can be seen in Table 44.
Table 44: Capital Summary
|
Capital Expenditure |
Over LoM |
Blanket Mine |
|
Mining Capital |
Unit |
|
|
Mechanical Engineering |
USDm |
18.6 |
|
Electrical Engineering |
USDm |
11.8 |
|
Deep drilling |
USDm |
10.0 |
|
Central Shaft |
USDm |
23.1 |
|
Capitalised Development |
USDm |
47.7 |
|
Sub-Total Sustaining Mining Capital |
USDm |
110.9 |
|
Total Mining Capital |
USDm |
110.9 |
|
Plant Capital |
||
|
TSF Phase 1 |
USDm |
6.8 |
|
TSF Phase 2 |
USDm |
6.7 |
|
Sub-Total Expansion Plant Capital |
USDm |
13.5 |
|
Mill Engineering |
USDm |
10.1 |
|
Milling |
USDm |
4.1 |
|
Sub-Total Sustaining Plant Capital |
USDm |
14.2 |
|
Total Plant Capital |
USDm |
27.7 |
|
Other Non-Direct Capital |
||
|
Technical (Planning & Survey) |
USDm |
7.5 |
|
Administration |
USDm |
3.5 |
|
Sub-Total Sustaining Other Capital |
USDm |
11.0 |
|
Total Other Capital |
USDm |
11.0 |
|
Total Expansion Capital |
USDm |
13.5 |
|
Total Sustaining Capital |
USDm |
136.1 |
|
Total Capital |
USDm |
149.6 |
Caledonia Mining Corporation Plc
S-K 1300 Technical Report Summary on the Blanket Gold Mine, Zimbabwe
Figure 83 illustrates the capital schedule over the LoM.
Figure 83: Capital Schedule
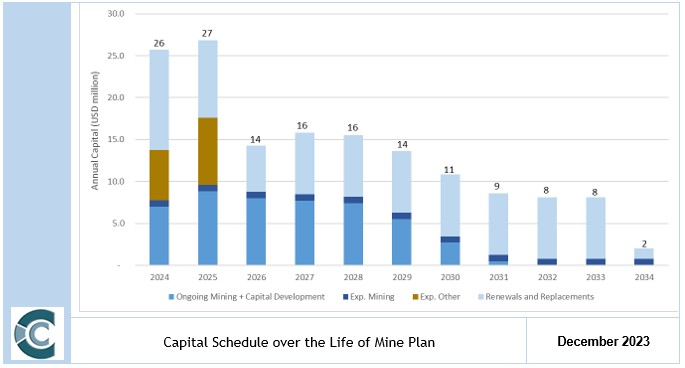
Item 18 (b) – Operating Cost
The Company reviewed Blanket Mine’s actual historic costs since 2017. From the information received it is clear that the historic costs remained relatively consistent ranging between USD2.7 million per month and USD3.6 million per month, fluctuating with tonnes from 2017 to June 2021. The cost per milled tonne in the same period typically ranged between USD65/t and USD80/t excluding outliers and ignoring June 2018 and July 2019, where extraordinary cost adjustments on power were applied. Operating costs considerably increased from July 2021 to 2024 due to increased milling capacity, headcount and increased power utility costs, ranging between USD4.2m and USD5.6m per month. Blanket opted to use the conservative twelve-month average 2024 forecast for financial modelling as this is deemed a true reflection of the actual costs on the mine. A sensitivity to the operating cost applied is included in Item 19 (b).
Caledonia Mining Corporation Plc
S-K 1300 Technical Report Summary on the Blanket Gold Mine, Zimbabwe
Figure 84: Historical Operating Costs
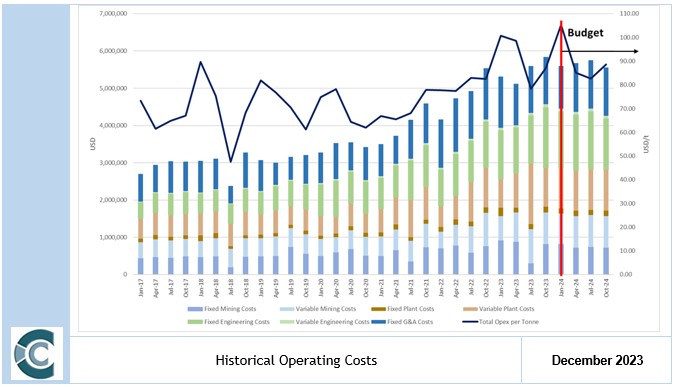
Note: Excluding management and shared service costs
Management and shared service costs as per the 2023 Blanket budget were also considered for the financial analysis. These costs are detailed in Table 45.
Table 45: Management and shared service costs
|
Management Costs |
Unit |
USD |
|
Shares Service Centre South Africa |
USD/month |
305,280 |
|
Shares Service Centre Zimbabwe |
USD/month |
222,300 |
|
Total Management Cost |
USD/month |
527,580 |
A sensitivity to the operating cost applied is included in Item 19 (d).
IV. Financial Costs Indicators
The operating costs in the financial model were reported into different categories as defined by the World Gold Council. Table 46 illustrates a breakdown off all the costs included in each costing category:
· (Operating) Adjusted Operating Cost;
· AISC; and
· AIC.
Caledonia Mining Corporation Plc
S-K 1300 Technical Report Summary on the Blanket Gold Mine, Zimbabwe
Table 46: Financial Cost Indicators
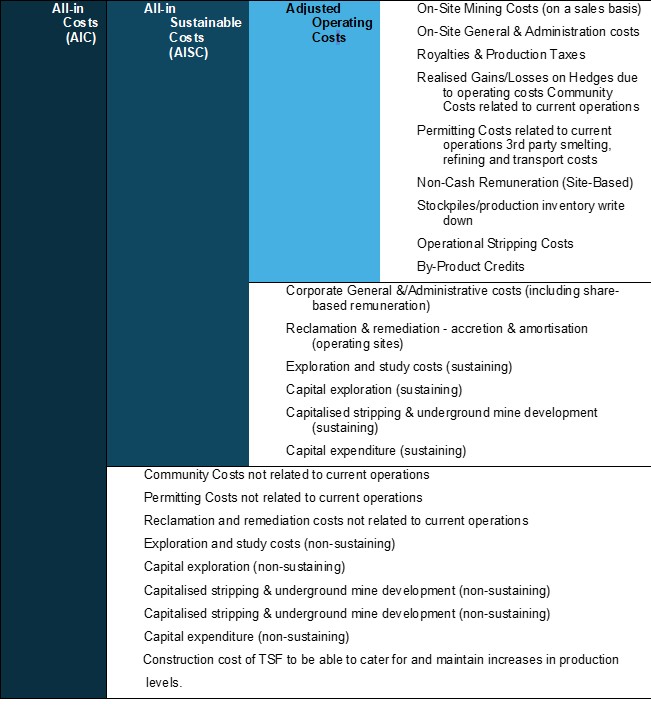
The general definitions of these costs are as follows:
Adjusted Operating Cost
The Adjusted Operating Cost represents the cash cost incurred at each processing stage, from mining through to recoverable metal delivered to market, and, if any, less net by-product credits. In addition, royalty taxes are included in Adjusted Operating Costs. Costs are reported as “per oz” of gold. The operating margin is defined as metal price received minus Adjusted Operating Costs.
Adjusted Operating Costs cover:
· mining, ore freight and milling costs;
· ore purchase and freight costs from third parties in the case of custom smelters or mills;
Caledonia Mining Corporation Plc
S-K 1300 Technical Report Summary on the Blanket Gold Mine, Zimbabwe
· mine-site administration and general expenses;
· concentrate freight, smelting and smelter general and administrative costs;
· matte freight, refining and refinery general and administrative costs;
· marketing costs (freight and selling);
· community relations costs; and
· royalty taxes.
All-in Sustainable Cost
AISC is the sum of net Adjusted Operating Costs (Operating), Sustaining Capital, reclamation costs and other non-direct operating costs. The AISC margin is defined as metal price received per ore tonne or gold ounce minus the AISC, over the metal price received. Non-direct operating costs cover:
· the portion of corporate and divisional overhead costs attributable to the operation; and
· research and exploration not attributable to the operation.
All-in Cost
AIC is the sum of the AISC, all non-sustaining capital costs and non-current operational costs and includes the construction cost of tailings facilities to enable to mine to increase and maintain production over the life of mine. The AIC margin is defined as metal price received per ore tonne or gold ounce minus the AIC, over the metal price received.
Costs reported for the Mine on this basis are displayed per plant feed tonne as well as per recovered gold ounce in Table 47. It should be noted that no contingencies have been applied to the operating costs as most of these costs are based on contracts or actuals. A 13% contingency has been applied to the capital expenditure. A sensitivity analysis to increase in OPEX and CAPEX has been included in Item 19 (d).
Caledonia Mining Corporation Plc
S-K 1300 Technical Report Summary on the Blanket Gold Mine, Zimbabwe
Table 47: Project Cost Indicators
|
Item |
Unit |
Blanket Mine |
|
Net Turnover |
USD/Feed tonne |
171 |
|
Mine Cost |
USD/Feed tonne |
31 |
|
Plant Costs |
USD/Feed tonne |
17 |
|
Other Costs |
USD/Feed tonne |
48 |
|
Operating Costs |
USD/Feed tonne |
96 |
|
SIB |
USD/Feed tonne |
18 |
|
Royalties |
USD/Feed tonne |
9 |
|
Reclamation |
USD/Feed tonne |
0 |
|
Other Costs |
USD/Feed tonne |
7 |
|
All-in Sustainable Costs (AISC) |
USD/Feed tonne |
130 |
|
Capital |
USD/Feed tonne |
2 |
|
Other Cash Costs |
USD/Feed tonne |
0 |
|
All-in Costs (AIC) |
USD/Feed tonne |
132 |
|
All-in Cost Margin |
% |
23% |
|
EBITDA1 |
USD/Feed tonne |
76 |
|
EBITDA Margin |
% |
44% |
|
Gold Recovered |
oz |
757,238 |
|
Average Gold Price |
USD/Gold oz |
1,877 |
|
Net Turnover2 |
USD/Gold oz |
1,739 |
|
Mine Cost |
USD/Gold oz |
311 |
|
Plant Costs |
USD/Gold oz |
171 |
|
Other Costs |
USD/Gold oz |
485 |
|
Operating Costs |
USD/Gold oz |
967 |
|
SIB Capex |
USD/Gold oz |
179 |
|
Royalties |
USD/Gold oz |
93 |
|
Reclamation |
USD/Gold oz |
1 |
|
Other Costs |
USD/Gold oz |
72 |
|
All-in Sustainable Costs (AISC) |
USD/Gold oz |
1,312 |
|
Capital |
USD/Gold oz |
18 |
|
Other Cash Costs |
USD/Gold oz |
0 |
|
All-in Costs (AIC) |
USD/Gold oz |
1,330 |
|
EBITDA |
USD/Gold oz |
771 |
Notes:1. Earnings before interest, tax, depreciation and amortisation (excludes CAPEX)
Figure 85 illustrates the annual operating cost per plant feed tonne against the feed tonnes. The increase in costs towards the end of life is due to the depletion of the potential Mineral Reserves.
Caledonia Mining Corporation Plc
S-K 1300 Technical Report Summary on the Blanket Gold Mine, Zimbabwe
Figure 85: Operating Costs vs. Feed Tonnes
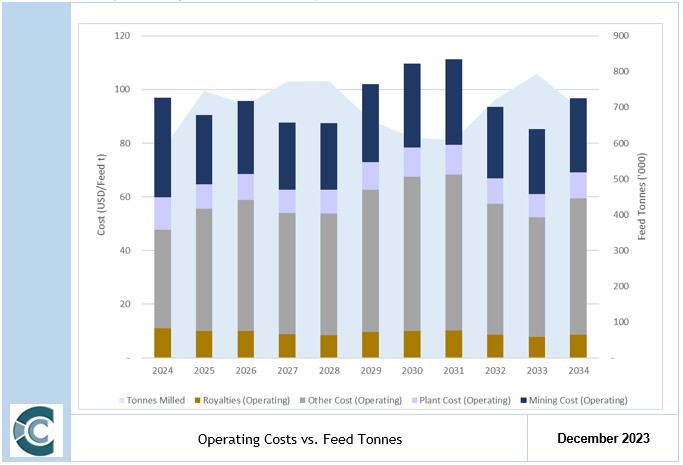
Caledonia Mining Corporation Plc
S-K 1300 Technical Report Summary on the Blanket Gold Mine, Zimbabwe
Figure 86 illustrates the all-in costs of the operation along with the realised gold price after applying the 98.5% payability.
Figure 86: AIC vs. Realised Gold Price
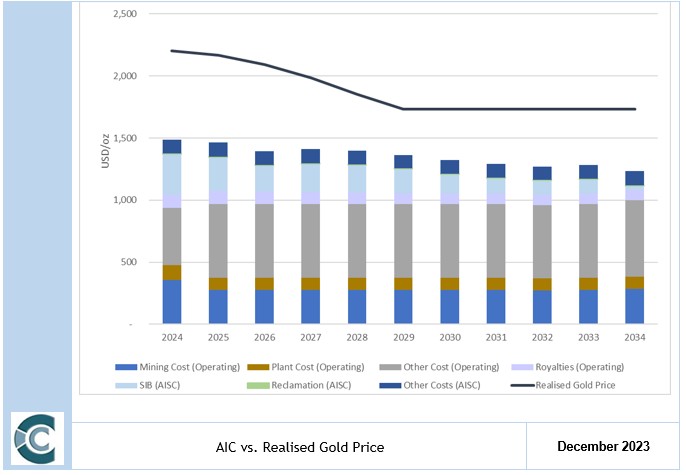
Item 18 (c) – Accuracy of Estimates
Blanket Mine is an operating mine. Costs are from the mine budgets and based on actual rates and are deemed accurate to within a 10% to 15% range. The basis of this TRS is a life of mine plan, which is of sufficient detail to support declaration of Mineral Reserves.
ITEM 19 – ECONOMIC ANALYSIS
The purpose of this section is to demonstrate the economic viability of the Mine Plan in order to declare updated Mineral Reserves.
Value relates to a specific point in time. The effective date for the economic analysis is March 1, 2024.
The evaluator performed an independent economic analysis on the Mine’s diluted Indicated and Measured Mineral Resources for conversion to Mineral Reserves. The Project has a budget plan based on a compliant mine plan with Indicated and Measured Resources. Thus, the income approach was applied on the total mineable reserve incorporated in the detailed mine plan as the primary economic analysis methodology in determining the economic viability for conversion to Mineral Reserves.
Caledonia Mining Corporation Plc
S-K 1300 Technical Report Summary on the Blanket Gold Mine, Zimbabwe
Item 19 (a) - Principal Assumptions
The scope of this economic analysis exercise was to determine the financial viability of the diluted Indicated and Measured Resources in the LoM plan, for conversion to Mineral Reserves. This is illustrated by using the DCF method on a Free cash flow to firm (“FCFF”) basis, to calculate the net present value (“NPV”) and subsequently, the intrinsic value of the Mine in real terms. The NPV is derived from post-royalties and tax, pre-debt real cash flows, after considering operating costs, capital expenditures for the mining operations and the processing plant and using forecast macro-economic parameters.
I. Basis of Evaluation of the Mining Assets
In generating the financial model and deriving the economic analysis, the following were considered: -
|
● |
Only diluted Indicated and Measured Resources in the LoM plan were considered for conversion to Mineral Reserves. |
|
● |
Any Inferred Mineral Resources in the LoM plan have been excluded from the economic analysis. |
|
● |
This Report details the optimised cash flow model with economic input parameters. |
|
● |
The cash flow model is in constant money terms and completed in USD. |
|
● |
The DCF economic analysis was set up in calendar years from January to December with the mine plan starting on March 1, 2024. |
|
● |
A hurdle rate of 15.4% (in real terms) was calculated for the discount factor, with an NPV sensitivity to the discount rate also included in the analysis. |
|
● |
The impact of the Mineral Royalties Act as per the Zimbabwean Mining Regulation. |
|
● |
Sensitivity analyses were performed to ascertain the impact of discount factors, commodity prices, grade, working costs and capital expenditures. |
|
● |
Economic analysis of the tax entity was performed on a stand-alone basis. |
|
● |
The full value of the operation was reported for Blanket as well as attributable values to CMC, i.e., 64% equity holding as well as facilitation loans repayments, management fees, and procurement margins. |
II. Macro-Economic Forecasts
The following section includes the macro-economic and commodity price forecasts for the operation over the LoM. Forecast data is based on projections for the different commodity prices and the country-specific macro-economic parameters and is in calendar years from January to December starting January 2024. USD commodity prices for the period 2024-2029 have been converted from nominal to real terms. Table 48 illustrates the forecasts for the next six years as well as the long-term forecast used in the financial model. The price forecasts are based on the median of various banks, brokers and analyst forecasts and are in real-terms throughout the LoM. The inflation rate was sourced from the World Economic Outlook January 2024.
Table 48: Macro-economic Forecasts (Real Terms)
|
Item |
Unit |
Year |
||||||
|
2024 |
2025 |
2026 |
2027 |
2028 |
2029 |
Long-Term |
||
|
1 |
2 |
3 |
4 |
5 |
6 |
|||
|
US Inflation Rate |
% |
2.10% |
1.70% |
1.70% |
1.70% |
1.70% |
1.70% |
1.70% |
|
Gold |
USD/oz |
2,205 |
2,167 |
2,093 |
1,987 |
1,852 |
1,731 |
1,731 |
Source: Consensus Economic Inc. & World Economic Outlook January 2024.
Figure 87 illustrates the 20-year inflation adjusted historic gold price. For the past ten years, the gold price has mostly been staying in a band between USD1,300/oz and USD2,000/oz, with increases to USD2,400 between 2020 and 2021. The price is starting to increase again during 2024, currently sitting at approximately USD2,300.
Caledonia Mining Corporation Plc
S-K 1300 Technical Report Summary on the Blanket Gold Mine, Zimbabwe
The long-term gold price was estimated as the real term average between the high and low gold price trading range over the past 10 years.
Figure 87: Inflation Adjusted Historic Gold Price
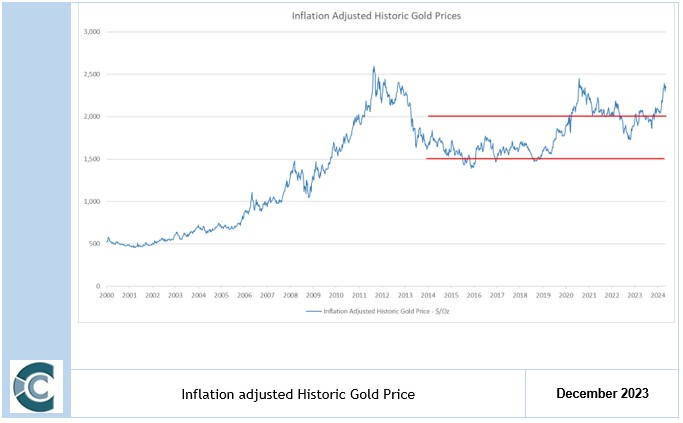
III. Working Capital
Working capital was considered to stay consistent with the repayment of current overdrafts at the end of LoM.
IV. Recoveries
The ore from the Blanket Mine operation is treated at the existing Blanket Plant. The economic analysis assumed a recovery percentage of 93.60% This compares to actual recoveries of 93.9% in 2021, 93.8% in 2022 and 93.8% in 2023. The recovery is detailed in the processing Section of this Report.
V. Discount Rate
It is generally accepted valuation practice to utilise a mathematical model such as the Capital Asset Pricing Model (“CAPM”) and relevant inputs from the capital markets to estimate the cost of equity and an appropriate cost of debt to estimate the respective Cash generating Units (“CGUs”) Weighted Average Cost of Capital (“WACC”). The WACC represents a blend of cost of debt and cost discount rate for the specific Project. A capital structure comprising 75% equity financing and 25% debt financing was used.
Table 49: Capital Asset Pricing Model Discount Rate Calculation
|
WACC |
Discount Rate |
|
Risk-free rate and country premium |
10.80% |
|
Equity Risk premium |
8.00% |
|
Firm specific risk premium |
2.20% |
|
Operational Risk (Base Beta) |
1.17 |
|
Cost of Debt |
5.70% |
|
Nominal Cost of equity |
18.20% |
|
WACC |
15.40% |
Caledonia Mining Corporation Plc
S-K 1300 Technical Report Summary on the Blanket Gold Mine, Zimbabwe
VI. Cash Flow Forecast
The saleable product tonnes and ounces are displayed in Table 79. The current mine plan includes 7,684 kt of ore containing 812 koz of gold at an average grade of 3.41 g/t. A total of 757 koz of gold is recovered over the 11-year LoM.
Table 50: Production Breakdown in Life of Mine
|
Item |
Project |
Blanket Gold Mine |
Caledonia Attributable* |
|
Ore Tonnes Mined |
kt |
7 684 |
4 918 |
|
Total Oz in Mine Plan |
oz |
811 718 |
519 500 |
|
Grade Delivered to Plant |
g/t |
3.41 |
3.41 |
|
Recovered grade |
g/t |
3.19 |
3.19 |
|
Yield/Recovery |
% |
93.6% |
93.6% |
|
Total Oz Recovered |
oz |
757 238 |
484 632 |
*Based on the legal ownership of 64%
The gold ounces produced along with the mined and recovered grades are illustrated in Figure 88. The gold production starts decreasing after 2032 as the grade drops in 2032 and 2033, and the tonnes milled decrease in 2034, nearing the end of LoM.
Figure 88: Recovered Gold
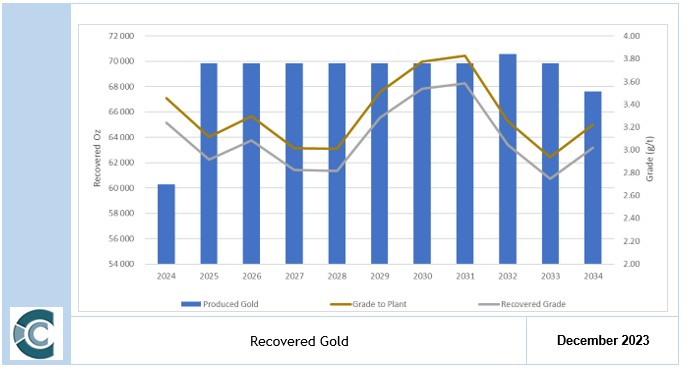
Cash Flow Forecast
The annual cash flow before capital expenditure, total capital expenditure and cumulative cash flow forecast for the mine over the LoM is illustrated in Figure 89.
Caledonia Mining Corporation Plc
S-K 1300 Technical Report Summary on the Blanket Gold Mine, Zimbabwe
Figure 89: Undiscounted Cash Flow
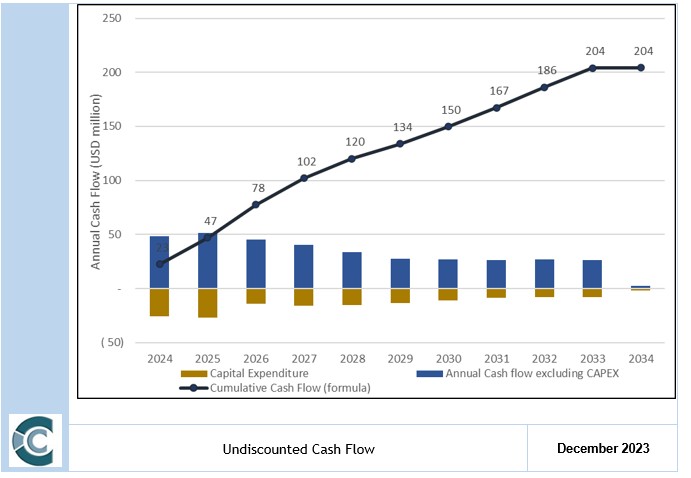
Caledonia Mining Corporation Plc
S-K 1300 Technical Report Summary on the Blanket Gold Mine, Zimbabwe
Table 51: Annual Cash Flow – Techno-economic Inputs
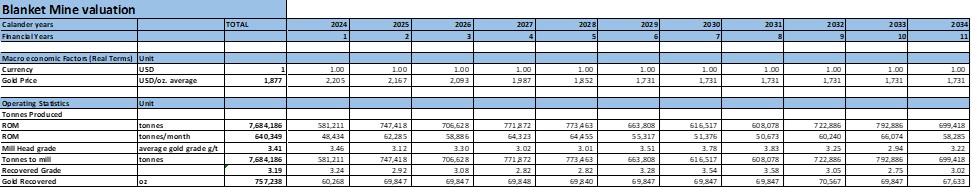
**2024 is only 10 months starting March 1, 2024 – December 31,2024.
Table 52: Annual Real Cash Flow
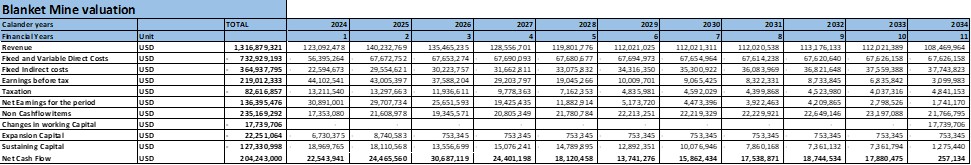
**2024 is only 10 months starting March 1, 2024 – December 31,2024.
Caledonia Mining Corporation Plc
S-K 1300 Technical Report Summary on the Blanket Gold Mine, Zimbabwe
Item 19 (b) - Net Present Value
The highlights of the economic analysis conducted by Caledonia are discussed in the following sections.
The Company’s in-house DCF model was employed to illustrate the NPV for the Project in real terms. The NPV was derived from post Government royalties and tax, pre-debt real cash flows, using the techno-economic parameters, commodity price and macro-economic projections. This economic analysis is based on a free cash flow and measures the economic viability of the diluted Indicated and Measured Resources in the LoM plan, for conversion to Mineral Reserves under a defined set of realistically assumed modifying factors.
Table 53 illustrates the Project NPV at various discount rates with a best estimated value of USD107 million at a real calculated discount rate of 15.4%. The mine plan is therefore economically viable indicating that an updated Mineral Reserve can be declared on the mine plan.
Table 53: Blanket Mine NPV Summary – Real Terms
|
Real Discount Rate |
Unit |
Blanket Mine |
Caledonia Attributable |
|
NPV @ 0% |
USDm |
204 |
158 |
|
NPV @ 2.5% |
USDm |
181 |
140 |
|
NPV @ 5% |
USDm |
161 |
125 |
|
NPV @ 7.5% |
USDm |
145 |
112 |
|
NPV @ 10.0% |
USDm |
131 |
101 |
|
NPV @ 12.5% |
USDm |
119 |
92 |
|
NPV @ 15% |
USDm |
109 |
84 |
|
NPV @ 15.4% |
USDm |
107 |
83 |
|
NPV @ 17% |
USDm |
102 |
79 |
Table 54 illustrates the Mine profitability ratios. The mine has a break-even gold price of USD1,331/oz. No IRR could be calculated as the mine is already operating with no upfront investment required.
Table 54: Profitability Ratios
|
Item |
Profitability Ratios |
Blanket Mine |
|
Internal Rate of Return (IRR) |
% |
N/A |
|
Total ounces in Mine plan |
oz |
811,718 |
|
NPV 15.4% per oz in Mine Plan |
USD/oz |
132 |
|
LoM |
Years |
11 |
|
Present Value of Income flow* |
USDm |
107 |
|
Break-even Gold Price (AIC) |
USD/oz |
1,331 |
Note: *Calculated on an EBITDA basis.
Item 19 (c) - Regulatory Items
I. Government Royalties
As described in Item 3 (d) mining royalties are charged in terms of the Mines and Minerals Act (Chapter 21:05). With the gold price exceeding USD1,200/oz, the applicable royalty rate will be 5% of the gross revenue from gold mining. The royalty will be tax deductible, with the tax rate applied on the earnings after royalty deductions.
II. Corporate Taxes
The prevailing taxation regime for mining companies in Zimbabwe includes the following provisions:
Caledonia Mining Corporation Plc
S-K 1300 Technical Report Summary on the Blanket Gold Mine, Zimbabwe
|
● |
Corporate Income tax at 25.75%. This includes an AIDS levy of 3% on the 25% corporate tax for an effective 25.75% tax rate. |
|
● |
Exploration, development, and capital costs can be expensed against profit in the year incurred or carried forward to be expensed against the first year of production. |
|
● |
Tangible and intangible property included in definition of capital expenditure to allow the inclusion of computer software used by the taxpayer in connection with the mining operations. |
|
● |
Exemptions on customs duty and import taxes on capital items during exploration and development phases. |
|
● |
Government Royalties are tax deductible. |
|
● |
Deductions for management fees expenses is limited based on such expenses exceeding 1% of total tax-deductible expenses |
|
● |
Withholding tax on dividend payments to non-Zimbabweans and on services provided by foreign suppliers at a rate of 5% to 20%, depending on the location of the payee. |
Item 19 (d) - Sensitivity Analysis
Based on the real cash flow calculated in the financial model, the Company performed single-parameter sensitivity analyses to ascertain the impact on the NPV. The bars represent various inputs into the model; each being increased or decreased by 15%. The left-hand side of the graph indicates a negative 15% change in the input while the right-hand side of the graph indicating a positive 15% change in the input. A negative effect to the NPVs represented by red bars and a positive effect represented by blue bars. For the DCF, the gold price and grade have the biggest impact on the sensitivity of the Project followed by the operating costs. The Project is least sensitive to capital.
Figure 90: Project Sensitivity (NPV 15.4%)
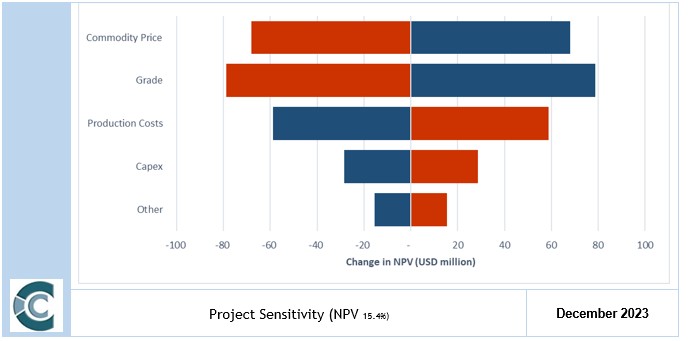
A sensitivity analysis was also conducted on the exchange rate and the commodity prices to better indicate the effect these two factors have on the NPV as well as the total costs and the grade. This is displayed in Table 55 and Table 56.
Caledonia Mining Corporation Plc
S-K 1300 Technical Report Summary on the Blanket Gold Mine, Zimbabwe
Table 55: Sensitivity Analysis of Commodity Prices and Mill Head Grade to NPV15.4% (USDm)
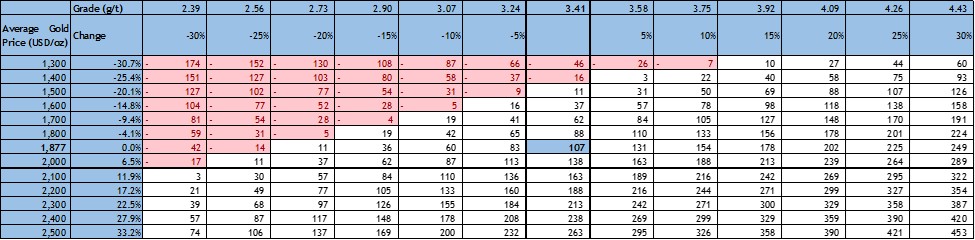
Note: Sensitivity illustrates average gold prices and not constant gold prices.
Caledonia Mining Corporation Plc
S-K 1300 Technical Report Summary on the Blanket Gold Mine, Zimbabwe
Table 56: Sensitivity Analysis of Cash Operating Costs and Capital spend to NPV15.4% (USDm)

Note: OPEX excludes Royalties in Sensitivity Analysis as the Royalties are dependent on operating margins. Capital excludes renewals and replacement capital as this is dependent on OPEX.
Caledonia Mining Corporation Plc
S-K 1300 Technical Report Summary on the Blanket Gold Mine, Zimbabwe
Item 19 (e) – Economic Analysis Conclusions
The value derived for the income approach only reflects the diluted Indicated and Measured Resources in the LoM plan, for conversion to Mineral Reserves. It is noted that Mineral Resources that are not Mineral Reserves do not have demonstrated economic viability. The Mineral Reserve is economically viable with a best estimated NPV of USD107 million at a real discount rate of 15.4%. No IRR could be calculated as Blanket is already in operation and no initial investment is required. The all-in cost margin is 24% with a break-even gold price of USD1,201/oz. Table 57 shows a summary of the economic analysis.
Table 57: Blanket Mine Economic Analysis Summary – Real Terms
|
Item |
Unit |
Blanket Mine |
Caledonia Attributable |
|
NPV @ 0% |
USDm |
204 |
158 |
|
NPV @ 2.5% |
USDm |
181 |
140 |
|
NPV @ 5% |
USDm |
161 |
125 |
|
NPV @ 7.5% |
USDm |
145 |
112 |
|
NPV @ 10.0% |
USDm |
131 |
101 |
|
NPV @ 12.5% |
USDm |
119 |
92 |
|
NPV @ 15% |
USDm |
109 |
84 |
|
NPV @ 15.4% |
USDm |
107 |
83 |
|
NPV @ 17% |
USDm |
102 |
79 |
|
IRR |
% |
N/A |
N/A |
|
All-in Cost Margin |
% |
24% |
24% |
ITEM 20 – ADJACENT PROPERTIES
The GGB is host to numerous gold occurrences, the majority of which have been worked by large-scale or artisanal miners. At least 268 mines have been operational across the geological terrain, of which only two are currently active. These include Blanket Mine and Jessie Mine at the south-eastern end of the belt near West Nicholson. At the western end of the belt some 22 km west of Gwanda, Freda is mined out. Blanket and Vubachikwe are sometimes referred to as the Sabiwa group of mines or the North Western Mining Camp. The locations of these mines are illustrated in Figure 91. The figure also displays several mining occurrences which are adjacent to or coincide with claims held by Blanket Mine Company.
Caledonia Mining Corporation Plc
S-K 1300 Technical Report Summary on the Blanket Gold Mine, Zimbabwe
Figure 91: Gold Mines of the Gwanda Greenstone Belt
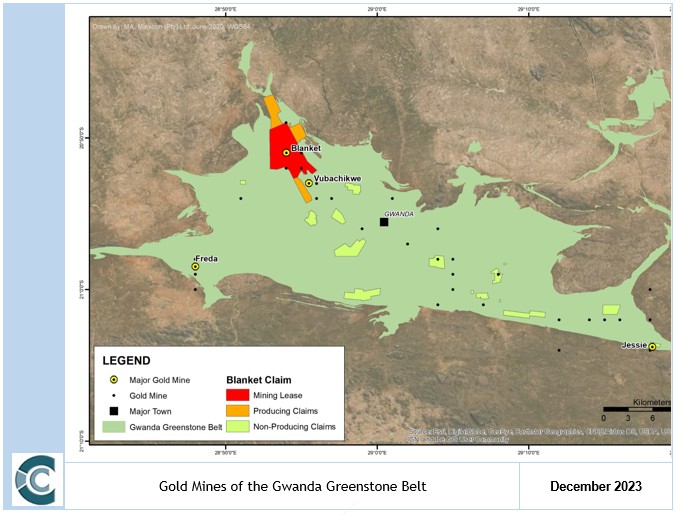
Vubachikwe Mine of Forbes and Thompson (Pvt) Ltd is an underground mine located on the northern limb of a plunging syncline which reached a depth of 1,155 m. Operations ceased on 8 November 2022 following a workers protest over unpaid salaries and has since not recommenced. Gold mineralisation is hosted in mafic and ultramafic greenstones and BIF (MSA, 2011). Ore occurs in 5-40 m thick lenses and up to 200 m down-dip, and are hosted mainly in northwest-plunging, north-south striking BIF which dips 75°SW. Gold occurs as free gold and inclusions in arsenopyrite, as well as disseminated carbonate replacements in the BIF (Spilpunt, 2001; MSA, 2011). The mineralised bodies are folded and boudinaged (Spilpunt, 2001).
Vubachikwe Mine produced almost 21,744 kg of gold to the end of 1991 at an average of 7 g/t (MSA, 2011). Underground workings have reached depths of 1,000 m (AGS, 2006). Blanket Mine purchased the Vubachikwe dump material between 2000 and 2005 treated it through the Blanket metallurgical plant.
Auriferous quartz veins at the underground Jessie Mine are hosted in hornblende schist dipping steeply to the southwest Erratically distributed pyrite, pyrrhotite, chalcopyrite and galena are observed. Ore grades reach up to 10.5 g/t, with production pre-2001 recorded by Spilpunt (2001) at some 11.5 t Au with minor copper. The mine is operated as an underground mine by FA Stewart (Pvt) Ltd.
The Freda Mine commenced production in 1919 targeting surficial oxidised ore as well as underlying ore containing pyrrhotite, pyrite and arsenopyrite, with minor amounts of tetradymite. The vein-type ores are hosted in epidiorite surrounded by grits and quartz-mica schist with the mined-out bodies reaching thicknesses of up to 30 m, striking 115° and inclining steeply to the southwest. Spilpunt (2001) reports that the deposit is mined out, with workings reaching a depth of 1,100 m with 7,550 kg Au recovered at a recovered grade of about 0.8 g/t Au.
Caledonia Mining Corporation Plc
S-K 1300 Technical Report Summary on the Blanket Gold Mine, Zimbabwe
Item 20 (a) Sources of Information
|
● |
Applied Geology Services cc (2006). Independent Qualified Person’s Report - Blanket Mine, Zimbabwe. Prepared for: Caledonia Mining Corporation. July 2006. 81pp |
|
● |
Spilpunt. Mineral Commodities and Africa – Gwanda Greenstone Belt (updated 2001). Available from: http://spilpunt.blogspot.com/2007/04/zimbabwe.html. Viewed 3 August 2020. |
|
● |
The MSA Group (2011). NI 43 101 Technical Report on the Blanket Gold Mine, Zimbabwe. J2225. Prepared on behalf of Caledonia Mining Corporation. 28 June 2011. |
|
● |
Forensic Report Dashes Hopes for Vumbachikwe Gold Mine's Reopening (miningzimbabwe.com). 8 February 2024 |
ITEM 21 – OTHER RELEVANT DATA AND INFORMATION
Item 21 (a) – Upside Potential
Item 21 (b) – Risk Assessment
A risk assessment to consider and quantify risks associated with the Mine was conducted by the 2022 QP’s, Minxcon, which has been retained as a matrix for this document. The result is not designed to be a definitive assessment of the risks but is rather a tool to articulate and evaluate those risks as identified by persons present at the risk assessment session. All items were reviewed and assessed using the risk severity criteria shown below:-
|
● |
Green – Low risk (score 1-5); |
|
● |
Yellow – Medium risk (score 6-12); |
|
● |
Orange - Significant risk (score 13-20); and |
|
● |
Red – High risk (score greater than 21). |
Once a high risk is identified, the project team is required to take remedial action to either resolve or mitigate the risk. The identification and recording of corrective and remedial measures was beyond the scope of this particular risk assessment exercise.
The outcome of the risk assessment is provided in Table 58. No major risks have been identified relating to the Blanket Mine operations.
Caledonia Mining Corporation Plc
S-K 1300 Technical Report Summary on the Blanket Gold Mine, Zimbabwe
Table 58: Risk Assessment
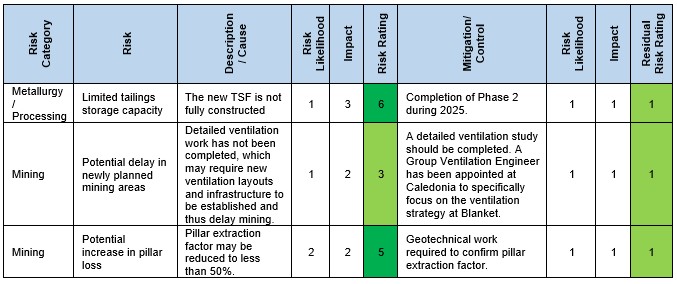
ITEM 22 – INTERPRETATION AND CONCLUSIONS
Mineral Resources
Caledonia Mining Corporation Plc reviewed all the information and has made the following observations regarding the Project:
Mineral Resources
|
● |
All data sources have been verified to be suitable for the establishment of a 3D geological model and Mineral Resource Estimation. Updates were made to the geological models of multiple orebodies from on mine geological observations and interpretations. |
|
● |
For all the domains were significant volume or data changes occurred, all geostatistics, variography and estimation parameters were reconsidered and updated where necessary. |
|
● |
The estimates generally show good reconciliation to data. However, scope may exist to further domain the orebodies and improve the quality of the estimates. |
|
● |
Some of the newer domains, typically with low data quantities, were interpolated using Inverse Distance Squared |
|
● |
Measured, Indicated and Inferred Mineral Resources can be declared for Blanket Mine due to the continuity of the geology and grade as well as a history of proven historical mining. The Inferred resources show geological continuity as defined through the extensive Long Hole Drilling program, while grade continuity has been improved by the increase in Run of Mine drilling and the Short Hole Drilling program in areas in the immediate vicinity of mining activities. |
|
● |
The 2023 estimate is a completely 3D digital block model estimate undertaken with Datamine Studio RM. The geological orebodies or wireframes outlining the grade shells are completely electronic and utilise the Deswik suite of software for the base maps together with the Deswik Geological Mapper as the interface for capturing geological information. |
|
● |
There has been a significant increase in the orebody volumes as defined by the geological wireframes. This work has been done on-mine by the relevant geological personnel who keep the structural and orebody models updated on a regular basis. |
Caledonia Mining Corporation Plc
S-K 1300 Technical Report Summary on the Blanket Gold Mine, Zimbabwe
Mining
|
● |
The LoM plan includes Measured, Indicated and Inferred Mineral Resources; however, only diluted Measured and Indicated Mineral Resources have been considered for economic assessment for Mineral Reserve estimates and have been converted into Proved and Probable Mineral Reserves respectively. |
|
● |
A significant portion of Inferred Mineral Resources has been included in the LoM plan for mining practicality. Typically, with a bottom – up mining strategy, the development enters the area to be mined on Inferred Resources and will then proceed to develop the sub-levels upwards to the mining area above which is in Measured or Indicated Mineral Resources. Clearly as development in ore progresses, the areas are sampled and with the new data points, these Inferred Resource areas are converted through development to Measured or Indicated Mineral Resources. In compiling a LOM plan, there will inevitably be an amount of mining taking place in Inferred Resources due to the vertical nature of the Blanket Mine orebodies. |
|
● |
The mining strategy is focused on opening up ground below 870 m Level and is in line with the planned capital and infrastructure development thrust on 30 Level and 34 Level. |
|
● |
Mining targets the Mineral Resources below 870 m Level with less mining above 750 m Level in the Blanket, ARS and Blanket Feudal orebodies. |
|
● |
An uneconomical tail containing 212.5 koz of gold continuing for a further 6 years has been excluded from the Mineral Reserve since it is not viable on its own. |
Engineering and Infrastructure
|
● |
Existing and planned infrastructure at the Blanket Mine and CMS extension projects are sufficient to sustain the current production profile and the planned production profile. |
Processing
|
● |
The process plant has been operating at a very consistent recovery of 93.5%, and this can be expected to continue as long as the ore mineralogy does not change. |
|
● |
The average processing rate for the past 12 months was 64.2 ktpm, and there are indications that slightly higher processing rates can be achieve with operational improvements. |
|
● |
A new TSF was commissioned in February 2024 and once the phase 1B and 2 extensions are fully completed in 2025, will provide depositional capacity at current production rates for a further 20 years until 2044. |
|
● |
Process Operating cost has been consistent at USD15/t ore treated. |
Economic Analysis
|
● |
The Blanket Mine plan including only the diluted Indicated and Measured Resources in the LoM plan, for conversion to Mineral Reserves is financially feasible at an 15.4% real discount rate, and therefore the Mineral Reserve can be declared. |
|
● |
The DCF value of USD107 million for the Blanket Mine (USD83 million at 78% attributable) was calculated at a real discount rate of 15.4%. |
|
● |
No IRR could be calculated since the mine is in operation and no initial investment is required. |
|
● |
Blanket Mine has an all-in cost margin of 24%, which is comparable to similar mines. |
|
● |
The Mine is most sensitive to commodity prices, and grade. |
|
● |
The Mine has a break-even gold price of USD1,331/oz including capital. |
|
● |
All-in sustainable costs for the Blanket Mine amount to USD130/milled t, which equates to USD1,312/oz. |
|
● |
All-in costs for the Blanket Mine amount to USD132/milled t, which equates to USD1,330/oz. |
Caledonia Mining Corporation Plc
S-K 1300 Technical Report Summary on the Blanket Gold Mine, Zimbabwe
ITEM 23 – RECOMMENDATIONS
Mineral Resources
Upside potential exists due to new geological interpretations. This can be used in targeted exploration drilling, in many cases close to existing infrastructure. There are areas where historical data has not yet been captured (in previous manual areas). This data should be captured to increase confidence in these areas, as well as allow for new potential targets to be identified.
Orientated core should be obtained during exploration drilling. Structural information should be collected and utilised to assist in the development of a geological model and construction of orebody wireframes. Predictive mineralisation mapping should be introduced to assist in exploration drilling planning, based on the conceptual geological model.
The QAQC data shows an improvement in the QAQC processes for the sampling database but still requires additional focus on immediate remedial action if required, especially for the down dip exploration drilling as this can impact the Mineral Resources significantly and thus requires the highest integrity.
To determine the upside potential of the Inferred and Exploration Target Mineral Resources, it is recommended to do additional drilling to increase the level of confidence of the Mineral Resources from the Inferred Classification to Indicated Classification for conversion to Probable Mineral Reserves. The onsite assay laboratory and QAQC processes should be upgraded.
Mining
It is recommended that rock engineering studies and modelling continue in order to improve the recommended strategy for pillar extraction.
Processing
The TSF Phase 1A was completed in February 2023 and Phase 2 of the TSF must be completed in 2025 to secure depositional capacity.
ITEM 24 – REFERENCES
|
● |
Applied Geology Services cc (2006). Independent Qualified Person’s Report - Blanket Mine, Zimbabwe. Prepared for: Caledonia Mining Corporation. July 2006. 81pp |
|
● |
Australian Government, Office of the Chief Economist (2022). Department of Industry, Science, Energy and Resources. Resources and Energy Quarterly, December 2022. |
|
● |
Caledonia Mining Corp (2006). Acquisition of Gold Mine. 20 June 2006. https://www.investegate.co.uk/caledonia-mining-crp--cmcl-/rns/acquisition-of-gold-mine/200606201300058747E/ |
|
● |
Campbell, S.G.G. and Pitfield, P.E.J. (1994). Structural Controls of Gold Mineralisation in the Zimbabwe Craton – Exploration Guidelines. Zimbabwe Geological Survey Bulletin No. 101. |
|
● |
Canadian Institute of Mining, Metallurgy and Petroleum (CIM) (2014). Definition Standards for Mineral Resources and Mineral Reserves, 10 May 2014. |
|
● |
Canadian Institute of Mining, Metallurgy and Petroleum (CIM) (2019). Estimation of Mineral Resources and Mineral Reserves Best Practices Guidelines. |
|
● |
GFMS (2019). GFMS Gold Survey 2019. 28pp. |
|
● |
Fuchter, W.A.H. (1990). The Geology and Gold Mineralisation of the North Western Mining Camp, Gwanda Greenstone Belt, Zimbabwe. Unpublished PhD thesis, Queens University. |
Caledonia Mining Corporation Plc
S-K 1300 Technical Report Summary on the Blanket Gold Mine, Zimbabwe
|
● |
Kalbskopf, S., and Nutt, T., (2003). Lithological Contrasts and Constraints on Gold Mineralisation in Granitoids in the Zimbabwe Craton: Structural Controls and Implications for Exploration. Economic Geology Research Unit, Hugh Allsop Laboratory. University of the Witwatersrand, Johannesburg. Information Circular, No. 370, 27 pp. |
|
● |
Knight Piésold Africa Limited (2019). Caledonia Mining Corporation - Blanket Mine (1983) (Pvt) Limited Blanket Mine Closure Plan, Closure Cost Estimates January 2019. Project Number: RI301-00588/02. Revision A. January 2019. 127pp. |
|
● |
Mhlanga, G. (2002). Data Driven Predictive Modelling for Archean Lode Gold Potential, Bubi Greenstone Belt, Southwest Zimbabwe. MSc Thesis, International Institute for Geo-information Science and Earth Observation, Enscehe, Netherlands. 108 pp. |
|
● |
Robert, F. (1996). Diversity of Archaean Lode Gold Deposits and Implications for Exploration. Course Notes, AMF Workshop Course No. 973/96, Australian Mineral Foundation, Adelaide. |
|
● |
Spilpunt. Mineral Commodities and Africa – Gwanda Greenstone Belt (updated 2001). Available from: http://spilpunt.blogspot.com/2007/04/zimbabwe.html. Viewed 3 August 2020. |
|
● |
The MSA Group (2011). NI 43 101 Technical Report on the Blanket Gold Mine, Zimbabwe. J2225. Prepared on behalf of Caledonia Mining Corporation. 28 June 2011. |
|
● |
United States Geological Survey (2024). Gold Data Sheet - Mineral Commodity Summaries 2024, 31 January 2024 via https://pubs.usgs.gov/periodicals/mcs2024/mcs2024-gold.pdf |
|
● |
Consensus Economics Inc. for Nominal and Real gold prices. |
|
● |
US inflation from World Economic Outlook January 2024. |
|
● |
Bloomberg for share price information. |
|
● |
The Office of Australia’s chief economist (2024) for gold outlook. |
|
● |
World Gold Council. Gold Demand Trends Data Tables, FY 2023 Statistics. |
|
● |
World Gold Council. Gold Demand Trends, Full Year and Q4 2023. London, United Kingdom. Published: 31 January 2024. |
|
● |
World Gold Council (2023). Latest World Official Reserves. Accessed on 8 April 2014 via https://www.gold.org/goldhub/data/gold-demand-by-country. |
|
● |
World Gold Council (2023). Latest World Official Reserves. Accessed on 8 April 2014 via https://www.gold.org/goldhub/data/gold-production-by-country. |
ITEM 25 – RELIANCE ON INFORMATION PROVIDED BY THE REGISTRANT
The QPs have accepted information supplied by Caledonia regarding the permits and licences as valid and complete, which is included in Item 3 of this TRS. The QPs consider such reliance reasonable because the information constitutes legal and environmental matters outside the expertise of the QPs.
Exhibit 15.6

DATE AND SIGNATURE PAGE
This technical report summary titled "Bilboes Gold Project Technical Report Summary" was prepared for Caledonia Mining Corporation Pie, in accordance with Subpart 1300 and Item 601(b)(96) of Regulation S-K, as adopted by the United States Securities and Exchange Commission. Its effective date is December 31 2023.
The Qualified Person ("QP") responsible for this Report is DRA Projects (Pty) Ltd.

Signature Date: May 15, 2024
ABBREVIATIONS, TERMS AND DEFINITIONS
|
Abbreviations/Terms |
Definition |
|
°C |
Degrees |
|
AACE |
American Association of Cost Engineers |
|
AMIS |
African Mineral Standards |
|
amsl |
above mean sea level |
|
AMZIM |
Anglo American Corporation of Zimbabwe Ltd |
|
Archean |
Bubi Greenstone Belt |
|
Au |
Native Gold |
|
Baker Steel |
Baker Steel Resources Limited |
|
BBWi |
Bond Ball Work Index |
|
BFS |
Basic Ferric Sulphate |
|
Bilboes |
Bilboes Gold Limited |
|
BIOX |
Biological Oxidation |
|
BoQ |
Bill of Quantities |
|
Caledonia |
Caledonia Mining Corporation Plc |
|
CCD |
Counter Current Decantation |
|
CCE |
Capital Cost Estimate |
|
CIL |
Carbon in Leach |
|
CIM |
Canadian Institute of Mining |
|
CMCL |
AIM of the London Stock Exchange plc |
|
COS |
Crushed Ore Stockpile |
|
CRM’s |
Certified Reference Materials |
|
CSR |
Corporate Social Responsibility |
|
Datamine |
Datamine Studio™ |
|
DD |
Diamond Drilling |
|
DEM |
Digital Elevation Model |
|
DRA |
DRA Projects (Pty) Ltd |
|
EC&I |
Electrical, Control and Instrumentation |
|
EHS |
Environmental, Health and Safety |
|
EIA |
Environmental Impact Assessment |
|
EMA |
Environmental Management Agency |
|
EMC |
Eurus Mineral Consultants |
|
EMP |
Environmental Management Plans |
| EPCM | Engineering, Procurement, Construction Management |
|
EPO |
Exclusive Prospecting Orders |
|
ESIA |
Environmental and Social Impact Assessment |
|
ESMP |
Environmental and Social Management Plan |
|
Abbreviations/Terms |
Definition |
|
ESSMS |
Environmental, Social and Safety Management System |
|
FEED |
Front End Engineering Design |
|
FGR |
Fidelity Gold Refinery |
|
GEV |
Generalized Extreme Value |
|
IFC |
International Finance Commission |
|
ILO |
International Labor Organization |
|
IMTT |
Intermediated Money Transfer Tax |
|
Infinite Treasure |
Infinite Treasure Limited |
|
IRR |
Internal Rate of Return |
|
ISBN |
Isabella North |
|
ISBS |
Isabella South |
|
LBMA |
London Bullion Market Association |
|
LCR |
Lab Coarse Duplicates |
|
LG |
Lerchs-Grossman |
|
LoM |
Life of Mine |
|
LPR |
Lab Pulp Duplicates |
|
LRP |
Livelihoods Restoration Plan |
|
ma |
mega annum |
|
mamsl |
Meter above mean sea level |
|
MAP |
Mean Annual Precipitation |
|
MCC |
Motor Control Centre |
|
MEL |
Mechanical Equipment List |
|
MRE |
Mineral Resource Estimate |
|
MSD-Z |
Meteorological Services Department of Zimbabwe |
|
NPV |
Net Present Value |
| OPEX | Operating Expenditure |
|
P&G |
Preliminary and General |
|
PDC |
Process Design Criteria |
|
PERC |
percussion Reverse Circulation |
|
PFD |
Process Flow Diagram |
|
PFS |
Pre-Feasibility Study |
|
PGM |
Platinum Group Metals |
|
PLZ |
Performance Laboratories Zimbabwe Limited |
|
POX |
Pressure Oxidation |
|
PSD |
Particle Size Distribution |
|
PV |
Prospecting Ventures |
|
QA/QC |
Quality Assurance / Quality Control |
|
Abbreviations/Terms |
Definition |
|
QP |
Qualified Person as defined in S-K 1300 |
|
RC |
Reverse Circulation |
|
RFQ |
Rock Quality Designation |
|
RMR |
Rock Mass Rating |
|
RoM |
Run of Mine |
|
RoR |
Rate of Rise |
|
RWD |
Return Water Dam |
|
SANAS |
South African National Accreditation System |
|
SEX |
Sodium Ethyl Xanthate |
|
SIB |
Stay in Business |
| S-K 1300 | Subpart 1300 and Item 601(b)(96) of Regulation S-K |
|
SLR |
SLR Consulting (Africa) (Pty) Ltd |
|
TRS |
Technical Report Summary within the meaning of S-K 1300 |
|
TSF |
Tailings Storage Facility |
|
US$ |
United States Dollar |
|
VAT |
Value Added Tax |
|
WGC |
World Gold Council |
|
WRD |
Waste Rock Dumps |
|
ZETDC |
Zimbabwe Electricity Transmission and Distribution Company |
|
ZINWA |
Zimbabwe National Water Authority |
SYSTEM OF UNITS
The international metric system of units (SI) will be used throughout the design in all documentation, specifications, drawings, reports, and all other documents associated.
TABLE OF CONTENT
|
1 |
EXECUTIVE SUMMARY |
20 |
||
|
|
1.1 | Introduction |
20 |
|
| 1.2 | Report Purpose | 20 | ||
| 1.3 | Project Location | 20 | ||
| 1.4 | Permits | 20 | ||
| 1.5 | History | 21 | ||
| 1.6 | Geology and Resource Estimate | 21 | ||
| 1.7 | Exploration | 21 | ||
| 1.8 | Sample Preparation, Analysis and Security | 22 | ||
| 1.9 | Mineral Resource Estimate | 24 | ||
| 1.10 | Mineral Reserve | 26 | ||
| 1.11 | Mining Strategy | 27 | ||
| 1.12 | Mine Production Schedules | 28 | ||
| 1.13 | Tailings Storage Facility | 29 | ||
|
|
1.14 | Infrastructure and Site Layout |
29 |
|
|
|
1.15 | Environmental |
31 |
|
|
|
1.16 | Project Permitting |
32 |
|
|
|
1.17 | Social and Community Related Requirements and Plans |
32 |
|
|
|
1.18 | Mine Closure |
33 |
|
|
|
1.19 | Process Plant |
33 |
|
|
|
1.20 | Capital Costs |
34 |
|
|
|
1.21 | Operating Costs |
35 |
|
|
|
1.22 | Market Studies |
36 |
|
|
|
1.23 | Economic Outcomes |
36 |
|
|
|
1.24 | Project Development |
37 |
|
| 1.25 | Conclusions | 37 | ||
| 1.26 | Recommendations | 39 | ||
| 2 | INTRODUCTION | 40 | ||
| 2.1 | Report Purpose | 40 | ||
| 2.2 | Sources of Information | 40 | ||
| 2.3 | Personal Inspections / Site Visits | 40 | ||
| 2.4 | QP Responsibilities and Relationships | 41 | ||
| 3 | PROPERTY DESCRIPTION | 42 | ||
| 3.1 | Project Location | 42 | ||
| 3.2 | Property Area | 42 | ||
| 3.3 | Mineral Tenure and Title | 43 | ||
| 3.4 | Royalties |
44 |
||
| 3.5 | Permits |
44 |
||
|
|
3.6 | Political Risks |
45 |
|
|
|
3.7 | Indigenization and Economic Empowerment |
45 |
|
|
4 |
ACCESSIBILITY, CLIMATE, LOCAL RESOURCES, INFRASTRUCTURE AND PHYSIOGRAPHY. |
47 |
||
|
|
4.1 | Access |
47 |
|
| 4.2 | Physiography |
47 |
||
| 4.3 | Climate |
47 |
||
| 4.4 | Local Resources and Infrastructure |
47 |
||
| 4.5 | Personnel | 48 | ||
| 4.6 | Supplies | 48 | ||
|
5 |
HISTORY |
49 |
||
| 5.1 | Holdings |
49 |
||
| 5.2 | Historical Sulfide Mineral Resource Estimates |
49 |
||
| 5.3 | Production |
52 |
||
|
6 |
GEOLOGICAL SETTING, MINERALIZATION AND DEPOSIT |
54 |
||
| 6.1 | Regional Geology |
54 |
||
|
|
6.2 | Regional Geology as it Relates to the Bilboes Properties |
58 |
||
| 6.3 | Stratigraphy |
59 |
|||
| 6.4 | Deposit Types |
60 |
|||
|
7 |
EXPLORATION |
62 |
||
| 7.1 | Geological Mapping |
62 |
||
| 7.2 | Trenching |
63 |
||
| 7.3 | Ground Geophysical Surveying |
63 |
||
| 7.4 | Prospecting and Sampling |
64 |
||
| 7.5 | Drilling |
64 |
||
| 7.6 | Hydrology and Hydrological Drilling |
68 |
||
| 7.7 | Geotechnical Drilling |
69 |
||
|
8 |
SAMPLE PREPARATION, ANALYSES AND SECURITY |
70 |
||
| 8.1 | Sampling |
70 |
||
| 8.2 | Analysis |
70 |
||
| 8.3 | Sample Security |
71 |
||
| 8.4 | Quality Control |
71 |
||
| 8.5 | QP Commentary | 73 | ||
|
9 |
DATA VERIFICATION |
74 |
|||
| 9.1 | Historical Data |
74 |
|||
| 9.2 | 2017/2018 Drilling Campaign |
74 |
|||
| 9.3 | QP Commentary |
74 |
|||
|
10 |
MINERAL PROCESSING AND METALLURGICAL TESTING |
75 |
|||
| 10.1 | Test Work Programme Overview | 75 | ||
| 10.2 | Discussion of the Results | 75 | ||
| 10.3 | Process Route Identification | 77 | ||
|
|
10.4 | Variability Testing |
78 |
|
| 10.5 | Pilot Plant Test Work |
78 |
||
| 10.6 | Pilot Plant Results | 79 | ||
| 10.7 | BIOX® |
81 |
||
| 10.8 | QP Commentary | 83 | ||
|
11 |
MINERAL RESOURCE ESTIMATES |
84 |
||
| 11.1 | Topography |
84 |
||
| 11.2 | Geological Database |
84 |
||
| 11.3 | Bulk Density |
84 |
||
| 11.4 | Geological Model |
85 |
||
| 11.5 | Weathering and Oxidation |
87 |
||
| 11.6 | Compositing | 88 | ||
| 11.7 | Variography | 88 | ||
| 11.8 | Top Capping | 89 | ||
| 11.9 | Grade Estimation |
89 |
||
| 11.10 | Model Validations |
91 |
||
| 11.11 | Reconciliation |
92 |
||
| 11.12 | Resource Classification |
92 |
||
| 11.13 | Declaration |
94 |
||
| 11.14 | QP Commentary | 96 | ||
|
12 |
MINERAL RESERVE ESTIMATES |
97 |
||
| 12.1 | Basis of Mineral Reserve Estimate |
97 |
||
| 12.2 | Mineral Reserve Declaration |
98 |
||
| 12.3 | Risk Assessment |
99 |
||
|
13 |
MINING METHODS |
100 |
||
| 13.1 | Hydrological and Geotechnical Investigation |
100 |
||
| 13.2 | Rock Mass Classification |
101 |
||
| 13.3 | Geotechnical Conclusions and Recommendations | 101 | ||
| 13.4 | Mining Pit Locations |
103 |
||
| 13.5 | Mining Strategy |
104 |
||
| 13.6 | Mine Design |
108 |
||
| 13.7 | Mine Production |
108 |
||
| 13.8 | Operating Assumptions |
109 |
||
| 13.9 | Fleet Requirements |
110 |
||
| 13.10 | Mining Personnel | 111 | ||
|
14 |
PROCESSING AND RECOVERY METHODS |
114 |
||
| 14.1 | Process Test work Results |
114 |
||
| 14.2 | Process Flow Description |
115 |
||
| 14.3 | Plant Water Requirements | 121 | ||
| 14.4 | Reagent Services | 121 | ||
|
15 |
INFRASTRUCTURE |
123 |
||
| 15.1 | Geotechnical Investigation and Design |
124 |
||
| 15.2 | Tailings Storage Facility |
126 |
||
| 15.3 | Civil Engineering and Earthworks |
130 |
||
| 15.4 | Mechanical Engineering |
131 |
||
| 15.5 | Electrical Power Supply and Reticulation (including Communications) |
132 |
||
| 15.6 | General Infrastructure |
133 |
||
| 15.7 | Water Management Infrastructure |
134 |
||
| 15.8 | Sewage Management |
135 |
||
| 15.9 | Project Execution |
135 |
||
|
16 |
MARKET STUDIES |
137 |
||
| 16.1 | Historical Supply and Demand |
137 |
||
| 16.2 | Gold Sales in Zimbabwe |
140 |
||
| 16.3 | Gold Price Predictions | 141 | ||
|
17 |
ENVIRONMENTAL STUDIES, PERMITTING, AND PLANS, NEGOTIATIONS, OR AGREEMENTS WITH LOCAL INDIVIDUALS OR GROUPS |
142 |
||
| 17.1 | Environmental Issues |
142 |
||
| 17.2 | Waste, Tailings, Monitoring and Water Management |
143 |
||
| 17.3 | Water Management |
146 |
||
| 17.4 | Project Permitting | 146 | ||
| 17.5 | Social and Community Related Requirements and Plans |
147 |
||
| 17.6 | Social / Community Issues |
148 |
||
| 17.7 | Mine Closure |
148 |
||
| 17.8 | Estimated Environmental Costs for Closure |
150 |
||
| 17.9 | QP Commentary | 150 | ||
| 18 | CAPITAL AND OPERATING COSTS | 151 | ||
| 18.2 | Operating Cost Estimate |
155 |
||
|
19 |
ECONOMIC ANALYSIS |
159 |
||
| 19.1 | Introduction | 159 | ||
| 19.2 | Method | 159 | ||
| 19.3 | Sources of Information | 160 | ||
| 19.4 | Base Date | 160 | ||
| 19.5 | Production Profile | 160 | ||
| 19.6 | Capital Expenditure and Phasing | 161 | ||
| 19.7 | Stay in Business Capital |
161 |
||
| 19.8 | Operating Expenditure | 161 | ||
| 19.9 | Gold Recovery | 162 | ||
| 19.10 | Gold Pricing |
162 |
||
| 19.11 | Salvage Value |
162 |
||
| 19.12 | Working Capital |
162 |
||
| 19.13 | Sunk and On-going Capital |
162 |
||
| 19.14 | Reclamation and Closure |
162 |
||
| 19.15 | Royalty Tax |
163 |
||
| 19.16 | Corporate Income Tax |
163 |
||
| 19.17 | Discount Rate |
163 |
||
| 19.18 | Economic Outcomes |
164 |
||
| 19.19 | Cash Flow Model |
164 |
||
| 19.20 | Sensitivity Analysis |
168 |
||
|
20 |
ADJACENT PROPERTIES |
170 |
||
|
21 |
OTHER RELEVANT DATA AND INFORMATION. |
172 |
||
| 21.1 | Royalties, Taxes and Economic Climate in Zimbabwe |
172 |
||
|
|
21.2 | Mining Legislation |
177 |
|
|
22 |
INTERPRETATION AND CONCLUSIONS |
178 |
||
| 22.1 | Mineral Resource Estimate |
178 |
||
| 22.2 | Mineral Reserves Estimate |
179 |
||
| 22.3 | Economic Outcomes |
179 |
||
| 22.4 | Risk Assessment |
180 |
||
|
23 |
RECOMMENDATIONS |
183 |
||
| 23.1 | Project Feasibility / Pre Project Execution / Implementation |
183 |
||
| 23.2 | Mineral Resource Estimation |
183 |
||
| 23.3 | Mineral Reserve Estimate | 183 | ||
|
24 |
REFERENCES |
184 |
||
|
25 |
RELIANCE ON INFORMATION PROVIDED BY THE REGISTRANT |
185 |
||
| Table 1-1: | Test work Program Outline | 26 |
| Table 1-2: | Mineral Resource based on a 0.9g/t Au Cut-Off Grade | 28 |
| Table 1-3: | Bilboes Gold Project Mineral Reserve Statement | 30 |
| Table 1-4: | Process Plant Main Design Criteria | 36 |
| Table 1-5: | Capital Summaries per Project Phase | 38 |
| Table 1-6: | Mining Contractor OPEX | 38 |
| Table 1-7: | Plant OPEX | 38 |
| Table 1-8: | LoM Operating Cost Summary | 39 |
| Table 1-9: | Project Economics Summary | 40 |
| Table 1-10: | Key Development Milestones | 40 |
| Table 3-1: | Bilboes Claims | 45 |
| Table 5-1: | Sulfide Inferred Mineral Resources as of 2009 | 52 |
| Table 5-2: | Sulfide Mineral Resources as of 31 March 2017, 0.0 g/t Au Block Cut-Off Applied | 54 |
| Table 5-3: | Sulfide Mineral Resources as of 31 March 2017, 0.9 g/t Au Block Cut-Off Applied | 54 |
| Table 5-4: | Production Data from Bilboes Mines to 31 December 2020 | 56 |
| Table 7-1: | History of Sulfide Project Core Drilling 1994 - 1999 (From Ngilazi & Martin, 2017) | 69 |
| Table 10-1: | Test work Program Outline | 78 |
| Table 10-2: | Optimum Flotation Conditions | 80 |
| Table 10-3: | Comparative Pilot Plant Simulated Recoveries | 83 |
| Table 10-4: | Flotation Residence Times | 83 |
| Table 10-5: | Summary of the Test Work Pre-Feasibility Results | 85 |
| Table 11-1: | Summary of Drill Holes | 87 |
| Table 11-2: | Summary of Density Measurement per Resource Area | 88 |
| Table 11-3: | Summary of the Geological Parameters for the Geological Models | 88 |
| Table 11-4: | Variogram Parameters used for Grade Estimation | 91 |
| Table 11-5: | Summary of Search Parameters | 93 |
| Table 11-6: | Block Model Configuration | 94 |
| Table 11-7: | Checklist Criteria for Resource Classification | 96 |
| Table 11-8: | Summary of Optimization Parameters used for the Lerchs-Grossmann Shells | 97 |
| Table 11-9: | Mineral Resource based on a 0.9g/t Au Cut-Off Grade | 98 |
| Table 12-1: | Bilboes Gold Project Mineral Reserve Statement (31 December 2023) | 101 |
| Table 12-2: | Risks associated with the Declaration of the Mineral Reserve | 102 |
| Table 13-1: | Isabella – McCays – Bubi – Predicted drawdown vs. time | 103 |
| Table 13-2: | Percentage Rock Types at Different Mining Pits | 104 |
| Table 13-3: | Slope Design | 105 |
| Table 13-4: | Optimization Financial Parameters | 108 |
| Table 13-5: | Geotechnical - Mining | 109 |
| Table 13-6: | Mining Continued – Throughput - Process | 109 |
| Table 13-7: | Summary of Selected Shells at US$1,800/oz | 110 |
| Table 13-8: | Bilboes Labor Compliments and Job Grades | 115 |
| Table 14-1: | Process Plant Design Criteria | 117 |
| Table 14-2: | Process Plant Major Reagents / Commodities | 124 |
| Table 15-1: | Proposed Soil and Rock Properties for Foundation Modelling on the TSF Site | 128 |
| Table 15-2: | Proposed Soil and Rock Properties for Foundation Modelling on Process Plant Site | 128 |
| Table 15-3: | Production Profile | 130 |
| Table 15-4: | Liner System | 132 |
| Table 15-5: | Substation Loading | 136 |
| Table 15-6: | Building Infrastructure | 136 |
| Table 16-1: | Predicted Gold Price | 144 |
| Table 17-1: | Potential Environmental Impacts | 145 |
| Table 18-1: | Exchange Rates | 154 |
| Table 18-2: | Capital Summary by Discipline | 156 |
| Table 18-3: | Capital Summaries per Project Phase | 157 |
| Table 18-4: | Mining Contractor Costs per Area (US$/total tonne) | 159 |
| Table 18-5: | Reagent Cost and Consumption for Isabella McCay’s and Bubi | 159 |
| Table 18-6: | Process Plant OPEX – Power | 161 |
| Table 18-7: | Process Plant OPEX | 161 |
| Table 19-1: | Sources of Information | 163 |
| Table 19-2: | Initial Capital Cost – Constant Terms (2023) | 164 |
| Table 19-3: | SIB Capital Cost (LoM) – Constant Terms (2023) | 164 |
| Table 19-4: | Operational Cost Estimate (LoM) – Constant Terms (2023) | 164 |
| Table 19-5: | Gold Recovery per Mineralization Property | 165 |
| Table 19-6: | Summary of Economic Outcomes | 167 |
| Table 19-7: | Cash Flow Model | 169 |
| Table 20-1: | Historic Gold Production from Mines around Isabella McCays and Bubi to 1980 | 174 |
| Table 21-1: | Capital Gains Tax | 177 |
| Table 21-2: | Vat Collection | 178 |
| Table 22-1: | Project Economics Summary | 182 |
| Table 22-2: | Summary of Identified Risks and The Mitigation Strategies | 184 |
LIST OF FIGURES
| Figure 1‑1: | Total Mine Material Movements for LoM | 34 |
| Figure 1‑2: | Overall Site Plan | 35 |
| Figure 1‑3: | Bilboes Simplified Process Flow Diagram | 39 |
| Figure 3‑1: | Regional Location of the Bilboes | 47 |
| Figure 3‑2: | Isabella-McCays Mine Claims Map | 48 |
| Figure 3‑3: | Bubi Mine Claims Map | 49 |
| Figure 6‑1: | Geological Map Zimbabwe (taken from Mugumbate, unknown year) | 59 |
| Figure 6‑2: | Greenstone Belts and known Gold Deposits in Zimbabwe (Mugandani 2017) | 60 |
| Figure 6‑3: | NNE Trending Great Dyke Cutting Across the Zimbabwe Craton (Mukaka et al 1998) | 61 |
| Figure 6‑4: | Geological Map showing the Zimbabwe Craton and Mobile Belts (Gore et al 2009) | 62 |
| Figure 6‑5: | Sedimentary Basins of Zimbabwe (taken from Mugumbate, unknown year) | 63 |
| Figure 6‑6: | Regional Geological Map showing Bilboes Properties (from Ngilazi and Martin ’17) | 64 |
| Figure 6‑7: | Bilboes Site Stratigraphy | 65 |
| Figure 7‑1: | Map of the Surface Geology at Bubi | 67 |
| Figure 7‑2: | Map of the Surface Geology at Isabella McCays | 68 |
| Figure 7‑3: | Plans Showing the Drilling for the Various Areas | 72 |
| Figure 10‑1: | Pilot Plant Campaign Flowsheets | 84 |
| Figure 11‑1: | Views of the Mineralization Zones | 91 |
| Figure 11‑2: | Section View showing Oxidation Profile at ISBS | 92 |
| Figure 13‑1: | Block Plan Showing Bilboes Pits and Process Plant Location | 108 |
| Figure 13‑2: | Block Plan Showing Bilboes Pits Location | 109 |
| Figure 13‑3: | Production Schedules per Area | 115 |
| Figure 14‑1: | Bilboes Simplified Process Flow Diagram | 121 |
| Figure 15‑1: | Mine Layout | 128 |
| Figure 15‑2: | Overall Site Plan | 129 |
| Figure 16‑1: | Historical Gold Supply (2010 -2023) | 142 |
| Figure 16‑2: | Historical Gold Demand (2010 - 2023) | 143 |
| Figure 16‑3: | Gold Price (2010 - 2023) | 144 |
| Figure 19‑1: | LoM Cash Flow Model | 170 |
| Figure 19‑2: | Sensitivity Analysis | 174 |
| Figure 20‑1: | Adjacent Properties around Isabella McCays and Bubi | 175 |
|
1 |
EXECUTIVE SUMMARY |
|
1.1 |
Introduction |
This Technical Report Summary (TRS) has been prepared for Caledonia Mining Corporation Plc (Caledonia) on the Bilboes Gold Mine, Zimbabwe which Caledonia acquired with the acquisition of Bilboes Gold Limited (Bilboes) on 6 January 2023. Caledonia is a Zimbabwean focused exploration, development, and mining corporation. Caledonia shares are listed on the NYSE American LLC and depositary interests in the shares are traded on the AIM of the London Stock Exchange plc (symbol: CMCL). Caledonia listed depositary receipts on the Victoria Falls Stock Exchange, a subsidiary of the Zimbabwe Stock Exchange, on December 2, 2021.
|
1.2 |
Report Purpose |
Caledonia mandated DRA Projects (Pty) Ltd (DRA) to complete this TRS to report the Mineral Resources and Mineral Reserves on the Bilboes Gold Mine effective as of 31 December 2023. This is the initial filing of a TRS in respect of the Bilboes Mine.
|
1.3 |
Project Location |
The Bilboes properties are located in the Matabeleland North Province of Zimbabwe. The Isabella-McCays properties are situated approximately 80 km north of Bulawayo while Bubi is situated approximately 100 km north of Bulawayo. Bubi is 32 km due north-east of Isabella.
Bilboes have rights to three groups of claims covering an area of 2,664.4 ha that consist of four open-pit mining properties in Matabeleland North Province of Zimbabwe. These open pits are referred to as Isabela North; Isabela South; McCays and Bubi.
Average daily temperatures range from 24°C in June, to 32° in October and apart from the occasional heavy downpour in the rainy season, there are no climatic conditions that prevent all year-round exploration and mining.
| 1.4 |
Permits |
Bilboes has been operating in Matabeleland since 1989. It holds the necessary mining permits and complies with the terms of the Mines and Minerals Act and allied regulations with respect to all of their claims and in particular that all of the registration certificates are valid, and the protection certificates are up to date. Bilboes thus requires no further permits to explore or produce from the current operational areas, but further permits will be required for the proposed haul road between Bubi and Isabella plant.
Further exploration outside the current claims will require approvals by the Environmental Management Agency (EMA) who may request an Environmental Impact Assessment (EIA) study.
|
1.5 |
History |
Initial exploration allowed the estimation of a small oxide Resource and an open-pit, heap-leach mine was commissioned in 1989. Some 90,048 oz of gold was produced since 2003. Subsequent exploration extended Isabella and new discoveries were made at Bubi and McCays, which has yielded production of 8,954 kg of gold (287,883 oz) to December 2020. All mining has been from open pit oxide ore utilizing the heap leach extraction processing method.
Exploration for sulfide Mineral Resources began in 1994/95, with 17,650m of exploratory drilling being completed by 1999, covering a strike length of 3,440 m. A maiden Mineral Resource estimate for the sulfide Mineral Resources was completed by SRK in 2009, containing 4.75 Mt of Inferred Mineral Resources grading 3.49 g/t. This estimate used a 2.0 g/t cut-off for delineation of the mineral Resource estimation domains.
|
1.6 |
Geology and Resource Estimate |
|
1.6.1 |
Geological Setting and Mineralization |
The Bubi Greenstone Belt (Archean) which consists of volcanic rocks of the Upper Bulawayan Group and capped by sedimentary sequences of the Shamvaian Group, all of which have been metamorphosed into felsic and mafic schists, underlies the Bilboes Properties. Gold deposits are concentrated at the interface between these two groups, where major structural breaks and splays provide pathways for hydrothermal vein mineralization.
Gold is associated with sulfides that is commonly found in hydrothermal systems. These include pyrite and arsenopyrite as major components, but copper, lead, zinc, antimony, are also present in some deposits. Common alteration associated with gold mineralization is silicification, with lesser sericite and chlorite alteration.
|
1.6.2 |
Deposit Types |
Mineralization is hydrothermal and consists of silicified stockworks that host pyrite and arsenopyrite. The stockworks are characterized by a series of subparallel echelon zones. The gold is very finely dispersed within the sulfides and is refractory. All the deposits are oxidized with the sulfide interface occurring between 6 m and 50 m below surface.
|
1.7 |
Exploration |
Soil sampling, trenching and geological mapping have been progressively conducted since exploration and oxide mining commenced in 1982. Soil sampling was used to identify areas for trenching and mapping. Trenches were sampled at 1 m to 2 m intervals. The assays were used to guide the interpretation and projection of oxide mineralization along strike and at depth. The assays from trench sampling were not used in grade estimation.
Ground Magnetics and Induced Polarization geophysical surveys have been conducted at Isabella, as part of the oxide ore exploration since 1996.
|
1.7.1 |
Drilling |
Drilling of the sulfides to provide data for the mineral resource estimate was done in three phases totaling 93,400 m. The first phase by Anglo American Corporation was between 1994 and 1999 and the second phase by Bilboes from 2011 to 2013. The latest drilling was from December 2017 to November 2018. The third campaign focused on upgrading of the mineral resources from the Inferred and Indicated to Indicated and Measured categories.
|
1.8 |
Sample Preparation, Analysis and Security |
During the drilling campaigns, all geological logging and sampling was conducted in accordance with Bilboes standard operating procedures which were adopted by AMZIM and enhanced over time to keep up with industry best practices.
Independent South African National Accreditation System (SANAS) accredited laboratories were used in the analyses of samples. Performance Laboratories Zimbabwe Limited (PLZ) in Harare was selected as the primary laboratory. ZIMLABS and Antech Laboratories (Antech) in Zimbabwe were used for check analyses.
Certified Reference Materials (CRMs), blanks, field duplicates, coarse and pulp repeats were used for Quality Assurance Quality Control (QA/QC) purposes.
The QP has assessed the standard operating procedures together with the results of the QA/QC program and are of the view that these are adequate for the purposes of reporting the Mineral Resources contained herein.
|
1.8.1 |
Data Verification |
Before commencement of the 2017/2018 drilling campaign in addition to the Datamine™ software already in place Bilboes acquired Fusion database software for the capture: storage and management of drill hole information. This software has built in data verification tools to minimize transcription errors. Bilboes standard operating procedure involves a thorough audit by a senior geologist of each drillholes’ geology and sampling logs, from data logging through to capturing into the database and QA/QC checks.
Each hardcopy log is audited and signed-off by a senior geologist prior to being used in modelling and estimation.
DRA visited the site during drilling and performed various checks to verify the integrity of the collar co-ordinates, logging and sampling procedures, and assay results and concluded that the data collection was consistent with industry standards.
|
1.8.2 |
Metallurgical Test Work |
The metallurgical test work campaign was concluded in different phases over a period extending from September 2013 to March 2019 and involved various laboratories and consultants as outlined in Table 1‑1. The outcomes from the test work have been used to define the processing route, process design basis and gold recoveries.
Table 1‑1: Test work Program Outline
|
Phase |
Test work Description |
Done By |
Supervision and Oversight |
Date |
|
1A |
Sample characterization detailing mineralogical and chemical analysis |
Mintek, South Africa |
Bilboes, MMC and MDM Engineering |
September 13 to December 13 |
|
1B |
Comminution test work done on the two composites namely Composite 1 (Bubi ore) and Composite 2 (combination of Diana, Calcite, Castile, Maria and McCays ores) |
Mintek, South Africa |
Bilboes, MMC and MDM Engineering |
January 14 to April 14 |
|
2 |
Selection of a process route covering gravity amenability tests, flotation optimization and treatment of the sulfide flotation concentrates via POX, Bio-Oxidation and Ultra-fine grinding followed by cyanidation |
Mintek and Suntech, South Africa |
Bilboes and MMC |
May 14 to September 14 |
|
3 |
Variability flotation tests and bulk flotation concentrate production for additional BIOX® and gold leach tests |
Suntech and SGS, South Africa |
Bilboes, Minxcon and MMC |
October 15 to August 16 |
|
4A |
Laboratory and Pilot plant test work campaigns on the different ore types to generate additional flotation kinetics and grind data, bulk concentrates for BIOX® pilot plants, flotation design parameters and validate flowsheet |
MMC at the client's project site in Zimbabwe |
Bilboes and DRA |
April 18 to September 18 |
|
4B |
Review, modelling and simulation of laboratory and pilot plant test results |
EMC, South Africa |
Bilboes, MMC and DRA |
October 18 to March 19 |
|
1.8.3 |
Process Route Identification |
Gravity amenability tests indicated poor gold recoveries and varied from 14% to 22% at 0.5% mass pull. Initial milling and flotation results indicated high gold recoveries of 89 - 97% with high mass pulls ranging 10 -15%, low concentrate grades of 12-20 g/t Au and unacceptable high levels of carbonates in the range of 7-13% which were bound to negatively affect the down-stream gold recovery process. Gold Dissolution from Flotation Concentrates using Biological Oxidation (BIOX®) provided 99% sulfide decomposition with 97% gold dissolution by cyanidation of the bio-residue.
Based on the test work and consideration of environmental impacts and risk minimization by adopting commercially established and proven processes, the process route identified for additional evaluation was flotation, pre-treatment of the concentrate by Bio-oxidation followed by cyanidation.
|
1.8.4 |
Pilot Plant Test Work |
The pilot plant test work was conducted over a period of three months from July 2018 to September 2018, utilizing 20 t of the Isabella McCays ore and 15 t of Bubi ore. The Isabella McCays ores gold recoveries ranged from 85.9% to 91.0% and the mass pulls ranged from 3.8% to 6.0% with a weighted average of 88.4% recovery and 5.0% mass pull. The Bubi ore recoveries ranged from 85.9% to 88.8% and mass pulls ranged from 7.8% to 15.2% with averages of 87.5% recovery and 10.0% mass pull.
|
1.8.5 |
BIOX® |
Test work was conducted during 2019 on Ore samples from Isabella McCays and Bubi deposits to develop test work data to design a gold processing plant.
The BIOX® test work indicated the following:
|
● |
An average BIOX® sulfide oxidation of 90% was achieved at a 6.5-day retention time and a feed slurry solids concentration of 20%, |
|
● |
This resulted in an average CIL gold dissolution of 95.7% on the BIOX® product solids, |
|
● |
The BAT tests completed on the Bubi concentrate sample achieved sulfide oxidation levels in the range 97 – 98% and yielded gold dissolutions in the range 92.3 to 96.8%. |
|
1.9 |
Mineral Resource Estimate |
The Mineral Resource Estimate (MRE) has been declared in terms of S-K 1300 Table 1‑2.
The Mineral Resource Estimate is summarized in Table 1‑2 using a cut-off grade of 0.9 g/t Au and constrained inside a Lerchs-Grossman (LG) optimized pit shell using US$ 2,400 per ounce gold price. Mineral Resources exclude Mineral Reserves.
Table 1‑2: Mineral Resource based on a 0.9g/t Au Cut-Off Grade
|
Mineral Ressources (0.9 g/t Au) Reference Point: In Situ |
|||||
|
Property |
Classification |
Tonnes (Mt) |
Au (g/t) |
Metal (kg) |
Ounces (koz) |
|
Isabella South (ISBS) |
Measured |
0.034 |
1.80 |
61.66 |
1.98 |
|
Indicated |
1.043 |
2.07 |
2,154.20 |
69.26 |
|
|
Total Measured and Indicated |
1.077 |
2.06 |
2 215.85 |
71.24 |
|
|
Inferred |
1.335 |
1.80 |
2,403.91 |
77.29 |
|
|
Isabella North (ISBN) |
Measured |
0.082 |
2.40 |
196.56 |
6.32 |
|
Indicated |
1.734 |
2.29 |
3,971.85 |
127.70 |
|
|
Total Measured and Indicated |
1.816 |
2.29 |
4,168.41 |
134.02 |
|
|
Inferred |
1.613 |
2.18 |
, 519.53 |
113.16 |
|
|
Bubi |
Measured |
0.059 |
1.22 |
72.17 |
2.32 |
|
Indicated |
4.437 |
1.51 |
6,702.28 |
215.49 |
|
|
Total Measured and Indicated |
4.496 |
1.51 |
6,774.44 |
217.81 |
|
|
Inferred |
5.116 |
1.80 |
9,208.47 |
296.06 |
|
|
McCays |
Measured |
0.066 |
1.77 |
117.27 |
3.77 |
|
Indicated |
1.261 |
1.85 |
2,338.52 |
75.19 |
|
|
Total Measured and Indicated |
1.327 |
1.85 |
2,455.79 |
78.96 |
|
|
Inferred |
1.054 |
2.16 |
2,273.84 |
73.11 |
|
|
Totals (ISBS +ISBN+ Bubi + McCays) |
Total Measured |
0.241 |
1.85 |
447.66 |
14.39 |
|
Total Indicated |
8.475 |
1.79 |
15,166.84 |
487.63 |
|
|
Total Measured and Indicated |
8.716 |
1.79 |
15,614.50 |
502.03 |
|
|
Total Inferred |
9.118 |
1.91 |
17,405.76 |
559.62 |
|
|
● |
S-K 1300 definitions observed for classification of Mineral Resources. |
|
● |
Mineral Resources are reported exclusive of Mineral Reserves Block bulk density interpolated from specific gravity measurements taken from core samples. |
|
● |
Resources are constrained by a Lerchs-Grossman (LG) optimized pit shell using Whittle software. |
|
● |
Mineral Resources are not Mineral Reserves and have no demonstrated economic viability. The estimate of Mineral Resources may be materially affected by mining, processing, metallurgical, infrastructure, economic, marketing, legal, environmental, social, and governmental factors (Modifying Factors). |
|
● |
Numbers may not add due to rounding. |
|
● |
The Mineral Resource Estimate has been depleted to reflect mining up to 31 December 2023 |
|
● |
Effective Date of Resource Estimate is 31 December 2023. |
|
1.10 |
Mineral Reserve |
The process to develop the Mineral Reserve estimate in accordance with S-K 1300 was as follows:
|
● |
Ore recovery of 95% and fixed dilution parameters of 20 cm of hanging wall and 20 cm of footwall (4% in Whittle) were applied in the optimizations, |
|
● |
A Whittle Pit optimization was performed, |
|
● |
A base gold price of United States Dollar (US$) 1,800/oz. A government royalty of 5.0% of revenue and a Refining/Selling Cost of 1.0% of revenue was then applied. This resulted in a Net Gold Price of ~US$ 1,692/oz, |
|
● |
Pit slopes inter-ramp angles ranging from 30° to 55°. Resulting overall pit slopes account for access ramps where applicable, |
|
● |
Gold recovery ranging from 83.62% to 88.88% dependent on mining area and ore type being processed, |
|
● |
Processing throughput of 2.88 Mtpa for Phase 1 and 2.16 Mtpa for Phase 2, |
|
● |
Mining contractor costs based on budget submissions from Southern African based mining contractors, |
|
● |
Average annual processing cost per tonne of ore, inclusive of general / administration costs range from US$ 21.56/t to US$ 44.24/t for all transitional and fresh ores depending on processing parameters, |
|
● |
The reference point for all grade and plant feed ore is the RoM plant feed tip and the plant feed stockpiles, |
A sensitivity assessment was done on gold prices of US$ 1,650/oz and US$ 1,950/oz. A gold price of US$2,400/oz scenario assessment was also completed to determine surface infrastructure boundaries only to ensure that no potential future resource is sterilized. This indicated that the optimal shell inventory (i.e., the size and shape of the optimal shell and therefore the ore and waste generated) was relatively robust for all mining areas.
Optimal shells (maximum profit) were selected for each deposit area based on a US$ 1,800/oz gold price that were then used as the basis for pit designs.
These shell selection criteria are relatively conservative, based on a 24-month (2022-2023) trailing average gold price of US$ 1,875/oz.
A conservative cut-off grade of 0.9 g/t based on project specific projected revenue and cost was applied to all Project resources to ensure tonnes milled generate enough revenue to cover processing costs as shown in Table 1‑3.
Table 1‑3: Bilboes Gold Project Mineral Reserve Statement
|
Classification |
Tonnage (Mt) |
Au Grade (g/t) |
Cut-off grade (g/t) |
In-situ Gold Content (koz) |
|
|
McCays |
Proven |
0.8 |
2.99 |
0.9 |
80 |
|
Probable |
2.7 |
2.47 |
0.9 |
212 |
|
|
Isabella South |
Proven |
1.3 |
2.24 |
0.9 |
93 |
|
Probable |
4.1 |
2.08 |
0.9 |
272 |
|
|
Isabella North |
Proven |
2.5 |
2.57 |
0.9 |
207 |
|
Probable |
2.7 |
2.23 |
0.9 |
192 |
|
|
Bubi |
Proven |
1.2 |
1.90 |
0.9 |
75 |
|
Probable |
9.7 |
2.39 |
0.9 |
743 |
|
|
Total |
Proven |
5.9 |
2.42 |
0.9 |
455 |
|
Probable |
19.1 |
2.31 |
0.9 |
1,418 |
|
|
Grand Total |
Probable + Proven |
24.9 |
2.34 |
0.9 |
1,873 |
|
● |
S-K 1300 definitions observed for classification of Mineral Reserves. |
|
● |
Mineral reserves are quoted as head grade or as plant feed. |
|
● |
All tonnes quoted are dry tonnes. |
|
● |
Numbers may not add due to rounding. |
|
● |
No metal equivalents are reported. |
|
● |
Effective Date of Mineral Reserve Estimate is 31 December 2023. |
The estimate of Mineral Reserves of the Bilboes Gold Mine could be affected by any unknown environmental, permitting, legal, title, taxation, socioeconomic, marketing, political, or other relevant issue. Furthermore, the estimate of Mineral Reserves could be affected by any unknown mining, metallurgical, infrastructure, or other relevant factor.
|
1.11 |
Mining Strategy |
A Life of Mine (LoM) schedule has been developed to supply two processing phases. These consist of Phase 1 at a processing capacity of 2.88 Mtpa (Isabella and McCays) and Phase 2 at a processing capacity of 2.16 Mtpa (Bubi). The LoM schedule considers the blending requirement that a maximum of 50% of feed to plant be sourced from Isabella North and the remainder from Isabella South (preferred blend) or McCays for Phase 1.
The mining utilizes conventional truck and shovel method with a mining contractor will be used for all open pit mining related earthmoving activities. Free dig and blasted waste will be loaded, hauled with 60t haul trucks, and dumped to designated waste dump locations which will be systematically dozed and levelled to allow dump to be raised to design heights.
The Bubi ore will be dumped on the pit rim stockpiles before being loaded and hauled with a fleet of road trucks to the central processing facility at Isabella. There it will either be directly tipped into the crushing facility or placed on the RoM pad stockpile areas.
McCays will commence production first. This will assist in delivering higher mill feed grades early in the project life.
Approximately eleven months of waste stripping will be required to expose sufficient ore to maintain a constant ore feed rate during Phase 1 once the processing plant has been commissioned.
The mining of all four deposits will run for a period of approximately 10 years at full process capacity - based on the current production schedule. The peak production requirements are 32.3 Mtpa (total material movement) in year 2029.
|
1.12 |
Mine Production Schedules |
For scheduling purposes, it was assumed that 100 t excavators with 6 m³ bucket will be deployed on waste and 75 t excavators (4 m³ bucket) on ore. These excavators will be loading trucks with a payload capacity of 60 t and 40 t, respectively.
The production profile is reported as ore fed to the plant from four mineralization properties which are McCays, Isabella North, Isabella South and Bubi. A total of 24.9 million tonnes of mineralized material is delivered to the processing facility, with 198 million tonnes of waste removed over the same period. The average gold grade over life of mine is estimated at 2.34 g/t.
The scheduling results are summarized in Figure 1‑1. The results show that the schedule is a practical solution that targets value and meets all mining and processing goals monthly.
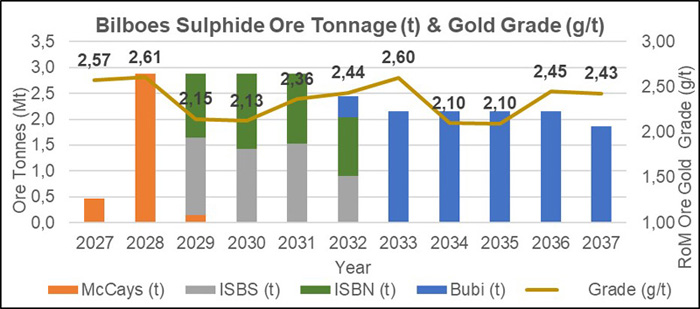
Figure 1‑1: Total Mine Material Movements for LoM
|
1.13 |
Tailings Storage Facility |
Two streams of tailings were envisaged: the flotation circuit (which produces flotation tailings), and the BIOX® circuit (which produces BIOX® CIL tailings and the neutralized BIOX® product that is mixed back with flotation tailings). The flotation and BIOX® tailings will be stored separately in two compartments due to variations in chemistry and rheology. A hybrid lined TSF development system that incorporated full containment of tailings during the initial high Rate of Rise (RoR) deposition phases, followed by upstream development in the latter phases of development when the RoR reduces to the permissible 2 m/year, was designed.
Full wall containment during the initial stages of deposition allows for storage of water on top of the TSF for as long as freeboard is maintained and seepage through surrounding embankments is prevented. Storage of water on the dam further allows for the deferment of the construction of the flotation Return Water Dam RWD (together with associated return water infrastructure) to that time when upstream construction commences. A floating barge, or an on-shore skid-mounted appropriately sized pump can then be used during that time. The return water flows have been provided accordingly.
The BIOX® RWD was designed assuming return to the plant or elsewhere for treatment. The BIOX® return water flows have also been provided accordingly.
|
1.14 |
Infrastructure and Site Layout |
The overall site plan is shown in Figure 1‑2 and includes major facilities of the Project including the Isabella North and South, McCays and Bubi open pit mines, gold processing plan, TSF, Waste Stockpiles, demarcated areas for mine buildings and accommodation facilities, main power line internal mine roads and access public roads.
Grid power will be supplied from the Zimbabwe National Grid by constructing a 70 km 132 kV Lynx line from Shangani Substation. To feed the line, a line bay will be constructed at Shangani. A mine substation will be constructed at Isabella. The estimate received is for a 132kV substation, equipped with a 50 MVA 132/33 kV step-down transformer.
Raw water will be provided from open pit dewatering and the wellfield boreholes located across the mine license area.
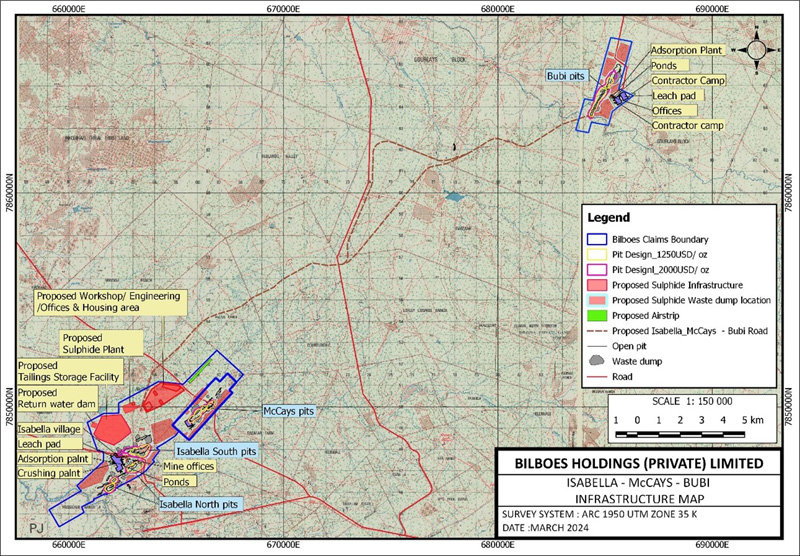
Figure 1‑2: Overall Site Plan

|
1.15 |
Environmental |
The ESIA and accompanying specialist studies were conducted in conformance with the relevant International Finance Corporation (IFC) Performance Standards and associated guidelines and in compliance with the legal framework of Zimbabwe. The EIA (SLR, 2019) identified the following potential environmental impacts:
The EIA (SLR, 2019) concluded that the proposed project presents several potential positive and negative impacts associated with the unmitigated scenario. With mitigation (in the residual impact scenario) some of the identified potential impacts can be prevented and the remainder can be managed and mitigated to remain within acceptable environmental limits so long as the mitigation set out in the Environmental and Social Management Plan (ESMP) is implemented and Bilboes develops, implements, and annually reviews the Environmental, Social and Safety Management System (ESSMS). Positive impacts can be enhanced by developing and implementing a Community Development Plan as set out in the ESMP.
Bilboes is committed to implementing the mitigation measures within the ESMP together with the ESSMS which will be implemented as part of Bilboes’ on-going efforts of continuous environmental improvement. The management system will contain plans and procedures to help manage environmental aspects and impacts and help ensure legal compliance.
Requirements for post-closure monitoring to determine whether the mitigation and rehabilitation measures are effective would be incorporated into a final Closure Plan to be compiled for the operations prior to the commencement of decommissioning.
|
1.16 |
Project Permitting |
An approved EIA is required in terms of the Environmental Management Act (Chapter 20:27) No. 13 of 2002 and the Mines and Minerals Act (Chapter 21:05) of 1996. The ESIA was undertaken for the project to satisfy the requirement and an ESIA Report completed for submission to Environmental Management Agency (EMA) within the first quarter of 2020. Thereafter, public feedback meetings were held to disclose the findings of the ESIA Report to the identified stakeholders. A record of this disclosure process was compiled and submitted to the EMA. An Environmental Impact Assessment (EIA) certificate was issued to Bilboes for the project in February 2021 and was valid for 2 years. The EIA certificate was renewed for 1 year to March 2024 and now to March 2025. The EIA certificate renewal process will continue annually for the duration of the operations, subject to conditions which include project update reports, compliance to Environmental Management Plans (EMP) outlined in the ESIA Report and notification to EMA for any changes in the project likely to alter the project as stipulated in the ESIA Report. Other project related licenses include air emissions (generators, smelter, incinerator), explosives (purchase and storage), firearms, medicines control, public health (medical examination), water abstract and hazardous substances (importation, transportation, storage and use), solid waste disposal which are renewed quarterly or annually.
|
1.17 |
Social and Community Related Requirements and Plans |
An Environmental and Social Management Plan (ESMP) has been developed which contains the environmental, social and safety management and monitoring commitments that Bilboes will implement to manage the negative impacts and enhance the positive impacts identified in the EIA. This will include
|
● |
A Livelihoods Restoration Plan (LRP). |
|
● |
Several Corporate Social Responsibility (CSR) programmes. |
|
● |
Develop fair and transparent labor, working conditions and recruitment policy. |
|
● |
A local procurement policy will be developed and implemented. |
|
● |
Develop a Stakeholder Engagement Plan. |
|
● |
Addressing the social or community impacts. |
|
1.18 |
Mine Closure |
Generally accepted “good international practice” mine closure methods were used as the basis for the conceptual closure plan, as well as, for determining the unit rates for the various closure components used in the LoM liability calculation. The mine closure methods also conform to the statutory requirements of Zimbabwe EMA who are the regulatory body.
|
1.19 |
Process Plant |
Extensive test work has been undertaken. The ore (fresh sulfide) is refractory to normal free milling processing due to the ultrafine gold particles being largely encapsulated (and generally appearing in solid solution) within the sulfide minerals. As a result, the selected process encompasses a biological sulfide destruction step (the Outotec proprietary BIOX® process) to liberate the gold particles and allow dissolution by a cyanide solution in the CIL circuit. The test work results were used to derive the Process Design Criteria (PDC) for the processing plant as depicted in Table 1‑4.
Table 1‑4: Process Plant Main Design Criteria
|
Description |
Unit |
Design |
Remarks |
|
Plant Annual RoM Throughput |
|||
|
Phase 1 Isabella McCays |
tpa |
2,880,000 |
|
|
Phase 2 Bubi |
tpa |
2,160,000 |
|
|
Plant Monthly RoM Throughput |
|||
|
Phase 1 Isabella McCays |
tpm |
240,000 |
|
|
Phase 2 Bubi |
tpm |
180,000 |
|
|
Au Head Grade Analysis (LoM) |
|||
|
Isabella McCays |
g/t |
2.51 |
|
|
Bubi |
g/t |
2.33 |
|
|
Ore Characteristics |
|||
|
SG (specific gravity) |
|||
|
Isabella McCays |
t/m³ |
2.77 |
|
|
Bubi |
t/m³ |
2.85 |
|
|
BBWi (Bond ball work index) |
|||
|
Isabella McCays |
kWh/t |
17.00 |
|
|
Bubi |
kWh/t |
21.45 |
|
|
Ore Product Sizes |
|||
|
Crushed Ore (P80) (80% passing size) |
mm |
13 |
|
|
Milled Ore (P80) (80% passing size) |
microns |
75 |
|
|
Flotation Mass Pull |
|||
|
Isabella McCays |
% |
5 |
|
|
Bubi |
% |
10 |
Ore will be derived from the two main mining areas (Isabella McCays and Bubi) with production throughput to be phased over the LoM based on tonnage, proximity to the process plant and metallurgical characteristics. Bubi ore, destined to be processed over the latter part of the LoM will be trucked approximately 23 km to the processing plant which will be situated at the Isabella McCays complex. The envisaged phasing is as depicted in Figure 1‑3.
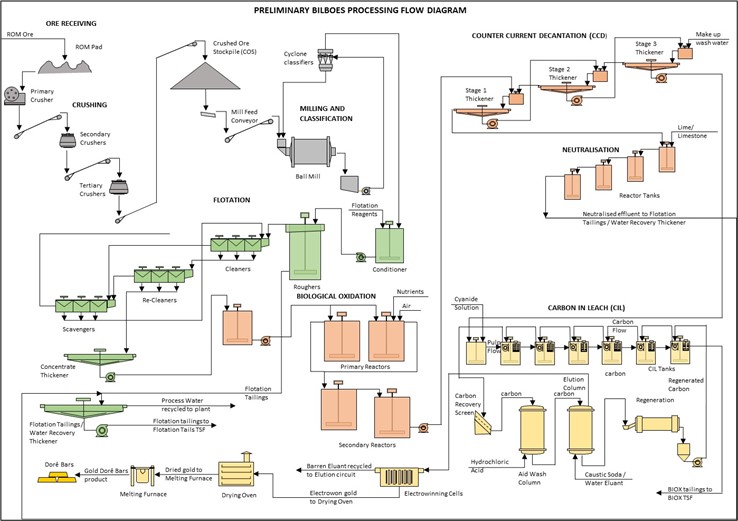
Figure 1‑3: Bilboes Simplified Process Flow Diagram
|
1.20 |
Capital Costs |
DRA developed and costed the two phases:
|
● |
Phase 1: 240 ktpm milled ore originating from the Isabella McCays mining area (years 1-6), |
|
● |
Phase 2: 180 ktpm milled ore originating from the Bubi mining area (years 6-10). |
The Capital Cost Estimate (CCE) (December 2023) meets the required accuracy criteria of -15% +25% and is equivalent to a Class 4 Estimate as defined by the American Association of Cost Engineers, (AACE).
The estimate further assumes that the project would be executed on an EPCM basis.
The Capital Estimate is summarized in Table 1‑5.
Table 1‑5: Capital Summaries per Project Phase
|
Description |
Grand Total |
Sub Total Phase 1 |
Sub Total Phase 2 |
|
|
(Million US$) | (Million US$) | (Million US$) |
|
Mining |
32.03 |
32.03 |
- |
|
Process |
170.02 |
146.90 |
23.12 |
|
Infrastructure, Utilities and Ancillaries |
132.55 |
110.76 |
21.79 |
|
Indirect Cost |
45.18 |
42.98 |
2.20 |
|
Contingency |
34.23 |
29.83 |
4.40 |
|
Total Project Costs |
414.03 |
362.50 |
51.51 |
|
1.21 |
Operating Costs |
The operating cost estimate has been completed from a zero base and presented in US$. Costs associated with labor, materials and consumables have been included in this estimate.
|
1.21.1 |
Mining Contractor Costing |
The average mining cost based on pricing received is US$ 3.01 /t including the ore transport cost from all mining areas process plant. The cost breakdown is shown in Table 1‑6.
Table 1‑6: Mining Contractor OPEX
|
Area |
Cost per Total Tonne Mined (Ore and Waste) (US$) |
|
G & A |
0.34 |
|
Drill and Blast |
0.44 |
|
Load and Haul Incl. Rehandle & Services |
2.23 |
|
Total |
3.01 |
|
Diesel Cost |
$1.52 (October 2023) |
|
1.21.2 |
Process Plant Operating Cost |
Operating costs have been estimated and based on the production profile for LoM. For illustrative purposes, static costs are presented for Phase 1 and Phase 2 in Table 1‑7. Main drivers in costs include reagents and power which collectively account for more than 70% of total plant operating costs.
Table 1‑7: Plant OPEX
|
Description |
Unit |
Phase 1: 240 ktpm IM |
Phase 2: 180 ktpm Bubi |
|
RoM |
t/a |
2,880,000 |
2,160,000 |
|
Total variable |
US$ m/a |
38 |
53 |
|
Total fixed |
US$ m/a |
12 |
17 |
|
Total |
US$ m/a |
50 |
71 |
|
Unit cost |
US$/t ore |
17.47 |
32.69 |
|
1.21.3 |
General and Administration Cost |
The G&A cost includes administrative personnel, general office supplies, safety and training, travel (both on site and off site), independent contractors, insurance, permits, fuel levies, security, camp power, camp costs, ICT, relocation, and recruitment.
Total G&A costs amount to US$ 4,912,650 per annum in Phases 1 and 2.
|
1.21.4 |
Total Operating Costs Summary |
The Bilboes Gold Mines total operating costs have been estimated and based on the production profile over LoM. A summary of LoM operating costs is shown in Table 1‑8.
Table 1‑8: LoM Operating Cost Summary
|
Description |
Cost (US$ m) |
Unit cost (US$ / t RoM) |
|
Mining |
639 |
26 |
|
Process Plant |
600 |
24 |
|
G&A |
46 |
2 |
|
Total |
1,285 |
52 |
|
1.22 |
Market Studies |
The Gold Trade Act empowers the Minister responsible for Finance to issue a Gold Dealers License which entitles entities to export and sell gold from Zimbabwe to customers of its choice. Prior to 1 June 2021, only Fidelity Gold Refinery (Private) Limited (FGR) had the Gold Dealership License and therefore all gold bullion was sold to FGR. With effect from 1 August 2021, all gold producers can directly sell any incremental production to customers of their choice using FGR’s license to export. Caledonia’s Blanket Mine is currently selling its gold to a customer of its choice but exporting the gold using FGR’s license. Sales proceeds come directly into Caledonia’s bank account. As all Bilboes’ production is considered incremental, Bilboes will be able to choose to sell its gold directly to customers of its choice or to continue selling to FGR.
Bilboes is confident that it will be able to export and sell its gold production on similar terms as those obtaining from FGR.
|
1.23 |
Economic Outcomes |
The financial model has been prepared on a 100% equity project basis and does not consider alternative financing scenarios. A discount rate of 10% has been applied in the analysis. The outcomes are presented on a pre-tax and post-tax basis. A static metal price of US$ 1,800/oz has been applied. All-in sustaining costs have been reported as per the World Gold Council (WGC) guideline dated November 2018 and is exclusive of project capital, depreciation, and amortization costs. Capital payback is exclusive of the construction period and referenced to the start of first production. Key financial outcomes are shown in Table 1‑9.
Table 1‑9: Project Economics Summary
|
Description |
Units |
Value |
|
Financial Outcomes (Post-tax, Constant Model Terms) |
||
|
NPV @ 10% |
US$ m |
328 |
|
IRR |
% |
33.4 |
|
Peak Cash Funding |
US$ m |
348 |
|
AISC |
US$/oz |
922 |
|
Payback (UNDISCOUNTED) - From Production Start |
years |
1.8 |
|
1.24 |
Project Development |
The key development milestones are as follows:
Table 1‑10: Key Development Milestones
|
Project Milestones |
Completion |
|
Client reviews and project roadmap decision making |
June 2024 |
|
FS revision phase |
February 2025 |
|
Funding for execution |
October 2025 |
|
Project execution of Phase 1 to achieve 240 ktpm |
December 2027 |
|
Phase 2 project execution for Bubi |
December 2032 |
|
1.25 |
Conclusions |
|
1.25.1 |
Mineral Resource Estimates |
The data was reviewed and validated by the QP who concluded that the data is suitable for the construction of the geological model and for the estimation of the Mineral Resource.
The QP is confident that enough geological work has been undertaken, and sufficient geological understanding gained, to enable the construction of a geological model suitable for the determination of a Mineral Resource estimate.
The geological modelling, Mineral Resource estimate and classification were undertaken utilizing recognized deposit and industry strategies/methodologies for the type of deposit of the Bilboes Gold Mine.
The MR is constrained in an optimized pit shell. This together with the assumptions relating to mining, processing, infrastructure, and market factors supports the “reasonable prospects for eventual economic extraction”.
The QP is not aware of any metallurgical, infrastructural, environmental, legal, title, taxation, socio-economic, or marketing issues that would impact on the Mineral Resource, or Reserve statements as presented.
Based on an assessment including: - data quality and integrity, data spacing, confidence in the grade interpolation, confidence in the geological interpretation and confidence in the estimate the QP believes the Mineral Resource estimated is robust.
|
1.25.2 |
Mining and Mineral Reserves |
The QP responsible for the declaration of the Mineral Reserve, is confident that significant geological work has been undertaken, and sufficient geological understanding gained, to enable the construction of an ore body model suitable for the derivation of Mineral Resource and Mineral Reserve estimates.
Based on the information presented in this TRS, the QP considers the MRE to be supported by the appropriate technical data and assumptions.
The open pit modelling is based on suitably supported assumptions and parameters and completed utilizing appropriate industry standards suitable for the Bilboes Gold Mine.
The economic modelling is supported by technical studies in mining, processing, infrastructure, environmental, social, and marketing. Based on the inputs from these disciplines, the financial model demonstrates a feasible mine. The economic analysis is based on a US$ 1,800/oz.
The sensitivity analyses demonstrates that the profitability of the project is most sensitive to revenue related factors such as gold price and recovery.
The QP is not aware of any metallurgical, infrastructural, environmental, legal, title, taxation, socio-economic, or marketing issues that would impact on the Mineral Reserve statements as presented or that would impact on the reliability and/or confidence of the declaration.
|
1.25.3 |
Risk Assessment |
Various risks have been identified with consideration of the appropriate mitigating factors.
|
1.26 |
Recommendations |
|
1.26.1 |
Geology and Mineral Resource |
During the operational phase, drilling is required to develop an advanced grade control model prior to mining. A drill spacing study will be required to determine the optimum spacing for “grade control” drilling. The closed space drilling will also enable a more accurate estimation of tonnage and grade as well as a greater definition of oxide, transitional and sulfide ore boundaries.
|
1.26.2 |
Mining |
Investigate waste stripping optimization in the early LoM to reduce early operating costs and improve the overall business case.
Investigate pit slope optimization due to very short pits life, to reduce stripping ratio and total waste movements.
On-going geotechnical analysis is recommended during future mining operations to assess pit slope angles to investigate if improvements can be made for less waste stripping, reduced operating costs, and improve overall business economics.
|
1.26.3 |
Processing |
Optimization efforts could be considered during the project execution front-end engineering and design phase, by conducting further test work focused on flotation optimization (including variability tests) to establish a grade-recovery relationship and validate recovery upsides.
Development of the skills base to effectively run the BIOX® operations is crucial for the business and should be prioritized prior and during the operational phase.
A sufficiently sized water storage dam should be constructed to collect and store water during the wet season and times when the operation is water positive to cater for the dry season.
|
2 |
INTRODUCTION |
This TRS has been prepared for Caledonia on the Bilboes Gold Mine, Zimbabwe, by DRA Projects (Pty) Ltd, which is a Qualified Person, in accordance with S-K 1300. For purposes of S-K 1300, this TRS is considered a Pre-Feasibility Study, or PFS. Caledonia acquired Bilboes on 6 January 2023. Caledonia is a Zimbabwean focused exploration, development, and mining corporation. Caledonia shares are listed on the NYSE American LLC and depositary interests in the shares are traded on the AIM of the London Stock Exchange plc (symbol: CMCL). Caledonia listed depositary receipts on the Victoria Falls Stock Exchange, a subsidiary of the Zimbabwe Stock Exchange, on December 2, 2021.
|
2.1 |
Report Purpose |
Caledonia mandated the completion of this TRS to report the Mineral Resources and Mineral Reserves on the Bilboes Gold Mine effective as of 31 December 2023 in compliance with S-K 1300. This is the first TRS to be prepared on the Bilboes Gold Mine. This is the initial filing of a TRS in respect of the Bilboes Mine.
|
2.2 |
Sources of Information |
All input drilling data used for the generation of the geological and resource models were supplied by Bilboes who also supplied all historical information including geological data, reports, and maps. The Whittle shells used to define the Mineral Resource and Mineral Reserve were created by DRA, using the latest block models supplied by DRA.
|
● |
All exploration and mining permit information was supplied by Bilboes, |
|
● |
Information on the process was obtained from the pilot plant test work, |
|
● |
The rest of the technical information was obtained by the various consultants engaged by Bilboes. |
|
2.3 |
Personal Inspections / Site Visits |
The following personal inspections/site visits were completed by the QP on the properties by DRA on 3 - 6 July 2017, 6 and 7 December 2017, 21 and 22 February 2018, 20 and 22 March 2018, 26 September 2018.
After discussion with the mine and based on the lack of any significant mine production or construction, it was deemed that site visits in 2023 would not add any value to the work completed.
|
2.4 |
QP Responsibilities and Relationships |
The QP is not affiliated with Caledonia or any other entity that has an ownership, royalty or other interest in the Bilboes properties.
|
3 |
PROPERTY DESCRIPTION |
|
3.1 |
Project Location |
The Bilboes properties are located in the Matabeleland North Province of Zimbabwe. The Isabella-McCays properties are situated approximately 80 km north of Bulawayo while Bubi is situated approximately 100 km north of Bulawayo. Bubi is 32 km due north-east of Isabella See Table 3‑1 for coordinates).
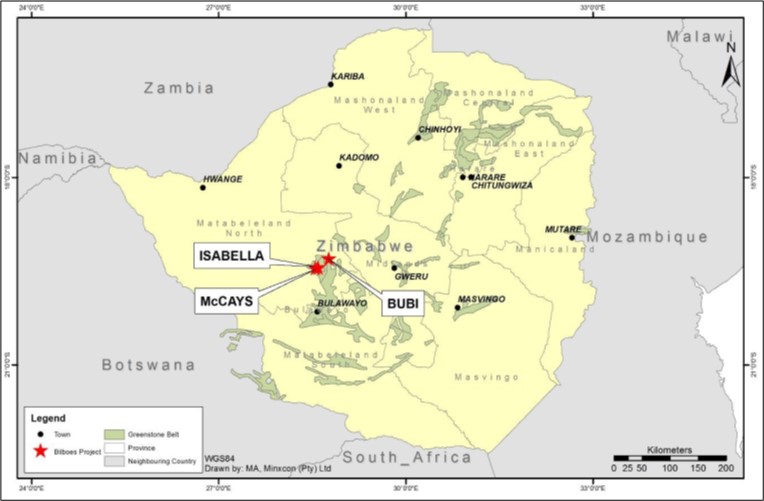
Figure 3‑1: Regional Location of the Bilboes1
|
3.2 |
Property Area |
The Isabella-McCays-Bubi properties comprise 130 claim blocks covering an area of 2,731.6 ha as shown in Table 3‑1.
Table 3‑1: Bilboes Claims
|
Group of Claims |
Mining District |
Province |
No. of Blocks |
Area (ha) |
Coordinate X1 |
Coordinate Y1 |
|
Calcite and Kerry |
Bulawayo |
Matabeleland North |
49 |
1,894.4 |
662,106 |
7,846,712 |
|
Ruswayi |
Bulawayo |
Matabeleland North |
33 |
330 |
666,339 |
7,849,975 |
|
Chikosi |
Bulawayo |
Matabeleland North |
48 |
507.2 |
684,838 |
7,865,515 |
|
Total |
130 |
2,731.6 |
Coordinates are in UTM Arc 1950 Zone 35K, Clarke 1880 spheroid format.
________________________________
1 Source: Burger et al, 2017
|
3.3 |
Mineral Tenure and Title |
Bilboes consist of 130 claim blocks wholly owned by Bilboes. Of the 130 blocks, 49 gold and base metal blocks and a Special Mine site belong to the Isabella mining area while McCays comprise of 33 gold blocks (Figure 3‑2) and Bubi consisting of 48 gold blocks (Figure 3‑3). The rights were obtained through certificates of Registration After Transfer from Prospecting Ventures, an exploration entity owned Anglo American which had pegged these claims after carrying out exploration work. Bilboes also thereafter registered additional claims in the surrounding area. The claims are protected annually against forfeiture through gold production and exploration work. The Company has exclusive rights to subsurface areas to produce gold from these properties and the rights are transferable and do not expire if the annual protection fees are paid when they become due.
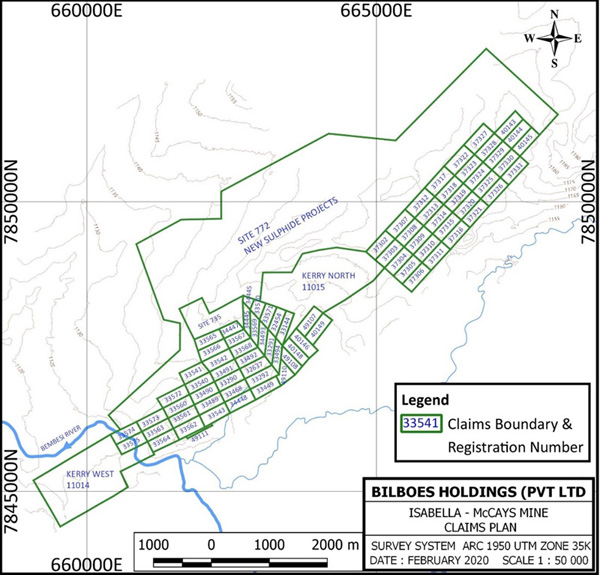
Figure 3‑2: Isabella-McCays Mine Claims Map
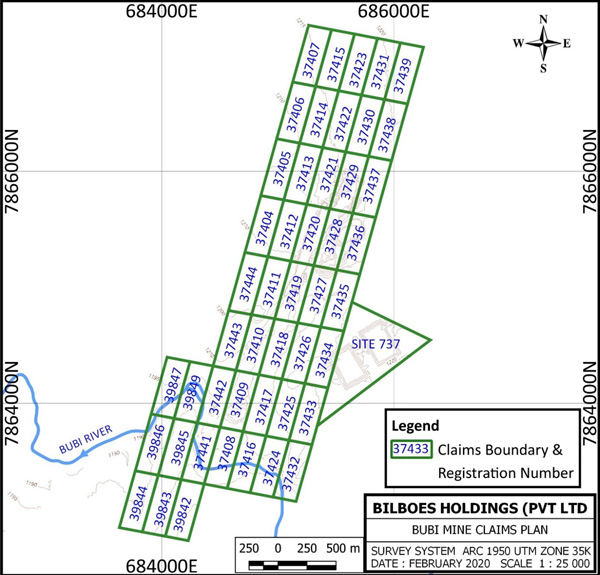
Figure 3‑3: Bubi Mine Claims Map
|
3.4 |
Royalties |
Royalty in Zimbabwe is levied as 5% on gross gold sales revenue.
|
3.5 |
Permits |
Bilboes has been operating in Matabeleland since 1989. It holds the necessary mining permits and complies with the terms of the Mines and Minerals Act and allied regulations with respect to all of their claims and in particular that all of the registration certificates are valid, and the protection certificates are up to date. Bilboes thus requires no further permits to explore or produce from the current operational areas, but further permits will be required for the proposed haul road between Bubi and Isabella plant.
Further exploration outside the current claims will require approvals by the EMA who may request an EIA study.
SLR Consulting based in South Africa in partnership with the local GryinOva Environmental Consultants conducted an ESIA study for the project and an EIA certificate of approval was issued by EMA in February 2021 and the certificate was valid for 2 years and subject to renewal on an annual basis for the duration of the operations. The current EIA certificate expires in March 2025. The conditions of renewal are notification to the agency of any changes in the project, compliance to the approved environmental plan and submission of progress report on the project. There is no reason that the renewal will not be granted.
Other project related licenses which are currently in use include air emissions (generators, smelter, incinerator), explosives (purchase and storage), firearms, medicines control, public health (medical examination), water abstract and hazardous substances (importation, transportation, storage and use), solid waste disposal which are renewed when they become due either quarterly or annually. The conditions of renewal involve payment of applicable fees to the regulatory bodies for an amount of $70,000 per annum.
Bilboes also hold 3,935 ha of additional claims and 51,900 ha of exploration licenses referred to as Exclusive Prospecting Orders (EPOs) around Isabella-McCays-Bubi and the Gweru area. These claims and EPOs have highly prospective targets which offer Bilboes excellent prospects for organic growth. The company has applied for an extension of the EPOs tenure for a further 3 years after the initial 3-year tenure expired in July 2021. The decision on the EPO applications is pending.
|
3.6 |
Political Risks |
Political uncertainties are risks, which may lead to unfavorable legislative and taxation framework changes, exchange control restrictions, international monetary fluctuations, civil unrest, or any other political instability. However, the current political environment is looking favorable due to the recent reforms by the Government under the new dispensation. It is expected that this or any other politically related risks will not affect Bilboes now or in the foreseeable future.
All the properties belonging to Bilboes are protected in respect of the Mines and Minerals Act. All the blocks of claims are registered with the Mining Commissioner’s office and are regularly inspected in compliance with the mining regulations and preserved against forfeiture.
|
3.7 |
Indigenization and Economic Empowerment |
The Indigenization and Economic Empowerment Act has since been amended and it now allows foreign entities to own 100% mining rights. Foreign shareholding will now be negotiated with investors.
All new foreign investment into Zimbabwe requires an investment license issued by the Zimbabwe Investment Authority in terms of the Zimbabwe Investment Authority Act.
Moreover, in the mid-term budgetary review statement of 2019 the Indigenization and Economic Empowerment Act was repealed and replaced by the Economic Empowerment Act, which is consistent with the current thrust “Zimbabwe is Open for Business".
|
4 |
ACCESSIBILITY, CLIMATE, LOCAL RESOURCES, INFRASTRUCTURE AND PHYSIOGRAPHY. |
|
4.1 |
Access |
Isabella McCays and Bubi are approximately 80 km and 100 km directly north and northeast of Bulawayo, the second largest city of Zimbabwe with an approximate population of 655,675 (2013). All the mines are accessed via public roads and although these are of variable quality, they are accessible by all types of vehicles. Isabella is 110 km (1.5 hours) whilst Bubi is 140 km (2 hours) by road from Bulawayo. Bubi can also be accessed by road from Isabella (70 km in 1 hour).
|
4.2 |
Physiography |
The properties lie between 1,150 m and 1,200 m above mean sea level (amsl). The area is covered by red and grey soils characteristic of greenstone rocks in Zimbabwe. Vegetation is dominated by scrubby Colophospermum Mopane, Acacia, and Combretum woodlands and minor occurrences of miombo with no extensive grasslands. Agricultural activities are restricted to ranching.
|
4.3 |
Climate |
Despite lying in the tropics, the climate is subtropical due to its relatively high altitude. The mean annual temperature is 19°C. Three broad seasons are prevalent: a dry, cool winter season from May to August; a dry, hot early summer from late August to Early November and a wet, warm summer from early November to April. Rainfall during the wet season averages 594 mm. The climatic conditions allow for a year-round exploration and mining activities.
|
4.4 |
Local Resources and Infrastructure |
The terms of the claims tenure system in Zimbabwe confer rights to use of the land surface for mining and construction of all related infrastructure such as housing, offices, plant, and tailings/waste disposal facilities subject to adherence to the environmental legislation. In 2019, Bilboes obtained rights for an additional 1,128 ha for a mine site at Isabella which will be adequate to cater for the additional sulfide mine infrastructure such as the sulfide plant, tailing’s storage facility, waste dumps, housing, and additional office infrastructure.
There is sufficient underground water around the mines to run the current heap-leach operations, but additional drill holes and pumping capacity will be required for the proposed sulfide-mining project. This issue was identified in the Pre-Feasibility stage of the project, along with water-use permits.
There are 33 kV power lines within 5 km and 25 km of the Isabella McCays and Bubi deposits respectively, that form part of the national grid, but new lines will have to be constructed to meet the increased capacity of the proposed exploitation of the sulfides.
A 70 km kV Lynx line will be constructed from Shangani Substation to a substation which will be constructed at Isabella. An alternative 88 kV power line, which is sufficient for the sulfide project, is located at Turk Mine about 40 km from Isabella McCays and 60 km from Bubi, but this line has recently had an increased consumer load.
Workshops, offices, and housing amenities are available for heap leach extraction, and these will require to be upgraded for the proposed sulfide mining project.
The mines have cell phone and internet connectivity and utilize a two-way radio system.
Generators at all mines allow continued production during load shedding. The capacity will need to be upgraded to cater for the sulfide operation.
|
4.5 |
Personnel |
Zimbabwe continues to boast the highest literacy rate in sub-Saharan Africa National examinations are written during the third term in November, with "O" level and "A" level subjects (UK based qualification for students aged 16 and above). Currently, there are seven public universities as well as four church-related universities in Zimbabwe that are fully internationally accredited. Zimbabwean culture places a high premium on education. Various mining related qualification such as geology, mining engineering and mineral processing are offered at tertiary level.
|
4.6 |
Supplies |
Mining supplies, including mining and processing equipment, are readily available in Zimbabwe.
|
5 |
HISTORY |
|
5.1 |
Holdings |
Bilboes was previously owned by Anglo American Corporation of Zimbabwe Ltd (AMZIM) and was later taken over by GAT investments (Pvt) Ltd in 2003. Bilboes held the Isabella, McCays and Bubi claims. AMZIM acquired the Isabella claims in 1982.
The Bilboes Properties are wholly owned by Bilboes Holdings (Pvt) Ltd, which is 100% owned by Bilboes Gold Limited (Bilboes Gold), which was acquired by Caledonia on 6 January 2023. Prior to its acquisition by Caledonia, Bilboes was a private company owned by three shareholders, Gat Investments (Private) Limited (Gat Investments), Baker Steel Resources (Baker Steel), and Infinite Treasure Limited (Infinite Treasure).
|
5.2 |
Historical Sulfide Mineral Resource Estimates |
In 2009, SRK undertook a Mineral Resource Estimate for the sulfide Properties based on the drill holes and geological interpretations supplied by Bilboes.
Geological models were created for all these deposits, excluding the oxide portions, to a depth of up to 150 m. Solid models were created from the wireframes generated and assays for gold within these were used for geostatistical modelling and resource estimation. The Mineral Resource of 5.2 Mt containing 533,000 oz was declared to 100 mbs with mineralization from 3.5 Mt containing 240,000 oz being declared from 100 – 150 mbs.
The grade estimation for the Sulfide Projects was based on a 2.0 g/t cut-off mineralized envelope. In general, the drill coverage was poor, with drill spacing ranging from 25 m (Bubi) to up to 100 m for McCays. In most cases there was only one hole per drill line.
Classification of the anomalies was based on the quality of the estimate, which in turn was based on grade continuity and data spacing and was done according to the guidelines contained within the JORC code (2012).
Estimates were validated by visually comparing the drill hole grades to the block model grades for each section line in Datamine Studio™ (Datamine).
The results of the estimation for the classification as an Inferred Mineral Resource (Table 5‑1).
Table 5‑1: Sulfide Inferred Mineral Resources as of 2009
|
Deposit |
Cut-Off (g/t) |
Tonnes (Mt) |
Au (g/t) |
Content (koz) |
|
Bubi |
2.00 |
1.435 |
2.68 |
124 |
|
Calcite |
2.00 |
0.500 |
4.96 |
80 |
|
Castile |
2.00 |
0.902 |
4.32 |
125 |
|
Diana |
2.00 |
0.915 |
3.49 |
103 |
|
Maria |
2.00 |
0.177 |
3.10 |
18 |
|
McCays |
2.00 |
0.821 |
3.20 |
84 |
|
Total / Average |
4.750 |
3.49 |
534 |
|
Subsequent to the 17,650 m core drilling by Anglo of 1994 - 1999, additional exploration work under Bilboes resumed in 2011 through to 2016 where an additional 20,527 m of core and 20,235 m of RC drilling was completed bringing the total metreage to 58,412 m. The drilling culminated in an interim Mineral Resource update by Mr. Arimon Ngilazi and Dr Anthony Martin in 2017.
These results are presented in Table 5‑2 and Table 5‑3, respectively.
Table 5‑2: Sulfide Mineral Resources as of 31 March 2017, 0.0 g/t Au Block Cut-Off Applied
|
Property |
Indicated |
Inferred |
||||||
|
|
Mass (Mt) |
Au Grade (g/t) |
Au (kg) |
Au (Moz) |
Mass (Mt) |
Au Grade (g/t) |
Au (kg) |
Au (Moz) |
|
BUBI |
29.96 |
2.20 |
65,912 |
2.12 |
9.05 |
1.90 |
17,195 |
0.55 |
|
ISBN |
12.07 |
2.19 |
26,433 |
0.85 |
1.55 |
2.01 |
3,116 |
0.10 |
|
ISBS |
7.90 |
2.43 |
19,197 |
0.62 |
0.51 |
2.62 |
1,336 |
0.04 |
|
MCCAYS |
3.48 |
2.44 |
8,491 |
0.27 |
7.07 |
1.97 |
13,928 |
0.45 |
|
Total |
53.41 |
2.25 |
120,034 |
3.86 |
18.17 |
1.96 |
35,575 |
1.14 |
Table 5‑3: Sulfide Mineral Resources as of 31 March 2017, 0.9 g/t Au Block Cut-Off Applied
|
Property |
Indicated |
Inferred |
||||||
|
|
Mass (Mt) |
Au Grade (g/t) |
Au (kg) |
Au (Moz) |
Mass (Mt) |
Au Grade (g/t) |
Au (kg) |
Au (Moz) |
|
BUBI |
28.05 |
2.27 |
63,674 |
2.05 |
8.66 |
1.93 |
16,714 |
0.54 |
|
ISBN |
9.94 |
2.53 |
25,148 |
0.81 |
1.29 |
2.27 |
2,928 |
0.09 |
|
ISBS |
7.05 |
2.60 |
18,330 |
0.59 |
0.44 |
2.86 |
1,258 |
0.04 |
|
MCCAYS |
2.55 |
3.19 |
8,135 |
0.26 |
5.58 |
2.38 |
13,280 |
0.43 |
|
Total |
47.60 |
2.42 |
115,286 |
3.71 |
15.97 |
2.14 |
34,181 |
1.10 |
|
5.3 |
Production |
|
5.3.1 |
Oxide Mineralization |
|
5.3.1.1 |
Isabella |
There are early records of insignificant gold production for the Isabella Mine prior to 1982. In its first year of operation the Isabella open pit operation produced 170 kg of gold from a monthly rate of 15,000 t of ore. At start of production there were three pits with a Mineral Reserve life of 18 months and as of 31 December 2020, the Mine had treated 6.4 Mt of oxides at 1.16 g/t (239 koz) and recovered 147 koz of gold inclusive of re-leached gold from the old heap leach pads. The bulk of the production from Isabella was from uncrushed ore with only 33 koz of gold being recovered from 2.3 Mt of crushed oxide ore after the installation of a crushing plant in 2007.
|
5.3.1.2 |
Bubi |
Bubi was commissioned in 1997 at 25,000 t per month of oxide ore and produced 9.5 koz of gold in its first year. Mining activities were suspended at Bubi Mine in 2007 after running out of oxide ore. Gold production from that period to 2013 has been from re-leaching of the old heaps. Progressively inclusive of re-leached gold from the old heap leach pads, the mine has produced 84 koz of gold as at end of December 2020 from 4.3 Mt of oxide ore at 1.00 g/t (138 koz). All the ore at Bubi Mine was treated without crushing. There has not been any mining at Bubi from 2005 after the exhaustion of oxides until the commencement of re-leaching activities at the beginning of 2019.
|
5.3.1.3 |
McCays |
As a result of regional exploration by Prospecting Ventures (PV), an Anglo American Corporation exploration company based in Zimbabwe at the time, a new gold deposit was discovered at McCays in 1997. In 1998 production from an open pit, heap-leach mine started. Further exploration work within the claims area during the operational phase of the mine was added to the Reserves until depletion and temporary closure in 2002. No mining activities took place between 2002 and 2012 at McCays. Gold production was through re-leaching from the year 2004 until 2009. No gold production occurred from 2010 to 2012. Activities commenced after the recapitalization of Bilboes in 2013. Cumulative gold production from inception at McCays was 55 koz) as of 31 December 2020. This included the re-leached gold from the old heap leach pads from treating 2.1 Mt of oxide ore at 1.16 g/t (78 koz). Inclusive of this, an estimated 22 koz) of gold was recovered from 950,000 t of crushed oxide ore after the installation of a crushing plant in 2013. The oxides at McCays are finished and only re-leaching activity is taking place.
|
5.3.2 |
Production Summary |
Prior to the open-pit exploitation of the Isabella Mineral Resource by Bilboes, the Calcite Mine (underground and now part of the Isabella strike) produced 559 kg of gold at an average recovered grade of 8.2 g/t.
The production from Bilboes mines including When Mine from inception to 31 December 2020 is presented in Table 5‑4.
Bilboes has produced some 90,048 oz of gold from the four mines since the takeover of the company in 2003 to 31 December 2020
Table 5‑4: Production Data from Bilboes Mines to 31 December 2020
|
Start-up Date |
Ore Treated (kt) |
Grade (g/t) |
Au Recovered (koz) |
|
|
Isabella |
1989 |
6,384 |
1.16 |
146.8 |
|
Bubi |
1997 |
4,342 |
1.00 |
84.0 |
|
McCays |
1998 |
2,094 |
1.16 |
55.2 |
|
When |
2005 |
184 |
0.78 |
1.9 |
|
Total |
13,004 |
1.10 |
287.9 |
|
|
6 |
GEOLOGICAL SETTING, MINERALIZATION AND DEPOSIT |
|
6.1 |
Regional Geology |
Geology in Zimbabwe can be divided into three main areas, the Archean, the Proterozoic, and the Phanerozoic (Figure 6‑1).
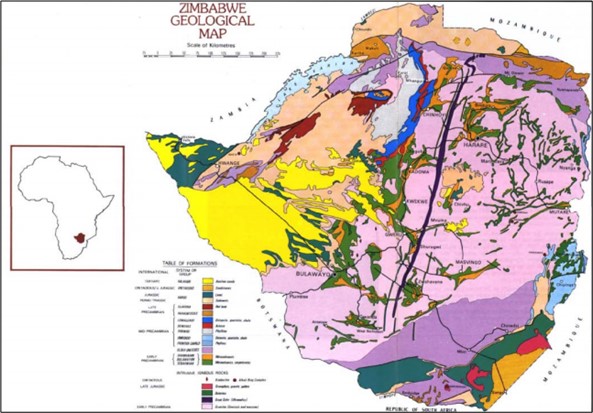
Figure 6‑1: Geological Map Zimbabwe (taken from Mugumbate, unknown year)
|
6.1.1 |
The Archean |
Rocks from the Archean era in Zimbabwe occupy most of the Zimbabwe Craton, an ancient stable continental block. This is the basement and primarily comprises granites and gneisses with remnants of volcano-sedimentary piles known as Greenstone Belts. Greenstone Belts cover approximately 60% of the land surface of Zimbabwe. The Greenstone Belts are renowned for their rich variety of Mineral Resources as shown in Figure 6‑2.
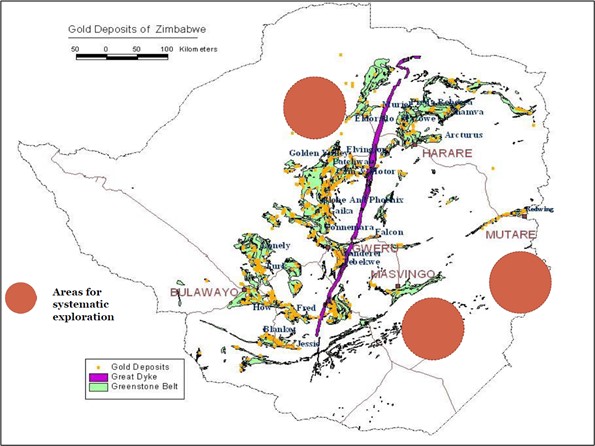
Figure 6‑2: Greenstone Belts and known Gold Deposits in Zimbabwe (Mugandani 2017)
|
6.1.2 |
The Proterozoic |
In Zimbabwe, the Proterozoic era followed immediately after the emplacement of the Great Dyke intrusion at the end of the Archean era. The Great Dyke is a layered mafic to ultramafic intrusion akin to the Bushveld Complex in South Africa. It was emplaced at the end of the Archaean era at approximately 2,500 mega annum (ma). It has a strike length of 550 km and ranges in width from 4 km to 11 km. It cuts across the entire Zimbabwe Craton in a roughly N-S direction as shown in Figure 6‑3. The Great Dyke hosts world-class reserves of Platinum Group Metals (PGMs) and chrome ore.
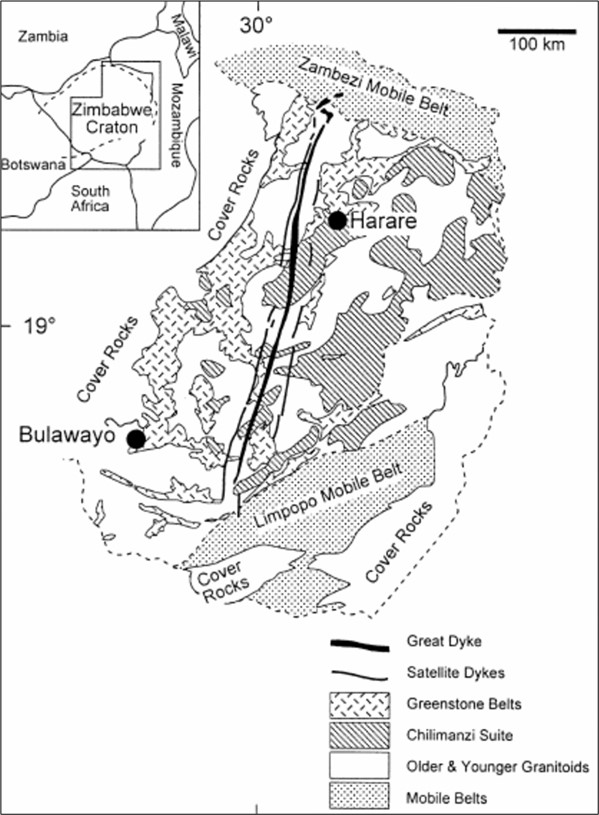
Figure 6‑3: NNE Trending Great Dyke Cutting Across the Zimbabwe Craton (Mukaka et al 1998)
There are three metamorphic mobile belts that border the Craton to the north-east, south, and north-west. The neo-Archaean Limpopo mobile belt borders the Craton on the southern boundary. The paleo-Proterozoic Magondi mobile belt borders the Craton to the north-west while the neo-Proterozoic Zambezi mobile belt borders the Craton to the north (Figure 6‑4). These metamorphic belts are hosts to economic metamorphic minerals. They also host several gemstones, precious, and base metals. To the east are the Umkondo group sediments which were deposited in a large basin and are capped by younger dolerite sills and basaltic flows. The Umkondo sediments host the Chiadzwa placer diamond deposits.
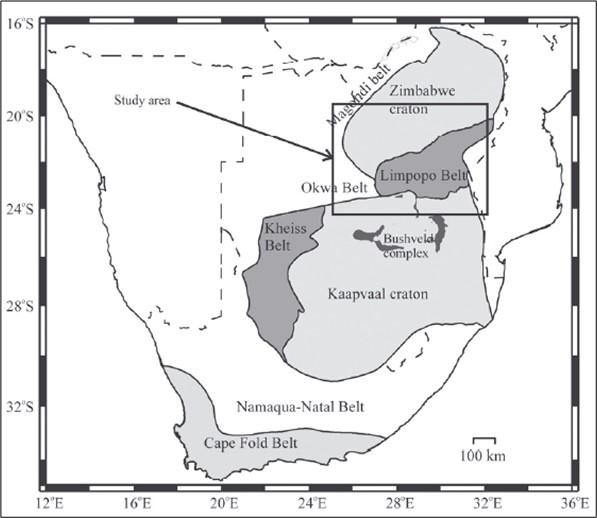
Figure 6‑4: Geological Map showing the Zimbabwe Craton and Mobile Belts (Gore et al 2009)
|
6.1.3 |
The Phanerozoic |
The Phanerozoic consists of several sequences of sedimentary rocks covering the peripheries of the Craton. Included in the Phanerozoic are sedimentary basins: the Permian - Triassic Jurassic Karoo Supergroup, Cretaceous sediments, and Tertiary to recent sand of the Kalahari Figure 6‑5.
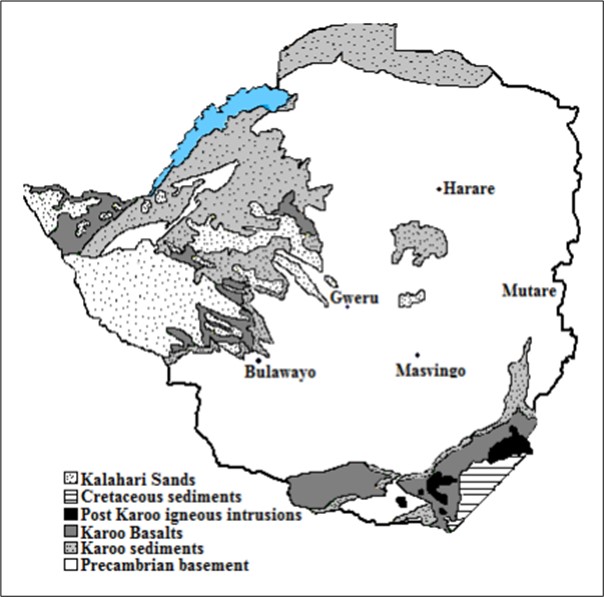
Figure 6‑5: Sedimentary Basins of Zimbabwe (taken from Mugumbate, unknown year)
|
6.2 |
Regional Geology as it Relates to the Bilboes Properties |
The Bubi Greenstone Belt covering the Bilboes Properties consists of volcanic rocks of the Upper Bulawayan Group capped by sedimentary sequences of the Shamvaian Group locally represented by Mdutjana and Dagmar Formations respectively (Figure 6‑6). The deposits occur within the meta-volcanic and meta-sediments close to the contact between these two stratigraphic units.
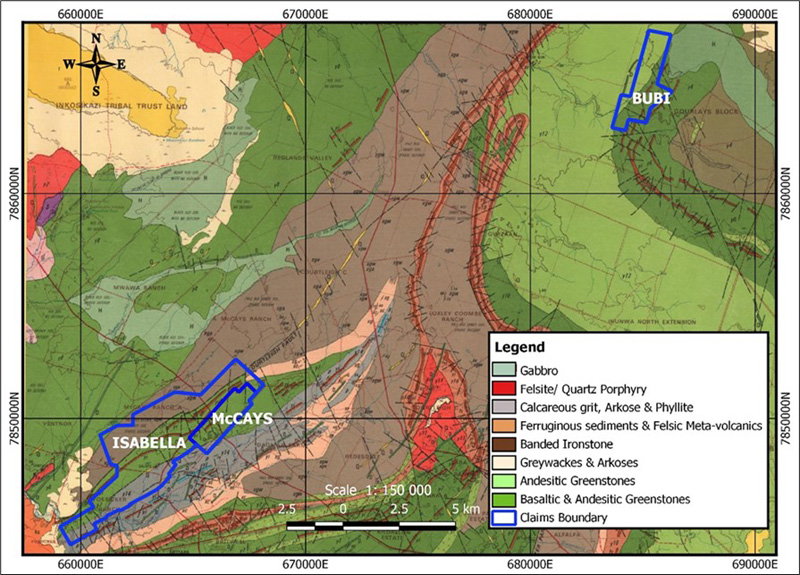
Figure 6‑6: Regional Geological Map showing Bilboes Properties (from Ngilazi and Martin ’17)
|
6.3 |
Stratigraphy |
The Bilboes stratigraphic presentation is depicted in Figure 6‑7.
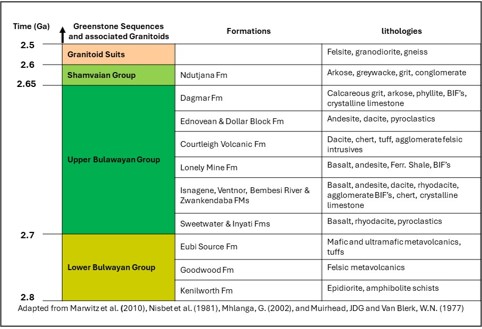
Figure 6‑7: Bilboes Site Stratigraphy
|
6.4 |
Deposit Types |
Mineralization at Bilboes’ four properties are Archaean lode, structurally controlled deposits. It consists of silicified stock-works/veins. The veins comprise pyrite and arsenopyrite. Gold is disseminated within the sulfide mineralization and is refractory. Pyrite is the dominant sulphide mineral, with minor arsenopyrite at Isabella & McCays, with the exception of the Isabella North orebodies here an equal proportion of pyrite to arsenopyrite is evident. At Bubi the dominant sulphides is pyrite with minor arsenopyrite. The mineralized zones are often subparallel to each other and are hosted in a much broader shear zone. The best mineralized zones are associated with brecciation and silicification.
The sulphide tends to weather readily and all of the deposits are covered by oxide caps to a depth of 12 m to 50 m which are readily amenable to heap-leach extraction.
Orebody widths at Isabella and McCays range from 5 m to 20 m and are wider near surface. Individual orebodies have strike ranges from 75 m to 500 m and are typically in en echelon pattern in a northwest to south-eastern pattern. The oxide cap is deepest at Isabella where the range is 12 m to 50 m. The overall mineralized strike is 4,400 m.
The oxide-sulphides interface at Bubi is shallow in the southwest at about 10 m to 12 m below surface and increases to 30 m in the central parts and to 40 m in the northeast. Orebody widths vary from 10 m in the southwest to as wide as 100 m in the central portions of the claims. The overall mineralized strike is 2,950 m,
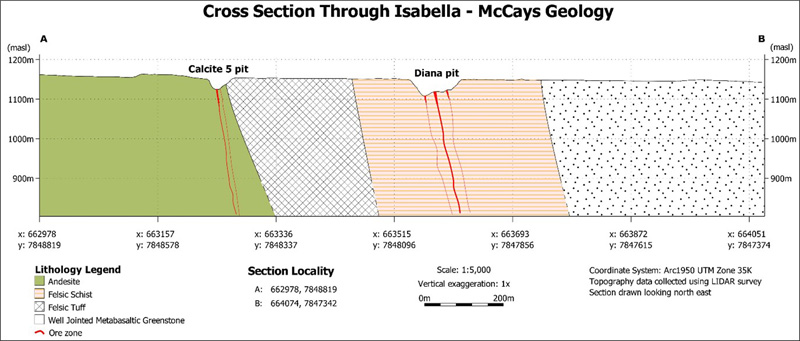
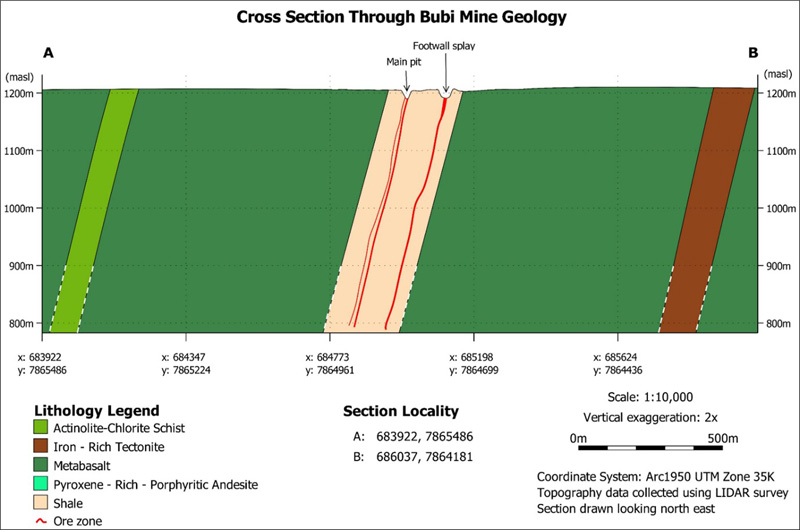
|
7 |
EXPLORATION |
|
7.1 |
Geological Mapping |
Mapping has been conducted progressively at the Bilboes mines since commencement of oxide gold operations, with the latest exercise being conducted between January and September 2018. Below are some of the maps produced for Bubi (Figure 7‑1) and the Isabella McCays area (Figure 7‑2). Mapping was done to decipher surface and in-pit geological and geotechnical information, critical for structural and alteration interpretation of mineralized units and in aiding pit geotechnical slope stability studies.
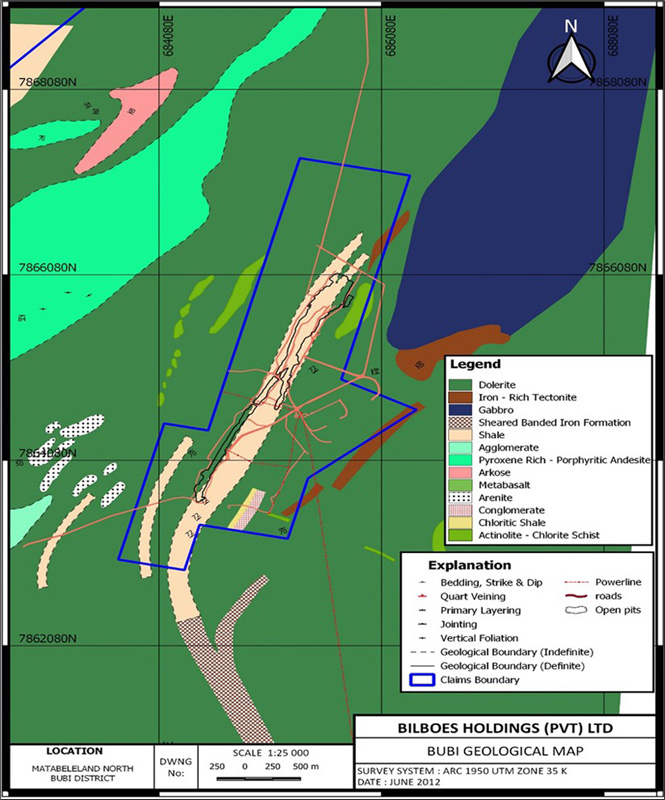
Figure 7‑1: Map of the Surface Geology at Bubi
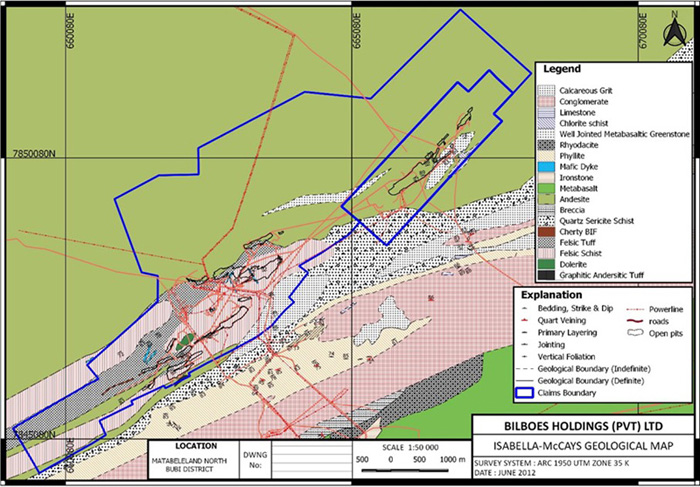
Figure 7‑2: Map of the Surface Geology at Isabella McCays
|
7.2 |
Trenching |
Trenching was conducted across all deposits as part of exploration work for the purposes of defining near surface geology and mineralization envelopes within the oxide horizons. The trenches were sampled generally on a 1 m to 2 m interval and analysed by the bottle roll method (excluded fire assay of the residual tails). These assays were used to help in the projection of oxide ore envelopes and excluded from any Mineral Resource estimation. Channel sampling was also done in all accessible sections of the pits during 2017, which also assisted in the projection of mineralized envelopes in the oxide and transition ore horizons, but the assays were also not used for Mineral Resource estimation.
|
7.3 |
Ground Geophysical Surveying |
Ground Magnetics and Induced Polarization Geophysical surveys were conducted at the Isabella North deposit by PV as part of the oxide ore exploration in 1996. The anomalies were followed up with oxide trenching and drilling. The oxide drilling data forms part of the depth interpretation of the Bilboes deposits from oxide through transitional and sulfide horizons. Further geophysical surveys were conducted in the Kerry West claims located west of the Isabella South claims and Kerry North claims, between Isabella North and McCays. Further drilling is outstanding on these targets and these offer potential for oxide and sulfide resources.
|
7.4 |
Prospecting and Sampling |
Early exploration works targeted oxide mineralization and includes soil sampling, trenching, and drilling. Assays from this work were not used in the sulfide Mineral Resource estimate but were used to guide the interpretation of the ore outlines at depth.
|
7.5 |
Drilling |
|
7.5.1 |
Sulfide Exploration |
Drilling of the sulfides to provide data for the Mineral Resource estimate was completed in three phases:
|
● |
Phase 1: Anglo American Corporation between 1994 and 1999, |
|
● |
Phase 2: Bilboes between 2011 and 2013, |
|
● |
Phase 3: Bilboes between December 2017 and November 2018. |
Phase 1: Anglo explored the sulfide potential beneath the oxides between 1994 and 1999. The results of widely spaced core drilling of the sulfides were used by Anglo American to estimate a non-compliant Mineral Resource for this mineralization and delineated 4.7 Mt at a grade of 3.49 g/t and containing 533,000 oz of gold over a 3,400 m strike to a vertical depth of 120 m from 17,650 m of core drilling.
Phase 2: Between 2011 and 2012, Bilboes completed further exploration on the sulfides with 16,230 m from 69 core holes and 14,021 m from 101 Reverse Circulation (RC) holes in 2013 and extended the strike to 7,000 m and achieved a vertical depth of 160 m for the mineralization.
Phase 3: An additional 34,987 m of drilling, split as 17,015 m from 129 core holes and 17,972 m from 178 RC holes was completed between December 2017 and November 2018. This was largely an infill drilling programme for a Mineral Resource upgrade across all deposits at Isabella, McCays and Bubi and achieved a vertical depth of 200 m. The total project drilling conducted over the three phases is 93,400 m of core and RC holes with an additional 2,500 m of core drilled for geotechnical work for the PFS.
Sulfide mineralization underlies all the oxide deposits at variable depths from 15 mbs to 50 mbs. Two exploration campaigns account for historical exploration of sulfide gold deposits at Bilboes. Both exploration campaigns were headed by PV. The first drilling campaign occurred in 1994/5. During this campaign 24 drill holes were completed. In the second drilling campaign which took place in 1997/9, 99 drill holes were completed. A total of 123 holes totaling 17,650 m (12,650 m core and 5,000 m percussion) were drilled at Isabella, McCays and Bubi covering a strike of 3,440 m.
Drill holes depths varied between 70 m and 350 m for the core holes, with the holes being collared through percussion drilling to a depth of 50 m. The percussion holes were largely used to estimate the oxide Mineral Resource and to define the oxide / sulfide interface. Only core drill holes were included in the sulfide databases. The drill line spacing varied between 25 m and 100 m with 25 m between holes along these lines.
The initial holes drilled by PV before 1995 targeted the Calcite (5), Castile (9) and McCays (10) deposits. The majority of these were drilled at 45° inclinations and from hanging wall positions of the mineralized zone. A few exceptions resulted from unavailability of a suitable collar position due to the open pits. Sampling was limited to the visually recognizable alteration zones resulting in approximately 30% of the total hole length being sampled.
At the Diana pit (Isabella Mine), 14 holes were drilled, two spaced at 10 m and two at 50 m with the rest spaced at approximately 25 m intervals. One hole was drilled on each line; all from the hanging wall with one from the footwall. The mineralized intersections occurred at 45 m to 95 m with one intersection at 125 m (DE15-530S). The footwall of the mineralization intersected was at 169 m to 182 m.
At Maria pit (Isabella) all six holes (1998-9) were drilled from the hanging wall with five holes spaced at 25 m and the rest at 50 m. The average intersection depths occurred at 45 m from surface and geological envelopes were modelled down to 100 m from surface. Two parallel, mineralized zones steeply dip at 70° to SE and the hanging wall ore body stretches along the entire length of the pit, but the footwall zone is restricted to the eastern end of the strike.
A total of 15 holes were drilled along the Calcite strike from the footwall and two from the hanging wall at 50 m to 120 m line spacing. The deepest intersection occurred at 130 m from surface and the intersection depths ranged from 50 m to 120 m. The eastern end of the strike remains open.
The Castile drilling intersected two mineralized zones that were modelled to 110 m from surface, but the mineralization remains open on all sides. Two holes intersected a significant parallel mineralization (6.68 g/t over 10.59 m and 4.90 g/t over 9 m) in the footwall of the two main zones. Both holes ended in mineralization and require further investigation in future. These holes have not been investigated in the 2017/8 drilling campaign because they lie outside of the proposed open pit.
The 25 holes at Bubi covered a strike of 900 m on lines 25 m apart except for two holes which were spaced at 50 m and 100 m. All the holes (but one) were drilled from the hanging wall in the same SE direction inclined at 45°. Three distinct, parallel zones were identified but these were discontinuous along strike and the mineralization remained open ended towards the southern strike of 1,500 m. The oxide cap is at 15 m to 30 m from surface and only 10 m in the southern strike. Drilled intercepts start at 20 m to 80 m and the deepest occurs at 130 m. The geological models were done to a vertical depth of 170 m from surface.
At McCays 23 holes were drilled in the pit and two mineralized zones were defined along strike but broken up mid-way. Drill spacing was at 50 m to 100 m with a few lines having two holes each. All holes were drilled from the hanging wall but at varying inclinations from 45° to 60°. The geological models were created to 160 m vertical depth with average intersections occurring at 75 m. Two of the holes at McCays had deep (but low grade) intersections that do not form part of the established pattern of mineralization.
A summary of the drilling completed is presented as Table 7‑1 with the drill hole distribution being presented in Figure 7‑3.
Table 7‑1: History of Sulfide Project Core Drilling 1994 - 1999 (From Ngilazi & Martin, 2017)
|
Mine |
Deposit |
Pit |
No. of Holes |
Total Strike (m) |
Drilled Length (m) |
Depth Achieved (m) |
|
|
Isabella North |
Diana |
14 |
315 |
2,200 |
150 |
| Isabella |
Calcite |
17 |
575 |
2,600 |
150 |
|
|
Isabella South |
Castile |
37 |
450 |
5,100 |
100 |
|
|
Maria |
7 |
200 |
550 |
70 |
||
|
McCays |
McCays |
Central / Eastern |
23 |
1,000 |
4,000 |
100 |
|
Bubi |
Bubi |
North |
25 |
900 |
3,200 |
120 |
|
Total |
123 |
3,440 |
17,650 |
|||
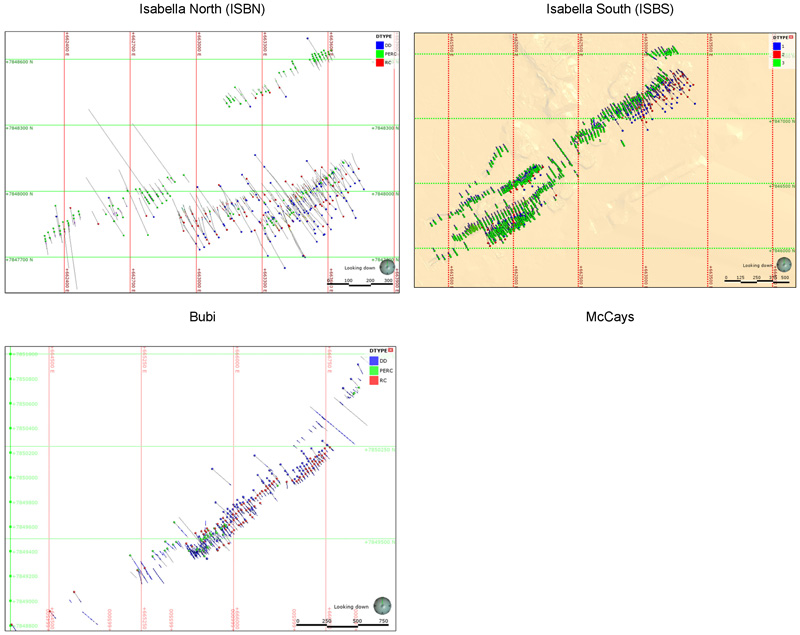
green = Percussion drilling
blue = Diamond Drilling
red = Reverse Circulation drilling
Figure 7‑3: Plans Showing the Drilling for the Various Areas
|
7.5.2 |
Logging and Sampling Procedure |
There are no written accounts of the historic sampling procedures, but Mr. Chimedza, who has been employed by Bilboes since 1996, was closely involved with the exploration of the sulfide deposits. He confirms that the sampling of the core followed Anglo American Corporation standard procedures. This was considered to have been sufficiently accurate for the purpose of reporting of Inferred Mineral Resource estimates contained in the 2009 Mineral Resource declaration.
The geological logging included descriptions of lithologies, structures, alteration, and visible sulfide mineralization. The information was entered into core logging sheets and mineralized zones were identified. All geological boundaries were defined with reference to the drill length. On completion of assaying, the gold results for each sample were recorded on the log sheets for easy reference. Core recoveries were recorded, and any depth discrepancies were checked and corrected. Geotechnical logging, including the RQD index and fracture spacing, was also undertaken.
Bilboes has hardcopy and digital datasets of all information except for the geotechnical logs for which only hard copies are available.
Core was fitted together, and a longitudinal line drawn to guide splitting. Within the mineralized zones sample intervals were marked between 0.5 m and 1.0 m, taking cognizance of geological and structural boundaries, and sampling was continued at 1 m intervals to 5 m on either side of the mineralization.
All the visually recognizable mineralized portions of the drill holes were cut, half core sampled, and assayed with well over 10,000 samples being assayed for gold.
|
7.6 |
Hydrology and Hydrological Drilling |
The project site falls within the Bembezi river sub-catchment which drains north towards the Zambezi River. The Gwayi catchment largely comprises the Northern Matabeleland area of hydrological zone A.
Daily and monthly rainfall were obtained from the Nkayi station from the Meteorological Services Department of Zimbabwe (MSD-Z) for 38 hydrological years (from 1980 to June 2018) and were analysed to determine the long-term monthly averages, minimum and maximum monthly rainfall. The Mean Annual Precipitation (MAP) is 657.0 mm, the wettest hydrological year saw 53% more rainfall than the MAP and the driest hydrological year saw only 60% of the MAP. The driest period was associated with the drought experienced in the 1990s.
Data from the Nkayi station was adopted as the design data owing to the weather station having an acceptable length of record of monthly rainfall data and being located closest to the site and at a similar altitude.
Ten years of monthly pan evaporation measurements for Bulawayo Goertz were provided by the MSD-Z. A pan coefficient of 0.75 was adopted for the conversion of Epan measurements to a reference evapotranspiration.
The annual maximum rainfall analysis for various duration storm events (from 24 hours up to 7 days) was undertaken on the 38 years of daily rainfall records supplied by the MSD-Z. The Generalized Extreme Value (GEV) distribution was then fitted to the annual maximum series to estimate storm depths for events with an annual probability of occurrence of up to 1:10,000 (0.01%).
No hydrological drilling has been undertaken. For pits that contained water ingress, a bathymetric survey was done to determine pit bottom.
|
7.7 |
Geotechnical Drilling |
A total of 18 geotechnical drill holes: ten at the Isabella McCays and five at Bubi, varying in depth from a minimum of 120 m to a maximum of 260 m were logged. The cumulative length of the drill holes at Isabella McCays Isabella McCays was about 1.67 km; and those at the Bubi was about 0.88 km.
SLR Consulting (Africa) (Pvt) Ltd, from South Africa was contracted by DRA to conduct a detailed geotechnical study across all the sulfide deposits. SLR Rock Engineers visited site at various stages of the geological drilling campaign during 2018 with the following tasks being conducted; review of geological and geotechnical data; geotechnical logging of core and the collection of intact rock samples for testing. Structural data was collected by both the Acoustic and Optical Televiewer from the geotechnical boreholes. Packer testing was also conducted in each borehole to determine the hydrogeological parameters of the rock mass, for groundwater modelling. Based on the analysis of the geological aspects of the deposits which included rock mass characterization, hydrogeology, and structural geology, a geotechnical model was developed for pit design parameters. Using these design parameters, kinematic, empirical and limit equilibrium analysis was conducted to determine the optimal slope configuration for the various deposits.
|
8 |
SAMPLE PREPARATION, ANALYSES AND SECURITY |
|
8.1 |
Sampling |
The recovery of samples from the RC and core drill rigs was done in accordance with laid down procedures adequate for the purposes of reporting of Mineral Resources. Once field measurements, markings and numbering and recording of critical information were completed, the core samples were transported daily from the drill site to the core yard and RC samples to secure metal containers to ensure security and avoid tampering, damage, loss, or contamination. The core was adequately secured to prevent damage, loss, or mix-up during transportation. Wet RC samples were collected in calico bags to allow water to drain out and minimize sample loss prior to sun drying in metal trays in a securely fenced section of the core shed which was free from dust ingress and other forms of contamination. Core samples were half split using a core saw and the samples averaged 2 - 3 kg. The core sizes were largely NQ with a few HQ cores being encountered at the start of drill holes. RC samples were collected by way of a Jones riffle splitter and the aliquots also averaged 2 - 3 kg. After sampling, excess cores and RC samples have been stored at the mine in secure sample containers and the core shed and have been retained for future use. All samples were labelled appropriately prior to dispatch. No further sample preparation was done at site and the half cores and riffle split RC samples were transported to the external accredited Laboratory. Transportation of samples to the Assay Laboratories was done utilizing Bilboes vehicles accompanied by a senior member of the technical team followed the laid down chain of custody procedure between the company and the Lab to ensure sample security in transit and proper handover-takeover. Transportation of samples to the Lab was done on the same day within working hours with no unnecessary stopovers along the way to reduce risk of loss, contamination, or damage.
DRA reviewed the procedures for sampling, sample preparation protocol, sample handling and storage and are of the view that these are adequate for the purposes of reporting of Mineral Resources contained herein. Bilboes and an Independent SRK Consultant also visited and inspected the laboratories used in the analyses and can confirm that these also followed the correct procedures for sample preparation.
|
8.2 |
Analysis |
Independent SANAS accredited laboratories were used in the analyses of samples. Samples were analysed for gold by Fire Assay on 50 g pulp aliquots and completed by Atomic Adsorption spectrophotometry method. Samples with grades at 3 g/t and above were repeated by the gravimetric finish.
Performance Laboratory (PLZ) in Harare, was selected as the primary laboratory (accreditation number T0533) ZIMLABS Laboratory located in Harare (accreditation number T0339), and Antech Laboratories (Antech) located in Kwekwe (accreditation number T0411) were used for check analyses. All Laboratories are in Zimbabwe and have all since migrated to the Southern African Development Community Accreditation Service “SADCAS” which accreditation is in accordance with ISO/IEC 17025 system. Current accreditation are:-
|
● |
Performance Laboratory - TEST-500070 issued on 3 June 2022, |
|
● |
ZIMLABS - TEST-50010 issued on 20 February 2015, |
|
● |
Antech - TEST-50030 issued on 1 June 2023. |
|
8.3 |
Sample Security |
At all times during sample collection, storage, and shipment to the laboratory facilities, the samples were in the control of Bilboes. The samples were then trucked to Performance Laboratories in Harare for geochemical analysis.
During the 2018 drilling and sampling campaign, all analytical results were emailed by Performance Laboratories to Bilboes. Comparisons were done between the drilling database received from Bilboes and the assay results received from Performance Laboratories to verify the database.
All the laboratories that conducted the sampling and analytical work were independent of Bilboes. Performance Laboratories in Zimbabwe is an entity of SGS. SGS produces impartial results that are considered suitable for Mineral Resource estimation.
|
8.4 |
Quality Control |
As part of their QA/QC protocols to test for the precision of the analytical process, Bilboes inserted CRMs, blanks into their sampling stream, and created duplicates for re-analysis. During the 2017 Mineral Resource review of the Bilboes properties, DRA did a thorough review of the QA/QC protocols. The findings of that review concluded were that the protocols employed at Bilboes were adequate and the database was deemed fit for the purposes of geological modelling and Mineral Resource estimations. The review was in respect of all protocols from commencement of drilling campaigns by Bilboes in 2011 till completion in 2018.
CRMs were sourced from AMIS in South Africa, Geostats in Australia, and Rocklabs in New Zealand. Silica powder from AMIS and local dolerite were used as blanks. Bilboes utilized two types of duplicate materials: a Pulp Duplicate (LPR) and a Coarse Duplicate (LCR). In a batch of twenty samples, at least four out of the twenty samples were control samples. This represents an insertion ratio of at least 20%. If more than 20% of CRM results in a batch returned results that fell outside the allowable deviation of the recommended value; all results from that batch were failed and re-analysed.
|
8.4.1 |
Blanks |
For the 2018 sampling campaign, Silica powder and local dolerite were used as blank material. AMIS0415, AMIS0439, and AMIS0484 were used as silica blanks. During the 2017 review by DRA, 272 blanks were present in the database. An additional 859 blanks were added to the database for the 2018 campaign, taking the total number of blanks to 1,131.
A detection limit of 0.02 g/t was set for the exercise while the upper acceptable limit was set at 0.1 g/t for the silica blanks and 0.15 g/t for the field blank. All samples for AMIS0415 and AMIS0439 plotted within the allowable upper limit of 0.1 g/t. Only one sample returned a gold value more than the 0.1 g/t allowable upper limit for AMIS0484. Similarly, with the field blank, only one sample returned a gold value more than the allowable 0.15 g/t upper limit.
|
8.4.2 |
Standards |
CRMs were sourced from African Mineral Standards (AMIS) in South Africa and Geostats Pty Ltd in Australia for the previous drilling campaign. For the 2018 drilling campaign, CRMs were sourced from AMIS - AMIS0440, AMIS0441, AMIS0473, AMIS0525, and AMIS0526. These represent the grade distribution observed at Bilboes. AMIS0473 has a recommended grade of 0.41 g/t, for AMIS0526 the recommended grade is 1.03 g/t, 1.74 g/t for AMIS0440, 2.44 g/t for AMIS0441, and 8.04 g/t for AMIS0525.
Most of the control samples of AMIS0440 plot within three standard deviations of the recommended mean value of 1.74 g/t. some seventeen samples plot outside the allowable three standard deviations limit. This is to be expected of a low/middle grade CRM.
All the control samples representing CRM AMIS0441 plot within three standard deviations of the recommended mean value of 2.44 g/t with most samples lying within two standard deviations.
For AMIS0473 all the control samples lie within one standard deviation of the mean of 0.41 g/t. For AMIS0525 all the control samples, bar one, plot within two standard deviations of the mean value of 8.04 g/t. However, a slight positive bias is observed for AMIS0525 with a majority of the samples lying above the recommended mean value. Five samples lie outside three standard deviations of the recommended mean value of 103 g/t for CRM AMIS0526
|
8.4.3 |
Duplicates |
Two types of duplicates were employed in the 2011 to 2018 drilling and sampling campaigns i.e., Lab repeats and field duplicates. The former is made up of LPR and LCR. There were 721 LPRs and 875 LCRs in the database for the 2018 campaign. The majority of samples were within a 15% margin. Samples that fell outside of the 15% margin could be attributed to the inherent nugget effect of the deposit.
|
8.4.4 |
Umpire Labs |
Performance Laboratories was used as the primary laboratory for analysis in the recent drilling campaigns from 2011 to 2018. To check the reliability of the results obtained from Performance Laboratories, ZIMLABS and Antech Lab were used as umpire laboratories. The results show the acceptable correlation between the primary laboratory and the umpire laboratories.
|
8.5 |
QP Commentary |
The QP is of the opinion that sample preparation, security and analytical procedures were adequate.
|
9 |
DATA VERIFICATION |
|
9.1 |
Historical Data |
DRA’ engagement with Bilboes began with a review of the previous Mineral Resource estimate. During the review process, rigorous tests were conducted to verify the integrity of the Bilboes database. A recommendation from the review process by DRA was to implement a commercial data management software, to which Bilboes complied by acquiring Datamine™ Fusion database software for the capture, storage, and management of drill hole information. This Fusion database was implemented prior to the start of the 2018 drilling campaign.
|
9.2 |
2017/2018 Drilling Campaign |
Before commencement of the 2017/2018 drilling campaign in addition to the Datamine™ software already in place Bilboes utilized Fusion database software for the capture: storage and management of drill hole information.
The 2018 drilling programme contained 41 RC and 55 DD holes for ISBN, 27 RC and 20 DD holes for ISBS, 76 RC and 55 DD holes for McCays, and 40 RC and 13 DD holes for Bubi. With regards to the 2018 data, DRA visited the site during drilling and performed various checks to verify the integrity of the collar co-ordinates, logging and sampling procedures, and assay results. Collar locations in the field were clearly marked. The mineralisation zones were observed in the cores as well as from outcrops in the surface mining pits.
The core logging and sampling processes at the core storage facility were observed to be consistent with industry standards. Each hardcopy log is audited and signed-off by a senior geologist prior to being used in modelling and estimation.
|
9.3 |
QP Commentary |
The data collected during the exploration, drilling and sampling programmes, including surveying, drill hole logging, sampling, geochemical analysis, and data quality assurance, was collected in a professional manner and in accordance with appropriate industry standards by suitably qualified and experienced personnel.
The data was reviewed and validated by the QP who concluded that the data is suitable for the construction of the geological model and for the purposes used in this TRS.
|
10 |
MINERAL PROCESSING AND METALLURGICAL TESTING |
|
10.1 |
Test Work Programme Overview |
The metallurgical test work was concluded in different phases over a period extending from September 2013 to March 2019 and involved various independent laboratories and consultants as outlined in Table 10‑1.
Table 10‑1: Test work Program Outline
|
Phase |
Test work Description |
Done By |
Supervision and Oversight |
Date |
|
1A |
Sample characterization detailing mineralogical and chemical analysis |
Mintek, South Africa |
Bilboes, MMC and MDM Engineering |
September 13 to December 13 |
|
1B |
Comminution test work done on the two composites namely Composite 1 (Bubi ore) and Composite 2 (combination of Diana, Calcite, Castile, Maria and McCays ores) |
Mintek, South Africa |
Bilboes, MMC and MDM Engineering |
January 14 to April 14 |
|
2 |
Selection of a process route covering gravity amenability tests, flotation optimization and treatment of the sulfide flotation concentrates via POX, Bio-Oxidation and Ultra-fine grinding followed by cyanidation |
Mintek and Suntech, South Africa |
Bilboes and MMC |
May 14 to September 14 |
|
3 |
Variability flotation tests and bulk flotation concentrate production for additional BIOX® and gold leach tests |
Suntech and SGS, South Africa |
Bilboes, Minxcon and MMC |
October 15 to August 16 |
|
4A |
Laboratory and Pilot plant test work campaigns on the different ore types to generate additional flotation kinetics and grind data, bulk concentrates for BIOX® pilot plants, flotation design parameters and validate flowsheet |
MMC at the client's project site in Zimbabwe |
Bilboes and DRA |
April 18 to September 18 |
|
4B |
Review, modelling and simulation of laboratory and pilot plant test results |
EMC, South Africa |
Bilboes, MMC and DRA |
October 18 to March 19 |
Phases 1 to 3 constituted preliminary test work and Phase 4 (Pilot plant), supplementary laboratory test work, modelling, and simulation the definitive test work.
|
10.2 |
Discussion of the Results |
|
10.2.1 |
Chemical Analyses |
The mineralogical and chemical analyses of the ores conducted on the individual and composite samples is summarized as follows:
|
● |
Gold content in the samples varied from 1.8 mg/kg to 6.8 mg/kg. |
|
● |
All samples contained high concentrations of Si, Al, Ca, Fe and As. Total sulfur concentrations in the samples varied from 1.2% to 5.3% and significant amounts of it were sulfide species. |
|
● |
The Total carbon in the ores was detected at 1.3% - 5.3% and was mainly present as carbonate. Organic carbon was low for all samples tested, indicating low potential for preg-robbing. Carbon (as carbonate) content was high, especially for Bubi and McCays pits (double amount in comparison to other composite samples). Carbonate concentrations of between 7.4% and 18.4% were detected in the samples. |
|
● |
The Total sulfur content in the samples was found to be mainly in the sulfide form with the lowest content of 0.69% in the McCays ore and the highest content of 2.65% in the Bubi ore. The concentration of elemental sulfur and sulphate was very low. High As content was detected in all samples which highlighted the importance of investigating the As behavior during the processing steps and to consider possible environmental issues in deciding on process route and economics. The As content in the McCays ore was disproportionately higher than the other pits. |
| 10.2.2 |
Mineralogical Characterization |
|
● |
Diagnostic leach results showed that gold recovery via direct cyanidation was low, varying from 25% to 50% and Au locked in sulfides and carbonate minerals varied from 46% to 72%. |
|
● |
Bulk Modal Analysis (BMA) showed that quartz, feldspar, and mica were present in major to intermediate amounts in all the samples, followed by major to minor amounts of carbonates. Sulfide minerals, pyrite and arsenopyrite, were present in minor to trace amounts throughout all samples. All other mineral phases are present in trace amounts in all samples. |
|
● |
The Au bearing minerals identified in this study were electrum (AuAg) and native gold (Au). Native gold and electrum are variably distributed throughout all samples. |
|
● |
Most Au-bearing grains reported to the 0 μm -10 μm size class fraction and a smaller quantity in the 10 μm -15 μm size class fraction. |
|
● |
Pyrite was the dominant BMS mineral present as majority of the samples followed by arsenopyrite (from 5 to 58%) and trace amounts of other sulfides (sphalerite, pentlandite, chalcopyrite, chalcostibnite, ullmannite, gersdorfiite and galena) |
|
● |
The majority of all BMS mineral grains (>50 mass%) in all samples reported to the finer, 0 μm -21 μm size classes, with lesser amounts reporting to the coarser size classes. |
|
● |
The majority (>80 mass%) of pyrite, arsenopyrite and other sulfides had free surface with lesser amounts being associated with other mineral phases in all the samples examined. |
|
10.2.3 |
Comminution |
Comminution test work showed that Isabella and McCays samples with Bond Ball Work Index (BBWi) values ranging from 15.70 kWh/t to 17.81 kWh/t and A*b values ranging 27.50 to 32.80 could be classified as being hard, while Bubi ore with a BBWi value of 21.45 kWh/t and A*b value of 19.0 was very hard. All samples were characterized as being moderately abrasive with Ai indices ranging from 0.22 to 0.42.
|
10.3 |
Process Route Identification |
|
10.3.1 |
Gravity Tests |
Gravity amenability tests indicated poor gold recoveries and varied from 14% to 22% at 0.5% mass pull. Gravity separation at higher mass pull provided higher gold recovery but still was not a feasible option.
|
10.3.2 |
Preliminary Flotation |
Initial milling and flotation results indicated high gold recoveries of 89% - 97% with high mass pulls ranging from 10%- 15%, low concentrate grades of 12 g/t - 20 g/t Au and unacceptable high levels of carbonates in the range of 7% - 13% which were bound to negatively affect the down-stream gold recovery process. The test work established that the ores can be easily floated with good recoveries at grinds ranging from 80% of 106 µm - 75 µm and that flotation optimization with respect to mass pulls, concentrate grade and other concentrate quality metrics was required.
|
10.3.3 |
Flotation Optimization |
Subsequent flotation optimization tests involving the addition of depressant and 1 and 2 cleaning stages improved the overall flotation performance with recoveries ranging from 88% to 94%, with mass pulls ranging from 4% - 12%, concentrate grades of 50 g/t – 120 g/t Au and acceptable carbonates levels in the range of 4% - 10%.
The optimum flotation conditions determined are presented in Table 10‑2.
Table 10‑2: Optimum Flotation Conditions
|
Description |
Value |
|
Grind |
80% - 75 µm |
|
Reagents Dosages – g/t |
- |
|
Copper Sulphate |
80 g/t |
|
Sodium Ethyl Xanthate |
100 g/t |
|
Sodium Carbonate |
200 – 350 g/t |
|
Starch |
70 – 125 g/t |
|
XP200 Frother |
35 – 60 g/t |
|
10.3.4 |
Gold Dissolution from Flotation Concentrates |
|
● |
Direct cyanidation of the flotation concentrate resulted in a 27% gold dissolution, |
|
● |
Ultra-fine grinding (80% -20 µm) followed by cyanidation and oxygenation resulted in a marginal improvement in gold dissolution from 27% to 30%, |
|
● |
A single Pressure Oxidation (POX) test was done on concentrate with the main objective to oxidize 100% of the sulfide which then resulted in a further 98% gold dissolution by cyanidation of the POX leach residue. Formation of Basic Ferric Sulphate (BFS) resulting in high lime and cyanide consumption in the downstream processing (cyanidation) was observed. A significant amount of arsenic was also detected in the POX filtrate. |
|
● |
BIOX® of the concentrate provided 99% sulfide decomposition with 97% gold dissolution by cyanidation of the bio-residue. Formation of iron and cyanide complexes was observed. The solid residue after cyanidation was of the bioleach product was stable with respect to arsenic. |
Based on the above results, historical test work and consideration of environmental impacts and risk minimization by adopting commercially established and proven processes, the process route identified for additional evaluation was flotation, pre-treatment of the concentrate by Bio-oxidation followed by cyanidation.
|
10.4 |
Variability Testing |
Variability flotation test work on the ores indicated an average recovery of 89.2%, a recovery range of 83.4% - 95.9% and recovery standard deviation of 3.4% for Isabella McCays ore and average recovery of 86.6%, a recovery range of 80.5% - 94.2% and recovery standard deviation of 4.4% for Bubi ore.
|
10.5 |
Pilot Plant Test Work |
The pilot plant test work was conducted over a period of three months from July 2018 to September 2018, with the follow up laboratory test work being conducted between September 2018 and January 2019.The pilot plant utilized a total of 20 t of the Isabella McCays ore and 15 t of Bubi ore.
|
10.5.1 |
Pilot Plant Operation and Flowsheets |
The flowsheets evaluated during the pilot plant campaigns are shown Figure 10‑1.
Flowsheet 2 was ultimately adopted as the preferred flowsheet based on better recoveries and concentrate grades.
Reagent addition was as per optimum flotation conditions outlined above.
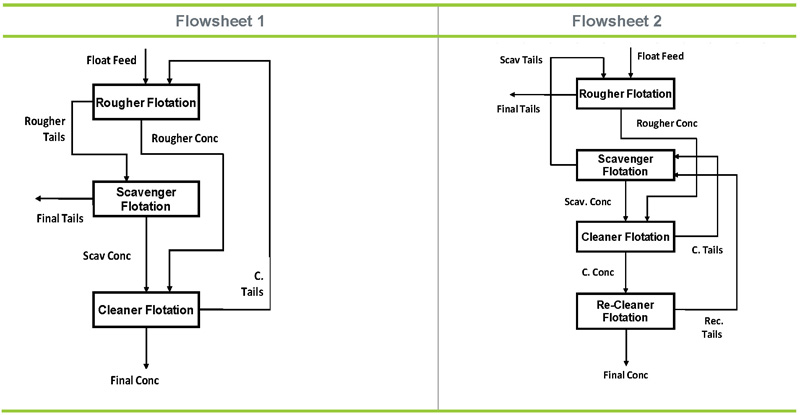
Figure 10‑1: Pilot Plant Campaign Flowsheets
|
10.6 |
Pilot Plant Results |
|
10.6.1 |
Recoveries and Mass Pulls |
The Isabella McCays ores gold recoveries ranged from 85.9% to 91.0% and the mass pulls ranged from 3.8% to 6.0% with a weighted average of 88.4% recovery and 5.0% mass pull. The Bubi ore recoveries ranged from 85.9% to 88.8% and mass pulls ranged from 7.8% to 15.2% with averages of 87.5% recovery and 10.0% mass pull.
|
10.6.2 |
Chemical Analyses of Bulk Concentrates |
The analyses of the individual and blended concentrates produced from the pilot plant operation for the BIOX® process piloting was within the limits of the BIOX® process requirements.
|
10.6.3 |
Additional Laboratory Test Work and Simulation |
Due to constraints on the classification circuit, the grind on the flotation feed ranged from 63% to 68% - 75 µm against a targeted grind of 80% - 75 µm. This outcome was addressed by conducting additional comparative laboratory flotation tests at these grinds to validate the effect of grind with modelling and simulation applied to the actual pilot plant recoveries to derive expected recoveries at the target grind as explained in the latter section.
|
10.6.4 |
Flotation Rate and Comparative Grind Tests |
To determine the expected pilot plant recoveries at the target grind of 80% - 75 µm, comparative flotation rate tests were conducted on the individual ores at the pilot plant grind of 65% - 75 µm and the target grind. The results showed that the target finer grind of 80% - 75 µm consistently resulted in higher recoveries in comparison to the pilot plant grind of 65% - 75 µm with recovery increments ranging from 0.2% - 4.7% on all ore types.
|
10.6.5 |
Modelling and Simulation |
|
10.6.5.1 |
Grind and Recoveries |
Eurus Mineral Consultants (EMC) were engaged to review and conduct modelling and simulation on the laboratory and pilot plant test work results.
The comparative results of the simulated pilot plant recoveries at 80% - 75 µm and the actual recoveries at 65% - 75 µm are presented in Table 10‑3. The results indicate an expected recovery improvement of 3.1% and 4.2% on the Isabella McCays and Bubi ores with grind improvement from 65% - 75 µm to 80% - 75 µm respectively.
Table 10‑3: Comparative Pilot Plant Simulated Recoveries
|
Ore Source |
Head g/t |
65% - 75 µm (Pilot Plant) |
80% - 75 µm (Simulation) |
Var:(80% - 75 µm) -(65% - 75 µm) |
||||||
|
|
|
% Mass Pull |
Conc g/t |
% Rec |
% Mass Pull |
Conc g/t |
% Rec |
% Mass Pull |
Conc g/t | % Rec |
|
Isabella North |
2.00 |
4.2 |
41.3 |
86.1 |
4.4 |
40.5 |
89.2 |
0.2 |
-0.8 |
3.1 |
|
Isabella South |
2.54 |
5.1 |
45.4 |
90.3 |
5.2 |
44.6 |
92.0 |
0.2 |
-0.8 |
1.7 |
|
McCays |
2.20 |
5.5 |
33.7 |
83.7 |
5.9 |
33.3 |
88.8 |
0.4 |
-0.4 |
5.1 |
|
Isabella McCays Total* |
2.20 |
4.7 |
41.0 |
86.9 |
4.9 |
40.3 |
90.0 |
0.3 |
-0.7 |
3.1 |
|
Bubi |
2.59 |
8.7 |
26.0 |
86.9 |
9.2 |
25.6 |
91.1 |
0.6 |
-0.4 |
4.2 |
|
*Based on ISBN-50%, ISBS-30%, McCays-20% |
||||||||||
|
10.6.5.2 |
Flotation Residence Times |
The modelling and simulation were also applied to derive requisite flotation residence times for the proposed Flowsheet 2 (Table 10‑4).
Table 10‑4: Flotation Residence Times
|
Flotation Stage |
Residence Time-Mins |
|
Rougher |
84 |
|
Cleaner |
68 |
|
Re-Cleaner |
46 |
|
Cleaner and Re-Cleaner Scavenger |
55 |
|
10.6.6 |
Projected Operational Gold Recovery |
The following observations from the test work programme results provide evidence of expected higher operational recoveries than the average expected 90.0% and 91.1% derived for the Isabella McCays and Bubi ores, respectively.
|
● |
Both Isabella McCays and Bubi ores indicated a positive correlation of head grade and recoveries. With pilot plant head grades being slightly lower than the planned LoM grades, actual plant recoveries can be expected to be better than pilot and simulated recoveries at the same grind. |
|
● |
Laboratory test work and plant simulation results showed marginal improvement in recoveries ranging from 0.3% to 0.9% with finer grinding from 80% - 75 µm to 90% - 75 µm. Although marginal and subject to further validation and analysis of economic benefits, the trend provides a basis for additional optimization prior to implementation or continuous improvement during the operational phase. |
|
● |
Comparative simulation of the proposed flotation circuit comprised of a Rougher, Cleaner Scavenger and a common 2-stage cleaning and a flowsheet comprising a Rougher, Cleaner Scavenger and separate 2 -stage showed marginal recovery improvement of 0.5% to 0.8% with the latter indicating potential to improve recoveries with flowsheet reconfiguration subject to validation and analysis of economic benefits. |
|
● |
Statistical analysis of results from all laboratory and pilot plant test work results showed expected recoveries of 90.2% and 92.1% and recovery ranges of 85.4% - 95.1% and 89.2% - 95.0% at one standard deviation for the Isabella McCays and Bubi ores, respectively. |
|
10.6.7 |
Improvements in Flotation Gold Recovery |
It is anticipated that with better knowledge of the recovery relationships, optimal milling and flotation design, steady state operation, higher head grades with continuous improvement and the benefits of the economies of operating experience, the downside recoveries can be avoided and that the operational recoveries ranging from a minimum of the expected values of 90.0% and 91.1% for Isabella McCays and Bubi respectively to a maximum of 95.0% for both ores may be realized.
|
10.7 |
BIOX® |
|
10.7.1 |
Test work |
The test work was conducted on ore samples from Isabella McCays and Bubi deposits to develop test work data to design a gold processing plant. Test Work Results
Summary of the test work results is presented in Table 10‑5.
Table 10‑5: Summary of the Test Work Pre-Feasibility Results
|
BIOX® Test work on Sulfide Concentrate |
|||
|
Isabella McCays |
Bubi |
||
|
Sulfide oxidation |
% |
89.6 |
90.0 |
|
Gold recovery |
% |
88.8 |
95.7 |
|
NaCN consumption |
kg/tconc |
16 - 18 |
18 - 20 |
|
Lime consumption |
kg/tconc |
5 - 15 |
5 - 15 |
BIOX® pilot plant test work programs were completed on composite Isabella McCays and Bubi concentrates produced during the on-site flotation test work programs. The pilot plant programs have provided details of sulfide oxidation performance under various operating conditions for each concentrate, as well as the relationship between gold dissolution and sulfide oxidation. This data has been used to specify certain design criteria for a full-scale BIOX® plant treating both concentrates. Associated metallurgical test work programs focusing on unit processes such as liquid – solids separation, neutralization and BIOX® product CIL were also completed on slurries generated during each pilot plant campaign.
|
10.7.1.1 |
Isabella McCays |
The Isabella McCays bulk concentrate sample had a gold grade of 49.9 g/t and a sulfide sulfur grade of 18%. The mineralogical assemblage comprised of 28.5% pyrite, 22.2% arsenopyrite and 0.02% stibnite. The continuous BIOX® pilot plant operated on this sample for a period of 103 days and the run included detailed sampling phases at 6.5 and 6-day retention times.
The BIOX® test work indicated the following:
|
● |
An average BIOX® sulfide oxidation of 89.6% was achieved at a 6-day retention time and a feed slurry solids concentration of 20%, |
|
● |
This resulted in an average CIL gold dissolution of 88.8% on the BIOX® product solids, |
|
● |
The lower-than-expected sulfide sulfur oxidation levels in the pilot plant overflow product slurry are believed to be due to short-circuiting of unoxidized/partially oxidized solids between the reactors, |
|
● |
The BAT BIOX® tests completed on the various Isabella McCays concentrate samples achieved sulfide oxidation levels in the range 86.4 to 99.3% and yielded gold dissolutions in the range 92.3 to 97.9%. |
The continuous neutralization pilot run conducted on an Isabella McCays BIOX® liquor sample produced a suitable effluent since the As(T) concentration in the neutralized solution was at 0.5 ppm and the TCLP testing of the residue showed a final As(T) leachate of <3 ppm, below the stipulated 5 ppm requirement. Continuous neutralization tests are recommended to optimize the use of the Isabella McCays float tails for Stage 1 pH control with respect to high Fe concentration in TCLP extract for the batch neutralization tests.
The settling behaviour and flocculent requirement for the various Isabella McCays process slurries were found to be comparable to projects with a similar concentrate mineralogy previously evaluation during BIOX® test work programs.
|
10.7.1.2 |
Bubi |
The Bubi bulk concentrate sample had a gold grade of 28 g/t and a sulfide sulfur grade of 27.1%. The mineralogical assemblage comprised of 57.2% pyrite and 9.00% arsenopyrite. The continuous BIOX® pilot plant operated on this sample for a period of 235 days and the run included detailed sampling phases at 6.5 and 6-day retention times.
The BIOX® test work indicated the following:
|
● |
An average BIOX® sulfide oxidation of 90% was achieved at a 6.5-day retention time and a feed slurry solids concentration of 20%, |
|
● |
This resulted in an average Carbon in Leach (CIL) gold dissolution of 95.7% on the BIOX® product solids, |
|
● |
The BAT tests completed on the Bubi concentrate sample achieved sulfide oxidation levels in the range 97 – 98% and yielded gold dissolutions in the range 92.3 to 96.8%. |
The continuous neutralization pilot run conducted on a Bubi McCays BIOX® liquor sample produced a suitable effluent since the As(T) concentration in the neutralized solution was at 0.5 ppm and the TCLP testing of the residue showed a final As(T) leachate of < 0.4 ppm, below the stipulated 5 ppm requirement. Continuous neutralization tests are recommended to optimize the use of Bubi / Isabella McCays float tails for Stage 1 pH with respect to high Fe concentration in TCLP extract for the batch neutralization test.
The settling behaviour and flocculent requirement for the for the various Bubi process slurries were found to be comparable to that achieved on the Isabella McCays process slurries. The test work indicated higher settling area requirement of 4,00 m²/t/h for the Bubi BIOX® product compared the 2,90 m²/t/h for the Isabella McCays BIOX® product.
|
10.8 |
QP Commentary |
The QP is of the opinion that the mineral processing and metallurgical testing data is adequate for the purposes used in the TRS.
|
11 |
MINERAL RESOURCE ESTIMATES |
The MRE was prepared by DRA in terms of S-K 1300.
Leapfrog Geo™ software was used to construct volumetric solids for the zones of weathering, structural discontinuities, and mineralization. Three-dimensional (3D) resource modelling, using geostatistical techniques for grade estimation, was done in Datamine Studio RM™. The key assumptions and methodologies used for the mineral resource estimates are outlined below.
|
11.1 |
Topography |
A 3D Digital Elevation Model (DEM) was provided by Bilboes. The points were generated from an airborne photogrammetric survey conducted in 2018 incorporating the existing rock dumps, heap leach pads, and mining pits. For pits that contained water ingress, a bathymetric survey was done to determine pit bottom.
|
11.2 |
Geological Database |
The database comprised of Diamond Drilling (DD), RC and percussion (PERC) holes, summarized in Table 11‑1.
At Isabella South (ISBS), drill holes dip between 40° and 60° towards the NW. At Isabella North (ISBN), drill holes dip between 45° and 60° towards the NW/SE while at McCays, they dip at 60°towards the SE. At Bubi, the majority of drill holes dip at approximately 60° towards the SE.
Table 11‑1: Summary of Drill Holes
|
Property |
DD Holes |
RC Holes |
Perc Holes |
Total |
||||
|
|
No. of Holes |
Meters |
No. of Holes |
Meters |
No. of Holes |
Meters |
No. of Holes |
Total Meters |
|
ISBS |
68 |
10,233.74 |
72 |
9,636 |
957 |
34,312 |
1,097 |
54,181.74 |
|
ISBN |
105 |
19,574.97 |
67 |
9,279 |
765 |
34,325 |
937 |
63,179.01 |
|
BUBI |
68 |
11,500.02 |
90 |
10,376 |
1,663 |
65,532 |
1,821 |
87,408.02 |
|
McCays |
89 |
12,565.49 |
88 |
8,931 |
298 |
20,055 |
475 |
41,551.49 |
|
11.3 |
Bulk Density |
For drilling campaigns prior to 2011, density measurements were taken at irregular intervals. During the 2011 to 2018 drilling campaigns, every metre of core was sampled, and submitted for density measurements. The Archimedes method of density measurement was used. A summary of these measurements per project area are presented in Table 11‑2.
Table 11‑2: Summary of Density Measurement per Resource Area
|
Resource Area |
No of Measurements |
Minimum (g/cm3) |
Maximum (g/cm3) |
Mean (g/cm3) |
|
ISBS |
2,599 |
2.01 |
3.39 |
2.76 |
|
ISBN |
3,604 |
2.00 |
3.94 |
2.78 |
|
McCays |
3,967 |
2.18 |
3.93 |
2.8 |
|
Bubi |
7,152 |
2.25 |
4.65 |
2.83 |
To check the reliability of the density measurements that were done in-house, 36 samples from Bubi, 25 from ISBS, 25 from ISBN and 15 from McCays were submitted to an independent third-party laboratory at the Institute of Mining Research, University of Zimbabwe. The in-house measurements compare well with the check analysis.
|
11.4 |
Geological Model |
Mineralization at Bilboes is classified as Archaean hydrothermal alteration within broad shear zones. Discrete mineralized zones have been observed from the oxide open cast mining. A summary of the mineralized zone is presented in Table 11‑3 and displayed in Figure 11‑1.
Table 11‑3: Summary of the Geological Parameters for the Geological Models
|
Resource Area |
Strike |
Dip (°) |
No of Mineralized zones |
|
ISBS |
NE |
~65° to 75° towards the SE |
16 |
|
ISBN |
NE |
79° to 85° towards the SE |
16 |
|
Bubi |
NE-SW |
SE at approximately 75° |
10 |
|
McCays |
NE-SW. |
73° towards the NW |
16 |
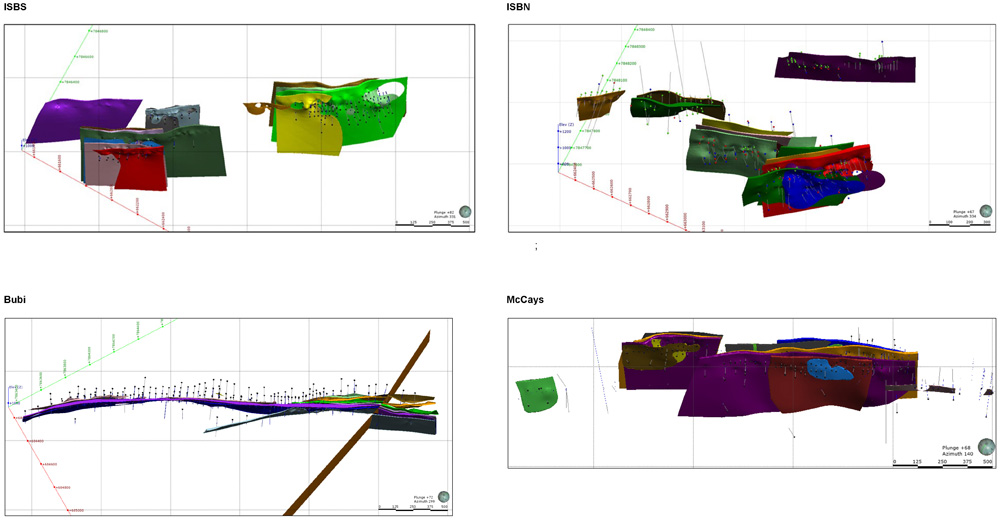
Figure 11‑1: Views of the Mineralization Zones
|
11.5 |
Weathering and Oxidation |
Oxidation profiles are important in determining the different rock mass densities of ‘ore’ and ‘waste’ and the metallurgical processing method, costs, and recoveries important during mine planning. The geological models included a transitional zone, as illustrated in purple in Figure 11‑2.
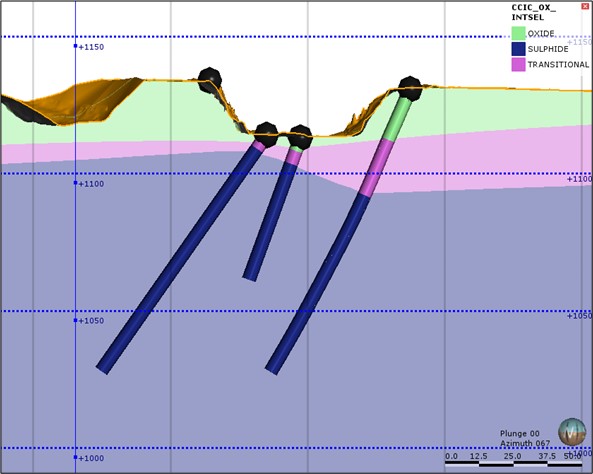
Figure 11‑2: Section View showing Oxidation Profile at ISBS
In areas with limited DD or RC drilling, percussion drilling data was used to inform the mineralized zones during the geological modelling process. Where percussion holes were used for geological modelling, they were also included in the estimation.
Oxidation of the “ore zones” is a result of chemical alteration that postdates mineralization. The moderately weathered part of the Transitional Zone was historically mined as part of Oxide Zone because the two zones were considered economically viable by heap leaching. The weakly weathered material was mined together with the fresh sulfide ore. For these reasons, the moderately weathered Transitional Zone was estimated together with the Oxide Zone. All DD and RC samples that occur within a mineralized zone, irrespective of whether they are located in the Oxide, Transitional, or Sulfide Zone, were used to estimate grade in all three zones. Percussion samples that occur in the Transitional and Oxide parts of the model, were used to estimate grade in the moderately weathered Transitional and Oxide parts of the model.
|
11.6 |
Compositing |
For all four properties, the predominant sampling interval was 0.5 m and 1.0 m; hence a composite length of 1.0 m was used. The statistics for the Au grade before and after compositing were reviewed to ensure that a bias had not been introduced into the database.
|
11.7 |
Variography |
For ISBS, a reliable semi-variogram was obtained for the Castile Main mineralized zone, because this zone contained the most samples. These variogram model parameters were used for all other zones in the Castile area (northern part of the project).
For the southern part of the project (Maria area), samples from these zones were grouped together to increase the number of sample pairs, while paying attention to the across strike direction to ensure that samples from one zone do not form pairs with samples from another zone.
At Bubi, the Main zone produced a reliable semi-variogram. All the other zones used these variogram parameters for estimation.
For McCays, a reliable semi-variogram was obtained for Main-1 and footwall West mineralized zones, which occur in fault block 2 and fault block 3, respectively. The variogram obtained within fault block 2 was applied to all mineralized zones within block 2, similarly the variogram obtained within fault block 3 was used for zones within that block. For the remaining mineralized zones, the variogram for the mineralized zone with a similar orientation was selected.
Diana Main was the zone that produced a robust semi-variogram in ISBN and was used for all other mineralized zones within ISBN. Table 11‑4 contains the normalized variogram parameters used for the estimation.
Table 11‑4: Variogram Parameters used for Grade Estimation
|
Property |
Zone |
Normalized Variogram Parameters |
||||||||
|
|
|
Spherical Range 1 | Spherical Range 2 | |||||||
|
|
Nugget (Co) |
X1 |
Y1 |
Z1 |
C1 |
X2 |
Y2 |
Z2 | C2 | |
|
ISBS |
Castile Main |
0.26 |
4.1 |
4.1 |
4.1 |
0.56 |
42 |
42 |
14.2 |
0.19 |
|
Maria Area |
0.44 |
3.2 |
3.2 |
3.2 |
0.28 |
20.8 |
20.8 |
6.3 |
0.28 |
|
|
ISBN |
Diana Main-1 |
0.31 |
17 |
17 |
4 |
0.32 |
36 |
36 |
7 |
0.38 |
|
Bubi |
Main Zone |
0.32 |
10.6 |
10.6 |
4.1 |
0.41 |
70 |
70 |
12.3 |
0.27 |
|
McCays |
Main-1 |
0.26 |
4 |
4 |
4 |
0.51 |
30 |
30 |
5 |
0.23 |
|
FW West |
0.19 |
8 |
8 |
1 |
0.2 |
30 |
30 |
6 |
0.61 |
|
|
11.8 |
Top Capping |
The top capping strategy considered various criteria to determine the optimum values.
Based on the above criteria, it was determined that Au values should remain uncapped. Top and bottom capping for density values was however necessary.
|
11.9 |
Grade Estimation |
|
11.9.1 |
Krige Neighborhood Analysis |
The aim of Krige Neighborhood Analysis is to determine the optimal theoretical search and estimation parameters during Kriging to achieve an acceptable Kriging Variance and Slope of Regression whilst ensuring that none or a minimal number of samples are assigned negative Kriging Weights.
The search parameters used are presented in Table 11‑5.
|
11.9.2 |
Estimation Method |
The method of estimations for Au was Ordinary Kriging while density was estimated using Inverse Power of Distance with a Power of 2. Estimations were undertaken using the Estimate process in Datamine. The boundaries between the waste / ore were treated as hard boundaries. Parental cell estimation was used.
Dynamic Anisotropy was used to search for samples during estimation to account for the change in dip of the mineralized zones.
Table 11‑5: Summary of Search Parameters
|
Project |
Search Method |
Search Distance Along Axis (M) |
3-1-3 Rotation Around Axis (°) |
Search Volume Factor |
Number of Samples |
||||||||||
|
|
|
|
S vol 1 | S vol 2 | S vol 3 | ||||||||||
|
|
|
X (Strike) | Y (Down-Dip) |
Z (Across Strike) |
Z (3) |
X (1) |
Z (3) |
S |
S |
Min |
Max |
Min |
Max |
Min | Max |
|
ISBS |
Dynamic Anisotropy (Rectangular) |
60 |
40 |
6 |
150 |
62 |
0 |
2 |
50 |
24 |
48 |
12 |
60 |
12 |
72 |
|
ISBN |
Dynamic Anisotropy (Rectangular) |
70 |
50 |
20 |
140 |
80 |
0 |
1.5 |
5 |
24 |
54 |
20 |
60 |
2 |
72 |
|
Bubi |
Dynamic Anisotropy (Rectangular) |
100 |
40 |
20 |
300 |
80 |
0 |
2 |
50 |
24 |
60 |
12 |
60 |
12 |
72 |
|
McCays |
Dynamic Anisotropy (Rectangular) |
60 |
60 |
20 |
320 |
78 |
0 |
1.5 |
5 |
6 |
30 |
6 |
30 |
1 |
70 |
|
11.9.3 |
Block Model Parameters |
The block model parameters are presented in Table 11‑6. Sub-cell splitting was used to ensure that the volumes are adequately represented in the block model. Zonal control was applied during grade estimation to ensure that samples from one zone were not used to estimate in another zone.
Table 11‑6: Block Model Configuration
|
Field |
Description |
ISBS |
ISBN |
Bubi |
McCays |
|
XMORIG |
Block Model Origin X Coordinate |
661,200 |
662,100 |
684,150 |
665,100 |
|
YMORIG |
Block Model Origin Y Coordinate |
7,845,850 |
7,847,600 |
7,863,300 |
7,849,200 |
|
ZMORIG |
Block Model Origin Z Coordinate |
750 |
690 |
900 |
730 |
|
XINC |
Parent Block Dimension in the X direction |
20 |
20 |
20 |
10 |
|
YINC |
Parent Block Dimension in the Y direction |
10 |
10 |
10 |
10 |
|
ZINC |
Parent Block Dimension in the Z direction |
5 |
5 |
5 |
5 |
|
NX |
Number of Parent cells in the X direction |
115 |
92 |
98 |
220 |
|
NY |
Number of Parent cells in the Y direction |
180 |
118 |
300 |
190 |
|
NZ |
Number of Parent cells in the Z direction |
90 |
112 |
70 |
100 |
|
11.10 |
Model Validations |
Model validation included the following:
|
● |
Visual comparisons of the estimated grades against the composite sample grades, |
|
● |
Statistical comparisons for the mean of estimated grades against the mean of the composited samples, |
|
● |
Trends (or swath analysis checking) to ensure that the regional grade trends from the drill holes were preserved in the model. The ordinary kriging algorithm calculates the best estimate by minimizing the estimation error (kriging variance). This results in smoothing of the block estimates, compared to the samples. The objective of this exercise was therefore to ensure that both regional and local trends were best preserved, |
|
● |
Filtering out the upper and lower deciles of the sample distribution and comparing that to the same for the estimated blocks. This was to assess whether there was over or under extrapolation. |
The means between sample and model estimates compared favourably.
Block on block analysis (Swath plots) compares local trends in the samples against model estimates. The approach was to divide the study areas into 50 m* 50 m* 20 m blocks in the X, Y and Z direction respectively, and to select samples within each block, and compare their mean against the mean of the model. Sample and model mean compared favourably.
|
11.11 |
Reconciliation |
Compared to the October 2021 MRE for the Measured and Indicated categories, which was prepared in accordance with CIM Standards, there is a 3.1 % decrease in tonnage and 0.8 % decrease in grade. Tonnage for the Inferred category has decreased by 2.8 %, and the grade has increased by 0.7%. Reasons for the change is due to in-fill grade control drilling as well as mining depletions.
|
11.12 |
Resource Classification |
Mineral Resource classification used a “Checklist” approach, where various criteria were considered and rated. These included:
|
● |
Data quality and integrity, |
|
● |
Data spacing for confidence in geological interpretations and grade interpolation, |
|
● |
Confidence in the geological interpretation from a regional and local perspective, and how that interpretation influences the controls for Au mineralization, |
|
● |
Reliability of the estimate in the mined-out areas, |
|
● |
Geostatistical confidence in grade continuity, |
|
● |
Geostatistical parameters such as kriging variance, kriging efficiency and search distances, to measure the relative confidence in the block estimates. |
All the above criteria were linked to drill hole spacing as the minimal qualifier for consideration. Areas with drillholes spacing less than 25 m; blocks estimated with at least 6 drillholes and with a relative ordinate kriging variance of less than 0.20 were considered for classification of Measured Mineral Resources; areas with drillholes spacing less than 50 m: blocks estimated with less than 4 drillholes and with a relative ordinary variance of less than 0.3 were considered for classification of Indicated Mineral Resources. Areas with drill hole spacing less than 100 m was considered for Inferred Mineral Resources. The drill spacing distance buffer was created in Leapfrog Geo™. A checklist used for the assessment of the Mineral Resources during classification criteria is summarized in Table 11‑7.
To determine what qualifies as surface mineable resources, whittle shells provided by DRA using a gold price of US$2,400/oz were used. Details of the additional Whittle parameters are presented in Table 11‑7 Mineral Resources within these shells were considered to have the potential for eventual economic extraction by open cast mining methods.
Table 11‑7: Checklist Criteria for Resource Classification
|
Items |
Discussion |
Confidence |
|
Drilling Techniques |
Diamond drill holes |
High |
|
Reverse Circulation drilling |
Medium |
|
|
Percussion drilling (predominantly in the oxidized zone) |
Low |
|
|
Logging |
All drill holes were logged by qualified geologists using standardized codes. Completed logs are checked and signed off by the senior geologist prior to capture into the database. The logging was of an appropriate standard for mineral resource estimation. |
High |
|
Drill Sample Recovery |
Recoveries recorded for every core run. |
High |
|
Sampling Methods |
Half core sampled at 1 m intervals for diamond drilling. Sampling occurs wherever there is evidence of alternation. |
High |
|
Portion of the rock chips collected at 1 m intervals sampled for RC drilling and Percussion drilling. |
Medium |
|
|
Quality of Assay Data and Laboratory Tests |
An external independent commercial laboratory has been used for all analytical test work for diamond and RC drilling. Appropriate sample preparations and assaying procedures have been used. Duplicate samples and industry CRMs were inserted within the sampling stream. The data has been declared fit for the purposes of geological and mineral resource modelling. |
High |
|
Percussion drilling used Bottle-Roll Analysis that was performed in-house. Analytical results are considered of low reliability because the method can only measure acid soluble gold. |
Low |
|
|
Verification of Sampling and Assaying |
Data integrity checks performed by DRA and Bilboes have confirmed data reliability. |
High |
|
Location of Data Points |
Drill hole collar location and orientation were surveyed by a qualified surveyor. |
High |
|
Tonnage Factors (Density) |
The Archimedes method of density determination was used in-house. Verification analysis was performed at the University of Zimbabwe and. The comparison of the in-house density determination and the check analysis compare favorably. |
High |
|
Data Density and Distribution |
Diamond and RC drilling was done at 25 m X 25 m on well informed areas, 50 m X 50 m on moderately informed areas, and 100 m X 100 m on less informed areas. The level of data density is sufficient to place Mineral Resources into the Measured, Indicated, and Inferred categories, respectively. |
High |
|
Database Integrity |
Data is stored in Datamine™ Fusion Database. |
High |
|
Geological Controls on Mineralization |
Geological setting and mineralization are very well understood. Mineralization is constrained to shear zones within a broad hydrothermal alteration halo. |
High |
|
Statistics and Variography |
Anisotropic spherical variograms were used to model the spatial continuity for the main mineralization domains. |
Medium |
|
Top or Bottom Cuts |
No cutting was applied to the Au estimation. Top and bottom cuts were applied to the density during estimation. |
High |
| Items | Discussion | Confidence |
|
Data Clustering |
Drill holes were drilled on an approximately regular grid, with decreasing regularization at depths. |
Medium |
|
Block Size |
Determined by QKNA. 20 mE x 10 mN x 20 mRL 3D block model constructed for ISBS, ISBN, and Bubi. For McCays the blocks were 10 mE x 10 mN x 5 mRL. |
High |
|
Search Distance |
Determined with the aid of QKNA as well as drilling spacing. |
High |
|
Grade Estimation |
Au estimated using Ordinary Kriging. Density estimated using Inverse Distance to the power if two. |
High |
|
Resource Classification |
Reported on a checklist bases with the drilling space. |
High |
|
Metallurgical Factors |
Metallurgical parameters were considered during the whittle optimization process, based on comprehensive test work and pilot plant. |
High |
|
Block Cut-offs |
0.9 g/t Au is used for block cut-offs. Other sensitivities at 0.0 g/t, 0.5 g/t and 1.5 g/t Au cut-off have also been presented. |
High |
This MRE was constrained to a Lerchs-Grossmann pit shell using 0.9 g/t Au as the cut-off grade (Table 11‑8). A gold price of US$2,400/oz scenario assessment was also completed to determine surface infrastructure boundaries to ensure that no potential future resource is sterilized through siting of future infrastructure.
Table 11‑8: Summary of Optimization Parameters used for the Lerchs-Grossmann Shells
|
Parameter |
Description |
Unit |
Bubi |
Isabella |
McCays |
|
Optimization Parameters |
Oxide Slope Angle - Weathered |
Degrees |
30 |
30 |
30 |
|
Trans Slope Angle |
Degrees |
48 |
48 |
48 |
|
|
Fresh Slope Angle |
Degrees |
51/55 |
51/55 |
48/51/55 |
|
|
Production Rate |
Ktpm |
180 |
240 |
240 |
|
|
Gold Price |
US$/Oz |
2,400 |
2,400 |
2,400 |
|
|
Discount Rate |
% |
10.0% |
10.0% |
10.0% |
|
|
Mining Costs |
Ore Cost |
US$/t Mined |
3.30 |
3.20 |
3.20 |
|
Waste Cost |
US$/t Mined |
2.30 |
2.30 |
2.30 |
|
|
Fixed Cost and Other |
US$/t Ore |
10.25 |
4.05 |
3.09 |
|
|
Processing Costs |
Processing Cost (Sulfide) |
US$/t Treated |
32.81 |
19.02 |
19.02 |
|
Recovery - Sulfides |
% |
88.90% |
83.60% |
83.60% |
|
|
Financial Parameters |
Royalties |
% |
5.00% |
5.00% |
5.00% |
|
Taxes |
% |
25.00% |
25.00% |
25.00% |
|
11.13 |
Declaration |
The Mineral Resource Estimate is summarized in the following table using a cut-off grade of 0.9 g/t Au and constrained inside a Lerchs-Grossman (LG) optimized pit shell using US$ 2,400 per ounce gold price (Table 11‑9). Mineral Resources exclude Mineral Reserves.
Table 11‑9: Mineral Resource based on a 0.9g/t Au Cut-Off Grade
|
Mineral Ressources (0.9 g/t Au) Reference Point: In Situ |
|||||
|
Property |
Classification |
Tonnes (Mt) |
Au (g/t) |
Metal (kg) |
Ounces (koz) |
|
Isabella South (ISBS) |
Measured |
0.034 |
1.80 |
61.66 |
1.98 |
|
Indicated |
1.043 |
2.07 |
2,154.20 |
69.26 |
|
|
Total Measured and Indicated |
1.077 |
2.06 |
2,215.85 |
71.24 |
|
|
Inferred |
1.335 |
1.80 |
2,403.91 |
77.29 |
|
|
Isabella North (ISBN) |
Measured |
0.082 |
2.40 |
196.56 |
6.32 |
|
Indicated |
1.734 |
2.29 |
3,971.85 |
127.70 |
|
|
Total Measured and Indicated |
1.816 |
2.29 |
4,168.41 |
134.02 |
|
|
Inferred |
1.613 |
2.18 |
3,519.53 |
113.16 |
|
|
Bubi |
Measured |
0.059 |
1.22 |
72.17 |
2.32 |
|
Indicated |
4.437 |
1.51 |
6,702.28 |
215.49 |
|
|
Total Measured and Indicated |
4.496 |
1.51 |
6,774.44 |
217.81 |
|
|
Inferred |
5.116 |
1.80 |
9,208.47 |
296.06 |
|
|
McCays |
Measured |
0.066 |
1.77 |
117.27 |
3.77 |
|
Indicated |
1.261 |
1.85 |
2,338.52 |
75.19 |
|
|
Total Measured and Indicated |
1.327 |
1.85 |
2,455.79 |
78.96 |
|
|
Inferred |
1.054 |
2.16 |
2,273.84 |
73.11 |
|
|
Totals (ISBS +ISBN+ Bubi + McCays) |
Total Measured |
0.241 |
1.85 |
447.66 |
14.39 |
|
Total Indicated |
8.475 |
1.79 |
15,166.84 |
487.63 |
|
|
Total Measured and Indicated |
8.716 |
1.79 |
15,614.50 |
502.03 |
|
|
Total Inferred |
9.118 |
1.91 |
17,405.76 |
559.62 |
|
|
● |
S-K 1300 definitions observed for classification of Mineral Resources. |
|
● |
Mineral Resources are reported exclusive of Mineral Reserves |
|
● |
Block bulk density interpolated from specific gravity measurements taken from core samples. |
|
● |
Resources are constrained by a Lerchs-Grossman (LG) optimized pit shell using Whittle software. |
|
● |
Mineral Resources are not Mineral Reserves and have no demonstrated economic viability. The estimate of Mineral Resources may be materially affected by mining, processing, metallurgical, infrastructure, economic, marketing, legal, environmental, social, and governmental factors (Modifying Factors). |
|
● |
Numbers may not add due to rounding. |
|
● |
The Mineral Resource Estimate has been depleted to reflect mining up to 31 December 2023 |
|
● |
Effective Date of Mineral Resource Estimate is 31 December 2023. |
|
11.14 |
QP Commentary |
The QP is of the opinion that all issues relating to all relevant technical and economic factors likely to influence the prospect of economic extraction can be resolved with further work.
|
12 |
MINERAL RESERVE ESTIMATES |
|
12.1 |
Basis of Mineral Reserve Estimate |
The process to develop the Mineral Reserve estimate in accordance with S-K 1300 was as follows:
|
● |
Ore recovery of 95% and fixed dilution parameters of 20 cm of hanging wall and 20 cm of footwall (4% in Whittle) were applied in the optimizations, |
|
● |
A Whittle Pit optimization was performed, |
|
● |
A base gold price of US$ 1,800/oz. A government royalty of 5.0% of revenue and a Refining/Selling Cost of 1.0% of revenue was then applied. This resulted in a Net Gold Price of ~US$ 1,692/oz, |
|
● |
Pit slopes inter-ramp angles ranging from 30° to 55°. Resulting overall pit slopes account for access ramps where applicable, |
|
● |
Gold recovery ranging from 83.62% to 88.88% dependent on mining area and ore type being processed, |
|
● |
Processing throughput of 2.88 Mtpa for Phase 1 and 2.16 Mtpa for Phase 2, |
|
● |
Mining contractor costs based on budget submissions from Southern African based mining contractors, |
|
● |
Average annual processing cost per tonne of ore, inclusive of general / administration costs range from US$ 21.56/t to US$ 44.24/t for all transitional and fresh ores depending on processing parameters, |
|
● |
The reference point for all grade and plant feed ore is the RoM plant feed tip and the plant feed stockpiles. |
A sensitivity assessment was done on gold prices of US$ 1,650/oz and US$ 1,950/oz. A gold price of US$2,400/oz scenario assessment was also completed to determine surface infrastructure boundaries only to ensure that no potential future resource is sterilized. This indicated that the optimal shell inventory (i.e., the size and shape of the optimal shell and therefore the ore and waste generated) was relatively robust for all mining areas.
Optimal shells (maximum profit) were selected for each deposit area based on a US$ 1,800/oz gold price that were then used as the basis for pit designs.
These shell selection criteria are relatively conservative, based on a 24-month (2022-2023 S&P Global) trailing average gold price of US$ 1,875/oz.
A conservative cut-off grade of 0.9 g/t based on project specific projected revenue and cost was applied to all Project resources to ensure tonnes milled generate enough revenue to cover processing costs as shown in Table 12‑1.
|
12.2 |
Mineral Reserve Declaration |
Table 12‑1 summarizes the Mineral Reserve Statement based on the work detailed above, undertaken as part of the Bilboes Gold Mine Project. The measured resources were converted to proven reserves and the indicated resources were converted to probable reserves. indicated and unclassified ore was considered and waste with any ores below the 0.9g/t cutoff grade. This indicated and unclassified ore would be drilled and upgrade to probable or proven reserve during the project life. The low grade would be stockpiled for consideration as potential plant feed at the end of the LOM depending on project economics at that time.
Table 12‑1: Bilboes Gold Project Mineral Reserve Statement (31 December 2023)
|
Deposit |
Classification |
Tonnage (Mt) |
Au Head Grade (g/t) |
Cut-of grade (g/t) |
Content (koz) |
|
McCays |
Proven |
0.8 |
2.99 |
0.9 |
80 |
|
Probable |
2.7 |
2.47 |
0.9 |
212 |
|
|
Isabella South |
Proven |
1.3 |
2.24 |
0.9 |
93 |
|
Probable |
4.1 |
2.08 |
0.9 |
272 |
|
|
Isabella North |
Proven |
2.5 |
2.57 |
0.9 |
207 |
|
Probable |
2.7 |
2.23 |
0.9 |
192 |
|
|
Bubi |
Proven |
1.2 |
1.90 |
0.9 |
75 |
|
Probable |
9.7 |
2.39 |
0.9 |
743 |
|
|
Total |
Proven |
5.9 |
2.42 |
0.9 |
455 |
|
Probable |
19.1 |
2.31 |
0.9 |
1,418 |
|
|
Grand Total |
Probable + Proven |
24.9 |
2.34 |
0.9 |
1,873 |
|
● |
Point of Reference: Plant Feed |
|
● |
S-K 1300 definitions observed for classification of Mineral Reserves. |
|
● |
Mineral reserves are quoted as head grade or as plant feed. |
|
● |
All tonnes quoted are dry tonnes. |
|
● |
Numbers may not add due to rounding. |
|
● |
No metal equivalents are reported. |
|
● |
Effective Date of Mineral Reserve Estimate is 31 December 2023. |
The estimate of Mineral Reserves of the Bilboes Gold Mine could be affected by any known environmental, permitting, legal, title, taxation, socioeconomic, marketing, political, or other relevant issue. Furthermore, the estimate of Mineral Reserves could be affected by any known mining, metallurgical, infrastructure, or other relevant factor.
|
12.3 |
Risk Assessment |
Various risks have been identified with consideration of the appropriate mitigating factors. These are presented in Table 12‑2.
Table 12‑2: Risks associated with the Declaration of the Mineral Reserve
|
Risk Category |
Risk |
Description / Cause |
Mitigation / Control |
|
Mining |
Poor run of mine ore grade |
Poor grade control of the ore zones could result in excessive dilution and/or ore losses in the run of mine ore grades. |
1. Grade control drilling will be conducted pre-mining and the cost for this has been allowed for in the PFS. 2. Grade controllers will be employed to monitor the mining team during operations. |
|
Mining |
Thin waste parting between ore zones |
Thin waste parting of less than 2 meters could be difficult to mine selectively and bulk mining may be preferred resulting in lower feed grades to plant. |
These areas have been modelled and allowed for in the mining blocks and provided there in strict monitoring the resultant grades will not vary significantly from planned grades. |
|
Mining |
Reduction in ore produced |
Poor drilling and blasting controls could cause overbreak on waste blocks that could accidently break good quality ore and mix it with waste. |
1. Due to on-going advance grade control and blast hole grade control geologists can accurately monitor the ore zones and grades. 2. Ore is visually different from waste to mapping and monitoring of broken waste and ore will show where controls have not been effective. |
|
13 |
MINING METHODS |
|
13.1 |
Hydrological and Geotechnical Investigation |
|
13.1.1 |
Hydrogeology |
Little was known of the hydrogeology for either the Isabella-McCays or Bubi Mines. There are some hydrogeological boreholes drilled around the Isabella-McCays pits, however there are no existing records for these boreholes, therefore no historical water levels or groundwater quality baseline could be determined.
The only levels measured and recorded are related to the geotechnical boreholes drilled around the Isabella-McCays and the Bubi open pits, where packer-testing was performed.
The estimation of an initial general hydraulic head over the entire area was done using the correlation between the elevation and hydraulic head values measured in each of the geotechnical boreholes.
Nine geotechnical boreholes were selected for packer testing. The interval selection was based on the presence of discontinuities determined on the televiewer log along the borehole interval.
The results of the packer testing have been incorporated in the numerical model.
|
13.1.2 |
Conclusion and Recommendations |
The numerical simulation for Isabella – McCays Mines and Bubi Mine lead to the following conclusions:
Each model indicates that a cone of drawdown will develop as a result of the mining activities. The open pits simulated act as hydrogeological sinks and groundwater inflows into the open pits will need to be pumped out for the duration of mining. After mining activities stop, the groundwater levels start to recover due to the formation of the pit lakes and the decrease of the hydraulic gradients towards the open pits.
The following shows the maximum drawdown at the end of mining and the recovery of the groundwater levels vs. time.
Table 13‑1: Isabella – McCays – Bubi – Predicted drawdown vs. time
|
Isabella - McCays drawdown vs. time |
Bubi drawdown vs. time |
||
|
Year |
Max. Drawdown (m) |
Year |
Max. Drawdown (m) |
|
7 |
112 |
6 |
85 |
|
25 |
43 |
25 |
77 |
|
50 |
33 |
50 |
45 |
|
75 |
21 |
75 |
10 |
|
100 |
13 |
100 |
9 |
|
13.1.3 |
Major Rock Domains |
Following the geotechnical logging of the drill holes, the following major rock domains were encountered (Table 13‑2).
Table 13‑2: Percentage Rock Types at Different Mining Pits
|
Rock Type |
Percentage Rock (%) |
|||
|
|
Isabella South |
Isabella North |
McCays |
Bubi |
|
Arkose |
26 |
14 |
- |
- |
|
Chlorite Schist |
23 |
- |
- |
- |
|
Schist |
16 |
- |
- |
- |
|
Felsic Schist |
35 |
83 |
- |
- |
|
Mafic Schist |
- |
2 |
21 |
13 |
|
Meta-Basalt |
- |
1 |
65 |
28 |
|
Banded-Iron Formation (BIF) / Chert |
- |
- |
4 |
- |
|
Meta-Andesite |
- |
- |
10 |
55 |
|
Saprock |
- |
- |
- |
4 |
|
13.2 |
Rock Mass Classification |
The rock mass quality for the different Bilboes pits (Isabella South, Isabella North, McCays and Bubi) was assessed using the Rock Mass Rating (RMR) RMR89 classification system developed by Bieniawski (1976, 1989). The results of the rock assessments show that the rock mass for all the four mining pits is considered to be fair to good.
|
13.3 |
Geotechnical Conclusions and Recommendations |
Based on the analysis of the engineering geological aspects of the investigated deposits which included rock mass characterization, hydrogeology, intact rock properties and structural geology, a geotechnical model comprising design parameters was developed. Using these design parameters; kinematic, empirical and limit equilibrium analysis was conducted to determine the optimal slope configuration for the various deposits.
Based on the analysis conducted, it is understood that the capacity of the slopes should be affected by the following:
|
● |
Completely weathered slopes should be a maximum of 3 m in height, and it is recommended that the material is pushed back from the crest, |
|
● |
For the transitional rock (highly to moderately weathered), by a combination of rock mass strength and adverse structural orientation. Inter-ramp heights of 60 m are achievable with inter-ramp angles between 45 degrees and 50°, |
|
● |
For the unweather rock slopes adverse structural orientation should determine the slope angle which is achievable. Inter-ramp heights of 90 m are achievable with inter-ramp angles of between 50 degrees and 55 degrees, depending on the wall direction. |
The controls on slope design are listed for the Bilboes pits with comments on the reliability of the data and descriptions of how the design issues were addressed for the purposes of the slope design (Table 13‑3).
Table 13‑3: Slope Design
|
Slope Design Issue |
Confidence |
Mitigation |
|
Faulting Faults were inferred to be sub-vertical; however, the width of fractured / disturbed ground either side of the faults is not understood. |
Moderate |
Kinematics was used to assess the stability of inter-ramp and overall slope. Inter-ramp and slope angles are restricted to between 50 and 55 degrees and 45 to 50 degrees respectively to ensure sub-vertical faults do not daylight |
|
Rock Fabric Large amounts of structural data were collected, defining the local occurrence, intensity, and orientation (dip and dip direction) of the structures |
High |
Good practice to collect and expand on the structural data collected to ensure that unknown structures are defined |
|
Soil and Intact Rock Properties Intact samples of rocks were collected and tested. |
Moderate |
Good practice to have an ongoing soil and rock testing program to build on the database |
|
Rock Mass Characterization Rock mass characterization was conducted and generally is representative of rock mass conditions. |
High |
Rock mass characterization should be ongoing to expand on the rock mass database. |
|
Groundwater The groundwater studies were conducted by SLR and included in the limit equilibrium analysis |
High |
All excess water inflows can be sent to local PCDs and then used as process water make up. |
The detailed pit slope design should require the following phasing once a final pit shell and pit stages are defined and inter-related.
|
● |
Additional intact strength testing is required for the rock and soil formations, |
|
● |
Additional structural data needs to be collected from the pits using a televiewer, |
|
● |
Continual collection of rock mass data from drilled core, |
|
● |
Conducting of additional stability analysis using the new pit shells, generated from with recommended slope angles recommendations presented on this document, and the revised geological and geotechnical models, |
|
● |
Developing the Ground Control Management Plan, |
|
● |
Projecting major structures onto the pit phases and final pit for geotechnical review and development of remedial measures and the timing of their implementation as required, |
|
● |
Defining the locations of the initial vibrating wire piezometers, the initial prisms, survey stations and trial horizontal drains and their specifications and the target dates for their installations. |
|
13.4 |
Mining Pit Locations |
The Bilboes Gold Mine consists of four mining areas containing between one to three pits each. These areas are McCays, Isabella South, Isabella North and Bubi as shown in Figure 13‑1, Figure 13‑2 and Figure 13‑3.
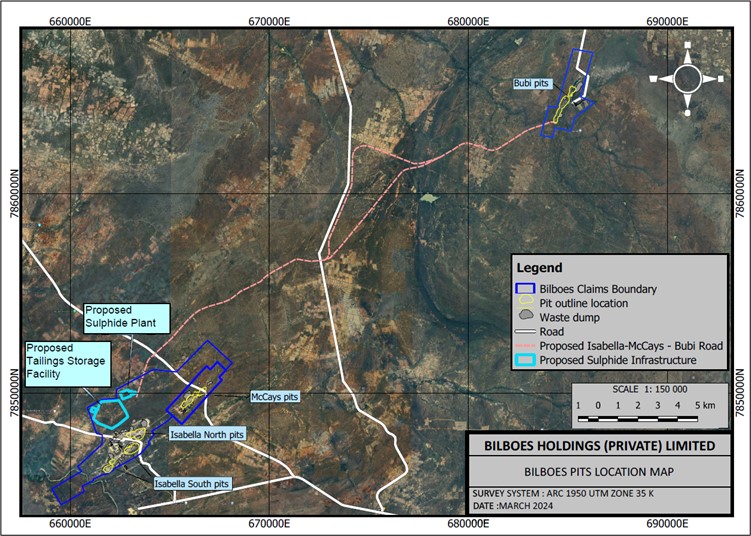
Figure 13‑1: Block Plan Showing Bilboes Pits and Process Plant Location
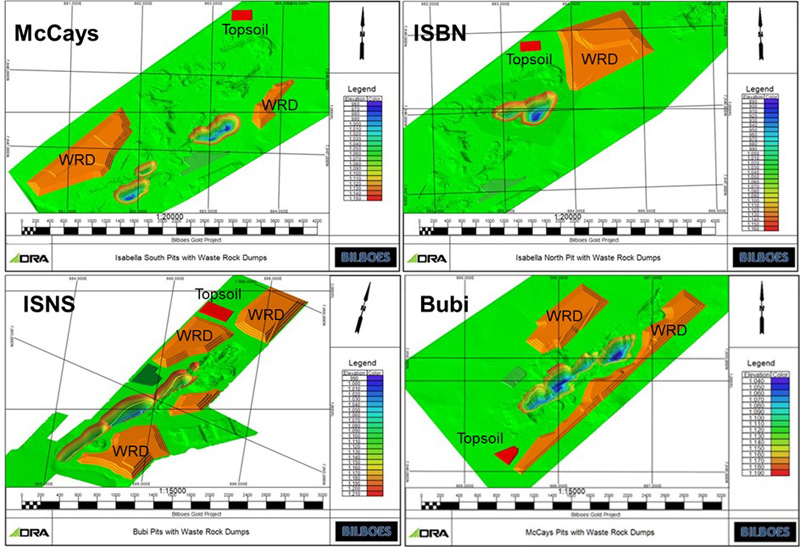
Figure 13‑2: Block Plan Showing Bilboes Pits Location
|
13.5 |
Mining Strategy |
A LoM schedule has been developed to supply two processing phases. These consist of Phase 1 at a processing capacity of 2.88 Mtpa (Isabellas and McCays) and Phase 2 at a processing capacity of 2.16 Mtpa (Bubi). The LoM schedule considers the blending requirement that a maximum of 50% of feed to plant be sourced from Isabella North and the remainder from Isabella South (preferred blend) or McCays for Phase 1.
A mining contractor will be used for all open pit mining related earthmoving activities.
All deposits will be mined utilizing conventional truck and shovel method.
Transitional and fresh ore and waste will be drilled and blasted.
Free dig and blasted waste will be loaded, hauled with 60 t haul trucks, and dumped to designated waste dump locations which will be systematically dozed and levelled to allow dump to be raised to design heights.
Free dig and blasted ore will be loaded and hauled with 40 or 60 t haul trucks and will either be directly tipped into the crushing facility, heap leach pads or placed on the Run of Mine (RoM) pad stockpile areas.
The Bubi ore will be dumped on the pit rim stockpiles before being loaded and hauled with a fleet of road trucks to the central processing facility at Isabella. There it will either be directly tipped into the crushing facility or placed on the RoM pad stockpile areas.
McCays will commence production first. This will assist in delivering higher mill feed grades early in the project life.
Nine months of pre-development waste stripping will be required to expose sufficient ore to maintain a constant ore feed rate during Phase 1 prior to the commissioning of the processing plant.
The mining of all four deposits will run for a period of approximately 10.8 years based on the current production schedule. The peak production requirements are 32.3 Mtpa (total material movement).
|
13.5.1 |
Mining Costs |
Mining costs are based on December 2023 contractor mining budget cost estimates.
|
13.5.2 |
Processing Recoveries and Costs |
Processing costs and recoveries for each metallurgical domain were received from DRA and modelled in 3D for each of the deposits.
|
13.5.3 |
Whittle Pit Optimization |
The gold prices and discount rate used in the optimizations are summarized in Table 13‑4.
Table 13‑4: Optimization Financial Parameters
|
Financial Parameters for Net Commodity Price |
Unit |
US$2,400 |
US$1,950 |
US$1,650 |
US$1,800 |
|
Date of Information: |
Oct 2023 |
Resource |
High |
Middle |
Base Case |
|
Base Currency |
US$ |
0 |
0 |
0 |
0 |
|
Annual Discount Rate (%) |
(%) |
10.0% |
10.0% |
10.0% |
10.0% |
|
Gold Price |
US$/Oz |
2,400 |
1,950 |
1,650 |
1,800 |
|
Royalties |
(%) |
5% |
5% |
5% |
5% |
|
Refining Cost |
US$/Oz |
1.0% |
1.0% |
1.0% |
1.0% |
|
Total Selling Cost |
US$/Oz |
144.00 |
117.00 |
99.00 |
108.00 |
|
Net Gold Price |
US$/g |
72.53 |
58.93 |
49.87 |
54.40 |
The geotechnical and waste parameters are presented in Table 13‑5.
Table 13‑5: Geotechnical - Mining
|
Geotechnical Parameters |
Unit |
Value |
Value |
Value |
Value |
|
Inter-Ramp Slope Angle |
ISBN |
ISBS |
McCays |
Bubi |
|
|
Oxide |
degrees |
30 |
30 |
30 |
30 |
|
Trans |
degrees |
48 |
48 |
48 |
48 |
|
Fresh |
degrees |
51/55 |
51/55 |
48/51/55 |
51/55 |
|
Bench Face Slope Angle |
|||||
|
Oxide |
degrees |
55 |
55 |
55 |
55 |
|
Trans |
degrees |
90 |
90 |
90 |
90 |
|
Fresh |
degrees |
90 |
90 |
90 |
90 |
|
Ramp Specifications – 70t truck |
|||||
|
Single Lane Width |
m |
12.5 |
12.5 |
12.5 |
12.5 |
|
Dual Lane Width |
m |
18.6 |
18.6 |
18.6 |
18.6 |
|
Design gradient (%) |
(%) |
10% |
10% |
10% |
10% |
|
Dilution and Mining Recovery |
Unit |
Value |
Value |
Value |
Value |
|
Mining Dilution |
(%) |
4% |
4% |
4% |
4% |
|
Mining Recovery |
(%) |
95% |
95% |
95% |
95% |
|
Distance ex-pit to Plant |
km |
2.5 |
3.5 |
2.6 |
28 |
|
Mining Cost Parameters |
Unit |
Value |
Value |
Value |
Value |
|
Reference Level Elevation |
RL |
1,151 |
1,135 |
1,163 |
1,195 |
|
Mining Cost Adjustment Factor (MCAF) |
US$/vert. meter |
0.006 |
0.006 |
0.006 |
0.006 |
|
Waste Mining Cost |
|||||
|
Oxide free dig |
US$/tonne |
1.49 |
1.49 |
1.49 |
1.59 |
|
Transitional and Fresh - including drill and blast |
US$/tonne |
1.99 |
1.99 |
1.99 |
2.03 |
The Whittle mining parameters are presented in Table 13‑6.
Table 13‑6: Mining Continued – Throughput - Process
|
Mining Cost Parameters |
Unit |
ISBN |
ISBS |
McCays |
Bubi |
|
Total Ore Mining Cost |
US$/tonne ore |
||||
|
Trans & Fresh – incl. drill and blast |
US$/tonne |
2.70 |
2.99 |
2.71 |
2.20 |
|
Extra Ore Cost (haul cost to plant) |
US$/tonne ore |
||||
|
Trans + Fresh |
US$/tonne |
1.52 |
1.81 |
1.53 |
9.01 |
|
Mill throughput Requirement |
|||||
|
LOM throughput Requirement |
Mtpa |
2.88 |
2.88 |
2.88 |
2.16 |
|
Additional Ore Mining Cost |
US$/tonne ore |
0.81 |
0.81 |
0.81 |
0.91 |
|
Processing Cost Parameters |
Unit |
Value |
Value |
Value |
Value |
|
Processing Cost Base |
|||||
|
Fresh - CIL 240(180) ktpm |
US$/tonne ore |
17.44 |
17.44 |
17.44 |
32.64 |
|
GA's |
US$/tonne ore |
2.59 |
2.59 |
2.59 |
2.59 |
|
Total Processing Cost |
|||||
|
Fresh - CIL 240(180) ktpm |
US$/tonne ore |
20.04 |
20.04 |
20.04 |
35.23 |
|
WHITTLE PROCESSING COST |
|||||
|
Fresh - CIL 240(180) ktpm |
US$/tonne ore |
21.56 |
21.85 |
21.57 |
44.24 |
|
Process Recovery |
|||||
|
Trans & Fresh - Biox & CIL Mean Recovery |
(%) |
83.6 |
83.6 |
83.6 |
88.9 |
To achieve mining selectivity and dilution reduction the decision was made to select mining equipment to mine the ore zone in 5 m flitches, the waste zones are to be mined in 10 m height.
The assumed dilution of 4% with a 5% mining loss was applied because the ore domains are continuous and will be clearly delineated and marked. Sampling of blast holes would be the basis for grade control in this analysis. The accuracy of the resulting ore/waste boundary is limited by the grade control resolution, a function of the drilling pattern's density.
|
13.5.4 |
Whittle Optimization Results |
The Whittle Optimization results of the median process recovery case are shown in Table 13‑7. To gauge the project sensitivity to the gold price fluctuations, three scenarios were run at US$1,650, US$1,800, and US$1,950.
Based on the Whittle shells selected there is a potential of 1,849 gold kilo-ounces available for processing and gold recovery after mining depending on the final pit wall and ramps design losses.
Predictably, the project value indicates linear sensitivity behavior as result of gold price variation. The Metal Mined, Mine Life and Ore Tonnes Mined sensitivities indicate that the Mineral Resource is relatively robust and insensitive to commodity prices. This analysis confirms the robustness of the optimal shells. Predictably, all DCF sensitivities to gold price fluctuations exhibit similar linear behavior.
The inventories of the selected shells are summarized in Table 13‑7.
Table 13‑7: Summary of Selected Shells at US$1,800/oz
|
All Run Results Max Profit |
Abb |
Units / Gold Price |
US$1,800 |
US$1,950 |
US$1,650 |
|
Parameter |
5% loss & 4% dilution |
||||
|
O-P Discounted Cashflow |
US$ m |
911.29 |
1,079.64 |
741.44 |
|
|
Mine Life Mine |
LOM |
Year |
10 |
10.80 |
9.40 |
|
Mineable Inventory |
Ore |
Mt |
24.95 |
27.74 |
23.50 |
|
Measured and Indicated |
Ore |
Mt |
24.95 |
27.74 |
23.50 |
|
Mineable Inventory |
Waste |
Mt |
198.10 |
222.50 |
189.80 |
|
Strip Ratio |
SR |
t:t |
7.94 |
8.02 |
8.08 |
|
Head grade |
Au |
g/t |
2.34 |
2.32 |
2.43 |
|
Au Metal In-situ |
Au |
koz |
1,874.43 |
2,069.33 |
1,835.97 |
|
Au Recovery |
Au |
% |
85.87% |
85.93% |
85.84% |
|
Au Metal Recovered |
Au |
koz |
1,610 |
1,778 |
1,576 |
|
Measured and Indicated |
Au |
koz |
1,610 |
1,778 |
1,576 |
|
EBIT before CAPEX |
US$ m |
1,116 |
1,346 |
898 |
|
|
13.6 |
Mine Design |
All the pit designs were developed using the DeswikCAD software package based on the selected optimal shells and utilizing the latest geological block models for each planned mining area.
The criteria for pit and waste dump ramp designs were based on the width and turning circle of a Caterpillar 773, as this size truck is likely to be used by mining contractors. Ramp gradients are 10%. Wherever possible, the ramp exits were located at the closest possible distance to the waste dumps to minimize ex-pit haulage.
The pit and waste dump design outlines recognized lease boundaries, neighboring villages, and the local road infrastructure. An additional requirement to siting the dump locations was to avoid all identified future exploration zones so as not to sterilize these areas. This had a slightly negative impact of increasing the ex-pit hauling distances in some cases.
Within the pit designs, a minimum distance of 50 m is required between the pit edge and final dump toe, which is considered acceptable. However, this is only a minimum separation distance, based on the Pit Shell from the US$2,400/oz gold pricing scenario was used to demarcate surface area to be left free of infrastructure that might sterilize remaining open pit/underground resource. Hence, pit rim to waste rock dump toe distances will exceed the minimum of 50 m in most cases.
Where possible existing haul roads will be re-used, but where none exist several new haul roads will be required.
|
13.7 |
Mine Production |
The scheduling undertaken for the Study is based on the ore and waste inventories for each of the pit designs. The aim of the scheduling component was to ensure that the mining process allowed for:
|
● |
Pre-stripping and stockpiling of sufficient ore in time for commissioning of the processing plant and then reaching the annual processing plant feed rate, |
|
● |
A practical and realistically achievable schedule in terms of fleet deployment, equipment productivities and bench turnover rates. |
The mining schedule aims to maximize value by:
|
● |
Reducing waste mining during the early years as much as possible, |
|
● |
Mining high grade materials during early years of LoM, |
|
● |
Delaying mining of deposits with higher ore mining cost, |
|
● |
Limit the waste excavator fleet to four excavators. |
Further requirements for the mining schedule were:
|
● |
McCays to be mined first due to highest average grade, |
|
● |
Isabella North ore must be blended with that of Isabella South (or McCays) with maximum of 50% of the feed to plant coming from Isabella North, |
|
● |
Bubi mined last due to long transport distance to plant. |
The mining schedule aims to meet the following processing plant feed criteria, during each scheduling period:
|
● |
Phase 1 production ramp up to 2.88 Mtpa of ore from McCays, Isabella South and North combined, |
|
● |
Phase 2 feed to plant rate of 2.16 Mtpa of ore from Bubi. |
Due to the relatively short life of each mining area, the production schedule was done in months. For reporting purposes, the monthly production schedule was also aggregated into calendar years.
All mining schedules were generated in XPAC, RPM’s propriety scheduling software.
|
13.8 |
Operating Assumptions |
The schedule is a practical solution that targets value and meets all mining and processing goals annually (Figure 13‑4). The key features of the schedule include:
|
● |
The operation is planned to utilize three crews on a two 10-hour shift roster for 353 days (365 / year less 12 public holidays) of the year based on mining being conducted by a mining contractor, |
|
● |
The need for 17.1 Mt of pre-strip material movement over nine months of pre stripping in the McCays and Isabella mining area will allow the process plant to commence its throughput ramp up, |
|
● |
Both Isabella South and North need to be pre-stripped while producing ore from McCays. The pre-strip requirements for these areas are 15.7 Mt and 1.4 Mt for Isabella North, respectively, |
|
● |
A maximum annual materials movement of 32.3 Mtpa in 2029, |
|
● |
The initial production ramp up needs four waste excavators and two ore excavators during the production ramp up for McCays, Isabella South and North. This remains constant during the LoM at Bubi except at stages where all the excavators are not fully utilized. |
|
● |
The ore excavators are never fully utilized for mining ore only and are used to mine the waste partings between the various reefs. |
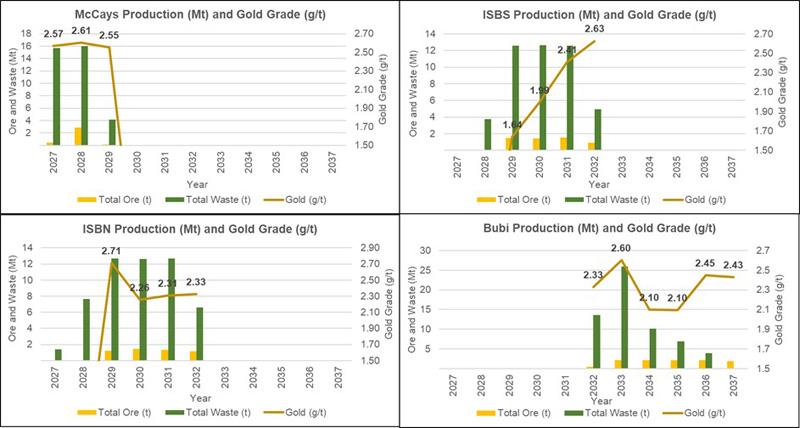
Figure 13‑3: Production Schedules per Area
|
13.9 |
Fleet Requirements |
|
13.9.1 |
Equipment Size |
The scheduling in XPAC is driven by the excavating capability during each period (i.e., the product of the number of excavators and their productivity).
For scheduling purposes, it was assumed that 100 t excavators with 6m3 bucket will be deployed on waste and 75 t excavators (4 m3 bucket) on ore. These excavators will be loading trucks with a payload capacity of 60 t and 40 t, respectively.
This selection was based on the likely equipment size that will be used by the mining contractors.
|
13.9.2 |
Waste Rock Dumps |
The waste dumps were staged appropriately to minimize haul distances throughout the LoM.
The waste dump construction and final landform are based on the following criteria:
|
● |
The maximum height of waste dumps is currently set at 40 m above ground level, |
|
● |
A swell and re-compaction factor of 30% was utilized to calculate a material placement density of waste on the waste dumps, |
|
● |
Dump bench face angle is designed at 30° during construction, with 10 m berms separating benches. During the rehabilitation phase, the WRD side slopes will be progressively dozed down into continuous slopes without benches, as required for agricultural use. After rehabilitation, the final landform slope will not exceed 19° overall slope angle, |
|
● |
The waste dumps will be built with a minimum 1:100 gradient on the top surface to ensure effective water shedding, |
|
● |
All dump locations were selected outside the boundaries as indicated by the Whittle gold price scenario of US$2,400/oz. Future prospecting zones were also considered so as not to sterilize any potential mineral resource, |
|
● |
The minimum operating width on the waste dump is 40 m, |
|
● |
All the waste dumps were designed with ramps of 10% gradient, |
|
● |
It has been assumed that all waste is benign and does not require any neutralizing treatment, or containment. |
The placement of the waste rock dumps was used to determine the expected hauling distances over LoM. The haul distances for ore for McCays, Isabella South and Isabella North is the direct haul to the processing plant. The Ore haul distances for Bubi only reflect the distance to the Bubi RoM pad where the ore will be re-handled onto on-road trucks for transport to the processing plant.
|
13.10 |
Mining Personnel |
The operation is planned to utilize three crews on a two 10-hour shift roster for 353 days (365 / year less 12 public holidays) of the year based on mining being conducted by a mining contractor.
The Bilboes Sulphides Project will have a management and technical services departments that are responsible for the overall operations and who’s costs are included in the owners general and administrative costs. (See table Table 13‑8)
The balance of the work force will be provided by the mining contractor and the costs are included in the contractor general and administrative costs or operators’ costs are included in the rates for specific operations.
Table 13‑8: Bilboes Labor Compliments and Job Grades
|
Personnel Complement Breakdown |
Job Grade |
Number |
|
General Manager |
D4 |
1 |
|
Mine Manager |
D3 |
1 |
|
Safety Manager |
D2 |
1 |
|
Environmental Manager |
D2 |
1 |
|
Security Manager |
D2 |
1 |
|
Administrator |
C4 |
1 |
|
Bilboes Management |
6 |
|
|
Tech Manager |
D3 |
1 |
|
Geologist |
D3 |
2 |
|
Surveyor |
C4 |
1 |
|
Grade Controller |
C4 |
8 |
|
Mine Planner |
D2 |
2 |
|
Accountant - DS |
D2 |
2 |
|
Assistant: Stores & Warehouse |
C4 |
6 |
|
Safety Officer |
C4 |
6 |
|
Security |
B3 |
24 |
|
Surface & Infrastructure Cook |
B3 |
6 |
|
Surface & Infrastructure Staff |
A1 |
20 |
|
Bilboes Technical Services |
78 |
|
|
Contracts Manager |
D5 |
1 |
|
Pit Manager |
D3 |
1 |
|
Pit Superintendents - DS |
D2 |
1 |
|
Pit Supervisor |
C4 |
4 |
|
Safety / Training Manager |
D3 |
1 |
|
Safety Officer |
C4 |
1 |
|
Training Officer |
C4 |
4 |
|
Miner Blaster |
A2 |
2 |
|
Production Foreman |
C4 |
8 |
|
Blasting / Grade Assistants |
A2 |
4 |
| Personnel Complement Breakdown | Job Grade | Number |
|
Surveyor Assistants |
B3 |
4 |
|
Pumping / Cleaning |
A2 |
3 |
|
Excavator Operator |
B4 |
24 |
|
FEL Operator |
B4 |
8 |
|
Truck Operators |
B4 |
96 |
|
Drill Operator |
B4 |
12 |
|
Dozer Operator |
B4 |
16 |
|
Dozer Operator |
B4 |
3 |
|
Truck W/E Operator |
B4 |
6 |
|
Comp / Grader Operator |
B4 |
6 |
|
Relief Operator |
B4 |
21 |
|
Mining Contractor |
226 |
|
|
Engineering Planner |
D1 |
1 |
|
Engineering GES |
D1 |
1 |
|
Diesel Mechanic |
C2 |
8 |
|
Electrician |
C2 |
2 |
|
Auto Electrician |
C2 |
2 |
|
Boilermaker |
C2 |
4 |
|
Artisan Assistant |
A3 |
16 |
|
Mining Contractor Engineering |
34 |
|
|
TOTAL MINING STAFF |
344 |
|
14 |
PROCESSING AND RECOVERY METHODS |
|
14.1 |
Process Test work Results |
Extensive test work (Section 10) has been undertaken. The ore (fresh sulfide) is refractory to normal free milling processing due to the ultrafine gold particles being largely encapsulated (and generally appearing in solid solution) within the sulfide minerals. As a result, the selected process encompasses a biological sulfide destruction step (Outotec proprietary BIOX® process) to liberate the gold particles and allow dissolution by a cyanide solution in the CIL circuit. The test work results were used to derive the PDC for the processing plant as depicted in Table 14‑1.
Table 14‑1: Process Plant Design Criteria
|
Description |
Unit |
Design |
Remarks |
|
Plant Annual RoM Throughput |
|||
|
Phase 1 Isabella McCays |
tpa |
2,880,000 |
Years approx. 1-6 |
|
Phase 2 Bubi |
tpa |
2,160,000 |
Years approx. 6-11 |
|
Plant Monthly RoM Throughput |
|||
|
Phase 1 Isabella McCays |
tpm |
240,000 |
|
|
Phase 2 Bubi |
tpm |
180,000 |
|
|
Head Grade Analysis |
|||
|
Transitional Ore Gold |
|||
|
Isabella Mc Cays |
g/t |
1.94 |
Average |
|
Bubi |
g/t |
1.61 |
Average |
|
Sulfides Ore Gold |
|||
|
Isabella McCays |
g/t |
2.42 |
Average |
|
Bubi |
g/t |
2.42 |
Average |
|
Ore Characteristics |
|||
|
Density |
|||
|
Isabella McCays |
t/m³ |
2.77 |
Average |
|
Bubi |
t/m³ |
2.85 |
|
|
BBWi (Bond ball work index) |
|||
|
Isabella McCays |
kWh/t |
17.00 |
Average |
|
Bubi |
kWh/t |
21.45 |
|
|
Ore Product Sizes |
|||
|
Crushed Ore (P80) (80% passing size) |
mm |
13 |
|
|
Milled Ore (P80) (80% passing size) |
microns |
75 |
|
|
Flotation Mass Pull |
|||
|
Isabella McCays |
% |
5 |
|
|
Bubi |
% |
10 |
|
14.2 |
Process Flow Description |
Ore will be derived from two main mining areas, namely Isabella McCays and Bubi, with production throughput to be phased over the LoM based on tonnage, proximity to the process plant and metallurgical characteristics. Bubi ore, destined to be processed over the latter part of the LoM will be trucked approximately 23km to the processing plant which will be situated at the Isabella McCays complex. The envisaged phasing is as depicted in Table 14‑1.
Operations in the process plant can essentially be divided into seven main sections (Figure 14‑1).
|
● |
Comminution (ore size reduction by crushing and milling to facilitate liberation of the mineral particles for subsequent downstream concentration), |
|
● |
Flotation (concentration of sulfides and gold into a small concentrate mass), |
|
● |
Biological oxidation - BIOX® (destruction of the sulfides in the concentrate using oxidizing bacteria to expose the gold particles for downstream recovery), |
|
● |
Carbon in leach (cyanidation leach of the BIOX® residue and recovery of the solubilized gold onto activated carbon), |
|
● |
Carbon treatment, |
|
● |
Electrowinning and smelting, |
|
● |
Tailings handling. |
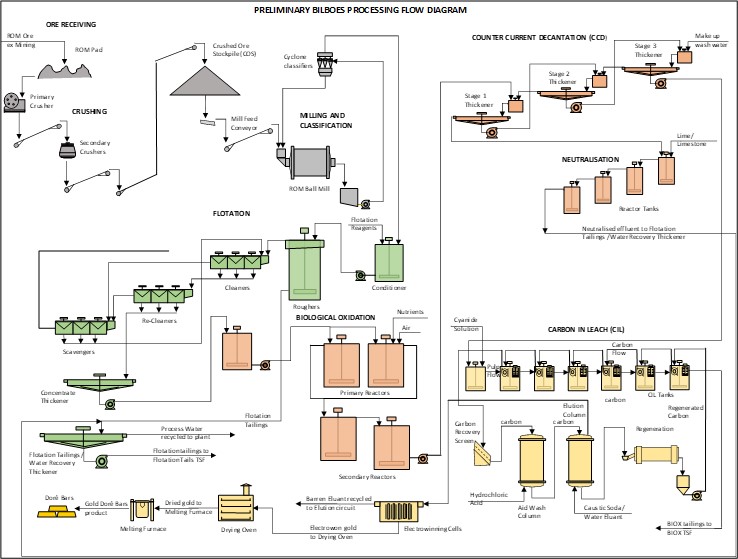
Figure 14‑1: Bilboes Simplified Process Flow Diagram
|
14.2.1 |
Comminution |
|
14.2.1.1 |
Crushing |
The crusher circuit has been designed to process the full LoM design monthly tonnage (240 ktpm ISBM). When processing Bubi ore the crushing circuit monthly throughput will reduce to approximately 180 ktpm due to the harder nature of the Bubi ore. Ore with a top size of approximately 900 mm is received from the open pit mining operations at the RoM Pad by haul truck. The ore may be stockpiled on the RoM Pad (for blending or delayed feeding purposes) or directly tipped into the primary jaw crusher. The crusher circuit comprises primary jaw and secondary cone stages to produce a product with P80 of 30 mm for stockpiling on the Crushed Ore Stockpile (COS) ahead of the milling circuit. Total capacity of the COS is approximately 26 ktpm t with a live capacity of 8 ktpm (24 hours). In times of ore shortages, the excess stockpile capacity may be processed using dozers and loaders to feed through the COS chutes.
|
14.2.1.2 |
Milling and Classification |
The crushed ore is withdrawn from beneath the COS and fed onto the mill feed conveyor by vibratory feeders. The mill feed conveyor discharges directly into the single RoM Ball Mill feed hopper. The conveyor is fitted with a weightometer to measure the throughput as well as controlling the speed of the vibratory feeder to give the set tonnage to the mill. The ball mill is a grated discharge mill with steel liners and utilizing steel balls as the grinding media. Milled slurry discharges via a trommel screen into the mill discharge sump and is pumped to the cyclone classification circuit. The cyclone overflow containing the fine particles gravitates to the flotation conditioning tank in the flotation section. The coarse particles exit in the cyclone underflow stream and return to the ball mill. Product size from the milling section is 80% passing 75 μm. During processing of the Bubi ore monthly milling throughput will reduce to 180 ktpm due to the harder nature of the Bubi ore.
|
14.2.2 |
Flotation |
Cyclone overflow from the milling section discharges into the flotation conditioning tank where it is adjusted with process water to the set flotation feed density. Flotation reagents are also added in this tank and the slurry is allowed to condition for a set period prior to being pumped to the flotation cells. The circuit will operate at natural pH and be configured in a rougher, cleaner, recleaner and cleaner scavenger format to facilitate maximum gold and sulfide recoveries while minimizing the carbonate recovery to the concentrate. Sodium Ethyl Xanthate (SEX) is used as the collector for the sulfide minerals, copper sulphate as an activator for the sulfide minerals while starch and sodium carbonate are used as depressants for the carbonates. The rougher tails, forming the tailings product, are dewatered in the water recovery thickener circuit, and pumped to the flotation tailings storage facility. The recleaner concentrate forms the concentrate and is pumped to the concentrate thickener for dewatering ahead of processing in the biological oxidation section. Supernatant water from the tailings and concentrate thickeners is recycled to the milling and flotation sections. The supernatant solution is recycled back to the process plant.
|
14.2.3 |
Biological Oxidation (BIOX®) |
In the BIOX® section bacterial oxidation of the sulfide minerals occurs, (by mesophilic bacteria, operating in the range of 15°C – 45°C) resulting in liberation of the included gold particles for further downstream recovery.
|
14.2.3.1 |
Biological Leaching |
Dewatered flotation concentrate is pumped to the BIOX® surge tank where it is diluted to the required density of approximately 18% solids. The slurry is then fed to the primary reactors (in parallel), with slurry overflowing to the secondary reactors (in series). Oxygen and carbon dioxide (air), nutrients, defoamer and sulfuric acid are added to the tanks. The required bacteria cultures are contained within the tanks; oxygen, solids feed rate, pH and temperature control are essential to ensure the bacterial activity level is maintained. Bacterial oxidation of the sulfides optimally takes place at a pH of 1.5 - 2.2 and a temperature of approximately 42oC. As the concentrate contains a relatively high amount of carbonate the addition of sulfuric acid will be required to maintain the required pH. Temperature is maintained by the circulation of cooling water via cooling coils within the reactors. Aeration of the tanks (oxygen supply) is by medium pressure air blowers (240 kPa). Air hold-up in the tanks is approximately 17% of live volume. Total required residence time in the reactors is 6.5 days. The oxidized slurry product exits the final Stage 2 reactor and is pumped to the Counter Current Decantation (CCD) section for separation of the acidic liquid and oxidized solids components.
|
14.2.3.2 |
Counter Current Decantation (CCD) |
A three stage CCD (counter current decantation) circuit allows for removal of the acidic solution components from the oxidized solids. The thickener underflow solids are progressively washed of acidic solution in an up-flow manner from Thickener 1 to 3, exiting as Thickener 3 underflow, while the acidic solution is progressively concentrated in a down flow manner exiting as Thickener 1 overflow. Make up water is added to the feed of Thickener 3 to maximize the washing efficiency. The Thickener 3 underflow slurry (washed oxidized product) is pumped to the CIL section for final gold recovery, while the Thickener 1 overflow acidic solution is pumped to the neutralization section for precipitation of the acidic and other acidic deleterious components.
|
14.2.3.3 |
Neutralization |
The neutralization circuit comprises eight stages, where the acidic solution is initially neutralized to a pH of approximately 4.5 with limestone (Stage 3) and then to a pH of 7 (Stage 7) with lime. The acidic components and solubilized arsenic are precipitated to the various sulphates with the arsenic fixed insolubly as basic ferric arsenate. The slurry is pumped to the water recovery thickener, where it combines with flotation tails, where the solids are dewatered (thickener underflow) and thereafter pumped to the Flotation tailings storage facility. The supernatant thickener overflow solution is channelled to the process water circuit for recycling to the process plant in general. Residence time per neutralization stage (8 off) is 1.5 hours thereby resulting in a circuit residence time of 12hrs.
|
14.2.4 |
Carbon in Leach (CIL) |
Washed oxidized slurry from the neutralization section is pumped to the pre-leach tank (CIL Tank 1) of the CIL circuit, where the slurry will be subjected pH adjustment with lime and additional aeration to ensure complete oxidation of cyanide consumers. The slurry will then overflow to CIL Tank 2 where cyanide is added and from there down the circuit to the final CIL tank. Tanks 2 to the final tank all contain activated carbon, retained within the tank by an interstage screen. Slurry residence time in the circuit is set at 36 hours, by which time maximum gold dissolution will have occurred and the carbon will have adsorbed approximately 99% of the soluble gold. The exiting slurry from the final CIL tank will pass over a carbon safety screen to ensure no loss of carbon due to possible interstage screen perforations, before gravitating to the tailings surge tank. From here the slurry is pumped to the detoxification circuit for cyanide destruction before being pumped into the BIOX® tailings storage facility. The carbon within the CIL tanks is pumped counter currently to the slurry flow, together with the relevant slurry, upstream from the last CIL tank to the CIL Tank 2. The carbon Au value increases as it progresses upstream in the circuit while the slurry solids and liquids Au values decrease as the slurry flows downstream in the circuit. Loaded carbon is recovered from CIL Tank 2 by pumping the carbon / slurry to the Loaded Carbon Screen. The slurry passes through the screen and returns to CIL Tank 2. The loaded carbon discharges from the screen into a hopper from where it is transferred the Acid Treatment Vessel at the head of the carbon treatment circuit.
|
14.2.5 |
Carbon Treatment |
A loaded carbon batch (5 t) is treated at ambient temperature with a 3% hydrochloric acid solution for approximately 1 hour in the acid wash vessel to remove inorganic foulants, predominantly calcium, ahead of the elution process. At the end of the process the spent acid is washed from the column with water and pumped to the BIOX® tailings tank and ultimately sent to the BIOX® tailings storage facility.
The acid washed carbon is transferred by water eduction to the elution column ahead of desorption of the Au. The elution process is the split AARL (Anglo American Research Laboratory) type. This process separates the elution (desorption) cycle from the electrowinning cycle thereby adding flexibility to the process. The loaded carbon is pre-soaked at 110°C with a solution comprising 1% cyanide and 2% caustic soda solution for approximately 1 hour. After this the carbon is eluted with high quality water at 125°C for a period of approximately 4 hours. The gold bearing solution (preg solution) is stored in the Preg Solution Tank in readiness for gold recovery in the electrowinning section. For flexibility, a second preg solution tank is installed to allow fully independent electrowinning to take place. The total elution cycle (including acid treatment) takes approximately 10 hours. The barren carbon is transferred by water eduction from the elution column to the regeneration kiln feed hopper.
The Regeneration Kiln is a horizontal retort type, operating at a temperature of 750°C (hot zone) in a non-oxidizing atmosphere to prevent ignition of the carbon. In this process organic foulants such as oils, greases and flotation reagents are removed thus returning the carbon close to its original virgin activity in readiness for reuse in the CIL circuit. Carbon discharges the kiln into a quench tank (cold water filled) and is then recycled by eductor back to the CIL circuit.
|
14.2.6 |
Electrowinning and Smelting |
The preg solution is pumped to the electrowinning circuit (situated in the Gold Room), comprising two electrowinning cells, each with 16 cathodes and 18 anodes. The cathode is stainless steel mesh wrapped around a stainless-steel frame, connected to the negative terminal, and encapsulated in a non-conducting, perforated cathode box. The anode comprises a stainless-steel perforated plate connected to the positive terminal. DC power to each cell is supplied by a dedicated rectifier (2,000 amps). The preg solution is circulated through the electrowinning circuit over 12 hours. Au in the preg solution deposits onto the stainless-steel mesh in the cathode box with the generation of hydrogen gas (resulting in localized acidic conditions in the cell). The pH in the preg solution must be maintained at approximately 13 to prevent excessive corrosion of the stainless-steel anode due to localized low pH. Oxidation reactions at the anode result in the generation of ammonia and hydrogen amongst others. The gases are vented off in a very diluted form to the atmosphere via an extraction system. Once the residual Au value in the preg solution has reached the low setpoint the process is deemed to be complete and is halted.
The cathode boxes are removed periodically from the electrowinning cell and the gold recovered from the stainless-steel mesh by high pressure water jets. The gold is then filtered and dried in a drying oven. The dried gold is mixed with fluxes (generally borax, silica, and sodium carbonate) and melted in a single pot diesel fired furnace at a temperature of approximately 1,100°C. (Melting point of gold is 1,064°C). Once molten the gold is poured into Molds, cooled, cleaned, stamped, and stored in the vault awaiting dispatch to the refinery.
|
14.2.7 |
Tailings Handling |
Tailings from the CIL circuit are detoxified to reduce the Weak Acid Dissociable Cyanide (WAD) levels to below 50 ppm prior to discharge to the BIOX® tailings TSF. This is accomplished using the INCO SO2 / Air-process. The process requires a copper catalyst, added as CuSO4 (copper sulphate). The SO2 source is sodium meta bi-sulphite (SMBS), while oxygen is generally sourced from compressed air. Minimum O2 requirement is generally 1 ppm - 2 ppm. Optimum pH is 8 - 10. The process results in the generation of sulfuric acid and thus requires the addition of lime (generally) or caustic soda to maintain pH at the optimum level.
|
14.3 |
Plant Water Requirements |
Raw water will be supplied to the raw water storage tank, with a live capacity of 2,560 m³, from the pit dewatering pumps and several borehole pumps. The raw water is used for gland service, carbon transfer duties, elution, gravity concentrator circuit water, reagent make-up and fire service duties. The raw water storage tank will have a reserve for firefighting purposes. This reserve will be maintained by suitability positioned fire water and raw water pump suctions.
Process water is stored in the process water dam, an earthen lined structure with a live volume of 10,400 m³. The process water dam collects water from the water recovery thickener, flotation tailings TSF and any plant run-off from pollution control dams. Process water is supplied to all sections of the plant for hosing and screen spraying and specifically to the milling and flotation sections for slurry dilution purposes. The process water balance is negative and relies on a make-up volume (from raw water) of approximately 4,000 m³/day under phase 2 conditions.
|
14.4 |
Reagent Services |
The Bilboes plant will use a substantial number of chemical reagents / commodities due to its complexity. Limestone will be sourced locally; all the other reagents will require importation into Zimbabwe.
Table 14‑2: Process Plant Major Reagents / Commodities
|
Reagent / Commodity |
Delivery Form |
Area(s) of Use |
Make up Facilities |
|
Quick / Burnt lime CaO (85%) |
Bulk powder, -1 mm solids |
Milling, BIOX® Neutralisation, CIL, Cyanide Detoxification |
Bulk Slaking (Hydration)plant supplying hydrated lime – Ca (OH)2 - via a ring main system |
|
Limestone (CaCO3) (45%) |
Bulk crushed, -40 mm solids |
BIOX® Neutralisation |
Milling plant with dedicated supply to neutralisation area |
| Reagent / Commodity | Delivery Form | Area(s) of Use | Make up Facilities |
|
Flocculant (various) |
Dry powder, 25 kg bags |
Flotation tails thickener, Flotation Conc. thickener, BIOX® CCD thickeners, Water recovery thickener |
Dedicated batch make up plants at each relevant site supplying liquid flocculant |
|
Flotation Collector: Sodium Ethyl Xanthate (SEX) |
Dry pellets, 850 kg bulk bags |
Flotation |
Dedicated batch make up plant supplying liquid reagent |
|
Flotation Activator Copper Sulphate (CuSO4) |
Dry powder, 25 kg bags |
Flotation |
Dedicated batch make up plant supplying liquid reagent |
|
Flotation Frother |
Dry powder, 200 kg drums |
Flotation |
Dedicated batch make up plant supplying liquid reagent |
|
Flotation Depressant 1 Sodium Carbonate (Na2CO3) |
Dry powder, 25 kg bags |
Flotation |
Dedicated batch make up plant supplying liquid reagent |
|
Flotation Depressant 2 Starch |
Dry powder, 25 kg bags |
Flotation |
Dedicated batch make up plant supplying liquid reagent |
|
Sulphuric Acid |
Bulk tanker liquid 93% H2SO4 |
BIOX® |
Ring main system feeding from storage tank to BIOX® circuit. |
|
BIOX® Nutrients |
Dry powder, 25 kg bags |
BIOX® |
Dedicated batch make up plant supplying liquid reagent |
|
Sodium Cyanide NaCN |
Briquettes, 1,000 kg bulk bags |
CIL, Elution |
Solution make-up and storage facility |
|
Caustic Soda NaOH |
Pellets, 1,000 kg bulk bags |
Carbon Treatment, Cyanide make-up facility |
Solution make-up, storage and distribution facility |
|
Hydrochloric Acid HCl |
33% Liquid, 200 l plastic drums |
Carbon Treatment Acid Wash |
Direct pumping from drum into Acid Wash solution make up tank |
|
Sodium Metabisulphite Na2S2O5 |
Powder, 1,000 kg bulk bags |
Cyanide Detoxification |
Solution make-up, storage and distribution facility |
|
Diesel |
Bulk Tanker |
Fire water system, Elution and Gold Room |
Local diesel storage tank for distribution |
|
Milling grinding media 80 mm dia. forged Cr-Mo steel |
200 l steel drums |
Milling |
Ball loader onto Mill feed conveyor |
|
15 |
INFRASTRUCTURE |
The mine layout is shown in Figure 15‑1.
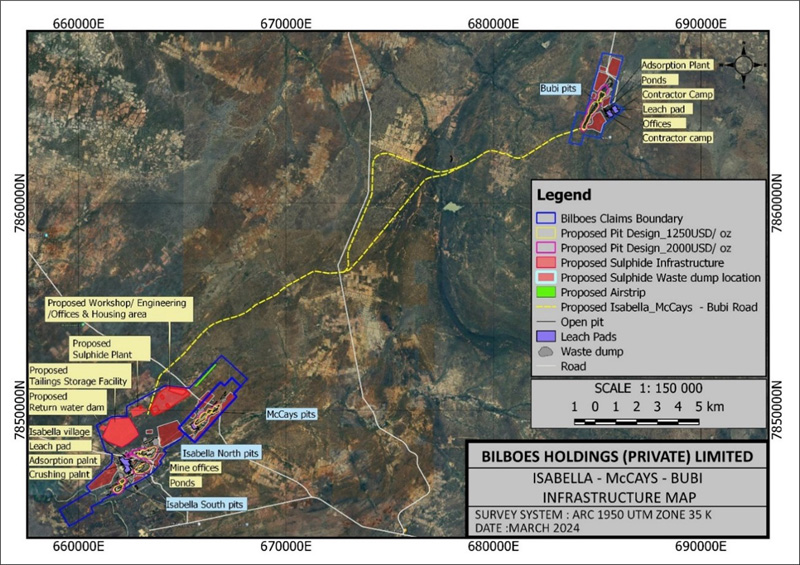
Figure 15‑1: Mine Layout
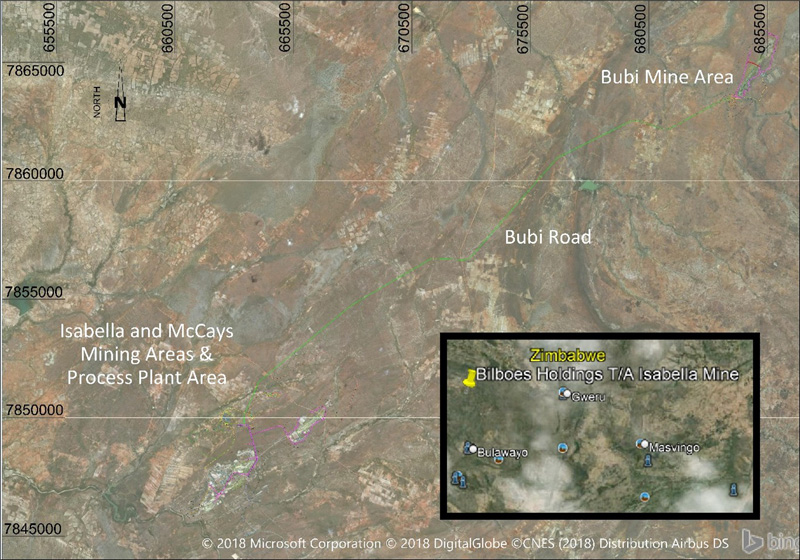
Figure 15‑2: Overall Site Plan
|
15.1 |
Geotechnical Investigation and Design |
The Bilboes Gold Project geotechnical engineering investigation involved the investigation for the Open Pit, TSF, the Process Plant (Plant) and Waste Rock Dump (WRD) foundation material analysis - Field Investigation and Data Collation
SLR Rock Engineers visited the site at various stages of the geological drilling campaign during 2018 which included, review of geological and geotechnical data, geotechnical logging of core and the collection of intact rock samples for laboratory testing.
Prior to the field investigation, a site reconnaissance study was conducted, during which the site was assessed with the view to planning the investigation methodology. This was followed by a desktop study investigation which involved the compilation and assessment of available information on the site including geology, aerial photography, and previous investigations on the site, where available.
The test pit locations were selected based on early conceptual site layouts of the TSF, RWD and Plant Site to gain maximum coverage of the area.
Selected soil samples were retrieved from the test pits and were submitted to the Contech Geotechnical Testing laboratory in Harare, Zimbabwe. The samples were chosen to determine the design parameters of each material units encountered at the site.
|
15.1.1 |
TSF Site |
The following soil and rock properties were derived from the investigation and are recommended for use in design, slope stability analysis and seepage modelling (Table 15‑1).
Table 15‑1: Proposed Soil and Rock Properties for Foundation Modelling on the TSF Site
|
Geotechnical Domain |
Depth (m) [mean values] |
USCS |
Dry Density (kg/m3) |
V |
Confined Modulus (MPa) |
Effective Cohesion (KPa) |
Effective Friction Angle (Degrees |
Ksat (m/s) |
|
Topsoil |
0.0 - 0.6 |
CL |
1,700 |
0.3 |
4 |
0 |
27 |
1 x 10⁻⁶ |
|
Residual Arkose |
0.6 - 1.0 |
CL/SC/GC |
1,700 |
0.3 |
8 |
0 |
27 |
1 x 10⁻⁶ |
|
Residual Andesite |
0.4 - 1.0 |
CL/SC |
1,800 |
0.3 |
15 |
0 |
30 |
1 x 10⁻⁶ |
|
Residual Meta-Basalt |
0.1 - 0.6 |
CL/SC/GC |
1,800 |
0.3 |
8 |
0 |
30 |
1 x 10⁻⁶ |
|
Rock Type |
Depth (m) [mean values] |
Rock Classification |
Dry Density (kg/m3) |
V |
GSI |
Rock Strength (MPa) |
Confined Modulus (KPa) |
Ksat (m/s) |
|
Arkose / Andesite / Meta-Basalt |
1.0 - 2.0 |
Poor Quality Rock Mass |
2,600 |
0.4 |
25 - 35 |
1 - 5 |
50 |
1 x 10⁻⁸ |
|
15.1.2 |
Process Plant Site |
The following soil and rock properties were derived from the investigation and are recommended for use in plant siting and foundation design (Table 15‑2).
Table 15‑2: Proposed Soil and Rock Properties for Foundation Modelling on Process Plant Site
|
Geotechnical Domain |
Depth (m) [mean values] |
USCS |
Dry Density (kg/m3) |
V |
Confined Modulus (MPa) |
Effective Cohesion (KPa) |
Effective Friction Angle (Degrees) |
|
Topsoil |
0.0 - 0.4 |
Not considered suitable for founding |
|||||
|
Residual Arkose |
0.4 - 1.0 |
CL |
1,700 |
2 |
0 |
27 |
|
|
Residual Arkose - Medium Dense to Dense |
1.0 - 1.3 |
CL/SC/GC |
1,800 |
0.3 |
8 |
0 |
30 |
|
Rock Type |
Depth (m) [mean values] |
Rock Classification |
Dry Density (kg/m3) |
V |
GSI |
Rock Strength (MPa) |
Confined Modulus (KPa) |
|
Arkose |
1.3 |
Poor Quality Rock Mass |
2,600 |
0.4 |
25 - 35 |
1-5 |
50 |
|
15.1.3 |
Waste Rock Dump Sites |
|
● |
The Waste Rock Dumps classifies geotechnically as a Class II Low Hazard, |
|
● |
Waste Rock Dump lift heights should be limited to 10 m with a minimum of a 10 m berm, with an overall height of 40 m. |
|
15.2 |
Tailings Storage Facility |
SLR Consulting (Africa) (Pty) Ltd (SLR) were appointed to design and cost a new TSF and the associated sundry infrastructure which include RWD, silt traps, pollution control system, access roads and perimeter fencing.
|
15.2.1 |
Design Standards |
It is understood that there are no specific Zimbabwean regulations or standards that are applicable to TSF designs. The Bilboes TSF design complies with various international regulations, standards, and guidelines as well as the necessary supplementary Zimbabwean regulations e.g., the environmental protection associated with the disposal of mining waste, the Zimbabwe Statutory Instrument 6 of 2007 applied and The Zimbabwe Standard Specification for Hazardous Waste Management (ZWS 806:2012)
According to Bilboes, the Zimbabwe EMA views the incorporation of a 1.5 mm thick HDPE geomembrane in the lining system as minimum best practice.
|
15.2.2 |
Design Criteria |
It is understood that the flotation and BIOX® CIL tailings streams are chemically and physically diverse, and as a result, it was considered appropriate to design a facility with two separate compartments.
The general area for a TSF site was preselected by Bilboes. SLR conducted a trade-off study that compared various TSF construction, development, and deposition techniques over several TSF layout options on the pre-selected site area. The trade-off costing exercise demonstrated that the lowest start-up and sustaining capital costs were associated with a hybrid development system that incorporated full containment of tailings during the initial high RoR deposition phases, followed by upstream development in the latter phases of development when the RoR reduces to the permissible 2 m/year.
Conventional tailings slurry disposal by way of spigotting with a maximum allowable RoR of 2 m/year above the containment wall crest was adopted for the project.
EPCM supplied the tailings production profile indicating three distinct phases of production as presented in Table 15‑3.
Table 15‑3: Production Profile
|
Phase |
Year |
Deposition Rate (tpm) |
Cumulative Tonnage (t) |
||
|
|
|
Flotation Tailings |
BIOX® Tailings |
Flotation Tailings | BIOX® Tailings |
|
Phase 1 |
1.75 to 7.25 |
240,000 |
12,000 |
14,977,000 |
803,000 |
|
Phase 2 |
7.25 to 13 |
180,000 |
18,000 |
11,178,000 |
1,242,000 |
|
TOTAL |
28,549,000 |
2,171,000 |
|||
Based on the production profile and plant process data supplied by DRA, the TSF was sized to accommodate a deposition rate of 28.5 Mt for the flotation tailings compartment, and 2.2 Mt for the BIOX® compartment.
TSF sizing was further based on an overall downstream (outer) embankment slope of 1V:4H which is considered an environmentally stable slope to encourage indigenous vegetation growth.
The properties derived from the geotechnical site investigation and were used for stability analysis and TSF foundation design:
|
● |
Selected embankment fill material friction angle (Φ’) |
: 25 degrees. | |
|
● |
Selected embankment fill material cohesion (C’) |
: 20 KPa | |
|
● |
Selected embankment fill material unit weight |
: 1,600 kg/m³ | |
|
● |
Waste Rock friction angle (Φ’) |
: 35 degrees. | |
|
● |
Waste Rock cohesion (C’) |
: 5 KPa | |
|
● |
Waste Rock unit weight |
: 2,100 kg/m³ | |
|
● |
Foundation material (residual arkose / andesite) friction angle (Φ’) |
: 30 degrees | |
|
● |
Foundation material (residual arkose / andesite) cohesion (C’) |
: 12.5 KPa | |
|
● |
Foundation material (residual arkose / andesite) unit weight |
: 1,700 kg/m³ | |
|
● |
Bedrock friction angle (Φ) |
: 50 degrees | |
|
● |
Bedrock cohesion (C’) |
: 50 KPa | |
|
● |
Bedrock unit weight |
: 2,600 kg/m³ |
|
15.2.3 |
Tailings Physical Characterization |
A full suite of geotechnical laboratory tests including foundation indicator tests, consolidated undrained triaxial tests, slurry settling tests, volumetric shrinkage tests, dispersiveness tests, evaporation / air-drying tests were conducted on representative Isabella McCays composite and the Bubi flotation tailings samples provided by Bilboes from the on-site pilot plant. The Isabella McCays Isabella McCays composite sample was blended at the Isabella-North: Isabella-South: McCays ratio of 50%: 30%: 20% in line with the mining plan.
The following tailings physical properties were derived from the geotechnical site investigation and were used in the design of the Bilboes TSF:
|
● |
In-situ dry density of deposited tailings for capacity calculations |
: 1,35 t/m³ | |
|
● |
Flotation tailings solids concentration in slurry (by mass) |
: 40% | |
|
● |
BIOX® tailings solids concentration in slurry (by mass) |
: 20% | |
|
● |
Flotation tailings specific gravity |
: 2,70 | |
|
● |
BIOX® tailings specific gravity |
: 2,75 | |
|
● |
Flotation tailings slurry density |
: 1,337 t/m³ | |
|
● |
BIOX® tailings slurry density |
: 1,144 t/m³ | |
|
● |
Flotation and BIOX® tailings effective friction angle (Φ’) |
: 31° | |
|
● |
Flotation and BIOX® tailings cohesion (C’ (KPa) |
: 0 | |
|
● |
Flotation and BIOX® tailings unit weight (kg/m³) |
: 1,500 |
Against expectation, the Isabella McCays BIOX® tailings foundation indicator tests results showed a very fine uniformly graded material (99% passing 0.075 mm sieve).
Based on preliminary discussions with Bilboes regarding the tailings Particle Size Distribution (PSD), the design envisaged a hybrid system of TSF construction incorporating full wall containment using waste rock material during the initial stages of deposition
(up to Year 7), together with upstream wall raises using dried consolidated tailings from Year 7 onwards. However, safe upstream construction will not be achievable using such fine tailings, and as such BIOX® tailings may require full containment. The Isabella McCays BIOX® tailings PSD will therefore need further testing and confirmation during the detailed design phase.
|
15.2.4 |
Liner Selection |
Based on the XRF results for the Isabella McCays BIOX® material, the Zimbabwe Standard Specification for Hazardous Waste Management (ZWS 806:2012) prescribes the following liner system as the minimum liner required for the Bilboes BIOX® tailings:
|
● |
2 mm HDPE, |
|
● |
150 mm cement base. |
The design presented in this report is based on the following selected liner systems (Table 15‑4):
Table 15‑4: Liner System
|
Layer Description |
Flotation Tailings |
BIOX Tailings |
|||
|
|
TSF |
RWD |
TSF |
RWD | |
|
HDPE geomembrane thickness |
1.5 mm |
2 mm |
2 mm |
2 mm |
|
|
Base layers |
300 mm selected clayey material (compacted in 2x150 mm thick layers) |
300 mm compacted clay liner (compacted in 2x150 mm thick layers) |
600 mm compacted clay liner (compacted in 4x150 mm thick layers) |
600 mm compacted clay liner (compacted in 4x150 mm thick layers) |
|
|
In-situ base preparation |
Rip and re-compact 150 mm in-situ layer |
Rip and re-compact 150 mm in-situ layer |
Rip and re-compact 150 mm in-situ layer |
Rip and re-compact 150 mm in-situ layer |
|
|
For the flotation compartment, the above only applies up to 200 m into the basin. The central portion of the flotation compartment will be lined with CCL as described below: |
N/A | ||||
|
Flotation Compartment Central Portion of Basin Liner |
|||||
|
1 |
600 mm CCL |
||||
|
2 |
150 mm Base preparation |
||||
|
15.2.5 |
Seepage / Leakage Quality |
The geochemical assessment report also provides expected seepage and liner leakage water qualities following source term modelling.
The geochemical assessment indicated that the BIOX® tailings are likely to be Potentially Acid Generating (PAG) whilst the flotation tailings are non-PAG.
|
15.2.6 |
Contaminant Plume Modelling |
Using the results of the geochemical assessment and source term modelling of tailings, SLR further conducted contaminant plume modelling to determine plume extents because of seepage or leakage from the TSF and associated RWDs. The composite liner option is expected to confine plume migration to the TSF site with the plume not expected to exceed 260 m from the source over a 100-year period.
|
15.2.7 |
TSF Infrastructure |
The TSF complex development incorporates an outer containment wall, constructed in stages using approved available mine waste and developed in a downstream manner and sized to fully contain all deposited tailings up to the point when the tailings deposition rate reduces from 240 ktpm to 180 ktpm. The remainder of the facility up to the LoM will then be raised progressively with upstream wall raises using compacted tailings.
|
15.2.7.1 |
TSF Hazard Classification |
The Bilboes TSF hazard classification was conducted in accordance with both SANS 10286:1998 and ANCOLD (2012). Based on the assessment the Bilboes TSF can be classified as follows:
|
● |
A “High” hazard facility per the SANS 10286:1998 safety classification criteria, |
|
● |
A “High B” consequence category per ANCOLD (2012). |
|
15.2.8 |
TSF Operation and Monitoring |
During the life of the TSF, various elements should be monitored to ensure the integrity of the TSF complex. Monitoring elements will typically include:
|
● |
TSF engineering parameters, |
|
● |
Groundwater monitoring programme, |
|
● |
Dust monitoring programme. |
|
15.2.9 |
TSF Closure Concept |
The closure concept is envisaged to include a covering of the mine waste with a low hydraulic conductivity layer such as a clay or geosynthetic membrane. There will be on-going rehabilitation of the TSF complex through on-going vegetating of the embankment slopes.
|
15.3 |
Civil Engineering and Earthworks |
The general approach adopted was to design / measure and quantify elements, identified as major capital expenses, from the compiled infrastructure layout drawings, and to make the necessary estimation for the following items.
|
● |
Haul road (± 26 km) between Isabella and Bubi, |
|
● |
Internal mining haul roads for Isabella and Bubi, between the proposed open pit mining access and RoM handling facilities, |
|
● |
Mine access roads to the proposed mining infrastructure including road to the Plant, Administration and Village terraces, Lime stockpile terrace, Substation terrace and existing mine infrastructure, |
|
● |
Service roads to the PCD, RWD and the relocated Explosive Magazines, |
|
● |
Re-alignment of a public gravel road around the McCays extension, |
|
● |
Internal plant roads, bus drop-off and parking, |
|
● |
Raw water pipeline from the wellfields supply to the Plant Process Water Dam, |
|
● |
Return water pipelines from the TSF to Plant PCD, |
|
● |
Bulk earthworks for terraces at Isabella including the Plant, RoM tip ramp and platform, Substation, Village, Administration, Lime stockpile, Contractor’s Laydown terrace and the RoM transfer terrace at Bubi, |
|
● |
Relocation of existing Explosives Magazines at Isabella and Bubi, |
|
● |
Brake test ramp for the Contractor’s Laydown terrace, |
|
● |
Mine Village and Administration building layout, |
|
● |
Sewer reticulation and Wastewater Treatment Works for the Plant, Administration and Village, |
|
● |
Fire and Potable water reticulation for the Plant, Administration and Village, |
|
● |
Stormwater channels for the Plant, Administration and Village, |
|
● |
Process Water Dam at the Plant, |
|
● |
PDC, provided for the Plant and Administration, as well as the Contractors Laydown, |
|
● |
Process Plant including the RoM tip, Primary Crusher, Secondary Crusher, Screening building, Transfer Towers, Floatation Concentrates Thickener, Cooling Towers, Neutralization Tanks, Reactors, BIOX® Area, Flotation, Reagents Area, Gold Room, Leaching Area, Mill Structure, Tailing’s area, Conveyors, Water reticulation, Sewer reticulation, Buildings. |
|
15.4 |
Mechanical Engineering |
The mechanical design criteria cover the process plant and mining related equipment and is based on established technology and practices in the gold mining and processing industry.
Engineering aspects will be developed and optimized for clear definition of scope for the project. Mechanical equipment design shall be based on the application of established technology and practices in the gold mining and processing industry. Equipment will be designed and selected on a “fit for purpose” basis, to carry out required duties over the LoM period.
Mining and process plant equipment and infrastructure will be designed for LoM, of. approximately 15 years.
Mechanized and automated methods shall be implemented where there is a clear contribution to a safer, more productive, and less labour-intensive environment.
Total life cycle costing of equipment and processes over "LoM” shall be considered during design and equipment selection phase.
Engineering design will endeavor to address outcomes of risk assessments and HAZOP studies. Resulting designs, selected equipment and processes shall be safe for operating and maintenance by personnel and shall be eco-friendly.
Value improving initiatives will be undertaken through application of practical value engineering techniques and the philosophy of standardization and rationalization of equipment (to reduce spares holding requirements). Design to capacity and process simplification will be applied where possible.
|
15.5 |
Electrical Power Supply and Reticulation (including Communications) |
|
15.5.1 |
Interconnection to National Grid |
Power will be supplied from the Zimbabwe National Grid by constructing a 70 km 132 kV Lynx line from Shangani Substation. To feed the line, a line bay will be constructed at Shangani. A mine substation will be constructed at Isabella. The estimate received is for a 132-kV substation, equipped with a 50 MVA 132/33 kV step-down transformer.
Detailed design should be considered to reduce the secondary voltage to 11 kV to enable the MV motors to be fed directly without an additional 33 / 11 kV transformer. The 1.5 MVA required by Bubi can also be supplied at 11 kV.
Power factor correction will be done with 11 kV capacitors.
Interfaces with other designs occur at the following battery limits:
|
● |
Zimbabwe Electricity Transmission and Distribution Company (ZETDC), |
|
● |
132 kV Substation. |
The bulk electricity supply for the project is being planned to cater for a production rate of 508 tph RoM. This corresponds to an electrical load of up to 34 MVA.
|
15.5.2 |
Power Requirements |
The connected and anticipated running power demand of the mine and plant can be seen in Table 15‑5 which compares the installed and anticipated running power and lists the estimated running maximum demand.
Table 15‑5: Substation Loading
|
Installed Power (kW) |
Run Power (kW) |
Estimated Maximum Demand (kVA) |
|
|
Mills and other 11 kV motors |
22,360 |
18,836 |
19,220 |
|
Plant LV Load |
18,960 |
13,858 |
14,146 |
|
Infrastructure |
1,700 |
1,700 |
2,205 |
|
Total |
43,020 |
34,394 |
35,571 |
|
15.5.3 |
Emergency Power |
Four 2.5 MVA emergency power generator sets will be installed and connected to the 11 kV consumer substation. Emergency power is reticulated to downstream substations at 11 kV, where it is distributed to the Motor Control Centre (MCCs).
|
15.6 |
General Infrastructure |
Table 15‑6 lists the building infrastructure that was considered.
Table 15‑6: Building Infrastructure
|
Building |
Type |
Size (m2) |
|
Security and Access Control |
Prefabricated building |
170 |
|
Admin Building |
A prefabricated building. Office furniture has been included in the square meter rate. |
430 |
|
Plant Laboratory |
A prefabricated building. Typical laboratory equipment has been included in the square meter rate. |
540 |
|
Control Room |
Prefabricated building |
170 |
|
Change house/s |
Prefabricated building/s |
325 |
|
Stores |
Two conventionally constructed buildings (brick and mortar) |
220 and 100 |
|
General Workshop |
A conventional constructed building (brick and mortar) |
520 |
|
Crusher Workshop |
Conventional constructed building (brick and mortar) |
270 |
|
Electrowinning and Gold Room |
Conventional constructed building (brick and mortar) |
220 |
|
Crusher MCC |
Prefabricated building |
302 |
|
CIL MCCs |
Prefabricated buildings |
253 |
|
Floatation MCC |
Prefabricated building |
65 |
|
Substation |
Prefabricated building |
351 |
|
Return Water Dam Pumphouses |
Two conventionally constructed buildings (brick and mortar) |
38 |
|
15.7 |
Water Management Infrastructure |
|
15.7.1 |
Water Balance |
The stormwater collection dams, and the pollution control dams as proposed herein, were designed in compliance with the IFC Environmental, Health and Safety (EHS) Guidelines for Mining (2007), together with the applicable local Zimbabwean Standards.
The project site falls within the Bembezi river sub-catchment which drains north towards the Zambezi River. The Bembezi river sub-catchment form part of the Gwayi catchment which largely comprises the Northern Matabeleland area of hydrological zone A.
The stormwater management plan was developed to comply primarily with the IFC EHS Guidelines for Mining (2007); while ensuring adherence to all the applicable local Zimbabwean Standards namely: the Environmental Management Act (Chapter 20:27) implemented by the EMA of Zimbabwe; and the Zimbabwe National Water Act (Chapter 20:24) implemented by the Zimbabwe National Water Authority (ZINWA) through the Zimbabwe National Water Authority Act (Chapter 20:25). In developing the conceptual stormwater management plan, reference was also made to regulation GN 704 of the South African National Water Act, 1998 (Act No. 36 of 1998).
Daily and monthly rainfall were obtained from the ZMSD Nkayi Stations over 38 years of hydrological records (from 1980 to June 2018) and were analysed to understand the long-term monthly averages, minimum and maximum monthly rainfall. The MAP adopted for this project is 657 mm.
A site wide monthly static water balance model was developed for the Bilboes operation to establish the storage sizes of the pollution control systems; and the average wet, dry season and average monthly water balance.
The water balance simulated water re-use associated with the processing plant, as a pump rate out of the PCD for each of the two mining phases.
The steady state water balance analysis indicates that the Bilboes flotation circuit requires on average approximately 250 m3/hr (6,015.6 m3/day) during Phase 1 before decreasing to 201.3 m3/hr (4,854.0 m3/day) in Phase 2. For the steady state water balance analysis, there is no make-up water required for the BIOX® circuit in all phases of mining.
To improve the understanding of the movement and the status of the water storage and transport infrastructure elements on the mine and how these changes in response to the varying climatic conditions, a Dynamic Daily Time Step Water Balance analysis was conducted for the project.
The daily time step water balance analysis for the RWD capacity of 380,000 m³, a return water pumping rate of 490 m³/hr and a worst-case tailings deposition rate of 240 ktpm yielded only two major spillages in a 70-year period which is considered to be in line with the IFC Environmental, Health and Safety guidelines for stormwater collection dams.
|
15.7.2 |
Ground Water |
Groundwater numerical modelling was undertaken to simulate the mining operation at Bubi Isabella McCays and the related establishment of the TSF at Isabella McCays. The objective of the modelling is to determine the potential impact on the groundwater flow and groundwater quality during and post mining, for Isabella McCays and Bubi. Isabella McCays and Bubi are located 32 km apart, and therefore a separate groundwater model was developed for each site.
The cone of drawdown predicted for both mines show that after 100 years of simulation, both pits will present a residual drawdown of approximately 10 m. However, the extent of each cone of drawdown is decreasing in time and will remain within the boundaries of the mine sites.
The mass transport simulations indicate that a liner is necessary to contain the migration of the contaminant plume from the contaminant sources.
|
15.8 |
Sewage Management |
Waterborne sewage networks have been allowed at the Process plant, Admin area, Residential Village and Contractor area at Isabella McCays. All areas mentioned above will gravitate to a central sewage purification plant. The purification plant was designed and costed for 400 people @ 150 litres per person per day. The purification plant will be a vendor supply package.
|
15.9 |
Project Execution |
|
15.9.1 |
Execution Strategy |
Phase 1 of the project is to be executed initially mostly at Isabella McCays and will involve the engineering, detailed design, procurement, construction, and commissioning of a 240 ktpm gold plant and associated infrastructure.
Phase 2 of the project involves mining at Bubi and a step change in production to 180 ktpm, due to the higher mass pull expected from the different type of ore. Phase 2 will only commence later in November 2028 to suit the life of mine production schedule.
|
15.9.2 |
Engineering and Design |
It has been advocated that a short Front End Engineering Design (FEED) phase be implemented to bridge any gaps arising from the PFS and Detailed Engineering period. The FEED phase will allow detailed design scoping to be done and focus on the key requirements for procurement planning and management.
|
15.9.3 |
Construction Philosophy |
The EPCM Contractor will mobilize a Project Construction Management Team who, under the overall direction of the EPCM Project Manager, through the EPCM Construction Manager will manage and co-ordinate the activities of the appointed construction contractors.
These appointed construction contractors will perform the construction operations for the duration of the construction phase.
|
15.9.4 |
Schedule |
The schedule is used for long term planning, including cash flow. The schedule will be revised to be aligned with the latest information available before the project can be progressed from the planning phase to the execution phase.
|
16 |
MARKET STUDIES |
|
16.1 |
Historical Supply and Demand |
Gold is a precious metal refined and sold as bullion on the international market. Aside from the gold holdings of central banks, current uses include jewellery, private investment, dentistry, medicine, and technology (Figure 16‑1).
Gold is mined in many countries around the globe; China, Australia and Russia are major gold producers providing 31.5% of world gold supply with recycled gold being a significant part of global supply (Figure 16‑2). Globally jewellery is the main application sphere of this precious metal accounting for over 48% of total demand.
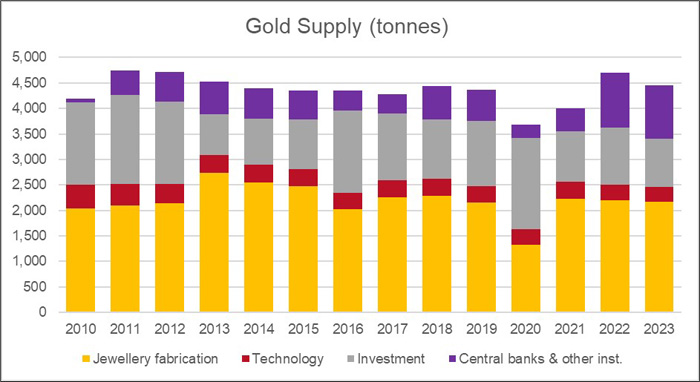
Figure 16‑1: Historical Gold Supply (2010 -2023)2
_______________________________
2 Source: World Gold Council
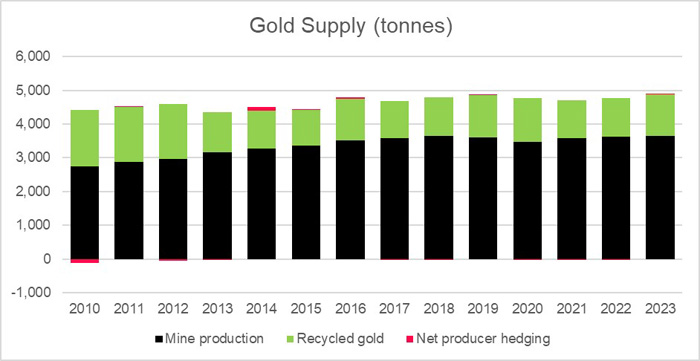
Figure 16‑2: Historical Gold Demand (2010 - 2023)3
About half of gold jewellery consumption is in India and China and these markets trends greatly influence the overall gold industry. Investment in gold is another important application sphere and its share is about 29%. Demand from national central banks has also been growing especially from banks of developing countries in Latin America, the Middle East and Asia.
The supply and demand of gold does not follow typical supply and demand logic as gold is indestructible and can easily be recycled and is stored in vaults of banks. Gold is therefore relatively liquid and subject to the vagaries of global economics. These characteristics of the gold market make it challenging to forecast the gold price.
_______________________________
3 Source: World Gold Council
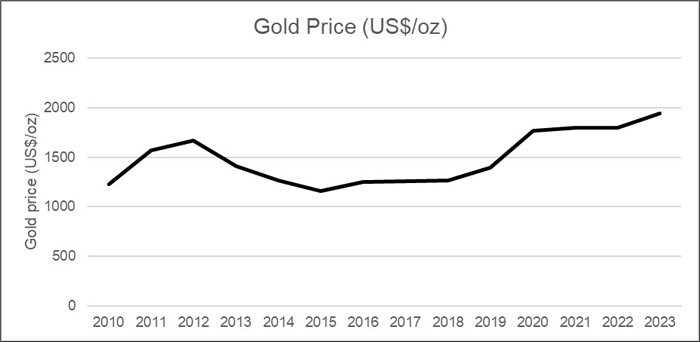
Figure 16‑3: Gold Price (2010 - 2023)4
Over the past century, gold has consistently shown as both a beacon of potential stability and a mirror reflecting global economic fluctuations. Gold's value over time is marked by significant fluctuations influenced by economic policies, global crises, and shifts in demand.
With a backdrop of financial and geopolitical uncertainties, the outlook for gold prices suggests a continued appeal of the precious metal as a so-called safe-haven asset. In recent years, gold has demonstrated resilience in the face of global economic challenges, including inflationary pressures and currency fluctuations.
Several macroeconomic factors could shape the gold projections in the future.
|
● |
Inflation: While many assume a direct correlation between inflation and gold, the relationship is complex and not as straightforward. Inflation can impact the metal, but other factors often mitigate its effects, |
|
● |
Currency Fluctuations: Gold and the US dollar share an inverse relationship. As the dollar weakens, gold often rises, becoming more attractive to investors holding other currencies, |
|
● |
Geopolitical Tensions: Conflicts and political instability historically drive investors towards gold as a so-called safe haven, potentially boosting its price during periods of heightened uncertainty. |
_______________________________
4 Source: World Gold Council
|
● |
Interest Rates: Gold's appeal can diminish with the expectation of rising interest rates, as higher yields on bonds and savings accounts compete with the non-yielding metal. |
|
16.2 |
Gold Sales in Zimbabwe |
The Gold Trade Act empowers the Minister responsible for Finance to issue a Gold Dealers License which entitles entities to export and sell gold from Zimbabwe to customers of its choice. Prior to 1 June 2021, only FGR had the Gold Dealership License and therefore all gold bullion was sold to FGR. With effect from 1 August 2021, all gold producers can directly sell any incremental production to customers of their choice using FGR’s license to export. Caledonia’s Blanket Mine is currently selling its gold to a customer of its choice but exporting the gold using FGR’s license. Sales proceeds come directly into Caledonia’s bank account. As all Bilboes’ production is considered incremental, Bilboes will be able to choose to sell its gold directly to customers of its choice or to continue selling to FGR.
Bilboes is confident that it will be able to export and sell its gold production on similar terms as those obtaining from FGR. Fidelity has two payment terms for its customers that gold producers may choose from as per the terms and conditions below:
|
16.2.1 |
Category A - Outright Purchase |
Payment within two days of lodgement of the gold using a spot price based on the London Bullion Market Association (LBMA) price discounted by 2.5%.
The applicable price is the day’s afternoon fix on the date of lodgement at Fidelity.
Melting and assaying charges of US$21 /kg gross bullion weight applies.
The applicable Government royalty is deducted from proceeds due to the customer.
|
16.2.2 |
Category B - Part Payment and Final Payment after a week |
|
● |
Fidelity will pay 85% of the value within two days of lodgment at Fidelity as initial payment, |
|
● |
The LBMA price will be discounted by 1.25%, |
|
● |
Final payment will be made after a week, |
|
● |
Lodgments must be made by Tuesday 12:00 noon, |
|
● |
Any deposit lodged after Tuesday cut-off shall be treated like a deposit for the following Tuesday, i.e., initial payment will be made the following Tuesday, |
|
● |
Melting and assaying charges of US$21/kg gross bullion weight apply, |
|
● |
The applicable Government royalty is deducted from final payment due to the customer. |
Bilboes is confident that it will be able to export and sell its gold production on similar terms as those obtaining from FGR.
|
16.3 |
Gold Price Predictions |
A summary of the predicted gold prices for 2024 are presented in Table 16‑1
Table 16‑1: Predicted Gold Price
|
Analyst/Firm |
2024 Gold Price Prediction |
|
Bank of America |
US$ 2,400/oz by end of 2024 |
|
UBS Bank |
US$ 2,200/oz by end of 2024 |
|
Goldman Sachs |
US$ 2,133/oz by end of 2024 |
|
World Bank |
US$ 1,900/oz by end of 2024 |
|
Citibank |
US$ 2,400/oz by end of 2024 |
|
ING |
US$ 2,100/oz by end of 2024 |
|
Wells Fargo |
US$ 2,100 – 2,200/oz by end of 2024 |
|
Ronald Stoeferle, Incrementum AG |
US$ 2,500/oz by end of 2024 |
|
Zach Scheidt, Rich Retirement Letter |
US$ 3,000/oz by end of 2024 |
Source: 2024 Gold Price Prediction, Trends, & 5-Year Forecast (goldsilver.com)
|
17 |
ENVIRONMENTAL STUDIES, PERMITTING, AND PLANS, NEGOTIATIONS, OR AGREEMENTS WITH LOCAL INDIVIDUALS OR GROUPS |
|
17.1 |
Environmental Issues |
The natural environment within the project site has been significantly transformed by existing mining operations. The surrounding environment is more natural with disturbances from communities and subsistence farming activities. Other mining operations do occur in the region, however over time several mines in the area have been closed. The EIA (SLR, 2019) identified a number of potential environmental impacts are shown in Table 17‑1.
Table 17‑1: Potential Environmental Impacts
|
Potential Environmental Impacts |
Mitigation |
Significance after mitigation |
|
Potential loss of soil and related grazing land capability within the proposed project footprint |
Soil can be conserved and reused during rehabilitation |
Low |
|
Potential contamination of soils, surface water and/or groundwater features |
Design of potentially contaminating facilities and managing the storage and handling of polluting substances and related clean-up of spills reduces the Intensity of these potential impacts |
Medium to High |
|
Alternation of drainage patterns and related downstream functionality of aquatic habitat due to encroachment of the Bubi open pit into the non-perennial Bubi River |
The Bubi River will be diverted to ensure that that the Hydraulic connectivity of the river is retained, and pollution, sedimentation and erosion impacts are generally avoided. |
Medium |
|
Potential contamination of surface and groundwater resources from various operational activities and contamination from the new TSF and WRDs |
Implementation of industry-aligned surface water management measures and a composite lining for the floatation compartment and full HDPE liner for the BIOX® compartment of TSF |
Surface water = Medium Groundwater = High |
|
Lowering of groundwater levels potentially affecting third party water supply should third party boreholes be located within the dewatering cone of depression |
Any third-party water sources that have a proven decrease in yield or dry up because of the proposed operations would be compensated with an alternative water supply of equivalent quality and quantity |
Medium |
|
Potential reduction in ambient air quality due to particulate emissions |
Implementation of an air quality and dust management plan during the implementation and operation of the proposed project lowers the intensity, and probability of such impacts occurring |
Medium (operational phase) to Very Low (construction and decommissioning phases) |
|
Elevation in ambient noise levels creating a potential disturbance to nearby receptors. |
Incorporating mitigation into the site design, as well as adopting sound management practices (e.g., maintaining machinery and equipment in good working order). |
Medium (operational phase) to Low (construction and decommissioning phases) |
|
Visual disturbance to nearby local communities |
Undertaking rehabilitation throughout the course of the proposed operations, |
Low |
|
Physical destruction and general disturbance of terrestrial and/or aquatic biodiversity |
By ensuring that the project footprint for planned clearing and infrastructure establishment is clearly demarcated and all areas of increased ecological sensitivity, outside of the mining footprint are designated as No-Go areas would limit the associated significance of these impacts |
Medium |
The EIA (SLR, 2019) concluded that the proposed project presents several potential positive and negative impacts associated with the unmitigated scenario. With mitigation (in the residual impact scenario) some of the identified potential impacts can be prevented and the remainder can be managed and mitigated to remain within acceptable environmental limits so long as the mitigation set out in the ESMP is implemented and Bilboes develops, implements, and annually reviews the ESSMS. Positive impacts can be enhanced by developing and implementing a Community Development Plan as set out in the ESMP.
Bilboes is committed to implementing the mitigation measures within the ESMP together with the ESSMS which will be implemented as part of Bilboes’ on-going efforts of continuous environmental improvement. The management system will contain plans and procedures to help manage environmental aspects and impacts and help ensure legal compliance.
|
17.2 |
Waste, Tailings, Monitoring and Water Management |
|
17.2.1 |
Tailings Management and Disposal |
Gold recovery at Bilboes would entail a two-stage process that would result in the generation of two different tailings streams - Flotation and BIOX® tailings. The TSF would be developed with two separate compartments to accommodate each tailings stream.
The proposed liner system for each comportment would incorporate (from top down):
|
● |
Floatation Compartment – A 1.5 mm HDPE geomembrane, a base layer of 300 mm selected clayey material (compacted in 2 x 150 mm thick layers), |
|
● |
BIOX® Compartment – A 2 mm HDPE geomembrane, a base layer of 600 mm selected compacted clay liner (compacted in 4 x 150 mm thick layers), |
|
● |
Both compartments would have a ripped and re-compacted 150 mm in-situ base layer, |
|
● |
The TSF would incorporate a filter drainage system comprising an 8.5 m wide, 500 mm deep toe drain located immediately adjacent to the upstream toe of the starter wall for the Floatation compartment and a 7.5 m wide, 500 mm deep toe drain located immediately adjacent to the upstream toe of the starter wall for the BIOX® compartment, |
Both compartments would have a reticulation of above-liner finger drains consisting of a configuration of 160 mm and 110 mm diameter slotted seepage collector pipes in the basin discharging to the solution trench independently of the toe drains to allow monitoring. The proposed decant systems consist of temporary intake structures (designated FT) and permanent intakes (designated FP). The intake structures have both top and side inlets.
There would be on-going rehabilitation of tailings through the application of the rising green wall. The TSF design slopes adopted (1V:4H) are considered environmentally stable to allow for indigenous vegetation growth with minimal ongoing maintenance. To assist with the vegetation establishment, the vegetation will be manually planted and irrigated during the initial stages. A cover involving topsoil and subsoil (in combination with the rocky waste rock material placed during construction protruding) will be progressively placed onto the side slopes of the TSF as the same is developed. These protrusions are advantageous as they mimic natural slopes and dissipate the kinetic energy of rain drops as they strike the surface.
The tops surface will be covered with topsoil mixed into tailings. The top surface will then be paddocked into smaller catchments to reduce water flow lengths.
The Bilboes TSF is classified as a Medium Hazard to High Hazard facility due to the number of residents in zone of influence estimated to be between 8 and 16 (determined in accordance within terms of the South African Code of Practice for Mine Residue Deposits (SABS 0286:1998) and the requirements of Mineral Regulation 527 of 23 April 2004). The classification considered the two compartments as one facility.
|
17.2.2 |
Waste Rock Management and Disposal |
The planned WRD construction method would entail the following:
|
● |
A nominal wall of waste material would initially be constructed to confine the extent of the dumping area within the planned WRD footprint. |
|
● |
Waste material will be delivered to WRD by truck and tipped from the leading edge of the WRD towards the inside of the WRD footprint. The waste will then be spread and shaped as necessary by earthmoving equipment. |
|
● |
The WRD would then be developed in successive lifts of up to 10 m in height, with each lift being completed before commencement of the subsequent lift. |
The WRD will be constructed at an angle of repose slopes of approximately 35°.
In principle, the WRD lift heights shall be limited to 10 m with a minimum of a 10 m berm, with an overall height of 40 m. Seepage from the toe of the WRD, as well as runoff from the slopes, would be controlled by the construction of an outer containment wall. The containment wall will be the boundary between the clean and potentially contaminated water systems for the purposes of stormwater management.
Some compaction of the waste is expected to take place during placement as trucks pass repeatedly over previously placed material on their way to and from the advancing faces of the WRDs. While compaction of wastes is desirable to maximize density and storage capacity, it is not a requirement for structural stability. Compaction will assist in reducing differential settlements with time, which will assist in ensuring the longer-term integrity of surface water management measures.
|
17.2.3 |
Non-Mineralized Waste Management |
Non-mineralized waste (including general industrial waste, medical clinic waste, hazardous industrial and domestic waste) would be temporarily handled and stored on site before being removed for recycling by suppliers, reuse by scrap dealers or final disposal at the existing waste disposal area located at Isabella. Bilboes has a designated burning site for all waste materials associated with cyanide packaging and hazardous waste on the heap leach pad where all leachate goes into the heap leach cyanide circulation stream as recommended by the cyanide suppliers. An internal waste management procedure will be developed for waste generated by the project.
With respect to sewage, it is proposed that the existing sewage treatment facility located at Isabella would handle the sewage generated. It is proposed that a sewage treatment plant would be established at Bubi.
|
17.2.4 |
Site Environmental Monitoring |
The proposed monitoring programme is detailed in the ESMP for the proposed project. The aspects for which monitoring is proposed includes:
|
● |
Annual monitoring (physical observation) for erosion, as well as slope / TSF failure, |
|
● |
Monthly surface and groundwater monitoring (of parameters including water quality, volumes, levels, spillages, and management infrastructure), |
|
● |
Monthly updating of the site-wide water balance (including biennial updates of the water balance model), |
|
● |
Air and noise monitoring to establish baseline constituent concentrations / ambient noise levels, as well as regular monitoring during construction and operations, as applicable. |
Requirements for post-closure monitoring to determine whether the mitigation and rehabilitation measures are effective would be incorporated into a final Closure Plan to be compiled for the operations prior to the commencement of decommissioning.
|
17.3 |
Water Management |
There is evidence that the Bembezi, Mdutshane and Bubi Rivers have been impacted open by various anthropogenic activities in the broader area. Furthermore, the planned widening of the open pits at Bubi would encroach directly on the Bubi River and the tributary located within Bubi claims area. This would have a material impact on this feature and may have an impact on downstream water users. It is thus recommended that the Bubi River be diverted around the proposed expansion of the southern open pit to:
|
● |
ensure that the hydraulic connectivity of the river is retained, and that pollution, sedimentation and erosion impacts are avoided; |
|
● |
limit the risk of flooding the southern open pit during a high flow event in the Bubi River. |
|
● |
The measures to be implemented by Bilboes to address potential adverse water quality effects and to ensure that the planned infrastructure is constructed, operated, and maintained to comply with the provisions of the IFC guidelines, include: |
|
● |
Separating clean water systems from dirty water systems, |
|
● |
Minimizing the size of dirty areas and divert clean run-off and rainfall water around dirty areas and back into its normal flow in the environment, |
|
● |
Locating all activities and infrastructure outside of the specified zones and/or flood lines of watercourses, as far as possible. Where this is not possible, the affected area should be remediated / rehabilitated to restore the original ecological function post-closure, |
|
● |
Maintaining specified zones around surface water features in instances where flood lines are unknown or un-surveyed, |
Incorporating suitable erosion protection measures at all discharge points, should any discharge be required. Furthermore, all discharges from the mine into the environment will comply with the IFC Effluent discharge standards.
|
17.4 |
Project Permitting |
An approved EIA is required in terms of the Environmental Management Act (Chapter 20:27) No. 13 of 2002 and the Mines and Minerals Act (Chapter 21:05) of 1996. The ESIA was undertaken for the project to satisfy the requirement and an ESIA Report was completed for submission to EMA within the first quarter of 2020. Thereafter, SLR held a public feedback meeting to disclose the findings of the ESIA Report to the identified stakeholders. A record of this disclosure process was compiled and submitted to EMA. An Environmental Impact Assessment (EIA) certificate was issued to Bilboes for the project in February 2021 and was valid for 2 years to February 2023. The EIA certificate is renewable on an annual basis subject to conditions which include project update reports, compliance to Environmental Management Plans (EMP) outlined in the ESIA Report and notification to EMA for any changes in the project likely to alter the project as stipulated in the ESIA Report. The current EIA certificate is valid until March 2025 and the renewal process will continue annually for the duration of the operations.
Other project related licenses / permits currently in use include explosives (purchase and storage), firearms, medicines control, public health (medical examination), water abstract and hazardous substances (importation, transportation, storage and use), solid waste disposal which are renewed quarterly or annually when become due. The conditions of renewal are limited to payment of applicable fees to the relevant statutory bodies. A total of $70,000 is required to cover all the license fees and permits on an annual basis.
|
17.5 |
Social and Community Related Requirements and Plans |
An ESMP has been developed which contains the environmental, social and safety management and monitoring commitments that Bilboes will implement to manage the negative impacts and enhance the positive impacts identified in the EIA.
To mitigate against the loss of, or reduced access to, land for livelihood activities, a LRP will be compiled and implemented prior to the commencement of construction.
As part of the existing operations Bilboes have undertaken several CSR programmes. These include the supply of various community boreholes at communities and local schools, building and repairs of school blocks, the repair of various local roads, excavation and scooping of dams and provision of various other services including access to health facilities at the mines and transport in cases of emergency.
To address potential issues related to employment, Bilboes will develop a fair and transparent labour, working conditions and recruitment policy. The policy will comply with local law, IFC Performance Standard 2: Labor and Working Conditions, and International Labor Organization (ILO) conventions.
To optimize local small business development, a local procurement policy will be developed and implemented and communicated to all local stakeholders.
The Stakeholder Engagement Plan developed for the project will be maintained and updated to provide a formal procedure for communications with the regulatory authorities and communities.
|
17.6 |
Social / Community Issues |
Based on the EIA undertaken for the proposed project, social or community impacts that were identified and assessed include the following:
|
● |
Positive economic impact because of the direct construction and operational project expenditure, direct and indirect business opportunities. Significance after mitigation = Very High Positive, |
|
● |
Potential reduction of access to land for livelihood activities (e.g., cattle ranching and subsistence agriculture) undertaken within the mine claims area. A key recommendation to ensure that these land users are appropriately identified, engaged, and compensated. Significance after mitigation = Medium, |
|
● |
Inward migration due to the expectation of employment. Bilboes should aim to source most employees from the surrounding local communities, as far as possible. Significance after mitigation = High to Medium, |
|
● |
Various health and safety risks for third parties are associated with the proposed project. While the likelihood of incidents is deemed to be low (with mitigation) any injuries or fatalities of third parties would be of high intensity. Significance after mitigation = Medium, |
|
● |
No cultural-heritage Resources were found to be located within the proposed project footprint. Significance after mitigation = Very Low. |
|
17.7 |
Mine Closure |
A conceptual closure plan and LoM closure liability estimate, based on the environmental, social, and economic risks identified in the EIA, is included in the EIA. Furthermore, the closure issues and concerns raised by stakeholders were also incorporated, where applicable.
Generally accepted “good international practice” mine closure methods were used as the basis for the conceptual closure plan, as well as, for determining the unit rates for the various closure components used in the LoM liability calculation. The mine closure methods also conform to the statutory requirements of Zimbabwe EMA who are the regulatory body.
Mine closure planning is a dynamic process that is integrated with LoM planning to ensure a seamless transition from the operational to the decommissioning phases in the mine life cycle. The environmental objective for closure is to minimize the impacts associated with the decommissioning and closure of the mine and to achieve post closure land use as outlined below.
The conceptual closure plan objectives include the following:
|
● |
Environmental damage is minimized to the extent that it is acceptable to all parties involved. |
|
● |
The land is rehabilitated to achieve a condition approximating its natural state (as far as practicable), or so that the envisaged post closure land use/land capability is achieved. |
|
● |
Some of the smaller open pits shall be completely backfilled with material from the overburden/WRDs. Inert building rubble from the decommissioning activities can also be buried in the pit voids. The remaining open pits would not be backfilled and remain open. The pit side-walls and end-walls will only be ‘made safe. |
|
● |
All surface infrastructure, excluding the TSF and any other surface infrastructure that will support the envisaged post-closure end use, will be removed from site after rehabilitation. |
|
● |
Contamination beyond the mine site by wind, surface run-off or groundwater movement will be prevented through appropriate erosion resistant covers, containment facilities (i.e., stormwater ponds) and drainage controls. |
|
● |
Mine closure is achieved efficiently, cost effectively and in compliance with the law. |
|
● |
The social and economic impacts resulting from mine closure are managed in such a way that negative socio-economic impacts are minimized. |
|
● |
Based on the above, the closure outcomes for the mine site are assumed to be as follows: |
|
● |
To achieve chemical, physical, and biological stability for an indefinite, extended time period over all disturbed landscapes and residual mining infrastructure |
|
● |
To protect surrounding surface water, groundwater, soils, and other natural resources from loss of utility value or environmental functioning |
|
● |
To limit the rate of emissions to the atmosphere of particulate matter and salts to the extent that degradation of the surrounding properties’ land value and land capability does not occur. |
|
● |
To create a final land use that has economic, environmental, and social benefits for future generations that outweigh the long-term aftercare costs associated with the facility. |
|
● |
These broad closure objectives and outcomes will be continually refined as operations continue. |
|
17.8 |
Estimated Environmental Costs for Closure |
The quantities used in the closure liability calculations were derived from the layout plans and general arrangements for the project; the project infrastructure details within the feasibility study report; and the proposed mining and deposition schedule. The closure liability calculation has been determined for the LoM (end of year 10) and is calculated to be US$ 32m (excl. VAT) (2023). The closure liability calculations will be regularly reviewed and updated during the project up and until the commencement of closure activities (i.e., final closure plan). On-going environmental rehabilitation is based on a unit rate of US$0.25 / t ore.
|
17.9 |
QP Commentary |
The QP is of the opinion that the current plans to address issues related to environmental compliance, permitting and local individuals and groups are adequate.
|
18 |
CAPITAL AND OPERATING COSTS |
|
18.1.1 |
Estimate Scope |
The basis of the CCE covers the process plant, associated infrastructure, and indirect costs for the 240 ktpm and 180 ktpm phased Bilboes PFS for which DRA developed the estimate.
The CCE for the process plant and associated infrastructure was prepared by DRA based on the Process Flow Diagram (PFD’s), Mechanical Equipment List (MEL), GA drawings and layout drawings. These drawings were developed per process plant area.
Phases 1 and 2
|
● |
Phase 1: 240 ktpm milled ore originating from the Isabella McCays (ISBM) mining area |
|
● |
Phase 2: 180 ktpm milled ore originating from the Bubi mining area |
The base date for the CCE is December 2023.
|
18.1.2 |
Exchange Rates |
The cost estimates outlined in this section of the report are denoted in US dollars ($). In cases where relevant, specific costs have been initially expressed in local currency and subsequently converted to US dollars for consistency. The following static exchange rates have been applied and shown in Table 18‑1 below. The rates correspond to the base date of the estimate and have been agreed with by the Bilboes owners' team.
Table 18‑1: Exchange Rates
|
Exchange |
Rate |
|
US$:ZAR |
18.74 |
|
US$:AUD |
1.50 |
|
US$:EUR |
0.92 |
|
US$:CNY |
7.24 |
|
US$:GBP |
0.79 |
|
US$:CAD |
1.32 |
|
US$:JPY |
144.57 |
|
18.1.3 |
Project Specific Estimate Development Methodology |
|
18.1.3.1 |
Mining Contractor |
The basis of the Bilboes PFS mining cost estimate was that all mining will be done by an experienced mining contractor. The pricing was based on a mining bill of quantities that was derived from the PFS production schedule. The dump locations/RoM tip location and haul distances for all material types was provided on a monthly and annual basis. This methodology ensures that all budget pricing receive is of a high accuracy level in real terms.
|
18.1.3.2 |
Bulk Earthworks and Infrastructure |
The earthworks and infrastructure Bill of Quantities (BoQs) produced by DRA for the 2019 FS were used and sent into the market for revalidation by the contractors. Initial preliminary BoQ was prepared and issued into the market for cost estimation purposes and to obtain relevant fixed and firm rates. The initial budget was based on the known scope of works and the best estimate was done on quantities based on experience from previous DRA projects. Basic engineering was completed for major cost contributors. Major earthworks cost contributors were modelled to obtain required quantities. The preliminary priced BoQ’s were then adjudicated, and a contractor was recommended. The recommended contractor’s rates were incorporated into the final measured BoQ.
Once the layout drawings and engineering were completed, the QS updated quantities in preliminary BoQ’s.
DRA Infrastructure quantified the Bulk Earthworks and General Infrastructure Services for all areas from layout drawings.
Preliminary and General (P&G’s) have been taken as 16% of the total supply and installation cost, in line with the P&G value quoted from the chosen Earthworks, Mining and Civils contractor.
|
18.1.4 |
Infrastructure Services |
The following infrastructure services were included in the costing: - Stormwater, Sewage, Potable and RAW Water Reticulation and Fire Water.
|
18.1.5 |
Infrastructure Building Works |
The infrastructure buildings BoQs were sent into the market for revalidation by the contractors. Architectural layouts for selected buildings and structures were developed. Building P&Gs of 31% have been used for the capital estimate for the total supply and installation cost, in accordance with the P&G value quoted from the chosen building works scope.
|
18.1.6 |
Mechanical Equipment |
From the MEL and PFD’s, DRA issued enquiries for all mechanical equipment to vendors for costing. Where necessary the mechanical equipment was revalidated using the adjudicated quotes.
The erection cost for the mechanical equipment was based on rates received from the steelwork and platework fabrication/erection contractor.
The mechanical P&Gs were applied at 74% of the erection component only, in line with the P&G value quoted by SMP contractors.
| 18.1.7 |
EPCM and External Services |
The EPCM costs has been escalated to base date December 2023. The EPCM costs cover the project management, detailed engineering, procurement, and construction management costs directly associated with the implementation of the project.
|
18.1.8 |
Process Plant and Infrastructure Capital Costs |
The process plant capital cost included: Ore Receiving and Crushing, Milling, Classification and Thickening, Flotation, BIOX®, CIL, Carbon Treatment, Gold Room, Tailings Handling and Cyanide Detoxification, Reagents, Process Plant Water Services and Reticulation, Process Plant Utility Services, E, C & I Plant, Plant Services, Fire Protection and Detection, Potable Water and Treatment, Sewage Treatment, Storm Water Management, Fencing, Pipe and Cable Racks, Plant Buildings and Workshops, Plant Management Offices Facility, Security, Change house, Crib Room Facility, Security, Control Room, Metallurgical Lab Facility, Mechanical Workshop, Plant Electrical Structures, Overhead Line, MV Substation, MCCs (Motor Control Centers), General Earthworks, Roads and Terraces, Buildings, Flotation TSF, BIOX TSF, Crossings, Temporary Facilities, Project Fleet, EPCM Contractor, First Fill and Commissioning, Spares and General Administration Costs.
|
18.1.9 |
Capital Estimate Summary |
A summary of the Capital cost is presented in Table 18‑2 with a breakdown per phase being presented in Table 18‑3.
Table 18‑2: Capital Summary by Discipline
|
Description |
Million US$ |
|
Open Pit Mining |
32.03 |
|
Earthworks |
37.53 |
|
Tailing Storage Facility |
75.25 |
|
Civils & Infrastructure |
14.70 |
|
Building Works |
5.93 |
|
Steelwork |
19.56 |
|
Platework |
11.82 |
|
Mechanicals |
78.43 |
|
Turnkey Packages |
- |
| Description | Million US$ |
|
EC&I |
35.39 |
|
Piping & Valves |
19.43 |
|
Transport |
8.73 |
|
Project Services, EPCM & Consultants |
22.68 |
|
Construction Services |
0.54 |
|
Consumables And Spares |
8.90 |
|
Owners Cost |
8.88 |
|
Project Contingency |
34.23 |
|
Client Contingency |
- |
|
Escalation |
- |
|
Total |
414.03 |
Table 18‑3: Capital Summaries per Project Phase
|
Description |
Grand Total |
Sub Total Phase 1 (Million US$) |
Sub Total Phase 2 (Million US$) |
|
(Million US$) |
|||
|
Mining |
32.03 |
32.03 |
- |
|
Process |
170.02 |
146.90 |
23.12 |
|
Infrastructure, Utilities and Ancillaries |
132.55 |
110.76 |
21.79 |
|
Indirect Cost |
45.18 |
42.98 |
2.20 |
|
Contingency |
34.23 |
29.83 |
4.40 |
|
Total Project Costs |
414.03 |
362.50 |
51.51 |
|
18.1.10 |
Exclusions and Assumptions |
|
18.1.10.1 |
Exclusions |
The following are items which are not included in the CCE: escalation beyond capex base date, forex variation allowances, forward cover for any foreign content , environmental permitting activities, hydrological / water supply related costs, costs of socio-economic development, costs for skills development, costs for enterprise and supplier development, costs for financial modelling and evaluation, cost of financing, sunk costs, legal costs, all Value Added Tax (VAT), import duties, surcharges and any other statutory taxation, levies, or government duties, acquisition costs including mineral rights and the purchase or use of land, all royalties, commissions, lease payments, rentals and other payments to landowners, title holders, mineral rights holders, surface right holders, and/or any other third parties and any provision for project risks outside of those related to design and estimating confidence levels.
|
18.1.10.2 |
Assumptions |
The following assumptions have been made in the preparation of this estimate:
|
● |
The project would proceed on an EPCM basis. |
|
● |
The project would generally be implemented as per the execution program. |
|
● |
All material and equipment will be purchased from recognized vendors. |
|
● |
The EPCM would be granted a site office location near to the works. |
|
18.1.11 |
Risks and Opportunities to Capital Estimate |
|
18.1.11.1 |
Foreign Exchange |
Changes in the costing can be expected due to the volatility of the local currency.
|
18.1.12 |
Contingencies |
Project Contingency has been allowed for estimating inaccuracy, because of the limited detail engineering conducted in the PFS (level of engineering approximately to 15%). These confidence levels were then factored to reflect as a percentage of the individual cost categories, from which an overall estimating contingency was derived.
|
18.2 |
Operating Cost Estimate |
|
18.2.1 |
Mining Operating Cost |
|
18.2.1.1 |
Basis of Cost Estimate |
The operating cost estimate has been completed from a zero base and presented in US$. Costs associated with labour, materials and consumables were included in this estimate.
|
18.2.1.2 |
Operating Cost Summary |
The basis of the mining cost estimate was that all mining will be done by an experienced mining contractor. The pricing was based on a mining BoQ that was derived from the PFS production schedule. The dump locations/RoM tip location and haul distances for all material types was provided on a monthly and annual basis. This methodology ensures that all budget pricing receive is of a high accuracy level in real terms.
The average mining contractor based on pricing received for life of mine for Bilboes is US$3.01/t including the ore transport cost from all mining areas to the Bilboes process plant near Isabella North. The cost per area is shown in Table 18‑4.
Table 18‑4: Mining Contractor Costs per Area (US$/total tonne)
|
Area |
Cost per Total Tonne Mined (Ore and Waste) (US$) |
|
Contractor G & A |
0.34 |
|
Drill and Blast |
0.44 |
|
Load and Haul Incl. Rehandle & Services |
2.23 |
|
Total |
3.01 |
|
Diesel Cost |
$1.52 (October 2023) |
|
18.2.2 |
Process Plant Operating Cost |
The operating cost estimate was completed from a zero base. All labour, energy costs, materials and consumables have been included in this estimate. The bulk of the inputs were generated by DRA based on outcomes from mass balance results, equipment sizing and budget quotations for the supply of reagents from typical suppliers within the region. Labor rates were supplied by the Bilboes owners’ team with the compliment developed to support the plant operation. Engineering maintenance costs are based on a % applied to direct costs and can be treated as an annual allowance. All costs presented below are for steady state throughput.
|
18.2.3 |
Reagent Consumption and Supply Rates |
Table 18‑5 presented below provides a summary of the expected reagent and consumable consumptions for Isabella McCay’s and Bubi ore, based on results obtained from test work, vendor specifications, benchmark data and mass balances.
Table 18‑5: Reagent Cost and Consumption for Isabella McCay’s and Bubi
|
Description |
Consumption Rate, kg/t ore |
Supply Cost, US$/t RoM |
Supplier Name |
|
Isabella McKay’s |
|||
|
Collector (SEX) |
0.150 |
3,125 |
BetaChem (SA) |
|
Modifier (CuSO4) |
0.100 |
3,170 |
BetaChem (SA) |
|
Frother (DOW) |
0.045 |
3,063 |
BetaChem (SA) |
|
Depressant (Na2SO3) |
0.350 |
500 |
BetaChem (SA) |
|
Depressant (Starch) |
0.110 |
1,825 |
BetaChem (SA) |
|
Sulfuric acid (H2SO4) |
1.050 |
575 |
Curechem (Local) |
|
Limestone |
2.183 |
65 |
PPC Zim |
|
Lime |
3.074 |
330 |
PPC Zim |
|
Nutrient |
0.430 |
423 |
- |
|
Anti-scalant |
0.002 |
3,810 |
- |
|
Corrosion inhibitor |
0.002 |
3,542 |
- |
| Description | Consumption Rate, kg/t ore | Supply Cost, US$/t RoM | Supplier Name |
|
Biocide |
0.002 |
4,500 |
- |
|
Defoamer - BIOX |
0.001 |
5,940 |
- |
|
Defoamer - CIL |
0.005 |
5,940 |
- |
|
Flocculant |
0.017 |
4,000 |
- |
|
Cyanide |
1.000 |
3,030 |
Curechem (Local) |
|
Carbon |
0.001 |
3,540 |
Acol chemicals (Local) |
|
Hydrochloric acid |
0.025 |
770 |
Curechem (Local) |
|
Caustic soda (NaOH) |
0.065 |
1,050 |
Curechem (Local) |
|
SMBS |
0.250 |
860 |
Acol chemicals (Local) |
|
Copper sulphate (CuSO4) |
0.005 |
3,167 |
Acol chemicals (Local) |
|
Bubi |
|||
|
Collector (SEX) |
0.150 |
3,125 |
BetaChem (SA) |
|
Modifier (CuSO4) |
0.100 |
3,170 |
BetaChem (SA) |
|
Frother (DOW) |
0.045 |
3.063 |
BetaChem (SA) |
|
Depressant (Na2SO3) |
0.350 |
500 |
BetaChem (SA) |
|
Depressant (Starch) |
0.110 |
1,825 |
BetaChem (SA) |
|
Limestone |
45.708 |
65 |
PPC Zim |
|
Lime |
7.831 |
330 |
PPC Zim |
|
Nutrient |
0.860 |
423 |
- |
|
Anti-scalant |
0.003 |
3,810 |
- |
|
Corrosion inhibitor |
0.003 |
3,542 |
- |
|
Biocide |
0.003 |
5,727 |
- |
|
Defoamer - BIOX |
0.001 |
5,940 |
- |
|
Defoamer - CIL |
0.020 |
5,940 |
- |
|
Flocculant |
0.030 |
4,000 |
- |
|
Cyanide |
2.000 |
3,030 |
Curechem (Local) |
|
Carbon |
0.012 |
3,540 |
Acol chemicals (Local) |
|
Hydrochloric acid |
0.050 |
770 |
Curechem (Local) |
|
Caustic soda (NaOH) |
0.130 |
1,050 |
Curechem (Local) |
|
SMBS |
0.500 |
860 |
Acol chemicals (Local) |
|
Copper sulphate (CuSO4) |
0.100 |
3,167 |
Acol chemicals (Local) |
|
18.2.4 |
Power |
The estimated average running load has been calculated using expected power draw from the equipment. Plant power has been based on grid supply at a unit rate of 0.10 US$/kWh. A summary is shown in Table 18‑6.
Table 18‑6: Process Plant OPEX – Power
|
Description |
Unit |
Value |
Source |
|
Power Supply Cost |
US$/kWh |
0.10 |
Bilboes Owners Team |
|
Power Draw: Isabella McCay’s |
kWh/t RoM |
66 |
Calculated |
|
Power Draw: Bubi |
kWh/t RoM |
114 |
Calculated |
|
18.2.5 |
Maintenance |
An annual maintenance allowance has been included and is based on a percentage of mechanical equipment, platework, steelwork, ECI, piping and valve capital costs. An allowance equivalent to 5% has been included in the cost estimate.
|
18.2.6 |
Labor |
Labor rates have been supplied by the Bilboes owners’ team. The complement has been reviewed between DRA, Bilboes and Metso Outotec covering the main process plant and BIOX for each scenario.
|
18.2.7 |
Laboratory |
Costs associated with the laboratory covering labour, consumables, and sample analysis have been considered. An estimated cost of 0.177 US$/t RoM was used for the various scenarios.
|
18.2.8 |
TSP Deposition and Operation |
SLR have conducted a concept level revalidation costing exercise for the tailing storage facility covering both the flotation and BIOX tailings storage. A unit operational cost of US$ 0.30/t flotation tails and US$ 0.49/t BIOX tails has been estimated and used in the cost estimate.
|
18.2.9 |
Operating Cost Estimate Summary |
Table 18‑7 provides an approximate breakdown of operating costs per major section of the proposed Bilboes plant and phase of the project.
Table 18‑7: Process Plant OPEX
|
|
|
Phase 1: |
Phase 2: |
|
Description |
Unit |
240 ktpm IM | 180 ktpm Bubi |
|
Overview |
|||
|
RoM |
t/a |
2,880,000 |
2,160,000 |
|
Total variable |
US$ m/a |
37.93 |
53.33 |
|
Total fixed |
US$ m/a |
12.38 |
17.27 |
|
Total |
US$ m/a |
50.31 |
70.60 |
|
Unit cost |
US$/t ore |
17.47 |
32.69 |
|
19 |
ECONOMIC ANALYSIS |
|
19.1 |
Introduction |
The potential economic viability and performance of the Bilboes study has been determined through developing a financial model founded on the results derived from the study and information provided by the Bilboes owner's team.
The results tabled in this section have been based on forward looking statements, including (but not limited to) the feed profiles, grade profiles, gold recoveries, capital and operating cost requirements and gold pricing profiles.
|
19.2 |
Method |
The economic analysis for this option has been conducted using Discounted Cash Flow (DCF) methodologies. The analysis has been based on earnings after taxation modelled in constant terms and does not consider the effects of inflation, interest, escalation, and other financial charges. The economic model has been populated on a 100% equity basis and does not consider alternative financing scenarios. Financing related costs such as interest expense, withholding taxes on dividends and interest income, are excluded from the economic model. Additional exclusions pertaining to capital and operating costs can be sourced from the relevant report chapter detailing these sections.
The interpretation of the taxation and the associated legislation relevant to Zimbabwe has been based on information available in the public domain as well as guidance received from the Bilboes team. DRA does not provide expert advice on taxation matters. VAT refunds and exemptions have not been considered in the economic model. Any other tax or levy, not explicitly defined, has not been considered in the model. The tax model used should be regarded as indicative but is deemed to be suitable for this level of study.
Cash flows considered in the cash flow model include annual revenue, operating costs, initial capital expenditure, Stay in Business (SIB) capital allowance, capital contingency, environmental rehabilitation capital allowance, royalties and income tax presented on a year-by-year basis. The project start date has been based on year 2026. All currency figures are reported in US$ with all cashflows presented in financial years starting in January and ending in December.
|
19.3 |
Sources of Information |
The basis of the financial evaluation has been founded on information sources from DRA and the Bilboes owners’ team. An overview of key sources of information is presented in Table 19‑1 below.
Table 19‑1: Sources of Information
|
Description |
Source of Information / Responsible / Notes |
|
General |
|
|
Discount rate |
Bilboes Owners Team |
|
Royalty tax rate |
Bilboes Owners Team |
|
Aids levy |
Bilboes Owners Team |
|
Macro Variables |
|
|
Exchange rates |
Bilboes Owners Team |
|
Product pricing |
Bilboes Owners Team |
|
Production Schedules |
|
|
RoM tonnes and ounces |
DRA |
|
Initial Capital Expenditure (CAPEX) |
|
|
Mining |
DRA |
|
Process plant |
DRA (with input from others) |
|
TSF |
SLR |
|
Stay in Business (SIB) Capital |
|
|
Mining |
DRA |
|
Process plant |
DRA |
|
Operational Expenditure (OPEX) |
|
|
Mining |
DRA |
|
Process plant |
DRA (with input from others) |
|
TSF |
SLR |
|
G&A |
Bilboes Owners Team |
|
Revenue |
|
|
Product recoveries |
Bilboes Owners Team (previous test work) |
|
Product pricing |
Bilboes Owners Team |
|
19.4 |
Base Date |
The base date for the model is 31 December 2023.
|
19.5 |
Production Profile |
The production profile is reported as ore fed to the plant from four mineralization properties which are McCays, Isabella North, Isabella South and Bubi for all three scenarios. A total of ~25 million tonnes of ore is delivered to the processing facility, with ~198 million tonnes of waste removed over the same period. The average grade over life of mine is estimated at ~2.34 g/t Au. The production schedule over life of mine can be found in Section 13 of this report.
|
19.6 |
Capital Expenditure and Phasing |
The total initial capital estimate for the project includes capital required to expand the mining operation and a contingency allowance. Initial capital has been phased, based on a high-level project execution schedule for each scenario. Further detail covering the execution schedule and basis of costs can be found in Section of this report.
A summary of initial capital costs is shown in Table 19‑2 below. This is inclusive of mining, processing, tailings, and a contingency allowance.
Table 19‑2: Initial Capital Cost – Constant Terms (2023)5
|
Total |
FY 2025 |
FY 2026 |
FY 2027 |
FY 2028 |
FY 2029 |
FY 2030 |
FY 2031 |
FY 2032 |
FY 2033 |
FY 2034 |
|
US$ m |
US$ m |
US$ m |
US$ m |
US$ m |
US$ m |
US$ m |
US$ m |
US$ m |
US$ m |
US$ m |
|
414 |
- |
157 |
182 |
- |
5 |
5 |
28 |
37 |
- |
- |
|
19.7 |
Stay in Business Capital |
SIB capital expenditure has been considered, covering the process plant allowances. No mining SIB costs are expected due to the short duration between phases 1 and 2 which have been capitalized. Process plant SIB has been based on an annual allowance of 1% of process plant Operating Expenditure (OPEX). Total SIB costs are summarized in Table 19‑2 below.
Table 19‑3: SIB Capital Cost (LoM) – Constant Terms (2023)
|
Scenario |
Unit |
Total (LoM) |
|
SIB Capital |
US$ m |
6 |
|
19.8 |
Operating Expenditure |
The operating costs for the LoM include the mining operation, processing plant (incl. tailings disposal) and G&A costs. Table 19‑4 shows the estimated operating cost by category over the LoM. These costs have been developed from first principles and do not include a contingency.
Table 19‑4: Operational Cost Estimate (LoM) – Constant Terms (2023)6
|
Description |
Cost (US$ m) |
Unit cost (US$ / t RoM) |
|
Mining |
639 |
26 |
|
Process Plant |
600 |
24 |
|
G&A |
46 |
2 |
|
Total |
1,285 |
52 |
_______________________________
5 Due to rounding, numbers presented in this table may not add up precisely to the totals provided.
6 Due to rounding, numbers presented in this table may not add up precisely to the totals provided.
|
19.9 |
Gold Recovery |
Process specific parameters have been applied for each mineralization property, informed from historical test work outcomes, third party consultation and discussions with the Bilboes owners’ team.
Metal recoveries have been applied as static variables over the prescribed LoM for each scenario. A summary of these inputs is shown in Table 19‑5 below.
Table 19‑5: Gold Recovery per Mineralization Property
|
Property |
Unit |
Recovery |
Reference |
|
McCays |
% |
83.62 |
Test work / Third party / Client |
|
Isabella north |
% |
83.62 |
Test work / Third party / Client |
|
Isabella south |
% |
83.62 |
Test work / Third party / Client |
|
Bubi |
% |
88.88 |
Test work / Third party / Client |
|
19.10 |
Gold Pricing |
A static metal price has been applied as prescribed by the Bilboes owners’ team. A price of US$ 1,800/oz has been applied in the financial model for all scenarios considered.
|
19.11 |
Salvage Value |
No allowance for asset disposal at the end of life of mine has been included in the financial model.
|
19.12 |
Working Capital |
No allowance for working capital has been included in the financial model.
|
19.13 |
Sunk and On-going Capital |
No on-going, historical, or sunk costs have been considered in the financial model.
|
19.14 |
Reclamation and Closure |
An allowance for on-going environmental rehabilitation is included in the financial model together with a final closure cost of US$32 m expended during the last year of operation for each scenario. On-going environmental rehabilitation is based on a unit rate of US$0.25 / t ore.
|
19.15 |
Royalty Tax |
Royalty tax has been based on Zimbabwean legislation (Mines and Minerals/Finance Act) and supported by the Bilboes team. Royalties’ payable are a function of gross revenue and a royalty percentage. The royalty percentage is fixed at 5% for gold and enforced regardless of operating margin achieved. The formula used to calculate royalty’s payable has been defined below:
Royalty USD=Gross Sales (USD)×Royalty %
Where royalty % is defined as:
Royalty %=5% for gold sales
|
19.16 |
Corporate Income Tax7 |
Corporate income tax has been based on Zimbabwean legislation (Income Tax Act) and as advised by the Bilboes owners’ team. Income tax payable are a function of pre-tax profit and a taxation rate. Pre-tax profit is inclusive of all revenue, capital and development costs, operating costs, depreciation, amortization, and royalties. Capital expenditure (and development costs) incurred prior to production are claimed in full during the first production year. Subsequent capital expenditure is expended in full during the year of occurrence. Losses are carried over indefinitely until a profit is realized following which tax is levied based on annual pre-tax profits. A fixed effective taxation rate of 24.72% has been applied and is inclusive of an AIDs levy.
|
19.17 |
Discount Rate |
The project is based on an execution start date of 2026. A 10% discount rate has been applied in the financial model. A day zero discounting has been applied i.e., the full financial year of 2026 has not been discounted in the model.
_______________________________
7 The interpretation of the taxation and the associated legislation relevant to Zimbabwe has been based on information available in the public domain as well as guidance received from the Bilboes team. DRA does not provide expert advice on taxation matters. It is recommended, during the next project phase, to seek validation through a third-party consulting firm who specialise in taxation and legislative conformance in Zimbabwe.
|
19.18 |
Economic Outcomes |
The financial model has been prepared on a 100% equity project basis and does not consider alternative financing scenarios. A discount rate of 10% has been applied in the analysis. The outcomes are presented on a pre-tax and post-tax basis. A static metal price of US$ 1,800/oz has been applied. All-in sustaining costs have been reported as per the WGC guideline dated November 2018 and is exclusive of project capital, depreciation, and amortization costs. Capital payback is exclusive of the construction period and referenced to the start of first production. Key financial outcomes are shown in Table 19‑6 below.
Table 19‑6: Summary of Economic Outcomes
|
Description |
Units |
Value |
|
Production Statistics (LoM) |
||
|
Life of Mine |
years |
11 |
|
Total RoM Tonnes |
Mt |
25 |
|
Cost Estimate Summary (LoM) |
||
|
Capital Cost (incl. contingency) |
US$ m |
414 |
|
SIB Capital Cost |
US$ m |
6 |
|
Operating Cost |
US$ m |
1,285 |
|
Unit Cost |
US$/t RoM |
52 |
|
Revenue (LoM) |
||
|
Au Recovered |
koz |
1,597 |
|
Ave. Price |
US$/oz |
1,800 |
|
Financial Outcomes (Post-tax, Constant Model Terms) |
||
|
NPV @ 10% |
US$ m |
328 |
|
IRR |
% |
33.4 |
|
Peak Cash Funding |
US$ m |
348 |
|
AISC |
US$/oz |
922 |
|
Payback (UNDISCOUNTED) - From Production Start |
years |
1.8 |
|
19.19 |
Cash Flow Model |
The LoM cash flow is summarized in Figure 19‑1 below. Figure 19‑1 shows the distribution of cash flow inclusive of capital costs, SIB capital, operating costs, revenue, rehab costs, royalties, and income tax.
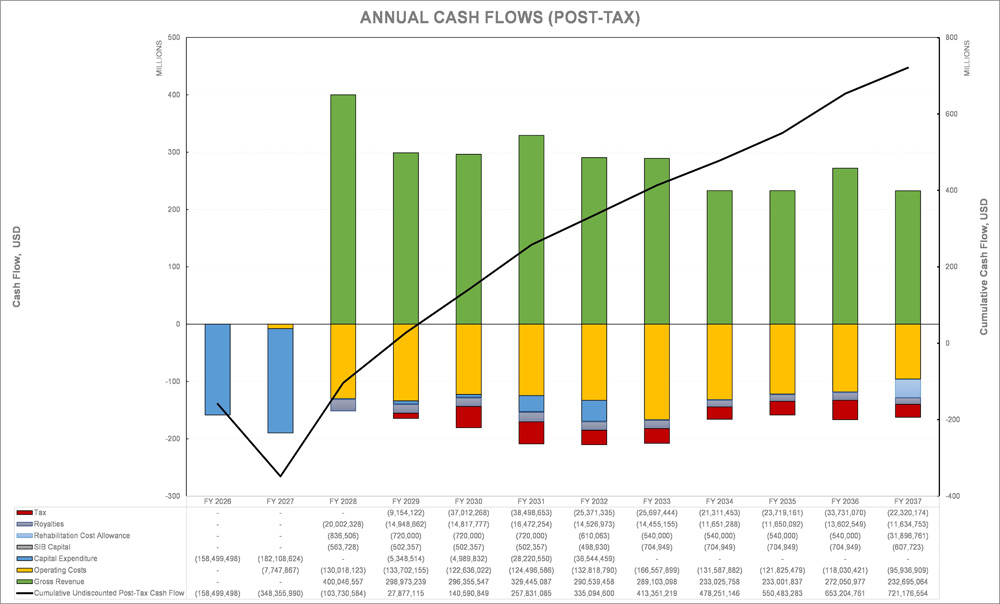
Figure 19‑1: LoM Cash Flow Model
Table 19‑7: Cash Flow Model
|
FY 2025 |
FY 2026 |
FY 2027 |
FY 2028 |
FY 2029 |
FY 2030 |
FY 2031 |
FY 2032 |
FY 2033 |
FY 2034 |
FY 2035 |
FY 2036 |
FY 2037 |
||
|
Total Gold Produced |
koz |
- |
- |
- |
222.25 |
166.10 |
164.64 |
183.03 |
161.41 |
160.61 |
129.46 |
129.45 |
151.14 |
129.28 |
|
Gross Revenue |
US$ m |
- |
- |
- |
400.05 |
298.97 |
296.36 |
329.45 |
290.54 |
289.10 |
233.03 |
233.00 |
272.05 |
232.70 |
|
Operating Costs |
||||||||||||||
|
Mining costs |
US$ m |
- |
- |
7.75 |
70.69 |
78.55 |
67.49 |
69.35 |
78.01 |
91.15 |
56.18 |
46.42 |
42.62 |
30.93 |
|
Process plant costs |
US$ m |
- |
- |
- |
56.37 |
50.24 |
50.24 |
50.24 |
49.89 |
70.49 |
70.49 |
70.49 |
70.49 |
60.77 |
|
Process plant costs - Oxides |
US$ m |
- |
- |
- |
- |
- |
- |
- |
- |
- |
- |
- |
- |
- |
|
G&A costs |
US$ m |
- |
- |
- |
2.95 |
4.91 |
4.91 |
4.91 |
4.91 |
4.91 |
4.91 |
4.91 |
4.91 |
4.24 |
|
Refining |
US$ m |
- |
- |
- |
4.00 |
2.99 |
2.96 |
3.29 |
2.91 |
2.89 |
2.33 |
2.33 |
2.72 |
2.33 |
|
Total Operating Costs |
US$ m |
- |
- |
7.75 |
134.02 |
136.69 |
125.60 |
127.79 |
135.72 |
169.45 |
133.92 |
124.16 |
120.75 |
98.26 |
|
SIB Capital |
||||||||||||||
|
Mining |
US$ m |
- |
- |
- |
- |
- |
- |
- |
- |
- |
- |
- |
- |
- |
|
Process plant |
US$ m |
- |
- |
- |
0.56 |
0.50 |
0.50 |
0.50 |
0.50 |
0.70 |
0.70 |
0.70 |
0.70 |
0.61 |
|
Total SIB Capital |
US$ m |
- |
- |
- |
0.56 |
0.50 |
0.50 |
0.50 |
0.50 |
0.70 |
0.70 |
0.70 |
0.70 |
0.61 |
|
Rehabilitation Cost |
US$ m |
- |
- |
- |
0.84 |
0.72 |
0.72 |
0.72 |
0.61 |
0.54 |
0.54 |
0.54 |
0.54 |
31.90 |
| FY 2025 | FY 2026 | FY 2027 | FY 2028 | FY 2029 | FY 2030 | FY 2031 | FY 2032 | FY 2033 | FY 2034 | FY 2035 | FY 2036 | FY 2037 | ||
|
Royalties |
US$ m |
- |
- |
- |
20.00 |
14.95 |
14.82 |
16.47 |
14.53 |
14.46 |
11.65 |
11.65 |
13.60 |
11.63 |
|
Capital Expenditure |
||||||||||||||
|
Mining |
US$ m |
- |
- |
30.99 |
- |
- |
- |
- |
- |
- |
- |
- |
- |
- |
|
Process and Infrastructure |
US$ m |
- |
128.05 |
109.48 |
- |
5.35 |
4.94 |
24.69 |
33.02 |
- |
- |
- |
- |
- |
|
Indirect |
US$ m |
- |
21.67 |
21.02 |
- |
- |
0.05 |
1.30 |
0.86 |
- |
- |
- |
- |
- |
|
Contingency |
US$ m |
- |
8.77 |
20.61 |
- |
- |
0.00 |
2.23 |
2.66 |
- |
- |
- |
- |
- |
|
Total Capital |
US$ m |
- |
158.50 |
182.11 |
- |
5.35 |
4.99 |
28.22 |
36.54 |
- |
- |
- |
- |
- |
|
Pre-Tax Cash Flow |
US$ m |
0.00 |
-158.50 |
-189.86 |
244.63 |
140.76 |
149.73 |
155.74 |
102.63 |
103.95 |
86.21 |
95.95 |
136.45 |
90.29 |
|
Tax |
- |
- |
- |
- |
9.15 |
37.01 |
38.50 |
25.37 |
25.70 |
21.31 |
23.72 |
33.73 |
22.32 |
|
|
Post-Tax Cash Flow |
US$ m |
0.00 |
-158.50 |
-189.86 |
244.63 |
131.61 |
112.71 |
117.24 |
77.26 |
78.26 |
64.90 |
72.23 |
102.72 |
67.97 |
|
19.20 |
Sensitivity Analysis |
A sensitivity analysis has been conducted assessing the impact of variations in initial capital cost, operating cost, and metal selling price. Each variable is assessed in isolation to determine the impact on Net Present Value (NPV) and Internal Rate of Return (IRR).
The impact of initial capital costs has a limited elasticity in impacting overall project value due to the capital phasing profile and relatively low expenditure in comparison to revenue and operating costs over the prescribed LoM. A summary of these relative variations is shown in Figure 19‑2.
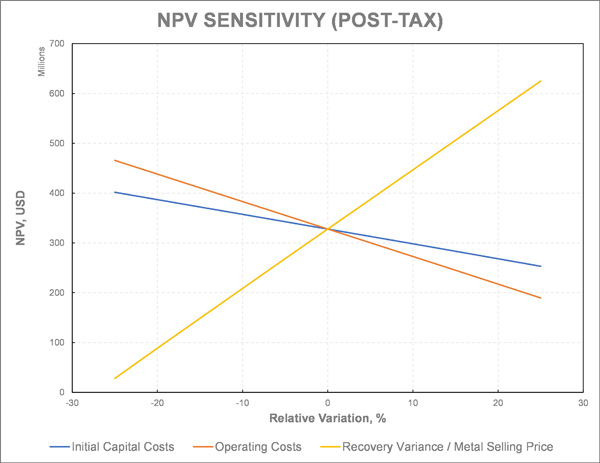
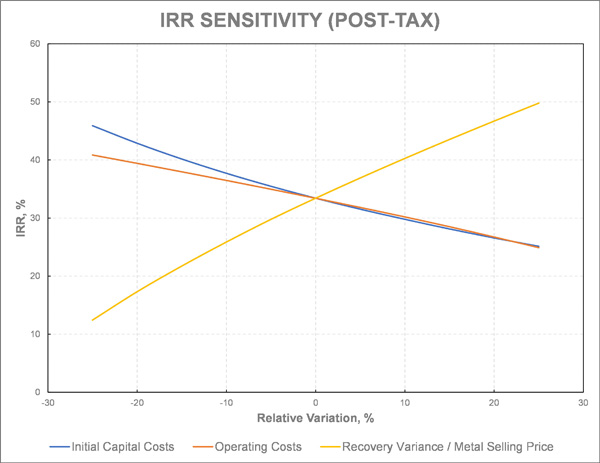
Figure 19‑2: Sensitivity Analysis
|
20 |
ADJACENT PROPERTIES |
Several small mines and two larger ones have operated in the past in the area around the Isabella property and within the Isabella and Gwizaan EPOs (Figure 20‑1) but all of these had been dormant for at least 15 years prior to the renewal of exploration activity in the area in the early 1980s. The productions listed in Table 20‑1 are for the period to 1980. The Calcite Mine is located in the area now covered by the Isabella operation and its production is included in the History section. The Motapa, Fossicker and Jupiter Mines are situated immediately to the south of the Mine and trend in the same general strike of Isabella, McCays and Bubi.
The Isabella EPO 1726 surrounds Isabella McCays while the Gwizaan EPO 1646 surrounds Bubi as well as a cluster of other Bilboes exploration claims namely When, Sandy and Ferroro. The two EPOs which are contiguous were approved for exploration through a government gazette of 13 July 2018 and had a combined ground holding of 67,419 ha. The EPOs has a three-year tenure which expired on 12 July 2021. Applications for extension the tenure of the EPOs is still pending. Several high quality geological and aeromagnetic targets are located within the major northeast-southwest trending deformation zones that transect the EPOs such as along the Peter-Pan, Courtleigh and Gabriella-Mulungwane shear zones. These targets in addition to the existing exploration claims offer potential for organic growth of Bilboes’ gold Mineral Resources.
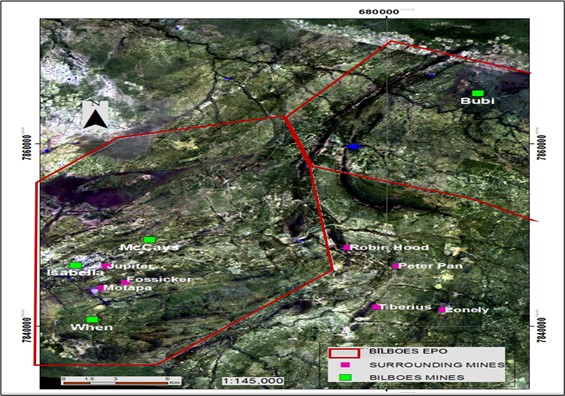
Figure 20‑1: Adjacent Properties around Isabella McCays and Bubi
Table 20‑1: Historic Gold Production from Mines around Isabella McCays and Bubi to 1980
|
Mine |
Au kg |
Grade g/t |
Coordinates |
Locality from Isabella |
|
|
|
|
Easting | Northing | ||
|
Motapa |
9,467 |
4.3 |
663,613 |
7,844,250 |
2 km south |
|
Fossicker |
472 |
3.7 |
664,953 |
7,844,803 |
3 km south-east |
|
Jupiter |
201 |
3.9 |
663,870 |
7,846,633 |
1 km east |
|
Lonely |
34,786 |
17.5 |
683,276 |
7,841,837 |
20 km east |
|
Peter Pan |
968 |
2.9 |
680,606 |
7,846,618 |
18 km east |
|
Robin Hood |
248 |
2.1 |
677,790 |
7,848,663 |
15 km east |
|
Tiberius |
263 |
2.2 |
679,408 |
7,842,128 |
17 km east |
Source Bartholomew (1990), Coordinate system: UTM, Arc1950, Zone 35S, Spheroid-Clarke 1880.
The QP has been unable to verify the information in this section. The information in this section is not necessarily indicative of the mineralization on the Bilboes properties.
|
21 |
OTHER RELEVANT DATA AND INFORMATION. |
Note: The information below relates to the fiscal year 2023 and is in Zimbabwe Dollars (Z$), unless otherwise stated. An appropriate exchange rate to the US$ will be applied at the time of any transaction.
|
21.1 |
Royalties, Taxes and Economic Climate in Zimbabwe |
|
21.1.1 |
Royalties, Taxes and Economic Climate in Zimbabwe |
The tax regime in Zimbabwe has remained relatively stable and favourable regionally over the past few years and those directly affecting the mining industry are listed below.
|
21.1.2 |
Royalties |
Royalties are levied on gross revenue from the sale of gold.
|
● |
Royalties are levied at source hence payments made by Fidelity Printers and Refiners (Private) Limited (Fidelity) (the entity that buys all of the official production in Zimbabwe) are net of royalties. |
|
● |
From 1 January 2020, mining royalties are an allowable expense in the determination of taxable income. |
|
● |
For primary gold producers a two-tier system that is based on gold prices is applicable. For gold prices below US$1,200/oz the rate is 3% and for gold prices above US$1,200/oz the rate is 5% |
|
● |
The government is still considering other proposals submitted by mining houses to restore viability through review of other fees and charges. |
|
● |
The basis of determination of royalty payments on opaque mining products as follows: |
|
● |
Concentrate – computed on 80% of the international price of the refined mineral contained therein. |
|
● |
Matte- computed on 85% of the international price of the refined mineral contained therein. |
|
● |
Gold: invoice value as determined by Fidelity Printers and Refineries |
|
● |
Diamonds and all other minerals, the invoice value as determined by the MMCZ. |
|
21.1.3 |
Customs Duties |
|
● |
Maximum applied on cost of imports |
: 10% | |
|
● |
Capital equipment imports |
: 0% |
|
21.1.4 |
Value Added Tax |
|
● |
Locally procured and imported inputs and equipment |
: 15% | |
| ● | Exports are zero rated and input VAT is fully recoverable in most cases or can be used to set off against other tax liabilities. No output VAT is levied on gold sales as they are zero-rated. Silver is subject to VAT at 14.5%. | ||
|
21.1.5 |
Withholding Taxes |
|
● |
Supplies by unregistered traders (without Tax Clearance Certificate) |
: 30% | |
|
● |
Non-Resident Shareholders’ Tax on dividends |
: 15% | |
|
● |
On fees, royalties, dividends, and interest |
: 15% | |
|
● |
On dividends distributed by a ZSE listed company |
: 10% | |
|
● |
Services from non-residents |
: 15% |
|
21.1.6 |
Corporate Tax |
|
● |
On taxable profits: 25% flat rate [plus 3% AIDS levy] to make effective rate 25.75%, |
|
● |
Capital redemption allowances in year incurred |
|
| : 100%, |
|
● |
Deduction limits on passenger vehicles |
|
|
|
||
|
: Z$5million /US$10,000, |
|
● |
Deduction limits on employee housing |
|
|
: Z$12,5 million / US$ 25,000, |
|
● |
Deduction limits on donations to medical centers |
|
|
: Z$50 million/ US$ 100,000 per annum, |
|
● |
Deduction limits on donations to research and development institutions |
|
|
: Z$50 million / US$100,000 per annum. |
|
● |
Pre-production operating expenditure |
|
|
: 100% in first year of production |
|
● |
Carry forward of losses |
|
|
: Indefinite for mining operations. |
|
21.1.7 |
Ring Fencing |
|
● |
Each mining location is ring fenced and only costs applicable to location are deductible. |
|
21.1.8 |
Employment Levies |
|
● |
National Social Security |
: 4.5% of an employee wage rate. | |
|
● |
The cap is declared monthly |
: Z$2,414,896per month. | |
|
● |
Workmen’s compensation |
: 1.77% base earnings | |
|
● |
Manpower Development Levy |
: 1% of the gross earnings | |
|
● |
Standards Development Levy |
: 0.5% of the gross earnings |
|
21.1.9 |
Electricity Levies |
|
● |
Rural Electrification Levy |
: 6% of electricity bill |
|
21.1.10 |
Rural Council Levies |
|
● |
Unit tax: Z$12,000 / unit |
|
● |
The number of units for each company is dependent on number of employees with the first 100 employees making a unit and any other 50 employees thereafter forming units. |
|
21.1.11 |
Other Relevant Points |
|
● |
Administration fees in excess of 1% of other tax-deductible expenses is disallowed and taxed as a dividend. |
|
● |
Capital gains tax (Table 21‑1) |
Table 21‑1: Capital Gains Tax
|
Acquired |
Rate |
Currency |
|
Before 22 February 2019 |
5% of gross capital amount |
ZWL |
|
5% of foreign currency gross capital amount |
US$ |
|
|
On or after 22 February 2019 |
20% of capital gain |
ZWL |
|
20% of foreign currency capital gain |
US$ |
|
● |
Capital gains withholding tax: |
|
● |
On listed marketable securities |
: 1.5% | |
|
● |
On listed marketable securities held for less than 6 months |
: 4% | |
|
● |
On unlisted marketable securities |
: 5% | |
|
● |
On immovable property acquired before 22 February 2019 |
: 5% | |
|
● |
On immovable property acquired after 22 February 2019 |
: 15% | |
| ● | All items consumer price index to be used in computing inflation allowance for ZWL disposals and 2.5% for US$ transactions. | ||
Note: In respect of any sale of a specified asset that is purported to have been sold in Zimbabwe dollars, it shall be presumed that the specified asset was paid for in a foreign currency at the United Sates dollar market valuation of the specified asset on the date of sale, and that the capital gains tax thereon shall be paid in United States dollars accordingly, unless the seller provides documentary proof satisfactory to the commissioner of taxes that the specified assets in question was sold for Zimbabwean dollars Deferment of VAT collection on imported capital equipment is as per Table 21‑2:
Table 21‑2: Vat Collection
|
Value of Equipment (US$) |
Deferment period (Days) |
|
100,000 to 1,000,000 |
90 |
|
1,000,001 to 10,000,000 |
120 |
|
10,000,001 and above |
180 |
|
● |
Mining claims fees are based on land area. The Mines and Minerals Act provides for maintenance of mining title through payment of annual protection fees. Protection fees for a gold / base metal block is US$150 per 5 ha per annum. For Exclusive Prospecting Orders (EPOs) they have a two to three-year tenure and can be renewed for an additional period to a cumulative maximum of six years subject to approval by the Ministry of Mines and Mining Development’s Mining Affairs Board and a renewal fee of US$1,500 is required with the application. The annual rental fee US$0.08 per ha in the first year, US$0.11 in the second year and US$0.15 in the third year. A company is allowed to peg claims during the tenure of the EPO subject to the following conditions: |
|
● |
That the area to be Pegged is not prohibited from pegging under the Mines and Minerals Act after the acquisition of a prospecting licenses at US$75 per gold / base metal block |
|
● |
Appointment of an Approved Pegger for the requisite groundwork and filing of paperwork for registration. |
|
● |
Payment of registration fees of US$300 or a base metal block and US$ 563 for a special base metal block. |
|
● |
Approval by the Ministry of Mines for erection of permanent beacons around the blocks as per Mines and Minerals Act. |
|
● |
EIA fees charged based on a sliding scale from 0.8% to 1.2% of the relevant project cost. |
|
● |
Payroll tax (Pay as You Earn) is deducted from employees’ earnings and paid to the government. The tax-free band has been increased to Z$9,000,000 per annum or Z$750,000 per month. The upper income tax bands moved to Z$270,000,000 per annum or Z$22,500,000 per month. The effective maximum rate of tax (including AIDS levy) is 41.2%. |
|
● |
Exemption of customs duty import tax and surtax on all capital goods during exploration phase of a mining project and for a period of up to 5 years from date of grant of a mining title, during the development phase of the mining project. |
|
● |
A 2% Intermediated Money Transfer Tax (IMTT) charged per e-commerce ZWL denominated transaction. Any transaction exceeding equivalent in ZWL of US$500,000 has a maximum tax of US$10,150 (at the Interbank Rate) payable in ZWL. |
|
● |
A 1% IMTT charged per e-commerce foreign currency denominated transaction. Any transaction exceeding US$500,000 has a maximum tax of US$10,150. |
|
● |
IMTT (Outbound Foreign Payment Tax) at a rate of 1% for every outbound foreign payment or partial payment made. This tax applies to each transaction that is subject to the tax thin capitalization - Offshore borrowings require Reserve Bank of Zimbabwe approval, and interest paid on borrowings of a debt-to-equity ratio of up to a maximum of three to one is tax deductible. Beyond the maximum allowable ratio any interest paid is assumed to be a dividend pay-out and is liable to withholding tax at the non-resident tax rate. |
|
21.1.12 |
Rebates of Duty |
The following tax rebates are allowed:
|
● |
Rebate of duty on goods for the prospecting and search for mineral deposits. |
|
● |
Rebate of duty on goods imported in terms of an agreement entered pursuant to a special mining lease. |
|
● |
Rebate of duty on goods imported temporarily for an approved project. |
|
● |
Rebate of duty on goods for incorporation in the construction of approved projects; and |
|
● |
No export duties for all mineral commodities. |
|
● |
Rebate of duty extended to capital equipment imported by mining and manufacturing sectors for values above 1 million, effective 1 January 2016. |
|
21.2 |
Mining Legislation |
The Government, as of 2019, had amended the mining laws, thereby decriminalizing the operation of small-scale miners to allow more locals to participate in the exploitation of the country’s mineral wealth. More emphasis is being placed on the “use it or lose it” regulations, which allow the government to repossess unused mining claims from holders.
|
22 |
INTERPRETATION AND CONCLUSIONS |
|
22.1 |
Mineral Resource Estimate |
|
● |
The data collected during the exploration, drilling and sampling programmes, including surveying, drill hole logging, sampling, geochemical analysis, and data quality assurance, was collected in a professional manner and in accordance with appropriate industry standards by suitably qualified and experienced personnel. |
|
● |
The data was reviewed and validated by the QP who concluded that the data is suitable for the construction of the geological model and for the estimation of the Mineral Resource. |
|
● |
The QP is confident that enough geological work has been undertaken, and sufficient geological understanding gained, to enable the construction of a geological model suitable for the determination of a Mineral Resource estimate. |
|
● |
The geological modelling and Mineral Resource estimate were undertaken utilizing recognized deposit and industry strategies/methodologies for the type of deposit of the Bilboes Gold Mine. |
|
● |
The QP considers that both the modelling and the grade interpolation have been conducted in an unbiased manner and that the resulting grade and tonnage estimates should be reliable within the context of the classification applied. |
|
● |
The Mineral Resource estimate was suitably verified prior to sign off by the QP. |
|
● |
The approach to the classification of the Mineral Resource estimate is considered appropriate for the Bilboes Gold Mine. Sufficient detail is presented to confirm the robustness of the approach. |
|
● |
The Mineral Resource is constrained in an optimized pit shell. This together with the assumptions relating to mining, processing, infrastructure, and market factors supports the “reasonable prospects for eventual economic extraction. |
|
● |
The QP is not aware of any metallurgical, infrastructural, environmental, legal, title, taxation, socio-economic, or marketing issues that would impact on the Mineral Resource, or Reserve statements as presented. |
|
● |
Based on an assessment including: - data quality and integrity, data spacing, confidence in the grade interpolation, confidence in the geological interpretation and confidence in the estimate the QP believes the Mineral Resource estimated is robust. |
|
22.2 |
Mineral Reserves Estimate |
|
● |
The QP responsible for the declaration of the Mineral Reserve, is confident that significant geological work has been undertaken, and sufficient geological understanding gained, to enable the construction of an ore body model suitable for the derivation of Mineral Resource and Mineral Reserve estimates. |
|
● |
Based on the information presented in this TRS, the QP considers the Mineral Reserve estimate to be supported by the appropriate technical data and assumptions. |
|
● |
The QP considers that both the modelling and the grade interpolation have been conducted in an unbiased manner and that the resulting grade and tonnage estimates should be reliable within the context of the classification applied. |
|
● |
The open pit modelling is based on suitably supported assumptions and parameters and completed utilizing appropriate industry standards suitable for the Bilboes Gold Mine. |
|
● |
The economic modelling is supported by technical studies in mining, processing, infrastructure, environmental, social, and marketing. Based on the inputs from these disciplines, the financial model demonstrates a feasible mine. The economic analysis is based on a US$ 1,800/oz. |
|
● |
The sensitivity analyses demonstrates that the profitability of the project is most sensitive to revenue related factors such as gold price and recovery. |
|
● |
The QP is not aware of any metallurgical, infrastructural, environmental, legal, title, taxation, socio-economic, or marketing issues that would impact on the Mineral Reserve statements as presented or that would impact on the reliability and/or confidence of the declaration. |
|
22.3 |
Economic Outcomes |
The financial model has been prepared on a 100% equity project basis and does not consider alternative financing scenarios. A discount rate of 10% has been applied in the analysis. The outcomes are presented in Table 22‑1 on a pre-tax and post-tax basis. A static metal price of US$1,800 /oz has been applied.
Table 22‑1: Project Economics Summary
|
Description |
Unit |
Pre-Tax |
Post-Tax |
|
Project Economics |
|||
|
NPV @ 10% |
Million US$ |
411 |
328 |
|
IRR |
% |
38.6 |
33.4 |
|
Peak Cash Funding |
Million US$ |
348 |
348 |
|
AISC* |
US$/oz |
922 |
922 |
|
Payback (UNDISCOUNTED) |
yrs |
1.8 |
1.8 |
*As per updated guidance note published by WGC, 2018. Excludes project capital, depreciation, and amortization costs.
|
22.4 |
Risk Assessment |
Various risks have been identified with consideration of the appropriate mitigating factors. These are presented in Table 22‑2.
Table 22‑2: Summary of Identified Risks and The Mitigation Strategies
|
Risk Category |
Risk |
Description / Cause |
Mitigation / Control |
|
Permitting |
Significant effect of ability to produce |
The lapsing of permits or license |
Proactive management oof permits, licenses, compliance etc. |
|
Geology and Mineral Resources |
Significant Variance in Mineral Resource Tonnage |
1. Inaccurate mineral resource models due to poor geological understanding of the deposit. 2. Inaccurate mineral resource models due to geological complexity of the deposit. 3. The tonnage is expected to change on a local scale but is unlikely to vary significantly on a global scale. |
1. Contingency measures applied during mineral resource modelling to ensure mineral resource models remain conservative. 2. Continued drilling conducted on the deposit to improve geological understanding of the deposit. 3. A infill drilling programme will be conducted pre-mining and throughout the life of the mine. |
|
Geology and Mineral Resources |
Significant Variance in Mineral Resource Grade |
The estimation of the grade is based on a limited number of intersection points. Although care has been taken to provide a robust estimate, the grade is expected to change on a local scale but is unlikely to vary significantly on a global scale. |
1. A grade control programme including drilling will be conducted pre-mining and throughout the life of the mine. Provision has been made for infill drilling and on-going exploration drilling during LoM. |
|
Geology and Mineral Resources |
Inaccurate oxide, transitional and sulfide Ore Reserve tonnes and grades |
Poor interpretation of the oxide, transitional and sulfide zones resulting in non-optimal planning. |
Continued monitoring of the Oxide-Sulfide interface during the mining operation. |
|
Mining |
Poor run of mine ore grade |
Poor grade control of the RoM ore resulting in excessive dilution or the run of mine ore grades. |
1. Grade control drilling will be conducted pre-mining and the cost for this has been allowed for in the PFS. 2. Grade controllers will be employed to monitor the mining team during operations. |
|
Mining |
Significant reduction in ore produced |
Lack of production due to aspects of geology, personnel, and resources |
1. Continuous skills training 2. Monitoring of critical resources of production e.g. fleet 3. Proactive production management |
|
Processing |
Lower than planned gold recovery from the plant |
Inaccurate gold recovery from the plant |
1. Gold recovery assumptions were informed by the on-site flotation and BIOX® pilot plant test work. 2. Bilboes procured a flotation and a BIOX pilot plant for on-site test works during the operational phase to optimize the flotation and BIOX® gold recovery. 3. Sulfide / Sulphur concentrate feed grade which ensures high bacterial activity and process stability is higher than the minimum of 4-6% required. |
| Risk Category | Risk | Description / Cause | Mitigation / Control |
|
Processing |
Operational inefficiencies in the BIOX® plant |
1. As it will be the first BIOX plant in Zimbabwe there may not be local operators / metallurgists with appropriate expertise. 2. Shortage of BIOX critical skills in Zimbabwe. |
1. Provision made for experienced in the budget. 2. Bilboes will enter into a BIOX® Technology License Agreement with Outotec for technical support in the running of the BIOX plant. 3. Outotec will train and develop local personnel in the running of the BIOX® plant. 4. Bilboes will second personnel to similar operations for exposure before commencement of its own operation. |
|
Finance |
Inflation |
The project is in Zimbabwe, which is facing severe economic challenges, which seriously undermines confidence for investment in major projects. |
The project earns its revenues and pays all its costs in US$ and has minimal exposure to Zimbabwe inflation. |
|
23 |
RECOMMENDATIONS |
|
23.1 |
Project Feasibility / Pre Project Execution / Implementation |
Revise the earlier feasibility study to restate the base case to the required accuracy class and introduce areas of optimization to maximise the business case and finalise planning for the project execution phase. The revised feasibility study will also be the main foundation for project execution funding. The feasibility study revision will require $3.5 million.
|
23.2 |
Mineral Resource Estimation |
During a future operational phase, drilling is required to develop an advanced grade control model prior to mining. The costs for this have been allocated at 5% of G&A costs.
|
23.3 |
Mineral Reserve Estimate |
|
● |
As part of a revised feasibility study, conduct Whittle optimization studies at higher gold prices than the current plan to investigate the potential for additional Mineral Reserves. |
|
● |
On-going geotechnical analysis is recommended during future mining operations to assess pit slope angles to investigate if improvements can be made for less waste stripping, reduced operating costs, and improve overall business economics. |
|
24 |
REFERENCES |
|
● |
Bartholomew DS (1990) Gold Deposits in Zimbabwe. Geological Survey of Zimbabwe Mineral Resources Series, 23, pp 75 |
|
● |
Gore, J., James, D. E., Zengeni, T. G., & Gwavava, O. G. (2009). Crustal Structure of the Zimbabwe Craton and the Limpopo Belt of South Africa: New Constraints from Seismic Data and Implications for its Evolution. The Geological Society of South Africa, 112, 213-228. |
|
● |
Mugandani, E. T. (2017). Status of Mineral Exploration and Development in Zimbabwe. SAIMM Conference. |
|
● |
Mukasa, S. B.; Wilson, A. H.; and Carlson, R. W. 1998. A multielement geochronologic study of the Great Dyke, Zimbabwe: significance of the robust and reset ages. Earth Planet. Sci. Lett. 164:353–369. |
|
● |
Ngilazi, A., & Martin, A. (2017). Independent Technical Report on Bilboes Properties, Matabeleland, Zimbabwe. Technical Report, Bibloes Holdings (Pvt) Ltd. |
|
● |
Subramani D, Mungoshi J, Olivier J, Thompson D (15 December 2021). Bilboes Gold Project Feasibility Study, National Instrument 43-101 Technical Report. Document Number: J JZWEBR7537-STU-REP-001. Prepared on behalf of Bilboes Gold Limited. |
|
● |
SLR Consulting (Pty) ltd (August 2019) Hydrogeological Study for Bubi-Isabella-McCays Mines. Project No.: 710.04026.00019. Prepared for: DRA Projects (Pty) Ltd |
|
● |
SLR Consulting (Pty) ltd (August 2019) Geotechnical Study for Bubi-Isabella-McCays Mines. Project No.: 710.04026.00019. Prepared for: DRA Projects (Pty) Ltd |
|
● |
World Gold Council (2018) Guidance Note on Expenditure Definitions |
|
● |
World Gold Council (2024) Statistics for Gold Demand and Supply |
|
25 |
RELIANCE ON INFORMATION PROVIDED BY THE REGISTRANT |
The following chart identifies the categories of information for which the QP has relied on information provided by Bilboes and the particular portions of the TRS that were prepared in reliance upon such information and the extent of such reliance.
|
● |
Geological Data (drilling, assays etc.) and Exploration Information, |
|
● |
Metallurgical test work reports, |
|
● |
Processing labour rates, unit power costs and unit reagent costs delivered to site, |
|
● |
General and administrative costs, |
|
● |
Maro variables covering exchange rates and gold pricing (including refining), |
|
● |
General economic input variables, taxation and levy rates, |
|
● |
Geotechnical Studies where completed by SLR, |
|
● |
The Tailings Storage Facility design and costing was also completed by SLR. |
The QP affirms that the inputs mentioned above which have been supplied by other sources meet an acceptable standard, drawing from relevant sources derived from prior experience, current applicable operations and/or applicable benchmarks/studies.
The QP believes such reliance is reasonable after the data/information has been reviewed.
Exhibit 15.7
CONSENT OF UWE ENGELMANN
I consent to the use of my name, or any quotation from, or summarization of, the technical report summary entitled “S-K 1300 Technical Report Summary on the Maligreen Gold Project, Zimbabwe”, with effective date of December 31, 2022 and issued on April 28, 2023, included or incorporated by reference in:
|
(i) |
the Annual Report on Form 20-F for the period ended December 31, 2023 of Caledonia Mining Corporation Plc being filed with the United States Securities and Exchange Commission, and any amendments or supplements thereto; and |
|
(ii) |
the Company’s Form F-3 Registration Statement (File No. 333-255500), and any amendments or supplements thereto. |
I further consent to the filing of the technical report summary as an exhibit thereto.
 |
|
| Uwe Engelmann, BSc (Zoo. & Bot.), BSc | |
| Hons (Geol.), Pr.Sci.Nat., MGSSA | |
| Date: 15 May , 2024 |
Exhibit 15.8
CONSENT OF MARTHINUS VAN STADEN
I consent to the use of my name, or any quotation from, or summarization of, the technical report summary entitled “S-K 1300 Technical Report Summary on the Blanket Gold Mine, Zimbabwe”, with effective date of December 31, 2023 and issued on May 15, 2024 included or incorporated by reference in:
|
(i) |
the Annual Report on Form 20-F for the period ended December 31, 2023 of Caledonia Mining Corporation Plc being filed with the United States Securities and Exchange Commission, and any amendments or supplements thereto; and |
|
(ii) |
the Company’s Form F-3 Registration Statement (File No. 333-255500), and any amendments or supplements thereto. |
I further consent to the filing of the technical report summary as an exhibit thereto.
 |
|
| Marthinus van Staden, B. Eng (Mining) | |
| Pr. Eng, AMMSA, SAIMM | |
| Date: May 15, 2024 |
Exhibit 97.1
CALEDONIA MINING CORPORATION PLC INCENTIVE COMPENSATION RECOVERY POLICY
|
1. |
Introduction. |
The Board of Directors of Caledonia Mining Corporation Plc (the “Company”) believes that it is in the best interests of the Company and its shareholders to create and maintain a culture that emphasizes integrity and accountability and that reinforces the Company's compensation philosophy. The Board has therefore adopted this policy (the “Policy”), which supplements from the Effective Date (as defined below) the provisions relating to reduction, cancellation, forfeiture or recoupment of any payments or settlements of awards (“Awards”) made under the Company’s Omnibus Equity Incentive Compensation Plan or its successors (the “Plan”) and in particular its clause 18.1 (Forfeiture Events). The Policy provides for the recovery of erroneously awarded incentive compensation in the event that the Company is required to prepare an accounting restatement due to material noncompliance of the Company with any financial reporting requirements under applicable securities laws, and/or in the event of detrimental conduct by certain employees or others who receive incentive awards, which includes, without limitation, consultants who are granted share options pursuant to the Plan. This Policy is designed to comply with Section 10D of the Securities Exchange Act of 1934, as amended (the “Exchange Act”), related rules and the listing standards of NYSE American LLC or any other securities exchange on which the Company’s shares are listed in the future.
To the extent necessary, and where permitted by law, this policy shall constitute an agreement to extend and to exclude the applicability of any statute of limitations for recoupment by the Company of any Incentive Compensation.
|
2. |
Administration. |
This Policy shall be administered by the Board or, if so designated by the Board, the Compensation Committee (the “Committee”), in which case all references herein to the Board shall be deemed references to the Committee. Any determinations made by the Board shall be final and binding on all affected individuals.
|
3. |
Covered Executives and Covered Employees. |
Unless and until the Board determines otherwise, for purposes of this Policy, the term “Covered Executive” means a current or former employee who is or was identified by the Company as the Company’s chief executive officer, chief financial officer, chief accounting officer or controller, chief operating officer, any vice-president of the Company in charge of a principal business unit, division, or function (such as sales, administration, or finance), any other officer who performs a policy-making function, or any other person who performs similar policy-making functions for the Company. Executive officers of the Company’s subsidiaries are deemed “Covered Executives” if they perform such policy-making functions for the Company. “Policy-making function” is not intended to include policy-making functions that are not significant.
Unless and until the Board determines otherwise, for purposes of this Policy, the term “Covered Employee” means a current or former employee, consultant or contractor who has received an Award under the Plan, and for the avoidance of doubt also includes every Covered Executive.
This Policy covers Incentive Compensation received by a person after beginning service as a Covered Employee and who served as a Covered Employee at any time during the performance period for that Incentive Compensation.
|
4. |
Recovery: Accounting Restatement. |
In the event the Company is required to prepare an accounting restatement of its financial statements filed with the Securities and Exchange Commission (the “SEC”) due to the Company’s material noncompliance with any financial reporting requirements under applicable securities laws (including any required accounting restatement to correct an error in previously issued financial statements that is material to the previously issued financial statements, or that would result in a material misstatement if the error were corrected in the current period or left uncorrected in the current period) (an “Accounting Restatement”), the Company will recover reasonably promptly any excess FRM Compensation received by any Covered Executive and, at the Board’s discretion, any other Covered Employee during the three completed fiscal years immediately preceding the date on which the Company is required to prepare an Accounting Restatement, including transition periods resulting from a change in the Company’s fiscal year as provided in Rule 10D-1 of the Exchange Act. FRM Compensation is deemed “received” in the Company’s fiscal period during which the Financial Reporting Measure specified in the Incentive Compensation award is attained, even if the payment or grant of the Incentive Compensation occurs after the end of that period. The determination of the time when the Company is “required” to prepare an Accounting Restatement shall be made in accordance with applicable SEC and national securities exchange rules and regulations.
|
(a) |
Definition of Incentive Compensation. |
For purposes of this Policy, “FRM Compensation” means any compensation that is granted, earned, or vested based wholly or in part upon the attainment of a Financial Reporting Measure, including, for example, bonuses or awards under the Company’s short and long-term incentive plans, grants and awards under the Company’s equity incentive plans, and contributions of such bonuses or awards to the Company’s deferred compensation plans or other employee benefit plans that are not tax-qualified plans. For purposes of this Policy, “Incentive Compensation” means FRM Compensation and any other compensation received pursuant to the vesting of Awards. For avoidance of doubt, Incentive Compensation that is deferred (either mandatorily or voluntarily) under the Company’s non-qualified deferred compensation plans, as well as any matching amounts and earnings thereon, are subject to this Policy, but for greater certainty Incentive Compensation will not include base salary or wages (as defined under applicable law).
|
(b) |
Financial Reporting Measures. |
“Financial Reporting Measures” are those that are determined and presented in accordance with the accounting principles used in preparing the Company’s financial statements (including non-GAAP financial measures) and any measures derived wholly or in part from such financial measures. For the avoidance of doubt, Financial Reporting Measures include stock price and total shareholder return. A measure need not be presented within the financial statements or included in a filing with the SEC or other applicable securities regulators to constitute a Financial Reporting Measure for purposes of this Policy. For the avoidance of doubt, and relevant to some currently outstanding Awards, a performance metric such as achievement of a certain cost per ounce of gold produced shall constitute a Financial Reporting Measure.
|
(c) |
Excess FRM Compensation: Amount Subject to Recovery. |
The amount(s) to be recovered from the Covered Employee will be the amount(s) by which the Covered Employee’s FRM Compensation for the relevant period(s) exceeded the amount(s) that the Covered Employee otherwise would have received had such FRM Compensation been determined based on the restated amounts contained in the Accounting Restatement. All amounts shall be computed without regard to taxes paid.
For FRM Compensation based on Financial Reporting Measures such as stock price or total shareholder return, where the amount of excess compensation is not subject to mathematical recalculation directly from the information in an Accounting Restatement, the Board will calculate the amount to be reimbursed based on a reasonable estimate of the effect of the Accounting Restatement on such Financial Reporting Measure upon which the FRM Compensation was received. The Company will maintain documentation of that reasonable estimate and will provide such documentation to the applicable national securities exchange.
|
(d) |
Method of Recovery. |
The Board will determine, in its sole discretion, and subject to applicable laws, the method(s) for recovering reasonably promptly excess Incentive Compensation hereunder. Such methods may include, without limitation:
|
(i) |
requiring reimbursement of Incentive Compensation previously paid; |
|
(ii) |
forfeiting any Incentive Compensation contribution made under the Company’s deferred compensation plans; |
|
(iii) |
offsetting the recovered amount from any Incentive Compensation that the Covered Employee may be awarded in the future; |
|
(iv) |
appointing the Company’s broker to sell any shares received as Incentive Compensation on the Covered Employee’s behalf; |
|
(v) |
taking any other remedial and recovery action permitted by law, as determined by the Board; or |
|
(vi) |
some combination of the foregoing. |
|
5. |
Recovery: Detrimental Conduct. |
In addition to FRM Compensation recoverable pursuant to Section 4 of this Policy, in the event the Board makes a good faith determination that a Covered Employee has engaged in Detrimental Conduct, then, in the Board’s sole discretion, the Company may seek to recover all or a portion of the Covered Employee’s Incentive Compensation settled or paid to a Covered Employee, and may reduce, cancel or forfeit any vested and unvested Awards, in the fiscal year during which the determination is made or the immediately prior fiscal year (provided such determination is made within 45 days of the end of that fiscal year).
The term “Detrimental Conduct” includes but is not limited to any of the following in relation to the Covered Employee:
|
(a) |
their deliberate and continued failure substantially to perform their duties and responsibilities, which failure has had an adverse effect on the Company; |
|
(b) |
their knowing and willful violation of any law, government regulation, the Company’s Code of Business Conduct, Ethics and Anti-Bribery Policy or any other Company or group policy; |
|
(c) |
their breach of noncompetition, confidentiality, nonsolicitation, noninterference, corporate property protection or any other agreements that may apply to the Covered Employee; |
|
(d) |
their act of fraud or dishonesty; or |
|
(e) |
their gross misconduct or negligence in performance of their duties. |
|
6. |
No Indemnification or Advance. |
Subject to applicable law, the Company shall not indemnify, including by paying or reimbursing for premiums for any insurance policy covering any potential losses, any Covered Employees against the loss of any erroneously awarded Incentive Compensation, nor shall the Company advance any costs or expenses to any Covered Employees in connection with any action to recover excess Incentive Compensation.
|
7. |
Interpretation. |
The Board is authorized to interpret and construe this Policy and to make all determinations necessary, appropriate or advisable for the administration of this Policy. It is intended that this Policy be interpreted in a manner that is consistent with the requirements of Section 10D of the Exchange Act and any applicable rules or standards adopted by the SEC or any national securities exchange on which the Company's securities are listed.
|
8. |
Effective Date. |
The effective date of this Policy is October 2, 2023 (the “Effective Date”). This Policy applies to Incentive Compensation received by Covered Employees on or after the Effective Date. Without limiting the scope or effectiveness of this Policy, all Awards also remain subject to the provisions of the Plan relating to reduction, cancellation, forfeiture or recoupment of any payments or settlements of Awards and in particular its clause 18.1 (Forfeiture Events), as they may be amended from time to time. In addition, this Policy is intended to be and will be incorporated as an essential term and condition of any Incentive Compensation agreement, plan or program that the Company establishes or maintains on or after the Effective Date.
|
9. |
Amendment and Termination. |
The Board may amend this Policy from time to time in its discretion, and shall amend this Policy as it deems necessary to reflect changes in regulations adopted by the SEC under Section 10D of the Exchange Act and to comply with any rules or standards adopted by NYSE American LLC or any other securities exchange on which the Company’s shares are listed in the future.
|
10. |
Other Recovery Rights. |
The Board intends that this Policy will be applied to the fullest extent of the law. The Board may require that any employment agreement or similar agreement relating to Incentive Compensation received on or after the Effective Date shall, as a condition to the grant of any benefit thereunder, require a Covered Employee to agree to abide by the terms of this Policy. Any right of recovery under this Policy is in addition to, and not in lieu of, any (i) other remedies or rights of compensation recovery that may be available to the Company pursuant to the terms of any similar policy in any incentive compensation plan, any employment agreement, or similar agreement relating to Incentive Compensation, unless any such agreement expressly prohibits such right of recovery, and (ii) any other legal remedies available to the Company. The provisions of this Policy are in addition to (and not in lieu of) any rights to repayment the Company may have under Section 304 of the Sarbanes-Oxley Act of 2002 and other applicable laws.
|
11. |
Impracticability. |
The Company shall recover any excess FRM Compensation in accordance with this Policy, except to the extent that certain conditions are met and the Board has determined that such recovery would be impracticable, all in accordance with Rule 10D-1 of the Exchange Act and any rules or standards adopted by NYSE American LLC or any other securities exchange on which the Company’s shares are listed in the future. For the avoidance of doubt, the decision as to whether to recover any other Incentive Compensation shall be at the sole discretion of the Board of Directors which shall be under no obligation to give any reasoning therefor.
|
12. |
Successors. |
This Policy shall be binding upon and enforceable against all Covered Employees and their beneficiaries, heirs, executors, administrators or other legal representatives.
Approved and authorised by resolution of the Board passed on 8 August 2023
Document Control and Certification
|
Version |
1 |
|
Date |
8 August 2023 |
|
Status |
In effect |
|
Author |
General Counsel |
Version Control
|
Date |
Revision # |
Description of Change |
Author |