UNITED STATES
SECURITIES AND EXCHANGE COMMISSION
WASHINGTON, D.C. 20549
FORM
CURRENT REPORT
PURSUANT TO SECTION 13 OR 15(D) OF THE SECURITIES EXCHANGE ACT OF 1934
Date
of Report (Date of earliest event reported):
(Exact name of registrant as specified in its charter)
(State or other jurisdiction of incorporation)
| (Commission File Number) | (IRS Employer Identification No.) | |||
| (Address of principal executive offices) | (Zip Code) |
(Registrant’s telephone number, including area code)
Not Applicable
(Former name or former address, if changed since last report.)
Check the appropriate box below if the Form 8-K filing is intended to simultaneously satisfy the filing obligation of the registrant under any of the following provisions (see General Instruction A.2. below):
Securities registered pursuant to Section 12(b) of the Act:
| Title of each class | Trading Symbol(s) | Name of exchange on which registered |
| The |
Indicate by check mark whether the registrant is an emerging growth company as defined in Rule 405 of the Securities Act of 1933 (§230.405 of this chapter) or Rule 12b-2 of the Securities Exchange Act of 1934 (§240.12b-2 of this chapter).
Emerging
growth company
If an emerging growth company, indicate by check mark if the registrant has elected not to use the extended transition period for complying with any new or revised financial accounting standards provided pursuant to Section 13(a) of the Exchange Act. ☐
Item 7.01 Regulation FD Disclosure.
First Community Corporation (the “Company”) is furnishing investor presentation materials as Exhibit 99.1 to this Form 8-K, which are to be used by the Company’s management in virtual meetings with investors on May 15, 2024 coordinated by Hovde Group, LLC.
The information in Items 7.01 and 9.01, including Exhibit 99.1, is furnished to, and not filed with, the U.S. Securities and Exchange Commission.
Item 9.01. Financial Statements and Exhibits.
(d) Exhibits
| Item | Exhibit List |
| 99.1 | First Community Corporation Investor Presentation. This Exhibit is furnished to, and not filed with, the U.S. Securities and Exchange Commission. |
| 104 | Cover Page Interactive Data File (embedded within the Inline XBRL document) |
SIGNATURES
Pursuant to the requirements of the Securities Exchange Act of 1934, the registrant has duly caused this report to be signed on its behalf by the undersigned hereunto duly authorized.
| FIRST COMMUNITY CORPORATION | |||
| By: | /s/ D. Shawn Jordan |
||
| Name: | D. Shawn Jordan |
||
| Title: | Chief Financial Officer | ||
Dated: May 14, 2024
Exhibit 99.1
The Bank Behind Your Business May 15, 2024
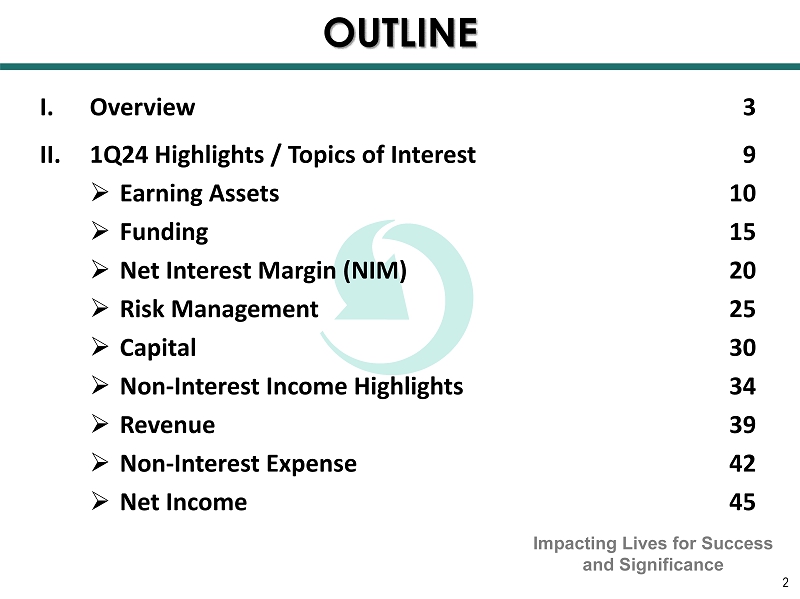
OUTLINE 2 I. Overview 3 II. 1Q24 Highlights / Topics of Interest 9 » Earning Assets 10 » Funding 15 » Net Interest Margin (NIM) 20 » Risk Management 25 » Capital 30 » Non - Interest Income Highlights 34 » Revenue 39 » Non - Interest Expense 42 » Net Income 45 Impacting Lives for Success and Significance
OVERVIEW Impacting Lives for Success and Significance
6 4
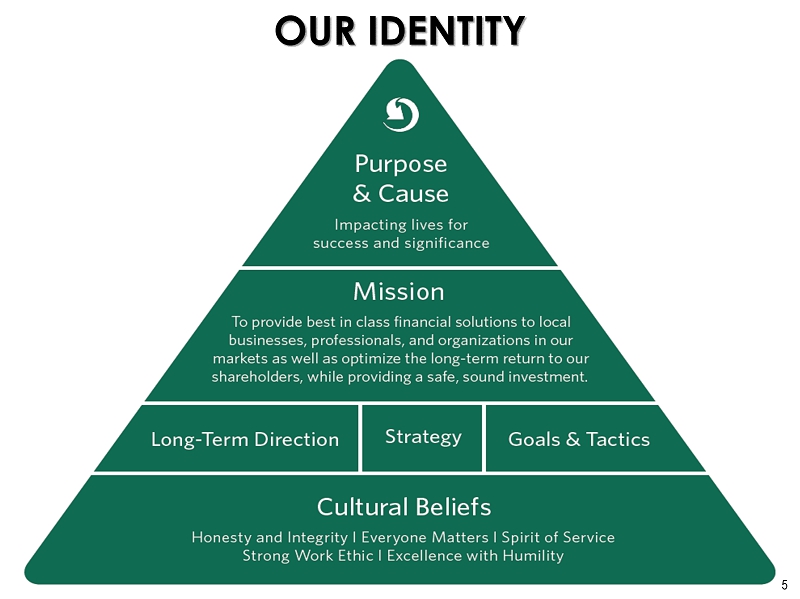
OUR IDENTITY 5
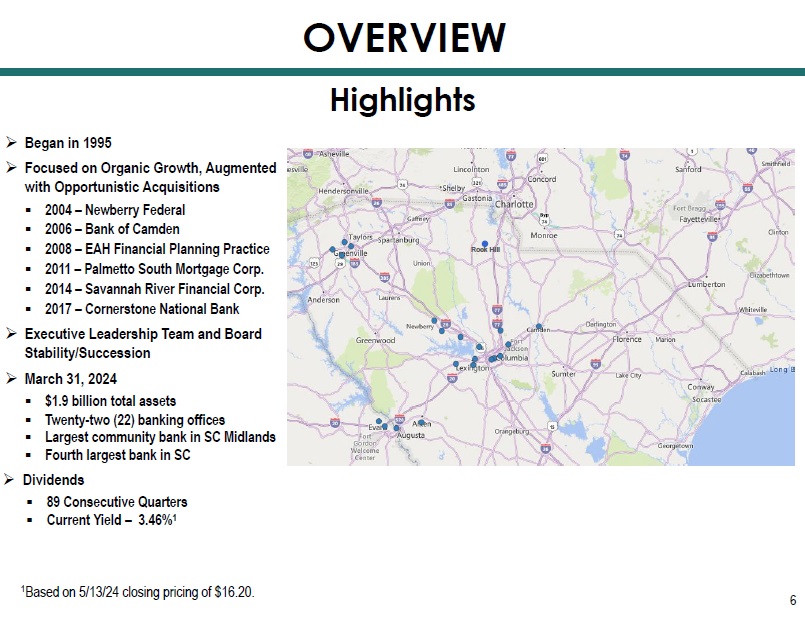
» Began in 1995 » Focused on Organic Growth, Augmented with Opportunistic Acquisitions ▪ 2004 – Newberry Federal ▪ 2006 – Bank of Camden ▪ 2008 – EAH Financial Planning Practice ▪ 2011 – Palmetto South Mortgage Corp. ▪ 2014 – Savannah River Financial Corp. ▪ 2017 – Cornerstone National Bank » Executive Leadership Team and Board Stability/Succession » March 31, 2024 ▪ $1.9 billion total assets ▪ Twenty - two (22) banking offices ▪ Largest community bank in SC Midlands ▪ Fourth largest bank in SC » Dividends ▪ 89 Consecutive Quarters ▪ Current Yield – 3.46% 1 OVERVIEW Highlights Rock Hill 1 Based on 5/13/24 closing pricing of $16.20. 6
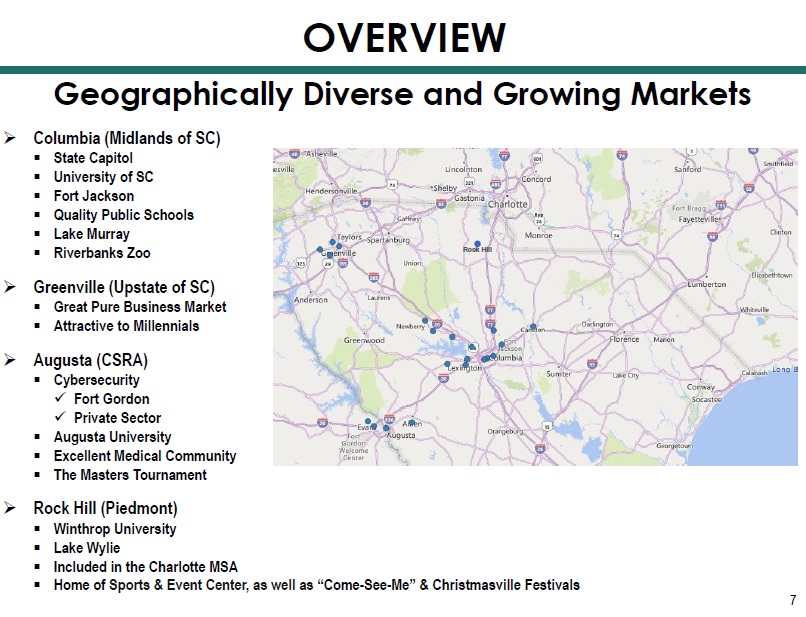
» Columbia (Midlands of SC) ▪ State Capitol ▪ University of SC ▪ Fort Jackson ▪ Quality Public Schools ▪ Lake Murray ▪ Riverbanks Zoo » Greenville (Upstate of SC) ▪ Great Pure Business Market ▪ Attractive to Millennials » Augusta (CSRA) ▪ Cybersecurity x Fort Gordon x Private Sector ▪ Augusta University ▪ Excellent Medical Community ▪ The Masters Tournament » Rock Hill (Piedmont) ▪ Winthrop University ▪ Lake Wylie ▪ Included in the Charlotte MSA ▪ Home of Sports & Event Center, as well as “Come - See - Me” & Christmasville Festivals Geographically Diverse and Growing Markets OVERVIEW Rock Hill 7
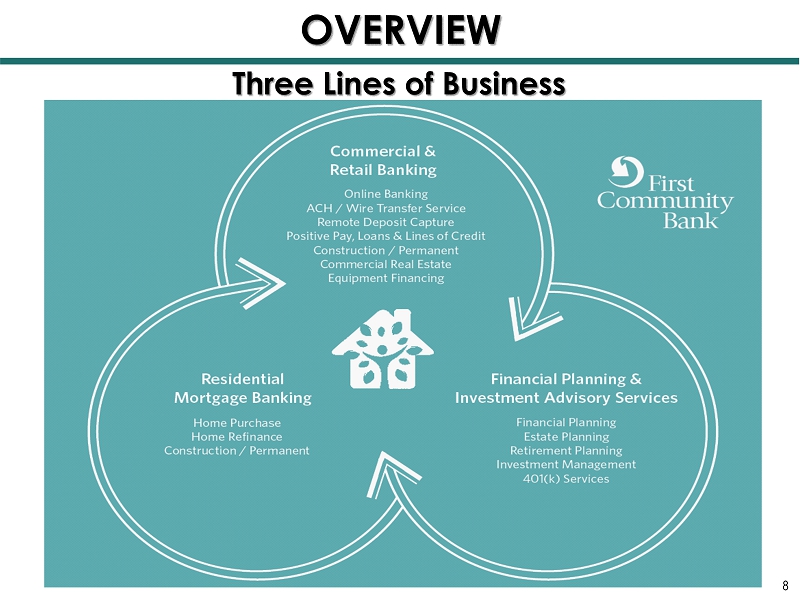
Three Lines of Business OVERVIEW 8
1Q24 HIGHLIGHTS / TOPICS OF INTEREST Impacting Lives for Success and Significance
EARNING ASSETS Impacting Lives for Success and Significance
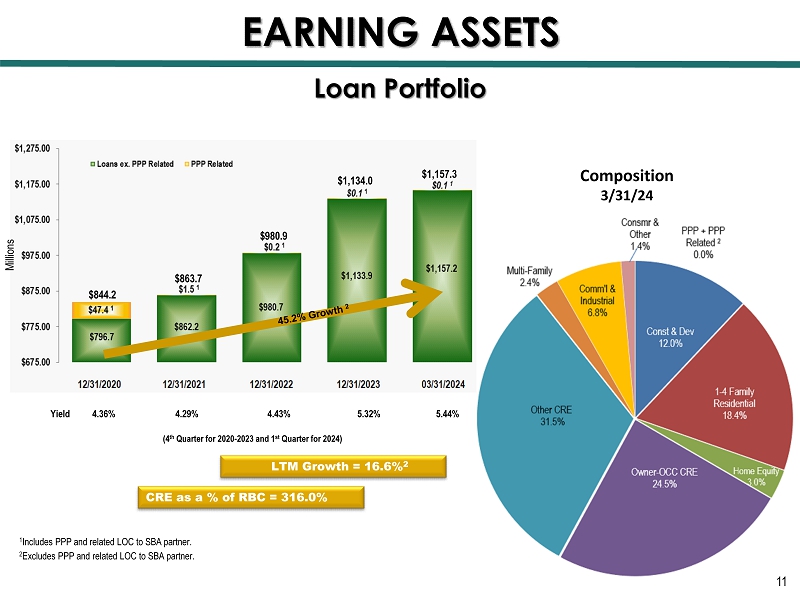
Loan Portfolio LTM Growth = 16.6% 2 1 Includes PPP and related LOC to SBA partner. 2 Excludes PPP and related LOC to SBA partner. CRE as a % of RBC = 316.0% (4 th Quarter for 2020 - 2023 and 1 st Quarter for 2024) $980.9 $1,134.0 $844.2 Yield 4.36% 4.29% 4.43% 5.32% 5.44% 11 EARNING ASSETS $1,157.3 Composition 3/31/24 Millions $863.7
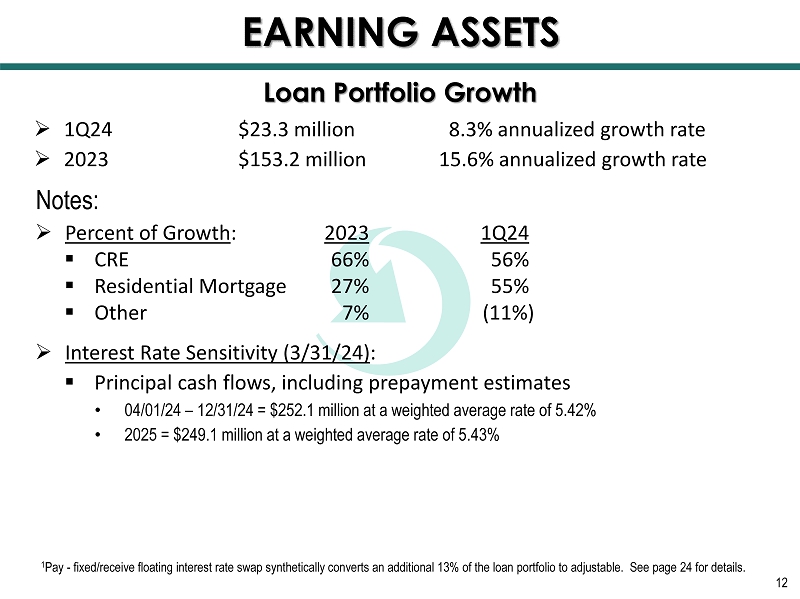
» 1Q24 $23.3 million 8.3% annualized growth rate » 2023 $153.2 million 15.6% annualized growth rate Notes: » Percent of Growth : 2023 1Q24 ▪ CRE 66% 56% ▪ Residential Mortgage 27% 55% ▪ Other 7% (11%) » Interest Rate Sensitivity (3/31/24) : ▪ Principal cash flows, including prepayment estimates • 04/01/24 – 12/31/24 = $252.1 million at a weighted average rate of 5.42% • 2025 = $249.1 million at a weighted average rate of 5.43% 12 1 Pay - fixed/receive floating interest rate swap synthetically converts an additional 13% of the loan portfolio to adjustable. S ee page 24 for details. Loan Portfolio Growth EARNING ASSETS
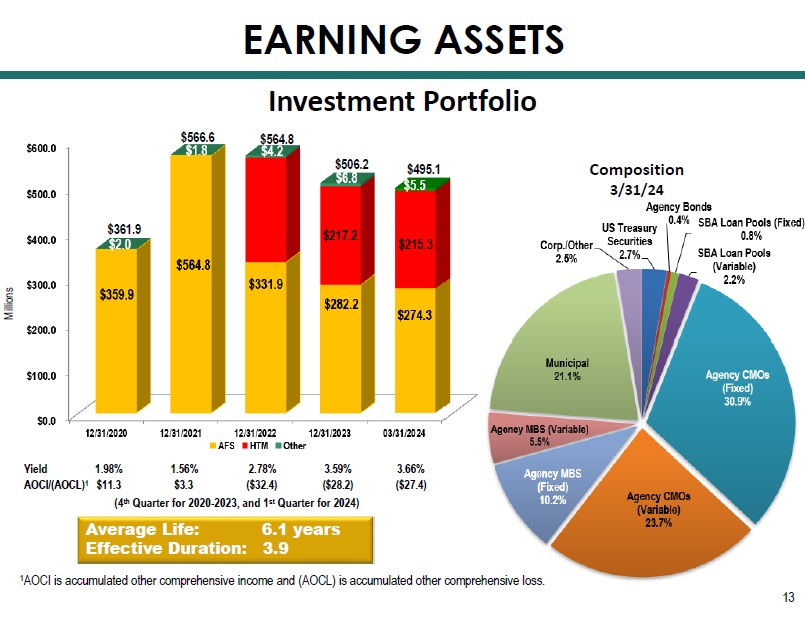
Investment Portfolio Yield 1.98% 1.56% 2.78% 3.59% 3.66% AOCI/(AOCL) 1 $11.3 $3.3 ($32.4) ($28.2) ($27.4) (4 th Quarter for 2020 - 2023, and 1 st Quarter for 2024) Average Life: 6.1 years Effective Duration: 3.9 Composition 3/31/24 $361.9 $564.8 $506.2 EARNING ASSETS Millions $495.1 13 $566.6 1 AOCI is accumulated other comprehensive income and (AOCL) is accumulated other comprehensive loss.
Notes: 2023 Activity : » Sold $39.9 million of book value US Treasuries (3Q23) » Weighted average book yield of securities sold was 1.75% » Pre - tax loss of $1.2 million » Proceeds used to reduce FHLB borrowings and build liquidity to fund future loan growth » Projected earn back period of 1.6 years Mix (1Q24) : » Floating 32% » Fixed 68% Principal Cash Flows : » 4/1/24 – 12/31/24 $31.5 million » FY2025 $49.4 million 14 Investment Portfolio EARNING ASSETS
FUNDING Impacting Lives for Success and Significance
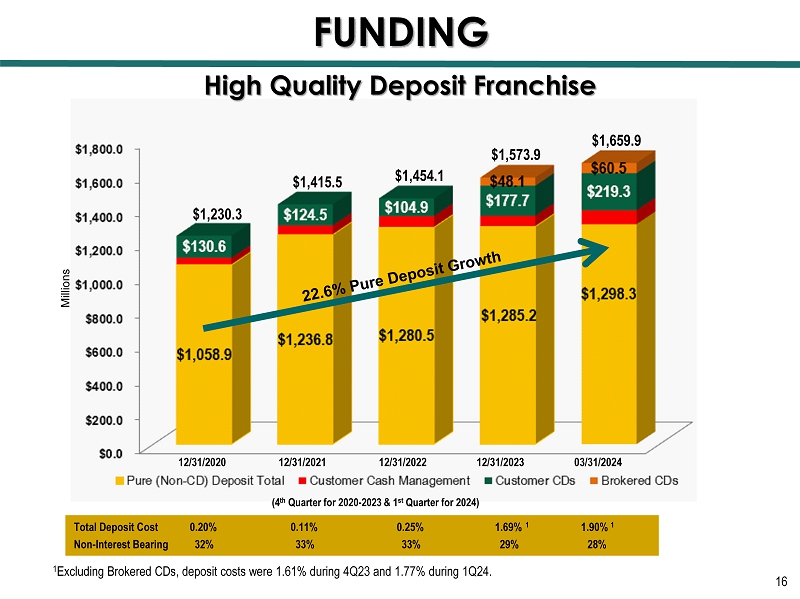
Total Deposit Cost 0.20% 0.11% 0.25% 1.69% 1 1.90% 1 Non - Interest Bearing 32% 33% 33% 29% 28% Millions $1,230.3 $1,415.5 $1,454.1 $1,573.9 (4 th Quarter for 2020 - 2023 & 1 st Quarter for 2024) 16 High Quality Deposit Franchise $1,659.9 FUNDING 12/31/2020 12/31/2021 12/31/2022 12/31/2023 03/31/2 024 1 Excluding Brokered CDs, deposit costs were 1.61% during 4Q23 and 1.77% during 1Q24.
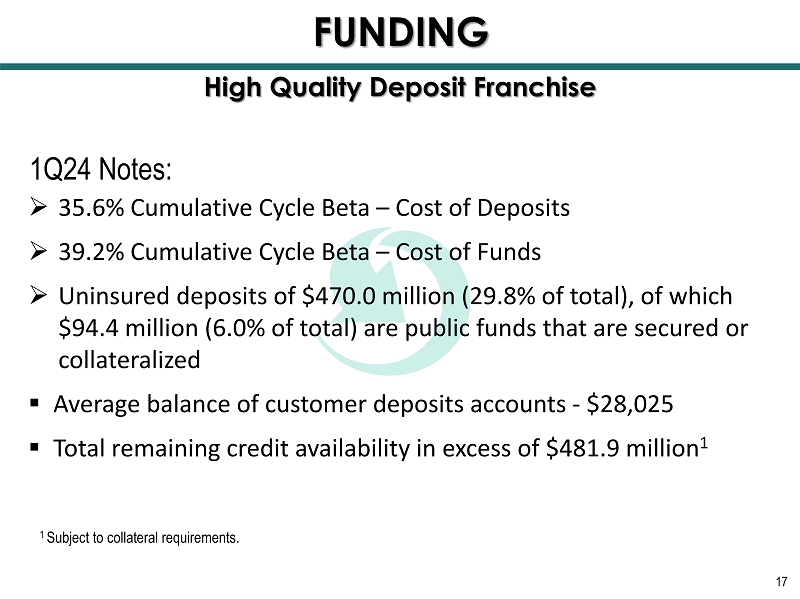
1Q24 Notes: » 35.6% Cumulative Cycle Beta – Cost of Deposits » 39.2% Cumulative Cycle Beta – Cost of Funds » Uninsured deposits of $470.0 million (29.8% of total), of which $94.4 million (6.0% of total) are public funds that are secured or collateralized ▪ Average balance of customer deposits accounts - $28,025 ▪ Total remaining credit availability in excess of $481.9 million 1 17 High Quality Deposit Franchise FUNDING 1 Subject to collateral requirements.
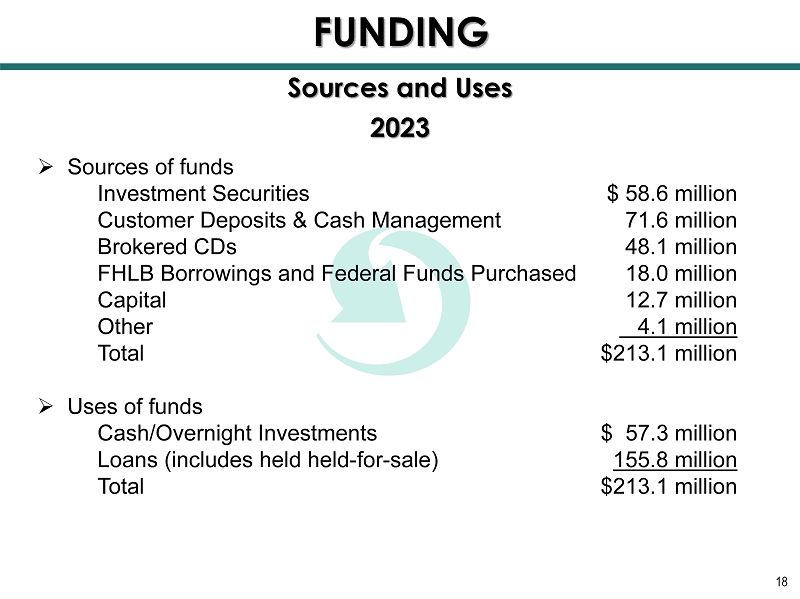
18 2023 » Sources of funds Investment Securities $ 58.6 million Customer Deposits & Cash Management 71.6 million Brokered CDs 48.1 million FHLB Borrowings and Federal Funds Purchased 1 8.0 million Capital 12.7 million Other 4.1 million Total $213.1 million » Uses of funds Cash/ Overnight Investments $ 57.3 million Loans (includes held held - for - sale) 155.8 million Total $213.1 million Sources and Uses FUNDING
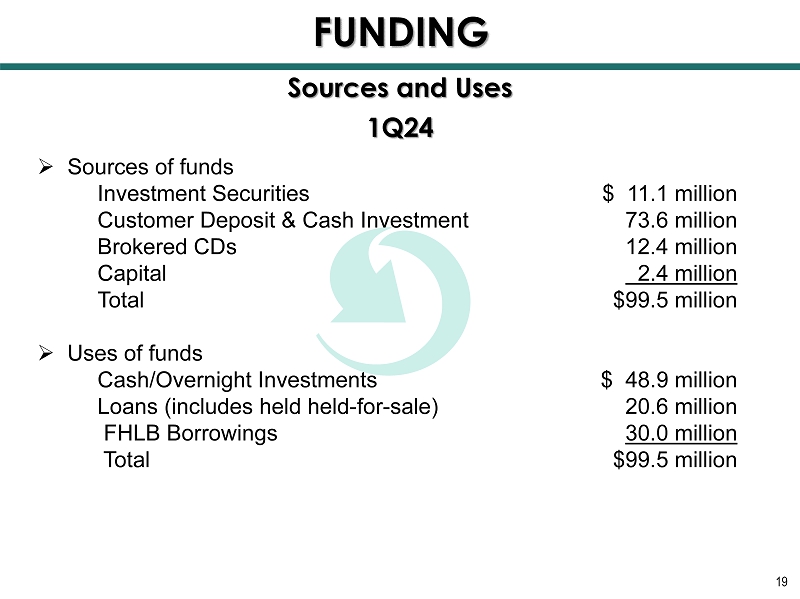
19 1Q24 » Sources of funds Investment Securities $ 11.1 million Customer Deposit & Cash Investment 73.6 million Brokered CDs 12.4 million Capital 2.4 million Total $99.5 million » Uses of funds Cash/ Overnight Investments $ 48.9 million Loans (includes held held - for - sale) 20.6 million FHLB Borrowings 30.0 million Total $99.5 million Sources and Uses FUNDING
NET INTEREST MARGIN Impacting Lives for Success and Significance
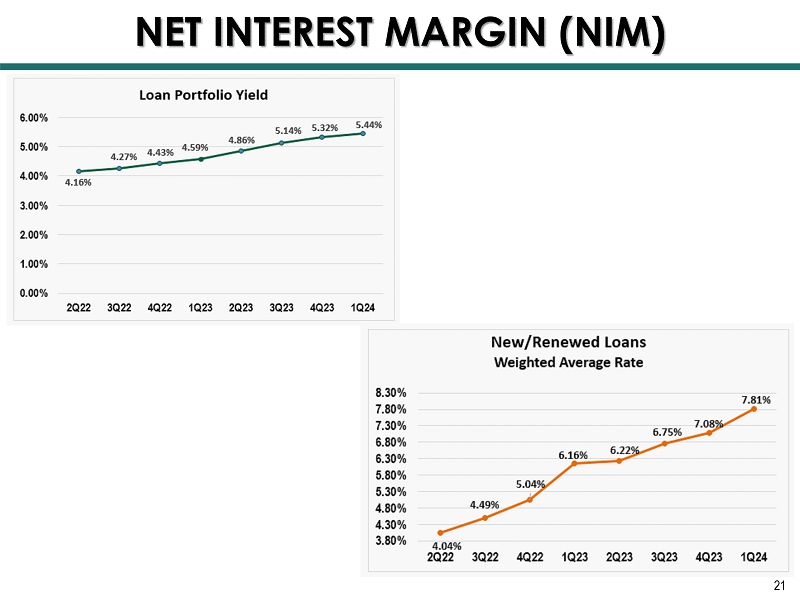
21 NET INTEREST MARGIN (NIM)
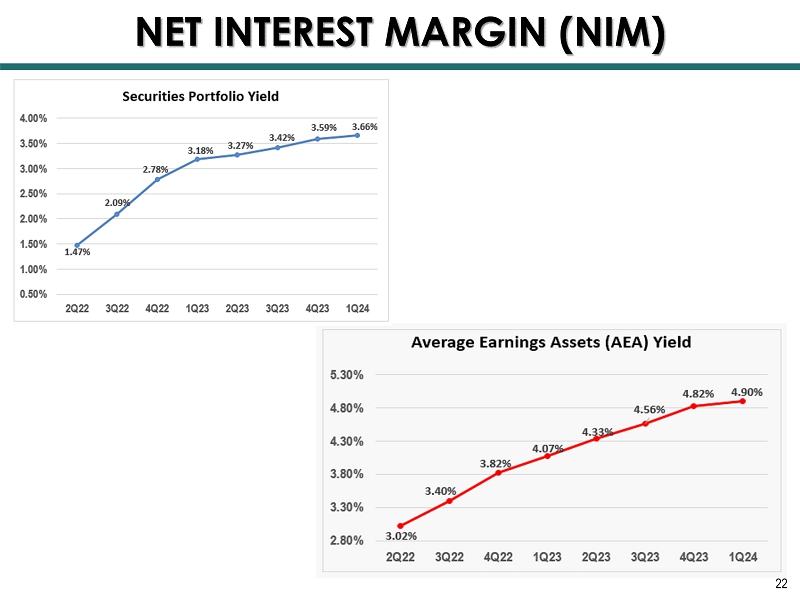
22 NET INTEREST MARGIN (NIM)
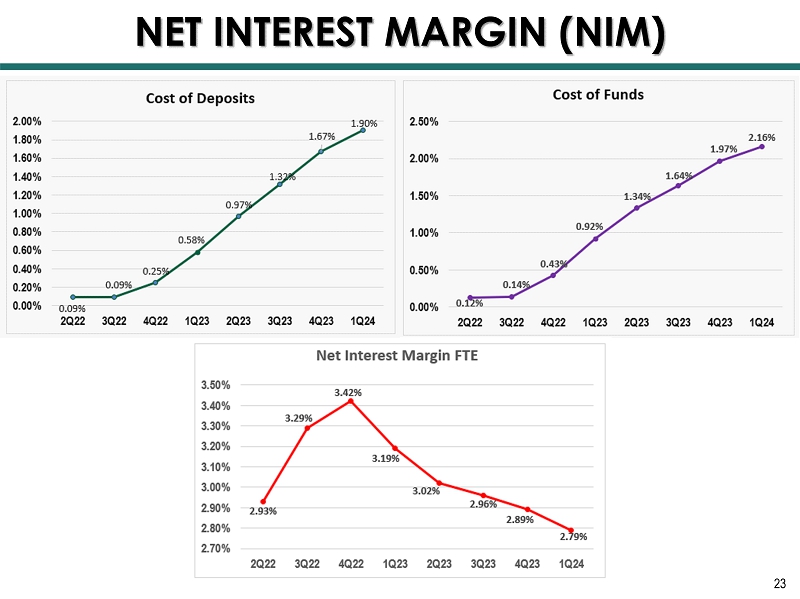
23 NET INTEREST MARGIN (NIM)
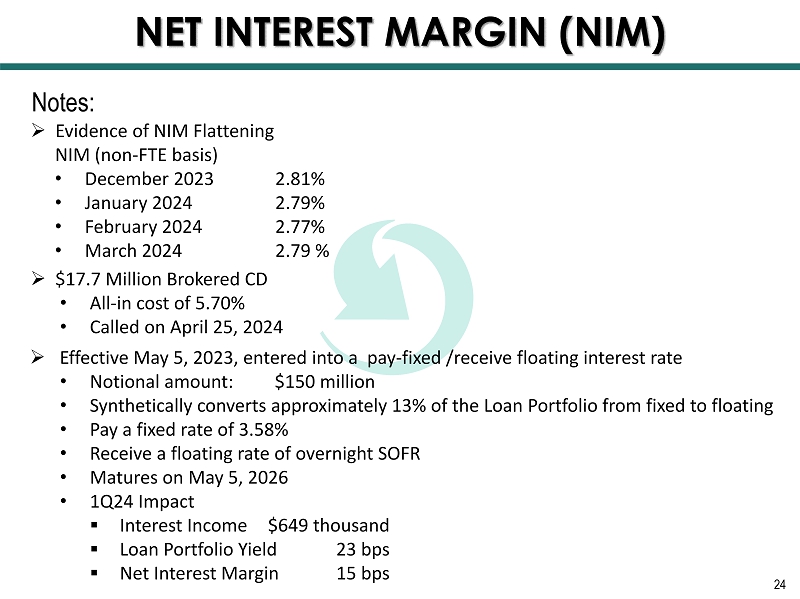
24 Notes: » Evidence of NIM Flattening NIM (non - FTE basis) • December 2023 2.81% • January 2024 2.79% • February 2024 2.77% • March 2024 2.79 % » $17.7 Million Brokered CD • All - in cost of 5.70% • Called on April 25, 2024 » Effective May 5, 2023, entered into a pay - fixed /receive floating interest rate • Notional amount: $150 million • Synthetically converts approximately 13% of the Loan Portfolio from fixed to floating • Pay a fixed rate of 3.58% • Receive a floating rate of overnight SOFR • Matures on May 5, 2026 • 1Q24 Impact ▪ Interest Income $649 thousand ▪ Loan Portfolio Yield 23 bps ▪ Net Interest Margin 15 bps NET INTEREST MARGIN (NIM)
RISK MANAGEMENT Impacting Lives for Success and Significance
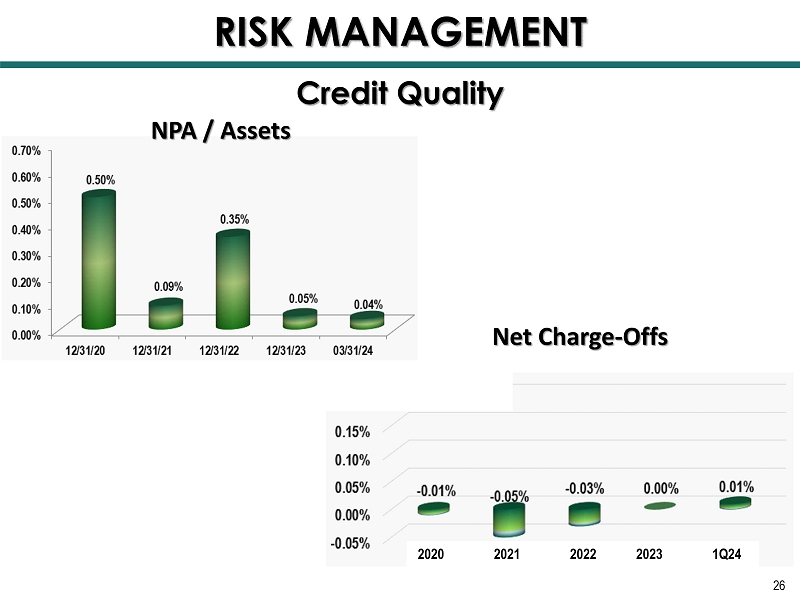
26 Credit Quality RISK MANAGEMENT 2020 2021 2022 2023 1Q24 NPA / Assets Net Charge - Offs
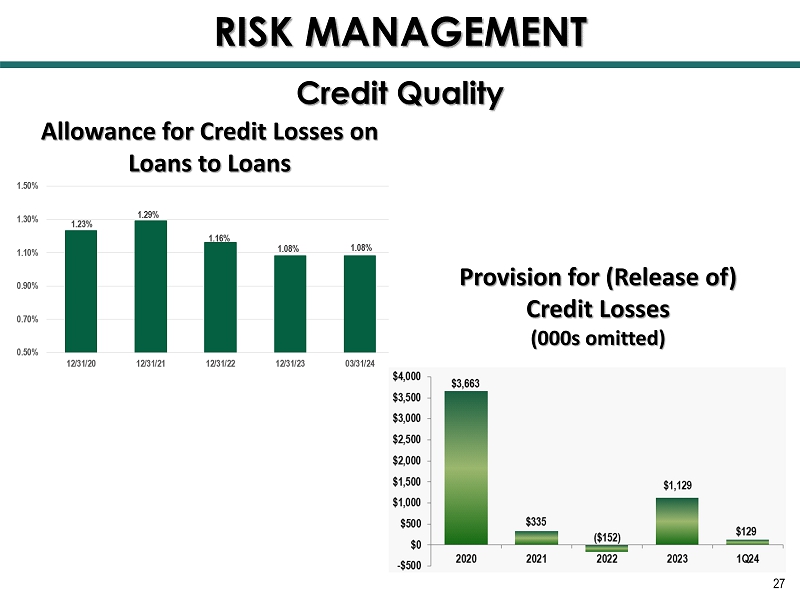
27 Allowance for Credit Losses on Loans to Loans Provision for (Release of) Credit Losses (000s omitted) Credit Quality RISK MANAGEMENT
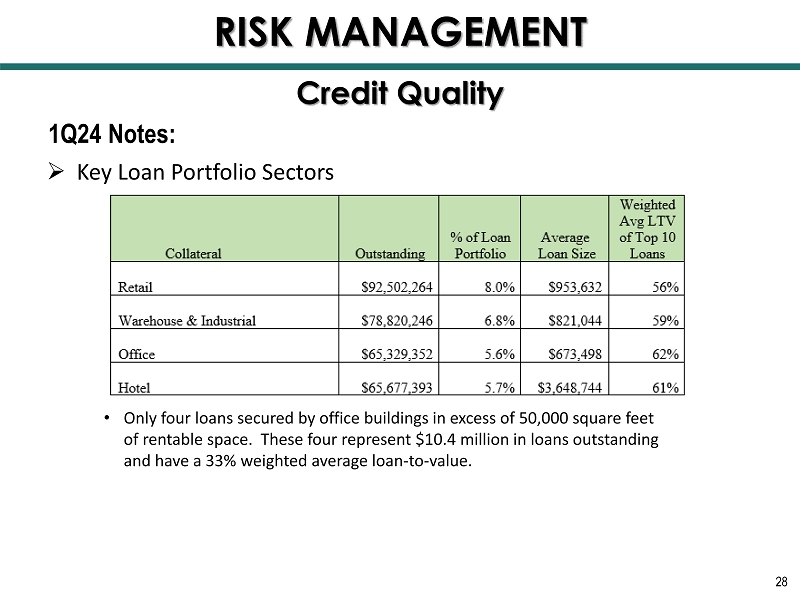
1Q24 Notes: » Key Loan Portfolio Sectors 28 • Only four loans secured by office buildings in excess of 50,000 square feet of rentable space. These four represent $10.4 million in loans outstanding and have a 33% weighted average loan - to - value. Credit Quality RISK MANAGEMENT
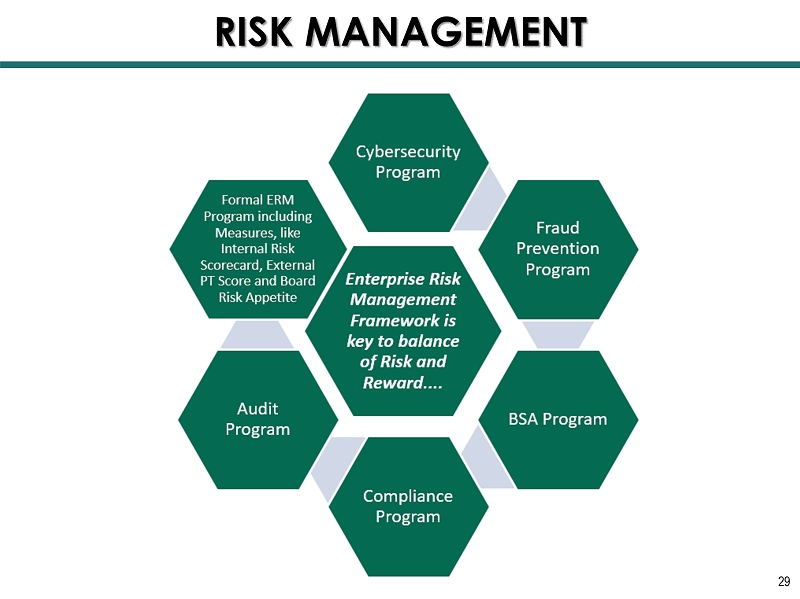
29 RISK MANAGEMENT
CAPITAL Impacting Lives for Success and Significance
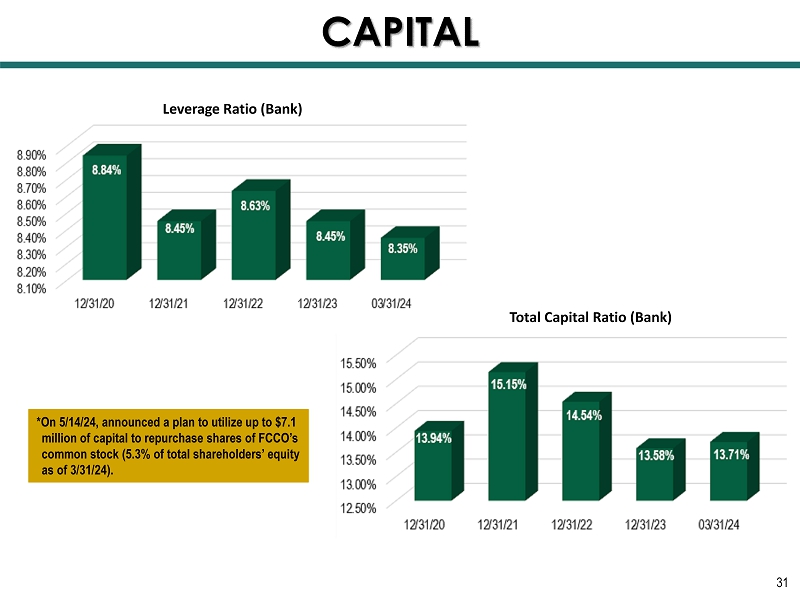
31 Leverage Ratio (Bank) Total Capital Ratio (Bank) CAPITAL *On 5/14/24, announced a plan to utilize up to $7.1 million of capital to repurchase shares of FCCO’s common stock (5.3% of total shareholders’ equity as of 3/31/24).
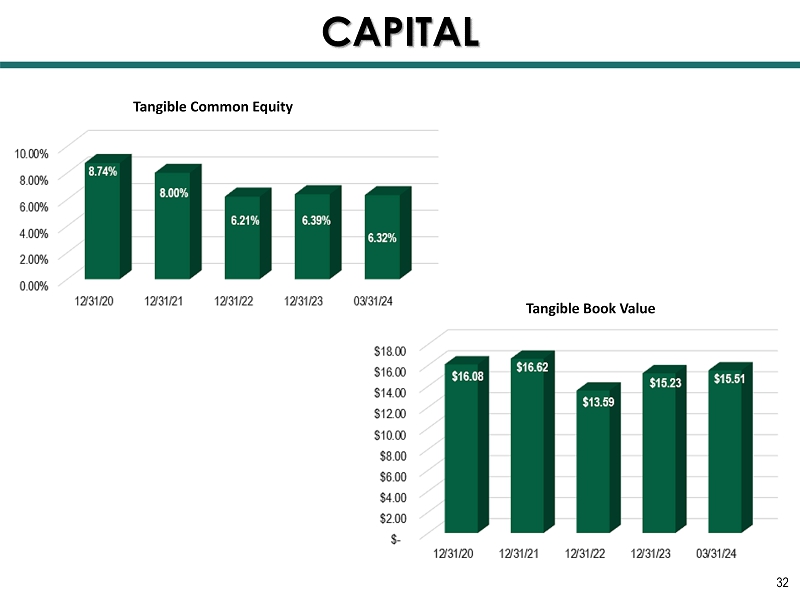
32 Tangible Common Equity Tangible Book Value CAPITAL
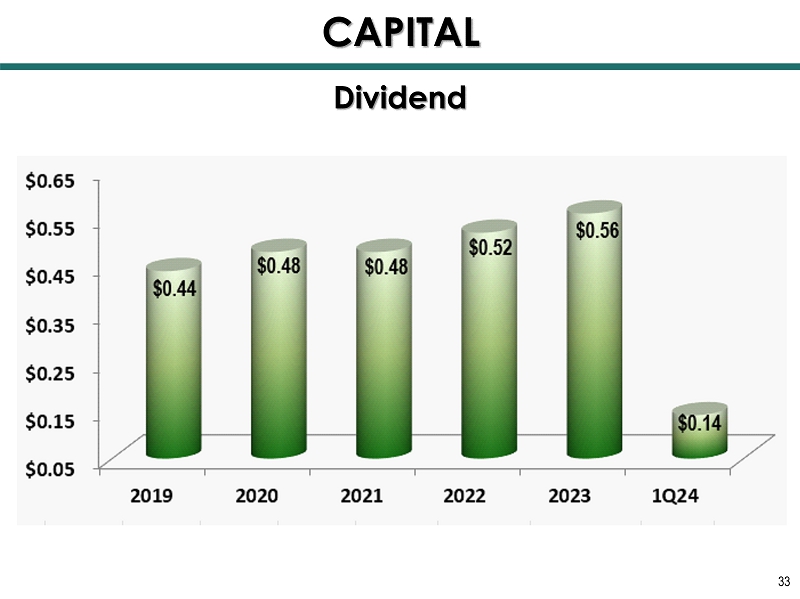
Dividend 33 CAPITAL
NON - INTEREST INCOME HIGHLIGHTS Impacting Lives for Success and Significance
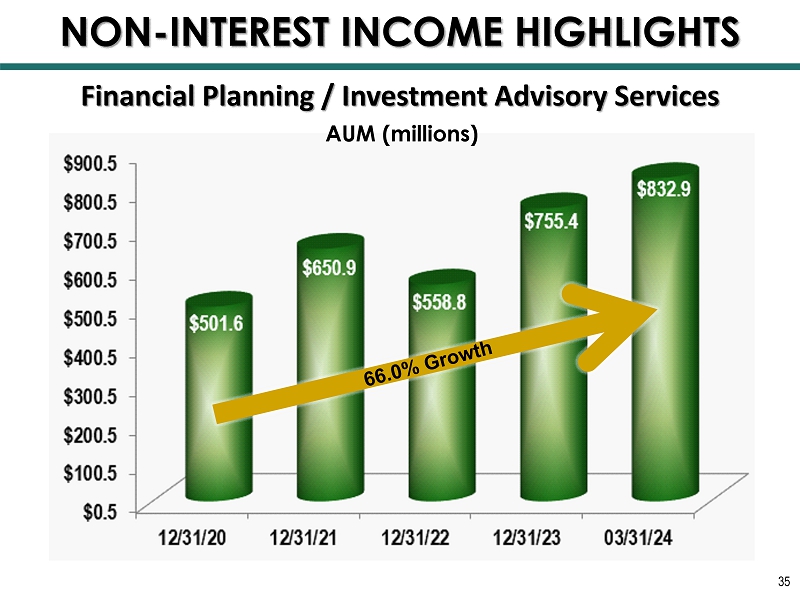
Financial Planning / Investment Advisory Services AUM (millions) 35 NON - INTEREST INCOME HIGHLIGHTS
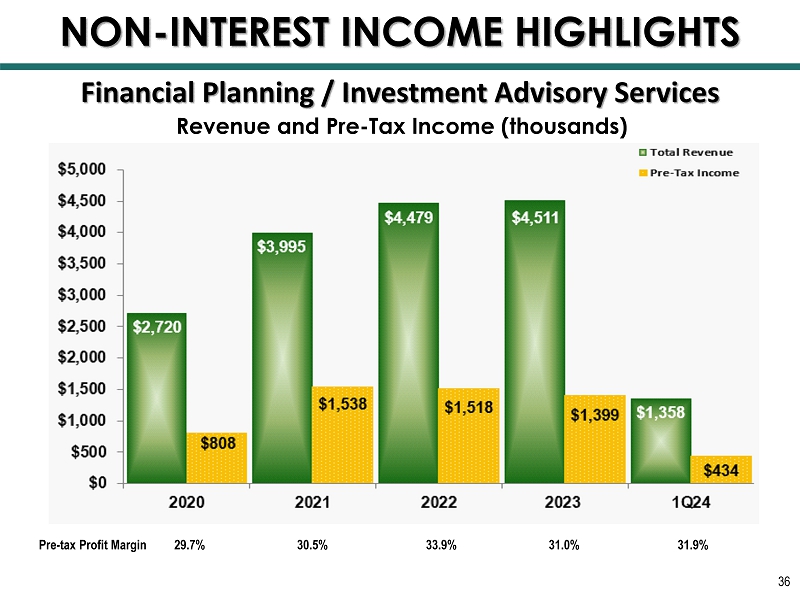
Financial Planning / Investment Advisory Services Revenue and Pre - Tax Income (thousands) 36 Pre - tax Profit Margin 29.7% 30.5% 33.9% 31.0% 31.9% NON - INTEREST INCOME HIGHLIGHTS
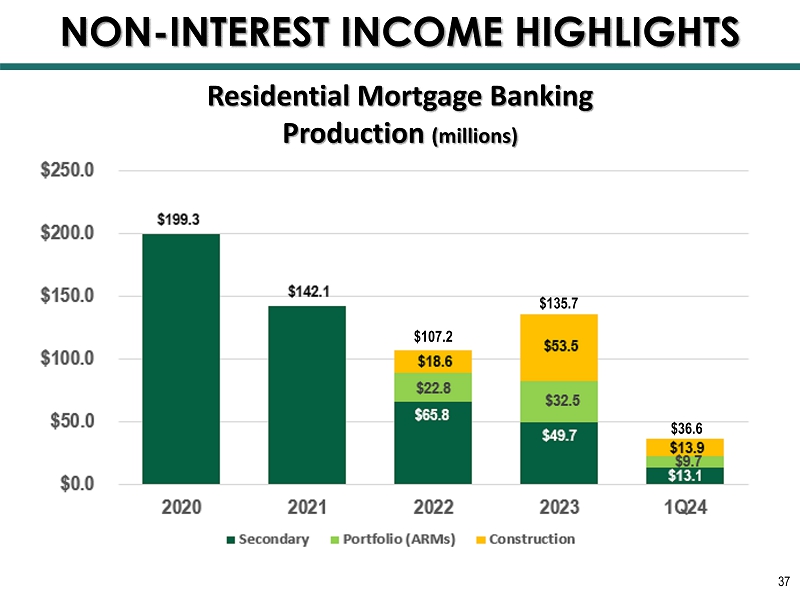
37 Residential Mortgage Banking Production (millions) NON - INTEREST INCOME HIGHLIGHTS $36.6 $107.2 $135.7
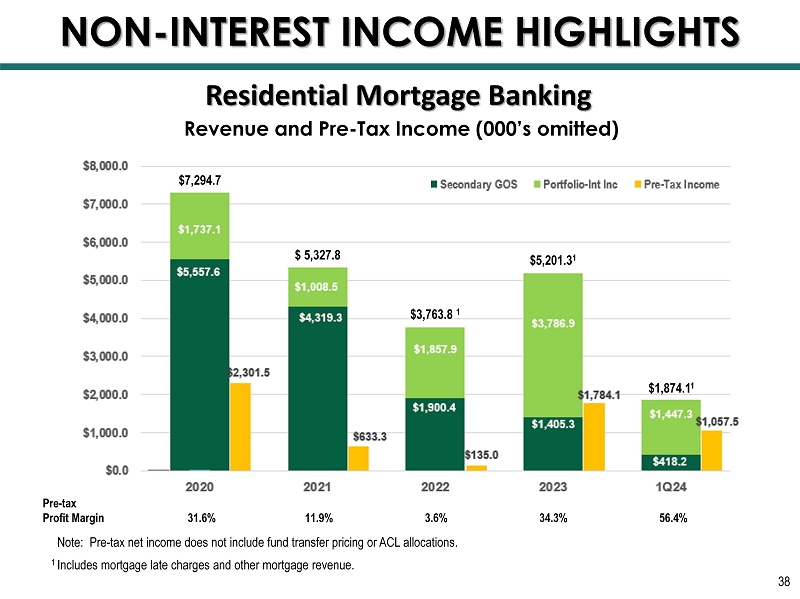
Pre - tax Profit Margin 31.6% 11.9% 3.6% 34.3% 56.4% Residential Mortgage Banking Revenue and Pre - Tax Income (000’s omitted) 38 $7,294.7 $ 5,327.8 $1,874.1 1 $3,763.8 1 $5,201.3 1 Note: Pre - tax net income does not include fund transfer pricing or ACL allocations. 1 Includes mortgage late charges and other mortgage revenue. NON - INTEREST INCOME HIGHLIGHTS

REVENUE Impacting Lives for Success and Significance
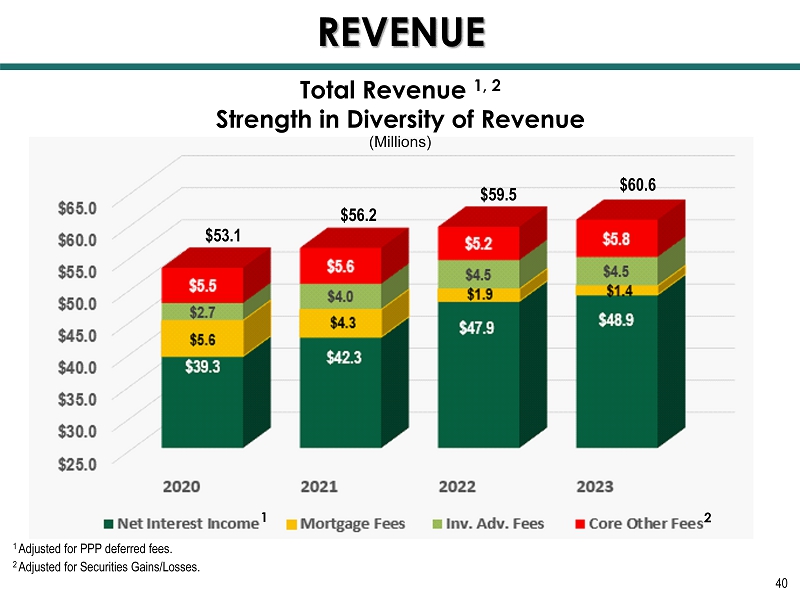
40 (Millions) $53.1 $56.2 $60.6 $59.5 Total Revenue 1, 2 Strength in Diversity of Revenue REVENUE 1 Adjusted for PPP deferred fees. 2 Adjusted for Securities Gains/Losses. 2 1
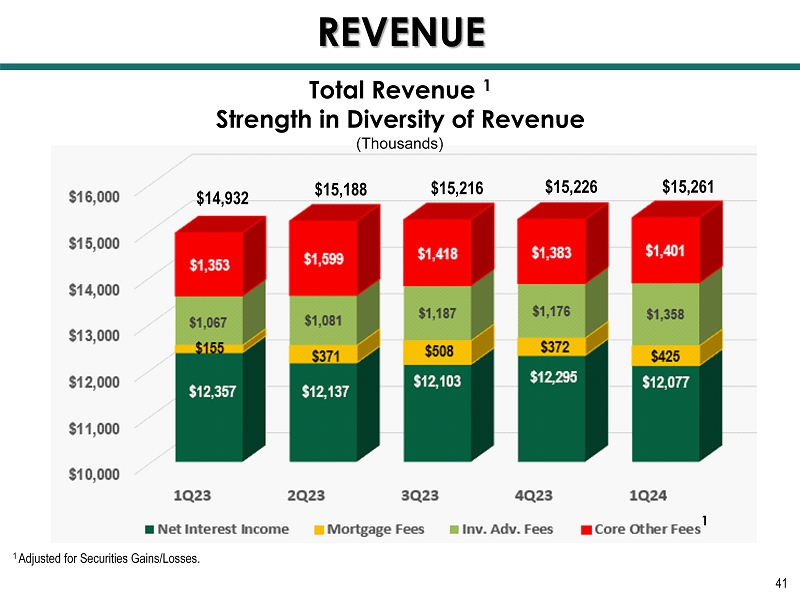
41 (Thousands) $14,932 $15,188 $15,261 $15,226 Total Revenue 1 Strength in Diversity of Revenue 1 Adjusted for Securities Gains/Losses. 1 $15,216 REVENUE
NON - INTEREST EXPENSE Impacting Lives for Success and Significance
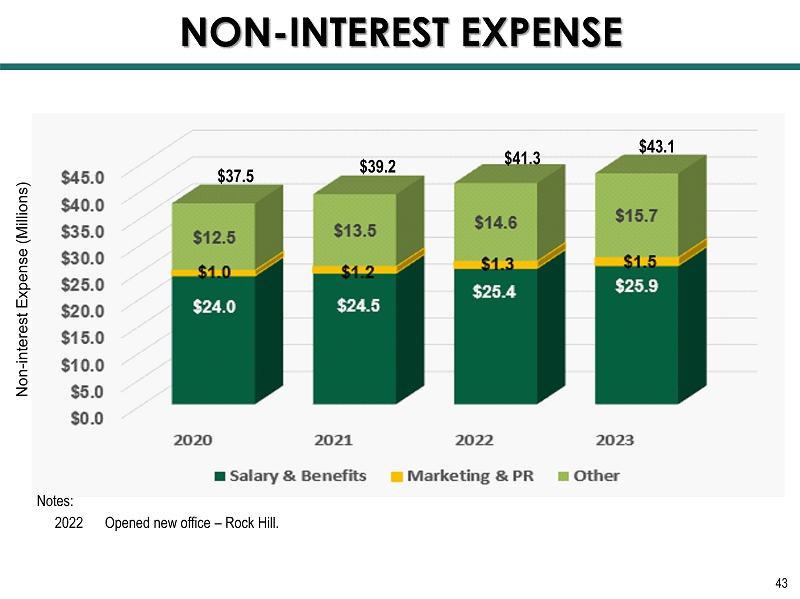
NON - INTEREST EXPENSE 43 Non - interest Expense (Millions) $37.5 $39.2 $43.1 Notes: 2022 Opened new office – Rock Hill. $41.3
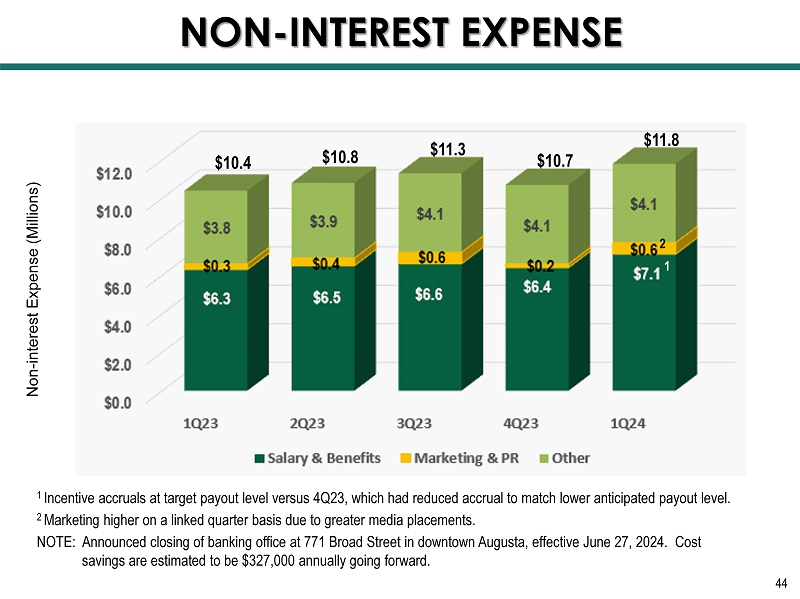
NON - INTEREST EXPENSE 44 Non - interest Expense (Millions) $10.4 $10.8 $11.8 1 Incentive accruals at target payout level versus 4Q23, which had reduced accrual to match lower anticipated payout level. 2 Marketing higher on a linked quarter basis due to greater media placements. NOTE: Announced closing of banking office at 771 Broad Street in downtown Augusta, effective June 27, 2024. Cost savings are estimated to be $327,000 annually going forward. $11.3 $10.7 1 2
NET INCOME Impacting Lives for Success and Significance
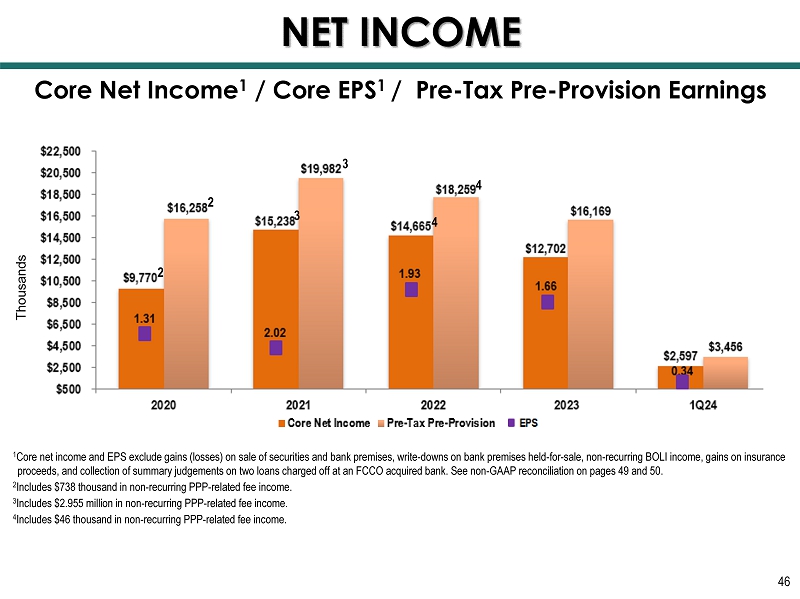
1 Core net income and EPS exclude gains (losses) on sale of securities and bank premises, write - downs on bank premises held - for - sa le, non - recurring BOLI income, gains on insurance proceeds, and collection of summary judgements on two loans charged off at an FCCO acquired bank. S ee non - GAAP reconciliation on pages 49 and 50. 2 Includes $738 thousand in non - recurring PPP - related fee income. 3 Includes $2.955 million in non - recurring PPP - related fee income. 4 Includes $46 thousand in non - recurring PPP - related fee income. Thousands Core Net Income 1 / Core EPS 1 / Pre - Tax Pre - Provision Earnings 46 NET INCOME 2 3 2 3 4 4
FORWARD - LOOKING STATEMENTS 47 SAFE HARBOR STATEMENT – In this presentation, unless the context suggests otherwise, references to the “Company” or “FCCO” refer to First Community Corporation and references to “we,” “us,” and “our” mean the combined business of the Company, First Community Bank (or FCB) and its wholly - owned subsidiaries . This presentation and other written reports and statements made by us and our management from time to time may contain forward - looking statements . These statements include, without limitation, statements regarding our operating philosophy, growth plans and opportunities, strategies and financial performance, industry and economic trends and estimates and assumptions underlying accounting policies . Words such as “believe,” “expect,” “anticipate,” “intend,” “target,” “estimate,” “focus,” “continue,” “positions,” “plan,” “predict,” “project,” “forecast,” “guidance,” “goal,” “objective,” “prospects,” “possible” or “potential,” by future conditional verbs such as “assume,” “will,” “would,” “should,” “could” or “may,” or by variations of such words or by similar expressions are intended to identify such forward - looking statements . These forward - looking statements are subject to numerous assumptions, risks and uncertainties, which change over time, are difficult to predict and are generally beyond our control . Although we believe that the assumptions underlying the forward - looking statements are reasonable, any of the assumptions could prove to be inaccurate . Therefore, we can give no assurance that the results contemplated in the forward - looking statements will be realized . The inclusion of this forward - looking information should not be construed as a representation by the Company or any other person that such future events, plans, or expectations will occur or be achieved . In addition to factors previously disclosed in the reports filed by us with the US Securities and Exchange Commission (the “SEC”), additional risks and uncertainties may include, but are not limited to : ( 1 ) competitive pressures among depository and other financial institutions may increase significantly and have an effect on pricing, spending, third - party relationships and revenues ; ( 2 ) the strength of the US economy in general and the strength of the local economies in which we conduct operations may be different than expected, including unemployment levels, supply chain disruptions, higher inflation, and slowdowns in economic growth ; ( 3 ) the rate of delinquencies and amounts of charge - offs, the level of allowance for credit loss, the rates of loan growth, or adverse changes in asset quality in our loan portfolio, which may result in increased credit risk - related losses and expenses ; ( 4 ) changes in legislation, regulation, policies, or administrative practices, whether by judicial, governmental, or legislative action ; ( 5 ) adverse conditions in the stock market, the public debt markets and other capital markets (including changes in interest rate conditions) could have a negative impact on the Company ; ( 6 ) technology and cybersecurity risks, including potential business disruptions, reputational risks, and financial losses, associated with potential attacks on or failures by our computer systems and computer systems of our vendors and other third parties ; ( 7 ) inflation and changes in the interest rate environment that reduce our margins or reduce the fair value of financial instruments ; and ( 8 ) the ultimate ramifications, if any, of the 2023 and 2024 bank failures with respect to increased regulatory supervision and any increases in the costs of doing business . Additional factors that could cause results to differ materially from those described in the forward - looking statements can be found in our reports (such as the annual report on Form 10 - K, quarterly reports on Form 10 - Q and current reports on Form 8 - K) filed with the SEC and available at the SEC’s internet site (http : //www . sec . gov) . All subsequent written and oral forward - looking statements by us or any person acting on our behalf is expressly qualified in its entirety by the cautionary statements above . The foregoing review of important factors should not be construed as exhaustive and should be read in conjunction with other cautionary statements that are included herein . We undertake no obligation to update or revise any forward - looking statement, whether as a result of new information, future events or otherwise, except as required by law .
NON - GAAP FINANCIAL MEASURES The Bank Behind Your Business 48 NON - GAAP FINANCIAL MEASURES – This presentation contains certain non - GAAP financial measures that are not in accordance with US generally accepted accounting principles (GAAP) . We use certain non - GAAP financial measures to provide meaningful, supplemental information regarding our operational results and to enhance investors’ overall understanding of our financial performance . The limitations associated with non - GAAP financial measures include the risk that persons might disagree as to the appropriateness of items comprising these measures and that different companies might calculate these measures differently . These disclosures should not be considered an alternative to our GAAP results . See the end of this presentation for a non - GAAP financial measures reconciliation to the most directly comparable GAAP financial measure .
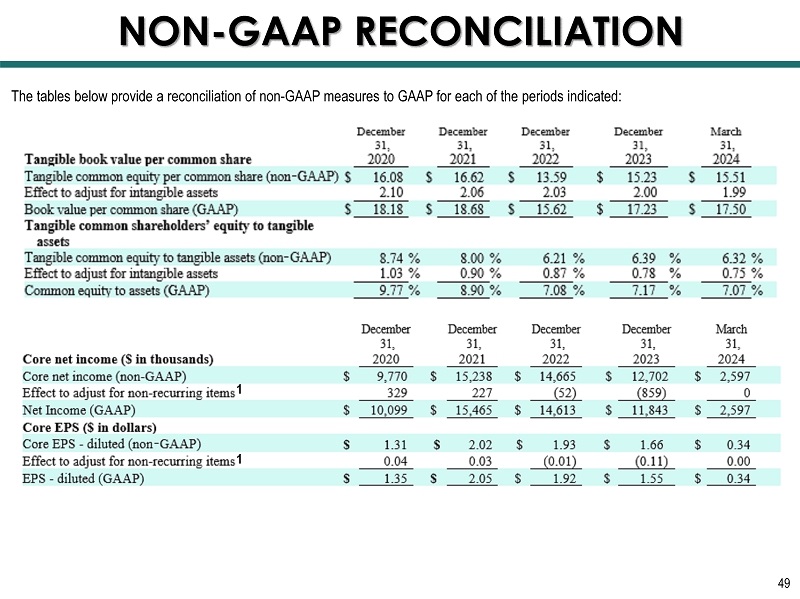
NON - GAAP RECONCILIATION 49 The tables below provide a reconciliation of non - GAAP measures to GAAP for each of the periods indicated: 1 1
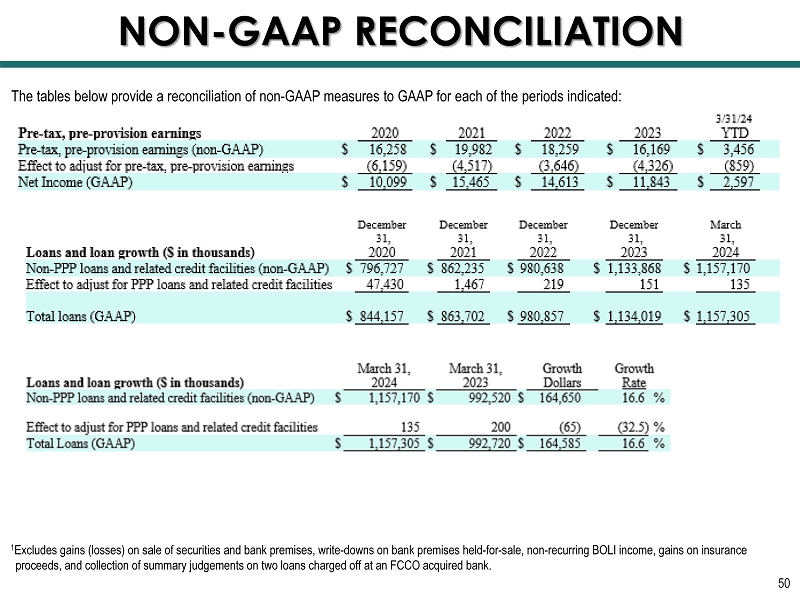
NON - GAAP RECONCILIATION 50 1 Excludes gains (losses) on sale of securities and bank premises, write - downs on bank premises held - for - sale, non - recurring BOLI income, gains on insuranc e proceeds, and collection of summary judgements on two loans charged off at an FCCO acquired bank. The tables below provide a reconciliation of non - GAAP measures to GAAP for each of the periods indicated: