As filed with the U.S. Securities and Exchange
Commission on April 29, 2024
UNITED STATES
SECURITIES AND EXCHANGE COMMISSION
Washington, D.C. 20549
FORM 20-F
☐ REGISTRATION STATEMENT PURSUANT TO SECTION 12(b) OR (g) OF THE SECURITIES EXCHANGE ACT OF 1934
OR
☒ ANNUAL REPORT PURSUANT TO SECTION 13 OR 15(d) OF THE SECURITIES EXCHANGE ACT OF 1934
For the fiscal year ended December 31, 2023
OR
☐ TRANSITION REPORT PURSUANT TO SECTION 13 OR 15(d) OF THE SECURITIES EXCHANGE ACT OF 1934
OR
☐ SHELL COMPANY REPORT PURSUANT TO SECTION 13 OR 15(d) OF THE SECURITIES EXCHANGE ACT OF 1934
Commission file number 001-35401
CEMENTOS PACASMAYO S.A.A.
(Exact name of Registrant as specified in its
charter)
PACASMAYO CEMENT CORPORATION
(Translation of Registrant’s name into
English)
Republic of Peru
(Jurisdiction of incorporation or organization)
Calle La Colonia 150, Urbanización El
Vivero
Surco, Lima
Peru
(Address of principal executive offices)
Javier Durand, Esq., General Counsel
Tel. +51-1-317-6000
Calle La Colonia 150
Urb. El Vivero - Lima, Peru
(Name, telephone, email and/or facsimile number
and address of company contact person)
Securities registered pursuant to Section 12(b)
of the Act.
| Title
of each class |
|
Trading
Symbol(s) |
|
Name
of each exchange on which registered |
| Common Shares, par value S/1.00
per share, in the form of American Depositary Shares, each representing five Common Shares |
|
CPAC |
|
New York Stock Exchange |
Securities registered pursuant to Section 12(g)
of the Act: None
Securities for which there is a reporting obligation
pursuant to Section 15(d) of the Act: None
Indicate the number of outstanding shares of each
of the issuer’s classes of capital or common stock as of the close of the period covered by the annual report:
| At December 31, 2023 | 423,868,449 common shares 4,238,397 investment shares* |
| * | Excluding 36,040,497 investment shares held in treasury. |
Indicate by check mark if
the Registrant is a well-known seasoned issuer, as defined in Rule 405 of the Securities Act. Yes ☐
No ☒
If this report is an annual
or transition report, indicate by check mark if the Registrant is not required to file reports pursuant to Section 13 or 15(d) of the
Securities Exchange Act of 1934. Yes ☐ No ☒
Note- Checking the box above
will not relieve any registrant required to file reports pursuant to Section 13 or 15(d) of the Securities Exchange Act of 1934 from their
obligations under those Sections.
Indicate by check mark whether
the Registrant (1) has filed all reports required to be filed by Section 13 or 15(d) of the Securities Exchange Act of 1934 during the
preceding 12 months (or for such shorter period that the Registrant was required to file such reports), and (2) has been subject to such
filing requirements for the past 90 days. Yes ☒ No ☐
Indicate by check mark whether
the Registrant has submitted electronically every Interactive Data File required to be submitted and posted pursuant to Rule 405 of Regulation
S-T (§ 203.405 of this chapter) during the preceding 12 months (or for such other period that the registrant was required to submit
and post such files).
Yes ☒
No ☐
Indicate by check mark whether
the Registrant is a large accelerated filer, an accelerated filer, a non-accelerated filer or an emerging growth company. See definition
of “large accelerated filer,” “accelerated filer,” and “emerging growth company” in Rule 12b-2 of
the Exchange Act. (Check one):
| Large accelerated filer ☐ | Accelerated filer ☒ | Non-accelerated filer ☐ |
| | | Emerging growth company ☐ |
If an emerging growth company
that prepares its financial statements in accordance with U.S. GAAP, indicate by check mark if the registrant has elected not to use the
extended transition period for complying with any new or revised financial accounting standards† provided pursuant to Section 13(a)
of the Exchange Act. ☐
† The term “new
or revised financial accounting standard” refers to any update issued by the Financial Accounting Standards Board to its Accounting
Standards Codification after April 5, 2012.
Indicate by check mark whether
the registrant has filed a report on and attestation to its management’s assessment of the effectiveness of its internal control
over financial reporting under Section 404(b) of the Sarbanes-Oxley Act (15 U.S.C. 7262(b)) by the registered public accounting firm that
prepared or issued its audit report. ☒
If securities are registered
pursuant to Section 12(b) of the Act, indicate by check mark whether the financial statements of the Registrant included in the filing
reflect the correction of an error to previously issued financial statements. ☐
Indicate by check mark whether
any of those error corrections are restatements that required a recovery analysis of incentive-based compensation received by any of the
Registrant’s executive officers during the relevant recovery period pursuant to §240.10D-1(b). ☐
Indicate by check mark which
basis of accounting the Registrant has used to prepare the financial statements included in this filing:
| U.S. GAAP ☐ | International Financial Reporting Standards as issued by the International Accounting Standards Board ☒ | Other ☐ |
If “Other” has been checked
in response to the previous question, indicate by check mark which financial statement item the Registrant has elected to follow. Item
17 ☐ Item 18 ☐
If this is an annual report,
indicate by check mark whether the Registrant is a shell company (as defined in Rule 12b-2 of the Exchange Act). Yes ☐
No ☒
PART
I
INTRODUCTION
Certain Definitions
All references to “we,”
“us,” “our,” “our company,” “Pacasmayo,” and “Cementos Pacasmayo” in this
annual report are to Cementos Pacasmayo S.A.A., a publicly held corporation (sociedad anónima abierta) organized under the
laws of Peru, and, unless the context requires otherwise, its consolidated subsidiaries. References to “our controlling shareholder”
are to Inversiones ASPI S.A. The term “U.S. dollar” or “U.S. dollars” and the symbol “US$” refer to
the legal currency of the United States; and the term “sol” or “soles” and the symbol “S/”
refer to the legal currency of Peru.
Financial Information
Our consolidated financial
statements included in this annual report have been prepared in soles and in accordance with International Financial Reporting
Standards (“IFRS”) as issued by the International Accounting Standards Board (“IASB”) and audited in accordance
with the standards of the Public Company Accounting Oversight Board (United States).
We have translated some of
the soles amounts appearing in this annual report into U.S. dollars for convenience purposes only. Unless the context otherwise
requires, the rate used to translate soles amounts to U.S. dollars was S/3.709 to US$1.00, which was the average accounting exchange
rate (tipo de cambio contable) reported on December 31, 2023, by the Peruvian Superintendence of Banks, Insurance and Private Pension
Fund Administrators (Superintendencia de Banca, Seguros y AFPs, or “SBS”). The Federal Reserve Bank of New York
does not report a noon buying rate for soles. The U.S. dollar equivalent information presented in this annual report is provided
solely for convenience of the reader and should not be construed as implying that the soles amounts represent, or could have been
or could be converted into, U.S. dollars at such rates or at any other rate.
Certain figures included in
this annual report have been subject to rounding adjustments. Accordingly, figures shown as totals in certain tables may not be arithmetic
aggregations of the figures that precede them.
In this annual report, we
present EBITDA, EBITDA margin, adjusted EBITDA and adjusted EBITDA margin, which are financial measures that are not recognized under
IFRS. We refer to such financial measures as “non-IFRS” financial measures. A non-IFRS financial measure is generally defined
as one that purports to measure financial performance, financial position or cash flows of the subject reporting company but excludes
or includes amounts that would not be so adjusted in the most comparable IFRS measure. We present EBITDA and adjusted EBITDA, and EBITDA
margin and adjusted EBITDA margin because we believe they provide the reader with supplemental measures of the financial performance of
our core operations that facilitate period-to-period comparisons on a consistent basis. EBITDA, adjusted EBITDA, EBITDA margin and adjusted
EBITDA margin should not be used as an alternative to profit or operating profit, operating margin as an indicator of operating performance,
as an alternative to cash flow provided by operating activities or as a measure of liquidity (in each case, as determined in accordance
with IFRS). EBITDA, EBITDA margin, adjusted EBITDA and adjusted EBITDA margin, as calculated by us, may not be comparable to similarly
titled measures reported by other companies, including those in the cement industry. For a calculation of EBITDA and adjusted EBITDA and
a reconciliation of EBITDA and adjusted EBITDA to the most directly comparable IFRS financial measure, see “Item 4. Information
on the Company—B. Business Overview—Overview.” EBITDA margin is equal to EBITDA divided by sales of goods. Adjusted
EBITDA margin is equal to adjusted EBITDA divided by sales of goods.
Market Information
We make estimates in this
annual report regarding our competitive position and market share, as well as the market size and expected growth of the construction
sector and cement industry in Peru. We have made these estimates on the basis of our management’s knowledge and statistics and other
information available from the following sources:
| ● | the Central Bank of Peru (Banco Central de Reserva del Perú, or the “BCRP”); |
| ● | the National Statistical Institute of Peru (Instituto Nacional de Estadística e Informática,
or “INEI”); |
| ● | the Association of Cement Producers of Peru (Asociación de Productores de Cemento, or “ASOCEM”); |
| ● | the Ministry of Housing, Construction and Sanitation (Ministerio de Vivienda, Construcción y
Saneamiento);; |
| ● | ADUANET, a website administered by the Peruvian Tax Superintendence (Superintendencia Nacional de Administración
Tributaria, or “SUNAT”); |
| ● | the Peruvian Chamber of Construction (Cámara Peruana de la Construcción); and |
| ● | the Global Competitiveness Index prepared by the World Economic Forum. |
We believe these estimates
to be accurate as of the date of this annual report.
Forward-Looking Statements
This annual report contains
forward-looking statements. Forward-looking statements convey our current expectations or forecasts of future events. These statements
involve known and unknown risks, uncertainties and other factors, including those listed under “Item 3. Key Information –
D. Risk Factors,” which may cause our actual results, performance or achievements to differ materially from the forward-looking
statements that we make.
Forward-looking statements
typically are identified by words or phrases such as “may,” “will,” “expect,” “anticipate,”
“aim,” “estimate,” “intend,” “project,” “plan,” “believe,” “potential,”
“continue,” “is/are likely to,” or other similar expressions. Any or all of our forward- looking statements in
this annual report may turn out to be inaccurate. Our actual results could differ materially from those contained in forward-looking statements
due to a number of factors, including:
| ● | political, economic and social risk inherent to conducting business in Peru; |
| ● | exchange rates, inflation rates and interest rates; |
| ● | the entry of new competitors into the market we serve; |
| ● | construction activity levels, particularly in the northern region of Peru; |
| ● | private investment and public spending in construction projects; |
| ● | natural disasters, such as floods and earthquakes affecting the northern region of Peru, and global events,
such as public health crises and epidemics/pandemics and the worldwide effects thereof and responses thereto; |
| ● | availability and prices of energy, admixtures and raw materials; |
| ● | changes in the regulatory framework, including tax, environmental and other laws; |
| ● | the successful expansion of our production capacity; |
| ● | our ability to compete with potential substitutes of cement products that may be introduced in the Peruvian
construction industry; |
| ● | our ability to maintain and expand our distribution network; |
| ● | international conflicts, such as the current one between Russia and
Ukraine and Israel and Hamas, and the worldwide effects and responses thereto |
| ● | our ability to retain and attract skilled employees; and |
| ● | other factors discussed under “Item 3. Key Information—D. Risk Factors.” |
The forward-looking statements
in this annual report represent our expectations and forecasts as of the date of the filing of this annual report. Except as required
by law, we undertake no obligation to update or revise publicly any forward-looking statements, whether as a result of new information,
future events or otherwise, after the date of this annual report.
ITEM 1. IDENTITY OF DIRECTORS, SENIOR MANAGEMENT AND ADVISERS
Not applicable.
ITEM 2. OFFER STATISTICS AND EXPECTED TIMETABLE
Not applicable.
ITEM 3. KEY INFORMATION
A. [Reserved]
B. Capitalization and Indebtedness
Not applicable.
C. Reasons for the Offer and Use of Proceeds
Not applicable.
D. Risk Factors
Global Macroeconomic Conditions
Global macroeconomic
conditions may have an adverse effect on our business, financial condition and results of operations.
Our operations and customers
are located in Peru. As a result, our business, financial condition and results of operations, like those of most companies in Peru, may
be adversely affected by the level of economic activity in the country. However, economic activity in Peru is significantly affected by
global factors. The United States, China and Europe are important recipients of Peru’s exports, and therefore a slowdown in one
or more of these economies will affect Peru’s economic activity. Further, natural resources exports, particularly mining, are the
main source of income of the Peruvian economy, and therefore any reduction in demand and/or pricing for these exports will have a significant
effect on economic activity in Peru, and hence could adversely affect the demand for our products.
During 2023, world economic
activity was affected by the continuing Russia-Ukraine war, as well as the war between Israel and Hamas, and by rising inflation rates.
The world economy showed moderate growth, due in part to the dynamism of the economies of the United States and India, in spite of a sharp
contraction in China and the unfavorable evolution of Europe. The global manufacturing sector remained stagnant during 2023, principally
as a result of the lack of dynamism in global trade, particularly trade in goods, mainly due to the disruptions in maritime trade that
raised transportation costs, particularly container shipping. Container shipping costs increased, in part, because the Panama Canal was
affected by droughts, which led to restrictions and transportation delays. Separately, the attacks in the Red Sea area caused the major
shipping companies to divert their ships away from transit through the Suez Canal to other routes, such as the circumnavigation of Africa
through the Cape of Good Hope. Although these shipping transportation pressures have recently decreased, increases in shipping costs remains
a risk factor for global growth. We produce and sell all of our products within Peru, and are therefore less exposed to these global factors,
but an overall increase in freight costs could affect our ability to import some third-party raw materials and therefore affect our results
of operations, and we may still experience indirect impacts, such as rising inflation rates.
The cement sector is closely
related to the following main macroeconomic variables: (i) the expansion or contraction of the economy as measured by gross domestic product
(“GDP”), (ii) domestic demand, (iii) private investment and (iv) public spending. In this regard, prolonged conditions, at
the global level, that adversely affect one or more of these variables would negatively affect the cement sector, which may have an adverse
effect on our business, financial condition and results of operations.
International conflicts,
such as the current war between Russia and Ukraine, and the war between Israel and Hamas, as well as other geopolitical tensions or conflicts
have put upward pressure on international prices, increasing inflation, and therefore could adversely affect our business, financial condition,
and results of operations.
Russia’s full-scale
invasion of Ukraine in February 2022 and Israel’s invasion of Gaza in October 2023 have created economic uncertainty, volatility
and disruption in global markets. Although the length and impact of these conflicts are highly unpredictable, to date, they have had an
adverse effect on global economic conditions and business activity globally and have led to (i) credit and capital market disruptions,
(ii) increases in interest rates and inflation in the market in which we operate and (iii) lower global growth, among others. In addition,
the Russia-Ukraine war has caused interruptions in the trade flows of goods produced in those countries (mainly energy and grains) which,
in turn, generated upward pressure on international prices of those goods.
Similar pressures have been
observed in the price of energy. Russia is a major producer of natural gas, oil and coal. Production and commercial activities have been
affected by direct and indirect sanctions. Peru is a net importer of oil, and as such it has been affected by increased prices, which
led to above-average inflation levels in 2023. Moreover, we use coal in our operations that, although mostly sourced locally, has a price
that is correlated to the global price of energy. Likewise, according to our electricity contracts, payments for electricity are based
on a formula that takes into consideration certain market variables, such as the U.S. purchase price index, the global price of oil, the
local price of natural gas and the import price of bituminous coal. If energy prices increase globally, our local price of energy will
also increase, therefore affecting our results of operation.
Geopolitical and economic
risks have also increased over the past few years as a result of trade tensions between the United States and China, and the rise of populism
and tensions in South America and Europe. The foregoing conflicts and any other geopolitical tensions may lead, among others, to a de-globalization
of the world economy, an increase in protectionism or barriers to immigration, a general reduction of international trade in goods and
services, or a reduction in the integration of financial markets. For our company, the inflationary pressures generated by these conflicts
and/or de-globalization could adversely affect our business, financial condition and results of operations.
Increases in global
freight costs could adversely affect international prices, which, in turn, may increase inflation and therefore adversely affect our business,
financial condition and results of operations.
Although global freight prices
have decreased from the peak levels experienced in the past two years, during 2023, certain adverse developments continued to put pressure
on these prices. During the second half of the year, attacks on commercial vessels in the Red Sea caused increases in costs relating to
re-rerouting commercial vessels away from the Suez Canal. Although this route does not directly affect our business, prolonged increased
freight prices on this route can affect prices on other routes and therefore our business and results of operations. In addition, global
risks to the supply chain relating to climate effects, which impact maritime transport (such as the low water levels in the Panama Canal),
continue to adversely affect global freight prices. Likewise, geopolitical tensions in Europe, the Middle East and China, as well as continued
trade tensions between China and the United States, could generate new risks to the supply chain and corresponding increases in freight
prices.
Risks Relating to Peru
Political, social and
economic developments in Peru including political instability, rates of inflation and unemployment could have a material adverse effect
on our business, financial condition and results of operations.
All of our operations and
customers are located in Peru. Accordingly, our business, financial condition and results of operations depend on the level of economic
activity in Peru. Our business, financial condition and results of operations could be affected by changes in economic and other policies
of the Peruvian government (which has exercised and continues to exercise substantial influence over many aspects of the private sector),
and by other economic and political developments in Peru, including devaluation or depreciation, currency exchange controls, inflation,
economic downturns, political instability, corruption scandals, social disturbances and terrorism.
During the 1980s and the early
1990s, Peru experienced severe terrorist activity targeted against, among others, the government and the private sector. Since then, terrorist
activity in Peru has been mostly confined to small-scale operations in the Huallaga Valley and the Valleys of the Rivers Apurimac, Ene
and Mantaro, or “VRAEM,” areas, both in the Eastern part of the country. The Huallaga Valley and VRAEM constitute the largest
areas of coca cultivation in the country and thus serve as a hub for the illegal drug trade. Terrorist activity and the illegal drug trade
continue to be key challenges for Peruvian authorities. Any violence derived from the drug trade or a resumption of large-scale terrorist
activities which may occur could hurt our operations and could disrupt the economy of Peru and our business. In addition, Peru has recently
experienced social and political turmoil, including riots, nationwide protests, strikes and street demonstrations, as well as overall
lack of safety in the streets, extortions, among other crimes that affect personal security, and could therefore have an effect on demand
for our products and services and affect our business and results of operations.
In the past, Peru has experienced
political instability that included a succession of regimes with disparate economic policies and programs that created uncertainty for
domestic and foreign investors. Pedro Castillo became President of Peru, after a disputed election result in 2021. He faced political
opposition in the Peruvian Congress, which was highly fragmented, as no political party had achieved a clear majority and at least 10
political parties had minority representation, which led some groups in the Peruvian Congress to ask for his resignation. On December
7, 2022, President Castillo announced his decision to dissolve Congress, to intervene in the Judiciary, the Public Ministry, the Attorney
General’s Office, and the Constitutional Court, in addition to the scheduling of an election of a new Congress. These efforts by
President Castillo failed due to the immediate rejection by all government bodies, including the cabinet and the armed and police forces.
President Castillo was impeached that same day by Congress and arrested in transit to the Mexican embassy in Lima to request political
asylum. The then Vice President Dina Boluarte was sworn in as President in accordance with the line of constitutional succession.
The initial days of President
Boluarte’s term were characterized by strong protests in certain areas of the country. Her mandate is currently scheduled to end
in 2026. However, since the political opposition in the Peruvian Congress remains strong, no assurance can be given that impeachment motions
will not be presented to the Peruvian Congress against President Boluarte during the remainder of her term. We can provide no assurance
that protests will not escalate in the future. In addition, the Peruvian government may seek to modify and reform the Peruvian Constitution
to expand the role of the government in activities currently undertaken by the private sector in accordance with statements made during
the campaign of former President Castillo. Although it is expected that a majority of the Peruvian Congress would oppose certain new policies
and reforms, we can provide no assurance that policymaking by the government will not be unpredictable. We cannot assure you whether President
Boluarte or any of her successors will pursue business-friendly and open-market economic policies that stimulate economic growth and stability,
and that measures negatively impacting private investment, such as higher taxation or exchange controls, will not be implemented.
Economic activity of Peru
in 2023 was affected by climatic anomalies, such as Cyclone Yaku in the North of Peru, and the overall effects of coastal El Niño
Phenomenon, which lasted during much of the year (between April and November), and materialized in the form of rain in the north and anomalies
of marine and environmental temperatures. Variations in economic indicators such as inflation, “GDP”, the balance of payments,
the appreciation and depreciation of the national currency, access to credit, interest rates, investment and savings, consumption, spending
and fiscal income and employment rates, among other variables, over which we have no control, could affect the development of the Peruvian
economy and, therefore, could adversely affect our business, financial condition and results of operations.
Despite Peru’s ongoing
economic growth and continued stabilization, the social and political tensions and high levels of poverty and proper employment continue.
Future government policies to preempt or respond to social disturbances could include, among other things, expropriation, nationalization,
suspension of the enforcement of creditors’ rights and new taxation policies. These policies could adversely and materially affect
the Peruvian economy and our business.
A depreciation or devaluation
of the sol could have a material adverse effect on our business, financial condition and results of operations.
A significant depreciation
or devaluation of the sol may affect us due to the fact that our revenues are denominated in soles while 25.7% of our costs,
as of December 31, 2023, was denominated in U.S. dollars. As a result, we are exposed to currency mismatch risks. We expect to continue
reducing our U.S. dollar-denominated costs, since we stopped requiring imported clinker when our new kiln came on line during the second
half of 2023. Nonetheless, a depreciation or devaluation of the sol against the U.S. dollar and increased exchange rate volatility
would increase the cost of our debt service obligations which could have a material adverse effect on our business, financial condition
and results of operations.
The implementation of
restrictive exchange rate policies and other similar laws by the Peruvian government could adversely affect our business, financial condition
and results of operations.
Since 1991, the Peruvian economy
has undergone a major transformation from a highly protected and regulated system to a free market economy. During this period, protectionist
and interventionist laws and policies have been dismantled. Currently, foreign exchange rates are determined by market conditions, with
regular open-market operations by the BCRP in the foreign exchange market to reduce volatility in the value of Peru’s currency against
the U.S. dollar.
We cannot assure you that
the Peruvian government will not institute restrictive exchange rate policies in the future. Any such restrictive exchange rate policy
could have a material adverse effect on our business, financial condition and results of operations and adversely affect our ability to
repay debt or other obligations and restrict our access to international financing.
In addition, if the Peruvian
government were to institute restrictive exchange rate policies in the future, we might be obligated to seek an authorization from the
Peruvian government to make payments in U.S. dollars. We cannot assure you that such an authorization would be obtained. Any such exchange
rate restrictions or the failure to obtain such an authorization could materially and adversely affect our ability to make payments under
our U.S. dollar-denominated debt and to pay dividends on our common shares to holders of the American Depositary Shares (“ADSs”)
representing our common shares.
Increased rates of inflation
in Peru could have an adverse effect on the Peruvian long-term credit market, as well as the Peruvian economy generally and, therefore,
on our business, financial condition and results of operations.
In the past, Peru has suffered
through periods of high and hyper-inflation, which has materially undermined the Peruvian economy and the government’s ability to
create conditions that support economic growth. In response to increased inflation, the BCRP, which sets the Peruvian basic interest rate,
may increase or decrease the basic interest rate in an attempt to control inflation or foster economic growth. Increases in the base interest
rate could adversely affect our results of operations, increasing the cost of certain funding. Additionally, a return to a high-inflation
environment would also undermine Peru’s foreign competitiveness, with negative effects on the level of economic activity and employment,
while increasing our operating costs and adversely impacting our operating margins if we are unable to pass the increased costs on to
our customers. Although inflation was 3.1% for 2023, below the previous five-year average of 4.4%, inflation rates in Peru may rise in
the future as a result of supply shocks, including rises in prices of energy, increased freight costs, and/or an increase in domestic
demand. Conflicts, such as the war between Russia and Ukraine and Israel and Hamas are likely to exacerbate these effects. In addition,
there has been an increase in interest rates globally, which may have an effect on the cost of financing and adversely affect our business
and financial condition if we were to require financing
Changes in tax laws
or their interpretation may increase our tax burden and, as a result, negatively affect our business.
The Peruvian Congress and
government regularly implement changes to tax laws that may increase our tax burden, or the tax burden of our subsidiaries. These changes
may include modifications in our taxable base, tax rates and, on occasion, the enactment of temporary taxes that in some cases have become
permanent taxes or changes to VAT (value added tax) exemptions applicable to certain of our operations in the Amazonian region. We are
unable to estimate the outcomes that these changes may have on business. In that sense, the Peruvian government recently introduced several
changes related to transfer pricing rules and formal obligations in order to comply with BEPS (base erosion and profit shifting) Guidelines
on transactions performed between related parties or with the intervention of low or no-tax jurisdictions, such as the obligation to file
new local-files, master-files and country-by-country reports with the Peruvian tax authority, and to adjust taxable bases accordingly
for income tax purposes.
The effects of any tax reforms
that could be proposed in the future and any other changes that result from the enactment of additional reforms have not been, and cannot
be, quantified. However, any changes to our tax regime or interpretations thereof (including in connection with the tax rates, tax base
(base imponible), deductions rules, payments in advance regime (regimen de pagos a cuenta), time of payment or the establishment
of new taxes thereof) may result in increases in our overall costs and/or our overall compliance costs, which could negatively affect
our results of operations.
Our operations could
be adversely affected by an earthquake, flood or other natural disasters.
Severe weather conditions
and other natural disasters in areas in which we operate may materially adversely affect our operations. Peru is affected by El Niño,
an oceanic and atmospheric phenomenon that causes a warming of temperatures in the Pacific Ocean, resulting in heavy rains off the coast
of Peru and various other effects in other parts of the world. The effects of El Niño, which typically occurs every two to seven
years, and is occurring in 2024, include flooding and the destruction of fish populations and agriculture, and, accordingly, have a negative
impact on Peru’s economy. For example, in March 2023, Cyclone Yaku generated intense rainfall, which resulted in flooding and landslides,
which severely damaged some areas in the north of Peru. Although our facilities were not significantly affected, our ability to ship cement
was compromised by the destruction of infrastructure. Moreover, the road between our quarry and our plant in Piura was flooded and became
inaccessible, potentially causing increased logistics costs. Since we had inventory of seashells from our quarry, we were able to use
it while repairing the road. During the first quarter of 2024, we officially inaugurated a new road between our quarry and our plant in
Piura that was rebuilt in a manner that will allow water to pass below in the event of heavy rains.
Peru also is located in an
area that experiences seismic activity and occasionally is affected by earthquakes. For example, in 2007, an earthquake with a magnitude
of 7.9 on the Richter scale struck the central coast of Peru, severely damaging the region south of Lima. Although the North is not typically
affected by earthquakes, we cannot assure you that such an event will not occur and if it does, it could adversely affect our business
and results of operations.
Our operations could
be adversely affected by government-mandated plant closures.
Public health crises, such
as epidemics or pandemics, as well as other events deemed to be public emergencies, may result in the government requiring us to cease
our operations. For example, in March 2020, the Peruvian government ordered a state of emergency due to the COVID-19 outbreak, and required
us to close our operations for approximately two months in 2020. This closure had a materially adverse effect on our business, financial
condition, and results of operations, in particular during the state of emergency. Although our business recovered well following the
required period of closure, we cannot assure you that the government will not take similar measures in the future as a result of public
health crises or other public emergencies that may have an impact on the Peruvian economy as a whole, the construction sector, our customers’
ability to purchase cement and cement-based products, and/or our customers’ ability to pay for products we have previously sold
to them.
Our
operations are subject to physical challenges related to climate change.
Climate change may have an
adverse impact on the regions where our operations are located. Some of the risks of climate change include heavy precipitation. Extreme
precipitation, leading to flooding, may damage the roads and potentially reduce our productivity and increase our costs. Roads blocked
as a consequence of floods could also affect our ability to both ship our finished products and receive raw materials, negatively affecting
our business and results of operation.
The Peruvian economy
could be adversely affected by economic developments in regional or global markets.
Financial and securities
markets in Peru are influenced by economic and market conditions in regional and global markets. Although economic conditions vary from
country to country, investors’ perceptions of the events occurring in one country may adversely affect cash flows and securities
from issuers in other countries, including Peru. For example, the announcement of rate increases by the U.S. Federal Reserve, the
trade war between the United States and China, and, while our direct exposure to Russia is limited, Russia’s large-scale continued
military invasion of Ukraine, the military conflict between Israel and Hamas, among other factors, had an impact on the Peruvian economy
by adding inflationary pressures, including in respect of high food and energy prices.
Any interruption to the
recovery of the developed economies, the continued effects of the global crises, a worsening or resurgence of the debt crisis in Europe,
a new geopolitical tension in Europe resulting in economic and/or financial crisis, or a combination of the above, could affect the Peruvian
economy, and consequently, materially adversely affect our business. In particular, the Peruvian economy recently has suffered the effects
of fluctuating commodity prices in the international markets, a decrease in export volumes, a decrease in foreign direct investment inflows
and, as a result, a decline in foreign reserves and an increase in its current account deficit. Additionally, adverse developments in
regional or global markets or an increase in the perceived risks associated with investing in emerging markets in the future could adversely
affect the Peruvian economy and, as a result, adversely affect our business, financial condition and results of operations.
A decline in the prices
of certain commodities in the international markets could have a material adverse effect on our financial condition and results of operations.
In 2023, traditional exports,
in particular mineral products, fishing products, agricultural products and petroleum and its derivatives, represented 72.4% of Peru’s
total exports, according to the figures published by the BCRP. Changes in commodity prices in the international markets may have an adverse
impact on Peruvian government finances, which could affect both investor confidence and the sustainability of government expenditure and
social programs. Thus, a decline in commodity prices could, ultimately, affect the political environment in Peru, especially as regional
and local governments are particularly reliant on tax revenue from mining operations. Lower commodity prices could also affect the retail
sector, leading to, for example, a decline in purchasing power and consumer spending.
Corruption and ongoing
high-profile corruption investigations may hinder the growth of the Peruvian economy and have a negative impact on our business and operations.
Starting
in 2017, Peru has suffered a series of government institutional crises due to, among other things, several corruption scandals involving
prominent political figures, mainly past Presidents, and some large construction companies. Some of these corruption scandals resulted
in impeachments (Martin Vizcarra and Pedro Castillo) or resignation ( Pedro Pablo Kuczynski)
In
addition, several corruption scandals regarding authorities at municipal, regional and national government levels are also ongoing, and
former and current government officials have been detained. Peruvian authorities are currently conducting several high profile corruption
investigations relating to the activities of certain Brazilian companies and their Peruvian partners in the construction and infrastructure
sectors, which have resulted in suspension or delay of important infrastructure projects, which were otherwise operational and permitted.
Additional investigations and/or corruption scandals may arise as a result of the cooperation agreement signed between the Peruvian government
and Odebrecht S.A. in 2019. We cannot predict how these or future corruption scandals or investigations may affect the Peruvian economy,
hinder the growth of the Peruvian economy and indirectly have a material adverse effect on our business, financial condition and results
of operations.
Although recent history indicates
that the macroeconomic stability of the country may remain unaffected by political turmoil, we cannot provide any assurance that political
turmoil will not in the future have a material effect on the political or economic stability of the country. See “—Economic,
social and political developments in Peru including political instability, rates of inflation and unemployment could have a material adverse
effect on our business, financial condition and results of operations.”
Public health crises,
including epidemics/pandemics, such as the COVID-19 pandemic, have adversely affected Peru’s economy and therefore our business,
financial condition and results of operations.
The COVID-19 pandemic had
a material adverse impact on the Peruvian economy in 2020, resulting in volatility in the financial markets, reduced international trade
and lower activity in certain of the key drivers of the economy. In addition, social distancing and stay-at-home quarantine measures imposed
to minimize pressure on the healthcare system and contain social costs, adversely affected dynamism of various productive sectors of the
economy. Reduced activity in these economic sectors resulted in reduced employment and less income for families and companies.
We cannot assure you that the measures adopted
by the Peruvian government to counteract the effects of public health crises, such as the COVID-19 pandemic, or others, will be sufficient
over the long term to restore public confidence or to restore economic growth.
Risks Relating to our Business and Industry
We are subject to the
possible entry of domestic or international competitors into our market, which could decrease our market share and profitability.
The cement market in Peru
is competitive and is currently served mainly by three main groups, which together supply most of the cement consumed in the country,
although there are two smaller producers and some imports. In the cement industry, the location of a production plant tends to limit the
market a plant can serve because transportation costs are high, reducing profit margins. Historically, we have supplied the northern region
of Peru while two other groups have supplied the central (which includes the Lima metropolitan area) and southern regions of Peru, driven
principally by the location of production facilities and distribution focus. However, competition could intensify if other manufacturers
decide to enter our market.
We may face increased competition
if the other Peruvian cement manufacturers, despite incremental freight costs, expand their distribution of cement to the northern region
of Peru, or if they develop a cement plant in the north, particularly if the cement markets in Lima or other areas of Peru become saturated.
In the past, some foreign cement manufacturers have announced plans to build cement plants in the central region of the country. If competition
intensifies in the central region of Peru due to the presence of foreign cement manufacturers or otherwise, it may have price repercussions
in our market.
We also face the possibility
of competition from the entry into our market of imported clinker for grinding facilities, cement or other materials or products from
foreign manufacturers, which may have significantly greater financial resources than us, particularly as production capacity continues
to exceed depressed demand in other parts of the world and transportation costs decrease.
We may not be able to maintain
our market share if we cannot match our competitors’ prices or keep pace with the development of new products. If any of these events
were to occur, our business, financial condition and results of operations could be adversely affected.
Demand for our cement
products is highly related to housing construction in northern Peru, which, in turn, is affected by economic conditions in the region.
Cement consumption is highly
related to construction levels. Demand for our cement products depends, in large part, on residential construction in the north of Peru,
which consists mostly of low-income families gradually building or improving their own homes without technical assistance, which we refer
to as auto-construcción. We estimate that in 2023, auto-construcción accounted for approximately 73.0% of
our cement sales. Residential construction, in turn, is highly correlated to prevailing economic conditions in Peru. A decline in economic
conditions would reduce household disposable income and cause a significant reduction in residential construction, leading to a decrease
in demand for cement. As a result, a deterioration of economic conditions in the northern region of Peru would have a material adverse
effect on our financial performance and results of operations. We cannot assure you that growth in Peru’s GDP, or the contribution
to GDP growth attributable to the northern region of the country, will continue at the recent pace or at all, as the economy continues
to be affected by external factors such as inflationary pressure, and political uncertainty continues.
A reduction in private
or public construction projects in the northern region of Peru would have a material adverse effect on our business, financial condition
and results of operations.
We estimate that in 2023,
approximately 16.2% of our cement sales were derived from private construction (other than auto-construcción) and 10.8%
from public construction in the north of Peru. Significant interruptions or delays in, or the termination of, private or public construction
projects may adversely affect our business, financial condition and results of operations. Private and public construction levels in our
market depend on investments in the region which, in turn, are affected by economic conditions.
The level of public infrastructure
construction also depends, to a great extent, on the priorities and financial resources of the national, regional and local governmental
authorities. Although the anticipated increase in Peru’s large infrastructure projects has been delayed, this remains an important
growth driver for the country and also a necessity due to Peru’s significant infrastructure deficit. In the North, spending was
directed towards reconstruction works to address the damage caused by Coastal El Niño, based on Peru’s “Reconstruction
with Changes” Plan. This Plan had an approved budget of S/25.7 billion (US$7.6 billion), and in June 2020, the Peruvian government
signed an agreement with the government of the United Kingdom, for the execution of a package of S/7 billion. Through the agreement, the
United Kingdom provided the structure, strategy and governance processes necessary for the timely delivery of all works, promoting efficiency
and avoiding corruption. This agreement expired on December 31, 2023. We cannot assure you that public spending for construction projects
will continue in the upcoming years. A reduction in public infrastructure spending in our market would adversely affect our business,
financial condition and results of operations.
Our business, financial
condition and results of operations may be adversely affected by increases in energy prices or shortages in the supply of energy, as well
as third-party raw materials.
Electricity and coal account
for a significant percentage of our production costs. In 2023, the cost of electricity represented approximately 16.0% of our cement production
costs, compared to 14.2% in 2022 and 13.5% in 2021, and coal represented approximately 23.1% of our cement production costs in 2023, compared
to 16.8% in 2022 and 11.5% in 2021. The increase in the percentage of the total production cost that coal represents is related to an
overall decrease in other costs, as we stopped using imported clinker and achieved overall savings in maintenance costs. We use a substantial
amount of coal in our production process. Most of the coal we use is anthracite coal which we purchase from domestic
suppliers and import a small amount of bituminous coal from suppliers primarily in Colombia, in each case, at market prices. We do not
have long-term coal supply agreements, and we do not engage in hedging transactions in connection with the price of coal. Any shortage
or interruption in the supply of coal could also disrupt our operations. In addition, the price of coal is largely driven by the price
of oil, and, as a result, increases in international oil prices are likely to affect the price of coal and adversely affect our results
of operations.
We have a long-term electricity
supply agreement with Electroperú S.A. (“Electroperú”), a government-owned company, to serve the electricity
requirements of our Pacasmayo and Piura facilities until 2026. We have also entered into a supply agreement with Electro Oriente S.A.
(“ELOR”) to supply the Rioja facility until November 2024 (subject to extension). During 2023, there was a disruption in the
energy supply in the Rioja facility, initially estimated as maintenance works that should have lasted 2 to 3 days, but that ended up lasting
around seven weeks. During this period, we were unable to operate our plant and had to transport the cement from our coastal plants in
order to satisfy demand, resulting in increased costs.
Our business, financial condition
and results of operations could be materially and adversely affected by higher costs, interruptions, and unavailability or shortage of
electricity. We have no back-up power system at our plants and cannot assure you that, in case of interruption or failure in Electroperú’s
or ELOR’s operations, we will have access to other energy sources at the same prices and conditions, which could adversely affect
our business, financial condition and results of operations. Moreover, electricity to our plants is transmitted through the Peruvian Electricity
Interconnection System (Sistema Eléctrico Interconectado Nacional del Perú, or “SEIN”). Any interruptions
or failures in SEIN’s system would also have a material adverse effect on our business, financial condition and results of operations.
In the recent years, we have
experienced electricity rationing, limiting our use of electricity to certain times of the day. In such cases, we were forced to readjust
our production schedules in order to ensure that our production process was not interrupted. In the event of any future rationing of electricity,
we may not be able to readjust quickly enough, and our production process may be interrupted. Future shortages or efforts to respond to
or prevent shortages, such as rationing, may adversely impact the cost or supply of electricity for our operations.
A significant increase in
the prices of coal, gas or electricity would increase our costs of production. We may not be able to increase the prices of our cement
products in the future if the prices of coal, gas or electricity rises, which would adversely affect our business, financial condition
and results of operations.
Changes in the cost
or availability of admixtures and raw materials supplied by third parties may adversely affect our business, financial condition and results
of operations.
We use certain admixtures
and raw materials in the production of cement, such as gypsum, blast furnace slag and iron that we obtain from third parties. In 2023,
our cost of admixtures and raw materials supplied by third parties as a percentage of our cement production costs was approximately 5.3%,
compared to approximately 5.1% in 2022. Moreover, although our need for imported clinker significantly declined in 2023, when compared
to 2022, we still had to use some imported clinker, and the cost of this imported clinker as a percentage of our cement production costs
was approximately 4.0%, compared to 16.3% in 2022. We do not have long-term contracts for the supply of admixtures or raw materials that
we use and if existing suppliers cease operations or reduce or eliminate production of these products, our costs to procure these materials
may increase significantly or we may be obligated to procure alternatives to replace these products.
We may undertake future
acquisitions that may not achieve expected benefits.
Our strategic initiatives
include pursuing acquisitions that tend to diversify our existing portfolio of products and services and expand our geographic footprint.
In the future, we may decide to expand by acquiring other companies in Peru or abroad. Any future acquisitions will depend on our ability
to identify suitable candidates, negotiate acceptable terms, and obtain financing for the acquisitions. If future acquisitions are significant,
they could change the scale of our business and expose us to new geographic, political, operating and financial risks. In addition, each
acquisition involves a number of risks, such as the diversion of our management’s attention from our existing business to integrating
the operations and personnel of the acquired business, possible adverse effects on our results of operations during the integration process,
our inability to achieve the intended objectives of the combination and potential unknown liabilities associated with the acquired assets.
We may not be able to
obtain the funding required to implement future strategies.
Our strategies to continue
to expand our cement production capacity and distribution network require significant capital expenditures. We cannot assure you that
we will generate sufficient cash flow from operations, or that we will have access to external financing sources, to adequately fund such
capital expenditures. Our access to external sources of financing will depend on many factors, including factors beyond our control, such
as conditions in the global capital markets and investors’ risk perception of investing in Peru and in emerging markets generally.
Any equity or debt financing, if available, may not be on terms that are favorable to us. If our access to external financing is limited,
we may not be able to execute our strategy, which could adversely affect our business, financial condition and results of operations.
In addition, our local bonds
due 2029 and 2034, and the “club deal” loan we entered into in 2021, contain covenants that limit our ability and that of
our restricted subsidiaries to incur additional indebtedness if we do not meet certain financial ratios. If we are unable to incur additional
debt to fund our future strategies, our business could be adversely affected.
We are subject to risks
related to litigation and administrative proceedings that could adversely affect our business and financial performance in the event of
an unfavorable ruling.
The nature of our business
exposes us to litigation relating to product liability claims, labor, health and safety matters, environmental matters, regulatory, tax
and administrative proceedings, governmental investigations, tort claims and contract disputes, among other matters. In the past, we have
been subject to antitrust and tax proceedings or investigations. While we contest these matters vigorously and make insurance claims when
appropriate, litigation is inherently costly and unpredictable, making it difficult to accurately estimate the outcome of actual or potential
litigation. Although we establish provisions as we deem necessary, the amounts that we reserve could vary significantly from any amounts
we actually pay due to the inherent uncertainties in the estimation process. We cannot assure you that these or other legal proceedings
will not materially affect our ability to conduct our business, financial condition and results of operations in the event of an unfavorable
ruling.
Our business is subject
to a number of operational risks, which may adversely affect our business, financial condition and results of operations.
Our business is subject to
several industry-specific operational risks, including accidents, natural disasters, labor disputes and equipment failures. Such occurrences
could result in damage to our production facilities and equipment, and/or the injury or death of our employees and others involved in
our production process. Moreover, such accidents or failures could lead to environmental damage, loss of resources or intermediate goods,
delays or the interruption of production activities and monetary losses, as well as damage to our reputation. Our insurance may not be
sufficient to cover losses from these events, which could adversely affect our business, financial condition and results of operations.
In addition, key equipment
at our facilities, such as our mills and kilns, may deteriorate sooner than we currently estimate. Such deterioration of our assets may
result in additional maintenance or capital expenditures and could cause delays or the interruption of our production activities. If these
assets do not generate the cash flows we expect, and we are not able to procure replacement assets in an economically feasible manner,
our business, financial condition and results of operations may be materially and adversely affected.
Our business depends
on the continued operation of our Pacasmayo and Piura facilities.
Our production facilities
in Pacasmayo and Piura are essential to our business. In 2023, approximately 91.2% of our total cement and all of our quicklime was produced
at our Pacasmayo and Piura facilities. These plants are subject to normal hazards of operating any cement production facility, including
accidents, natural disasters and unexpected malfunctioning of the equipment. Any interruption in our operation of our Pacasmayo or Piura
facilities or a decrease in the effective capacity of these facilities would adversely affect our results of operations.
The introduction of
cement substitutes into the market and the development of new construction techniques could have a material adverse effect on our business,
financial condition and results of operations.
Materials such as plastic,
aluminum, ceramics, glass, wood and steel can be used in construction as a substitute for cement. In addition, other construction techniques,
such as the use of drywall, could decrease the demand for cement and concrete. In Peru, drywall has only been introduced into the housing
construction market in recent years and it is not widely used. However, the use of drywall for housing construction could increase significantly
in the future as it becomes more popular. In addition, research aimed at developing new construction techniques and modern materials may
introduce new products in the future. The use of substitutes for cement could cause a significant reduction in the demand and prices for
our cement products.
Our success depends
on key members of our management and board of directors
Our success depends largely
on the efforts and strategic vision of our executive management team and our board of directors. The loss of the services of some or all
of our executive management team or members of our board of directors could have a material adverse effect on our business, financial
condition and results of operations.
The execution of our business
plan also depends on our ongoing ability to attract and retain additional qualified employees capable of operating our plants. Due to
the limited pool of skilled workers in the north of Peru or workers from other regions willing to relocate to the north of Peru, we may
not be successful in attracting and retaining the personnel we require. If we are unable to hire, train and retain qualified employees
at a reasonable cost, we may be unable to successfully operate our business or reach full planned production levels in a timely manner
and, as a result, our business, financial condition and results of operations could be adversely affected.
Our operations and sales
are highly concentrated in the northern region of Peru.
All of our operations are
located in the northern region of Peru, including our production facilities and the quarries from where we obtain limestone to produce
cement. In addition, substantially all our cement products are sold to consumers in this market. As a result, any adverse economic, political,
or social conditions affecting the northern region of Peru, as well as natural disasters and weather conditions, such as the El Niño
climate pattern, among other factors that may affect this region, could have a material adverse effect on our business, financial condition
and results of operations. For example, in March 2023, Cyclone Yaku generated intense rainfall, which resulted in flooding and mudslides,
which severely damaged some areas in the north of Peru, particularly the city of Pacasmayo, where we operate. Although there was no severe
physical damage to our properties, we were affected by temporary road interruptions, inadequate workforce turnout, temporary disruptions
in the supply of products, delays in the delivery of our products.
We are subject to environmental
regulations and may be exposed to liability and political cost as a result of our handling of hazardous materials and potential costs
for environmental compliance.
We are subject to various
environmental protection and health and safety laws and regulations that regulate, among other things, the generation, storage, handling,
use and transportation of hazardous materials; emissions and discharge of hazardous materials; and the health and safety of our employees.
Pursuant to Peruvian law, in order to conduct mining and industrial activities, we are required, among other things, to (i) submit an
environmental impact assessment to the Ministry of Production (Ministerio de la Producción) and a mining closure plan to
the Ministry of Energy and Mines (Ministerio de Energía y Minas, or “MINEM”) prior to initiating mining activities,
(ii) comply with certain air emission and wastewater discharge standards, (iii) obtain approval from the water management authority to
discharge wastewater into natural water sources or soil, (iv) dispose solid waste generated by us in special landfills exclusively through
companies registered with the environmental agency, and (v) store fuel in compliance with environmental and safety standards. In addition,
we are required to have a health and safety committee and develop an internal health and safety code. Although we believe we are in compliance
with all these regulations in all material respects, we cannot assure you that we have been or will be at all times in full compliance
with these laws and regulations. Any violation of such laws or regulations could result in substantial fines, criminal sanctions, revocations
of operating permits and shutdowns of our facilities. In addition, current or future governments may also impose stricter regulations
which may require us to incur higher compliance costs.
Pursuant to certain applicable
environmental laws, we could be held liable for all or substantially all of the damages caused by pollution at our current or former facilities
or those of our predecessors or at disposal sites. We could also be held liable for all incidental damages due to the health effects of
exposure of individuals to hazardous substances or other environmental damage.
We cannot assure you that
our costs of complying with current and future environmental and health and safety laws and regulations, and any liabilities arising from
past or future releases of, or exposure to, hazardous substances will not adversely affect our business, financial condition and results
of operations.
Evolving expectations and/or requirements
for reporting on or implementing environmental, social and governance (ESG) programs could increase our costs, and failure to meet expectations
or requirements could adversely affect our sales and results of operations.
Expectations from shareholders,
customers, employees, and other third parties concerning ESG reporting have increased and are increasing, and our ability to meet those
expectations may be dependent on third parties. Regulatory requirements are also increasing, including a new rule on the Enhancement and
Standardization of Climate-Related Disclosures for Investors adopted by the U.S. Securities and Exchange Commission on March 6, 2024 which
will require the disclosure of information including a registrant’s material climate-related risks, activities to mitigate that
risk, oversight of climate-related risks, any material climate-related targets or goals, the financial statement impacts of severe weather
events, and, for certain issuers, Scope 1 and 2 greenhouse gas emissions. Although this new rule was voluntarily stayed by the SEC on
April 4, 2024, pending resolution of multiple challenges to be heard by the Eighth Circuit Court, we cannot assure you that the stay will
not be lifted in the future. Meeting stakeholder expectations and regulatory requirements could require additional resources and compliance
costs.
Social disturbances
by local communities may have an adverse effect on our business and results of operations.
Mining is an important part
of the Peruvian economy. As of December 31, 2023, mining and oil and gas accounted for approximately 11.6% of the country’s GDP,
according to the BCRP. On several occasions, local communities have opposed these operations and accused them of polluting the environment
and hurting agricultural and other traditional economic activities. In recent years, Peru has experienced protests against mining projects
in several regions around the country. For example, since 2019, there have been on-and-off conflicts in Las Bambas between local communities
and China Minmetals Corp, resulting in road blockages and halt in operations repeatedly throughout this period, and is still ongoing.
We conduct some extraction activities in our quarries and operate in areas close to local communities. Although we have historically had
very good relationships with the local communities where we operate and nearby, we provide no assurance that this will continue to be
the case in the future. During 2022, certain local communities made social demands relating to agriculture, transportation, mining, which
caused instability. Social disturbances, mainly in the center and south of the country after the impeachment of President Castillo, caused
further instability and resulted in an overall slowdown in GDP growth until the first quarter of 2023.
Illegal mining has also generated
conflicts. During the last three years, Compañía Minera Poderosa, a gold mining company operating in Peru, has suffered
repeated attacks by illegal miners colluding with national and foreign criminal organizations. Although a state of emergency has been
declared in the region, and Minera Poderosa has significantly increased its own security, there was a new attack on April 5, 2024.
Social disturbances, mainly
in the center and south of the country after the impeachment of President Castillo, caused further instability and resulted in an overall
slowdown in GDP growth until the first quarter of 2023. Further social demands and conflicts may have an effect on the Peruvian economy,
and on our business and results of operations.
International agreements
related to climate change may result in an increase in our costs.
There are ongoing international
efforts to address greenhouse emissions. The United Nations and certain international organizations have taken action against activities
that may increase the atmospheric concentration of greenhouse gases. Regulatory measures, such as the Kyoto Protocol, aimed at addressing
greenhouse gas emissions and climate changes, are in various stages of negotiation and implementation. Such measures may result in increased
costs to us for installation of new controls aimed at reducing greenhouse gas emissions, purchase of credits or licenses for atmospheric
emissions, and monitoring and registration of greenhouse gas emissions from our operations. These measures, if adopted in Peru, could
adversely affect our business, financial condition and results of operations.
Changes in regulations
or in the interpretation of regulations may adversely affect our business, financial condition and results of operations.
Our business is subject to
extensive regulation in Peru, including, among others, relating to tax, environmental, labor, health and safety, and mining matters. We
believe that our facilities are currently operating in all material respects in accordance with all applicable concessions, laws and regulations.
Future regulatory changes, changes in the interpretation of such regulations or stricter enforcement of such regulations, including changes
to our concession agreements, may increase our compliance costs and could potentially require us to alter our operations. We cannot assure
you that regulatory changes in the future will not adversely affect our business, financial condition and results of operations.
Any dispute with the
labor unions that represent our employees could have an adverse effect on our business, financial condition and results of operations.
As of December 31, 2023, approximately
22.2% of our employees were members of employee unions. Although we consider our relations with our employees are currently positive,
we cannot assure you that we will not experience work slowdowns, work stoppages, strikes or other labor disputes in the future, which
could adversely affect our business, financial condition and results of operations.
New projects may require
the prior approval of local indigenous communities.
On September 7, 2011, Peru
enacted Law No. 29785, regarding the Prior Consultation Right of Local Indigenous Communities, in accordance with the International Labor
Organization Convention No. 169 (Ley del Derecho a la Consulta Previa a los Pueblos Indígenas y Originarios, Reconocido en el
Convenio 169 de la Organización Internacional del Trabajo). This law, which became effective on December 6, 2011, establishes
a prior consultation procedure (procedimiento de consulta previa) that the Peruvian government must carry out with local indigenous
communities, whose rights may be directly affected by new legislative or administrative measures, including the granting of new mining
concessions. Local indigenous communities do not have a veto right; upon completion of this prior consultation procedure, the Peruvian
government retains the discretion to approve or reject the applicable legislative or administrative measure. However, to the extent that
in the future our new projects may require implementation of legislative or administrative measures that impact local indigenous communities,
we may not be able to undertake such projects, unless the Peruvian government first conducts the foregoing consultation procedure. We
cannot assure you that this law will not adversely affect our new projects and have an adverse effect on our business, financial condition
and results of operations.
The instruments pursuant
to which our principal indebtedness was issued contain financial and other covenants, and any default under any of these instruments may
have a material adverse effect on our financial condition and cash flows.
In January 2019, we issued
an aggregate of S/570 million in debt securities in two issuances under our local bond program: one in the aggregate principal amount
of S/260 million bearing interest a rate of 6.68750% with a term of 10 years, and another in the aggregate principal amount of S/310 million
bearing interest at a rate of 6.84375% with a term of 15 years. These issuances contain the same restrictions and covenants as our 4.50%
Senior Notes due 2023. And, in 2021, we entered into a “club deal” loan, which also contains restrictive covenants, as well
as financial covenants requiring us to meet certain financial ratios tests. Failure to meet or satisfy any of these covenants could result
in an event of default under the indenture, the agreements governing our local bonds or our “club deal” loan.
Failures in our information
technology systems and information security (cybersecurity) systems can adversely impact our operations and reputation.
Our operations are to a certain
extent dependent on information technology and automated operating systems to manage or support our operations. The proper functioning
of these systems is critical to the efficient operation and management of our business. In addition, these systems may require modifications
or upgrades as a result of technological changes or growth in our business. These changes may be costly and disruptive to our operations.
Our systems may be vulnerable to damage, disruption or intrusion caused by circumstances beyond our control, such as physical or electronic
break-ins, catastrophic events, power outages, natural disasters, computer system or network failures, viruses or malware, unauthorized
access and cyberattacks. Although we take actions to secure our systems and electronic information through cybersecurity tools, backup
and recovery solutions, procedures and policies which are based on Cybersecurity framework NIST 1.1 and ISO/IEC 27001:2013, have disaster
recovery plans in case of incidents that could cause major disruptions to our business, these measures may not be sufficient since cybersecurity
threats continue to evolve. Any significant information leakage or theft of information could affect our compliance with data privacy
laws and damage our relationship with our employees, customers and suppliers, and also adversely impact our business, financial condition
and results of operations. Our insurance does not cover any risk associated with any cyber security risks.
We are incorporating
artificial intelligence technologies into our processes. These technologies may present business, compliance, and reputational risks.
Recent
technological advances in artificial intelligence and machine-learning technology both present opportunities and pose risks to us. If
we fail to keep pace with rapidly evolving technological developments in artificial intelligence, our competitive position and business
results may suffer. At the same time, use of artificial intelligence has recently become the source of significant media attention and
political debate. The introduction of these technologies, particularly generative AI, into our operations may result in new or expanded
risks and liabilities, including due to enhanced governmental or regulatory scrutiny, litigation, compliance issues, ethical concerns,
confidentiality or security risks, as well as other factors that could adversely affect our business, reputation, and financial results.
In addition, our personnel could, unbeknownst to us, improperly utilize artificial intelligence and machine learning-technology while
carrying out their responsibilities. The use of artificial intelligence can lead to unintended consequences, including generating content
that appears correct but is factually inaccurate, misleading or otherwise flawed, or that results in unintended biases and discriminatory
outcomes, which could harm our reputation and business and expose us to risks related to inaccuracies or errors in the output of such
technologies and the risk that using such technologies could result in leakage of our confidential information.
Risks Relating to our Common Shares and ADSs
The market price of
ADSs may fluctuate significantly, and you could lose all or part of your investment.
Volatility in the market price
of the ADSs may prevent you from being able to sell your ADSs at or above the price you paid for them. The market price and liquidity
of the market for the ADSs may be significantly affected by numerous factors, some of which are beyond our control and may not be directly
related to our operating performance. These factors include, among others:
| ● | actual or anticipated changes in our results of operations, or failure to meet expectations of financial
market analysts and investors; |
| ● | investor perceptions of our prospects or our industry; |
| ● | operating performance of companies comparable to us and increased competition in our industry; |
| ● | new laws or regulations or new interpretations of laws and regulations applicable to our business; |
| ● | general economic trends in Peru; |
| ● | catastrophic events, such as earthquakes and other natural disasters; and |
| ● | developments and perceptions of risks in Peru and in other countries. |
Our controlling shareholder
has significant influence over us and his interests could conflict with the interests of other shareholders.
As of March 31, 2024, our
controlling shareholder beneficially owned 50.01% of our outstanding common shares. As a result, our controlling shareholder has the ability
to determine the outcome of substantially all matters submitted for a vote to our shareholders and thus exercise control over our business
policies and affairs, including, among others, the following:
| ● | the composition of our board of directors and, consequently, any determinations of our board with respect
to our business direction and policy, including the appointment and removal of our executive officers; |
| ● | determinations with respect to mergers, other business combinations and other transactions, including
those that may result in a change of control; |
| ● | whether dividends are paid or other distributions are made and the amount of any such dividends or distributions; |
| ● | whether we offer preemptive and accretion rights to holders of our common shares in the event of a capital
increase; |
| ● | sales and dispositions of our assets; and |
| ● | the amount of debt financing we incur. |
Our controlling shareholder
may direct us to take actions that could be contrary to the interests of our other shareholders and may be able to prevent other shareholders
from blocking these actions or from causing different actions to be taken. Also, our controlling shareholder may prevent change of control
transactions that might otherwise provide the shareholders with an opportunity to dispose of or realize a premium on their investment
in our common shares and ADSs. We cannot assure you that our controlling shareholder will act in a manner consistent with our other shareholders’
best interests.
Holders of ADSs may
be unable to exercise voting rights with respect to our common shares underlying the ADSs at our shareholders’ meetings.
Holders of ADSs may exercise
voting rights with respect to the common shares represented by the ADSs only in accordance with the deposit agreement relating to the
ADSs. Holders of our common shares will receive notice of shareholders’ meetings through publication of a notice 25 days in advance,
pursuant to Peruvian law, in the official gazette in Peru, a Peruvian newspaper of general circulation, the bulletin of the Lima Stock
Exchange and the website of the Superintendencia del Mercado de Valores (the “Peruvian Securities Commission”), and
will be able to exercise their voting rights by either attending the meeting in person or voting by proxy. ADS holders will not receive
notice directly from us. Instead, pursuant to the deposit agreement, we will notify the depositary, which will mail to holders of ADSs
the notice of the meeting and a statement as to the manner in which voting instructions may be given. To exercise their voting rights,
ADS holders must instruct the depositary how to exercise the voting rights for the common shares which underlie their ADSs. Due to these
additional procedural steps involving the depositary, the process for exercising voting rights may take longer for ADS holders than for
holders of our common shares.
Holders of ADSs also may not
receive voting materials in time to instruct the depositary to vote the common shares underlying their ADSs. In addition, the depositary
and its agents are not responsible for failing to carry out voting instructions of the holders of ADS or for the manner of carrying out
such instructions, unless such failure can be attributable to gross negligence, bad faith or willful misconduct on the part of the depositary
or its agents. Accordingly, holders of ADSs may not be able to exercise voting rights, and they will have little, if any, recourse if
the underlying common shares are not voted as requested.
The ability of holders
of ADSs to receive payments of cash dividends may be limited.
Our shareholders’ ability
to receive cash dividends may be limited by the ability of the depositary to convert cash dividends paid in soles into U.S. dollars.
Under the terms of our deposit agreement with the depositary for the ADSs, the depositary will convert any cash dividend or other cash
distribution we pay on the common shares underlying the ADSs into U.S. dollars, if it can do so on a reasonable basis and can transfer
the U.S. dollars to the United States. If this conversion is not possible or if any government approval is needed and cannot be obtained,
the deposit agreement allows the depositary to distribute the foreign currency only to those ADS holders to whom it is possible to do
so. If the exchange rate fluctuates significantly during a time when the depositary cannot convert the foreign currency, holders of ADSs
may lose some or all of the value of the dividend distribution.
Holders of ADSs may
be unable to exercise pre-emptive or accretion rights with respect to the common shares underlying their ADSs.
Under Peruvian corporate law,
if we issue new common shares as part of a capital increase, unless otherwise agreed to by holders of 40% of our outstanding common shares,
our shareholders will generally have the right to subscribe to a proportional number of common shares of the class held by them to maintain
their existing ownership percentage, which is known as preemptive rights. In addition, shareholders are entitled to the right to subscribe
for the unsubscribed common shares of either the class held by them or other classes which remain unsubscribed at the end of a preemptive
rights offering, on a pro rata basis, which is known as accretion rights. Holders of ADSs may not be able to exercise the preemptive or
accretion rights relating to common shares underlying the ADSs unless a registration statement under the U.S. Securities Act of 1933,
as amended (the “Securities Act”), is effective with respect to those rights or an exemption from the registration requirements
of the Securities Act is available. We are not obligated to file a registration statement with respect to the common shares relating to
these preemptive and accretion rights and we cannot assure you that we will file any such registration statement. Unless we file a registration
statement or an exemption from registration is available, holders of ADSs may receive only the net proceeds from the sale of their preemptive
and accretion rights by the depositary or, if the preemptive and accretion rights cannot be sold, they will be allowed to lapse. As a
result, U.S. holders of ADSs may suffer dilution of their interest in our company upon future capital increases.
We are entitled to amend
the deposit agreement under which the ADSs were issued, and to change the rights of ADS holders under the terms of such agreement, without
the prior consent of the ADS holders.
We are entitled to amend the
deposit agreement and to change the rights of the ADS holders under the terms of such agreement, without the prior consent of the ADS
holders. Any change related to an increase in deposits or charges for book-entry securities services or any modification that might hinder
the rights of the ADS holders will be effective within 30 days after the ADS holders have received notice of such change or modification
and such holders will have no right to any compensation whatsoever.
Our status as a foreign
private issuer allows us to follow alternate standards to the corporate governance standards of the New York Stock Exchange, which may
limit the protections afforded to investors.
We are a “foreign private
issuer” within the meaning of the New York Stock Exchange corporate governance standards. Under New York Stock Exchange rules, a
foreign private issuer may elect to comply with the practices of its home country and not to comply with certain corporate governance
requirements applicable to U.S. companies with securities listed on the exchange. We currently follow certain Peruvian practices concerning
corporate governance and intend to continue to do so. Accordingly, holders of ADSs will not have the same protections afforded to shareholders
of companies that are subject to all New York Stock Exchange corporate governance requirements.
For example, the New York
Stock Exchange listing standards provide that the board of directors of a U.S. listed company must have a majority of independent directors
at the time the company ceases to be a “controlled company.” Under Peruvian corporate governance practices, a Peruvian company
is not required to have a majority of independent members on its board of directors.
The listing standards for
the New York Stock Exchange also require that U.S. listed companies; at the time they cease to be “controlled companies,”
have a nominating/corporate governance committee and a compensation committee (in addition to an audit committee). Each of these committees
must consist solely of independent directors and must have a written charter that addresses certain matters specified in the listing standards.
Under Peruvian law, a Peruvian company may, but is not required to, form special governance committees, which may be composed partially
or entirely of non-independent directors.
In addition, New York Stock
Exchange rules require the independent non-executive directors of U.S. listed companies to meet on a regular basis without management
being present. There is no similar requirement under Peruvian law.
The New York Stock Exchange’s
listing standards also require U.S. listed companies to adopt and disclose corporate governance guidelines. In November 2013, the Peruvian
Securities Commission and a committee comprised of regulatory agencies and associations prepared and published a list of suggested non-mandatory
corporate governance guidelines called the “Good Corporate Governance Code for Peruvian Companies.” Although we have implemented
a number of these measures, we are not required to comply with the corporate governance guidelines by law or regulation, only to disclose
whether or not we are in compliance.
Minority shareholders
in Peru are not afforded equivalent protections as minority shareholders in other jurisdictions and investors may face difficulties in
commencing judicial and arbitration proceedings against our company or our controlling shareholder.
Our company is organized and
existing under the laws of Peru, and our controlling shareholder is resident in Peru. Accordingly, investors may face difficulties in
serving process on our company, our officers and directors or our controlling shareholder in other jurisdictions, and in enforcing decisions
granted by courts located in other jurisdictions against our company, our officers and directors or our controlling shareholder that are
based on securities laws of jurisdictions other than Peru.
In Peru, there are no proceedings
to file class action suits or shareholder derivative actions with respect to issues arising between minority shareholders and an issuer,
its controlling shareholders or directors and officers. Furthermore, the procedural requirements to file actions by shareholders differ
from those of other jurisdictions, such as in the United States. As a result, it may be more difficult for our minority shareholders to
enforce their rights against us, our directors, officers or controlling shareholder as compared to the shareholders of a U.S. company.
The deposit agreement provides that the depositary has no obligation to commence or become involved in any judicial proceedings and any
other legal actions relating to the ADSs or the deposit agreement, either on behalf of the ADS holders or on behalf of any other person.
The ability of investors
to enforce civil liabilities under U.S. securities laws may be limited.
Most of our directors or executive
officers are not residents of the United States. All or a substantial portion of our assets and those of our directors and executive officers
are located outside of the United States. As a result, it may not be possible for investors in our securities to affect service of process
within the United States upon such persons or to enforce in U.S. courts or outside of the United States judgments obtained against such
persons outside of the United States.
We are a company organized
and existing under the laws of Peru, and there is no existing treaty between the United States and Peru for the reciprocal enforcement
of foreign judgments. It is not clear whether a Peruvian court would accept jurisdiction and impose civil liability if proceedings were
commenced in a foreign jurisdiction predicated solely upon U.S. federal securities laws.
ITEM 4. INFORMATION ON THE COMPANY
A. History and Development of the Company
Our History
Cementos Pacasmayo S.A.A.
was incorporated in Lima, Peru in 1949, by a group of private investors that founded the company to serve the cement market in the northern
region of Peru. Cementos Pacasmayo began its operations in 1957 and is a publicly held corporation (sociedad anónima abierta)
organized under the laws of Peru. Our executive offices are located at Calle La Colonia 150, Urbanización El Vivero, Surco, Lima,
Peru. Our telephone number at this location is + (511) 317-6000. Our website address is www.cementospacasmayo.com.pe. Information on or
accessible through our website is not a part of, nor incorporated by reference in, this annual report.
Cementos Pacasmayo S.A.A. and Hochschild Mining plc together constitute
the two businesses of the Hochschild Group, which has operated in Latin America for more than 100 years. Hochschild Mining plc is incorporated
in the United Kingdom and its shares have been listed on the London Stock Exchange since 2006. Cementos Pacasmayo has been listed on the
Lima Stock Exchange since 1995. As of March 31, 2024, Eduardo Hochschild, directly and indirectly, owned and controlled 38.32% of the
shares of Hochschild Mining plc. Through Inversiones ASPI S.A. (“ASPI”), as of that same date, Eduardo Hochschild, directly
and indirectly, owned and controlled 50.01% of the outstanding common shares of Cementos Pacasmayo. S.A.A.
The Hochschild Group traces
its origins to 1911, when Mauricio Hochschild, a German mining engineer, founded a group of companies in South America that came to be
known as the Hochschild Group. Following World War I, the Hochschild Group expanded into Bolivia where it developed significant interests
in tin. The Hochschild Group commenced operations in Peru in 1925 and in 1945 Luis Hochschild, the nephew of Mauricio Hochschild (and the
father of Eduardo Hochschild), joined the Hochschild Group’s Peruvian operations.
During the first decades of
its operations, the Hochschild Group focused on the commercialization of minerals, although it later began operating its own mines and
other industrial companies. During World War II, the Hochschild Group was a key supplier of tin and other metals to the allied forces.
The Hochschild Group acquired
its initial ownership interest in us in 1956. Set forth below are key developments in our company’s history.
| ● | In 1957, we began our operations with the installation of our first clinker line with an installed production
capacity of approximately 110,000 metric tons per year. In 1966 and 1977, we added a second and third clinker line, respectively, increasing
our installed clinker production capacity to approximately 830,000 metric tons per year. |
| ● | In November 1984, the South American mining and industrial operations of the Hochschild Group were sold
to the Anglo American Corporation of South Africa which, in the same month, sold the Peruvian operations of the Hochschild Group, including
its interest in Cementos Pacasmayo and predecessors of Hochschild Mining plc, to a group of companies controlled by Luis Hochschild. |
| ● | In 1995, we launched our distribution network to commercialize and distribute our products throughout
the northern region of Peru. In that same year, we also listed our common shares for trading on the Lima Stock Exchange, currently under
the ticker symbol “CPACASC1.” |
| ● | In 1998, we acquired from the Peruvian government our Rioja facility, located in the northeast of Peru.
At the time, the Rioja facility had one clinker line with an installed cement production capacity of approximately 35,000 metric tons
per year. |
| ● | In 2003, we acquired Zemex Corporation, a U.S. company engaged in non-metallic mining and industrial activities
in the United States and Canada, which we sold in 2007 in a series of transactions. |
| ● | In 2009, we created Fosfatos del Pacífico in order to explore phosphate rock deposits from our
concession at Bayóvar in the north of Peru. |
| ● | In 2010, we reached an aggregate total installed cement production capacity of 3.1 million in our Pacasmayo
and Rioja facilities and completed the conversion of our Waelz kiln, retrofitting it to produce quicklime or calcine zinc interchangeably.
That same year, we also sold our copper mining concessions in the central region of Peru known as “Mina Raul,” which were
previously leased to a third party, for US$28.0 million. |
| ● | In December 2011, we sold a minority equity interest in Fosfatos to an affiliate of Mitsubishi to develop
our phosphate deposits in the Bayóvar fields, in the northwest of Peru. |
| ● | In March 2012, we completed our initial equity offering of 22,296,800 ADSs in the United States and listed
the ADSs on the New York Stock Exchange. |
| ● | In February 2013, we issued US$300 million in our inaugural international bond offering. A portion
of the proceeds from this offering were used to prepay amounts outstanding on our secured loan agreement with BBVA Banco Continental,
and the remaining proceeds were used to fund a portion of the capital expenditures related to the construction and operation of our new
Piura plant and our cement business. |
| ● | In September 2015, we began producing cement at our new plant in Piura. This was a very important milestone
for us, since we have been investing in this project since 2012 and we have begun to reap the benefits of this investment. |
| ● | In January 2016, we began producing clinker at our new plant in Piura, finishing the start-up of the plant,
adding one million metric tons of annual clinker production capacity. |
| ● | In March 2017, we completed the spin-off of Fostatos del Pacífico. |
| ● | In December 2017, our board of directors resolved to focus our strategy on our core business of developing
cement and building solutions. In furtherance of this strategy, we have focused on disposing of our non-core investments. In the fourth
quarter of 2017, we discontinued our brine project. |
| ● | In March 2018, we launched our new brand image and updated its vision: to further enhance our position
as a leader in developing building solutions and innovations that anticipate the needs of our clients and that contributes to the progress
of our country. |
| ● | During 2018, we implemented the ISO 37001 anti-bribery management systems, obtaining certification in
January 2019. This certification confirms that our management systems are designed to help prevent, detect and respond to bribery and
comply with anti-bribery laws and voluntary commitments applicable to our activities. This certification and related initiatives reiterate
our commitment to global anti-bribery best practices and high standards of transparency and good corporate governance. |
| ● | In November 2018, we launched an offer to purchase for cash a portion of the US$300 million principal
amount of our outstanding 4.50% Senior Notes due 2023. The offer expired on December 7, 2018 and we purchased a total of US$168,388,000,
or approximately 56.13% of the total outstanding amount of our 4.500% Senior Notes due 2023. |
| ● | On January 8, 2019, the General Shareholders’ Meeting approved the creation of a local bond program
in an aggregate principal amount up to S/1,000 million. On January 31, 2019, we issued an aggregate principal amount of S/570 million
in debt securities under our local bond program: one in the aggregate principal amount of S/260 million accruing interest at a rate of
6.68750% per annum with term to maturity of 10 years, and the other in the aggregate principal amount of S/310 million accruing interest
at a rate of 6.84375% per annum with a term to maturity of 15 years. The proceeds were used to purchase a portion of our 4.50% Senior
Notes due 2023. The rates and terms obtained reduce our financial cost structure, with lower cost of capital, an extended maturity and
less exposure to exchange rate fluctuations. |
| ● | In 2020, we were included on the Dow Jones Sustainability (“DJS”) MILA Pacific Alliance Index
for the second consecutive year. This index is made up of those companies that demonstrate superior performance among their peers based
on social, environmental, and economic criteria. |
| ● | In 2021, given the exponential growth in the demand for cement, in October 2021, the optimization of the
capacity of our Pacasmayo plant was approved, in order to produce an additional estimated 660,000 metric tons of clinker, and thus reduce
the consumption of imported clinker. |
| ● | In 2022, for the fourth consecutive year, we managed to be
part of the annual DJS MILA Pacific Alliance Index, achieving a score of 79 points, which was an improvement of four points compared
to the previous year. We were the only Peruvian cement company present in DJS MILA Pacific Alliance Index for 2022. In addition, to strengthen
our sustainability strategy and especially our commitment to reducing emissions, in 2022, we designated a Sustainability Manager and
a Climate Change Managing Director. During 2022, we implemented the ISO 37301 compliance management system, obtaining the certification
in January 2023. |
| ● | In 2023, we finished investing approximately US$ 83.5 million in a more efficient kiln for our Pacasmayo
plant. This investment is fully aligned with our medium- and long-term strategy as it demonstrates on the one hand, our firm belief in
the future growth of our country and, on the other hand, our commitment to carbon neutrality, as this new kiln lowers our emissions. In
addition, for the fifth consecutive year we were part of the annual DJS MILA Pacific Alliance Index and for the fourth consecutive year
we were included in The Sustainability Yearbook 2024. Finally, the Institutional Investor highlighted us within the top three in the construction
sector in Latin America in the “2023 Latin American Executive Team” and in the categories: Best Investor Relations Program,
Best Investor Relations Team, Best CEO, Best CFO, Best Investor Relations Professional and Best Board of Directors. We also achived the
“Most Honored Company” distinction in Peru and Latin America, for having the highest cumulative success in the rankings. |
Capital Expenditures
We expect to spend approximately
S/ 75 million per year over the next three years on recurring capital expenditures necessary to operate our plants and equipment. During
2023, we incurred additional capital expenditures to finance the optimization of our plant in Pacasmayo. We financed these investments
with our current and future cash flows.
The table below sets forth
our total capital expenditures incurred in 2023, 2022 and 2021.
| | |
Year ended December 31, | |
| (in millions of S/) | |
2023 | | |
2022 | | |
2021 | |
| | |
| | |
| | |
| |
| Pacasmayo plant projects | |
| 251.1 | | |
| 149.7 | | |
| 45.4 | |
| Concrete and aggregates equipment | |
| 18.2 | | |
| 18.8 | | |
| 27.9 | |
| Rioja plant projects | |
| 9.4 | | |
| 4.5 | | |
| 8.9 | |
| Piura plant projects | |
| 17.6 | | |
| 17.1 | | |
| 15.1 | |
| Other investing activities | |
| 3.0 | | |
| - | | |
| - | |
| Total | |
| 299.3 | | |
| 190.1 | | |
| 97.3 | |
B. Business Overview
Overview
We are a Peruvian cement company,
and the only cement manufacturer in the northern region of Peru. With more than 65 years of operating history, we produce, distribute
and sell cement and cement-related materials, such as precast products and ready-mix concrete. Our products are primarily used in construction,
which has been one of the fastest growing segments of the Peruvian economy in recent years. We also produce and sell quicklime for use
in mining operations, although it represents a very small percentage of our overall revenues.
In 2023, our cement, concrete
and precast shipments were approximately 3.0 million metric tons, representing an estimated 24.0% share of total cement shipments
in Peru. Our sales volumes in 2023 decreased by 13.9% compared to 2022, but are still above pre-pandemic levels, as the variation between
2023 and 2019 was 13.0%. We believe the construction sector has significant potential to grow with the continued deficit in infrastructure
and the persistent housing deficit in the country, as well as the reconstruction of northern Peru following Cyclone Yaku in the first
half of 2023
We own three cement production
facilities, our flagship Pacasmayo facility located in the northwest region of Peru, our Piura facility located around 300 kilometers
north of Pacasmayo, and our smaller Rioja facility located in the northeast. Our facilities have a total installed annual cement production
capacity of approximately 4.9 million metric tons. We also have an installed annual production capacity of 240,000 metric tons of quicklime.
We own concession rights to several quarries with reserves of limestone and other raw materials located near our facilities.
In 2023, we began producing
clinker in our new kiln in Pacasmayo, optimizing our capacity in this plant and adding 660,000 metric tons of clinker capacity per year.
We provide consumers with
high-quality and value-added cement products and, as a result, we believe we have developed strong brand recognition and customer loyalty
in our market. We have developed one of the largest independent retail distribution networks for construction materials in Peru. Through
our network of 285 independent retailers and 313 hardware stores as of December 31, 2023, we distribute our cement products as well as
other construction materials manufactured by third parties, such as steel rebar, cables and pipes, in the northern region of Peru. We
also sell our cement products directly to other retailers that are not part of our distribution network and to private construction companies
and government entities.
The following table sets forth
certain macroeconomic data for Peru and operating and financial data for our company for the periods indicated.
| | |
As of and for the year ended December 31, | |
| | |
2023 | | |
2022 | | |
2021 | |
| Economic data(1): | |
| | |
| | |
| |
| Change in GDP | |
| (0.7 | )% | |
| 2.9 | % | |
| 13.2 | % |
| Change in construction sector in Peru | |
| (8.0 | )% | |
| 3.5 | % | |
| 34.7 | % |
| Operating data: | |
| | | |
| | | |
| | |
| Capacity (thousands of metric tons per year): | |
| | | |
| | | |
| | |
| Installed cement capacity | |
| 4,940 | | |
| 4,940 | | |
| 4,940 | |
| Installed clinker capacity | |
| 3,035 | | |
| 2,780 | | |
| 2,780 | |
| Production (thousands of metric tons): | |
| | | |
| | | |
| | |
| Cement production | |
| 2,946 | | |
| 3,436 | | |
| 3,632 | |
| Clinker production | |
| 2,097 | | |
| 2,198 | | |
| 2,036 | |
| Utilization rate at Pacasmayo plant(2): | |
| | | |
| | | |
| | |
| Cement | |
| 57.1 | % | |
| 61.0 | % | |
| 67.9 | % |
| Clinker | |
| 61.6 | % | |
| 62.3 | % | |
| 58.6 | % |
| Utilization rate at Rioja plant(2): | |
| | | |
| | | |
| | |
| Cement | |
| 58.8 | % | |
| 69.8 | % | |
| 76.8 | % |
| Clinker | |
| 69.0 | % | |
| 85.7 | % | |
| 94.4 | % |
| Utilization rate at Piura plant(2): | |
| | | |
| | | |
| | |
| Cement | |
| 64.5 | % | |
| 85.1 | % | |
| 82.7 | % |
| Clinker | |
| 80.7 | % | |
| 100.0 | % | |
| 89.3 | % |
| | |
| | | |
| | | |
| | |
| Gross profit (S/ million) | |
| 689.4 | | |
| 652.0 | | |
| 559.4 | |
| Gross profit margin(3): | |
| 35.4 | % | |
| 30.8 | % | |
| 28.9 | % |
| EBITDA (S/ million) | |
| 481.8 | | |
| 493.9 | | |
| 453.9 | |
| EBITDA margin (4) | |
| 24.7 | % | |
| 23.3 | % | |
| 23.4 | % |
| Adjusted EBITDA(5) (S/ million) | |
| 518.3 | | |
| 493.9 | | |
| 453.9 | |
| Adjusted EBITDA margin(6) | |
| 26.6 | % | |
| 23.3 | % | |
| 23.4 | % |
| Profit (S/ million) | |
| 168.9 | | |
| 176.8 | | |
| 153.2 | |
| Profit margin | |
| 8.7 | % | |
| 8.4 | % | |
| 7.9 | % |
| (1) | Source: BCRP. |
| (2) | Utilization rate is calculated by dividing production for
the specified period by installed capacity of that period. |
| (3) | Gross profit margin is equal to gross profit as a percentage
of net sales. |
| (4) | EBITDA margin is equal to EBITDA divided by sales of goods. |
| (5) | Adjusted EBITDA excludes the effect of the impairment of
our vertical kilns. |
| (6) | Adjusted EBITDA margin is equal to adjusted EBITDA divided
by sales of goods. |
Non-IFRS Financial Measures and Reconciliation
We define EBITDA as net profit
minus finance income and plus finance costs, income tax expense, and depreciation and amortization, and plus or minus gain from exchange
difference, net. We define adjusted EBITDA as EBITDA minus the impairment of our vertical kilns.
EBITDA and adjusted EBITDA
should not be construed as alternatives to profit or operating profit, as indicators of operating performance, as alternatives to cash
flow provided by operating activities or as measures of liquidity (in each case, as determined in accordance with IFRS). EBITDA and adjusted
EBITDA, as calculated by us, may not be comparable to similarly titled measures reported by other companies, including those in the cement
industry.
The following table sets forth
the reconciliation of our profit to EBITDA and adjusted EBITDA:
| | |
Year ended December 31, | |
| | |
2023 | | |
2023 | | |
2022 | | |
2021 | |
| | |
(in millions of
US$)(1) | | |
(in millions of S/) | | |
(in millions of S/) | | |
(in millions of S/) | |
| | |
| | |
| | |
| | |
| |
| Net profit | |
| 45.5 | | |
| 168.9 | | |
| 176.8 | | |
| 153.2 | |
| Income tax expense | |
| 20.7 | | |
| 76.8 | | |
| 85.6 | | |
| 70.9 | |
| Finance income | |
| (1.9 | ) | |
| (7.2 | ) | |
| (3.3 | ) | |
| (2.9 | ) |
| Finance costs | |
| 28.0 | | |
| 104.0 | | |
| 95.2 | | |
| 89.0 | |
| Net (loss) gain derivative financial instruments recognized at fair value through profit or loss | |
| — | | |
| — | | |
| 0.1 | | |
| 1.0 | |
| (Gain) Loss from exchange difference, net | |
| (1.3 | ) | |
| (4.9 | ) | |
| 1.0 | | |
| 7.1 | |
| Depreciation and amortization | |
| 38.9 | | |
| 144.2 | | |
| 138.5 | | |
| 135.6 | |
| EBITDA | |
| 129.9 | | |
| 481.8 | | |
| 493.9 | | |
| 453.9 | |
| Impairment of vertical kilns | |
| 9.9 | | |
| 36.6 | | |
| — | | |
| — | |
| Adjusted EBITDA | |
| 139.7 | | |
| 518.3 | | |
| — | | |
| — | |
| (1) | Calculated based on an average exchange rate of S/3.709 to
US$1.00 as of December 31, 2023. |
Peruvian Cement Market
Peru had a negative 0.7% GDP
in 2023, mainly due to the effects of social conflicts, unfavorable climatic conditions and the outbreak of avian flu, which affected
production capacity and had a second round effect on private sector income and confidence. Addtionally, there was a decrease in the purchasing
power of households due to the persistent and significant increase in food prices, as well as a lower demand for non-traditional products,
mainly from the North American market. From 2019 to 2023 GDP grew at a compound annual growth rate, (“CAGR”), of 0.7%. Growth
during this period was accompanied by low inflation, which averaged 4.4% per year. In addition, as of December 31, 2023, the government
had accumulated foreign exchange reserves of approximately US$75.6 billion, and the sovereign long-term debt rating was investment grade
from each of the three major international credit rating agencies. Although this economic growth had resulted, among other key trends,
in significant poverty reduction, with a decrease in the percentage of the country’s population living below the poverty line from
approximately 48.6% in 2004 to approximately 27.2% in 2022.
We sell substantially all
our cement in the northern region of Peru, which in 2023 accounted for approximately 32.9% of the country’s population and 20.0%
of national GDP. Two other groups sold most of the cement consumed in each of the central and southern regions of Peru, with 1.7% of all
the cement consumed in the country coming from imports, and approximately 3.4% coming from a small domestic producer. From 2019 to 2023,
total cement consumption in Peru increased 1.2% according to the INEI. Peru continues to have a significant housing deficit, estimated
by the INEI at 1.9 million homes nationwide. In Peru, cement is mainly sold to a highly fragmented consumer base, consisting primarily
of households that buy cement in bags to gradually build or improve their own homes without professional technical assistance,a segment
known in our industry as auto-construcción. We estimate that in 2023 sales to the auto-construcción segment
accounted for approximately 73.0% of our total sales of cement, private construction projects accounted for 16.2%, and public construction
projects accounted for the remaining 10.8%. Approximately 88.5% of our total cement sales in 2023 were in the form of bagged cement, substantially
all of which was sold through retailers.
Even though our ready-mix
sales are still a small proportion of our sales, we expect this trend to change as infrastructure becomes a bigger driver of demand in
the upcoming years.
Impairment of Vertical
Kilns
At the end of 2023, our board
of directors, advised by management, recognized a specific impairment for the net value of the assets of the vertical clinker kilns located
at the Pacasmayo cement plant for a net cost of S/36,551,000. This deterioration estimate was carried out as a consequence of replacing
the old technology of these kilns due to the entry into operation of a new horizontal kiln in the Pacasmayo plant, which is more efficient
and produces fewer emissions. This amount was recorded in the impairment of property, plant and equipment item in the consolidated statement
of profit or loss.
Competitive Strengths
Our principal competitive
strengths include the following:
Strong corporate governance
standards and international recognition
Our common shares are listed
on the Lima Stock Exchange and the ADSs are listed on the New York Stock Exchange. We are subject to the disclosure requirements of the
U.S. Securities and Exchange Commission (the “SEC”) and the Peruvian Securities Commission and we must comply with and
adopt internal compliance standards to increase transparency and improve corporate governance standards including an audit committee and
appointment of independent directors. Since 2009, every year we have been selected as part of the Good Corporate Governance Index of the
Lima Stock Exchange (recently renamed S&P/BVL Peru General ESG Index), designed to measure the performance of securities in the S&P/BVL
Peru General Index that meet sustainability criteria. Furthermore, we were included for the fifth consecutive year as part of the 2023
DJSI MILA Pacific Alliance Index. This index is made up of those companies that demonstrate superior performance among their peers under
social, environmental and economic criteria. This achievement comes as a result of Pacasmayo’s effort to improve in all of these
criteria and to work towards ambitious goals in terms of long-term sustainability. We are committed not only to remain in the Index but
to improve our performance, as we are convinced that the focus on sustainability is key to our business and our stakeholders. Additionally,
Institutional Investor highlighted us within the top 3 in the construction sector in Latin America in the “2023 Latin American Executive
Team” and in the categories: Best Investor Relations Program, Best Investor Relations Team, Best CEO, Best CFO, Best Investor Relations
Professional and Best Board of Directors. We also obtained the “Most Honored Company” distinction in Peru and Latin America,
for having the highest cumulative success in the rankings.
In February 2024, we were
selected to be part of The Sustainability Yearbook 2024, for the fourth consecutive year. To appear in the Yearbook, companies must score
within the top 15% of their industry globally and have a gap of less than 30% from the leader’s Global ESG score. With around 9,400
companies evaluated around the world, an inclusion in the yearbook is a true statement of excellence in corporate sustainability.
Track record of cash flow generation and
strong results through multiple business cycles
We have historically generated
strong cash flow and high profit margins mainly due to the following key factors:
| ● | our leadership position in the northern region of Peru; and |
| ● | our extensive distribution network, operational flexibility and efficiency, and focus on innovation. |
These factors helped us generate
adjusted EBITDA of S/518.3 million during 2023, the highest in company history. This solid financial position and our ability to consistently
generate operating cash flow also allows us to obtain relatively low interest rates.
Leader in attractive
and expanding market with solid macroeconomic fundamentals
We are currently the only
cement manufacturer in the northern region of Peru and we produce and sell substantially all of our cement in the region. In 2023, the
northern region accounted for approximately 32.9% of the country’s population and 20.0% of its GDP. From 2019 to 2023, GDP in the
northern region increased at a CAGR of 0.8%. During the same period, our cement sales volume grew at a CAGR of 3.1%, above northern region
GDP mainly due to the resilience of the auto-construcción segment, driven by high employment levels in the agriculture,
fishing and services sectors, which are prominent in the North.
Best-in-class operating
efficiencies with vertical integration and strong brand recognition
Our quarries are located in
close proximity to our plants, enabling us to minimize transportation costs. We strive to enhance our operational efficiency by focusing
on lowering costs and improving profitability. We also benefit from our vertically integrated operations, participating in the entire
chain of production from the quarries, which we own directly, to the related products such as quicklime, ready–mix, precast and
our large distribution network. We have developed one of the largest independent retail distribution networks for construction materials
in Peru, known as “DINO,” consisting of 285 independent retailers and 313 hardware stores as of December 31, 2023, primarily
small, local stores in the northern region, through which we distribute our cement products, as well as construction materials manufactured
by third parties. We use our distribution network, together with our strategically located commercial offices, to promote our products
and stay abreast of market developments. We have developed this network through years of fostering relationships with retailers in the
region, which we believe would be difficult for a competitor to replicate. Our distribution network has enabled us to build strong recognition
for our Pacasmayo brand among retailers and end-consumers in our market, which we believe is important to our business, particularly because
our cement is principally sold in bags to retail consumers.
Disciplined capital
expenditure plan with attractive risk / return profile
We seek to minimize risk while
securing an adequate return on our development projects. In 2015, we completed construction of our new plant in Piura, the third largest
city in northern Peru, which has an annual production capacity of 1.6 million metric tons of cement. The Piura plant improved our competitive
position in the northern region of Peru. With production from three plants, we are able to serve our market more efficiently. This state-of-the-art
plant is one of the most modern in Latin America. It also reduces transportation costs by enabling the dispatching of cement from plants
within closer proximity to the point of sale.
In 2021, we decided to invest
approximately US$83.5 million to optimize our current capacity at our Pacasmayo plant, in order to produce an additional estimated 660,000
metric tons of clinker per year. This optimization was completed during the second half of 2023, allowing us to stop using imported clinker,
and therefore achieving higher margins.
Emphasis on innovation
We place significant emphasis
on research and development to ensure our products meet the needs of consumers in our market and to improve the efficiency of our operations.
For example, we have developed cement products suitable to coastal construction that tend to be more exposed to erosion from sulfate.
We believe that, by educating retailers and end consumers of these attributes of our products, we have been successful in building demand
and realizing higher margins for our differentiated product offering.
In July 2016, we created the
Innovation Department with the main objective of systematizing the continuous transformation process of the business in order to ensure
a sustainable growth for Cementos Pacasmayo and the improvement of its margins. To achieve this objective it is necessary to:
| ● | Put the customer at the center of all our processes. |
| ● | Design a management innovation model. |
| ● | Promote an organizational culture that encourages entrepreneurship and innovation. |
Given that customers, and
consumption patterns can change quickly and unexpectedly we must quickly adapt in order to retain our customers.
During 2023, we continued
developing, and in some cases, consolidating our digital platforms,shown in the following chart:
| Name
of the project |
|
Description |
| MAVERICK |
|
We have improved our concrete service to adapt to the unique needs of each client. We change the way of programming and create new tools to establish different prices according to what each client requires. Our digital transformation team is helping to lead and accelerate this process to achieve these goals. |
| APOLO |
|
During 2023, we partially launched our new B2B ecommerce platform that will support our digital transformation and CX strategy. |
| Design System |
|
We have developed and implemented the Pacasmayo “Bricks” Design System, a collection of reusable components, guidelines and resources used by designers and developers to create consistent and efficient user interfaces. |
| AYU |
|
Project designed to help families in Peru build their dreams without incurring debt or interest. Through an intelligent purchasing method, families will be able to define their project and buy the materials that their project needs month by month. This year there were 500 registrations (potential self-construction projects). |
| DEDALO |
|
Design and guide the implementation of a process automation model, accelerating the digital transformation of the company. |
| PACAS PRO |
|
Is a digital platform aimed at the industrial segment. It aims to maximize the experience of construction companies during the execution of their projects through online and relevant information. |
Strong relationship
with local communities
Since we began operations
over 65 years ago, we have been committed to improving the quality of life of the communities surrounding our plants, whose members we
regularly employ. We have developed close and cooperative relationships with the local communities, which are supported by several social
responsibility initiatives we have undertaken. For example, the family of our controlling shareholder founded, Asociación Tecsup,
a leading non-profit institute in Peru that provides technical education to students as well as UTEC, a leading technical university.
We provide scholarships and financial aid to local qualified students interested in studying at Tecsup.
As part of our Vision 2030
program, aimed at contributing to the progress of our country, in 2023, we built the Regional Archive of Cajamarca, through the mechanism
of Works for Taxes (mechanism implemented by the Peruvian government that allows for quality public infrastructure and services executed
by private sector companies, which are responsible for financing them through the payment of their income tax). This emblematic building
was financed and built by our Company and stores all the historical documentation of the culture and tradition of the city.
In 2023, we also launched our “Sueños en Concreto”
program to improve the infrastructure conditions of homes and thereby contribute to improving the quality of life and habitability conditions
in the areas in which we operate. We started in 2022 with a pilot program and by the end of 2023 we have improved 296 homes.
Highly experienced and
professional management and board of directors
Our management team, with
an average of 15 years of experience in the cement industry in Peru, has extensive technical and local market expertise and has led our
company through our recent growth. We have developed a strong professional business culture and a team of highly qualified executives.
We also have a well-regarded and experienced board of directors that includes some of Peru’s business leaders and former senior
government officials.
Our Strategies
Our objective is to maximize
shareholder value, while honoring our commitment to the environment and abiding by our social responsibility goals. We aim to be a leading
company that provides building solutions anticipating the needs of our clients and that contributes to the continued development of our
country. We intend to achieve our objective through the following principal strategies:
Continue to focus on
our core business of supplying the demand for cement
We plan to continue to meet
the demand for cement in our market, while controlling production costs. We intend to continue to serve the current cement market, as
well as increasing cement demand through the production of new cement-based products. Our principal goal is to maintain our market share
in the northern region of Peru without reducing the profitability of our business, as to continue developing building solutions to satisfy
our clients’ needs.
Deepen our commercial
relationship with retailers and end-consumers
We plan to enhance our commercial
relationships with retailers and end-consumers in our market, both to maintain brand loyalty and to foster demand for our cement products.
We will continue to support retailers in our DINO distribution network by providing product education, training sessions, rewards programs,
and assistance in financing purchases of our products. In addition, we continue with our door-to-door commercial strategy for cement sales.
We believe that these initiatives have been successful in strengthening our relationship with retailers and end-consumers.
Continue to focus on
being the preferred provider of building solutions
We strive to be the supplier
of choice for cement consumers in the northern region of Peru, whether its individuals building their homes or private construction companies
or governmental entities undertaking projects of any size. We continue to focus on providing consumers with efficient and customized building
solutions for their construction needs. Over the past several years, we have evolved from being a single type cement manufacturer to offering
six different types of cement products, under two brands, and other building solutions, such as assembly gravity walls, sheet piles, precast
beams, among others. Moreover, in 2018 we launched a new corporate image and future vision, transforming ourselves from a cement producer
to a building solutions company. We focus on innovation and are constantly searching for ways to improve building practices, inspired
by our culture based on sustainability. For example, we offer cement that contains special properties that protect against sulfate erosion,
as well as other products designed to meet the needs of consumers in the northern region of Peru. For the industrial segment and under
our PacasPro brand, we continue with the digitalization of the purchasing process and of the use of our products and services.
For our mass channel and self-builders we have Mundo Experto, an ecosystem that integrates physical and digital solutions, improves
the purchasing experience and contributes to the professionalization and formalization of the construction market. Our mission is to provide
a comprehensive solution for all project types and thus respond to the unique needs of each client, generating savings and efficiencies
in the construction processes. During 2023, the company began the reconstruction of the two runways and the perimeter fence of Piura Airport,
not only as a cement and concrete provider, but with direct involvement in the construction as well as part of a consortium. The modernization
of the airport aims to stimulate the tourism industry in the region and exceed the 1.09 million passengers transported during 2023.
Selectively pursue acquisitions
We will continue to evaluate
and may selectively pursue strategic acquisitions of cement and complementary businesses that expand our geographic footprint and diversify
our portfolio of products. Our management team has significant operating experience and industry knowledge in the production and commercialization
of cement and cement-related materials, and we believe this experience will enable us to identify and pursue attractive acquisitions that
will maximize shareholder value.
Continue to strengthen
our enterprise risk management
We continue to strengthen
our enterprise risk management methods and processes that allow us to identify, assess and monitor the legal, commercial, operational,
financial and reputational risks, as well as fraud, corruption, bribery and money laundering and financing of terrorism risks, determining
the existing controls and establishing a plan along with other areas in order to mitigate existing risks. Along these lines, since 2018,
we have implemented the ISO 37001 Anti-bribery management systems obtaining the certification every year since 2019. This certification
confirms that our management system is designed to help prevent, detect and respond to bribery and comply with anti-bribery laws and voluntary
commitments applicable to its activities. We believe this certification reiterates our commitment to global anti-bribery best practices
and high standards of transparency and good corporate governance. Also, to continue to strengthen our management systems, during 2022
we implemented the ISO 37301 compliance management system, obtaining certification in January 2023, with a first audited follow-up in
September 2023.
Maintain high environmental,
social and governance standards
We are committed to maintaining
high environmental, social and corporate governance standards. We are focused on developing and strengthening a favorable social environment
for the continuity and growth of our operations, prioritizing our social investment in innovative education, health and local development
programs in coordination with other stakeholders to contribute to sustainable development. Since 2009, every year we have been selected
as part of the S&P/BVL Peru General ESG Index (formerly known as the Good Corporate Governance Index of the Lima Stock Exchange),
designed to measure the performance of securities in the S&P/BVL Peru General Index that meet sustainability criteria. Furthermore,
we were included for the fifth consecutive year as part of the 2023 DJSI MILA Pacific Alliance Index. This index is made up of those companies
that demonstrate superior performance among their peers under social, environmental and economic criteria. This achievement comes as a
result of Pacasmayo’s effort to improve in all of these criteria and to work towards ambitious goals in terms of long-term sustainability.
We are committed not only to remain in the Index but to improve our performance, as we are convinced that the focus on sustainability
is key to our business and our stakeholders.
In February 2024, we were
selected to be part of The Sustainability Yearbook 2024, for the fourth consecutive year. To appear in the Yearbook, companies must score
within the top 15% of their industry globally and have a gap of less than 30% from the leader’s Global ESG score. With around 9,400
companies evaluated around the world, an inclusion in the yearbook is a true statement of excellence in corporate sustainability. This
achievement is a recognition of our extraordinary efforts to improve in all of these criteria and to work towards ambitious goals in terms
of long-term sustainability. We are committed not only to remain in the Index but to improve our performance, as we are convinced that
the focus on sustainability is key to our business and our stakeholders.
In 2023, we launched the EcoSaco,
a cement bag that completely disintegrates within the concrete mix, generating zero waste. For us, this is much more than a cement bag,
it’s a solution that has the potential to revolutionize the market, particularly the self-construction segment. As with any transformational
change, it requires much effort in order to gradually change culturally established paradigms and consumer habits. This is precisely why
we are so glad that the EcoSaco won the Semana Economica ESG Sustanaibility Price, both in the Sustainable Product Innovation Category
and the Grand Prize, awarded to the project with the greatest environmental, social and economic impact. The EcoSaco also obtained the
“Gran Effie”, as well as a Gold Effie that was awarded in the “Innovation in product marketing” category and a
Silver Effie in the “Positive change in the environment” category. The Effie awards are a symbol of outstanding achievement,
recognized worldwide, that honor all types of effective marketing.
Our Products
Our core products are cement
and other cement-related materials. We also produce quicklime. In 2023, cement, concrete, mortar and precast accounted for 92.8% of our
net sales and quicklime accounted for 1.8%. We also sell and distribute construction materials, such as steel rebar, cables and pipes,
manufactured by large third-party manufacturing companies, and others which in 2023 represented 5.4% of our net sales.
The following table sets forth
a breakdown of our shipments by type of product for the periods indicated:
| | |
Year ended December 31, | |
| (in thousands of metric tons) | |
2023 | | |
2022 | | |
2021 | |
| Cement, concrete, mortar and precast | |
| 2,953 | | |
| 3,432 | | |
| 3,632 | |
| Quicklime | |
| 30 | | |
| 46 | | |
| 69 | |
The following table sets forth a breakdown
of our total net sales by product for the periods indicated:
| | |
Year ended December 31, | |
| (in millions of S/) | |
2023 | | |
2022 | | |
2021 | |
| Cement, concrete, mortar and precast | |
| 1,850.2 | | |
| 1,963.8 | | |
| 1,784.5 | |
| Construction Supplies (1) | |
| 74.1 | | |
| 114.0 | | |
| 113.9 | |
| Quicklime | |
| 25.7 | | |
| 37.9 | | |
| 39.1 | |
| Others | |
| — | | |
| — | | |
| 0.3 | |
| Total | |
| 1,950.1 | | |
| 2,115.7 | | |
| 1,937.8 | |
| (1) | Refers to construction materials manufactured by third parties that we distribute. Construction supplies
include the following products: steel rebar, wires, nails, corrugated iron, electric conductors, plastic tubes and accessories, among
others. |
Cement
Cement is a powdered mixture
of ground minerals that, when mixed with water, adheres to other materials and hardens to form a rock-like substance. Cement is generally
mixed with other materials, such as gravel and sand, forming concrete with a high degree of compressive strength that is able to withstand
substantial pressure.
Cement types are generally
classified as either Portland cement or blended hydraulic cement. Portland cement is a hydraulic cement produced by pulverizing clinker,
consisting essentially of crystalline hydraulic calcium silicates and calcium sulfate. Blended hydraulic cement consists of a mixture
of Portland cement clinker and mineral admixtures, such as blast furnace slag, pozzolanic materials and limestone.
We produce predominantly blended
cement, which represented 86.3% of our cement sales in 2023. This type of cement requires less clinker and reduces carbon dioxide emissions
of our operations and production. Our global clinker/cement ratio is estimated at 72%, below the average value for similar producers globally
of approximately 77.6%, according to “Getting the Numbers Right (GNR)” by the Global Cement and Concrete Association (the
“GCCA”) in 2021.
We produce a range of cement
products suitable for various uses, such as residential and commercial construction and civil engineering. We currently offer the following
six types of cement products designed for specific uses:
| ● | Type ICo. This type of cement is used for general purposes or when not required for a specific
special condition. It is widely used due to its excellent workability and good development of compressive strength. |
| ● | Type MS(MH). This is the new formula for the type of cement that is used to protect against moderate
sulfate action, such as drainage structures, with higher-than-normal, but not unusually severe, sulfate concentrations in groundwater.
It is designed for sites and structures in humid areas that are exposed to sulfates and sea water. It also prevents thermal contraction
cracking due to moderate heat hydration. |
| ● | Type I. This type of cement is for general purposes and suitable if special properties are not
needed. It is generally used for constructing pavements, floors, reinforced concrete buildings, bridges, reservoirs, pipes, masonry
units and precast concrete products. |
| ● | Type V. Type V cement is used in concrete exposed to severe sulfate action, principally in places
where soil or ground water has high sulfate content. It is generally used in hydraulic construction, such as irrigation canals, tunnels,
water conduits and drains. |
| ● | Type HS. Type HS cement is used in concrete that is exposed to severe sulfate action, principally
where soil or ground water has high sulfate content. It is recommended for port construction, industrial plants and construction of sewage
sites. |
| ● | Type HE. Cement designed to provide high early strengths at early ages. It is a cement with strengths
similar to Type I but has a lower carbon footprint. |
We believe that our Type V,
Type MS(MH) and Type HS cement products are particularly suitable for construction in the northern coastal region of Peru, where sulfate
and chloride concentrations from soil, ground water and sea water affect the durability of construction structures. By educating retailers
about the different cement characteristics and conducting marketing campaigns, we believe we have been successful in building demand for
our cement products. Our research and development department is also equipped to produce custom-tailored cement products on demand. In
addition, through our dedicated research and development team we have significantly reduced the amount of clinker required for cement
production minimizing our capital expenditures and significantly reducing our carbon dioxide emissions (CO2).
We market and distribute our
cement primarily in 42.5 kilogram bags. Most of our bagged cement is sold to the retail sector consisting primarily of households that
buy bags of cement to build or expand their own homes over time with little or no formal technical assistance (commonly referred to as
auto-construcción). The bags are made of Kraft paper to preserve the quality of the cement. Our bags include information
relating to the composition of our cement, handling instructions, production dates and storage instructions. Our cement bags have different
colors to easily identify the different types of cement. Once bagged at our Pacasmayo, Rioja and Piura facilities, our cement is loaded
onto trucks operated by third parties. Cement in bulk is sold to large industrial consumers.
During 2023, we began certifying
all of our products under the rigorous scheme 5 of ICONTEC, an international certification body for products, services and management
systems. We obtained this certification for our entire cement portfolio, complying with the most rigorous level for products established
by the Supreme Decree that regulates the commercialization of cement in Peru. Product certification is carried out based on the requirements
of the Cement Technical Regulations, which establish the characteristics that cement must meet at the production and marketing level.
Likewise, the Cement Technical Regulations require that all cement producing and importing companies in Peru comply with the requirements
indicated therein in order to be able to market their products. The certification process consisted of a rigorous audit of the quality
management system at the production, manufacturing and marketing level in our three plants and at authorized points of sale.
Concrete Products
We also produce and sell concrete
products principally in the form of ready-mix concrete used in large construction sites, as well as precast, bricks, pavers and other
precast materials.
| ● | Ready-mix concrete. Ready-mix is a blend of cement, aggregates (sand and stone), admixtures and
water. It is manufactured and delivered to construction sites in a form that is ready to use. This mixture hardens to form a building
material, ranging from sidewalks to skyscrapers. We have 19 fixed and mobile ready-mix plants. |
| ● | Concrete precast. We produce and sell concrete precast, such as paving units, or paver stones for pedestrian walkways, as well
as other bricks for partition walls and concrete precast for structural and non-structural uses. Some examples of concrete precast are: |
| o | New Jersey Walls: safety barriers used to separate
traffic flows. |
| o | Corner block: a product that complements the structures
built with our precast, giving better functionality to any corner. |
| o | Beam block: a product that is used to confine the
upper part of walls built with our precast. |
| o | Concrete pipes: precast reinforced concrete pipes
that are installed without the need to open pit ditches or dredging of maritime floors. The main use of concrete pipe is to collect seawater
(inlet pipe) and to bring brackish water back out to sea (outfall pipe). We have built a 1.5 kilometer long underwater outfall project
for the Talara Refinery, where it is necessary to build a water collection system for its fire and cooling system. |
| o | Sheet piles presented and assembled: concrete piles
that can be pre-stressed or reinforced (they are two different types of manufacturing) that sink one alongside the other, forming a containment
structure, used as riparian defenses. We manufacture pre-stressed and reinforced sheet piles that can form a coastal defense for rivers,
ensuring the containment of water during rainy events, reducing the vulnerability of cities to floods. |
| ● | New cement based products. We have developed, and are in the process of developing more cement-based products that are innovative
and easy building solutions. Some of these products are: |
| ⮚ | Mortar for brick laying: Pre-dosed and bagged dry masonry mortar for block and brick laying. |
| ⮚ | Mortar for plaster: Pre-dosed mortar to plaster interiors and exteriors, walls and ceilings. Allows
smooth finishes and thin applications |
| ⮚ | Caravista Concrete: Concrete designed to be exposed without any additional coating or paint. |
| ⮚ | Tremie Concrete: Concrete designed to be placed under water at depths greater than 1.5 meters. |
| ⮚ | Mortar for brick laying: Pre-dosed and bagged dry masonry mortar for block and brick laying. |
| ⮚ | Viaforte Type MH: Cement of moderate heat of special hydration for stabilization of soils and road
bases. The cement provides greater workability and less risk of cracking on site, also ensuring greater durability to the structure |
| ⮚ | Bagged Dry Concrete: Pre-dosed mixture of cement, aggregates (Stone and Sand) and additives, that
only requires the addition of water indicated on the package and mixing (manual or mechanical) to be used immediately |
Quicklime
We produce and distribute
quicklime, which has several industrial uses. Quicklime serves as a neutralizer, lubricant, drying and absorbing material, disinfectant,
and as a raw material. Quicklime has various applications, including in the steel, food, fishing and chemical industries. It is also used
in mining operations to treat water and industrial residues, in agriculture as a fertilizer enhancer and, to a lesser extent, in other
industries. In Peru, quicklime is mainly used in the mining industry, as an additive to treat water residues. We produce quicklime in
finely and coarsely ground varieties and sell it either in bags of one metric ton or in bulk, according to clients’ requirement.
Quicklime currently represents a small percentage of our revenues.
Production Process
Cement Production Process
The diagram below depicts
the standard cement production process, which consists of the following main stages:
| ● | extraction and transportation of limestone or coquina (seashells) from the quarry; |
| ● | grinding and homogenization to make the raw material of consistent quality; |
| ● | packaging, loading and distribution. |
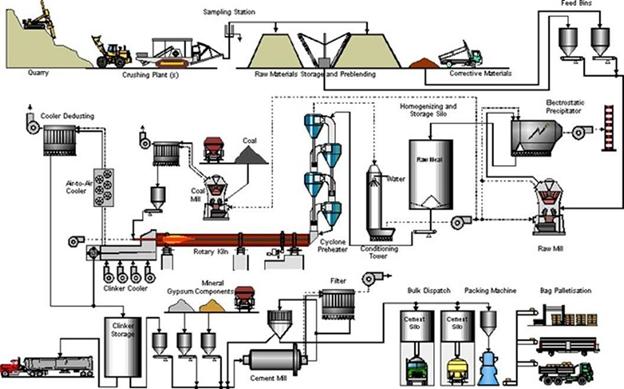
Extraction of raw materials.
To produce cement, limestone/coquina are extracted from our quarries. We use explosives to loosen the limestone and deploy bulldozers
to remove dirt and the overburden covering the limestone. We crush the limestone in our primary and secondary cone crusher and the resulting
limestone is loaded into trucks and hauled to our Pacasmayo or Rioja facilities from the adjacent quarry where it is stored. In the case
of Piura, our surface miner drills out our coquina quarry and then it is also loaded into trucks and hauled to the Piura plant.
Grinding and homogenization.
Limestone/coquina, clay and sand are mixed with iron that is acquired from third parties. The quality of the resulting raw meal is monitored
by examining samples of each batch and processing them through our quality control x-ray software that automatically measures the mix
of materials to confirm the blend is in compliance with our quality standards. Subsequently, the raw meal is sent to a blending silo and
then to a storage silo from where it is fed into the pre-heater.
Clinkerization. The
raw meal is heated at a temperature of approximately 1,450 degrees Celsius in our kilns. The intense heat causes the limestone and other
materials in the mixture to react inside the kiln, turning the mixture into clinker. Clinker is then cooled to a temperature of approximately
200 degrees Celsius and stored in a silo or in an outdoor yard.
Cement grinding. After
being cooled, clinker, together with gypsum and some admixtures, is fed into a ball mill or into a vertical roller mill where it is ground
into a fine powder to produce cement. In this form, cement reacts as a binding agent that, when mixed with water, sand, stone and other
aggregates, is transformed into concrete or mortar.
Storage in silos. After
passing through the ball mills, the cement is transferred on conveyor belts and stored in concrete silos in order to preserve its quality
until distribution.
Packaging, loading and
transport. Cement is transferred through another conveyor belt from the silo to be packaged in 42.5 kilogram bags and then loaded
into trucks operated by third parties to be transported for distribution. Bulk cement may be transported (unpackaged) on especially designed
trucks that deliver large amounts of cement directly to the work site.
Quicklime Production Process
Quicklime is produced by crushing
limestone with a calcium carbonate content of at least 95% by calcinating it in a rotary kiln. The limestone for quicklime comes from
our quarries. The crushing of the limestone is done at the quarry and the calcination process takes place only at our Pacasmayo facility.
We produce quicklime in finely and coarsely ground varieties and sell both varieties in big bags as well as in bulk.
Raw Materials and Energy Sources
Limestone and Other Calcareous Resources
We obtain limestone required
to produce clinker and quicklime principally from land where we have concession rights. For our Pacasmayo plant, we extract limestone
from our Acumulación Tembladera quarry located approximately 60 kilometers from the plant, and for our Rioja plant, we extract
limestone from our Calizas Tioyacu quarry which is adjacent to our Rioja plant. For our Piura plant, we extract coquina from Virrilá
quarry, located approximately 120 kilometers from the plant.
Acumulación Tembladera.
We have a concession with an indefinite term to extract limestone and other minerals from our Acumulación Tembladera quarry, a
3,390 hectares open-pit mine located in the district of Yonan, in the department of Cajamarca. We acquired this concession in November
2002.
Calizas Tioyacu. For
our Rioja production, we have a concession with an indefinite term to extract limestone and other minerals from a 400 hectares open-pit
mine near our Rioja facility in the district of Elias Soplin Vargas, in the department of San Martín. We acquired this concession
in February 1998.
Virrilá. For
our Piura production, we also have a group of concessions with an indefinite term to extract coquina and other minerals from our Virrilá
quarry, a 931 hectares open-pit mine located in the district of Sechura, in the department of Piura. We acquired these concessions between
2000 and 2008.
In addition to our Acumulación
Tembladera, Calizas Tioyacu, Bayovar 4 and Virrilá quarries, we also own concession rights to various other calcareous material
quarries consisting, in total, of approximately 40,767 hectares located in the northern region of Peru. None of these quarries are in
operation as of the date of this annual report.
Clay, Sand and Other Raw Materials and Admixtures
The other raw materials that
we use to produce clinker are clay, sand, iron and diatomite.
Clay
For cement production in our
Pacasmayo facility, we extract clay from our Cerro Pintura quarry, a 400 hectares open-pit concession located in the district and province
of Pacasmayo, department of La Libertad. We were granted this concession by the MEM in 1996. The term of the concession is indefinite,
provided we pay an annual concession fee and meet minimum annual production requirements.
For cement production in our
Rioja facility, we extract clay from our Pajonal quarry, a 400 hectares open-pit concession located in the district and province of Rioja,
department of San Martin. This concession was granted to us by the MEM in 1998. The term of the concession is indefinite, provided we
pay an annual concession fee and meet minimum annual production requirements.
We have not calculated our
clay reserves, as we believe there is an abundant supply of clay in our concessions and more broadly in the northern region where we operate.
Sand
For cement production in our
Pacasmayo facility, we use sand extracted from our Cerro Pintura quarry. Our Rioja facility does not utilize sand as a raw material given
the type of cement it produces.
We have not calculated our
sand reserves, as we believe there is an abundant supply of sand in our concessions and more broadly in the northern region where we operate.
Iron
We use small quantities of
iron in our cement production, which we purchase from third parties at market prices.
Coal
We purchase mostly anthracite
coal from local suppliers and import small amounts of bituminous coal from suppliers mainly in Colombia, in each case at spot market prices.
Anthracite coal tends to be less expensive than bituminous coal. We store coal at our premises and in our warehouse facilities, adjacent
to the Salaverry port and in Trujillo, where we have sufficient stock of coal to maintain our production levels for the next year.
In December 2009 and February
2010, we entered into option agreements to acquire coal mining concessions as a means to secure a steady and reliable source for our coal
requirements and to reduce the volatility in costs related to coal. In 2011, we exercised certain options under these agreements to acquire
coal mining concessions for 908.5 hectares near our Pacasmayo facility for a total purchase price of US$4.5 million. In 2013, we
exercised our remaining options to purchase an additional coal mining concession for 501.2 hectares for US$1.0 million, thereby completing
the acquisition of the related coal mining concessions.
Pozzolanic Materials and Other Admixtures
Our cement production also
requires small amounts of other admixtures, such as pozzolanic materials, gypsum and blast furnace slag.
For cement production in our
Pacasmayo facility, we use pozzolanic materials obtained from our Cunyac quarry, a 200 hectares open-pit concession located in the district
of Sexi, province of Santa Cruz, department of Cajamarca. The concession was granted to us by the MEM in 2008. The term of the concession
is indefinite, provided we pay an annual concession fee and meet minimum annual production requirements.
For cement production in our
Rioja facility, we use pozzolanic materials obtained from our Fila Larga quarry, a 1,000 hectares open-pit concession located in the district
of El Milagro, province of Utcubamba, department of Amazonas. The concession was granted to us by the MEM in 1998.
We also own several other
concessions containing pozzolanic material which have not been exploited. In addition, our use of pozzolanic materials may be substituted
with clinker or other admixtures. Other admixtures, such as gypsum and blast furnace slag, are purchased at market prices from third-party
suppliers. If we are unable to acquire raw materials or admixtures from current suppliers, we believe that other sources of raw materials
and admixtures would be available without significant interruption to our business.
Energy Sources
Electricity
As of December 31, 2023, all
of the electricity requirements for our Pacasmayo and Piura facilities were supplied by Electroperú and for our Rioja facility
by ELOR.
We have a long-term electricity
supply contract with Electroperú currently valid until 2026. Electroperú has agreed to provide us with sufficient energy
to operate our Pacasmayo and Piura facilities at pre-determined maximum amounts during the term of the contract. Payments for electricity
are based on a formula that takes into consideration our energy consumption and certain market variables, such as the U.S. purchase price
index, the global price of oil, the local price of natural gas and the import price of bituminous coal.
In addition, we have a medium-term
electricity supply contract with ELOR to supply the Rioja facility, valid until November 2024 ELOR supplies the Rioja facility with 6.7
megawatts of electricity at peak hours and eight megawatts at non-peak hours. Payments for electricity are based on a formula that takes
into consideration our energy consumption and certain market variables, such as the U.S. dollar price, the local price of natural gas,
the global price of oil and the import price of bituminous coal.
Other Production Materials
We use other materials in
the cement production process, including paper bags to package cement, which we purchase principally from local suppliers; plastic bags
used to package quicklime, which we purchase from local suppliers; and water to cool the kiln exhaust gases and for our crushing operations
at our Acumulación Tembladera quarry, which we obtain principally from a well located at our Pacasmayo facility and from the Jequetepeque
river. Water used in our production process is maintained in a closed system at our plants and re-processed for utilization in our production
process.
Consumer Base
The retail cement sector in
Peru is characterized by households that purchase single bags of cement to gradually build or improve their homes with little or no professional
assistance. This sector is known as auto-construcción. Families in this sector tend to invest a large portion of their savings
in building or improving their own homes. Auto-construcción is often conducted with the help of a foreman (maestro de
obra) who generally has experience in construction. Our retail marketing plans typically target the maestro de obra who is
usually the decision maker when buying cement and other related construction materials.
We also sell directly to small,
medium and large private construction companies working on a variety of construction projects, from housing complexes to commercial developments.
In the public sector, we provide cement for national, regional and local governments carrying out construction projects including housing
complexes and public construction, ranging from local schools and hospitals to large infrastructure.
Sales and Distribution
Distribution
Our market extends from the
Ecuadorian border in the north of Peru to the city of Barranca in the south (approximately 180 kilometers north of Lima), to the rainforest
in the east and the Pacific Ocean in the west. Our market covers the provinces of Amazonas, Cajamarca, La Libertad, Lambayeque, Piura
and Tumbes in the north; and San Martín and Loreto in the northeast.
Our Pacasmayo, Piura and Rioja
facilities supply the entire northern region of Peru, interchangeably subject to where it is most efficient to ship from at the moment,
depending on the distance and type of cement being produced, among other factors.
In 2023, approximately 88.5%
of our total cement shipments were in the form of bagged cement, substantially all of which was sold through retailers both within and
outside of our distribution network. The remaining 11.5% of our cement was sold in bulk or in shipments of precast products or ready-mix
concrete directly to large construction companies.
We have developed one of the
largest independent retail distribution networks for construction materials in Peru, consisting of 313 hardware stores, with which we
have a distribution agreement. In addition, we also distribute to other independent retailers located throughout the northern region of
Peru with whom we do not have contractual relationships. We have built our distribution network by investing in strengthening our relationship
with retailers.
Even though our ready-mix
sales are still a small proportion of our sales, we expect this trend to change as infrastructure becomes a bigger driver of demand in
the upcoming years. Additionally, we sell and distribute other construction materials manufactured by third parties that are used alongside
cement, such as steel rebar, plastic pipes and electrical wires, among others.
Marketing and Brand Awareness
We use our distribution network,
together with our strategically located local commercial offices, to promote our products and brands, as well as to keep us informed of
market developments. We believe our distribution network has enabled us to build strong recognition for our Pacasmayo brand among maestros
de obra, retailers and end consumers which we believe is important to our business, particularly because our cement is principally
sold in bags to retail consumers.
Our marketing expenses in
2023 were approximately S/7.5 million, or 0.4% of our sales. Historically, our marketing strategy has been to develop brand loyalty by
providing high-quality products, tailored to the needs of our customers, and customer service accompanied by complimentary training for
the maestros de obra, who are typically the decision makers in the auto-construcción segment.
We develop strong ties with
our distributors by promoting income generating opportunities for them. For instance, we give them priority when hiring transportation
to distribute our cement throughout our territory. Also, our large salesforce has the ability to cover most of the construction sites
in northern Peru generating business opportunities that are then channeled through our distributors. Finally, our distributors enjoy various
commercial and marketing benefits such as rebates, special promotions, special credit conditions, and loyalty programs.
We have been working consistently
in recent years to focus time and attention on our client’s needs, in an effort to go beyond just selling cement and its byproducts,
to providing solutions and innovating. Consequently, we were well-positioned to leverage these initiatives during the ongoing pandemic
period. The self-construction segment has been the primary driver behind the growth in sales volume during 2023. We have focused on several
fronts to enhance the customer experience and to facilitate access to our solutions. We have developed Mundo Experto, which is
a virtual ecosystem made up of digital solutions that serves to join supply and demand and offers a superior purchasing experience leveraged
on intensive use of technology to generate more value for our users. The digital solutions are targeted and customized for the different
users, such as foremen, hardware stores, and the self-builder.
Quality Control
In Peru, cement production
is subject to standardization (normalización) regulations approved by the National Institute for the Protection of Competition
and Intellectual Property (Instituto Nacional de Defensa de la Competencia y de la Protección de la Propiedad Intelectual,
or “INDECOPI”). Although the standardization regulations are not mandatory, they are useful in achieving an optimum level
of management. As of the date of this annual report, we comply with all standardization regulations applicable to our products.
We have established a quality
assurance program in accordance with ISO Standard 9001-2008, certified by SGS del Perú S.A.C., a company that provides inspection,
verification, testing and certification services. We monitor quality at every stage of the cement production process. In our facilities,
we periodically test the quality of our raw materials. These tests include chemical, physical and x-ray tests. We perform similar examinations
of the clinker we produce. Additionally, we also perform regular quality tests on our finished products.
We have a quality control
area with computerized systems to access real-time information on the quality of our products. As part of our quality control process,
we monitor the performance of our different cement products, monitor the performance of additives in our cement and review monthly statistical
analysis on the resistance of cement, among other things.
During 2023, we began certifying
all of our products under the rigorous scheme 5 of ICONTEC, an international certification body for products, services and management
systems. We obtained this certification for our entire cement portfolio, complying with the most rigorous level for products established
by the Supreme Decree that regulates the commercialization of cement in Peru. Product certification is carried out based on the requirements
of the Cement Technical Regulations, which establish the characteristics that cement must meet at the production and marketing level.
Likewise, the Cement Technical Regulations require that all cement producing and importing companies in Peru comply with the requirements
indicated therein in order to be able to market their products. The certification process consisted of a rigorous audit of the quality
management system at the production, manufacturing and marketing level in our three plants and at authorized points of sale.
This certification is evidence
that our corporate culture motivates us to exceed the quality standards of our products with focus on sustainability, as we are going
above and beyond the legal requirements and using this certification as a tool for continuous improvement for the benefit of our clients
and the sector as a whole.
Competitive Position
Peru’s cement production
is segmented into three main geographic regions: the northern region, the central region, including Lima’s metropolitan area, and
the southern region. We are the only cement manufacturer in the northern region of Peru. The central region is principally served by UNACEM
(formerly known as Cementos Lima and Cemento Andino), some imports, Caliza Cemento Inca and Mixercon. The south is principally served
by Cementos Yura. In 2023, our cement shipments were approximately 2.9 million metric tons, representing an estimated 23.9% share of total
cement shipments in Peru.
Regulatory Matters
Overview
Although our core business
is the production of cement, we hold a number of mining concessions granted by the Peruvian government for the supply of limestone and
other raw materials required for cement production. As a result, we are subject both to the mining and the general industrial legal framework
in Peru. The regulatory framework applicable to our cement production may be divided into rules and regulations relating to (i) the mining
and crushing of limestone and clay, and (ii) the production process.
Mining Regulations
The General Mining Law (Texto
Único Ordenado de la Ley General de la Minería) approved by Supreme Decree No. 014-92-EM, published in the Peruvian
Official Gazette, El Peruano, on June 3, 1992, is the primary law governing both metallic and non-metallic mining activities in
Peru and is supplemented by implementing guidelines and policies regarding mining and the processing of minerals enacted by the MEM. Under
the General Mining Law, mining activities (except storage, reconnaissance, prospecting and trade) are carried out exclusively through
various forms of concessions. Mining concessions are granted by the Geological, Mining and Metallurgical Institute (Instituto Geológico
Minero y Metalúrgico, or “INGEMMET”), and all other concessions, including our mineral processing concessions,
are granted by the Directorate General for Mining of the MEM. Any act, transfer, termination or agreement related to these concessions
must be registered with the Mining Rights Registry, which is part of the National Public Registry System, to be effective against the
Peruvian government and third parties.
Holders of concessions or
mining claims must comply with several obligations, including the payment of an annual concession fee (derecho de vigencia) of
US$3.00 per applicable hectare. The annual concession fee is due and payable on or prior to June 30 of each year. Failure to pay the annual
concession fee for two consecutive years will result in the termination of the mining concession.
Mining activities require
holders to obtain title to the surface land from individual landowners, peasant communities or the Peruvian government. Mining concessions
are granted for an unlimited period, subject to the achievement of minimum annual production levels. Two different regimes apply depending
on the date the concession was granted:
Under Legislative Decree 1320
and Supreme Decree No. 011-2017-EM, since January 1, 2019, if the annual minimum production or investment has not been met, the annual
penalty and the causes to terminate a mining concession will be determined by the General Mining Law for all concessions, as described
below.
For concessions granted until
2008, the following rules apply:
| ● | the minimum annual production target is equivalent to one tax unit (approximately S/4,950 or US$1,335)
per year per hectare, in case of metallic mining concessions, and 10% of one tax unit (approximately US$134) per year per hectare, in
the case of non-metallic mining concessions; |
| ● | the minimum production level is to be achieved no later than the end of the tenth year from the date of
grant; |
| ● | if the minimum production level is not achieved within that period, an annual penalty equivalent to 2% of
the minimum annual production level is due until such level is achieved; |
| ● | if the minimum production level is not achieved by the end of the fifteenth year, an annual penalty equivalent
to 5% of the minimum annual production level is due until such level is achieved; |
| ● | if the minimum production level is not achieved by the end of the twentieth year, an annual penalty equivalent
to 10% of the minimum annual production level is due until such level is achieved; and |
| ● | if the minimum production level is not achieved by the end of the thirtieth year, the mining concession
expires. |
Any penalty must be paid prior
to June 30 of each year. Failure to pay the penalty for two consecutive years results in the termination of the mining concession.
Since January 1, 2020, these
penalties will be applied for concessions granted in 2009 and thereafter.
The foregoing penalties and
fines are not applicable to mining concessions granted by the government through private investment promotion initiatives, which will
be subject to the minimum production and investment levels set forth in such contracts.
In addition to the payment
of the annual concession fee and the penalty, holders of mining concessions must, pursuant to the Mining Royalty Law, pay a royalty for
the exploitation of metallic and non-metallic resources. Prior to the amendment of the Mining Royalty Law described below, the amount
of the royalty was determined on a monthly basis. For those minerals with an international market price (gold, silver, copper, zinc, lead
and tin), the amounts were computed by applying the rates to the value of the concentrate or its equivalent, according to the applicable
international market price. The historic rate scales were established in the Mining Royalty Law’s regulations as shown in the following
table:
Annual sales
(in millions of US$) | |
Rate | |
| Up to 60 | |
| 1 | % |
| Between 60 and up to 120 | |
| 2 | % |
| More than 120 | |
| 3 | % |
In case of minerals without
an international reference market price (minerals other than gold, silver, copper, zinc, lead and tin), the mining royalty amounted to
1% of the value of the final product obtained from the mineral separation process, net of any costs incurred in the mineral separation
process (componente minero).
However, the Mining Royalty
Law was amended on September 29, 2011 to increase the tax payable on metallic and non-metallic mineral resources. Effective October 1,
2011, the royalty for the exploitation of metallic and non-metallic resources is payable on a quarterly basis in an amount equal to the
greater of (i) an amount determined in accordance with the following statutory scale of tax rates based on a company’s operating
profit margin and applied to the company’s operating profit, as adjusted by certain non-deductible expenses, and (ii) 1% of a company’s
net sales, in each case, during the applicable quarter. The royalty rate applied to the company’s operating profit is based on its
operating profit margin according to the following statutory scale of rates:
| Operating Margin | |
Applicable Rate (%) | |
| 0% - 10% | |
| 1.00 | |
| 10% - 15% | |
| 1.75 | |
| 15% - 20% | |
| 2.50 | |
| 20% - 25% | |
| 3.25 | |
| 25% - 30% | |
| 4.00 | |
| 30% - 35% | |
| 4.75 | |
| 35% - 40% | |
| 5.50 | |
| 40% - 45% | |
| 6.25 | |
| 45% - 50% | |
| 7.00 | |
| 50% - 55% | |
| 7.75 | |
| 55% - 60% | |
| 8.50 | |
| 60% - 65% | |
| 9.25 | |
| 65% - 70% | |
| 10.00 | |
| 70% - 75% | |
| 10.75 | |
| 75% - 80% | |
| 11.50 | |
| More than 80% | |
| 12.00 | |
Mining royalty payments will
be deductible for income tax purposes in the fiscal year in which such payments are made.
We believed that certain portions
of the regulations of the Mining Royalty Law were unconstitutional, because they impose a mining royalty tax on non-mining activities.
For instance, for cement companies, the amended Mining Royalty Law and its regulations established that the mining royalty tax was calculated
based on the total operating profit or net sales, as opposed to operating profit or net sales attributable exclusively to mining products,
such as limestone, used to produce cement. Accordingly, in December 2011, we filed a claim to declare that the mining royalty tax applicable
for the exploitation of non-metallic mining resources be calculated based on the value of the final product obtained from the mineral
separation process, net of any costs incurred in the mineral separation process (“componente minero”).
In November 2013, the Peruvian
Constitutional Court affirmed the constitutional challenge we filed against the new regulation of the Mining Royalty Law, in a final and
unappealable ruling, on the grounds that the new regulation violates the constitutional right of property, as well as the principles of
legal reserve and proportionality. Therefore, the new regulation is rendered inapplicable to our operation. As a result, we will continue
to use as a basis for the calculation of the mining royalty the value of the concentrate or mining component, and not the value of the
product obtained from the industrial or manufacturing process.
Finally, holders of mining
concessions are required at the beginning of their operations to submit a mining closure plan that must contain a description of the steps
to restore the areas and facilities of each mining operation area to pre-mining condition. Holders of mining concessions are required
to secure completion of the restorative measures by means of the following guarantees: (i) banking guarantee or credit insurance; (ii)
cash guarantees; (iii) trusts; or (iv) those indicated in the Peruvian Civil Code.
In August 2021, Law 31347,
that modifies the Mine Closure Law (Law 28090), specifying aspects such as mandatory, administrative and oversight powers, opportunity
for presentation and approval, applicable guarantees, periodic reports to be presented to various authorities, among others was approved.
As of the date of this annual
report, we primarily owned non-metallic mining concessions and limited metallic mining concessions with respect to iron. Substantially
all of our concessions were granted prior to 2008. Our mining rights and concessions are in full force and effect under applicable Peruvian
laws. We believe that we are in compliance in all material respects with the terms and requirements applicable to our mining rights and
concessions.
Production Process
The cement production process
along with other manufacturing activities are governed by General Industry Law (Ley General de Industrias), Law No. 23407, published
in El Peruano on May 29, 1982, which establishes basic rules that promote and regulate activities in the manufacturing industry.
The Ministry of Production is vested with authority to promote private investments in connection with industrial, processing and manufacturing
activities, the surveillance of sustainable exploitation of natural resources (except for those extractive activities involving primary
transformation of natural products), the protection of the environment, and the supervision of the quality of manufactured products. All
industrial companies are subject to the General Industry Law and its regulations to the extent that the company’s gross income is
primarily derived from industrial activities. Pursuant to Supreme Decree No. 009-2011-MINAM, the supervisory and monitoring functions
of the Ministry of Production were transferred to the OEFA in 2013.
Technical Regulation on Hydraulic Cement
On January 21, 2022, the
Government published D.S. 1-2022-PRODUCE, which approves the Technical Regulation on Hydraulic Cement Used in Buildings and Constructions
in General, through which various aspects are regulated that will allow verification of compliance with the minimum safety requirements
of cement. Originally, the Regulation entered into force six months after its publication, later extended to July 22, 2023 by D.S. 10-2022-PRODUCE,
a period in which all the parties involved (public entities, national manufacturers, importers, laboratories, chain of supply, among others)
must adapt their protocols to comply with the provisions of the Regulation.
Environmental Regulations
Industrial
companies, and in particular those in the cement sector, are required to comply with various environmental regulations, such as the Law
on the National Environmental Impact Assessment System approved by Legislative Decree No. 27446 and its regulations approved by Supreme
Decree No. 019-2009-MINAM, which establish the environmental impact assessment process. Public and private investment projects that involve
activities, constructions or works that may cause negative environmental impacts must comply with this law. Projects are categorized according
to environmental risk under this law.
The
Environmental Management Regulations for the Manufacturing Industry and Internal Trade, approved by Supreme Decree No. 017-2015-PRODUCE,
as amended, promote and regulate environmental management, as well as the conservation and sustainable use of natural resources in the
development of manufacturing and domestic trade activities. It also regulates the application of management instruments, procedures, environmental
protection measures and promotes cleaner production agreements, giving priority to the principle of prevention.
In
terms of air emissions, the Ministry of the Environment has adopted legally binding environmental quality standards (Maximum Permissible
Limits) for cement industries (approved by Supreme Decree No. 001-2020-MINAM). These standards are legally enforceable and must be
met by all operations in the cement industry.
Resolution
Nos. 004-2018-OEFA/CD and 006-2018-OEFA/CD define administrative infractions and establish a scale of penalties related to environmental
management instruments and obligations related to monitoring, environmental management, the development of industrial activities and the
handling of hazardous materials and inputs. applicable to those administered in the manufacturing industry and domestic trade sector that
are under the scope of competence of the Environmental Assessment and Control Agency. Infractions are classified according to their severity
as minor, serious and very serious offenses and the monetary penalty imposed will depend on this.
By
means of Board of Directors Resolution No. 023-2013-OEFA/CD and No. 0312015-OEFA/CD, of the Environmental Assessment and Control Agency
(OEFA), the OEFA assumes the functions of monitoring, supervision, control and sanction in environmental matters in the Cement and
Concrete Sector of the Manufacturing Industry, of the Industrial Subsector of the Ministry of Production - PRODUCE.
The
Law on Integrated Solid Waste Management approved by Decree Law No. 1278 and its regulations approved by Supreme Decree No. 014-2017-MINAM,
seek to ensure the constant maximization of efficiency in the use of materials, and to regulate the management and handling of solid waste,
which includes the minimization of the generation of solid waste at the source. the material and energy recovery of solid waste, as well
as the proper final disposal of the same.
Law
30754, published on April 18, 2018, approved the Framework Law on Climate Change. This law establishes the principles, approaches, and
general provisions for coordinating, articulating, designing, executing, informing, monitoring, evaluating, and disseminating public policies
for the comprehensive, participatory, and transparent management of climate change adaptation and mitigation. It also established that
the Ministry of the Environment will establish guidelines to incorporate climate risk and vulnerability analysis, as well as climate
change mitigation and adaptation measures, in the evaluation of investment projects subject to the National Environmental Plan Impact
Assessment System.
This
law aims to reduce the country’s vulnerability to climate change, take advantage of low-carbon growth opportunities, and comply
with the international commitments assumed by the government of Peru before the United Nations Framework Convention on Climate Change,
with an intergenerational approach.
The
Regulations of the Framework Law on Climate Change were approved on December 31, 2019, by Supreme Decree No. 013-2019-MINAM. The objectives
set out in these Regulations will be achieved through the implementation of climate change adaptation and mitigation measures, the creation
of systems that contribute to the accounting of carbon dioxide emissions, the reduction of carbon dioxide emissions and the promotion
of private sector participation in implementation. of sustainable and low-carbon projects. To date, however, no concrete measures or targets
have been set, nor have any deadlines been set for their implementation.
There
is no type of emissions trading scheme in Peruvian law.
On
January 25, 2022, Supreme Decree No. 003-2022-MINAM was published, declaring a climate emergency of national interest and establishing
guidelines and priority actions for climate change mitigation and adaptation.
In September 2023, the International
Sustainability Standards Committee issued the first international sustainability and climate standards: IFRS S1 General Requirements for
the Information to be Disclosed on Sustainability related to Financial Information and IFRS S2 Weather-related Disclosures. The purpose
of these standards is for entities to disclose information about their risks and opportunities related to sustainability and climate that
is useful to the primary users of financial information for decision-making. The Company is currently assessing these standards and the
methodology for their implementation.
Prior Consultation with Local Indigenous Communities
On September 7, 2011, Peru
enacted Law No. 29785, Prior Consultation Right of Local Indigenous Communities. The law was enacted in order to implement Convention
No. 169 of the International Labor Organization on Local Indigenous Communities in Independent Countries, previously ratified by Peru
through Legislative Decree No. 26253. This law, which became effective on December 6, 2011, establishes a prior consultation procedure
to be undertaken by the Peruvian government in favor of local indigenous communities, whose collective rights may be directly affected
by new legislative or administrative measures, including the granting of new mining concessions. Regulation implementing this law was
approved on April 3, 2012, by Supreme Decree No. 001-2012-MC, which defines the local indigenous communities that are entitled to the
prior consultation rights and establishes the different stages that comprise the prior consultation procedure.
Consultation procedures for
mining and processing concessions are carried out by the MEM prior to the granting of a new processing concession.
According to the recent practice
of the Geologic Institute of Mining and Metallurgy (Instituto Geológico Minero Metalúrgico), the granting of mining
concessions does not qualify as an “administrative measure” that potentially affects the rights of indigenous people because
it does not grant per se a right to explore and exploit mineral deposits. Accordingly, the granting of mining concessions has not
been included among measures that require consultation procedures with indigenous people. According to Ministerial Resolution No. 003-2013-MEM-DM,
the MEM has established that consultation procedures are applicable prior to the commencement of: (i) exploration activities (Autorización
de inicio de actividades de exploración); (ii) exploitation activities (Autorización de inicio o reinicio de las
actividades de desarrollo, preparación y explotación - incluye plan de minado y botaderos); and (iii) processing
concessions (otorgamiento de concesión de beneficio).
Local indigenous communities
do not have a veto right; upon completion of this prior consultation procedure, the Peruvian government can discretionarily approve or
reject the applicable legislative or administrative measure. In addition, any sale, lease or other act of disposal of surface land owned
by local indigenous communities is subject to the approval of an assembly composed of the members of such communities according to the
following rules:
| ● | for local indigenous communities located on the coast, approval of not less than 50% of members attending
the assembly is required; and |
| ● | for local indigenous communities located in the highlands and the Amazon region, approval of at least
2/3 of all members attending the assembly is required. |
Permits and Licenses
Mining Concessions
According to the General Mining
Law, a mining concession is required in order to extract mineral resources needed to produce cement. The mining concession grants the
right to explore and exploit the mineral resources located in a solid of indefinite depth, limited by the vertical plane corresponding
to the sides of square, rectangle or polygon referred to by the Universal Transversal Mercator coordinates. The Geological Mining and
Metallurgical Institute (Instituto Geológico Minero y Metalúrgico) is in charge of managing the procedure of granting
mining concessions, which includes the receipt of the request, the granting and the termination of mining concessions.
Explosives.
Mining concessionaires are
required to obtain the following permits to operate and store explosives:
| ● | Certificate of Mining Operation (Certificado de Operación Minera), granted by the MEM; |
| ● | Semiannual Authorization for Use of Explosives, granted by the General Bureau of Explosives of the Ministry
of Interior (Superintendencia Nacional de Control de Servicios de Seguridad, Armas, Municiones y Explosivos de Uso Civil, or “SUCAMEC”); |
| ● | Manipulation of Explosives License for each individual that intends to handle explosives, granted by the
SUCAMEC; and |
| ● | Explosive’s Warehouse Operation License, granted by SUCAMEC. |
Water and Wastewaters
To use water resources in
cement industry activities, it is necessary to obtain a water right granted by the Water Management Authority (Autoridad Nacional del
Agua, or “ANA”) prior to the use of underground or fresh water sources. If the proposed activities will generate domestic
or industrial wastewaters, which will be discharged into natural water sources or soil, authorization from ANA is required, with a favorable
opinion of the General Bureau of Environmental Health (Dirección General de Salud Ambiental, or “DIGESA”).
Hazardous Waste
Hazardous waste generated
as a consequence of cement production activities must be disposed of in specialized landfills. The transportation of solid waste outside
the limits of the industrial complex must be conducted exclusively through specialized companies registered with DIGESA and MINAM. Industries
are free to contract with an EO-RS (a company that provides solid waste services such as transportation, treatment or disposal) or with
an EC-RS (a company that carries out commercialization activities aiming at the reuse of solid waste). Yet in order to limit their liability
in case of environmental harm, industries must make sure the EO-RS and EC-RS they retain count with all necessary permits to collect,
transport and dispose of hazardous wastes.
Chemical Feedstock
The commercialization, transportation
and use of controlled chemical feedstock (Insumos Químicos y Productos Fiscalizados, or “IQPF”) is restricted,
because of their potential use in the production of illegal drugs or controlled substances. Companies that require an IQPF must obtain
an IQPF User Certificate (Certificado de Usuario de IQPF) from the General Bureau of Chemical Feedstock of the Ministry of Interior
(Unidad Antidrogas de la Policía Nacional del Perú, or “DIRANDRO”). Companies such as ours are also required
to register with the Ministry of Production any IQPF activities they plan to carry out (Registro Único para el Control de IQPF).
Fuel Storage
Any company that purchases
fuels for its own activities and has facilities to receive and store fuel with a minimum capacity of one meter cubed (264.170 gallons)
is required to (i) receive from the Mining and Energy Investment Supervision Body (Organismo Supervisor de la Inversión en Energía
y Minería, or “OSINERGMIN”) prior permission to build and operate said installations, and (ii) be registered with
the Registry of Direct Fuel Consumers, in order to obtain the SCOP Code (Código del Sistema de Control de Órdenes de
Pedido) necessary to purchase fuel.
Cultural Heritage Protection
If the design and development
of cement industry activities involves the removal of topsoil, a Certificate of Non-Existence of Archaeological Ruins (Certificado
de Inexistencia de Restos Arqueológicos, or “CIRA”) from the Ministry of Culture (Ministerio de Cultura)
with respect to the area under construction must be obtained. The CIRA will either certify that on the surface of the evaluated area no
archaeological sites or features were discovered or will identify their exact location and extent in order to implement precautionary
measures to protect the archaeological artifact. The CIRA is valid for an unlimited period but will become void should any archaeological
artifacts be accidentally discovered during the construction works or due to any natural cause. In such an instance, the company must
stop the construction work immediately and notify the Ministry of Culture. Failure to stop the construction work may generate civil and
criminal liabilities. Under certain exceptional circumstances, Peruvian legislation allows the removal of archeological artifacts when
the area is required for development of projects that are of national interest.
Labor Regulations
Peruvian legislation allows
hiring employees through: (i) a fixed-term contract, (ii) a contract for an indefinite duration; or (iii) a contract for part-time employment.
The minimum wage established
in Peru is S/1,025 per month. Peruvian labor legislation establishes a maximum 8-hour work day or 48 hours per week for employees older
than 18 years. For overtime, employers must pay at least an additional 25% and an additional 35% over the regular hourly wage for the
first two hours and for any additional hours, respectively. Employees are entitled to a minimum rest of 24 consecutive hours per week.
Regardless of the type of
employment contract, pursuant to Peruvian law full-time employees are entitled to receive:
(i) an
additional 10% of the minimum wage, provided that they are responsible for (a) one or more children under the age of 18 or (b) persons
who are up to 24 years of age if they are pursuing higher education,
(ii) two
additional months’ salary per year, one in July and one in December (pursuant to Law No. 29351, said payments were not subject
to any social contribution, except for Income Tax; consequently, employers paid directly to their employees as an Extraordinary Bonus,
the amount of the contribution to the Social Health Insurance (ESSALUD) for such payments, equivalent to 9% of the bonus paid),
(iii) thirty
calendar days of annual paid vacation per year,
(iv) life
insurance, since the first day at work,
(v) a
compensation for years of service (CTS) equal to 1.16% of a monthly salary and is deposited each year in May and November, provided they
work an average of at least four hours per day for the same employer,
(vi) benefits
from the Peruvian Social Health Insurance (ESSALUD) to which employers must contribute a rate equivalent to 9% of their employees’
income, and
(vii) a
percentage of the company’s annual income net of taxes (10% in the case of income derived from industrial cement operations, and
8% in the case of income derived from our mining or commercial activities), provided the company has twenty or more employees.
On June 25, 2021, Law 31246 was published, which
modified the current Law on Safety and Health at Work to guarantee the right of workers to safety and health at work in the face of epidemiological
and health risk.
Free and Fair Competition Protection
In Peru, businesses are generally
not required to receive the prior authorization of the antitrust authority, which in Peru is INDECOPI. However, in order to promote economic
efficiency and protect consumers, anti-competitive behavior is subject to sanctions under applicable law. Behavior that is prohibited
according to national law includes: (i) the abuse of a dominant market position, (ii) concerted horizontal practices and (iii) concerted
vertical practices. Moreover, under the Unfair Competition Law it is illegal to act in a way that may hinder the competitive process.
An unfair behavior is one that is objectively contrary to the entrepreneurial good faith, ethical behavior and efficiency in a market
economy.
On January 7, 2021, Law No.
31112, Law that establishes the Prior Control of Business Concentration Operations, was published in the Official Gazette “El Peruano”,
which entered into force in January 2021, together with its Regulations, approved by Supreme Decree No. 039-2021-PCM. This law establishes
a system of prior control of business concentration operations in order to promote effective competition and economic efficiency in the
markets for the welfare of consumers.
C.
Organizational Structure
Cementos Pacasmayo S.A.A.
is part of the Hochschild Group. As of March 31, 2024, Eduardo Hochschild, directly and indirectly, owned and controlled 38.32% of the
shares of Hochschild Mining plc. Through Inversiones ASPI, as of that same date, Eduardo Hochschild, directly and indirectly, owned and
controlled 50.01% of the outstanding common shares of Cementos Pacasmayo.
All of our operating subsidiaries
are incorporated in Peru. The following chart sets forth our simplified corporate structure, operating subsidiaries only, as of the date
of this annual report.
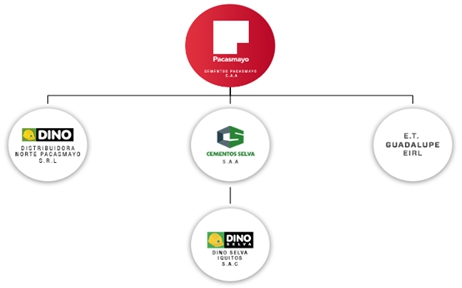
The following is a brief description
of the principal activities of our consolidated subsidiaries.
| ● | Cementos Selva S.A.C. is engaged in the production and marketing of
cement and other construction materials in the northeast region of Peru. It also owns all of the equity shares of Dinoselva Iquitos S.A.C.
(a cement and construction materials distributor in the north of Peru, which also produces and sells precast, cement bricks and ready-mix
concrete) |
| ● | Distribuidora Norte Pacasmayo S.R.L. is mainly engaged in selling cement produced by the Company. Additionally,
it produces and sells precast, cement bricks and ready-mix concrete. |
| ● | Empresa de Transmisión Guadalupe S.A.C. is mainly engaged in providing electric energy transmission
services to the Company. |
Other immaterial, non-operating subsidiaries
| ● | Salmueras sudamericanas S.A.C. (“Salmueras”) was engaged in the exploration of a brine project
located in the northern region of Peru. In December 2017, the Company decided not to continue with the activities related to this project. |
| ● | Soluciones Takay S.A.C is a platform that connects families that want to build with certified professionals. |
| ● | 150Krea Inc. seeks to develop a business in the United States relating to digital innovation in the construction
industry |
| | | |
| | ● | Acuicola Los Paiches is a social venture that focuses on fish farming. |
| ● | Corporación Materiales Piura S.A.C. is a non-operating company that owns some mining properties
located in Piura. |
Participation in Consortia
| ● | Consorcio Constructor del Norte del Perú began operating during 2023 and is mainly dedicated to
the execution of the project for the improvement of runways and perimeter fence of the Piura airport. |
D.
Property, Plant and Equipment
Properties
We own our headquarters office
in Lima, Peru, at Calle La Colonia 150, Urbanización El Vivero, Surco. We also own our plants, warehouses, transportation
facilities and the office space at our production facilities, including our workers’ facilities occupying approximately 50,000 square
meters at our Pacasmayo facility and a warehouse occupying approximately 25,000 square meters at the Salaverry port facility.
Area of Operation
We own and operate three cement
production facilities. Our largest facility is located in the city of Pacasmayo, department of La Libertad, approximately 667 kilometers
north of Lima. The second facility is located in the city of Piura, department of Piura, approximately 330 kilometers north of Pacasmayo.
This facility started cement production in September 2015. We also own and operate a smaller cement facility, located in the city of Rioja,
department of San Martín, approximately 468 kilometers east of the Panamericana Norte highway. From our Pacasmayo and Piura facilities
we supply cement principally to the coastal and highland regions of northern Peru, including the cities of Piura, Chiclayo, Cajamarca,
Trujillo and Chimbote. From our Rioja facility, we supply cement to the northeastern region of Peru, including the cities of Moyobamba,
Tarapoto, Loreto, among others.
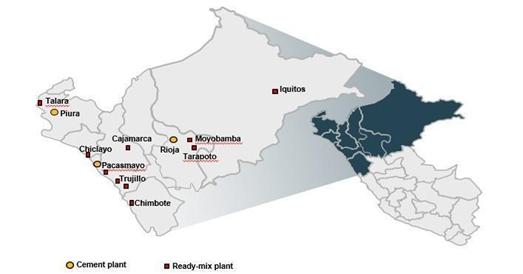
Pacasmayo Facility
As of December 31, 2023, our
Pacasmayo facility had four horizontal kilns, which produce clinker (one of which also currently produces quicklime), and an additional
Waelz rotary kiln that produces quicklime. One of these horizontal kilns with a total installed annual clinker production capacity of
660,000 metric tons was added in 2023. In addition,we formerly had six vertical shaft kilns with a total installed annual clinker production
capacity of 465,120 metric tons. We made a provision for the impairment of these vertical shaft kilns at the end of 2023. As a result
of these changes, the current clinker capacity at our Pacasmayo plant is 1,755,600 metric tons. Additionally, our facility has a primary
and secondary cone crusher located near our Acumulación Tembladera limestone quarry. The main crusher has installed crushing capacity
of 800 metric tons per hour and the secondary crusher has installed crushing capacity of 170 metric tons per hour. Our Pacasmayo facility
also features three cement finishing mills with installed annual cement production capacity of 2.9 million metric tons. Our Pacasmayo
facility is also equipped with silos containing storage capacity for 26,700 metric tons of cement.
As of December 31, 2023, our
Pacasmayo facility had installed production capacity of approximately 240,000 metric tons of quicklime per year, including the annual
installed capacity of one of our clinker kilns and our Waelz rotary kiln, which are equipped to also produce quicklime.
Piura Facility
Annual installed production
capacity of our Piura plant is 1.6 million metric tons of cement and 990,000 metric tons of clinker. Our Piura plant operates with one
horizontal kiln with installed clinker production capacity of 990,000 metric tons per year, as well as a cement mill with installed cement
production capacity of 1.6 million metric tons per year. Our Piura plant also has three storage silos with storage capacity of 25,300
metric tons of cement.
Rioja Facility
Annual installed production
capacity of our Rioja plant is 440,000 metric tons of cement and 289,080 metric tons of clinker.
Our Rioja facility currently
operates with a small cone crusher and four vertical shaft kilns with total annual installed clinker production capacity of 289,080 metric
tons and three cement finishing mills with total annual installed cement production capacity of 440,000 metric tons. Our Rioja plant is
also equipped with silos with a storage capacity of 1,750 metric tons of cement.
Ready-Mix Concrete Facilities
We also have 22 fixed and
mobile ready-mix concrete and precast facilities located in the northern cities of Chimbote, Trujillo, Chiclayo, Piura, Cajamarca, Pacasmayo
and Tarapoto among others. These facilities allow us to supply ready-mix concrete and precast materials to small, medium and large construction
projects throughout the entire northern region of Peru. As of December 31, 2023, our ready-mix operations had 167 mixer trucks, 34 concrete
pumps and two pavers available to deliver ready-mix concrete.
Capacity and Volumes
The table below sets forth
our clinker, cement and quicklime production capacity and volumes in our Pacasmayo and Rioja facilities for the periods indicated.
| |
|
As of and for the year ended December 31, |
|
| |
|
2023 |
|
|
2022 |
|
|
2021 |
|
| (in thousands of metric tons, except percentages) |
|
Capacity |
|
|
Production |
|
|
Utilization rate(1) |
|
|
Capacity |
|
|
Production |
|
|
Utilization rate(1) |
|
|
Capacity |
|
|
Production |
|
|
Utilization rate (1) |
|
| Cement: |
|
|
|
|
|
|
|
|
|
|
|
|
|
|
|
|
|
|
|
|
|
|
|
|
|
|
|
| Pacasmayo facility |
|
|
2,900 |
|
|
|
1,656 |
|
|
|
57.1 |
% |
|
|
2,900 |
|
|
|
1,768 |
|
|
|
61.0 |
% |
|
|
2,900 |
|
|
|
1,970 |
|
|
|
67.9 |
% |
| Piura facility |
|
|
1,600 |
|
|
|
1,032 |
|
|
|
64.5 |
% |
|
|
1,600 |
|
|
|
1,361 |
|
|
|
85.1 |
% |
|
|
1,600 |
|
|
|
1,324 |
|
|
|
82.8 |
% |
| Rioja facility |
|
|
440 |
|
|
|
259 |
|
|
|
58.8 |
% |
|
|
440 |
|
|
|
307 |
|
|
|
69.8 |
% |
|
|
440 |
|
|
|
338 |
|
|
|
76.8 |
% |
| Total |
|
|
4,940 |
|
|
|
2,946 |
|
|
|
59.6 |
% |
|
|
4,940 |
|
|
|
3,436 |
|
|
|
69.6 |
% |
|
|
4,940 |
|
|
|
3,632 |
|
|
|
73.5 |
% |
| Clinker(2): |
|
|
|
|
|
|
|
|
|
|
|
|
|
|
|
|
|
|
|
|
|
|
|
|
|
|
|
|
|
|
|
|
|
|
|
|
| Pacasmayo facility |
|
|
1,756 |
|
|
|
1,098 |
|
|
|
61.6 |
% |
|
|
1,500 |
|
|
|
935 |
|
|
|
62.3 |
% |
|
|
1,500 |
|
|
|
879 |
|
|
|
58.6 |
% |
| Piura facility |
|
|
990 |
|
|
|
799 |
|
|
|
80.7 |
% |
|
|
1,000 |
|
|
|
1,023 |
|
|
|
100.0 |
% |
|
|
1,000 |
|
|
|
893 |
|
|
|
89.3 |
% |
| Rioja facility |
|
|
289 |
|
|
|
200 |
|
|
|
69.1 |
% |
|
|
280 |
|
|
|
240 |
|
|
|
85.7 |
% |
|
|
280 |
|
|
|
264 |
|
|
|
94.3 |
% |
| Total |
|
|
3,035 |
|
|
|
2,097 |
|
|
|
68.5 |
% |
|
|
2,780 |
|
|
|
2,198 |
|
|
|
79.1 |
% |
|
|
2,780 |
|
|
|
2,036 |
|
|
|
73.2 |
% |
| Quicklime(3): |
|
|
|
|
|
|
|
|
|
|
|
|
|
|
|
|
|
|
|
|
|
|
|
|
|
|
|
|
|
|
|
|
|
|
|
|
Pacasmayo facility
|
|
|
240 |
|
|
|
29 |
|
|
|
12.1 |
% |
|
|
240 |
|
|
|
46 |
|
|
|
19.2 |
% |
|
|
240 |
|
|
|
69 |
|
|
|
28.8 |
% |
| (1) | Utilization rate is calculated by dividing production for the specified period by installed capacity. |
| (2) | Clinker capacity has been estimated using 330 production days. |
| (3) | Our Rioja facility does not produce quicklime. In addition, one of our clinker kilns and our Waelz rotary
kiln are equipped to produce quicklime. |
Summary Disclosure (229.1303)
Map of Mining Concessions of Cementos Pacasmayo
S.A.A. and subsidiaries.
Figure 1 shows the map of Peru and the location
of the Peruvian mining properties of Cementos Pacasmayo and subsidiaries, in the northern part of the country. The mining properties are
located in Piura, Lambayeque, Cajamarca, Amazonas, Ica, Cusco, San Martin, La Libertad and Ancash regions.
Figure 1 General map of the mining properties and industrial facilities
of Cementos Pacasmayo S.A.A. and subsidiaries
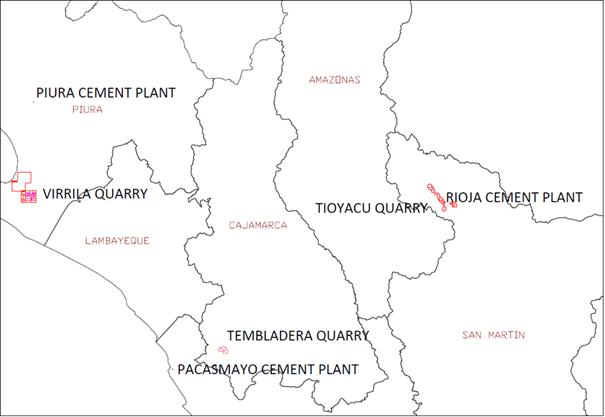
General description of mining properties and operations
Cementos Pacasmayo’s access to its mining
properties in Peru are obtained through mining rights granted by INGEMMET.
Mineral properties in Peru are classified according
to the type of material (i.e. metallic and non-metallic).
Cementos Pacasmayo has mining properties in exploration,
development and production stages. Cementos Pacasmayo has three material properties (Tembladera, Virrilá, and Tioyacu), all of
which are in the production stage.
Cementos Pacasmayo acquired Corporación
de Materiales Piura S.A.C., whose mining concessions are shown in Annex 1.
Table 1 provides an overview of Cementos Pacasmayo’s
material properties, including relevant information for each quarry.
Table 1 Main mining properties of Cementos
Pacasmayo S.A.A. and subsidiaries
| Mining Property | |
Mining concessions | |
Location of the mining concession | |
Percentage of ownership
interests | | |
Operator | |
Surface area (ha) | | |
Stage of the mining concession | |
Permits | | |
Key condition of permit | |
Type of mine / material | |
Beneficiation plant and other installations | |
Production 2023
(Ton) | | |
Production 2022
(Ton) | | |
Production 2021
(Ton) | |
| Tembladera | |
Acumulación Tembladera | |
Cajamarca | |
| 100 | % | |
San Martin Contratistas Generales SA | |
| 3,391 | | |
Production | |
Yes | | |
EIA(2) and
others | |
Open Pit / Limestone | |
Industrial facilities(3) | |
| 1,842,375 | | |
| 1,727,182 | | |
| 1,629,895 | |
| Virrila | |
UEA(1) Virrila | |
Piura | |
| 100 | % | |
San Martin Contratistas Generales SA | |
| 38,226 | | |
Production | |
Yes | | |
EIA(2) and others | |
Open Pit / Coquina | |
Industrial facilities(3) | |
| 932,933 | (4) | |
| 1,766,003 | | |
| 1,465,709 | |
| Tioyacu | |
UEA(1) Rioja | |
San Martin | |
| 100 | % | |
Cementos Selva S.A.C | |
| 9,600 | | |
Production | |
Yes | | |
EIA(2) and others | |
Open Pit / Limestone | |
Industrial facilities(3) | |
| 351,644 | (5) | |
| 421,636 | | |
| 377,702 | |
| (1) | Unidad Economica Administrativa represents a grouping of
two or more mining concessions incorporated to the National Mining Cadastre with definitive character, of the same kind of substance
and of the same mining owner. |
| (2) | Environmental Impact Assessment (EIA). |
| (3) | Cement plants are governed by the laws of the industrial
sector. |
| (4) | Production at the Virrila quarry was affected in 2023 because
operations were interrupted between May and September of that year due to the interruption of traffic caused by the overflowing of the
La Niña lagoon caused by Cyclone Yaku. |
| (5) | The 2023 production of the Tioyacu quarry was lower compared
to 2022, because no blasting activities were carried out in April and May. |
| A. | Summary of Mineral Resources and Mineral Reserves |
Tables 2 and 3 summarize the mineral resources
and reserves, respectively, of the mining properties of Cementos Pacasmayo and its subsidiaries.
Table 2 Summary of Mineral Resources (exclusive
of Reserves) of Cementos Pacasmayo S.A.A. and subsidiaries as of December 31, 2023.
| | |
Measured Mineral Resources | | |
Indicated Mineral Resources | | |
Measured + Indicated Mineral Resource | | |
Inferred Mineral Resources | |
| | |
Amount
(Million
Tonnes) | | |
Grades/
Qualities
(% CaO) | | |
Amount
(Million
Tonnes) | | |
Grades/
Qualities
(% CaO) | | |
Amount
(Million
Tonnes) | | |
Grades/
Qualities
(% CaO) | | |
Amount
(Million
Tonnes) | | |
Grades/
Qualities
(% CaO) | |
| Limestone: | |
| | |
| | |
| | |
| | |
| | |
| | |
| | |
| |
| Acumulación Tembladera | |
| 122.6 | | |
| 49.33 | | |
| 34.5 | | |
| 50.32 | | |
| 157.1 | | |
| 49.55 | | |
| 75.9 | | |
| 50.33 | |
| UEA Rioja | |
| 0.05 | | |
| 50.10 | | |
| 0.5 | | |
| 48.01 | | |
| 0.5 | | |
| 48.20 | | |
| 19.8 | | |
| 46.34 | |
| Coquina: | |
| | | |
| | | |
| | | |
| | | |
| | | |
| | | |
| | | |
| | |
| UEA Virrila | |
| 19.9 | | |
| 49.68 | | |
| 28.0 | | |
| 48.92 | | |
| 47.9 | | |
| 49.24 | | |
| 4.4 | | |
| 46.67 | |
| * | Table 2 is based on the following cement prices: Tembladera/Pacasmayo
(S/616.7 per ton) and Virrila/Piura (S/687.8 per ton). The mineral resource estimates are at the point of delivery to the cement plant
(point of reference). Also the assumptions (e.g., prices, costs and other economic assumptions) used to establish prospects of economic
extraction during the mineral resources estimation can be found in the Cementos Pacasmayo S.A.A. Technical Report Summaries (TRS) 20-F
229.601 (Item 601) Exhibits 96.1, 96.2 and 96.3 of this 20-F filing. |
Table 3 Summary of Mineral Reserves of Cementos
Pacasmayo S.A.A. and subsidiaries’ properties at December 31, 2023.
| | |
Proven Mineral Reserves | | |
Probable Mineral Reserves | | |
Total Mineral Reserves | |
| | |
Amount
(Million
Tonnes) | | |
Grades/
Qualities
(%CaO) | | |
Amount
(Million
Tonnes) | | |
Grades/
Qualities
(%CaO) | | |
Amount
(Million
Tonnes) | | |
Grades/
Qualities
(%CaO) | |
| Limestone: | |
| | |
| | |
| | |
| | |
| | |
| |
| Acumulación Tembladera | |
| 65.5 | | |
| 49.66 | | |
| 12.3 | | |
| 49.63 | | |
| 77.8 | | |
| 49.65 | |
| UEA Rioja | |
| 5.9 | | |
| 50.17 | | |
| 4.4 | | |
| 48.07 | | |
| 10.3 | | |
| 49.28 | |
| Coquina: | |
| | | |
| | | |
| | | |
| | | |
| | | |
| | |
| UEA Virrila | |
| 40.3 | | |
| 51.87 | | |
| 2.7 | | |
| 49.78 | | |
| 43.0 | | |
| 51.73 | |
| * | Table 3 is based on the following cement prices: Tembladera/Pacasmayo
(S/616.7 per ton), Virrila/Piura (S/687.8 per ton) and Tioyacu/Rioja (S/724.6 per ton). The mineral resource estimates are at the point
of delivery to the cement plant (point of reference). Also the assumptions (e.g., prices, costs and other economic assumptions) used
to establish economic viability during the mineral reserves estimation can be found in the Cementos Pacasmayo S.A.A. and Cementos Selva
S.A.C Technical Report Summaries (TRS) 20-F 229.601 (Item 601) Exhibits 96.1, 96.2 and 96.3 of this 20-F filing. |
● Annex 1. List of Cementos Pacasmayo and Subsidiaries new Concessions.
| Name of mineral concession | |
Location of the properties | |
Type and amount of ownership interests | | |
Operator | | |
Surface (Has) | | |
Stage of Property | | |
Permits | | |
Type of mine / material | |
Beneficiation plant and other installations | |
Production of 2023 | | |
Production of 2022 | | |
Production of 2021 | |
| Gobernador 1 | |
Piura | |
| 100 | % | |
| NA | | |
| 300 | | |
| Exploration | | |
| No | | |
Non Metallic | |
No | |
| 0 | | |
| 0 | | |
| 0 | |
| Gobernador 2 | |
Piura | |
| 100 | % | |
| NA | | |
| 400 | | |
| Exploration | | |
| No | | |
Non Metallic | |
No | |
| 0 | | |
| 0 | | |
| 0 | |
| Gobernador 3 | |
Piura | |
| 100 | % | |
| NA | | |
| 300 | | |
| Exploration | | |
| No | | |
Non Metallic | |
No | |
| 0 | | |
| 0 | | |
| 0 | |
| La Roca I | |
Piura | |
| 100 | % | |
| NA | | |
| 900 | | |
| Exploration | | |
| No | | |
Non Metallic | |
No | |
| 0 | | |
| 0 | | |
| 0 | |
| La Roca II | |
Piura | |
| 100 | % | |
| NA | | |
| 200 | | |
| Exploration | | |
| No | | |
Non Metallic | |
No | |
| 0 | | |
| 0 | | |
| 0 | |
| Luna de Paita | |
Piura | |
| 100 | % | |
| NA | | |
| 500 | | |
| Exploration | | |
| No | | |
Non Metallic | |
No | |
| 0 | | |
| 0 | | |
| 0 | |
| Meche 1 | |
Piura | |
| 100 | % | |
| NA | | |
| 1,000 | | |
| Exploration | | |
| No | | |
Non Metallic | |
No | |
| 0 | | |
| 0 | | |
| 0 | |
| Meche 2 | |
Piura | |
| 100 | % | |
| NA | | |
| 500 | | |
| Exploration | | |
| No | | |
Non Metallic | |
No | |
| 0 | | |
| 0 | | |
| 0 | |
| Meche 3 | |
Piura | |
| 100 | % | |
| NA | | |
| 400 | | |
| Exploration | | |
| No | | |
Non Metallic | |
No | |
| 0 | | |
| 0 | | |
| 0 | |
| Mercedes 2 | |
Piura | |
| 100 | % | |
| NA | | |
| 1,000 | | |
| Exploration | | |
| No | | |
Non Metallic | |
No | |
| 0 | | |
| 0 | | |
| 0 | |
| Mercedes 3 | |
Piura | |
| 100 | % | |
| NA | | |
| 1,000 | | |
| Exploration | | |
| No | | |
Non Metallic | |
No | |
| 0 | | |
| 0 | | |
| 0 | |
| Mercedes 4 | |
Piura | |
| 100 | % | |
| NA | | |
| 1,000 | | |
| Exploration | | |
| No | | |
Non Metallic | |
No | |
| 0 | | |
| 0 | | |
| 0 | |
| Mercedes 5 | |
Piura | |
| 100 | % | |
| NA | | |
| 900 | | |
| Exploration | | |
| No | | |
Non Metallic | |
No | |
| 0 | | |
| 0 | | |
| 0 | |
| Mercedes 6 | |
Piura | |
| 100 | % | |
| NA | | |
| 900 | | |
| Exploration | | |
| No | | |
Non Metallic | |
No | |
| 0 | | |
| 0 | | |
| 0 | |
| Mercedes 7 | |
Piura | |
| 100 | % | |
| NA | | |
| 900 | | |
| Exploration | | |
| No | | |
Non Metallic | |
No | |
| 0 | | |
| 0 | | |
| 0 | |
| Sol de Colán | |
Piura | |
| 100 | % | |
| NA | | |
| 900 | | |
| Exploration | | |
| No | | |
Non Metallic | |
No | |
| 0 | | |
| 0 | | |
| 0 | |
Acumulación Tembladera Individual Disclosure (229.1304)
Property description
Location
The Tembladera property is located in Yonan district,
Contumaza province, Cajamarca region, Peru at longitude -79.123393° and latitude -7.245671°. It is located 60 kilometers from
the cement plant.
The area of the mining concession is 3,390.97
hectares. The mining rights are granted by INGEMMET through a Presidential Resolution.
Cementos Pacasmayo S.A.A. owns the mining concession
and it is registered with the name Acumulación Tembladera as a non-metallic mining concession.
The Pacasmayo cement plant and Acumulación
Tembladera mining concession are shown in Figure 1 while the locations of the Acumulación Tembladera and the Pacasmayo cement plant
are shown separately in Figures 2 and 3, respectively.
Figure 1 Pacasmayo cement plant and Acumulación
Tembladera
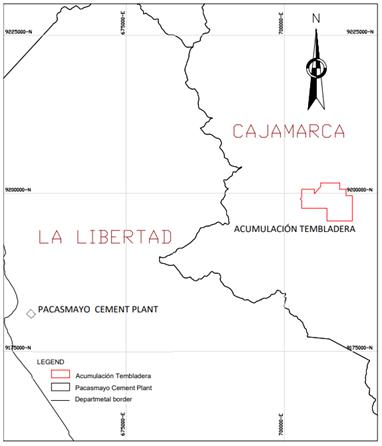
Figure 2 Acumulación Tembladera
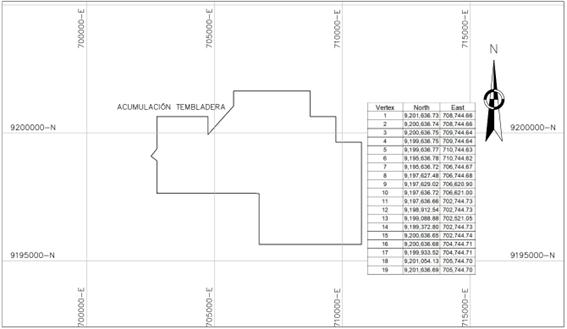
Pacasmayo cement plant is shown in Figure 3.
Figure 3 Pacasmayo cement plant
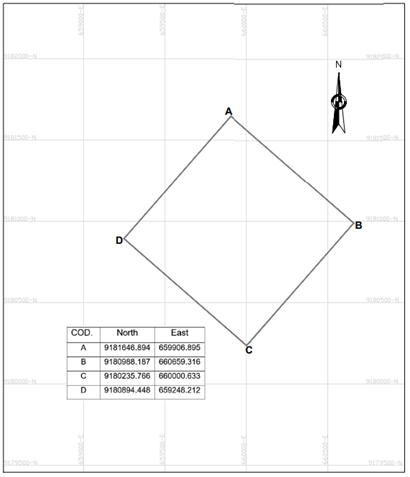
Infrastructure
The Tembladera quarry has the necessary infrastructure
for normal operations. Facilities for electric power, water supply, fuel, access and roads have been installed.
Energy is supplied by Hidrandina S.A. Company,
which obtains energy from the national grid. Energy distribution is overhead and at medium voltage of 2.3 kilovolts. The quarry also has
an electrical sub-station. The sub-station area is 1,062 square meters.
Water is obtained from the village canal, which
flows near the quarry. The water is used for minor activities within the quarry, such as access and road watering, limestone watering
in mining areas, post-blasting watering, watering of green areas, and consumption by restrooms.
A contractor manages the fuel system. The fuel
storage and dispatch system has the necessary equipment to supply fuel to the mobile and fixed units within the quarry. Trained personnel
and safety measures are in place to handle fuel safely.
The Tembladera quarry can be accessed by air from
Lima to Trujillo (1 hour) and by land from Trujillo to Tembladera Quarry. The route is from Trujillo to Pacasmayo (112.6 kilometers),
from Pacasmayo to Ciudad de Dios (14.3 kilometers) and from Ciudad de Dios to Tembladera (50 kilometers) and Tembladera - Security point
(0.8 kilometers), for a total of 747.1 kilometers. The entire route is paved. Alternatively, the quarry can be accessed by air from Lima
to Chiclayo, time average 1.15 hrs. of flight, and from Chiclayo to Ciudad de Dios (86.8 kilometers) and from Ciudad de Dios to Tembladera
(50 kilometers) and Tembladera – Security point (0.8 kilometers). The entire route is paved.
The Tembladera quarry’s personnel come from
the town of Tembladera, adjacent to the quarry. Others come from Cajamarca and La Libertad region.
Personnel from the town of Tembladera are transported
to the quarry in buses and pickup trucks.
Mining Concession Ownership and Area
The Tembladera Accumulation was granted by Resolution
No. 01989-2002-INACC/J of the National Institute of Concessions and Cadastre (Instituto Nacional de Concesiones y Catastro).
The procedure to obtain a mining concession is
established in the General Mining Law (Supreme Decree 014-92-EM) and its Regulation Legislative Decree 020-2020-EM.
The mining concession is in the owner’s name of
Cementos Pacasmayo S.A.A. and is also registered with the name Acumulación Tembladera as a non-metallic mine.
Cementos Pacasmayo S.A.A has the surface rights
to the area of operation in the Tembladera quarry.
Cementos Pacasmayo S.A.A. pays the right of use
for the concession Acumulación Tembladera with unique code 010001801L. These payments must be made from the first working day of
January to June 30th of each year, providing the financial entities the unique code of its mining right. The Acumulación Tembladera
concession payment is equivalent to US$3.00 per hectare.
Royalties
Law No. 28258 approved the Peruvian Mining Royalty
Law on June 24, 2004, which was amended by Law No. 29788 of September 28, 2011. Cementos Pacasmayo S.A.A. currently pays the Mining Royalty
(see note 24 to the consolidated financial statements).
The payment to the Peruvian government is made
through SUNAT, which is the entity designated to control this consideration for the use of natural resources. Such payment is made through
an application that the tax authority has made available to those required to pay.
If the mining royalty is not declared or paid,
penalties for infractions and default interest for non-compliance are incurred. However, failure to pay these fines is not a cause for
the loss of the mining concession.
Mining activities on the property and industrial
in the cement plant
Tembladera Quarry
The Tembladera quarry, located in the Acumulación
Tembladera mining concession, is currently in the production stage. The Tembladera quarry is an open-pit mine that uses explosives to
fragment the limestone rock. After crushing, the material is loaded onto trucks to be transported from the quarry to the cement plant
located in Pacasmayo.
Figure 4 shows the flowsheet of mining processes
at the Tembladera quarry. Further details of the process are provided in Exhibit 96.1 of this 20-F filing.
Figure 4 Diagram of mining process of the Tembladera
quarry
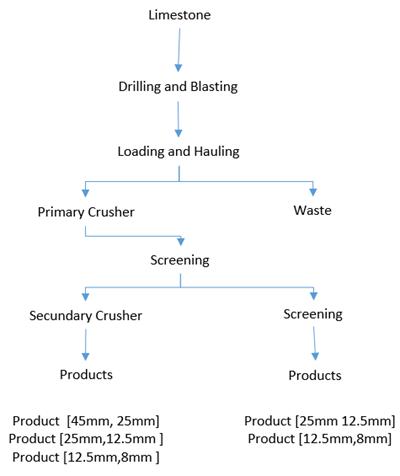
The Tembladera quarry has been operating for 66
years. The amount of limestone to be mined is planned annually through the mining plan.
The equipment at the Tembladera quarry is in optimum
condition to maintain continuity of operations. Maintenance and optimization of the equipment is carried out periodically and is supervised
by the operator of the quarry. The equipment is in good condition and operational. Further details of the equipment are provided in Exhibit
96.1 of this 20-F filing.
Pacasmayo industrial cement plant
The Pacasmayo cement plant is subject to the laws of the industrial
sector, according to current Peruvian regulations.
The Pacasmayo plant is located at Pacasmayo District, Pacasmayo Province,
La Libertad Region. This plant is 67.3 kilometers from Tembladera quarry. This facility receives material from the Tembladera quarry.
The Pacasmayo plant produces various products for the construction industry, the main product being cement. Different types of cement
are produced depending on their applications, using limestone, sand, iron and clays as raw materials. The specific mix of raw materials
produces the clinker necessary to produce cement.
| ● | Extraction and transportation of limestone; |
| ● | Grinding and homogenization to make the raw material of consistent
quality; |
| ● | Packaging, loading and distribution. |
Figure 5 shows the flowsheet for raw material processing, clinker and
cement production. Further details of the process are provided in Exhibit 96.1 of this 20-F filing.
Figure 5 Pacasmayo industrial plant process
block diagram
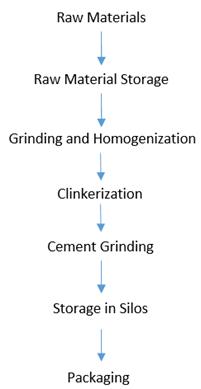
The Pacasmayo plant has been in operation for
66 years. The equipment at the Pacasmayo plant is in optimal condition to avoid any interruption in cement production. Maintenance and
optimization of the equipment is carried out periodically and is supervised by Cementos Pacasmayo personnel. The Pacasmayo plant is currently
being optimized with a modern, state-of-the-art clinker production line in order to increase production. The equipment is in good condition
and operational. Further details of the equipment are provided in Exhibit 96.1 of this 20-F filing.
Facilities
The total cost of the mining concession, mine
development costs, land, buildings and other facilities, machinery and equipment, furniture and fixtures, transportation units, computer
equipment and tools, quarry rehabilitation costs, capitalized interest and work in progress amounted to S/.738,667,041 as of December
31, 2023.
Tembladera Quarry
The Tembladera quarry has facilities such as offices,
explosives magazine for blasting, electrical substation, maintenance shop, lubricant warehouse, gas station, oil tank, guardhouse, limestone
field, dining room, laboratory, truck scale, ore belt, loading tunnel, meteorological station, safety trench and septic tank.
Pacasmayo Plant
The Pacasmayo plant has facilities such as maintenance
workshops, warehouses, laboratories, administrative offices, and cement production lines that support cement production.
History
By means of Resolution No. 01989-2002-INACC/J
dated November 4, 2002, the National Institute of Mining Cadastre and Concessions granted Cementos Pacasmayo S.A.A., the non-metallic
concession title called “Acumulación Tembladera” with code No. 01-00018-01-L.
The property dates back to its oldest integral
concession: “Norte No. 1” granted by the Regional Mining Office of Cajamarca by ministerial resolution No. 267 of June 30, 1950,
for the benefit of Cementos Portland del Norte S.A., starting operations as Cementos Pacasmayo S.A.A., from 1957 until 2013 when Calizas
del Norte S.A.C. (CALNOR) was incorporated. CALNOR started activities from January 2014 until May 2016. San Martin Contratistas Generales
S.A. started activities from October 2016 to the present.
In December 2022, Cementos Pacasmayo started a
diamond drilling campaign of eight drill holes to confirm mineral resources and reserves. Drilling activities continue in the first month
of 2023.
Property Encumbrances
Cementos Pacasmayo S.A.A. does not make any payments
with respect to encumbrances for the Acumulación Tembladera property. The Acumulación Tembladera mining concession currently
has no outstanding payments with respect to infractions and penalties.
Concessions
The Acumulación Tembladera mining concession
is a production stage property with estimated mineral reserves.
Geology
The ore deposit contains
limestone with a grade suitable for cement production. The limestone is contained within the Cajamarca Formation, belonging to the Upper
Cretaceous (Turonian floor, around 90 MA). This Formation overlies the Quilquiñan Group, and intrajacent to the Celendín
Formation.
Table 1 shows the stratigraphic
column of the area of the Tembladera quarry and briefly describes the Cajamarca Formation and the Upper Cretaceous Celendín Formation
that outcrop in the project area. Figure 6 shows the local geology of the quarry.
Table 1 Stratigraphic Column of the Tembladera
quarry
| System |
Series |
Stratigraphic
Unit |
Intrusive
rocks |
Lithologic
Description |
| Quaternary |
Recent |
Fluvial Deposit |
Qr-fl |
|
|
Fluvial origin |
| Alluvial Deposit |
Qr-al |
|
|
Alluvial origin |
| Tertiary |
Lower |
|
|
Andesite |
T-an |
Intrusion of andesitic dykes longitudinally into the deposit rock mass. |
| Cretaceous |
Upper |
Celendin Formation |
Ks-ce |
|
|
Thin layers of clayey nodular limestone, interbedded with marls and lutites. |
| Cajamarca Formation |
Ks-c |
|
|
Limestone of marine origin of whitish to light gray color. |
| Quilquiñan Group |
Ks-q |
|
|
Lutites and marls with some calcareous intercalations. |
Figure 6 Geological section of Tembladera quarry
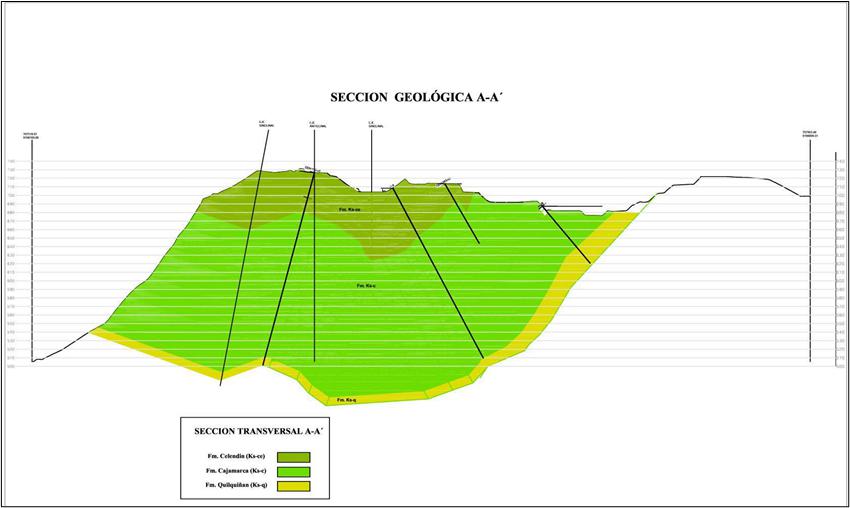
Resources and Reserves
Table 2 shows the mineral resources at the Tembladera quarry at the
end of the 2023 fiscal year.
Table 2 Mineral Resources (exclusive of Reserves)
at the end of the 2023 fiscal year based on cement price of S/616.7 per ton. The mineral resource estimates are at the point of delivery
to the cement plant (point of reference)
| | |
Amount
(Million
Tonnes) | | |
Grades/
qualities
(% CaO) | | |
Grades/
qualities
(% SO3) | | |
Grades/
qualities
(% MgO) | | |
Grades/
qualities
(% Al2O3) | | |
Cut-off grades
(% CaO) | |
| Measured resources | |
| 122.6 | | |
| 49.33 | | |
| 1.83 | | |
| 1.82 | | |
| 4.76 | | |
| 48.60 | |
| Indicated resources | |
| 34.5 | | |
| 50.32 | | |
| 1.68 | | |
| 1.44 | | |
| 3.85 | | |
| 48.60 | |
| Measured + Indicated resources | |
| 157.1 | | |
| 49.55 | | |
| 1.80 | | |
| 1.74 | | |
| 4.56 | | |
| 48.60 | |
| Inferred resources | |
| 75.9 | | |
| 50.33 | | |
| 1.62 | | |
| 1.45 | | |
| 3.93 | | |
| 48.60 | |
The mineral resources estimation considered the
expected price of cement, the complete forecast horizon contemplates 30-year projection. Clinker is used for cement production through
the addition of other non-metallic minerals.
Table 3 shows the mineral reserves at the Tembladera quarry.
Table 3 Mineral Reserves at the end of the 2023
fiscal year based on cement price of S/616.7 per ton. Mineral reserve estimates are at the point of delivery to the cement plant (point
of reference)
| | |
Amount
(Million Tonnes) | | |
Grades/
qualities
(% CaO) | | |
Grades/
qualities
(% SO3) | | |
Grades/
qualities
(% MgO) | | |
Grades/
qualities
(% Al2O3) | | |
Cut-off grades
(% CaO) | |
| Proven reserves | |
| 65.5 | | |
| 49.66 | | |
| 1.52 | | |
| 1.54 | | |
| 4.60 | | |
| 48.60 | |
| Probable reserves | |
| 12.3 | | |
| 49.63 | | |
| 1.57 | | |
| 1.56 | | |
| 4.91 | | |
| 48.60 | |
| Total Reserves | |
| 77.8 | | |
| 49.65 | | |
| 1.53 | | |
| 1.54 | | |
| 4.65 | | |
| 48.60 | |
The mineral reserves estimation considered the
expected price of cement. The complete forecast horizon contemplates a total of 30 years. Clinker is used for cement production through
the addition of other non-metallic minerals.
Reconciliation of Mineral Resources and Reserves at the End of the
Fiscal Year
Table 4 shows the difference between the mineral
resource estimates at the end of 2023 and 2022.
Table 4 Resources for the last two fiscal years
expressed in millions of tons.
| | |
Resources as
at Dec. 31,
2023 | | |
Resources as
at Dec. 31,
2022 | | |
Discrepancy |
| Measured resources | |
| 122.6 | | |
| 127.4 | | |
The difference is due to the annual consumption of limestone used in the cement plant. |
| Indicated resources | |
| 34.5 | | |
| 35.7 | | |
The difference is due to the annual consumption of limestone used in the cement plant. |
| Measured + Indicated resources | |
| 157.1 | | |
| 163.1 | | |
The difference is due to the annual consumption of limestone used in the cement plant. |
| Inferred resources | |
| 75.9 | | |
| 74.1 | | |
The difference is due to readjustments in the calcareous horizons in the model update process. |
| * | The prices assumed for the Mineral Resources estimation in
the economic model can be found in the Cementos Pacasmayo S.A.A. Technical Report Summary (TRS) of the Tembladera Quarry and Pacasmayo
Cement Plant 20-F 229.601 (Item 601) Exhibit 96.1 of this 20-F filing.
All mineral resources are estimated at cement plant. The updated average price is S/616.7 per ton of cement at nominal values,
perpetuity is included at the end of the 30-year projection. |
Table 5 shows the difference between the mineral reserve estimates
at the end of 2023 and 2022.
Table 5 Reserves for the last two fiscal years
expressed in millions of tons.
| | |
Reserves as
at Dec. 31,
2023 | | |
Reserves as
at Dec. 31,
2022 | | |
Discrepancy |
| Proven reserves | |
| 65.5 | | |
| 62.1 | | |
Mineral reserve estimation for 2023 considered 30 years as Life of Mine (LOM) due to economic issues of price and cost forecast. Main differences are supported by annual limestone consumption to produce cement. |
| Probable reserves | |
| 12.3 | | |
| 12.2 | | |
There is no difference in tons. |
| * | The prices assumed for the Mineral Reserves estimation in
the economic model can be found in the Cementos Pacasmayo S.A.A. Technical Report Summary (TRS) Tembladera Quarry and Pacasmayo plant
20-F 229.601 (Item 601) Exhibit 96.1 filing. All mineral Reserves are estimated at cement plant. The updated average price is S/616.7
per ton of cement, average of the 30-year projection, at nominal values. |
Cementos Pacasmayo has previously disclosed mineral
resources and reserves at the Tembladera quarry in its annual report on Form 20-F filed on April 27, 2023. Cementos Pacasmayo previously
filed a TRS to support its disclosure of mineral resources and reserves at the Tembladera quarry as Exhibit 96.1 of its annual report
on Form 20-F filed on April 28, 2022. Cementos Pacasmayo is updating that TRS with the new TRS filed as Exhibit 96.1 of this 20-F filing
to ensure the material assumptions are current. The main reasons for this update are prices, costs, cement demand, kiln 4 optimization
and other economic assumptions. Further details are provided in Exhibit 96.1 of that 20-F filing.
Other Activities
Cementos Pacasmayo S.A.A. has carried out drilling
at the Tembladera quarry to confirm the mineral reserves. New drilling data is not included in the 2023 reserves model.
Virrilá Individual Disclosure (229.1304)
Property description
Location
The Virrila property is located in the Sechura
District, Sechura Province, Piura Region, Peru at longitude -80.758952° and latitude -5.933999°. The concessions are registered
in INGEMET (Instituto Geológico Minero y Metalúrgico) as Virrila 3, Virrila 4, Virrila 6, Virrila 7, Virrila 8, Virrila
9, Virrila 10, Virrila 11, Virrila 12, Virrila 13, Virrila 14, Virrila 15, Virrila 16, Virrila 17, Virrila 18, Virrila 19, Virrila 20,
Virrila 21, Virrila 22, Virrila 23 and Bayovar N° 4 with mining activity.
The area of the mining property is 38,226.00 hectares.
The mining rights are granted by INGEMMET through a Presidential Resolution.
Cementos Pacasmayo S.A.A. owns the mining property
and it is registered with the name Unidad Económica Administrativa (UEA) Virrila as a non-metallic mining property.
Cementos Pacasmayo currently has an agreement
with the Fundación Comunal San Martin de Sechura for the use of the surface land associated with the production area of the Virrila
quarry.
Piura Cement Plant and UEA Virrila are shown in
Figure 1 while the locations of the UEA Virrila property and Piura cement plant are shown in Figures 2 and 3, respectively.
Figure 1 Piura cement plant and UEA Virrila
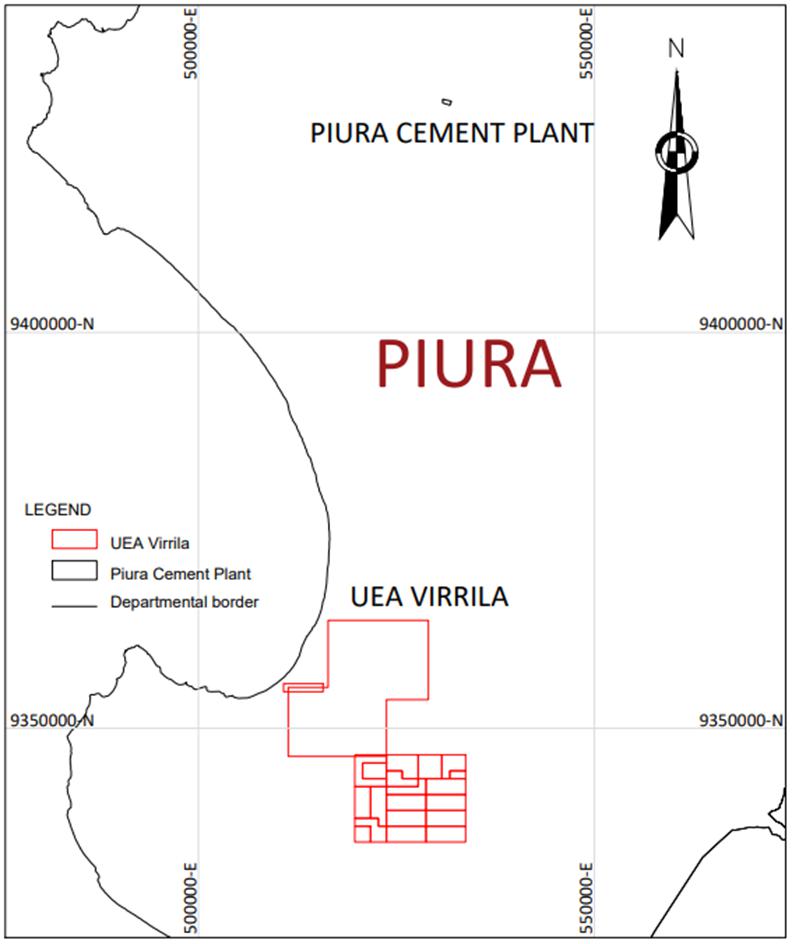
Figure 2 UEA Virrila property
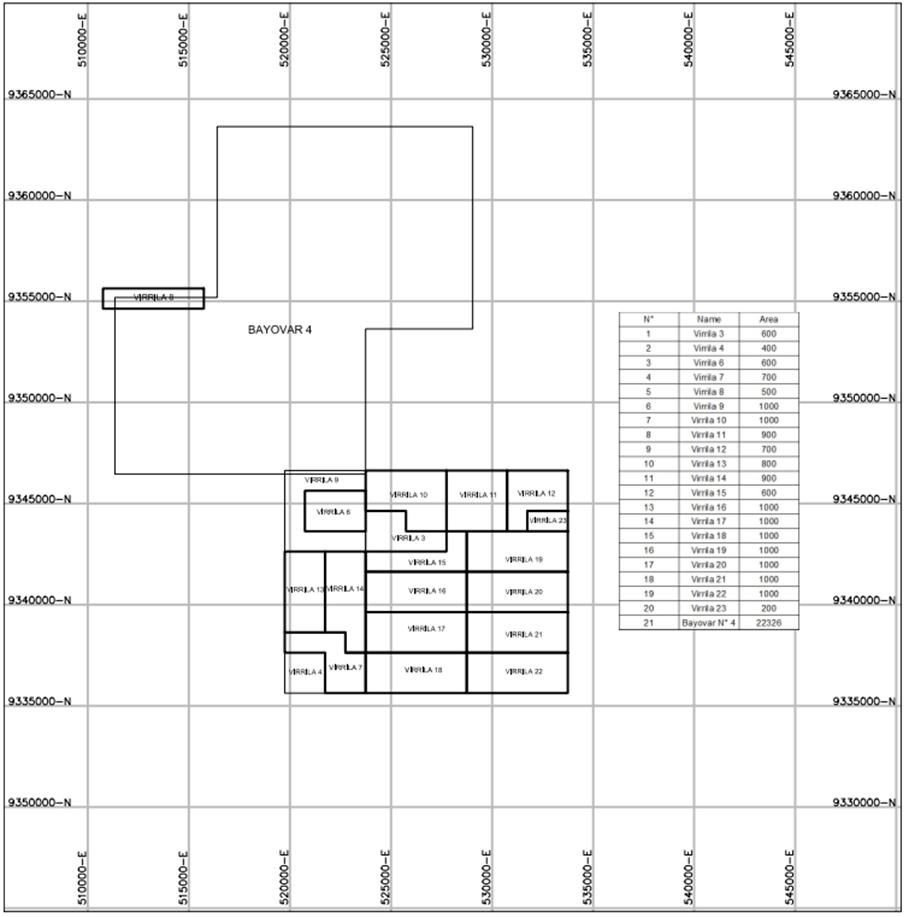
Figure 3 Piura cement plant
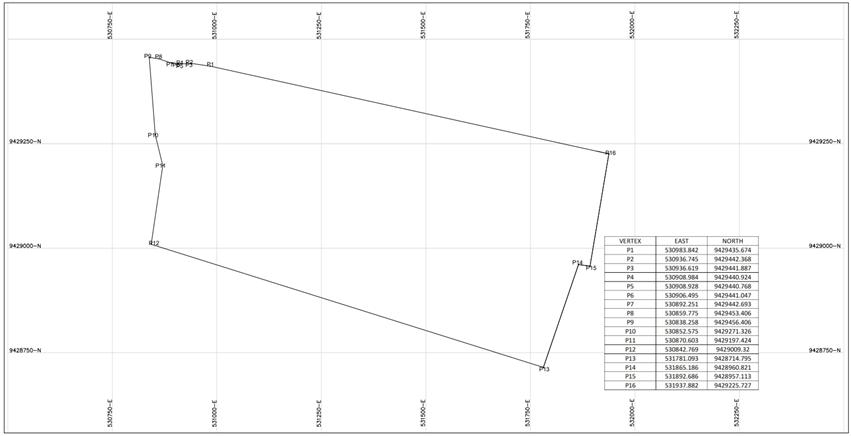
Infrastructure
The Virrila quarry has the necessary infrastructure
for normal operations. Facilities for electric power, water supply, fuels, accesses and roads have been installed.
Virrila quarry is supplied with fuel by diesel
oil tanker trucks. Fuel distribution is the responsibility of an authorized contractor company.
The Virrila quarry is supplied with energy by
electric generators.
The Virrila quarry can be accessed by paved road
from Piura city, along the north Panamerican highway, to the Bayovar intersection and then to the Virrila quarry. Estimated travel time
is 2 hours.
Personnel for the Virrila quarry come from the
town of Sechura, near the quarry. Others are from Piura.
Personnel from the Sechura township are transported
to the quarry in buses and pickup trucks. The contractor is responsible for the logistics of personnel operating in the quarry.
Mining Concession Ownership and Area
INGEMMET granted mining
rights to Cementos Pacasmayo on March 31, 2016 by Presidential Resolution No. 0147-2016-INGEMMET/PCD/PM including nine (9) non-metallic
mining rights in the ¨Unidad Económica Administrativa¨ (UEA) Virrila, with code No. 01-00011-00-U of Cementos Pacasmayo
S.A.A.
Presidential Resolution
No. 2869-2015-INGEMMET/PCD/PM dated September 30, 2015 added twelve (12) non-metallic mining rights to ¨Unidad Económica Administrativa¨
(UEA) Virrila, with code No. 01-00011-00-U of Cementos Pacasmayo S.A.A. bringing the total to 21 mining rights.
Royalties
Law No. 28258 approved the Peruvian Mining Royalty
Law on June 24, 2004 and was amended by Law No. 29788 of September 28, 2011. Cementos Pacasmayo S.A.A. currently pays the Mining Royalty
(see note 24 to the consolidated financial statements).
The payment to the Peruvian government is made
through SUNAT, which is the entity designated to control this consideration for the use of natural resources. Such payment is made through
an application that the tax authority has made available to those required to pay.
In case the mining royalty is not declared or
paid, penalties for infractions and default interest for non-compliance are incurred. However, failure to pay these fines is not a cause
for the loss of the mining concession.
Mining Activities on the Property
The Virrila quarry located
in the Virrila EAU is currently in the production stage. This is an open-pit mine where surface miners are used to fragment the coquina,
which is loaded onto trucks by front-end loaders and transported to the cement plant located in Piura which is 120 kilometers from UEA
Virrila.
Figure 4 shows the flowsheet
of mining processes at the Virrila quarry. Further details of the process are provided in Exhibit 96.2 of this 20-F filing.
Figure 4 Diagram of mining process of the Virrila
quarry
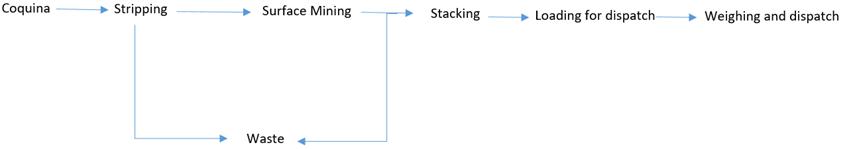
The Virrila quarry has
been operating for eight years. The amount of coquina to be mined is planned annually through the mining plan.
The equipment in operation
at the Virrila quarry is in optimum condition to maintain continuity of operations. Maintenance and optimization of the equipment is carried
out periodically and is supervised by the operator of the quarry. The equipment is in good condition and operational. Further details
of the equipment are provided in Exhibit 96.2 of this 20-F filing.
Piura Cement Plant
The cement plant is under the laws of the industrial
sector, according to current Peruvian regulations.
The cement plant is located at Veintiséis
de Octubre District, Piura Province and Piura Region. This facility receives material from the Virrila quarry. The cement plant produces
various products for the construction industry, the main product being cement. Different types of cement are produced depending on their
applications, and using coquina, sand, iron and clays as raw materials. The specific mix of raw materials produces the clinker necessary
to produce cement.
The standard cement production process consists
of the following main stages:
| ● | Extraction and transportation of coquina; |
| ● | Grinding and homogenization to make the raw material of consistent quality; |
| ● | Packaging, loading and distribution. |
Figure 5 shows the flowsheet for raw material
processing, clinker and cement production. Further details of the process are provided in Exhibit 96.2 of this 20-F filing.
Figure 5 Piura plant process block diagram
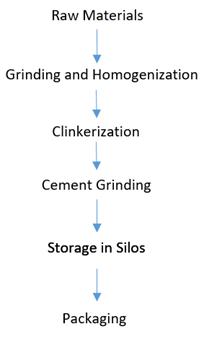
The equipment in operation at the Piura plant
is in optimal condition to avoid any interruption in cement production. Maintenance and optimization of the equipment is carried out periodically
and is supervised by Cementos Pacasmayo S.A.A. personnel. The equipment is in good condition and operational. Further details of the equipment
are provided in Exhibit 96.2 of this 20-F filing.
Facilities
The total cost of the mining concession, mine
development costs, land, buildings and other facilities, machinery and equipment, furniture and fixtures, transportation units, computer
equipment and tools, quarry rehabilitation costs, capitalized interest and work in progress amounted to S/858,282,298 as of December 31,
2023.
Virrilá Quarry
The Virrila quarry has facilities such as offices,
dining room, infirmary, vehicle parking lots, lubricant warehouse, chemical baths, maintenance shop, sample preparation laboratory, industrial
water tank, truck scale, hopper for weighing, wastewater treatment pond, and satellite and radio antenna.
Piura Plant
The Piura plant has facilities such as maintenance
workshops, warehouses, laboratories, administrative offices, and cement production lines that support cement production.
History
The quarry is a non-metallic deposit of coquina
material, source of different types of cements for construction; Cementos Pacasmayo S.A.A. owns the deposit.
The Virrila quarry started operations in 2015.
The mining contractor San Martin Contratistas Generales S.A. was in charge of the production from the beginning of operations until March
14, 2020. The mining contractor Posada Perú S.A.C started operations at the Virrila quarry on September 14, 2020 until December
30, 2021.
On January 3, 2022, the mining contractor San
Martin Contratistas Generales S.A. was hired to transport the coquina from the Virrila quarry to the Piura plant.
From May to June 2023 Cementos Pacasmayo carried
out a drilling campaign in order to confirm mineral reserves in Zone 2 and 4 (see Exhibit 96.2 of 20-F filing).
From May to September 2023, Virrila quarry stopped
operations due to the interruption of traffic caused by the overflow of the La Niña lagoon provoked by Cyclone Yaku. Likewise,
the Piura plant stopped its clinker production operations (raw meal milling, coal milling and reception of raw materials) from July to
September of that year to avoid exceeding the strategic inventories (clinker). The cement grinding, receiving (cement additions), packaging
and dispatching processes remained active to cover the cement demand.
Virrila quarry restarted operations in October.
Property Encumbrances
Cementos Pacasmayo S.A.A.
does not make any payments with respect to encumbrances for the UEA Virrila concessions. The UEA Virrila concessions currently have no
outstanding payments with respect to infractions and penalties.
Concessions
The UEA Virrila is a production stage property
with estimated mineral reserves.
Geology
The lithostratigraphy
of the area consists of Cenozoic sedimentary units, locally formed by Tertiary units and covered by Quaternary deposits; the Tablazo Lobitos
and Quaternary deposits of ancient alluvial, lacustrine and Aeolian origin form these units. Table 1 shows the stratigraphic column of
the area of the Virrila quarry while Figure 6 shows a geologic section of the geology of the quarry.
Table 1 Stratigraphic Column of the Virrilá
quarry
| Era |
System |
Symbol |
Serie |
Stratigraphic Unit |
| Cenozoic |
Quaternary |
Qh-e |
Holocene |
Eolic deposits |
| Qp-tt |
Pleistocene |
Tablazo Talara |
| Tertiary |
Tm-zi |
Miocene |
Lower Zapallal Formation |
Figure 6 Geological section of the Virrilá
quarry
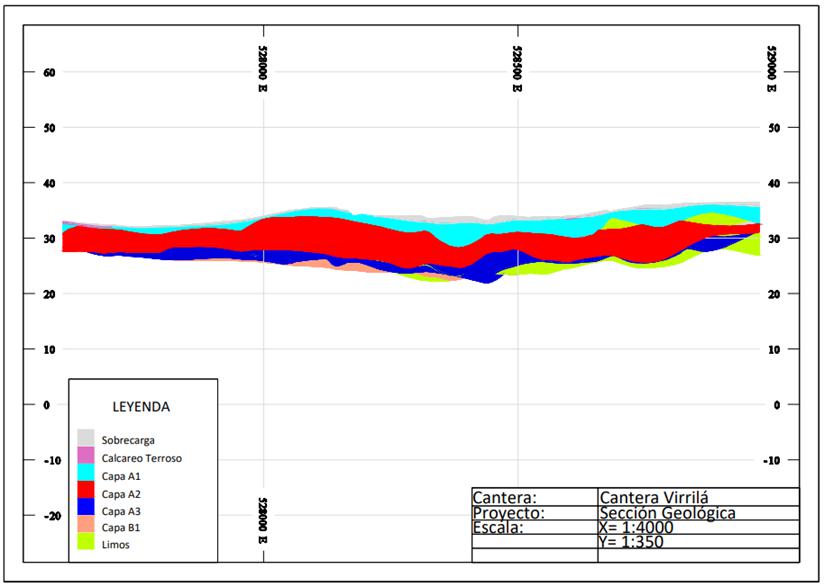
Resources and Reserves
Table 2 shows the Mineral Resources at the Virrila quarry at the end
of the 2023 fiscal year.
Table 2 Mineral Resources (exclusive of Reserves)
at the end of the 2023 fiscal year based on cement price of S/687.8 per ton. The mineral resource estimates are at the point of delivery
to the cement plant (point of reference).
| | |
Amount
(Million
Tonnes) | | |
Grades/
qualities
(% CaO) | | |
Grades/
qualities
(% SO3) | | |
Grades/
qualities
(% MgO) | | |
Cut-off grades
(% CaO) | |
| Measured resources | |
| 19.9 | | |
| 49.68 | | |
| 0.61 | | |
| 0.66 | | |
| 48.50 | |
| Indicated resources | |
| 28.0 | | |
| 48.92 | | |
| 1.11 | | |
| 1.17 | | |
| 48.50 | |
| Measured + indicated resources | |
| 47.9 | | |
| 49.24 | | |
| 0.90 | | |
| 0.96 | | |
| 48.50 | |
| Inferred resources | |
| 4.4 | | |
| 46.67 | | |
| 2.15 | | |
| 1.61 | | |
| 48.50 | |
The mineral resource estimation considered the
expected price of cement. The complete forecast horizon contemplates a total of 33 years of projection. Clinker is used for cement production
through the addition of other non-metallic minerals.
Table 3 Mineral Reserves at the end of the 2023 fiscal year based
on cement price of S/687.8 per ton. Mineral reserve estimates are at the point of delivery to the cement plant (point of reference).
| | |
Amount
(Million
Tonnes) | | |
Grades/
qualities
(% CaO) | | |
Grades/
qualities
(% SO3) | | |
Grades/
qualities
(% MgO) | | |
Cut-off grades
(% CaO) | |
| Proven reserves | |
| 40.3 | | |
| 51.87 | | |
| 0.35 | | |
| 0.70 | | |
| 48.50 | |
| Probable reserves | |
| 2.7 | | |
| 49.78 | | |
| 1.08 | | |
| 1.42 | | |
| 48.50 | |
| Total reserves | |
| 43.0 | | |
| 51.73 | | |
| 0.40 | | |
| 0.74 | | |
| 48.50 | |
The mineral reserves
estimation considered the expected price of cement. The complete forecast horizon contemplates a total of 30 years of projection. Clinker
is used for cement production through the addition of other non-metallic minerals.
Reconciliation of
Resources and Reserves at fiscal year-end
Table 4 shows the difference between the mineral
resource estimates at the end of 2023 and 2022.
Table 4 Resources for the last two fiscal years
expressed in millions of tons.
| | |
Resources as
of Dec. 31,
2023 | | |
Resources as
of Dec. 31,
2022 | | |
Discrepancy |
| Measured Resources | |
| 19.9 | | |
| 17.4 | | |
The difference is due to the annual consumption of coquina used in the cement plant. |
| Indicated Resources | |
| 28.0 | | |
| 29.0 | | |
The difference is due to the annual consumption of coquina used in the cement plant. |
| Measured + Indicated Resources | |
| 47.9 | | |
| 46.4 | | |
The difference is due to the annual consumption of coquina used in the cement plant. |
| Inferred Resources | |
| 4.4 | | |
| 3.9 | | |
The difference is due to updating the geological model. |
| * | The prices assumed for the Mineral Resources estimation in
the economic model can be found in the Cementos Pacasmayo S.A.A. Technical Report Summary (TRS) of the Virrila Quarry and Piura plant
20-F 229.601 (Item 601) Exhibit 96.2 of this 20-F filing. All Resources are estimated at cement plant. The updated average price is S/687.8
per ton of cement, average of the 30-year projection, at nominal values. |
Table 5 shows the difference between the mineral reserve estimates
at the end of 2023 and 2022.
Table 5 Reserves for the last two fiscal years
expressed in millions of tons.
| | |
Reserves as
of Dec. 31,
2023 | | |
Reserves as
of Dec. 31,
2022 | | |
Discrepancy |
| Proven Reserves | |
| 40.3 | | |
| 42.6 | | |
The difference is due to the annual consumption of coquina used in the cement plant. |
| Probable Reserves | |
| 2.7 | | |
| 2.9 | | |
The difference is due to the annual consumption of coquina used in the cement plant. |
| * | The prices assumed for the Mineral Reserves estimation
in the economic model can be found in the Cementos Pacasmayo S.A.A. Technical Report Summary (TRS) Virrila Quarry and Piura Cement Plant
20-F 229.601 (Item 601) Exhibit 96.2 of this 20-F filing. All Reserves are estimated at cement plant. The updated average price
is S/687.8 per ton of cement, average of the 30-year projection, at nominal values. |
Cementos Pacasmayo has
previously disclosed mineral resources and reserves at the Virrila quarry in its annual report on Form 20-F filed on April 27, 2023. Cementos
Pacasmayo previously filed a TRS to support its disclosure of mineral resources and reserves at the Virrila quarry as Exhibit 96.2 of
its annual report on Form 20-F filed on April 28, 2022. Cementos Pacasmayo is updating that TRS with the new TRS filed as Exhibit 96.2
of this 20-F filing to ensure the material assumptions are current. The main reasons for this update are prices, costs and cement demand.
Further details are provided in Exhibit 96.2 of that 20-F filing.
Exploration
Cementos Pacasmayo S.A.A.
has carried out exploration drilling in the Virrila quarry to confirm the mineral reserves. This activity will improve the accuracy of
mineral reserves estimation. The drilling results, by themselves, do not constitute material information as the exploration drilling results
are included in the analysis for estimating mineral resources and reserves.
Tioyacu Individual Disclosure
(229.1304)
Property description
Location
The Tioyacu property is located in Elias Soplin
Vargas district, Rioja province, San Martin region, Peru at longitude -77.284376° and latitude -5.999057°. It is located 5 kilometers
from the cement plant.
The mining rights registered with INGEMMET are
as follows Moyobamba 98, Pajonal 2, Rioja 1, Rioja 2, Rioja 3, Rioja 5, Rioja 6, Rioja 7, Rioja 8, Rioja 9, Calizas Tioyacu, Arcillas
el Pajonal, Pajonal 3 and Pajonal 4. The area of the mining property is 9,600 hectares.
The mining rights (the mining concession title)
are granted by INGEMMET through a Presidential Resolution.
Cementos Selva S.A.C. owns the mining property
and it is registered with the name Unidad Económica Administrativa (UEA) Rioja as a non-metallic mining property.
Rioja cement plant and UEA Rioja are shown in
Figure 1 while the locations of the UEA Rioja property and Rioja cement plant are shown in Figures 2 and 3, respectively.
Figure 1 Rioja cement plant and UEA Rioja
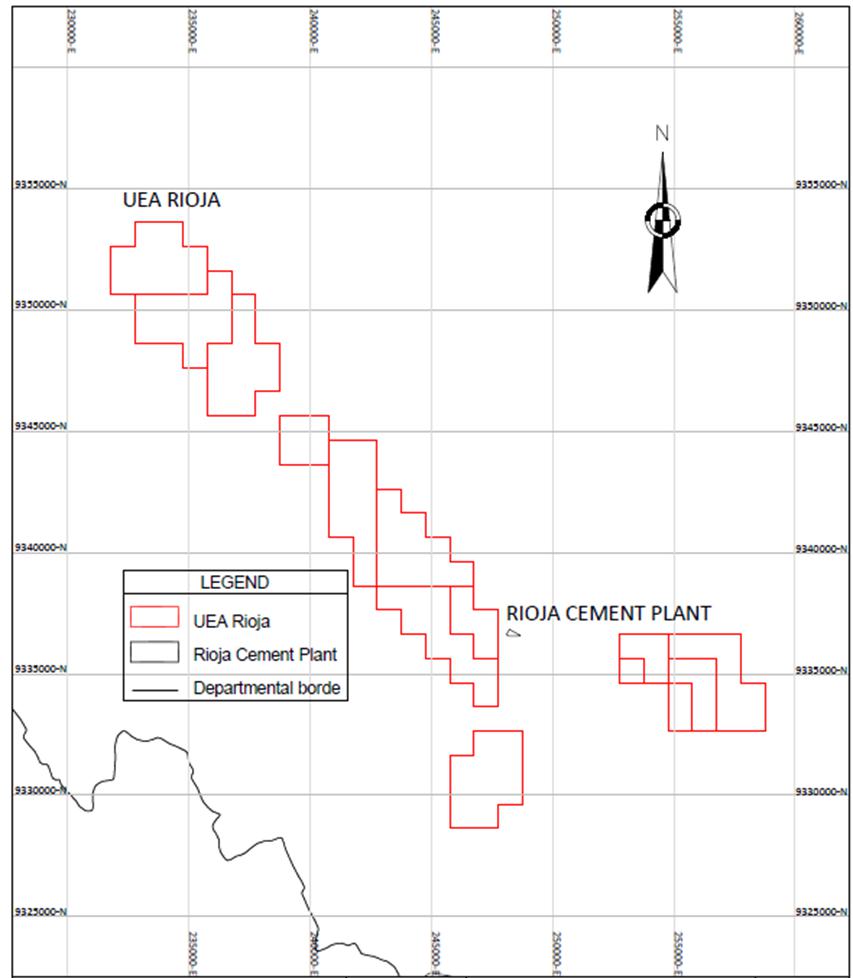
Figure 2 UEA Rioja property
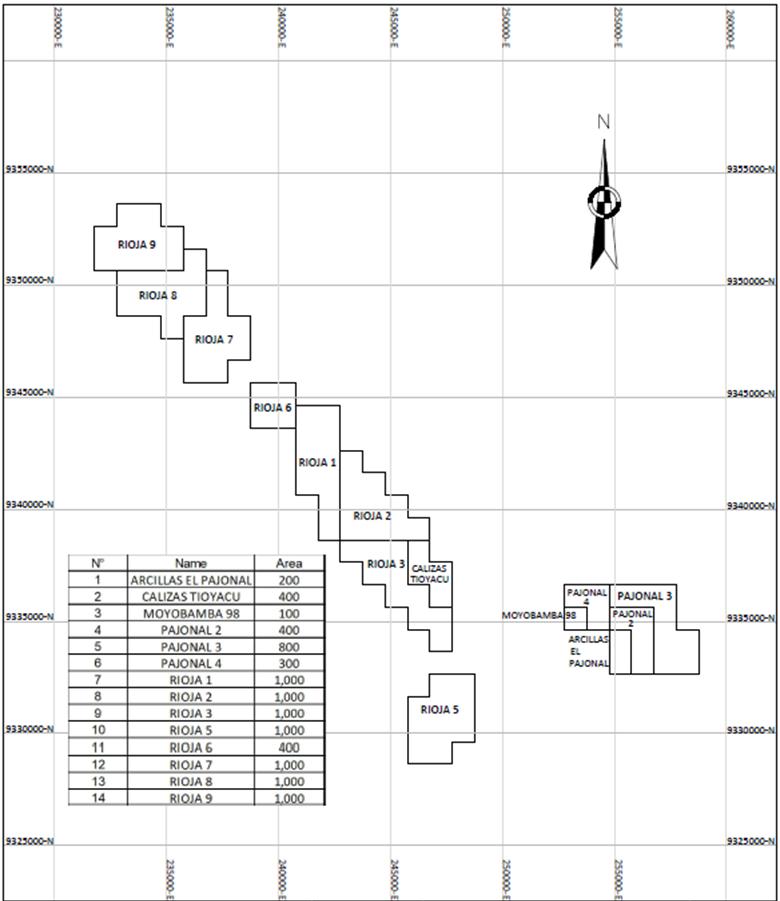
Figure 3 Rioja cement plant
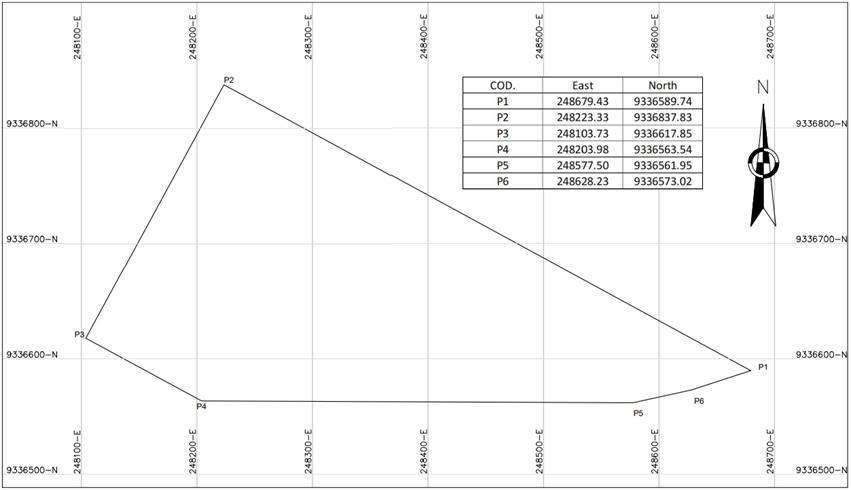
Infrastructure
The Tioyacu quarry has the necessary infrastructure
for normal operations. Facilities for electric power, water supply, fuel, access and roads have been installed.
The Rioja plant owned by Cementos Selva S.A.C.,
a wholly-owned subsidiary of Cementos Pacasmayo, currently has adequate infrastructure (such as workshops, service stations, restrooms,
and others).
The Tioyacu quarry can be accessed from the coast
by air from Lima to Tarapoto, time average 1.10 hours of flight, and from Tarapoto to Rioja (139 kilometers) and from Rioja to the Cementos
Selva S.A.C. plant (15 kilometers). Alternatively, one can access the site by road from Lima to Rioja, a distance of 1107 kilometers on
paved road.
The personnel at Tioyacu quarry come from the
Elias Soplin Vargas district. Others are from Rioja and Nueva Cajamarca.
Mining Concessions Ownership and Area
Calizas Tioyacu concession
was approved by Resolution 0960-96-RPM granted by the Public Mining Registry.
The procedure to obtain
a mining concession is stipulated in the General Mining Law (Supreme Decree 014-92-EM) and its Regulation Legislative Decree 020-2020-EM.
Cementos Selva S.A.C.
is the owner of the mining concession and is registered under the name Calizas Tioyacu as a non-metallic mine.
Tioyacu quarry has a
Usufruct and Easement Agreement for the use and easement of the surface where mining activities are carried out. The agreement was signed
with Corporación de Desarrollo de San Martin (COREDESAM).
Cementos Selva S.A.C.
pays the concession fee for the Calizas Tioyacu concession with unique code 010912495. These payments must be made from the first working
day of January to June 30th of each year, providing the Financial Entities the unique code of its mining right. In the case of the Calizas
Tioyacu concession, the payment is equivalent to US$3 per hectare.
Royalties
The Peruvian Mining Royalty
Law was approved on June 24, 2004 by Law No. 28258, which was amended by Law No. 29788 of September 28, 2011. Cementos Selva S.A.C. currently
pays the Mining Royalty (see note 24 to the consolidated financial statements).
The payment to the Peruvian
government is made through the SUNAT, which is the entity designated to control this consideration for the use of natural resources. Such
payment is made through an application that the tax authority has made available to those required to pay.
If the mining royalty
is not declared or paid, fines for infractions and late payment interest for non-compliance are incurred. However, failure to pay these
fines is not a cause for the loss of the mining concession.
Mining Activities on the Property
Tioyacu Quarry
The Tioyacu quarry located
in the Calizas Tioyacu mining concession is currently in the production stage. The Tioyacu quarry is an open-pit mine that uses explosives
to fragment the limestone rock, which is then loaded onto trucks by front-end loaders and transported to the Rioja plant.
Figure 4 shows a flowsheet
of mining processes at the Tioyacu quarry. Further details of the process are provided in Exhibit 96.3 of this 20-F filing.
Figure 4 Diagram of mining process of the Tioyacu
quarry
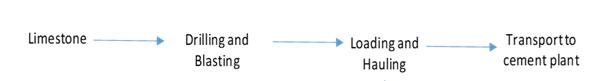
The Tioyacu quarry has been operating for 23 years
for Cementos Selva S.A.C. The material extracted from the quarry is used to supply the Rioja Cement Plant, which has also been in operation
for 23 years. The amount of limestone to be mined is planned annually through the mining plan.
The equipment in operation at the Tioyacu quarry
is in optimum condition to maintain continuity of operations. Maintenance and optimization of the equipment is carried out periodically
and is supervised by the operator of the quarry. The equipment is in good condition and operational. Further details of the equipment
are provided in Exhibit 96.3 of this 20-F filing.
Rioja Cement Plant
It is important to mention that the cement plant
is under the laws of the industrial sector, according to current Peruvian regulations.
The Rioja cement plant is located in the district
of Elías Soplin Vargas, La Rioja province, San Martin region, 5 kilometers from the quarry. This facility receives material from
the Tioyacu quarry. The cement plant produces various products for the construction industry, the main product being cement. Different
types of cement are produced depending on their applications, using limestone, sand, iron and clays as raw materials. The specific mix
of raw materials produces the clinker necessary to produce cement.
The standard cement production process consists
of the following main stages:
| ● | Extraction and transportation of limestone; |
| ● | Crushing and Drying of Raw Materials; |
| ● | Grinding and homogenization to make the raw material of consistent
quality; |
| ● | Packaging, loading and distribution. |
Figure 5 shows the flowsheet for raw material
processing, as well as clinker and cement production. Further details of the process are provided in Exhibit 96.3 of this 20-F filing.
Figure 5 Rioja plant process block diagram
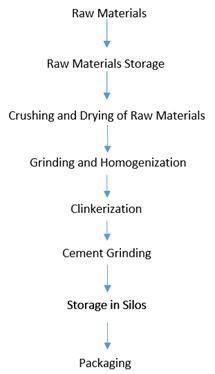
The equipment in operation at the Rioja plant
is in optimal condition to avoid any interruption in cement production. Maintenance and optimization of the equipment is carried out periodically
and is supervised by Cementos Selva S.A.C personnel. The equipment is in good condition and operational. Further details of the equipment
are provided in Exhibit 96.3 of this 20-F filing.
Facilities
The total cost of the
mining concession, mine development costs, land, buildings and other constructions, machinery and equipment, furniture and fixtures, transportation
units, computer equipment and tools, quarry rehabilitation costs, capitalized interest and work in progress amounts to S/136,491,040 as
of December 31, 2023.
Tioyacu Quarry
The Tioyacu quarry does not have maintenance and
administrative facilities because the Cementos Selva S.A.C plant is near the quarry and provides the necessary facilities for quarry operations.
Rioja Plant
The Rioja plant has facilities such as maintenance
workshops, warehouses, laboratories, administrative offices, and cement production lines that support cement production.
History
The Tioyacu quarry began
operations as Cementos Rioja S.A. in 2000. Prior to this, Cementos Rioja S.A. had successfully won the bid for the “Cement Plant
with Vertical Kiln of Rioja”, promoted by CEPRI Cemento Rioja at the Public Auction of February 6, 1998. Ownership was then transferred
by the Regional Government of San Martin by public deed on March 28, 1988, to Cementos Rioja S.A.
The development of the
project, and the non-metallic mining concession – Calizas Tioyacu, among others, were a part of the transfer in favor of Cementos
Rioja S.A. by Empresa Minera del Perú, by public deed dated April 8, 1998.
According to the provisions
of the ninth article of the General Mining Law (Supreme Decree No. 014-92-EM), the industrial cement plant is not an integral or accessory
part of the mining concession, nor does it carry out mining activities, it is a different property dedicated to the industrial manufacturing
of cement.
On March 1, 2022, Cementos
Selva S.A. changed its corporate name to Cementos Selva S.A.C. (CSSAC).
In December 2023, Cementos
Selva started a diamond drilling campaign of six drill holes to confirm mineral reserves.
Property Encumbrances
Cementos Selva S.A.C.
does not make any payments with respect to encumbrances for the Tioyacu quarry. Tioyacu quarry currently has no outstanding payments with
respect to infractions and penalties.
Concessions
The Calizas Tioyacu is
a production stage property with estimated mineral reserves.
Geology
The ore deposit contains
limestone with a grade suitable for cement production. The limestone is contained within the Condorsinga Formation. This Formation is
part of the Pucará Group. Figure 6 shows the stratigraphic column of the area of the Tioyacu quarry while Figure 7 shows the local
geology of the quarry.
Figure 6 Rioja plant process block diagram
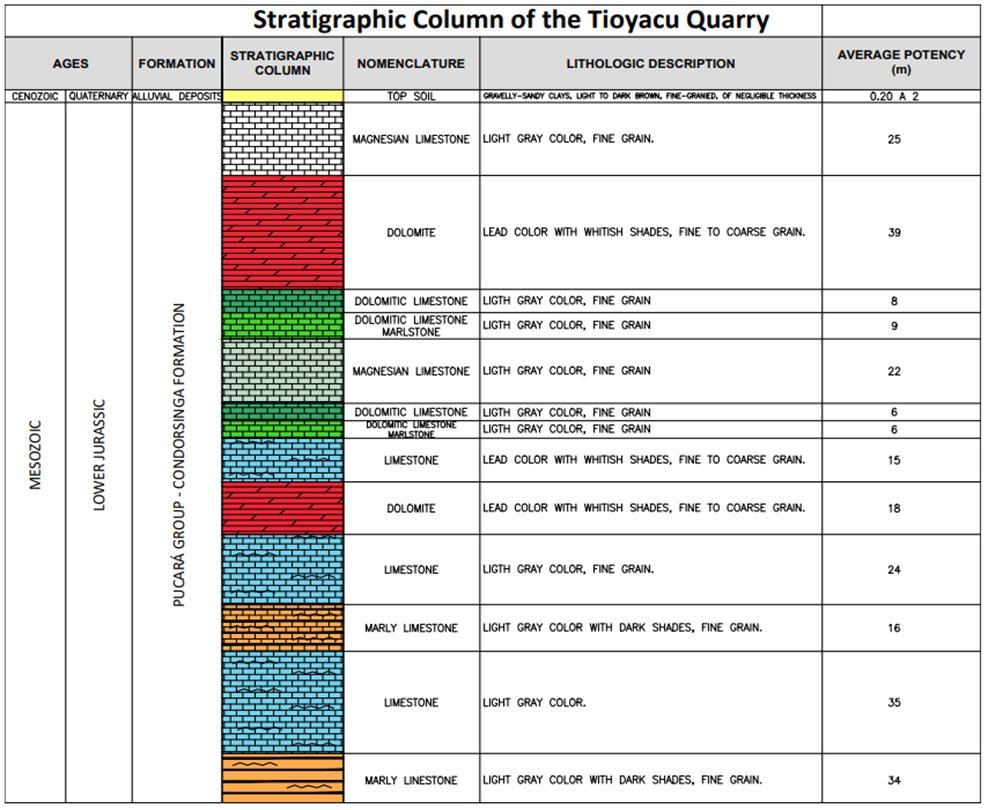
Figure 7 Geological section of the Tioyacu quarry
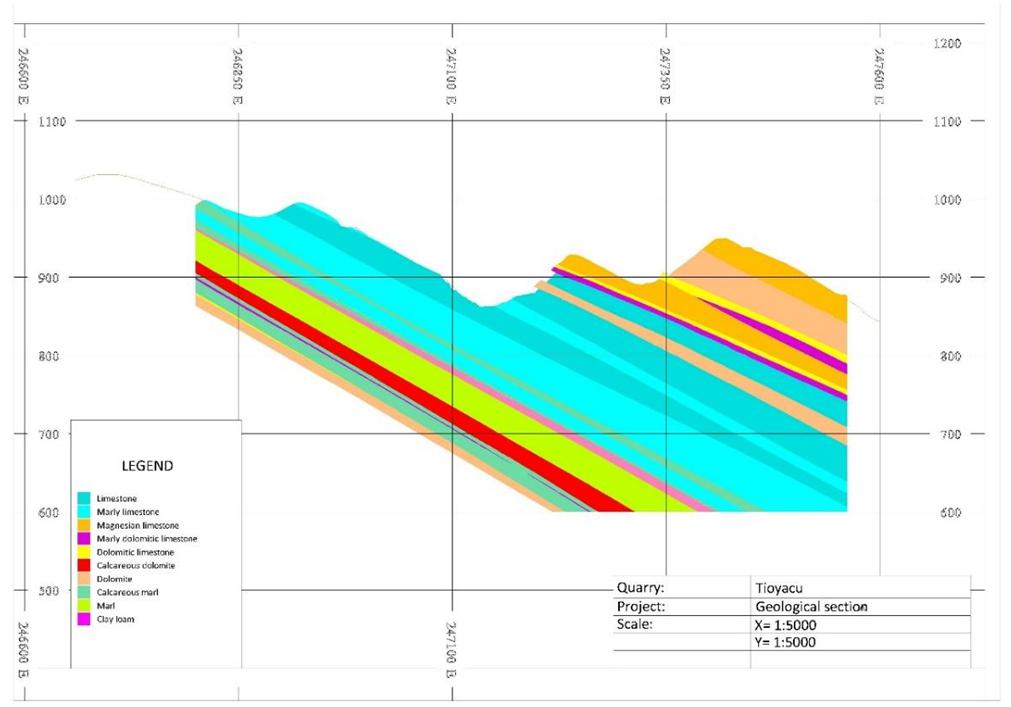
Resources and Reserves
Table 1 shows the mineral
resources at the Tioyacu quarry at the end of the 2023 fiscal year.
Table 1 Limestone Resources (exclusive of Reserves)
at the end of the 2023 fiscal year based on cement price of S/724.6 per ton. The mineral resource estimates are at the point of delivery
to the cement plant (point of reference).
| | |
Amount
(Million Ton) | | |
Grades/
qualities
(% CaO) | | |
Grades/
qualities
(% SiO2) | | |
Grades/
qualities
(% K2O) | | |
Cut-off grades
(%CaO) | |
| Measured resources | |
| 0.05 | | |
| 50.10 | | |
| 5.82 | | |
| 0.22 | | |
| 51.00 | (1) |
| Indicated resources | |
| 0.5 | | |
| 48.01 | | |
| 6.23 | | |
| 0.19 | | |
| 51.00 | (1) |
| Measured + Indicated resources | |
| 0.5 | | |
| 48.20 | | |
| 6.19 | | |
| 0.20 | | |
| 51.00 | (1) |
| Inferred resources | |
| 19.8 | | |
| 46.34 | | |
| 2.67 | | |
| 0.14 | | |
| 51.00 | (1) |
Table 2 Limestone Reserves at the end of the
2023 fiscal year based on cement price of S/724.6 per ton. The mineral reserve estimates are at the point of delivery to the cement plant
(point of reference).
| | |
Amount | | |
Grades/
qualities
(% CaO) | | |
Grades/
qualities
(% SiO2) | | |
Grades/
qualities
(% K2O) | | |
Cut-off grades
(%CaO) | |
| Proven reserves | |
| 5.9 | | |
| 50.17 | | |
| 5.86 | | |
| 0.22 | | |
| 51.00 | (1) |
| Probable reserves | |
| 4.4 | | |
| 48.07 | | |
| 6.84 | | |
| 0.21 | | |
| 51.00 | (1) |
| Total reserves | |
| 10.3 | | |
| 49.28 | | |
| 6.28 | | |
| 0.22 | | |
| 51.00 | (1) |
| (1) | The quality restrictions established may vary according to the requirements of the material balance, associated
with limestone and other raw materials. |
The estimation of mineral reserves considered the expected price of
cement. The complete forecast horizon contemplates a total of 24 years of projection. Clinker is used for cement production through the
addition of other non-metallic minerals.
Reconciliation of Resources and Reserves at
the end of the fiscal year
Table 3 shows the difference between the mineral resource estimates
at the end of 2023and 2022.
Table 3 Resources for the two fiscal years expressed
in millions of tons.
| | |
Resources as at
December 31,
2023 | | |
Resources as at
December 31,
2022 | | |
Discrepancy |
| Measured resources | |
| 0.05 | | |
| 0.1 | | |
Due to the limestone production plan. |
| Indicated resources | |
| 0.5 | | |
| 0.1 | | |
Due to the limestone production plan. |
| Measured + Indicated resources | |
| 0.5 | | |
| 0.2 | | |
Due to the limestone production plan. |
| Inferred resources | |
| 19.8 | | |
| 19.8 | | |
The inferred resources are the same as last year. |
| * | No economic analysis was performed for the Inferred Mineral
Resources. |
Table 4 Reserves for the last two fiscal years
expressed in millions of tons.
| | |
Reserves as at
December 31,
2023 | | |
Reserves as at
December 31,
2022 | | |
Discrepancy |
| Proven reserves | |
| 5.9 | | |
| 6.3 | | |
The difference is due to the annual consumption of limestone used in the cement plant. |
| Probable reserves | |
| 4.4 | | |
| 4.7 | | |
The difference is due to the annual consumption of limestone used in the cement plant. |
| * | The prices assumed for the Mineral Reserves estimation in
the economic model can be found in the Cementos Selva S.A.C. Technical Report Summary (TRS) of the Tioyacu Quarry and Rioja Cement Plant
20-F 229.601 (Item 601) Exhibit 96.3 of this 20-F filing. All mineral reserves are estimated as quantities at cement plant. The updated
average price is S/724.6 per ton of cement, average of the 24-year projection, at nominal values. |
Cementos Pacasmayo has previously disclosed mineral
resources and reserves at the Tioyacu quarry in its annual report on Form 20-F filed on April, 2023. Cementos Pacasmayo previously filed
a TRS to support its disclosure of mineral resources and reserves at the Tioyacu quarry as Exhibit 96.3 of its annual report on Form 20-F
filed on April 28, 2022. Cementos Pacasmayo is updating that TRS with the new TRS filed as Exhibit 96.3 of this 20-F filing to ensure
the material assumptions are current. The main reasons for this update are price, cost and cement demand. Further details are provided
in Exhibit 96.3 of that 20-F filing.
Other Activities
Cementos Selva S.A.C has carried out drilling
at the Tioyacu quarry to confirm mineral reserves. This activity will improve the accuracy of mineral reserves estimation. New drilling
data is not included in the 2023 reserves model.
Internal Control Disclosure
(229.1305)
Cementos Pacasmayo S.A.A, as part of its corporate
policies and through its Vice-President of Operations, has implemented the necessary controls and procedures for quality assurance (QA)
and quality control (QC) of the company’s production activities and associated information for the estimation of mineral resources and
reserves. Cementos Pacasmayo has also implemented quality management systems for its production activities and the quality management
system has been ISO 9001 certified since 2015.
The QA and QC measures are applied to exploration,
quarry production (mining), and cement plant processing activities. For laboratory analysis of exploration samples used in mineral resource
and reserve estimates, Cementos Pacasmayo uses a program of duplicate samples, standards and blanks to evaluate the reliability of the
laboratory results that its qualified persons rely on for mineral resource and reserve estimates. Its qualified persons also verify the
data prior to using the data in their work.
As part of the quality control activities, Cementos
Pacasmayo periodically hires an external laboratory to verify Cementos Pacasmayo’s laboratory results obtained during the exploration
activities, which are part of the geological database and subsequently used in the estimation of resources and reserves.
In each of its operations, Cementos Pacasmayo,
following the Quality Management System, applies the quality control procedures specific to each stage of the process such as exploration
activities, limestone/coquina production, reception of raw materials in the cement plant, crushing of raw materials, coal grinding, cement
grinding and raw materials or products in the Cement Plants (e.g., clinker, other materials and cement).
Quality control procedures include sample security
such as chain of custody for reliable information.
Cementos Pacasmayo has a chemical analysis laboratory
at each of its cement plants where procedures based on international standards are used for the chemical and physical analysis of raw
materials, clinker, and other materials; mainly used in limestone and cement production. Methodologies including the insertion of blanks,
duplicates, and standards are applied as part of the quality plan.
Cementos Pacasmayo has a data management department
whose goal is to verify the quality of the information and its incorporation into the geological database, so that it can be used in studies
and interpretations, geological modeling, and estimation of mineral resources and reserves.
Data verification activities apply to exploration,
limestone/coquina production and cement processing data.
At the cement plant, the quality plan uses the
PDCA (Plan, Do, Check, Act) cycle, which allows Cementos Pacasmayo to verify the quality of information during cement production activities.
Cementos Pacasmayo has implemented internal controls
to ensure its mineral Resource and Reserves estimates are compliant with Regulation S-K 1300 requirements, including ensuring that mineral
resource and reserve estimates are prepared by qualified persons who are members of the Peruvian Engineers Association, an organization
that regulates the legal professional practice of engineers in Peru.
Mineral resource and reserve estimates at the
end of each fiscal year are and will continue to be reviewed by our Mining Operations Department to ensure compliance with S-K 1300. Cementos
Pacasmayo engineers and geologists reconcile actual production with estimates of mineral resources and reserves annually to verify accuracy
of the estimates. The comprehensive risk inherent in Cementos Pacasmayo’s estimates of mineral resources and reserves are consistent
with industry best practices.
Insurance
We maintain a comprehensive
insurance program that protects us from certain types of property and casualty losses. Our plants and equipment are insured against losses.
Additionally, our insurance policy provides coverage for business interruption in our cement manufacturing facilities. We also purchase
commercial insurance to cover risks associated with workers’ compensation and other general liabilities. We believe our insurance
programs and policy limits and deductibles are appropriate for the risks associated with our business and are in line with the insurance
policies of similar cement manufactures that operate in Peru.
Sustainability Performance
We report our sustainability
performance information to the Getting the Numbers Right (“GNR”) database, inspired by the guiding principles of the Cement
Sustainability Initiative (the “CSI”), a sector-project of the World Business Council for Sustainable Development (the “WBCSD”)
among other cement companies in Latin America through the Inter-American Cement Federation (the “FICEM”).
In August 2018, we joined
the GCCA and the GCCA announced the formation of a strategic partnership with the WBCSD to facilitate sustainable development of the cement
and concrete sectors and their value chains. As part of a new agreement, the work carried out by the CSI and the GNR database was transferred
from the WBCSD to the GCCA on January 1, 2019. In 2023, our CEO, Humberto Nadal was elected board member of the GCCA for the 2024-2026
period.
In 2019, we became members
of Innovandi Global Cement and Concrete Research Network which is GCCA’s Innovation arm, which runs key programs to develop innovations
to help the industry decarbonize and produce carbon neutral concrete by 2050.
In 2020, member companies
of the Global Cement and Concrete Association came together as leaders in the sector to commit to producing carbon neutral concrete by
2050, in line with global climate targets – accelerating the Co2 reductions.
In 2022, we were included
for the fourth consecutive year as part of the DJS MILA Pacific Alliance Index. This index is made up of those companies that demonstrate
superior performance among their peers under social, environmental and economic criteria. This achievement comes as a result of Pacasmayo’s
effort to improve in all of these criteria and to work towards ambitious goals in terms of long-term sustainability. We are committed
not only to remain in the Index but to improve our performance, as we are convinced that the focus on sustainability is key to our business
and our stakeholders. We participated in the Carbon Disclosure Project (CDP) for the first time, and we are committed to participate every
year in this project going forward. CDP is a not-for-profit charity that runs the global disclosure system for investors, companies, cities,
states and regions to manage their environmental impacts.
In 2023, we were included
for the fifth consecutive year in the annual DJS MILA Pacific Alliance Index and remain the only Peruvian cement company in this prestigious
index. In addition, this year we inaugurated a new kiln at our Pacasmayo plant, which, in addition to adding 660,000 metric tons of clinker
capacity per year, will help us on our path to carbon neutrality and allow us to achieve energy efficiency. Cementos Pacasmayo and Dino
SRL have been recognized by the Ministry of the Environment with the “Carbon Footprint Peru’’ seal. This is an official tool of the
Peruvian State that acknowledges public and private organizations that manage their Greenhouse Gas Emissions (GHG) for the benefit of
the environment. We are also part of the S&P/BVL Peru General ESG index, which recognizes us as one of the most sustainable companies
in the Peruvian stock market.
In February 2024, we were
selected to be part of The Sustainability Yearbook for the fourth consecutive year. To appear in the Yearbook, companies must score within
the top 15% of their industry globally and have a gap of less than 30% from the leader’s Global ESG score. 2021 was the first year
that Peruvian companies were included as part of the Yearbook, and we are the only cement company that has been part of the Yearbook for
four consecutive years. With around 9,400 companies evaluated around the world, an inclusion in the yearbook is a true statement of excellence
in corporate sustainability.
Social Performance
We are committed to the development
and quality of life of communities that surround the area where we operate. We have developed a good relationship with the local communities
surrounding our plant facilities since we started operations in Pacasmayo. We have a number of social responsibility programs aimed at
improving health and education in the area. Below is a brief description of a few of our social initiatives.
Tecsup. Tecsup is a
leading not-for-profit institute in Peru that provides technical education. It was founded by the family of our controlling shareholder,
and we support it by providing scholarships to promising students living near our plants to study at the Trujillo campus of Tecsup. Through
its three campuses in Peru, Tecsup has graduated over 11,285 students in various technical fields, some of whom currently work for us
and our affiliated companies.
Center for Technological
Training. We have three training centers at our facilities where we teach students and adults business and technical skills. Our centers
are staffed with instructors from Tecsup. The goal of the center is to help develop the professional skills of the local population, especially
of students and teachers at the educational institutions in the towns of Tembladera, Pacasmayo and Sechura. In 2022, this program benefited
over 1,909 stakeholders.
Abilities Strengthening.
This program seeks to provide training to local stakeholders such as grassroots organizations, local entrepreneurs. The objective of the
program is to strengthen their skills and knowledge by providing courses and seminars especially designed for that purpose. The program
is funded by us and in 2022 benefited 186 stakeholders.
Universidad de Ingeniería
y Tecnología. UTEC (University of Engineering and Technology) is an educational nonprofit proposal that since 2012 is aimed
at the development of people in the engineering field, looking to satisfy the need for these types of professionals in the labor market
by implementing a curriculum in line with the trends and demands that globalization poses to modern engineering, with an integrated approach
to innovative teaching models. We support it by providing financial aid for its operations. To enhance students’ knowledge, UTEC
also has various national and international alliances with top organizations.
Acuícola Los Paiches.
Through our social venture, Acuícola Los Paiches S.A.C., we studied the reproductive forms of the “paiche” (arapaima
giga), a native fish species that was on the edge of extinction. After years of studies and scientific testing, we have successfully bred
this species in captivity, and we have obtained thousands of fingerlings.
Floor Improvement Project.
To promote the urban development of our areas of influence, we set out to improve the infrastructure conditions of homes, through
the substitution of dirt floors for concrete floors to contribute to the improvement of the quality of life and habitability conditions
of the towns surrounding our operations. This is how 203 families joined this initiative and with our support they have managed to build
concrete floors in their homes. Likewise, we have contributed 4,290 bags of cement to build a total of 7,052.14 square meters of concrete
floors. This project has motivated the participants to invest financial resources and contribute labor to improve their homes.
Risk Management
Risk Management Description
Corporate Risk Management
(GRC) is a structured approach that allows managing all of the important risks that could affect our long-term objectives. The purpose
of this approach is to support senior management in the decision-making process, in order to reduce adverse impacts and take advantage
of opportunities; as well as managing the action plans to mitigate the risks.
Therefore, Pacasmayo has processes
and systems that analyze and evaluate the management of its business units, encouraging continuous improvement. Our management control
systems include:
| ● | Mapping of new emerging risks and definition of impact, probability and design of controls; |
| ● | Periodic review of current risks and update of impact probability and controls information; |
| ● | Quantification and effect of risk on EBITDA; |
| ● | Evaluation of external factors; and |
| ● | Periodic review of policies, procedures, regular internal audits and employee training. |
Risk Management Process
The following are highlights
of our risk management process.
| ● | The risks are mapped considering the impact on profit, revenues, resources, employees, communities where
we operate and our suppliers. |
| ● | An integrated risk management system and tools are used to collect information collaboratively with the
functional areas and external sources of the company. |
| ● | These processes include the evaluation of risks related to operations, human rights, sustainability, fraud
and corruption, in different areas such as commercial, operations, environment, health and safety, among others. |
| ● | The development of a risk management culture throughout the company in a decentralized manner, integrating
the processes to the mapping of risks and the identification and mitigation of risks from the strategic level to the operational level. |
| ● | The foregoing is reinforced with training for employees and suppliers and communication plans for the
entire company. |
Risk Management Organization
|
Managers responsible
for risk metrics |
|
Risk management team |
|
Risks committee |
|
Audit Committee |
|
● Those responsible for the
evaluation, management and prevention of the risk metrics of each area.
|
|
●
Group responsible for the implementation of the corporate risk management strategy, which includes activities such as risk
identification, evaluation, quantification, and promotion of a risk management culture, among others. |
|
● Group created to establish
and supervise the implementation of the risk management strategy at th™e corporate level.
|
|
● Made up by 3 independent
board members, reports directly to the Board
|
| |
|
|
|
|
|
|
| ● Risk management
coordinates with them for the development and monitoring of these metrics. |
|
|
|
● It is made up by the CEO,
the VPs and the Risks Manager |
|
● The participants are the
external auditors, the internal auditor, the compliance officer, the CFO and the Risk Manager |
| |
|
|
|
|
|
|
| |
|
|
|
● the Risks Committee
reports to the Audit Committee |
|
● Evaluates improvement
opportunities and plans for the risk metrics. |
Climate Related Risks
ESG risk management includes
risks related to climate change. Therefore, they are analyzed through the same risk management stages and are part of Pacasmayo’s
2030 Sustainability Plan. This risk assessment includes risks that could occur in the short, medium or long term, and of different types,
such as physical risks and transition risks, among others.
We have clear objectives to
manage climate risks and opportunities, aiming to reduce our emissions by 20% and achieve more than 20% co-processing by 2030. All of
this goes hand in hand with the implementation of operational contingency plans and the conditioning of plant infrastructure to ensure
continuity, as well as the testing of emergency and crisis response plans.
For this purpose, we are aligned
with the recommendations of the Task Force on Climate-related Financial Disclosures (TCFD) for risks related to climate change. For example,
one risk would be that our employees’ health would be affected by heat waves or lack of water, as well as the paralysis of our operations
due to water stress, landslides or forest fires. We are also exposed to the possibility of not marketing finished products, as well as
supplying raw materials to production plants due to disabled access roads.
In 2023, we have also identified
and evaluated the risks and opportunities related to climate change and analyzed the impacts of these risks on our strategy. These risks
have been incorporated into the risk matrix and our business continuity plan with measures for action and mitigation of impacts in the
event of any of these risks.
The preparation of our business
continuity plan has involved the development of a business impact analysis, the identification of risk scenarios, emergency plans, crisis
management and response committees for each of the scenarios proposed. The scenarios include business interruptions as a result of the
effects of climate change such as heavy rains and floods.
Emerging Risks
Emerging risks are those that
have an impact in the long-term. The risks considered here include all recently identified risks that could have a long-term impact on
the company’s business or industry, although in some cases they may have already begun to impact the company’s business.
| Risk Description |
|
Potential Impact |
|
Mitigation Actions |
|
Evidence of Mitigation Actions |
Economic Risk:
At the ministerial level of the Peruvian government, technical working groups are being developed to implement a possible change in the regulations relating to the weight of cement bags. The new national regulation would aim to improve the safety and health of construction workers, trying to prevent injuries caused by lifting heavy loads. |
|
Medium to high:
Economic impact for Cementos Pacasmayo by changing the infrastructure of the dispatch process and adapting the capacity of each plant to comply with the standard. This new regulation would imply a total change in the process of bagging, handling, storage, distribution, and transportation of cement. |
|
Cementos Pacasmayo has developed The Napoleon Project, which aims to evaluate all the variables that would be impacted by the change in national regulations. |
|
Impacts on the packaging management and commercialization process along the entire cement bag journey.
Expenditures, investments and returns on the different corporate fronts in the face of regulatory change.
Pilot industrial production of 85,000 bags of cement in compliance
with the new regulations. |
| |
|
|
|
|
|
|
Social Risk:
The exacerbated social climate due to the political crisis in the country in 2023, led to several stoppages, uprisings and obstructions at the level of roads, and access to operations of various companies nationwide. |
|
Medium to high:
The impact on Cementos Pacasmayo was translated into constant uncertainty due to the stoppage of some of operations, not only affecting the continuity of Cementos Pacasmayo’s operations as a whole, but also, and very importantly, the people who work directly or indirectly in the different locations of our company and therefore, their right to work. |
|
Negotiation and signing of collective bargaining agreements with the different unions, regular meetings with union authorities, agreements and attention to their demands and claims. Work by the community relations group in neighboring communities. |
|
Community projects defined in the strategic plan for social
management.
Talks and trainings to the communities with the program “Conociendo
Pacasmayo”.
Monitoring of the social climate and assessment with the
Social Information System (SIGS). |
ITEM 4A.UNRESOLVED
STAFF COMMENTS
Not applicable.
ITEM 5. OPERATING
AND FINANCIAL REVIEW AND PROSPECTS
A.
Operating Results
Overview
We are a Peruvian cement company,
and the only cement manufacturer in the northern region of Peru. With more than 65 years of operating history, we produce, distribute
and sell cement and cement-related materials, such as precast products and ready-mix concrete. Our products are primarily used in construction.
We also produce and sell quicklime for use in mining operations.
In 2023, our cement sales
volume were approximately 3.0 million metric tons, representing an estimated 23.9% share of Peru’s total cement sales that year.
That same year, we also sold approximately 46 thousand metric tons of quicklime.
We own three cement production
facilities, our Pacasmayo and Piura facilities located in the northwest region of Peru, and our smaller Rioja facility located in the
northeast. Our facilities have a total installed annual cement production capacity of approximately 4.9 million metric tons and 3.1 million
metric tons of clinker capacity. We also have installed annual production capacity of 240,000 metric tons of quicklime. We own concession
rights to several quarries with reserves of limestone/coquina and other raw materials located near our facilities.
In 2021, due to the exponential
growth in cement sales, we decided to invest approximately US$83.5 million to optimize our current capacity at our Pacasmayo plant, in
order to produce approximately 660,000 additional metric tons of clinker per year. This capacity came on line during the second half of
2023.
Factors Affecting our Results
of Operations
Revenue Drivers
In 2023, approximately 88.5%
of our total cement sales were in the form of bagged cement, substantially all of which was sold through retailers both within and outside
of our distribution network. The remaining 11.5% of our cement was sold in bulk or in shipments of precast products or ready-mix concrete
directly to large construction companies. Our retail sales are directed to both the auto-construcción segment and construction
companies that buy cement for a variety of small construction works, including minor residential, commercial and infrastructure projects.
Cement destined for large private and public projects, such as housing complexes, highways, irrigation channels, hospitals, schools, mining
and industrial facilities, is typically sold in bulk or in shipments of precast products or ready-mix concrete.
We estimate that sales to
the auto-construcción segment accounted for approximately 73.0% of our total cement sales in 2023, 73.6% in 2022 and 70.3%
in 2021; private construction projects, both large and small, accounted for approximately 16.2% of our total cement sales in 2023, 12.7%
in 2022, and 14.7% in 2021; and public construction projects accounted for the remaining 10.8% in of our total cement sales in 2023, 10.7%
in 2022, and 15.0% in 2021. Since 2020, we have seen an increase in auto-construcción compared to other segments, mainly
due to its resilience in times of crisis. As the Peruvian economy becomes less informal, and there is more stability and confidence from
the private sector, private construction projects and infrastructure are expected to become increasingly more important to our business.
Our cement sales are largely
driven by residential construction (both auto-construcción and small and large housing developments undertaken by construction
companies), which is generally affected by economic conditions in the northern region of Peru. Auto-construcción is particularly
affected by levels of disposable household income, as low-income families tend to invest most of their savings in developing their homes.
Larger residential construction is more susceptible to the economic outlook, the availability of financing and prevailing investment levels
in the region. GDP in the northern region of Peru is estimated to have increased by 0.8% in 2023, 1.7% in 2022, and 11.2% in 2021. Our
cement volumes, which represented most of the cement sales in the northern region of Peru, contracted by 13.9% in 2023, contracted by
5.3% in 2022 and grew by 40.4% in 2021, in terms of metric tons.
Our cement sales are also
driven, to a lesser extent, by commercial developments and infrastructure projects. Commercial and other private construction projects
are also affected by the level of public and private investment in the region, while public infrastructure projects depend on the priorities
and financial resources of the national, regional and local governments. Since 2020, there has been a significant reduction in activity
relating to these projects, due initially to the economic impact of the COVID-19 pandemic, as well as subsequent political uncertainty.
Private investment contracted by 7.4% in 2023, and public investment increased 1.4% in 2023.
Cost Drivers
Coal is one of the main raw
materials used in our production process, in particular in our kilns. We purchase anthracite coal from nearby coal mines and import a
small amount of bituminous coal primarily from Colombia. We do not have long-term coal supply agreements, and we do not engage in hedging
transactions in connection with the price of coal. In the past, the price of bituminous coal has been related to the international price
of oil, as it is used as a substitute for oil. Coal accounted for an estimated 23.1% of our costs of production in 2023, 16.8% in 2022
and 11.5% in 2021.The increase in the percentage of the total production cost that coal represents is related to an overall decrease in
other costs, as we stopped using imported clinker and achieved overall savings in maintenance costs.
Electricity is used in our
facilities mainly to power our cement mills. We power our Pacasmayo and Piura facilities with electricity purchased from Electroperú,
with which we have a long-term supply agreement expiring in 2026. Our Rioja facility is powered primarily with electricity from ELOR,
with which we have a medium-term supply agreement expiring in 2024. Under these agreements, the price of electricity is based on a formula
that takes into consideration our consumption of electricity and certain market variables, including the international price of oil. Electricity
accounted for approximately 16.0% of our cost of production in 2023, 14.2% in 2022 and 13.5% in 2021. Electricity costs tend to be lower
during the rainy season, from January to March of each year, as our region is served primarily by hydro-electric power plants.
In addition, we purchase from
third parties admixtures and certain raw materials that we use in our production process, including gypsum, blast furnace slag, iron and
other materials. Admixtures and raw materials used in our cement production process do not include construction supplies that we acquire
from third-parties for resale through our distribution network along with our cement products. The cost of admixtures and raw materials
purchased from third parties, excluding imported clinker, accounted for approximately 5.3% of our cost of production in 2023, 5.1% in
2022, and 4.2% in 2021.
Starting in 2021, due to a
sharp increase in demand, we had to use imported clinker while our new capacity was being built. In 2023 our new kiln in Pacasmayo began
operating, significantly reducing our need for imported clinker. The cost of imported clinker as a percentage of our cement production
costs was approximately 4.0% in 2023, compared to 16.3% in 2022 and 21.3% in 2021.
Personnel expenses represented
18.7% of our total costs and expenses in 2023, 16.2% in 2022 and 15.0% in 2021.
Third-party Construction Supplies
In addition to selling our
own products, we also sell and distribute construction supplies manufactured by third parties, such as steel rebar, wires and pipes that
are typically used in construction along with our cement. Our profit margins from the sale of third party construction supplies are significantly
lower than the margins on our cement products and they are affected by fluctuations in product prices and the exchange rate between the
sol and the U.S. dollar between the time we purchase these products and the time we resell them. We sell these products primarily
as a service to retailers in our distribution network in an effort to support the sale of our cement products.
Mining Royalty Tax
The mining royalty tax for
the exploitation of metallic and non-metallic minerals is payable on a quarterly basis in an amount equal to the greater of (i) an amount
determined in accordance with a statutory scale of tax rates based on a company’s operating profit margin that is applied to its
operating profit, as adjusted by certain non-deductible expenses and (ii) 1% of a company’s net sales, in each case during the applicable
quarter. These amounts are determined based on our unconsolidated financial statements and those of our subsidiaries with operations that
are under the scope of the Mining Royalty Law. Mining royalty payments are deductible for income tax purposes in the fiscal year in which
such payments are made. For additional information, see note 29 to our consolidated financial statements included in this annual report.
Operating Segments
We have three operating segments:
(i) cement, concrete, mortar and precast, (ii) quicklime and (iii) sales of construction supplies. For additional information on our operating
segments, see note 27 to our consolidated financial statements included in this annual report.
New Accounting Pronouncements
For a description of new interpretations
and improvements to IFRS in effect since 2023, see notes 2.3.16 and 4 to our consolidated financial statements included in this annual
report.
Critical Accounting Policies
The following is a discussion
of our application of critical accounting policies that require our management to make certain assumptions about matters that are uncertain
at the time the accounting estimate is made, where our management could reasonably use different estimates, or where accounting changes
may reasonably occur from period to period, and in each case would have a material effect on our financial statements. For additional
information, see note 3 to our annual audited consolidated financial statements included in this annual report.
Determination of Useful Live of Assets for Depreciation and Amortization
Purposes
Depreciation of mining concessions
and mine development costs are charged to cost of production on a units-of-production basis using proved reserves. Other assets are depreciated
on a straight-line-basis over their estimated useful lives, as follows:
| |
Years |
| Buildings and other construction: | |
|
| Administrative facilities | |
Between 20 and 51 |
| Main production structures | |
Between 20 and 56 |
| Minor production structures | |
Between 20 and 35 |
| Machinery and equipment: | |
|
| Mills and horizontal furnaces | |
Between 24 and 45 |
| Vertical furnaces, crushers and grinders | |
Between 23 and 36 |
| Electricity facilities and other minors | |
Between 10 and 35 |
| Furniture and fixtures | |
10 |
| Transportation units: | |
|
| Heavy units | |
Between 5 and 15 |
| Light units | |
Between 5 and 10 |
| Computer equipment | |
Between 3 and 10 |
| Tools | |
Between 5 and 10 |
The assets’ residual
value, useful lives and methods of depreciation/amortization are reviewed at each reporting period, and adjusted prospectively, if appropriate.
An item of property, plant
and equipment and any significant part initially recognized is derecognized upon disposal or when no future economic benefits are expected
from its use or disposal. Any gain or loss arising on derecognition of the asset (calculated as the difference between the net disposal
proceeds and the carrying amount of the asset) is included in the consolidated statement of profit or loss when recognition of the asset
is derecognized.
Revenue Recognition
Revenue is measured at the
fair value of the consideration received or receivable, taking into account contractually defined terms of payment, discounts and excluding
taxes or duty.
The following specific recognition
criteria must also be met before revenue is recognized:
Sales of goods
Revenue from sale of goods
is recognized at the point in time when control of the asset is transferred to the customer, generally on delivery of the goods.
We consider whether there
are other promises in the contract that are separate performance obligations to which a portion of the transaction price needs to be allocated.
In determining the transaction price for the sale of goods, we consider the effects of variable consideration, the existence of significant
financing components, noncash consideration, and consideration payable to the customer (if any).
Rendering of services
In the operating segments
of cement, concrete, mortar, precast, quicklime and construction supplies, we provide transportation services. These services are sold
together with the sale of the goods to the customer.
Transportation services are
satisfied when the transport service is concluded, which coincides with the moment of delivery of the goods to the customers.
Interest income
For all financial instruments
measured at amortized cost and interest-bearing financial assets, interest income is recorded using the effective interest rate (EIR).
EIR is the rate that exactly discounts the estimated future cash payments or receipts over the expected life of the financial instrument
or a shorter period, where appropriate, to the net carrying amount of the financial asset or liability. Interest income is included in
finance income in the consolidated statement of profit or loss.
Impairment of Non-Financial Assets
We assess at each reporting
date whether there is an indication that an asset may be impaired. If any indication exists, or when annual impairment testing for an
asset is required, (goodwill and intangible assets with indefinite useful lives), we estimate the asset’s recoverable amount. An
asset’s recoverable value is the higher of an asset’s or cash-generating unit’s fair value less costs of disposal and
its value in use, and is determined for an individual asset, unless the asset does not generate net cash inflows that are largely independent
of those from other assets or groups of assets. Where the carrying amount of an asset’s cash-generating unit exceeds its recoverable
amount, the asset is considered impaired and is written down to its recoverable amount. In assessing value in use, the estimated future
cash flows are discounted to their present value using a pre-tax discount rate that reflects current market assessments of the time value
of money and the risks specific to the asset. In determining fair value less costs of disposal, recent market transactions are taken into
account. If no such transactions can be identified, an appropriate valuation model is used. These calculations are corroborated by valuation
multiples, quoted share prices for publicly traded companies or other available fair value indicators.
As of December 31, 2023, 2022 and 2021, goodwill related to the acquisition
of assets made by our subsidiary Distribuidora Norte Pacasmayo S.R.L. amounted to S/4,459,000. We have assessed the recoverable amount
of our goodwill and have determined that there are no indicators of an impairment loss of this asset as of December 31, 2023 and 2022.
Management recognized a specific impairment to retirement for the net value of the assets of the vertical clinker kilns located at the
Pacasmayo cement plant for a net cost of S/36,551,000. This deterioration estimate was carried out as a consequence of replacing the old
technology of these kilns due to the entry into operation of the Clinker Lines Optimization Project – Kiln 4 in the Pacasmayo plant,
which is more efficient and produces fewer emissions. This amount was recorded in the impairment of property, plant and equipment item
in the consolidated statement of profit or loss. As of December 31, 2023, management had not identified additional signs of impairment
for long-lived assets.
We base our impairment calculation
on detailed budgets and forecast calculations, which are prepared separately from our cash generation units to which the individual assets
are allocated. Impairment losses of continuing operations, including impairment on inventories, are recognized in the consolidated statement
of profit or loss in expense categories consistent with the function of the impaired asset.
An assessment is made at each
reporting date as to whether there is any indication that previously recognized impairment losses may no longer exist or have decreased.
If such indication exists, we estimate the asset’s or cash-generating unit’s recoverable amount. A previously recognized impairment
loss is reversed only if there has been a change in the assumptions used to determine the asset’s recoverable amount since the last
impairment loss was recognized. The reversal is limited so that the carrying amount of the asset does not exceed its recoverable amount,
nor exceed the carrying amount that would have been determined, net of depreciation, had no impairment loss been recognized for the asset
in prior years. Such reversal is recognized in the consolidated statement of profit or loss. Exploration and evaluation assets are tested
for impairment annually as of December 31, either individually or at the cash-generating unit level, as appropriate and when circumstances
indicate that the carrying value may be impaired.
Deferred Tax
Deferred tax is provisioned
using the liability method on temporary differences between the tax bases of assets and liabilities and their carrying amounts for financial
reporting purposes at the reporting date.
Deferred tax liabilities are
recognized for all taxable temporary differences, except in respect of taxable temporary differences associated with investments in subsidiaries,
associates and interests in joint arrangements, when the timing of the reversal of the temporary differences can be controlled and it
is probable that the temporary differences will not reverse in the foreseeable future.
Deferred tax assets are recognized
for all deductible temporary differences, the carry forward of unused tax credits and unused tax losses. Deferred tax assets are recognized
to the extent that it is probable that taxable profit will be available against which the deductible temporary differences, and the carry
forward of unused tax credits and unused tax losses can be utilized, except in respect of deductible temporary differences associated
with investments in subsidiaries, where deferred assets are recognized only to the extent that it is probable that the temporary differences
will reverse in the foreseeable future and taxable profit will be available against which the temporary differences can be utilized.
The carrying amount of deferred
tax assets is reviewed at each reporting date and reduced to the extent that it is no longer probable that sufficient taxable profit will
be available to allow all or part of the deferred tax asset to be utilized. Unrecognized deferred tax assets are re-assessed at each reporting
date and are recognized to the extent that it has become probable that future taxable profits will allow the deferred tax asset to be
recovered.
Deferred tax assets and liabilities
are measured at the tax rates that are expected to apply in the year when the asset is realized or the liability is settled, based on
tax rates (and tax laws) that have been enacted or substantively enacted at the reporting date. Deferred tax related to items recognized
outside profit or loss is recognized outside profit or loss. Deferred tax items are recognized in correlation to the underlying transaction
either in other comprehensive income or directly in equity.
Deferred tax assets and deferred
tax liabilities are offset if a legally enforceable right exists to set off current tax assets against current income tax liabilities
and the deferred taxes relate to the same taxable entity and the same taxation authority.
Derivative Financial Instruments and Hedge Accounting
Initial Recognition and Subsequent Measurement
We use derivative financial
instruments, such as cross-currency swaps (CCS), to hedge our foreign currency exchange rate risk. Such derivative financial instruments
are initially recognized at their fair value on the date on which the derivative contract is entered into and subsequently remeasured
at their fair value. Derivatives are carried as financial assets when the fair value is positive and as financial liabilities when fair
value is negative.
For the purpose of hedge accounting,
hedges are classified as follows:
| ● | “Fair value hedges” are those that hedge the exposure to changes in the fair value of a recognized
asset or liability or an unrecognized firm commitment. |
| ● | “Cash flow hedges” are those that hedge the exposure to variability in cash flows that is
either attributable to a particular risk associated with a recognized asset or liability or a highly probable forecast transaction or
the foreign currency risk in an unrecognized firm commitment. |
| ● | “Hedges of a net investment in a foreign operation.” |
At the inception of a hedge
relationship, we formally designate and document the hedge relationship to which we wish to apply hedge accounting and the risk management
objective and strategy for undertaking the hedge.
The documentation includes
identification of the hedging instrument, the hedged item or transaction, the nature of the risk being hedged and how our management will
assess the effectiveness of changes in the hedging instrument’s fair value in offsetting the exposure to changes in the hedged item’s
fair value or cash flows attributable to the hedged risk. Such hedges are expected to be highly effective in achieving offsetting changes
in fair value or cash flows and are assessed on an ongoing basis to determine that they actually have been highly effective throughout
the financial reporting periods for which they were designated.
A hedging relationship qualifies
for hedge accounting if it meets all of the following effectiveness requirements:
| ● | there is ‘an economic relationship’ between the hedged item and the hedging instrument; |
| ● | the effect of credit risk does not ‘dominate the value changes’ that result from that economic
relationship; and |
| ● | the hedge ratio of the hedging relationship is the same as that resulting from the quantity of the hedged
item that the Group actually hedges and the quantity of the hedging instrument that the Group actually uses to hedge that quantity of
hedged item. |
Hedges that meet all the qualifying
criteria for hedge accounting are recorded as cash flow hedges.
Cash flow hedges
Any gains or losses arising
from changes in the fair value of derivatives is taken directly to profit or loss, except for the effective portion of cash flow hedges,
which is recognized in other comprehensive income (OCI) and later reclassified to profit or loss when the hedge item affects profit or
loss.
For any other cash flow hedges,
the amount accumulated in OCI is reclassified to profit or loss as a reclassification adjustment in the same period or periods during
which the hedged cash flows affect profit or loss.
If the cash flow hedge is
discontinued, the amount accumulated in other comprehensive income must remain in other comprehensive income accumulated if the covered
cash flows are still expected to occur. Otherwise, the amount will be immediately reclassified to profit or loss as a reclassification
adjustment. After discontinuation, once the covered cash flows are given, any amount that remains in other comprehensive accumulated results
must be recorded considering the nature of the underlying transaction.
On February 8, 2023, we paid
in full the outstanding US$131,612,000 aggregate principal amount of our 4.50% Senior Notes due 2023 at maturity using proceeds from the
Club Deal credit line, and we also settled the US$132,000,000 in related derivative financial instruments.
Results of Operations
Comparison of Year Ended December 31, 2023 to Year Ended December
31, 2022
| | |
Year ended December 31, | | |
| |
| (amounts in millions of S/) | |
2023 | | |
2022 | | |
Variation % | |
| Sales of goods | |
| 1,950.1 | | |
| 2,115.7 | | |
| (7.8 | )% |
| Cost of sales | |
| (1,260.6 | ) | |
| (1,463.7 | ) | |
| (13.9 | )% |
| Gross profit | |
| 689.5 | | |
| 652.0 | | |
| 5.7 | % |
| Operating income (expenses): | |
| | | |
| | | |
| | |
| Administrative expenses | |
| (234.7 | ) | |
| (227.6 | ) | |
| 3.1 | % |
| Selling and distribution expenses | |
| (66.8 | ) | |
| (65.2 | ) | |
| 2.4 | % |
| Other operating (expense) income, net | |
| (13.8 | ) | |
| (3.9 | ) | |
| N/A | |
| Impairment of assets | |
| (36.6 | ) | |
| - | | |
| N/A | |
| Total operating expenses, net | |
| (351.9 | ) | |
| (296.7 | ) | |
| 18.6 | % |
| Operating profit | |
| 337.6 | | |
| 355.3 | | |
| (5.0 | )% |
| Other income (expenses): | |
| | | |
| | | |
| | |
| Finance income | |
| 7.2 | | |
| 3.3 | | |
| N/A | |
| Finance costs | |
| (104.0 | ) | |
| (95.1 | ) | |
| 9.4 | % |
| Net (loss) gain on derivative financial instruments at fair value through profit or loss | |
| - | | |
| (0.1 | ) | |
| N/A | |
| Loss from exchange difference, net | |
| 4.9 | | |
| (1.0 | ) | |
| N/A | |
| Total other expenses, net | |
| (91.8 | ) | |
| (92.9 | ) | |
| (1.1 | %) |
| Profit before income tax | |
| 245.7 | | |
| 262.4 | | |
| (6.4 | )% |
| Income tax expense | |
| (76.8 | ) | |
| (85.6 | ) | |
| (10.3 | )% |
| Profit for the year | |
| 168.9 | | |
| 176.8 | | |
| (4.5 | )% |
Sales of Goods
The following table sets forth
a breakdown of our sales of goods by segment for 2023 and 2022:
| | |
Year ended December 31, | |
| | |
2023 | | |
% | | |
2022 | | |
% | |
| Cement, concrete, mortar and precast | |
| 1,850.2 | | |
| 94.9 | | |
| 1,963.8 | | |
| 92.8 | |
| Quicklime | |
| 25.7 | | |
| 1.3 | | |
| 37.9 | | |
| 1.8 | |
| Construction supplies | |
| 74.1 | | |
| 3.8 | | |
| 114.0 | | |
| 5.4 | |
| Other | |
| 0.1 | | |
| 0.0 | | |
| - | | |
| - | |
| Total sales of goods | |
| 1,950.1 | | |
| 100.0 | | |
| 2,115.7 | | |
| 100.0 | |
Our total sales of goods decreased
by 7.8%, or S/165.6 million, to S/1,950.1 million in 2023 from S/2,115.7 million in 2022. This decrease was primarily due to the following
factors:
| ● | a 5.8%, or S/113.6 million, decrease in sales of cement, concrete, mortar and precast mainly due to decreased
public and private investment; |
| ● | a 32.2%, or S/12.2 million, decrease in quicklime sales, mainly due to decreased sales volume in 2023;
and |
| ● | a 35.0%, or S/39.9 million, decrease in the sale of construction supplies, mainly due to the contraction
in demand from the construction segment. |
The following table
sets forth the composition of our sales of cement, concrete, mortar and precast for 2023 and 2022:
| | |
Year ended December 31, | | |
| |
| | |
2023 | | |
2022 | | |
Variation | |
| | |
(in millions of S/) | | |
% | |
| Cement | |
| 1,642.4 | | |
| 1,742.7 | | |
| (5.8 | ) |
| Concrete and mortar | |
| 161.2 | | |
| 189.9 | | |
| (15.1 | ) |
| Pavement | |
| 21.1 | | |
| - | | |
| N/A | |
| Precast | |
| 25.5 | | |
| 31.2 | | |
| (18.3 | ) |
| Total | |
| 1,850.2 | | |
| 1,963.8 | | |
| (5.8 | ) |
Our total sales of cement,
concrete, mortar and precast decreased by 5.8%, or S/113.6 million, to S/1,850.2 million in 2023 from S/1,963.8 million in 2022. This
decrease was primarily due to the following factors:
| ● | cement sales revenue decreased 5.8%, or S/100.3 million, in 2023 due to lower sales volume ((14.5)%),
partially offset by an increase in the average prices of cement due to both a price increase and a more favorable sales mix, as we started
selling more of our higher-priced cements (8.7%); |
| ● | concrete and mortar sales revenue decreased 15.1%, or S/28.7 million, mainly due to a decrease in sales
volume of concrete and mortar ((15.8)%), as public and private investment slowed down as a result of macroeconomic uncertainty, a low
confidence levels from the private sector, partially offset by an increase in the average prices of concrete (0.7%); and |
| ● | pavement sales revenue are mainly due to the contract for the reconstruction of the two runways and the
perimeter fence of the Piura Airport; and |
| ● | precast revenue decreased by 18.3%, or S/5.7 million, mainly due to a decrease in sales volume ((15.3)%)
for the public sector, as well as a decrease in the average price of precast products ((3.0)%), mainly due to sales mix as we sold higher
margin products during 2022. |
Cost of Sales
The following table sets forth
a breakdown of our cost of sales by segment for 2023 and 2022:
| | |
Year ended December 31, | |
| | |
2023 | | |
2022 | |
| | |
(in millions
of S/) | | |
% | | |
(in millions
of S/) | | |
% | |
| Cement, concrete, mortar and precast | |
| (1,162.5 | ) | |
| 92.2 | | |
| (1,316.5 | ) | |
| 89.9 | |
| Quicklime | |
| (24.2 | ) | |
| 1.9 | | |
| (35.9 | ) | |
| 2.5 | |
| Construction supplies | |
| (73.4 | ) | |
| 5.8 | | |
| (110.4 | ) | |
| 7.5 | |
| Other | |
| (0.5 | ) | |
| 0.1 | | |
| (0.9 | ) | |
| 0.1 | |
| Total cost of sales | |
| (1,260.6 | ) | |
| 100.0 | | |
| (1,463.7 | ) | |
| 100.0 | |
Our total cost of sales decreased
by 13.9%, or S/203.1 million, to S/1,260.6 million in 2023, from S/1,463.7 million in 2022, primarily due to the following factors:
| ● | a 11.7%, or S/154.0 million, decrease in the cost of sales of cement, concrete, mortar and precast, mainly
due to the lower production volumes, as well as the replacement of imported clinker with our own clinker, and to the decrease in the cost
of coal; |
| ● | a 32.6%, or S/11.7 million, decrease in the cost of sales of quicklime, mainly due to lower production
volumes, as well as lower costs of raw materials, such as coal; and |
| ● | a 33.5%, or S/37.0 million, decrease in the cost of sales of construction
supplies, mainly due to sales lower volumes. |
The following table sets forth
the composition of our cost of sales of cement, concrete, mortar, pavement and precast for 2023 and 2022:
| | |
Year ended December 31, | | |
| |
| | |
2023 | | |
2022 | | |
Variation | |
| | |
(in millions of S/) | | |
% | |
| Cement | |
| (966.1 | ) | |
| (1,111.5 | ) | |
| (13.1 | ) |
| Concrete and mortar | |
| (148.4 | ) | |
| (169.6 | ) | |
| (12.5 | ) |
| Pavement | |
| (21.8 | ) | |
| - | | |
| N/A | |
| Precast | |
| (26.2 | ) | |
| (35.4 | ) | |
| (26.1 | ) |
| Total | |
| (1,162.5 | ) | |
| (1,316.5 | ) | |
| (11.7 | ) |
Our cost of sales represented
64.6% of our sales revenue in 2023, compared to 69.2% in 2022. Our total cost of sales of cement, concrete, mortar and precast decreased
by 11.7%, or S/154.0 million, in 2023, primarily due to the following factors:
| ● | cost of sales of cement decreased by 13.1%, or S/145.4 million, mainly due to a decrease in volume sold
((14.5)%), partially offset by a slight increase in production costs (1.4%) due to the increased freight costs to final consumers; |
| ● | cost of sales of concrete, and mortar decreased 12.5%, or S/21.2 million mainly due to a decrease in volume
sold ((15.8)%), partially offset by an increase in production costs (3.3%); |
| ● | cost of sales of pavement is mainly due to the contract for the reconstruction of the two runways and
the perimeter fence of the Piura Airport; and |
| ● | a 26.1% decrease in the cost of sales of precast, mainly due to decreased sales volume ((15.3)%) and decrease
in production cost ((10.8)%). |
Gross Profit
The following table sets forth
a breakdown of our gross profit and gross profit margin (gross profit as a percentage of net sales) by segment for 2023 and 2022:
| | |
Year ended December 31, | |
| | |
2023 | | |
2022 | |
| | |
Gross
profit | | |
Gross profit
margin | | |
Gross
profit | | |
Gross profit
margin | |
| | |
(in millions
of S/) | | |
% | | |
(in millions
of S/) | | |
% | |
| Cement, concrete, mortar and precast | |
| 687.7 | | |
| 37.2 | | |
| 647.3 | | |
| 33.0 | |
| Quicklime | |
| 1.5 | | |
| 5.8 | | |
| 2.0 | | |
| 5.3 | |
| Construction supplies | |
| 0.7 | | |
| 0.9 | | |
| 3.6 | | |
| 3.2 | |
| Other | |
| (0.4 | ) | |
| N/A | | |
| (0.9 | ) | |
| N/A | |
| Total gross profit | |
| 689.5 | | |
| 35.4 | | |
| 652.0 | | |
| 30.8 | |
Total gross profit increased
by 5.8%, or S/37.5 million, to S/ 689.5 million in 2023, from S/ 652.0 million in 2022, mainly due to the reduction in the use of imported
clinker, as we started operating our new, more efficient kiln in the second half of 2023, as well as more favorable costs of raw materials.
Our gross profit margin for 2023 was 35.4% compared to 30.8% for 2022.
The following table sets forth
a breakdown of our gross profit and gross profit margin for the cement, concreteand mortar, pavementmortar and precast segments for 2023
and 2022:
| | |
Year ended December 31, | | |
| |
| | |
2023 | | |
2022 | | |
| |
| | |
Gross
profit | | |
Gross profit
margin | | |
Gross
profit | | |
Gross profit
margin | | |
Gross profit
margin
variation | |
| | |
(in millions
of S/) | | |
% | | |
(in millions
of S/) | | |
% | | |
percentage
points | |
| Cement | |
| 676.3 | | |
| 41.2 | | |
| 631.2 | | |
| 36.2 | | |
| 5.0 | |
| Concrete and mortar | |
| 12.8 | | |
| 6.6 | | |
| 20.3 | | |
| 10.7 | | |
| (2.7 | ) |
| Pavement | |
| (0.7 | ) | |
| (3.3 | ) | |
| - | | |
| - | | |
| - | |
| Precast | |
| (0.7 | ) | |
| (2.7 | ) | |
| (4.2 | ) | |
| (13.5 | ) | |
| 10.7 | |
| Total gross profit | |
| 687.7 | | |
| 37.2 | | |
| 647.3 | | |
| 33.0 | | |
| 4.2 | |
Gross profit margin for cement,
concrete, pavement, mortar, and precast segment increased by 4.2 percentage points in 2023 compared to 2022. This increase was due mainly
to an increase in cement margin (5.0 percentage points) mainly due to cost savings because of lower use of imported clinker and lower
costs of raw materials, as well as higher average prices.
Operating Income (Expenses)
Our operating expenses primarily
reflect administrative and selling and distribution expenses. In 2023, our operating expenses increased by S/55.2 million to S/351.9 million
from S/296.7 million in 2022, mainly due to the impairment of our vertical kilns, a slight increase in administrative and selling expenses,
and the expenses related to the reconstruction of La Niña road, explained below.
Administrative Expenses
The following table sets forth
the composition of our administrative expenses for 2023 and 2022:
| | |
Year ended December 31, | |
| (in millions of S/) | |
2023 | | |
2022 | |
| Personnel expenses | |
| 125.1 | | |
| 116.7 | |
| Third-part services | |
| 68.3 | | |
| 72.2 | |
| Board of directors compensation | |
| 6.8 | | |
| 6.1 | |
| Depreciation and amortization | |
| 18.0 | | |
| 16.7 | |
| Taxes | |
| 5.9 | | |
| 5.7 | |
| Other | |
| 10.6 | | |
| 10.2 | |
| Total | |
| 234.7 | | |
| 227.6 | |
Our administrative expenses
increased by 3.1%, or S/7.1 million, to S/234.7 million in 2023 from S/227.6 million in 2022. Personnel expenses increased by S/8.3 million
in line with increased inflation.
Administrative expenses related
to the cement, concrete, mortar and precast segment accounted for approximately 98.1% of total administrative expenses for 2023 remaining
in line with 2022. Administrative expenses related to the construction supplies and other segments accounted for approximately 1.1% and
0.8%, respectively, of total administrative expenses for 2023 compared to approximately 1.2%, and 0.7%, respectively, for 2022.
Selling and Distribution Expenses
The following table sets forth
the components of our selling and distribution expenses for 2023 and 2022:
| | |
Year ended December 31, | |
| (in millions of S/) | |
2023 | | |
2022 | |
| Personnel expenses | |
| 41.6 | | |
| 42.3 | |
| Advertising and promotion expenses | |
| 7.5 | | |
| 6.4 | |
| Other | |
| 17.7 | | |
| 16.5 | |
| Total | |
| 66.8 | | |
| 65.2 | |
Our total selling and distribution
expenses increased by 2.5%, or S/1.6 million, to S/ 66.8 million in 2023 from S/65.2 million in 2022, primarily due to increased advertising
expenses, as well as expenses related to the advancement of our digital strategy.
Selling and distribution expenses
related to the cement, concrete, mortar and precast segment represented approximately 98.1% of total selling and distribution expenses
for 2023 remaining in line with 2022. Selling and distribution expenses related to construction supplies and other segments represented
approximately 1.1% and 0.8% respectively, of total selling and distribution expenses for 2023, compared to 1.2% and 0.7%, respectively,
for 2022.
Other Operating (Expense) Income, Net
Our other operating income,
net decreased S/9.9 million, to a net expense of S/13.8 million in 2023 from a net expense of S/3.9 million in 2022, mainly due to the
expenses related to the reconstruction of La Niña road, which connects our main quarry and the Piura plant. During the first quarter
of 2023, rains interrupted our ability to use this road normally and we therefore invested in its reconstruction in order to normalize
transit between the quarry and our plant.
Impairment of Our Vertical
Kilns
At the end of 2023, the board
of directors, advised by management, recognized a specific impairment for the net value of the assets of the vertical clinker kilns located
at the Pacasmayo cement plant for a net cost of S/36,551,000. This deterioration estimate was carried out as a consequence of replacing
the old technology of these kilns due to the entry into operation of a new kiln in the Pacasmayo plant, which is more efficient and produces
fewer emissions. This amount was recorded in the impairment of property, plant and equipment item in the consolidated statement of profit
or loss.
Total Other Expenses,
Net
Our total other expenses,
net decreased by S/1.1 million, to S/91.8 million in 2023 from S/92.9 million in 2022.
Income Tax Expense
Our income tax expense decreased
by 10.3%, or S/8.8 million, to S/76.8 million for 2023 from S/85.6 million for 2022, mainly due to a decrease in profit before income
tax. Our effective tax rate for 2023 was 31.0% and 33.0% in 2022.
Profit for the Year
As a result of the foregoing, our profit for 2023
decreased by 4.5%, or S/7.9 million, from S/176.8 million for 2022 to S/168.9 million for 2023, mainly due to the S/.36.6 million impairment
of our vertical kilns.
For a comparison of our results of operations for
the year ended December 31, 2022, to the year ended December 31, 2021, please see our annual report on Form 20-F, filed on April 29, 2023.
Liquidity and Capital Resources
Our main cash requirements
are our operating expenses, capital expenditures relating to the maintenance and expansion of our facilities, the servicing of our debt,
the payment of dividends and payment of taxes. Our primary sources of cash have been cash flow from operating activities, and our issuance
of debt securities and, to a lesser extent, loans and other financings. We believe that these sources of cash will be sufficient to cover
our working capital needs in the ordinary course of our business.
Cash Flows
The table below sets forth
certain components of our cash flows for the years ended December 31, 2023, 2022 and 2021.
| | |
Year ended December 31, | |
| (in millions of S/) | |
2023 | | |
2022 | | |
2021 | |
| Net cash flows from operating activities | |
| 412.3 | | |
| 111.8 | | |
| 170.6 | |
| Net cash flows used in investing activities | |
| (289.4 | ) | |
| (176.2 | ) | |
| (91.8 | ) |
| Net cash flows used in financing activities | |
| (115.4 | ) | |
| (121.5 | ) | |
| (130.1 | ) |
| Increase (decrease) in cash | |
| 7.4 | | |
| (185.8 | ) | |
| (51.4 | ) |
Cash Flows from Operating Activities
Net cash flows from operating
activities increased by 268.8% or S/300.5 million, to S/412.3 million in 2023 from S/111.8 million in 2022, mainly due to a decrease in
inventory purchases, accounts payable and prepaid expenses.
Net cash flows from operating
activities decreased by 34.5%, or S/58.8 million, to S/111.8 million in 2022 from S/170.6 million in 2021, mainly due to high inventory
purchases and higher interest and tax payments as our results of operations and profits increased.
Cash Flows used in Investing Activities
Net cash flows used in investing
activities were S/289.4 million for 2023, as compared to S/176.2 million for 2022, and were primarily related to the construction of the
new kiln in our Pacasmayo plant.
Net cash flows used in investing
activities were S/176.2 million for 2022, as compared to S/91.8 million for 2021, and were primarily related to purchases of property,
plant and equipment for our cement plants.
Cash Flows used in Financing Activities
Net cash flows used in financing activities were
S/115.4 million for 2023, as compared to S/121.5 million for 2022 and were primarily due to dividends paid to our shareholders.
Net cash flows used in financing activities were
S/121.5 million for 2022, as compared to S/130.1 million for 2021 and were primarily due to dividends paid to our shareholders and a higher
payment of bank loans offset by a higher income from banks loans received in 2022.
Indebtedness
On February 8, 2023, we repaid
in full at scheduled maturity the outstanding US$131,612,000 aggregate principal amount of our 4.50% Senior Notes due 2023 using proceeds
from our “club deal” credit line described below, and we also settled the US$132,000,000 in related derivative financial instruments.
As of December 31, 2023, the
Company’s total outstanding debt reached S/1,573.0 million (equivalent to US$424.1 million).
| As of December 31, 2023 | |
Amount
(in millions of S/) | | |
Interest Rate | | |
Maturity Date |
| Mid-term promissory notes: | |
| | |
| | |
|
| Banco de Crédito del Perú | |
| 38.0 | | |
| 9.44 | % | |
January 22, 2024 |
| BBVA Perú | |
| 38.0 | | |
| 9.78 | % | |
January 19, 2024 |
| BBVA Perú | |
| 19.0 | | |
| 8.83 | % | |
March 15, 2024 |
| BBVA Perú | |
| 19.0 | | |
| 8.83 | % | |
March 15, 2024 |
| BBVA Perú | |
| 25.3 | | |
| 6.98 | % | |
December 12, 2024 |
| BBVA Perú | |
| 25.3 | | |
| 6.98 | % | |
December 12, 2024 |
| BBVA Perú | |
| 25.4 | | |
| 6.98 | % | |
December 12, 2024 |
| BBVA Perú | |
| 19.0 | | |
| 7.32 | % | |
November 22, 2024 |
| BBVA Perú | |
| 19.0 | | |
| 7.32 | % | |
November 22, 2024 |
| Club deal: | |
| | | |
| | | |
|
| Banco de Crédito del Perú | |
| 387.9 | | |
| 5.82 | % | |
December 1, 2028 |
| Scotiabank | |
| 387.9 | | |
| 5.82 | % | |
December 1, 2028 |
| Senior Notes due: | |
| | | |
| | | |
|
| 2029 | |
| 259.7 | | |
| 6.69 | % | |
February 1, 2029 |
| 2034 | |
| 309.5 | | |
| 6.84 | % | |
February 1, 2034 |
International Bonds.
In February 2013, we issued US$300,000,000 aggregate principal amount of our 4.50% Senior Notes due 2023 in our inaugural international
bond offering. A portion of the proceeds from this offering were used to prepay amounts outstanding on our secured loan agreement with
BBVA Banco Continental, and the remaining proceeds were used in capital expenditures incurred in connection with the construction and
operation of the new Piura plant and our cement business. The Senior Notes were issued pursuant to Rule 144A under the Securities Act
and in compliance with Regulation S under the Securities Act and listed on the Irish Stock Exchange.
The indenture pursuant to
which the Senior Notes were issued contains certain covenants, including restrictions on our and our restricted subsidiaries’ ability
to incur further indebtedness or issue disqualified stock and preferred stock, unless the following conditions are met:
| ● | the fixed charge coverage ratio for our most recently ended four fiscal quarters for which internal financial
statements are available immediately preceding the date on which such additional indebtedness is incurred or such disqualified stock or
such preferred stock is issued, as the case may be, would have been at least 2.5 to 1.0; and |
| ● | the consolidated debt to adjusted EBITDA ratio for our most recently ended four fiscal quarters for which
internal financial statements are available immediately preceding the date on which such additional indebtedness is incurred or such disqualified
stock or such preferred stock is issued, as the case may be, would have been no greater than 3.5 to 1.0, in each case, determined on a
pro forma basis (including a pro forma application of the net proceeds therefrom), as if the additional indebtedness had been incurred
or the disqualified stock or the preferred stock had been issued, as the case may be, at the beginning of such four fiscal quarters. |
The indenture also
contains restrictions on our ability and that of our restricted subsidiaries to incur liens and to merge, consolidate or transfer all
or substantially all of our assets.
In management’s opinion,
we were in compliance with all of applicable covenants under the indenture as of the date of this annual report.
The subsidiaries that guarantee
the Senior Notes are those related to our cement business namely, Cementos Selva S.A.C., Distribuidora Norte Pacasmayo S.R.L., Empresa
de Transmisión Guadalupe S.A.C., Dinoselva Iquitos S.A.C. and Calizas del Norte S.A.C. (liquidated during 2022).
In December 2018, we purchased
US$168,388,000, or approximately 56.13%, of the total outstanding Senior Notes by means of a partial cash tender offer using proceeds
from the issuance of debt securities in the local market.
In February 2023, the remaining
balance of the Senior Notes matured and were paid using proceeds from the issuance of the debt securities in the local market described
below.
Local Bonds. On January
8, 2019, the General Shareholders’ Meeting approved the issuance of a local bond program for up to S/1,000 million. On January 31,
2019, we issued two series of local bonds in the aggregate principal amount of S/570 million. One in the aggregate principal amount of
S/260 million bearing interest at a rate of 6.68750% for a term of 10 years, and the other in the aggregate principal amount of S/310
million bearing interest at a rate of 6.84375% for a term of 15 years. The rates and terms obtained benefit our financial costs structure,
with lower cost of capital, an extended maturity and less exposure to currency fluctuations.
Medium-term “Club
Deal” Corporate Loan. On August 6, 2021, we entered into a medium-term corporate loan in a “Club Deal” format with
Banco de Crédito del Perú S.A. and Scotiabank Perú S.A.A. The loan amounts to S/860,000,000 that allowed the payment
of all the financial obligations that the Company maintains with a maturity until February 2023. The loan includes a grace / availability
period of 18 months from August 6, 2021 and a payment term of seven years from the last disbursement in February 2023. The loan will
be paid in 22 equal quarterly installments and amounts due under it accrue interest an annual rate of 5.82 percent.
Under this loan, the Company must
comply with the following financial covenants:
| a. | maintain a debt ratio (Financial Debt / EBITDA) of no more
than 3.50 to 1; |
| b. | maintain a debt service coverage ratio (FCSD / SD) of at least
1.15 to 1; and |
| c. | maintain a debt service coverage ratio (EBITDA / SD) of at
least 1.50 to 1. |
In addition, the Company is
required to comply with certain customary restrictive and affirmative covenants. As of December 31, 2023 and 2022, the Company was in
compliance with the ratios and other obligations contained in the Club Deal.
Derivative Financial Instruments. In February
2023, we canceled the cross currency swaps when we paid all of the outstanding international bond in US dollars.
Short-term loans. As of December 31, 2023,
we had obtained nine loans, each in the amount of S/228,000,000, one with Banco de Crédito del Perú S.A. and eight with
BBVA Perú, for working capital. Each of these loans has a medium-term maturity and accrues interest at an effective annual rate
of between 6.98 and 9.78 percent.
During 2023, the net gain
generated by the exchange difference was approximately S/4,933,000 and, during 2022, the net loss from exchange difference amounted to
S/1,040,000 All these results are presented in the caption “Loss from exchange difference, net” of the consolidated statement
of profit and loss.
Capital Expenditures
See “Item 4—Information
on the Company—A. History and Development of the Company—Capital Expenditures.”
B. Research and Development, Patents and Licenses, Etc.
Since 2016, Pacasmayo embarked
on the path of innovation and digital transformation, a journey that has allowed us to explore new ways of doing things, interact with
environments with a lot of uncertainty, as well as propose a cultural change. After all this time and with much experience gained, we
were ready to rethink a new strategy, seeking to accelerate and extend the adoption of innovation and digital transformation initiatives
in all areas of the company, making it necessary to decentralize their execution.
Pacasmayo has become a company
that provides building solutions not only derived from cement, but that satisfy the needs of any actor in the construction sector. That
is why today Pacasmayo complements its product research capacity with research focused on people. In other words, knowing who the hardware
sellers, self-builders, construction foremen, transporters or construction residents really are, allows us to find new opportunities for
Pacasmayo.
C. Trend Information
Cement Market
The Peruvian Cement Market
Peru’s cement production
is segmented into three principal geographic regions: the northern region, the central region, including Lima’s metropolitan area,
and the southern region. The table below sets forth selected data with respect to each region in Peru and the corresponding cement manufacturers.
Market share data is based on metric tons of cement delivered during 2023.
Geographic Breakdown
Northern Region (thousands of metric tons)
| Plant | |
% share | | |
2023 | | |
2022 | | |
2021 | | |
2020 | | |
2019 | |
| Pacasmayo Group | |
| 23.9 | | |
| 2,951 | | |
| 3,437 | | |
| 3,614 | | |
| 2,576 | | |
| 2,615 | |
| Imports | |
| - | | |
| - | | |
| 2 | | |
| 40 | | |
| 38 | | |
| 13 | |
| Total | |
| 23.9 | | |
| 2,951 | | |
| 3,439 | | |
| 3,654 | | |
| 2,614 | | |
| 2,628 | |
Central Region (thousands of metric tons)
| Plant | |
% share | | |
2023 | | |
2022 | | |
2021 | | |
2020 | | |
2019 | |
| UNACEM | |
| 45.4 | | |
| 5,617 | | |
| 6,297 | | |
| 5,838 | | |
| 4,172 | | |
| 5,316 | |
| Caliza Inca | |
| 4.7 | | |
| 585 | | |
| 515 | | |
| 492 | | |
| 382 | | |
| 513 | |
| Imports | |
| 1.2 | | |
| 145 | | |
| 202 | | |
| 691 | | |
| 493 | | |
| 663 | |
| Total | |
| 51.3 | | |
| 6,347 | | |
| 7,014 | | |
| 7,021 | | |
| 5,047 | | |
| 6,492 | |
Southern Region (thousands of metric tons)
| Plant | |
% share | | |
2023 | | |
2022 | | |
2021 | | |
2020 | | |
2019 | |
| Grupo Yura | |
| 20.9 | | |
| 2,581 | | |
| 3,047 | | |
| 2,904 | | |
| 2,019 | | |
| 2,584 | |
| Imports | |
| 0.5 | | |
| 65 | | |
| 67 | | |
| 150 | | |
| 189 | | |
| 98 | |
| Total | |
| 21.4 | | |
| 2,646 | | |
| 3,114 | | |
| 3,054 | | |
| 2,208 | | |
| 2,682 | |
| Others | |
| 3.4 | | |
| 423 | | |
| 427 | | |
| 877 | | |
| 732 | | |
| 769 | |
| Total Regions | |
| 100.00 | | |
| 12,367 | | |
| 13,994 | | |
| 14,606 | | |
| 10,601 | | |
| 12,571 | |
Sources: ASOCEM,
INEI, ADUANET (SUNAT).
Although a large part of housing
construction is mainly concentrated in the Lima metropolitan area, located in the central region of Peru, the housing market in the provinces
of Peru, including the northern region, has grown significantly in recent years. Despite this trend, Peru continues to have significant
shortages in housing, estimated by the INEI at 1.9 million homes nationwide. Economic growth, particularly in the mining and agribusiness
sectors, rising employment levels and the implementation of real estate projects, resulted in the creation of higher paying jobs, which
ultimately resulted in the expansion of the housing market. However, the COVID-19 pandemic took a toll on it and, in 2020, poverty levels
increased 9.9 percentage points. Fortunately, poverty levels for 2021, which is the last available data, decreased by 4.2 percentage points,
reaching 25.9%.
Peru continues to have a significant
deficit in infrastructure. In recent years, significant efforts have been made to channel investments into the infrastructure sector through
a series of initiatives that range from the creation of financial instruments (such as the infrastructure investment and trust funds)
to regulatory changes, to promotion of more public private partnerships (for example “taxes for infrastructure” which allows
private companies to use part of their tax payments to directly finance infrastructure works) to allowing for other executors, such as
the government to government agreements that have recently been signed by Peru and other governments to ensure promptly execution without
corruption.
Distribution and Logistics
Peru’s cement market
is divided into three regions circumscribed primarily by the location of established production facilities. Our facilities are located
in the northern region of Peru, UNACEM is the main producer in the central region, and Yura in the southern region. Cement is mainly sold
in bags of 42.5 kilograms (approximately 94 pounds). However, cement can also be sold in bulk according to customer requirements.
The transportation and storage
of cement requires specialized equipment. A favorable location of the production facilities not only reduces the time required to transport
cement products to distributors and third-party merchants but also diminishes the costs of necessary equipment and resources. The location
of a cement plant relative to its distribution network provides operational efficiencies and advantages that translate into stronger market
share.
Cement can be stored in silos
for up to 12 months if the silo is completely humidity proof. The typical vehicles used for the transport of cement are adapted to maintain
the necessary environment during shipment. The proximity of production plants and storage centers to distribution centers, third-party
vendors and retail outlets, creates a more efficient supply chain and minimizes the time and resources required to transport products
from the production line to the construction site. The streamlined nature of this process ensures that cement products in the northern
region of Peru, for example, reach customers within approximately one week of production. A cement company’s success is inherently
linked to the sophistication of its distribution network and its emphasis on quality assurance throughout the supply chain.
Competitive Dynamics
The Peruvian cement market
is comprised basically of three groups and 2 other plants:
| ● | Cementos Pacasmayo and Cementos Selva, which principally serve the northern region; |
| ● | UNACEM, which principally serves the central region; |
| ● | Cementos Yura, which primarily serve the southern region; |
| ● | Caliza Cemento Inca, located in Cajamarquilla, Lima which principally serves the central region as well
as other regions throughout the country; and |
| ● | Mixercon, located in the city of Lima, mainly serves this city, and to a lesser extent some provinces
of the country. |
Additionally, there are cement
importers, according to the ADUANET, that mainly supply the cities of Lima and, to a lesser extent, other provinces of the country.
The level of competitiveness
of cement companies generally depends on their cost structure, which is a function of the cost of energy, fuel, costs of raw materials
and transportation. Cement companies in Peru generally compete within the limits of their distribution market, which is determined principally
by their geographic locations.
The following are the main
characteristics of the cement sector in Peru:
| ● | highly fragmented consumer base; |
| ● | relatively low cost of energy and raw materials; |
| ● | operations and distribution primarily determined by geographic location; and |
| ● | high correlation to auto-construcción and public and private investments. |
D. Critical Accounting Estimates
Our consolidated financial statements are prepared in conformity with
IFRS, as issued by the IASB. See note 3 to our consolidated financial statements included in this annual report.
ITEM 6. DIRECTORS, SENIOR MANAGEMENT AND EMPLOYEES
A. Directors and Senior Management
General
Our business and affairs are
managed by the board of directors in accordance with our by-laws and Peruvian Corporate Law No. 26887 (“Peruvian Corporate Law”).
Our by-laws provide for a board of directors of between seven and eleven members. Between three and five alternate directors may be elected
by the shareholders to act on behalf of any director who is absent from meetings or who is unable to exercise his or her duties, when
and for whatever period fixed by the chairman of the board. Alternate directors have the same responsibilities, duties and powers of directors
to the extent they are called to replace them.
Directors are elected at a
shareholders’ meeting and hold office for three years. Directors may be elected to multiple terms. Our current board of directors
is composed of seven directors. In the first board meeting held after the annual shareholders’ meeting where members of the board
are elected, the board of directors must elect among its members a chairman and a vice chairman.
The board of directors typically
meets in regularly scheduled bi-monthly meetings and when called by the chairman of the board or a person representing the chairman. Resolutions
must be adopted by a majority of the directors present at the meeting and the chairman is entitled to cast the deciding vote in the event
of a tie.
Duties and Liabilities of Directors
Pursuant to Article 177 of
Peruvian Corporate Law, directors are jointly and severally liable to a corporation, shareholders and third parties for any damages caused
by abuse of power, fraud, willful misconduct or gross negligence. In addition, pursuant to Article 3 of Law No. 29720, as of June 26,
2011, directors of companies listed on the Lima Stock Exchange are also strictly liable for any damages caused as a result of any transactions
in which they were involved and which resulted in damages or other losses to the corporation. A director cannot be found liable if the
director expressed disagreement at the time the vote was cast or upon learning of such transaction and if there is a record expressing
such opposition.
Our by-laws prohibit a director
from voting on matters in which such director has an interest. In addition, Article 180 of the Peruvian Corporate Law requires a director
with a conflicting interest on a specific matter to disclose such interest and abstain from the deliberation and decision-making process
with respect to such matter. A director who violates this requirement is liable for any damages caused to us and may be removed by a majority
of the board of directors upon request of any member of the board or by a majority vote of the shareholders.
Our by-laws stipulate that
Directors’ compensation is determined by the Mandatory Annual General Shareholders’ Meeting at the time it reviews our annual
audited financial statements. The fixed portion of the Chairman’s compensation shall be twice the amount allocated to any other
director. If directors are part of one or more Committees, their compensation may include an additional amount for the work performed
as members of such Committees. The additional compensation of the directors may not exceed the aggregate fixed portion of the compensation
that the directors are entitled to receive. Our by-laws do not restrict Directors from voting upon matters relating to their own compensation.
Our by-laws do not prohibit
our directors from borrowing from us. However, Article 179 of the Peruvian Corporate Law provides that directors of a company may enter
into an agreement with such company only if the related loan agreement relates to operations the company performs in the regular course
of business and in an arms’-length transaction. Further, a company may provide a loan to a director or grant securities in such
director’s favor only in connection with operations that the company usually performs with third parties. Agreements, credits, loans
or guarantees that do not meet the requirements set forth above require prior approval from at least two thirds of the members of the
Company’s Board of Directors. Directors are jointly liable to the company and the Company’s creditors for contracts, credit,
loans or securities executed or granted without complying with Article 179 of the Peruvian Corporate Law.
Neither our by-laws nor Peruvian
Corporate Law contain age limit requirements for the retirement or non-retirement of directors.
Board of Directors
The following sets forth our
directors and their respective positions as of December 31, 2023.
| Name | |
Position | |
Year of Birth |
| Eduardo Hochschild Beeck | |
Chairman of the Board | |
1963 |
| José Raimundo Morales Dasso | |
Vice Chairman of the Board | |
1946 |
| Ana María Botella Serrano | |
Independent Director | |
1953 |
| Esteban Chong León | |
Independent Director | |
1958 |
| Ana Sofía Hochschild | |
Director | |
1998 |
| Venkat Krishnamurthy | |
Independent Director | |
1971 |
| Humberto Nadal Del Carpio | |
Director, Chief Executive Officer | |
1964 |
The following sets forth selected
biographical information for each of the members of our board of directors. The average tenure of board members is 10.42 years. The business
address of each of our current directors is Calle La Colonia 150, Urb. El Vivero, Surco, Lima, Peru.
Eduardo Hochschild Beeck. Mr. Hochschild
has been a Director since April 1991 and is currently Chairman of the Board of Directors. He is a Mechanical Engineer from Tufts University,
Boston, United States. Mr. Hochschild is also Chairman of Hochschild Mining plc, Aclara Resources Inc., ASPI. and the Board of Directors
of UTEC and TECSUP and is an expert advisor to the Economic Council of the Episcopal Conference.
José Raimundo Morales
Dasso. Mr. Morales has been a Director since March 2008. He holds a degree in Economics and Administration from the Universidad del
Pacífico, and a Master’s degree in Business Administration from the Wharton Graduate School of Finance from the University
of Pennsylvania, United States. Between 1970 and 1989 he held various positions at Bank of America and Wells Fargo Bank. He joined Banco
de Credito del Peru in 1980 and held senior management positions. He was CEO of BCP from October 1990 to April 2008. He is currently Vice
Chairman of the Board of Directors of Credicorp LTD., Banco de Crédito del Perú S.A. and Pacífico Cía. Seguros
y Reaseguros. He is also a member of the Board of Directors of Grupo Crédito, Atlantic Security Holding Corporation, and Fosfatos
del Pacífico S.A.
Ana María Botella Serrano. Mrs.
Botella has been a Director since July 9, 2020. Previously, she was Alternate Director from September 1, 2019 to July 9, 2020. She holds
a degree in Law from the Complutense University of Madrid and belongs by competitive examination to the Senior Corps of Civil Administrators
of the Spanish State. As a civil servant she has worked in the Ministry of the Interior, the Civil Government of La Rioja, the Ministry
of Public Works, the Treasury Delegation of Valladolid and the Ministry of Finance. In 2003 she was elected Councilor of the City Council
of Madrid, has been Second Deputy Mayor and has held the Government Delegations of Employment and Social Services and Environment and
Mobility. In December 2011 she was sworn in as Mayor of Madrid City Council, a position she held until June 2015. She is currently Executive
President of the Integra Foundation and Program Director of the Atlantic Institute of Government.
Esteban Chong Leon.
Mr. Chong has been a Director since March 24, 2023. Mr. Chong holds a Bachelor’s degree in Accounting from Universidad del Pacífico
and a Master’s in Business Administration from the University of Pittsburgh (United States). He holds a diploma in International
Financial Reporting Standards from The Association of Chartered Certified Accountants (United Kingdom) and in Corporate Governance of
Board of Directors from Northwestern University – Kellogg School of Management (United States). He is the Head Professor, Head
of the Accounting Department, and President of the Admission Council at the Universidad del Pacífico. He is a retired partner
at PricewaterhouseCoopers Peru with more than 36 years of professional experience, 20 of them as a partner. He held various positions
at PricewaterhouseCoopers including Territory Senior Partner for Peru and Bolivia, Head of Assurance for Peru, partner in charge of Risk
Management, Member of the Regional Executive Committee and Representative to the Regional Board (Theater Oversight Board), where he was
Chairman of the Admissions Committee. He is currently a Director of Inmobiliaria Los Alerces, KR Comercial and KR Proyectos and is a
member of the Audit, Risk and Finance Committee of CGIAR (formerly Consultative Group on International Agricultural Research).
Ana Sofia Hochschild Correa.
Ms. Hochschild has been a Director since March 24, 2023. She holds a bachelor’s degree in Psychology from IE University in Madrid,
with a special focus on organizational psychology and knowledge in digital transformation. She has worked at Sony, Ernst & Young,
Voxel School and XR Ventures. She is director of Voxel School. L.S. and participates in other initiatives linked to education. She is
currently pursuing a Master’s Degree at Harvard University, participating in the Education Leadership, Organizations, and Entrepreneurship
program.
Venkat
Krishnamurthy. Mr. Krishnamurthy has been a Director since July 9, 2020. He holds a Bachelor of Science from the Indian Institute
of Technology in Kanpur, where he received the Presidential Gold Medal and a PhD in Computer Science from Stanford University. Mr. Krishnamurthy
is a serial entrepreneur, who has created disruptive business and technology breakthroughs in Computer Graphics, Enterprise Software,
Social Networks, Internet Marketing, IOT, CAD, Laser Scanning, Manufacturing, Metrology, Orthodontics, EAS/Security and Supply Chain.
He is currently co-founder at Alignable, North America’s largest network for small and medium businesses and Gita Krishnamurthy
Vidyalaya, a free school for under-privileged children in South India, as well as board member at privately held internet travel business
Grand Circle Corporation. He is an Academy Award winner for Technical Achievement (2001) for pioneering inventions in the area of animation-ready
higher order (polynomial) surface reconstruction from 3-D scanners. Previously, he co-founded Invisalign, Paraform/Metris, now Nikon
Metrology, CTO at OATSystems, now Checkpoint’s RFID/IOT division and Instructor at MIT Professional Education on Radical Innovation.
Humberto Nadal Del Carpio. Mr. Nadal joined the Company as Corporate Development Manager in June 2007, has been a Director since March
2008 and CEO since April 2011. He is an economist graduated from Universidad del Pacífico and has an MBA from Georgetown University.
He is also CEO of ASPI, Fosfatos del Pacífico and FOSSAL. He is currently Vice Chairman of Ferreycorp S.A.A. and Ferreyros S.A.
since August 2020, and independent member of the Board of Directors of Ferreycorp S.A.A. and Ferreyros S.A. since March 2017. Director
of the Asociación de Productores de Cemento (Asocem); and former president and current member of the Board of Trustees of Universidad
del Pacífico. He is a director of the GCCA, a global association that brings together most of the world’s cement producing
companies. He is director of FICEM, an association of cement producers in Latin America that comprises 80% of the companies in the region.
He is a member of the Advisory Board of the Faculty of Humanities, Arts and Social Sciences of the Universidad de Ingeniería y
Tecnología (UTEC). Previously, he was Chairman of the Board of Directors of Fondo Mi Vivienda. Member of the G-50 group.
Executive Officers
Our executive officers oversee
our business and are responsible for the execution of the decisions of the board of directors. The following table presents information
concerning the current executive officers of the company and their respective positions:
| Name | |
Position | |
Year of
Birth | |
Year of
Appointment |
| Humberto Nadal Del Carpio | |
Chief Executive Officer | |
1964 | |
2008 |
| Manuel Bartolomé Ferreyros Peña | |
Chief Financial Officer | |
1966 | |
2008 |
| Jorge Javier Durand Planas | |
Legal Vice – President/General Counsel | |
1966 | |
2008 |
| Carlos Julio Pomarino Pezzia (1) | |
Vice – President of the Cement Business | |
1962 | |
2009 |
| Diego Arispe Silva | |
Corporate Social Responsibility Managing Director | |
1981 | |
2021 |
| Aldo Bertoli Estrella | |
Commercial Managing Director | |
1969 | |
2016 |
| Ibrahim Chahuan Riveros | |
Buildings Solutions Managing Director | |
1988 | |
2021 |
| Ely Hayashi Hirahoka | |
Finance Managing Director, Management Control and Asset Management Director | |
1982 | |
2021 |
| Tito Alberto Inope Mantero | |
Corporate Excellence Managing Director | |
1972 | |
2015 |
| Diego Reyes Pazos | |
Supply Chain, Administration and Risks Managing Director. | |
1977 | |
2013 |
| Hugo Villanueva Castillo (2) | |
Operations Managing Director | |
1962 | |
2012 |
| Inés Roggero | |
Innovation and Digital Transformation and Data and Analytics Managing Director | |
1981 | |
2022 |
| Julio Oropeza Reyes (2) | |
Operations Managing Director | |
1978 | |
2022 |
| (1) | Mr. Pomarino retired on December 31, 2023. |
| (2) | During 2023, Mr. Villanueva and Mr. Oropeza shared the role of Operations
Managing Director, withMr. Oropeza fully replacing him during the month of December 2023 |
The following sets forth selected
biographical information for each of our executive officers:
See the information set forth
under “Board of Directors” for biographical information for Mr. Nadal.
Manuel Bartolomé
Ferreyros Peña. Mr. Ferreyros has been Chief Financial Officer since January 2008. He was Alternate Director from March 2008
until July 9, 2020. He is a member of the Board of Directors of Fosfatos del Pacífico S.A. and FOSSAL S.A.A. Mr. Ferreyros has
a bachelor’s degree in business administration from the Universidad de Lima, a multinational MBA from the Adolfo Ibáñez
School of Management, Miami and an MBA from the College of Insurance in New York. Mr. Ferreyros has participated in the Senior Management
Program of the Central American Institute of Business Administration (INCAE) and in the CEO’s Management Program at the Kellogg
School of Management, among others. Before joining the Company, Mr. Ferreyros was CEO at La Positiva Seguros y Reaseguros. Distinguished
among the three best CFOs in the construction industry in Latin America by Institutional Investor magazine between 2014 and 2023.
Jorge Javier Durand Planas.
Mr. Durand joined the Hochschild Group in 1994 and has been the General Counsel and Legal Vice President of the Company since 2008. Previously,
he was Legal Vice President of Hochschild Mining plc. He is a lawyer graduated from the Universidad de Lima and a Master of Business Administration
from the Universidad del Pacífico. Among other studies, he participated in the Management Program for Lawyers and in the Corporate
Governance and Performance Program of the Yale School of Management (United States), in the Strategic Negotiations Program of Harvard
Business School (United States) and in the Prince of Wales Business & Sustainability Program of the University of Cambridge Institute
for Sustainability Leadership (United Kingdom). Currently, Mr. Durand is a member of the Board of Directors of ASPI, UTEC and TECSUP.
He is also a member of the Board of Directors of Fosfatos del Pacífico S.A. since March 30, 2021 and of FOSSAL since March 24,
2023.
Carlos Julio Pomarino
Pezzia. Mr. Pomarino was Vice - President of the Cement Business from July 2017 until December 2023. He has a Bachelor’s degree
in Economic Engineering from the Universidad Nacional De Ingenieria and an MBA from the Adolfo Ibáñez Business School and
ESAN. In addition, he has participated in the Senior Management Program (PAD) of the Universidad de Piura and completed the Certification
of independent Board members at Centrum Católica. He was Vice President of the Cement Business from 2012 to 2017, Deputy General
Manager from 2009 to 2012, Commercial Manager of the Company from 2002 to 2009 and General Manager of Distribuidora Norte Pacasmayo S.R.L.
from 1998 to 2009. Before joining the Company, Mr. Pomarino worked as Administration and Finance Manager at Comercializadora de Alimentos
S.A. and as Head of Finance at the Fabrica de Tejidos San Jacinto S.A.
Diego Arispe Silva.
Mr. Arispe has been the Corporate Social Responsibility Managing Director since June 2019 and of Corporate Social Responsibility since
January 2022. He holds a law degree from the Pontificia Universidad Católica del Perú (PUCP) and a MBA from Columbia Business
School (United States). He has worked at the company for more than 15 years, having held various positions in the areas of Human Management,
Social Responsibility, and Legal, and was part of the team in charge of the implementation of our cement plant in Piura, as Project Controller.
Aldo Bertoli Estrella.
Mr. Bertoli has been the Commercial Managing Director since May 2016. He holds a degree in Business Administration from the Universidad
del Pacífico and a master’s degree in Business Administration from the Universidad de Piura. Before joining our company, Mr. Bertoli
worked for five years as Peru-Ecuador-Bolivia Sales Manager at Pepsico Inc. Previously, he spent 12 years at Procter & Gamble in various
commercial positions, including four years in Bolivia as Country Manager.
Ibrahim Chahuan Riveros.
Mr. Chahuan has been Buildings Solutions Managing Director since January 2022. He holds a bachelor’s degree in Business Administration
from Universidad del Pacífico and an Executive MBA from Northwestern University - Kellogg School of Management. Mr. Chahuan has
11 years of experience with Cementos Pacasmayo, having held various positions mainly in the marketing, finance and operations. He participated
in key corporate finance projects for the development of the company, such as the issuance of bonds in the international capital markets
and for nearly seven years he has been in charge of promoting and developing building solutions.
Ely Hayashi Hirahoka.
Ms. Hayashi has been the Finance Managing Director, Management Control and Asset Management Director since January 2022. She holds a Bachelor’s
degree in Business Administration from Universidad del Pacífico and a Master’s degree in Business Administration (MBA) from IE
Business School in Madrid, Spain. Ms. Hayashi joined Cementos Pacasmayo in 2006 and has held various positions in operational and financial
areas throughout her more than 15 years with the company.
Tito Alberto Inope Mantero.
Mr. Inope has been Corporate Excellence Managing Director since January 2022. Previously, he held the position of Construction Solutions
Managing Director. He holds a degree in economics from the Universidad de Lima and holds a Master’s degree in Business Administration
(MBA) from the Universidad de Ciencias Aplicadas (UPC), as well as the Programa de Alta Dirección (PAD). Mr. Inope joined Cementos
Pacasmayo in 1996 and has held various management positions in Operations, Projects and Planning during his 27 years with the company.
Diego Reyes Pazos.
Mr. Reyes has served as Supply Chain Manager since 2013 and subsequently assumed also the management of Administration and Risks. He has
solid experience in supply chain, project development, system/process design and implementation, and financial analysis. He holds a bachelor’s
degree in Business Administration from the Universidad de Lima and a master’s degree in Business Administration from the Universidad
de Piura. Before joining the company, Mr. Reyes worked as Operations and Finance Manager at Belcorp, as senior business process expert
for Latin America at SAB Miller, Project Manager in the Supply Chain Vice-Presidency at UCP Backus & Johnston, among others.
Hugo Pedro Villanueva Castillo. Mr.
Villanueva was the Operations Managing Director from January 2012 until December 2023. Previously, he served as the Operations Manager
at Cementos Selva for more than nine years. He worked at the company for more than 22 years and held various positions in the areas of
quality, production and operations. He has a bachelor’s degree in chemical engineering from the Universidad Mayor de San Marcos.
He holds an MBA from Tecnológico de Monterrey, Mexico, has participated in the General Management Program of the PAD of Universidad
de Piura and in the Senior Management Program of INCAE in Costa Rica. Additionally, he has completed various industry specialization programs.
Inés Roggero Cilloniz. Ms.
Roggero has been the Innovation and Digital Transformation Managing Director since June 2022. In January 2023 she was assigned the leadership
of the Data and Analytics tribe. Before joining the company, she was the Corporate Innovation Manager at Alicorp, where she was in charge
of identifying process improvement initiatives, new analog and digital products. In addition, Ms. Roggero has more than 17 years of experience
in mass marketing in companies such as Johnson & Johnson and Coca-Cola company. During this time, she has won more than 10 marketing
awards and has successfully launched more than 10 new products on the market. She holds a Master’s degree in Design Management from
IED Barcelona.
Julio Oropeza Reyes.
Mr. Oropeza has been the Operations Managing Director since November 2022. He is also in charge of the company’s Climate Change and R&D
Committees. He has 24 years of experience in the cement industry, holding different positions and functions in Venezuela, Ecuador, Chile,
Argentina and Peru. His areas of expertise include: production, process optimization, quality control, KPI and cost optimization, high
performance team building, environmental management, safety, innovation, project development and plant management. He holds a degree in
Chemical Engineering from Universidad Nacional Experimental Francisco de Miranda (Venezuela, 2002), certified as Process Engineer (Holcim,
2012) and an MBA in Integrated Management System: Quality, Environment and Safety from Universidad de Viña del Mar (Chile, 2015).
B. Compensation
As of December 31, 2023, the
total short-term compensation paid to our executive officers amounted to S/28,922,000 (2022: S/26,066,000 and 2021: S/22,678,000) and
the total long-term compensation paid to our executive officers amounted to S/7,632,000 (2022: S/8,272,000 and 2021: S/9,763,000). There
were no post-employment or contract termination benefits or share-payments.
Since 2011, and still current, we have paid each of our directors a
yearly compensation of US$200,000 (US$400,000 in the case of our Chairman). In addition, compensation paid to certain of our directors
for serving on board committees will be, in aggregate per year, not higher than the total amount paid to our directors for serving on
our board of directors. Our 2023 director compensation was approved at our annual shareholders’ meeting.
Neither we nor any of our
subsidiaries have entered into any agreement that provides for any benefit or compensation to any director or executive officer after
expiration of his or her term.
Executive Compensation Plan
Our business operates in a
competitive environment where highly trained professionals and executives are in demand. Continued expansion of the Peruvian economy over
the past several years has created new opportunities resulting in additional competition for local talent. As a result, we have in place
compensation plan to retain our key executives and attract new executives with the skills and experience required to achieve our strategic
objectives and create long-term value for our shareholders. We believe that executive compensation should reward individual performance
and the achievement of our strategic objectives.
Our executive compensation
plan has been designed to achieve the following primary objectives:
| ● | recruit, retain and incentivize highly talented and dedicated executives with the skills and experience
required to manage and operate our business and create long-term value for our shareholders; |
| ● | provide our executive officers with compensation opportunities that are fair, reasonable and competitive
in the market; |
| ● | compensate based on our performance and individual performance; |
| ● | promote transparency by using clear and straightforward compensation metrics; and |
| ● | align the interests of our executive officers with the interests of our shareholders, both in the short-term
and long-term. |
Our executive compensation
plan is in addition to workers’ profit sharing requirements applicable to all of our employees, including our executive officers,
under Peruvian labor laws.
Our compensation plan has
been designed to compensate our executives through a combination of base salary, a cash bonus incentive and other benefits that we believe
are fair and equitable to us and our shareholders and competitive in the market. We believe that the combination of salary, cash bonus
incentive and other benefits help distinguish us from other companies in the cement industry in Peru and serve as an important retention
tool as we compete for executive talent. We also believe that it will provide an appropriate compensation structure to retain our executives,
reward them for individual performance, and induce them to contribute to the creation of long-term value. For more information about our
Compensation Plan please see note 19 to our consolidated financial statements included in this annual report.
Components of Executive Compensation
The key components of our
executive compensation plan are:
| ● | short-term cash bonus incentives; and |
| ● | long-term cash bonus incentives. |
We believe that the use of
few and straightforward compensation components promotes the effectiveness and transparency of our executive compensation plan and enables
us to be competitive. No formula or specific weightings or relationships are used to allocate the various components in our executive
compensation plan. Each component has an important role in implementing our executive compensation philosophy and in meeting the executive
compensation objectives described above.
Base Salary
We compensate our executive
officers and other employees with a base salary to compensate them for services rendered on a day-to-day basis during the fiscal year.
Base salaries provide stable compensation to executives, allow us to recruit and retain highly talented and dedicated executives and,
through periodic merit increases, provide a basis upon which executives may be rewarded for individual performance.
Short-Term Cash Bonus Incentives
As a key component of our
compensation plan, we currently provide our executive officers the opportunity to earn annual cash bonuses based on the achievement of
our short-term business objectives. As additional cash compensation that is contingent on achieving our business objectives, cash incentives
augment the base salary component while being tied directly to corporate and individual performance objectives.
Long-Term Cash Bonus Incentives
In addition, as a tool to
promote retention of our executive officers, we have implemented a deferred cash incentive program that we believe aligns compensation
with corporate performance, allows us to recruit and retain competent executive talent, and rewards for superior performance measured
over the long-term. Our plan provides for the payment of bonuses in addition to the annual bonuses that are paid to our executive officers.
Our long-term bonus incentive
program features the following key components:
| ● | available to senior executives who have been employed by our company at this level for at least four years; |
| ● | at the end of each year, the cash bonus will be accrued in a “personal virtual account” for
the benefit of the relevant executive; |
| ● | at the beginning of the sixth year the relevant executive will receive the amount accrued during the first
four years; |
| ● | additional annual bonuses will be accrued for the following four years and a final payout will be made
at the end of the eighth year from the creation or beginning of the plan; and |
| ● | if the employee decides to voluntarily leave the company before a scheduled distribution, he will not
receive this compensation. |
Our plan provides that the
executive must meet the following eligibility criteria:
| ● | must be no older than 58 years at the time his or her participation in the incentive program begins; |
| ● | must have at least four years as senior executives with either our company, or our subsidiaries or affiliates; |
| ● | is a professional who is deemed to have characteristics that are attractive to the market; and |
| ● | the executive’s departure is deemed by the board of directors or a committee thereof to have an
adverse effect on our performance. |
C. Board Practices
For information about the
date of expiration of the current term of office and the period during which each director has served in such office, see “Item
6. Directors, Senior Management and Employees—A. Directors and Senior Management.”
Benefits upon Termination of Employment
There are no contracts providing
for benefits to directors upon termination of employment.
Board Committees
We have four board committees
composed by members of our board of directors, which are described below. The members of these committees were elected at the Board meeting
held on April 17, 2023, for a three-year period.
Executive Committee
Our by-laws permit us to delegate
an executive committee composed of three to five members of the board of directors. Mr. Eduardo Hochschild Beeck (chairman), Mr. Raimundo
Morales Dasso and Mr. Humberto Nadal del Carpio are currently members of our executive committee. Our executive committee is mainly
responsible for (i) supervising and supporting our management in executing the resolutions passed by our board of directors, (ii) executing
the strategy approved by our board of directors, (iii) meeting short-term and medium-term goals, as well as designing action plans to
meet such goals in accordance with the long-term strategy and goals approved by our board of directors, (iv) approving agreements or transactions
involving amounts greater than US$3 million but less than US$20 million, (v) monitoring compliance with the annual budget and approving
any significant deviations from approved levels of working capital, (vi) making strategic decisions that do not rise to the level of a
full board approval, and (vii) approving and executing new projects in amounts up to US$20 million.
Our executive committee also
performs the functions of a compensation committee.
Antitrust Best Practices Committee
The antitrust best practices
committee is composed of three members: Mr. Raimundo Morales Dasso, Mr. Humberto Nadal del Carpio and Mr. Eduardo Hochschild
Beeck. The antitrust best practices committee is responsible for informing our employees about our competition best practices and for
monitoring compliance with such practices, including compliance with antitrust regulations.
Audit Committee
Our audit committee is composed
of three directors: Mr. Esteban Chong Leon, who is the chairman of the audit committee, Mr. Venkat Krishnamurthy and Mrs. Ana
María Botella Serrano. All of the members of the audit committee qualify as independent in accordance with the SEC rules applicable
to foreign private issuers Mr. Esteban Chong Leon also qualifies as a financial expert under SEC rules. The audit committee is responsible
for (i) reviewing our financial statements; (ii) evaluating our internal controls and procedures, and identifying deficiencies; (iii)
the appointment, compensation, retention; and (iv) oversight of our external auditors. Additionally, it is responsible for informing our
board of directors regarding any issues that arise with respect to the quality or integrity of our financial statements, our compliance
with legal or regulatory requirements, the performance and independence of the external auditors, or the performance of the internal audit
function; and overseeing measures adopted as a result of any observations made by our shareholders, directors, executive officers, employees
or any third parties with respect to accounting, internal controls and internal and external audit, as well as any complaints regarding
management irregularities, including anonymous and confidential methods for addressing concerns raised by employees.
Sustainability and Good Corporate Governance Committee
Our sustainability and good
corporate governance committee is composed of three directors. The current members are Mr. Eduardo Hochschild Beeck (chairman), Mr. Raimundo
Morales Dasso and Mr. Humberto Nadal del Carpio. The Sustainability and Good Corporate Governance Committee is responsible for assisting
the Board in its role of proposing and overseeing Sustainability measures, as well as overseeing Director nomination and Committee assignments,
and Board and CEO successions. Similarly, it is responsible for assisting in the implementation of committee and Board self-assessment
surveys and the review of governance principles.
D. Employees
As of December 31, 2023, we
had a total of 1,772 permanent employees. The following table sets forth a breakdown of our employees by category as of the periods indicated.
| | |
As of December 31, | |
| | |
2023 | | |
2022 | | |
2021 | |
| Senior Management | |
| 50 | | |
| 46 | | |
| 39 | |
| Administrative personnel | |
| 988 | | |
| 993 | | |
| 944 | |
| Plant workers (cement) | |
| 331 | | |
| 324 | | |
| 319 | |
| Plant workers (concrete) | |
| 403 | | |
| 350 | | |
| 390 | |
| Total(1) | |
| 1,772 | | |
| 1,713 | | |
| 1,692 | |
| (1) | Workers from our social venture Acuícola Los Paiches
S.A.C. are excluded from these calculations. |
As of December 31, 2023, approximately
22.2% of our employees were members of labor unions (Sindicato Único de Trabajadores de Cementos Pacasmayo S.A.A, Sindicato
de Trabajadores de Distribuidora Norte Pacamasyo S.R.L, Sindicato Único de Trabajadores de la Empresa Distribuidora Norte Pacasmayo
S.R.L.-Dino) that represents its members in collective bargaining negotiations. Our management and administrative personnel are not
members of a labor union. Labor relations for unionized and non-unionized employees in our production facilities, including compensation
and benefits, are governed by a collective bargaining agreement that is renewed annually. In May 2022, three-year Union Agreements were
signed with our largest union.
Under Peruvian law, it is
illegal to lay off employees without cause or without following certain formal procedures. In addition, employees who are laid off are
entitled to severance payments upon termination of their employment in an amount equal to one and a half month’s salary for each
full year of work performed with a maximum payment equal to 12 monthly salaries provided they are indefinite term employees. In case of
fixed term employment relationship the severance payment is equal to 1.5 monthly salaries for each month, until the completion of the
contract, with a maximum of 12 monthly salaries.
Our employees are enrolled
in either the national public pension fund or a privately managed pension fund. In both cases the applicable payment (approximately 13%)
is withheld by the employer from the employees’ monthly salary. As of December 31, 2023, approximately 9.7% of our employees were
enrolled with the national public pension fund and 89.5% with a private social pension plan.
We seek to build a company with a high level of engagement with collaborators,
with the aim of achieving a sense of belonging for our people and, therefore, their happiness in the organization. Our engagement strategy
seeks to measure the following components:
| ● | Engagement - It measures the employee’s strong connection with their work (a psychological state of energy,
dedication and total involvement in their work). |
| ● | Leadership - It measures the leadership style adapted to the individual needs of its employees and that
focuses on helping them grow and succeed. |
This involvement and identification
will allow us to consolidate ourselves as a committed team, that shares the same objectives and values, that co-creates the success of
the company and at the same time focuses on growing and improving their personal well-being. The resources we use for our engagement strategy
consist of two large measurements that are carried out in July and November, which are complemented with periodic measurements (pulses)
to know the feeling and think about a specific dimension and/or situation. Our goal for 2023 was to have an Engagement Index of 85.70%,
and thanks to the joint work of leaders, promoters and teams in general, we achieved an index of 86.40%.
We believe we have a good
relationship with our employees. In the past, we have not experienced any material strikes, work stoppages or any other significant disruptions.
E. Share Ownership
As of March 31, 2024, persons
who are currently members of our board of directors and our executive officers held as a group 1,426,553 of our common shares and no investment
shares (not including common shares held by Mr. Eduardo Hochschild through ASPI). This amount represented less than 1% of our outstanding
share capital as of March 31, 2024. Mr. Eduardo Hochschild through ASPI indirectly controlled 211,985,547 common shares, representing
50.01% of common shares.
Mr. Manuel Ferreyros, Mr. Humberto
Nadal, Mr. Raimundo Morales, Mr. Carlos Pomarino own individually and in the aggregate less than 1% of our common shares.
ITEM 7. MAJOR SHAREHOLDERS AND RELATED PARTY TRANSACTIONS
A. Major Shareholders
As of March 31, 2024, our
issued and outstanding share capital was composed of 423,868,449 common shares. In addition, as of March 31, 2024, we had 40,278,894 non-voting
investment shares outstanding, 36,040,497 of which were held in treasury.
The following table sets forth
the beneficial ownership of our common shares and non-voting investment shares as of March 31, 2024.
| | |
As of March 31, 2024 | |
| | |
Common shares | | |
Investment shares | | |
Total | |
| Shareholder | |
Number of
shares
(in millions) | | |
Percentage | | |
Number of
shares
(in millions) | | |
Percentage | | |
Number of
shares
(in millions) | | |
Percentage | |
| ASPI (1) | |
| 211,985.5 | | |
| 50.0 | % | |
| — | | |
| — | | |
| 211,985.5 | | |
| 45.7 | % |
| Cementos Pacasmayo (treasury shares) | |
| — | | |
| — | | |
| 36,040.5 | | |
| 89.5 | % | |
| 36,040.5 | | |
| 7.8 | % |
| AFP Prima | |
| 39,972.6 | | |
| 9.4 | % | |
| — | | |
| — | | |
| 39,972.6 | | |
| 8.6 | % |
| AFP Integra | |
| 34,717.5 | | |
| 8.2 | % | |
| — | | |
| — | | |
| 34,717.5 | | |
| 7.5 | % |
| PROFUTURO AFP | |
| 24,675.1 | | |
| 5.8 | % | |
| — | | |
| — | | |
| 24,675.1 | | |
| 5.3 | % |
| AFP HABITAT | |
| 15,484.7 | | |
| 3.7 | % | |
| — | | |
| — | | |
| 15,484.7 | | |
| 3.3 | % |
| Directors and officers (2) | |
| 1,585.9 | | |
| 0.4 | % | |
| — | | |
| — | | |
| 1,585.9 | | |
| 0.3 | % |
| American Depositary Share Program | |
| 34,951.8 | | |
| 8.2 | % | |
| — | | |
| — | | |
| 34,951.8 | | |
| 7.5 | % |
| Other shareholders | |
| 60,495.3 | | |
| 14.3 | % | |
| 4,238.4 | | |
| 10.5 | % | |
| 64,733.7 | | |
| 13.9 | % |
| Total | |
| 423,868.5 | | |
| 100.0 | % | |
| 40,278.9 | | |
| 100.0 | % | |
| 464,147.3 | | |
| 100.0 | % |
| (1) | ASPI is indirectly controlled by Mr. Eduardo Hochschild through Farragut Holdings, Inc. (Cayman Islands).
Mr. Eduardo Hochschild is a member of the board of directors of our company. The shares expressed here include those held through
ASPI. |
| (2) | See “Item 6. Directors, Senior Management and Employees—Share Ownership” for information
regarding shares of our common stock owned by members of our board of directors and executive officers. The number of common shares held
by directors and executive officers excludes any shares that may be deemed to be beneficially owned by Mr. Eduardo Hochschild through
ASPI. |
Changes in Ownership
The following sets forth the
composition of ownership from December 31, 2019 to December 31, 2023, including common share and investment (non-voting) shares.
| | |
As of December 31, | |
| Shareholder | |
2023 | | |
2022 | | |
2021 | | |
2020 | | |
2019 | |
| ASPI | |
| 45.7 | % | |
| 45.7 | % | |
| 45.7 | % | |
| 45.7 | % | |
| 45.7 | % |
| Cementos Pacasmayo (treasury shares) | |
| 7.8 | % | |
| 7.8 | % | |
| 7.8 | % | |
| 7.8 | % | |
| 7.8 | % |
| IN—Fondo 2 (AFP Integra) | |
| 3.0 | % | |
| - | | |
| - | | |
| - | | |
| - | |
| RI—Fondo 2 (AFP Prima) | |
| 4.8 | % | |
| 5.0 | % | |
| 5.2 | % | |
| 4.6 | % | |
| 3.9 | % |
| RI—Fondo 3 (AFP Prima) | |
| 3.8 | % | |
| 4.0 | % | |
| 4.0 | % | |
| - | | |
| 4.1 | % |
| American Depositary Receipt Program | |
| 7.7 | % | |
| 7.3 | % | |
| 7.4 | % | |
| 6.8 | % | |
| 6.7 | % |
| IN—Fondo 3 (AFP Integra) | |
| 3.4 | % | |
| 4.3 | % | |
| 5.0 | % | |
| 4.1 | % | |
| 5.1 | % |
| PR—Fondo 3 (AFP Profuturo) | |
| 3.6 | % | |
| 4.2 | % | |
| 4.4 | % | |
| 3.7 | % | |
| 4.0 | % |
| Other shareholders | |
| 20.2 | % | |
| 18.4 | % | |
| 16.1 | % | |
| 22.7 | % | |
| 18.5 | % |
| Total | |
| 100 | % | |
| 100 | % | |
| 100.0 | % | |
| 100.0 | % | |
| 100.0 | % |
Differences in Voting Rights
Our major shareholders do
not have different voting rights.
Securities Held in the Host Country
On February 7, 2012, we completed
our initial public offering of 20,000,000 ADSs, each representing five common shares, in the United States. On March 2, 2012, we sold
an additional 2,296,800 ADSs pursuant to an over-allotment option granted to the underwriters in that offering. The ADSs are listed on
the New York Stock Exchange. As of March 31, 2024, we estimate that there were 6,966,356 ADSs outstanding, which represented 8.2% of our
common shares outstanding as of such date.
Arrangements for Change in Control
We are not aware of any arrangements
that may, when in force, result in a change in control.
B. Related Party Transactions
Peruvian Law Concerning Related Party Transactions
Under Peruvian law, board
members and executive officers of a publicly held company may not (i) engage in transactions with the company or any related party of
the company, except for transactions entered into in the ordinary course of business and on an arm’s length basis, (ii) appropriate
for their own benefit a business opportunity that belongs to the company, or (iii) participate in any transaction or decision that presents
a conflict of interest with the company.
Peruvian law sets forth certain
restrictions and limitations on transactions with certain related parties.
For instance, from a tax standpoint,
the value of those transactions must be equal to the fair market value assessed under transfer pricing rules (i.e., the value agreed to
by unrelated parties under the same or similar circumstances). Similarly, companies with securities registered in the Peruvian Public
Registry of Securities (Registro Público del Mercado de Valores), such as us, are required to comply with the following
rules:
| ● | The directors and managers of the company cannot, without the prior authorization of the board of directors,
(i) receive in the form of a loan money or assets of the company; or (ii) use, for their own benefit or for the benefit of related parties,
assets, services or credits of the company. |
| ● | The execution of agreements that involve at least 5% of the assets of the company with persons or entities
related to directors, managers or shareholders that own, directly or indirectly, 10% of the share capital, requires the prior authorization
of the board of directors (with no participation of the director involved in the transaction, if any). |
| ● | The execution of agreements with a party controlled by the company’s controlling shareholder requires
the prior authorization of the board of directors and an evaluation of the terms of the transaction by an external independent company
(audit companies or other to be determined by the Peruvian Securities Commission). |
The external independent company
that reviews the transaction should not be related to the parties involved therein, nor to directors, managers or shareholders that own
at least 10% of the share capital of the company.
Related Party Transactions
As a general policy, we do
not enter into transactions with related parties, including our board members and officers, on terms more favorable than what we would
offer third parties. Any related party transaction we have entered into in the past has been in the ordinary course of business and on
an arm’s length basis.
As of December 31, 2023, we
had no accounts payable balance with ASPI, our controlling shareholder.
The following transactions
have been entered into by us with related parties:
| ● | We lease a plot of land adjacent to our headquarters to our affiliate, Compañía Minera Ares
S.A.C., a subsidiary of Hochschild Mining plc. We received rental payments of S/1,230,000 in 2021, S/1,200,000 in 2022 and S/1,150,000
in 2023. |
| ● | We provide back office management and administrative services to ASPI, Fossal and Fosfatos del Pacifico,
for which we received S/305,000 in 2021, S/198,000 in 2022 and S/305,000 in 2023. |
| ● | We receive a reimbursement of security services from our affiliate Compañía Minera Ares
S.A.C., a subsidiary of Hochschild Mining plc. We paid a total of S/2,836,000 in 2021, S/2,110,000 in 2022 and S/1,940,000 in 2023 for
these services. |
ASPI and Hochschild Mining
plc are majority-owned and controlled, directly and indirectly, by Mr. Eduardo Hochschild.
For more information about
our related-party transactions please see note 22 to our consolidated financial statements included in this annual report.
C. Interests of Experts and Counsel
Not applicable.
ITEM 8. FINANCIAL INFORMATION
A. Consolidated Statements and Other Financial Information.
See “Item 19.—Exhibits.”
Legal and Administrative Proceedings
From time to time, we may
become subject to various legal and administrative proceedings that are incidental to the ordinary conduct of our business. We are currently
not party to any material legal or administrative proceedings.
Dividends and Dividend Policy
Our ability to pay dividends
is subject to our results of operations for each year. Holders of our common shares and investment shares are entitled to receive dividends
on a pro rata basis in accordance with their respective number of shares held
Under our dividend policy,
shareholders must take the following factors into consideration prior to declaring dividends: our financial and economic condition, including
committed and budgeted expenses and obligations, and previously approved investments. In addition, our dividend policy states that (a)
our board of directors may declare advanced dividends based on either the net income resulting from financial statements prepared for
such purpose or the cumulative net income corresponding to previous years, provided that shareholders delegated such authority to the
board of directors, and (b) holders of common shares representing no less than 20% of our total share capital may request the distribution
of dividends up to 50% of the net income corresponding to the previous year, net of any legal reserve requirements. Our board of directors
makes a recommendation at the annual shareholders’ meeting with respect to the amount and timing of dividend payments, if any, to
be made on our common shares and investment shares.
Under Peruvian law, companies
may distribute up to 100% of their profit (after payment of income tax) subject to a 10% legal reserve until the legal reserve equals
20% of shareholders’ equity. According to Article 40 of the Peruvian Corporate Law, in order to distribute dividends, profits must
be determined in accordance with the individual financial statements of the company.
Payment of Dividends
Dividends are paid to holders
of our common shares and investment shares, as of a record date determined by us. In order to allow for the settlement of securities,
under the rules of the Peruvian Securities Commission, investors who purchase shares of a publicly held company three business days prior
to a dividend payment date do not have the right to receive such dividend payment. Dividends on issued and outstanding common shares and
investment shares are distributed pro rata.
Holders of common shares and
investment shares are not entitled to interest on accrued dividends. In addition, under Article 232 of the Peruvian Corporate Law, the
right to collect accrued dividends declared by a publicly held company expires 10 years from the original dividend payment date.
Previous Dividend Payments
The following table sets forth
the amounts of cash dividends declared and paid from 2012 through the date hereof for our common shares and our investment shares.
| Year ended December 31, | |
Dividends
paid (in S/) | | |
Per share
(in S/) | |
| 2023 | |
| 190,300,411 | | |
| 0.41000 | |
| 2022 | |
| 194,941,884 | | |
| 0.42000 | |
| 2021 | |
| 366,676,401 | | |
| 0.79000 | |
| 2020 | |
| 106,753,888 | | |
| 0.23000 | |
| 2019 | |
| 154,118,465 | | |
| 0.36000 | |
| 2018 | |
| 161,396,280 | | |
| 0.37700 | |
| 2017 | |
| 149,837,396 | | |
| 0.35000 | |
| 2016 | |
| 155,236,000 | | |
| 0.28500 | |
| 2015 | |
| 162,950,000 | | |
| 0.28000 | |
At the annual shareholders’ meeting held on March 21, 2024, the
shareholders of the Company approved the financial statements for fiscal year 2023 including the net income for such year and delegated
to the Board of Directors the authority to decide the distribution of dividends from the retained earnings account and fiscal year 2023
operating results.
B. Significant Changes
We are not aware of any changes
bearing upon our financial condition since the date of the financial statements included in this annual report.
ITEM 9. THE OFFER AND LISTING
A. Offer and Listing Details
Market Price of Our Common Shares and ADSs
ADSs
On February 7, 2012, we completed
our initial public offering of 20,000,000 ADSs, each representing five common shares, in the United States. On March 2, 2012, we sold
an additional 2,296,800 ADSs pursuant to an over-allotment option granted to the underwriters in that offering.
The ADSs are listed on the
New York Stock Exchange under the symbol “CPAC.”
B. Plan of Distribution
Not applicable.
C. Markets
Trading in the Peruvian Securities Market
The Lima Stock Exchange
As of December 31, 2023, there
were 339 companies with securities listed on the Lima Stock Exchange. Established in 1970, the Lima Stock Exchange is Peru’s only
securities exchange. On November 19, 2003, the members of the Lima Stock Exchange approved to convert its corporate status to a publicly
held corporation effective as of January 1, 2003. As of December 31, 2023, The Lima Stock Exchange had a share capital of S/13,010,000
divided into 13,010,000 shares with a par value S/1.00 each, fully subscribed and paid. As of December 31, 2023, the Lima Stock Exchange
had 249 shareholders.
Trading on the Lima Stock
Exchange is primarily done on an electronic trading system that became operational in August 1995. From the first Monday of November through
the second Sunday of March of each year, trading hours are Monday through Friday (except holidays) as follows: 8:20 a.m.-8:30 a.m. (pre-market
ordering); 8:30 a.m.-2:55 p.m. (trading); 2:55 p.m.-3:00 p.m. (after-market sales); and 3:00 p.m.-3:10 p.m. (after-market trading). At
all other times, trading hours are from Monday to Friday (except holidays) as follows: 9:00 a.m.-9:30 a.m. (pre-market ordering); 9:30
a.m.-3:55 p.m. (trading); 3:55 p.m.-4:00 p.m. (after-market sales); and 4:00 p.m.-4:10 p.m. (after-market trading).
Transactions during the electronic
sessions are executed through brokerage firms and stock brokers on behalf of their clients. Brokers submit orders in the order in which
they are received. The orders must specify the type of security as well as the amount and price of the proposed sale or purchase. In order
to control price volatility, for Peruvian companies there are volatility auctions for variations of +/- 7% during trading session and
+/- 4% during the last half-hour of continuous trading, when a stock reaches the 15% limit there is an auction and a consequent price
formation. For non-Peruvian companies there is no limit because it is the price in the foreign market the main reference.
Regulation of the Peruvian Securities Market
The Securities Market Law
regulates certain securities matters, such as transparency and disclosure, corporate takeovers, capital market instruments and operations,
the securities markets and broker-dealers, and credit-rating agencies. In 1996, the Peruvian Securities Commission, “Superintendencia
del Mercado de Valores – SMV”, formerly known as the National Supervisory Commission for Securities and Companies (Comisión
Nacional Supervisora de Empresas y Valores, or “CONASEV”), was given additional responsibilities relating to the supervision,
regulation and development of the securities market, while the Lima Stock Exchange was granted the status of a self-regulatory organization.
Additionally, a unified system of guarantees and capital requirements was established for the Lima Stock Exchange.
Pursuant to Law No. 29782,
published in the Peruvian Official Gazette, El Peruano, on July 28, 2011, the Peruvian Securities Commission is a governmental
entity reporting to Peru’s Ministry of Economy and Finance with functional, administrative, economic, technical and budgetary autonomy.
The Peruvian Securities Commission
is governed by the Superintendent and a five board-members confirmed by the Superintendent (who acts as President of the board) and four
members appointed by the Peruvian Executive Power (one suggested by the Ministry of Economy and Finance, one suggested by the BCRP, one
suggested by the Peruvian Superintendence of Banking, Insurance and Private Pension Funds and one independent member). The Peruvian Securities
Commission has broad regulatory powers, including reviewing, promoting, and making rules regarding the securities market, supervising
its participants, and approving the registration of public offerings of securities.
The Peruvian Securities Commission
supervises the securities markets and the dissemination of information to investors. It also (i) governs the operations of the Public
Registry of Securities, (ii) regulates mutual funds, publicly placed investment funds and their respective management companies and broker-dealers,
(iii) monitors compliance with accounting regulations by companies under its supervision as well as the accuracy of financial statements
and (iv) registers and supervises auditors who provide accounting services to those companies registered with the Peruvian Securities
Commission.
Pursuant to the Securities
Market Law, broker-dealers must maintain a guarantee fund. This guarantee fund must be managed by an entity supervised by the Peruvian
Securities Commission. Contributions to the guarantee fund must be made by the 25 broker-dealers that are members of the Lima Stock Exchange
and are based on the volume traded over the exchange. In addition to the guarantee fund managed, each broker-dealer is required to maintain
a guarantee in favor of the Peruvian Securities Commission to guarantee any liability that broker-dealers may have with respect to their
clients. Such guarantees are generally established through letters of credit issued by local banks.
Disclosure Obligations
Issuers of securities registered
with the Peruvian Securities Commission are required to disclose material information relating to the issuer. Pursuant to the Securities
Market Law and relevant regulations enacted thereunder, all material information in connection with the issuer of registered securities
(such as our common shares and investment shares), its activities or securities issued or secured by such issuer which may influence the
liquidity or price of such securities must be disclosed. Accordingly, issuers must file with the Peruvian Securities Commission mainly
two types of information: (a) financial information, including interim unaudited financial statements on a quarterly basis (which are
not required to be subject to limited review), and annual audited consolidated financial statements on an annual basis, and (b) material
information relating to the issuer and its activities that may significantly affect the price, offering or negotiation of the issued securities,
and in general, all the information that may be relevant for investors to be able to make investment decisions.
In order to comply with the
foregoing disclosure obligations, issuers must disclose reaffirmation to the Peruvian Securities Commission and, if the securities are
listed, with the Lima Stock Exchange as soon as practicable but not later than one business day after having become aware of such information.
D. Selling Shareholders
Not applicable.
E. Dilution
Not applicable.
F. Expenses of the Issue
Not applicable.
ITEM 10. ADDITIONAL INFORMATION
A. Share Capital
Not applicable.
B. Memorandum and Articles of Association
Set forth below is certain
information relating to our share capital, including brief summaries of the material provisions of our by-laws, Peruvian corporate law
and certain related laws and regulations of Peru, all as in effect as of the date hereof.
General
We are a publicly held corporation
under Peruvian Corporate law registered with the Public Registry of Corporations in Lima. We are currently listed on the Lima Stock Exchange.
The second article of our
by-laws provides that our principal corporate purpose is mining and the production and sale of cement, quicklime and other construction
materials in Peru and internationally.
We have common shares and
investment shares.
See “Item 6. Directors,
Senior Management and Employees—A. Directors and Senior Management” for information regarding our Board of Directors.
Common Shares
Common shares represent 100%
of our voting shares. As of March 31, 2024, 423,868,449 of our common shares were outstanding. As of March 31, 2024, there were 34,952
owners of record of our common shares (considering the ADSs listed in the New York Stock Exchange are held by one registered owner). Our
common shares have a par value of S/1.00 per share and have been fully subscribed and are fully paid. Our common shares are registered
in the Securities Public Registry of the Peruvian Securities Commission and are listed on the Lima Stock Exchange.
Investment Shares
As of March 31, 2024, 4,238,397
of our investment shares were outstanding excluding 36,040,497 investment shares that were held in treasury. Investment shares have no
voting rights and are not, under Peruvian law and accounting regulations, characterized as share capital. However, investment shares are
still considered part of a company’s equity. As of March 31, 2024, there were 421 owners of record of our investment shares. Our
investment shares have a par value of S/1.00 per share and have been fully subscribed and are fully paid. Our investment shares are registered
in the Securities Public Registry of the Peruvian Securities Commission and are listed on the Lima Stock Exchange.
Shareholders’ Liability
Under Peruvian Corporate Law,
holders of our common shares cannot vote on matters with respect to which they have a conflict of interest.
Under Article 133 of the Peruvian
Corporate Law, a shareholder must abstain from voting if such shareholder has a conflict of interest. A resolution approved in disregard
of this provision may be challenged under Article 139 of the Peruvian Corporate Law and any shareholder that participated in the determination
in breach of this provision, if such shareholder’s vote was key in attaining the required majority, may be held liable individually,
or jointly with any other shareholder voting in breach of the provision.
Redemption and Rights of Withdrawal
Under Article 200 of the Peruvian
Corporate Law, holders of our common shares have redemption rights if: (i) we change our corporate purpose; (ii) a change occurs
in the place of organization to a foreign country; or (iii) any transformation, merger or significant spin-off occurs with respect to
our company.
Preemptive and Accretion Rights
If we increase our share capital,
holders of our common shares and investment shares have the right to subscribe to new common shares and investment shares, respectively,
on a pro rata basis. Holders of common shares have preemptive rights in order to maintain their share interest in our share capital, unless
the capital increase (i) results from a conversion of debt to common shares; (ii) is approved by shareholders representing at least
40% of the subscribed voting shares provided that the capital increase does not favor, directly or indirectly, certain shareholders to
the detriment of others; and (iii) results from a corporate reorganization. Holders of investment shares have preemptive rights to maintain
their proportional ownership in our share capital.
Shareholders who are in default
of any payments relating to a capital call may not exercise their preemptive rights.
Preemptive rights are exercised
in two rounds. During the first round, shareholders may subscribe to the new shares on a pro rata basis. During the second round, shareholders
who participated in the first round may subscribe to any remaining shares on a pro rata basis up to the amount of shares such shareholders
subscribed for in the first round. The first round must remain open for at least 15 business days. The second round must remain open for
at least three business days.
Voting Rights and Dividends
Common Shares
Holders of common shares are
entitled to one vote per share, with the exception of the election of the board of directors, where each holder is entitled to one vote
per share per nominee. Each holder’s votes may be cast for a single nominee or distributed among the nominees at the holder’s
discretion. To that effect, each of our common shares gives the holder the rights to as many votes as there are directors to be elected.
Shareholders may pool votes in favor of one person or distribute them among various persons. Those candidates for the board who receive
the most votes are elected directors. Holders of common shares may attend and vote at shareholders’ meetings either in person or
through a proxy.
Holders of common shares have
the right to participate in the distribution of dividends and shareholder equity resulting from liquidation. Our by-laws do not establish
a maximum time limit for the payment of the dividends. However, according to Article 232 of the Peruvian Corporate law, the right to collect
past-due dividends in the case of companies that are publicly held companies, such as ours, expires 10 years after the date on which the
dividend payment was due.
Our share capital may be increased
by a decision of holders of common shares at a shareholders’ meeting. Capital reductions may be voluntary or mandatory and must
be approved by holders of common shares at a shareholders’ meeting. Capital reductions are mandatory when accumulated losses exceed
50% of the capital and to the extent such accumulated losses are not offset by accumulated earnings and capital increases within the following
fiscal year. Capital increases and reductions must be communicated to the Peruvian Securities Commission, the Lima Stock Exchange and
the SUNAT. Voluntary capital reductions must also be published in the official gazette El Peruano and in a widely circulated
newspaper in the city in which we are located.
Investment Shares
Under Peruvian Corporate Law,
investment shares do not represent share capital. Accordingly, our balance sheet reflects the investment shares as a separate account
from our share capital. Holders of investment shares are neither entitled neither to vote nor to participate in shareholders’ meetings.
However, investment shares confer upon the holders thereof the right to participate in the dividends distributed according to their par
value, in the same manner as common shares. Investment shares also confer to the holders thereof the preemptive right to (i) maintain
the current proportion of the investment shares in the case of a capital increase through new contributions; (ii) increase the number
of investment shares upon capitalization of retained earnings, revaluation surplus or other reserves that do not represent cash contributions;
(iii) participate in the distribution of assets resulting from a liquidation in the same manner as common shares; and, (iv) redeem the
investment shares in case of a merger and/or change of business activity.
Liquidation Rights
If we are liquidated, our
shareholders have the right to receive net assets resulting from the liquidation, after we comply with our obligation to pay all our creditors
and after discounting any existing dividend liabilities. For this reason, we cannot assure that we will be able to reimburse 100% of the
book value of the common shares and investment shares in case of bankruptcy or liquidation.
Ordinary and Extraordinary Meetings
Pursuant to Peruvian Corporate
Law and our by-laws, the annual shareholders’ meeting must be held during the three-month period after the end of each fiscal year.
Additional shareholders’ meetings may be held during the year. Because we are a publicly held corporation, we are subject to the
special control of the Peruvian Securities Commission, as provided in Article 253 of the Peruvian Corporate Law. If we do not hold the
annual shareholders’ meeting during the three-month period after the end of each fiscal year or any other shareholders’ meeting
required by our by-laws, a public notary or a competent judge shall call for such a meeting at the request of at least one shareholder
of the common shares. Such meeting will take place within a reasonable period of time.
Other shareholders’
meetings are convened by the board of directors when deemed convenient by our company or when it is requested by the holders of at least
20% of our common shares. If, at the request of holders of 20% of the common shares, the shareholders’ meeting is not convened by
the board of directors within 15 business days of the receipt of such request, or the board expressly or implicitly refuses to convene
the shareholders’ meeting, a public notary or a competent judge will call pursuant to Law No. 29560 for such meeting at the request
of holders of at least 20% of our common shares. If a public notary or competent judge calls for a shareholders’ meeting, the place,
time and hour of the meeting, the agenda and the person who will preside shall be indicated on the meeting notice. If the meeting called
is other than the annual shareholders’ meeting or a shareholders’ meeting required by the Peruvian Corporate Law or the by-laws,
the agenda will contain those matters requested by the shareholders who requested the meeting.
Holders of investment shares
have no right to request the board to call a shareholders’ meeting.
Notices of Meetings
Since we are a publicly held
corporation, notice of shareholders’ meetings must be given by publication of a notice. The publication shall occur at least 25
days prior to any shareholders’ meeting in the Peruvian Official Gazette, El Peruano, and in a widely circulated newspaper
in the city in which we are located. The notice requirement may be waived at the shareholders’ meeting by agreement of the holders
of 100% of the outstanding common shares.
Quorum and Voting Requirements
According to Article 25 of
our by-laws and Article 257 of the Peruvian Corporate Law, shareholders’ meetings called for the purpose of considering a capital
increase or decrease, the issuance of obligations, a change in the by-laws, the sale in a single act of assets with an accounting value
that exceeds 50% of our share capital, a merger, division, reorganization, transformation or dissolution, are subject to a first, second
and third quorum call, each of the second and third quorum call to occur upon the failure of the preceding one. A quorum for the first
call requires the presence of shareholders holding 50% of our total common shares. For the second call, the presence of shareholders holding
at least 25% of our total common shares is adequate, while for the third call there is no quorum requirement. These decisions require
the approval of the majority of the common shares represented at the shareholders’ meeting. Shareholders’ meetings convened
to consider all other matters are subject to a first and second quorum call, the second quorum call to occur upon the failure of the first
quorum.
In accordance with Peruvian
Corporate Law, only those holders of common shares whose names are registered in our stock ledger not less than 10 days in advance of
a meeting will be entitled to attend the shareholders’ meeting and to exercise their rights.
Limitations on the Rights of Non-residents or Foreign Shareholders
There are no limitations under
our by-laws or Peruvian Corporate Law on the rights of nonresidents or foreign shareholders to own securities or exercise voting rights
with respect to our securities.
Disclosure of Shareholdings and Tender Offer Regulations
Disclosure of Shareholdings
There are no provisions in
our by-laws governing the ownership threshold above which share ownership must be disclosed.
However, according to Article
10 of CONASEV Resolution No. 090-2005-EF-94.10, as amended, we must inform the Peruvian Securities Commission of the members of our economic
group and a list of our holders of common shares owning more than a 4% share interest, as well as any change to such information.
Tender Offer Regulations
Peruvian security regulations
include mandatory takeover rules applicable to the acquisition of control of a listed company.
Subject to certain conditions,
such regulations generally establish the obligation to make a tender offer when a person or group of persons acquires a relevant interest
in a listed company. According to Peruvian law, a person acquires a relevant interest in a listed company when such person (a) holds or
has the power to exercise directly or indirectly 25%, 50% or 60% of the voting rights in a listed company, or (b) has the power to appoint
or remove the majority of the board members or to amend its by-laws.
In general, the tender offer
must be launched prior to the acquisition of the relevant interest. The tender offer may be launched after the “relevant interest”
is acquired if it is acquired (a) by means of an indirect transaction, (b) as a consequence of a public sale offer, or (c) in no more
than four transactions within a three-year period.
This mandatory procedure has
the effect of alerting other shareholders and the market that an individual or financial group has acquired a significant percentage of
a company’s voting shares, and gives other shareholders the opportunity to sell their shares at the price offered by the purchaser.
The purchaser is required to launch a tender offer unless: (a) shareholders representing 100% of the voting rights consent in writing,
(b) voting shares are acquired by a depositary in order to subsequently issue ADSs, or (c) voting shares are acquired pursuant to the
exercise of preemptive rights.
Changes in Capital
Our by-laws do not establish
special conditions to increase or reduce our share capital beyond what is required under Peruvian Corporate Law.
Anti-Takeover Provisions
Our by-laws do not contain
any provision that would have the effect of delaying, deferring or preventing a change of control. However, acquisitions of shares of
our capital stock that involve a change of control may be subject to Peruvian securities and exchange regulations (Ley de Mercado de
Valores y Reglamento de Oferta Pública de Adquisición y de Compra de Valores por Exclusión) applicable to tender
offers.
Form and Transfer
Common shares and investment
shares may be either physical share certificates in registered form or book-entry securities in the CAVALI S.A. ICLV book-entry settlement
system, also in registered form.
Furthermore, the Peruvian
Corporate Law forbids publicly held corporations, such as us, from including in their by-laws stipulations limiting the transfer of their
shares or restraining their trading in other ways. In addition, pursuant to our by-laws, we cannot recognize a shareholders’ agreement
that contemplates limitations, restrictions or preferential rights on the transfer of shares, even if such an agreement is recorded in
our stock ledger (matrícula de acciones) or in CAVALI S.A. ICLV.
C.
Material Contracts
On December 31, 2007, we entered
into a contract for the general management and provision of services with ASPI, pursuant to which we provide legal and corporate services
to it. See “Item 7. Major Shareholders and Related Party Transactions—A. Related Party Transactions.”
On February 1, 2008, we entered
into a surface rights agreement with Compañía Minera Ares S.A.C., pursuant to which we lease a plot of land adjacent to
our headquarters to our affiliate, Compañía Minera Ares S.A.C., a subsidiary of Hochschild Mining plc. See “Item 7.
Major Shareholders and Related Party Transactions—A. Related Party Transactions.”
On June 30, 2008, we entered
into a property lease agreement with ASPI pursuant to which we lease part of our headquarters as office space to ASPI. See “Item
7. Major Shareholders and Related Party Transactions—A. Related Party Transactions.”
On June 3, 2010, we entered
into a long-term electricity supply agreement with Electroperú, a government-owned company, which was set to expire in July 2020,
to serve the electricity requirements of our Pacasmayo facility. Electroperú has agreed to provide us with sufficient energy to
operate our Pacasmayo facility (later expanded to include our Piura facility) at pre-determined maximum amounts during the term of the
contract. Payments for electricity are based on a formula that takes into consideration our energy consumption and certain market variables,
such as the U.S. purchase price index, the global price of oil, the local price of natural gas and the import price of bituminous coal.
We entered into an addendum to this agreement, effective February 1, 2016, which extended the term of the agreement until December 31,
2025, reduced the prices for the 2016-2020 period and established new prices for the 2020-2026 period. See “Item 4. Information
on the Company—A. History and Development of the Company—Raw Materials and Energy Sources.” We subsequently entered
into another addendum to extend this agreement until May 31, 2026.
On February 8, 2013, we issued
US$300,000,000 aggregate principal amount of our 4.50% Senior Notes due 2023, in our inaugural international bond offering, pursuant to
an indenture. A portion of the proceeds were used to prepay amounts outstanding our secured loan agreement with BBVA Banco Continental,
and the remaining proceeds were used to cover a portion of the capital expenditures in connection with the construction and development
of the new Piura plant and our cement business. We prepaid a portion of the Senior Notes in a cash tender offer in 2018, and we repaid
the remaining amount upon maturity in February 2023. See “Item 5. Operating and Financial Review and Prospects—B. Liquidity
and Capital Resources.”
On January 31, 2019, we issued
an aggregate principal amount of S/570,000,000 of debt securities in the local market in two issuances. One in the aggregate principal
amount of S/260 million bearing interest at a rate of 6.68750% for a term of 10 years, and the other in the aggregate principal amount
of S/310 million bearing interest at a rate of 6.84375% for a term of 15 years. The proceeds were used to purchase a portion of our 4.50%
Senior Notes due 2023.
On August 6, 2021, we established
the conditions of a medium-term corporate loan in the form of a “Club Deal” with Banco de Crédito del Perú S.A.
and Scotiabank Perú S.A.A. The loan amounted to S / 860,000,000 that will allow the payment of all the financial obligations that
the Company maintains with maturity until February 2023 and will be disbursed based on the maturity of each of them.
On November 29, 2021, we entered
into a supply contract with FLSmidth A/S for the supply of the equipment and engineering for a new 2000 tons per day pyro line for our
Pacasmayo Plant for a total amount of €19,254,150.
On February 16, 2022, we entered
into a construction and erection contract with Ingeniería y Construcción Sigdo Koppers Perú S.A.C. for the construction
and erection required for our new 2000 tons per day pyro line for our Pacasmayo plant for a referential amount of S/ 66,083,227.
Since August 1990, there have
been no exchange controls in Peru and all foreign exchange transactions are based on free market exchange rates. Prior to August 1990,
the Peruvian foreign exchange market consisted of several alternative exchange rates. Additionally, during the 1990s, the Peruvian currency
experienced a significant number of large devaluations, and Peru has consequently adopted, and operated under, various exchange rate control
practices and exchange rate determination policies, ranging from strict control over exchange rates to market determination of rates.
Current Peruvian regulations on foreign investment allow the foreign holders of equity shares of Peruvian companies to receive and repatriate
100 percent of the cash dividends distributed by such companies. Such investors are allowed to purchase foreign exchange at free market
currency rates through any member of the Peruvian banking system and transfer such foreign currency outside Peru without restriction.
The following summary contains
a description of certain Peruvian and United States federal income tax consequences of the acquisition, ownership and disposition of common
shares or ADSs, but it does not purport to be a comprehensive description of all the tax considerations that may be relevant to a decision
to purchase common shares or ADSs. The summary is based upon the tax laws of Peru and regulations thereunder and on the tax laws of the
United States and regulations thereunder as in effect on the date hereof, which are subject to change.
Prospective holders of common
shares or ADSs should consult their own tax advisors as to the tax consequences of the acquisition, ownership and disposition of common
shares or ADSs in their particular circumstances.
Peruvian Tax Considerations
The following are the principal
tax consequences of ownership of common shares or ADSs by non-resident individuals or entities (“Non-Peruvian Holders”) as
of the date hereof. Legislative, judicial or administrative changes or interpretations may, however, be forthcoming. Any such changes
or interpretations could affect the tax consequences to holders of common shares or ADSs and could alter or modify the conclusions set
forth herein. This summary is not intended to be a comprehensive description of all the tax consequences of acquisition, ownership and
disposition of common shares or ADSs and does not describe any tax consequences arising under the laws of any taxing jurisdiction other
than Peru or applicable to a resident of Peru or to a person with a permanent establishment in Peru.
For purposes of Peruvian taxation:
| ● | individuals are residents of Peru, if they are Peruvian nationals
who have established their principal place of residence in Peru or if they are foreign nationals with a permanence in Peru of 183 days
in any 12-month period (the condition of Peruvian resident can only be acquired as of the 1st of January of the year following the fulfillment
of residence conditions); and |
| ● | legal entities are residents of Peru if they are established
or incorporated in Peru. |
Peruvian Income Tax
Rate
The Peruvian income tax rate is 29.5%.
Cash Dividends and
Other Distributions
Cash dividends paid with respect
to common shares and amounts distributed with respect to ADSs are currently subject to a Peruvian withholding tax, at a rate of 5.0% of
the dividend paid. As a general rule, the distribution of additional common shares representing profits, distribution of shares which
differ from the distribution of earnings or profits, as well as the distribution of preemptive rights with respect to common shares, which
are carried out as part of a pro rata distribution to shareholders, will not be subject to Peruvian tax or withholding taxes.
Capital Gains
Pursuant to Article 6 of the
Peruvian income tax law, individuals and entities resident in Peru are subject to Peruvian income tax on their worldwide income while
Non-Peruvian Holders are subject to Peruvian income tax on Peruvian source income only.
The general rule of the Law
of Income Tax in Peru provides that income derived from the disposal of securities issued by Peruvian entities is considered Peruvian
source income and is therefore subject to income tax. Peruvian income tax law also provides that capital gains resulting from the disposal
of ADSs that represent shares issued by Peruvian entities are considered Peruvian source income and therefore also subject to Peruvian
income tax. Peruvian income tax law also provides that taxable income resulting from the disposal of securities is determined by the difference
between the sale price of the securities at market value and the tax basis.
Notwithstanding the foregoing,
capital gains resulting from the disposal of ADSs or beneficial interest in ADSs that represent shares issued by a Peruvian entity are
not considered Peruvian source income as long as the ADSs issued by the foreign depositary are held in the name of a nominee and such
ADSs are not transferred to a third party as a result of the disposal of the ADSs.
In the event ADSs are exchanged
into common shares and such common shares are disposed of, capital gains resulting therefrom will be subject to an income tax rate of
either 5% or 30%, depending on where the transaction takes place. If the transaction is consummated in Peru, the income tax rate is 5%;
if the transaction is consummated outside of Peru, capital gains are taxed at a rate of 30%. Peruvian income tax law regulations have
stated that transactions are deemed to be consummated in Peru if the common shares are transferred through the Lima Stock Exchange. Any
gain resulting from the conversion of ADSs into common shares or common shares into ADSs will not be subject to taxation in Peru.
Any Non-Peruvian Holder who
acquires common shares will have the following tax basis: (i) for common shares purchased by the transferor, the acquisition price paid
for the shares; (ii) for common shares received by the transferor as a result of a share capital increase because of a capitalization
of net profits, the face or nominal value of such common shares; (iii) for other common shares received free of any payment, the stock
market value of such shares if listed on the Lima Stock Exchange or, if not, the face or nominal value of such common shares and (iv)
for common shares of the same type acquired at different opportunities and at different values, the tax basis will be the weighted average
cost. In cases where common shares are sold by Non-Peruvian Holders outside the Lima Stock Exchange, the tax basis must be certified by
the Peruvian tax administration prior to the time payment is made to the transferor; otherwise it would not be possible to deduct the
tax basis and a 30% Peruvian income tax would apply to the total sale price. Under Peruvian income tax law, tax basis certification is
granted by the tax authorities within 30 days from the date of the application (which application must contain supporting evidence
with respect to the tax basis) is made by the transferor. If the tax authorities do not respond within such 30 day period, the tax basis
presented for approval by the transferor is deemed automatically approved.
On December 31, 2010, Law
No. 29645 was enacted and took effect from January 1, 2011. This law states that in transactions relating to Peruvian securities through
the Lima Stock Exchange, CAVALI S.A. ICLV (the Peruvian clearing house) will act as withholding agent to the extent that such transactions
are settled in cash through CAVALI’s account (liquidación en efectivo). The implementing regulations of Law No. 29645
enacted on July 9, 2011 provide that CAVALI began acting as a withholding agent as from November 1, 2011. As a result, while such regulations
do not apply to securities transferred though the Lima Stock Exchange by a Non-Peruvian Holder, such transferor must still self-assess
and pay its income tax liability directly to Peruvian tax authorities within the first 12 working days following the month in which
Peruvian source income was earned. With respect to transactions of Peruvian securities conducted through the Lima Stock Exchange that
are settled directly without CAVALI’s intervention (liquidación directa), Non-Peruvian Holders are required to self-assess
and pay income taxes directly to the Peruvian tax authorities within the first 12 working days following the month in which income from
a Peruvian source was earned. Finally, if the purchaser is resident in Peru and the sale is not performed through the Lima Stock Exchange,
the purchaser will act as withholding agent.
However,
Law No. 30341 regulating an exception to the general rule was enacted on December 12, 2015, and entered into force on January 1, 2016,
and Legislative Decree No. 1262, supplementing Law No. 30341, entered into force on January 1, 2017. This law was in force until December
31, 2019.
However, the validity of Law
30341 was initially extended until December 31, 2022, by Emergency Decree 005-2019. Then, Law No. 31662, published on December 30, 2022,
again extended its validity until December 31, 2023. The exemption from income tax provided for by Law 30341, that promotes liquidity
and integration of the Securities Market, now contains the following rules:
| 1. | The exemption is applicable to capital gains generated by
individuals and undivided succession or conjugal partnerships that chose to be taxed as such (not applicable to entities). |
| 2. | The exemption applies to up to 100 tax units (Unidad Impositiva
Tributaria) of the capital gain generated in each taxable year. |
The
exemption regulated by the law applies to income from the sale of shares and other securities representing shares made through a centralized
trading mechanism supervised by the Superintendency of Securities, when the shares do not represent 10% or more of the shares issued by
a given company.
Law
No. 30341 and the amendment by Legislative Decree No. 1262, Emergency Decree 005-2019 and Law 31662 include the following provisions:
| ● | Securities covered by the exemption: |
| ⮚ | American Depositary Receipts (ADRs) representing ADSs and
Global Depositary Receipts (GDRs); |
| ⮚ | Exchange Trade Fund (ETF) units having underlying shares
and / or debt securities as underlying; |
| ⮚ | Certificates of participation in mutual funds for investment
in securities; |
| ⮚ | Certificates of participation in Investment Fund in Real
Estate Income (FIRBI) and certificates of participation in Trust for Securitization for Investment in Real Estate Income (FIBRA); and |
| ● | Requirements that apply to the exemption: |
| ⮚ | No transfer of 10% or more of the shares or securities representing
shares in a period of twelve (12) months. In the case of ADRs and GDRs, this requirement will be determined by considering the underlying
shares; |
| ⮚ | In the case of shares or securities representing shares,
the calculation of the percentage shall be determined based on the total number of shares of capital or account of investment shares
at the time of disposal; |
| ⮚ | The law indicates those operations to be considered for calculating
this percentage, as well as those that do not; |
| ⮚ | The securities must have a stock market presence. To determine
if the securities have a stock market presence, the following shall be taken into account: |
| ● | Within 180 business days prior to the transfer, the number of
days in which the daily-negotiated amount has exceeded the limit established in the regulation shall be determined. This limit cannot
be less than six Tax Units (ITU) and will be established considering the volume of transactions that take place in the centralized negotiation
mechanisms; |
| ● | The number of days determined according to what is indicated
in the previous section will be divided between 180 and multiplied by 100; and |
| ● | The result cannot be less than the limit established by the
regulation. This limit cannot exceed 45%. |
| ⮚ | Those responsible for conducting centralized trading mechanisms
must disseminate on their web pages the list of the securities that comply with having a presence in the stock market. |
| ⮚ | If, after applying the waiver, the issuer delivers the values
of the Securities Registry of the Stock Exchange, in whole or in part, in an act or progressively, within the 12 months following the
sale, the exoneration applied with respect to the values listed; and |
| ⮚ | Those responsible for conducting the centralized trading
mechanisms must notify SUNAT, in accordance with the procedure set forth in the regulations, of the securities whose registrations are
canceled within 12 months of the sale. |
Other Considerations
No Peruvian estate or gift
taxes are imposed on the gratuitous transfer of ADSs or common shares. No stamp, transfer or similar tax applies to any transfer of ADSs
or common shares, except for commissions payable by seller and buyer to the Lima Stock Exchange (0.15% of value sold), fees payable to
the Peruvian Securities Commission (0.05% of value sold), brokers’ fees (about 0.05% to 1% of value sold) and Value Added Tax (at
the rate of 18%) on commissions and fees. Any investor who sells its common shares on the Lima Stock Exchange will incur these fees and
taxes upon purchase and sale of the common shares.
United States Federal Income Tax Considerations
The following are the material
United States federal income tax consequences as of the date hereof to a United States Holder (as defined below) of the ownership and
disposition of ADSs and our common shares. This summary deals only with ADSs and common shares held as capital assets (generally,
property held for investment). As used herein, the term “United States Holder” means a beneficial owner of ADSs or common
shares that is for United States federal income tax purposes:
| ● | an individual who is a citizen or resident of the United States; |
| ● | a corporation (or other entity treated as a corporation for United States federal income tax purposes)
created or organized in or under the laws of the United States, any state thereof or the District of Columbia; |
| ● | an estate the income of which is subject to United States federal income taxation regardless of its source;
or |
| ● | a trust if it (1) is subject to the primary supervision of a court within the United States and one or
more United States persons have the authority to control all substantial decisions of the trust, or (2) has a valid election in effect
under applicable United States Treasury regulations to be treated as a United States person. |
This summary does not represent
a detailed description of the United States federal income tax consequences applicable to you if you are subject to special treatment
under the United States federal income tax laws, including if you are:
| ● | a dealer or broker in securities or currencies; |
| ● | a financial institution; |
| ● | a regulated investment company; |
| ● | a real estate investment trust; |
| ● | a tax-exempt organization; |
| ● | a person holding ADSs or our common shares as part of a hedging, integrated or conversion transaction,
a constructive sale or a straddle; |
| ● | a trader in securities that has elected the mark-to-market method of accounting for your securities; |
| ● | a person liable for alternative minimum tax; |
| ● | a person who owns or is deemed to own 10% or more of our stock (by vote or value); |
| ● | a partnership or other pass-through entity for United States federal income tax purposes; |
| ● | a person required to accelerate the recognition of any item of gross income with respect to ADSs or our
common shares as a result of such income being recognized on an applicable financial statement; or |
| ● | a person whose “functional currency” is not the U.S. dollar. |
The discussion below is based
upon the provisions of the U.S. Internal Revenue Code of 1986, as amended (the “Code”), and regulations, rulings and judicial
decisions thereunder as of the date hereof, and such authorities may be replaced, revoked or modified so as to result in United States
federal income tax consequences different from those discussed below. There is currently no income tax treaty between the United States
and Peru that would provide for United States federal income tax consequences different from those discussed below. In addition, this
summary assumes that the deposit agreement, and all other related agreements, will be performed in accordance with their terms.
If a partnership (or other
entity or arrangement treated as a partnership for United States federal income tax purposes) holds ADSs or our common shares, the tax
treatment of a partner in the partnership will generally depend upon the status of the partner and the activities of the partnership.
If you are a partnership or a partner of a partnership holding ADSs or our common shares, you should consult your tax advisors.
This summary does not contain
a detailed description of all the United States federal income tax consequences to you in light of your particular circumstances and does
not address the Medicare tax on net investment income, United States federal estate and gift taxes or the effects of any state, local
or non-United States tax laws. If you are considering the acquisition of ADSs or our common shares, you should consult your own tax advisors
concerning the United States federal income tax consequences to you in light of your particular situation as well as any consequences
arising under other United States federal tax laws and the laws of any other taxing jurisdiction.
ADSs
If you hold ADSs, for United
States federal income tax purposes, you generally will be treated as the owner of the underlying common shares that are represented by
such ADSs. Accordingly, deposits or withdrawals of common shares for ADSs will not be subject to United States federal income tax.
Taxation of Dividends
The gross amount of distributions
on the ADSs or common shares (including amounts withheld to reflect Peruvian withholding taxes) will be taxable as dividends, to the extent
paid out of our current or accumulated earnings and profits, as determined under United States federal income tax principles.
To the extent that the amount
of any distribution (including amounts withheld to reflect Peruvian withholding taxes) exceeds our current and accumulated earnings and
profits for a taxable year, as determined under United States federal income tax principles, the distribution will first be treated as
a tax-free return of capital, causing a reduction in the adjusted basis of the ADSs or common shares, and the balance in excess of adjusted
basis will be taxed as capital gain recognized on a sale or exchange. However, we do not expect to keep earnings and profits in accordance
with United States federal income tax principles. Therefore, you should expect that a distribution will generally be reported as a dividend.
Such dividends (including withheld taxes) will be includable in your gross income as ordinary income on the day actually or constructively
received by you, in the case of the common shares, or by the depositary, in the case of ADSs. Such dividends will not be eligible for
the dividends received deduction generally allowed to corporations under the Code.
Subject to applicable limitations
(including a minimum holding period requirement), dividends received by non-corporate United States Holders from a qualified foreign corporation
may be treated as “qualified dividend income” that is subject to reduced rates of taxation. A non-United States corporation
is generally treated as a qualified foreign corporation with respect to dividends paid by that corporation on common shares (or ADSs backed
by such shares) that are readily tradable on an established securities market in the United States. United States Treasury Department
guidance indicates that the ADSs, which are listed on the New York Stock Exchange, but not our common shares, are readily tradable on
an established securities market in the United States. Thus, we believe that dividends we pay on our common shares that are represented
by ADSs, but not our common shares that are not so represented, will be eligible for the reduced tax rates. There can be no assurance,
however, that the ADSs will be considered readily tradable on an established securities market in the United States in later years. You
should consult your own tax advisors regarding the application of these rules given your circumstances.
The amount of any dividend
paid in soles will equal the U.S. dollar value of the soles received, calculated by reference to the exchange rate in effect
on the date the dividend is actually or constructively received by you, in the case of the common shares, or by the depositary, in the
case of ADSs, regardless of whether the soles are converted into U.S. dollars at that time. If the soles received as a dividend
are converted into U.S. dollars on the date they are received, you generally will not be required to recognize foreign currency gain or
loss in respect of the dividend income. If the soles received as a dividend are not converted into U.S. dollars on the date of
receipt, you will have a tax basis in the soles equal to their U.S. dollar value on the date of receipt. Any gain or loss realized
on a subsequent conversion or other disposition of the soles will be treated as United States source ordinary income or loss.
Subject to certain conditions
and limitations (including a minimum holding period requirement), Peruvian withholding taxes on dividends may be treated as foreign taxes
eligible for credit against your United States federal income tax liability. For purposes of calculating the foreign tax credit, dividends
paid on the ADSs or common shares will be treated as foreign source income and will generally constitute passive category income. However,
Treasury regulations addressing foreign tax credits (the “Foreign Tax Credit Regulations”) impose additional requirements
for foreign taxes to be eligible for a foreign tax credit, and there can be no assurance that those requirements will be satisfied. The
United States Treasury Department and the Internal Revenue Service (the “IRS”) are considering proposing amendments to the
Foreign Tax Credit Regulations. In addition, recent notices from the IRS provide temporary relief by allowing taxpayers that comply with
applicable requirements to apply many aspects of the foreign tax credit regulations as they previously existed (before the release of
the current Foreign Tax Credit Regulations) for taxable years ending before the date that a notice or other guidance withdrawing or modifying
the temporary relief is issued (or any later date specified in such notice or other guidance). Instead of claiming a foreign tax credit,
you may be able to deduct Peruvian withholding taxes on dividends in computing your taxable income, subject to generally applicable limitations
under United States law (including that a United States Holder is not eligible for a deduction for otherwise creditable foreign income
taxes paid or accrued in a taxable year if such United States Holder claims a foreign tax credit for any foreign income taxes paid or
accrued in the same taxable year). The rules governing the foreign tax credit and deductions for foreign taxes are complex. You are urged
to consult your tax advisors regarding the availability of a foreign tax credit or a deduction under your particular circumstances.
Distributions of ADSs, common
shares or rights to subscribe for ADSs or common shares that are received as part of a pro rata distribution to all of our shareholders
generally will not be subject to United States federal income tax.
Taxation of Capital Gains
For United States federal
income tax purposes, you will recognize taxable gain or loss on any sale, exchange or other taxable disposition of ADSs or common shares
in an amount equal to the difference between the amount realized for the ADSs or common shares and your tax basis in the ADSs or common
shares, both as determined in U.S. dollars. Such gain or loss will generally be capital gain or loss. Capital gains of non-corporate United
States Holders derived with respect to capital assets held for more than one year are eligible for reduced rates of taxation. The deductibility
of capital losses is subject to limitations.
If Peruvian income tax is
withheld on the sale, exchange or other taxable disposition of ADSs or our common shares, your amount realized will include the gross
amount of the proceeds of that disposition before deduction of the Peruvian income tax. Any gain or loss recognized by you will generally
be treated as United States source gain or loss. Consequently, in the case of gain from the disposition of ADSs or common shares that
is subject to Peruvian income tax, you may not be able to benefit from a foreign tax credit for that Peruvian income tax (i.e., because
the gain from the disposition would be United States source), unless you can apply the credit (subject to applicable limitations) against
United States federal income tax payable on other income from foreign sources. However, pursuant to the Foreign Tax Credit Regulations,
any such Peruvian income tax would generally not be a foreign income tax eligible for a foreign tax credit (regardless of any other income
that you may have that is from foreign sources). In such case, the non-creditable Peruvian income tax may reduce the amount realized on
the sale, exchange or other taxable disposition of the ADSs or common shares. As discussed above, however, recent notices from the IRS
provide temporary relief by allowing taxpayers that comply with applicable requirements to apply many aspects of the foreign tax credit
regulations as they previously existed (before the release of the current Foreign Tax Credit Regulations) for taxable years ending before
the date that a notice or other guidance withdrawing or modifying the temporary relief is issued (or any later date specified in such
notice or other guidance). If a Peruvian income tax is imposed on the sale, exchange or other taxable disposition of the ADSs or common
shares and you apply such temporary relief, such Peruvian income tax may be eligible for a foreign tax credit or deduction, subject to
the applicable conditions and limitations. You are urged to consult your tax advisors regarding the tax consequences if Peruvian income
tax is imposed on a disposition of ADSs or common shares, including the availability of a foreign tax credit or a deduction under your
particular circumstances.
Passive Foreign Investment Company
We do not believe that we
are, for United States federal income tax purposes, a passive foreign investment company (“PFIC”), and we expect to operate
in such a manner so as not to become a PFIC. If, however, we are or become a PFIC, you could be subject to additional United States federal
income taxes on gain recognized with respect to the ADSs or common shares and on certain distributions, plus an interest charge on certain
taxes treated as having been deferred under the PFIC rules. Non-corporate United States Holders will not be eligible for reduced rates
of taxation on any dividends received from us (as discussed above under “—Taxation of Dividends”) if we are a PFIC in
the taxable year in which such dividends are paid or in the preceding taxable year.
Information Reporting and Backup Withholding
In general, information reporting
will apply to dividends in respect of ADSs or our common shares and the proceeds from the sale, exchange or other taxable disposition
of ADSs or our common shares that are paid to you within the United States (and in certain cases, outside the United States), unless you
establish that you are an exempt recipient. Backup withholding may apply to such payments if you fail to provide a taxpayer identification
number and a certification that you are not subject to backup withholding or if you fail to report in full dividend and interest income.
Backup withholding is not
an additional tax. Any amounts withheld under the backup withholding rules will be allowed as a refund or a credit against your United
States federal income tax liability provided the required information is furnished to the IRS in a timely manner.
The above description is
not intended to constitute a complete analysis of all tax consequences relating to the ownership or disposition of ADSs or our common
shares. You should consult your own tax advisors concerning the overall tax consequences to you, including the consequences under laws
other than United States federal income tax laws, of an investment in ADSs or our common shares.
F.
Dividends and Paying Agents
Not applicable.
G.
Statement by Experts
Not applicable.
H.
Documents on Display
We make our filings in electronic
form under the EDGAR filing system of the SEC. Our filings are available through the EDGAR system at www.sec.gov. In addition, our filings
are available to the public over our website www.cementospacasmayo.com.pe. Such filings and other information on our website are not incorporated
by reference in this annual report. You may request a copy of this filing, and any other report, at no cost, by writing to us at the following
address or telephoning us:
Investor Relations Department
Calle La Colonia 150,
Urbanización El Vivero, Surco,
Lima, Peru
Tel.: + (511) 317-6000
E-mail: cbustamante@cpsaa.com.pe
I.
Subsidiary Information
See note 1 to our consolidated
financial statements included in this annual report for a description of our subsidiaries.
ITEM 11.
QUANTITATIVE AND QUALITATIVE DISCLOSURES ABOUT MARKET RISK
For a description of our market
risks, see note 31 to our consolidated financial statements included in this annual report.
ITEM 12. DESCRIPTION OF SECURITIES OTHER THAN EQUITY SECURITIES
A.
Debt Securities
Not applicable.
B.
Warrants and Rights
Not applicable.
C.
Other Securities
Not applicable.
D.
American Depositary Shares
Fees and expenses
JPMorgan Chase Bank, N.A.,
as depositary, pursuant to our Deposit Agreement, dated as of February 7, 2012, and the amendment dated December 4, 2020 (as so amended
the “Deposit Agreement”), may charge each person to whom ADSs are issued, including, without limitation, issuances against
deposits of common shares, issuances in respect of common share distributions, rights and other distributions, issuances pursuant to a
stock dividend or stock split declared by us or issuances pursuant to a merger, exchange of securities or any other transaction or event
affecting the ADSs or deposited securities, and each person surrendering ADSs for withdrawal of deposited securities or whose ADSs or
American Depositary Receipts representing ADSs (“ADRs”) are cancelled or reduced for any other reason, US$5.00 for each 100
ADSs (or any portion thereof) issued, delivered, reduced, cancelled or surrendered, as the case may be. The depositary may sell (by public
or private sale) sufficient securities and property received in respect of a common share distribution, rights and/or other distribution
prior to such deposit to pay such charge.
The following additional charges
shall be incurred by the ADR holders, by any party depositing or withdrawing common shares or by any party surrendering ADSs or to whom
ADSs are issued (including, without limitation, issuance pursuant to a stock dividend or stock split declared by us or an exchange of
stock regarding the ADRs or the deposited securities or a distribution of ADSs), whichever is applicable:
| ● | a fee of US$1.50 per ADR or ADRs for transfers of certificated or direct registration ADRs; |
| ● | a fee of US$0.05 or less per ADS for any cash distribution made pursuant to the deposit agreement; |
| ● | a fee of US$0.05 or less per ADS per calendar year (or portion thereof) for services performed by the
depositary in administering the ADRs (which fee may be charged on a periodic basis during each calendar year and shall be assessed against
holders of ADRs as of the record date or record dates set by the depositary during each calendar year and shall be payable in the manner
described in the next succeeding provision); |
| ● | reimbursement of such fees, charges and expenses as are incurred by the depositary and/or any of the depositary’s
agents (including, without limitation, the custodian and expenses incurred on behalf of holders in connection with compliance with foreign
exchange control regulations or any law or regulation relating to foreign investment) in connection with the servicing of the common shares
or other deposited securities, the delivery of deposited securities or otherwise in connection with the depositary’s or its custodian’s
compliance with applicable law, rule or regulation (which charge shall be assessed on a proportionate basis against holders as of the
record date or dates set by the depositary and shall be payable at the sole discretion of the depositary by billing such holders or by
deducting such charge from one or more cash dividends or other cash distributions); |
| ● | a fee for the distribution of securities (or the sale of securities in connection with a distribution),
such fee being in an amount equal to US$0.05 per ADS issuance fee for the execution and delivery of ADSs which would have been charged
as a result of the deposit of such securities (treating all such securities as if they were common shares) but which securities or the
net cash proceeds from the sale thereof are instead distributed by the depositary to those holders entitled thereto; |
| ● | stock transfer or other taxes and other governmental charges; |
| ● | cable and facsimile transmission and delivery charges incurred at your request in connection with the
deposit or delivery of common shares; |
| ● | transfer or registration fees for the registration of transfer of deposited securities on any applicable
register in connection with the deposit or withdrawal of deposited securities; and |
| ● | expenses of the depositary in connection with the conversion of foreign currency into U.S. dollars. |
We will pay all other charges
and expenses of the depositary and any agent of the depositary (except the custodian) pursuant to agreements from time to time between
us and the depositary. The charges described above may be amended from time to time by agreement between us and the depositary.
Our depositary has agreed
to reimburse us for certain expenses we incur that are related to establishment and maintenance of the ADR program, including investor
relations expenses and exchange application and listing fees. The amounts of reimbursements available to us are not based upon the amounts
of fees the depositary collects from investors. The depositary collects its fees for issuance and cancellation of ADSs directly from investors
depositing common shares or surrendering ADSs for the purpose of withdrawal or from intermediaries acting on their behalf. The depositary
collects fees for making distributions to investors by deducting those fees from the amounts distributed or by selling a portion of distributable
property to pay the fees. The depositary may collect its annual fee for depositary services by deduction from cash distributions, or by
directly billing investors, or by charging the book-entry system accounts of participants acting for them. The depositary will generally
set off the amounts owing from distributions made to holders of ADSs. If, however, no distribution exists and payment owing is not timely
received by the depositary, the depositary may refuse to provide any further services to holders that have not paid those fees and expenses
owing until such fees and expenses have been paid. At the discretion of the depositary, all fees and charges owing under the deposit agreement
are due in advance and/or when declared owing by the depositary.
The Deposit Agreement is incorporated
by reference as Exhibit 2.2 to this annual report, and Amendment No. 1 thereto is incorporated by reference in this annual report
as Exhibit 2.2A, and Amendment No. 2 thereto is incorporated by reference in this annual report as Exhibit 2.2B. We encourage you to review
these documents carefully if you are a holder of ADRs.
PART II
ITEM 13. DEFAULTS, DIVIDEND ARREARAGES
AND DELINQUENCIES
Not applicable.
ITEM 14. MATERIAL MODIFICATIONS
TO THE RIGHTS OF SECURITY HOLDERS AND USE OF PROCEEDS
Not applicable.
ITEM 15. CONTROLS AND PROCEDURES
A.
Disclosure Controls and Procedures
As of the end of the period
covered by this annual report, the Company’s management, with the participation of our Chief Executive Officer and Chief Financial
Officer, performed an evaluation of the effectiveness of the design and operation of our disclosure controls and procedures as defined
in Rules 13a-15(e) and 15d-15(e) of the Exchange Act. Our disclosure controls and procedures are designed to ensure that information required
to be disclosed in the reports we file or submit under the Exchange Act is recorded, processed, summarized and reported within the time
periods specified in the SEC’s rules and forms, and that such information is accumulated and communicated to our management, including
the Chief Executive Officer and the Chief Financial Officer, to allow timely decisions regarding required disclosures. Any controls and
procedures, no matter how well designed and operated, can provide only reasonable assurance of achieving the desired control objective.
Based on this evaluation, our Chief Executive Officer and Chief Financial Officer concluded that, as of December 31, 2023, the design
and operation of our disclosure controls and procedures were effective at the reasonable assurance level.
B.
Management’s Annual Report on Internal Control Over Financial Reporting
Our management is responsible
for establishing and maintaining adequate internal control over financial reporting. Our internal control over financial reporting is
designed to provide reasonable assurance regarding the reliability of financial reporting and the preparation of the financial statements
for external purposes in accordance with generally accepted accounting principles.
Because of its inherent limitations,
internal control over financial reporting may not necessarily prevent or detect some misstatements. It can only provide reasonable assurance
regarding financial statement preparation and presentation. Also, projections of any evaluation of effectiveness for future periods are
subject to the risk that controls may become inadequate because of changes in conditions or because the degree of compliance with the
policies or procedures may deteriorate over time.
Management assessed the effectiveness
of its internal control over financial reporting for the year ended December 31, 2023. The assessment was based on criteria established
in the framework “Internal Controls—Integrated Framework” issued by the Committee of Sponsoring Organizations of the
Treadway Commission (2013 Framework) (COSO). Based on this assessment, our management has concluded that as of December 31, 2023, our
internal control over financial reporting was effective.
The effectiveness of internal
control over financial reporting as of December 31, 2023, has been audited by Tanaka, Valdivia & Asociados SCRL, member firm of Ernst
& Young Global Limited, an independent registered public accounting firm, as stated in their attestation report, which is included
under “Item 15—Controls and Procedures —C. Attestation Report of Independent Registered Public Accounting Firm.”
C.
Attestation Report of the Independent Registered Public Accounting Firm
Report of the Independent Registered Public
Accounting Firm
To the Board of Directors and Shareholders of Cementos Pacasmayo S.A.A.
and subsidiaries
Opinion on Internal Control Over Financial Reporting
We have audited Cementos Pacasmayo S.A.A. and subsidiaries’ internal
control over financial reporting as of December 31, 2023, based on criteria established in Internal Control—Integrated Framework
issued by the Committee of Sponsoring Organizations of the Treadway Commission (2013 framework), (the COSO criteria). In our opinion,
Cementos Pacasmayo S.A.A. and subsidiaries (the Company) maintained, in all material respects, effective internal control over financial
reporting as of December 31, 2023, based on the COSO criteria.
We also have audited, in accordance with the standards of the Public
Company Accounting Oversight Board (United States) (PCAOB), the consolidated statements of financial position of the Company as of December
31, 2023 and 2022, the related consolidated statements of profit or loss, other comprehensive income (loss), changes in equity and cash
flows for each of the three years in the period ended December 31, 2023, and the related notes and our report dated April 29, 2024 expressed
an unqualified opinion thereon.
Basis for Opinion
The Company’s management
is responsible for maintaining effective internal control over financial reporting and for its assessment of the effectiveness of internal
control over financial reporting included in the accompanying Management’s Annual Report on Internal Control Over Financial Reporting.
Our responsibility is to express an opinion on the Company’s internal control over financial reporting based on our audit. We are
a public accounting firm registered with the PCAOB and are required to be independent with respect to the Company in accordance with the
U.S. federal securities laws and the applicable rules and regulations of the Securities and Exchange Commission and the PCAOB.
We conducted our audit in
accordance with the standards of the PCAOB. Those standards require that we plan and perform the audit to obtain reasonable assurance
about whether effective internal control over financial reporting was maintained in all material respects.
Our audit included obtaining an understanding of internal control over
financial reporting, assessing the risk that a material weakness exists, testing and evaluating the design and operating effectiveness
of internal control based on the assessed risk, and performing such other procedures as we considered necessary in the circumstances.
We believe that our audit provides a reasonable basis for our opinion. Definition and Limitations of Internal Control over Financial Reporting.
Definition and Limitations of Internal Control Over Financial Reporting
A company’s internal control over financial reporting is a process
designed to provide reasonable assurance regarding the reliability of financial reporting and the preparation of financial statements
for external purposes in accordance with generally accepted accounting principles. A company’s internal control over financial reporting
includes those policies and procedures that (1) pertain to the maintenance of records that, in reasonable detail, accurately and fairly
reflect the transactions and dispositions of the assets of the company; (2) provide reasonable assurance that transactions are recorded
as necessary to permit preparation of financial statements in accordance with generally accepted accounting principles, and that receipts
and expenditures of the company are being made only in accordance with authorizations of management and directors of the company; and
(3) provide reasonable assurance regarding prevention or timely detection of unauthorized acquisition, use, or disposition of the company’s
assets that could have a material effect on the financial statements.
Because of its inherent limitations,
internal control over financial reporting may not prevent or detect misstatements. Also, projections of any evaluation of effectiveness
to future periods are subject to the risk that controls may become inadequate because of changes in conditions, or that the degree of
compliance with the policies or procedures may deteriorate.
/s/ Tanaka, Valdivia & Asociados Sociedad Civil de Responsabilidad
Limitada
A member practice of
Ernst & Young Global Limited
Lima, Peru
April 29, 2024
D.
Changes in Internal Control Over Financial Reporting
There have been no changes
in our internal control over financial reporting identified in connection with the evaluation required under Rules 13a-15 or 15d-15 that
occurred during the period covered by this annual report that has materially affected, or is reasonably likely to materially affect, our
internal control over financial reporting.
ITEM 16. [RESERVED]
ITEM 16A. AUDIT COMMITTEE FINANCIAL
EXPERT
Our Board of Directors has
determined that Mr. Esteban Chong Leon, President of the audit committee, is a “financial expert,” as such term is defined
in the SEC rules. We have determined that Ms. Ana Maria Botella, Mr. Venkat Krishnamurti and Mr. Esteban Chong Leon are independent
under the standards of the New York Stock Exchange listing rules and Rule 10A-3 under the Exchange Act.
ITEM 16B. CODE OF ETHICS
We have adopted a code of
ethics that applies to our directors, officers and employees. Our code of ethics is available on our website http://www.cementospacasmayo.com.pe.
Information on our website is not incorporated by reference in this annual report.
If we make any substantive
amendment to our code of ethics or if we grant any waivers, including any implicit waiver, from a provision of the code of ethics, we
will disclose the nature of such amendment or waiver by filing a current report on a Form 6-K or in our subsequent annual report on Form
20-F to be filed with the SEC. During the year ended December 31, 2023, no such amendment was made nor did we grant any waiver to any
provision of our code of ethics.
ITEM 16C. PRINCIPAL ACCOUNTANT
FEES AND SERVICES
Audit and Non-Audit Fees
The following table presents
the aggregate fees for professional services and other services rendered by our independent auditors, Tanaka, Valdivia y asociados, SCRL,
member firm of Ernst & Young Global Limited, responsible for auditing the annual consolidated financial statements included in the
annual report, during the fiscal years ended December 31, 2023, 2022, and 2021.
| | |
Year Ended December 31, | |
| (in thousands of S/) | |
2023 | | |
2022 | | |
2021 | |
| Audit fees | |
| 1,190 | | |
| 1,244 | | |
| 1,208 | |
| All other fees | |
| 117 | | |
| 45 | | |
| - | |
| Tax fees | |
| 206 | | |
| 497 | | |
| 256 | |
| Total fees | |
| 1,513 | | |
| 1,786 | | |
| 1,464 | |
Audit fees in the above table
are the aggregate fees billed and billable by our independent auditors in connection with the audit of our annual consolidated financial
statements and review of our quarterly financial information.
Tax fees in the above table
are fees billed relating to tax compliance services.
All other fees in the above
table are fees billed relating to advisory services.
Audit Committee Pre-Approval
Policies and Procedures
We
have adopted pre-approval policies and procedures under which our audit committee is responsible for the oversight of the independent
auditors and has established pre-approval procedures for the engagement of its independent registered public accounting firm for audit
and non-audit services. Such services can only be contracted if they are approved by the audit committee, they comply with the restriction
provided under applicable rules and they do not jeopardize the independence of our auditors.
ITEM 16D. EXEMPTIONS FROM THE
LISTING STANDARDS FOR AUDIT COMMITTEES
Not applicable.
ITEM 16E. PURCHASES OF EQUITY
SECURITIES BY THE ISSUER AND AFFILIATED PURCHASERS
Not applicable.
ITEM 16F. CHANGE IN REGISTRANT’S
CERTIFYING ACCOUNTANT
Not applicable.
ITEM 16G. CORPORATE GOVERNANCE
We are a “foreign private
issuer” within the meaning of the New York Stock Exchange corporate governance standards. Under New York Stock Exchange rules, a
foreign private issuer may elect to comply with the practices of its home country and not to comply with certain corporate governance
requirements applicable to U.S. companies with securities listed on the exchange.
We currently follow certain
Peruvian practices concerning corporate governance and intend to continue to do so. There are significant differences in the Peruvian
corporate governance practices as compared to those followed by United States domestic companies under the New York Stock Exchange’s
listing standards.
The New York Stock Exchange
listing standards provide that the board of directors of a U.S. listed company must have a majority of independent directors at the time
the company ceases to be a “controlled company.” Under Peruvian corporate governance practices, a Peruvian company is not
required to have a majority of independent members on its board of directors.
The listing standards for
the New York Stock Exchange also require that U.S. listed companies, at the time they cease to be “controlled companies,”
have a nominating/corporate governance committee and a compensation committee (in addition to an audit committee). Each of these committees
must consist solely of independent directors and must have a written charter that addresses certain matters specified in the listing standards.
Under Peruvian law, a Peruvian company may, but is not required to, form special governance committees, which may be composed partially
or entirely of non-independent directors.
In addition, New York Stock
Exchange rules require the independent non-executive directors of U.S. listed companies to meet on a regular basis without management
being present. There is no similar requirement under Peruvian law.
The New York Stock Exchange’s
listing standards also require U.S. listed companies to adopt and disclose corporate governance guidelines. In November 2013, the Peruvian
Securities Commission and a committee comprised of regulatory agencies and associations prepared and published a list of suggested non-mandatory
corporate governance guidelines called the “Good Corporate Governance Code for Peruvian Companies.” These principles are disclosed
on the Peruvian Securities Commission web page at http:// http://www.smv.gob.pe/ and the Lima Stock Exchange web page at http://www.bvl.com.pe.
Although we have implemented a number of these measures and are part of the Best Corporate Governance Practices Index of the Lima Stock
Exchange, we are not required to comply with the referred corporate governance guidelines by law or regulation, only to disclose whether
or not we are in compliance.
ITEM 16H. MINE SAFETY DISCLOSURE
Not applicable.
ITEM
16I. DISCLOSURE REGARDING FOREIGN JURISDICTIONS THAT PREVENT INSPECTIONS
Not applicable.
ITEM 16K. CYBERSECURITY
Risk Management and
Strategy
Cementos Pacasmayo considers risk management to be a fundamental pillar
of its strategy. The Company therefore evaluates threats and vulnerabilities, identifies its critical assets and quantifies the associated
risk at least twice a year or sooner if warranted. Identified risks are confirmed at the senior management to determine whether, due to
their importance, they should be considered strategic risks, and different remediation or mitigation mechanisms relating to such risks
are evaluated. For example, cybersecurity risks have been evaluated and determined to be strategic risks for the following reasons:
| ● | economic impact due to loss of information and interruption
of our operations due to attacks on our information systems and failures of our systems that support business processes and guarantee
continuity; and |
| ● | economic and reputational impact due to cyberattacks (phishing,
malware, etc.) due to lack of patches or inadequate patch management, lack of secure identification and authentication mechanisms (AD
authentication, complex passwords, tokens, captcha, etc.), poor password management and lack of protection against new generation threats. |
Cementos Pacasmayo’s cybersecurity strategy is based on the NIST
1.1 framework. Specifically, when referring to the identification and management of cybersecurity risks and threats that could compromise
the Company, Cementos Pacasmayo has developed a methodology for risk management of information security based on ISO/IEC 27005. This systematic
method allows the Company’s management to make appropriate decisions. Besides that, during 2023, we underwent an assessment by KPMG,
the purpose of which was to evaluate our information security management system maturity level, since we are opting for the ISO 270001
certification in 2024. Our overall risk management system maturity index is also evaluated by insurance companies such as MARSH PERU S.AC.
CORREDORES DE SEGUROS and RIMAC SEGUROS Y REASEGUROS.
The
Company identifies and oversees risks internally. The audit committee of the Company has defined what a material cybersecurity risk is,
so that the occurrence of a cybersecurity incident can be reported to the SEC. During 2023, Cementos Pacasmayo did not identify any threats
that materially affected, or were reasonably likely to materially affect, its business strategy, results of operations or financial condition.
As part of our information security policies, we have established the standards for access to and use of our information systems by employees
or by third parties. In addition, we have established a new policy specifically relating to the access to and use of our information systems
by third parties, which sets forth the conditions any third party must comply with in order to have any access to our information systems.
We are in the process of establishing these policies as obligations in all of the Company’s contracts during 2024.
Finally,
twice a year we run ethical hacking and pen-testing to evaluate our risks and vulnerabilities, and we have engaged an ethical hacking
service which runs automatically when we perform spot exercises in our information systems (in-house and third party solutions).
However,
despite our efforts to identify and respond to cybersecurity threats, we cannot eliminate all risks from cybersecurity threats, or provide
assurances that we have not experienced an undetected cybersecurity incident. For more information about these risks, see “Item
3D. Risk Factors—Risks Relating to Our Business and Industry—Failures in our information technology systems and information
security (cybersecurity) systems can adversely impact our operations and reputation.”
Governance
Role of the Board
The Board, in coordination with the audit committee, which is the corporate
body in charge of centralizing corporate risks, oversees the Company’s risk management program, which includes risks arising from
cybersecurity threats. The audit committee is promptly apprised of any cybersecurity incident that meets established reporting thresholds
by senior management and receives ongoing updates regarding any such incident until it has been resolved. The audit committee meets quarterly
and reviews the corporate risk matrix in detail, including cybersecurity risks. At each regularly scheduled Board meeting, the chair of
the audit committee provides the full Board with an update on all significant matters discussed, reviewed, considered and approved by
the audit committee since the last regularly scheduled.
We have established a Policy for Response to Cybersecurity Incidents,
and a related plan, which includes four playbooks (covering ransomware, phishing, DOS and malware) on how to respond to each type of incident
and the specificities to communications matters, to our legal, compliance, risk management and audit committee. This policy and these
plans are part of our Disaster Recovery Plan (DRP) which is also part of our Business Continuity Plan (BCP).
Role of Management
Senior management is highly
committed to maintaining corporate cybersecurity and is cognizant of cybersecurity risks and threats and the potential impact of the occurrence
of cybersecurity incidents, which is evidenced by the review and oversight of such matters by the audit committee and the cybersecurity
subcommittees and has provided the necessary resources for the mitigation of such risks. In addition to the audit committee at the Board
level, we also have two cybersecurity sub committees (IT & OT), each of which meets quarterly, with the presence of the Company’s
senior executive officers. All participants in the subcommittee meetings receive a copy of the presentation for each meeting, which sets
forth the applicable subcommittee’s role, strategy, project status (culture, risks, IT/OT and policies) and relevant information
(our key performance metrics and POCs on cybersecurity technology, cybersecurity lab results, etc.), and meeting minutes, which include
a summary of the information to be discussed and the principal action points.
Our chief information officer is principally responsible for overseeing our cybersecurity strategy and risk management,
and he leads both of our cybersecurity subcommittees (IT & OT). Our chief information officer has been heading up our cybersecurity
strategy since we formally established it three years ago, and he holds the following certifications:
| ● | MIT Sloan School of Management – Cybersecurity for Managers
Executive Program – August 2021 |
| ● | Instituto Atlantico de Gobierno (Madrid, Spain) – Cybersecurity
on a Daily Basis Executive Program – February 2021 |
| ● | Instituto Atlantico de Gobierno (Madrid, Spain) – Cybersecurity
Keys and trends 2020 Executive Program – May 2020 |
All of Cementos Pacasmayo’s
senior executive officers have been trained in cybersecurity matters and are the main promoters of our corporate cybersecurity culture
and compliance with the established internal framework, which includes policies, guidelines and cybersecurity standards, among others.
SECTION
1.02 PART III
ITEM 17. FINANCIAL STATEMENTS
Not applicable.
ITEM 18. FINANCIAL STATEMENTS
See our consolidated financial
statements beginning at page F-1 of this annual report. Our financial statements have been prepared in accordance with IFRS as issued
by the IASB.
ITEM 19. EXHIBITS
The following documents are filed as part of this
Annual Report on Form 20-F or incorporated by reference herein.
Exhibit
Number |
|
Description of Document |
| 1.1 |
|
Amended and Restated By-laws of the Registrant, as currently in effect, incorporated by reference to Exhibit 1.1 of the Registrant’s Annual Report on Form 20-F filed with the SEC on May 1, 2017 (File No. 001-35401) |
| 2.1 |
|
Registrant’s Form of American Depositary Receipt, incorporated by reference to Exhibit 4.1 to the Registrant’s Registration Statement on Form F-1 filed with the SEC on January 6, 2012 (File No. 333-178922) |
| 2.2 |
|
Deposit Agreement dated January 19, 2012 among the Registrant, J.P. Morgan Chase N.A., as depositary, and the holders from time to time of American depositary shares issued thereunder, incorporated by reference to Exhibit 4.2 to the Registrant’s Registration Statement on Form F-1 filed with the SEC on January 6, 2012 (File No. 333-178922) |
| 2.2A |
|
Amendment No. 1, dated as of February 21, 2017, to the Deposit Agreement dated as of February 7, 2012, among the Registrant, J.P. Morgan Chase Bank, N.A., as depositary, and all holders from time to time of American depositary receipts issued thereunder, incorporated by reference to the Registrant’s Registration Statement on Form F-6 filed with the SEC on February 21, 2017 (File No. 333-216152) |
| 2.2B |
|
Amendment No. 2, dated as of December 4, 2020, to the Deposit Agreement dated as of February 7, 2012, among the Registrant, J.P. Morgan Chase Bank, N.A., as depositary, and all holders from time to time of American depositary receipts issued thereunder, incorporated by reference to the Registrant’s Registration Statement on Form F-6 filed with the SEC on December 4, 2020 (File No. 333-216152) |
| 2.3 |
|
Indenture, dated as of February 8, 2013, among the Registrant, the Subsidiary Guarantors named therein and Deutsche Bank Trust Company Americas incorporated by reference to Exhibit 2.3 of the Registrant’s Annual Report on Form 20-F filed with the SEC on April 30, 2014 (File No. 001-35401) |
| 2.4 |
|
Local bond issuance agreement (Contrato Marco de Emisión de Bonos Corporativos correspondiente al Segundo Programa de Bonos Corporativos de Cementos Pacasmayo S.A.A.) dated January 8, 2019, between Scotiabank Perú S.A.A. as administrative agent and Cementos Pacasmayo S.A.A. as issuer (English summary of principal terms), providing for the issuance of up to S/1,000,000,000 in one or more series, and related issuances of series 1 in an aggregate principal amount of S/260,000,000 and series 2 in an aggregate principal amount of S/310 million, incorporated by reference to Exhibit 4.3 of the Registrant’s Annual Report on Form 20-F filed with the SEC on April 30, 2019 (File No. 001-35401) |
| 2(d) |
|
Description of securities registered under Section 12(d) of the Exchange Act incorporated by reference to Exhibit 2(d) of the Registrant’s Annual Report on Form 20-F filed with the SEC on May 1, 2020 (File No. 001-35401) |
| 4.1 |
|
Power Supply Agreement, dated June 3, 2010, between the Registrant and Electroperú S.A., incorporated by reference to Exhibit 4.1 of the Registrant’s Annual Report on Form 20-F filed with the SEC on April 30, 2012 (File No. 001-35401) |
| 4.2 |
|
Contract of General Management and Provision of Services, dated December 31, 2007, between the Registrant and Inversiones ASPI S.A. (formerly Inversiones Pacasmayo S.A.), incorporated by reference to Exhibit 4.2 of the Registrant’s Annual Report on Form 20-F filed with the SEC on April 30, 2012 (File No. 001-35401) |
| 4.3 |
|
Property Lease Agreement, dated June 30, 2008, between the Registrant and Inversiones ASPI S.A. (formerly Inversiones Pacasmayo S.A.), incorporated by reference to Exhibit 4.3 of the Registrant’s Annual Report on Form 20-F filed with the SEC on April 30, 2012 (File No. 001-35401) |
| 4.4 |
|
Surface Rights Agreement, dated February 1, 2008, between the Registrant and Compañía Minera Ares S.A.C., incorporated by reference to Exhibit 4.4 of the Registrant’s Annual Report on Form 20-F filed with the SEC on April 30, 2012 (File No. 001-35401) |
|
4.5
|
|
Addendum, effective February 1, 2020, to the Power Supply Agreement, dated June 3, 2010, between the Registrant and Electroperú S.A., incorporated by reference to Exhibit 4.5 of the Registrant’s Annual Report on Form 20-F filed with the SEC on May 1, 2020 (File No. 001-35401) |
| 4.6 |
|
Summary of Principal Terms for Equipment and Engineering supply contract between the Registrant and FL SMIDTTH A/S dated November 29, 2021, incorporated by reference to Exhibit 4.6 of the Registrant’s Annual Report on Form 20-F filed with the SEC on April 28, 2022 (File No. 001-35401) |
| 4.7 |
|
Summary of Principal Terms for Construction and Assembly Contract between the Registrant and Ingeniería y Construcción Sigdo Koppers Perú S.A.C. dated February 16, 2022, incorporated by reference to Exhibit 4.7 of the Registrant’s Annual Report on Form 20-F filed with the SEC on April 28, 2022 (File No. 001-35401) |
| 8.1 |
|
List of Subsidiaries, incorporated by reference to Exhibit 4.7 of the Registrant’s Annual Report on Form 20-F filed with the SEC on April 27, 2023 (File No. 001-35401)
|
| 12.1 |
|
Certification of the Chief Executive Officer pursuant to Section 302 of the Sarbanes-Oxley Act of 2002 |
| 12.2 |
|
Certification of the Chief Financial Officer pursuant to Section 302 of the Sarbanes-Oxley Act of 2002 |
| 13.1* |
|
Certification pursuant to 18 U.S.C. 1350, as adopted pursuant to Section 906 of the Sarbanes-Oxley Act of 2002 for Chief Executive Officer |
| 13.2* |
|
Certification pursuant to 18 U.S.C. 1350, as adopted pursuant to Section 906 of the Sarbanes-Oxley Act of 2002 for Chief Financial Officer |
| 96.1 |
|
Technical Report Summary (TRS), Tembladera Quarry and Pacasmayo Cement Plant 20-F 229.601 (Item 601) |
| 96.2 |
|
Technical Report Summary (TRS), Virrilá Quarry and Piura Cement Plant 20-F 229.601 (Item 601) |
| 96.3 |
|
Technical Report Summary (TRS), Tioyacu Quarry and Rioja Cement Plant 20-F 229.601 (Item 601) |
| 97 |
|
Compensation Recovery Policy |
| 101.INS |
|
Inline XBRL Instance Document. |
| 101.SCH |
|
Inline XBRL Taxonomy Extension Schema Document. |
| 101.CAL |
|
Inline XBRL Taxonomy Extension Calculation Linkbase Document. |
| 101.DEF |
|
Inline XBRL Taxonomy Extension Definition Linkbase Document. |
| 101.LAB |
|
Inline XBRL Taxonomy Extension Label Linkbase Document. |
| 101.PRE |
|
Inline XBRL Taxonomy Extension Presentation Linkbase Document. |
| 104 |
|
Cover Page Interactive Data File (formatted as Inline XBRL and contained in Exhibit 101). |
| * | This certification will not be deemed “filed” for purposes of Section 18 of the Exchange Act
(15 U.S.C. 78r), or otherwise subject to the liability of that section. Such certification will not be deemed to be incorporated by reference
into any filing under the Securities Act or the Exchange Act, except to the extent that the Registrant specifically incorporates it by
reference. |
SIGNATURES
The registrant hereby certifies
that it meets all of the requirements for filing on Form 20-F and that it has duly caused and authorized the undersigned to sign this
annual report on Form 20-F on its behalf.
| |
CEMENTOS PACASMAYO S.A.A. |
| |
|
|
| |
By: |
/s/ Humberto Nadal Del Carpio |
| |
|
Humberto Nadal Del Carpio
Chief Executive Officer
|
| |
|
|
| |
By: |
/s/ Manuel Bartolome Ferreyros Peña |
| |
|
Manuel Bartolome Ferreyros Peña |
| |
|
Chief Financial Officer |
Date: April 29, 2024
Cementos Pacasmayo S.A.A. and Subsidiaries
Consolidated
financial statements as of December 31, 2023 and 2022 and for the
years ended December 31, 2023, 2022 and 2021, together with the
Report of
Independent Registered Accounting Firm
Cementos Pacasmayo S.A.A. and Subsidiaries
Consolidated financial statements as of December 31, 2023 and 2022
and for the years ended December 31, 2023, 2022 and 2021, together with the Report of Independent Registered Accounting Firm
Contents
Report of Independent
Registered Public Accounting Firm
To the Board of Directors and Shareholders of Cementos Pacasmayo S.A.A.
and subsidiaries
Opinion on the Financial Statements
We have audited the accompanying consolidated
statements of financial position of Cementos Pacasmayo S.A.A. and subsidiaries (the Company) as of December 31, 2023 and 2022, the related
consolidated statements of profit or loss, other comprehensive income (loss), changes in equity and cash flows for each of the three
years in the period ended December 31, 2023, and the related notes (collectively referred to as the “consolidated financial statements“).
In our opinion, the consolidated financial statements present fairly, in all material respects, the financial position of the Company
as of December 31, 2023 and 2022, and the results of its operations and its cash flows for each of the three years in the period ended
December 31, 2023, in conformity with International Financial Reporting Standards as issued by the International Accounting Standards
Board.
We also have audited, in accordance with the standards of the Public
Company Accounting Oversight Board (United States) (PCAOB), the Company’s internal control over financial reporting as of December
31, 2023, based on criteria established in Internal Control - Integrated Framework issued by the Committee of Sponsoring Organizations
of the Treadway Commission (2013 framework) and our report dated April 29, 2024, expressed an unqualified opinion thereon.
Basis for opinion
These financial statements are the responsibility
of the Company‘s management. Our responsibility is to express an opinion on the Company‘s financial statements based on our
audits. We are a public accounting firm registered with the PCAOB and are required to be independent with respect to the Company in accordance
with the U.S. federal securities laws and the applicable rules and regulations of the Securities and Exchange Commission and the PCAOB.
We conducted our audits in accordance with the
standards of the PCAOB. Those standards require that we plan and perform the audit to obtain reasonable assurance about whether the financial
statements are free of material misstatement, whether due to error or fraud. Our audits included performing procedures to assess the risks
of material misstatement of the financial statements, whether due to error or fraud, and performing procedures that respond to those risks.
Such procedures included examining, on a test basis, evidence regarding the amounts and disclosures in the financial statements. Our audits
also included evaluating the accounting principles used and significant estimates made by management, as well as evaluating the overall
presentation of the financial statements. We believe that our audits provide a reasonable basis for our opinion.
Critical Audit Matter
The critical audit matter communicated below is a matter arising from
the current period audit of the financial statements that was communicated or required to be communicated to the audit committee and that:
(1) relates to accounts or disclosures that are material to the financial statements and (2) involved our especially challenging, subjective
or complex judgments. The communication of the critical audit matter does not alter in any way our opinion on the consolidated financial
statements, taken as a whole, and we are not, by communicating the critical audit matter below, providing a separate opinion on the critical
audit matter or on the accounts or disclosures to which it relates.
| |
Uncertain tax positions |
| |
|
| Description of the Matter |
As disclosed in Note 7(c) to the consolidated
financial statements, the Company has identified certain income tax-related contingencies associated to the mining royalties of years
2008 and 2009. In these years, relevant taxation authorities have challenged the tax treatment applied by the Company under the royalty
law for metallic and non-metallic mining activity in Peru. As of December 31, 2023, the Company has recognized an asset for claims to
the SUNAT for an amount of S/29,559,000, resulting from payments made to the taxation authorities as part of the tax claim process in
Peru but for which the Company is disputing the validity of the taxation authorities’ assessment. The Company has disclosed, but
has not recorded a provision, related to these matters as management has concluded that the criteria for recognition of an income tax
liability under IFRS has not been met and that the amounts paid to date are recoverable based upon the technical merits of the income
tax positions of royalty law for metallic and non-metallic mining activity taken by the Company.
Uncertainty in a tax position may arise where
there is an uncertainty as to the meaning of the tax law, or the applicability of the tax law (General Mining Law) to a particular transaction,
or both. The Company uses significant judgment to determine whether, based on the technical merits, a tax position is more likely than
not to be sustained and in the determination of the recoverable amount of the mining royalties paid under protest.
Auditing the estimation of the outcome and measurement of the uncertain
tax positions and the related recoverability of the claim for the payments made under protest, before the uncertain tax treatment is resolved,
requires a high degree of auditor judgment and significant audit effort due to the complexity and judgement used by the Company in the
assessment based on interpretations of the income tax legislation and legal rulings in Peru.
|
| |
|
| How We Addressed the Matter in Our Audit |
We obtained an understanding, evaluated the design
and tested the operating effectiveness of controls over the Company’s accounting process for income taxes, including uncertain tax
positions and tax contingencies. For example, we tested the controls over management’s review of the technical merits of tax positions,
disputed tax assessments and the determination of the recoverable amount of the payments made under protest.
Our audit procedures included, among others, evaluating
the assumptions used by the Company to develop its uncertain tax positions based on relevant Peruvian income tax laws, including the inspection
of the Company´s internal and external counsel analysis of these matters. In addition, we involved our tax subject matter professionals
to assess the technical merits of the Company’s tax position and to evaluate the application of relevant tax law and accounting
guidance in assessing the recognition and recoverability of the related asset claim to the SUNAT.
Furthermore, we evaluated the disclosure of this matter in Note 7(c)
to the consolidated financial statements.
|
/s/ Tanaka, Valdivia & Asociados Sociedad Civil de Responsabilidad
Limitada
A member practice of
Ernst & Young Global Limited
We have served as the Company’s auditor
since 2002.
Lima, Peru
April 29, 2024
Cementos Pacasmayo S.A.A. and Subsidiaries
Consolidated statement of financial position
As of December 31, 2023 and 2022
| | |
Note | |
2023 | | |
2022 | |
| | |
| |
S/(000) | | |
S/(000) | |
| Assets | |
| |
| | |
| |
| Current assets | |
| |
| | |
| |
| Cash and cash equivalents | |
6 | |
| 90,193 | | |
| 81,773 | |
| Other financial instruments | |
26 | |
| - | | |
| 86,893 | |
| Trade and other receivables, net | |
7 | |
| 99,688 | | |
| 101,491 | |
| Income tax prepayments | |
| |
| 4,485 | | |
| 8,268 | |
| Inventories | |
8 | |
| 791,074 | | |
| 884,969 | |
| Prepayments | |
| |
| 6,809 | | |
| 25,059 | |
| Total current assets | |
| |
| 992,249 | | |
| 1,188,453 | |
| | |
| |
| | | |
| | |
| Non-current assets | |
| |
| | | |
| | |
| Trade and other receivables, net | |
7 | |
| 43,397 | | |
| 43,543 | |
| Financial investments designated at fair value through other comprehensive income | |
| |
| 249 | | |
| 274 | |
| Property, plant and equipment, net | |
9 | |
| 2,099,351 | | |
| 2,007,838 | |
| Intangible assets, net | |
10 | |
| 62,920 | | |
| 56,861 | |
| Goodwill | |
| |
| 4,459 | | |
| 4,459 | |
| Deferred income tax assets | |
14 | |
| 11,428 | | |
| 9,005 | |
| Right of use assets | |
| |
| 7,609 | | |
| 3,639 | |
| Other assets | |
| |
| 73 | | |
| 89 | |
| Total non-current assets | |
| |
| 2,229,486 | | |
| 2,125,708 | |
| Total assets | |
| |
| 3,221,735 | | |
| 3,314,161 | |
| | |
| |
| | | |
| | |
| Liabilities and equity | |
| |
| | | |
| | |
| Current liabilities | |
| |
| | | |
| | |
| Trade and other payables | |
11 | |
| 231,511 | | |
| 284,554 | |
| Financial obligations | |
13 | |
| 383,146 | | |
| 618,907 | |
| Lease liabilities | |
| |
| 3,999 | | |
| 2,005 | |
| Income tax payable | |
| |
| 14,222 | | |
| 16,340 | |
| Provisions | |
12 | |
| 56,510 | | |
| 31,333 | |
| Total current liabilities | |
| |
| 689,388 | | |
| 953,139 | |
| | |
| |
| | | |
| | |
| Non-current liabilities | |
| |
| | | |
| | |
| Financial obligations | |
13 | |
| 1,189,880 | | |
| 974,264 | |
| Lease liabilities | |
| |
| 4,130 | | |
| 2,350 | |
| Provisions | |
12 | |
| 27,453 | | |
| 47,638 | |
| Deferred income tax liabilities | |
14 | |
| 120,876 | | |
| 141,635 | |
| Total non-current liabilities | |
| |
| 1,342,339 | | |
| 1,165,887 | |
| Total liabilities | |
| |
| 2,031,727 | | |
| 2,119,026 | |
| | |
| |
| | | |
| | |
| Equity | |
15 | |
| | | |
| | |
| Capital stock | |
| |
| 423,868 | | |
| 423,868 | |
| Investment shares | |
| |
| 40,279 | | |
| 40,279 | |
| Investment shares held in treasury | |
| |
| (121,258 | ) | |
| (121,258 | ) |
| Additional paid-in capital | |
| |
| 432,779 | | |
| 432,779 | |
| Legal reserve | |
| |
| 168,636 | | |
| 168,636 | |
| Other accumulated comprehensive loss | |
| |
| (16,290 | ) | |
| (17,787 | ) |
| Retained earnings | |
| |
| 261,994 | | |
| 268,618 | |
| Total equity | |
| |
| 1,190,008 | | |
| 1,195,135 | |
| Total liabilities and equity | |
| |
| 3,221,735 | | |
| 3,314,161 | |
The accompanying notes are an integral part of these consolidated
financial statements.
Cementos Pacasmayo S.A.A. and Subsidiaries
Consolidated statement of profit or loss
For the years ended December 31, 2023, 2022 and
2021
| | |
Note | |
2023 | | |
2022 | | |
2021 | |
| | |
| |
S/(000) | | |
S/(000) | | |
S/(000) | |
| | |
| |
| | |
| | |
| |
| Sales of goods | |
16 | |
| 1,950,075 | | |
| 2,115,746 | | |
| 1,937,767 | |
| Cost of sales | |
17 | |
| (1,260,623 | ) | |
| (1,463,715 | ) | |
| (1,378,336 | ) |
| Gross profit | |
| |
| 689,452 | | |
| 652,031 | | |
| 559,431 | |
| | |
| |
| | | |
| | | |
| | |
| Operating income (expenses) | |
| |
| | | |
| | | |
| | |
| Administrative expenses | |
18 | |
| (234,711 | ) | |
| (227,577 | ) | |
| (196,069 | ) |
| Selling and distribution expenses | |
19 | |
| (66,825 | ) | |
| (65,237 | ) | |
| (51,520 | ) |
| Other operating (expense) income, net | |
| |
| (13,810 | ) | |
| (3,899 | ) | |
| 6,408 | |
| Impairment to retirement of property, plant and equipment | |
9(g) | |
| (36,551 | ) | |
| - | | |
| - | |
| Total operating expenses, net | |
| |
| (351,897 | ) | |
| (296,713 | ) | |
| (241,181 | ) |
| Operating profit | |
| |
| 337,555 | | |
| 355,318 | | |
| 318,250 | |
| | |
| |
| | | |
| | | |
| | |
| Other income (expenses) | |
| |
| | | |
| | | |
| | |
| Finance income | |
| |
| 7,246 | | |
| 3,306 | | |
| 2,891 | |
| Finance costs | |
21 | |
| (104,045 | ) | |
| (95,105 | ) | |
| (88,965 | ) |
| Net gain (loss) on derivative financial instruments recognized at fair value through profit or loss | |
26(a) | |
| 19 | | |
| (59 | ) | |
| 589 | |
| Net loss on settlement of derivative financial instruments recognized at fair value through profit or loss | |
26(a) | |
| - | | |
| - | | |
| (1,569 | ) |
| Gain (loss) from exchange difference, net | |
5 | |
| 4,933 | | |
| (1,040 | ) | |
| (7,086 | ) |
| Total other expenses, net | |
| |
| (91,847 | ) | |
| (92,898 | ) | |
| (94,140 | ) |
| Profit before income tax | |
| |
| 245,708 | | |
| 262,420 | | |
| 224,110 | |
| | |
| |
| | | |
| | | |
| | |
| Income tax expense | |
14 | |
| (76,808 | ) | |
| (85,592 | ) | |
| (70,940 | ) |
| | |
| |
| | | |
| | | |
| | |
| Profit for the year | |
| |
| 168,900 | | |
| 176,828 | | |
| 153,170 | |
| | |
| |
| | | |
| | | |
| | |
| Earnings per share | |
| |
| | | |
| | | |
| | |
Basic and diluted earnings per share attributable to equity holders of common shares and investment in shares of Cementos Pacasmayo S.A.A. (S/ per share) | |
23 | |
| 0.39 | | |
| 0.41 | | |
| 0.36 | |
The accompanying notes are an integral part of these consolidated
financial statements.
Cementos Pacasmayo S.A.A. and Subsidiaries
Consolidated statement of other comprehensive income (loss)
For the years ended December 31, 2023, 2022 and
2021
| | |
Note | |
2023 | | |
2022 | | |
2021 | |
| | |
| |
S/(000) | | |
S/(000) | | |
S/(000) | |
| | |
| |
| | |
| | |
| |
| Profit for the year | |
| |
| 168,900 | | |
| 176,828 | | |
| 153,170 | |
| Other comprehensive income (loss) | |
| |
| | | |
| | | |
| | |
| Other comprehensive income (loss) that will not be reclassified to profit or loss in subsequent years: | |
| |
| | | |
| | | |
| | |
| Change in fair value of financial instruments designated at fair value through other comprehensive loss | |
| |
| (25 | ) | |
| (565 | ) | |
| (1,995 | ) |
| Deferred income tax | |
14 | |
| 7 | | |
| 167 | | |
| 589 | |
| Other comprehensive income (loss) to be reclassified to profit or loss in subsequent years: | |
| |
| | | |
| | | |
| | |
| Net gain on cash flows hedges | |
26(a) | |
| 2,154 | | |
| 3,838 | | |
| 20,836 | |
| Deferred income tax | |
14 | |
| (634 | ) | |
| (1,133 | ) | |
| (6,146 | ) |
| Other comprehensive income (loss) for the year, net of income tax | |
| |
| 1,502 | | |
| 2,307 | | |
| 13,284 | |
| | |
| |
| | | |
| | | |
| | |
| Total other comprehensive income for the year, net of income tax | |
| |
| 170,402 | | |
| 179,135 | | |
| 166,454 | |
The accompanying notes are an integral part of these consolidated
financial statements.
Cementos Pacasmayo S.A.A. and Subsidiaries
Consolidated statement of changes in equity
For the years ended December 31, 2023, 2022 and
2021
| | |
Capital
stock | | |
Investment
shares | | |
Treasury shares | | |
Additional paid-in capital | | |
Legal
reserve | | |
Unrealized loss on financial instruments designated at fair value | | |
Unrealized gain (loss) on cash flow hedge | | |
Retained earnings | | |
Total | |
| | |
S/(000) | | |
S/(000) | | |
S/(000) | | |
S/(000) | | |
S/(000) | | |
S/(000) | | |
S/(000) | | |
S/(000) | | |
S/(000) | |
| | |
| | |
| | |
| | |
| | |
| | |
| | |
| | |
| | |
| |
| | |
| | |
| | |
| | |
| | |
| | |
| | |
| | |
| | |
| |
| Balance as of January 1, 2021 | |
| 423,868 | | |
| 40,279 | | |
| (121,258 | ) | |
| 432,779 | | |
| 168,636 | | |
| (14,463 | ) | |
| (18,915 | ) | |
| 456,629 | | |
| 1,367,555 | |
| Profit for the year | |
| - | | |
| - | | |
| - | | |
| - | | |
| - | | |
| - | | |
| - | | |
| 153,170 | | |
| 153,170 | |
| Other comprehensive income (loss) | |
| - | | |
| - | | |
| - | | |
| - | | |
| - | | |
| (1,406 | ) | |
| 14,690 | | |
| - | | |
| 13,284 | |
| Total comprehensive income | |
| - | | |
| - | | |
| - | | |
| - | | |
| - | | |
| (1,406 | ) | |
| 14,690 | | |
| 153,170 | | |
| 166,454 | |
| Dividends, note 15(g) | |
| - | | |
| - | | |
| - | | |
| - | | |
| - | | |
| - | | |
| - | | |
| (338,204 | ) | |
| (338,204 | ) |
| | |
| | | |
| | | |
| | | |
| | | |
| | | |
| | | |
| | | |
| | | |
| | |
| Balance as of December 31, 2021 | |
| 423,868 | | |
| 40,279 | | |
| (121,258 | ) | |
| 432,779 | | |
| 168,636 | | |
| (15,869 | ) | |
| (4,225 | ) | |
| 271,595 | | |
| 1,195,805 | |
| Profit for the year | |
| - | | |
| - | | |
| - | | |
| - | | |
| - | | |
| - | | |
| - | | |
| 176,828 | | |
| 176,828 | |
| Other comprehensive income (loss) | |
| - | | |
| - | | |
| - | | |
| - | | |
| - | | |
| (398 | ) | |
| 2,705 | | |
| - | | |
| 2,307 | |
| Total comprehensive income | |
| - | | |
| - | | |
| - | | |
| - | | |
| - | | |
| (398 | ) | |
| 2,705 | | |
| 176,828 | | |
| 179,135 | |
| Dividends, note 15(g) | |
| - | | |
| - | | |
| - | | |
| - | | |
| - | | |
| - | | |
| - | | |
| (179,805 | ) | |
| (179,805 | ) |
| | |
| | | |
| | | |
| | | |
| | | |
| | | |
| | | |
| | | |
| | | |
| | |
| Balance as of December 31, 2022 | |
| 423,868 | | |
| 40,279 | | |
| (121,258 | ) | |
| 432,779 | | |
| 168,636 | | |
| (16,267 | ) | |
| (1,520 | ) | |
| 268,618 | | |
| 1,195,135 | |
| Profit for the year | |
| - | | |
| - | | |
| - | | |
| - | | |
| - | | |
| - | | |
| - | | |
| 168,900 | | |
| 168,900 | |
| Other comprehensive income (loss) | |
| - | | |
| - | | |
| - | | |
| - | | |
| - | | |
| (18 | ) | |
| 1,520 | | |
| - | | |
| 1,502 | |
| Total comprehensive income | |
| - | | |
| - | | |
| - | | |
| - | | |
| - | | |
| (18 | ) | |
| 1,520 | | |
| 168,900 | | |
| 170,402 | |
| Dividends, note 15(g) | |
| - | | |
| - | | |
| - | | |
| - | | |
| - | | |
| - | | |
| - | | |
| (175,524 | ) | |
| (175,524 | ) |
| Others | |
| - | | |
| - | | |
| - | | |
| - | | |
| - | | |
| (5 | ) | |
| - | | |
| - | | |
| (5 | ) |
| | |
| | | |
| | | |
| | | |
| | | |
| | | |
| | | |
| | | |
| | | |
| | |
| Balance as of December 31, 2023 | |
| 423,868 | | |
| 40,279 | | |
| (121,258 | ) | |
| 432,779 | | |
| 168,636 | | |
| (16,290 | ) | |
| - | | |
| 261,994 | | |
| 1,190,008 | |
The accompanying notes are an integral part of these consolidated
financial statements.
Cementos Pacasmayo S.A.A. and Subsidiaries
Consolidated statement of cash flows
For the years ended December 31, 2023, 2022 and
2021
| | |
Note | |
2023 | | |
2022 | | |
2021 | |
| | |
| |
S/(000) | | |
S/(000) | | |
S/(000) | |
| | |
| |
| | |
| | |
| |
| Operating activities | |
| |
| | |
| | |
| |
| Profit before income tax | |
| |
| 245,708 | | |
| 262,420 | | |
| 224,110 | |
| Non-cash adjustments to reconcile profit before income tax to net cash flows from operating activities | |
| |
| | | |
| | | |
| | |
| Depreciation and amortization | |
| |
| 144,195 | | |
| 138,539 | | |
| 135,567 | |
| Finance costs | |
21 | |
| 104,045 | | |
| 95,105 | | |
| 88,965 | |
| Impairment to retirement of property, plant and equipment | |
9(g) | |
| 36,551 | | |
| - | | |
| - | |
| Long-term incentive plan | |
12(c) y 20 | |
| 7,632 | | |
| 8,272 | | |
| 9,763 | |
| Provision for inventory obsolescence | |
8(b) | |
| 2,956 | | |
| 1,977 | | |
| 3,348 | |
| Allowance for expected credit losses | |
7(d) | |
| 1,707 | | |
| 1,972 | | |
| 563 | |
| Net (gain) loss on derivative financial instruments recognized at fair value through profit or loss | |
26(a) | |
| (19 | ) | |
| 59 | | |
| (589 | ) |
| Accumulated net loss due to settlement of derivative financial instruments at fair value through profit or loss | |
26(a) | |
| - | | |
| - | | |
| 1,569 | |
| Finance income | |
| |
| (7,246 | ) | |
| (3,306 | ) | |
| (2,891 | ) |
| Exchange difference related to monetary transactions | |
| |
| (973 | ) | |
| 3,804 | | |
| (9,114 | ) |
| Net gain on disposal of property, plant and equipment and intangible assets | |
| |
| (813 | ) | |
| (591 | ) | |
| (1,775 | ) |
| Other items that do not generate operating flows, net | |
| |
| 18,021 | | |
| 10,413 | | |
| 3,761 | |
| Working capital adjustments | |
| |
| | | |
| | | |
| | |
| Increase in trade and other receivables | |
| |
| (1,870 | ) | |
| (3,695 | ) | |
| (47,713 | ) |
| Decrease (increase) in inventories | |
| |
| 90,581 | | |
| (282,554 | ) | |
| (151,530 | ) |
| Decrease (increase) in prepayments | |
| |
| 13,210 | | |
| (10,099 | ) | |
| (12,956 | ) |
| (Decrease) increase in trade and other payables | |
| |
| (48,680 | ) | |
| 60,571 | | |
| 48,834 | |
| | |
| |
| 605,005 | | |
| 282,887 | | |
| 289,912 | |
| Interest received | |
| |
| 7,315 | | |
| 3,668 | | |
| 4,484 | |
| Interest paid | |
| |
| (96,907 | ) | |
| (80,573 | ) | |
| (68,433 | ) |
| Income tax paid | |
| |
| (103,090 | ) | |
| (94,163 | ) | |
| (55,401 | ) |
| Net cash flows from operating activities | |
| |
| 412,323 | | |
| 111,819 | | |
| 170,562 | |
| | |
| |
| | | |
| | | |
| | |
| Investing activities | |
| |
| | |
| | |
| |
| Opening of term deposits with original maturity greater than 90 days | |
| |
| (10,000 | ) | |
| - | | |
| - | |
| Redemption of term deposits with original maturity greater than 90 days | |
| |
| 10,000 | | |
| - | | |
| - | |
| Purchase of property, plant and equipment | |
9(a) | |
| (272,600 | ) | |
| (162,785 | ) | |
| (85,594 | ) |
| Purchase of intangible assets | |
10(a) | |
| (16,707 | ) | |
| (15,712 | ) | |
| (8,953 | ) |
| Purchase of investments available for sale | |
| |
| - | | |
| (363 | ) | |
| (1,779 | ) |
| Loans granted | |
| |
| (1,679 | ) | |
| (141 | ) | |
| (174 | ) |
| Loan to related party | |
22 | |
| - | | |
| - | | |
| (17,121 | ) |
| Cash flow proceeds from sale of property, plant and equipment | |
| |
| 1,392 | | |
| 2,664 | | |
| 4,152 | |
| Proceeds from loans | |
| |
| 150 | | |
| 149 | | |
| 524 | |
| Collection of loans from related parties | |
22 | |
| - | | |
| - | | |
| 17,121 | |
| Net cash flows used in investing activities | |
| |
| (289,444 | ) | |
| (176,188 | ) | |
| (91,824 | ) |
| | |
| |
| | | |
| | | |
| | |
| Financing activities | |
| |
| | | |
| | | |
| | |
| Proceeds from bank overdraft | |
| |
| 85,333 | | |
| - | | |
| - | |
| Payment of bank overdraft | |
| |
| (85,333 | ) | |
| - | | |
| - | |
| Payment of bank loans | |
25 | |
| (661,520 | ) | |
| (448,984 | ) | |
| - | |
| Dividends paid | |
25 | |
| (175,431 | ) | |
| (179,820 | ) | |
| (336,821 | ) |
| Payment for hedging instrument | |
25 | |
| (7,708 | ) | |
| (15,390 | ) | |
| (15,214 | ) |
| Lease payments | |
| |
| (3,564 | ) | |
| (2,511 | ) | |
| (2,419 | ) |
| Bank loans received | |
25 | |
| 639,000 | | |
| 525,000 | | |
| 220,000 | |
| Dividends returned | |
25 | |
| 465 | | |
| 229 | | |
| 481 | |
| Cash flow from settlement of derivative financial instruments | |
| |
| 93,323 | | |
| - | | |
| 3,879 | |
| Net cash flows used in financing activities | |
| |
| (115,435 | ) | |
| (121,476 | ) | |
| (130,094 | ) |
| Net increase (decrease) in cash and cash equivalents | |
| |
| 7,444 | | |
| (185,845 | ) | |
| (51,356 | ) |
| Net foreign exchange difference | |
| |
| 976 | | |
| (5,784 | ) | |
| 15,846 | |
| Cash and cash equivalents as of January 1 | |
6 | |
| 81,773 | | |
| 273,402 | | |
| 308,912 | |
| | |
| |
| | | |
| | | |
| | |
| Cash and cash equivalents as of December 31 | |
6 | |
| 90,193 | | |
| 81,773 | | |
| 273,402 | |
| Transactions with no effect on cash flows: | |
| |
| | | |
| | | |
| | |
| Unrealized exchange difference related to monetary transactions | |
| |
| (973 | ) | |
| 3,804 | | |
| (9,114 | ) |
| Outstanding accounts payable related to acquisition of property, plant and equipment | |
9(e) | |
| 9,379 | | |
| 14,560 | | |
| 7,615 | |
| Addition of right-of-use assets and lease liabilities | |
| |
| 6,915 | | |
| 613 | | |
| 217 | |
| Additions of quarry rehabilitation costs | |
12 | |
| 4,458 | | |
| 2,745 | | |
| - | |
The accompanying notes are an integral part of these consolidated
financial statements.
Cementos Pacasmayo S.A.A. and Subsidiaries
Notes to the consolidated
financial statements
As of December 31, 2023, 2022 and 2021
Cementos Pacasmayo S.A.A. (hereinafter “the Company”) was
incorporated in 1957 and, under the Peruvian General Corporation Law, is an open stock corporation, its shares are listed on the Lima
and New York Stock Exchange. The Company is a subsidiary of Inversiones ASPI S.A., which holds 50.01 percent of the Company’s common
shares as of December 31, 2023, 2022 and 2021. The Company’s registered address is Calle La Colonia No.150, Urbanización
El Vivero, Santiago de Surco, Lima, Peru. All the subsidiaries are domiciled and operate in Peru.
The Company’s main activity is the production and
marketing of cement, blocks, concrete and other minors in La Libertad region of the northern of Peru.
The issuance of the consolidated financial statements of
the Company and its subsidiaries (hereinafter “the Group”) for the year ended December 31, 2023 were approved by the General
Shareholder’s Meeting on March 21, 2024. The consolidated financial statements as of December 31, 2022 and for the year then ended
were approved by the General Shareholders’ Meeting on March 24, 2023.
For the years ended December 31, 2023, 2022 and 2021, the
consolidated financial statements comprise the financial statements of the Company and its subsidiaries: Cementos Selva S.A.C. and subsidiaries,
Distribuidora Norte Pacasmayo S.R.L., Empresa de Transmisión Guadalupe S.A.C., Salmueras Sudamericanas S.A., Calizas del Norte
S.A.C. (liquidated during 2022), Soluciones Takay S.A.C., 150Krea Inc. and Corporación Materiales Piura S.A.C. As of these dates,
the Company maintained a 100 percent interest in all its subsidiaries.
The main activities of the subsidiaries incorporated in
the consolidated financial statements are described as follows:
| - | Cementos Selva S.A.C. is engaged in production and marketing of cement and other construction materials in the northeast region of
Peru.Also, it holds 100 percent of the shares in Dinoselva Iquitos S.A.C. (a cement and construction materials distributor in the north
of Peru, which also produces and sells precast, cement bricks and ready-mix concrete) and in Acuícola Los Paiches S.A.C. (a fish
farm entity). |
| - | Distribuidora Norte Pacasmayo S.R.L. is mainly engaged in selling cement produced by the Company.Additionally, it produces and sells
precast, cement bricks and ready-mix concrete. It is the main partner of Consorcio Constructor Norte del Peru. |
| - | Empresa de Transmisión Guadalupe S.A.C. is mainly engaged in providing electric energy transmission services to the Company. |
| - | Salmueras Sudamericanas S.A.(“Salmueras”) In December 2017, the Company decided not to continue with the activities related
to this project of Salmueras. |
Notes to
the consolidated financial statements (continued)
| - | Calizas del Norte S.A.C. On May 31, 2016, the Company decided to liquidate the subsidiary Calizas del Norte S.A.C. Thjs liquidation
was completed during 2022. |
| - | Soluciones Takay S.A.C., entity constituted on March 29, 2019 whose corporate purpose is to provide advisory services and information,
promotion, acquisition and intermediation services for the management and development of real estate projects by natural and/or legal
persons. |
| - | 150Krea Inc., entity constituted on June 3, 2021 whose corporate purpose is the lease of intangible assets. |
| - | Corporación Materiales Piura S.A.C., entity acquired on January 4, 2023 whose corporate purpose is the extraction of stone,
sand and clay. |
| 2. | Significant accounting policies |
| 2.1 | Basis of preparation – |
The consolidated financial statements
of the Group have been prepared in accordance with International Financial Reporting Standards (IFRS), as issued by the International
Accounting Standards Board (IASB).
The consolidated financial statements
have been prepared on a historical cost basis, except for financial instruments designated at fair value through other comprehensive income
(OCI) and derivative financial instruments that have been measured at fair value. The carrying values of recognized assets and liabilities
that are designated as hedged items in fair value hedges that would otherwise be carried at amortized cost are adjusted to record changes
in fair value attributable to the risks that are being hedged in effective hedge relationships. The consolidated financial statements
are presented in Soles and all values are rounded to the nearest thousand (S/000), except when otherwise indicated.
The consolidated financial statements
provide comparative information in respect of the previous period or periods. There are certain standards and amendments applied for the
first time by the Group during 2023 that did not require the restatement of previous financial statements, as explained in note 2.3.17.
Notes to the consolidated financial statements (continued)
| 2.2 | Basis of consolidation - The consolidated financial statements comprise the financial statements of the Company and its subsidiaries as of December 31, 2023 and 2022 and for the years ended December 31, 2023, 2022 and 2021. Control is achieved when the Group is exposed, or has rights, to variable returns from its involvement with the investee and has the ability to affect those returns through its power over the investee. Specifically, the Group controls an investee if and only if it has: (i) power over the investee (i.e. existing rights that give it the current ability to direct the relevant activities of the investee), (ii) exposure, or rights, to variable returns from its involvement with the investee, and (iii) the ability to use its power over the investee to affect its returns. |
Consolidation of a subsidiary begins when
the Group obtains control over the subsidiary and ceases when the Group loses control of the subsidiary. Assets, liabilities, income and
expenses of a subsidiary acquired or disposed of during the year are included in the consolidated financial statements from the date the
Group gains control until the date the Group ceases to control the subsidiary.
The accounting policies into line with
the Group´s accounting policies. All intra-group assets and liabilities, equity, income, expenses and cash flows relating to transactions
between members of the Group are eliminated in full on consolidation.
A change in the ownership interest of
a subsidiary, without a loss of control, is accounted for as an equity transaction.
| 2.3 | Summary of significant accounting policies - |
| 2.3.1 | Cash and cash equivalents - |
Cash and cash equivalents presented in
the statement of financial position and statement of cash flows comprise cash at banks and on hand and short-term deposits with an original
maturity of three months or less.
| 2.3.2 | Financial instruments-initial recognition and subsequent measurement – |
A financial instrument is any contract
that gives rise to a financial asset of one entity and a financial liability or equity instrument of another entity.
Initial recognition and measurement -
Financial assets are classified at initial
recognition as measured at amortized cost, fair value through OCI or fair value through profit or loss.
The Group’s financial assets include cash and cash
equivalents, commercial and other receivables and financial assets at fair value through OCI.
Notes to the consolidated financial statements (continued)
Subsequent measurement -
For purposes of subsequent measurement,
financial assets are classified into the following categories:
| - | Financial assets at amortized cost (debt instruments). |
| - | Financial assets at fair value through OCI with recycling of cumulative gains and losses (debt instruments). |
| - | Financial assets designated at fair value through OCI without recycling of cumulative gains and losses upon derecognition (equity
instruments). |
| - | Financial assets at fair value through profit or loss. |
The classification depends on the business
model of the Company and the contractual terms of the cash flows.
Financial assets at amortized cost (debt
instruments) -
The Group measures financial assets at
amortized cost if both of the following conditions are met:
| - | The financial asset is held within a business model with the objective to collect contractual cash flows and not sale or trade it,
and, |
| - | The contractual terms of the financial asset give rise on specified dates to cash flows that are solely payments of principal and
interest on the principal amount outstanding |
Financial assets at amortized cost are
subsequently measured using the effective interest (EIR) method and are subject to impairment. Gains and losses are recognized in profit
or loss when the asset is derecognized, modified or impaired.
Financial assets are not reclassified
after their initial recognition, except if the Group changes its business model for its management.
As of December 31, 2023, 2022 and 2021,
the Group held trade and other receivables in this category; because they meet the conditions described above.
Financial assets at fair value through
OCI (equity instruments) -
Upon initial recognition, the Group can
elect to irrevocably classify its equity investments as equity instruments designated at fair value through OCI when they meet the definition
of equity and are not held for trading. The classification is determined on an instrument-by-instrument basis.
Notes to the consolidated financial statements (continued)
Gains and losses on these financial assets
are never recycled to profit or loss. Dividends are recognized as other income in the statement of profit or loss when the right of payment
has been established, except when the Group benefits from such proceeds as a recovery of part of the cost of the financial asset, in which
case, such gains are recorded in OCI. Equity instruments designated at fair value through OCI are not subject to impairment assessment.
As of December 31, 2023, 2022 and 2021
the Group elected to classify irrevocably its non-listed equity investments under this category.
| (ii) | Impairment of financial assets - |
The Group recognizes an allowance for
expected credit losses (ECLs) for all debt instruments not held at fair value through profit or loss. ECLs are based on the difference
between the contractual cash flows due in accordance with the contract and all the cash flows that the Group expects to receive, discounted
at an approximation of the original effective interest rate. The expected cash flows will include cash flows from the sale of collateral
held or other credit enhancements that are integral to the contractual terms.
ECLs are recognized in two stages. For
credit exposures for which there has not been a significant increase in credit risk since initial recognition, ECLs are provided for credit
losses that result from default events that are possible within the next 12-months (a 12-month ECL). For those credit exposures for which
there has been a significant increase in credit risk since initial recognition, a loss allowance is required for credit losses expected
over the remaining life of the exposure, irrespective of the timing of the default (a lifetime ECL).
For trade receivables and contract assets,
the Group applies a simplified approach in calculating ECLs. Therefore, the Group does not track changes in credit risk, but instead recognizes
a loss allowance based on lifetime ECLs at each reporting date. The Group has established a provision matrix that is based on its historical
credit loss experience, adjusted for forward-looking factors specific to the debtors and the economic environment.
The Group considers a financial asset
in default when contractual payments are 360 days past due. However, in certain cases, the Group may also consider a financial asset to
be in default when internal or external information indicates that the Group is unlikely to receive the outstanding contractual amounts
in full before taking into account any credit enhancements held by the Group. A financial asset is written off when there is no reasonable
expectation of recovering the contractual cash flows.
Notes to the consolidated financial statements (continued)
| (iii) | Financial liabilities - |
Initial recognition and measurement -
Financial liabilities are classified
at initial recognition as financial liabilities at fair value through profit or loss, loans and borrowings, payables, or as derivatives
designated as hedging instruments in an effective hedge, as appropriate.
All financial liabilities are recognized
initially at fair value and, in the case of loans and borrowings and payables, net of directly attributable transaction costs.
The Group’s financial liabilities
include trade and other payables, interest-bearing loans and borrowings.
Subsequent measurement -
The subsequent measurement of financial
liabilities depends on their classification, the Group maintains Loans and Borrowings, which accounting treatment is explained below:
After their initial recognition, interest-bearing
loans and borrowings are subsequently measured at amortized cost using the EIR method. Gains and losses are recognized in the consolidated
statement of profit or loss when the liabilities are derecognized as well as through the EIR amortization process.
Amortized cost is calculated by considering
any discount or premium on acquisition and fees or costs that are an integral part of the EIR. The EIR amortization is included as finance
costs in the consolidated statement of profit or loss.
As of December 31, 2023, 2022 and 2021,
the Group included trade and other payables and financial liabilities in this category, for more information refer to notes 11 and 13.
Derecognition -
A financial liability is derecognized
when the obligation under the liability is discharged or cancelled or expired. When an existing financial liability is replaced by another
from the same lender on substantially different terms, or the terms of an existing liability are substantially modified, such an exchange
or modification is treated as a derecognition of the original liability and the recognition of a new liability. The difference in the
respective carrying amount is recognized in the consolidated statement of profit or loss.
Notes to the consolidated financial statements (continued)
| (iv) | Derivative financial instruments and hedge accounting – |
The Group used derivative financial instruments,
cross currency swaps (CCS), to hedge its foreign currency exchange rate risk. These derivative financial instruments are initially recognized
at their fair values on the date on which the derivative contract is entered into and subsequently are remeasured at their fair value.
Derivatives are accounted for as financial assets when their fair value is positive and as financial liabilities when their fair value
is negative.
For the purpose of hedge accounting,
hedges are classified as:
| - | Fair value hedges when hedging the exposure to changes in the fair value of a recognized asset or liability or an unrecognized firm
commitment. |
| - | Cash flow hedges when hedging the exposure to variability in cash flows that is either attributable to a particular risk associated
with a recognized asset or liability or a highly probable forecast transaction or the foreign currency risk in an unrecognized firm commitment. |
| - | Hedges of a net investment in a foreign operation. |
At the inception of a hedge relationship,
the Group formally designates and documents the hedge relationship to which the Group wishes to apply hedge accounting and the risk management
objective and strategy for undertaking the hedge.
The documentation includes identification
of the hedging instrument, the hedged item or transaction, the nature of the risk being hedged and how the Group will assess the effectiveness
of changes in the hedging instrument’s fair value in offsetting the exposure to changes in the hedged item’s fair value or
cash flows attributable to the hedged risk. Such hedges expect to be highly effective in achieving offsetting changes in fair value or
cash flows and are assessed on an ongoing basis to determine that they have been highly effective throughout the financial reporting periods
for which they were designated.
A hedging relationship qualifies for
hedge accounting if it meets all the following effectiveness requirements:
| - | There is ‘an economic relationship’ between the hedged item and the hedging instrument. |
| - | The effect of credit risk does not ‘dominate the value changes’ that result from that economic relationship. |
| - | The hedge ratio of the hedging relationship is the same as that resulting from the quantity of the hedged item that the Group hedges
and the quantity of the hedging instrument that the Group uses to hedge that quantity of hedged item. |
Cash flow hedges
Any gains or losses arising from changes
in the fair value of derivatives is taken directly to profit or loss, except for the effective portion of cash flow hedges, which is recognized
in OCI and later reclassified to profit or loss when the hedge item affects profit or loss.
For any other cash flow hedges, the amount
accumulated in OCI is reclassified to profit or loss as a reclassification adjustment in the same period or periods during which the hedged
cash flows affect profit or loss.
Notes to the consolidated financial statements (continued)
In the case that the cash flow hedge
is discontinued, the amount accumulated in other comprehensive income must remain in other comprehensive income accumulated if the covered
cash flows are still expected to occur. Otherwise, the amount will be immediately reclassified to profit or loss as a reclassification
adjustment. After discontinuation, once the hedged cash flows are given, any amount that remains in other comprehensive accumulated results
must be recorded considering the nature of the underlying transaction.
The Group maintained derivative financial
instruments, cross currency swaps, to hedge its foreign currency exchange rate risk, these instruments were maintained until February
2023, date when there were paid in foreign currency. These derivative financial instruments were initially recognized at their fair values
on the date on which the derivative contract was entered into and subsequently were remeasured at their fair value. Derivatives are accounted
for as financial assets when their fair value is positive and as financial liabilities when their fair value is negative, variation ay
fair value were registered in equity.
As of December 31, 2023, the Group did
not maintain derivative financial instruments.
| (v) | Fair value measurement - |
The Group measures financial instruments
such as derivatives, and equity investments, at fair value at each period end.
Fair value is the price that would be
received to sell an asset or paid to transfer a liability in an orderly transaction between market participants at the measurement date.
The fair value measurement is based on the presumption that the transaction to sell the asset or transfer the liability takes place either:
| - | In the principal market for the asset or liability, or |
| - | In the absence of a principal market, in the most advantageous market for the asset or liability. |
The principal or the most advantageous
market must be accessible by the Group.
The fair value of an asset or a liability
is measured using the assumptions that market participants would use when pricing the asset or liability, assuming that market participants
act in their economic best interest.
A fair value measurement of a non-financial
asset takes into account a market participant’s ability to generate economic benefits by using the asset in its highest and best
use or by selling it to another market participant that would use the asset in its highest and best use.
The Group uses valuation techniques that
are appropriate in the circumstances and for which sufficient data are available to measure fair value, maximizing the use of relevant
observable inputs and minimizing the use of unobservable inputs.
Notes to the consolidated financial statements (continued)
All assets and liabilities for which
fair value is measured or disclosed in the financial statements are categorized within the fair value accounting hierarchy, described
as follows, based on the lowest level input that is significant to the fair value measurement as a whole:
| - | Level 1 — Quoted (unadjusted) market prices in active markets for identical assets or liabilities |
| - | Level 2 — Valuation techniques for which the lowest level input that is significant to the fair value measurement is directly
or indirectly observable |
| - | Level 3 — Valuation techniques for which the lowest level input that is significant to the fair value measurement is unobservable |
For assets and liabilities that are recognized
in the financial statements at fair value on a recurring basis, the Group determines whether transfers have occurred between levels in
the hierarchy by re-assessing categorization (based on the lowest level input that is significant to the fair value measurement as a whole)
at the end of each reporting period.
The Group’s management determines
the policies and procedures for recurring and non-recurring fair value measurements.
At each reporting date, the Financial
Management analyzes the changes in the values of the assets and liabilities that must be measured or determined on a recurring and non-recurring
basis according to the Group’s accounting policies. For this analysis, Management contrasts the main variables used in the latest
assessments made with updated information available from valuations included in contracts and other relevant documents.
Management also compares the changes
in the fair value of each asset and liability with the relevant external sources to determine whether the change is reasonable.
For purposes of disclosure of fair value,
the Group has determined classes of assets and liabilities based on the inherent nature, characteristics and risks of each asset and liability,
and the level of the fair value accounting hierarchy as explained above, see note 26(b).
| 2.3.3 | Foreign currencies - |
The functional and presentation currency
for the consolidated financial statements of the Group is soles, which is also the functional currency for its subsidiaries.
Transactions and balances
Transactions in foreign currencies are
initially recorded at their respective functional currency spot rates at the date the transaction first qualifies for recognition.
Monetary assets and liabilities denominated
in foreign currencies are translated at the functional currency spot rates of exchange at the reporting date. Differences arising on settlement
or translation of monetary items are recognized in profit or loss.
Non-monetary items that are measured
in terms of historical cost in a foreign currency are translated using the exchange rates at the dates of the initial transactions.
Notes to the consolidated financial statements (continued)
Inventories are valued at the lower of
cost or net realizable value. Costs incurred in bringing each product to its present location and conditions are accounted for as follows:
Raw materials, spare parts and supplies
| - | Initially at cost and are recorded at the lower of cost and net realizable value. |
Finished goods and work in progress
| - | Cost of direct materials and supplies, services provided by third parties, direct labor and a proportion of manufacturing overheads
is based on normal operating capacity, excluding borrowing costs and exchange currency differences. |
Inventory in transit
Net realizable value is the estimated
selling price in the ordinary course of business, less estimated cost of completion and the estimated costs of inventory necessary to
make the sale.
Borrowing costs directly attributable
to the acquisition, construction or production of an asset that necessarily takes a substantial period of time to get ready for its intended
use or sale are capitalized as part of the cost of the respective asset. All other borrowing costs are expensed in the period in which
they occur. Borrowing costs consist of interest and other costs that an entity incurs in connection with the borrowing of funds.
Where the funds used to finance a project
form part of general borrowings, the amount capitalized is calculated using a weighted average of interest rates applicable to relevant
general borrowings of the Group during the period. All other borrowing costs are recognized in the consolidated statement of profit or
loss in the period in which they are incurred.
Notes to the consolidated financial statements (continued)
| 2.3.6 | Property, plant and equipment - |
Property, plant and equipment is stated
at cost, net of accumulated depreciation and/or accumulated impairment losses, if any. Such cost includes the cost of replacing component
parts of the property, plant and equipment and borrowing costs for long-term construction projects if the recognition criteria are met,
see note 2.3.5. The capitalized value of a finance lease is also included within property, plant and equipment. When significant parts
of plant and equipment are required to be replaced at intervals, the Group recognizes such parts as individual assets with specific useful
lives and depreciates them separately based on their specific useful lives. Likewise, when a major inspection is performed, its cost is
recognized in the carrying amount of the plant and equipment as a replacement if the recognition criteria are satisfied. All other repair
and maintenance costs are recognized as operation cost or expense in profit or loss as incurred.
The present value of the expected cost
for the decommissioning of an asset after its use is included in the cost of the respective asset if the recognition criteria for a provision
are met. Refer to significant accounting judgments, estimates and assumptions, see note 3, and quarry rehabilitation cost provisions,
see note 12.
Depreciation of assets is determined
using the straight-line method over the estimated useful lives of such assets as follows:
| | |
Years |
| | |
|
| Buildings and other construction: | |
|
| Administrative facilities | |
Between 20 and 51 |
| Main production structures | |
Between 20 and 56 |
| Minor production structures | |
Between 20 and 35 |
| Machinery and equipment: | |
|
| Mills and horizontal furnaces | |
Between 24 and 45 |
| Vertical furnaces, crushers and grinders | |
Between 23 and 36 |
| Electricity facilities and other minors | |
Between 10 and 35 |
| Furniture and fixtures | |
10 |
| Transportation units: | |
|
| Heavy units | |
Between 5 and 15 |
| Light units | |
Between 5 and 10 |
| Computer equipment | |
Between 3 and 10 |
| Tools | |
Between 5 and 10 |
The asset’s residual value, useful
lives and methods of depreciation are reviewed at each reporting period and adjusted prospectively if appropriate.
An item of property, plant and equipment
and any significant part initially recognized is derecognized upon disposal or when no future economic benefits are expected from its
use or disposal. Any gain or loss arising on derecognition of the asset (calculated as the difference between the net disposal proceeds
and the carrying amount of the asset) is included in the consolidated statement of profit or loss when the asset is derecognized.
| 2.3.7 | Mining concessions - |
Mining concessions correspond to the
exploration rights in areas of interest acquired. Mining concessions are stated at cost, net of accumulated amortization and/or accumulated
impairment losses, if any, and are presented within the “Property, plant and equipment” caption of consolidated statement
of financial position. Those mining concessions are amortized following the straight-line method. In the event the Group abandons the
concession, the costs associated, see note 9(b), are written-off in the consolidated statement of profit or loss.
For the years ended December 31, 2023,
2022 and 2021, mining concessions of the Group correspond to areas that contain raw material necessary for cement production.
Notes to the consolidated financial statements (continued)
| 2.3.8 | Quarry development costs and stripping costs - |
Quarry development costs -
Quarry development costs incurred are
stated at cost and are the next step in development of quarries after the exploration and evaluation stage. Quarry development costs are,
upon commencement of the production phase, presented net of accumulated amortization and/or accumulated impairment losses, if any, and
are presented within the property, plant and equipment caption. The amortization is calculated using the straight-line method based on
the useful life of the quarry to which it relates. Expenditures that significantly increase the economic life of the quarry under exploitation
are capitalized.
Stripping costs -
Stripping costs incurred in the development
of a mine before production commences are capitalized as part of mine development costs and subsequently amortized over the life of the
mine on a units-of-production basis, using the proved reserves.
Stripping costs incurred subsequently
during the production phase of its operation are recorded as part of cost of production.
Intangible assets acquired separately
are measured on initial recognition at cost. The cost of intangible assets acquired in a business combination is their fair value at the
date of acquisition. Following initial recognition, intangible assets are carried at cost less any accumulated amortization and accumulated
impairment losses. Internally generated intangibles, excluding capitalized development costs, are not capitalized and the related expenditure
is reflected in profit or loss in the period in which the expenditure is incurred. The useful lives of intangible assets are assessed
as either finite or indefinite.
Notes to the consolidated financial statements (continued)
Intangible assets with finite lives are
amortized over the economic useful life and assessed for impairment whenever there is an indication that the intangible asset may be impaired.
The amortization period and the amortization method for an intangible asset with a finite useful life are reviewed at least at the end
of each reporting period. Changes in the expected useful life or the expected pattern of consumption of future economic benefits embodied
in the asset are considered to modify the amortization period or method, as appropriate, and are treated as changes in accounting estimates.
The amortization expense on intangible assets with finite lives is recognized in the statement of profit or loss in the expense category
that is consistent with the function of the intangible assets.
The Group’s intangible assets with
finite useful lives are amortized over an average term between three and ten years.
Any gain or loss arising upon derecognition
of the asset (calculated as the difference between the net disposal proceeds and the carrying amount of the asset) is included in the
statement of profit or loss.
Exploration and evaluation assets -
Exploration and evaluation activity involve
the search for mineral resources, the determination of technical feasibility and the assessment of commercial viability of an identified
resource. Exploration and evaluation activity include:
| - | Researching and analyzing historical exploration data. |
| - | Gathering exploration data through geophysical studies. |
| - | Exploratory drilling and sampling. |
| - | Determining and examining the volume and grade of the resource. |
| - | Surveying transportation and infrastructure requirements. |
| - | Conducting market and finance studies. |
Once the legal right to explore has been
acquired, exploration and evaluation costs are charged to the consolidated statement of profit or loss, unless management concludes that
a future economic benefit is more likely than not to be realized, in which case such costs are capitalized, see note 10(b). These costs
include directly attributable employee remuneration, materials and fuel used, surveying costs, drilling costs and payments made to contractors.
In evaluating if costs meet the criteria
to be capitalized, several different sources of information are used, including the nature of the assets, extension of the explored area
and results of sampling, among others. The information that is used to determine the probability of future benefits depends on the extent
of exploration and evaluation that has been performed.
Notes to the consolidated financial statements (continued)
Exploration and evaluation costs are
capitalized when the exploration and evaluation activity is within an area of interest for which it is expected that the costs will be
recouped by future exploitation and active and significant operations in relation to the area are continuing or planned for the future.
All capitalized exploration and evaluation
costs are monitored for indications of impairment. Where a potential impairment indicator is identified, an assessment is performed for
each area of interest in conjunction with the group of operating assets (representing a cash generating unit) to which the exploration
is attributed.
The Group assesses at each reporting
date whether there is an indication that exploration and evaluation assets may be impaired, see note 10(c).
| 2.3.10 | Ore reserve and resource estimates - |
Ore reserves are estimates of the amount
of ore that can be economically and legally extracted from the Group’s mining properties and concessions. The Group estimates its
ore reserves and mineral resources, based on information compiled by appropriately qualified persons relating to the geological data on
the size, depth and shape of the ore body, and requires complex geological judgments to interpret the data. The estimation of recoverable
reserves is based upon factors such as estimates of foreign exchange rates, commodity prices, future capital requirements, and production
costs along with geological assumptions and judgments made in estimating the size and grade of the ore body. Changes in the reserve or
resource estimates may impact upon the carrying value of exploration and evaluation assets, provision for quarry rehabilitation and depreciation
and amortization charges.
General -
Provisions are recognized when the Group has a present
obligation (legal or constructive) as a result of a past event, it is probable that an outflow of resources embodying economic benefits
will be required to settle the obligation and a reliable estimate can be made of the amount of the obligation. When the Group expects
some or all of a provision to be reimbursed, for example under an insurance contract, the reimbursement is recognized as a separate asset
but only when the reimbursement is virtually certain. The expense relating to any provision is presented in profit or loss net of any
reimbursement. If the effect of the time value of money is material, provisions are discounted using a current pre-tax rate that reflects
where appropriate, the risks specific to the liability. When discounting is used, the increase in the provision due to the passage of
time is recognized as finance cost in the consolidated statement of profit or loss.
Notes to the consolidated
financial statements (continued)
Quarry rehabilitation provision -
The Group records the present value of estimated costs
of legal and constructive obligations required to restore operating locations in the period in which the obligation is incurred. Quarry
rehabilitation costs are provided at the present value of expected costs to settle the obligation using estimated cash flows and are recognized
as part of the cost of that particular asset. The cash flows are discounted at a current risk-free rate. The unwinding of the discount
is expensed as incurred and recognized in the consolidated statement of profit or loss as a finance cost. The estimated future costs of
quarry rehabilitation are reviewed annually and adjusted as appropriate. Changes in the estimated future costs or in the discount rate
applied are added to or deducted from the cost of the asset.
Environmental expenditures and liabilities -
Environmental expenditures that relate to current or future
revenues are expensed or capitalized as appropriate. Expenditures that relate to an existing condition caused by past operations and do
not contribute to current or future earnings are expensed.
Liabilities for environmental costs are recognized when
a clean-up is probable, and the associated costs can be reliably estimated. Generally, the timing of recognition of these provisions coincides
with the commitment to a formal plan of action or, if earlier, on divestment or on closure of inactive sites.
The amount recognized is the best estimate of the expenditure
required. Where the liability will not be settled for a number of years, the amount recognized is the present value of the estimated future
expenditure.
| 2.3.12 | Employees benefits - |
The Group has short-term obligations
for employee benefits including salaries, severance contributions, legal bonuses, performance bonuses and profit sharing. These obligations
are recorded monthly on an accrual basis.
Additionally, the Group has a long-term
incentive plan for key management. This benefit is settled in cash, measured on the salary of each officer and upon fulfilling certain
conditions such as years of experience within the Group and permanency. The Group recognizes the long-term obligation at its present value
at the end of the reporting period using the projected credit unit method. To calculate the present value of these long-term obligations
the Group uses a government bond discount rate at the date of the consolidated financial statements. This liability is annually reviewed
on the date of the consolidated financial statements, and the accrual updates and the effect of changes in discount rates are recognized
in the consolidated statement of profit or loss.
| 2.3.13 | Revenue recognition - |
The Group is dedicated to the production
and trading of cement, concrete, blocks and other minors, as well as trade of construction supplies. These goods are sold in contracts
with customers.
Revenue is measured at the fair value
of the consideration received or receivable, considering contractually defined terms of payment and excluding taxes or duties.
Notes to the consolidated financial statements (continued)
The following specific recognition criteria
must also be met before revenue is recognized:
Sales of goods -
Revenue from sale of goods is recognized
at the point in time when control of the asset is transferred to the customer, generally on delivery of the goods.
The Group considers whether there are
other terms in the contract that are separate performance obligations to which a portion of the transaction price needs to be allocated.
In determining the transaction price for the sale of goods, the Group considers the effects of variable consideration, the existence of
significant financing components, noncash consideration, and consideration payable to the customer (if any).
Rendering of services -
In the business segments cement, concrete,
blocks and construction supplies, the Group provides transportation services. These services are sold together with the sale of the goods
to the customer.
Transportation services are satisfied
when the transport service is concluded, which coincides with the moment of delivery of the goods to the customers.
Current income tax -
Current income tax assets and liabilities
are measured at the amount expected to be recovered from or paid to the tax authorities. The tax rates and tax laws used to compute the
amount are those that are enacted or substantively enacted, at the reporting date in Peru, where the Group operates and generates taxable
income.
Deferred tax -
Deferred tax is determinated on temporary
differences between the tax bases of assets and liabilities and their carrying amounts for financial reporting purposes at the reporting
date.
Deferred tax liabilities are recognized
for all taxable temporary differences, except in respect of taxable temporary differences associated with investments in subsidiaries,
associates and interests in joint arrangements, when the timing of the reversal of the temporary differences can be controlled and it
is probable that the temporary differences will not reverse in the foreseeable future.
Deferred tax assets are recognized for
all deductible temporary differences, the carry forward of unused tax credits and unused tax losses.
Notes to the consolidated financial statements (continued)
The carrying amount of deferred tax assets
is reviewed at each reporting date and reduced to the extent that it is no longer probable that sufficient taxable profit will be available
to allow all or part of the deferred tax asset to be utilized. Unrecognized deferred tax assets are re-assessed at each reporting date
and are recognized to the extent that it has become probable that future taxable profits will allow the deferred tax asset to be recovered.
Deferred tax assets and liabilities are
measured at the tax rates that are expected to apply in the year when the asset is realized or the liability is settled, based on tax
rates (and tax laws) that have been enacted or substantively enacted at the reporting date.
Deferred tax related to items recognized
outside profit or loss is recognized outside profit or loss. Deferred tax items are recognized in correlation to the underlying transaction
either in OCI or directly in equity.
Own equity instruments which are reacquired
(treasury shares) are recognized at cost and deducted from equity. No gain or loss is recognized in the consolidated statement of profit
or loss on the purchase, sale, issue or cancellation of the Group’s own equity instruments.
| 2.3.16 | Impairment of non-financial assets – |
The Group assesses, at each reporting
date, whether there is an indication that an asset may be impaired. If any indication exists, or when annual impairment testing for an
asset is required (goodwill and Intangible assets with indefinite useful lives), the Group estimates the asset’s recoverable amount.
An asset’s recoverable amount is the higher of an asset’s or cash-generating unit’s (CGU) fair value less costs of disposal
and its value in use and is determined for an individual asset, unless the asset does not generate cash inflows that are largely independent
of those from other assets or groups of assets. Where the carrying amount of an asset or CGU exceeds its recoverable amount, the asset
is considered impaired and is written down to its recoverable amount.
In assessing value in use, the estimated
future cash flows are discounted to their present value using a pre-tax discount rate that reflects current market assessments of the
time value of money and the risks specific to the asset. In determining fair value less costs of disposal, recent market transactions
are considered. If no such transactions can be identified, an appropriate valuation model is used. These calculations are corroborated
by valuation multiples, quoted share prices for publicly traded companies or other available fair value indicators.
The Group supports its impairment calculation
by using detailed budgets and forecast calculations, which are prepared separately for each of the Group´s CGUs to which the individual
assets are allocated.
Impairment losses related to continuing
operations, including impairment on inventories, are recognized in the consolidated statement of profit or loss in expense categories
consistent with the function of the impaired asset.
Notes to the consolidated financial statements (continued)
In addition, an assessment is made at
each reporting date to determine whether there is any indication that previously recognized impairment losses may no longer exist or have
decreased. If such an indication exists, the Group estimates the asset’s or CGU’s recoverable amount. A previously recognized
impairment loss is reversed only if there has been a change in the assumptions used to determine the asset’s recoverable amount
since the last impairment loss was recognized. The reversal is limited so that the carrying amount of the asset does not exceed its recoverable
amount, nor exceed the carrying amount that would have been determined, net of depreciation, had no impairment loss been recognized for
the asset in prior years. Such reversal is recognized in the consolidated statement of profit or loss.
Exploration and evaluation assets are
tested for impairment annually as of December 31, either individually or at the cash-generating unit level, as appropriate, and when circumstances
indicate that the carrying value may be impaired.
As of December 31, 2023 and 2022 there
were no signs of impairment for long-lived assets.
| 2.3.17 | New amended standards and interpretations – |
The Group applied for the first-time certain standards
and amendments, which are effective for annual periods beginning on or after January 1, 2023. The Group has not early adopted any other
standard, interpretation or amendment that has been issued but is not yet effective.
Definition of Accounting Estimates - Amendments to IAS
8
The amendments to IAS 8 clarify the distinction between
changes in accounting estimates, changes in accounting policies and the correction of errors. They also clarify how entities use measurement
techniques and inputs to develop accounting estimates.
The amendments had no impact on the Group’s consolidated
financial statements.
Disclosure of Accounting Policies - Amendments to IAS
1 and IFRS Practice Statement 2
The amendments to IAS 1 and IFRS Practice Statement 2 Making
Materiality Judgements provide guidance and examples to help entities apply materiality judgements to accounting policy disclosures. The
amendments aim to help entities provide accounting policy disclosures that are more useful by replacing the requirement for entities to
disclose their ‘significant’ accounting policies with a requirement to disclose their material accounting policies and adding
guidance on how entities apply the concept of materiality in making decisions about accounting policy disclosures.
The amendments have had an impact on the Group’s
disclosures of accounting policies, but not on the measurement, recognition or presentation of any items in the Group’s financial
statements.
Deferred Tax related to Assets and Liabilities arising
from a Single Transaction – Amendments to IAS 12
The amendments to IAS 12 Income Tax narrow the scope of
the initial recognition exception, so that it no longer applies to transactions that give rise to equal taxable and deductible temporary
differences such as leases and decommissioning liabilities.
The amendments had no impact on the Group’s consolidated
financial statements.
Notes to the consolidated financial statements (continued)
| 3. | Significant accounting judgments, estimates and assumptions |
The
preparation of the Group’s consolidated financial statements requires management to make judgments, estimates and assumptions that
affect the reported amounts of revenues, expenses, assets and liabilities, and the accompanying disclosures. Uncertainty about these assumptions
and estimates could result in outcomes that require a material adjustment to the carrying amount of assets or liabilities affected in
future periods.
If
signs of impairment are identified, the most significant estimate considered by the Company’s Management will correspond to the
evaluation of the impairment of long-lived assets. As of December 31, 2023, 2022 and 2021, Management has not identified signs of impairment
for long-lived assets, which is why it considers that there are no significant estimates for those dates.
| 4. | Standards issued but not yet effective |
The
standards and interpretations relevant to the Group, that will have effect at January 1, 2024 are below:
| - | Amendments to IFRS 16: Lease Liability in a Sale and Leaseback |
| - | Amendments to IAS 1: Classification of Liabilities as Current or Non-current |
| - | Supplier Finance Arrangements - Amendments to IAS 7 and IFRS 7 |
The
amendments are not expected to have a material impact on the Group’s financial statements.
| 5. | Transactions in foreign currency |
Transactions in foreign currency take place at the open-market
exchange rates published by the Superintendence of Banks, Insurance and Pension Funds Administration. As of December 31, 2023 the exchange
rates for transactions in United States dollars, published by this institution, were S/3.705 for purchase and S/3.713 for sale (S/3.808
for purchase and S/3.82 for sale as of December 31, 2022, S/3,975 for purchase and S/3.998 for sale as of December 31, 2021).
Notes to the consolidated financial statements (continued)
As of December 31, 2023, 2022 and 2021, the Group had the
following assets and liabilities in United States dollars:
| | |
2023 | | |
2022 | | |
2021 | |
| | |
US$(000) | | |
US$(000) | | |
US$(000) | |
| | |
| | |
| | |
| |
| Assets | |
| | |
| | |
| |
| Cash and cash equivalents | |
| 5,887 | | |
| 4,426 | | |
| 51,343 | |
| Trade and other receivables | |
| 3,259 | | |
| 3,262 | | |
| 4,946 | |
| Advances to suppliers for work in progress | |
| 4,829 | | |
| 18,899 | | |
| 10,175 | |
| | |
| 13,975 | | |
| 26,587 | | |
| 66,464 | |
| | |
| | | |
| | | |
| | |
| Liabilities | |
| | | |
| | | |
| | |
| Trade and other payables | |
| (19,082 | ) | |
| (18,399 | ) | |
| (10,356 | ) |
| Interest-bearing loans and borrowings | |
| - | | |
| (131,612 | ) | |
| (149,612 | ) |
| | |
| (19,082 | ) | |
| (150,011 | ) | |
| (159,968 | ) |
| Cross currency swap position | |
| - | | |
| 132,000 | | |
| 132,000 | |
| | |
| | | |
| | | |
| | |
| Net monetary position | |
| (5,107 | ) | |
| 8,576 | | |
| 38,496 | |
As of December 31, 2022, the Group had cash currency hedging agreements
for its bonds (denominated in US dollars), see note 16. Of the US$132,000,000 shown in the swap position as of December 31,2022, there
were underlying liabilities in the amount of US$131,612,000 and the difference of US$388,000 was maintained as derivative financial instruments
at fair value through profit or loss. In February 2023 the cross currency swaps were settled.
During 2023, the net gain originated by the exchange difference
was approximately S/4,933,000 (the net loss from exchange difference amounted to S/1,040,000 and S/7,086,000 during 2022 and 2021, respectively).
All these results are presented in the caption “Gain (loss) from exchange difference, net” in the consolidated statement of
profit or loss.
| 6. | Cash and cash equivalents |
| (a) | This caption was made up as follows: |
| | |
2023 | | |
2022 | |
| | |
S/(000) | | |
S/(000) | |
| | |
| | |
| |
| Cash on hand | |
| 182 | | |
| 161 | |
| Cash at banks (b) | |
| 46,611 | | |
| 39,112 | |
| Short-term deposits (c) | |
| 43,400 | | |
| 42,500 | |
| | |
| 90,193 | | |
| 81,773 | |
Notes to the consolidated financial statements (continued)
| 7. | Trade and other receivables |
| (a) | This caption was made up as follows: |
| | |
Current | | |
Non-current | |
| | |
2023 | | |
2022 | | |
2023 | | |
2022 | |
| | |
S/(000) | | |
S/(000) | | |
S/(000) | | |
S/(000) | |
| | |
| | |
| | |
| | |
| |
| Trade receivables (b) | |
| 83,840 | | |
| 78,519 | | |
| - | | |
| - | |
| Other accounts receivable | |
| 13,179 | | |
| 6,789 | | |
| - | | |
| - | |
| Accounts receivable from Parent company and affiliates, note 22 | |
| 1,973 | | |
| 1,858 | | |
| - | | |
| - | |
| Funds restricted to tax payments | |
| 1,322 | | |
| 244 | | |
| - | | |
| - | |
| Interest receivable | |
| 1,091 | | |
| 1,163 | | |
| - | | |
| - | |
| Loans to employees | |
| 1,061 | | |
| 676 | | |
| - | | |
| - | |
| Loans granted | |
| 1,014 | | |
| 1,001 | | |
| - | | |
| - | |
| Other receivables from sale of fixed assets | |
| 82 | | |
| 215 | | |
| - | | |
| - | |
| Allowance for expected credit losses (d) and (e) | |
| (9,014 | ) | |
| (7,433 | ) | |
| - | | |
| - | |
| Financial assets classified as receivables (e) | |
| 94,548 | | |
| 83,032 | | |
| - | | |
| - | |
| Value-added tax credit | |
| 5,140 | | |
| 18,459 | | |
| 1,193 | | |
| 1,874 | |
| Claim to the SUNAT (c) | |
| - | | |
| - | | |
| 29,559 | | |
| 29,559 | |
| Other accounts receivable | |
| - | | |
| - | | |
| 12,645 | | |
| 12,110 | |
| Tax refund receivable | |
| - | | |
| - | | |
| 9,034 | | |
| 9,034 | |
| Allowance for expected credit losses (d) | |
| - | | |
| - | | |
| (9,034 | ) | |
| (9,034 | ) |
| Non-financial assets classified as receivables | |
| 5,140 | | |
| 18,459 | | |
| 43,397 | | |
| 43,543 | |
| | |
| 99,688 | | |
| 101,491 | | |
| 43,397 | | |
| 43,543 | |
Company has made, under protest, payments
of the debts arbitrarily placed in collection. These payments as of December 31, 2023 and 2022 amount to S/29,559,000. To date, the Company
has initiated the corresponding legal actions to recover said payments and in the opinion of Management and its external legal advisors,
it has a high probability of obtaining a favorable result.
Notes to the consolidated financial statements (continued)
| (d) | The movement of the allowance for expected credit losses is as follows: |
| | |
2023 | | |
2022 | | |
2021 | |
| | |
S/(000) | | |
S/(000) | | |
S/(000) | |
| | |
| | |
| | |
| |
| Opening balance | |
| 16,467 | | |
| 14,573 | | |
| 14,358 | |
| Additions, note 19 | |
| 1,707 | | |
| 1,972 | | |
| 563 | |
| Recoveries | |
| (126 | ) | |
| (78 | ) | |
| (348 | ) |
| Ending balance | |
| 18,048 | | |
| 16,467 | | |
| 14,573 | |
As of December 31,
2023, the additions include S/1,707,000 related to the provision for expected credit losses for trade receivables (S/1,972,000 and S/563,000
as of December 31, 2022 and 2021, respectively), which are presented in the caption “selling and distribution expenses” on
the consolidated statement of profit and loss, see note 19.
| (e) | The aging analysis of trade and other accounts receivable as of December 31, 2023 and 2022, is as follows: |
| As of December 31, | |
| | |
Neither past due nor | | |
Past due but not impaired | |
| 2023 | |
Total | | |
impaired | | |
< 30 days | | |
30-60 days | | |
61-90 days | | |
91-120 days | | |
> 120 days | |
| | |
S/(000) | | |
S/(000) | | |
S/(000) | | |
S/(000) | | |
S/(000) | | |
S/(000) | | |
S/(000) | |
| | |
| | |
| | |
| | |
| | |
| | |
| | |
| |
| Expected credit loss rate | |
| 8.7 | % | |
| 0.2 | % | |
| 1.0 | % | |
| 0.8 | % | |
| 7.6 | % | |
| 20.5 | % | |
| 64.4 | % |
| Carrying amount 2023 | |
| 103,562 | | |
| 62,120 | | |
| 20,566 | | |
| 4,525 | | |
| 2,435 | | |
| 1,195 | | |
| 12,721 | |
| Expected credit loss | |
| 9,014 | | |
| 147 | | |
| 206 | | |
| 37 | | |
| 186 | | |
| 245 | | |
| 8,193 | |
| As of December 31, | |
| | |
Neither past due nor | | |
Past due but not impaired | |
| 2022 | |
Total | | |
impaired | | |
< 30 days | | |
30-60 days | | |
61-90 days | | |
91-120 days | | |
> 120 days | |
| | |
S/(000) | | |
S/(000) | | |
S/(000) | | |
S/(000) | | |
S/(000) | | |
S/(000) | | |
S/(000) | |
| | |
| | |
| | |
| | |
| | |
| | |
| | |
| |
| Expected credit loss rate | |
| 8.2 | % | |
| 0.1 | % | |
| 1.5 | % | |
| 3.5 | % | |
| 2.1 | % | |
| - | | |
| 59.4 | % |
| Carrying amount 2022 | |
| 90,465 | | |
| 63,676 | | |
| 8,538 | | |
| 3,807 | | |
| 2,573 | | |
| - | | |
| 11,871 | |
| Expected credit loss | |
| 7,433 | | |
| 64 | | |
| 124 | | |
| 135 | | |
| 55 | | |
| - | | |
| 7,055 | |
Notes to the consolidated financial statements (continued)
| (a) | This caption is made up as follows: |
| | |
2023 | | |
2022 | |
| | |
S/(000) | | |
S/(000) | |
| | |
| | |
| |
| Goods and finished products | |
| 16,488 | | |
| 18,903 | |
| Work in progress | |
| 173,569 | | |
| 186,281 | |
| Raw materials | |
| 329,598 | | |
| 397,096 | |
| Packages and packing | |
| 3,944 | | |
| 5,245 | |
| Fuel | |
| 3,899 | | |
| 3,642 | |
| Spare parts and supplies | |
| 251,006 | | |
| 260,742 | |
| Inventory in transit | |
| 12,570 | | |
| 13,060 | |
| | |
| 791,074 | | |
| 884,969 | |
| (b) | As of December 31, 2023 and 2022, the amount of the provision for inventory obsolescence amounts to S/27,525,000 and S/24,905,000,
respectively. In the years 2023, 2022 and 2021, the net effect recognized in the consolidated statement of profit or loss for S/2,956,000,
S/1,977,000 and S/3,348,000, respectively. |
Notes
to the consolidated financial statements (continued)
| 9. | Property, plant and equipment |
| (a) | The composition and movement in property, plant and equipment for two years ended December 31, 2023 and 2022 is presented below: |
| | |
Mining concessions (b) | | |
Mine development costs (b) | | |
Land | | |
Buildings and other construction | | |
Machinery, equipment and related spare parts | | |
Furniture and accessories | | |
Transportation units | | |
Computer equipment and tools | | |
Quarry rehabilitation costs | | |
Capitalized interest (f) | | |
Work in progress (d) and units
in transit | | |
Total | |
| | |
S/(000) | | |
S/(000) | | |
S/(000) | | |
S/(000) | | |
S/(000) | | |
S/(000) | | |
S/(000) | | |
S/(000) | | |
S/(000) | | |
S/(000) | | |
S/(000) | | |
S/(000) | |
| | |
| | |
| | |
| | |
| | |
| | |
| | |
| | |
| | |
| | |
| | |
| | |
| |
| Cost | |
| | |
| | |
| | |
| | |
| | |
| | |
| | |
| | |
| | |
| | |
| | |
| |
| | |
| | |
| | |
| | |
| | |
| | |
| | |
| | |
| | |
| | |
| | |
| | |
| |
| As of January 1, 2022 | |
| 75,914 | | |
| 58,002 | | |
| 256,552 | | |
| 693,085 | | |
| 1,697,655 | | |
| 10,706 | | |
| 113,351 | | |
| 34,428 | | |
| 9,030 | | |
| 65,007 | | |
| 62,140 | | |
| 3,075,870 | |
| Additions | |
| - | | |
| 7,311 | | |
| 868 | | |
| - | | |
| 13,085 | | |
| 318 | | |
| 658 | | |
| 2,849 | | |
| 2,745 | | |
| 3,158 | | |
| 143,540 | | |
| 174,532 | |
| Sales and/or retirement | |
| - | | |
| - | | |
| (2,285 | ) | |
| - | | |
| (4,978 | ) | |
| (14 | ) | |
| (2,654 | ) | |
| (228 | ) | |
| - | | |
| - | | |
| (398 | ) | |
| (10,557 | ) |
| Disposals | |
| - | | |
| - | | |
| - | | |
| (1,600 | ) | |
| (17,075 | ) | |
| (28 | ) | |
| (4,460 | ) | |
| (481 | ) | |
| - | | |
| - | | |
| - | | |
| (23,644 | ) |
| Transfers, note 10 | |
| - | | |
| 529 | | |
| - | | |
| 3,069 | | |
| 22,853 | | |
| 98 | | |
| 442 | | |
| 4,736 | | |
| - | | |
| - | | |
| (32,461 | ) | |
| (734 | ) |
| As of December 31, 2022 | |
| 75,914 | | |
| 65,842 | | |
| 255,135 | | |
| 694,554 | | |
| 1,711,540 | | |
| 11,080 | | |
| 107,337 | | |
| 41,304 | | |
| 11,775 | | |
| 68,165 | | |
| 172,821 | | |
| 3,215,467 | |
| Additions | |
| 36,184 | | |
| 19,870 | | |
| 3,449 | | |
| - | | |
| 25,891 | | |
| 432 | | |
| 160 | | |
| 3,209 | | |
| 4,458 | | |
| 6,132 | | |
| 174,435 | | |
| 274,220 | |
| Sales and/or retirement | |
| - | | |
| (101 | ) | |
| - | | |
| - | | |
| (41,075 | ) | |
| (162 | ) | |
| (2,064 | ) | |
| (316 | ) | |
| - | | |
| - | | |
| (559 | ) | |
| (44,277 | ) |
| Transfers, note 10 | |
| - | | |
| (14,521 | ) | |
| - | | |
| 127,675 | | |
| 186,727 | | |
| (271 | ) | |
| (50 | ) | |
| 990 | | |
| - | | |
| - | | |
| (300,616 | ) | |
| (66 | ) |
| As of December 31, 2023 | |
| 112,098 | | |
| 71,090 | | |
| 258,584 | | |
| 822,229 | | |
| 1,883,083 | | |
| 11,079 | | |
| 105,383 | | |
| 45,187 | | |
| 16,233 | | |
| 74,297 | | |
| 46,081 | | |
| 3,445,344 | |
| | |
| | | |
| | | |
| | | |
| | | |
| | | |
| | | |
| | | |
| | | |
| | | |
| | | |
| | | |
| | |
| Accumulated depreciation | |
| | | |
| | | |
| | | |
| | | |
| | | |
| | | |
| | | |
| | | |
| | | |
| | | |
| | | |
| | |
| As of January 1, 2022 | |
| 12,328 | | |
| 10,484 | | |
| - | | |
| 158,455 | | |
| 705,454 | | |
| 7,871 | | |
| 78,163 | | |
| 22,456 | | |
| 2,382 | | |
| 9,021 | | |
| - | | |
| 1,006,614 | |
| Additions | |
| 72 | | |
| 387 | | |
| - | | |
| 18,818 | | |
| 95,486 | | |
| 575 | | |
| 7,398 | | |
| 3,595 | | |
| 140 | | |
| 1,521 | | |
| - | | |
| 127,992 | |
| Sales and/or retirement | |
| - | | |
| - | | |
| - | | |
| - | | |
| (3,990 | ) | |
| (12 | ) | |
| (2,269 | ) | |
| (194 | ) | |
| - | | |
| - | | |
| - | | |
| (6,465 | ) |
| Disposals | |
| - | | |
| - | | |
| - | | |
| (795 | ) | |
| (13,425 | ) | |
| (26 | ) | |
| (4,278 | ) | |
| (428 | ) | |
| - | | |
| - | | |
| - | | |
| (18,952 | ) |
| Transfers, note 10 | |
| - | | |
| (3 | ) | |
| - | | |
| - | | |
| - | | |
| - | | |
| - | | |
| - | | |
| - | | |
| - | | |
| - | | |
| (3 | ) |
| As of December 31, 2022 | |
| 12,400 | | |
| 10,868 | | |
| - | | |
| 176,478 | | |
| 783,525 | | |
| 8,408 | | |
| 79,014 | | |
| 25,429 | | |
| 2,522 | | |
| 10,542 | | |
| - | | |
| 1,109,186 | |
| Additions | |
| 72 | | |
| 422 | | |
| - | | |
| 20,113 | | |
| 98,915 | | |
| 516 | | |
| 6,252 | | |
| 3,606 | | |
| 128 | | |
| 1,625 | | |
| - | | |
| 131,649 | |
| Sales and/or retirement | |
| - | | |
| (56 | ) | |
| - | | |
| - | | |
| (22,620 | ) | |
| (153 | ) | |
| (1,896 | ) | |
| (201 | ) | |
| - | | |
| - | | |
| - | | |
| (24,926 | ) |
| Transfers, note 10 | |
| - | | |
| - | | |
| - | | |
| 2,065 | | |
| (2,030 | ) | |
| - | | |
| (35 | ) | |
| - | | |
| - | | |
| - | | |
| - | | |
| - | |
| As of December 31, 2023 | |
| 12,472 | | |
| 11,234 | | |
| - | | |
| 198,656 | | |
| 857,790 | | |
| 8,771 | | |
| 83,335 | | |
| 28,834 | | |
| 2,650 | | |
| 12,167 | | |
| - | | |
| 1,215,909 | |
| | |
| | | |
| | | |
| | | |
| | | |
| | | |
| | | |
| | | |
| | | |
| | | |
| | | |
| | | |
| | |
| Impairment (g) | |
| | | |
| | | |
| | | |
| | | |
| | | |
| | | |
| | | |
| | | |
| | | |
| | | |
| | | |
| | |
| As of December 31, 2022 | |
| 42,859 | | |
| 24,048 | | |
| 3,624 | | |
| 13,579 | | |
| 12,918 | | |
| 200 | | |
| 26 | | |
| 454 | | |
| - | | |
| - | | |
| 735 | | |
| 98,443 | |
| | |
| | | |
| | | |
| | | |
| | | |
| | | |
| | | |
| | | |
| | | |
| | | |
| | | |
| | | |
| | |
| Additions (g) | |
| 9,197 | | |
| 525 | | |
| 361 | | |
| 17,459 | | |
| 17,669 | | |
| 8 | | |
| 1 | | |
| - | | |
| - | | |
| 1,413 | | |
| 2,686 | | |
| 49,319 | |
| Disposals | |
| - | | |
| - | | |
| - | | |
| - | | |
| (17,669 | ) | |
| (8 | ) | |
| (1 | ) | |
| - | | |
| - | | |
| - | | |
| - | | |
| (17,678 | ) |
| As of December 31, 2023 | |
| 52,056 | | |
| 24,573 | | |
| 3,985 | | |
| 31,038 | | |
| 12,918 | | |
| 200 | | |
| 26 | | |
| 454 | | |
| - | | |
| 1,413 | | |
| 3,421 | | |
| 130,084 | |
| Net book value | |
| | | |
| | | |
| | | |
| | | |
| | | |
| | | |
| | | |
| | | |
| | | |
| | | |
| | | |
| | |
| As of December 31, 2022 | |
| 20,655 | | |
| 30,926 | | |
| 251,511 | | |
| 504,497 | | |
| 915,097 | | |
| 2,472 | | |
| 28,297 | | |
| 15,421 | | |
| 9,253 | | |
| 57,623 | | |
| 172,086 | | |
| 2,007,838 | |
| As of December 31, 2023 | |
| 47,570 | | |
| 35,283 | | |
| 254,599 | | |
| 592,535 | | |
| 1,012,375 | | |
| 2,108 | | |
| 22,022 | | |
| 15,899 | | |
| 13,583 | | |
| 60,717 | | |
| 42,660 | | |
| 2,099,351 | |
Notes to the consolidated financial statements (continued)
| (c) | The Group has assessed the recoverable amount of its remaining long-term assets and, except the assets as specifically mentioned in
(b), did not find indicators of an impairment for these assets as of December 31, 2023 and 2022. |
| (e) | As of December 31, 2023, the Group maintains accounts payable related to the acquisition of property, plant and equipment for S/9,379,000
(S/14,560,000 as of December 31, 2022), see note 11. |
| (g) | In previous years management recognized a full impairment related to the total net book value of a closed zinc mining unit which included
concession costs, development costs and related facilities and equipment. |
At the end of 2023, Management recognized
a specific impairment to retirement for the net value of the assets of the vertical clinker kilns located at the Pacasmayo cement plant
for a net cost of S/36,551,000. This deterioration estimate was carried out as a consequence of replacing the old technology of these
kilns due to the entry into operation of the Clinker Lines Optimization Project – Kiln 4 in said plant, which is more efficient
and produces fewer emissions. This amount was recorded in the impairment to retirement of property, plant and equipment item in the consolidated
statement of profit or loss.
Likewise, Management recognized a specific
impairment to retirement of the value of the coal concessions (northern zone) for S/11,393,000, recorded in other operating (expenses)
income item of the consolidated statement of profit or loss.
Notes to the consolidated financial statements (continued)
| 10. | Intangibles assets, net |
| (a) | The composition and movement of this caption as of the date of the consolidated statement of financial position is presented below: |
| | |
IT applications | | |
Finite life intangible | | |
Indefinite life intangible | | |
Exploration cost and mining evaluation (b) | | |
Total | |
| | |
S/(000) | | |
S/(000) | | |
S/(000) | | |
S/(000) | | |
S/(000) | |
| Cost | |
| | |
| | |
| | |
| | |
| |
| | |
| | |
| | |
| | |
| | |
| |
| As of January 1, 2022 | |
41,423 | | |
24,543 | | |
1,975 | | |
51,279 | | |
119,220 | |
| Additions | |
| 14,564 | | |
| - | | |
| - | | |
| 417 | | |
| 14,981 | |
| Disposals | |
| (27 | ) | |
| - | | |
| - | | |
| - | | |
| (27 | ) |
| Transfers and reclassifications, note 9 | |
| 107 | | |
| - | | |
| - | | |
| 627 | | |
| 734 | |
| As of December 31, 2022 | |
| 56,067 | | |
| 24,543 | | |
| 1,975 | | |
| 52,323 | | |
| 134,908 | |
| Additions | |
| 15,667 | | |
| - | | |
| - | | |
| 523 | | |
| 16,190 | |
| Sales and/or retirement | |
| (593 | ) | |
| - | | |
| - | | |
| - | | |
| (593 | ) |
| Transfers and reclassifications, note 9 | |
| 66 | | |
| - | | |
| - | | |
| - | | |
| 66 | |
| As of December 31, 2023 | |
| 71,207 | | |
| 24,543 | | |
| 1,975 | | |
| 52,846 | | |
| 150,571 | |
| Accumulated amortization | |
| | | |
| | | |
| | | |
| | | |
| | |
| As of January 1, 2022 | |
| 18,025 | | |
| 8,165 | | |
| 71 | | |
| 8,996 | | |
| 35,257 | |
| Additions | |
| 5,833 | | |
| 2,454 | | |
| - | | |
| 575 | | |
| 8,862 | |
| Transfers and reclassifications, note 9 | |
| - | | |
| - | | |
| - | | |
| 3 | | |
| 3 | |
| As of December 31, 2022 | |
| 23,858 | | |
| 10,619 | | |
| 71 | | |
| 9,574 | | |
| 44,122 | |
| Additions | |
| 6,939 | | |
| 2,454 | | |
| - | | |
| 313 | | |
| 9,706 | |
| Sales and/or retirement | |
| (554 | ) | |
| - | | |
| - | | |
| - | | |
| (554 | ) |
| As of December 31, 2023 | |
| 30,243 | | |
| 13,073 | | |
| 71 | | |
| 9,887 | | |
| 53,274 | |
| Impairment | |
| | | |
| | | |
| | | |
| | | |
| | |
| As of December 31, 2022 | |
| 456 | | |
| - | | |
| - | | |
| 33,469 | | |
| 33,925 | |
| Additions | |
| - | | |
| - | | |
| - | | |
| 452 | | |
| 452 | |
| As of December 31, 2023 | |
| 456 | | |
| - | | |
| - | | |
| 33,921 | | |
| 34,377 | |
| Net Carrying Value | |
| | | |
| | | |
| | | |
| | | |
| | |
| As of December 31, 2022 | |
| 31,753 | | |
| 13,924 | | |
| 1,904 | | |
| 9,280 | | |
| 56,861 | |
| As of December 31, 2023 | |
| 40,508 | | |
| 11,470 | | |
| 1,904 | | |
| 9,038 | | |
| 62,920 | |
| (c) | As of December 31, 2023 and 2022, the Group evaluated the conditions of use of the projects related to the exploration and mining
evaluation costs and its other intangibles, not finding any indicators of impairment in said assets, except specific additions to retirements
for the year 2023. |
Notes to the consolidated financial statements (continued)
| 11. | Trade and other payables |
| (a) | This balance is made up as follows: |
| | |
2023 | | |
2022 | |
| | |
S/(000) | | |
S/(000) | |
| | |
| | |
| |
| Trade payables (b) | |
| 107,327 | | |
| 156,586 | |
| Interest payable (d) | |
| 29,828 | | |
| 26,611 | |
| Remuneration payable | |
| 27,792 | | |
| 22,245 | |
| Advances from customers | |
| 15,726 | | |
| 14,702 | |
| Taxes and contributions | |
| 17,225 | | |
| 11,347 | |
| Dividends payable, note 15(g) | |
| 10,322 | | |
| 9,764 | |
| Accounts payable related to the acquisition of property, plant and equipment, note 9(e) | |
| 9,379 | | |
| 14,560 | |
| Board of Directors’ fees | |
| 4,700 | | |
| 5,191 | |
| Guarantee deposits | |
| 3,488 | | |
| 4,127 | |
| Account payable to the principal and affiliates, note 22 | |
| 516 | | |
| 2,686 | |
| Hedge finance cost payable | |
| - | | |
| 5,978 | |
| Other accounts payable | |
| 5,208 | | |
| 10,757 | |
| | |
| 231,511 | | |
| 284,554 | |
| (c) | Other payables are non-interest bearing and have an average term of 3 months. |
Notes to
the consolidated financial statements (continued)
| (a) | This balance is made up as follows: |
| | |
Workers’
profit-sharing (b) | | |
Long-term incentive plan (c) | | |
Quarry
Rehabilitation provision (d) | | |
Provision of legal contingencies | | |
Total | |
| | |
S/(000) | | |
S/(000) | | |
S/(000) | | |
S/(000) | | |
S/(000) | |
| | |
| | |
| | |
| | |
| | |
| |
| At January 1, 2022 | |
| 24,269 | | |
| 22,513 | | |
| 11,036 | | |
| 3,090 | | |
| 60,908 | |
| Additions (b), note 20 | |
| 32,161 | | |
| 8,272 | | |
| - | | |
| 1,368 | | |
| 41,801 | |
| Exchange difference | |
| - | | |
| - | | |
| (495 | ) | |
| - | | |
| (495 | ) |
| Unwinding of discounts, note 21 | |
| - | | |
| 1,200 | | |
| 91 | | |
| - | | |
| 1,291 | |
| Change in estimate | |
| - | | |
| - | | |
| 2,745 | | |
| - | | |
| 2,745 | |
| Payments and advances | |
| (25,097 | ) | |
| - | | |
| - | | |
| (2,182 | ) | |
| (27,279 | ) |
| At December 31, 2022 | |
| 31,333 | | |
| 31,985 | | |
| 13,377 | | |
| 2,276 | | |
| 78,971 | |
| Current portion | |
| 31,333 | | |
| - | | |
| - | | |
| - | | |
| 31,333 | |
| Non-current portion | |
| - | | |
| 31,985 | | |
| 13,377 | | |
| 2,276 | | |
| 47,638 | |
| | |
| 31,333 | | |
| 31,985 | | |
| 13,377 | | |
| 2,276 | | |
| 78,971 | |
| | |
| | | |
| | | |
| | | |
| | | |
| | |
| At January 1, 2023 | |
| 31,333 | | |
| 31,985 | | |
| 13,377 | | |
| 2,276 | | |
| 78,971 | |
| Additions (b), note 20 | |
| 35,258 | | |
| 7,632 | | |
| - | | |
| - | | |
| 42,890 | |
| Exchange difference | |
| - | | |
| - | | |
| (292 | ) | |
| - | | |
| (292 | ) |
| Unwinding of discounts, note 21 | |
| - | | |
| 1,691 | | |
| 133 | | |
| - | | |
| 1,824 | |
| Change in estimate | |
| - | | |
| - | | |
| 4,458 | | |
| - | | |
| 4,458 | |
| Payments and advances | |
| (32,263 | ) | |
| (11,625 | ) | |
| - | | |
| - | | |
| (43,888 | ) |
| At December 31, 2023 | |
| 34,328 | | |
| 29,683 | | |
| 17,676 | | |
| 2,276 | | |
| 83,963 | |
| | |
| | | |
| | | |
| | | |
| | | |
| | |
| Current portion | |
| 34,328 | | |
| 22,182 | | |
| - | | |
| - | | |
| 56,510 | |
| Non-current portion | |
| - | | |
| 7,501 | | |
| 17,676 | | |
| 2,276 | | |
| 27,453 | |
| | |
| 34,328 | | |
| 29,683 | | |
| 17,676 | | |
| 2,276 | | |
| 83,963 | |
Notes to the consolidated
financial statements (continued)
| (b) | Workers’ profit sharing - |
In accordance with Peruvian legislation,
the Group is obliged to pay its employees profit sharing of between 8% and 10% of annual taxable income. Distributions to employees under
the plan are based 50% on the number of days that each employee worked during the preceding year and 50% on proportionate annual salary
levels.
The workers’ profit sharing is recognized
in the following line items:
| | |
2023 | | |
2022 | | |
2021 | |
| | |
S/(000) | | |
S/(000) | | |
S/(000) | |
| | |
| | |
| | |
| |
| Cost of sales, note 20 | |
| 15,244 | | |
| 15,165 | | |
| 13,887 | |
| Administrative expenses, note 20 | |
| 15,210 | | |
| 12,520 | | |
| 8,935 | |
| Selling and distribution expenses, note 20 | |
| 3,804 | | |
| 3,287 | | |
| 2,227 | |
| Investment | |
| 1,000 | | |
| 1,189 | | |
| 116 | |
| | |
| 35,258 | | |
| 32,161 | | |
| 25,165 | |
| (c) | Long-term incentive plan - |
In 2011, the Group implemented a compensation
plan for its key management. This long-term benefit is payable in cash, based on the salary of each officer and depends on the years of
service of each officer in the Group. According to the latest plan update, the executive would receive the equivalent of an annual salary
for each year of service beginning to accrue from 2019. This benefit accrues and accumulates for each officer and is payable in two installments:
the first payment will be made on the sixth year after the creation of this bonus plan, and the last payment at the end of the ninth year
from the creation of the plan. If the executive decides to voluntarily leave the Group before a scheduled distribution, they will not
receive this compensation. The Group used the Projected Unit Credit Method to determine the present value of this deferred obligation
and the related current deferred cost, considering the expected increases in salary base and the corresponding current government bond
discount rate (risk-free rate).
| (d) | Quarry Rehabilitation provision - |
As of December 31, 2023 and 2022, it corresponds
to the provision for the future costs of rehabilitating the quarries exploited in Company’s operations. The provision has been created
based on studies made by internal specialists. Management believes that the assumptions used, based on current economic environment, are
a reasonable basis upon which to estimate the future liability. These estimates are reviewed regularly to consider any material change
to the assumptions. However, actual quarry rehabilitation costs will ultimately depend upon future market prices for the necessary decommissioning
works required to reflect future economic conditions.
Future cash flows have been estimated
based on financial budgets approved by Management. The range of the risk-free discount rate in dollars used in the calculation of the
provision as of December 31, 2023 was from 0.52 to 4.20 percent and the risk-free discount rate in dollars used in the calculation of
the provision as of December 31, 2022 was from 0.54 to 4.14 percent.
Management expects to incur a significant
part of this obligation in the medium and long-term. The Group estimates that this liability is sufficient according to the current environmental
protection laws approved by the Ministry of Energy and Mines of Peru.
Notes to the consolidated financial statements (continued)
| (a) | This caption is made up as follows: |
| | |
Currency | |
Nominal interest rate | | |
Maturity | |
2023 | | |
2022 | |
| | |
| |
| | |
| |
S/(000) | | |
S/(000) | |
| | |
| |
| | |
| |
| | |
| |
| Short -term promissory notes | |
| |
| | |
| |
| | |
| |
| Banco de Crédito del Perú | |
S/ | |
| 9.44 | % | |
January 22, 2024 | |
| 38,000 | | |
| - | |
| BBVA Perú | |
S/ | |
| 9.78 | % | |
January 19, 2024 | |
| 38,000 | | |
| - | |
| BBVA Perú | |
S/ | |
| 8.83 | % | |
March 15, 2024 | |
| 19,000 | | |
| - | |
| BBVA Perú | |
S/ | |
| 8.83 | % | |
March 15, 2024 | |
| 19,000 | | |
| - | |
| BBVA Perú | |
S/ | |
| 6.98 | % | |
December 12, 2024 | |
| 25,300 | | |
| - | |
| BBVA Perú | |
S/ | |
| 6.98 | % | |
December 12, 2024 | |
| 25,300 | | |
| - | |
| BBVA Perú | |
S/ | |
| 6.98 | % | |
December 12, 2024 | |
| 25,400 | | |
| - | |
| BBVA Perú | |
S/ | |
| 7.32 | % | |
November 22, 2024 | |
| 19,000 | | |
| - | |
| BBVA Perú | |
S/ | |
| 7.32 | % | |
November 22, 2024 | |
| 19,000 | | |
| - | |
| Banco de Crédito del Perú | |
S/ | |
| 8.93 | % | |
December 18,2023 | |
| - | | |
| 38,000 | |
| Banco de Crédito del Perú | |
S/ | |
| 8.93 | % | |
December 18,2023 | |
| - | | |
| 38,000 | |
| | |
| |
| | | |
| |
| 228,000 | | |
| 76,000 | |
| | |
| |
| | | |
| |
| | | |
| | |
| Senior Notes (b) | |
| |
| | | |
| |
| | | |
| | |
| Principal, net of issuance costs (b.2) | |
S/ | |
| 6.69 | % | |
February 1, 2029 | |
| 259,686 | | |
| 259,625 | |
| Principal, net of issuance costs (b.2) | |
S/ | |
| 6.84 | % | |
February 1, 2034 | |
| 309,506 | | |
| 309,457 | |
| Principal, net of issuance costs (b.1) | |
US$ | |
| 4.50 | % | |
February 8, 2023 | |
| - | | |
| 502,699 | |
| | |
| |
| | | |
| |
| 569,192 | | |
| 1,071,781 | |
| | |
| |
| | | |
| |
| | | |
| | |
| Short and long-term Corporate Loan under “Club deal” (c) | |
| |
| | | |
| |
| | | |
| | |
| Banco de Crédito del Perú | |
S/ | |
| 5.82 | % | |
December 1,2028 | |
| 387,917 | | |
| 222,695 | |
| Scotiabank | |
S/ | |
| 5.82 | % | |
December 1,2028 | |
| 387,917 | | |
| 222,695 | |
| | |
| |
| | | |
| |
| 775,834 | | |
| 445,390 | |
| | |
| |
| | | |
| |
| 1,573,026 | | |
| 1,593,171 | |
| | |
| |
| | | |
| |
| | | |
| | |
| Maturity | |
| |
| | | |
| |
| | | |
| | |
| Current | |
| |
| | | |
| |
| 383,146 | | |
| 618,907 | |
| Non-current | |
| |
| | | |
| |
| 1,189,880 | | |
| 974,264 | |
| | |
| |
| | | |
| |
| 1,573,026 | | |
| 1,593,171 | |
Notes to
the consolidated financial statements (continued)
| (b.1) | Senior Notes in US dollars |
Until February 2023, the Company had outstanding corporate
bonds which were denominated in US dollars. These bonds were issued in January 2013. The cross currency swaps maintained by the Company
to hedge the exchange rate variations of corporate bonds were executed and settled in full in correlation with the payment of these corporate
bonds.
| (b.2) | Senior Notes in Soles |
The
General Shareholders’ Meeting held on January 8, 2019, approved the issuance of Senior Notes denominated in soles in the local market
up to the maximum amount of S/1,000,000,000 through the Second Corporate Bonds Program of Pacasmayo, whose purpose was to settle the mid-term
loans described in the previous paragraph. On January 31, 2019, senior notes were issued for: i) S/260,000,000 at a rate of 6.688 percent
per year and maturity of 10 years and; ii) S/310,000,000 at a rate of 6.844 percent per year and maturity of 15 years.
The Senior Notes in soles issued in 2019 are guaranteed
by the following Company’s subsidiaries: Cementos Selva S.A.C., Distribuidora Norte Pacasmayo S.R.L., Empresa de Transmisión
Guadalupe S.A.C. and Dinoselva Iquitos S.A.C.
The financial covenants related to the Senior Notes denominated
issued in US dollars and soles state that if the Company and its guarantor subsidiaries issue debt or equity instruments, merges with
another company or dispose or rents significant assets, the Senior Notes will trigger the following financial covenants, calculated based
on the Company and Guarantee Subsidiaries annual consolidated financial statements:
| - | A fixed charge covenant ratio of at least 2.5 to 1. |
| - | A consolidated debt-to-EBITDA ratio of no greater than 3.5 to 1. |
As of December 31, 2023 and 2022,
these covenants have not been activated because no situation has occurred that requires their measurement, as indicated in the previous
paragraph.
For the years ended December 31, 2023, 2022 and 2021, senior
notes generated interest that has been recognized in the consolidated statement of profit or loss for S/38,690,000, S/60,225,000 and S/63,333,000,
respectively, see note 21.
Notes to
the consolidated financial statements (continued)
| (c) | Medium-term Corporate Loan under “Club Deal” modality: |
On August 6, 2021, the Company established the conditions
of a medium-term corporate loan under “Club Deal” modality with Banco de Crédito del Perú S.A. and Scotiabank
Perú S.A.A. The loan amounts to S/860,000,000 that allowed the payment of all the financial obligations that the Company maintains
with a maturity until February 2023. The loan conditions include a grace / availability period of 18 months from August 6 and a payment
term of 7 years from the last disbursement, which was in February 2023. Since that date, the loan will be paid in 22 equal quarterly installments
and has an annual interest rate of 5.82 percent.
As part of the loan conditions,
the Company assumed the following obligations:
| I. | Comply with the following financial covenants: |
| a. | Debt Ratio (Financial Debt / EBITDA) <= 3.50x |
| b. | Debt Service Coverage Ratio (FCSD / SD) >= 1.15x |
| c. | Debt Service Coverage Ratio (EBITDA / SD) >= 1.50x |
These financial safeguards will be calculated and verified
at the end of each calendar quarter, considering the information of the consolidated financial statements of the Company for the last
12 months, prepared in accordance with IFRS.
As of December 31, 2023 and 2022, the Company complies with
the ratios contained in the conditions of the Club Deal and corporate bonds and has certain do’s and don’ts obligations that
it has been complying with to date.
Notes to
the consolidated financial statements (continued)
| 14. | Deferred income tax assets and liabilities |
The
following is the composition of the caption according to the items that originated it:
| | |
As of January 1,
2022 | | |
Effect on profit or loss | | |
Quarry
rehabilitation
provision | | |
Effect on OCI | | |
As of December 31,
2022 | | |
Effect on profit or loss | | |
Effect on OCI | | |
Quarry
rehabilitation
provision | | |
As of December 31,
2023 | |
| | |
S/(000) | | |
S/(000) | | |
S/(000) | | |
S/(000) | | |
S/(000) | | |
S/(000) | | |
S/(000) | | |
S/(000) | | |
S/(000) | |
| Movement of deferred income tax assets: | |
| | |
| | |
| | |
| | |
| | |
| | |
| | |
| | |
| |
| Deferred income tax assets | |
| | |
| | |
| | |
| | |
| | |
| | |
| | |
| | |
| |
| Allowance for expected credit losses for trade receivables | |
| 1,533 | | |
| 555 | | |
| - | | |
| - | | |
| 2,088 | | |
| 473 | | |
| - | | |
| - | | |
| 2,561 | |
| Provision for vacations | |
| 1,905 | | |
| 196 | | |
| - | | |
| - | | |
| 2,101 | | |
| 114 | | |
| - | | |
| - | | |
| 2,215 | |
| Provision of discounts and bonuses to customers | |
| 2,227 | | |
| (448 | ) | |
| - | | |
| - | | |
| 1,779 | | |
| 85 | | |
| - | | |
| - | | |
| 1,864 | |
| Effect of differences between book and tax bases of fixed assets | |
| (644 | ) | |
| 986 | | |
| - | | |
| - | | |
| 342 | | |
| 934 | | |
| - | | |
| - | | |
| 1,276 | |
| Legal claim contingency | |
| 461 | | |
| - | | |
| - | | |
| - | | |
| 461 | | |
| - | | |
| - | | |
| - | | |
| 461 | |
| Lease liabilities | |
| 819 | | |
| (119 | ) | |
| - | | |
| - | | |
| 700 | | |
| (259 | ) | |
| - | | |
| - | | |
| 441 | |
| Estimate for devaluation of spare parts and supplies | |
| 432 | | |
| 3 | | |
| - | | |
| - | | |
| 435 | | |
| (13 | ) | |
| - | | |
| - | | |
| 422 | |
| Effect of differences between book and tax bases of inventories | |
| 55 | | |
| - | | |
| - | | |
| - | | |
| 55 | | |
| - | | |
| - | | |
| - | | |
| 55 | |
| Effect of tax-loss carry forward | |
| 1,711 | | |
| (1,018 | ) | |
| - | | |
| - | | |
| 693 | | |
| (693 | ) | |
| - | | |
| - | | |
| - | |
| Allowance for expected credit losses for other receivables | |
| 974 | | |
| (974 | ) | |
| - | | |
| - | | |
| - | | |
| - | | |
| - | | |
| - | | |
| - | |
| Other | |
| 604 | | |
| 290 | | |
| - | | |
| - | | |
| 894 | | |
| 1,537 | | |
| - | | |
| - | | |
| 2,431 | |
| | |
| 10,077 | | |
| (529 | ) | |
| - | | |
| - | | |
| 9,548 | | |
| 2,178 | | |
| - | | |
| - | | |
| 11,726 | |
| Deferred income tax liabilities | |
| | | |
| | | |
| | | |
| | | |
| | | |
| | | |
| | | |
| | | |
| | |
| Right of use assets | |
| (648 | ) | |
| 88 | | |
| - | | |
| - | | |
| (560 | ) | |
| 245 | | |
| - | | |
| - | | |
| (315 | ) |
| Other | |
| 17 | | |
| - | | |
| - | | |
| - | | |
| 17 | | |
| - | | |
| - | | |
| - | | |
| 17 | |
| | |
| (631 | ) | |
| 88 | | |
| - | | |
| - | | |
| (543 | ) | |
| 245 | | |
| - | | |
| - | | |
| (298 | ) |
| Total deferred income tax assets | |
| 9,446 | | |
| (441 | ) | |
| - | | |
| - | | |
| 9,005 | | |
| 2,423 | | |
| - | | |
| - | | |
| 11,428 | |
| Movement of deferred income tax liabilities: | |
| | | |
| | | |
| | | |
| | | |
| | | |
| | | |
| | | |
| | | |
| | |
| Deferred income tax assets | |
| | | |
| | | |
| | | |
| | | |
| | | |
| | | |
| | | |
| | | |
| | |
| Impairment on brine project assets Salmueras | |
| 17,818 | | |
| 212 | | |
| - | | |
| - | | |
| 18,030 | | |
| 215 | | |
| - | | |
| - | | |
| 18,245 | |
| Impairment of assets | |
| - | | |
| - | | |
| - | | |
| - | | |
| - | | |
| 8,928 | | |
| - | | |
| - | | |
| 8,928 | |
| Long-term incentive plan | |
| 6,641 | | |
| 2,794 | | |
| - | | |
| - | | |
| 9,435 | | |
| (679 | ) | |
| - | | |
| - | | |
| 8,756 | |
| Impairment of mining assets | |
| 6,704 | | |
| 951 | | |
| - | | |
| - | | |
| 7,655 | | |
| (275 | ) | |
| - | | |
| - | | |
| 7,380 | |
| Financial instruments designated at fair value through OCI | |
| 6,640 | | |
| - | | |
| - | | |
| 167 | | |
| 6,807 | | |
| - | | |
| 7 | | |
| - | | |
| 6,814 | |
| Provision for spare parts and supplies obsolescence | |
| 5,708 | | |
| 216 | | |
| - | | |
| - | | |
| 5,924 | | |
| 759 | | |
| - | | |
| - | | |
| 6,683 | |
| Quarry rehabilitation provision | |
| 2,726 | | |
| 27 | | |
| 810 | | |
| - | | |
| 3,563 | | |
| 802 | | |
| - | | |
| 1,373 | | |
| 5,738 | |
| Provision for vacations | |
| 3,681 | | |
| 203 | | |
| - | | |
| - | | |
| 3,884 | | |
| 336 | | |
| - | | |
| - | | |
| 4,220 | |
| Legal claim contingency | |
| 930 | | |
| (502 | ) | |
| - | | |
| - | | |
| 428 | | |
| 798 | | |
| - | | |
| - | | |
| 1,226 | |
| Allowance for expected credit losses for trade receivables | |
| 635 | | |
| 18 | | |
| - | | |
| - | | |
| 653 | | |
| 454 | | |
| - | | |
| - | | |
| 1,107 | |
| Lease liabilities | |
| 450 | | |
| (240 | ) | |
| - | | |
| - | | |
| 210 | | |
| - | | |
| - | | |
| - | | |
| 210 | |
| Other | |
| 328 | | |
| - | | |
| - | | |
| - | | |
| 328 | | |
| 1,118 | | |
| - | | |
| - | | |
| 1,446 | |
| | |
| 52,261 | | |
| 3,679 | | |
| 810 | | |
| 167 | | |
| 56,917 | | |
| 12,456 | | |
| 7 | | |
| 1,373 | | |
| 70,753 | |
| Deferred income tax liabilities | |
| | | |
| | | |
| | | |
| | | |
| | | |
| | | |
| | | |
| | | |
| | |
| Effect of differences between book and tax bases of fixed assets and in the depreciation rates | |
| (190,178 | ) | |
| 3,752 | | |
| (810 | ) | |
| - | | |
| (187,236 | ) | |
| 199 | | |
| - | | |
| (1,373 | ) | |
| (188,410 | ) |
| Effect of costs of issuance of senior notes | |
| (2,685 | ) | |
| 314 | | |
| - | | |
| - | | |
| (2,371 | ) | |
| 391 | | |
| - | | |
| - | | |
| (1,980 | ) |
| Right of use assets | |
| (746 | ) | |
| 354 | | |
| - | | |
| - | | |
| (392 | ) | |
| (805 | ) | |
| - | | |
| - | | |
| (1,197 | ) |
| Net gain on cash flow hedge | |
| (7,414 | ) | |
| 36 | | |
| - | | |
| (1,133 | ) | |
| (8,511 | ) | |
| 9,145 | | |
| (634 | ) | |
| - | | |
| - | |
| Other | |
| (42 | ) | |
| - | | |
| - | | |
| - | | |
| (42 | ) | |
| - | | |
| - | | |
| - | | |
| (42 | ) |
| | |
| (201,065 | ) | |
| 4,456 | | |
| (810 | ) | |
| (1,133 | ) | |
| (198,552 | ) | |
| 8,930 | | |
| (634 | ) | |
| (1,373 | ) | |
| (191,629 | ) |
| Total deferred income tax liabilities, net | |
| (148,804 | ) | |
| 8,135 | | |
| - | | |
| (966 | ) | |
| (141,635 | ) | |
| 21,386 | | |
| (627 | ) | |
| - | | |
| (120,876 | ) |
| | |
| | | |
| 7,694 | | |
| | | |
| (966 | ) | |
| | | |
| 23,809 | | |
| (627 | ) | |
| | | |
| | |
Notes to the consolidated financial statements (continued)
The Group offsets tax assets and liabilities if and only
if it has a legally enforceable right to set off current tax assets and current tax liabilities, and the tax assets and deferred tax liabilities
relate to income taxes levied by the same tax authority. The legal right is defined for each individual determination of the income tax
of the Company and its Subsidiaries.
A reconciliation between tax expense and the product of
the accounting profit multiplied by Peruvian tax rate for the years ended December 31, 2023, 2022 and 2021 are as follows:
| | |
2023 | | |
2022 | | |
2021 | |
| | |
S/(000) | | |
S/(000) | | |
S/(000) | |
| | |
| | |
| | |
| |
| Profit before income tax | |
| 245,708 | | |
| 262,420 | | |
| 224,110 | |
| Income tax expense calculated at the statutory income tax rate of 29.5% | |
| (72,484 | ) | |
| (77,414 | ) | |
| (66,112 | ) |
| | |
| | | |
| | | |
| | |
| Permanent differences | |
| | | |
| | | |
| | |
| Non-deductible expenses, net | |
| (2,369 | ) | |
| (7,415 | ) | |
| (4,070 | ) |
| Effect of tax-loss carry forward not recognized | |
| (1,955 | ) | |
| (763 | ) | |
| (758 | ) |
| Income tax expense the effective income tax rate of 31% in 2023 (2022: 33% and 2021: 32%) | |
| (76,808 | ) | |
| (85,592 | ) | |
| (70,940 | ) |
The components of the deferred income tax related to the
items recognized in the OCI during the years ended December 31, 2023, 2022 and 2021, are as follow:
| | |
2023 | | |
2022 | | |
2021 | |
| | |
S/(000) | | |
S/(000) | | |
S/(000) | |
| | |
| | |
| | |
| |
| Consolidated statement of profit or loss | |
| | |
| | |
| |
| Current | |
| (100,617 | ) | |
| (93,286 | ) | |
| (71,385 | ) |
| Deferred | |
| 23,809 | | |
| 7,694 | | |
| 445 | |
| | |
| (76,808 | ) | |
| (85,592 | ) | |
| (70,940 | ) |
As of December 31, 2023, 2022 and 2021, the Group had not
recognized a deferred tax liability for taxes that would be payable on the unremitted earnings of the Group’s subsidiaries. The
Group has determined that the timing differences will be reversed by means of dividends to be received in the future that, according to
the current tax rules in effect in Peru, are not subject to income tax.
As of December 31, 2023, certain subsidiaries of the Group
had tax loss carryforwards of S/44,725,000 (2022: S/25,424,000). These tax loss carryforwards do not expire, are related to subsidiaries
that have a history of losses for some time and cannot be used to offset future taxable profits of other Group subsidiaries. No deferred
tax assets have been recognized in relation to these tax loss carryforwards, since there are no possibilities of tax planning opportunities
or other evidence of recovery in the near future.
For information purposes, the temporary difference associated
with investments in subsidiaries, would generate an aggregate deferred tax liability amounting to S/126,972,000 (2022: S/104,842,000),
which should not be recognized in the consolidated financial statements as it is not expected to reverse in the foreseeable future and
the Company is in control of such reversal.
Notes to the consolidated financial statements (continued)
As of December 31, 2023 and 2022, share
capital was represented by 423,868,449 authorized common shares subscribed and fully paid, with a nominal value of one Soles per share.
As of December 31, 2023, the total outstanding common shares were as follows; 35,753,501 were listed on the New York Stock Exchange and
388,114,948 were listed on the Lima Stock Exchange. As of December 31, 2022 of the total outstanding common shares; 34,060,726 were listed
on the New York Stock Exchange and 389,807,723 were listed on the Lima Stock Exchange.
Investment shares do not have voting rights
or participate in shareholder’s meetings or the appointment of directors. Investment shares confer upon the holders thereof the
right to participate in dividends distributed according to their nominal value, in the same manner as common shares. Investment shares
also confer the holders thereof the right to:
| (i) | maintain the current proportion of the investment shares in the case of capital increase by new contributions; |
| (ii) | increase the number of investment shares upon capitalization of retained earnings, revaluation surplus or other reserves that do not
represent cash contributions; |
| (iii) | participate in the distribution of the assets resulting from liquidation of the Company in the same manner as common shares; and, |
| (iv) | redeem the investment shares in case of a merger and/or change of business activity of the Company. |
As of December 31, 2023 and 2022, the Company had 40,278,894
investment shares subscribed and fully paid, with a nominal value of one Sol per share.
As of December 31, 2023 and 2022, the
Company maintains 36,040,497 investment shares held in treasury amounting to S/121,258,000.
| (d) | Additional paid-in capital - |
As of December 31, 2023 and 2022, the
additional capital amounted to S/432,779,000 and arises mainly as a result of the excess of total proceeds obtained versus par value in
the issuance of 111,484,000 common shares and 927,783 investment shares corresponding to a public offering of American Depositary Shares
(ADS) registered with the New York Stock Exchange and Lima Stock Exchange.
Notes to the consolidated financial statements (continued)
Provisions of the General Corporation
Law require that a minimum of 10 per cent of the distributable earnings for each period, after deducting the income tax, be transferred
to a legal reserve until such is equal to 20 per cent of the capital. This legal reserve can offset losses or can be capitalized, and
in both cases, there is the obligation to replenish it.
| (f) | Other accumulated comprehensive results - |
This reserve records fair value changes on available-for-sale financial assets and the unrealized results of cash flow hedges.
| (g) | Distributions made and proposed – |
| | |
2023 | | |
2022 | | |
2021 | |
| | |
| | |
| | |
| |
| Approval date by Board of Directors | |
| November 7, 2023 | | |
| October 10, 2022 | | |
| April 29, 2021 | |
| Declared dividends per share to be paid in cash S/. | |
| 0.41000 | | |
| 0.42000 | | |
| 0.79000 | |
| Declared dividends S/(000): | |
| 175,524 | | |
| 179,805 | | |
| 338,204 | |
As of December 31, 2023 and 2022, dividends
payable amounted to S/10,322,000 and S/9,764,000, respectively, see note 11.
Notes to the consolidated financial statements (continued)
This caption is made up as follows:
| | |
For the year ended of December 31, 2023 | |
| | |
Cement | | |
Concrete and mortar | | |
Precast | | |
Construction supplies | | |
Other | | |
Total | |
| | |
S/(000) | | |
S/(000) | | |
S/(000) | | |
S/(000) | | |
S/(000) | | |
S/(000) | |
| | |
| | |
| | |
| | |
| | |
| | |
| |
| Segments | |
| | |
| | |
| | |
| | |
| | |
| |
| Sale of cement, concrete, mortar and precast | |
| 1,642,420 | | |
| 182,278 | | |
| 25,540 | | |
| - | | |
| - | | |
| 1,850,238 | |
| Sale of construction supplies | |
| - | | |
| - | | |
| - | | |
| 74,096 | | |
| - | | |
| 74,096 | |
| Sale of other | |
| - | | |
| - | | |
| - | | |
| - | | |
| 25,741 | | |
| 25,741 | |
| | |
| | | |
| | | |
| | | |
| | | |
| | | |
| | |
| | |
| 1,642,420 | | |
| 182,278 | | |
| 25,540 | | |
| 74,096 | | |
| 25,741 | | |
| 1,950,075 | |
| | |
For the year ended of December 31, 2022 | |
| | |
Cement | | |
Concrete and mortar | | |
Precast | | |
Construction supplies | | |
Other | | |
Total | |
| | |
S/(000) | | |
S/(000) | | |
S/(000) | | |
S/(000) | | |
S/(000) | | |
S/(000) | |
| | |
| | |
| | |
| | |
| | |
| | |
| |
| Segments | |
| | |
| | |
| | |
| | |
| | |
| |
| Sale of cement, concrete, mortar and precast | |
| 1,742,704 | | |
| 189,945 | | |
| 31,177 | | |
| - | | |
| - | | |
| 1,963,826 | |
| Sale of construction supplies | |
| - | | |
| - | | |
| - | | |
| 114,024 | | |
| - | | |
| 114,024 | |
| Sale of other | |
| - | | |
| - | | |
| - | | |
| - | | |
| 37,896 | | |
| 37,896 | |
| | |
| | | |
| | | |
| | | |
| | | |
| | | |
| | |
| | |
| 1,742,704 | | |
| 189,945 | | |
| 31,177 | | |
| 114,024 | | |
| 37,896 | | |
| 2,115,746 | |
| | |
For the year ended of December 31, 2021 | |
| | |
Cement | | |
Concrete and mortar | | |
Precast | | |
Construction supplies | | |
Other | | |
Total | |
| | |
S/(000) | | |
S/(000) | | |
S/(000) | | |
S/(000) | | |
S/(000) | | |
S/(000) | |
| | |
| | |
| | |
| | |
| | |
| | |
| |
| Segments | |
| | |
| | |
| | |
| | |
| | |
| |
| Sale of cement, concrete, mortar and precast | |
| 1,534,867 | | |
| 213,565 | | |
| 36,055 | | |
| - | | |
| - | | |
| 1,784,487 | |
| Sale of construction supplies | |
| - | | |
| - | | |
| - | | |
| 113,905 | | |
| - | | |
| 113,905 | |
| Sale of other | |
| - | | |
| - | | |
| - | | |
| - | | |
| 39,375 | | |
| 39,375 | |
| | |
| | | |
| | | |
| | | |
| | | |
| | | |
| | |
| | |
| 1,534,867 | | |
| 213,565 | | |
| 36,055 | | |
| 113,905 | | |
| 39,375 | | |
| 1,937,767 | |
For all segments, performance obligations are met at the
time of delivery of the goods and the terms of payment are usually between 30 and 90 days from the date of dispatch.
For all segments, the amounts presented as sales of the
different products are already net of discounts and bonuses.
Notes to the consolidated financial statements (continued)
This caption is made up as follows:
| | |
2023 | | |
2022 | | |
2021 | |
| | |
S/(000) | | |
S/(000) | | |
S/(000) | |
| | |
| | |
| | |
| |
| Beginning balance of goods and finished products | |
| 20,037 | | |
| 25,304 | | |
| 12,877 | |
| Beginning balance of work in progress | |
| 186,937 | | |
| 135,008 | | |
| 114,246 | |
| Consumption of miscellaneous supplies | |
| 429,069 | | |
| 607,518 | | |
| 566,781 | |
| Maintenance and third-party services | |
| 244,722 | | |
| 277,250 | | |
| 242,412 | |
| Shipping costs | |
| 177,393 | | |
| 201,849 | | |
| 196,064 | |
| Depreciation and amortization | |
| 125,494 | | |
| 121,871 | | |
| 118,998 | |
| Personnel expenses, note 20(b) | |
| 125,318 | | |
| 125,683 | | |
| 113,513 | |
| Costs of packaging | |
| 66,456 | | |
| 81,023 | | |
| 71,580 | |
| Other manufacturing expenses | |
| 76,337 | | |
| 95,183 | | |
| 102,177 | |
| Ending balance of goods and finished products | |
| (16,916 | ) | |
| (20,037 | ) | |
| (25,304 | ) |
| Ending balance of work in progress | |
| (174,224 | ) | |
| (186,937 | ) | |
| (135,008 | ) |
| | |
| 1,260,623 | | |
| 1,463,715 | | |
| 1,378,336 | |
| 18. | Administrative expenses |
This caption is made up as follows:
| | |
2023 | | |
2022 | | |
2021 | |
| | |
S/(000) | | |
S/(000) | | |
S/(000) | |
| | |
| | |
| | |
| |
| Personnel expenses, note 20(b) | |
| 125,072 | | |
| 116,748 | | |
| 96,891 | |
| Third-party services | |
| 68,329 | | |
| 72,172 | | |
| 59,896 | |
| Depreciation and amortization | |
| 18,002 | | |
| 16,667 | | |
| 16,569 | |
| Donations | |
| 9,028 | | |
| 8,494 | | |
| 9,067 | |
| Board of Directors compensation | |
| 6,788 | | |
| 6,112 | | |
| 6,397 | |
| Taxes | |
| 5,941 | | |
| 5,669 | | |
| 5,563 | |
| Consumption of supplies | |
| 1,551 | | |
| 1,715 | | |
| 1,686 | |
| | |
| 234,711 | | |
| 227,577 | | |
| 196,069 | |
| 19. | Selling and distribution expenses |
This caption is made up as follows:
| | |
2023 | | |
2022 | | |
2021 | |
| | |
S/(000) | | |
S/(000) | | |
S/(000) | |
| | |
| | |
| | |
| |
| Personnel expenses, note 20(b) | |
| 41,642 | | |
| 42,300 | | |
| 33,867 | |
| Third-party services | |
| 12,270 | | |
| 11,106 | | |
| 9,733 | |
| Advertising and promotion | |
| 7,548 | | |
| 6,417 | | |
| 5,637 | |
| Allowance for expected credit losses, note 7(d) | |
| 1,707 | | |
| 1,972 | | |
| 563 | |
| Other | |
| 3,658 | | |
| 3,442 | | |
| 1,720 | |
| | |
| 66,825 | | |
| 65,237 | | |
| 51,520 | |
Notes
to the consolidated financial statements (continued)
| 20. | Employee benefits expenses |
| (a) | Employee benefits expenses are made up as follow: |
| | |
2023 | | |
2022 | | |
2021 | |
| | |
S/(000) | | |
S/(000) | | |
S/(000) | |
| | |
| | |
| | |
| |
| Wages and salaries | |
| 162,252 | | |
| 165,530 | | |
| 138,675 | |
| Workers ‘profit sharing, note 12(b) | |
| 34,258 | | |
| 30,972 | | |
| 25,049 | |
| Social contributions | |
| 33,868 | | |
| 32,966 | | |
| 28,842 | |
| Legal bonuses | |
| 23,013 | | |
| 20,556 | | |
| 19,620 | |
| Vacations | |
| 22,226 | | |
| 18,481 | | |
| 18,032 | |
| Long-term incentive plan, note 12 | |
| 7,632 | | |
| 8,272 | | |
| 9,763 | |
| Cessation payments | |
| 6,308 | | |
| 4,511 | | |
| 2,203 | |
| Training | |
| 1,332 | | |
| 2,307 | | |
| 1,408 | |
| Other | |
| 1,143 | | |
| 1,136 | | |
| 679 | |
| | |
| 292,032 | | |
| 284,731 | | |
| 244,271 | |
| (b) | Employee benefits expenses are allocated as follows: |
| | |
2023 | | |
2022 | | |
2021 | |
| | |
S/(000) | | |
S/(000) | | |
S/(000) | |
| | |
| | |
| | |
| |
| Cost of sales, note 17 | |
| 125,318 | | |
| 125,683 | | |
| 113,513 | |
| Administrative expenses, note 18 | |
| 125,072 | | |
| 116,748 | | |
| 96,891 | |
| Selling and distribution expenses, note 19 | |
| 41,642 | | |
| 42,300 | | |
| 33,867 | |
| | |
| 292,032 | | |
| 284,731 | | |
| 244,271 | |
This caption is made up as follows:
| | |
2023 | | |
2022 | | |
2021 | |
| | |
S/(000) | | |
S/(000) | | |
S/(000) | |
| | |
| | |
| | |
| |
| Interest on senior notes, note 13 (b.1) and 13 (b.2) | |
| 38,690 | | |
| 60,225 | | |
| 63,333 | |
| Interest on Club Deal promissory note and loan, note 13(c) | |
| 59,643 | | |
| 14,920 | | |
| 7,326 | |
| Finance cost on cross currency swaps | |
| 1,730 | | |
| 15,155 | | |
| 15,046 | |
| Expenses for the purchase and amortization of issuance costs of senior notes | |
| 1,249 | | |
| 1,027 | | |
| 815 | |
| Interest on lease liabilities | |
| 573 | | |
| 317 | | |
| 383 | |
| Counterparty credit risk in cross currency swaps | |
| 12 | | |
| 62 | | |
| 848 | |
| Interest for bank overdraft | |
| 31 | | |
| - | | |
| - | |
| Other | |
| 293 | | |
| 2,108 | | |
| 479 | |
| | |
| | | |
| | | |
| | |
| Total interest expense | |
| 102,221 | | |
| 93,814 | | |
| 88,230 | |
| Unwinding of discount of provisions, note 12 | |
| 1,824 | | |
| 1,291 | | |
| 735 | |
| | |
| 104,045 | | |
| 95,105 | | |
| 88,965 | |
Notes
to the consolidated financial statements (continued)
Transactions with related entities -
During 2023, 2022 and 2021, the Company carried out the
following transactions with its parent company Inversiones ASPI S.A. and its other related parties:
| | |
2023 | | |
2022 | | |
2021 | |
| | |
S/(000) | | |
S/(000) | | |
S/(000) | |
| | |
| | |
| | |
| |
| Income | |
| | |
| | |
| |
| Parent | |
| | |
| | |
| |
| Inversiones ASPI S.A. (ASPI) | |
| | |
| | |
| |
| Income from office lease | |
| 16 | | |
| 16 | | |
| 20 | |
| Fees for management and administrative services | |
| 88 | | |
| 100 | | |
| 98 | |
| | |
| | | |
| | | |
| | |
| Other related parties | |
| | | |
| | | |
| | |
| Compañía Minera Ares S.A.C. (Ares) | |
| | | |
| | | |
| | |
| Income from land lease, note 24 | |
| 1,150 | | |
| 1,200 | | |
| 1,230 | |
| Income from office lease | |
| 259 | | |
| 244 | | |
| 332 | |
| Fossal S.A.A. (Fossal) | |
| | | |
| | | |
| | |
| Income from office lease | |
| 16 | | |
| 16 | | |
| 18 | |
| Fees for management and administrative services | |
| 44 | | |
| 52 | | |
| 52 | |
| Fosfatos del Pacífico S.A. (Fospac) | |
| | | |
| | | |
| | |
| Income from office lease | |
| 16 | | |
| 16 | | |
| 19 | |
| Fees for management and administrative services | |
| 143 | | |
| 46 | | |
| 155 | |
| Asociación Sumac Tarpuy | |
| | | |
| | | |
| | |
| Income from office lease | |
| 16 | | |
| 16 | | |
| 20 | |
| | |
| | | |
| | | |
| | |
| Expense | |
| | | |
| | | |
| | |
| Other related parties | |
| | | |
| | | |
| | |
| Security services provided by Compañía Minera Ares S.A.C. | |
| (1,940 | ) | |
| (2,110 | ) | |
| (2,836 | ) |
| | |
| | | |
| | | |
| | |
| Loans | |
| | | |
| | | |
| | |
| Other related parties | |
| | | |
| | | |
| | |
| Loans to Fossal S.A.A. | |
| - | | |
| - | | |
| (14,252 | ) |
| Loans to Fosfatos del Pacífico S.A. | |
| - | | |
| - | | |
| (2,869 | ) |
| Loan collection from Fossal S.A.A. | |
| - | | |
| - | | |
| 14,252 | |
| Loan collection from Fosfatos del Pacífico S.A. | |
| - | | |
| - | | |
| 2,869 | |
Notes
to the consolidated financial statements (continued)
As a result of these transactions, the
Company had the following rights and obligations as of December 31, 2023 and 2022:
| | |
2023 | | |
2022 | |
| | |
Accounts
receivable | | |
Accounts
payable | | |
Accounts
receivable | | |
Accounts
payable | |
| | |
S/(000) | | |
S/(000) | | |
S/(000) | | |
S/(000) | |
| | |
| | |
| | |
| | |
| |
| Parent | |
| | |
| | |
| | |
| |
| Inversiones ASPI S.A. | |
| 89 | | |
| - | | |
| - | | |
| 5 | |
| | |
| 89 | | |
| - | | |
| - | | |
| 5 | |
| | |
| | | |
| | | |
| | | |
| | |
| Other related parties | |
| | | |
| | | |
| | | |
| | |
| Fosfatos del Pacífico S.A. | |
| 1,413 | | |
| 305 | | |
| 1,123 | | |
| 461 | |
| Compañía Minera Ares S.A.C. | |
| 315 | | |
| 211 | | |
| 564 | | |
| 2,220 | |
| Fossal S.A.A. | |
| 52 | | |
| - | | |
| 75 | | |
| - | |
| Other | |
| 104 | | |
| - | | |
| 96 | | |
| - | |
| | |
| 1,884 | | |
| 516 | | |
| 1,858 | | |
| 2,681 | |
| | |
| 1,973 | | |
| 516 | | |
| 1,858 | | |
| 2,686 | |
Terms and conditions of transactions
with related parties -
Outstanding balances with related parties
at the year-end are unsecured and interest free and settlement occurs in cash. For the years ended December 31, 2023, 2022 and 2021, the
Group had not recorded an allowance for expected credit losses relating to amounts owed by related parties. This assessment is undertaken
each financial year through examining the financial position of the related party and the market in which the related party operates.
Compensation of key management personnel
of the Group –
The compensation paid to key management
personnel includes expenses for profit-sharing, compensation and other concepts for members of the Board of Directors and the key management.
For the year ended December 31, 2023, the total short-term compensation amounted to S/28,922,000 (2022: S/26,066,000 and 2021: S/22,678,000)
and the total long-term compensation amounted to S/7,632,000 (2022: S/8,272,000 and 2021: S/9,763,000), and there were no post-employment
or contract termination benefits or share-payments.
Basic and diluted earnings per share amounts are calculated
by dividing the profit for the year by the weighted average number of common shares and investment shares outstanding during the year.
The calculation of basic and diluted earnings per share
is shown below:
| | |
2023 | | |
2022 | | |
2021 | |
| Numerator | |
| | |
| | |
| |
| Profit for the year (S/000) | |
| 168,900 | | |
| 176,828 | | |
| 153,170 | |
| Denominator | |
| | | |
| | | |
| | |
| Weighted average number of common and investment shares (thousands of shares) | |
| 428,107 | | |
| 428,107 | | |
| 428,107 | |
| | |
| | | |
| | | |
| | |
| Basic and diluted earnings per share (S/) | |
| 0.39 | | |
| 0.41 | | |
| 0.36 | |
The Group had no dilutive potential ordinary shares as
of December 31, 2023, 2022 and 2021.
There have been no other transactions involving common
shares or investment shares between the reporting date and the date of the authorization of these consolidated financial statements.
Notes
to the consolidated financial statements (continued)
| 24. | Commitments and contingencies |
Operating lease commitments –
Group as lessor
As
of December 31, 2023 and 2022, the Group, as lessor, has a land lease with Compañía Minera Ares S.A.C. a related party of
Inversiones ASPI S.A. This lease is renewable annually, and provided an annual rent expense for the years ended December 31, 2023, 2022
and 2021 of S/1,150,000, S/1,200,000 and S/1,230,000, respectively; see note 22.
Consortium contract –
On
December 19, 2022, Distribuidora Norte Pacasmayo S.R.L., subsidiary of the Group, had subscribed a collaboration contract with a third
party, with the purpose to participate together in the project “Mejoramiento del Sistema de Pistas y Cerco Perimétrico del
Aeropuerto de Piura”. The mentioned contract is valid for a maximum of 2 years and 11 months.
On
this matter, the Company has communicated to the tax authority the subscription of the collaboration contract which will take independent
accounting and Distribuidora Norte Pacasmayo S.R.L. will be the contracting party that will act as operator of the contract.
Capital commitments
As
of December 31, 2023 and 2022, the Group had no significant capital commitments.
Usufruct Concessions
In
December 2013, the Company signed an agreement with a third party, related to the use of the Virrilá concession, to carry out other
non-metallic mining activities related to cement production. This agreement has a term of 30 years, with fixed annual payments of US$600,000
for the first three years and variable payments for the rest of the contract. The related expense for the years ended December 31, 2023,
2022 and 2021 amounted to S/5,273,000, S/9,445,000 and S/7,280,000 respectively, and was recognized as part of cost of inventory production.
As part of this agreement, the Company is required to pay an equivalent amount of S/4.5 for each metric ton of calcareous extracted that
is indexed by inflation after the first year of exploitation; the annual royalty may not be less than the equivalent to 850,000 metric
tons after the beginning of the fourth year of production.
The
Company signed an agreement with two third parties in October 2007, related to usufruct of the Bayovar 4 concession for an indefinite
period to extract seashells and other minerals. As consequence, the Group made payments amounting to US$250,000 for each third party for
the first five years and variable payments for the rest of the contract. The related expense as of December 31, 2023 and 2022 amounted
to S/1,514,000 and S/1,582,000, respectively, and were recognized as part of the cost of inventory production. As part of this agreement,
the Company is required to pay an equivalent amount of US$5.1 to each third party for every metric ton of calcareous extracted, with the
minimum production level for the calculation of 20,000 metric tons every six months following the beginning of the sixth year of production.
Mining royalty
According
with the Royalty Mining Law in force since October 1, 2011, the royalty for the exploitation of metallic and nonmetallic resources is
payable on a quarterly basis in an amount equal to the greater of: (i) an amount determined in accordance with a statutory scale of rates
based on operating profit margin that is applied to the quarterly operating profit, adjusted by certain items, and (ii) 1% of net sales,
in each case during the applicable quarter. These amounts are estimated based on the unconsolidated financial statements of Cementos Pacasmayo
S.A.A. and the subsidiaries affected by this mining royalty, prepared in accordance with IFRS. Mining royalty payments will be deductible
for income tax purposes in the fiscal year in which such payments are made.
Mining
royalty expense paid to the Peruvian Government for 2023, 2022 and 2021 amounted to S/983,000, S/1,193,000 and S/990,000 and, respectively,
and is recognized as part of the cost of inventory production.
Notes to the consolidated financial statements
(continued)
Tax situation
The Company is subject to Peruvian tax
law. As of December 31, 2023, 2022 and 2021, the income tax rate is 29.5 percent of the taxable profit after deducting employee participation,
which is calculated at a rate of 8 to 10 percent of the taxable income.
For purposes of determining income tax,
transfer pricing for transactions with related companies and companies resident in territories with low or no taxation, must be supported
with documentation including information on the valuation methods used and the criteria considered for determination. Based on the operations
of the Group, Management and its legal advisors believe that as a result of the application of these standards will not result in significant
contingencies for the Group as of December 31, 2023 and 2022.
The tax authority has the power to review
and, if applicable, adjust the income tax calculated by each company in the four years subsequent after the year of filing the tax return.
The statements of income tax and value
added tax corresponding to the years indicated in the attached table are subject to review by the tax authorities:
| | |
Years open to review by Tax Authority |
| Entity | |
Income tax | |
Value-added tax |
| | |
| |
|
| Cementos Pacasmayo S.A.A. | |
2018 - 2023 | |
Dec. 2018 - 2023 |
| Cementos Selva S.A.C. | |
2018 - 2023 | |
Dec. 2018 - 2023 |
| Distribuidora Norte Pacasmayo S.R.L. | |
2018 - 2023 | |
Dec. 2018 - 2023 |
| Empresa de Transmisión Guadalupe S.A.C. | |
2018 - 2023 | |
Dec. 2018 - 2023 |
| Salmueras Sudamericanas S.A. | |
2018 - 2023 | |
Dec. 2018 - 2023 |
| Calizas del Norte S.A.C. (liquidated during 2022) | |
2018 - 2022 | |
Dec. 2018 - 2022 |
| Soluciones Takay S.A.C. | |
2019 – 2023 | |
May to Dec.2019 - 2023 |
| Corporación Materiales Piura S.A.C. | |
2019 – 2023 | |
Dec.2018- 2023 |
Due to possible interpretations that
the tax authority may give to legislation in effect, it is not possible to determine whether or not any of the tax audits will result
in increased liabilities for the Group. For that reason, tax or surcharge that could arise from future tax audits would be applied to
the income of the period in which it is determined. However, in management’s opinion and that of its legal advisors, any possible
additional payment of taxes would not have a material effect on the consolidated financial statements as of December 31, 2023 and 2022.
Environmental matters
The
Group’s exploration and exploitation activities are subject to environmental protection standards.
Environmental remediation -
Law No. 28271 regulates environmental
liabilities in mining activities. This Law has the objectives of ruling the identification of mining activity’s environmental liabilities
and financing the remediation of the affected areas. According to this law, environmental liabilities refer to the impact caused to the
environment by abandoned or inactive mining operations.
In compliance with the above-mentioned
laws, the Group presented environmental impact studies (EIS), declaration of environmental studies (DES) and Environmental Adaptation
and Management Programs (EAMP) for its mining concessions.
Notes
to the consolidated financial statements (continued)
The Peruvian authorities approved the
EIS and EAMP presented by the Group for its mining concessions and exploration projects. A detail of plans and related expenses approved
is presented as follows:
| |
| |
| |
| | |
| |
Operating year expense | |
| Project unit | |
Resource | |
Resolution
Number | |
| Year of
approval | | |
Program
approved | |
| 2023 | | |
| 2022 | | |
| 2021 | |
| | |
| |
| |
| | | |
| |
| S/(000) | | |
| S/(000) | | |
| S/(000) | |
| | |
| |
| |
| | | |
| |
| | | |
| | | |
| | |
| Rioja | |
Limestone | |
RD186-2014-PRODUCE/DVMYPE-I/DIGGAM | |
| 2014 | | |
EIA | |
| 879 | | |
| 810 | | |
| 713 | |
| Tembladera | |
Limestone | |
RD304-18-PRODUCE/DVMYPE-I/DIGAAMI | |
| 2018 | | |
PAMA | |
| 320 | | |
| 299 | | |
| 298 | |
| | |
| |
| |
| | | |
| |
| 1,199 | | |
| 1,109 | | |
| 1,011 | |
As of December 31, 2023 and 2022, the
Group had no liabilities related to environmental remediation expenses because all were paid before the end of the year.
Quarry rehabilitation provision
-
The Law No. 28090 regulates the obligations
and procedures that must be met by the holders of mining activities for the preparation, filing and implementation of Quarry Closure Plans,
as well as the establishment of the corresponding environmental guarantees to secure fulfillment of the investments that this includes,
subject to the principles of protection, preservation and recovery of the environment. In connection with this obligation, as of December
31, 2023 and 2022, the Group maintained a provision for the closing of the quarries exploited by its operations amounting to S/17,676,000
and S/13,377,000, respectively. The Group believes that this liability is adequate to meet the current environmental protection laws approved
by the Ministry of Energy and Mines, refer to note 12.
Notes
to the consolidated financial statements (continued)
Legal claim contingency
As
of December 31, 2023, the Group had received claims from third parties in relation with its operations which in aggregate represent S/966,000
that corresponded to labor claims from former employees.
Management
expects that these claims will be resolved within the next five years based on prior experience; however, the Group cannot assure that
these claims will be resolved within this period because the authorities do not have a maximum term to resolve cases.
The
Group has been advised by its legal counsel that it is only possible, but not probable, that these actions will succeed. Accordingly,
no provision for any liability has been made in these interim condensed consolidated unaudited financial statements.
| 25. | Financial risk management, objectives and policies |
The Group’s main financial liabilities comprise loans
and borrowings, trade payables and other payables. The main purpose of these financial liabilities is to finance the Group’s operations.
The Group´s main financial assets include cash and short-term deposits and trade and other receivables that derive directly from
its operations.
The Group is exposed to market risk, credit risk and liquidity
risk. The Group’s senior management oversees the management of these risks. The Group’s senior management is supported by
Financial Management that advises on financial risks and the appropriate financial risk governance framework for the Group. The financial
management provides assurance to the Group’s senior management that the Group’s financial risk-taking activities are governed
by appropriate policies and procedures and that financial risks are identified, measured and managed in accordance with the Group´s
policies and risk objectives.
Management reviews and implements policies for managing
each of these risks, which are summarized below.
Market risk -
Market risk is the risk that the fair value or future cash
flows of a financial instrument will fluctuate because of changes in market prices. Market risk comprise three types of risk: interest
rate risk, foreign currency risk and other price risk (such as equity price risk and commodity risk).
The sensitivity analyses shown in the following sections
relate to the Group’s consolidated position as of December 31, 2023 and 2022. The sensitivity analyses have been prepared on the
basis that the amount of net debts and the proportion of financial instruments in foreign currencies are all constant and on the basis
of the hedge designations in place as of December 31, 2023 and 2022.
Notes
to the consolidated financial statements (continued)
Interest rate risk -
Interest rate risk is the risk that the fair value or future
cash flows of a financial instrument will fluctuate because of changes in market interest rates.
As of December 31, 2023 and 2022, all of the Group’s
borrowings are at a fixed rate of interest; consequently, the management evaluated that it is not relevant to do an interest rate sensitivity
analysis.
Foreign currency risk -
Foreign currency risk is the risk that the fair value or
future cash flows of a financial instrument will fluctuate because of changes in foreign exchange rates. The Group’s exposure to
the risk of changes in foreign exchange relates primarily to the Group’s operating activities (when revenue or expense is denominated
in a different currency from the Group’s functional currency).
As of December 31, 2023 cross currency swaps were settled
in full in correlation with the payment of international dollar bonds.
Foreign currency sensitivity
The following table demonstrates the sensitivity to a reasonably
possible change in the US dollar exchange rate, with all other variables held constant. The impact on the Group’s profit before
income tax is due to changes in the fair value of monetary assets and liabilities.
| 2023 | |
Change in
US$ rate | | |
Effect on
consolidated profit
before tax | |
| U.S. Dollar | |
% | | |
S/(000) | |
| |
| | |
| |
| |
| +5 | | |
| (948 | ) |
| | |
| +10 | | |
| (1,896 | ) |
| | |
| -5 | | |
| 948 | |
| | |
| -10 | | |
| 1,896 | |
| 2022 | |
Change in
US$ rate | | |
Effect on
consolidated profit
before tax | |
| U.S. Dollar | |
% | | |
S/(000) | |
| | |
| | |
| |
| |
| +5 | | |
| 1,638 | |
| |
| +10 | | |
| 3,276 | |
| | |
| -5 | | |
| (1,638 | ) |
| | |
| -10 | | |
| (3,276 | ) |
| 2021 | |
Change in
US$ rate | | |
Effect on
consolidated profit
before tax | |
| U.S. Dollar | |
% | | |
S/(000) | |
| | |
| | |
| |
| |
| +5 | | |
| 7,695 | |
| |
| +10 | | |
| 15,391 | |
| | |
| -5 | | |
| (7,695 | ) |
| | |
| -10 | | |
| (15,391 | ) |
Credit risk -
Credit risk is the risk that counterparty will not meet
its obligations under a financial instrument or customer contract, leading to a financial loss. The Group is exposed to a credit risk
from its operating activities (primarily for trade receivables) and from its financing activities, including deposits with banks and financial
institutions, foreign exchange transactions and other financial instruments.
Notes to the consolidated financial statements (continued)
Trade receivables
Customer credit risk is managed by each business unit subject
to the Group’s established policy, procedures and control relating to customer credit risk management. Credit quality of the customer
is assessed, and individual credit limits are defined in accordance with this assessment. Outstanding customer receivables are regularly
monitored and any shipments to major customers are generally covered by letters of credit. As of December 31, 2023 and 2022, the Group
had 4 customers, that owed the Group more than S/3,000,000 each accounting for approximately 29% and 23% of all trade receivables outstanding,
respectively. There were 25 and 27 customers with balances greater than S/700,000 and less than S/3,000,000, which accounted for approximately
48% and 55% of the total trade receivables, respectively. The evaluation for allowance for expected credit losses is updated at the date
of the consolidated financial statements and individually for the main customers. This calculation is based on actual historical data
incurred.
The maximum exposure to credit risk at the reporting date
is the carrying value of each class of financial assets disclosed in note 7. The Group does not hold collateral as security.
Cash deposits and hedging derivative financial instruments
or at fair value through profit or loss-
Credit risk from balances with banks and financial institutions
is managed by the Group’s treasury department in accordance with the Group’s policy. Investments of surplus funds are made
only with approved counterparties of first level. The limits are set to minimize the concentration of risks and therefore mitigate financial
loss through potential counterparty’s failure to make payments. As of December 31, 2023 and 2022, the Group’s maximum exposure
to credit risk for the components of carrying amounts as showed in note 6. The Group’s maximum exposure relating to financial derivative
instruments is noted in the liquidity table below. The hedging derivative financial instruments were liquidated in February 2023.
Liquidity risk -
The Group monitors its risk of shortage of funds using
a recurring liquidity planning tool.
The Group’s objective is to maintain a balance between
continuity of funding and flexibility through the use of bank loans and long term debentures. Access to sources of funding is sufficiently
available and debt maturing within 12 months can be rolled over under the same conditions with existing lenders, if is necessary.
Notes
to the consolidated financial statements (continued)
The table below summarizes the maturity profile of the
Group’s financial liabilities based on contractual undiscounted payments:
| | |
Less than 3 months | | |
3 to 12 months | | |
1 to 5 years | | |
More than 5 years | | |
Total | |
| | |
S/(000) | | |
S/(000) | | |
S/(000) | | |
S/(000) | | |
S/(000) | |
| | |
| | |
| | |
| | |
| | |
| |
| As of December 31, 2023 | |
| | |
| | |
| | |
| | |
| |
| Financial obligations | |
| 115,092 | | |
| 269,272 | | |
| 625,455 | | |
| 570,000 | | |
| 1,579,819 | |
| Interest | |
| 31,769 | | |
| 57,356 | | |
| 231,220 | | |
| 77,643 | | |
| 397,988 | |
| Trade and other payables | |
| 175,847 | | |
| 38,439 | | |
| - | | |
| - | | |
| 214,286 | |
| Lease liabilities | |
| 986 | | |
| 2,957 | | |
| 4,186 | | |
| - | | |
| 8,129 | |
| | |
| | | |
| | | |
| | | |
| | | |
| | |
| As of December 31, 2022 | |
| | | |
| | | |
| | | |
| | | |
| | |
| Financial obligations | |
| 414,290 | | |
| 116,818 | | |
| 326,544 | | |
| 651,638 | | |
| 1,509,290 | |
| Interest | |
| 36,222 | | |
| 45,282 | | |
| 213,427 | | |
| 119,201 | | |
| 414,132 | |
| Derivative financial instruments | |
| 7,473 | | |
| - | | |
| - | | |
| - | | |
| 7,473 | |
| Trade and other payables | |
| 231,698 | | |
| 41,509 | | |
| - | | |
| - | | |
| 273,207 | |
| Lease liabilities | |
| 502 | | |
| 1,503 | | |
| 2,350 | | |
| - | | |
| 4,355 | |
The financial derivative instruments disclosed in the table
below are the gross undiscounted cash flows. However, those amounts may be settled gross or net. The following table shows the corresponding
reconciliation to those amounts to their carrying amounts:
| | |
Less than 3
months | | |
3 to 12 months | | |
1 to 5 years | | |
Total | |
| | |
S/(000) | | |
S/(000) | | |
S/(000) | | |
S/(000) | |
| | |
| | |
| | |
| | |
| |
| As of December 31, 2022 | |
| | |
| | |
| | |
| |
| Inflows | |
| 88,968 | | |
| - | | |
| - | | |
| 88,968 | |
| Outflows | |
| (1,627 | ) | |
| - | | |
| - | | |
| (1,627 | ) |
| Net | |
| 87,341 | | |
| - | | |
| - | | |
| 87,341 | |
| | |
| | | |
| | | |
| | | |
| | |
| Discounted at the applicable interbank rates | |
| 86,893 | | |
| - | | |
| - | | |
| 86,893 | |
Changes in liabilities arising from financing activities:
| | |
Balance as of January 1, | | |
Distribution of dividends | | |
Finance cost on cross currency swaps | | |
Cash
inflow | | |
Cash
outflow | | |
Movement of foreign currency | | |
Amortization of costs of issuance of senior notes | | |
Others | | |
Balance as of December 31 | |
| | |
S/(000) | | |
S/(000) | | |
S/(000) | | |
S/(000) | | |
S/(000) | | |
S/(000) | | |
S/(000) | | |
S/(000) | | |
S/(000) | |
| | |
| | |
| | |
| | |
| | |
| | |
| | |
| | |
| | |
| |
| 2023 | |
| | |
| | |
| | |
| | |
| | |
| | |
| | |
| | |
| |
| Hedge finance cost payable | |
| 5,978 | | |
| - | | |
| 1,730 | | |
| - | | |
| (7,708 | ) | |
| - | | |
| - | | |
| - | | |
| - | |
| Dividends payable | |
| 9,764 | | |
| 175,524 | | |
| - | | |
| 465 | | |
| (175,431 | ) | |
| - | | |
| - | | |
| - | | |
| 10,322 | |
| Interest-bearing loans | |
| 1,593,171 | | |
| - | | |
| - | | |
| 639,000 | | |
| (661,520 | ) | |
| - | | |
| 2,206 | | |
| 169 | | |
| 1,573,026 | |
| | |
| | | |
| | | |
| | | |
| | | |
| | | |
| | | |
| | | |
| | | |
| | |
| 2022 | |
| | | |
| | | |
| | | |
| | | |
| | | |
| | | |
| | | |
| | | |
| | |
| Hedge finance cost payable | |
| 6,213 | | |
| - | | |
| 15,155 | | |
| - | | |
| (15,390 | ) | |
| - | | |
| - | | |
| - | | |
| 5,978 | |
| Dividends payable | |
| 9,550 | | |
| 179,805 | | |
| - | | |
| 229 | | |
| (179,820 | ) | |
| - | | |
| - | | |
| - | | |
| 9,764 | |
| Interest-bearing loans | |
| 1,545,355 | | |
| - | | |
| - | | |
| 525,000 | | |
| (448,984 | ) | |
| (25,407 | ) | |
| (2,793 | ) | |
| - | | |
| 1,593,171 | |
Notes
to the consolidated financial statements (continued)
Capital management -
For the purpose of the Group’s
capital management, capital includes capital stock, investment shares, additional paid-in capital and all other equity reserves attributable
to the equity holders of the Company. The primary objective of the Group’s capital management is to maximize the shareholders’
value.
In order to achieve this overall objective,
the Group’s capital management, among other things, aims to ensure that it meets financial covenants attached to the interest-bearing
loans and borrowings that define capital structure requirements. Breaches in meeting the financial covenants would permit the creditors
to immediately call the senior notes. There have been no breaches in the financial covenants of Senior Notes in any of the years presented.
The Group manages its capital structure
and adjusts it in light of changes in economic conditions and the requirements of the financial covenants. To maintain or adjust the capital
structure, the Group may adjust the dividend payment to shareholders, return capital to shareholders or issue new shares.
No changes were made in the objectives,
policies or processes for managing capital during the years ended December 31, 2023 and 2022.
| 26. | Fair value of financial assets and liabilities |
Financial assets -
Except for derivative financial instruments and financial
instruments designated at fair value through OCI, all financial assets which included trade and other receivables are classified in the
category of loans and receivables, which are non-derivative financial assets carried at amortized cost, held to maturity, and generate
a fixed or variable interest income for the Group. The carrying value may be affected by changes in the credit risk of the counterparties.
Financial liabilities -
All financial liabilities of the Group including trade
and other payables financial obligations are classified as loans and borrowings and are carried at amortized cost.
| (a) | Derivative financial instruments - |
Hedging derivatives -
Foreign currency risk -
As of December 31, 2022, the Company maintained
cross currency swaps agreements for a notional amount of US$132,000,000, with maturity in 2023 and an average rate of 2.97%. Of this total,
US$131,612,000 has been designated as hedging instruments for Senior notes that are denominated in U.S. dollars, with the intention of
hedging the foreign exchange risk.
The cash flow hedge of the expected future
payments was assessed to be highly effective and resulted in an unrealized gain of S/2,154,000 for the year 2023 (unrealized gain of S/3,838,000
and S/20,836,000 during 2022 and 2021, respectively). The amounts retained in OCI of 2022 are expected to be recognized in the consolidated
statement of profit or loss in 2023, the year of its maturity.
As of December 31, 2023, cross currency swaps were settled
in full in correlation with the payment of international dollar bonds.
Notes
to the consolidated financial statements (continued)
Assets (liabilities) from financial
instruments at fair value through profit or loss -
As of December 31, 2022 and 2021 the Company
held cross currency swaps that do not have an underlying relationship amounts to US$388,000. The effect on profit or loss of the change
in their fair value was a loss of S/59,000 and gain of S/589,000 in the year 2022 and 2021.
In January 2021, derivative financial
instruments at fair value through profit or loss were settled in the amount of US$18,000,000, the result was a net loss amounting to S/1,569,000
presented in “Accumulated net loss on settlement of derivative financial instruments at fair value through profit or loss”
caption in the consolidated statement of profit or loss.
In February 2023, cross currency swaps
from trading have been settled and obtained a gain of S/19,000.
| (b) | Fair values and fair value accounting hierarchy - |
Set out below is a comparison of the carrying amounts and
fair values of financial instruments as of December 31, 2023 and 2022, as well as the fair value accounting hierarchy. The dates of valuations
at fair value were as of December 31, 2023 and 2022, respectively.
| | |
Carrying amount | | |
Fair value | | |
Fair value hierarchy | |
| | |
2023 | | |
2022 | | |
2023 | | |
2022 | | |
2023/2022 | |
| | |
S/(000) | | |
S/(000) | | |
S/(000) | | |
S/(000) | | |
| |
| | |
| | |
| | |
| | |
| | |
| |
| Financial assets | |
| | |
| | |
| | |
| | |
| |
| Cash and cash equivalents | |
90,193 | | |
81,773 | | |
90,193 | | |
81,773 | | |
Level 1 | |
| Trade and other receivables | |
| 143,085 | | |
| 145,034 | | |
| 143,085 | | |
| 145,034 | | |
Level 2 | |
| Other financial instruments | |
| - | | |
| 86,893 | | |
| - | | |
| 86,893 | | |
Level 2 | |
| Financial investments designated at fair value through other comprehensive income | |
| 249 | | |
| 274 | | |
| 249 | | |
| 274 | | |
Level 3 | |
| Total financial assets | |
| 233,527 | | |
| 313,974 | | |
| 233,527 | | |
| 313,974 | | |
| |
| | |
| | | |
| | | |
| | | |
| | | |
| |
| Financial liabilities | |
| | | |
| | | |
| | | |
| | | |
| |
| Trade and other payables | |
| 231,511 | | |
| 284,554 | | |
| 231,511 | | |
| 284,554 | | |
Level 2 | |
| Senior notes | |
| 569,192 | | |
| 1,071,781 | | |
| 532,987 | | |
| 996,156 | | |
Level 1 | |
| Promissory notes | |
| 1,003,834 | | |
| 521,390 | | |
| 931,014 | | |
| 459,117 | | |
Level 2 | |
| Total financial liabilities | |
| 1,804,537 | | |
| 1,877,725 | | |
| 1,695,512 | | |
| 1,739,827 | | |
| |
Notes
to the consolidated financial statements (continued)
All financial instruments for which fair value is recognized
or disclosed are categorized within the fair value hierarchy, based on the lowest level input that is significant to the fair value measurement
as a whole. The fair value hierarchies are those described in note 2.3.2 (v).
For assets and liabilities that are recognized at fair value
on a recurring basis, the Group determines whether transfers have occurred between levels in the hierarchy. As of December 31, 2023 and
2022, there were no transfers between the fair value hierarchies.
Management assessed that cash and cash equivalents; trade
and other receivables and other current liabilities approximate their carrying amounts largely due to the short-term maturities of these
instruments.
The following methods and assumptions were used to estimate
the fair values:
| - | The fair value of cross currency swaps was measured by using valuation techniques where inputs are based on market data and present
value calculations. The models incorporate various inputs, including the credit quality of counterparties, foreign exchange, forward rates
and interest rate curves. |
A credit valuation adjustment (CVA) is applied to the “Over-The-Counter”
derivative exposures to consider the counterparty’s risk of default when measuring the fair value of the derivative. CVA is the
mark-to market cost of protection required to hedge credit risk from counterparties in this type of derivatives portfolio. CVA is calculated
by multiplying the probability of default (PD), the loss given default (LGD) and the expected exposure (EE) at the time of default.
A debit valuation adjustment (DVA) is applied to incorporate
the Group’s own credit risk in the fair value of derivatives (that is the risk that the Group might default on its contractual obligations),
using the same methodology as for CVA.
| - | The fair value of the quoted senior notes is based on the current quotations value at the reporting date as they trade on the exchange. |
| - | The fair value of the fixed rate promissory note it is calculated using the results of cash flow discounted at the average indebtedness
rates effective as of the reporting date. |
| - | The fair value of financial instruments at fair value with changes in OCI has been determined through the percentage of the Company’s
shareholding in the equity of Fossal S.A.A. |
Notes
to the consolidated financial statements (continued)
For management purposes, the Group is organized into business
units based on their products and activities and have three reportable segments as follows:
| - | Production and marketing of cement, concrete,
mortar and blocks in the northern region of Peru. |
| - | Sale of construction supplies (steel rebar and building materials) in the northern region of Peru. |
| - | Production and marketing of quicklime in the northern region of Peru. |
No operating segments
have been aggregated to form the above reportable operating segments.
Management monitors the profit before income tax of each
business unit separately for the purpose of making decisions about resource allocation and performance assessment. Segment performance
is evaluated based on profit before income tax and is measured consistently with profit before income tax in the consolidated statement
of profit and loss.
Transfer prices between operating segments are on an arm’s
length basis in a manner similar to transactions with third parties.
| | |
2023 | | |
2022 | | |
2021 | |
| | |
Cement, concrete, mortar and blocks | | |
Construction supplies | | |
Others (*) | | |
Total consolidated | | |
Cement, concrete, mortar and blocks | | |
Construction supplies | | |
Others (*) | | |
Total consolidated | | |
Cement, concrete, mortar and blocks | | |
Construction supplies | | |
Others (*) | | |
Total consolidated | |
| | |
S/(000) | | |
S/(000) | | |
S/(000) | | |
S/(000) | | |
S/(000) | | |
S/(000) | | |
S/(000) | | |
S/(000) | | |
S/(000) | | |
S/(000) | | |
S/(000) | | |
S/(000) | |
| | |
| | |
| | |
| | |
| | |
| | |
| | |
| | |
| | |
| | |
| | |
| | |
| |
| Revenues from external customers | |
| 1,850,238 | | |
| 74,096 | | |
| 25,741 | | |
| 1,950,075 | | |
| 1,963,826 | | |
| 114,024 | | |
| 37,896 | | |
| 2,115,746 | | |
| 1,784,487 | | |
| 113,905 | | |
| 39,375 | | |
| 1,937,767 | |
| Gross profit | |
| 687,727 | | |
| 723 | | |
| 1,002 | | |
| 689,452 | | |
| 647,285 | | |
| 3,670 | | |
| 1,076 | | |
| 652,031 | | |
| 550,816 | | |
| 3,501 | | |
| 5,114 | | |
| 559,431 | |
| Administrative expenses | |
| (230,203 | ) | |
| (2,692 | ) | |
| (1,816 | ) | |
| (234,711 | ) | |
| (223,162 | ) | |
| (2,741 | ) | |
| (1,674 | ) | |
| (227,577 | ) | |
| (191,132 | ) | |
| (2,675 | ) | |
| (2,262 | ) | |
| (196,069 | ) |
| Selling and distribution expenses | |
| (65,542 | ) | |
| (766 | ) | |
| (517 | ) | |
| (66,825 | ) | |
| (63,971 | ) | |
| (786 | ) | |
| (480 | ) | |
| (65,237 | ) | |
| (50,223 | ) | |
| (703 | ) | |
| (594 | ) | |
| (51,520 | ) |
| Other operating (expense) income, net | |
| (13,813 | ) | |
| 3 | | |
| - | | |
| (13,810 | ) | |
| (2,964 | ) | |
| 8 | | |
| (943 | ) | |
| (3,899 | ) | |
| 6,358 | | |
| 47 | | |
| 3 | | |
| 6,408 | |
| Finance income | |
| 7,160 | | |
| 9 | | |
| 77 | | |
| 7,246 | | |
| 3,252 | | |
| 20 | | |
| 34 | | |
| 3,306 | | |
| 2,874 | | |
| 17 | | |
| - | | |
| 2,891 | |
| Finance cost | |
| (104,045 | ) | |
| - | | |
| - | | |
| (104,045 | ) | |
| (95,102 | ) | |
| (3 | ) | |
| - | | |
| (95,105 | ) | |
| (88,961 | ) | |
| (3 | ) | |
| (1 | ) | |
| (88,965 | ) |
| Net (loss) gain on (settlement of) derivative financial instruments recognized at fair value through profit or loss | |
| 19 | | |
| - | | |
| - | | |
| 19 | | |
| (59 | ) | |
| - | | |
| - | | |
| (59 | ) | |
| (980 | ) | |
| - | | |
| - | | |
| (980 | ) |
| Impairment of assets | |
| (36,551 | ) | |
| - | | |
| - | | |
| (36,551 | ) | |
| - | | |
| - | | |
| - | | |
| - | | |
| - | | |
| - | | |
| - | | |
| - | |
| Gain (loss) from exchange difference, net | |
| 4,932 | | |
| (6 | ) | |
| 7 | | |
| 4,933 | | |
| (1,030 | ) | |
| 5 | | |
| (15 | ) | |
| (1,040 | ) | |
| (6,987 | ) | |
| (30 | ) | |
| (69 | ) | |
| (7,086 | ) |
| Profit before income tax | |
| 249,684 | | |
| (2,729 | ) | |
| (1,247 | ) | |
| 245,708 | | |
| 264,249 | | |
| 173 | | |
| (2,002 | ) | |
| 262,420 | | |
| 221,765 | | |
| 154 | | |
| 2,191 | | |
| 224,110 | |
| Income tax expense | |
| (78,050 | ) | |
| 853 | | |
| 389 | | |
| (76,808 | ) | |
| (86,189 | ) | |
| (56 | ) | |
| 653 | | |
| (85,592 | ) | |
| (70,198 | ) | |
| (49 | ) | |
| (693 | ) | |
| (70,940 | ) |
| Profit for the year | |
| 171,634 | | |
| (1,876 | ) | |
| (858 | ) | |
| 168,900 | | |
| 178,060 | | |
| 117 | | |
| (1,349 | ) | |
| 176,828 | | |
| 151,567 | | |
| 105 | | |
| 1,498 | | |
| 153,170 | |
Notes
to the consolidated financial statements (continued)
| | |
2023 | | |
2022 | | |
2021 | |
| | |
Cement,
concrete and blocks | | |
Construction
supplies | | |
Others
(*) | | |
Consolidated | | |
Cement,
concrete and blocks | | |
Construction
supplies | | |
Others
(*) | | |
Consolidated | | |
Cement,
concrete and blocks | | |
Construction
supplies | | |
Others
(*) | | |
Consolidated | |
| | |
S/(000) | | |
S/(000) | | |
S/(000) | | |
S/(000) | | |
S/(000) | | |
S/(000) | | |
S/(000) | | |
S/(000) | | |
S/(000) | | |
S/(000) | | |
S/(000) | | |
S/(000) | |
| | |
| | |
| | |
| | |
| | |
| | |
| | |
| | |
| | |
| | |
| | |
| | |
| |
| Segment
assets | |
| 3,074,279 | | |
| 46,941 | | |
| 100,266 | | |
| 3,221,486 | | |
| 3,086,104 | | |
| 38,353 | | |
| 102,537 | | |
| 3,226,994 | | |
| 2,940,888 | | |
| 42,578 | | |
| 111,229 | | |
| 3,094,695 | |
| Other
assets (*) | |
| - | | |
| - | | |
| 249 | | |
| 249 | | |
| 86,630 | | |
| - | | |
| 537 | | |
| 87,167 | | |
| 106,280 | | |
| - | | |
| 797 | | |
| 107,077 | |
| Total
assets | |
| 3,074,279 | | |
| 46,941 | | |
| 100,515 | | |
| 3,221,735 | | |
| 3,172,734 | | |
| 38,353 | | |
| 103,074 | | |
| 3,314,161 | | |
| 3,047,168 | | |
| 42,578 | | |
| 112,026 | | |
| 3,201,772 | |
| Operating
liabilities | |
| 1,968,133 | | |
| 62,907 | | |
| 687 | | |
| 2,031,727 | | |
| 2,041,923 | | |
| 76,780 | | |
| 323 | | |
| 2,119,026 | | |
| 1,930,140 | | |
| 75,633 | | |
| 194 | | |
| 2,005,967 | |
| Capital
expenditure (**) | |
| 299,326 | | |
| - | | |
| - | | |
| 299,326 | | |
| 190,126 | | |
| - | | |
| - | | |
| 190,126 | | |
| 97,288 | | |
| - | | |
| - | | |
| 97,288 | |
| Depreciation
and amortization | |
| (137,968 | ) | |
| (1,468 | ) | |
| (4,759 | ) | |
| (144,195 | ) | |
| (133,276 | ) | |
| (1,545 | ) | |
| (3,718 | ) | |
| (138,539 | ) | |
| (128,522 | ) | |
| (1,102 | ) | |
| (5,943 | ) | |
| (135,567 | ) |
| Provision
of inventory net realizable value and obsolescence | |
| (2,956 | ) | |
| - | | |
| - | | |
| (2,956 | ) | |
| (2,027 | ) | |
| - | | |
| - | | |
| (2,027 | ) | |
| (3,374 | ) | |
| - | | |
| - | | |
| (3,374 | ) |
Geographic information
As of December 31, 2023 and 2022, all non-current assets
are located in Peru and all revenues are from clients located in the north region of the country.
CEMENTOS PACASMAYO SAA
+51
1-317-6000
0.36
0.39
0.41
3.975
For management purposes, the Group is organized into business units based on their products and activities and have three reportable segments as follows: - Production and marketing of cement, concrete, mortar and blocks in the northern region of Peru. - Sale of construction supplies (steel rebar and building materials) in the northern region of Peru. - Production and marketing of quicklime in the northern region of Peru. No operating segments have been aggregated to form the above reportable operating segments. Management monitors the profit before income tax of each business unit separately for the purpose of making decisions about resource allocation and performance assessment. Segment performance is evaluated based on profit before income tax and is measured consistently with profit before income tax in the consolidated statement of profit and loss.
false
FY
00000
00000
0001221029
0001221029
2023-01-01
2023-12-31
0001221029
dei:BusinessContactMember
2023-01-01
2023-12-31
0001221029
2023-12-31
0001221029
2022-12-31
0001221029
2022-01-01
2022-12-31
0001221029
2021-01-02
2021-12-31
0001221029
cpac:CapitalStockMember
2021-01-01
0001221029
cpac:customInvestmentSharesMember
2021-01-01
0001221029
ifrs-full:TreasurySharesMember
2021-01-01
0001221029
ifrs-full:AdditionalPaidinCapitalMember
2021-01-01
0001221029
cpac:LegalReserve1Member
2021-01-01
0001221029
cpac:UnrealizedGainlossOnFinancialInstrumentsDesignatedAtFairValueMember
2021-01-01
0001221029
cpac:UnrealizedGainOnCashFlowHedgeMember
2021-01-01
0001221029
ifrs-full:RetainedEarningsMember
2021-01-01
0001221029
2021-01-01
0001221029
cpac:CapitalStockMember
2021-01-02
2021-12-31
0001221029
cpac:customInvestmentSharesMember
2021-01-02
2021-12-31
0001221029
ifrs-full:TreasurySharesMember
2021-01-02
2021-12-31
0001221029
ifrs-full:AdditionalPaidinCapitalMember
2021-01-02
2021-12-31
0001221029
cpac:LegalReserve1Member
2021-01-02
2021-12-31
0001221029
cpac:UnrealizedGainlossOnFinancialInstrumentsDesignatedAtFairValueMember
2021-01-02
2021-12-31
0001221029
cpac:UnrealizedGainOnCashFlowHedgeMember
2021-01-02
2021-12-31
0001221029
ifrs-full:RetainedEarningsMember
2021-01-02
2021-12-31
0001221029
cpac:CapitalStockMember
2021-12-31
0001221029
cpac:customInvestmentSharesMember
2021-12-31
0001221029
ifrs-full:TreasurySharesMember
2021-12-31
0001221029
ifrs-full:AdditionalPaidinCapitalMember
2021-12-31
0001221029
cpac:LegalReserve1Member
2021-12-31
0001221029
cpac:UnrealizedGainlossOnFinancialInstrumentsDesignatedAtFairValueMember
2021-12-31
0001221029
cpac:UnrealizedGainOnCashFlowHedgeMember
2021-12-31
0001221029
ifrs-full:RetainedEarningsMember
2021-12-31
0001221029
2021-12-31
0001221029
cpac:CapitalStockMember
2022-01-01
2022-12-31
0001221029
cpac:customInvestmentSharesMember
2022-01-01
2022-12-31
0001221029
ifrs-full:TreasurySharesMember
2022-01-01
2022-12-31
0001221029
ifrs-full:AdditionalPaidinCapitalMember
2022-01-01
2022-12-31
0001221029
cpac:LegalReserve1Member
2022-01-01
2022-12-31
0001221029
cpac:UnrealizedGainlossOnFinancialInstrumentsDesignatedAtFairValueMember
2022-01-01
2022-12-31
0001221029
cpac:UnrealizedGainOnCashFlowHedgeMember
2022-01-01
2022-12-31
0001221029
ifrs-full:RetainedEarningsMember
2022-01-01
2022-12-31
0001221029
cpac:CapitalStockMember
2022-12-31
0001221029
cpac:customInvestmentSharesMember
2022-12-31
0001221029
ifrs-full:TreasurySharesMember
2022-12-31
0001221029
ifrs-full:AdditionalPaidinCapitalMember
2022-12-31
0001221029
cpac:LegalReserve1Member
2022-12-31
0001221029
cpac:UnrealizedGainlossOnFinancialInstrumentsDesignatedAtFairValueMember
2022-12-31
0001221029
cpac:UnrealizedGainOnCashFlowHedgeMember
2022-12-31
0001221029
ifrs-full:RetainedEarningsMember
2022-12-31
0001221029
cpac:CapitalStockMember
2023-01-01
2023-12-31
0001221029
cpac:customInvestmentSharesMember
2023-01-01
2023-12-31
0001221029
ifrs-full:TreasurySharesMember
2023-01-01
2023-12-31
0001221029
ifrs-full:AdditionalPaidinCapitalMember
2023-01-01
2023-12-31
0001221029
cpac:LegalReserve1Member
2023-01-01
2023-12-31
0001221029
cpac:UnrealizedGainlossOnFinancialInstrumentsDesignatedAtFairValueMember
2023-01-01
2023-12-31
0001221029
cpac:UnrealizedGainOnCashFlowHedgeMember
2023-01-01
2023-12-31
0001221029
ifrs-full:RetainedEarningsMember
2023-01-01
2023-12-31
0001221029
cpac:CapitalStockMember
2023-12-31
0001221029
cpac:customInvestmentSharesMember
2023-12-31
0001221029
ifrs-full:TreasurySharesMember
2023-12-31
0001221029
ifrs-full:AdditionalPaidinCapitalMember
2023-12-31
0001221029
cpac:LegalReserve1Member
2023-12-31
0001221029
cpac:UnrealizedGainlossOnFinancialInstrumentsDesignatedAtFairValueMember
2023-12-31
0001221029
cpac:UnrealizedGainOnCashFlowHedgeMember
2023-12-31
0001221029
ifrs-full:RetainedEarningsMember
2023-12-31
0001221029
cpac:InversionesASPISAMember
2023-01-01
2023-12-31
0001221029
cpac:InversionesASPISAMember
2022-01-01
2022-12-31
0001221029
cpac:InversionesASPISAMember
2021-01-02
2021-12-31
0001221029
srt:MinimumMember
cpac:AdministrativeFacilitiesMember
2023-01-01
2023-12-31
0001221029
cpac:AdministrativeFacilitiesMember
2023-01-01
2023-12-31
0001221029
srt:MinimumMember
cpac:MainProductionStructuresMember
2023-01-01
2023-12-31
0001221029
cpac:MainProductionStructuresMember
2023-01-01
2023-12-31
0001221029
srt:MinimumMember
cpac:MinorProductionStructuresMember
2023-01-01
2023-12-31
0001221029
cpac:MinorProductionStructuresMember
2023-01-01
2023-12-31
0001221029
srt:MinimumMember
cpac:MillsAndHorizontalFurnacesMember
2023-01-01
2023-12-31
0001221029
cpac:MillsAndHorizontalFurnacesMember
2023-01-01
2023-12-31
0001221029
srt:MinimumMember
cpac:VerticalFurnacesCrushersAndGrindersMember
2023-01-01
2023-12-31
0001221029
cpac:VerticalFurnacesCrushersAndGrindersMember
2023-01-01
2023-12-31
0001221029
srt:MinimumMember
cpac:ElectricityFacilitiesAndOtherMinorsMember
2023-01-01
2023-12-31
0001221029
cpac:ElectricityFacilitiesAndOtherMinorsMember
2023-01-01
2023-12-31
0001221029
cpac:FurnitureAndFixtureMember
2023-01-01
2023-12-31
0001221029
srt:MinimumMember
cpac:HeavyUnitsMember
2023-01-01
2023-12-31
0001221029
cpac:HeavyUnitsMember
2023-01-01
2023-12-31
0001221029
srt:MinimumMember
cpac:LightUnitsMember
2023-01-01
2023-12-31
0001221029
cpac:LightUnitsMember
2023-01-01
2023-12-31
0001221029
srt:MinimumMember
ifrs-full:ComputerEquipmentMember
2023-01-01
2023-12-31
0001221029
ifrs-full:ComputerEquipmentMember
2023-01-01
2023-12-31
0001221029
srt:MinimumMember
cpac:ToolsMember
2023-01-01
2023-12-31
0001221029
cpac:ToolsMember
2023-01-01
2023-12-31
0001221029
cpac:USDMember
2023-12-31
0001221029
cpac:USDMember
2022-12-31
0001221029
cpac:USDMember
2021-12-31
0001221029
ifrs-full:TradeReceivablesMember
2023-12-31
0001221029
ifrs-full:TradeReceivablesMember
2022-12-31
0001221029
cpac:OtherAccountsReceivableMember
2023-12-31
0001221029
cpac:OtherAccountsReceivableMember
2022-12-31
0001221029
cpac:AccountsReceivableFromParentCompanyAndAffiliatesMember
2023-12-31
0001221029
cpac:AccountsReceivableFromParentCompanyAndAffiliatesMember
2022-12-31
0001221029
cpac:FundsRestrictedToTaxPaymentsMember
2023-12-31
0001221029
cpac:FundsRestrictedToTaxPaymentsMember
2022-12-31
0001221029
cpac:InterestsReceivablesMember
2023-12-31
0001221029
cpac:InterestsReceivablesMember
2022-12-31
0001221029
cpac:LoansToEmployeesMember
2023-12-31
0001221029
cpac:LoansToEmployeesMember
2022-12-31
0001221029
cpac:LoansGrantedMember
2023-12-31
0001221029
cpac:LoansGrantedMember
2022-12-31
0001221029
cpac:OtherReceivablesFromSaleOfFixedAssetsMember
2023-12-31
0001221029
cpac:OtherReceivablesFromSaleOfFixedAssetsMember
2022-12-31
0001221029
cpac:AllowanceForExpectedCreditLossesForOtherReceivablesMember
2023-12-31
0001221029
cpac:AllowanceForExpectedCreditLossesForOtherReceivablesMember
2022-12-31
0001221029
cpac:FinancialAssetsClassifiedAsReceivablesMember
2023-12-31
0001221029
cpac:FinancialAssetsClassifiedAsReceivablesMember
2022-12-31
0001221029
cpac:ValueaddedTaxCreditMember
2023-12-31
0001221029
cpac:ValueaddedTaxCreditMember
2022-12-31
0001221029
cpac:ClaimToTheSUNATMember
2023-12-31
0001221029
cpac:ClaimToTheSUNATMember
2022-12-31
0001221029
cpac:OtherAccountsReceivableNetMember
2023-12-31
0001221029
cpac:OtherAccountsReceivableNetMember
2022-12-31
0001221029
cpac:TaxRefundReceivableMember
2023-12-31
0001221029
cpac:TaxRefundReceivableMember
2022-12-31
0001221029
cpac:AllowanceForExpectedCreditLossesMember
2023-12-31
0001221029
cpac:AllowanceForExpectedCreditLossesMember
2022-12-31
0001221029
cpac:NonfinancialAssetsClassifiedAsReceivablesMember
2023-12-31
0001221029
cpac:NonfinancialAssetsClassifiedAsReceivablesMember
2022-12-31
0001221029
cpac:TotalMember
2023-12-31
0001221029
cpac:TotalMember
2022-12-31
0001221029
ifrs-full:FinancialAssetsNeitherPastDueNorImpairedMember
2023-12-31
0001221029
ifrs-full:FinancialAssetsPastDueButNotImpairedMember
cpac:LessThanOneMonthMember
2023-12-31
0001221029
ifrs-full:FinancialAssetsPastDueButNotImpairedMember
ifrs-full:LaterThanOneMonthAndNotLaterThanTwoMonthsMember
2023-12-31
0001221029
ifrs-full:FinancialAssetsPastDueButNotImpairedMember
ifrs-full:LaterThanTwoMonthsAndNotLaterThanThreeMonthsMember
2023-12-31
0001221029
ifrs-full:FinancialAssetsPastDueButNotImpairedMember
ifrs-full:LaterThanThreeMonthsMember
2023-12-31
0001221029
ifrs-full:FinancialAssetsPastDueButNotImpairedMember
cpac:LaterThanFourMonthMember
2023-12-31
0001221029
ifrs-full:FinancialAssetsNeitherPastDueNorImpairedMember
2022-12-31
0001221029
ifrs-full:FinancialAssetsPastDueButNotImpairedMember
cpac:LessThanOneMonthMember
2022-12-31
0001221029
ifrs-full:FinancialAssetsPastDueButNotImpairedMember
ifrs-full:LaterThanOneMonthAndNotLaterThanTwoMonthsMember
2022-12-31
0001221029
ifrs-full:FinancialAssetsPastDueButNotImpairedMember
ifrs-full:LaterThanTwoMonthsAndNotLaterThanThreeMonthsMember
2022-12-31
0001221029
ifrs-full:FinancialAssetsPastDueButNotImpairedMember
ifrs-full:LaterThanThreeMonthsMember
2022-12-31
0001221029
ifrs-full:FinancialAssetsPastDueButNotImpairedMember
cpac:LaterThanFourMonthMember
2022-12-31
0001221029
ifrs-full:MiningAssetsMember
2023-01-01
2023-12-31
0001221029
cpac:CostMember
cpac:MiningConcessionsMember
2021-12-31
0001221029
cpac:CostMember
cpac:MineDevelopmentsMember
2021-12-31
0001221029
cpac:CostMember
ifrs-full:LandMember
2021-12-31
0001221029
cpac:CostMember
cpac:BuildingsAndOtherConstructionMember
2021-12-31
0001221029
cpac:CostMember
cpac:MachineryEquipmentAndRelatedSparePartsMember
2021-12-31
0001221029
cpac:CostMember
cpac:FurnitureAndAccessoriesMember
2021-12-31
0001221029
cpac:CostMember
cpac:TransportationUnitsMember
2021-12-31
0001221029
cpac:CostMember
cpac:ComputerEquipmentAndToolsMember
2021-12-31
0001221029
cpac:CostMember
cpac:MineRehabilitationCostsMember
2021-12-31
0001221029
cpac:CostMember
cpac:CapitalizedInterestsMember
2021-12-31
0001221029
cpac:CostMember
cpac:WorksInProgressAndUnitsInTransitMember
2021-12-31
0001221029
cpac:CostMember
cpac:TotalMember
2021-12-31
0001221029
cpac:CostMember
cpac:MiningConcessionsMember
2022-01-01
2022-12-31
0001221029
cpac:CostMember
cpac:MineDevelopmentsMember
2022-01-01
2022-12-31
0001221029
cpac:CostMember
ifrs-full:LandMember
2022-01-01
2022-12-31
0001221029
cpac:CostMember
cpac:BuildingsAndOtherConstructionMember
2022-01-01
2022-12-31
0001221029
cpac:CostMember
cpac:MachineryEquipmentAndRelatedSparePartsMember
2022-01-01
2022-12-31
0001221029
cpac:CostMember
cpac:FurnitureAndAccessoriesMember
2022-01-01
2022-12-31
0001221029
cpac:CostMember
cpac:TransportationUnitsMember
2022-01-01
2022-12-31
0001221029
cpac:CostMember
cpac:ComputerEquipmentAndToolsMember
2022-01-01
2022-12-31
0001221029
cpac:CostMember
cpac:MineRehabilitationCostsMember
2022-01-01
2022-12-31
0001221029
cpac:CostMember
cpac:CapitalizedInterestsMember
2022-01-01
2022-12-31
0001221029
cpac:CostMember
cpac:WorksInProgressAndUnitsInTransitMember
2022-01-01
2022-12-31
0001221029
cpac:CostMember
cpac:TotalMember
2022-01-01
2022-12-31
0001221029
cpac:CostMember
cpac:MiningConcessionsMember
2022-12-31
0001221029
cpac:CostMember
cpac:MineDevelopmentsMember
2022-12-31
0001221029
cpac:CostMember
ifrs-full:LandMember
2022-12-31
0001221029
cpac:CostMember
cpac:BuildingsAndOtherConstructionMember
2022-12-31
0001221029
cpac:CostMember
cpac:MachineryEquipmentAndRelatedSparePartsMember
2022-12-31
0001221029
cpac:CostMember
cpac:FurnitureAndAccessoriesMember
2022-12-31
0001221029
cpac:CostMember
cpac:TransportationUnitsMember
2022-12-31
0001221029
cpac:CostMember
cpac:ComputerEquipmentAndToolsMember
2022-12-31
0001221029
cpac:CostMember
cpac:MineRehabilitationCostsMember
2022-12-31
0001221029
cpac:CostMember
cpac:CapitalizedInterestsMember
2022-12-31
0001221029
cpac:CostMember
cpac:WorksInProgressAndUnitsInTransitMember
2022-12-31
0001221029
cpac:CostMember
cpac:TotalMember
2022-12-31
0001221029
cpac:CostMember
cpac:MiningConcessionsMember
2023-01-01
2023-12-31
0001221029
cpac:CostMember
cpac:MineDevelopmentsMember
2023-01-01
2023-12-31
0001221029
cpac:CostMember
ifrs-full:LandMember
2023-01-01
2023-12-31
0001221029
cpac:CostMember
cpac:BuildingsAndOtherConstructionMember
2023-01-01
2023-12-31
0001221029
cpac:CostMember
cpac:MachineryEquipmentAndRelatedSparePartsMember
2023-01-01
2023-12-31
0001221029
cpac:CostMember
cpac:FurnitureAndAccessoriesMember
2023-01-01
2023-12-31
0001221029
cpac:CostMember
cpac:TransportationUnitsMember
2023-01-01
2023-12-31
0001221029
cpac:CostMember
cpac:ComputerEquipmentAndToolsMember
2023-01-01
2023-12-31
0001221029
cpac:CostMember
cpac:MineRehabilitationCostsMember
2023-01-01
2023-12-31
0001221029
cpac:CostMember
cpac:CapitalizedInterestsMember
2023-01-01
2023-12-31
0001221029
cpac:CostMember
cpac:WorksInProgressAndUnitsInTransitMember
2023-01-01
2023-12-31
0001221029
cpac:CostMember
cpac:TotalMember
2023-01-01
2023-12-31
0001221029
cpac:CostMember
cpac:MiningConcessionsMember
2023-12-31
0001221029
cpac:CostMember
cpac:MineDevelopmentsMember
2023-12-31
0001221029
cpac:CostMember
ifrs-full:LandMember
2023-12-31
0001221029
cpac:CostMember
cpac:BuildingsAndOtherConstructionMember
2023-12-31
0001221029
cpac:CostMember
cpac:MachineryEquipmentAndRelatedSparePartsMember
2023-12-31
0001221029
cpac:CostMember
cpac:FurnitureAndAccessoriesMember
2023-12-31
0001221029
cpac:CostMember
cpac:TransportationUnitsMember
2023-12-31
0001221029
cpac:CostMember
cpac:ComputerEquipmentAndToolsMember
2023-12-31
0001221029
cpac:CostMember
cpac:MineRehabilitationCostsMember
2023-12-31
0001221029
cpac:CostMember
cpac:CapitalizedInterestsMember
2023-12-31
0001221029
cpac:CostMember
cpac:WorksInProgressAndUnitsInTransitMember
2023-12-31
0001221029
cpac:CostMember
cpac:TotalMember
2023-12-31
0001221029
ifrs-full:AccumulatedDepreciationAndAmortisationMember
cpac:MiningConcessionsMember
2021-12-31
0001221029
ifrs-full:AccumulatedDepreciationAndAmortisationMember
cpac:MineDevelopmentsMember
2021-12-31
0001221029
ifrs-full:AccumulatedDepreciationAndAmortisationMember
ifrs-full:LandMember
2021-12-31
0001221029
ifrs-full:AccumulatedDepreciationAndAmortisationMember
cpac:BuildingsAndOtherConstructionMember
2021-12-31
0001221029
ifrs-full:AccumulatedDepreciationAndAmortisationMember
cpac:MachineryEquipmentAndRelatedSparePartsMember
2021-12-31
0001221029
ifrs-full:AccumulatedDepreciationAndAmortisationMember
cpac:FurnitureAndAccessoriesMember
2021-12-31
0001221029
ifrs-full:AccumulatedDepreciationAndAmortisationMember
cpac:TransportationUnitsMember
2021-12-31
0001221029
ifrs-full:AccumulatedDepreciationAndAmortisationMember
cpac:ComputerEquipmentAndToolsMember
2021-12-31
0001221029
ifrs-full:AccumulatedDepreciationAndAmortisationMember
cpac:MineRehabilitationCostsMember
2021-12-31
0001221029
ifrs-full:AccumulatedDepreciationAndAmortisationMember
cpac:CapitalizedInterestsMember
2021-12-31
0001221029
ifrs-full:AccumulatedDepreciationAndAmortisationMember
cpac:WorksInProgressAndUnitsInTransitMember
2021-12-31
0001221029
ifrs-full:AccumulatedDepreciationAndAmortisationMember
cpac:TotalMember
2021-12-31
0001221029
ifrs-full:AccumulatedDepreciationAndAmortisationMember
cpac:MiningConcessionsMember
2022-01-01
2022-12-31
0001221029
ifrs-full:AccumulatedDepreciationAndAmortisationMember
cpac:MineDevelopmentsMember
2022-01-01
2022-12-31
0001221029
ifrs-full:AccumulatedDepreciationAndAmortisationMember
ifrs-full:LandMember
2022-01-01
2022-12-31
0001221029
ifrs-full:AccumulatedDepreciationAndAmortisationMember
cpac:BuildingsAndOtherConstructionMember
2022-01-01
2022-12-31
0001221029
ifrs-full:AccumulatedDepreciationAndAmortisationMember
cpac:MachineryEquipmentAndRelatedSparePartsMember
2022-01-01
2022-12-31
0001221029
ifrs-full:AccumulatedDepreciationAndAmortisationMember
cpac:FurnitureAndAccessoriesMember
2022-01-01
2022-12-31
0001221029
ifrs-full:AccumulatedDepreciationAndAmortisationMember
cpac:TransportationUnitsMember
2022-01-01
2022-12-31
0001221029
ifrs-full:AccumulatedDepreciationAndAmortisationMember
cpac:ComputerEquipmentAndToolsMember
2022-01-01
2022-12-31
0001221029
ifrs-full:AccumulatedDepreciationAndAmortisationMember
cpac:MineRehabilitationCostsMember
2022-01-01
2022-12-31
0001221029
ifrs-full:AccumulatedDepreciationAndAmortisationMember
cpac:CapitalizedInterestsMember
2022-01-01
2022-12-31
0001221029
ifrs-full:AccumulatedDepreciationAndAmortisationMember
cpac:WorksInProgressAndUnitsInTransitMember
2022-01-01
2022-12-31
0001221029
ifrs-full:AccumulatedDepreciationAndAmortisationMember
cpac:TotalMember
2022-01-01
2022-12-31
0001221029
ifrs-full:AccumulatedDepreciationAndAmortisationMember
cpac:MiningConcessionsMember
2022-12-31
0001221029
ifrs-full:AccumulatedDepreciationAndAmortisationMember
cpac:MineDevelopmentsMember
2022-12-31
0001221029
ifrs-full:AccumulatedDepreciationAndAmortisationMember
ifrs-full:LandMember
2022-12-31
0001221029
ifrs-full:AccumulatedDepreciationAndAmortisationMember
cpac:BuildingsAndOtherConstructionMember
2022-12-31
0001221029
ifrs-full:AccumulatedDepreciationAndAmortisationMember
cpac:MachineryEquipmentAndRelatedSparePartsMember
2022-12-31
0001221029
ifrs-full:AccumulatedDepreciationAndAmortisationMember
cpac:FurnitureAndAccessoriesMember
2022-12-31
0001221029
ifrs-full:AccumulatedDepreciationAndAmortisationMember
cpac:TransportationUnitsMember
2022-12-31
0001221029
ifrs-full:AccumulatedDepreciationAndAmortisationMember
cpac:ComputerEquipmentAndToolsMember
2022-12-31
0001221029
ifrs-full:AccumulatedDepreciationAndAmortisationMember
cpac:MineRehabilitationCostsMember
2022-12-31
0001221029
ifrs-full:AccumulatedDepreciationAndAmortisationMember
cpac:CapitalizedInterestsMember
2022-12-31
0001221029
ifrs-full:AccumulatedDepreciationAndAmortisationMember
cpac:WorksInProgressAndUnitsInTransitMember
2022-12-31
0001221029
ifrs-full:AccumulatedDepreciationAndAmortisationMember
cpac:TotalMember
2022-12-31
0001221029
ifrs-full:AccumulatedDepreciationAndAmortisationMember
cpac:MiningConcessionsMember
2023-01-01
2023-12-31
0001221029
ifrs-full:AccumulatedDepreciationAndAmortisationMember
cpac:MineDevelopmentsMember
2023-01-01
2023-12-31
0001221029
ifrs-full:AccumulatedDepreciationAndAmortisationMember
ifrs-full:LandMember
2023-01-01
2023-12-31
0001221029
ifrs-full:AccumulatedDepreciationAndAmortisationMember
cpac:BuildingsAndOtherConstructionMember
2023-01-01
2023-12-31
0001221029
ifrs-full:AccumulatedDepreciationAndAmortisationMember
cpac:MachineryEquipmentAndRelatedSparePartsMember
2023-01-01
2023-12-31
0001221029
ifrs-full:AccumulatedDepreciationAndAmortisationMember
cpac:FurnitureAndAccessoriesMember
2023-01-01
2023-12-31
0001221029
ifrs-full:AccumulatedDepreciationAndAmortisationMember
cpac:TransportationUnitsMember
2023-01-01
2023-12-31
0001221029
ifrs-full:AccumulatedDepreciationAndAmortisationMember
cpac:ComputerEquipmentAndToolsMember
2023-01-01
2023-12-31
0001221029
ifrs-full:AccumulatedDepreciationAndAmortisationMember
cpac:MineRehabilitationCostsMember
2023-01-01
2023-12-31
0001221029
ifrs-full:AccumulatedDepreciationAndAmortisationMember
cpac:CapitalizedInterestsMember
2023-01-01
2023-12-31
0001221029
ifrs-full:AccumulatedDepreciationAndAmortisationMember
cpac:WorksInProgressAndUnitsInTransitMember
2023-01-01
2023-12-31
0001221029
ifrs-full:AccumulatedDepreciationAndAmortisationMember
cpac:TotalMember
2023-01-01
2023-12-31
0001221029
ifrs-full:AccumulatedDepreciationAndAmortisationMember
cpac:MiningConcessionsMember
2023-12-31
0001221029
ifrs-full:AccumulatedDepreciationAndAmortisationMember
cpac:MineDevelopmentsMember
2023-12-31
0001221029
ifrs-full:AccumulatedDepreciationAndAmortisationMember
ifrs-full:LandMember
2023-12-31
0001221029
ifrs-full:AccumulatedDepreciationAndAmortisationMember
cpac:BuildingsAndOtherConstructionMember
2023-12-31
0001221029
ifrs-full:AccumulatedDepreciationAndAmortisationMember
cpac:MachineryEquipmentAndRelatedSparePartsMember
2023-12-31
0001221029
ifrs-full:AccumulatedDepreciationAndAmortisationMember
cpac:FurnitureAndAccessoriesMember
2023-12-31
0001221029
ifrs-full:AccumulatedDepreciationAndAmortisationMember
cpac:TransportationUnitsMember
2023-12-31
0001221029
ifrs-full:AccumulatedDepreciationAndAmortisationMember
cpac:ComputerEquipmentAndToolsMember
2023-12-31
0001221029
ifrs-full:AccumulatedDepreciationAndAmortisationMember
cpac:MineRehabilitationCostsMember
2023-12-31
0001221029
ifrs-full:AccumulatedDepreciationAndAmortisationMember
cpac:CapitalizedInterestsMember
2023-12-31
0001221029
ifrs-full:AccumulatedDepreciationAndAmortisationMember
cpac:WorksInProgressAndUnitsInTransitMember
2023-12-31
0001221029
ifrs-full:AccumulatedDepreciationAndAmortisationMember
cpac:TotalMember
2023-12-31
0001221029
cpac:ImpairmentMiningAssetsMember
cpac:MiningConcessionsMember
2022-12-31
0001221029
cpac:ImpairmentMiningAssetsMember
cpac:MineDevelopmentsMember
2022-12-31
0001221029
cpac:ImpairmentMiningAssetsMember
ifrs-full:LandMember
2022-12-31
0001221029
cpac:ImpairmentMiningAssetsMember
cpac:BuildingsAndOtherConstructionMember
2022-12-31
0001221029
cpac:ImpairmentMiningAssetsMember
cpac:MachineryEquipmentAndRelatedSparePartsMember
2022-12-31
0001221029
cpac:ImpairmentMiningAssetsMember
cpac:FurnitureAndAccessoriesMember
2022-12-31
0001221029
cpac:ImpairmentMiningAssetsMember
cpac:TransportationUnitsMember
2022-12-31
0001221029
cpac:ImpairmentMiningAssetsMember
cpac:ComputerEquipmentAndToolsMember
2022-12-31
0001221029
cpac:ImpairmentMiningAssetsMember
cpac:MineRehabilitationCostsMember
2022-12-31
0001221029
cpac:ImpairmentMiningAssetsMember
cpac:CapitalizedInterestsMember
2022-12-31
0001221029
cpac:ImpairmentMiningAssetsMember
cpac:WorksInProgressAndUnitsInTransitMember
2022-12-31
0001221029
cpac:ImpairmentMiningAssetsMember
cpac:TotalMember
2022-12-31
0001221029
cpac:ImpairmentMiningAssetsMember
cpac:MiningConcessionsMember
2023-01-01
2023-12-31
0001221029
cpac:ImpairmentMiningAssetsMember
cpac:MineDevelopmentsMember
2023-01-01
2023-12-31
0001221029
cpac:ImpairmentMiningAssetsMember
ifrs-full:LandMember
2023-01-01
2023-12-31
0001221029
cpac:ImpairmentMiningAssetsMember
cpac:BuildingsAndOtherConstructionMember
2023-01-01
2023-12-31
0001221029
cpac:ImpairmentMiningAssetsMember
cpac:MachineryEquipmentAndRelatedSparePartsMember
2023-01-01
2023-12-31
0001221029
cpac:ImpairmentMiningAssetsMember
cpac:FurnitureAndAccessoriesMember
2023-01-01
2023-12-31
0001221029
cpac:ImpairmentMiningAssetsMember
cpac:TransportationUnitsMember
2023-01-01
2023-12-31
0001221029
cpac:ImpairmentMiningAssetsMember
cpac:ComputerEquipmentAndToolsMember
2023-01-01
2023-12-31
0001221029
cpac:ImpairmentMiningAssetsMember
cpac:MineRehabilitationCostsMember
2023-01-01
2023-12-31
0001221029
cpac:ImpairmentMiningAssetsMember
cpac:CapitalizedInterestsMember
2023-01-01
2023-12-31
0001221029
cpac:ImpairmentMiningAssetsMember
cpac:WorksInProgressAndUnitsInTransitMember
2023-01-01
2023-12-31
0001221029
cpac:ImpairmentMiningAssetsMember
cpac:TotalMember
2023-01-01
2023-12-31
0001221029
cpac:ImpairmentMiningAssetsMember
cpac:MiningConcessionsMember
2023-12-31
0001221029
cpac:ImpairmentMiningAssetsMember
cpac:MineDevelopmentsMember
2023-12-31
0001221029
cpac:ImpairmentMiningAssetsMember
ifrs-full:LandMember
2023-12-31
0001221029
cpac:ImpairmentMiningAssetsMember
cpac:BuildingsAndOtherConstructionMember
2023-12-31
0001221029
cpac:ImpairmentMiningAssetsMember
cpac:MachineryEquipmentAndRelatedSparePartsMember
2023-12-31
0001221029
cpac:ImpairmentMiningAssetsMember
cpac:FurnitureAndAccessoriesMember
2023-12-31
0001221029
cpac:ImpairmentMiningAssetsMember
cpac:TransportationUnitsMember
2023-12-31
0001221029
cpac:ImpairmentMiningAssetsMember
cpac:ComputerEquipmentAndToolsMember
2023-12-31
0001221029
cpac:ImpairmentMiningAssetsMember
cpac:MineRehabilitationCostsMember
2023-12-31
0001221029
cpac:ImpairmentMiningAssetsMember
cpac:CapitalizedInterestsMember
2023-12-31
0001221029
cpac:ImpairmentMiningAssetsMember
cpac:WorksInProgressAndUnitsInTransitMember
2023-12-31
0001221029
cpac:ImpairmentMiningAssetsMember
cpac:TotalMember
2023-12-31
0001221029
cpac:NetBookValueMember
cpac:MiningConcessionsMember
2022-01-01
2022-12-31
0001221029
cpac:NetBookValueMember
cpac:MineDevelopmentsMember
2022-01-01
2022-12-31
0001221029
cpac:NetBookValueMember
ifrs-full:LandMember
2022-01-01
2022-12-31
0001221029
cpac:NetBookValueMember
cpac:BuildingsAndOtherConstructionMember
2022-01-01
2022-12-31
0001221029
cpac:NetBookValueMember
cpac:MachineryEquipmentAndRelatedSparePartsMember
2022-01-01
2022-12-31
0001221029
cpac:NetBookValueMember
cpac:FurnitureAndAccessoriesMember
2022-01-01
2022-12-31
0001221029
cpac:NetBookValueMember
cpac:TransportationUnitsMember
2022-01-01
2022-12-31
0001221029
cpac:NetBookValueMember
cpac:ComputerEquipmentAndToolsMember
2022-01-01
2022-12-31
0001221029
cpac:NetBookValueMember
cpac:MineRehabilitationCostsMember
2022-01-01
2022-12-31
0001221029
cpac:NetBookValueMember
cpac:CapitalizedInterestsMember
2022-01-01
2022-12-31
0001221029
cpac:NetBookValueMember
cpac:WorksInProgressAndUnitsInTransitMember
2022-01-01
2022-12-31
0001221029
cpac:NetBookValueMember
cpac:TotalMember
2022-01-01
2022-12-31
0001221029
cpac:NetBookValueMember
cpac:MiningConcessionsMember
2023-01-01
2023-12-31
0001221029
cpac:NetBookValueMember
cpac:MineDevelopmentsMember
2023-01-01
2023-12-31
0001221029
cpac:NetBookValueMember
ifrs-full:LandMember
2023-01-01
2023-12-31
0001221029
cpac:NetBookValueMember
cpac:BuildingsAndOtherConstructionMember
2023-01-01
2023-12-31
0001221029
cpac:NetBookValueMember
cpac:MachineryEquipmentAndRelatedSparePartsMember
2023-01-01
2023-12-31
0001221029
cpac:NetBookValueMember
cpac:FurnitureAndAccessoriesMember
2023-01-01
2023-12-31
0001221029
cpac:NetBookValueMember
cpac:TransportationUnitsMember
2023-01-01
2023-12-31
0001221029
cpac:NetBookValueMember
cpac:ComputerEquipmentAndToolsMember
2023-01-01
2023-12-31
0001221029
cpac:NetBookValueMember
cpac:MineRehabilitationCostsMember
2023-01-01
2023-12-31
0001221029
cpac:NetBookValueMember
cpac:CapitalizedInterestsMember
2023-01-01
2023-12-31
0001221029
cpac:NetBookValueMember
cpac:WorksInProgressAndUnitsInTransitMember
2023-01-01
2023-12-31
0001221029
cpac:NetBookValueMember
cpac:TotalMember
2023-01-01
2023-12-31
0001221029
cpac:CostMember
cpac:ITApplicationsMember
2021-12-31
0001221029
cpac:CostMember
cpac:FiniteLifeIntangibleMember
2021-12-31
0001221029
cpac:CostMember
cpac:IndefiniteLifeIntangibleMember
2021-12-31
0001221029
cpac:CostMember
cpac:ExplorationCostAndMiningEvaluationMember
2021-12-31
0001221029
cpac:CostMember
cpac:IntangibleAssetMember
2021-12-31
0001221029
cpac:CostMember
cpac:ITApplicationsMember
2022-01-01
2022-12-31
0001221029
cpac:CostMember
cpac:FiniteLifeIntangibleMember
2022-01-01
2022-12-31
0001221029
cpac:CostMember
cpac:IndefiniteLifeIntangibleMember
2022-01-01
2022-12-31
0001221029
cpac:CostMember
cpac:ExplorationCostAndMiningEvaluationMember
2022-01-01
2022-12-31
0001221029
cpac:CostMember
cpac:IntangibleAssetMember
2022-01-01
2022-12-31
0001221029
cpac:CostMember
cpac:ITApplicationsMember
2022-12-31
0001221029
cpac:CostMember
cpac:FiniteLifeIntangibleMember
2022-12-31
0001221029
cpac:CostMember
cpac:IndefiniteLifeIntangibleMember
2022-12-31
0001221029
cpac:CostMember
cpac:ExplorationCostAndMiningEvaluationMember
2022-12-31
0001221029
cpac:CostMember
cpac:IntangibleAssetMember
2022-12-31
0001221029
cpac:CostMember
cpac:ITApplicationsMember
2023-01-01
2023-12-31
0001221029
cpac:CostMember
cpac:FiniteLifeIntangibleMember
2023-01-01
2023-12-31
0001221029
cpac:CostMember
cpac:IndefiniteLifeIntangibleMember
2023-01-01
2023-12-31
0001221029
cpac:CostMember
cpac:ExplorationCostAndMiningEvaluationMember
2023-01-01
2023-12-31
0001221029
cpac:CostMember
cpac:IntangibleAssetMember
2023-01-01
2023-12-31
0001221029
cpac:CostMember
cpac:ITApplicationsMember
2023-12-31
0001221029
cpac:CostMember
cpac:FiniteLifeIntangibleMember
2023-12-31
0001221029
cpac:CostMember
cpac:IndefiniteLifeIntangibleMember
2023-12-31
0001221029
cpac:CostMember
cpac:ExplorationCostAndMiningEvaluationMember
2023-12-31
0001221029
cpac:CostMember
cpac:IntangibleAssetMember
2023-12-31
0001221029
cpac:AccumulatedAmortization1Member
cpac:ITApplicationsMember
2021-12-31
0001221029
cpac:AccumulatedAmortization1Member
cpac:FiniteLifeIntangibleMember
2021-12-31
0001221029
cpac:AccumulatedAmortization1Member
cpac:IndefiniteLifeIntangibleMember
2021-12-31
0001221029
cpac:AccumulatedAmortization1Member
cpac:ExplorationCostAndMiningEvaluationMember
2021-12-31
0001221029
cpac:AccumulatedAmortization1Member
cpac:IntangibleAssetMember
2021-12-31
0001221029
cpac:AccumulatedAmortization1Member
cpac:ITApplicationsMember
2022-01-01
2022-12-31
0001221029
cpac:AccumulatedAmortization1Member
cpac:FiniteLifeIntangibleMember
2022-01-01
2022-12-31
0001221029
cpac:AccumulatedAmortization1Member
cpac:IndefiniteLifeIntangibleMember
2022-01-01
2022-12-31
0001221029
cpac:AccumulatedAmortization1Member
cpac:ExplorationCostAndMiningEvaluationMember
2022-01-01
2022-12-31
0001221029
cpac:AccumulatedAmortization1Member
cpac:IntangibleAssetMember
2022-01-01
2022-12-31
0001221029
cpac:AccumulatedAmortization1Member
cpac:ITApplicationsMember
2022-12-31
0001221029
cpac:AccumulatedAmortization1Member
cpac:FiniteLifeIntangibleMember
2022-12-31
0001221029
cpac:AccumulatedAmortization1Member
cpac:IndefiniteLifeIntangibleMember
2022-12-31
0001221029
cpac:AccumulatedAmortization1Member
cpac:ExplorationCostAndMiningEvaluationMember
2022-12-31
0001221029
cpac:AccumulatedAmortization1Member
cpac:IntangibleAssetMember
2022-12-31
0001221029
cpac:AccumulatedAmortization1Member
cpac:ITApplicationsMember
2023-01-01
2023-12-31
0001221029
cpac:AccumulatedAmortization1Member
cpac:FiniteLifeIntangibleMember
2023-01-01
2023-12-31
0001221029
cpac:AccumulatedAmortization1Member
cpac:IndefiniteLifeIntangibleMember
2023-01-01
2023-12-31
0001221029
cpac:AccumulatedAmortization1Member
cpac:ExplorationCostAndMiningEvaluationMember
2023-01-01
2023-12-31
0001221029
cpac:AccumulatedAmortization1Member
cpac:IntangibleAssetMember
2023-01-01
2023-12-31
0001221029
cpac:AccumulatedAmortization1Member
cpac:ITApplicationsMember
2023-12-31
0001221029
cpac:AccumulatedAmortization1Member
cpac:FiniteLifeIntangibleMember
2023-12-31
0001221029
cpac:AccumulatedAmortization1Member
cpac:IndefiniteLifeIntangibleMember
2023-12-31
0001221029
cpac:AccumulatedAmortization1Member
cpac:ExplorationCostAndMiningEvaluationMember
2023-12-31
0001221029
cpac:AccumulatedAmortization1Member
cpac:IntangibleAssetMember
2023-12-31
0001221029
cpac:ImpairmentOfAssetsMember
cpac:ITApplicationsMember
2022-12-31
0001221029
cpac:ImpairmentOfAssetsMember
cpac:FiniteLifeIntangibleMember
2022-12-31
0001221029
cpac:ImpairmentOfAssetsMember
cpac:IndefiniteLifeIntangibleMember
2022-12-31
0001221029
cpac:ImpairmentOfAssetsMember
cpac:ExplorationCostAndMiningEvaluationMember
2022-12-31
0001221029
cpac:ImpairmentOfAssetsMember
cpac:IntangibleAssetMember
2022-12-31
0001221029
cpac:ImpairmentOfAssetsMember
cpac:ITApplicationsMember
2023-12-31
0001221029
cpac:ImpairmentOfAssetsMember
cpac:FiniteLifeIntangibleMember
2023-12-31
0001221029
cpac:ImpairmentOfAssetsMember
cpac:IndefiniteLifeIntangibleMember
2023-12-31
0001221029
cpac:ImpairmentOfAssetsMember
cpac:ExplorationCostAndMiningEvaluationMember
2023-12-31
0001221029
cpac:ImpairmentOfAssetsMember
cpac:IntangibleAssetMember
2023-12-31
0001221029
cpac:NetCarryingValueMember
cpac:ITApplicationsMember
2022-12-31
0001221029
cpac:NetCarryingValueMember
cpac:FiniteLifeIntangibleMember
2022-12-31
0001221029
cpac:NetCarryingValueMember
cpac:IndefiniteLifeIntangibleMember
2022-12-31
0001221029
cpac:NetCarryingValueMember
cpac:ExplorationCostAndMiningEvaluationMember
2022-12-31
0001221029
cpac:NetCarryingValueMember
cpac:IntangibleAssetMember
2022-12-31
0001221029
cpac:NetCarryingValueMember
cpac:ITApplicationsMember
2023-12-31
0001221029
cpac:NetCarryingValueMember
cpac:FiniteLifeIntangibleMember
2023-12-31
0001221029
cpac:NetCarryingValueMember
cpac:IndefiniteLifeIntangibleMember
2023-12-31
0001221029
cpac:NetCarryingValueMember
cpac:ExplorationCostAndMiningEvaluationMember
2023-12-31
0001221029
cpac:NetCarryingValueMember
cpac:IntangibleAssetMember
2023-12-31
0001221029
cpac:ProvisionForWorkersProfitSharingMember
ifrs-full:BottomOfRangeMember
2023-12-31
0001221029
cpac:ProvisionForWorkersProfitSharingMember
ifrs-full:BottomOfRangeMember
2022-12-31
0001221029
cpac:ProvisionForWorkersProfitSharingMember
ifrs-full:TopOfRangeMember
2023-12-31
0001221029
cpac:ProvisionForWorkersProfitSharingMember
ifrs-full:TopOfRangeMember
2022-12-31
0001221029
cpac:ProvisionForWorkersProfitSharingMember
2023-12-31
0001221029
cpac:ProvisionForWorkersProfitSharingMember
2022-12-31
0001221029
cpac:ProvisionForDecommissioningRestorationAndRehabilitationCostMember
ifrs-full:BottomOfRangeMember
2023-12-31
0001221029
cpac:ProvisionForDecommissioningRestorationAndRehabilitationCostMember
ifrs-full:TopOfRangeMember
2023-12-31
0001221029
cpac:ProvisionForDecommissioningRestorationAndRehabilitationCostMember
ifrs-full:BottomOfRangeMember
2022-12-31
0001221029
cpac:ProvisionForDecommissioningRestorationAndRehabilitationCostMember
ifrs-full:TopOfRangeMember
2022-12-31
0001221029
cpac:ProvisionForWorkersProfitSharingMember
2021-12-31
0001221029
cpac:ProvisionForLongTermIncentivePlanMember
2021-12-31
0001221029
cpac:QuarryRehabilitationProvisionMember
2021-12-31
0001221029
cpac:ProvisionOfLegalContingenciesMember
2021-12-31
0001221029
cpac:ProvisionForWorkersProfitSharingMember
2022-01-01
2022-12-31
0001221029
cpac:ProvisionForLongTermIncentivePlanMember
2022-01-01
2022-12-31
0001221029
cpac:QuarryRehabilitationProvisionMember
2022-01-01
2022-12-31
0001221029
cpac:ProvisionOfLegalContingenciesMember
2022-01-01
2022-12-31
0001221029
cpac:ProvisionForLongTermIncentivePlanMember
2022-12-31
0001221029
cpac:QuarryRehabilitationProvisionMember
2022-12-31
0001221029
cpac:ProvisionOfLegalContingenciesMember
2022-12-31
0001221029
cpac:ProvisionForWorkersProfitSharingMember
2023-01-01
2023-12-31
0001221029
cpac:ProvisionForLongTermIncentivePlanMember
2023-01-01
2023-12-31
0001221029
cpac:QuarryRehabilitationProvisionMember
2023-01-01
2023-12-31
0001221029
cpac:ProvisionOfLegalContingenciesMember
2023-01-01
2023-12-31
0001221029
cpac:ProvisionForLongTermIncentivePlanMember
2023-12-31
0001221029
cpac:QuarryRehabilitationProvisionMember
2023-12-31
0001221029
cpac:ProvisionOfLegalContingenciesMember
2023-12-31
0001221029
cpac:SeniorNotesInUSDollarsMember
2019-01-08
2019-01-08
0001221029
cpac:SeniorNotesInSolesMember
2019-01-08
2019-01-08
0001221029
ifrs-full:FinancialGuaranteeContractsMember
2023-01-01
2023-12-31
0001221029
ifrs-full:FinancialGuaranteeContractsMember
2022-01-01
2022-12-31
0001221029
ifrs-full:FinancialGuaranteeContractsMember
2021-01-02
2021-12-31
0001221029
cpac:JanuaryTwentyTwoTwoThousandTwentyFourMember
cpac:BancoDeCrditoDelPerMember
2023-01-01
2023-12-31
0001221029
cpac:JanuaryTwentyTwoTwoThousandTwentyFourMember
cpac:BancoDeCrditoDelPerMember
2023-12-31
0001221029
cpac:JanuaryTwentyTwoTwoThousandTwentyFourMember
cpac:BancoDeCrditoDelPerMember
2022-12-31
0001221029
cpac:JanuaryNineteenTwoThousandTwentyFourMember
cpac:BBVAPeruMember
2023-01-01
2023-12-31
0001221029
cpac:JanuaryNineteenTwoThousandTwentyFourMember
cpac:BBVAPeruMember
2023-12-31
0001221029
cpac:JanuaryNineteenTwoThousandTwentyFourMember
cpac:BBVAPeruMember
2022-12-31
0001221029
cpac:MarchFifteenTwoThousandTwentyFourMember
cpac:BBVAPeruMember
2023-01-01
2023-12-31
0001221029
cpac:MarchFifteenTwoThousandTwentyFourMember
cpac:BBVAPeruMember
2023-12-31
0001221029
cpac:MarchFifteenTwoThousandTwentyFourOneMember
cpac:BBVAPeruMember
2023-01-01
2023-12-31
0001221029
cpac:MarchFifteenTwoThousandTwentyFourOneMember
cpac:BBVAPeruMember
2023-12-31
0001221029
cpac:MarchFifteenTwoThousandTwentyFourOneMember
cpac:BBVAPeruMember
2022-12-31
0001221029
cpac:DecemberTwelveTwoThousandTwentyFourMember
cpac:BBVAPeruMember
2023-01-01
2023-12-31
0001221029
cpac:DecemberTwelveTwoThousandTwentyFourMember
cpac:BBVAPeruMember
2023-12-31
0001221029
cpac:DecemberTwelveTwoThousandTwentyFourOneMember
cpac:BBVAPeruMember
2023-01-01
2023-12-31
0001221029
cpac:DecemberTwelveTwoThousandTwentyFourOneMember
cpac:BBVAPeruMember
2023-12-31
0001221029
cpac:DecemberTwelveTwoThousandTwentyFourOneMember
cpac:BBVAPeruMember
2022-12-31
0001221029
cpac:DecemberTwelveTwoThousandTwentyFourTwoMember
cpac:BBVAPeruMember
2023-01-01
2023-12-31
0001221029
cpac:DecemberTwelveTwoThousandTwentyFourTwoMember
cpac:BBVAPeruMember
2023-12-31
0001221029
cpac:DecemberTwelveTwoThousandTwentyFourTwoMember
cpac:BBVAPeruMember
2022-12-31
0001221029
cpac:NovemberTwentyTwoTwoThousandTwentyFourMember
cpac:BBVAPeruMember
2023-01-01
2023-12-31
0001221029
cpac:NovemberTwentyTwoTwoThousandTwentyFourMember
cpac:BBVAPeruMember
2023-12-31
0001221029
cpac:NovemberTwentyTwoTwoThousandTwentyFourOneMember
cpac:BBVAPeruMember
2023-01-01
2023-12-31
0001221029
cpac:NovemberTwentyTwoTwoThousandTwentyFourOneMember
cpac:BBVAPeruMember
2023-12-31
0001221029
cpac:NovemberTwentyTwoTwoThousandTwentyFourOneMember
cpac:BBVAPeruMember
2022-12-31
0001221029
cpac:December182023Member
cpac:BancoDeCrditoDelPerMember
2023-01-01
2023-12-31
0001221029
cpac:December182023Member
cpac:BancoDeCrditoDelPerMember
2023-12-31
0001221029
cpac:December182023Member
cpac:BancoDeCrditoDelPerMember
2022-12-31
0001221029
cpac:DecemberEighteenTwoThousandTwentyThreeMember
cpac:BancoDeCrditoDelPerMember
2023-01-01
2023-12-31
0001221029
cpac:DecemberEighteenTwoThousandTwentyThreeMember
cpac:BancoDeCrditoDelPerMember
2023-12-31
0001221029
cpac:DecemberEighteenTwoThousandTwentyThreeMember
cpac:BancoDeCrditoDelPerMember
2022-12-31
0001221029
cpac:ShorttermPromissoryNotesMember
2023-12-31
0001221029
cpac:ShorttermPromissoryNotesMember
2022-12-31
0001221029
cpac:February12029Member
cpac:SeniorNoteMember
2023-01-01
2023-12-31
0001221029
cpac:February12029Member
cpac:SeniorNoteMember
2023-12-31
0001221029
cpac:February12029Member
cpac:SeniorNoteMember
2022-12-31
0001221029
cpac:February12034Member
cpac:SeniorNoteMember
2023-01-01
2023-12-31
0001221029
cpac:February12034Member
cpac:SeniorNoteMember
2023-12-31
0001221029
cpac:February12034Member
cpac:SeniorNoteMember
2022-12-31
0001221029
cpac:February82023Member
cpac:SeniorNoteMember
2023-01-01
2023-12-31
0001221029
cpac:February82023Member
cpac:SeniorNoteMember
2023-12-31
0001221029
cpac:February82023Member
cpac:SeniorNoteMember
2022-12-31
0001221029
cpac:SeniorNoteMember
2023-12-31
0001221029
cpac:SeniorNoteMember
2022-12-31
0001221029
cpac:December12028Member
cpac:ShortAndLongtermCorporateLoanMember
cpac:BancoDeCrditoDelPerMember
2023-01-01
2023-12-31
0001221029
cpac:December12028Member
cpac:ShortAndLongtermCorporateLoanMember
cpac:BancoDeCrditoDelPerMember
2023-12-31
0001221029
cpac:December12028Member
cpac:ShortAndLongtermCorporateLoanMember
cpac:BancoDeCrditoDelPerMember
2022-12-31
0001221029
cpac:December12028Member
cpac:ShortAndLongtermCorporateLoanMember
cpac:ScotiabankMember
2023-01-01
2023-12-31
0001221029
cpac:December12028Member
cpac:ShortAndLongtermCorporateLoanMember
cpac:ScotiabankMember
2023-12-31
0001221029
cpac:December12028Member
cpac:ShortAndLongtermCorporateLoanMember
cpac:ScotiabankMember
2022-12-31
0001221029
cpac:ShortAndLongtermCorporateLoanMember
2023-12-31
0001221029
cpac:ShortAndLongtermCorporateLoanMember
2022-12-31
0001221029
cpac:MovementOfDeferredIncomeTaxAssetsMember
cpac:AllowanceForExpectedCreditLossesForTradeReceivablesMember
2021-12-31
0001221029
cpac:MovementOfDeferredIncomeTaxAssetsMember
cpac:AllowanceForExpectedCreditLossesForTradeReceivablesMember
2022-01-01
2022-12-31
0001221029
cpac:MovementOfDeferredIncomeTaxAssetsMember
cpac:AllowanceForExpectedCreditLossesForTradeReceivablesMember
2022-12-31
0001221029
cpac:MovementOfDeferredIncomeTaxAssetsMember
cpac:AllowanceForExpectedCreditLossesForTradeReceivablesMember
2023-01-01
2023-12-31
0001221029
cpac:MovementOfDeferredIncomeTaxAssetsMember
cpac:AllowanceForExpectedCreditLossesForTradeReceivablesMember
2023-12-31
0001221029
cpac:MovementOfDeferredIncomeTaxAssetsMember
cpac:ProvisionForVacationsMember
2021-12-31
0001221029
cpac:MovementOfDeferredIncomeTaxAssetsMember
cpac:ProvisionForVacationsMember
2022-01-01
2022-12-31
0001221029
cpac:MovementOfDeferredIncomeTaxAssetsMember
cpac:ProvisionForVacationsMember
2022-12-31
0001221029
cpac:MovementOfDeferredIncomeTaxAssetsMember
cpac:ProvisionForVacationsMember
2023-01-01
2023-12-31
0001221029
cpac:MovementOfDeferredIncomeTaxAssetsMember
cpac:ProvisionForVacationsMember
2023-12-31
0001221029
cpac:MovementOfDeferredIncomeTaxAssetsMember
cpac:ProvisionOfDiscountsAndBonusesToCustomersMember
2021-12-31
0001221029
cpac:MovementOfDeferredIncomeTaxAssetsMember
cpac:ProvisionOfDiscountsAndBonusesToCustomersMember
2022-01-01
2022-12-31
0001221029
cpac:MovementOfDeferredIncomeTaxAssetsMember
cpac:ProvisionOfDiscountsAndBonusesToCustomersMember
2022-12-31
0001221029
cpac:MovementOfDeferredIncomeTaxAssetsMember
cpac:ProvisionOfDiscountsAndBonusesToCustomersMember
2023-01-01
2023-12-31
0001221029
cpac:MovementOfDeferredIncomeTaxAssetsMember
cpac:ProvisionOfDiscountsAndBonusesToCustomersMember
2023-12-31
0001221029
cpac:MovementOfDeferredIncomeTaxAssetsMember
cpac:EffectOfDifferencesBetweenBookAndTaxBasesOfFixedAssetsMember
2021-12-31
0001221029
cpac:MovementOfDeferredIncomeTaxAssetsMember
cpac:EffectOfDifferencesBetweenBookAndTaxBasesOfFixedAssetsMember
2022-01-01
2022-12-31
0001221029
cpac:MovementOfDeferredIncomeTaxAssetsMember
cpac:EffectOfDifferencesBetweenBookAndTaxBasesOfFixedAssetsMember
2022-12-31
0001221029
cpac:MovementOfDeferredIncomeTaxAssetsMember
cpac:EffectOfDifferencesBetweenBookAndTaxBasesOfFixedAssetsMember
2023-01-01
2023-12-31
0001221029
cpac:MovementOfDeferredIncomeTaxAssetsMember
cpac:EffectOfDifferencesBetweenBookAndTaxBasesOfFixedAssetsMember
2023-12-31
0001221029
cpac:MovementOfDeferredIncomeTaxAssetsMember
cpac:LegalClaimContingencyMember
2021-12-31
0001221029
cpac:MovementOfDeferredIncomeTaxAssetsMember
cpac:LegalClaimContingencyMember
2022-01-01
2022-12-31
0001221029
cpac:MovementOfDeferredIncomeTaxAssetsMember
cpac:LegalClaimContingencyMember
2022-12-31
0001221029
cpac:MovementOfDeferredIncomeTaxAssetsMember
cpac:LegalClaimContingencyMember
2023-01-01
2023-12-31
0001221029
cpac:MovementOfDeferredIncomeTaxAssetsMember
cpac:LegalClaimContingencyMember
2023-12-31
0001221029
cpac:MovementOfDeferredIncomeTaxAssetsMember
ifrs-full:LeaseLiabilitiesMember
2021-12-31
0001221029
cpac:MovementOfDeferredIncomeTaxAssetsMember
ifrs-full:LeaseLiabilitiesMember
2022-01-01
2022-12-31
0001221029
cpac:MovementOfDeferredIncomeTaxAssetsMember
ifrs-full:LeaseLiabilitiesMember
2022-12-31
0001221029
cpac:MovementOfDeferredIncomeTaxAssetsMember
ifrs-full:LeaseLiabilitiesMember
2023-01-01
2023-12-31
0001221029
cpac:MovementOfDeferredIncomeTaxAssetsMember
ifrs-full:LeaseLiabilitiesMember
2023-12-31
0001221029
cpac:MovementOfDeferredIncomeTaxAssetsMember
cpac:EstimateForDevaluationOfSparePartsAndSuppliesMember
2021-12-31
0001221029
cpac:MovementOfDeferredIncomeTaxAssetsMember
cpac:EstimateForDevaluationOfSparePartsAndSuppliesMember
2022-01-01
2022-12-31
0001221029
cpac:MovementOfDeferredIncomeTaxAssetsMember
cpac:EstimateForDevaluationOfSparePartsAndSuppliesMember
2022-12-31
0001221029
cpac:MovementOfDeferredIncomeTaxAssetsMember
cpac:EstimateForDevaluationOfSparePartsAndSuppliesMember
2023-01-01
2023-12-31
0001221029
cpac:MovementOfDeferredIncomeTaxAssetsMember
cpac:EstimateForDevaluationOfSparePartsAndSuppliesMember
2023-12-31
0001221029
cpac:MovementOfDeferredIncomeTaxAssetsMember
cpac:EffectOfDifferencesBetweenBookAndTaxBasesOfInventoriesMember
2021-12-31
0001221029
cpac:MovementOfDeferredIncomeTaxAssetsMember
cpac:EffectOfDifferencesBetweenBookAndTaxBasesOfInventoriesMember
2022-01-01
2022-12-31
0001221029
cpac:MovementOfDeferredIncomeTaxAssetsMember
cpac:EffectOfDifferencesBetweenBookAndTaxBasesOfInventoriesMember
2022-12-31
0001221029
cpac:MovementOfDeferredIncomeTaxAssetsMember
cpac:EffectOfDifferencesBetweenBookAndTaxBasesOfInventoriesMember
2023-01-01
2023-12-31
0001221029
cpac:MovementOfDeferredIncomeTaxAssetsMember
cpac:EffectOfDifferencesBetweenBookAndTaxBasesOfInventoriesMember
2023-12-31
0001221029
cpac:MovementOfDeferredIncomeTaxAssetsMember
cpac:EffectOfTaxLossCarryForwardMember
2021-12-31
0001221029
cpac:MovementOfDeferredIncomeTaxAssetsMember
cpac:EffectOfTaxLossCarryForwardMember
2022-01-01
2022-12-31
0001221029
cpac:MovementOfDeferredIncomeTaxAssetsMember
cpac:EffectOfTaxLossCarryForwardMember
2022-12-31
0001221029
cpac:MovementOfDeferredIncomeTaxAssetsMember
cpac:EffectOfTaxLossCarryForwardMember
2023-01-01
2023-12-31
0001221029
cpac:MovementOfDeferredIncomeTaxAssetsMember
cpac:EffectOfTaxLossCarryForwardMember
2023-12-31
0001221029
cpac:MovementOfDeferredIncomeTaxAssetsMember
cpac:AllowanceForExpectedCreditLossesForOtherReceivablesMember
2021-12-31
0001221029
cpac:MovementOfDeferredIncomeTaxAssetsMember
cpac:AllowanceForExpectedCreditLossesForOtherReceivablesMember
2022-01-01
2022-12-31
0001221029
cpac:MovementOfDeferredIncomeTaxAssetsMember
cpac:AllowanceForExpectedCreditLossesForOtherReceivablesMember
2022-12-31
0001221029
cpac:MovementOfDeferredIncomeTaxAssetsMember
cpac:AllowanceForExpectedCreditLossesForOtherReceivablesMember
2023-01-01
2023-12-31
0001221029
cpac:MovementOfDeferredIncomeTaxAssetsMember
cpac:AllowanceForExpectedCreditLossesForOtherReceivablesMember
2023-12-31
0001221029
cpac:MovementOfDeferredIncomeTaxAssetsMember
cpac:OtherDeferredIncomeTaxAssetsMember
2021-12-31
0001221029
cpac:MovementOfDeferredIncomeTaxAssetsMember
cpac:OtherDeferredIncomeTaxAssetsMember
2022-01-01
2022-12-31
0001221029
cpac:MovementOfDeferredIncomeTaxAssetsMember
cpac:OtherDeferredIncomeTaxAssetsMember
2022-12-31
0001221029
cpac:MovementOfDeferredIncomeTaxAssetsMember
cpac:OtherDeferredIncomeTaxAssetsMember
2023-01-01
2023-12-31
0001221029
cpac:MovementOfDeferredIncomeTaxAssetsMember
cpac:OtherDeferredIncomeTaxAssetsMember
2023-12-31
0001221029
cpac:MovementOfDeferredIncomeTaxAssetsMember
cpac:TotalDeferredIncomeTaxAssetsMember
2021-12-31
0001221029
cpac:MovementOfDeferredIncomeTaxAssetsMember
cpac:TotalDeferredIncomeTaxAssetsMember
2022-01-01
2022-12-31
0001221029
cpac:MovementOfDeferredIncomeTaxAssetsMember
cpac:TotalDeferredIncomeTaxAssetsMember
2022-12-31
0001221029
cpac:MovementOfDeferredIncomeTaxAssetsMember
cpac:TotalDeferredIncomeTaxAssetsMember
2023-01-01
2023-12-31
0001221029
cpac:MovementOfDeferredIncomeTaxAssetsMember
cpac:TotalDeferredIncomeTaxAssetsMember
2023-12-31
0001221029
cpac:DeferredIncomeTaxLiabilitiesMember
ifrs-full:RightofuseAssetsMember
2021-12-31
0001221029
cpac:DeferredIncomeTaxLiabilitiesMember
ifrs-full:RightofuseAssetsMember
2022-01-01
2022-12-31
0001221029
cpac:DeferredIncomeTaxLiabilitiesMember
ifrs-full:RightofuseAssetsMember
2022-12-31
0001221029
cpac:DeferredIncomeTaxLiabilitiesMember
ifrs-full:RightofuseAssetsMember
2023-01-01
2023-12-31
0001221029
cpac:DeferredIncomeTaxLiabilitiesMember
ifrs-full:RightofuseAssetsMember
2023-12-31
0001221029
cpac:DeferredIncomeTaxLiabilitiesMember
cpac:OtherDeferredIncomeTaxAssetsOneMember
2021-12-31
0001221029
cpac:DeferredIncomeTaxLiabilitiesMember
cpac:OtherDeferredIncomeTaxAssetsOneMember
2022-01-01
2022-12-31
0001221029
cpac:DeferredIncomeTaxLiabilitiesMember
cpac:OtherDeferredIncomeTaxAssetsOneMember
2022-12-31
0001221029
cpac:DeferredIncomeTaxLiabilitiesMember
cpac:OtherDeferredIncomeTaxAssetsOneMember
2023-01-01
2023-12-31
0001221029
cpac:DeferredIncomeTaxLiabilitiesMember
cpac:OtherDeferredIncomeTaxAssetsOneMember
2023-12-31
0001221029
cpac:TotalDeferredIncomeTaxLiabilitiesThreeMember
2021-12-31
0001221029
cpac:TotalDeferredIncomeTaxLiabilitiesThreeMember
2022-01-01
2022-12-31
0001221029
cpac:TotalDeferredIncomeTaxLiabilitiesThreeMember
2022-12-31
0001221029
cpac:TotalDeferredIncomeTaxLiabilitiesThreeMember
2023-01-01
2023-12-31
0001221029
cpac:TotalDeferredIncomeTaxLiabilitiesThreeMember
2023-12-31
0001221029
cpac:TotalDeferredIncomeTaxAssetsNetMember
2021-12-31
0001221029
cpac:TotalDeferredIncomeTaxAssetsNetMember
2022-01-01
2022-12-31
0001221029
cpac:TotalDeferredIncomeTaxAssetsNetMember
2022-12-31
0001221029
cpac:TotalDeferredIncomeTaxAssetsNetMember
2023-01-01
2023-12-31
0001221029
cpac:TotalDeferredIncomeTaxAssetsNetMember
2023-12-31
0001221029
cpac:MovementOfDeferredIncomeTaxLiabilitiesMember
cpac:ImpairmentOnBrineProjectAssetsSalmuerasNotaMember
2021-12-31
0001221029
cpac:MovementOfDeferredIncomeTaxLiabilitiesMember
cpac:ImpairmentOnBrineProjectAssetsSalmuerasNotaMember
2022-01-01
2022-12-31
0001221029
cpac:MovementOfDeferredIncomeTaxLiabilitiesMember
cpac:ImpairmentOnBrineProjectAssetsSalmuerasNotaMember
2022-12-31
0001221029
cpac:MovementOfDeferredIncomeTaxLiabilitiesMember
cpac:ImpairmentOnBrineProjectAssetsSalmuerasNotaMember
2023-01-01
2023-12-31
0001221029
cpac:MovementOfDeferredIncomeTaxLiabilitiesMember
cpac:ImpairmentOnBrineProjectAssetsSalmuerasNotaMember
2023-12-31
0001221029
cpac:MovementOfDeferredIncomeTaxLiabilitiesMember
cpac:ImpairmentOfAssetsMember
2021-12-31
0001221029
cpac:MovementOfDeferredIncomeTaxLiabilitiesMember
cpac:ImpairmentOfAssetsMember
2022-01-01
2022-12-31
0001221029
cpac:MovementOfDeferredIncomeTaxLiabilitiesMember
cpac:ImpairmentOfAssetsMember
2022-12-31
0001221029
cpac:MovementOfDeferredIncomeTaxLiabilitiesMember
cpac:ImpairmentOfAssetsMember
2023-01-01
2023-12-31
0001221029
cpac:MovementOfDeferredIncomeTaxLiabilitiesMember
cpac:ImpairmentOfAssetsMember
2023-12-31
0001221029
cpac:MovementOfDeferredIncomeTaxLiabilitiesMember
cpac:LongtermIncentivePlanMember
2021-12-31
0001221029
cpac:MovementOfDeferredIncomeTaxLiabilitiesMember
cpac:LongtermIncentivePlanMember
2022-01-01
2022-12-31
0001221029
cpac:MovementOfDeferredIncomeTaxLiabilitiesMember
cpac:LongtermIncentivePlanMember
2022-12-31
0001221029
cpac:MovementOfDeferredIncomeTaxLiabilitiesMember
cpac:LongtermIncentivePlanMember
2023-01-01
2023-12-31
0001221029
cpac:MovementOfDeferredIncomeTaxLiabilitiesMember
cpac:LongtermIncentivePlanMember
2023-12-31
0001221029
cpac:MovementOfDeferredIncomeTaxLiabilitiesMember
cpac:ImpairmentOfMiningAssetsMember
2021-12-31
0001221029
cpac:MovementOfDeferredIncomeTaxLiabilitiesMember
cpac:ImpairmentOfMiningAssetsMember
2022-01-01
2022-12-31
0001221029
cpac:MovementOfDeferredIncomeTaxLiabilitiesMember
cpac:ImpairmentOfMiningAssetsMember
2022-12-31
0001221029
cpac:MovementOfDeferredIncomeTaxLiabilitiesMember
cpac:ImpairmentOfMiningAssetsMember
2023-01-01
2023-12-31
0001221029
cpac:MovementOfDeferredIncomeTaxLiabilitiesMember
cpac:ImpairmentOfMiningAssetsMember
2023-12-31
0001221029
cpac:MovementOfDeferredIncomeTaxLiabilitiesMember
cpac:FinancialInstrumentsDesignatedAtFairValueThroughOCIMember
2021-12-31
0001221029
cpac:MovementOfDeferredIncomeTaxLiabilitiesMember
cpac:FinancialInstrumentsDesignatedAtFairValueThroughOCIMember
2022-01-01
2022-12-31
0001221029
cpac:MovementOfDeferredIncomeTaxLiabilitiesMember
cpac:FinancialInstrumentsDesignatedAtFairValueThroughOCIMember
2022-12-31
0001221029
cpac:MovementOfDeferredIncomeTaxLiabilitiesMember
cpac:FinancialInstrumentsDesignatedAtFairValueThroughOCIMember
2023-01-01
2023-12-31
0001221029
cpac:MovementOfDeferredIncomeTaxLiabilitiesMember
cpac:FinancialInstrumentsDesignatedAtFairValueThroughOCIMember
2023-12-31
0001221029
cpac:MovementOfDeferredIncomeTaxLiabilitiesMember
cpac:ProvisionForSparePartsAndSuppliesObsolescenceMember
2021-12-31
0001221029
cpac:MovementOfDeferredIncomeTaxLiabilitiesMember
cpac:ProvisionForSparePartsAndSuppliesObsolescenceMember
2022-01-01
2022-12-31
0001221029
cpac:MovementOfDeferredIncomeTaxLiabilitiesMember
cpac:ProvisionForSparePartsAndSuppliesObsolescenceMember
2022-12-31
0001221029
cpac:MovementOfDeferredIncomeTaxLiabilitiesMember
cpac:ProvisionForSparePartsAndSuppliesObsolescenceMember
2023-01-01
2023-12-31
0001221029
cpac:MovementOfDeferredIncomeTaxLiabilitiesMember
cpac:ProvisionForSparePartsAndSuppliesObsolescenceMember
2023-12-31
0001221029
cpac:MovementOfDeferredIncomeTaxLiabilitiesMember
cpac:QuarryRehabilitationProvisionMember
2021-12-31
0001221029
cpac:MovementOfDeferredIncomeTaxLiabilitiesMember
cpac:QuarryRehabilitationProvisionMember
2022-01-01
2022-12-31
0001221029
cpac:MovementOfDeferredIncomeTaxLiabilitiesMember
cpac:QuarryRehabilitationProvisionMember
2022-12-31
0001221029
cpac:MovementOfDeferredIncomeTaxLiabilitiesMember
cpac:QuarryRehabilitationProvisionMember
2023-01-01
2023-12-31
0001221029
cpac:MovementOfDeferredIncomeTaxLiabilitiesMember
cpac:QuarryRehabilitationProvisionMember
2023-12-31
0001221029
cpac:MovementOfDeferredIncomeTaxLiabilitiesMember
cpac:ProvisionForVacationsMember
2021-12-31
0001221029
cpac:MovementOfDeferredIncomeTaxLiabilitiesMember
cpac:ProvisionForVacationsMember
2022-01-01
2022-12-31
0001221029
cpac:MovementOfDeferredIncomeTaxLiabilitiesMember
cpac:ProvisionForVacationsMember
2022-12-31
0001221029
cpac:MovementOfDeferredIncomeTaxLiabilitiesMember
cpac:ProvisionForVacationsMember
2023-01-01
2023-12-31
0001221029
cpac:MovementOfDeferredIncomeTaxLiabilitiesMember
cpac:ProvisionForVacationsMember
2023-12-31
0001221029
cpac:MovementOfDeferredIncomeTaxLiabilitiesMember
cpac:LegalClaimContingencyMember
2021-12-31
0001221029
cpac:MovementOfDeferredIncomeTaxLiabilitiesMember
cpac:LegalClaimContingencyMember
2022-01-01
2022-12-31
0001221029
cpac:MovementOfDeferredIncomeTaxLiabilitiesMember
cpac:LegalClaimContingencyMember
2022-12-31
0001221029
cpac:MovementOfDeferredIncomeTaxLiabilitiesMember
cpac:LegalClaimContingencyMember
2023-01-01
2023-12-31
0001221029
cpac:MovementOfDeferredIncomeTaxLiabilitiesMember
cpac:LegalClaimContingencyMember
2023-12-31
0001221029
cpac:MovementOfDeferredIncomeTaxLiabilitiesMember
cpac:AllowanceForExpectedCreditLossesForTradeReceivablesOneMember
2021-12-31
0001221029
cpac:MovementOfDeferredIncomeTaxLiabilitiesMember
cpac:AllowanceForExpectedCreditLossesForTradeReceivablesOneMember
2022-01-01
2022-12-31
0001221029
cpac:MovementOfDeferredIncomeTaxLiabilitiesMember
cpac:AllowanceForExpectedCreditLossesForTradeReceivablesOneMember
2022-12-31
0001221029
cpac:MovementOfDeferredIncomeTaxLiabilitiesMember
cpac:AllowanceForExpectedCreditLossesForTradeReceivablesOneMember
2023-01-01
2023-12-31
0001221029
cpac:MovementOfDeferredIncomeTaxLiabilitiesMember
cpac:AllowanceForExpectedCreditLossesForTradeReceivablesOneMember
2023-12-31
0001221029
cpac:MovementOfDeferredIncomeTaxLiabilitiesMember
ifrs-full:LeaseLiabilitiesMember
2021-12-31
0001221029
cpac:MovementOfDeferredIncomeTaxLiabilitiesMember
ifrs-full:LeaseLiabilitiesMember
2022-01-01
2022-12-31
0001221029
cpac:MovementOfDeferredIncomeTaxLiabilitiesMember
ifrs-full:LeaseLiabilitiesMember
2022-12-31
0001221029
cpac:MovementOfDeferredIncomeTaxLiabilitiesMember
ifrs-full:LeaseLiabilitiesMember
2023-01-01
2023-12-31
0001221029
cpac:MovementOfDeferredIncomeTaxLiabilitiesMember
ifrs-full:LeaseLiabilitiesMember
2023-12-31
0001221029
cpac:MovementOfDeferredIncomeTaxLiabilitiesMember
cpac:OtherDeferredIncomeTaxAssetsTwoMember
2021-12-31
0001221029
cpac:MovementOfDeferredIncomeTaxLiabilitiesMember
cpac:OtherDeferredIncomeTaxAssetsTwoMember
2022-01-01
2022-12-31
0001221029
cpac:MovementOfDeferredIncomeTaxLiabilitiesMember
cpac:OtherDeferredIncomeTaxAssetsTwoMember
2022-12-31
0001221029
cpac:MovementOfDeferredIncomeTaxLiabilitiesMember
cpac:OtherDeferredIncomeTaxAssetsTwoMember
2023-01-01
2023-12-31
0001221029
cpac:MovementOfDeferredIncomeTaxLiabilitiesMember
cpac:OtherDeferredIncomeTaxAssetsTwoMember
2023-12-31
0001221029
cpac:MovementOfDeferredIncomeTaxLiabilitiesMember
cpac:TotalDeferredIncomeTaxAssetsOneMember
2021-12-31
0001221029
cpac:MovementOfDeferredIncomeTaxLiabilitiesMember
cpac:TotalDeferredIncomeTaxAssetsOneMember
2022-01-01
2022-12-31
0001221029
cpac:MovementOfDeferredIncomeTaxLiabilitiesMember
cpac:TotalDeferredIncomeTaxAssetsOneMember
2022-12-31
0001221029
cpac:MovementOfDeferredIncomeTaxLiabilitiesMember
cpac:TotalDeferredIncomeTaxAssetsOneMember
2023-01-01
2023-12-31
0001221029
cpac:MovementOfDeferredIncomeTaxLiabilitiesMember
cpac:TotalDeferredIncomeTaxAssetsOneMember
2023-12-31
0001221029
cpac:MovementOfDeferredIncomeTaxLiabilitiesMember
cpac:EffectOfDifferencesBetweenBookAndTaxBasesOfFixedAssetsAndInTheDepreciationRatesUsedForBookPurposesTwoMember
2021-12-31
0001221029
cpac:MovementOfDeferredIncomeTaxLiabilitiesMember
cpac:EffectOfDifferencesBetweenBookAndTaxBasesOfFixedAssetsAndInTheDepreciationRatesUsedForBookPurposesTwoMember
2022-01-01
2022-12-31
0001221029
cpac:MovementOfDeferredIncomeTaxLiabilitiesMember
cpac:EffectOfDifferencesBetweenBookAndTaxBasesOfFixedAssetsAndInTheDepreciationRatesUsedForBookPurposesTwoMember
2022-12-31
0001221029
cpac:MovementOfDeferredIncomeTaxLiabilitiesMember
cpac:EffectOfDifferencesBetweenBookAndTaxBasesOfFixedAssetsAndInTheDepreciationRatesUsedForBookPurposesTwoMember
2023-01-01
2023-12-31
0001221029
cpac:MovementOfDeferredIncomeTaxLiabilitiesMember
cpac:EffectOfDifferencesBetweenBookAndTaxBasesOfFixedAssetsAndInTheDepreciationRatesUsedForBookPurposesTwoMember
2023-12-31
0001221029
cpac:MovementOfDeferredIncomeTaxLiabilitiesMember
cpac:EffectOfCostsOfIssuanceOfSeniorNotesOneMember
2021-12-31
0001221029
cpac:MovementOfDeferredIncomeTaxLiabilitiesMember
cpac:EffectOfCostsOfIssuanceOfSeniorNotesOneMember
2022-01-01
2022-12-31
0001221029
cpac:MovementOfDeferredIncomeTaxLiabilitiesMember
cpac:EffectOfCostsOfIssuanceOfSeniorNotesOneMember
2022-12-31
0001221029
cpac:MovementOfDeferredIncomeTaxLiabilitiesMember
cpac:EffectOfCostsOfIssuanceOfSeniorNotesOneMember
2023-01-01
2023-12-31
0001221029
cpac:MovementOfDeferredIncomeTaxLiabilitiesMember
cpac:EffectOfCostsOfIssuanceOfSeniorNotesOneMember
2023-12-31
0001221029
cpac:MovementOfDeferredIncomeTaxLiabilitiesMember
ifrs-full:RightofuseAssetsMember
2021-12-31
0001221029
cpac:MovementOfDeferredIncomeTaxLiabilitiesMember
ifrs-full:RightofuseAssetsMember
2022-01-01
2022-12-31
0001221029
cpac:MovementOfDeferredIncomeTaxLiabilitiesMember
ifrs-full:RightofuseAssetsMember
2022-12-31
0001221029
cpac:MovementOfDeferredIncomeTaxLiabilitiesMember
ifrs-full:RightofuseAssetsMember
2023-01-01
2023-12-31
0001221029
cpac:MovementOfDeferredIncomeTaxLiabilitiesMember
ifrs-full:RightofuseAssetsMember
2023-12-31
0001221029
cpac:MovementOfDeferredIncomeTaxLiabilitiesMember
cpac:NetGainOnCashFlowHedgeMember
2021-12-31
0001221029
cpac:MovementOfDeferredIncomeTaxLiabilitiesMember
cpac:NetGainOnCashFlowHedgeMember
2022-01-01
2022-12-31
0001221029
cpac:MovementOfDeferredIncomeTaxLiabilitiesMember
cpac:NetGainOnCashFlowHedgeMember
2022-12-31
0001221029
cpac:MovementOfDeferredIncomeTaxLiabilitiesMember
cpac:NetGainOnCashFlowHedgeMember
2023-01-01
2023-12-31
0001221029
cpac:MovementOfDeferredIncomeTaxLiabilitiesMember
cpac:NetGainOnCashFlowHedgeMember
2023-12-31
0001221029
cpac:MovementOfDeferredIncomeTaxLiabilitiesMember
cpac:OtherMember
2021-12-31
0001221029
cpac:MovementOfDeferredIncomeTaxLiabilitiesMember
cpac:OtherMember
2022-01-01
2022-12-31
0001221029
cpac:MovementOfDeferredIncomeTaxLiabilitiesMember
cpac:OtherMember
2022-12-31
0001221029
cpac:MovementOfDeferredIncomeTaxLiabilitiesMember
cpac:OtherMember
2023-01-01
2023-12-31
0001221029
cpac:MovementOfDeferredIncomeTaxLiabilitiesMember
cpac:OtherMember
2023-12-31
0001221029
cpac:MovementOfDeferredIncomeTaxLiabilitiesMember
cpac:TotalDeferredIncomeTaxLiabilitiesMember
2021-12-31
0001221029
cpac:MovementOfDeferredIncomeTaxLiabilitiesMember
cpac:TotalDeferredIncomeTaxLiabilitiesMember
2022-01-01
2022-12-31
0001221029
cpac:MovementOfDeferredIncomeTaxLiabilitiesMember
cpac:TotalDeferredIncomeTaxLiabilitiesMember
2022-12-31
0001221029
cpac:MovementOfDeferredIncomeTaxLiabilitiesMember
cpac:TotalDeferredIncomeTaxLiabilitiesMember
2023-01-01
2023-12-31
0001221029
cpac:MovementOfDeferredIncomeTaxLiabilitiesMember
cpac:TotalDeferredIncomeTaxLiabilitiesMember
2023-12-31
0001221029
cpac:MovementOfDeferredIncomeTaxLiabilitiesMember
cpac:TotalDeferredIncomeTaxLiabilitiesNetThreeMember
2021-12-31
0001221029
cpac:MovementOfDeferredIncomeTaxLiabilitiesMember
cpac:TotalDeferredIncomeTaxLiabilitiesNetThreeMember
2022-01-01
2022-12-31
0001221029
cpac:MovementOfDeferredIncomeTaxLiabilitiesMember
cpac:TotalDeferredIncomeTaxLiabilitiesNetThreeMember
2022-12-31
0001221029
cpac:MovementOfDeferredIncomeTaxLiabilitiesMember
cpac:TotalDeferredIncomeTaxLiabilitiesNetThreeMember
2023-01-01
2023-12-31
0001221029
cpac:MovementOfDeferredIncomeTaxLiabilitiesMember
cpac:TotalDeferredIncomeTaxLiabilitiesNetThreeMember
2023-12-31
0001221029
cpac:MovementOfDeferredIncomeTaxLiabilitiesMember
cpac:TotalDeferredIncomeTaxLiabilitiesNetMember
2022-01-01
2022-12-31
0001221029
cpac:MovementOfDeferredIncomeTaxLiabilitiesMember
cpac:TotalDeferredIncomeTaxLiabilitiesNetMember
2023-01-01
2023-12-31
0001221029
cpac:LimaStockExchangeMember
2023-12-31
0001221029
cpac:LimaStockExchangeMember
2022-12-31
0001221029
cpac:InvestmentSharesMember
2023-12-31
0001221029
cpac:InvestmentSharesMember
2022-12-31
0001221029
cpac:CementMember
2023-01-01
2023-12-31
0001221029
cpac:ConcreteAndMortarMember
2023-01-01
2023-12-31
0001221029
cpac:PrecastMember
2023-01-01
2023-12-31
0001221029
cpac:ConstructionSuppliesMember
2023-01-01
2023-12-31
0001221029
cpac:OtherMember
2023-01-01
2023-12-31
0001221029
cpac:CementMember
2022-01-01
2022-12-31
0001221029
cpac:ConcreteAndMortarMember
2022-01-01
2022-12-31
0001221029
cpac:PrecastMember
2022-01-01
2022-12-31
0001221029
cpac:ConstructionSuppliesMember
2022-01-01
2022-12-31
0001221029
cpac:OtherMember
2022-01-01
2022-12-31
0001221029
cpac:CementMember
2021-01-02
2021-12-31
0001221029
cpac:ConcreteAndMortarMember
2021-01-02
2021-12-31
0001221029
cpac:PrecastMember
2021-01-02
2021-12-31
0001221029
cpac:ConstructionSuppliesMember
2021-01-02
2021-12-31
0001221029
cpac:OtherMember
2021-01-02
2021-12-31
0001221029
cpac:InversionesASPIMember
2023-01-01
2023-12-31
0001221029
cpac:InversionesASPIMember
2022-01-01
2022-12-31
0001221029
cpac:InversionesASPIMember
2021-01-02
2021-12-31
0001221029
cpac:CompaaMineraAresSACMember
2023-01-01
2023-12-31
0001221029
cpac:CompaaMineraAresSACMember
2022-01-01
2022-12-31
0001221029
cpac:CompaaMineraAresSACMember
2021-01-02
2021-12-31
0001221029
cpac:FossalSAAMember
2023-01-01
2023-12-31
0001221029
cpac:FossalSAAMember
2022-01-01
2022-12-31
0001221029
cpac:FossalSAAMember
2021-01-02
2021-12-31
0001221029
cpac:FosfatosDelPacficoSAMember
2023-01-01
2023-12-31
0001221029
cpac:FosfatosDelPacficoSAMember
2022-01-01
2022-12-31
0001221029
cpac:FosfatosDelPacficoSAMember
2021-01-02
2021-12-31
0001221029
cpac:AsociacinSumacTarpuyMember
2023-01-01
2023-12-31
0001221029
cpac:AsociacinSumacTarpuyMember
2022-01-01
2022-12-31
0001221029
cpac:AsociacinSumacTarpuyMember
2021-01-02
2021-12-31
0001221029
cpac:LoansToFossalSAAMember
2023-12-31
0001221029
cpac:LoansToFossalSAAMember
2022-12-31
0001221029
cpac:LoansToFossalSAAMember
2021-12-31
0001221029
cpac:LoansToFosfatosDelPacficoSAMember
2023-12-31
0001221029
cpac:LoansToFosfatosDelPacficoSAMember
2022-12-31
0001221029
cpac:LoansToFosfatosDelPacficoSAMember
2021-12-31
0001221029
cpac:LoanCollectionFromFossalSAAMember
2023-12-31
0001221029
cpac:LoanCollectionFromFossalSAAMember
2022-12-31
0001221029
cpac:LoanCollectionFromFossalSAAMember
2021-12-31
0001221029
cpac:LoanCollectionFromFosfatosDelPacficoSAMember
2023-12-31
0001221029
cpac:LoanCollectionFromFosfatosDelPacficoSAMember
2022-12-31
0001221029
cpac:LoanCollectionFromFosfatosDelPacficoSAMember
2021-12-31
0001221029
cpac:InversionesASPISAMember
2023-12-31
0001221029
cpac:InversionesASPISAMember
2022-12-31
0001221029
cpac:FosfatosDelPacficoSAMember
2023-12-31
0001221029
cpac:FosfatosDelPacficoSAMember
2022-12-31
0001221029
cpac:CompaniaMineraAresSACMember
2023-12-31
0001221029
cpac:CompaniaMineraAresSACMember
2022-12-31
0001221029
cpac:FossalSAMember
2023-12-31
0001221029
cpac:FossalSAMember
2022-12-31
0001221029
cpac:OtherMember
2023-12-31
0001221029
cpac:OtherMember
2022-12-31
0001221029
ifrs-full:OtherRelatedPartiesMember
2023-12-31
0001221029
ifrs-full:OtherRelatedPartiesMember
2022-12-31
0001221029
ifrs-full:ContingentLiabilityArisingFromPostemploymentBenefitObligationsMember
2023-01-01
2023-12-31
0001221029
cpac:PeruvianGovernmentMember
2023-01-01
2023-12-31
0001221029
ifrs-full:BottomOfRangeMember
2023-01-01
2023-12-31
0001221029
ifrs-full:BottomOfRangeMember
2022-01-01
2022-12-31
0001221029
ifrs-full:BottomOfRangeMember
2021-01-02
2021-12-31
0001221029
ifrs-full:TopOfRangeMember
2023-01-01
2023-12-31
0001221029
ifrs-full:TopOfRangeMember
2022-01-01
2022-12-31
0001221029
ifrs-full:TopOfRangeMember
2021-01-02
2021-12-31
0001221029
cpac:RehabilitationProvisionMember
2023-12-31
0001221029
cpac:RehabilitationProvisionMember
2022-12-31
0001221029
cpac:CementosPacasmayoSAAMember
2023-01-01
2023-12-31
0001221029
cpac:CementosSelvaSACMember
2023-01-01
2023-12-31
0001221029
cpac:DistribuidoraNortePacasmayoSRLMember
2023-01-01
2023-12-31
0001221029
cpac:EmpresaDeTransmisinGuadalupeSACMember
2023-01-01
2023-12-31
0001221029
cpac:SalmuerasSudamericanasSAMember
2023-01-01
2023-12-31
0001221029
cpac:CalizasDelNorteSACMember
2023-01-01
2023-12-31
0001221029
cpac:SolucionesTakaySACMember
2023-01-01
2023-12-31
0001221029
cpac:CorporacinMaterialesPiuraSACMember
2023-01-01
2023-12-31
0001221029
cpac:RiojaProjectUnitMember
2023-01-01
2023-12-31
0001221029
cpac:RiojaProjectUnitMember
2022-01-01
2022-12-31
0001221029
cpac:RiojaProjectUnitMember
2021-01-02
2021-12-31
0001221029
cpac:TembladeraMember
2023-01-01
2023-12-31
0001221029
cpac:TembladeraMember
2022-01-01
2022-12-31
0001221029
cpac:TembladeraMember
2021-01-02
2021-12-31
0001221029
ifrs-full:TradeReceivablesMember
cpac:CustomersFourMember
2023-01-01
2023-12-31
0001221029
ifrs-full:TradeReceivablesMember
cpac:CustomersFourMember
2022-01-01
2022-12-31
0001221029
ifrs-full:TradeReceivablesMember
2023-01-01
2023-12-31
0001221029
ifrs-full:TradeReceivablesMember
2022-01-01
2022-12-31
0001221029
ifrs-full:TopOfRangeMember
2023-12-31
0001221029
ifrs-full:TopOfRangeMember
2022-12-31
0001221029
ifrs-full:BottomOfRangeMember
2023-12-31
0001221029
ifrs-full:BottomOfRangeMember
2022-12-31
0001221029
ifrs-full:TradeReceivablesMember
cpac:Customers25Member
2023-01-01
2023-12-31
0001221029
ifrs-full:TradeReceivablesMember
cpac:Customers25Member
2022-01-01
2022-12-31
0001221029
cpac:ChangesInExchangeRatePlusFiveMember
cpac:ForeignCurrencyRiskMember
2023-01-01
2023-12-31
0001221029
cpac:ChangeInExchangeRatePlusTenMember
cpac:ForeignCurrencyRiskMember
2023-01-01
2023-12-31
0001221029
cpac:ChangeInExchangeRateMinusFiveMember
cpac:ForeignCurrencyRiskMember
2023-01-01
2023-12-31
0001221029
cpac:ChangeInExchangeRateMinusTenMember
cpac:ForeignCurrencyRiskMember
2023-01-01
2023-12-31
0001221029
cpac:ChangesInExchangeRatePlusFiveMember
cpac:ForeignCurrencyRiskMember
2022-01-01
2022-12-31
0001221029
cpac:ChangeInExchangeRatePlusTenMember
cpac:ForeignCurrencyRiskMember
2022-01-01
2022-12-31
0001221029
cpac:ChangeInExchangeRateMinusFiveMember
cpac:ForeignCurrencyRiskMember
2022-01-01
2022-12-31
0001221029
cpac:ChangeInExchangeRateMinusTenMember
cpac:ForeignCurrencyRiskMember
2022-01-01
2022-12-31
0001221029
cpac:ChangesInExchangeRatePlusFiveMember
cpac:ForeignCurrencyRiskMember
2021-01-02
2021-12-31
0001221029
cpac:ChangeInExchangeRatePlusTenMember
cpac:ForeignCurrencyRiskMember
2021-01-02
2021-12-31
0001221029
cpac:ChangeInExchangeRateMinusFiveMember
cpac:ForeignCurrencyRiskMember
2021-01-02
2021-12-31
0001221029
cpac:ChangeInExchangeRateMinusTenMember
cpac:ForeignCurrencyRiskMember
2021-01-02
2021-12-31
0001221029
ifrs-full:NotLaterThanThreeMonthsMember
2023-01-01
2023-12-31
0001221029
ifrs-full:LaterThanThreeMonthsAndNotLaterThanOneYearMember
2023-01-01
2023-12-31
0001221029
ifrs-full:LaterThanOneYearAndNotLaterThanFiveYearsMember
2023-01-01
2023-12-31
0001221029
ifrs-full:LaterThanFiveYearsMember
2023-01-01
2023-12-31
0001221029
ifrs-full:NotLaterThanThreeMonthsMember
2023-12-31
0001221029
ifrs-full:LaterThanThreeMonthsAndNotLaterThanOneYearMember
2023-12-31
0001221029
ifrs-full:LaterThanOneYearAndNotLaterThanFiveYearsMember
2023-12-31
0001221029
ifrs-full:LaterThanFiveYearsMember
2023-12-31
0001221029
ifrs-full:NotLaterThanThreeMonthsMember
2022-01-01
2022-12-31
0001221029
ifrs-full:LaterThanThreeMonthsAndNotLaterThanOneYearMember
2022-01-01
2022-12-31
0001221029
ifrs-full:LaterThanOneYearAndNotLaterThanFiveYearsMember
2022-01-01
2022-12-31
0001221029
ifrs-full:LaterThanFiveYearsMember
2022-01-01
2022-12-31
0001221029
ifrs-full:NotLaterThanThreeMonthsMember
2022-12-31
0001221029
ifrs-full:LaterThanThreeMonthsAndNotLaterThanOneYearMember
2022-12-31
0001221029
ifrs-full:LaterThanOneYearAndNotLaterThanFiveYearsMember
2022-12-31
0001221029
ifrs-full:LaterThanFiveYearsMember
2022-12-31
0001221029
ifrs-full:OnDemandMember
2022-12-31
0001221029
cpac:HedgeFinanceCostPayableMember
2022-12-31
0001221029
cpac:HedgeFinanceCostPayableMember
2023-01-01
2023-12-31
0001221029
cpac:DividendsPayableMember
2022-12-31
0001221029
cpac:DividendsPayableMember
2023-01-01
2023-12-31
0001221029
cpac:DividendsPayableMember
2023-12-31
0001221029
cpac:InterestbearingLoansMember
2022-12-31
0001221029
cpac:InterestbearingLoansMember
2023-01-01
2023-12-31
0001221029
cpac:InterestbearingLoansMember
2023-12-31
0001221029
cpac:HedgeFinanceCostPayableMember
2021-12-31
0001221029
cpac:HedgeFinanceCostPayableMember
2022-01-01
2022-12-31
0001221029
cpac:DividendsPayableMember
2021-12-31
0001221029
cpac:DividendsPayableMember
2022-01-01
2022-12-31
0001221029
cpac:InterestbearingLoansMember
2021-12-31
0001221029
cpac:InterestbearingLoansMember
2022-01-01
2022-12-31
0001221029
ifrs-full:CurrencySwapContractMember
2022-12-31
0001221029
2021-01-01
2021-01-31
0001221029
2021-01-31
0001221029
ifrs-full:CurrencySwapContractMember
2023-02-01
2023-02-28
0001221029
cpac:CashEquivalentMember
ifrs-full:Level1OfFairValueHierarchyMember
2023-12-31
0001221029
cpac:CashEquivalentMember
ifrs-full:Level1OfFairValueHierarchyMember
2022-12-31
0001221029
cpac:TradeAndOtherReceivablesMember
ifrs-full:Level2OfFairValueHierarchyMember
2023-12-31
0001221029
cpac:TradeAndOtherReceivablesMember
ifrs-full:Level2OfFairValueHierarchyMember
2022-12-31
0001221029
cpac:DerivativesFinancialAssetsCrossCurrencySwapsMember
ifrs-full:Level2OfFairValueHierarchyMember
2023-12-31
0001221029
cpac:DerivativesFinancialAssetsCrossCurrencySwapsMember
ifrs-full:Level2OfFairValueHierarchyMember
2022-12-31
0001221029
cpac:FinancialInvestmentAtFairValueThroughOtherComprehensiveIncomeMember
ifrs-full:Level3OfFairValueHierarchyMember
2023-12-31
0001221029
cpac:FinancialInvestmentAtFairValueThroughOtherComprehensiveIncomeMember
ifrs-full:Level3OfFairValueHierarchyMember
2022-12-31
0001221029
cpac:TradeAndOtherPayablesMember
ifrs-full:Level2OfFairValueHierarchyMember
2023-12-31
0001221029
cpac:TradeAndOtherPayablesMember
ifrs-full:Level2OfFairValueHierarchyMember
2022-12-31
0001221029
cpac:SeniorNoteMember
ifrs-full:Level1OfFairValueHierarchyMember
2023-12-31
0001221029
cpac:SeniorNoteMember
ifrs-full:Level1OfFairValueHierarchyMember
2022-12-31
0001221029
cpac:PromissoryNotesMember
ifrs-full:Level2OfFairValueHierarchyMember
2023-12-31
0001221029
cpac:PromissoryNotesMember
ifrs-full:Level2OfFairValueHierarchyMember
2022-12-31
0001221029
cpac:CementConcreteMortarAndBlocksMember
2023-01-01
2023-12-31
0001221029
cpac:TotalConsolidatedMember
2023-01-01
2023-12-31
0001221029
cpac:CementConcreteMortarAndBlocksMember
2022-01-01
2022-12-31
0001221029
cpac:TotalConsolidatedMember
2022-01-01
2022-12-31
0001221029
cpac:CementConcreteMortarAndBlocksMember
2021-01-02
2021-12-31
0001221029
cpac:TotalConsolidatedMember
2021-01-02
2021-12-31
0001221029
cpac:CementConcreteAndBlocksMember
2023-12-31
0001221029
cpac:ConstructionSuppliesMember
2023-12-31
0001221029
cpac:OtherMember
2023-12-31
0001221029
cpac:TotalConsolidatedMember
2023-12-31
0001221029
cpac:CementConcreteAndBlocksMember
2022-12-31
0001221029
cpac:ConstructionSuppliesMember
2022-12-31
0001221029
cpac:OtherMember
2022-12-31
0001221029
cpac:TotalConsolidatedMember
2022-12-31
0001221029
cpac:CementConcreteAndBlocksMember
2021-12-31
0001221029
cpac:ConstructionSuppliesMember
2021-12-31
0001221029
cpac:OtherMember
2021-12-31
0001221029
cpac:TotalConsolidatedMember
2021-12-31
0001221029
cpac:CementConcreteAndBlocksMember
2023-01-01
2023-12-31
0001221029
cpac:CementConcreteAndBlocksMember
2022-01-01
2022-12-31
0001221029
cpac:CementConcreteAndBlocksMember
2021-01-02
2021-12-31
xbrli:shares
iso4217:PEN
iso4217:PEN
xbrli:shares
xbrli:pure
iso4217:USD
Exhibit 12.1
CERTIFICATION PURSUANT TO
SECTION 302 OF THE SARBANES-OXLEY ACT OF 2002
I, Humberto Nadal Del Carpio, certify
that:
| 1. | I have reviewed this annual report on Form 20-F of Cementos Pacasmayo S.A.A.; |
| 2. | Based on my knowledge, this report does not contain any untrue statement of a material fact or omit to state a material fact necessary
to make the statements made, in light of the circumstances under which such statements were made, not misleading with respect to the period
covered by this report; |
| 3. | Based on my knowledge, the financial statements, and other financial information included in this report, fairly present in all material
respects the financial condition, results of operations and cash flows of the company as of, and for, the periods presented in this report; |
| 4. | The company’s other certifying officer(s) and I are responsible for establishing and maintaining disclosure controls and procedures
(as defined in Exchange Act Rules 13a-15(e) and 15d-15(e)) for the company and have: |
| (a) | Designed such disclosure controls and procedures, or caused
such disclosure controls and procedures to be designed under our supervision, to ensure that material information relating to the company,
including its consolidated subsidiaries, is made known to us by others within those entities, particularly during the period in which
this report is being prepared; |
| (b) | Evaluated the effectiveness of the company’s disclosure
controls and procedures and presented in this report our conclusions about the effectiveness of the disclosure controls and procedures,
as of the end of the period covered by this report based on such evaluation; and |
| (c) | Disclosed in this report any change in the company’s
internal control over financial reporting that occurred during the period covered by the annual report that has materially affected,
or is reasonably likely to materially affect, the company’s internal control over financial reporting; and |
| 5. | The company’s other certifying officer(s) and I have disclosed, based on our most recent evaluation of internal control over
financial reporting, to the company’s auditors and the audit committee of the company’s board of directors (or persons performing
the equivalent functions): |
| (a) | All significant deficiencies and material weaknesses in the
design or operation of internal control over financial reporting which are reasonably likely to adversely affect the company’s
ability to record, process, summarize and report financial information; and |
| (b) | Any fraud, whether or not material, that involves management
or other employees who have a significant role in the company’s internal control over financial reporting. |
Date: April 29, 2024
| |
/s/ Humberto Nadal Del Carpio |
| |
Humberto Nadal Del Carpio |
| |
Chief Executive Officer |
Exhibit 12.2
CERTIFICATION PURSUANT TO
SECTION 302 OF THE SARBANES-OXLEY ACT OF 2002
I, Manuel Bartolome Ferreyros Peña, certify
that:
| 1. | I have reviewed this annual report on Form 20-F of Cementos Pacasmayo S.A.A.; |
| 2. | Based on my knowledge, this report does not contain any untrue statement of a material fact or omit to state a material fact necessary
to make the statements made, in light of the circumstances under which such statements were made, not misleading with respect to the period
covered by this report; |
| 3. | Based on my knowledge, the financial statements, and other financial information included in this report, fairly present in all material
respects the financial condition, results of operations and cash flows of the company as of, and for, the periods presented in this report; |
| 4. | The company’s other certifying officer(s) and I are responsible for establishing and maintaining disclosure controls and procedures
(as defined in Exchange Act Rules 13a-15(e) and 15d-15(e)) for the company and have: |
| (a) | Designed such disclosure controls and procedures, or caused
such disclosure controls and procedures to be designed under our supervision, to ensure that material information relating to the company,
including its consolidated subsidiaries, is made known to us by others within those entities, particularly during the period in which
this report is being prepared; |
| (b) | Evaluated the effectiveness of the company’s disclosure
controls and procedures and presented in this report our conclusions about the effectiveness of the disclosure controls and procedures,
as of the end of the period covered by this report based on such evaluation; and |
| (c) | Disclosed in this report any change in the company’s
internal control over financial reporting that occurred during the period covered by the annual report that has materially affected,
or is reasonably likely to materially affect, the company’s internal control over financial reporting; and |
| 5. | The company’s other certifying officer(s) and I have disclosed, based on our most recent evaluation of internal control over
financial reporting, to the company’s auditors and the audit committee of the company’s board of directors (or persons performing
the equivalent functions): |
| (a) | All significant deficiencies and material weaknesses in the
design or operation of internal control over financial reporting which are reasonably likely to adversely affect the company’s
ability to record, process, summarize and report financial information; and |
| (b) | Any fraud, whether or not material, that involves management
or other employees who have a significant role in the company’s internal control over financial reporting. |
Date: April 29, 2024
| |
/s/ Manuel Bartolome Ferreyros Peña |
| |
Manuel Bartolome Ferreyros Peña |
| |
Chief Executive Officer |
Exhibit 13.1
CERTIFICATION PURSUANT TO 18 U.S.C. SECTION
1350,
AS ADOPTED PURSUANT TO
SECTION 906 OF THE U.S. SARBANES-OXLEY ACT OF
2002
In connection with the Annual Report of Cementos
Pacasmayo S.A.A. (the “Company”) on Form 20-F for the fiscal year ended December 31, 2023, as filed with the U.S. Securities
and Exchange Commission on the date hereof (the “Report”), I, Humberto Nadal Del Carpio, Chief Executive Officer of the Company,
certify, pursuant to 18 U.S.C. Section 1350, as adopted pursuant to Section 906 of the U.S. Sarbanes-Oxley Act of 2002, that to the best
of my knowledge:
| (i) | the Report fully complies with the requirements of Section
13(a) or 15(d) of the U.S. Securities Exchange Act of 1934; and |
| (ii) | the information contained in the Report fairly presents, in
all material respects, the financial condition and results of operations of the Company. |
Date: April 29, 2024
| |
/s/ Humberto Nadal Del Carpio |
| |
Humberto Nadal Del Carpio |
| |
Chief Executive Officer |
Exhibit 13.2
CERTIFICATION PURSUANT TO 18 U.S.C. SECTION
1350,
AS ADOPTED PURSUANT TO
SECTION 906 OF THE U.S. SARBANES-OXLEY ACT OF
2002
In connection with the Annual Report of Cementos
Pacasmayo S.A.A. (the “Company”) on Form 20-F for the fiscal year ended December 31, 2023, as filed with the U.S. Securities
and Exchange Commission on the date hereof (the “Report”), I, Manuel Bartolome Ferreyros Peña, Chief Financial Officer of the
Company, certify, pursuant to 18 U.S.C. Section 1350, as adopted pursuant to Section 906 of the U.S. Sarbanes-Oxley Act of 2002, that
to the best of my knowledge:
| (i) | the Report fully complies with the requirements of Section
13(a) or 15(d) of the U.S. Securities Exchange Act of 1934; and |
| (ii) | the information contained in the Report fairly presents, in
all material respects, the financial condition and results of operations of the Company. |
Date: April 29, 2024
| |
/s/ Manuel Bartolome Ferreyros Peña |
| |
Manuel Bartolome Ferreyros Peña |
| |
Chief Executive Officer |
Exhibit
96.1
CEMENTOS
PACASMAYO S.A.A.
Technical
Report Summary (TRS)
Tembladera
Quarry
and
Pacasmayo
Cement Plant
20-F
229.601 (Item 601)
January
2024
Index
| 1. |
Executive Summary |
1 |
| |
1.1. |
Location and access |
1 |
| |
1.2. |
Climate |
1 |
| |
1.3. |
History |
1 |
| |
1.4. |
Geological environment and mineralization |
2 |
| |
1.5. |
Exploration |
3 |
| |
1.6. |
Sample preparation, analysis and security |
3 |
| |
1.7. |
Data verification |
4 |
| |
1.8. |
Mineral processing and metallurgical tests |
5 |
| |
1.9. |
Estimation of Resources and Mineral Reserves |
6 |
| |
1.10. |
Mining Methods |
6 |
| |
1.11. |
Processing Plant & Infrastructure |
7 |
| |
1.12. |
Market studies |
8 |
| |
1.13. |
Capital and operating costs & Economic Analysis |
10 |
| |
1.14. |
Adjacent properties |
13 |
| |
1.15. |
Conclusions |
14 |
| |
1.16. |
Recommendations |
16 |
| 2. |
Introduction |
17 |
| |
2.1. |
Participants |
17 |
| |
2.2. |
Terms of Reference |
17 |
| |
2.3. |
Conventions |
19 |
| |
2.4. |
Previous Work and Sources of Information |
19 |
| |
2.5. |
Details of QP Personal Inspection |
20 |
| |
2.6. |
Previously Filed Technical Report Summary |
20 |
| 3. |
Property description |
21 |
| |
3.1. |
Tembladera quarry |
21 |
| |
3.2. |
Pacasmayo Industrial Cement Plant |
23 |
| 4. |
Accesibility, climate, local Resources,
infrastructure and physiography |
25 |
| |
4.1. |
Tembladera quarry |
25 |
| |
4.2. |
Pacasmayo cement plant |
27 |
| 5. |
History |
29 |
| |
5.1. |
Tembladera quarry |
29 |
| |
5.2. |
Pacasmayo Plant |
30 |
| 6. |
Geological setting, mineralization, and
deposit |
31 |
| |
6.1. |
Regional geology |
31 |
| |
6.2. |
Local Geology |
33 |
| |
6.3. |
Characteristics of the deposit |
35 |
| 7. |
Exploration |
37 |
| |
7.1. |
Drilling |
37 |
| |
7.3. |
Geotechnical studies |
38 |
| 8. |
Sample preparation, analyses, and security |
39 |
| |
8.1. |
Geology and quarry |
39 |
| |
|
8.1.1. |
Preparation of samples, procedures, assays
and laboratories |
39 |
| |
|
8.1.2. |
Quality Assurance Actions |
40 |
| |
|
8.1.3. |
Quality Plan |
40 |
| |
|
8.1.4. |
Sample security |
41 |
| |
|
8.1.5. |
Chain of custody |
41 |
| |
|
8.1.6. |
Qualified person’s opinion on quarry
QAQC |
41 |
| |
8.2. |
Pacasmayo plant |
42 |
| |
|
8.2.1. |
Samples preparation, procedures, assays
and laboratories |
42 |
| |
|
|
8.2.1.1. |
Raw materials sample preparation |
42 |
| |
|
|
8.2.1.2. |
Analysis of Laboratory |
43 |
| |
|
8.2.2. |
Quality Assurance Actions |
43 |
| |
|
8.2.3. |
Security of the samples |
44 |
| |
|
8.2.4. |
Qualified Person’s Opinion on cement
plant QaQc |
45 |
| 9. |
Data verification |
46 |
| |
9.1. |
Geology and quarry |
46 |
| |
|
9.1.1. |
Data Verification procedure |
46 |
| |
|
9.1.2. |
Data collection |
46 |
| |
|
9.1.3. |
Management and Validation of Database |
46 |
| |
|
9.1.4. |
Tracking Data |
46 |
| |
|
9.1.5. |
Validation of Data |
47 |
| |
|
9.1.6. |
Qualified Person’s Opinion Geologic
Data |
48 |
| |
9.2. |
Pacasmayo plant |
48 |
| |
|
9.2.1. |
Data verification procedures |
48 |
| |
|
9.2.2. |
Data validation |
49 |
| |
|
9.2.3. |
Qualified Person’s Opinion on cement
plant |
49 |
| 10. |
Mineral proccessing and metallurgical testing |
50 |
| |
10.1. |
Nature of Testing Program |
50 |
| |
10.2. |
Cement Manufacturing Test Results |
51 |
| |
10.3. |
Qualified Person’s Opinion of the
Adequacy of the Test Data |
51 |
| 11. |
Mineral Resources estimates |
52 |
| |
11.1. |
Data base |
54 |
| |
11.2. |
Density |
54 |
| |
11.3. |
Compositing |
54 |
| |
11.4. |
Basic statistics of the data (Assay –
Composites) |
54 |
| |
11.5. |
Extreme values |
55 |
| |
11.6. |
Variogram Analysis |
55 |
| |
11.7. |
Interpolation |
56 |
| |
11.8. |
Resources estimation |
58 |
| |
|
11.8.1. |
Cut-off |
58 |
| |
|
11.8.2. |
Reasonable Prospects of Economic Extraction |
59 |
| |
|
11.8.3. |
Mineral Resources classification |
59 |
| |
11.9. |
Qualified Person’s Opinion |
60 |
| 12. |
Mineral Reserves estimates |
61 |
| |
12.1. |
Criteria for Mineral Reserves determination |
62 |
| |
|
12.1.1. |
Run of Mine (ROM) determination
criteria |
62 |
| |
|
12.1.2. |
Cement plant recovery |
62 |
| |
12.2. |
Reserves estimation methodology |
62 |
| |
12.3. |
Reserves estimates |
63 |
| 13. |
Mining methods |
64 |
| |
13.1. |
Mining Methods and Equipment |
64 |
| |
13.2. |
Geotechnical models |
67 |
| |
13.3. |
Hydrological models |
68 |
| |
13.4. |
Other Mine Design and Planning Parameters |
68 |
| |
13.5. |
Annual Production Rate |
68 |
| |
13.6. |
Mining Plan |
68 |
| |
13.7. |
Life of Mine |
70 |
| |
13.8. |
Staff |
70 |
| 14. |
Processing and recovery methods |
71 |
| |
14.1. |
Process plant |
71 |
| |
14.2. |
Raw materials for the cement production |
71 |
| |
14.3. |
Flow sheet |
73 |
| |
14.4. |
Main equipment |
73 |
| |
14.5. |
Material balance cement plant |
74 |
| |
|
14.5.1. |
Material balance |
74 |
| |
14.6. |
Process losses |
74 |
| |
14.7. |
Water consumption |
75 |
| |
14.8. |
Fossil fuel consumption |
75 |
| |
14.9. |
Electric power consumption |
75 |
| |
14.10. |
Maintenance Plan |
75 |
| |
14.11. |
Staff |
75 |
| 15. |
Infrastructure |
76 |
| |
15.1. |
Tembladera quarry |
76 |
| |
15.2. |
Pacasmayo plant |
76 |
| 16. |
Market Studies |
78 |
| |
16.1. |
The cement market in Peru |
78 |
| |
16.2. |
Industry and Macroeconomic Analysis |
79 |
| |
16.3. |
The North Region Market |
80 |
| |
16.4. |
Cement price |
82 |
| |
16.5. |
Current and future demand |
83 |
| 17. |
Environmental studies, permitting, and
plans, negotiations, or agreements with local individuals or groups. |
85 |
| |
17.1. |
Environmental Aspects |
85 |
| |
|
17.1.1. |
Tembladera quarry |
85 |
| |
|
17.1.2. |
Cement plant in Pacasmayo |
86 |
| |
17.2. |
Solid waste disposal |
87 |
| |
17.3. |
Qualified Person’s Opinion |
87 |
| 18. |
Capital and operations costs |
88 |
| |
18.1. |
Basis for operating and capital cost for
the quarry and plant |
88 |
| |
18.2. |
Capital and Operating Cost Estimates |
89 |
| |
18.3. |
Capital and Operating Cost Estimation Risks |
90 |
| 19. |
Economic analysis |
91 |
| |
19.1. |
Methodology: Discounted Cash flow (Free) |
91 |
| |
19.2. |
Assumptions |
91 |
| |
|
19.2.1. |
General and Macroeconomic Assumptions |
91 |
| |
|
19.2.2. |
Income and Cost Assumptions |
92 |
| |
19.3. |
Results of financial model |
92 |
| |
19.4. |
Sensitivity Analysis |
95 |
| 20. |
Adjacent properties |
97 |
| 21. |
Other relevant data and information |
98 |
| 22. |
Interpretation and conclusions |
98 |
| 23. |
Recommendations |
100 |
| 24. |
References |
101 |
| 25. |
Reliance on information provided by the
registrant. |
102 |
Index
of tables
| Table
1 |
Mineral
Resources (exclusive of Reserves) of Tembladera quarry |
6 |
| Table 2 |
Mineral Reserves of
Tembladera quarry |
6 |
| Table 3 |
Projection of demand and
price for the next 30 years |
9 |
| Table 4 |
Free Cash Flow and valuation |
12 |
| Table 5 |
Resource Categorization
(exclusive of Reserves) at the Tembladera quarry |
15 |
| Table 6 |
Mineral Reserves expressed
in millions of tonnes |
15 |
| Table 7 |
List of Cementos Pacasmayo
S.A.A. Professionals |
18 |
| Table 8 |
QP’s field visit |
20 |
| Table 9 |
Central cordinates of the
Acumulación Tembladera property |
21 |
| Table 10 |
Central coordinates
of the Pacasmayo cement plant |
23 |
| Table 11 |
Regional stratigraphic column |
31 |
| Table 12 |
Local stratigraphic column
of the Tembladera quarry |
35 |
| Table 13 |
Characteristics of the Tembladera
deposit |
35 |
| Table 14 |
Drilling campaigns in Tembladera
quarry |
37 |
| Table 15 |
Quality Plan of the Tembladera
quarry |
41 |
| Table 16 |
Tests and frequency for
each stage of the process |
43 |
| Table 17 |
Quality Plan of Pacasmayo
cement plant |
44 |
| Table 18 |
Lithologic units of the
Tembladera quarry geological model |
52 |
| Table 19 |
Pacasmayo plant material
restrictions |
53 |
| Table 20 |
Characteristics of the block
model |
53 |
| Table 21 |
Limestone Cal statistics |
55 |
| Table 22 |
Variogram modeling parameters |
56 |
| Table 23 |
Estimation Parameters Secondary
Variables |
56 |
| Table 24 |
Estimation Parameters CaO |
57 |
| Table 25 |
Resource Categorization
(exclusive of Reserves) at the Tembladera quarry |
58 |
| Table 26 |
Mineral Reserves expressed
in millions of tonnes |
63 |
| Table 27 |
Main equipment of the Tembladera
quarry |
66 |
| Table 28 |
Auxiliary equipment of the
Tembladera quarry |
66 |
| Table 29 |
Parameters of design according
to geotechnical zonification |
67 |
| Table 30 |
Reviewed Safety Factor 2021 |
67 |
| Table 31 |
Summary of Tembladera quarry
design parameters |
68 |
| Table 32 |
Mining plan for the next
years |
69 |
| Table 33 |
Main equipment in Pacasmayo
plant |
73 |
| Table 34 |
Balance for crude production |
74 |
| Table 35 |
Balance for clinker production |
74 |
| Table 36 |
Balance para producción
de cemento. |
74 |
| Table 37 |
Fuel consumption in Pacasmayo
plant |
75 |
| Table 38 |
Tembladera quarry Facilities* |
77 |
| Table 39 |
Cement shipments at domestic
level (in thousands of tonnes) |
79 |
| Table 40 |
Types of products of Pacasmayo
Cement plant |
81 |
| Table 41 |
Forecast of future demand
for Pacasmayo cement plant |
84 |
| Table 42 |
Concepts about cost structure
of Tembladera quarry and Pacasmayo plant |
88 |
| Table 43 |
Operating costs forecast
of quarry and plant |
89 |
| Table 44 |
Investment forecast in quarry
and plant |
90 |
| Table 45 |
Profit and Loss Statement |
93 |
| Table 46 |
Free Cash Flow and valuation |
94 |
| Table 47 |
Sensitivity analysis of
the Net Present Value |
95 |
| Table 48 |
Sensitivity analysis of
EBITDA |
95 |
| Table 49 |
Resource Categorization
(exclusive of Reserves) at the Tembladera quarry |
99 |
| Table 50 |
Mineral Reserves expressed
in millions of tonnes |
99 |
| Table 51 |
List of Cementos Pacasmayo
S.A.A. information. |
102 |
Index
of figures
| Figure
1 |
Tembladera
quarry mining sequence |
7 |
| Figure 2 |
Pacasmayo plant process
block diagram |
8 |
| Figure 3 |
Graph of slopes of the variables
on the Economic Value |
13 |
| Figure 4 |
Sensitivity of EBITDA |
13 |
| Figure 5 |
Acumulación Tembladera
Concession |
22 |
| Figure 6 |
Pacasmayo Industrial Plant
map |
24 |
| Figure 7 |
Geological Section of the
Tembladera quarry |
36 |
| Figure 8 |
Water level at the Tembladera
quarry |
38 |
| Figure 9 |
Tembladera quarry mining
sequence |
65 |
| Figure 10 |
Tembladera quarry
final pit |
70 |
| Figure 11 |
Pacasmayo plant process
block diagram |
73 |
| Figure 12 |
Mining Facilities |
77 |
| Figure 13 |
Segmentation of the cement
market in Peru |
78 |
| Figure 14 |
Global GDP and Construction
sector GDP MoM variation (%) |
80 |
| Figure 15 |
Historic prices of cement
in Peru |
82 |
| Figure 16 |
Evolution of the national
demand of cement |
83 |
| Figure 17 |
Sensitivity of Net Present
Value |
96 |
| Figure 18 |
Sensitivity of EBITDA |
96 |
| Figure 19 |
Concession Acumulación
Tembladera and adjacent concessions. |
97 |
Cementos
Pacasmayo S.A.A (CPSAA) is a Peruvian company, whose corporate purpose is the production of cement and other products associated with
the construction sector. This Technical Report Summary summarizes a Pre-feasibility study of the Tembladera quarry located in the Cajamarca
Region and the cement plant located in La Libertad Regional, both owned by CPSAA. Cementos Pacasmayo’s qualified persons prepared
this Report to support disclosure of limestone Resources and Reserves.
The
Tembladera quarry contains limestone, which is the main raw material for cement production. This quarry is located in the Yonan district
of Contumaza province in Cajamarca Region. There is an access road to this quarry from Lima to Trujillo. The Cementos Pacasmayo plant
is located at Kilometer 666 of the Panamericana Norte highway in the district and province of Pacasamayo in the region of La Libertad.
The cement manufacturing plant is located 60 kilometers away from the Tembladera Quarry and 120 kilometers from the city of Trujillo.
The
quarry is in the semi-arid climate of the region of the Andean lower level of northern Peru. Precipitation ranges from minimum values
of 0 mm from June to September, to a maximum value of 26.3 mm in March. Temperatures throughout the year vary between 20°C from July
to August, and 25°C in March. The maximum temperature is 27°C on average, but it can go up to 29°C (January - April). Minimum
temperatures are around 15-17°C (July - September).
In
the cement plant in Pacasmayo, the annual average temperature varies between 16.5 and 25.0°C. The monthly average temperature varies
between 19 and 25°C. The annual relative humidity averages 85%.
Tembladera
quarry is a limestone deposit, which is used to produce different types of cement for construction. The deposit is owned by Cementos
Pacasmayo S.A.A.
In
2002, the National Institute of Cadastre and Mining Claims gave to Cementos Pacasmayo S.A.A., the title of non-metallic concession called
“Acumulación Tembladera”, which goes back in time to the date of the oldest claim “North N° 1” granted
by the Mining Regional Office of Cajamarca by Ministerial Resolution N° 267, dated June 30, 1950, in favor of Cementos Portland del
Norte S.A., starting operations as Cementos Pacasmayo S.A.A. from 1957 to 2013.
The
Calizas del Norte S.A.C. company (CALNOR) operated the mine from January 2014 to May 2016. The Tembladera quarry did not operate from
June to September 2016. Afterwards, Cementos Pacasmayo hired San Martin Contratistas Generales S.A. to operte the mine, wich they have
done since October 2016.
CPSAA
conducted a major exploration project in Marcy 2007, which consisted of a drilling campaign. MINTEC, a consulting company, was hired
to create the 3D model of the deposit and estimate Mineral Resources.
In
2019, another campaign of eight diamond drill holes was carried out, to confirm the Mineral Resources and the Reserves in the eastern
part of the deposit. Interpretation of the information obtained was used to prepare a new geological model. Cementos Pacasmayo oversaw
the interpretation.
In
December 2022, Cementos Pacasmayo started a diamond drilling campaign of eight (8) drill holes to confirm Mineral Resources and Reserves.
Drilling activities continue during the first month of 2023.
| 1.4. | Geological
environment and mineralization |
The
deposit is contained within the so-called Cajamarca Formation, which belongs to the Upper Cretaceous (Turonian floor, around 90 MA).
This formation overlies the Quilquiñan Group and underlies the Celendín Formation.
Sedimentary
rocks corresponding to the Cajamarca Formation and the Upper Cretaceous Celendín Formation outcrop in the area.
On
the other hand, the Cajamarca Formation is composed of thin limestones, well stratified, in strata of thin layers, with a coloration
that goes from dark to light gray. It has a thickness of 230 meters.
Exploration
activities at the Tembladera quarry were carried out in 2007 and 2019. The first diamond drilling campaign, in 2007, drilled 31 drill
holes. In 2007, DCR Ingenieros S.R. Ltd determined the geotechnical guidelines of the Tembladera quarry and grouped them into seven (7)
geotechnical zones. In 2019, the second diamond drilling campaign was carried out with eight (8) drill holes. In the same year, Walsh
Peru S.A. carried out a hydrogeological study of the Tembladera quarry.
During
2021, Cementos Pacasmayo update of Hydrogeological studies in the Tembladera quarry was made; however, the works were office work. Likewise,
the update of geotechnical studies on the stability of the pit slope and the waste disposal in the quarry. Those works involved sample
collection and sample analysis to determine the rock strength, density, and other properties.
From
December 2022 to early 2023, Cementos Pacasmayo drilled eight (8) more holes at the Tembladera quarry in order to confirm the Mineral
Reserves.
| 1.6. | Sample
preparation, analysis and security |
Cementos
Pacasmayo has implemented procedures for sample preparation, tests and security of the information on its operations. The cement plants
and operations have been complying with ISO 9001 standards since 2015. The certification under this standard is renewed annually by means
of an external audit.
With
respect to the geology, CPSAA uses the XRF technique and other analytical methods to analyze the main chemical components in the limestone.
In the cement plant, the raw materials for the production of clinker and cement are analyzed using methods specified in the A.S.T.M.
and Peruvian Technical Standards for cement testing. The laboratory in the cement plant has properly calibrated equipment and a periodic
maintenance plan.
At
the Pacasmayo plant, the sampling and data verification plan applies to the processes of receiving raw materials, crushing of raw materials,
coal grinding, crude grinding, clinkerization and cement grinding. Additionally, it is applied to the lime production, lime grinding
and lime dispatch.
Cementos
Pacasmayo S.A.A. had implemented quality assurance, quality control (QAQC) protocols for the development of the exploration and production
activities in the Tembladera quarry and in the Pacasmayo plant to ensure the quality of the information that is used in the estimation
of Mineral Resources and Reserves.
Concerning
geological activities, CPSAA has a data verification unit for the geological database. This unit has as its main function, the verification
of data to be used in the estimation of Mineral Resources and Reserves. For the appropriate administration of information, internal protocols
have been implemented that are subject to internal audits. The stages within the verification activities for the geologic data are the
data collection, the administration and validation of data received from internal and external laboratories, data tracking through the
confirmation of custody chains and finally, validation of data in the database that will allow the development of the Mineral Resources
and Reserves model.
The
qualified persons followed the defined processes for information flows to support Mineral Resource and Reserve estimation. The qualified
person followed the same process as a means of verifying and validating the geologic data. They found that the validated information
is congruent in the interpretations of the same, with which the fundamental base geological models were generated for the estimation
of the Mineral Resources.
No
findings have been found that could invalidate the estimation of the Resources and Reserves of the deposit.
For
data verification activities at the cement plant, the Plan, Do, Check and Act (PDCA) methodology is used. This is applied to the technical
information received from the company’s internal and external customers. The quality control laboratory compares the
results with national and international laboratories as part of the verification procedures.
In
the author’s opinion, the methodologies used for collecting and processing data at the cement plant are accurate and free of important
errors. The information can be used within the models’ construction and estimates for cement production. Considering that the analyses
of the main chemical components and physical properties of the raw materials and final products are made in external laboratories, the
quality of the information is adequate for preparing mineral Resource and Reserve Estimates.
| 1.8. | Mineral
processing and metallurgical tests |
Cementos
Pacasmayo has procedures for the development of products at the laboratory level and its scaling at the industrial level, as well as
its own procedures for the preparation, review, issuance and control of laboratory test reports. Cementos Pacasmayo has a research and
development laboratory located in the Pacasmayo plant to evaluate technical aspects of cement plant and quarry operations.
To
have a representative sample of its raw materials and cement at the Pacasmayo plant, Cementos Pacasmayo performs the analysis of its
samples in its internal Research and Development Laboratory located at the plant.
A
significant percentage of Research and Development activities are focused on evaluating different ratios between clinker-mineral additions
providing the best functional characteristics to our products and at the same time balancing the benefits generated for the company.
Another objective is to identify other additions that can substitute for clinker: slag, pozzolana, fly ash, calcined clays, etc., to
reduce its environmental footprint and the cost of cement production. Based on this work, the laboratory has determined (and confirmed
with production estimates) that 1 tonne of limestone yields 0.74 tonnes of clinker and the clinker/cement factor of the main cements
with additions is 0.72.
The
Research Laboratory issues technical reports following the criteria of international standards to the operations area which evaluates
the convenience of industrial implementation of the tests and validating what is reported at the laboratory level.
| 1.9. | Estimation
of Resources and Mineral Reserves |
Qualified
person (QP) has estimated limestone Resources and Reserves for this property. For the evaluation, the information from exploration activities
from previous years has been used, and is the database for the Resources and Reserves model.
The
limestone Resources are presented in Table 1. The Resource estimation considered the quality restrictions of limestone received in Pacasmayo
cement plant, limits of the concessions, accessibility to the Resources and legal restrictions of the mining concessions, economic factors
and modifying factors.
The
minimum quality accepted is 48.6% CaO to be used as raw material for production and considering the sale prices of cement at the Pacasmayo
plant, the economic evaluation used for Reserve evaluation is shown in Chapter 19 and considers the same criteria used for the estimation
of Reserves.
Table
1 Mineral Resources (exclusive of Reserves) of Tembladera quarry
| |
Resources |
Tonnes
M |
CaO
(%) |
MgO
(%) |
Al2O3
(%) |
SiO2
(%) |
SO3
(%) |
| Limestone |
Measured |
122.6 |
49.33 |
1.83 |
1.82 |
4.76 |
0.31 |
| Indicated |
34.5 |
50.32 |
1.68 |
1.44 |
3.85 |
0.20 |
| Measured + Indicated |
157.1 |
49.55 |
1.80 |
1.74 |
4.56 |
0.29 |
| Inferred |
75.9 |
50.33 |
1.62 |
1.45 |
3.93 |
0.31 |
For
Reserve estimation, the Resources and the quality criteria, modifying factors and limestone production costs were considered. The mining
method used is open pit. The economic results are shown in Chapter 19.
Table
2 Mineral Reserves of Tembladera quarry
| |
Reserves |
Tonnes
M |
CaO
(%) |
MgO
(%) |
Al2O3
(%) |
SiO2
(%) |
SO3
(%) |
| Limestone |
Proven |
65.5 |
49.66 |
1.52 |
1.54 |
4.60 |
0.37 |
| Probable |
12.3 |
49.63 |
1.57 |
1.56 |
4.91 |
0.28 |
| Total |
77.8 |
49.65 |
1.53 |
1.54 |
4.65 |
0.36 |
Cementos
Pacasmayo S.A.A. is the current owner of the Tembladera quarry, which has outsourced its production to a specialized contractor. The
limestone mining at the Tembladera quarry includes drilling, blasting, loading, hauling, and crushing.
Figure
1 Tembladera quarry mining sequence
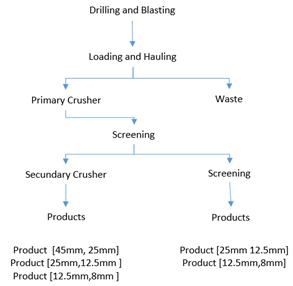
The
major equipment used for the production of limestone in the Tembladera quarry is a track drill, primary crusher, secondary crusher,
excavator, tractor, front loader, and dump truck. Also, auxiliary equipment is necessary, like pickups, lubricator trucks,
ambulance, and other equipment.
The
mining plan of the Tembladera quarry considers an average annual production of 2.6 million tonnes of limestone for the next 30 years
and a stripping rate of 0.17.
Based
on the plant requirements and sales projection for the next 30 years, the pit design parameters for the Tembladera quarry are inter-ramp
slope angle, bench slope, bench height, safety bench, width of ramps,
safety berm height and ramp gradient.
| 1.11. | Processing
Plant & Infrastructure |
Cement
production considers the stages of raw material extraction, grinding and homogenization, clinkerization, cement grinding, silo storage
and packaging, loading and transportation. Cement is moved through conveyor belts to packing systems to be packed in bags and then loaded
onto trucks operated by third parties for distribution.
Figure
2 Pacasmayo plant process block diagram
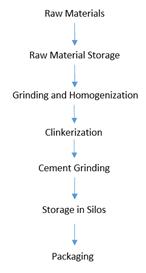
The
raw materials and additions are considered for cement production at Pacasmayo plant. The raw materials for cement production are limestone,
sand, iron, clay and coal. The mixture of these raw materials is crude which is fed to the calcination kiln to produce clinker. The limestone
represents 86.18% by weight of the raw material.
Clinker
and additional materials are used to produce cement. The additions used in cement production are slag, pozzolana, gypsum and limestone.
Currently, the cement plant in Pacasmayo has a Clinker/Cement factor of 0.72.
The
Pacasmayo plant has an electrical substation with a capacity of 105 MVA, the electric power is supplied from the national grid.
Cementos
Pacasmayo has implemented a preventive and corrective maintenance plan to keep cement production uninterrupted.
Cementos
Pacasmayo maintains operational efficiency to control costs and operating margins, and makes efforts to diversify energy sources and
ensure supply when possible.
The
Peruvian Cement Market is geographically segmented by regions: northern, central and southern region and every region is served by different
companies, most of which are cement producers.
The
main companies that supply the cement market in Peru are Cementos Pacasmayo S.A.A., UNACEM, Cemento Yura, Cementos Selva S.A.C. There
are also companies that import cement or clinker, such as Cemento Inka, Cemento Nacional, and Cemex, among others.
The
companies that commercialized cement in Peru follow the Peruvian Technical Standards associated with - technical specifications for cement.
Portland
Cement is subdivided into Type I and Type V. Portland Cement is subdivided into Type ICO, Type IL, Type 1P and Type 1 (PM); and finally,
Hydraulic Cements specified by performance are Type GU, Type MS (MH), Type HS, Type HE, Type MH and Type LH.
Cementos
Pacasmayo, being the leading company in the production and sale of cement in the Northern Region, has a market share in the following
cities: Cajamarca, Chiclayo, Chimbote, Jaén, Pacasmayo, Piura, Rioja, Tarapoto, Trujillo, Tumbes, Yurimaguas and Iquitos. Cementos
Pacasmayo also has a Market Share above 93.8% in the northern region of the country.
Annual
cement shipments at the national scale for the year 2023 reached a total of 12.2 million tonnes, while total cement shipments at the
Pacasmayo plant for 2023 were 1,634.8 thousand tonnes. Pacasmayo plant meets almost 52.2% of the cement demand in the Northern Region
of the country and its cement shipments represent 55.7% of the three cement plant’s overall shipments.
Table
3 shows the projected demand and price per ton of cement for the next 30 years.
Table
3 Projection of demand and price for the next 30 years
| | |
Shipments (tonnes) | | |
Revenue
S/ x t | |
| 2024P | |
| 1,860,241 | | |
| 447.9 | |
| 2025P | |
| 2,262,148 | | |
| 421.5 | |
| 2026P | |
| 2,307,390 | | |
| 432.6 | |
| 2027P | |
| 2,069,164 | | |
| 444.1 | |
| 2028P | |
| 2,069,164 | | |
| 455.9 | |
| 2029P | |
| 2,069,164 | | |
| 467.9 | |
| 2030P | |
| 2,069,164 | | |
| 480.3 | |
| 2031P | |
| 2,069,164 | | |
| 493.1 | |
| 2032P | |
| 2,182,171 | | |
| 506.1 | |
| 2033P | |
| 2,257,814 | | |
| 519.5 | |
| 2034P | |
| 2,334,970 | | |
| 533.3 | |
| 2035P | |
| 2,413,670 | | |
| 547.4 | |
| 2036P | |
| 2,493,943 | | |
| 562.0 | |
| 2037P | |
| 2,575,822 | | |
| 576.8 | |
| 2038P | |
| 2,659,338 | | |
| 592.1 | |
| 2039P | |
| 2,744,525 | | |
| 607.8 | |
| 2040P | |
| 2,831,416 | | |
| 623.9 | |
| 2041P | |
| 2,920,044 | | |
| 640.5 | |
| 2042P | |
| 3,005,252 | | |
| 657.4 | |
| 2043P | |
| 3,034,110 | | |
| 674.9 | |
| 2044P | |
| 3,060,320 | | |
| 692.7 | |
| 2045P | |
| 3,060,320 | | |
| 711.1 | |
| 2046P | |
| 3,060,320 | | |
| 729.9 | |
| 2047P | |
| 3,060,320 | | |
| 749.3 | |
| 2048P | |
| 3,060,320 | | |
| 769.1 | |
| 2049P | |
| 3,060,320 | | |
| 789.5 | |
| 2050P | |
| 3,060,320 | | |
| 810.4 | |
| 2051P | |
| 3,060,320 | | |
| 831.9 | |
| 2052P | |
| 3,060,320 | | |
| 854.0 | |
| 2053P | |
| 3,060,320 | | |
| 876.6 | |
| 1.13. | Capital
and operating costs & Economic Analysis |
This
document presents the cash flow analysis and an economic evaluation of the project based on the current operating costs of the cement
plant in Pacasmayo and using information from the Tembladera quarry for limestone production.
For
the Reserves evaluation, the general and macroeconomic assumptions used for the projection of the free/economic cash flows and for the
valuation are:
| - | Projection
horizon: 30 years (2024 to 2053) according to the estimated years of quarry life. |
| - | Annual
inflation rate, 2.90%, based on based on The International Monetary Fund as of October 2023:
applies equally to sales price, costs, and expenses. |
| - | Capital
cost projections were determined using a historical ratio of annual investments and maintenance
costs which also considers the increase in production volume. |
| - | The
company’s capital structure is being considered in the discount rate (WACC) of 11.56%. |
| - | Income
tax rate: effective rate of actual (historical) business results, 29% - 30%. |
| - | Workers’
Profit Sharing: 10%. |
| - | Exchange
rate: exchange rate is assumed to remain at 3.80 (USD/PEN). |
The
economic analysis uses the economic assumptions listed in Chapter 19. The main variables considered in the economic model for the sensitivity
analysis were cement price, production cost and CapEx.
For
the economic analysis of Reserves, the free cash flow is constructed, which does not incorporate the financing structure, since the latter
is considered in the weighted average cost of capital of the company (WACC) for discounting future cash flows. The following financial
parameters were calculated:
| ● | Average
plant throughput for cement production: 2.6 million tonnes per year over the 30-year projection. |
| ● | Average
sales price: 616.7 Soles per ton of cement, an average of the 30-year projection, at nominal
values. |
| ● | Revenues:
1,620 million Soles, an average of the 30-year projection. |
| ● | Average
cash production cost: 409.3 Soles per ton of cement, an average of the 30-year projection,
at nominal values. |
The
cash flow of the project is presented in Table 4 below. The NPV at a discount rate of 11.56% is 1,514 million Soles.
Table
4 Free Cash Flow and valuation
| | |
FCF - Valuation (Thousand S/) | |
| | |
(-) Taxes (EBIT*t) | | |
(-) CapEx | | |
EBITDA Planta Pacasmayo | | |
Free Cash Flow | |
| | |
| | |
| | |
| | |
| |
| 2023P | |
| -74,978 | | |
| -27,225 | | |
| 243,201 | | |
| 140,999 | |
| 2024P | |
| -69,471 | | |
| -28,015 | | |
| 229,018 | | |
| 131,532 | |
| 2025P | |
| -74,699 | | |
| -28,827 | | |
| 244,165 | | |
| 140,639 | |
| 2026P | |
| -69,090 | | |
| -29,663 | | |
| 218,964 | | |
| 120,212 | |
| 2027P | |
| -68,282 | | |
| -30,523 | | |
| 214,075 | | |
| 115,270 | |
| 2028P | |
| -74,465 | | |
| -31,408 | | |
| 227,865 | | |
| 121,992 | |
| 2029P | |
| -77,984 | | |
| -32,319 | | |
| 234,531 | | |
| 124,228 | |
| 2030P | |
| -77,571 | | |
| -33,256 | | |
| 230,120 | | |
| 119,293 | |
| 2031P | |
| -86,839 | | |
| -34,221 | | |
| 258,134 | | |
| 137,074 | |
| 2032P | |
| -93,373 | | |
| -35,213 | | |
| 277,424 | | |
| 148,837 | |
| 2033P | |
| -96,821 | | |
| -36,234 | | |
| 286,264 | | |
| 153,209 | |
| 2034P | |
| -107,379 | | |
| -37,285 | | |
| 314,738 | | |
| 170,074 | |
| 2035P | |
| -115,420 | | |
| -38,367 | | |
| 336,806 | | |
| 183,019 | |
| 2036P | |
| -119,607 | | |
| -39,479 | | |
| 348,546 | | |
| 189,460 | |
| 2037P | |
| -130,917 | | |
| -40,624 | | |
| 380,042 | | |
| 208,500 | |
| 2038P | |
| -139,812 | | |
| -41,802 | | |
| 405,251 | | |
| 223,637 | |
| 2039P | |
| -145,054 | | |
| -43,014 | | |
| 420,260 | | |
| 232,191 | |
| 2040P | |
| -157,272 | | |
| -44,262 | | |
| 455,154 | | |
| 253,620 | |
| 2041P | |
| -166,837 | | |
| -45,545 | | |
| 482,918 | | |
| 270,535 | |
| 2042P | |
| -169,060 | | |
| -46,866 | | |
| 489,374 | | |
| 273,447 | |
| 2043P | |
| -178,021 | | |
| -48,225 | | |
| 514,484 | | |
| 288,238 | |
| 2044P | |
| -182,772 | | |
| -49,624 | | |
| 527,426 | | |
| 295,030 | |
| 2045P | |
| -183,761 | | |
| -51,063 | | |
| 529,282 | | |
| 294,457 | |
| 2046P | |
| -191,300 | | |
| -52,544 | | |
| 550,074 | | |
| 306,230 | |
| 2047P | |
| -196,592 | | |
| -54,068 | | |
| 563,792 | | |
| 313,132 | |
| 2048P | |
| -197,111 | | |
| -55,636 | | |
| 565,322 | | |
| 312,575 | |
| 2049P | |
| -204,688 | | |
| -57,249 | | |
| 586,751 | | |
| 324,814 | |
| 2050P | |
| -209,890 | | |
| -58,909 | | |
| 601,888 | | |
| 333,089 | |
| 2051P | |
| -211,356 | | |
| -60,618 | | |
| 606,018 | | |
| 334,044 | |
| 2052P | |
| -219,278 | | |
| -62,375 | | |
| 628,477 | | |
| 346,823 | |
| WACC | |
| 11.56 | % |
| Economic NPV (Thousand S/) | |
| 1,513,634 | |
Sensitivity
analysis was also made to show the influence of changes in prices, OpEx and CapEx on NPV.
Figure
3 Graph of slopes of the variables on the Economic Value

Figure
4 Sensitivity of EBITDA

The
Acumulación Tembladera property shares borders with private properties. No mining activities are being performed on these
properties. The mining concession (EAGLE 1) overlaps with the Acumulación Tembladera property by 46.43 hectares; however,
Cementos Pacasmayo owns the surface property; consequently, this concession does not restrict the Cementos Pacasmayo’s activities in
the current exploitation
areas. Eagle 1 does not interfere with Cementos Pacasmayo S.A.A.’s operations, Resources or Reserve estimates. Also Julissa A concession
does not interfere with the area of the mining rights in the Cementos Pacasmayo S.A.A. concession.
| ● | From
a legal point of view, Cementos Pacasmayo S.A.A. has the ownership of the mining properties
for the exploration, development and production of limestone to supply the cement plants
for normal production during the life of the quarry. |
| ● | Cementos
Pacasmayo S.A.A. has been complying with international ISO-9001 (Quality) standards since
2015 and has implemented Quality Assurance and Quality Control (QaQc). The controls are applied
for the construction of the Geological Model, Resource Estimation and Reserves Estimation. |
| ● | Cementos
Pacasmayo S.A.A. has a quality assurance system in its operations that includes sample preparation
methods, procedures, analysis and safety of results which comply with the best practices
in the industry. |
| ● | The
information verification and validation processes are carried out following the procedures
indicated in the information flows. The validated information is congruent with the one that
generated the geological models, which are the fundamental basis for the estimation of Resources. |
| ● | The
geological modeling of the limestone deposit is consistent with the relationship between
the information and the geological model. |
| ● | The
Reserves estimations consider the geologic and modifying factors as well as risks. The quality
variable is the CaO content, which is very stable in the deposit, also there are along with
other secondary variables that determine the quality of the Reserves. |
| ● | In
the process of calculating Mineral Reserves and in the production plans of the quarry, these
variables have been adequately considered in the mining plan,
properly sequenced and with blending processes. There are sufficient proven and probable Mineral Reserves for the next 30 years. |
| ● | Table
5 shows the Mineral Resources of the Tembladera quarry. Likewise, the Mineral Reserves are
shown in Table 6. |
Table
5 Resource Categorization (exclusive of Reserves) at the Tembladera quarry
| |
Resources |
Tonnes
M |
CaO
(%) |
MgO
(%) |
Al2O3
(%) |
SiO2
(%) |
SO3
(%) |
| Limestone |
Measured |
122.6 |
49.33 |
1.83 |
1.82 |
4.76 |
0.31 |
| Indicated |
34.5 |
50.32 |
1.68 |
1.44 |
3.85 |
0.20 |
| Measured + Indicated |
157.1 |
49.55 |
1.80 |
1.74 |
4.56 |
0.29 |
| Inferred |
75.9 |
50.33 |
1.62 |
1.45 |
3.93 |
0.31 |
Table
6 Mineral Reserves expressed in millions of tonnes
| |
Reserves |
Tonnes
M |
CaO
(%) |
MgO
(%) |
Al2O3
(%) |
SiO2
(%) |
SO3
(%)
|
| Limestone |
Proven |
65.5 |
49.66 |
1.52 |
1.54 |
4.60 |
0.37 |
| Probable |
12.3 |
49.63 |
1.57 |
1.56 |
4.91 |
0.28 |
| Total |
77.8 |
49.65 |
1.53 |
1.54 |
4.65 |
0.36 |
| ● | The
cement plant located in Pacasmayo has equipment and facilities available for cement production
using limestone from the Tembladera quarry and other necessary materials. |
| ● | The
Health, Safety and Environment department is in charge of supervising compliance with the
Company’s corporate policies and the various legal requirements of the national regulatory
bodies by all company áreas. |
| ● | Through
its Social Responsibility area, Cementos Pacasmayo S.A.A. has generated relationships of
trust with the communities surrounding its operations, which have a solid relationship with
our communities, identifying their primary needs in health, education, urban development,
and local development. |
| ● | The
operation in Tembladera quarry and Pacasmayo plant, with regards to infrastructure, is technically
and economically feasible due to the life of the quarry. |
| ● | The
sensitivity analysis shows that the operation is economically robust. |
| ● | Maintain
the QAQC program for exploration, development and production activities associated with cement
production. |
| ● | It
is recommended to perform the technical interpretation of the data generated during the 2022
diamond drilling campaign, so that they can be incorporated into the resource and reserves
model, which will provide greater support and robustness to these models. |
| ● | Complement
the geotechnical monitoring of the quarry components with the implementation of the Geotechnical
Monitoring Plan, which consists of the installation of slope displacement control landmark. |
| ● | Perform
density tests for limestone in the next studies at the Tembladera quarry. |
| ● | For
future diamond drilling campaigns, evaluate the rock density for each limestone horizon. |
This
Technical Summary Report (TRS) was prepared for Cementos Pacasmayo by qualified persons (QPs) who work for Cementos Pacasmayo, who according
to their qualifications and experience developed the chapters based on their expertise. Likewise, the aforementioned QPs used the Company’s
information sources, information validated and approved by the competent authorities in Peru and public information sources. Table 7
indicates the qualified persons who prepared this document as well as the chapters and information under their responsibility.
Marco
Carrasco, who holds the position of Project Manager of Cementos Pacasmayo and is certified by the Mining and Metallurgical Society of
America (MMSA) of the United States as a QP, served as the supervising QP. He acted as Project Manager, whose primary role was to compile
the information received from the QPs of each chapter to have an integrated document. Each QP is responsible for the section they wrote.
This
technical report summary was prepared as an exhibit to support disclosure of Mineral Resources and Reserves by Cementos Pacasmayo. This
report summarizes the results of the Prefeasibility study of the “Acumulación Tembladera” property for the production
of limestone using open pit mining methods. The report is effective December 31, 2023.
The
limestone extracted from the Acumulación Tembladera property supplies raw material for the Pacasmayo plant where cement is produced.
The annual cement production is 2.6 million tonnes per year (Mtpy). Actual operating costs have been considered for the estimates and
used as a basis for economic projections within the economic analysis. This technical report summary estimates Mineral Resources and
Reserves according to the regulations published in Securities Exchange Commission (SEC) Form 20-F and under subpart 1300 of Regulation
S-K.
The
report was prepared by the qualified persons listed in Table 7 using available studies and, in some cases (see Chapter 25), relying on
information provided by Cementos Pacasmayo, the registrant.
Table
7 List of Cementos Pacasmayo S.A.A. Professionals
| Item |
|
Chapter |
|
First and Last Names |
|
Job Position |
|
Profession |
| 0 |
|
Compiled all |
|
Marco Carrasco (*) |
|
Project Manager |
|
Chemical Engineer |
| 1 |
|
Executive summary |
|
All QPs (**) |
|
|
|
|
| 2 |
|
Introduction |
|
All QPs (**) |
|
|
|
|
| 3 |
|
Property description |
|
Henry Vargas (***) |
|
Environmental Coordinator |
|
Environmental Engineer |
| 4 |
|
Accessibility, climate, local Resources, infrastructure and physiography |
|
Henry Vargas (***) |
|
Environmental Coordinator |
|
Environmental Engineer |
| 5 |
|
History |
|
Jorge Vega |
|
Mining Projects Superintendent |
|
Mining Engineer |
| 5 |
|
History |
|
Jhonson Rodríguez |
|
Senior Geologist |
|
Geological Engineer |
| 6 |
|
Geological setting, mineralization, and deposit |
|
Jhonson Rodríguez |
|
Senior Geologist |
|
Geological Engineer |
| 7 |
|
Exploration |
|
Jhonson Rodríguez |
|
Senior Geologist |
|
Geological Engineer |
| 8 |
|
Sample preparation, analyses, and security |
|
Jhonson Rodríguez |
|
Senior Geologist |
|
Geological Engineer |
| 8 |
|
Sample preparation, analyses, and security |
|
Dennis Rodas |
|
Quality Control Superintendent |
|
Chemical Engineer |
| 9 |
|
Data verification |
|
Jhonson Rodríguez |
|
Senior Geologist |
|
Geological Engineer |
| 9 |
|
Data verification |
|
Dennis Rodas |
|
Quality Control Superintendent |
|
Chemical Engineer |
| 10 |
|
Mineral processing and metallurgical testing |
|
Dennis Rodas |
|
Quality Control Superintendent |
|
Chemical Engineer |
| 11 |
|
Mineral resource estimates |
|
Jason Gamio (****) |
|
Chief of Planning and Evaluation of Resources and Reserves |
|
Geological Engineer |
| 12 |
|
Mineral reserve estimates |
|
Jason Gamio (****) |
|
Chief of Planning and Evaluation of Resources and Reserves |
|
Geological Engineer |
| 13 |
|
Mining methods |
|
Jorge Vega |
|
Mining Projects Superintendent |
|
Mining Engineer |
| 14 |
|
Processing and recovery methods |
|
Dennis Rodas |
|
Quality Control Superintendent |
|
Chemical Engineer |
| 15 |
|
Infrastructure |
|
Jorge Vega |
|
Mining Projects Superintendent |
|
Mining Engineering |
| 16 |
|
Market studies |
|
Jason Gamio (****) |
|
Chief of Planning and Evaluation of Resources and Reserves |
|
Geological Engineer |
| 17 |
|
Environmental studies, permitting, and plans, negotiations, or agreements with local individuals or groups |
|
Henry Vargas (***) |
|
Environmental Coordinator |
|
Environmental Engineer |
| 18 |
|
Capital and operating costs |
|
Jason Gamio (****) |
|
Chief of Planning and Evaluation of Resources and Reserves |
|
Geological Engineer |
| 19 |
|
Economic analysis |
|
Jason Gamio (****) |
|
Chief of Planning and Evaluation of Resources and Reserves |
|
Geological Engineer |
| 20 |
|
Adjacent properties |
|
Henry Vargas (***) |
|
Environmental Coordinator |
|
Environmental Engineer |
| 21 |
|
Other relevant data and information |
|
All QPs (**) |
|
|
|
|
| 22 |
|
Interpretation and conclusions |
|
All QPs (**) |
|
|
|
|
| 23 |
|
Recommendations |
|
All QPs (**) |
|
|
|
|
| 24 |
|
References |
|
All QPs (**) |
|
|
|
|
| 25 |
|
Reliance on information provided by the registrant |
|
All QPs (**) |
|
|
|
|
| (*) | Marco
Carrasco, who holds the position of Project Manager of Cementos Pacasmayo compiled the information received from the QPs of each chapter
to have an integrated report. Each QP is responsible for the section they wrote. |
| (**) | Henry
Vargas, Jorge Vega, Jhonson Rodríguez, Dennis Rodas and Jason Gamio |
| (***) | Henry
Vargas joined Cementos Pacasmayo as Environmental Coordinator in December 2022. |
| (****) | Jason
Gamio assumed new responsibilities as Chief of Planning and Evaluation of Resources and Reserves in April 2023. |
Unless
otherwise indicated in the report, all currencies are in soles and all measurements and units are in the metric system. The Tembladera
Accumulation property is represented by Universal Transverse Mercator (UTM) coordinates. All coordinates referenced in this report and
in the accompanying figures, tables, maps and sections are provided in the WGS84 coordinate system, UTM 17S zone, unless otherwise indicated.
| 2.4. | Previous
Work and Sources of Information |
The
information used is sufficient to allow this TRS to be completed with the level of detail required by Regulation S-K subpart 1300. The
information used included exploration results from the various drilling campaigns, actual information from Cementos Pacasmayo’s operations,
information submitted to and approved by the corresponding authorities and public information in organizations specialized in the cement
industry. The list of sources of information is presented in Chapter 24 of this report.
| 2.5. | Details
of QP Personal Inspection |
The
QPs who developed this document visited the Tembladera quarry and Pacasmayo plant as part of their activities for 2023.
Table
8 QP’s field visit
| Item |
First and Last Names |
Job Position |
Profession |
Field visit |
| 1 |
Henry Vargas |
Environmental Coordinator |
Environmental Engineer |
Mr. Vargas has visited the Tembladera quarry and Pacasmayo plant multiple times. The last visit to the Tembladera quarry and Pacasmayo Plant was in September 2023. During this visit, Mr. Vargas inspected the environmental monitoring points, solid waste areas, raw material warehouse, and the administrative area of the Pacasmayo plant and Tembladera quarry to verify the environmental controls. |
| 2 |
Jorge Vega |
Mining Projects Superintendent |
Mining Engineer |
Mr. Vega has visited the Tembladera quarry on a regular basis, most recently on November 2023. During the most recent site visit, Mr. Vega inspected the production zones, the quarry design parameters
and the equipment’s condition. |
| 3 |
Dennis Rodas |
Quality Control Superintendent |
Chemical Engineer |
Pacasmayo plant, all year as part of his duties in the quality control department. |
| 4 |
Jason Gamio |
Chief of Planning and Evaluation of Resources and Reserves |
Geological Engineer |
Mr. Gamio has visited the Tembladera quarry and Pacasmayo plant regularly. The last visit to the Tembladera quarry and Pacasmayo plant was in July 2023, visiting core facilities, discussing grade control, geological mapping, exploration, and delineation drill practices, diamond drill core logging, quality assurance, and quality control (QA/QC), raw material storage and mineral reserve estimation practices. |
| 5 |
Jhonson Rodríguez |
Senior Geologist |
Geological Engineer |
Mr. Rodríguez has regularly visited the Tembladera quarry and Pacasmayo plant, most recently in October 2022. He visited core facilities and discussed grade control, geological mapping, exploration and delineation drill practices, diamond drill core logging, quality assurance, quality control (QA/QC), and laboratories. During 2023, he coordinated with operational staff about the items above. |
| 6 |
Marco Carrasco |
Project Manager |
Chemical Engineer |
From September to December 2023, Mr. Carrasco visited the Pacasmayo plant multiple times. His last visit to the Tembladera quarry was in 2022, but during 2023, he coordinated remotely with operational staff. His visit emphasized the operational cement process and equipment conditions (kilns, mills, storages (raw material and sub-products and products, etc.). |
| 2.6. | Previously
Filed Technical Report Summary |
This
Technical Report Summary (TRS) updates the previously filed technical report summary for the property. The previously filed TRS is
the “Technical Report Summary (TRS), Tembladera Quarry and Pacasmayo Cement Plant 20-F 229.601”, which was filed
as Exhibit 96.1 of the CPSAA’s Annual Report on Form 20-F filed with the SEC on April 28, 2022 (File No. 001-35401).
We
refer to the non-metallic mining concession called Acumulación Tembladera. The mentioned mining property is located in the area
of Tembladera, in the district of Yonan, province of Contumaza, Cajamarca region.
The
quarry is located 60 km from the Pacasmayo district, Pacasmayo province, La Libertad region, where the cement plant is located. Consider
the UTM coordinate of the center of the circle of the Acumulación Tembladera as follows:
Table
9 Central cordinates of the Acumulación Tembladera property
| North | | |
East | | |
Radius | | |
Zone | |
| | 706744.79 | | |
| 9198636.74 | | |
| 5,000.00 | | |
| 17 | |
The
area of the property is 3,390.97 hectares and is shown in Figure 5. The mining rights (the mining concession title) are granted by INGEMMET
(Geological Mining and Metallurgic Institute) of the Energy and Quarries Sector by means of a Presidential Resolution. In the particular
case of the Acumulación Tembladera, the Director’s Resolution N° 01989-2002-INACC/J the State Organization that granted
that title was the National Institute of Concessions and Mining Cadastre (Instituto Nacional de Concesiones y Catastro). Cementos Pacasmayo
S.A.A has surface rights for the operation area in the Tembladera quarry.
The
mineral rights were issued based on the General Mining Law (DS-014-92-EM) and its Regulation D.L 020-2020-EM.
The
property is in the name of Cementos Pacasmayo S.A.A., is also registered with the name Acumulación Tembladera, and with type of
substance NON-METALLIC.
Cementos
Pacasmayo S.A.A. pays the right of validity for the concession of Acumulación Tembladera with unique code 010001801L. These payments
must be made from the first business day of January to June 30 of every year.
Cementos
Pacasmayo S.A.A. pays royalties to the State according to regulations established by the Authority in Law N° 28258 and its amendment
N° 29788, for the property called Acumulación Tembladera.
Figure
5 Acumulación Tembladera Concession
| 3.2. | Pacasmayo
Industrial Cement Plant |
The
cement plant property is located in the Pacasmayo District, Pacasmayo Province, La Libertad Region. It is located at Kilometer 666 of
the Panamericana Norte.
The
property is shown in the Figure 6 and Table 10 shows the UTM coordinates of the center of the circle of the Pacasmayo plant:
Table
10 Central coordinates of the Pacasmayo cement plant
| North | | |
East | | |
Radius | | |
Zone | |
| | 659953.76 | | |
| 9180941.32 | | |
| 700.00 | | |
| 17 | |
The
area of the property is 86.7 hectares. The property is registered in the National Superintendency of Public Registries (Superintendencia
Nacional de los Registros Públicos – SUNARP) under the registration number 11004542 in registry zone No. V TRUJILLO, Registry
Office San Pedro de Lloc.
Cementos
Pacasmayo S.A.A. pays taxes to the State according to that established by the Municipal Authority, for the Pacasmayo plant.
Figure
6 Pacasmayo Industrial Plant map
| 4. | Accesibility,
climate, local Resources, infrastructure and physiography |
This
chapter describes the accessibility, climate, local resources and infrastructure for the Tembladera quarry and Pacasmayo plant. The chapter
uses information obtained from technical and environmental studies prepared by specialized companies and approved by the authorities.
Topography
Tembladera
is located between 500 and 1000 masl. The topography shows steep surfaces and abrupt slopes. Drainage is dendritic and controlled by
structural features; all the streams are tributaries of the Jequetepeque River.
Access
The
main access is by land. The journey from the city of Lima to the Tembladera quarry is as follows: Lima – Pacasmayo (666 km), Pacasmayo
– Ciudad de Dios (14.3 km), Ciudad de Dios – Tembladera (50 km) and Tembladera – Checkpoint (0.8 km), for a total of
747.1 km.
By
air route is as follows: Lima – Trujillo in 1 hour flight, and from Trujillo to Tembladera quarry by land route for a journey of
2 hours.
Another
alternative by air route is as follows: Lima – Chiclayo, in approx. 1:15 hrs. flight, and from Chiclayo to Tembladera by land route
with a journey of 2.5 hrs.
Climate
The
Tembladera quarry is located in the western slope of the Andes Mountains range of the Cajamarca Region. The climate is characteristic
of semi-arid areas of the lower Andean floor of northern Peru.
Meteorological
information is administered by the National Service of Meteorology and Hydrology, SENAMHI. The precipitation data from the Monte Grande
Meteorological Station has minimum values 0 mm from June to September and maximum values of 26.3 mm in March, corresponding to the dry
and wet periods of the year. The total annual precipitation averages 64.6 mm.
Temperature
The
average monthly temperature fluctuates from 20 °C in July and August to 25 °C in March. The monthly thermal amplitude is less
than 4 °C. The maximum average temperatures range from 27 °C to 29 °C (January – April), and the minimum temperatures
range from 15 – 17 °C (July - September).
Physiography
The
quarry area is located in northern Peru between the transition of the coast and the mountain range, a region characterized by hilly mountainous
relief, cut by rivers and streams creating cultivated valleys and watercourses, where the current morpho-dynamic processes show a moderate
to low activity, except during periods of the El Niño Phenomenon. The property groups physiographic units into three morphological
classes: plains, mountains and hills and one class originated by human activity.
Local
resources and infrastructure
The
personnel of the quarry are divided into Cementos Pacasmayo S.A.A. and contractor personnel. Additionally, the quarry is located 5 kilometres
from the Tembladera town, where there are local resources for a population such as housing, schools, hotels, electrical infrastructure,
water supply, internet access, etc. The contractor accesses the Tembladera quarry by pickup trucks and buses.
The
national electricity grid is the source of energy for the Tembladera quarry. A water channel supplies the Tembladera quarry with water,
which is authorized by the National Water Authority (ANA).
| 4.2. | Pacasmayo
cement plant |
Topography
The
area is located in the alluvial pampas, with elevations between 25 and 100 m.a.s.l., consisting of extensive variety of conglomerate
material that represent ancient dejection cones of the Copinsnique, Jequetepeque, Las Viejas, Zaña and Reque rivers. In general,
these pampas are desert-like and are practically free of crops; they are equal to the high terraces created by the rivers in the area.
The
continuity of these pampas is interrupted by the trenches eroded by the modern rivers. It is common to find minor terraces on the flanks
of the valleys, especially in the inland sectors, such as the Jequetepeque valley.
The
coastal morphology consists of an almost continuous line of ravines, interrupted only by the narrow valleys of the main rivers. The ravines
are 20 to 50 metres high, almost vertical, constiting of conglomerate material belonging to the ancient dejection cones. The beaches
are very narrow.
Access
The
main access is by land. The journey from the city of Lima to Pacasmayo (682km). By air route is as follows. Lima – Trujillo, 1
hour flight, and by land route 1.5 hours from Trujillo to Pacasmayo. Another alternative by air route is Lima – Chiclayo, 1 hour
flight and from Chiclayo to Pacasmayo 1.5 hours by land route.
Climate
Temperature:
This coastal zone has average annual temperatures between 16.5 and 25.0 ºC. The average monthly temperature ranges from 19 to 25
°C, based on data from the Meteorological Station of Cementos Pacasmayo S.A.A.
Precipitation:
The area has very low precipitation for the most of the year, having an annual average of less than 10 mm.
The
annual average Relative Humidity is 85%.
Atmospheric
Pressure: The atmospheric pressure fluctuates from 1017 hPa to 1013 hPa in the period of November 2006, with a daily average of 1009
hPa. These pressure values are related to the influence of the South Pacific Anticyclone.
Sunshine
is high at midday in summer, with an average of 7 hours of solar rays per day. In the winter, the sunshine decreases to 3.5 hours of
solar rays, although it is worth noting that there are clouds that allow the diffuse radiation to pass through.
Local
resources and infrastructure
The
personnel of the plant are divided into Cementos Pacasmayo S.A.A. and contractor personnel. The cement plant is located next to Pacasmayo
town where most of the personnel live. They are taken from Pacasmayo to the cement plant in buses provided by Cementos Pacasmayo.
Electricity
is supplied by the national grid and there is a contract with Electro Perú, which supplies energy through a 60 KV transmission
line.
Water
supply at the Pacasmayo plant is provided by a groundwater well.
Tembladera
quarry is a limestone quarry mining limestone that is suitable for different types of cement. The quarry and deposit are owned by Cementos
Pacasmayo S.A.A. By means of Director’s Resolution No. 01989-2002-INACC/J dated on November 4, 2002, the National Institute of
Cadastre and Mining Concessions granted to Cementos Pacasmayo S.A.A., the title of the non-metallic accumulation concession called “Acumulación
Tembladera” with code No. 01-00018-01-L, whose antiquity goes back to the date of its oldest integral concession: “Norte No.
1” granted by the Regional Mining Headquarters of Cajamarca by Ministerial Resolution No. 267 of June 30, 1950, in favor of Cementos
Portland del Norte S.A., starting operations as Cementos Pacasmayo S.A. from 1957 to 2013, the year in which Calizas del Norte S.AC.(CALNOR)
was constituted. CALNOR started activities from January 2014 to May 2016. San Martin Contratistas Generales S.A. started activities from
October 2016 to the present.
In
March 2007, MINTEC Consulting company was hired by Cementos Pacasmayo to perform the 3D modeling of the deposit and a preliminary estimation
of the Mineral Resources. The geological information was obtained from 31 diamond drill holes. The samples obtained were analyzed in
internal and external laboratories to obtain the content of CaO, MgO, Al2O3, SiO2, Fe2O3,
SO3, Cl and CO3.
With
the information generated, the geological interpretation was made and the structures which control or dominate the deposit were defined.
The geological model was completed by Cementos Pacasmayo’s QPs in the MineSight software from vertical sections.
In
2019, a campaign of eight (8) diamond drill holes was carried out to confirm the Mineral Resources and Reserves of the east area of the
deposit. With the interpretation of information obtained, a new geological model was prepared. Cementos Pacasmayo oversaw the interpretation
and the geologic modeling.
In
December 2022, Cementos Pacasmayo started a diamond drilling campaign of eight (8) additional drill holes to confirm Mineral Resources
and Reserves. Drilling activities continued during the first month of 2023.
In
1957, Compañia Cementos Pacasmayo S.A. began operations in the Pacasmayo plant by installing the first clinker line, which had
an installed production capacity of approximately 110,000 metric tons per year.
In
1966, CPSAA added a second clinker line of 150,000 metric tons per year, increasing the installed clinker production capacity.
In
1974, Cementos Norte Pacasmayo S.A. (CNP) was created to transfer gradually the shares to the Peruvian State.
In
1976, a third clinker line was added, increasing the installed clinker production capacity to 540,000 metric tons per
year.
In
1994, CPSAA installed a new computerized process control and optimization system in the Pacasmayo plant, and the Management approved
the expansion of the practical clinker production capacity from 540,000 metric tons per year to 690,000 metric tons per year. In 1995,
CNP upgraded the third kiln technologically, allowing it to increase its capacity to 840,000 metric tons per year of clinker.
On
December 10, 1998, a significant milestone was reached in our company’s history. Cementos Pacasmayo S.A.A. was born due to the merger
between Cementos Norte Pacasmayo, Cementos Selva (formerly Cementos Rioja), and Cordasa. This strategic move not only solidified our
position in the market but also paved the way for our continued growth and success.
In
2023, we completed a significant investment in a more efficient kiln for our Pacasmayo plant. This strategic move underscores our unwavering
belief in our country’s future growth and, more importantly, our steadfast commitment to environmental sustainability. The new kiln,
designed to significantly lower our emissions, is a testament to our dedication to carbon neutrality.
| 6. | Geological
setting, mineralization, and deposit |
The
strata of the district of Yonan, province of Contumaza, Cajamarca region consists of Cretaceous Age sedimentary strata of the Quilquiñan
Group, Cajamarca Formation, Celendín Formation, and Recent Quaternary Deposits (Table 11).
Table
11 Regional stratigraphic column
Quilquiñan
Group (Ks-q).
The
Quillquiñán Group is composed of the Romirón and Coñor formations which together are represented by 100 to
200 m. of shales and marls with some calcareous intercalations.
The
Quilquiñán Group overlies the Pulluicana Group and underlies the Cajamarca Formation. Both contacts are concordant. It
varies from a thickness of 120 m., in the Chongoyape quadrangle, to a known maximum of 281 m. in the Tembladera area (Cerro de
Chepén). The group consists of dark gray friable shales and bluish marls in thin layers weathering to dark brown or
reddish brown. The Quillquiñán Group is fossiliferous and contains a varied fauna of ammonites, lamellibranchs and
echinoidea. BENAVIDES V., (1956) dated it to the Late Cenomanian-Early Turonian interval because of its ammonite content.
Cajamarca
Formation (Ks-c).
The
Cajamarca Formation is composed of 100 to 400 m. of limestone whose main outcrops are located in the Cutervo, Chota and Celendín
quadrangles. The Cajamarca Formation is characterized by regular and uniform stratification and grayish or whitish colors.
The
formation is limited by concordant contacts with the Celendín Formation in the upper part and with the Quilquiñán
Group at the base. In both cases these are sharp contacts with abrupt lithology changes. The Cajamarca Formation has a fairly uniform
lithology throughout the region. It consists of a thin, pure, light brown limestone weathering to whitish or light gray. The limestone
is well stratified in thin to medium layers.
A nearly complete section at Tembladera (Cerro de Chepén) is 111 m thick. (BENAVIDES V., 1956). The Cajamarca Formation is characterized
by the content of Coilopoceras newelli BENAVIDES, from the late Turonian (BENAVIDES, V. 1956); therefore it correlates with the upper
part of the Jumasha Formation, from other parts of northern and central Peru.
Celendín
Formation (Ks-ce).
The
Celendín Formation outcrops only in the Cutervo, Chota and Celendín quadrangles generating a relief of hollows and low
terrains characterized by yellowish and brownish tones produced by weathering. The formation concordantly overlies the Cajamarca Formation.
The Celendín Formation is composed of thin layers of clayey nodular limestone, intercalated with marls and shales. In general,
the marls and shales predominate over the limestones. The ammonites contained in the Celendín Formation indicate that the unit
belongs to the Coniacian and early Santonian (BENAVIDES, B. 1956). The Celendín Formation correlates with other outcrops of the
same unit in the north and center of the country and with the top of the Chota Formation in the Selva region.
Recent
Quaternary Deposits.
Along
the coastal strip and the Andean foothills, there are abundant alluvial and fluvial deposits made up of conglomerates, gravels, sands,
silts, etc. forming the floors of the valleys and ravines located between San Pedro de Lloc, and Motupe, where the main population centers
and farming areas of the area are located.
(Source: Bulletin No. 38 Series A. National Geological Chart by John Wilson - 1,984).
The
Tembladera quarry hosts a limestone deposit with a grade suitable for cement production. The deposit is contained within the so-called
Cajamarca Formation, belonging to the Upper Cretaceous (Turonian floor, around 90 MA). This formation overlies the Quilquiñan
Group and underlies the Celendín Formation.
Sedimentary
rocks corresponding to the Cajamarca Formation and the Upper Cretaceous Celendín Formation outcrop in the area as described below.
This formation overlies the Quilquiñan Group, and underlies the Celendín Formation.
Mesozoic
Quilquiñan
Group (Ks-q).
Composed
by a thin stratification of marly shales, thin layers of marly limestones, and marl nodules in thin layers, dark brown in color, it is
not mineable. This formation is the limit of the Cajamarca Fm. limestones. Which represents the oldest rocks in the area, they are found
outcropping in the northern part of the area of the quarry.
Cajamarca
formation (Ks-c)
Composed
of thin limestones, well stratified, in strata of thin layers, with a color ranging from dark to light gray, these limestones are mined
for cement production because they meet quality standards. This formation lies concordant with the Quilquiñan group.
The
average strike of these strata is N 75° W and dip varies from sub-horizontal to 50º. It has a thickness or power of 230 meters.
Celendín
formation (Ks-ce)
It
presents an interstratification of thin layers of light gray limestones, cream to dark brown nodular marly limestones and shales. This
formation outcrops on the south-central side of the quarry, in a reduced area, with a thickness of 35 meters, which underlies concordant
to the Cajamarca Fm. These types of limestones were considered as waste rock for not complying with the quality standards.
Cenozoic
In
the quarry, intrusions of andesitic dikes of plutonic formation can be found, which intrude longitudinally in very localized areas of
the limestone deposit rock mass. These dykes present aphanitic to porphyritic texture, with some plagioclase crystals visible in greenish
gray to whitish matrix, showing moderate to high alteration, moderate poly directional fracturing degree.
Quaternary
Deposits
Along
the Andean foothills there are abundant alluvial and fluvial deposits made up of conglomerates, gravels, silty sands, etc. In the Tembladera
quarry area, these deposits are restricted to the Jequetepeque riverbeds, stream mouths and some terraces.
Table
12 Local stratigraphic column of the Tembladera quarry
| System |
Series |
Stratigraphic
Unit |
Intrusive
rocks |
Lithologic
Description |
| Quaternary |
Recent |
Fluvial
Deposit |
Qr-fl |
|
|
Fluvial
origin |
| Alluvial
Deposit |
Qr-al |
|
|
Alluvial
origin |
| Tertiary |
Lower |
|
|
Andesite |
T-an |
Intrusion
of andesitic dykes longitudinally into the deposit rock mass. |
| Cretaceous |
Upper |
Celendin
Formation |
Ks-ce |
|
|
Thin
layers of clayey nodular limestone, interbedded with marls and lutites. |
| Cajamarca
Formation |
Ks-c |
|
|
Limestone
of marine origin of whitish to light gray color. |
| Quilquiñan
Group |
Ks-q |
|
|
Lutites
and marls with some calcareous intercalations. |
| 6.3. | Characteristics
of the deposit |
Table
13 shows the main characteristics of the deposit.
Table
13 Characteristics of the Tembladera deposit
| Quarry |
Average
Width (m) |
Total
Length (m) |
Thickness
(m) |
Average
depth (m) |
Continuity |
| Top
Elevation |
Lower
elevation |
| Tembladera |
800 |
1900 |
230 |
720 |
420 |
It
is a sedimentary deposit whose continuity is controlled by a folded structure (syncline) whose limits are marked by its flanks. |
Figure
7 Geological Section of the Tembladera quarry
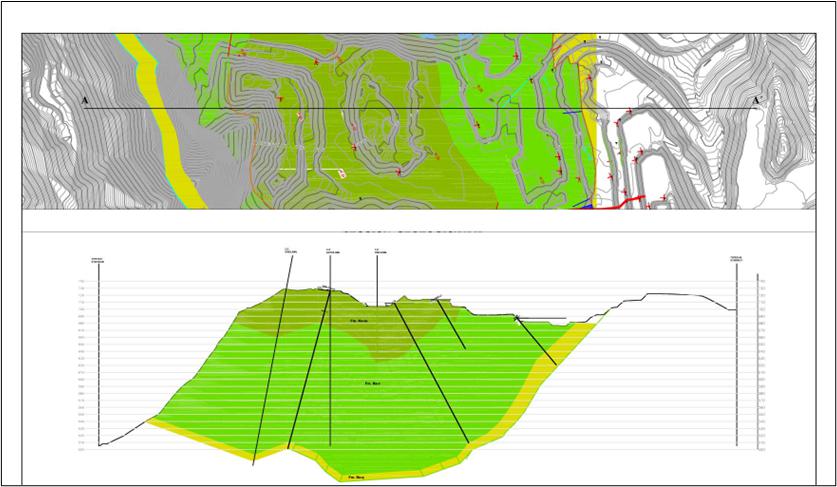
Cementos
Pascamayo’s exploration activities at the Tembladera quarry property involve diamond drilling to adequately characterize the geology.
The holes range in depth from 80 to 150, with an average depth of 120.
Table
14 Drilling campaigns in Tembladera quarry
| Drilling
Campaign |
Date |
N°
of holes |
Hole
Type |
Holes
dimeter |
N°
of samples |
Type
of sampling |
Objective |
| 1 |
2007 |
31 |
Diamond
Drilling |
HQ |
2515 |
Core
sampling |
Exploration |
| 2 |
2019 |
8 |
Diamond
Drilling |
HQ |
858 |
Core
sampling |
Exploration |
| 3 |
2022
- 2023 |
8 |
Diamond
Drilling |
HQ |
956 |
Core
sampling |
Reserves
Confirmation |
During
2023, Cementos Pacasmayo did not conduct hydrogeological studies. The last hydrogeological studies were conducted during 2021 and the
information was presented in the previously filed TRS titled “Technical Report Summary (TRS), Tembladera Quarry and Pacasmayo Cement
Plant 20-F 229.601”, which was filed as Exhibit 96.1 of the CPSAA’s Annual Report on Form 20-F filed with the SEC on April
28, 2022 (File No. 001-35401).
As
stated in the previous TRS, Cementos Pacasmayo hired Magma Consulting S.A.C. in 2021 to update its previous hydrogeological surveys.
The hydrogeological study included the evaluation of 5 piezometers. Magma Consulting S.A.C. concluded that the groundwater is 300 m above
the current topographic elevation. Figure 8 shows the water table relative to ground surface (Magma Consulting S.A.C. 2021).
Figure
8 Water level at the Tembladera quarry
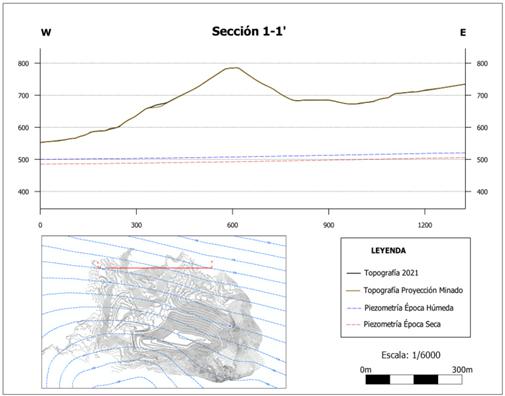
As
per the previous TRS, CPSAA hired Walsh Perú S.A. to define the hydrogeological characteristics of the quarry. Their study (Walsh
Perú S.A., 2009), which included evaluation of EC, TDS, S, pH, and T from 13 monitoring points. The evaluation concluded there
is no water contamination from the current mining practices.
During
2023, Cementos Pacasmayo did not conduct geotechnical studies. The update studies were conducted during 2021 and the information was
presented in the previously filed TRS titled “Technical Report Summary (TRS), Tembladera Quarry and Pacasmayo Cement Plant 20-F
229.601”, which was filed as Exhibit 96.1 of the CPSAA’s Annual Report on Form 20-F filed with the SEC on April 28, 2022
(File No. 001-35401).
As
per the previously filed TRS, the geotechnical studies concluded, based on the geotechnical test work that the current slopes at the
Tembladera quarry are stable for static and pseudo-static loading conditions, with safety factors above the minimum recommended for
operating conditions. The studies also recommended geotechnical design criteria including a single bench height of 10 m,
inter-ramp angles between 35° and 45°, with berm widths ranging from 5.04 m to 6.40 m. The recommended bank angles is
between 47° and 70° and bench angles is between 47° and 70°.
| 8. | Sample
preparation, analyses, and security |
This
Chapter describes the preparation, analysis and security of the samples used for the geology, quarry and cement plant operations.
Cementos
Pacasmayo S.A.A. has implemented international standards in all its operations such as quarries and plants. The ISO 9001 standard has
been implemented and certified since 2015. The certification is renewed annually through an external audit.
The
SSOMASIG department (Security, Occupational Health, Environment and Management Systems), is part of the team that determines and gives
the necessary support for the maintenance of the ISO 9001 (Quality) and the scope is in all the company’s activities.
The
Geology department has protocols for the activities of sample preparation methods, quality control procedues, security and other activities.
| 8.1.1. | Preparation
of samples, procedures, assays and laboratories |
Samples
obtained from the drill holes are placed in holders to be duly coded, cut, bagged and sent to the laboratory at the Pacasmayo plant and
are occasionally sent to an external laboratory following the company’s procedures.
Certimin
S.A. is used as an external laboratory for chemical analysis. Certimin S.A. is a Peruvian laboratory that is certified in ISO 9001, ISO
14001, ISO 45001, NTP-ISO/IEC 17025 Accreditation and has a membership in ASTM. This laboratory has modern facilities for the development
of mining services associated with the cement industry and technical support in the geochemical field for national and international
companies.
For
the limestone samples, the laboratory analyses evaluate CaO, MgO, Al2O3, SiO2, Fe2O3,
SO3 and Cl. Once received in the laboratory, the properties of the limestone to be used in cement production are analyzed.
| 8.1.2. | Quality
Assurance Actions |
Cementos
Pacasmayo S.A.A. has developed quality assurance actions, which guarantees the accuracy of the results in the sampling, in the preparation
and analysis of the samples.
Cementos
Pacasmayo S.A.A. has implemented QAQC protocols for the development of exploration and production activities in the Tembladera quarry
to ensure the quality of the information that allows the estimation of Mineral Resources and Reserves of the deposit.
Based
on the information and samples from the 2019 drilling campaign where limestone samples were obtained, Cementos Pacasmayo S.A.A. performed
an audit for the validation of results as part of the quality assurance and quality control (QAQC) activities. For this purpose, it hired
the Wiracocha Mining Services S.R.L., who conducted a re-sampling of a group of drill holes executed in Tembladera quarry in the past.
Also, the work included the revision of the QAQC program. The samples and controls of this program were analyzed at Certimin S.A., an
external laboratory.
The
analysis of the results obtained for the different samples and controls inserted show a confidence level, with an acceptable bias that
are within the standards of the sampling theory, which guarantees the accuracy of the results in the initial sampling, so it is concluded
that both the preparation and analysis of the samples obtained initially in the laboratory of Cementos Pacasmayo S.A.A., has reliable
processes and procedures.
The
quality plan implemented by Cementos Pacasmayo for the quarries includes the insertion of blanks, duplicates and standards, in order
to control the precision, accuracy and contamination in the samples.
Table
15 Quality Plan of the Tembladera quarry
| Blanks |
Duplicates |
Standards |
Remark |
| 1 control sample for each batch of 20 samples. |
2 control sample for each batch of 20 samples. |
1 control sample for each batch of 20 samples. |
Cementos Pacasmayo protocol ¨OM-GL-PRT-0023-R0¨. |
Cementos
Pacasmayo S.A.A. has implemented QAQC protocols for the development of exploration and production activities in the Tembladera quarry
in order to ensure the quality of the information that allows the estimation of Resources and Reserves of the deposit.
Cementos
Pacasmayo S.A.A has a specific area for the storage of the samples obtained during the drilling campaigns; the samples are properly stored
to preserve their quality.
The
necessary materials for storage and transport of the samples were implemented. Sampling cards were also implemented with information
on the name of the project, name of the borehole to be sampled, date of sampling, sampling interval, sampling manager, sampling and type
of sample or control sample.
All
samples were labeled, and a photographic record is available. The photographic record of each sampling bag is made together with the
weighing of the sample.
Cementos
Pacasmayo has implemented actions to ensure the physical security of samples, data, and associated records. The traceability of the sample
from its generation to its analysis and subsequent conservation of rejects and pulps. At the Tembladera quarry, core samples are duly
stored in the coreshack.
| 8.1.6. | Qualified
person’s opinion on quarry QAQC |
In
the author’s opinion, Cementos Pacasmayo has been complying with the international standards of ISO-9001 (Quality) since 2015 and implemented
Quality Assurance
and Quality Control (QAQC). Cementos Pacasmayo S.A.A. has used a QAQC check program comprising blank, standard and duplicate samples.
The QAQC shipping rate used complies with accepted industry standards for insertion rates, as well; the actual sample storage areas and
procedures are consistent with industry standards.
Protocols
in the different exploration and production processes are strictly complied with. There is information on sample preparation methods,
quality control measures, sample security, and these results are accurate and free of significant error. The information in this report
is adequate for use in the construction of the Geological Model, Resource Estimation and Reserve Estimation.
| 8.2.1. | Samples
preparation, procedures, assays and laboratories |
Cementos
Pacasmayo S.A.A. has a quality control plan for each of its operations that is part of the quality system.
As
part of the quality control plan (P-CC-D-03 VE 05 Quality control - cement and lime), samples of raw materials such as limestone, sand,
clay and iron are evaluated in the laboratory at the Pacasmayo plant, where they are analyzed to determine the chemical composition of
each material for cement production.
The
procedures applied are the chemical analysis of raw materials and crude, sampling of clinker, slag and pozzolana, physical testing of
cement, chemical analysis by wet route for clinker and cement, preparation of coal samples, physical testing for additions, analyses,
and operating procedures in the X-ray area, which are based on ASTM, NTP (Peruvian Technical Standard) and ISO standards.
| 8.2.1.1. | Raw
materials sample preparation |
For
preparation of samples, it is considered the collection and preparation of samples procedure, which consists of primary and secondary
crushing, and reduction of the sample by the quartering method, then the sample is pulverized in the ring mill.
| 8.2.1.2. | Analysis
of Laboratory |
The
laboratory at Pacasmayo plant has implemented the ISO 9001 standard; also, it has calibrated equipment, with a calibration and maintenance
program established by the laboratory area. The main equipment in the laboratory at Pacasmayo plant are the XRF fluorcence equipment
and the compressive strength press, which are maintained annually.
The
tests for air content, fineness, autoclave expansion, compressive strength and setting time, and vicat are made for all types of cements.
The autoclave contraction, 14-days mortar expansion, 6-months sulfates expansion, SO3, MgO, loss on ignition, insoluble residue,
and C3A and 2 C3A+ C4AF tests only apply to some specific cements.
| 8.2.2. | Quality
Assurance Actions |
The
sampling plan P-CC-D-04 VE 08 Sampling plan and frequency of tests and data verification applies to the processes of raw material reception,
raw material crushing, coal milling, raw meal milling, clinkerization, cement milling, lime production, lime milling and lime dispatch.
Table
16 Tests and frequency for each stage of the process
| Stage |
Tests |
Frequency |
| Receiving
raw materials |
Chemical
analysis by X-ray, granulometry and humidity. |
1
samples per 2 hour up to 1 time per day. |
| Crushing
raw materials |
Chemical
analysis by X-ray. |
2
samples by shift or depending on the material. |
| Coal
grinding |
Chemical
analysis by X-ray, humidity, calorific value and proximate analysis. |
1
samples per 2 hour up to 1 time per day. |
Raw
meal grinding
|
Chemical
analysis for X-ray, Humidity, R70 and R170. |
Each
1 hour up to 2 hours. |
| Clinkerization |
Chemical
analysis by X-ray. |
Each
hour up to 2 hours. |
| Cement
and other grinding |
Chemical
analysis by X-ray, pozzolana, IAP pozzolana, IAP Slag, Blaine, R325, R450, loss on ignition, insoluble residue and chemical/physical
tests. |
Each
1 hour up to 1 time per shift. |
| Packaging
of cement |
Chemical
analysis by X-ray, Blaine, R325, R450, loss on ignition, insoluble residue and chemical/physical tests. |
2
samples per shift and depending on te type of cement |
The
quality plan implemented by Cementos Pacasmayo for the cement plants includes the insertion of blanks, duplicates and standards, in order
to control the precision, accuracy and pollution in the samples.
Table
17 Quality Plan of Pacasmayo cement plant
| Blanks |
Duplicates |
Standard |
Comment |
| 02 |
784 |
11
for cement (NIST)
05
for coal |
Blanks
only apply by performing spot checks by Classical methods. |
The
Pacasmayo plant has a QAQC plan, which includes the items mentioned in Table 17. Likewise, the results for the period 2023 show two blank
samples, 784 duplicate samples, and 16 standard samples. They are below the error limits.
As
part of the quality plan, the laboratory evaluates its performance through external interlaboratory; in this sense, the laboratory participates
in 02 interlaboratory:
| ● | CCRL:
Compliance greater than 97% in qualification Z Score > 4 |
| ● | XAMTEC:
Qualification greater than 99%. |
Likewise,
quality assurance actions include control of finished products, control of non-conforming products, validation of silos, density analysis,
QaQc program, quality plan and Quality control parameters for raw materials received at the Pacasmayo plant.
| 8.2.3. | Security
of the samples |
Cementos
Pacasmayo S.A.A. has implemented QAQC protocols for the development of cement production activities at the Pacasmayo plant, to ensure
the quality of the information that allows the Estimation of the Resources and Reserves of the deposit.
Sample
preparation methods are Sample collection and preparation, clinker, slag and pozzolan sampling and Coal sample preparation.
The
testing procedures are: Chemical analysis of raw meal and raw materials, analysis by X-ray equipment, X-ray laboratory operation, physical
tests for additions, physical chemical analysis for coal samples, physical tests for cement, wet testing of clinker and cement and quality
plan.
Likewise,
the control parameters are raw material parameters, pozzolana, slag, mineral reception parameters, clinker production parameters, raw
material parameters for raw meal; raw meal feed parameters, raw meal milling parameters, coal milling parameters and cement milling parameters.
| 8.2.4. | Qualified
Person’s Opinion on cement plant QaQc |
Cementos
Pacasmayo S.A.A. has a Quality Assurance, Research and Development area that ensures compliance with the requirements for finished products
specified in Peruvian Technical Standards, which are traceable to the standards of the American Society for Testing and Materials (ASTM).
For
quality assurance, the control parameters have been defined from the raw materials, products in process and finished products. Compliance
with the requirements based on indicators of the quality assurance management system for the 2023 period is 0% of nonconforming products
in the market. This is evaluated under the specification of Standards NTP 334.009, NTP 334.090, and NTP 334.082 (similar to ASTM C150
and ASTM C1157). Likewise, the level of customer satisfaction (D-COM-P-01 VE09 Customer satisfaction) is 90.82%.
In
this sense, in the author’s opinion, the quality assurance system at the Pacasmayo plant, which includes preparation methods, procedures,
analysis and security, complies with the best practices in the industry, thus ensuring that the final customer has confidence in the
quality level of the products marketed by Cementos Pacasmayo.
This
Chapter shows the data verification activities for the geology, quarry and cement plant areas.
| 9.1.1. | Data
Verification procedure |
CPSAA
has an unit specialized in the compilation, verification and standardization of information for the geological database. It’s main function
is the validation of the data to be used in the estimation of mineral Resources and Reserves. For the proper management of the information,
internal protocols have been implemented, which are subject to internal audits.
The
data collection applies to exploration activities. For diamond drilling, the process flow for planning and executing drilling, survey
methods for reporting drill collars and ddh / verification of the quality of information and recovery process of the core information.
In addition, for geological sampling activities, the processes flowsheet, validation and consistency of sample information, sample preparation
and testing, density, registration process and digital photographic storage are used.
| 9.1.3. | Management
and Validation of Database |
The
stages for management and validation of database are the recovery, processing and storage of the database. Which includes database development
process flow, information standardization and integration process, information storage strategy, appropriate database technology, structure
and practicality of the database system that allows a fast and flexible access and input of information and validation of chemical results,
which includes the QaQc report.
The
consistency between the database records and the original registry was verified by the QPs in 2023. No differences were detected
between the database and the log files. A digital copy of all records is kept as a pdf file. Digital certificates support the
chemical analysis data.
The
collection of the information considered the following: drill collars, survey, lithology, samples and assays.
The
geology department provided copies of all Tembladera quarry drilling records, including Excel spreadsheets, driller’s logs, field
geologist’s logs, quality results sheets from the Pacasmayo laboratory, collar sheets, and survey sheets. Data for each hole was
individually checked in the database to confirm accuracy.
The
reviews included:
| ● | Drillhole
lithology database comparison to geophysical logs |
| ● | Sample
quality database comparison to quality certificates |
| ● | Core
photographic record. |
Typical
errors may impact reserve and resource estimation related to discrepancies in original data entry. These errors may include:
| ● | Incorrect
drillhole coordinates (including elevation). |
| ● | Mislabeled
drillhole lithology. |
| ● | Unnoticed
erroneous quality analyses where duplicate analyses were not requested. |
| ● | Unrecorded
drillhole core loss. |
Data
validation follows the field operational procedures that collect information from the source (collar, survey, lithology, samples, and
assays).
Finally, when the information is transmitted and uploaded to the mining software for geological modeling and estimation, it is double-checked
to eliminate any additional errors.
| 9.1.6. | Qualified
Person’s Opinion Geologic Data |
The
qualified persons followed the defined processes for information flows to support Resource and Reserve estimation. The qualified person
followed the same process as a means of verifying and validating the geologic data. They found that the validated information is congruent
in the interpretations of the same, with which the fundamental base geological models were generated for the estimation of the Resources.
No
findings have been found that could invalidate the estimation of the Resources and Reserves of the unit.
The
Quality Control Plan contemplates the following aspects: PDCA cycle, customer, person in charge, activities, risks, control methods,
monitoring, measurement, analysis, evaluation and documentary evidence.
The
PDCA cycle is:
| ● | Plan,
during this stage the following activities are considered: determination of characteristics
of raw materials, product in process and finished product, elaboration of control and arrays
parameters and determination of activities and results assurance program. |
| ● | Do,
during this stage the following activities are considered: verification and compliance with
the requirements and matrices, sampling and preparation. |
| ● | Check,
during this stage the following activities are considered: chemical analysis by XRF, chemical
analysis, physical analyses, recording of results, taking action on non-conformities. |
| ● | Act,
during this stage the following activity is considered, acting to improve. |
| ● | The
Quality Assurance Plan is applied to the following customers: production, quarry, provisions
chain and external customer. |
| 9.2.1. | Data
verification procedures |
The
XRF analysis, chemical analysis and physical analysis are made to verify the results of the samples, as part of the Quality Control Plan.
The
data resulting from these three types of analysis are recorded and evaluated - to determine whether or not they comply with the technical
specifications.
Data
verification procedures include internal audits, check lists, statistical tables, reports, validation of data, certificates, interlaboratory
test reports and compliance with quality protocols.
Cementos
Pacasmayo S.A.A. through its quality assurance and control unit participates in evaluations with international laboratories such as CCRL/ASTM
(Concrete and Cement Reference Laboratory), which is an international reference laboratory for construction materials, and Xamtec of
Colombia, an international interlaboratory, in order to report reliable data.
The
Quality Control laboratories endorse their analysis methods by participating in interlaboratory analysis programs, which compare the
results with national and foreign laboratories. The methods of analysis compared are X-ray fluorescence (XRF) and the physical cement
tests, which are the methods used to control cement quality. In all the results of these interlaboratory programs, the companies always
obtain the best results for each test.
| 9.2.3. | Qualified
Person’s Opinion on cement plant |
In
the author’s opinion, the methodologies used for collecting and processing data at the cement plant are accurate and free of important
errors. The information can be used within the models’ construction and estimates for cement production. Considering that the analyses
of the main chemical components and physical properties of the raw materials and final products are made in external laboratories, the
quality of the information is adequate for preparing mineral Resource and Reserve Estimates.
| 10. | Mineral
proccessing and metallurgical testing |
| 10.1. | Nature
of Testing Program |
Cementos
Pacasmayo S.A.A. has a Quality Assurance and Research and Development department. The objective of the department is to develop, evaluate
and research procedures for the development of products at laboratory level and their scaling up to industrial level. Another objective
is to identify supplementary cementitious materials (SCM) that can substitute for clinker: slag, pozzolana, fly ash, calcined clays,
etc., to reduce their environmental footprint and the cost of cement production.
They
have also implemented their own procedures for the preparation, review, issuance and control of test reports associated with cement production.
Cementos
Pacasmayo has implemented the ISO 9001 standard since 2015. The Research and Development laboratory, located at the Pacasmayo plant,
is responsible for technical aspects of cement plant and quarry operations.
Cementos
Pacasmayo applies the procedures:
| ● | P-ID-P-04
Preparation of raw materials. |
| ● | P-ID-P-05
Sampling of cement and raw materials. |
| ● | P-ID-P-13
Input, storage and disposal of samples. |
A
permanent control is carried out with other laboratories to give greater reliability to the results. Likewise, interlaboratory reports
are issued with external laboratories such as CCRL (Cement and Concrete Reference Laboratory), which is a reference laboratory for construction
materials at international level, and Xamtec from Colombia, an internal interlaboratory.
Cementos
Pacasmayo S.A.A. has also obtained the certification that certifies compliance with Supreme Decree No. 001-2022, which validates compliance
with the Technical Regulation on Hydraulic Cement used in Buildings and General Construction.
Cementos
Pacasmayo SAA opted for the highest and most rigorous certification model (Type 5) granted by ICONTEC, which has extensive
experience in the certification of products and services.
A
significant percentage of Research and Development activities are focused on evaluating different ratios between clinker-mineral additions
that provide the best functional characteristics to our products and at the same time keep balance with the benefits generated for the
company. Whether it is a requirement or an internal initiative oriented to supply any previously identified need, the laboratory tests
are developed with the objective to generate operational benefit to the company. Based on this work, the laboratory has determined (and
confirmed with production estimates) that 1 tonne of limestone yields 0.74 tonnes of clinker and the clinker/cement factor with
additions is 0.72.
The
R&D Laboratory located at the Pacasmayo plant provides analysis and research services to all of the company’s cement plants.
| 10.2. | Cement
Manufacturing Test Results |
At
the Pacasmayo plant, the studies conducted in the Research and Development Laboratory and the Quality Control department include: reduction
of the clinker/cement factor, substitution of slag for pozzolan, and substitution of fossil fuels for rice husks, the latter at the Rioja
plant. The clinker/cement factor of the main cements with additions is 0.72.
The
substitution of slag from blast furnace by natural pozzolanic materials was also analyzed, with the objective of improving the company’s
carbon footprint and reducing operating costs. The main test was the analysis of pozzolanic activity at laboratory level and subsequently
at industrial level. By 2024, the objective is to further reduce slag consumption and further reduce CO2.
| 10.3. | Qualified
Person’s Opinion of the Adequacy of the Test Data |
The
Research Laboratory issues technical reports following the criteria of international standards for the operations area, identifying the
correct data, defining the requirements that may vary but include accuracy, consistency, and validity through an evaluation of the data
and implementation of solutions, and finally, validating the adequacy of the data.
The
operations area then evaluates the convenience of industrially implementing the tests and validating what is reported at the laboratory
level.The reliability in the integrity and adequacy of The data reported by the area is based not only on the technical competencies
of the collaborators but also on the high scores obtained in the external interlaboratory of recognized entities such as XAMTEC and CCRL
in their different programs.
| 11. | Mineral
Resources estimates |
The
geological model was developed and structured using Leapfrog software. The model solids were generated considering the lithology of the
deposit based on the geological characteristics and its quality.
Due
to the nature of the deposit and its stratified nature and occurrence, the geological model was interpreted with the help of 56 E-W cross
sections and 82 N-S sections, spaced every 20 meters.
Additionally,
in the interpretation with the sectioning, a structural analysis has been considered defining a main NE-SW fault system whose effect
on the terrain has been reflected in the displacement of blocks related to fault jumps of normal and inverse nature.
The
geochemical analysis of the samples from the diamond drilling campaigns was performed by the geologists of Cementos Pacasmayo S.A.A.,
which has allowed grouping the calcareous stratigraphic sequence into 15 lithological groups or domains, establishing the following sequence
to be considered in the geological modeling.
The
lithological units have been grouped by assigning a numerical code to each, in the mining software, to simplify the modeling. Table 18
shows the lithological units with their respective Mine Sight code and numerical code.
Table
18 Lithologic units of the Tembladera quarry geological model
| Lithologic
Units |
Mine
Sight Code
ITEM
(USO) |
Numeric
Code
(CUSO) |
| 01_CALIZA
MARGOSA |
CM
G |
1 |
| 02_CALIZA
IMPURA MARGOSA A |
CIMA |
2 |
| 03_MARGA
DE ARENISCA |
MGA
R |
3 |
| 04_CALIZA
IMPURA MARGOSA B |
CIMB |
4 |
| 05_CALIZA
TIPO I |
C
TI |
5 |
| 06_CALIZA
TIPO I |
C
TI |
6 |
| 07_CALIZA
CAL |
CA
L |
7 |
| 08_CALIZA
TIPO I |
C
TI |
8 |
| 09_CALIZA
ADICION |
CA
DI |
9 |
| 10_CALIZA
TIPO I |
C
TI |
10 |
| 11_CALIZA
ADICIÓN |
CA
DI |
11 |
| 12_CALIZA
TIPO I |
C
TI |
12 |
| 13_CALIZA
CAL |
CA
L |
13 |
| 14_CALIZA
TIPO I |
C
TI |
14 |
| 15_CALIZA
ADICION |
CA
DI |
15 |
| 16_DIQUES |
DQ |
16 |
The
main criteria used for geological modeling are the lithological and quality aspects.
The
lithological criteria are based on the macroscopic physical characteristics, such as color, texture, hardness, etc., of the calcareous
rocks.
In
relation to the quality criteria, the main reference is the content of calcium oxide (CaO) as the main oxide, and of economic interest,
as well as the concentration of oxides and secondary elements and/or contaminants were also considered in classifying the type of rocks
oriented to the final product.
In
the Tembladera quarry, the referential cut off of the oxides that determine the classification of the final products of calcareous rock
is shown in Table 19.
Table
19 Pacasmayo plant material restrictions
| |
|
Limestone
Type I |
Limestone
Type V |
Limestone
Type Cal |
Limestone
Type Addition |
| Al2O3
(%) |
Min. |
0 |
0 |
0 |
0 |
| Max. |
2.50 |
1.30 |
0 |
0 |
| Target |
1.50 |
0.80 |
0 |
0 |
| CaO
(%) |
Min. |
48.60 |
50.50 |
51.10 |
41.00 |
| Max. |
0 |
0 |
0 |
0 |
| Target |
50.20 |
52.00 |
52.50 |
44.00 |
| MgO
(%) |
Min. |
0 |
0 |
0 |
0 |
| Max. |
2.50 |
2.50 |
0 |
2.50 |
| Target |
1.50 |
1.50 |
0 |
1.50 |
| SO3
(%) |
Min. |
0 |
0 |
0 |
0 |
| Max. |
0.35 |
0.35 |
0 |
1.10 |
| Target |
0.25 |
0.25 |
0 |
0.50 |
| SiO2
(%) |
Min. |
0 |
0 |
0 |
0 |
| Max. |
0 |
0 |
2.00 |
0 |
| Target |
0 |
0 |
1.50 |
0 |
The
block model was configured based on the dimensions and spatial distribution of the bodies containing the material of economic interest.
Table 20 shows the extents of and dimensions of blocks in the block model (coordinates in UTM units).
Table
20 Characteristics of the block model
| |
Minimum
(m) |
Maximum
(m) |
Size
(m) |
Number |
| X |
706700 |
708700 |
10 |
200 |
| Y |
9197800 |
9199200 |
10 |
140 |
| Z |
350 |
900 |
10 |
55 |
A
total of 396 samples from 39 diamond drill holes were used for the Resource estimation.
The
data is managed in a database, where it is extracted and then loaded and used in MineSight software.
The
density data for the estimation of the limestone Resources of the Tembladera quarry as of December 2023, were taken from the historical
data of sampling results carried out in the first drilling campaigns, the density varies between 2.69 and 2.72 t/m3.
In
general, each geological unit is estimated from the information of the composites belonging to that unit, the composites should not cross
“hard” boundaries between different geological units, in this case units were established according to the quality.
The
objective of compositing is to have uniform grades in each initial core, to reconstitute the grade profile of each drillhole. This means
that when compositing we must be careful that the composites preserve the original nature of the sample. The calculated values considered
in the compositing were for the SiO2, Al2O3, CaO, MgO and SO3.
Composites
were made at different lengths to determine the optimum compositing size. The optimum value was 10 m. This size, which best fits the
nature of the original sample, was included in the resource estimation process.
In
addition, the length of the composites is considered based on an exact multiple of the height of the blocks used to model the deposit
and is also matched to the bench height to be processed.
| 11.4. | Basic
statistics of the data (Assay – Composites) |
Table
21 shows the results of the basic statistics of the main oxides as CaO, SiO2, MgO, Al2O3 and
SO3, for the original data and for the composited data. The statistical analysis was performed for each defined
body with the interpretation of deposit quality, which were also taken as criteria for modeling and estimation.
Table
21 shows the statistics for “Limestone Cal” as this is the one of greatest economic interest due to its CaO content and the
main one in the estimation of Resources and Reserves.
Table
21 Limestone Cal statistics
| Components |
Origen |
Valid |
Rejected |
Minimum |
Maximum |
Mean |
Std.
Devn. |
Variance |
Co.
Of Variation |
| CaO |
Assay |
945 |
0 |
42.99 |
54.84 |
52.37 |
1.35 |
1.82 |
0.03 |
| Composito |
186 |
0 |
48.03 |
54.04 |
52.33 |
0.83 |
0.70 |
0.02 |
| SiO2 |
Assay |
943 |
2 |
0.01 |
11.35 |
1.66 |
1.22 |
1.48 |
0.73 |
| Composito |
186 |
0 |
0.11 |
6.17 |
1.58 |
0.82 |
0.66 |
0.52 |
| MgO |
Assay |
945 |
0 |
0.19 |
5.79 |
1.47 |
0.80 |
0.64 |
0.54 |
| Composito |
186 |
0 |
0.34 |
3.68 |
1.46 |
0.55 |
0.30 |
0.38 |
| Al2O3 |
Assay |
941 |
4 |
0.01 |
3.99 |
0.64 |
0.43 |
0.19 |
0.68 |
| Composito |
186 |
0 |
0.09 |
2.31 |
0.60 |
0.29 |
0.09 |
0.49 |
| SO3 |
Assay |
916 |
29 |
0.01 |
1.03 |
0.19 |
0.13 |
0.02 |
0.68 |
| Composito |
179 |
7 |
0.01 |
0.50 |
0.18 |
0.11 |
0.01 |
0.61 |
Extreme
values are those analysis results that are not representative of the unit being studied and are those that are above the mean plus twice
the standard deviation.
In
the analysis of the extreme values in the laboratory results for the calcareous lithologic units that are being estimated, no deviation
has been found, all the results are coherent and representative of the levels to which they correspond.
The
variographic analysis considered the composited data for each level corresponding to each body of economic interest of the Tembladera
quarry; the variographic structures found indicate preferential directions in the correlation of the results, which allows us to analyze
the spatial behavior of the variables, mainly of the CaO variable.
This
has allowed us to obtain resulting experimental variographic structures that reflect the maximum distance or maximum range and the way
in which one point has influence on another point at different distances.
Table
22 Variogram modeling parameters
| Type
of Variogram Model |
Spherical |
| Nugget
effect |
0.2 |
| Total
Sill |
1 |
| Range |
150
and 510 |
The
Ordinary Kriging Interpolation (OK) method was used for the main CaO variable, of Inverse Distance (ID2) for the secondary variables
(Oxides, see Table 25) and Nearest Neighbor (NN) for validations, defining parameters for each estimator. Tables 23 and 24 show the main
parameters used to define the interpolations of the main CaO variable of the CAL limestone layer and of the secondary variables, respectively.
The
interpolations were performed in 3 consecutive processes.
| - | The
first with a search radius of 1/3 the range of the variogram. |
| - | The
second with a search radius of 2/3 the range of the variogram. |
| - | Finally,
the third one considering the maximum range of the variogram. |
Regarding
the number of composites, we used a minimum of 2 per block and 5 as maximum, for the first interpolation and a minimum of 1 per block
for the second and third pass with 3 and 5 as maximum, respectively.
Additionally,
a maximum of 02 composites were considered for each borehole taken in the interpolation.
Table
23 Estimation Parameters Secondary Variables
| Comment |
Pass
1 |
Pass
2 |
Pass
3 |
| Search
dist. Block on Model -X |
150 |
300 |
750 |
| Search
dist. Block on Model -Y |
120 |
240 |
750 |
| Search
dist. Block on Model -Z |
70 |
80 |
80 |
| Max
distance accept data |
150 |
300 |
900 |
| Min
# comps per Block |
2 |
1 |
1 |
| Max
# comps per Block |
5 |
3 |
5 |
| Min
# comps per hole |
2 |
2 |
2 |
| Variable
Model |
SI13 |
SI13 |
SI13 |
| Variable
comp |
SIO2 |
SIO2 |
SIO2 |
| Pass |
PASS1 |
PASS2 |
PASS3 |
| Distance
along major |
30 |
60 |
90 |
| Distance
along minor |
175 |
350 |
525 |
| Distance
along vert |
85 |
170 |
260 |
| ROT |
0 |
0 |
0 |
| DIPN |
75 |
75 |
75 |
| DIPE |
45 |
45 |
45 |
| Limiting
Variable model |
RT13 |
RT13 |
RT13 |
| Code
model |
13 |
13 |
13 |
| Limiting
Variable composite |
CUSO |
CUSO |
CUSO |
Table
24 Estimation Parameters CaO
| Comment |
Pass
01 |
Pass
02 |
Pass
03 |
| Search
dis. Block on Model -X |
150 |
300 |
750 |
| Search
dis. Block on Model -Y |
120 |
240 |
750 |
| Search
dis. Block on Model -Z |
70 |
80 |
80 |
| Max
distance accept data |
150 |
300 |
900 |
| Min
# comps a Block |
2 |
1 |
1 |
| Max
# comps a Block |
5 |
3 |
5 |
| Min
# comps per hole |
2 |
2 |
2 |
| Variable
Model |
CA13 |
CA13 |
CA13 |
| Variable
comp |
CAO |
CAO |
CAO |
| Variable
Pass |
PSC13 |
PSC13 |
PSC13 |
| Pass
1 |
PASS1 |
PASS2 |
PASS3 |
| Store
Distance |
DIC13 |
DIC13 |
DIC13 |
| Store
max # comp |
NCC13 |
NCC13 |
NCC13 |
| Store
max # drillholes |
NDC13 |
NDC13 |
NDC13 |
| Store
krigeage variance |
SDC13 |
SDC13 |
SDC13 |
| Distance
along major |
30 |
60 |
90 |
| Distance
along minor |
175 |
350 |
525 |
| Distance
along vert |
85 |
170 |
260 |
| ROT |
0 |
0 |
0 |
| DIPN |
75 |
75 |
75 |
| DIPE |
45 |
45 |
45 |
| Limiting
Variable model |
RT13 |
RT13 |
RT13 |
| Codigo
model |
13 |
13 |
13 |
| Limiting
Variable composite |
CUSO |
CUSO |
CUSO |
| File
variogram |
allvar.
var |
allvar.
var |
allvar.
var |
The
geological modeling of the limestone deposit of the Tembladera quarry has been modeled considering the quality and geological characteristics
of the calcareous horizons, such interpretation was made based on the diamond drill holes carried out in the drilling campaigns, the
relationship between the information and the geological model is consistent.
| 11.8. | Resources
estimation |
Mineral
Resource estimates are effective December 31, 2023. All Mineral Resources are estimated as quantities at cement plant. For the estimation
of Mineral Resources, the content of CaO was considered, in addition to the content of impurities. The impurities are restrictions determined
by the cement production plant. Table 25 shows the quantity of Resources and the average values of their quality.
Table
25 Resource Categorization (exclusive of Reserves) at the Tembladera quarry
| |
Resources |
Tonnes
M |
CaO
(%) |
MgO
(%) |
Al2O3
(%) |
SiO2
(%) |
SO3
(%) |
| Limestone |
Measured |
122.6 |
49.33 |
1.83 |
1.82 |
4.76 |
0.31 |
| Indicated |
34.5 |
50.32 |
1.68 |
1.44 |
3.85 |
0.20 |
| Measured + Indicated |
157.1 |
49.55 |
1.80 |
1.74 |
4.56 |
0.29 |
| Inferred |
75.9 |
50.33 |
1.62 |
1.45 |
3.93 |
0.31 |
For
the determination of Resources, the costs of extraction, transportation, cement processing and cement dispatch were considered. The costs
are based on actual sources of current operations in Cementos Pacasmayo S.A.A. and the selling price of cement during 2024 (447.9 S/.
x t). Chapter 18 and 19 shows the costs and prices for the determination of Mineral Resources. The main factor for the determination
of Resources is quality. The cut off can be seen in Table 19. The Tembladera quarry is a sedimentary deposit in that sense the model
for the estimation of Resources has considered the Tembladera quarry as a unit, whose limestone production is carried out by 10 m banks.
| 11.8.2. | Reasonable
Prospects of Economic Extraction |
The
evaluation of mineral resources has considered other modifying factors such as limestone production costs, cement sales prices and the
environmental and social viability of our operations.
The
updating of the geological knowledge of the site is in process, a diamond drilling campaign has been carried out whose interpretation
is currently being prepared, this will allow us to deepen the geological knowledge of the quarry mainly in structures that deepen and
cut the calcareous horizons such as andesitic dams which constitute contaminating structures of the economic material.
From
an environmental and social point of view, Cementos Pacasmayo has been carrying out activities in Peru for more than 60 years and is
recognized as a Peruvian company with a high reputation. Therefore, environmental and social viability is expected to continue.
In
the near future, the inclusion of the new diamond drilling campaign developed in the eastern part of the pit (in production) will additionally
help us to understand the geology of the deposit and will also help us to reclassify the Inferred Resources found in that area of the
deposit.
| 11.8.3. | Mineral
Resources classification |
The
parameters for Resource classification used by Cementos Pacasmayo S.A.A. were obtained from the experience of calculating the optimum
drilling grid for sampling by geostatistical methods. Additionally, the variographic analysis was considered taking as reference the
variogram range. After considering all these, resource classification was based on the following criteria:
| - | Measured
Resource: 1/3 of the distance of the variogram range. |
| - | Indicated
Resource: 2/3 of the distance of the variogram range. |
| - | Inferred
Resource: The total distance of the variogram range. |
From
this basic configuration, several configurations have been defined, taking into account the number of holes and the average search distance.
Other factors used for Mineral Resource estimation are the maximum number of composites used per block and the number of drill holes
for each block, as shown in Table 23.
| 11.9. | Qualified
Person’s Opinion |
The
geological modeling of the limestone deposit of the Tembladera quarry has been modeled considering the quality and geological characteristics
of the calcareous horizons, said interpretation was made based on the diamond drill holes carried out in the drilling campaigns, the
relationship between information and data geological. model is consistent.
The
revision of the model for this report has been based on the review of the modeled calcareous horizons, slight modifications of the solids
with data related to the progress of production and the updating of the solids to the new topographical production base.
No
fundamental changes in the estimation plans or strategies have been considered, such as ranges or interpolation distances that could
considerably modify the resource model.
The
Tembladera quarry resource estimate has been developed following the best standards and modeling and estimation techniques of the mining
industry.
| 12. | Mineral
Reserves estimates |
The
total estimated Mineral Reserves in the Tembladera quarry are 77.8 M tonnes which are detailed in Table 26 in their different categories.
In
the periodic update of the Reserves of the Tembladera quarry, the Reserves produced within the update of the Resources and Reserves models
are taken into account, along with any changes to assumptions about “modifying factors” or the change and entry of any new
information if it had been generated.
The
quality metric used in the Mineral Resources and Reserves estimation is the calcium oxide (CaO) content. It is a stable variable in the
deposit, which develops in specific ranges depending on the lithological domain, and are characterized according to the strata or horizons
as they were deposited, with varying degrees of concentration.
Based
on the revised Mineral Resources model, the Mineral Reserves model was also updated with which the new design of the production pit was
made and elaborated.
The
Mineral Reserves estimated in the limestone deposit was 65.5 M of proven Reserves with 49.66% of CaO and 12.3 M of probable Reserves
with 49.63% of CaO for a total of 77.8 M of Reserves that support the mining plans for its production and the supply to Cementos Pacasmayo
S.A.A. plants.
A
LOM of 30 years has been calculated for the quarry. This based on the estimated Reserves and the plant’s limestone consumption projection
for the following years, provided by the management and financial control area, and is incremental until 2044 and fixed consumption thereafter.
| 12.1. | Criteria
for Mineral Reserves determination |
The
criteria used for the determination of Mineral Reserves are described below.
| 12.1.1. | Run
of Mine (ROM) determination criteria |
ROM
is all material produced in the quarry that complies with the specifications and will be sent to the plant for cement production. For
determining ROM tonnage, dilution is considered negligible. The recovery in the quarry was assumed to be 100%.
| 12.1.2. | Cement
plant recovery |
The
limestone received at the Pacasmayo plant is properly stored and then mixed with other raw materials to obtain the raw meal feed (kiln
feed). The use of limestone in the formulation of the raw meal is an average of 86.18%. After the crude is obtained, it is fed to the
calcination kiln to obtain clinker. Finally, the clinker is mixed with additions to obtain cement.
| 12.2. | Reserves
estimation methodology |
For
the determination of the Mineral Reserves, the costs of extraction, transportation and cement processing, including the quality restrictions
of the raw material, were considered. The costs are based on actual sources from the current operations of Cementos Pacasmayo S.A.A.
in Tembladera quarry and Pacasmayo plant. Chapter 18 shows the costs to determine the Mineral Reserves.
| ● | Proven
and Probable Reserves are derived from Measured and Indicated Resources, respectively. |
| ● | Proven
and Probable Reserves are within the pit designed for the Tembladera quarry. |
| ● | Reserves
are those for which economic viability has been demonstrated by discounted cash flow analysis
based on estimated capital and operating costs. |
| ● | Cementos
Pacasmayo S.A.A. has permits for limestone production at the Tembladera quarry. All material
considered to be Mineral Reserves are material for which CPSAA has mining permits. |
| ● | The
effective date of the Reserve estimate is December 31, 2023. |
| ● | The
Reserve estimate is the final product placed in the Pacasmayo plant. |
The
quality restrictions for limestone at the Pacasmayo cement plant are Al2O3, CaO, MgO, SO3 and SiO2.
These restrictions are used for Limestone Type I, Limestone Type V, Limestone Type Cal and Limestone Type Adición.
From
the quality point of view, the cut-off grade for limestone is 48.6% CaO and from the economic point of view, the results are shown in
Chapter 19.
The
economic analysis for the estimation of Mineral Resources and Reserves is presented in Chapter 19. Reserves are expressed in millions
of tonnes and are shown in Table 26.
Table
26 Mineral Reserves expressed in millions of tonnes
| |
Reserves |
Tonnes
M
|
CaO
(%)
|
MgO
(%)
|
Al2O3
(%)
|
SiO2
(%)
|
SO3
(%)
|
| Limestone |
Proven |
65.5 |
49.66 |
1.52 |
1.54 |
4.60 |
0.37 |
| Probable |
12.3 |
49.63 |
1.57 |
1.56 |
4.91 |
0.28 |
| Total |
77.8 |
49.65 |
1.53 |
1.54 |
4.65 |
0.36 |
The
Reserves calculated for the quarry from the Mineral Resources consider the risk factors and modifying factors within which the quality
factors are considered as the most sensitive ones that by their nature can affect the Reserves. Although the main variable is CaO, which
is very stable in the deposit, there are others that determine the quality of the Reserves and could even affect the process if they
are not adequately controlled, such as the SO3 content.
In
the process of calculating Reserves, and in the quarry production plans, these variables have been adequately considered in the mining
plan; properly sequenced, and with blending processes.
In
addition to quality factors, ore reserves could change from operating performance-controlled production costs, allowing for maximization
of the use of resources in the extractive processes for the use of resources in the extractive processes for the industrialists, guaranteeing
the LOM of the quarry.
Cementos
Pacasmayo S.A.A. is the current owner of the Tembladera quarry. The production of the quarry has been outsourced to a specialized contractor,
San Martin Contratistas Generales S.A., who conducts limestone mining activities. Cementos Pacasmayo S.A.A. supervises the quarry to
verify the activities and production according to the requirements of the Cement plant.
| 13.1. | Mining
Methods and Equipment |
The
mining method is open pit mining, which consists of mining in a series of benches with pit expansion possible both vertically and laterally.
At Tembladera, mining generally proceeds top-down with a bench height of 10 metres and no more than 3 working benches open simultaneously.
The materials are loaded by 3 excavators and transported to the primary crusher or waste dump by 10 trucks.
The
transported material passes through the primary crusher, which reduces the fragments to a size of less than 4”. The crushed limestone
is accumulated in 2 piles to separate the products and/or ease the following secondary crushing operation, which is generally carried
out for limestone lime-type, bringing the granulometry of that limestone to less than 45 mm.
The
secondary crusher only processes limestone destined for lime production, after which the product is screened using meshes of size 24
mm, 12 mm and 8 mm. The two coarse products are used for lime and the fine product is used as raw material for Type V cement. As a request
of Pacasmayo cement plant, the secondary crusher is processing Type I limestone.
Figure
9 Tembladera quarry mining sequence

The
mining of limestone at the Tembladera quarry includes the following unit operations:
Drilling
is mainly done with 1 hydraulic drill with a second one on standby and used if necessary. The work is done in two 12-hour shifts with
20 effective hours and 4.0 hours of operational and non-operational delays.
The
Blasting fragments the rock to a suitable size for efficient loading, hauling and crushing operations. The operation mainly uses ANFO
as the blasting agent, and non-electric detonators are used to mitigate vibration and sound.
After
blasting, the Quality Control staff delimits the zones according to the results of blast hole sampling to define the material destinations.
The excavators then load the material into trucks, which transport it to the assigned destination (waste dump or crusher).
The
purpose of crushing is to reduce the size of the rock as a result of blasting to the size required by the plant. The quarry has 2 types
of crushers:
Primary
Crusher
The
Primary crusher, which is an Allis Chalmers 7”, is used to reduce the ROM limestone to sizes less than 4” at an average crushing
rate of 700 tonnes/hour. After the primary crushing, the material is separated in two hoppers depending on the type of material and its
granulometry.
Secondary
Crusher
The
secondary crusher, which is a Symons 5 1/2, reduces limestone sizes further to less than 45 mm at an average of 130 tonnes per hour.
The limestone then passes through screens and is classified into 3 sizes of 45mm-25mm, 25mm-12.5mm and 12.5mm-8mm. As a request of Pacasmayo
cement plant, the secondary crusher is processing Type I limestone.
The
main equipment used to carry out mining activities at the Tembladera quarry are shown in Table 27 and Table 28 shows the auxiliary equipment.
Table
27 Main equipment of the Tembladera quarry
| Equipment |
Quantity |
Function |
Description |
| Track
Drill |
1 |
Drilling |
This
machine is used to drill holes for blasting. |
| Primary
Crusher |
1 |
Material
Crushing |
This
equipment allows to reduce the particulate size from 12” to 4”. |
| Secondary
Crusher |
1 |
Material
Crushing |
This
equipment allows to reduce the particulate size from 4” to 12.5mm and also to classify it by size. |
| Caterpillar
tractor |
1 |
Material
Loading and Stacking |
Equipment
used to move the fragmented material resulting from blasting. |
| Front
Loader and Excavator |
5 |
Material
Loading and Stacking |
Material
handling equipment. |
| Dump
truck |
10 |
Material
hauling |
Equipment
for conveying material from the production areas to the primary crusher. Their capacity is 20 m3. |
Table
28 Auxiliary equipment of the Tembladera quarry
| Equipment |
Quantity |
Function |
Description |
| Pickup
van and Bus |
4 |
Personnel
Transportation |
Personnel
and material transport units. |
| Tanker
truck, Lucanteraire, Lubricator truck, Mobile crane, Compressor, Welding machine, Ambulance and Fuel Tanker Truck. |
11 |
Auxiliary
equipment |
Auxiliary
equipment to ensure the operability of quarry equipment and personnel. |
| Motor
grader, Compactor |
2 |
Track
maintenance |
Equipment
used for track maintenance. |
| Hydraulic
Hammer |
1 |
Breaking
banks |
Equipment
used to reduce the fragment size greater than 12” in the primary crusher. |
The
stability study prepared by DCR Ingenieros S.R. Ltd in 2007 was used until 2020. The slope stability study established 10 zones within
the deposit. For the period from 2021 and onwards, the update made by Magma Consulting S.A.C. shown in Tables 29 and 30 will be applied.
Table
29 Parameters of design according to geotechnical zonification
| Domain |
Bench
height
(m) |
Design |
Berm
width (m) |
Slope
azimuth
range |
BFA
(°) |
IRA
(°) |
| Domain
01 |
10 |
47 |
35 |
5.16 |
80-140 |
| Domain
02 |
10 |
50 |
36 |
5.37 |
NA |
| Domain
03 |
10 |
47 |
35 |
5.04 |
80-130 |
| 10 |
65 |
43 |
6.10 |
<80 and
130< |
| Domain
04 |
10 |
65 |
43 |
6.10 |
<105
and 170< |
| 10 |
48 |
35 |
5.27 |
105-170 |
| Domain
05 |
10 |
70 |
45 |
6.40 |
NA |
| Domain
06 |
10 |
70 |
45 |
6.40 |
NA |
| Domain
07 |
10 |
70 |
45 |
6.40 |
NA |
| Domain
08 |
10 |
70 |
45 |
6.40 |
NA |
| Domain
09 |
10 |
58 |
41 |
5.30 |
NA |
| Domain
10 |
10 |
65 |
41 |
6.84 |
<10
and 50< |
| Domain
11 |
10 |
65 |
41 |
6.84 |
NA |
*
Note:
BFA:
Slope angle
IRA:
Inter ramp angle
It
is recommended to have a bench for each 150 m of slope, this bench should be at least 10.5m wide and for blocks 1, 2, 3 and 4 it should
be at 602 m above sea level.
Table
30 Reviewed Safety Factor 2021
| Section |
Description |
Safety
factor |
| Static |
Pseudo-static
K=0.147g |
| S-1 |
Global
Fault |
4.23 |
3.29 |
| S-2 |
Global
Fault |
3.49 |
2.72 |
| S-3 |
Global
Fault |
2.92 |
2.30 |
| S-4 |
Global
Fault |
2.90 |
2.29 |
| S-5 |
Global
Fault |
3.14 |
2.52 |
| S-6 |
Global
Fault |
3.42 |
2.77 |
| S-7 |
Global
Fault |
3.33 |
2.69 |
| S-8 |
Global
Fault |
4.90 |
3.97 |
| S-9 |
Global
Fault |
6.21 |
4.78 |
| S-10 |
Global
Fault |
5.00 |
4.06 |
| S-11 |
Global
Fault |
5.02 |
3.91 |
| S-12 |
Global
Fault |
3.04 |
2.43 |
In
2021 the hydrogeological study was conducted by Magma Consulting S.A. and based on the hydrogeological interpretation, basin morphology,
lithology, piezometric levels, recharge and discharge zones, and piezometry, groundwater is at a depth of 300 m with respect to the topographic
elevation of the Tembladera quarry.
| 13.4. | Other
Mine Design and Planning Parameters |
The
limestone production achieved as of December 2023 is 1,842,375 tonnes and 118,316 tonnes of waste rock was removed, which gives a stripping
ratio of 0.06. Based on the plant requirements and sales projection for the next 30 years, the pit design parameters for the Tembladera
quarry are presented in Table 31.
Table
31 Summary of Tembladera quarry design parameters
| Description |
Value |
| Interramp
slope angle |
variable
between 35° and 45° |
| Bench
slope angle insitu |
variable
between 47° and 70° |
| Bench
height |
10
metres |
| Safety
bench |
5.04
to 6.40 meters |
| Width
of ramps |
12.0
meters (including safety berm and curb and gutter |
| Safety
berm height |
1.30m |
| Ramp
gradient |
10%
to 12% |
| 13.5. | Annual
Production Rate |
Considering
that the cement plant demands an average annual production of 2.6 million tonnes per year of limestone, the plan for the following 30
years is shown in Table 32.
The
proposed mining plan for the next 30 years is presented in Table 32.
Table
32 Mining plan for the next years
| Year | |
Year | | |
Tonnes | | |
CaO | | |
MgO | | |
SO3 | | |
Al2O3 | | |
SiO2 | |
| 1 | |
| 2024 | | |
| 2,362,261 | | |
| 49.67 | | |
| 1.66 | | |
| 0.24 | | |
| 1.56 | | |
| 4.64 | |
| 2 | |
| 2025 | | |
| 2,543,433 | | |
| 50.02 | | |
| 1.56 | | |
| 0.25 | | |
| 1.44 | | |
| 4.33 | |
| 3 | |
| 2026 | | |
| 2,550,091 | | |
| 49.66 | | |
| 1.48 | | |
| 0.21 | | |
| 1.60 | | |
| 4.80 | |
| 4 | |
| 2027 | | |
| 2,515,031 | | |
| 49.85 | | |
| 1.39 | | |
| 0.30 | | |
| 1.54 | | |
| 4.63 | |
| 5 | |
| 2028 | | |
| 2,515,031 | | |
| 49.78 | | |
| 1.29 | | |
| 0.29 | | |
| 1.60 | | |
| 4.87 | |
| 6 | |
| 2029 | | |
| 2,515,031 | | |
| 49.71 | | |
| 1.39 | | |
| 0.37 | | |
| 1.61 | | |
| 4.73 | |
| 7 | |
| 2030 | | |
| 2,515,031 | | |
| 49.88 | | |
| 1.47 | | |
| 0.33 | | |
| 1.54 | | |
| 4.54 | |
| 8 | |
| 2031 | | |
| 2,515,031 | | |
| 50.01 | | |
| 1.43 | | |
| 0.31 | | |
| 1.54 | | |
| 4.49 | |
| 9 | |
| 2032 | | |
| 2,531,663 | | |
| 49.68 | | |
| 1.22 | | |
| 0.32 | | |
| 1.57 | | |
| 4.84 | |
| 10 | |
| 2033 | | |
| 2,542,796 | | |
| 49.23 | | |
| 1.35 | | |
| 0.39 | | |
| 1.56 | | |
| 5.42 | |
| 11 | |
| 2034 | | |
| 2,554,151 | | |
| 50.11 | | |
| 1.44 | | |
| 0.43 | | |
| 1.28 | | |
| 4.30 | |
| 12 | |
| 2035 | | |
| 2,565,734 | | |
| 50.08 | | |
| 1.55 | | |
| 0.37 | | |
| 1.28 | | |
| 4.30 | |
| 13 | |
| 2036 | | |
| 2,577,548 | | |
| 49.92 | | |
| 1.53 | | |
| 0.34 | | |
| 1.39 | | |
| 4.32 | |
| 14 | |
| 2037 | | |
| 2,589,598 | | |
| 49.92 | | |
| 1.56 | | |
| 0.38 | | |
| 1.38 | | |
| 4.30 | |
| 15 | |
| 2038 | | |
| 2,601,890 | | |
| 49.24 | | |
| 1.52 | | |
| 0.48 | | |
| 1.75 | | |
| 5.02 | |
| 16 | |
| 2039 | | |
| 2,614,427 | | |
| 50.08 | | |
| 1.52 | | |
| 0.39 | | |
| 1.43 | | |
| 4.31 | |
| 17 | |
| 2040 | | |
| 2,627,215 | | |
| 49.44 | | |
| 1.51 | | |
| 0.45 | | |
| 1.59 | | |
| 4.67 | |
| 18 | |
| 2041 | | |
| 2,640,258 | | |
| 49.86 | | |
| 1.59 | | |
| 0.39 | | |
| 1.50 | | |
| 4.38 | |
| 19 | |
| 2042 | | |
| 2,652,799 | | |
| 49.12 | | |
| 1.70 | | |
| 0.35 | | |
| 1.73 | | |
| 5.04 | |
| 20 | |
| 2043 | | |
| 2,657,046 | | |
| 49.99 | | |
| 1.57 | | |
| 0.40 | | |
| 1.48 | | |
| 4.33 | |
| 21 | |
| 2044 | | |
| 2,660,903 | | |
| 48.87 | | |
| 1.78 | | |
| 0.39 | | |
| 1.88 | | |
| 5.30 | |
| 22 | |
| 2045 | | |
| 2,660,903 | | |
| 49.57 | | |
| 1.54 | | |
| 0.38 | | |
| 1.60 | | |
| 4.56 | |
| 23 | |
| 2046 | | |
| 2,660,903 | | |
| 49.90 | | |
| 1.49 | | |
| 0.37 | | |
| 1.43 | | |
| 4.34 | |
| 24 | |
| 2047 | | |
| 2,660,903 | | |
| 49.56 | | |
| 1.62 | | |
| 0.34 | | |
| 1.67 | | |
| 4.59 | |
| 25 | |
| 2048 | | |
| 2,660,903 | | |
| 49.34 | | |
| 1.64 | | |
| 0.41 | | |
| 1.59 | | |
| 4.87 | |
| 26 | |
| 2049 | | |
| 2,660,903 | | |
| 49.92 | | |
| 1.54 | | |
| 0.36 | | |
| 1.48 | | |
| 4.25 | |
| 27 | |
| 2050 | | |
| 2,660,903 | | |
| 49.98 | | |
| 1.49 | | |
| 0.38 | | |
| 1.41 | | |
| 4.25 | |
| 28 | |
| 2051 | | |
| 2,660,903 | | |
| 49.40 | | |
| 1.72 | | |
| 0.35 | | |
| 1.64 | | |
| 4.54 | |
| 29 | |
| 2052 | | |
| 2,660,903 | | |
| 49.76 | | |
| 1.72 | | |
| 0.36 | | |
| 1.43 | | |
| 4.17 | |
| 30 | |
| 2053 | | |
| 2,660,903 | | |
| 49.90 | | |
| 1.67 | | |
| 0.34 | | |
| 1.49 | | |
| 4.26 | |
| Total general | |
| | | |
| 77,795,094 | | |
| 49.71 | | |
| 1.53 | | |
| 0.36 | | |
| 1.53 | | |
| 4.58 | |
| * | Limestones
that contain elements out of the design range, a dosage is made for the crude in the cement production. |
In
the same period of 30 years, the removal of waste rock will be a stripping average of 0.17 tonnes of waste rock/limestone, according
to the mine plan.
Figure
10 Tembladera quarry final pit
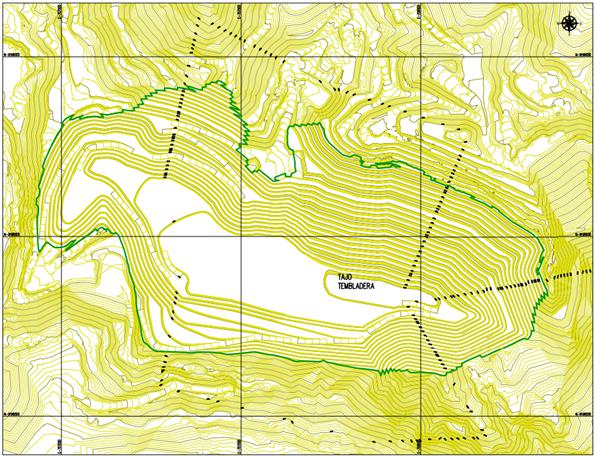
The
life of the Tembladera quarry is 30 years.
Cementos
Pacasmayo personnel develop its operations at the Tembladera quarry with its staff and contractors.
| 14. | Processing
and recovery methods |
The
cement production involves the following stages:
Receiving
raw materials: the limestone is produced from the Tembladera quarry, as described in Chapter 13. The other raw materials are obtained
from third party companies and in the case of clay, it is obtained from our own quarry on the Señor de los Milagros de Pacasmayo
property.
Grinding
and homogenization: once the limestone is received at the plant, it is mixed with clay, sand and iron. The mixture must comply with the
quality standards to be sent to a storage silo from where it is fed the preheater of the clinker kiln.
Clinkerization:
the blend is heated at a temperature of approximately 1,450 Celsius degrees in rotary kilns whose product is clinker. The clinker is
then cooled at a temperature of approximately 200 Celsius degrees and is stored in a silo or in an open-air yard.
Cement
grinding: after being cooled, the clinker, together with the additions, is entered into a mill to obtain a fine powder called cement.
Storage
in silos: after passing through the mills, the cement is transferred on conveyor belts or grutters and stored in concrete silos to preserve
its quality until distribution.
Packaging,
loading and transportation: the cement is moved through conveyor belts and pneumatic conveyors to bagging systems to be packed into bags
and then loaded to the trucks for distribution.
| 14.2. | Raw
materials for the cement production |
At
the Pacasmayo plant, the following raw materials and additions are used in the production of cement.
Raw
materials
Limestone:
a material composed largely of calcium carbonate, is used as raw material and also as additive in the production of cement.
Sand:
inert material composed basically of crystalline silica, aluminum and alkalis, such as potassium and sodium.
Iron:
inert material composed basically of iron oxide (Fe2O3).
Clay:
inert material composed basically of silicon, aluminum and a low proportion of alkalis such as potassium and sodium.
Coal:
a solid, black or dark brown mineral that contains essentially carbon, as well as small amounts of hydrogen, oxygen and nitrogen.
Raw
meal: the artificial mixture of limestone, clay, sand and iron, which is used to produce clinker.
Clinker:
product obtained during the calcination of the mixture of limestone, sand, clays and iron.
Fossil
fuel
Bunker
oil: fuel used as an energy source in the calcining kiln.
Additions
Slag:
artificial pozzolanic material that can set in contact with water and can develop compressive strength.
Pozzolan:
materials containing silica and/or alumina, which can be of natural or artificial origin.
Gypsum:
material composed of calcium sulfate hydrates. When gypsum is mixed with the clinker, it allows for better control of the setting
time when the cement initiates the hydration reactions. The mineral gypsum may contain crystalline silica.
Figure
11 shows the flow sheet for the cement production at the cement plant.
Figure
11 Pacasmayo plant process block diagram
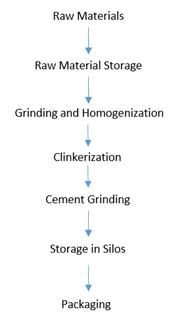
Table
33 below shows the design and production capacities for clinker and cement.
Table
33 Main equipment in Pacasmayo plant
| Equipment |
Product |
Capacity of production* |
Unit |
|
Raw meal Mill 1
Raw meal Mill 2
Raw meal Mill 3 |
Raw meal |
594,000
1,425,600
633,600 |
tonnes/year |
|
Miag 1
Miag 2 |
Coal |
95,040
126,720 |
tonnes/year |
|
Kiln 2
Kiln 3
Kiln 4 |
Clinker I-V |
264,000
831,600
660,000 |
tonnes/year |
|
Cement Mill 4
Cement Mill 6
Cement Mill 7 |
Cement Type I-V |
498,960
1,211,760
1,211,760 |
tonnes/year |
|
Bagging system 3
Bagging system 4
Bagging system 5
Bagging system 6 |
Cement |
1,080,000
1,500,000
1,500,000
1,440,000 |
bags/month |
| * | The
equipment capacities consider 330 days of production. |
| 14.5. | Material
balance cement plant |
The
following section presents information on the material balance at Pacasmayo plant for cement production.
Table
34 shows the balance of crude production, while Table 35 shows the material balance of clinker production at the Pacasmayo plant considering
the use of limestone obtained from the Tembladera quarry, coal, clay, sand, and iron as part of the raw material for the production of
clinker. Table 36 shows the balance for cement production considering the additions used for the mixture with clinker and consequently,
cement production.
Table
34 Balance for crude production
| Raw material | |
Annual quantity (tonnes/year) | | |
Dosage | |
| Limestone | |
| 1,473,764 | | |
| 86.18 | % |
| Others | |
| 236,263 | | |
| 13.82 | % |
| Crude Type I and Crude Type V | |
| 1,710,028 | | |
| 100 | % |
Table
35 Balance for clinker production
| Crude | |
Annual quantity (tonne/year) | |
| Crude Type I, CrudeType V and Coal* | |
| 1,848,530 | |
| Clinker Type I and Clinker TypeV | |
| 1,195,802 | |
| * | Additionally,
clinker imported during 2023 amounted to a total of 63,993 tonnes. |
Table
36 Balance para producción de cemento.
| Raw Material | |
Annual quantity (tonnes/year) | | |
Dosage | |
| Clinker | |
| 1,195,802 | | |
| 72.22 | % |
| Additions | |
| 460,027 | | |
| 27.78 | % |
| Cement | |
| 1,655,829 | | |
| 100 | % |
| * | The
amount of limestone used as an addition was 227,429 tonnes. |
Losses
in the cement production process associated with the raw material (limestone) are 0.53% due to the rainy season and the phenomenon of
cyclone Yaku.
Pacasmayo
plant has a water treatment plant (PETAT) for the kiln cooling system during clinker production. The cooling water is used in the clinker
and cement grinding processes. It is also used to irrigate green areas and accesses. 386,981 m3 of water was consumed at the
Pacasmayo Plant during its operations in 2023.
| 14.8. | Fossil
fuel consumption |
Liquid
fuels are used for the various engines in the operation. Table 37 shows the consumption of liquid fuels used at the Pacasmayo plant.
Table
37 Fuel consumption in Pacasmayo plant
| Fuel |
Consumption |
Description |
| Diésel |
457,016 (gal/year) |
P. Cal 41.2 Gj/t |
| Oil 6 |
540,352 (gal/year) |
P. Cal 43.7 Gj/t |
| 14.9. | Electric
power consumption |
The
Pacasmayo plant has an electrical substation with a capacity of 105 MVA, which is supplied by the national grid. 653,578 GJ of energy
was consumed at the Pacasmayo plant during its operations in 2023.
Cementos
Pacasmayo has implemented a preventive and corrective maintenance plan with the purpose of not interrupting cement production.
Cementos
Pacasmayo maintains the operational efficiency to control costs and operating margins. Cementos Pacasmayo has initiatives to diversify
the energy sources and secure the supply when possible.
Cementos
Pacasmayo personnel develop its operations at the Pacasmayo plant with its staff and contractors.
The
quarry consumes electrical energy supplied by the national electricity system through Hidrandina S.A. company. The supply is aerial with
medium voltage of 2.3 KV. The Tembladera quarry has electricity sub-stations located in coordinates UTM 707345 E and 9197947 N, it occupies
a surface area of 1,062 m2.
The
supply of liquid fuels to the Tembladera quarry is through a contractor.
The
water is used to water the roads, limestone in loads, demolition, vegetation, consumption and sanitary facilities.
The
Tembladera quarry has the following facilities:
DME
01 Dump
The
current elevation of the upper platform of the DME-1 dump is 535 meters above sea level. To ensure the physical stability of this dump
and increase its storage volume, it has been designed to reach an upper platform elevation of 545 meters above sea level at a slope of
2.5H:1V.
DME
05A Deposit
To
ensure the physical stability of this future dump, it has been deemed convenient to maintain the upper platform at 740 masl at a slope
of 2.5H:1V.
Low
grade stockpile
The
design has a low-grade stockpile with a slope angle of 35° and a berm width of 10m with a minimum elevation of 532 masl and a maximum
elevation of 580 masl, reaching a capacity of 1 M m3.
The
auxiliary facilities at the Tembladera quarry are administrative offices, explosives storage, key yard, power house, crushers and the
auxiliary service facilities are interconnected to the electrical system of the Central-North system for power supply.
There
are also additional facilities at the Tembladera quarry, as described in Table 38.
Table
38 Tembladera quarry Facilities*
| Facility | |
Area m2 | |
| Offices | |
| 972 | |
| Explosives warehouse 2-3 | |
| 156 | |
| Truck Scale N°2 | |
| 65 | |
| Loading Tunnel | |
| 78 | |
| Ore Belt N°4, 5 and 6 | |
| 195 | |
| Meteorological Station | |
| 17 | |
| Septic Well | |
| 8 | |
| Recreational Complex | |
| 4,362 | |
| * | Source,
EIA (Environmental Impact Study) |
Figure
12 Mining Facilities
Electricity
is supplied by the national grid and there is a contract with Electro Perú, which supplies energy through two 60 KV
transmission line. There is also a sub-station with three power transformers of 30, 37.5 and 37.5 MVA at ONAF, equivalent to 28.8
MW, 36 MW and 36 MW of active power, respectively.
The
Pacasmayo plant is supplied with fuel by a contractor and has a fuel tank for regular vehicle fueling.
Water
supply at the Pacasmayo plant is provided by a groundwater well, Cementos Pacasmayo is allow to draw 561,932
m3 per year.
Cementos
Pacasmayo is a leading company in the cement production and other construction materials in the north of Peru. This chapter describes
the cement market as well as the macro and microeconomic factors that define it.
For
the description of the cement market in Peru, public information has been collected from different sources, such as the Central Reserve
Bank of Peru (BCRP), National Institute of Statistics and Informatics (INEI), Association of Cement Producers (ASOCEM), Ministry of Housing,
Construction and Sanitation, Superintendency of Tax Administration and the Peruvian Construction Chamber. In addition to this information,
this chapter also relies on statistics provided by the company, CPSAA, to provide a better understanding of its specific market.
| 16.1. | The
cement market in Peru |
The
Peruvian cement market is geographically segmented by regions: north region, central region and south region. Diverse companies supply
each region. Figure 13 is an illustration of the Peruvian map and of its 3 regions, according to the segmentation of cement market, where
each region is the main area of influence of domestic cement companies.
Figure
13 Segmentation of the cement market in Peru
The
main companies which deal with the cement market in Peru are: Cementos Pacasmayo S.A.A., UNION Andina de Cementos S.A.A., Yura S.A. and
Cementos Selva S.A.C. Additionally, there are companies that import cement or clinker, such as Caliza Cemento Inca S.A., Distribuidora Cemento
Nacional S.A.C., CEMEX Perú S.A., Cal & Cemento Sur S.A., amongst others.
Table
39 shows the cement shipments at domestic level (in thousand of tonnes):
Table
39 Cement shipments at domestic level (in thousands of tonnes)
| | |
2021 | | |
2022 | | |
2023 | |
| National cement shipments | |
| 12,500.0 | | |
| 14,113.3 | | |
| 12,175.7 | |
| Overall cement shipments (CPSAA/CSSAC, 3 plants) | |
| 3,625.2 | | |
| 3,436.8 | | |
| 2,936.6 | |
| Pacasmayo plant shipments | |
| 1,970.9 | | |
| 1,766.7 | | |
| 1,634.8 | |
Sources:
ASOCEM and CPSAA/CSSAC.
The
types of cement produced by the main cement companies of the country are Type I, Type V, Type ICO, Type IL, Type GU, Type MS (MH), Type
HS, Type HE and Type MH.
It
is important to mention that, according to the main requirement standards, Peruvian Technical Standards, cements are divided into five
types:
| ● | NTP
334. 009 2013. Cements Portland. Requirement. (ASTM C 150). |
| ● | NTP
334. 090 2013. Cements Portland Added. Requirements. (ASTM C595). |
| ● | NTP
334. 082 2011. Cements Portland. Performance Specification. (ASTM C1157). |
| ● | NTP
334. 050 2004. Cements Portland White. Requirements. (ASTM C150). |
| ● | NTP
334. 069 2007. Building Cements. Requirements. (ASTM C091). |
Cementos
Pacasmayo only produces cement that meets the first three NTP standards.
| 16.2. | Industry
and Macroeconomic Analysis |
Producer
and trading companies of cement compete mainly within the limits of their area of influence, which is determined by the geographical
location of their plants, giving rise to segmentation of the national market. However, the north region presents a high demand potential
because of the infrastructure gap, the housing deficit and a higher capillarity in terms of important adjacent cities with an urbanization
level lower than in the central and south region.
On
the other hand, it highlights the importance of transportation in the structure of cement costs; composed primarily of raw materials,
fuels and transport.
The
cement market and the industry in Peru have the following characteristics:
| ● | Base
of consumers highly segmented, informal and of low Resources. |
| ● | Low
costs of energy and raw materials. |
| ● | Zone
of influence / distribution determined by geographical location of the plant. |
| ● | High
correlation level between public and private investment, and self-construction. |
The
construction sector and cement industry have a behavior directly related to the Gross Domestic Product (GDP) and Private Consumption.
Figure 14 shows how the GDP of the construction sector (variation % monthly) accompanies the cyclic behavior of the Global GDP (variation
% monthly), showing variations of lower significance than those of the Global GDP, but in the same direction. It is also noted that,
in May 2020, the GDP of the construction sector had a positive variation of more than 200% (with regards to the previous month), whilst
the Global GDP was only 10%. This was due to the confinement measures given by the Government to counter the Covid-19 pandemic. This
reactivation was motivated primarily by the private-construction sector consumption. Under the uncertainty conditions caused by the sanitation
and economic crisis in 2020, consumers showed savings behaviors, which meant that people preferred consumption of goods for home improvement,
amongst them, cement. This trend was maintained throughout 2021. However, in 2023 there was a decrease in demand for public and private
investment due to the political and social situation. As a result, cement volumes are returning to pre-covid levels.
Figure
14 Global GDP and Construction sector GDP MoM variation (%)
Source:
INEI 2021
The
cement industry is also motivated by housing sector growth, public and private investment in infrastructure, mining projects,
shopping centers, construction of transportation systems, etc. Thus, one of the variables with more impact on cement industry
and future demand is the infrastructure gap which remains high in the country. For the 2016 – 2025 period, the infrastructure
gap is estimated at US$ 160 billion, and this is present in the main economic sectors and services of public supply; that is:
Transportation (36%), Energy (19%), Telecommunications (17%), Health (12%), Sewage System (8%), Irrigation (5%) and Education (3%).
The 90% of the roads not comprised in the large national road network still remain unpaved; only 40% of schools have access to basic
services such as water, electricity and sewage system. There are only 15 hospital beds for every 10,000 individuals, vs. 27 beds
recommended by the WHO.
In
2023, the cement market contracted by 14% compared to 2022, while it grew by 20% in 2019 (pre-pandemic). However, by 2024, it is expected
to have 2.6% growth compared to 2023. Climatic (cyclone Yaku) and social (protests and blockades) factors impacted domestic cement dispatches. In
addition, regional and local and local governments began new administrations with lower-than-expected public spending than expected.
Given
greater stability in the sector, a moderate growth of 2% in cement shipments is expected by 2024
| 16.3. | The
North Region Market |
Cementos
Pacasmayo, a leading company in the production and sales of cement in the North Region, has market presence in the following cities:
Cajamarca, Chiclayo, Chimbote, Jaén, Pacasmayo, Piura, Rioja, Tarapoto, Trujillo, Tumbes, Yurimaguas and Iquitos. The company
has a Market share of 93.8% in the north region of the country.
Overall
shipments of Pacasmayo plant for 2023 were 1,634.8 thousand tonnes. Pacasmayo plant supplies almost 52.2% of the cement demand of the
North Region.
Other
companies with lower presence in the cement market of the North Region are:
These
companies are competitors of Pacasmayo plant.
Cementos
Pacasmayo S.A.A in its Pacasmayo plant produces different types of cement and it has in the National Market, different trademarks to
deal with diverse segments of the market. Table 40 shows the products in Pacasmayo plant.
Table
40 Types of products of Pacasmayo Cement plant
| Business
Name |
|
Use |
|
Comment |
| Cemento
Portland |
|
|
|
|
| Cement
Type I |
|
Cement
for general use. |
|
The
average result of resistance to compression is higher than the minimum requirement set forth in the technical standard NTP 334.009
/ ASTM C150. |
| Cement
Type V |
|
For
works, structures exposed to soils with high sulphate (salt residue).
|
|
The
average result of resistance to compression is higher than the mínimum requirement set forth in the technical standard NTP
334.009 / ASTM C150. |
| Qhuna
Type I |
|
For
use in construction Works in general, manufacturing of bricks, sewage systems, paving stones, to lay bricks, plaster with cement,
to cover with majolicas, preparation of concretes in foundations, over foundations, brake shoes, beams, columns and building roofs.
|
|
Complies
with the requirements of technical standards NTP 334.009 and ASTM C 150. |
| Cemento
Portland Added |
|
|
|
|
| Cement
Fortimax |
|
Ideal
for Works which require moderate h heat, for Works exposed to sulphate action and for Works near to large water sources (sea, lakes,
rivers, etc.) |
|
The
average result of resistance to compression is higher than the mínimum requirement set forth in technical standard NTP 334.082
/ ASTM C1157. |
| Cement
Extra Forte |
|
Ideal
for the execution of structural Works, repairs, remodelings, home applications, floors, levelings, grouts, tips, prefabricated elements
of small and medium size and concrete elements which require special characteristics. |
|
The
average result of resistance to compression is higher than the mínimum requirement set forth in technical standard NTP 334.090. |
| Cement
Ultra Armado |
|
Ideal
for the execution of structural Works, elaboration of mortars for floors, leveling, grouts and tips and production of prefabricated
elements of small and medium size.
|
|
The
average result of resistance to compression is higher than the mínimum requirement set forth in technical standard NTP 334.090
/ ASTM C595. |
| Cement
Type HE |
|
|
|
|
| Cements
fir Prefabrications |
|
For
construction elements. |
|
The
average result of resistance to compression is higher than the mínimum requirement set forth in technical standard NTP 334.009
/ ASTM C150. |
| Qhuna
Structural |
|
|
|
|
| Hydraulic
Cements specified by performance |
|
|
|
|
| Line
Mochica MS |
|
For
structures in contact with environements and humid and salty soils. |
|
|
| Line
Mochica GU |
|
Cement
of general use. |
|
|
| Qhuna
MS |
|
Structural
elements and non-structural which are exposed to environments and humid salty soils.
|
|
Complies
with the requirements set forth in standard ASTM C 1157 and NTP 334.082. |
The
prices of cement in the Peruvian market vary pursuant to their type and their geographical location. The price difference of each type
is explained primarily by the dosifications of raw materials and additions, whilst the variations for geographical location are caused
by the freights for the distribution to the points of sale.
At
domestic level, the cement price in 2023 was, on average, 690.59 S/ x t. Figure 15 shows the historic prices of cement in Peru.
Figure
15 Historic prices of cement in Peru
Source:
Ministerio de Vivienda, Construcción y Saneamiento (December 2023).
Figure
15 shows the sustained growth of the price of more than 4% per year, from 2017 until 2018, it fell slightly in 2019 to climb back up
again in 2020.
| 16.5. | Current
and future demand |
Cement
demand at the national level is met by local shipments (local production), for the most part, and by imports. In 2023, 11.20 M tonnes
were shiped locally; 13.6% less than in the same period of 2022 (12.97 M). Imports amounted to 0.21 M tonnes during 2023; 21.9% below
the 2022 figure (0.27 M).
Figure
16 shows the evolution of the national demand of cement, expressed in thousand of tonnes, since 2017.
Figure
16 Evolution of the national demand of cement

Source:
ASOCEM
It
is noted that domestic demand has been growing, on average, at a rate of 3% per year, with the exception of 2020, which is considered
an atypical year due to the adverse effects of the pandemic and the confinement measures, to then take a historic leap in 2021 with an
annual increase of 38%. During 2023, shipments decreased by 13.8% compared to 2022 as a result of the political and social situation
in the country.
According
to our internal information, in terms of regional distribution, the Northern Region accounts for approximately 25.6% of domestic cement
demand, the Central Region for 54.5%, and the Southern Region for 19.9%.
Cementos
Pacasmayo’s cement shipments (3 plants) reached 2,936.6 thousand tonnes in 2023, capturing a 24.1% share of total shipments in
Peru and 93.8% in the Northern Region. This is 15% less than in 2022 (3,436.8 thousand tonnes).
The
company invested US$87.4 million in the clinker line optimization project at the Pacasmayo plant, which includes the construction of
a new kiln that will increase clinker production capacity by 600,000 tons per year. The project will optimize production costs in the
short term and medium term to meet market demand for cement.
Despite the decline in cement dispatches in 2023, demand is expected to increase due to the high infrastructure deficit in the northern
region. For this reason, the company’s strategic priority is investing in the new clinker line.
Table
41 shows the projection of future demand or shipments of cement for Pacasmayo plant. These projections are based on the 2024 shipments.
Table
41 Forecast of future demand for Pacasmayo cement plant
| Year | |
Cement Shipments (Tonnes) | | |
Variation
(%) | |
| 2024 | |
| 1,860,241 | | |
| | |
| 2025 | |
| 2,262,148 | | |
| 22 | % |
| 2026 | |
| 2,307,390 | | |
| 2 | % |
| 2027 | |
| 2,069,164 | | |
| -10 | % |
| 2028 | |
| 2,069,164 | | |
| 0 | % |
| 2029 | |
| 2,069,164 | | |
| 0 | % |
| 2030 | |
| 2,069,164 | | |
| 0 | % |
| 2031 | |
| 2,069,164 | | |
| 0 | % |
| 2032 | |
| 2,182,171 | | |
| 5 | % |
| 2033 | |
| 2,257,814 | | |
| 3 | % |
| 2034 | |
| 2,334,970 | | |
| 3 | % |
| 2035 | |
| 2,413,670 | | |
| 3 | % |
| 2036 | |
| 2,493,943 | | |
| 3 | % |
| 2037 | |
| 2,575,822 | | |
| 3 | % |
| 2038 | |
| 2,659,338 | | |
| 3 | % |
| 2039 | |
| 2,744,525 | | |
| 3 | % |
| 2040 | |
| 2,831,416 | | |
| 3 | % |
| 2041 | |
| 2,920,044 | | |
| 3 | % |
| 2042 | |
| 3,005,252 | | |
| 3 | % |
| 2043 | |
| 3,034,110 | | |
| 1 | % |
| 2044 | |
| 3,060,320 | | |
| 1 | % |
| 2045 | |
| 3,060,320 | | |
| 0 | % |
| 2046 | |
| 3,060,320 | | |
| 0 | % |
| 2047 | |
| 3,060,320 | | |
| 0 | % |
| 2048 | |
| 3,060,320 | | |
| 0 | % |
| 2049 | |
| 3,060,320 | | |
| 0 | % |
| 2050 | |
| 3,060,320 | | |
| 0 | % |
| 2051 | |
| 3,060,320 | | |
| 0 | % |
| 2052 | |
| 3,060,320 | | |
| 0 | % |
| 2053 | |
| 3,060,320 | | |
| 0 | % |
| 17. | Environmental
studies, permitting, and plans, negotiations, or agreements with local individuals or groups. |
| 17.1. | Environmental
Aspects |
Cementos
Pacasmayo holds Corporate Policies, which are applied to the operations of quarries and cement plants. Relevant policies include Safety
Occupational Health Policy, Quality Policy and Environmental Policy.
Cementos
Pacasmayo S.A.A. carries out activities in Tembladera quarry and Pacasmayo plant, in that sense, according to the environmental legislation.
It has an environmental authority in the industrial sector and another authority (Ministry of Energy and Mines) that issues an opinion
for the Closure of quarries.
Likewise,
Cementos Pacasmayo complies with the provisions of the Regulation with Superno Decree No. 033-2005-EM - Regulation of the Mine Closure
Law.
Tembladera
quarry holds the environmental permit authorized by the Ministry of Production, dated November 08, 2018, through Directorate Resolution
N° 304-2018-PRODUCE/DVMYPE-I/DGAAMI. It approved the updating of the Environmental Management Plan of the Adequation Program and
Environmental Management (PAMA per its acronym in Spanish) of Tembladera quarry, this, pursuant to the Technical-Legal Report NO 979-2018-PRODUCE/DVMYPE-I/DGAAMI-DEAM
and its annexes.
The
updating of the Environmental Management Plan of the PAMA included the identification of potential environmental impacts for which, there
were preventive, corrective and/or mitigation measures.
Additionally,
it includes the environmental monitoring program taking into consideration the components of air quality, environmental noise and biological
monitoring. There are 4 monitoring stations for air quality, 4 monitoring stations for environmental noise and 10 stations for biological
monitoring.
In
the Tembladera quarry, measurements of air quality and particulate matter parameters were considered. The results obtained in 2023 are
under the environmental quality standard limit, ECA in compliance with the established Supreme Decree No. 003-2017-MINAM.
The
environmental noise monitoring results obtained in 2023 are below the standards of the environmental quality standard, ECA, complying
with the provisions of Supreme Decree N°085-2003-PCM.
Cementos
Pacasmayo complies with Peruvian legislation on Closure Plans, which under current legislation is the Regulation of Environmental Management
of the Manufacturing Industry and Domestic Trade, Supreme Decree No. 017-2015-PRODUCE. This standard establishes the environmental management
of the activities covered by Ministerial Resolution No. 157-2011-MINAM, table of the first update of the list of inclusion of investment
projects subject to the National System of Environmental Impact Assessment (SEIA).
For
the Tembladera quarry, Directorial Resolution Number 265-2016-MEM/DGAAM approved the Updating of the Closure Plan for the Tembladera
quarry mining unit of Cementos Pacasmayo S.A.A.
The
Closure Plan submitted by Cementos Pacasmayo has included the necessary measures to ensure effectiveness or consistency with the requirements
necessary for the protection of public health and the environment. The initial strategy has continued with the Closure of the components
of Tembladera quarry mining unit, establishing temporary, progressive, final and post-Closure activities at the end and/or closure of
operations.
Final
closure activities have included physical stability in the mine, geochemical stability, water management facilities, dismantling for
the removal of equipment and machinery. Also included are infrastructure demolition, reclamation, waste disposal, landform establishment,
habitat rehabilitation, revegetation and social programs.
Post-closure
activities such as physical maintenance, geochemical maintenance, hydrological maintenance, and biological maintenance will be carried
out, and post-closure monitoring activities include physical stability monitoring, geochemical stability monitoring,
water management monitoring, biological monitoring and social monitoring.
It
is important to mention that the approval of the Mine Closure Plan involves the constitution of guarantees to ensure that the owner of
the mining activity complies with the obligations derived from the Mine Closure Plan, in accordance with environmental protection regulations.
Cementos
Pacasmayo has a guarantee of faithful compliance with the mine closure plan for the Tembladera quarry according to the approval of the
updated mine closure plan for an amount of 421,941.00 USD.
We
have a strong relationship with our communities and have identified their main needs such as health, education, urban development and
local development. In this regard, we have a social investment program, which contributes to dealing with their necessities, based on
good dialog and the compliance with our commitments.
The
communities are a priority for Cementos Pacasmayo. For this reason, we promote periodic meetings with their representatives and create
opportunities for dialog to know their expectations. In addition, we have established public and private alliances for development projects
and programs, to contribute to a better quality of life, and to strengthen our relations. During 2023, we worked in partnership with
the district authorities of Pacasmayo and Tembladera.
CPSAA
has no commitments for local procurement and hiring although it does its best to hire local talent and do business with local businesses.
| 17.1.2. | Cement
plant in Pacasmayo |
Cementos
Pacasmayo S.A.A. in compliance with current environmental regulations, it has been carrying out environmental monitoring through an accredited
laboratory, the results are reported to the Environmental Evaluation Agency - OEFA, competent authority for environmental supervision
and control activities, responsible for reviewing and validating the information presented by the industrial owner.
In
the Pacasmayo plant, the measurements of air quality parameters and particulate air material were considered, the results obtained in
2023 are below the environmental quality
standard limit (ECA) complying with that established in the Supreme Decree No. 003-2017-MINAM.
In
the environmental noise monitoring, the results obtained in 2023 are below the limit of the environmental quality standard (ECA) in compliance
with that established in the Supreme Decree N°085-2003-PCM.
Regarding
atmospheric emissions at the source of emissions, the results obtained in 2023 are below the maximum permissible limit (MPL) in compliance
with that established in Supreme Decree N°001-2020-MINAM.
Finally,
in accordance with Environmental Management Regulation of the Manufacturing Industry and Domestic Trade, approved with Supreme Decree
N° 017-2015-PRODUCE, companies that produce cement are required to submit Closure Plans when executing decommissioning activities.
Cementos Pacasmayo in compliance with Peruvian legislation will submit the Closure Plan in a timely manner.
| 17.2. | Solid
waste disposal |
Cementos
Pacasmayo S.A.A. has a Solid Waste Minimization and Disposal Plan for our production activities at the Pacasmayo plant and Tembladera
quarry. Annually, our company declares the generation, storage, collection, and final disposal of hazardous and non-hazardous solid waste
in compliance with environmental legislation.
In
our solid waste minimization plan for 2023, we declared 24 tonnes of hazardous waste and 28.8 tonnes of non-hazardous waste for the Tembladera
quarry. Likewise, for the Pacasmayo plant we declared 88.5 tonnes of hazardous waste and 1,079.8 tonnes of non-hazardous waste, which
were disposed of in accordance with environmental legislation.
| 17.3. | Qualified
Person’s Opinion |
Cementos
Pacasmayo S.A.A. complies with national environmental standards applicable to the development of industrial activity and for the exploitation
of non-metallic minerals carried out in the Tembladera quarry where limestone, the main material for the manufacture of cement, is produced.
The
company has been complying with the provisions of the Environmental Management Regulation for the Manufacturing Industry and Internal
Trade approved with Supreme Decree No. 017-2015-PRODUCE, which regulates the environmental management of the activities indicated in
Ministerial Resolution No. 157- 2011-MINAM and investment projects subject to the National Environmental Impact Assessment System (SEIA)
and its modifications.
Cementos
Pacasmayo S.A.A. reports the environmental commitments, semiannually and quarterly to the Environmental Evaluation Agency - OEFA. The
monitoring is carried out through external laboratories that provide comprehensive monitoring and analysis services and have double accreditation,
by the IAS and the INACAL, both signatories of the ILAC-MRA international Mutual Recognition Agreement.
Cementos
Pacasmayo S.A.A. strictly complies with the protocols in the different processes in compliance with environmental legislation and reporting
to the OEFA.
The
qualified person believes that CPSAA’s current plans and management strategies are adequate for addressing any issues related to
environmental compliance and maintaining its environmental permits. In addition, the qualified person believes that CPSAA has a good
relationship with the local communities and that its social investment plans are adequate for reducing any social risks to the project.
| 18. | Capital
and operations costs |
| 18.1. | Basis
for operating and capital cost for the quarry and plant |
This
section presents, in a tabular manner, the operating costs of Tembladera quarry for the extraction of limestone, the main raw material
used in cement production at the Pacasmayo plant. The section also contains the operating costs for the cement plant where the whole
industrial process to convert the raw material to cement takes place. The costs are mainly based on real historic costs which are the
basis for estimating forecasted costs.
Similarly,
this section reports the detail of the capital investments made in the quarry and plant, and the forecasted plan of investments, required
to sustain all the activities in the quarry and plant, and to assure the supply of limestone Reserves for the production levels required
to support forecasted cement sales of Pacasmayo plant.
Table
42 depicts the main components of the cost structure of Tembladera quarry and Pacasmayo plant and the sources used in their forecasts.
Table
42 Concepts about cost structure of Tembladera quarry and Pacasmayo plant
| Concept |
|
Description |
|
Source |
| Quarry
Operating Cost |
|
Mineral
Production, processing, fuel, Materials (Explosives), Maintenance, Insurances and Services |
|
●
Real, historic costs
●
Suppliers´ quotes |
| Quarry
Operating Cost |
|
Royalties |
|
●
Contract of mining
royalty payment with
regional/state entities |
| Quarry
Operating Cost |
|
Energy |
|
●
Historic, real costs
●
Supply Contract
●
Suppliers´quote |
| Plant
Operating Cost |
|
Fuel,
Materials, Maintenance, Wages and Insurances |
|
●
Historic, real costs
●
Suppliers´quote |
| Plant
Operating Cost |
|
Energy |
|
●
Historic, real costs
●
Supply Contract
●
Suppliers´quote |
Being
an ongoing operation, actual historical costs are the primary basis of information to estimate forecasted costs. These actual costs in
some cases are maintained, and in other cases are appropriately adjusted to account for factors specific to the quarry operation, conditions
and obligations stipulated in supply and concession contracts, and other macroeconomic factors that could have an indirect impact on
future operating costs, such as inflation and devaluation of the local currency against the US dollar.
| 18.2. | Capital
and Operating Cost Estimates |
Table
43 details the operating costs of quarry and plant for the year 2023, and 30 years of forecast.
Table
43 Operating costs forecast of quarry and plant
| | |
Production Data | | |
| | |
| |
| | |
Extracted Mineral | | |
Cement Production | | |
Total Operating Cost | | |
Cost per tonne of product | |
| | |
tonnes ’000 | | |
tonnes ’000 | | |
S/ ’000 | | |
S/ x tonne | |
| | |
| | |
| | |
| | |
| |
| 2023 | |
| 1,842 | | |
| 1,656 | | |
| 446,242 | | |
| 269.5 | |
| 2024 | |
| 2,191 | | |
| 1,860 | | |
| 487,362 | | |
| 261.99 | |
| 2025 | |
| 2,466 | | |
| 2,262 | | |
| 626,416 | | |
| 276.91 | |
| 2026 | |
| 2,346 | | |
| 2,307 | | |
| 655,898 | | |
| 284.26 | |
| 2027 | |
| 2,256 | | |
| 2,069 | | |
| 598,573 | | |
| 289.28 | |
| 2028 | |
| 2,256 | | |
| 2,069 | | |
| 618,537 | | |
| 298.93 | |
| 2029 | |
| 2,256 | | |
| 2,069 | | |
| 628,832 | | |
| 303.91 | |
| 2030 | |
| 2,256 | | |
| 2,069 | | |
| 645,358 | | |
| 311.89 | |
| 2031 | |
| 2,256 | | |
| 2,069 | | |
| 669,045 | | |
| 323.34 | |
| 2032 | |
| 2,272 | | |
| 2,182 | | |
| 724,359 | | |
| 331.94 | |
| 2033 | |
| 2,283 | | |
| 2,258 | | |
| 771,678 | | |
| 341.78 | |
| 2034 | |
| 2,294 | | |
| 2,335 | | |
| 825,864 | | |
| 353.69 | |
| 2035 | |
| 2,306 | | |
| 2,414 | | |
| 871,442 | | |
| 361.04 | |
| 2036 | |
| 2,318 | | |
| 2,494 | | |
| 924,391 | | |
| 370.65 | |
| 2037 | |
| 2,329 | | |
| 2,576 | | |
| 987,384 | | |
| 383.33 | |
| 2038 | |
| 2,342 | | |
| 2,659 | | |
| 1,043,518 | | |
| 392.40 | |
| 2039 | |
| 2,354 | | |
| 2,745 | | |
| 1,106,933 | | |
| 403.32 | |
| 2040 | |
| 2,367 | | |
| 2,831 | | |
| 1,180,855 | | |
| 417.05 | |
| 2041 | |
| 2,380 | | |
| 2,920 | | |
| 1,248,162 | | |
| 427.45 | |
| 2042 | |
| 2,392 | | |
| 3,005 | | |
| 1,321,046 | | |
| 439.58 | |
| 2043 | |
| 2,396 | | |
| 3,034 | | |
| 1,374,673 | | |
| 453.07 | |
| 2044 | |
| 2,400 | | |
| 3,060 | | |
| 1,418,478 | | |
| 463.51 | |
| 2045 | |
| 2,400 | | |
| 3,060 | | |
| 1,455,923 | | |
| 475.74 | |
| 2046 | |
| 2,400 | | |
| 3,060 | | |
| 1,499,248 | | |
| 489.90 | |
| 2047 | |
| 2,400 | | |
| 3,060 | | |
| 1,534,947 | | |
| 501.56 | |
| 2048 | |
| 2,400 | | |
| 3,060 | | |
| 1,577,305 | | |
| 515.41 | |
| 2049 | |
| 2,400 | | |
| 3,060 | | |
| 1,627,649 | | |
| 531.86 | |
| 2050 | |
| 2,400 | | |
| 3,060 | | |
| 1,668,429 | | |
| 545.18 | |
| 2051 | |
| 2,400 | | |
| 3,060 | | |
| 1,714,703 | | |
| 560.30 | |
| 2052 | |
| 2,400 | | |
| 3,060 | | |
| 1,768,915 | | |
| 578.02 | |
| 2053 | |
| 2,400 | | |
| 3,060 | | |
| 1,813,597 | | |
| 592.62 | |
Table
43 shows the projection for the next 30 years, according to the production plan for 30 years of Reserves. Costs are adjusted annually
by applying 2.90% inflation rate to the cost/tonne.
Table
44 shows the detail of capital investments in the quarry and plant, by type of investment, for 1 year of historical result (2023) and
30 years of projection.
Table
44 Investment forecast in quarry and plant
| | |
Total Investments | |
| | |
S/ ’000 | |
| | |
| |
| 2023 | |
| 12,495 | |
| 2024 | |
| 27,225 | |
| 2025 | |
| 28,015 | |
| 2026 | |
| 28,827 | |
| 2027 | |
| 29,663 | |
| 2028 | |
| 30,523 | |
| 2029 | |
| 31,408 | |
| 2030 | |
| 32,319 | |
| 2031 | |
| 33,256 | |
| 2032 | |
| 34,221 | |
| 2033 | |
| 35,213 | |
| 2034 | |
| 36,234 | |
| 2035 | |
| 37,285 | |
| 2036 | |
| 38,367 | |
| 2037 | |
| 39,479 | |
| 2038 | |
| 40,624 | |
| 2039 | |
| 41,802 | |
| 2040 | |
| 43,014 | |
| 2041 | |
| 44,262 | |
| 2042 | |
| 45,545 | |
| 2043 | |
| 46,866 | |
| 2044 | |
| 48,225 | |
| 2045 | |
| 49,624 | |
| 2046 | |
| 51,063 | |
| 2047 | |
| 52,544 | |
| 2048 | |
| 54,068 | |
| 2049 | |
| 55,636 | |
| 2050 | |
| 57,249 | |
| 2051 | |
| 58,909 | |
| 2052 | |
| 60,618 | |
| 2053 | |
| 62,375 | |
In
recent years, there have been no significant variations in investments related to maintenance and replacement of equipment in the quarry
and plant to sustain operations.
As
mentioned previously, the Company recently decided to invest an estimated US$ 85 million for the project optimization of clinker
lines in Pacasmayo plant and thus, optimize its installed production capacity of clinker. This investment has been made throughout
2022 and 2023. This explains the higher investments in those years in Table 44. Following that, the Company´s investment plan
does not consider any extraordinary activity. It is the sole plan to perform the necessary replacement for the quarry support and
the maintenance of operations in plant, in such a manner that the investments are kept at levels similar to those registered
throughout the last years. Future investments are at nominal values and consider an annual increase of 2.90% for
inflation.
The
costs described in this chapter are applied to estimate the Mineral Resources and Reserves of the Tembladera quarry as part of the analysis.
| 18.3. | Capital
and Operating Cost Estimation Risks |
Considering
that mine production and cement plant will continue in the same geological deposit and using the same mining and industrial methods,
there is little risk associated with the specific engineering estimation methods used for capital and production costs. An assessment
of accuracy of estimation methods is reflected in the sensitivity analysis in Section 19.
For
purposes of the Preliminary Feasibility Study completed relative to the Tembladera quarry and Pacasmayo plant, both capital and operating
costs are estimated to an accuracy of +/- 25%.
| 19.1. | Methodology:
Discounted Cash flow (Free) |
The
Economic Analysis chapter describes the assumptions, parameters and methodology used to demonstrate the economic viability or profitability
of extracting the mineral Reserves and Resources. That is, the Pre feasibility level support for the determination of mineral Resources
and Reserves, by means of a business valuation through the Discounted (Free or Economic) Cash Flow method.
In
the economic the same evaluation criteria were considered for the estimation of Minerql Resources and Reserves.
For
the cash flow projection, the forecast horizon is consistent with the life of the quarry, which is calculated based on the total declared
Reserves and the annual production of the quarry. The cash flow for each period is approximated indirectly from the EBITDA (the latter
is constructed in the Profit and Loss Statement), and the corresponding adjustments are made for taxes and capital costs (CapEx).
Finally,
for this economic analysis we work with the free cash flow, since it does not incorporate the capital structure, and we apply the weighted
average cost of capital (WACC) for discounting future cash flows.
| 19.2.1. | General
and Macroeconomic Assumptions |
For
the Reserves evaluation, the general and macroeconomic assumptions used for the projection of the free/economic cash flows and for the
valuation are:
| - | Projection
horizon: 30 years (2024 to 2053) according to the estimated years of quarry life. |
| - | Annual
inflation rate, 2.90%, based on The International Monetary Fund as of October 2023: applies equally to sales price, costs and expenses. |
| - | Capital
cost projections were determined using a historical ratio of annual investments and maintenance
costs which also considers the increase in production volume. |
| - | The
company’s capital structure is being considered in the discount rate (WACC) of 11.56%. |
| - | Income
tax rate: effective rate of actual (historical) business results, 29% - 30%. |
| - | Workers’
Profit Sharing: 10%. |
| - | Exchange
rate: exchange rate is assumed to remain at 3.80 (USD/PEN). |
| 19.2.2. | Income
and Cost Assumptions |
| ● | The
sales price of cement, expressed as S/ x t, is the sales price from Pacasmayo plant to Distribuidora Norte Pacasmayo, FOB at Pacasmayo
plant; and this is lower than the sales price to the final customer in the market. This difference is explained by the distribution freight
to the multiple points of sale and by the selling expenses associated with distribution and promotion in the different commercial channels. |
| ● | The
base price used in the projection is an estimate for the year 2024 (447.9 S/ x t), which has been determined based on current market
conditions and cement demand for 2024, among other factors. |
| ● | Starting
in 2025 (year 2 of the projection), an annual price escalation rate of 2.90% is applied the sales prices. |
| ● | The
cost of cement production, expressed as S/ x t, has been estimated for the year 2024 based on actual operating costs, the market situation
of local inputs and services, plant demand for imported clinker and other factors. Cost of production for year 2024 is 262.0 S/ x t. |
| ● | In
the case of imported clinker, the considered cost returns to regular pre-Russian-Ukrainian
war levels. This means 65 USD x t for Type I clinker and 75 USD x t for Type V clinker. In
this sense, the projection, starting in 2032 (the year in which clinker imports are resumed),
assumes values more consistent with the historical average, plus an adjustment for inflation. |
| ● | Starting
in 2025, an annual cost escalation rate of 2.90% is applied to the costs. |
| ● | The
initial stock of products in the quarry and plant is assumed to be zero. |
| 19.3. | Results
of financial model |
For
the Mineral Reserves evaluation, the following financial parameters were calculated:
| ● | NPV
of 1,514 million soles at a discount rate of 11.56%. |
| ● | Average
plant throughput for cement production: 2.6 million tonnes per year over the 30-year projection. |
| ● | Average
sales price: 616.7 soles per ton of cement, an average of the 30-year projection, at nominal
values. |
| ● | Revenues:
1,620 million soles annual, an average of the 30-year projection. |
| ● | Average
cash production cost: 409.3 soles per ton of cement, an average of the 30-year projection,
at nominal values. |
The
Table 45 shows the forecast of the Profit and Loss Statement of the operation of Tembladera quarry and Pacasmayo plant.
Table
45 Profit and Loss Statement
| | |
Shipments (tonnes) | | |
Revenue
S/ x t | | |
Gross Profit
S/ ’000 | | |
Gross Margin
S/ x t | | |
Gross Mg
% | | |
Operating Profit | | |
(+) Depreciation | | |
EBITDA Pacasmayo Plant | | |
EBITDA Mg % | |
| | |
| | |
| | |
| | |
| | |
| | |
| | |
| | |
| | |
| |
| 2024P | |
| 1,860,241 | | |
| 447.9 | | |
| 326,647 | | |
| 175.6 | | |
| 39 | % | |
| 180,271 | | |
| 42,161 | | |
| 222,432 | | |
| 27 | % |
| 2025P | |
| 2,262,148 | | |
| 421.5 | | |
| 305,185 | | |
| 134.9 | | |
| 32 | % | |
| 156,484 | | |
| 52,956 | | |
| 209,440 | | |
| 22 | % |
| 2026P | |
| 2,307,390 | | |
| 432.6 | | |
| 319,431 | | |
| 138.4 | | |
| 32 | % | |
| 170,305 | | |
| 52,407 | | |
| 222,712 | | |
| 22 | % |
| 2027P | |
| 2,069,164 | | |
| 444.1 | | |
| 296,920 | | |
| 143.5 | | |
| 32 | % | |
| 144,054 | | |
| 50,288 | | |
| 194,343 | | |
| 21 | % |
| 2028P | |
| 2,069,164 | | |
| 455.9 | | |
| 299,722 | | |
| 144.9 | | |
| 32 | % | |
| 139,802 | | |
| 48,644 | | |
| 188,446 | | |
| 20 | % |
| 2029P | |
| 2,069,164 | | |
| 467.9 | | |
| 313,101 | | |
| 151.3 | | |
| 32 | % | |
| 151,105 | | |
| 48,208 | | |
| 199,313 | | |
| 21 | % |
| 2030P | |
| 2,069,164 | | |
| 480.3 | | |
| 320,952 | | |
| 155.1 | | |
| 32 | % | |
| 154,518 | | |
| 49,535 | | |
| 204,053 | | |
| 21 | % |
| 2031P | |
| 2,069,164 | | |
| 493.1 | | |
| 322,283 | | |
| 155.8 | | |
| 32 | % | |
| 148,427 | | |
| 50,976 | | |
| 199,402 | | |
| 20 | % |
| 2032P | |
| 2,182,171 | | |
| 506.1 | | |
| 350,036 | | |
| 160.4 | | |
| 32 | % | |
| 175,082 | | |
| 51,282 | | |
| 226,365 | | |
| 20 | % |
| 2033P | |
| 2,257,814 | | |
| 519.5 | | |
| 369,612 | | |
| 163.7 | | |
| 32 | % | |
| 190,206 | | |
| 53,915 | | |
| 244,120 | | |
| 21 | % |
| 2034P | |
| 2,334,970 | | |
| 533.3 | | |
| 385,247 | | |
| 165.0 | | |
| 31 | % | |
| 198,098 | | |
| 53,682 | | |
| 251,780 | | |
| 20 | % |
| 2035P | |
| 2,413,670 | | |
| 547.4 | | |
| 413,744 | | |
| 171.4 | | |
| 31 | % | |
| 224,432 | | |
| 52,919 | | |
| 277,351 | | |
| 21 | % |
| 2036P | |
| 2,493,943 | | |
| 562.0 | | |
| 438,811 | | |
| 176.0 | | |
| 31 | % | |
| 244,990 | | |
| 52,383 | | |
| 297,373 | | |
| 21 | % |
| 2037P | |
| 2,575,822 | | |
| 576.8 | | |
| 457,545 | | |
| 177.6 | | |
| 31 | % | |
| 255,841 | | |
| 52,130 | | |
| 307,971 | | |
| 21 | % |
| 2038P | |
| 2,659,338 | | |
| 592.1 | | |
| 487,883 | | |
| 183.5 | | |
| 31 | % | |
| 283,472 | | |
| 52,753 | | |
| 336,224 | | |
| 21 | % |
| 2039P | |
| 2,744,525 | | |
| 607.8 | | |
| 515,420 | | |
| 187.8 | | |
| 31 | % | |
| 305,907 | | |
| 53,019 | | |
| 358,926 | | |
| 22 | % |
| 2040P | |
| 2,831,416 | | |
| 623.9 | | |
| 536,800 | | |
| 189.6 | | |
| 30 | % | |
| 318,885 | | |
| 53,537 | | |
| 372,422 | | |
| 21 | % |
| 2041P | |
| 2,920,044 | | |
| 640.5 | | |
| 570,547 | | |
| 195.4 | | |
| 31 | % | |
| 349,670 | | |
| 54,460 | | |
| 404,131 | | |
| 22 | % |
| 2042P | |
| 3,005,252 | | |
| 657.4 | | |
| 600,534 | | |
| 199.8 | | |
| 30 | % | |
| 374,362 | | |
| 55,112 | | |
| 429,474 | | |
| 22 | % |
| 2043P | |
| 3,034,110 | | |
| 674.9 | | |
| 616,094 | | |
| 203.1 | | |
| 30 | % | |
| 381,517 | | |
| 53,284 | | |
| 434,801 | | |
| 21 | % |
| 2044P | |
| 3,060,320 | | |
| 692.7 | | |
| 642,815 | | |
| 210.0 | | |
| 30 | % | |
| 405,191 | | |
| 51,969 | | |
| 457,160 | | |
| 22 | % |
| 2045P | |
| 3,060,320 | | |
| 711.1 | | |
| 659,950 | | |
| 215.6 | | |
| 30 | % | |
| 417,056 | | |
| 51,533 | | |
| 468,589 | | |
| 22 | % |
| 2046P | |
| 3,060,320 | | |
| 729.9 | | |
| 672,007 | | |
| 219.6 | | |
| 30 | % | |
| 420,442 | | |
| 49,249 | | |
| 469,691 | | |
| 21 | % |
| 2047P | |
| 3,060,320 | | |
| 749.3 | | |
| 693,963 | | |
| 226.8 | | |
| 30 | % | |
| 438,980 | | |
| 49,122 | | |
| 488,102 | | |
| 21 | % |
| 2048P | |
| 3,060,320 | | |
| 769.1 | | |
| 710,339 | | |
| 232.1 | | |
| 30 | % | |
| 449,395 | | |
| 50,260 | | |
| 499,655 | | |
| 21 | % |
| 2049P | |
| 3,060,320 | | |
| 789.5 | | |
| 720,092 | | |
| 235.3 | | |
| 30 | % | |
| 449,107 | | |
| 51,503 | | |
| 500,610 | | |
| 21 | % |
| 2050P | |
| 3,060,320 | | |
| 810.4 | | |
| 741,699 | | |
| 242.4 | | |
| 30 | % | |
| 466,727 | | |
| 52,911 | | |
| 519,637 | | |
| 21 | % |
| 2051P | |
| 3,060,320 | | |
| 831.9 | | |
| 759,268 | | |
| 248.1 | | |
| 30 | % | |
| 478,691 | | |
| 54,363 | | |
| 533,054 | | |
| 21 | % |
| 2052P | |
| 3,060,320 | | |
| 854.0 | | |
| 769,921 | | |
| 251.6 | | |
| 29 | % | |
| 480,363 | | |
| 55,814 | | |
| 536,177 | | |
| 21 | % |
| 2053P | |
| 3,060,320 | | |
| 876.6 | | |
| 792,680 | | |
| 259.0 | | |
| 30 | % | |
| 498,821 | | |
| 57,277 | | |
| 556,098 | | |
| 21 | % |
Cement
sales at Pacasmayo Plant are on average S/ 1,620 million per year (for the period 2024-2053) and the average EBITDA margin for the same
period is 21%.
The
EBITDA margin remains relatively stable in the 30-year projection. The slight variations in the margin are mainly explained by the cost
of remunerations, which has a behavior with peaks every three years due to union negotiations, the distribution of demand among plants
and the consumption of imported clinker when reaching the maximum production capacity of the company’s own clinker.
Table
46 shows the Free Cash Flow projection and the valuation of the cement business of Pacasmayo plant:
Table
46 Free Cash Flow and valuation
| | |
FCF - Valuation (Thousand S/) | |
| | |
(-) Taxes (EBIT*t) | | |
(-) CapEx | | |
EBITDA Planta Pacasmayo | | |
Free Cash Flow | |
| | |
| | |
| | |
| | |
| |
| 2024P | |
| -74,978 | | |
| -27,225 | | |
| 243,201 | | |
| 140,999 | |
| 2025P | |
| -69,471 | | |
| -28,015 | | |
| 229,018 | | |
| 131,532 | |
| 2026P | |
| -74,699 | | |
| -28,827 | | |
| 244,165 | | |
| 140,639 | |
| 2027P | |
| -69,090 | | |
| -29,663 | | |
| 218,964 | | |
| 120,212 | |
| 2028P | |
| -68,282 | | |
| -30,523 | | |
| 214,075 | | |
| 115,270 | |
| 2029P | |
| -74,465 | | |
| -31,408 | | |
| 227,865 | | |
| 121,992 | |
| 2030P | |
| -77,984 | | |
| -32,319 | | |
| 234,531 | | |
| 124,228 | |
| 2031P | |
| -77,571 | | |
| -33,256 | | |
| 230,120 | | |
| 119,293 | |
| 2032P | |
| -86,839 | | |
| -34,221 | | |
| 258,134 | | |
| 137,074 | |
| 2033P | |
| -93,373 | | |
| -35,213 | | |
| 277,424 | | |
| 148,837 | |
| 2034P | |
| -96,821 | | |
| -36,234 | | |
| 286,264 | | |
| 153,209 | |
| 2035P | |
| -107,379 | | |
| -37,285 | | |
| 314,738 | | |
| 170,074 | |
| 2036P | |
| -115,420 | | |
| -38,367 | | |
| 336,806 | | |
| 183,019 | |
| 2037P | |
| -119,607 | | |
| -39,479 | | |
| 348,546 | | |
| 189,460 | |
| 2038P | |
| -130,917 | | |
| -40,624 | | |
| 380,042 | | |
| 208,500 | |
| 2039P | |
| -139,812 | | |
| -41,802 | | |
| 405,251 | | |
| 223,637 | |
| 2040P | |
| -145,054 | | |
| -43,014 | | |
| 420,260 | | |
| 232,191 | |
| 2041P | |
| -157,272 | | |
| -44,262 | | |
| 455,154 | | |
| 253,620 | |
| 2042P | |
| -166,837 | | |
| -45,545 | | |
| 482,918 | | |
| 270,535 | |
| 2043P | |
| -169,060 | | |
| -46,866 | | |
| 489,374 | | |
| 273,447 | |
| 2044P | |
| -178,021 | | |
| -48,225 | | |
| 514,484 | | |
| 288,238 | |
| 2045P | |
| -182,772 | | |
| -49,624 | | |
| 527,426 | | |
| 295,030 | |
| 2046P | |
| -183,761 | | |
| -51,063 | | |
| 529,282 | | |
| 294,457 | |
| 2047P | |
| -191,300 | | |
| -52,544 | | |
| 550,074 | | |
| 306,230 | |
| 2048P | |
| -196,592 | | |
| -54,068 | | |
| 563,792 | | |
| 313,132 | |
| 2049P | |
| -197,111 | | |
| -55,636 | | |
| 565,322 | | |
| 312,575 | |
| 2050P | |
| -204,688 | | |
| -57,249 | | |
| 586,751 | | |
| 324,814 | |
| 2051P | |
| -209,890 | | |
| -58,909 | | |
| 601,888 | | |
| 333,089 | |
| 2052P | |
| -211,356 | | |
| -60,618 | | |
| 606,018 | | |
| 334,044 | |
| 2053P | |
| -219,278 | | |
| -62,375 | | |
| 628,477 | | |
| 346,823 | |
| WACC | |
| 11.56 | % |
| Economic NPV (Thousand S/) | |
| 1,513,634 | |
The
net present value (NPV) of Pacasmayo Plant cement business amounts to more than S/ 1,514 million at a discount rate of 11.56% and it
is made up of the sum of the discounted cash flows of each period, for the 30-year projection. It is important to mention that the discounted
recovery period (of the investment for the clinker line optimization) is 3 years.
For
discounting of the cash flows, the weighted average cost of capital of the company (WACC for its acronym in English) was applied.
| 19.4. | Sensitivity
Analysis |
The
sensitivity analysis considers a variation of +/- 5 and 10% in the variables that have the greatest impact on the NPV and EBITDA. These
variables are the cement sales price, operating cost and CapEx.
Table
47 and 48 detail the sensitivity of the EBITDA and NPV to each variable, respectively, when the variables are varied independently. Figures
17 and 18 show the results of the sensitivity of NPV and EBITDA, respectively, to the three variables.
Table
47 Sensitivity analysis of the Net Present Value
| Variable / Variation | |
| -10 | % | |
| -5 | % | |
| 0 | % | |
| +5% | | |
| +10 | % |
| Price | |
| -43.0 | | |
| -21.5 | | |
| 0 | | |
| 21.5 | | |
| 43.0 | |
| Cost | |
| 36.5 | | |
| 18.2 | | |
| 0 | | |
| -18.2 | | |
| -36.5 | |
| CapEx | |
| 1.5 | | |
| 0.8 | | |
| 0 | | |
| -0.8 | | |
| -1.5 | |
Table
48 Sensitivity analysis of EBITDA
| Variable / Variation | |
| -10 | % | |
| -5 | % | |
| 0 | % | |
| +5% | | |
| +10 | % |
| Price | |
| -45.5 | | |
| -22.8 | | |
| 0 | | |
| 22.8 | | |
| 45.5 | |
| Cost | |
| 34.7 | | |
| 17.3 | | |
| 0 | | |
| -17.3 | | |
| -34.7 | |
| CapEx | |
| -0.1 | | |
| 0 | | |
| 0 | | |
| 0 | | |
| 0.1 | |
Figure
17 Sensitivity of Net Present Value
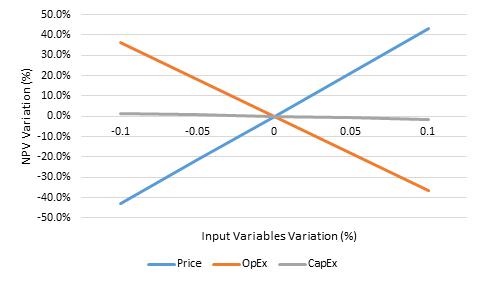
Figure
18 Sensitivity of EBITDA
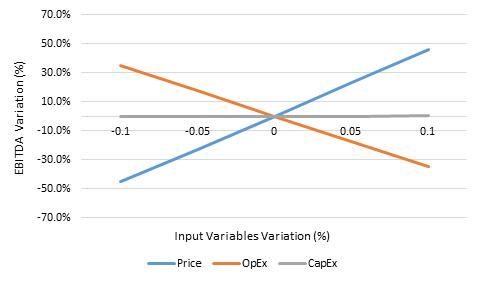
Based
on these results, the NPV is most sensitive to cement price, followed by operating cost, and least sensitive to the CapEx. The EBITDA,
on the other hand, is as sensitive to cement price as to the cost, and shows no sensitivity towards variations to the CapEx.
The
information in this chapter was obtained from the competent authority Instituto Geológico, Minero Metalúrgico (INGEMMET)
according to the document “Resumen del Derecho Minero Acumulación Tembladera”. Figure 19 shows adjacent mineral concessions.
The Eagle 1 concession overlaps with the Cementos Pacasmayo S.A.A. concession by 46.43 hectares. The Julissa A concession does not interfere
with the area of the mining rights in the Cementos Pacasmayo S.A.A. concession.
Eagle
1 does not interfere with Cementos Pacasmayo S.A.A.’s operations or Reserve estimates.
Figure
19 Concession Acumulación Tembladera and adjacent concessions.
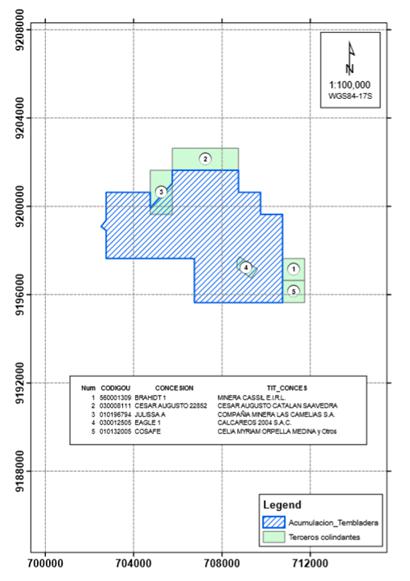
| 21. | Other
relevant data and information |
Not
applicable
| 22. | Interpretation
and conclusions |
| ● | From
a legal point of view, Cementos Pacasmayo S.A.A. has the ownership of the mining properties for the exploration, development and production
of limestone to supply the cement plants for normal production during the life of the quarry. |
| ● | Cementos
Pacasmayo S.A.A. has been complying with international ISO-9001 (Quality) standards since 2015 and has implemented Quality Assurance
and Quality Control (QAQC). The controls are applied for the construction of the Geological Model, Resource Estimation and Reserves Estimation. |
| ● | Cementos
Pacasmayo S.A.A. has a quality assurance system in its operations that includes sample preparation
methods, procedures, analysis and safety of results which comply with the best practices
in the industry. |
| ● | The
information verification and validation processes are carried out following the procedures
indicated in the information flows. The validated information is congruent with the one that
generated the geological models, which are the fundamental basis for the estimation of Resources. |
| ● | The
geological modeling of the limestone deposit is consistent with the relationship between
the information and the geological model. |
| ● | The
Mineral Resources and Reserves estimation consider the geologic characteristics and modifying
factors as well as due consideration of risk: geologic and associated with evaluation of
modifying factors. The main quality variable is the CaO content, which is very stable in
the deposit, also there are along with other secondary variables that determine the quality
of the Reserves. |
| ● | In
the process of estimating Mineral Reserves and in the production plans of the quarry, these
variables have been adequately considered in the mining plan, properly sequenced and with
blending processes. There are sufficient proven and probable Reserves for the next 30 years. |
| ● | Table
49 shows the Mineral Resources of the Tembladera quarry and the results of Mineral Resource
classification. Likewise, the Mineral Reserves and the results of Mineral Reserve classification
are shown in Table 50. |
Table
49 Resource Categorization (exclusive of Reserves) at the Tembladera quarry
| |
Resources |
Tonnes
M |
CaO
(%) |
MgO
(%) |
Al2O3
(%) |
SiO2
(%) |
SO3
(%) |
| Limestone |
Measured |
122.6 |
49.33 |
1.83 |
1.82 |
4.76 |
0.31 |
| Indicated |
34.5 |
50.32 |
1.68 |
1.44 |
3.85 |
0.20 |
| Measured + Indicated |
157.1 |
49.55 |
1.80 |
1.74 |
4.56 |
0.29 |
| Inferred |
75.9 |
50.33 |
1.62 |
1.45 |
3.93 |
0.31 |
Table
50 Mineral Reserves expressed in millions of tonnes
| |
Reserves |
Tonnes
M
|
CaO
(%)
|
MgO
(%) |
Al2O3
(%) |
SiO2
(%) |
SO3
(%)
|
| Limestone |
Proven |
65.5 |
49.66 |
1.52 |
1.54 |
4.60 |
0.37 |
| Probable |
12.3 |
49.63 |
1.57 |
1.56 |
4.91 |
0.28 |
| Total |
77.8 |
49.65 |
1.53 |
1.54 |
4.65 |
0.36 |
| ● | The
cement plant located in Pacasmayo has equipment and facilities available for cement production
using limestone from the Tembladera quarry and other necessary materials. |
| ● | The
Health, Safety and Environment department is in charge of supervising compliance with the
Company’s corporate policies and the various legal requirements of the national regulatory
bodies by all company áreas. |
| ● | Through
its Social Responsibility area, Cementos Pacasmayo S.A.A. has generated relationships of
trust with the communities surrounding its operations, which have a solid relationship with
our communities, identifying their primary needs in health, education, urban development,
and local development. |
| ● | The
operation in Tembladera quarry and Pacasmayo plant, with regards to infrastructure, is technically
and economically feasible due to the life of the quarry. |
| ● | The
sensitivity analysis shows that the operation is economically robust. |
| ● | Maintain
the QAQC program for exploration, development and production activities associated with cement
production. |
| ● | It
is recommended to perform the technical interpretation of the data generated during the 2022
diamond drilling campaign, so that they can be incorporated into the Mineral Resource and
Reserves model, which will provide greater support and robustness to these models. |
| ● | Complement
the geotechnical monitoring of the quarry components with the implementation of the Geotechnical
Monitoring Plan, which consists of the installation of slope displacement control landmark. |
| ● | Perform
density tests for limestone in the next studies at the Tembladera quarry. |
| ● | For
future diamond drilling campaigns, evaluate the rock density for each limestone horizon. |
BISA
Ingeniería de Proyectos S.A.(2017). Actualización del Plan de Manejo Ambiental del Programa de Adecuación y Manejo
Ambiental – PAMA de la Cantera Tembladera.
Servicios
Generales de Seguridad y Ecología S.A. (2011). Declaración de Impacto Ambiental Instalación de 02 Hornos Verticales
nº 5 y 6.
Servicios
Generales de Seguridad y Ecología S.A. (2007). Estudio de Impacto Ambiental Incremento de la Producción de Clinker en
la Planta de Cemento.
BISA
Ingeniería de Proyectos S.A. (2017). Actualización del Plan de Manejo Ambiental del Programa de Adecuación y
Manejo Ambiental – PAMA de la Cantera Tembladera – Volumen I
Magma
Consulting S.A.C. (2021). Estudio Geomecánico Geotécnico Cantera Tembladera.
Magma
Consulting S.A.C. (2021). Anexo 4: Estudio Hidrogeológico Cantera Tembladera.
Walsh
Perú S.A. (2016). Actualización del Plan de Cierre de la Cantera Tembladera.
| 25. | Reliance
on information provided by the registrant. |
In
preparing this report, the qualified persons relied upon data, written reports and statements provided by the registrant in accordance
with 17 CFR § 229.1302(f). After careful review of the information provided, the QPs have no reason to believe that any material
facts have been withheld or misstated. Cementos Pacasmayo provided the information as summarized in Table 51.
Table
51 List of Cementos Pacasmayo S.A.A. information.
| Chapter |
Chapter
name |
Information
provided by CPSAA |
| 3 |
Property
description |
Legal
matters related to property rights and the authority “Instituto Geológico, Minero y Metalúrgico INGEMMET” |
| 16 |
Market
studies |
Marketing
information, ASOCEM, INEI, MEF and BCRP |
| 17 |
Environmental
studies, permitting, and plans, negotiations, or agreements with local individuals or groups |
Environmental
studies and information, Community Relations and agreements with stakeholders |
| 18 |
Capital
and operating costs |
Historical
data about cost, price and investments |
| 19 |
Economic
analysis |
The
International Monetary Fund, Economic model, Macroeconomic trends, data, assumptions, and interest rates |
| 20 |
Adjacent
properties |
Legal
matters related to property rights and the authority “Instituto Geológico, Minero y Metalúrgico “INGEMMET” |
Exhibit
96.2
CEMENTOS
PACASMAYO S.A.A.
Technical
Report Summary (TRS)
Virrila
Quarry
and
Piura
Cement Plant
20-F
229.601 (Item 601)
Index (Revisar)
| 1. |
Executive summary |
1 |
| |
1.1. |
Location and access |
1 |
| |
1.2. |
Climate |
1 |
| |
1.3. |
History |
1 |
| |
1.4. |
Geological environment and mineralization |
2 |
| |
1.5. |
Exploration |
2 |
| |
1.6. |
Sample preparation, analysis and security |
3 |
| |
1.7. |
Data Verification |
4 |
| |
1.8. |
Mineral processing and metallurgical test |
5 |
| |
1.9. |
Estimation of Resources and Mineral Reserves |
6 |
| |
1.10. |
Mining Methods |
6 |
| |
1.11. |
Processing Plant and Infrastructure |
7 |
| |
1.12. |
Market studies |
9 |
| |
1.13. |
Capital and operating costs and Economic Analysis |
10 |
| |
1.14. |
Adjacent properties |
13 |
| |
1.15. |
Conclusions |
14 |
| |
1.16. |
Recommendations |
15 |
| 2. |
Introduction |
17 |
| |
2.1. |
Participants |
17 |
| |
2.2. |
Terms of Reference |
17 |
| |
2.3. |
Conventions |
19 |
| |
2.4. |
Previous Work and Sources of Information |
19 |
| |
2.5. |
Details of QP Personal Inspection |
20 |
| |
2.6. |
Previously Filed Technical Report Summary |
20 |
| 3. |
Property description |
21 |
| |
3.1. |
Virrila quarry |
21 |
| |
3.2. |
Piura Industrial Cement Plant |
24 |
| 4. |
Accesibility, climate, local resources, infrastructure and physiography |
26 |
| |
4.1. |
Virrila quarry |
26 |
| |
4.2. |
Piura industrial cement plant |
28 |
| 5. |
History |
29 |
| 6. |
Geological setting, mineralization, and deposit |
30 |
| |
6.1. |
Regional geology |
30 |
| |
6.2. |
Local geology |
31 |
| |
6.3. |
Characteristics of the deposit |
33 |
| 7. |
Exploration |
34 |
| |
7.1. |
Drilling |
34 |
| |
7.2. |
Hydrogeology |
35 |
| |
7.3. |
Geotechnical studies |
35 |
| 8. |
Sample preparation, analysis and security |
36 |
| |
8.1. |
Geology and Quarry |
36 |
| |
|
8.1.1. |
Preparation of samples, procedures, assays and laboratories |
36 |
| |
|
8.1.2. |
Quality Assurance Actions |
37 |
| |
|
8.1.3. |
Quality Plan |
37 |
| |
|
8.1.4. |
Sample security |
38 |
| |
|
8.1.5. |
Chain custody |
38 |
| |
|
8.1.6. |
Qualified Person’s Opinion on Cement Plant QAQC |
38 |
| |
8.2. |
Piura Plant |
39 |
| |
|
8.2.1. |
Samples preparation, procedures, assays and laboratories |
39 |
| |
|
|
8.2.1.1. |
Raw materials sample preparation |
39 |
| |
|
|
8.2.1.2. |
Laboratory analysis |
40 |
| |
|
8.2.2. |
Quality Assurance Actions |
40 |
| |
|
8.2.3. |
Security of the samples |
42 |
| |
|
8.2.4. |
Qualified Person’s Opinion on cement plant QAQC |
42 |
| 9. |
Data verification |
43 |
| |
9.1. |
Geology and quarry |
43 |
| |
|
9.1.1. |
Data Verification procedure |
43 |
| |
|
9.1.2. |
Data collection |
43 |
| |
|
9.1.3. |
Management and Validation of Database |
43 |
| |
|
9.1.4. |
Tracking Data |
43 |
| |
|
9.1.5. |
Validation of Data |
44 |
| |
|
9.1.6. |
Qualified Person’s Opinion Geologic Data |
45 |
| |
9.2. |
Piura plant |
45 |
| |
|
9.2.1. |
Data verification procedures |
45 |
| |
|
9.2.2. |
Data validation |
46 |
| |
|
9.2.3. |
Qualified Person’s Opinion on cement plant |
46 |
| 10. |
Mineral processing and metallurgical testing |
47 |
| |
10.1. |
Nature of testing program |
47 |
| |
10.2. |
Cement Manufacturing Test Results |
48 |
| |
10.3. |
Qualified Peron Opinion of the Adequacy of the Test Data |
48 |
| 11. |
Mineral Resources Estimates |
49 |
| |
11.1. |
Database |
51 |
| |
11.2. |
Density |
51 |
| |
11.3. |
Compositing |
51 |
| |
11.4. |
Basic statistics of the data (Assay – Composites) |
51 |
| |
11.5. |
Extreme values |
52 |
| |
11.6. |
Variogram Analysis |
52 |
| |
11.7. |
Interpolation |
53 |
| |
11.8. |
Resources estimation |
54 |
| |
|
11.8.1. |
Cut-off |
54 |
| |
|
11.8.2. |
Reasonable prospects of economic extraction |
55 |
| |
11.9. |
Mineral Resources classification |
55 |
| |
11.10. |
Qualified person’s opinion |
56 |
| 12. |
Mineral Reserves estimates |
57 |
| |
12.1. |
Criteria for Mineral Reserves determination |
57 |
| |
|
12.1.1. |
Run of Mine (ROM) determination criteria |
57 |
| |
|
12.1.2. |
Cement plant recovery |
58 |
| |
12.2. |
Reserves estimation methodology |
58 |
| |
12.3. |
Reserves estimates |
59 |
| 13. |
Mining methods |
60 |
| |
13.1. |
Mining methods and Equipment |
60 |
| |
13.2. |
Geotechnical models |
61 |
| |
13.3. |
Hydrological models |
63 |
| |
13.4. |
Other mine design and planning parameters |
64 |
| |
13.5. |
Annual production rate |
64 |
| |
13.6. |
Mining plan |
65 |
| |
13.7. |
Life of Mine |
66 |
| |
13.8. |
Staff |
66 |
| 14. |
Processing and recovery methods |
67 |
| |
14.1. |
Process Plant |
67 |
| |
14.2. |
Raw materials for the cement production |
68 |
| |
14.3. |
Flow sheet |
69 |
| |
14.4. |
Main equipment |
70 |
| |
14.5. |
Cement Plant Mass balance |
70 |
| |
14.6. |
Process losses |
70 |
| |
14.7. |
Water consumption |
71 |
| |
14.8. |
Fossil fuel consumption |
71 |
| |
14.9. |
Electric power consumption |
71 |
| |
14.10. |
Maintenance Plan |
71 |
| |
14.11. |
Staff |
71 |
| 15. |
Infrastructure |
72 |
| |
15.1. |
Virrila quarry |
72 |
| |
15.2. |
Piura plant |
73 |
| 16. |
Market Studies |
73 |
| |
16.1. |
The cement market in Peru |
73 |
| |
16.2. |
Industry and Macroeconomic Analysis |
74 |
| |
16.3. |
The North Region Market |
76 |
| |
16.4. |
Cement price |
76 |
| |
16.5. |
Current and future demand |
77 |
| 17. |
Environmental studies, permitting, and plans, negotiations, or agreements with local individual or groups. |
80 |
| |
17.1. |
Environmental Aspects |
80 |
| |
|
17.1.1. |
Virrila quarry |
80 |
| |
|
17.1.2. |
Piura plant |
82 |
| |
17.2. |
Solid waste disposal |
82 |
| |
17.3. |
Qualified Person’s Opinion |
83 |
| 18. |
Capital and operations costs |
84 |
| |
18.1. |
Basis for operating and capital cost for the quarry and plant |
84 |
| |
18.2. |
Capital and Operating Cost Estimates |
85 |
| |
18.3. |
Capital and Operating cost estimation risks |
86 |
| 19. |
Economic analysis |
87 |
| |
19.1. |
Methodology: for Discounted Cash flow (Free) |
87 |
| |
19.2. |
Assumptions |
87 |
| |
|
19.2.1. |
General and Macroeconomic Assumptions |
87 |
| |
|
19.2.2. |
Income and Cost Assumptions |
87 |
| |
19.3. |
Results of financial model |
87 |
| |
19.4. |
Sensitivity Analysis |
90 |
| 20. |
Adjacent properties |
92 |
| 21. |
Other relevant data and information |
93 |
| 22. |
Interpretation and conclusions |
93 |
| 23. |
Recommendations |
95 |
| 24. |
References |
96 |
| 25. |
Reliance on information provided by the registrant |
97 |
Index
of tables
| Table 1 |
Mineral Resources (exclusive of Reserves) in the Virrila quarry |
6 |
| Table 2 |
Ore Reserves in the Virrila quarry |
6 |
| Table 3 |
Projection of demand and price for the next 30 years |
9 |
| Table 4 |
Free Cash Flow and valuation |
12 |
| Table 5 |
Resource Categorization (exclusive of Reserves) at the Virrila quarry |
15 |
| Table 6 |
Mineral Reserves expressed in millions of tonnes |
15 |
| Table 7 |
List of Cementos Pacasmayo S.A.A. Professionals |
18 |
| Table 8 |
QP’s field visit |
20 |
| Table 9 |
UEA Virrila Concessions |
21 |
| Table 10 |
Central coordinates of the UEA Virrila property |
22 |
| Table 11 |
Central coordinates of the Piura cement plant |
24 |
| Table 12 |
Regional stratigraphic column |
30 |
| Table 13 |
Local stratigraphic column of the Virrila quarry |
32 |
| Table 14 |
Characteristics of the Virrila deposit |
33 |
| Table 15 |
Quality Plan of the Virrila quarry |
38 |
| Table 16 |
Tests and frequency for each stage of the process |
41 |
| Table 17 |
Lithologic units of the Virrila quarry geological model |
49 |
| Table 18 |
Quality Parameters for Dome and Additive coquina |
50 |
| Table 19 |
Characteristics of the block model |
50 |
| Table 20 |
Basic data statistics |
52 |
| Table 21 |
Estimation Parameters Secondary Variables |
53 |
| Table 22 |
Resource Categorization (exclusive of Reserves) at the Virrila quarry |
54 |
| Table 23 |
Ore Reserves expressed in million tons |
59 |
| Table 24 |
Mining equipment at the Virrila Quarry |
61 |
| Table 25 |
Virrila quarry physical stability analysis summary |
62 |
| Table 26 |
Geotechnical properties of materials |
63 |
| Table 27 |
Mine design parameters |
64 |
| Table 28 |
Minning plan forecast |
65 |
| Table 29 |
Main equipment in Piura plant |
70 |
| Table 30 |
Balance for raw meal production |
70 |
| Table 31 |
Balance for cement production |
70 |
| Table 32 |
Fuel Consumption for Cementos Pacasmayo S.A.A – Piura Plant |
71 |
| Table 33 |
Cement shipments at domestic level (in thousands of tonnes) |
74 |
| Table 34 |
Cement at Piura plant |
76 |
| Table 35 |
Forecast of future demand for Piura cement plant |
79 |
| Table 36 |
Concepts about cost structure of Virrila quarry and Piura plant |
84 |
| Table 37 |
Operating costs forecast of quarry and plant |
85 |
| Table 38 |
Investment forecast in quarry and plant |
86 |
| Table 39 |
Profit and Loss Statement |
88 |
| Table 40 |
Free Cash Flow and valuation |
89 |
| Table 41 |
Sensitivity analysis of the Net Present Value |
90 |
| Table 42 |
Sensitivity analysis of EBITDA |
90 |
| Table 43 |
Resources at the Virrila quarry in millions of tonnes (exclusive of Reserves) |
94 |
| Table 44 |
Mineral Reserves expressed in millions of tonnes |
94 |
| Table 42 |
List of Cementos Pacasmayo S.A.A. information. |
97 |
Index
of figures
| Figure 1 |
Mining secuence of Virrila quarry |
7 |
| Figure 2 |
Piura plant process block diagram |
8 |
| Figure 3 |
Sensitivity of Net Present Value |
13 |
| Figure 4 |
Sensitivity of EBITDA |
13 |
| Figure 5 |
UEA Virrila map |
23 |
| Figure 6 |
Piura plant perimeter |
25 |
| Figure 6 |
Geological section of the Virrila quarry |
33 |
| Figure 8 |
Map of the location of drill holes in the Virrila quarry |
35 |
| Figure 8 |
Mining secuence of Virrila quarry |
60 |
| Figure 10 |
Virrila quarry final pit |
66 |
| Figure 11 |
Piura plant process block diagram |
69 |
| Figure 12 |
Virrila quarry facilities |
72 |
| Figure 13 |
Segmentation of the cement market in Peru |
73 |
| Figure 14 |
Global GDP and Construction sector GDP MoM variation (%) |
75 |
| Figure 15 |
Historic prices of cement in Peru |
77 |
| Figure 16 |
Evolution of the national demand of cement |
78 |
| Figure 17 |
Sensitivity of Net Present Value |
91 |
| Figure 18 |
Sensitivity of EBITDA |
91 |
| Figure 19 |
Adjacent properties map |
92 |
Cementos
Pacasmayo S.A.A (CPSAA) is a Peruvian company whose corporate purpose is the production of cement and other products associated with
the construction sector. This Technical Report Summary summarizes a Pre-feasibility study of the Virrila quarry and Cement Plant located
in the Piura Region, both owned by CPSAA. Cementos Pacasmayo´s qualified persons prepared this Report to support disclosure of
coquina Resources and Reserves.
The
Virrila quarry contains coquina, the main raw material for cement production. This quarry is located in the Sechura district, of Sechura
Province, in the Piura Region. There is an access road to this quarry from Lima to Piura. The Piura plant is located in Piura city, and
is 192 km from Virrila quarry and 950 Km from Lima.
The
quarry is in a temperate and humid climate, with little rainfall, mostly between February and April. Average annual temperatures vary
between 17.8 °C and 29.5 °C. The highest temperatures were recorded in January, February, and March, and the lowest in August
and September.
In
the Piura plant, the climate is predominantly arid and warm, with no rain for most of the year. The average maximum temperature is 31.2
°C, and the minimum is 17.7 °C. When the El Niño phenomenon occurs, there is rainfall, especially between December and
June.
The
Virrila quarry is a production stage operation on a non-metallic deposit of calcareous material from marine shells that supply raw material
to the cement plant in Piura. Cementos Pacasmayo S.A.A owns the mineral deposit.
The
Virrila quarry started operations on September 17, 2015. The mining contractor San Martin Contratistas Generales S.A. was in charge
of the production from the start of operations until March 14, 2020. The mining contractor Posada Perú S.A.C started
operations at the Virrila quarry on September 14, 2020, until December 30, 2021. On January 3, 2022, the mining contractor San
Martin Contratistas Generales S.A. was hired for the production of the coquina. The transport the coquina from the Virrila quarry to
the Piura plant in in charge of other companies.
During
the 2023 period, two mining contractors worked at the Virrilá quarry operations from January to April with San Martin Contratistas
Generales S.A. and from October to December with Sechura Ingenieria y Contrucción E.I.R.L.
From
May to September 2023, Cantera Virrila stopped operations due to the interruption of traffic caused by the overflow of the La Niña
lagoon provoked by cyclone Yaku. Likewise, the Piura plant stopped its clinker production operations (raw meal milling, coal milling
and reception of raw materials) from July to September was to avoid exceeding the strategic inventories (clinker). The cement grinding,
receiving (cement additions), packaging and dispatching processes remained active to cover the cement demand.
Virrila
quarry restarted operations in October.
| 1.4. | Geological
environment and mineralization |
Geologically,
the study area is in the desert zone of Sechura and has sedimentary rocks from the Recent Quaternary.
It
is composed of silty sand deposits with intercalations of medium to fine-grained sands and coquina horizons. Below the recent deposits,
there are diagenetic eolian deposits in the sandy matrix with calcareous cement. Below these, there are intercalations of conglomerates
with gray diatomites, intercalated with white reef sandstones, corresponding to the Talara Bedrock and the upper levels of the Zapallal
Formation.
The
Virrila quarry deposit is comprised of coquiniferous portions of the Talara Tablazo that undergo lateral variations in thickness and
composition of calcareous remains.
In
2007 and 2008 exploration activities were performed to obtain geological information from the Virrila quarry that would allow the
production of coquina.
In 2013, exploration activities were carried out by means of test pits in the best areas of the mining
concession.
In
2019, activities and sampling in the operation area were developed to validate the Mineral Reserves in the area of operation and update
the inventory.
In
2021, drilling was conducted to confirm Reserves within the operations and to know in more detail the characteristics of the deposit.
In
2022, drilling was conducted to confirm Reserves in the same area that the 2021 campaign.
In
2023, from May to June Cementos Pacasmayo carry out a drilling campaign in order to confirm mineral Reserves of Virrila deposit.
| 1.6. | Sample
preparation, analysis and security |
Cementos
Pacasmayo S.A.A., through its quality control group, performed quality assurance activities for the samples obtained at the Virrila deposit,
applying the quality control plan, protocols, and measures necessary to get information on the coquina samples. Laboratory analyses were
performed at the chemical laboratory of Piura plant and were applied for the estimation of Resources and Reserves of the deposit.
The
Piura plant’s Quality Assurance and Control Department has implemented a sampling and data verification plan for the following processes:
raw material reception, raw mill scale, raw mill grinding, kiln feed, coal scale, coal grinding, preheater, kiln filter, clinkerization,
cement grinding, mill scale, cement grinding, cement composting, packaging control, packaging-composting and by-pass.
Likewise,
Cementos Pacasmayo S.A.A. has implemented quality assurance, quality control (QAQC) protocols to develop exploration and production activities
in the Virrila quarry and in the Piura plant to ensure the quality of the information that is used in the estimation of Mineral Resources
and Reserves.
Cementos
Pacasmayo has procedures for sample preparation, testing, and information security in its operations. The cement plants and operations
have implemented the ISO 9001 standard since 2015. Certification is renewed annually through an external audit.
Concerning
geological activities, CPSAA has a data verification unit for the geological database. This unit has as its main function, the verification
of data to be used in the estimation of Mineral Resources and Reserves. For the appropriate administration of information, internal protocols
have been implemented that are subject to internal audits. The stages within the verification activities for the geologic data are the
data collection, the administration and validation of data received from internal and external laboratories, data tracking through the
confirmation of custody chains and finally, validation of data in the database that will allow the development of the Mineral Resources
and Reserves model.
The
qualified persons followed the defined processes for information flows to support Mineral Resource and Reserve estimation. The qualified
person followed the same process as a means of verifying and validating the geologic data. They found that the validated information
is congruent in the interpretations of the same, with which the fundamental base geological models were generated for the estimation
of the Mineral Resources.
No
findings have been found that could invalidate the estimation of the Resources and Reserves of the deposit.
For
data verification activities at the cement plant, the Plan, Do, Check and Act (PDCA) methodology is used. This is applied to the technical
information received from the company’s internal and external customers. The quality control laboratory compares the results with national
and international laboratories as part of the verification procedures.
In
the author’s opinion, the methodologies used for collecting and processing data at the cement plant are accurate and free of important
errors. The information can be used within the models’ construction and estimates for cement production. Considering that the analyses
of the main chemical components and physical properties of the raw materials and final products are made in external laboratories, the
quality of the information is adequate for preparing mineral Resource and Reserve Estimates.
| 1.8. | Mineral
processing and metallurgical test |
Cementos
Pacasmayo has procedures for developing products at the laboratory level and scaling at the industrial level: its guidelines for preparing,
reviewing, insurance, and controlling laboratory test reports. Cementos Pacasmayo has a research and development laboratory located in
the Pacasmayo plant to evaluate the technical operations of cement plant and quarry operations.
In
order for its operations at the Piura plant to have a representative sample of its raw materials and cement, Cementos Pacasmayo performs
the analysis of its samples in its internal Research and Development Laboratory located at the Pacasmayo plant.
A
significant percentage of Research and Development activities are focused on evaluating different ratios between clinker-mineral additions
providing the best functional characteristics to our products, and balancing the benefits generated for the company. Another objective
is to identify other additions that can substitute for clinker: slag, pozzolana, fly ash, calcined clays, etc., to reduce our environmental
footprint and the cost of cement production. Based on this work, the laboratory has determined (and confirmed with production estimates)
that 1 tonne of coquina yields 0.77 tonnes of clinker and the clinker/cement factor of the main cements with additions is 0.72.
The
clinker/cement factor of the cement with additions: ICO and MS(MH) were investigated.
For
ICO cement, the clinker/cement factor was reduced by 0.71 (2021), 0.67 (2022) and 0.68 (2023). For MS(MH) cement the clinker/cement factor
was 0.72 (2021), 0.69 (2022) and 0.70 (2023).
The
Research Laboratory issues technical reports following the criteria of international standards to the operations area, which evaluates
the convenience of implementing the tests industrially and validating what is reported at the laboratory level.
| 1.9. | Estimation
of Resources and Mineral Reserves |
The
qualified persons (QPs) have estimated coquina Resources and Reserves for this property. The information from exploration in the previous
years has been used for the evaluation, and is the database for the Resources and Reserves model.
The
coquina Resources are presented in Table 1. The Resource estimation considered the quality restrictions of coquina received in the Piura
plant, limits of the concessions, accessibility to the Resources and legal limits of the mining concessions, relevant economic factors,
and modifying factors.
The
minimum quality accepted is 48.5% CaO to be used as raw material for cement production. Considering the sales prices of cement at the
Piura plant, the economic evaluation used for Resource evaluation is shown in Chapter 19 and uses the same criteria used to estimate
Reserves.
Table
1 Mineral Resources (exclusive of Reserves) in the Virrila quarry
| |
Resources |
Tonnes
M |
CaO
(%) |
SO3 (%) |
MgO (%) |
SiO2 (%) |
Na2O (%) |
K2O (%) |
Cl (ppm) |
| Coquina |
Measured |
19.9 |
49.68 |
0.61 |
0.66 |
7.21 |
0.23 |
0.20 |
0.08 |
| Indicated |
28.0 |
48.92 |
1.11 |
1.17 |
7.42 |
0.21 |
0.22 |
0.08 |
| Measured + Indicated |
47.9 |
49.24 |
0.90 |
0.96 |
7.33 |
0.22 |
0.21 |
0.08 |
| Inferred |
4.4 |
46.67 |
2.15 |
1.61 |
9.80 |
0.23 |
0.25 |
0.06 |
For
Reserve estimation, the Resources and the quality criteria, modifying factors, and coquina production costs were considered. The economic
results are shown in Chapter 19. The mining method used is open pit mining.
Table
2 Ore Reserves in the Virrila quarry
| |
Reserves |
Tonnes
M |
CaO (%) |
SO3 (%) |
MgO (%) |
SiO2 (%) |
Na2O (%) |
K2O (%) |
Cl (ppm) |
| Coquina |
Proven |
40.3 |
51.87 |
0.35 |
0.70 |
5.02 |
0.29 |
0.16 |
0.032 |
| Probable |
2.7 |
49.78 |
1.08 |
1.42 |
6.45 |
0.25 |
0.20 |
0.096 |
| Total |
43.0 |
51.73 |
0.40 |
0.74 |
5.11 |
0.29 |
0.16 |
0.036 |
Cementos
Pacasmayo S.A.A. is the current owner of the Virrila quarry and is in charge of the coquina´s production. The loading/transport
of coquina has been outsourced to a
contractor, Cementos Pacasmayo S.A.A. supervises the quarry to verify the activities and output according to the requirements of the
Cement Plant.
The
mining of coquina at the Virrila quarry consider the activities of Stripping, surface mining, stacking, loading for dispatch, weighing
and dispatch.
Figure
1 Mining secuence of Virrila quarry

The
main equipment used for the production of coquina in the Virrila quarry is a surface miner, front loader and dump truck. Also auxiliary
equipment is necessary like pikup van, tanker truck and other equipment.
The
mining plan of the Virrila quarry consider an average annual production of 1.43 million tonnes of coquina for the next 30 years and a
stripping rate of 0.41.
Based
on the plant requirements and sales projection for the next 30 years, the pit design parameters for the Virrila quarry are maximum pit
height, maximum bench height and pit bank slope.
| 1.11. | Processing
Plant and Infrastructure |
Cement
production considers the stages of raw material extraction, raw material grinding and homogenization, clinkerization, cement grinding,
silo storage and packaging, loading, and transportation. Cement is moved through pneumatic conveyors to bagging systems to be packed
in bags and then loaded onto trucks operated by third parties for distribution.
Figure
2 Piura plant process block diagram
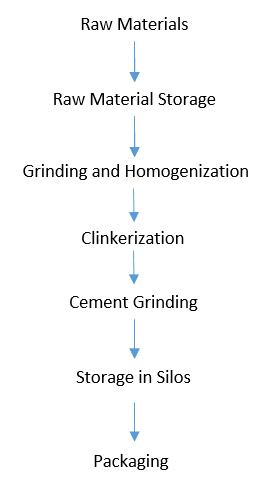
The
raw materials for cement production are coquina, sand, iron, clay, and coal. The mixture of these raw materials is the ground material
called raw meal, which is fed to the calcining kiln to produce clinker. Coquina represents 83.46% by weight of the raw meal.
Clinker
and additions are used to produce cement. The additions used in cement production are slag, pozzolana, shale, and gypsum.
Currently,
the Piura cement plant has a clinker/cement ratio of 0.71.
The
Piura plant has an electrical substation of 37.50 MW and uses electricity supplied from the national grid.
Cementos
Pacasmayo has implemented a preventive and corrective maintenance plan to prevent interruptions in cement production.
Cementos
Pacasmayo maintains operating efficiency to control costs and operating margins, and has initiatives to diversify energy sources and
secure supply when possible.
The
Peruvian cement market is geographically segmented by region: northern region, central region, and southern region, and each area is
served by several companies, most of which are cement producers.
The
main companies that supply the Peruvian cement market are Cementos Pacasmayo, UNACEM, and Cemento Yura. Some companies import cement
or clinker, such as Cemento Inka, Cemento Nacional and Cemex, among others.
Companies
that market cement in Peru follow the Peruvian Technical Standards associated with cement technical specifications.
Portland
cement is subdivided into Type I and Type V cement. Portland Cement is subdivided into Type ICO, Type IL, Type IP, and Type I (PM); and
finally, Hydraulic Cements specified by performance are Type GU, Type MS (MH), Type HS, Type HE, Type MH, and Type LH.
Cementos
Pacasmayo, being the leading company in the production and sale of cement in the Northern Region, has a market share in the following
cities: Cajamarca, Chiclayo, Chimbote, Jaén, Pacasmayo, Piura, Rioja, Tarapoto, Trujillo, Tumbes, Yurimaguas and Iquitos. Cementos
Pacasmayo also has a market share of 93.8% in the country’s northern region.
Annual
cement deliveries nationwide for the year 2023 reached 12.2 million tons, while total cement deliveries of Piura plant for 2023 were
1.04 million tons. The Piura plant serves 33.4% of the cement demand in the country’s Northern Region, and its cement dispatches represent
almost 35.6% of the three cement plant’s overall shipments.
Table
3 shows the projected demand and price per ton of cement for the next 30 years.
Table
3 Projection of demand and price for the next 30 years
| | |
Shipments (tonnes) | | |
Revenue
S/ x t | |
| | |
| | |
| |
| 2024P | |
| 847,382 | | |
| 497.8 | |
| 2025P | |
| 1,030,460 | | |
| 470.1 | |
| 2026P | |
| 1,051,069 | | |
| 482.6 | |
| 2027P | |
| 1,356,464 | | |
| 495.4 | |
| 2028P | |
| 1,424,976 | | |
| 508.5 | |
| 2029P | |
| 1,494,859 | | |
| 522.0 | |
| 2030P | |
| 1,566,140 | | |
| 535.8 | |
| 2031P | |
| 1,638,846 | | |
| 550.0 | |
| 2032P | |
| 1,600,000 | | |
| 564.6 | |
| 2033P | |
| 1,600,000 | | |
| 579.6 | |
| 2034P | |
| 1,600,000 | | |
| 594.9 | |
| 2035P | |
| 1,600,000 | | |
| 610.7 | |
| 2036P | |
| 1,600,000 | | |
| 626.9 | |
| 2037P | |
| 1,600,000 | | |
| 643.5 | |
| 2038P | |
| 1,600,000 | | |
| 660.5 | |
| 2039P | |
| 1,600,000 | | |
| 678.0 | |
| 2040P | |
| 1,600,000 | | |
| 696.0 | |
| 2041P | |
| 1,600,000 | | |
| 714.5 | |
| 2042P | |
| 1,600,000 | | |
| 733.4 | |
| 2043P | |
| 1,600,000 | | |
| 752.8 | |
| 2044P | |
| 1,600,000 | | |
| 772.8 | |
| 2045P | |
| 1,600,000 | | |
| 793.3 | |
| 2046P | |
| 1,600,000 | | |
| 814.3 | |
| 2047P | |
| 1,600,000 | | |
| 835.9 | |
| 2048P | |
| 1,600,000 | | |
| 858.0 | |
| 2049P | |
| 1,600,000 | | |
| 880.7 | |
| 2050P | |
| 1,600,000 | | |
| 904.1 | |
| 2051P | |
| 1,600,000 | | |
| 928.0 | |
| 2052P | |
| 1,600,000 | | |
| 952.6 | |
| 2053P | |
| 1,600,000 | | |
| 977.9 | |
| 1.13. | Capital
and operating costs and Economic Analysis |
This
document presents the cash flow analysis and an economic evaluation of the project based on the current operating costs of the cement
plant in Piura. It uses the information on the Virrila quarry for coquina production.
For
the Reserves evaluation, the general and macroeconomic assumptions used for the projection of the free/economic cash flows and for the
valuation are:
| - | Projection
horizon: 30 years (2024 to 2053) according to the estimated years of quarry life. |
| - | Annual
inflation rate, 2.90%, based on based on The International Monetary Fund as of October 2023:
applies equally to sales price, costs, and expenses. |
| - | Capital
cost projections were determined using a historical ratio of annual investments and maintenance
costs which also considers the increase in production volume. |
| - | The
company’s capital structure is being considered in the discount rate (WACC) of 11.56%. |
| - | Income
tax rate: effective rate of actual (historical) business results, 29% - 30%. |
| - | Workers’
Profit Sharing: 10%. |
| - | Exchange
rate: exchange rate is assumed to remain at 3.80 (USD/PEN). |
The
economic analysis uses the economic assumptions listed in Chapter 19. The main variables considered in the economic model for the sensitivity
analysis were cement price, production cost, and Capex. Some of these main assumptions are listed below here.
The
free cash flow is constructed for the economic analysis, which does not incorporate the financing structure. The latter is considered
in the weighted average cost of capital (WACC) to discount future cash flows. The following financial parameters were calculated:
| ● | NPV
of 1,664 million Soles at a discount rate of 11.56%. |
| ● | Average
plant throughput for cement production: 1.5 million tonnes per year over the 30-year projection. |
| ● | Average
sales price: 687.8 Soles per ton of cement, an average of the 30-year projection, at nominal
values. |
| ● | Revenues:
1,046 million Soles, an average of the 30-year projection. |
| ● | Average
cash production cost: 428.6 Soles per ton of cement, an average of the 30-year projection,
at nominal values. |
The
cash flow of the project is presented in Table 4 below. The net present value at a discount rate of 11.56% is 1,664 million Soles.
Table
4 Free Cash Flow and valuation
| | |
FCF - Valuation (Thousand S/) | |
| | |
(-) Taxes (EBIT*t) | | |
(-) CapEx | | |
EBITDA Planta Pacasmayo | | |
Free Cash Flow | |
| | |
| | |
| | |
| | |
| |
| 2023P | |
| -35,476 | | |
| -15,488 | | |
| 139,332 | | |
| 88,367 | |
| 2024P | |
| -41,798 | | |
| -15,938 | | |
| 162,619 | | |
| 104,884 | |
| 2025P | |
| -44,430 | | |
| -16,400 | | |
| 171,473 | | |
| 110,643 | |
| 2026P | |
| -65,344 | | |
| -16,875 | | |
| 241,057 | | |
| 158,837 | |
| 2027P | |
| -71,048 | | |
| -17,365 | | |
| 257,410 | | |
| 168,998 | |
| 2028P | |
| -80,970 | | |
| -17,868 | | |
| 283,543 | | |
| 184,705 | |
| 2029P | |
| -88,795 | | |
| -18,386 | | |
| 307,358 | | |
| 200,177 | |
| 2030P | |
| -91,206 | | |
| -18,920 | | |
| 315,968 | | |
| 205,842 | |
| 2031P | |
| -88,098 | | |
| -19,468 | | |
| 304,740 | | |
| 197,175 | |
| 2032P | |
| -90,628 | | |
| -20,033 | | |
| 312,631 | | |
| 201,969 | |
| 2033P | |
| -92,979 | | |
| -20,614 | | |
| 315,883 | | |
| 202,290 | |
| 2034P | |
| -97,783 | | |
| -21,212 | | |
| 327,775 | | |
| 208,780 | |
| 2035P | |
| -100,948 | | |
| -21,827 | | |
| 336,490 | | |
| 213,715 | |
| 2036P | |
| -102,294 | | |
| -22,460 | | |
| 340,598 | | |
| 215,845 | |
| 2037P | |
| -108,257 | | |
| -23,111 | | |
| 353,369 | | |
| 222,001 | |
| 2038P | |
| -112,617 | | |
| -23,781 | | |
| 362,696 | | |
| 226,297 | |
| 2039P | |
| -115,005 | | |
| -24,471 | | |
| 367,421 | | |
| 227,945 | |
| 2040P | |
| -119,961 | | |
| -25,181 | | |
| 380,815 | | |
| 235,673 | |
| 2041P | |
| -123,640 | | |
| -25,911 | | |
| 390,845 | | |
| 241,294 | |
| 2042P | |
| -125,805 | | |
| -26,662 | | |
| 396,237 | | |
| 243,770 | |
| 2043P | |
| -130,757 | | |
| -27,436 | | |
| 410,304 | | |
| 252,111 | |
| 2044P | |
| -134,251 | | |
| -28,231 | | |
| 420,956 | | |
| 258,474 | |
| 2045P | |
| -135,894 | | |
| -29,050 | | |
| 427,025 | | |
| 262,081 | |
| 2046P | |
| -140,774 | | |
| -29,892 | | |
| 441,793 | | |
| 271,127 | |
| 2047P | |
| -144,467 | | |
| -30,759 | | |
| 453,142 | | |
| 277,916 | |
| 2048P | |
| -146,458 | | |
| -31,651 | | |
| 460,439 | | |
| 282,330 | |
| 2049P | |
| -151,719 | | |
| -32,569 | | |
| 476,463 | | |
| 292,175 | |
| 2050P | |
| -156,077 | | |
| -33,514 | | |
| 489,098 | | |
| 299,508 | |
| 2051P | |
| -159,344 | | |
| -34,486 | | |
| 497,218 | | |
| 303,389 | |
| 2052P | |
| -164,936 | | |
| -35,486 | | |
| 514,082 | | |
| 313,661 | |
| WACC | |
| 11.56 | % |
| Economic NPV (Thousand S/) | |
| 1,663,683 | |
Sensitivity
analysis was also made to show the influence of changes in prices, OpEx and CapEx on NPV.
Figure
3 Sensitivity of Net Present Value
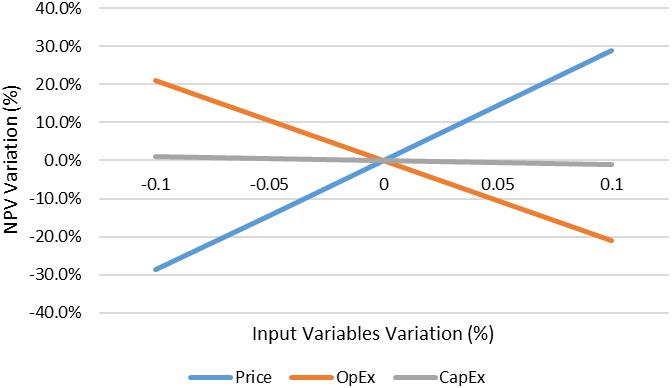
Figure
4 Sensitivity of EBITDA
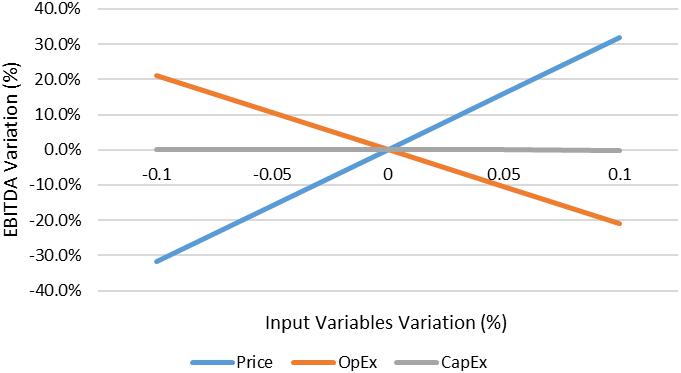
To
the north of the Cementos Pacasmayo S.A.A. concession is the Bayovar N° 7 concession owned by Americas Potash Peru S.A. To the east
of CPSAA’s concession are concessions Virrila 12, Virrila 19, and Virrila 23 owned by Cementos Pacasmayo S.A.A. To the west are concessions
Virrila 6, Virrila 9 and Virrila 14 owned by Cementos Pacasmayo S.A.A. and to the north is concession Virrila 16 owned by Cementos Pacasmayo
S.A.A.
| ● | From
a legal viewpoint, Cementos Pacasmayo S.A.A. has mining rights for the areas of exploration, development, and production of coquina to
supply the cement plants for normal production during the quarry’s life. It also has an agreement with Fundación Comunal San Martín
de Sechura for the right of usufruct, surface and easement for the area of operations at the Virrila quarry. |
| ● | Cementos
Pacasmayo S.A.A. has been complying with international ISO-9001 (Quality) standards since 2015 and has implemented Quality Assurance
and Quality Control (QAQC). The controls are applied for the construction of the Geological Model, Resource Estimation and Reserves Estimation. |
| ● | Cementos
Pacasmayo S.A.A. has a quality assurance system in its operations that includes sample preparation methods, procedures, analysis and
security, which comply with the best practices in the industry. |
| ● | The
information verification and validation processes are carried out following the procedures indicated in the information flows. The validated
information is congruent with the one that generated the geological models, which are the fundamental basis for the estimation of Resources. |
| ● | The
geological modeling of the coquina deposit is consistent with the relationship between the information and the geological model. |
| ● | The
Reserves estimations consider the geologic and modifying factors as well as risk. The quality variable is the CaO content which is very
stable in the deposit. There also are other secondary variables that determine the quality of the Reserves. |
| ● | In
the process of calculating Mineral Reserves and in the production plans of the quarry, these variables have been adequately considered
in the mining plan, properly sequenced, and with blending processes. There are sufficient proven and probable Mineral Reserves for the
next 30 years. |
| ● | Table
5 shows the Mineral Resources of the Virrila quarry. Likewise, the Mineral Reserves are shown in Table 6. |
Table
5 Resource Categorization (exclusive of Reserves) at the Virrila quarry
| |
Resources |
Tonnes
Mt |
CaO
(%) |
SO3 (%) |
MgO (%) |
SiO2 (%) |
Na2O (%) |
K2O (%) |
Cl (ppm) |
| Coquina |
Measured |
19.9 |
49.68 |
0.61 |
0.66 |
7.21 |
0.23 |
0.20 |
0.08 |
| Indicated |
28.0 |
48.92 |
1.11 |
1.17 |
7.42 |
0.21 |
0.22 |
0.08 |
| Measured + Indicated |
47.9 |
49.24 |
0.90 |
0.96 |
7.33 |
0.22 |
0.21 |
0.08 |
| Inferred |
4.4 |
46.67 |
2.15 |
1.61 |
9.80 |
0.23 |
0.25 |
0.06 |
Table
6 Mineral Reserves expressed in millions of tonnes
| |
Reserves |
Tonnes
M |
CaO
(%) |
SO3 (%) |
MgO (%) |
SiO2 (%) |
Na2O (%) |
K2O (%) |
Cl (ppm) |
| Coquina |
Proven |
40.3 |
51.87 |
0.35 |
0.70 |
5.02 |
0.29 |
0.16 |
0.03 |
| Probable |
2.7 |
49.78 |
1.08 |
1.42 |
6.45 |
0.25 |
0.20 |
0.10 |
| Total |
43.0 |
51.73 |
0.40 |
0.74 |
5.11 |
0.29 |
0.16 |
0.04 |
| ● | The
cement plant located in Piura has all the equipment and facilities available to produce cement, using coquina from the Virrila quarry
and other necessary materials. |
| ● | The
Health, Safety and Environment department is in charge of supervising compliance with the Company’s corporate policies and the various
legal requirements of the national regulatory bodies by all company areas. |
| ● | Through
its Social Responsibility area, Cementos Pacasmayo S.A.A. has generated relationships of trust with the communities surrounding its operations,
which have translated into a solid relationship with our communities, identifying their primary needs in health, education, urban development,
and local development. |
| ● | The
operation at the Virrila quarry and Piura plant, and related infrastructure, is technically and economically feasible due to the quarry’s
life. The sensitivity analysis shows that the operation is economically robust. |
| ● | Develop
a geological exploration program surrounding the Virrila quarry to discover new coquiniferous zones and other materials related to cement
production. |
| ● | Maintain
the QaQc program for exploration, development and production activities associated with cement production. |
| ● | It
is recommended to carry out the geological interpretation of the data generated during the 2023 diamond drilling campaign, which considered
the confirmation of Reserves in zone 2 and zone 4, so that they can be incorporated into the respective models, which will provide them
with greater support and robustness. |
| ● | Update
and standardize the geological model with the information generated by the diamond drilling campaign, considering that some areas have
test wells and other perforations as a source of information. |
| ● | Update
the geological model and standardize the information for the estimation of Resources and Reserves, considering that some areas have test
pits and other drillings as a source of information. |
| ● | Control
the stripping ratio during the operation in order to achieve a reduction in production costs. |
This
technical summary report (TRS) was prepared for Cementos Pacasmayo by qualified persons (QPs), who works for Cementos Pacasmayo, who
according to their qualifications and experience, developed the chapters based on their expertise. Likewise, the aforementioned QP’s
used the Company information sources, information validated and approved by the competent authorities in Peru, and public information
sources. Table 7 indicates the qualified persons who participated in the prepared this document and the chapters and information under
their responsibility.
Marco
Carrasco, who holds the position of Project Manager of Cementos Pacasmayo, is QP certified by the Mining and Metallurgical Society of
America (MMSA) of the United States. He acted as Project Manager, whose primary role was compiled the information received from the QPs
of each chapter to have an integrated document. Each QP is responsible for the section they wrote.
This
report summarizes the Pre-feasibility study results of the “UEA Virrila” property for the production of coquina using open-pit
mining methods. This technical report summary was prepared as an exhibit to support disclosure of Mineral Resources and Reserves by Cementos
Pacasmayo. The information is effective December 31, 2023.
The
coquina was produced from the UEA Virrila property located in the Sechura district. This property supplies raw material for the Piura
plant where cement is produced. The annual cement production is 1.5 million tonnes per year (Mtpy). This technical report summary estimates
Mineral Resources and Reserves according to the regulations published in Securities Exchange Commission (SEC) Form 20-F and under subpart
1300 of Regulation S-K. Actual operating costs have been considered for the estimates and used as a basis for economic projections within
the financial analysis.
The
report was prepared by the qualified persons listed in Table 7 using available studies and, in some cases (see Chapter 25), relying on
information provided by Cementos Pacasmayo, the registrant.
Table
7 List of Cementos Pacasmayo S.A.A. Professionals
| Item | | |
Chapter | |
First and Last Names | |
Job Position | |
Profession |
| 0 | | |
Compiled all | |
Marco Carrasco (*) | |
Project Manager | |
Chemical Engineer |
| 1 | | |
Executive summary | |
All QPs (**) | |
| |
|
| 2 | | |
Introduction | |
All QPs (**) | |
| |
|
| 3 | | |
Property description | |
Henry Vargas (***) | |
Environmental Coordinator | |
Environmental Engineer |
| 4 | | |
Accessibility, climate, local Resources, infrastructure and physiography | |
Henry Vargas (***) | |
Environmental Coordinator | |
Environmental Engineer |
| 5 | | |
History | |
Jorge Vega | |
Mining Projects Superintendent | |
Mining Engineering |
| 5 | | |
History | |
Jhonson Rodríguez | |
Senior Geologist | |
Geological Engineer |
| 6 | | |
Geological setting, mineralization, and deposit | |
Jhonson Rodríguez | |
Senior Geologist | |
Geological Engineer |
| 7 | | |
Exploration | |
Jhonson Rodríguez | |
Senior Geologist | |
Geological Engineer |
| 8 | | |
Sample preparation, analyses, and security | |
Jhonson Rodríguez | |
Senior Geologist | |
Geological Engineer |
| 8 | | |
Sample preparation, analyses, and security | |
Ivanoff Rojas | |
Production Superintendent | |
Chemical Engineer |
| 9 | | |
Data verification | |
Jhonson Rodríguez | |
Senior Geologist | |
Geological Engineer |
| 9 | | |
Data verification | |
Ivanoff Rojas | |
Production Superintendent | |
Chemical Engineer |
| 10 | | |
Mineral processing and metallurgical testing | |
Ivanoff Rojas | |
Production Superintendent | |
Chemical Engineer |
| 11 | | |
Mineral resource estimates | |
Jason Gamio (****) | |
Chief of Planning and Evaluation of Resources and Reserves | |
Geological Engineer |
| 12 | | |
Mineral reserve estimates | |
Jason Gamio (****) | |
Chief of Planning and Evaluation of Resources and Reserves | |
Geological Engineer |
| 13 | | |
Mining methods | |
Jorge Vega | |
Mining Projects Superintendent | |
Mining Engineering |
| 14 | | |
Processing and recovery methods | |
Ivanoff Rojas | |
Production Superintendent | |
Chemical Engineer |
| 15 | | |
Infrastructure | |
Jorge Vega | |
Mining Projects Superintendent | |
Mining Engineering |
| 16 | | |
Market studies | |
Jason Gamio (****) | |
Chief of Planning and Evaluation of Resources and Reserves | |
Geological Engineer |
| | 17 | | |
Environmental studies, permitting, and plans, negotiations, or agreements with local individuals or groups | |
Henry Vargas (***) | |
Environmental Coordinator | |
Environmental Engineer |
| | 18 | | |
Capital and operating costs | |
Jason Gamio (****) | |
Chief of Planning and Evaluation of Resources and Reserves | |
Geological Engineer |
| | 19 | | |
Economic analysis | |
Jason Gamio (****) | |
Chief of Planning and Evaluation of Resources and Reserves | |
Geological Engineer |
| | 20 | | |
Adjacent properties | |
Henry Vargas (***) | |
Environmental Coordinator | |
Environmental Engineer |
| | 21 | | |
Other relevant data and information | |
All QPs (**) | |
| |
|
| | 22 | | |
Interpretation and conclusions | |
All QPs (**) | |
| |
|
| | 23 | | |
Recommendations | |
All QPs (**) | |
| |
|
| | 24 | | |
References | |
All QPs (**) | |
| |
|
| | 25 | | |
Reliance on information provided by the registrant | |
All QPs (**) | |
| |
|
| (*) | Marco
Carrasco, who holds the position of Project Manager of Cementos Pacasmayo compiled the information received from the QPs of each chapter
to have an integrated report. Each QP is responsible for the section they wrote. |
| (**) | Henry
Vargas, Jorge Vega, Jhonson Rodríguez, Ivanoff Rojas and Jason Gamio |
| (***) | Henry
Vargas has joined Cementos Pacasmayo as Environmental
Coordinator (December 2022). |
| (****) | Jason
Gamio assumed new responsibilities as Chief of planning
and evaluation of resources and reserves (April 2023). |
Unless
otherwise indicated in the report, all currencies are in soles and all measurements and units are in the metric system. The UEA Virrila
property is represented by Universal Transverse Mercator (UTM) coordinates. Unless otherwise indicated, all coordinates referenced in
this report and the accompanying figures, tables, maps, and sections are provided in the WGS84 coordinate system, UTM 17S zone.
| 2.4. | Previous
Work and Sources of Information |
The
information used is sufficient to allow this TRS to be completed with the level of detail required by Regulation S-K subpart 1300. The
information used included exploration results from the various drilling campaigns, actual information from Cementos Pacasmayo’s operations,
information submitted to and approved by the corresponding authorities and public information in organizations specialized in the cement
industry. The list of sources of information is presented in Chapter 24 of this report.
| 2.5. | Details
of QP Personal Inspection |
The
QP’s who developed this document visited the Virrila quarry and the Piura plant as part of their activities for 2023.
Table
8 QP’s field visit
| Item | | |
First and Last Names | |
Job Position | |
Profession | |
Field visit |
| 1 | | |
Henry Vargas | |
Environmental Coordinator | |
Environmental Engineer | |
Mr. Vargas inspected the environmental monitoring points, solid waste areas, raw material warehouse, and the administrative area of the Piura plant and Virrila quarry to verify the environmental controls. |
| 2 | | |
Jorge Vega | |
Mining Projects Superintendent | |
Mining Engineering | |
Mr. Vega has visited the Virrila quarry on a regular basis, most recently on June 2022. During the most recent site visit, Mr. Vega inspected the production zones, the quarry design parameters
and the equipment’s condition. During 2023, he coordinated with operational staff about the items above. |
| 3 | | |
Jhonson Rodríguez | |
Senior Geologist | |
Geological Engineer | |
Mr. Rodríguez has regularly visited the Virrila quarry and Piura plant, most recently in October 2022. He visited core facilities and discussed grade control, geological mapping, exploration and delineation drill practices, diamond drill core logging, quality assurance, quality control (QA/QC), and laboratories. During 2023, he coordinated with operational staff about the items above. |
| 4 | | |
Ivanoff Rojas | |
Production Superintendent | |
Chemical Engineer | |
Piura Plant, all year as part of his duties in the production department. |
| 5 | | |
Jason Gamio | |
Chief of planning and evaluation of resources and reserves | |
Geological Engineer | |
Mr. Gamio has visited the Virrila quarry and Piura plant regularly. The last visit to the Virrila quarry and Piura plant was in July 2022, visiting core facilities, discussing grade control, geological mapping, exploration, and delineation drill practices, diamond drill core logging, quality assurance, and quality control (QA/QC), raw material storage and mineral reserve estimation practices. During 2023, he coordinated with operational staff about the items above. |
| 6 | | |
Marco Carrasco | |
Project Manager | |
Chemical Engineer | |
From September to December 2023, Mr. Carrasco visited the Piura plant multiple times. His last visit to the Virrila quarry was in 2022, but during 2023, he coordinated remotely with operational staff. His visit emphasized the operational cement process and equipment conditions (kilns, mills, storages (raw material and sub-products and products, etc)). |
| 2.6. | Previously
Filed Technical Report Summary |
This
Technical Report Summary (TRS) updates the previously filed technical report summary for the property. The previously filed TRS is
the “Technical Report Summary (TRS), Virrila Quarry and Piura Cement Plant 20-F 229.601”, which was filed as Exhibit
96.2 of the CPSAA’s Annual.
The
quarry is located in Sechura District, Sechura Province, Piura Region. It is located 192 Km from Cementos Pacasmayo S.A.A.’s Piura plant.
The
Peruvian State granted the mining right to Cementos Pacasmayo S.A.A. to carry out exploration and production activities that allow non-metallic
minerals found in the subsurface through mining concessions.
The
mining rights registered with the authority, Instituto Geológico Minero y Metalúrgico (INGEMMET) are as follows Virrila
3, Virrila 4, Virrila 6, Virrila 7, Virrila 8, Virrila 9, Virrila 10, Virrila 11, Virrila 12, Virrila 13, Virrila 14, Virrila 15, Virrila
16, Virrila 17, Virrila 18, Virrila 19, Virrila 20, Virrila 21, Virrila 22, Virrila 23 y Bayovar N° 4. The area of the mining property
is 38,226.00 Hectares.
The
mining rights (the mining concession title) are granted by INGEMMET of the Energy and Mines Sector through a Presidential Resolution.
It is determined to include the mining rights in the Virrila Economic-Administrative Unit (UEA).
On
March 31, 2016, by Presidential Resolution No. 0147-2016-INGEMMET/PCD/PM, the competent authority granted to CPSAA the Virrila Economic-Administrative
Unit (UEA), with code No. 01-00011-00-U of Cementos Pacasmayo S.A.A. These mining rights included 21 mining concessions.
Table
9 UEA Virrila Concessions
| N° |
Code |
Name |
Hectares |
Material |
| 1 |
010221599 |
Virrila 3 |
600.00 |
Non Metallic |
| 2 |
010221699 |
Virrila 4 |
400.00 |
Non Metallic |
| 3 |
010531406 |
Virrila 6 |
600.00 |
Non Metallic |
| 4 |
010531306 |
Virrila 7 |
700.00 |
Non Metallic |
| 5 |
010089707 |
Virrila 8 |
500.00 |
Non Metallic |
| 6 |
010089807 |
Virrila 9 |
1000.00 |
Non Metallic |
| 7 |
010089907 |
Virrila 10 |
1000.00 |
Non Metallic |
| 8 |
010090007 |
Virrila 11 |
900.00 |
Non Metallic |
| 9 |
010090107 |
Virrila 12 |
700.00 |
Non Metallic |
| 10 |
010090207 |
Virrila 13 |
800.00 |
Non Metallic |
| 11 |
010090307 |
Virrila 14 |
900.00 |
Non Metallic |
| 12 |
010090407 |
Virrila 15 |
600.00 |
Non Metallic |
| 13 |
010090507 |
Virrila 16 |
1000.00 |
Non Metallic |
| 14 |
010090607 |
Virrila 17 |
1000.00 |
Non Metallic |
| 15 |
010090707 |
Virrila 18 |
1000.00 |
Non Metallic |
| 16 |
010090807 |
Virrila 19 |
1000.00 |
Non Metallic |
| 17 |
010090907 |
Virrila 20 |
1000.00 |
Non Metallic |
| 18 |
010091007 |
Virrila 21 |
1000.00 |
Non Metallic |
| 19 |
010091107 |
Virrila 22 |
1000.00 |
Non Metallic |
| 20 |
010479607 |
Virrila 23 |
200.00 |
Non Metallic |
| 21 |
12000440Y01 |
Bayovar N° 4 |
22326.00 |
Non Metallic |
The
properties described above were granted by the authority (INGEMMET) from 2000 to 2008. Table 10 shows the UTM central coordinates of
the Virrila Economic Administrative Unit (UEA).
Table
10 Central coordinates of the UEA Virrila property
| North | |
East | | |
Radius | | |
Zone | |
| 9,350,000 | |
| 526,000 | | |
| 20,000 | | |
| 17 | |
In
accordance with this, the Virrila UEA includes twenty-one (21) non-metallic mining rights with an extension of 38,226.00 hectares, in
favor of Cementos Pacasmayo S.A.A., owner of said rights; located in the district of Sechura, province of Sechura and department of Piura.
Cementos
Pacasmayo S.A.A. complies annually with the payments for the rights to the Virrila concessions.
These
payments must be made from the first business day of January to June 30 of each year, CPSAA provides the Financial Entities in charge
of receiving the payments with the SINGLE CODE (see Table 9) of its mining rights, to comply with its obligation.
In
the case of Virrila concessions, the payment is equivalent to US$3 per hectare.
Likewise,
Cementos Pacasmayo S.A.A. pays royalties to the State as established by the Authority in Law N° 28258 and its amendment N° 29788.
Cementos
Pacasmayo S.A.A currently has an agreement with the Fundacion Comunal San Martin de Sechura for the use of the surface land
associated with the production area of the Virrila quarry. The area of usufruct, surface and easement rights held by
Fundación Comunal San Martín de Sechura is 14,842.800 hectares. Superintendencia Nacional de los Registros
Públicos (SUNARP).
Figure
5 UEA Virrila map
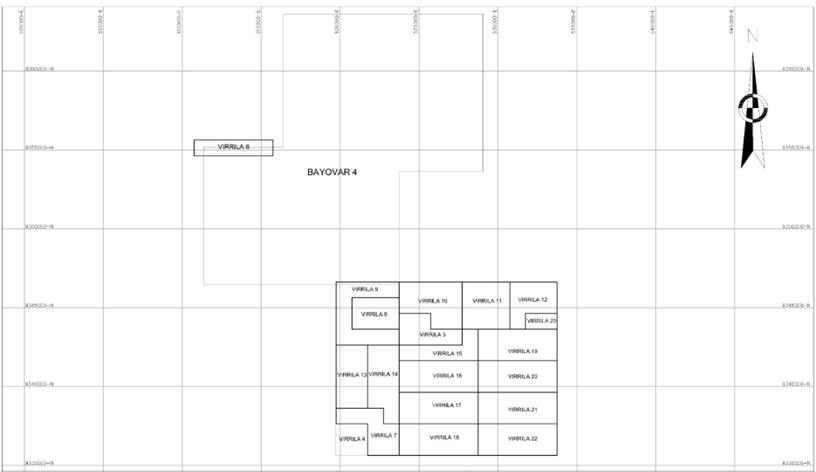
| 3.2. | Piura
Industrial Cement Plant |
The
cement plant property is located in the Veintiséis de Octubre District, Piura Province, Piura Region. The Piura plant is located
at kilometer 3 of the Piura highway.
The
property is shown in Figure 5, and Table 11 shows the UTM coordinates of the center of the circle of the Piura plant:
Table
11 Central coordinates of the Piura cement plant
| North | | |
East | | |
Radius | | |
Zone | |
| | 531293.65 | | |
| 9429098.05 | | |
| 650.00 | | |
| 17 | |
The
area of the property is 42.28 hectares. The property is registered in the National Superintendence of Public Registries (SUNARP) under
the registration numbers 11161659 and 11164329 in the registry zone No. I SEDE PIURA, Piura Registry Office.
Cementos
Pacasmayo S.A.A. pays taxes to the government as established by the Municipal Authority in the case of the Piura plant.
Figure
6 Piura plant perimeter
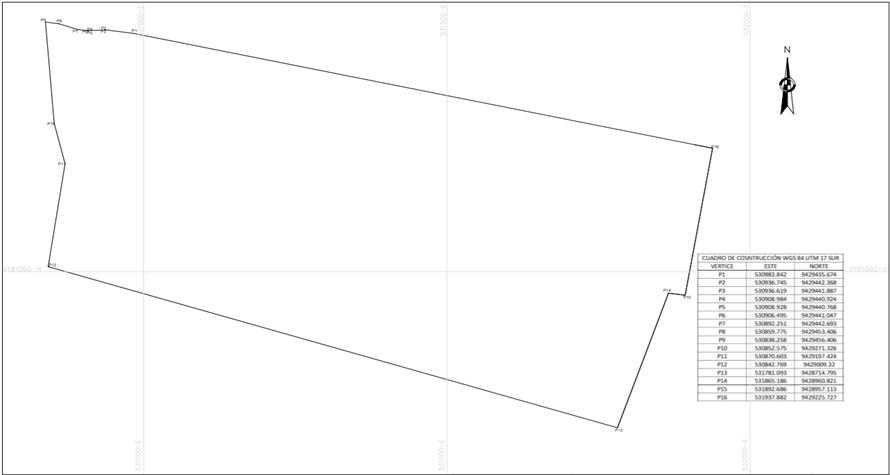
| 4. | Accesibility,
climate, local resources, infrastructure and physiography |
This
chapter describes the accessibility, climate, local resources and infrastructure for the Virrila quarry and Piura plant. Information
obtained from technical and environmental studies.
Topography
The
topography of the study area is homogeneous, comprising a flat relief made up of a large plain belonging to the Sechura desert.
Access
There
is an access road to this quarry from Lima to Piura. The Piura plant is located in Piura city, and it is located 192 km from Virrila
quarry and 950 Km from Lima.
The
main access is by land. The journey from Lima to the Virrila quarry is as follows: Lima - Sechura (950 km) for a total of 15 hours.
By
air, the route is as follows: Lima - Piura in 1.5 hours flight and an additional 1 hour drive on the Panamerican Highway north.
Climate
The
quarry has a temperate and wet climate, with little rainfall, mainly between February and April. Meteorological information was taken
at the SENAMHI Chusis station, the closest to the quarry. According to the data from this station, the predominant wind direction is
from the S and SE.
From
the analysis of the information from 2010-2014, it is evident that there is rainfall in the area in March and April. The months with
less precipitation are June, July, August, and September. The month of March has the highest rainfall in the years analyzed, with a monthly
total of 54.11 mm.
Temperature
The
highest temperature values were recorded in January, February, and March, and the lowest in August and September. Reported temperatures
for 2010-2014 were evaluated, showing temperature variations between 17.8 °C and 29.5 °C on average.
Physiography
The
quarry area is located in a basin where sedimentation was interrupted by tectonic movements with changes in accumulation styles until
the Pliocene.
The
lithostratigraphy of the area consists of Cenozoic sedimentary units corresponding to the Tertiary period that are not exposed on the
surface and Quaternary deposits (Tablezo Lobitos, Quaternary deposits of ancient alluvial, recent alluvial, coastal, lacustrine, beach
and eolian origin).
Other
geomorphological units outside the quarry area were identified as the estuary and floodplain.
The
degree of slope of the predominant land surface is flat to slightly sloping. According to its formation and dominant material type, the
plain landscape is Aeolian and Marine Plain.
Floods
and tsunamis form external geodynamics. Earthquakes form internal geodynamics.
Local
resources and infraestructure
The
quarry personnel is divided into Cementos Pacasmayo S.A.A. personnel and contractor personnel.
The
quarry is located 61.7 kilometers from the town of Sechura, which has the resources of a town. Contractor personnel is transported by
bus and pickup trucks for supervision personnel.
A
powerhouse provides a power supply with a generator set installed.
| 4.2. | Piura
industrial cement plant |
The
Piura plant is located in the province of Piura and region of the same name. The plant is located 192 km from the Virrila quarry.
Topography
The
Piura plant area is located on the left bank of the Piura to Paita highway, 3 km from the city of Piura, and has a coastal plain topography,
with thick banks of semi-compacted and compacted sands at an average depth of 0.50 m.
Climate
The
Piura plant area has a predominantly arid and warm climate with no rainfall for most of the year. When the El Niño phenomenon
occurs, there is rainfall, especially between December and June. The average maximum temperature is 31.2°C, and the minimum is 17.7°C.
The
dry season is from May to December, and the rainy season is from January to April. The highest rainfall occurs in March, reaching a value
of 448.4 mm.
The
average annual relative humidity has 69.9%; the lowest value of 66.5% was recorded in February and the highest value of 74.4% in June.
Regarding
wind speed data, the month with the lowest wind speed is March with 1.9 m/sec, and the month with the highest wind speed is September
with 3.3 m/sec. Regarding the data on wind direction, the wind direction is predominantly from south to north.
Physiography
In
the study area, the slope of the land is slightly inclined because it is covered by eolian materials made up of light gray silty sands
and sands, with loose sands resulting from the transfer of alluvial and fluvial materials by the wind; these are accumulations of sands
of variable thickness. It is possible to identify within the plains anthropic areas of recent works. Likewise, it is possible to distinguish
the slope phase from flat to slightly inclined (0 - 4 %).
Geomorphology
The
geomorphology of the Piura Region is the result of a succession of events related to processes of uplift, subsidence, erosion, sedimentation,
and deformation of the materials deposited in the sedimentary basins. This scenario has identified the following geoforms: Ardisols Sands,
Tablezos, Coastal Plain, Aeolian Sand Mantos.
Local
resources and infrastructure
Personnel
at the Piura plant are divided into Cementos Pacasmayo S.A.A. and contractors. Most of the personnel live in the city of Piura and travel
to the cement plant in company buses or their own vehicles.
Power
is supplied through the national grid. Cementos Pacasmayo has a contract with ENOSA (Electric Company), which provides power through
a 60 KV transmission line.
A
deep well supplies water to the Piura plant.
Virrila
quarry is a coquina quarry mining coquina that is suitable for different types of construction cement; Cementos Pacasmayo S.A.A owns
the mineral deposit.
The
Virrila quarry started operations on September 17, 2015. Cementos Pacasmayo hired San Martin Contratistas Generales S.A. to be the contractor
in charge of production from the start of operations until March 14, 2020.
Due
to the Covid-19 pandemic, operations at the Virrila quarry were suspended from March until September 2020.
After
the suspension, the mining contractor Posada Perú S.A.C started operations at the Virrila quarry on September 14, 2020, until
December 30, 2021.
January
3, 2022, the mining contractor San Martin Contratistas Generales S.A. was hired for the production of the coquina. The transport the
coquina from the Virrila quarry to the Piura plant is in charge of TRC and Induamerica companies.
During
the 2023 period, two mining contractors worked at the Virrilá quarry operations from January to April with San Martin Contratistas
Generales S.A. and from October to December with Sechura Ingenieria y Contrucción E.I.R.L.
In
2023, from May to June Cementos Pacasmayo carry out a drilling campaign in order to confirm Reserves in the zona 2 and zone 4.
From
May to September 2023, Virrila quarry stopped operations due to the interruption of traffic caused by the overflow of the La Niña
lagoon provoked by cyclone Yaku. Likewise, the Piura plant stopped its clinker production operations (raw meal milling, coal milling
and reception of raw materials) from July to September was to avoid exceeding the strategic inventories (clinker). The cement grinding,
receiving (cement additions), packaging and dispatching processes remained active to cover the cement demand.
Virrila
quarry and Piura plant restarted operations.
| 6. | Geological
setting, mineralization, and deposit |
The
strata of the district of Sechura, province of Sechura, Piura region, consists of Cenozoic Age sedimentary strata of the Tablazo Talara
deposit, Tablazo Lobitos deposit, Eolian deposits, Alluvial deposits and Recent deposits.
The
lithostratigraphic units found in the area correspond to Quaternary-Pleistocene deposits (2.58 to 0.129 Ma). Within this category are
first the tablazos, then the eolian deposits and old alluvial deposits with little diagenesis. The tablazos were first described by T.O.
BOSWORTH (1922) in the Talara - Mancora region and finally followed by the recent deposits.
Table
12 Regional stratigraphic column
Geologically,
the study area corresponds to the desert zone of Sechura and is represented by sedimentary materials from the Recent Quaternary.
It
is made up of silty sand deposits with intercalations of medium to fine-grained sands and coquina horizons.
Below
the recent deposits, there are diagenetic eolian deposits in a sandy matrix with calcareous cement. And underneath these are intercalations
of conglomerates with gray diatomites, intercalated with white reef sandstones, corresponding to the Tablazo of Talara and the upper
levels of the Zapallal Formation.
Cenozoic
- Tertiary (Miocene)
Zapallal
Formation (Tm-zas)
This
lithostratigraphic unit is an outcrop only in its upper member in the southern and northeastern part of the quarry area. It comprises
compact fine sand, coquina with fragments of reef shells, and conglomerate levels of diverse lithology with gravels smaller than 2”
in a sandy matrix with little cement.
It
is covered by light brown eolian sand, plant remains, and some very scarce remains of calcareous fragments due to erosion of its upper
levels.
Cenozoic
- Quaternary (Pleistocene)
Talara
Tablazo (Qp - tt)
It
is a Pleistocene-raised marine terrace. It has a significant extension in the region and constitutes 95% of the total area of the quarry.
Its relief is essentially flat, with slight undulations due to wind action and the crossing of small streams, which are activated only
during rainy periods. Topographically, this unit develops at an average elevation of 80 meters above sea level, with a slight inclination
to the SE. The calcareous deposit of the Virrila quarry is formed by coquiniferous portions of the Tablazo Talara that undergo lateral
variations in thickness and composition of calcareous remains.
Cenozoic
- Quaternary (Recent)
Aeolian
Deposits (Qr - e)
These
deposits are accumulations of fine to medium-grained sands transported from their sources of origin by the wind. They occur as small
layers or stacks of 1 to 2 meters thick, and are composed of brown silty sand with fragments of reef shells, gravels and remains of roots
at the deepest level. At the top, there are gray to dark brown eolian sands with few fragments of shells, reefs, gravels, and roots.
Table
13 Local stratigraphic column of the Virrila quarry
| Era |
System |
Series |
Lithostratigraphic
units |
Lithologic
Description |
|
Cenozoic |
Quaternary |
Recent |
Eolic
deposits |
SU |
Gray
to dark brown eolian sand, few fragments of coquina, gravels, remains of vegetation. |
| Pleistocene |
Tablazo
Talara |
CT |
Earthy
calcareous in beige to brown sandy matrix. Remnants of coquina, reefs, not very compact or loose and with some gravels. |
| B1S |
Fragments
of bivalves, gray color, with remains of shells and presence of gravel. |
| LM |
Sandy
silt with traces of calcareous, gray to beige color, medium dense, mostly occurring as large lenses within the CT, B1S and A1 layer. |
| A1 |
Calcareous
of fine matrix of beige to gray color, with presence of fragments of shells and reefs somewhat preserved of beige to gray color,
friable or somewhat compact due to the presence of sulfates. |
| A2-A |
Semi-compact
calcareous, with presence of coral reef and some sand. |
| A2 |
Coral
reef fragments of heterogeneous size and somewhat preserved, creamy beige to pinkish color, sometimes accompanied by a fine white
calcareous matrix, friable and somewhat compact in contact with the A2-B layer. |
| A2-B |
Semi-compact
coral reef fragments, with some gravel. |
| A2-C |
Fragments
of coral reef, with some gravel. |
| A3 |
Dark
beige calcareous fine compact matrix with presence of voids and high magnesium, weak reaction to HCl. |
| ARE |
Silty
sand with traces of calcareous minerals |
| B1 |
Fine
matrix calcareous, beige color with preserved coquina fragments of heterogeneous size and traces of gravels. |
| B2 |
Sandy
calcareous with remains of fragmented whitish gray shells and with presence of gravels. |
| GRV |
Conglomerate
of sandy matrix, medium to coarse-grained, gray color, compact. |
| Tertiary |
Miocene |
Zapallal
Formation |
DIA |
Diatomite
massive green color, semi compact. |
| 6.3. | Characteristics
of the deposit |
Table
14 shows the characteristics of the deposit.
Table
14 Characteristics of the Virrila deposit
| Quarry |
Average
Width (m) |
Average
Length (m) |
Average
Thickness (m) |
Average
depth (m) |
Continuity |
Top
Elevation |
Lower
Elevation |
| Virrila |
950-2000 |
3100-4000 |
7-20 |
37 |
20 |
Calcareous
sedimentary deposit whose zones are controlled by the continuity of the quality of the strata. |
Figure
6 Geological section of the Virrila quarry
During
2007 and 2008, exploration activities were performed to collect geological information from the Virrila quarry.
In
2013, exploration activities were carried out using test pits in the best areas of the concession.
In
2019, activities and sampling in the operation area were developed to validate the reserves in the area of operation and update the inventory.
During
2021, drilling was conducted to confirm Reserves within the operations. The work performed during 2021 aimed to:
| ● | Obtain
representative samples of drill core. |
| ● | Identify
and recognize the lithological strata. |
| ● | Perform
chemical tests to determine the qualities of the material. |
| ● | Reconfirm the volume and tonnage of the Reserves. |
The
drilling work was supervised by Cementos Pacasmayo S.A.A. personnel and executed by Ram Peru S.A.C.
Ram
Peru S.A.C. executed the diamond drill holes of 10 m depth. The drill holes had a vertical orientation (-90°), and HQ pipe (63, 5
mm) was used.
In
2022, drilling was conducted to confirm Reserves in the same area that the 2021 campaign.
In
2023, drilling campaign was conducted to confirm Reserves in the zone 2 and zone 4. The drilling work was supervised by Cementos Pacasmayo
S.A.A. personnel and executed by Ram Peru S.A.C.
Figure
8 Map of the location of drill holes in the Virrila quarry.
During
2023, Cementos Pacasmayo did not conduct hydrogeological studies. The last hydrogeological studies were conducted during 2012 and the
information was presented in the previously filed TRS titled “Technical Report Summary (TRS), Virrila Quarry and Piura Cement Plant
20-F 229.601”, which was filed as Exhibit 96.2 of the CPSAA’s Annual Report on Form 20-F filed with the SEC on April 28,
2022 (File No. 001-35401).
As
stated in the previous TRS, Cementos Pacasmayo hired IENDESA S.A.C to perform a hydrogeological study at the Virrila quarry .The hydrogeological
study included the evaluation of 07 Electro Vertical Soundings (SEV).
The
results showed that the yields oscillate between 13 to 17 l/s, and the depths range from 134.4 to 271.45 m, indicating the nappe is semi-confined
in the Tertiary age sedimentary rocks.
During
2023, Cementos Pacasmayo did not conduct geotechnical studies, The last geotechnical study was conducted 2013 and the information was
presented in the previously filed TRS titled “Technical Report Summary (TRS), Virrila Quarry and Piura Cement Plant 20-F 229.601”,
which was filed as Exhibit 96.2 of the CPSAA’s Annual Report on Form 20-F filed with the SEC on April 28, 2022 (File No. 001-35401).
As
per the previously filed TRS, the geotechnical studies concluded, based on the geotechnical test work that the current slopes at the
Virrila quarry are stable for static and pseudo-static loading conditions, with safety factors above the minimum recommended for operating
conditions.
| 8. | Sample
preparation, analysis and security |
This
Chapter describes the preparation, analysis and security of the samples used for the geology, quarry and cement plant operations.
Cementos
Pacasmayo S.A.A. has implemented international standards in all its operations, such as quarries and plants. The ISO 9001 standard has
been implemented and certified since 2015. The certification is renewed annually through an external audit.
The
SSOMASIG department (Security, Occupational Health, Environment and Management Systems) is part of the team that determines and gives
the necessary support for maintaining the ISO 9001 (Quality). The scope is in all the company’s activities.
The
Geology department has protocols for the activities of sample preparation methods, quality control procedues, security and other activities.
| 8.1.1. | Preparation
of samples, procedures, assays and laboratories |
Samples
obtained from the drill holes are placed in holders to be duly coded, cut, bagged and sent to the laboratory at the Piura plant and are
occasionally sent to an external laboratory following the company’s procedures.
Certimin
S.A. is used as an external laboratory for chemical analysis. This laboratory has modern facilities for developing mining services associated
with the cement industry and technical support in the geochemical field for national and international companies. Certimin S.A. is a
Peruvian laboratory certified in ISO 9001, ISO 14001, ISO 45001, NTP-ISO/IEC 17025 Accreditation and membership in ASTM.
For
the coquina samples, the laboratory analyses evaluate CaO, MgO, AlO3, SiO2, Fe2O3 and SO3.
Once received in the laboratory, the properties of the coquina to be used in cement production are analyzed
| 8.1.2. | Quality
Assurance Actions |
Cementos
Pacasmayo S.A.A., through its Quality Control unit, performed quality assurance activities for the samples obtained in the Virrila deposit,
applying the quality plan, procedures and measures necessary to obtain information from the coquina samples. The laboratory analyses
were performed in the chemical laboratory of the Piura plant. The results were used for the estimation of Resources and Reserves of the
deposit.
Cementos
Pacasmayo S.A.A. has implemented QAQC protocols to develop exploration and production activities in the Virrila quarry to ensure the
quality of the information that allows the estimation of Mineral Resources and Reserves in the deposit.
During
the 2022 drilling campaign, the QAQC control protocols were applied, and the samples obtained were sent to the Piura plant laboratory
for analysis. As part of the procedure, thick Duplicate and Twin samples were inserted, representing 3.22% and 24.8% as the insertion
ratio. Calcium oxide (CaO), which is the main component of the seashell for cement production, was analyzed. The Coarse Duplicate samples
represent 3.22% of the sample and 24.8% as the insertation ratio, the results present an error of 3% for the CaO. The percentage of good
samples was 97%. On the other hand, the quality control results for the Twin samples showed an error of 3% for the CaO, which is below
the permitted error of 30%. Also used were 33 samples of fine blanks and 34 standard samples prepared by an external laboratory (Certmin).
The
quality plan implemented by Cementos Pacasmayo for the quarries includes the insertion of blanks, duplicates and standards to control
the precision, accuracy, and contamination in the samples.
Table
15 Quality Plan of the Virrila quarry
| Blanks |
Duplicates |
Standards |
Remark |
| 1 control sample for each batch of 20 samples. |
2 control sample for each batch
of 20 samples. |
1 control sample for each batch
of 20 samples. |
Cementos Pacasmayo protocol ¨OM-GL-PRT-0023-R0¨. |
Cementos
Pacasmayo S.A.A. has implemented QAQC protocols to develop exploration and production activities in the Virrila quarry to ensure the
quality of the information that allows the estimation of Resources and Reserves in the deposit.
During
the drilling campaigns, Cementos Pacasmayo S.A.A. had built a core shack where the samples are correctly stored to preserve their quality.
CPSAA
provided the necessary materials for the storage and transport of the samples. CPSAA also implemented sampling cards with information
on the name of the project, name of the borehole to be sampled, date of sampling, sampling interval, sampling manager, sampling, and
type of sample or control sample.
All
samples were labeled and a photographic record is available. The photographic record of each sampling bag is made together with the weighing
of the sample.
CPSAA
implemented chain-of-custody systems to guarantee the physical security of the samples, data and associated records. The traceability
of the sample from its generation to its analysis and subsequent conservation of rejects and pulps. At the Virrila quarry, core samples
are duly stored in the coreshack.
| 8.1.6. | Qualified
Person’s Opinion on Cement Plant QAQC |
In
the qualified person’s opinion, Cementos Pacasmayo has been complying with the international standards of ISO-9001 (Quality) since
2015 and has implemented Quality Assurance and Quality Control (QAQC). Cementos Pacasmayo S.A.A. has used a QAQC check program comprising
blank, standard, and duplicate samples.
The
actual sample storage areas and procedures are consistent with industry standards.
There
is information on sample preparation methods, quality control measures and sample security. These results are accurate and free of significant
error. The protocols in the different exploration and production processes strictly comply with local and international best practices.
The
sample preparation, security, and analytical procedures used to acquire the data in this report are adequate for use in the construction
of the Geological Model, Resource Estimation, and Reserve Estimation.
| 8.2.1. | Samples
preparation, procedures, assays and laboratories |
Cementos
Pacasmayo S.A.A. has a quality control plan for each of its operations as part of the corporate quality system.
The
quality control plan (PI-CC-D-01/ Rev 05) describes the evaluation methods used in the Piura Plant’s quality control laboratory,
applied to samples of raw materials such as coquina, sand, clays, and iron ore; in-process products: raw meal, clinker, and cement; active
additions: gypsum mineral, pozzolana, slag, and coquina; and finished products such as MS, ICO and Type I packaged cement.
Different
analytical methods are applied for the physical and chemical characterization of raw materials, products in-process, and finished products,
such as classical tests, X-ray fluorescence tests, X-ray diffractometry tests, potentiometry, among other analytical techniques supported
by equipment designed for such specific purposes.
The
analytical methods are based on guidelines described in ASTM, NTP (Peruvian Technical Standard), and ISO standards.
| 8.2.1.1. | Raw
materials sample preparation |
The
sample preparation consists of the collection and preparation of samples. The sample preparation procedure consists of primary crushing,
pulverization and reduction of the sample by the quartering method. The sample is pulverized in the ring mill.
| 8.2.1.2. | Laboratory
analysis |
The
Piura plant laboratory has implemented the ISO 9001 standard; it has different instrumental equipment. The annual maintenance and calibration
program is applied to ensure the reliability and traceability of the measurements performed.
The
major equipment is X-ray fluorescence (XRF), which is used for chemical control of the different plant processes, such as:
| ● | Reception and entry of raw materials. |
| ● | Grinding of raw meal and coal. |
| ● | Grinding and packaging of cement. |
Also,
the hydraulic press is used to determine and analyze the compressive strength of the different types of cement produced in the plant.
For
all types of cement, different physical characterization tests are performed, such as air content test, Blaine fineness, autoclave expansion,
compressive strength, and setting time using the Vicat needle method.
Other
complementary tests are autoclave shrinkage test, expansion in the mortar at 14 days, expansion by sulfates at six months, chemical tests
by the classical method to determine loss on ignition and insoluble residue.
| 8.2.2. | Quality
Assurance Actions |
The
PI-CC-D-01/Rev 04 sampling and data verification plan applies to the processes of reception of raw materials, raw mill scale, raw meal
milling, kiln feeding, coal scale, coal milling, preheater, kiln filter, Clinkerization, cement mill scale, cement grinding, composite
cement grinding, packaging control and packaging – composite.
Table
16 Tests and frequency for each stage of the process
| Stage | |
Tests | |
Frequency |
| Reception of raw materials | |
XRF pellets, XRF beads, moisture, RM-3in, calorific power and Cl by potentiometry | |
Every 5 to 10 trucks |
| Raw mill scale | |
XRF pellets, XRF beads and Cl by potentiometry | |
1 time per shift |
| Crude milling | |
XRF pellets, RM 170 and loss on ignition. | |
Every hour or up to 1 time per shift. |
| Kiln feeding | |
XRF pellets, RM 170 and loss on ignition. | |
Every 2 hours |
| Coal scale | |
XRF pellets, calorific power and moisture. | |
Every 4 hours |
| Coal milling | |
XRF pellets, RM 63 um, calorific power and fine moisture. | |
Every 4 hours |
| Preheater | |
XRF beads, loss to fire, calcination and volatilization. | |
Every 2 hours |
| Kiln filter | |
Loss on ignition, XRF beads and Cl by potentiometry. | |
One sample per shift |
| Clinkerization | |
XRF pellets | |
Every hour |
| Cement Mill scale | |
XRF pellets, XRF beads for daily composting and XRF bead for daily composting | |
One sample per shift |
| Cement grinding | |
XRF pellets, Rm 325, RM 450, loss on ignition, Blaine and cal libre | |
Every 15 min or 1 time per shift |
| Composite cement grinding | |
XRF pellets, loss on ignition, insoluble residue (Type I), cal libre, Blaine, Rm 325, RM 450, compressive strength, setting, autoclave expansion and setting time using the Vicat needle method. | |
One sample per day |
| Packaging control | |
RM 1/2in, RM8 and XRF pellets | |
every 4 hours, every 100 big bags, every 5 trucks |
| Packaging – Composite | |
XRF pellets, loss on ignition, insoluble residue (Type I), cal libre, Blaine, Rm 325, RM 450, compressive strength, setting, autoclave expansion, setting time using the Vicat needle method, density, 14-day mortar bar expansion, sulfate resistance and heat of hydration (In Pacasmayo Cement Plant). | |
One sample per day |
The
quality plan implemented by Cementos Pacasmayo for the cement plants includes the insertion of standards to control the accuracy in the
samples. As part of the quality plan, the laboratory evaluates its performance through external interlaboratory; in this sense, the laboratory
participates in 02 interlaboratory:
| ● | CCRL:
Compliance greater than 97% in qualification Z Score > 4 |
| ● | XAMTEC:
Qualification greater than 99%. |
Quality
assurance actions include control of finished products, control of non-conforming products, validation of silos, density analysis, QAQC
program, quality plan and quality control parameters for raw materials received at the Piura plant.
| 8.2.3. | Security
of the samples |
Cementos
Pacasmayo S.A.A has implemented QaQc protocols to develop cement production activities at the Piura plant to ensure the quality of the
information that allows the Estimation of the Resources and Reserves of the deposit.
Sampling
of raw materials, raw meal and cement during the cement production process at the Piura plant is carried out by the contractor Bureau
Veritas.
Sample
preparation consists of sample collection and preparation for raw material, raw meal, coal, clinker and cement.
The
testing procedures are physical testing for cement, wet chemical analysis, and operation of XRF equipment.
Likewise,
the control parameters are raw material parameters, pozzolana, slag, mineral reception parameters, clinker production parameters, raw
material parameters for raw meal; raw meal feed parameters, raw meal milling parameters, coal milling parameters, and cement milling
parameters.
| 8.2.4. | Qualified
Person’s Opinion on cement plant QAQC |
Cementos
Pacasmayo S.A.A. has a Quality Assurance, Research and Development area that ensures compliance with the requirements for finished products
specified in Peruvian technical standards, which are traceable to the standards of the American Society for Testing and Materials (ASTM).
The
Research and Development area is located at the Pacasmayo plant, and its scope includes operations at the Piura plant.
Compliance
with the requirements based on the quality assurance management system, the indicator was 0% of nonconforming products in the market.
This evaluated under the specification of Standards NTP 334.009, NTP 334.090 and NTP 334.082 (similar to ASTM C150 and ASTM C1157). Likewise,
the level of customer satisfaction (G-GH-F-03 / Rev. 03 Customer satisfaction) is 90.82%.
Based
on the above, in the qualified person’s opinion, the quality assurance system at the Piura plant, which includes preparation methods,
procedures, analysis, and security, complies with the best practices in the industry, thus ensuring that the end customer has confidence
in the level of quality of the products marketed by Cementos Pacasmayo.
This
Chapter shows the data verification activities for the geology, quarry, and cement plant areas.
| 9.1.1. | Data
Verification procedure |
CPSAA
has an unit specialized in the compilation, verification and standardization of information for the geological database. It’s main function
is the validation of the data to be used in the estimation of mineral Resources and Reserves. For the proper management of the information,
internal protocols have been implemented, which are subject to internal audits.
The
data collection applies to exploration activities. For diamond drilling, the process flow for planning and executing drilling, survey
methods for reporting drill collars and ddh / verification of the quality of information and recovery process of the core information.
In addition, for geological sampling activities, the processes flowsheet, validation and consistency of sample information, sample preparation
and testing, density, registration process and digital photographic storage are used.
| 9.1.3. | Management
and Validation of Database |
The
stages for management and validation of database are the recovery, processing and storage of the database. Which includes database development
process flow, information standardization and integration process, information storage strategy, appropriate database technology, structure
and practicality of the database system that allows a fast and flexible access and input of information and validation of chemical results,
which includes the QaQc report.
The
consistency between the database records and the original registry was verified by the QPs in 2023. No differences were detected
between the database and the log files. A digital copy of all records is kept as a pdf file. Digital certificates support the
chemical analysis data.
The
collection of the information considered the following: drill collars, survey, lithology, samples and assays.
The
geology department provided copies of all Virrila quarry drilling records, including Excel spreadsheets, driller’s logs, field
geologist’s logs, quality results sheets from the Piura laboratory, collar sheets, and survey sheets. Data for each hole was individually
checked in the database to confirm accuracy.
The
reviews included:
| ● | Drillhole
lithology database comparison to geophysical logs |
| ● | Sample
quality database comparison to quality certificates |
| ● | Core
photographic record. |
Typical
errors may impact reserve and resource estimation related to discrepancies in original data entry. These errors may include:
| ● | Incorrect
drillhole coordinates (including elevation). |
| ● | Mislabeled
drillhole lithology. |
| ● | Unnoticed
erroneous quality analyses where duplicate analyses were not requested. |
| ● | Unrecorded
drillhole core loss. |
Data
validation follows the field operational procedures that collect information from the source (collar, survey, lithology, samples,
and assays). Finally, when the information is transmitted and uploaded to the mining software for geological modeling and
estimation, it is double-checked to eliminate any additional errors.
| 9.1.6. | Qualified
Person’s Opinion Geologic Data |
The
qualified persons followed the defined processes for information flows to support Resource and Reserve estimation. The qualified person
followed the same process as a means of verifying and validating the geologic data. They found that the validated information is congruent
in the interpretations of the same, with which the fundamental base geological models were generated for the estimation of the Resources.
No
findings have been found that could invalidate the estimation of the Resources and Reserves of the unit.
The
Quality Control Plan contemplates the following aspects: PDCA cycle, customer, a person in charge, activities, risks, control methods,
monitoring, measurement, analysis, evaluation and documentary evidence.
The
PDCA cycle is:
| ● | Plan;
during this stage, the following activities are considered: determination of characteristics of raw materials, product in-process and
finished product, elaboration of control and matrices parameters, and determination of actions and results in assurance program. |
| ● | Do;
during this stage, the following activities are considered: verification and compliance with the requirements and matrices, sampling,
and preparation. |
| ● | Check:
during this stage, the following activities are considered: chemical analysis by XRF, chemical analysis, physical analyses, recording
of results, taking action on non-conformities. |
| ● | Act,
during this stage, the following activity is considered, acting to improve. |
| ● | The
Quality Assurance Plan is applied to the following customers: production, quarry, provisions chain, and external customer. |
| 9.2.1. | Data
verification procedures |
The
XRF analysis, chemical analysis, and physical analysis are made to verify the results of the samples as part of the Quality Control Plan.
The
data resulting from these three types of analysis are recorded and evaluated to determine whether they comply with the technical specifications.
Data
verification procedures include internal audits, checklists, statistical tables, reports, data validation, certificates, interlaboratory
test reports, and compliance with quality protocols.
Cementos
Pacasmayo S.A.A. through its quality assurance and control unit participates in evaluations with international laboratories such as CCRL/ASTM
(Concrete and Cement Reference Laboratory), which is an international reference laboratory for construction materials, and Xamtec of
Colombia, an international interlaboratory, in order to report reliable data.
The
Quality Control laboratories endorse their analysis methods by participating in interlaboratory analysis programs, which compare the
results with national and foreign laboratories. The methods of analysis compared are X-ray fluorescence (XRF) and the physical cement
tests, which are the methods used to control cement quality. In all the results of these interlaboratory programs, the companies always
obtain the best results for each test.
| 9.2.3. | Qualified
Person’s Opinion on cement plant |
In
the author’s opinion, the methodologies used for collecting and processing data at the cement plant are accurate and free of fundamental
errors. This information can be used for the model’s construction and estimates for cement production.
Considering
that the analyses of the main chemical components and physical properties of the raw materials and final products are made in external
laboratories, the quality of the information is adequate for preparing mineral Resource and Reserve estimates.
| 10. | Mineral
processing and metallurgical testing |
| 10.1. | Nature
of testing program |
Cementos
Pacasmayo S.A.A. has a Quality Assurance and Control and a Research and Development department. The objective of the department is to
develop, evaluate, and research procedures for developing products at the laboratory level, and they are scaling up to the industrial
level. Another objective is to identify other additions that can substitute for clinker: slag, pozzolana, fly ash, calcined clays, etc.,
to reduce their environmental footprint and the cost of cement production.
They
have also implemented procedures for preparing, reviewing, issuing, and controlling test reports associated with cement production in
the Pacasmayo and Piura plants.
Cementos
Pacasmayo has implemented the ISO 9001 standard since 2015. The Research and Development laboratory, located at the Pacasmayo plant,
is responsible for technical aspects of cement plant and quarry operations (including the Virrila quarry).
A
permanent control is carried out with other laboratories to further the results. Likewise, interlaboratory reports are issued with external
laboratories such as CCRL (Cement and Concrete Reference Laboratory), a reference laboratory for construction materials at the international
level, and Xamtec from Colombia, an internal interlaboratory.
Cementos
Pacasmayo S.A.A. has also obtained the certification that certifies compliance with Supreme Decree No. 001-2022, which validates compliance
with the Technical Regulation on Hydraulic Cement used in Buildings and General Construction.
Cementos
Pacasmayo SAA opted for the highest and most rigorous certification model (Type 5) granted by ICONTEC, which has extensive
experience in the certification of products and services.
A
significant percentage of Research and Development activities are focused on evaluating different ratios between clinker-mineral additions
that provide the best functional characteristics to our products and at the same time keep balance with the benefits generated for the
company. Whether it is a requirement or an own initiative oriented to supply any previously identified need, the laboratory tests are
developed continuously, seeking to generate an operational benefit to the company. Based on this work, the laboratory has determined
(and confirmed with production estimates) that 1 tonne of limestone yields 0.77 tonnes of clinker and the clinker/cement factor with
additions is 0.72.
The
R&D Laboratory located at the Pacasmayo plant provides analysis and research services to all of the company’s cement plants.
| 10.2. | Cement
Manufacturing Test Results |
At
the Pacasmayo plant, the studies conducted in the Research and Development Laboratory and the Quality Control area include reducing the
clinker/cement factor and substituting slag for pozzolan at the Piura plant. The clinker/cement factor of the cement is 0.71.
| 10.3. | Qualified
Peron Opinion of the Adequacy of the Test Data |
The
Research Laboratory issues technical reports following the criteria of international standards for the operations area, identifying the
correct data, defining the requirements that may vary but include accuracy, consistency, and validity through an evaluation of the data
and implementation of solutions, and finally, validating the adequacy of the data.
The
operations area then evaluates the convenience of industrially implementing the tests and validating what is reported at the laboratory
level.The reliability in the integrity and adequacy of The data reported by the area is based not only on the technical competencies
of the collaborators but also on the high scores obtained in the external interlaboratory of recognized entities such as XAMTEC and CCRL
in their different programs.
| 11. | Mineral
Resources Estimates |
The
geological model was developed and structured using Leapfrog software. The QP generated the model solids, taking into account the lithology
of the deposit based on the geological characteristics and its quality.
Due
to the nature of the deposit in its stratified nature and occurrence, the qualified persons interpreted the geological model with the
help of a set of sections parallel to the two main directions of the deposit shape, spaced every 140 meters.
Considering
the conceptual model of the project and based on the fieldwork carried out by Cementos Pacasmayo’s geologists, the lithological descriptions
were grouped into ten horizons (Table 17).
Table
17 Lithologic units of the Virrila quarry geological model
| Lithologic Units |
Mine Sight Code
ITEM (TLITO) |
Numeric Code
ITEM (CODEM) |
| Aeolian sand, brown to brownish color, with coquina remains. |
SU |
1 |
| Earthy calcareous, creamy beige color, scarce coquina and reefs. |
CT |
2 |
| Calcareous with compact shell debris |
A1 |
3 |
| Coquina with presence of shells and beige corals |
A2-A,A2,A2-B,A2-C |
4,5,6,7 |
| Massive compact beige coquina and beige corals |
A3 |
8 |
| Green clayey silt with intercalation of calcareous levels. |
LM |
9 |
| Beige calcareous compact massive fine matrix. |
B1S |
10 |
| Gray sand, with traces of calcareous, gravel. |
ARE |
11 |
| Calcareous with remains of coquina and sand with some gravels. |
B1 |
12 |
| Gray sand, fine grain, friable. |
GRV |
13 |
| Green diatomite |
DIA |
14 |
The
main criterion for the geological model is the quality, supported and associated with the lithological aspect.
The
lithological criteria are based on the macroscopic physical characteristics of the shell horizons and the percentage of important elements
in their composition (oxides).
This
analysis uses a quality cut-off of 48.5% of CaO based cement manufacturing technical specifications. In addition, other quality parameters
were considered according to the technical specifications. All criteria together allowed the identification of good quality horizons,
which were assigned the following codes in the CAPA item.
Table
18 shows the quality parameters for Domo coquina and Addition coquina.
Table
18 Quality Parameters for Dome and Additive coquina
| |
|
Domo Coquina |
Addition Coquina |
| CaO (%) |
Min. |
48.50 |
NA |
| Max. |
- |
NA |
| Target |
50.00 |
NA |
| MgO (%) |
Min. |
- |
- |
| Max. |
2.00 |
2.00 |
| Target |
1.50 |
1.50 |
| SO3 |
Min. |
- |
- |
| Max. |
0.85 |
2.50 |
| Target |
0.80 |
2.00 |
| Cl |
Min. |
- |
- |
| Max. |
0.035 |
0.035 |
| Target |
0.030 |
0.030 |
| Na2O (%) |
Min. |
- |
- |
| Max. |
0.300 |
0.30 |
| Target |
0.250 |
0.25 |
| K2O (%) |
Min. |
- |
- |
| Max. |
0.200 |
0.20 |
| Target |
0.150 |
0.15 |
The
block model was configured based on the dimensions and spatial distribution of the formations containing the material of economic interest.
Table
19 shows the extents of and dimensions of block in the model. (Coordinates in UTM units).
Table
19 Characteristics of the block model
| |
Minimum
(m) |
Maximum
(m) |
Size
(m) |
Number |
| X |
528,430 |
533,170 |
10 |
474 |
| Y |
9,341,860 |
9,345,360 |
10 |
350 |
| Z |
20 |
45 |
0.5 |
90 |
The
Geological Model used 3,866 samples obtained from 536 diamond drilling wells executed in the current production areas for resource estimation.
The
data is processed and managed in Data Shed software and then used in Mine Sight software.
The
density data for the estimation of the coquina Resources of the Virrila quarry as of December 2023, were taken from the historical data
of sampling results carried out in the first drilling campaigns. The density ranges between 1.51 and 1.89 t/m3.
In
general, each geological unit is estimated from the composite data (the composites were restricted to not cross “hard” boundaries
between different geological units).
The
objective of composting is to create a distribution of grades of equal support (volumes) from the initial samples in the drill hole.
Thus, when compositing, one must be careful that the composites preserve the original nature of the sample. The calculated values considered
in the compositing were for the SiO2, Al2O3, CaO, MgO, and SO3.
Composites
were made at different lengths to determine the optimum compositing length, resulting in compositing at 1 m as the length that best fits
the nature of the original sample and is included in the resource estimation process.
In
addition, the length of the deposits is considered based on an exact multiple of the height of the blocks used to model the deposit and
is also matched to the bench height to be operated.
| 11.4. | Basic
statistics of the data (Assay – Composites) |
Table
20 shows the results of the basic statistics of the principal oxides as CaO, SiO2, MgO, Al2O3, SO3,
for the original data and the composited data.
QP
performed the statistical analysis for each defined body with the interpretation of deposit quality, which were also taken as criteria
for modeling and estimation.
Table
20 shows the statistics for “Horizon A2” as this is the main horizon for estimating the Reserves.
Table 20 Basic data statistics
| Components |
Origen |
Valid |
Rejected |
Minimum |
Maximum |
Mean |
Std. Devn. |
Variance |
Co. Of Variation |
| SiO2 |
Assay |
1,769 |
3 |
0.46 |
99.58 |
5.718 |
4.394 |
19.310 |
0.769 |
| Composito |
1,835 |
1 |
0.46 |
60.73 |
5.568 |
3.526 |
12.435 |
0.633 |
| CaO |
Assay |
1,769 |
3 |
0.12 |
55.65 |
51.503 |
2.918 |
8.514 |
0.057 |
| Composito |
1,835 |
1 |
21.25 |
55.59 |
51.630 |
2.353 |
5.535 |
0.046 |
| MgO |
Assay |
1,768 |
4 |
0.28 |
1.76 |
0.725 |
0.131 |
0.017 |
0.181 |
| Composito |
1,835 |
1 |
0.18 |
1.76 |
0.709 |
0.121 |
0.015 |
0.171 |
| Na2O |
Assay |
1,768 |
4 |
0.02 |
0.95 |
0.302 |
0.072 |
0.005 |
0.238 |
| Composito |
1,834 |
2 |
0.02 |
0.89 |
0.298 |
0.068 |
0.005 |
0.229 |
| K2O |
Assay |
1,769 |
3 |
0.04 |
0.97 |
0.166 |
0.074 |
0.005 |
0.445 |
| Composito |
1,835 |
1 |
0.05 |
0.95 |
0.159 |
0.060 |
0.004 |
0.377 |
| SO3 |
Assay |
1,759 |
13 |
0.01 |
2.47 |
0.306 |
0.243 |
0.059 |
0.794 |
| Composito |
1,829 |
7 |
0.01 |
1.97 |
0.300 |
0.218 |
0.047 |
0.726 |
| Cl |
Assay |
1,743 |
29 |
0.01 |
0.38 |
0.033 |
0.040 |
0.002 |
1.227 |
| Composito |
1,814 |
22 |
0.01 |
0.37 |
0.033 |
0.037 |
0.001 |
1.121 |
Extreme
values are considered to be those analysis results that are not representative of the unit being studied and are above the mean plus
twice the standard deviation.
Of
the extreme values in the laboratory results for the calcareous lithologic units that are being estimated, no deviation has been found,
all the results are coherent and representative of the levels to which they correspond.
In
the variogram analysis of the composited data for each level corresponding to each body of economic interest at the Virrila quarry, the
variogram structures found do not show any preferential direction in the correlation. With the variogram is not possible experimental
reflects the maximum distance or range and how a point influences another point at different lengths. In this sense, for the Virrila
quarry, the inverse of the distance method was applied.
The
Inverse Distance (ID2) method was used for all variables and Nearest Neighbor (NN) for validations, defining parameters for each estimator.
Table 21 shows the main parameters used to define the interpolations of the main CaO variable of the A2 layer and of the secondary variables,
respectively.
The
interpolations were performed in 3 consecutive processes.
| - | The
first with a search radius of 2 times the drilling grid. |
| - | The
second with a search radius of 1.5 times the drilling grid and |
| - | Finally,
the range corresponding to 1.0 times the drilling grid. |
Regarding
the number of composites, we used a minimum of 1 per block and 2 as maximum, for the first interpolation and a minimum of 2 per block
and 3 as maximum for the second and a minimum of 3 per block and 4 as maximum, for the third interpolation.
Additionally,
a maximum of 1 composite were considered for each borehole taken in the interpolation.
Table
21 Estimation Parameters Secondary Variables
| Comment |
Pass 1 |
Pass 2 |
Pass 3 |
| Distance in X direction |
200 |
200 |
200 |
| Distance in Y Direction |
200 |
200 |
200 |
| Distance in Z directions |
200 |
200 |
200 |
| 3D Distance |
200 |
200 |
200 |
| Min # Comp |
1 |
2 |
3 |
| Max # Comp |
2 |
3 |
4 |
| Max # Comp DDH |
1 |
1 |
1 |
| Element Model IDW |
CA4 |
CA4 |
CA4 |
| Element MComp IDW |
CACA |
CACA |
CACA |
| Pass in Model |
PSCA4 |
PSCA4 |
PSCA4 |
| Pass in comp |
PASS3 |
PASS2 |
PASS1 |
| Dist comp |
DICA4 |
DICA4 |
DICA4 |
| # comp for Block |
NCCA4 |
NCCA4 |
NCCA4 |
| # comp for DHH |
NDCA4 |
NDCA4 |
NDCA4 |
| Local error |
SDCA4 |
SDCA4 |
SDCA4 |
| Major Axis |
300 |
200 |
150 |
| Minor Axis |
200 |
150 |
100 |
| Vertical Axis |
20 |
20 |
20 |
| ROT |
320 |
320 |
320 |
| DIPN |
0 |
0 |
0 |
| DIPE |
0 |
0 |
0 |
| Body |
RT4 |
RT4 |
RT4 |
| Body code |
5 |
5 |
5 |
| ORE comp |
CODEM |
CODEM |
CODEM |
| Run extension |
1 |
2 |
3 |
| Archive 09 |
vi309.dat |
vi309.dat |
vi309.dat |
| 11.8. | Resources
estimation |
Mineral
Resource estimates are effective December 31, 2023. All Mineral Resources are estimated at cement plant. For the estimation of Mineral
Resources, the analysis considered the CaO content as well as the content of impurities. The impurities are restrictions determined by
the cement production plant. Table 22 shows the quantity of Resources and the average values of their quality.
Table
22 Resource Categorization (exclusive of Reserves) at the Virrila quarry
| |
Resources |
Tonnes
Mt |
CaO
(%) |
SO3 (%) |
MgO (%) |
SiO2 (%) |
Na2O (%) |
K2O (%) |
Cl (ppm) |
| Coquina |
Measured |
19.9 |
49.68 |
0.61 |
0.66 |
7.21 |
0.23 |
0.20 |
0.08 |
| Indicated |
28.0 |
48.92 |
1.11 |
1.17 |
7.42 |
0.21 |
0.22 |
0.08 |
| Measured + Indicated |
47.9 |
49.24 |
0.90 |
0.96 |
7.33 |
0.22 |
0.21 |
0.08 |
| Inferred |
4.4 |
46.67 |
2.15 |
1.61 |
9.80 |
0.23 |
0.25 |
0.06 |
For
the determination of Resources, the costs of extraction, transportation, cement processing and cement dispatch were considered. The costs
are based on actual sources of current operations in Cementos Pacasmayo S.A.A. and the selling price of cement in 497.8 S/. x t during
2024 (at cement plant). Chapter 18 shows the costs and prices for the determination of Mineral Resources. The main factor for the determination
of Resources is quality. The cut off can be seen in Table 18, the Virrila quarry is a sedimentary deposit and, thus, the model for the
estimation of Resources considered the Virrila quarry as a unit, whose coquina production is carried out by 12 m benches.
| 11.8.2. | Reasonable
prospects of economic extraction |
The
Mineral Resource estimation considers the Virrila deposit as a set of layers integrated into a single body, defined by the continuity
of quality.
The
definition of waste is based on the quality (CaO) as the main parameter. The waste is variable in thickness and quality throughout the
deposit.
The
area associated with the resource estimation is located in the central part of the UEA Virrila and away from the mining property boundaries.
On
the other hand, the public road to Bayovar Bay, the transmission line owned by a third party company, and an oil supply pipeline that
ends at the port of Petro Peru pass through our mining concessions. It is important to mention that these components do not interfere
with the operations in the Virrila quarry nor with the estimation of coquina resources reported in this report.
The
Mineral Resource evaluation has considered relevant technical and economic factors such as coquina production costs, cement sales prices,
environmental and social viability at our operations.
From
the environmental and social point of view, Cementos Pacasmayo has been developing activities in Peru for more than 60 years and is recognized
as a Peruvian company with a high reputation, therefore, it is expected that the environmental and social viability will continue.
The
economic analysis that shows the economic viability of Mineral Resources is presented in Chapter 19.
The
information that supports the estimation of the quarry’s Resources is consistent, which allows obtaining a robust Resource model.
| 11.9. | Mineral
Resources classification |
The
parameters for Resource classification used by Cementos Pacasmayo S.A.A. were obtained from the experience of calculating the optimum
drilling grid for sampling by geostatistical methods. Additionally, the variographic analysis was considered taking as reference the
variogram range. After considering all these, resource classification was based on the following criteria:
| ● | Measured
Resource: One regular drilling grid. |
| ● | Indicated
Resource: 2 regular perforation grids. |
| ● | Inferred
Resource: up to 3 grids. |
Several
configurations have been defined from this basic configuration, taking into account the number of drill holes and the average search
distance.
| 11.10. | Qualified
person’s opinion |
The
geological modeling of the Virrila quarry deposit has been developed considering four zones.
Currently,
the production has migrated and is centered 90% in zone 3, the quality and geological characteristics of the calcareous horizons were
considered as a basis for the interpretation and development of the model, taking into account the diamond drilling of the different
drilling campaigns. . The relationship between drill hole information and the geological model is consistent.
The
process of production in zone 1 is in its final phase, a gradual migration process to zone 3 should be initiated.
The
model for zones 2 and 4 has been developed based on the geological interpretation supported by different drilling campaigns.
It
is essential to homogenize the criteria for interpreting the geological information of the foru zones so that the models that support
the Resources can be standardized.
The
information that supports the estimation of the quarry’s Resources is consistent, allowing obtaining a robust resource model.
| 12. | Mineral
Reserves estimates |
The
total estimated Mineral Reserves in the Virrila quarry are 43 million tonnes which are detailed in Table 23 in their different categories.
In
In the periodic update of the Reserves of the Virrila quarry, the Reserves produced within the update of the Resource and Reserves models
are taken into account. Also taken into account were any changes to assumptions about “modifying factors” (which should be
evaluated), or the change and entry of any new data.
The
quality metric used in the Mineral Resources and Reserves estimation is the calcium oxide (CaO) content, which is a stable variable in
the deposit. Its specific values depend on the lithological domain with its concentration higher in some lithologies than in others.
Based
on the revised Mineral Resources model, the Mineral Reserves were estimated as the indicated and measured resources in the life of mine
pit that supports the mining plans for production and supply of coquina to the Cementos Pacasmayo S.A.A. plants.
The
QPs estimated life of mine consumption of coquina over the 30 years of mine life is based on the estimated Reserves and the projection
of plant needs provided by CPSAA management and finance control department. The projected consumption increases gradually each year.
At
the end of 2023 a diamond drilling campaign was carried out in zone 2 and 4, the update of the models will be done for the following
year.
| 12.1. | Criteria
for Mineral Reserves determination |
The
criteria used for the determination of Mineral Reserves are described below.
| 12.1.1. | Run
of Mine (ROM) determination criteria |
ROM
is considered to be all material produced in the quarry that complies with the specifications and will be sent to the plant for cement
production. For determining ROM tonnage, dilution was considered to be negligible. The recovery in the quarry was assumed to be 100%.
| 12.1.2. | Cement
plant recovery |
The
coquina received at the Piura plant is properly stored and then mixed with other raw materials to obtain the raw meal feed (kiln feed).
On average, the raw meal contains 83.46% coquina. After the raw meal is obtained, it is fed to the calcination kiln to obtain clinker.
Finally, the clinker is mixed with additives to obtain cement.
| 12.2. | Reserves
estimation methodology |
For
the determination of the mineral Reserves, the costs of production, transportation, cement processing, and the quality restrictions of
the raw material, were considered. The costs are based on actual sources from the current operations of Cementos Pacasmayo S.A.A. in
Virrila quarry and Piura plant. Chapter 19 shows the economic analysis to determine the Mineral Reserves.
| ● | Reserves
meet the quality restrictions for coquina at the Piura plant (Table 23). |
| ● | Proven
and Probable Reserves are derived from Measured and Indicated Resources, respectively. |
| ● | Proven
and Probable Reserves are within the life-of-mine pit designed for the Virrila quarry. |
| ● | Reserves
are those for which economic viability has been demonstrated by discounted cash fow analysis
based on estimated capital and operating costs. |
| ● | Cementos
Pacasmayo S.A.A. has an agreement with the San Martin de Sechura Community associated with
the Virrila concession. The agreement allows Cementos Pacasmayo to produce coquina from year
2010 to year 2040. |
| ● | The
effective date of the Reserve estimate is December 31, 2023. |
| ● | The
point of reference is at the point of delivery to the Piura plant. |
The
economic analysis that shows the economic viability of Mineral Resources and Reserves is presented in Chapter 19.
Reserves are expressed
in tonnes and are shown in Table 23.
Table
23 Ore Reserves expressed in million tons
| |
Reserves |
Tonnes
M |
CaO
(%) |
SO3
(%) |
MgO
(%) |
SiO2
(%) |
Na2O (%) |
K2O (%) |
Cl (ppm) |
| Coquina |
Proven |
40.3 |
51.87 |
0.35 |
0.70 |
5.02 |
0.29 |
0.16 |
0.032 |
| Probable |
2.7 |
49.78 |
1.08 |
1.42 |
6.45 |
0.25 |
0.20 |
0.096 |
| Total |
43.0 |
51.73 |
0.40 |
0.74 |
5.11 |
0.29 |
0.16 |
0.036 |
The
Reserves calculated for Virrila quarry from the Mineral Resources consider the risk factors and modifying factors. The quality factors
are considered the most sensitive factors that, by their nature, can affect the Reserve estimates. Although the main variable is considered
to be CaO, which is very stable in the deposit, there are others that determine the quality of the Reserves and could even affect the
process if they are not adequately controlled, such as the Chlorine and SO3 content.
However,
in certain conditions the increase of SO3 is acceptable, considering that its genesis, according to its geological nature,
comes from gypsum. This is important because it allows a better balance in the cycle of alkalis (Na2O, K2O) considered
in the sulfate module.
In
the process of calculating Reserves and in the quarry production plans, these variables have been adequately considered in the mining
plan by proper production sequencing with blending processes.
In
addition to quality factors, ore reserves could change from operating performance-controlled production costs, allowing for maximization
of the use of resources in the extractive processes for the use of resources in the extractive processes for the industrialists, guaranteeing
the LOM of the quarry.
Cementos
Pacasmayo S.A.A. is the current owner of the Virrila quarry and is in charge of the coquina´s production. The loading/transport
of coquina has been outsourced to a contractor, Cementos Pacasmayo S.A.A. supervises the quarry to verify the activities and output according
to the requirements of the Cement Plant.
In
2013, Cementos Pacasmayo S.A.A. performed a geotechnical study at the Virrila quarry to understand the rock mass.
In
2015, Cementos Pacasmayo S.A.A. carried out hydrogeological studies at the Virrila quarry to understand hydrology.
| 13.1. | Mining
methods and Equipment |
The
mining method is open-pit mining with benches, ramps, and access roads. The main production unit is a Surface Miner. The quarry does
not require explosives. Figure 8 shows the overall production process. The main production activities are:
| 1. | Production
with a surface miner; |
| 3. | Loading
for dispatch; and |
| 4. | Weighing
and transport. |
Figure
8 Mining secuence of Virrila quarry
| ● | Production
with surface miner |
The
surface miner is used in horizontal layers of 0.25 meters deep by 3.8 meters wide. Subsequently, it is sampled to assess the quality
of the coquina.
The
material is stacked using a front-end loader. The stockpiles consider the angle of repose of the material and form slopes of 37°,
maximum height of 3 m, and a maximum volume of 25,000 m3 per stockpile.
| ● | Loading,
Weighing and transport |
The
dump trucks are weighed on an 80 tonnes capacity platform scale. The material is transported from Virrila quarry to Piura plant.
Table
24 shows the main equipment used to conduct production activities at the Virrila quarry.
Table
24 Mining equipment at the Virrila Quarry
| Equipment |
Quantity |
Function |
Description |
| Pickup van |
04 |
Personnel Transportation |
Personnel and material transport units. |
| Surface Miner |
02 |
Continuous mining |
Coquina production |
| Front Loader |
04 |
Material Loading and Stacking |
Material handling equipment. |
| Tanker truck |
02 |
track watering |
Auxiliary equipment to ensure the operability of quarry equipment and personnel. |
| Dump truck |
04 |
Material hauling |
Equipment for conveying material from the production areas to the primary crusher. Their capacity is 15 m3. |
In
2013, Cementos Pacasmayo hired DCR Ingenieros S.A.C. to conduct geotechnical studies of the Virrila quarry. This serves as the basis
of geotechnical assumptions used at the quarry to date. The main results are presented below.
During
the study, DCR Ingenieros S.A.C noted that the lithological profile is stable when cut. With slopes between 75° to 80° of inclination,
no slides or landslides occur. The stability analyses determine these conditions.
Table
25 Virrila quarry physical stability analysis summary
Typical
section |
Typical
section |
Cutting
slope
angle (°) |
Safety
factor |
| Static |
Pseudo-Static |
| Section
A-A’ |
7 |
80 |
2.077 |
1.713 |
| Section
A-A’ |
8 |
75 |
2.323 |
1.827 |
| Section
B-B’ |
12 |
75 |
1.897 |
1.490 |
| Section
B-B’ |
16 |
75 |
2.477 |
1.920 |
Analysis
methodology
Stability
analyses were performed using the Rocscience SLIDE software, version 5.014, which allows the user to perform limit equilibrium calculations.
The
software used allowed engineers to search for the most critical failure surface with the lowest safety factor for a given geometry and
materials.
The
analysis considered the Morgenstern-Price and Spencer limit equilibrium methods, which satisfy the equilibrium of forces and moments.
It
also considered that the material is homogeneous and isotropic and that plastic collapse would occur due to the progressive failure mechanism
along the slip surface.
Factors
of Safety
The
safety factors recommended for the stability analyses are based on the recommendations of the Environmental Guide for Slope Stability
of Solid Waste Deposit Slopes of the Ministry of Energy and Mines, the United States Society of Dam (USSD), and the United States Bureau
of Reclamation (USBR).
According
to the guidelines mentioned above, the following safety factors are considered:
| - | Minimum
factor of safety in static conditions is 1.5. |
| - | Minimum
factor of safety in the pseudo-static condition is 1.0 |
Geotechnical
Parameters
The
geotechnical parameters used for the physical stability analysis were obtained from geotechnical field and laboratory investigations
and based on a geomechanical evaluation using the RocLab program (Rocscience).
Table
26 summarizes the geotechnical parameters used in the static and pseudo-static stability analysis.
Table
26 Geotechnical properties of materials
| Materials |
Specific gravity(kN/m3) |
Angle of friction (ɸ°) |
Cohesion (c) (kPa) |
|
Geotechnical unit UG-I
(Quaternary deposit) |
16 |
30 |
0 |
|
Geotechnical unit UG-II
(Very weak to weak coquina) |
20 |
24 |
23 |
|
Geotechnical unit UG-III
(Weak to moderately weak sandstone) |
22 |
40 |
61 |
Due
to the characteristics of the calcareous material (cemented coquina) present in the Virilla quarry, as well as the depth at which the
calcareous material to be produced is present, the physical stability of the quarry’s production cuts has been analyzed, considering
the following typical cutting geometry:
Cutting
slopes: 75° - 85°.
The
geotechnical aspects are those currently used in the virrila quarry.
Based
on the study that DRC Ingenieros S.A.C conducted in 2013, Ram Perú S.A.C drilled two piezometers in the Virrila quarry to obtain
information associated with the hydraulic tests being applied to date. The main results are presented below.
Topographically,
this unit is developed at a maximum elevation of 80 meters above sea level, being slightly inclined to the SE. The quarry is located
on a raised Pleistocene marine terrace, higher than 60 meters above sea level; Its relief is essentially flat, with slight undulations
due to wind action. Though, it is under the influence of the Piura river basin; the quarry is not at risk of flooding.
| 13.4. | Other
mine design and planning parameters |
The
coquina production achieved during the year 2023 is 0.9 million tonnes of coquina, and 0.3 million tonnes of waste rock, which gives
a stripping ratio of 0.33.
Based
on the plant requirements and sales projection for the next 30 years, the pit design parameters for the Virrila quarry are presented
in Table 27.
Table
27 Mine design parameters
| Description |
Value |
| Maximum pit height |
12 meters |
| Maximum bench height |
6 meters |
| Pit bank slope |
75° to 80° |
| Production (t/h) |
500 |
| Net production hours |
10 |
| Surface miner production (t/d) |
5,000 |
| Number of workdays per month |
25 |
| Production per month (t.) |
132,000 |
| Number of working months per year |
12 |
| Estimated annual production (t) |
1,430,000 |
| 13.5. | Annual
production rate |
Considering
that the cement plant demands an average annual production of 1.43 million tonnes per year of coquina, the plan for the following 30
years is shown in Table 28.
The
forecasted mining plan for the next 30 years is presented in Table 28.
Table
28 Minning plan forecast
| Year | |
Tonnes (t) | | |
CaO | | |
MgO | | |
SO3 | | |
Cl | | |
Na2O | | |
K2O | | |
SiO2 | |
| 2024 | |
| 1,430,000 | | |
| 51.92 | | |
| 0.76 | | |
| 0.37 | | |
| 0.022 | | |
| 0.29 | | |
| 0.16 | | |
| 4.99 | |
| 2025 | |
| 1,095,243 | | |
| 52.71 | | |
| 0.79 | | |
| 0.26 | | |
| 0.021 | | |
| 0.30 | | |
| 0.15 | | |
| 3.97 | |
| 2026 | |
| 1,117,148 | | |
| 52.91 | | |
| 0.76 | | |
| 0.32 | | |
| 0.025 | | |
| 0.29 | | |
| 0.14 | | |
| 3.84 | |
| 2027 | |
| 1,434,578 | | |
| 52.64 | | |
| 0.76 | | |
| 0.38 | | |
| 0.023 | | |
| 0.30 | | |
| 0.15 | | |
| 4.20 | |
| 2028 | |
| 1,441,942 | | |
| 52.81 | | |
| 0.77 | | |
| 0.35 | | |
| 0.022 | | |
| 0.30 | | |
| 0.14 | | |
| 3.85 | |
| 2029 | |
| 1,449,453 | | |
| 52.74 | | |
| 0.72 | | |
| 0.27 | | |
| 0.020 | | |
| 0.29 | | |
| 0.13 | | |
| 4.10 | |
| 2030 | |
| 1,457,114 | | |
| 51.62 | | |
| 0.77 | | |
| 0.38 | | |
| 0.021 | | |
| 0.31 | | |
| 0.17 | | |
| 5.43 | |
| 2031 | |
| 1,464,929 | | |
| 52.58 | | |
| 0.71 | | |
| 0.34 | | |
| 0.026 | | |
| 0.30 | | |
| 0.14 | | |
| 4.25 | |
| 2032 | |
| 1,460,753 | | |
| 52.29 | | |
| 0.74 | | |
| 0.35 | | |
| 0.020 | | |
| 0.30 | | |
| 0.15 | | |
| 4.77 | |
| 2033 | |
| 1,460,753 | | |
| 51.91 | | |
| 0.74 | | |
| 0.30 | | |
| 0.019 | | |
| 0.31 | | |
| 0.16 | | |
| 5.29 | |
| 2034 | |
| 1,460,753 | | |
| 51.76 | | |
| 0.74 | | |
| 0.38 | | |
| 0.018 | | |
| 0.30 | | |
| 0.16 | | |
| 5.44 | |
| 2035 | |
| 1,460,753 | | |
| 51.49 | | |
| 0.77 | | |
| 0.39 | | |
| 0.020 | | |
| 0.32 | | |
| 0.16 | | |
| 5.78 | |
| 2036 | |
| 1,460,753 | | |
| 51.51 | | |
| 0.72 | | |
| 0.29 | | |
| 0.021 | | |
| 0.30 | | |
| 0.17 | | |
| 5.79 | |
| 2037 | |
| 1,460,753 | | |
| 51.30 | | |
| 0.70 | | |
| 0.39 | | |
| 0.024 | | |
| 0.29 | | |
| 0.17 | | |
| 6.13 | |
| 2038 | |
| 1,460,753 | | |
| 51.64 | | |
| 0.64 | | |
| 0.27 | | |
| 0.033 | | |
| 0.26 | | |
| 0.16 | | |
| 5.47 | |
| 2039 | |
| 1,460,753 | | |
| 51.73 | | |
| 0.71 | | |
| 0.31 | | |
| 0.029 | | |
| 0.30 | | |
| 0.15 | | |
| 4.91 | |
| 2040 | |
| 1,460,753 | | |
| 51.91 | | |
| 0.70 | | |
| 0.29 | | |
| 0.020 | | |
| 0.30 | | |
| 0.16 | | |
| 5.39 | |
| 2041 | |
| 1,460,753 | | |
| 51.93 | | |
| 0.65 | | |
| 0.26 | | |
| 0.027 | | |
| 0.26 | | |
| 0.14 | | |
| 5.08 | |
| 2042 | |
| 1,460,753 | | |
| 52.56 | | |
| 0.64 | | |
| 0.30 | | |
| 0.032 | | |
| 0.25 | | |
| 0.13 | | |
| 3.85 | |
| 2043 | |
| 1,460,753 | | |
| 52.39 | | |
| 0.68 | | |
| 0.25 | | |
| 0.033 | | |
| 0.30 | | |
| 0.14 | | |
| 4.54 | |
| 2044 | |
| 1,460,753 | | |
| 52.13 | | |
| 0.71 | | |
| 0.30 | | |
| 0.021 | | |
| 0.33 | | |
| 0.16 | | |
| 5.03 | |
| 2045 | |
| 1,460,753 | | |
| 51.34 | | |
| 0.77 | | |
| 0.55 | | |
| 0.032 | | |
| 0.30 | | |
| 0.18 | | |
| 5.50 | |
| 2046 | |
| 1,460,753 | | |
| 51.29 | | |
| 0.77 | | |
| 0.40 | | |
| 0.030 | | |
| 0.29 | | |
| 0.17 | | |
| 5.81 | |
| 2047 | |
| 1,460,753 | | |
| 51.08 | | |
| 1.28 | | |
| 0.89 | | |
| 0.130 | | |
| 0.23 | | |
| 0.18 | | |
| 4.41 | |
| 2048 | |
| 1,460,753 | | |
| 51.28 | | |
| 0.86 | | |
| 0.70 | | |
| 0.037 | | |
| 0.26 | | |
| 0.17 | | |
| 4.67 | |
| 2049 | |
| 1,460,753 | | |
| 51.18 | | |
| 0.87 | | |
| 0.73 | | |
| 0.107 | | |
| 0.23 | | |
| 0.17 | | |
| 4.49 | |
| 2050 | |
| 1,460,753 | | |
| 50.21 | | |
| 0.48 | | |
| 0.69 | | |
| 0.085 | | |
| 0.21 | | |
| 0.19 | | |
| 6.27 | |
| 2051 | |
| 1,460,753 | | |
| 50.57 | | |
| 0.73 | | |
| 0.43 | | |
| 0.050 | | |
| 0.26 | | |
| 0.17 | | |
| 6.49 | |
| 2052 | |
| 1,460,753 | | |
| 50.45 | | |
| 0.74 | | |
| 0.42 | | |
| 0.051 | | |
| 0.28 | | |
| 0.18 | | |
| 6.44 | |
| 2053 | |
| 1,460,753 | | |
| 50.63 | | |
| 0.66 | | |
| 0.39 | | |
| 0.061 | | |
| 0.28 | | |
| 0.16 | | |
| 6.61 | |
| Total | |
| 43,026,973 | | |
| 51.73 | | |
| 0.74 | | |
| 0.40 | | |
| 0.036 | | |
| 0.28 | | |
| 0.16 | | |
| 5.11 | |
In
the same 30-year period, the removal of waste rock will have a stripping of 0.41 tonnes of waste rock/coquina.
Figure
10 Virrila quarry final pit
The
life of the Virrila quarry is 30 years.
The
Cementos Pacasmayo personnel develop its operations at the Virrila quarry with its staff and contractors.
| 14. | Processing
and recovery methods |
The
cement production process includes different stages: quarry production, reception of raw materials, raw material grinding, clinkerization,
cement grinding, cement packaging, and cement dispatch.
The
process begins with the reception and storage of raw materials; then, the material is fed to the raw milling stage, where the raw materials
(coquina, clay, bauxite, gypsum, sand, and iron ore) are mixed in specific quantities to obtain a material known as “raw meal.”
Piura
plant has a vertical mill for the raw material grinding stage. This equipment allows pulverizing all raw materials to obtain an average
fineness of less than 15% measured on a 170 µm mesh.
The
raw meal obtained is transported to a homogenizing silo, where it is stored before feeding it to the kiln.
This
stage aims to reduce the variability of the raw material mix and guarantees the uniformity of the quality of production in the clinkerization
stage.
The
homogenized raw material is fed into the rotary kiln. The temperature of the clinkering process reaches approximately 1450°C; the
resulting product is called “clinker.”
The
clinker obtained is then pulverized in a vertical mill, with small amounts of gypsum and other mineral additions (such as slag, pozzolana
and coquina). Combining different proportions of these minerals makes it possible to obtain the different types of cement marketed.
The
Piura plant has two silos for special cement and one silo for Type I cement for cement storage.
There
is also finished product storage (APT) for storing cement packaged in bags and big bags.
Before
shipment, the quality control laboratory evaluates the cement produced for all the physical and chemical characteristics required by
current technical standards. After the validation process, the Quality Assurance unit approves the cement for bulk or 42.50 kg bags.
| 14.2. | Raw
materials for the cement production |
At
the Piura plant, the following raw materials and additions are used to produce cement.
Raw
materials
Coquina
domo: Material composed mainly of calcium carbonate, used as raw material and as additive in cement production.
Sand:
Inert material composed basically of crystalline silica, aluminum and alkalis such as potassium and sodium.
Iron:
Inert material composed basically of iron oxide (Fe2O3).
Clay:
Inert material composed of silicon, aluminum and a low proportion of alkalis such as potassium and sodium.
Bauxite:
Material used as a source of alumina. Its primary function is an alumina corrector and melting effect in the clinkerization process.
Gypsum: Material
composed of calcium sulfate hydrates. The mineral gypsum may contain crystalline silica. When gypsum is mixed with the clinker, it controls
the setting time when the cement initiates the hydration reactions.
Coal:
Solid, black, or dark brown mineral that contains carbon and small amounts of hydrogen, oxygen, and nitrogen for the most part.
Raw
meal: Artificial mixture of coquina, clay, sand and iron used to produce clinker.
Clinker:
Product obtained during the calcination of the mixture of coquina, sand, clays, and iron.
Fossil
fuel
For
the heating process of the rotary kiln, it is necessary to use fossil fuels that are easy to burn since this process starts at low temperatures.
For this purpose, the Piura plant has systems that can use natural gas and DB5 diesel as complementary fuels for the clinker production
process.
Mineral
componets (MIC)
Slag:
Artificial pozzolanic material that can be set in contact with water and develop compressive strength.
Pozzolan:
Materials containing silica and/or alumina of natural or artificial origin.
Gypsum: Material
composed of calcium sulfate hydrates. The mineral gypsum may contain crystalline silica. When gypsum is mixed with the clinker, it controls
the setting time when the cement initiates the hydration reactions.
Figure
11 shows the flow sheet for the cement production at the cement plant.
Figure
11 Piura plant process block diagram
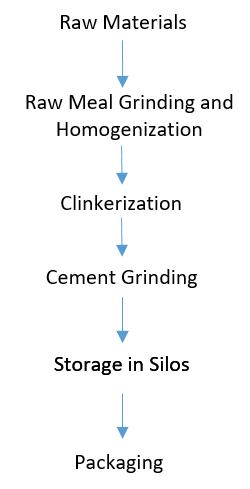
Table
29 below shows the design capacities for clinker and cement production.
Table
29 Main equipment in Piura plant
| Equipment |
Product |
Capacity of production* |
Unit |
| Raw meal Mill 1 |
Raw meal |
1,980,000 |
tonnes/year |
| Miag 1 |
Pulverized Coal |
182,160 |
tonnes/year |
| Kiln 1 |
Clinker |
990,000 |
tonnes/year |
| Mill 1 |
Cement |
1,639,440 |
tonnes/year |
| Bagging system 1 |
Cement |
1,009,800 |
tonnes/year |
| Bagging system 2 |
Cementca |
1,009,800 |
tonnes/year |
| * | The
capacities of each equipment consider a production of 330 days. |
| 14.5. | Cement
Plant Mass balance |
Table
30 shows the balance of raw meal production. In addition, Table 31 also shows the balance for cement production considering the additions
used for the mixture with clinker and, consequently, cement production.
Table
30 Balance for raw meal production
| Raw material | |
Annual quantity (tonnes/year) | | |
Dosage | |
| Coquina | |
| 1,036,293 | | |
| 83.46 | % |
| Others | |
| 205,391 | | |
| 16.54 | % |
| Raw meal | |
| 1,241,648 | | |
| 100 | % |
The
raw meal is fed to the rotary kiln. The production of 0.59 tons of clinker requires one ton of raw meal.
Table
31 Balance for cement production
| Raw Material | |
Annual quantity (tonnes/year) | | |
Dosage | |
| Clinker | |
| 733,045 | | |
| 71 | % |
| Additions | |
| 298,824 | | |
| 29 | % |
| Cement | |
| 1,031,868 | | |
| 100 | % |
Losses
in the cement production process associated with the raw material (coquina) are 2.18% due to the rainy season and the phenomenon of cyclone
Yaku.
The
Piura plant has a reverse osmosis plant for the water supply system for clinker production, which is used in the clinker and cement grinding
processes. It is also used to irrigate green areas and access roads. 247,286 m3 of water was consumed at the Pacasmayo Plant
during its operations in 2023.
| 14.8. | Fossil
fuel consumption |
Liquid
fuels and eventually natural gas (depending on availability) are used to generate the hot gases required in the production process. Table
32 shows the consumption of liquid fuels used in Cementos Pacasmayo S.A.A. - Piura plant, based on the volumes consumed during 2023.
Table
32 Fuel Consumption for Cementos Pacasmayo S.A.A – Piura Plant
| Fuel |
Consumption |
Description |
| Natural Gas |
0 m3 |
PC: 7.8 GJ/Nm3 |
| Diesel B5 |
298,935 gal |
PC 41.20 GJ/t |
| 14.9. | Electric
power consumption |
Cementos
Pacasmayo S.A.A. - Piura plant has an electrical substation with a nominal capacity of 37.50 MW, the energy is supplied by the national
interconnected network. 396,857 GJ of energy was consumed at the Pacasmayo plant during its operations in 2023.
Cementos
Pacasmayo S.A.A. has initiatives to diversify energy sources and secure supply when possible. Cementos Pacasmayo has implemented a preventive
and corrective maintenance plan to maintain the cement production. Cementos Pacasmayo controls operating efficiency to assure costs and
operating margins. The equipment is in good condition and operational.
The
Cementos Pacasmayo personnel develop its operations at the Piura plant with its staff and contractors.
Electricity
consumption during the operation stage is 100 kW-h, and a powerhouse provides the power supply with a 100 kW generator set.
The
fuel is supplied by a contractor using diesel oil trucks.
Water
consumption in quarry operations is for human consumption and industrial use.
The
quarry has offices and workshops for minor maintenance. No explosives is required, no crushers are used, and there is a scale for the
dispatch of coquina trucks located in an area adjacent to the offices.
Figure
12 Virrila quarry facilities
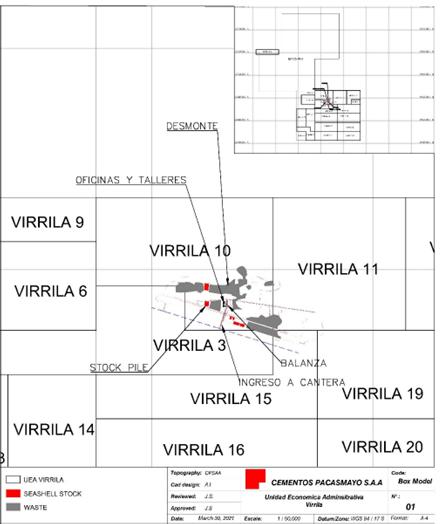
The
Piura plant has an installed power substation of 25 MW for use in electric motors and lighting of the plant.
Power
is supplied through a 60 KV transmission line from ENOSA’s Piura Oeste sub-station to the plant’s substation. The plant’s substation
is equipped with voltage transformers, protection, and energy metering equipment.
About
the fuel infrastructure, there is a pipeline system for liquid fuels and natural gas.
The
water supply comes from a deep well; the water is for industrial use, irrigation, and sanitary services. Drinking water which is supplied
in drums, is used for human consumption.
Cementos
Pacasmayo is a leading company in cement production and other construction materials in the north of Peru. This chapter describes the
cement market and the macro and microeconomic factors that define it.
For
the description of the cement market in Peru, public information has been collected from different sources, such as the Central Reserve
Bank of Peru (BCRP), National Institute of Statistics and Informatics (INEI), Association of Cement Producers (ASOCEM), Ministry of Housing,
Construction and Sanitation, Superintendency of Tax Administration and the Peruvian Construction Chamber. In addition to this information,
this chapter also relies on statistics provided by the company (CPSAA) to understand its specific market better.
| 16.1. | The
cement market in Peru |
The
Peruvian cement market is geographically segmented by north, central, and south regions. Diverse companies supply each area. Figure 13
illustrates the Peruvian map and its three regions, according to the segmentation of the cement market, where each part is the area of
influence of domestic cement companies.
Figure
13 Segmentation of the cement market in Peru

The
main companies that supply Peru’s cement market are Cementos Pacasmayo S.A.A., UNION Andina de Cementos S.A.A., Yura S.A., and Cementos
Selva S.A.C. Some companies import cement or clinker, such as Caliza Cemento Inca S.A., Distribuidora Cemento Nacional S.A.C., CEMEX
Perú S.A., Cal & Cemento Sur S.A., amongst others.
Table
33 shows the cement shipments at the domestic level (in thousands of tonnes):
Table
33 Cement shipments at domestic level (in thousands of tonnes)
| | |
2021 | | |
2022 | | |
2023 | |
| National cement shipments | |
| 12,500.0 | | |
| 14,113.3 | | |
| 12,175.7 | |
| Overall cement shipments (CPSAA/CSSAC, 3 plants) | |
| 3,625.2 | | |
| 3,436.8 | | |
| 2,936.6 | |
| Piura cement plant shipments | |
| 1,317.5 | | |
| 1,364.2 | | |
| 1,044.7 | |
Sources:
ASOCEM and CPSAA/CSSAC.
The
cement produced by the main cement companies of the country is Type I, Type V, Type ICO, Type IL, Type GU, Type MS (MH), Type HS, Type
HE, Type MH.
It
is important to mention that, according to the main requirement standards, Peruvian Technical Standards, there are five cement types:
| ● | NTP
334. 009 2013. Cements Portland. Requirement. (ASTM C 150). |
| ● | NTP
334. 090 2013. Cements Portland Added. Requirements. (ASTM C595). |
| ● | NTP
334. 082 2011. Cements Portland. Performance Specification. (ASTM C1157). |
| ● | NTP
334. 050 2004. Cements Portland White. Requirements. (ASTM C150). |
| ● | NTP
334. 069 2007. Building Cements. Requirements. (ASTM C091). |
Cementos
Pacasmayo only produces cement that meets the first three NTP standards.
| 16.2. | Industry
and Macroeconomic Analysis |
Producers
and trading companies of cement compete mainly within the limits of their area of influence, which is determined by the geographical
location of their plants, giving rise to segmentation of the national market. However, the north region presents a high demand potential
because of the infrastructure gap, the housing deficit, and a higher capillarity in terms of essential cities adjacent to one another,
and with an urbanization level lower than in the central and south regions.
On
the other hand, one should underline the importance of transportation in the structure of cement costs, which are composed primarily
of raw materials, fuels, and transportation.
The
cement market and the industry in Peru have the following characteristics:
| ● | The
base of consumers is highly segmented, informal, and of low resources. |
| ● | Low
costs of energy and raw materials. |
| ● | Zone
of influence/distribution determined by the geographical location of the plant. |
| ● | High
correlation between public and private investment and self-construction. |
| ● | The
construction sector and cement industry are directly related to the Gross Domestic Product (GDP) and Private Consumption. |
Figure
14 shows how the Global of the construction sector (variation % monthly) accompanies the cyclic behavior of the Global GDP (variation
% monthly), indicating variations of lower significance than those of the Global GDP, but in the same direction. It is also noted
that, in May 2020, the GDP of the construction sector had a positive variation of more than 200% (compared to the previous month), while
the Global GDP was only 10%. This situation was due to the confinement measures given by the Government to counter the Covid-19
pandemic. This reactivation was motivated primarily by the private-construction sector’s consumption. Under the uncertain conditions
caused by the health and economic crisis in 2020, consumers showed savings behaviors, which meant that people preferred consumption of
goods for home improvement, including cement. This trend was maintained throughout 2021. However, in 2022 there was a decrease in
demand for public and private investment due to the political and social situation. As a result, cement volumes are returning to pre-covid
levels.
Figure
14 Global GDP and Construction sector GDP MoM variation (%)
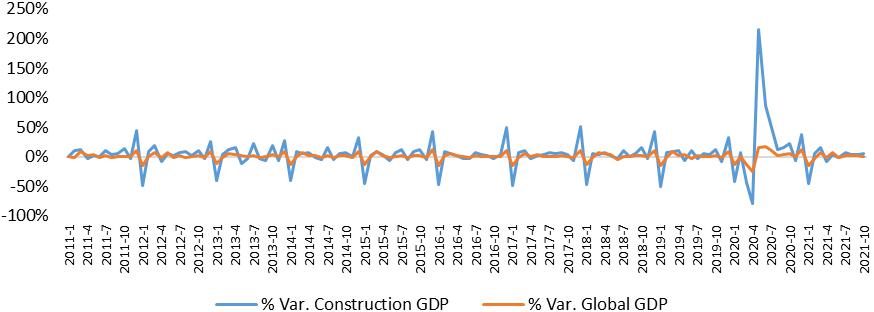
Source:
INEI 2022
The
cement industry is also driven by housing sector growth, public and private investment in infrastructure, mining projects, shopping centers,
construction of transportation systems, etc. Thus, one of the variables with more impact on the cement industry and future demand is
the infrastructure gap which remains high in the country.
For
the 2016 – 2025 period, the infrastructure gap is estimated at US$ 160 billion, and this is present in the main economic sectors
and services of public supply, that is, Transportation (36%), Energy (19%), Telecommunications (17%), Health (12%), Sewage System (8%),
Irrigation (5%) and Education (3%). Ninety percent of the roads not included in the extensive national road network remain without pavement;
only 40% of schools have access to essential services such as water, electricity, and sewage system; there are only 15 hospital beds
for every 10,000 individuals, compared to 27 beds recommended by the WHO.
In
2023, the cement market contracted by 14% compared to 2022, while it grew by 20% in 2019 (pre-pandemic). However, by 2024, it is expected
to have 2.6% growth compared to 2023. Climatic (cyclone Yaku) and social (protests and blockades) factors impacted domestic cement dispatches.
In addition, regional and local and local governments began new administrations with lower-than-expected public spending than expected.
Given
greater stability in the sector, a moderate growth of 2% in cement shipments is expected by 2024.
| 16.3. | The
North Region Market |
Cementos
Pacasmayo, a leading company in the production and sales of cement in the North Region, has market presence in the following cities:
Cajamarca, Chiclayo, Chimbote, Jaén, Pacasmayo, Piura, Rioja, Tarapoto, Trujillo, Tumbes, Yurimaguas and Iquitos. CPSAA has a
Market share of over 93.8% in the country’s north region.
Piura
plant supplies 33.4% of the cement demand of the country’s North Region. Overall shipments of the Piura plant for 2023 were 1,044.7 thousand
tonnes.
Other
companies with lower presence in the cement market of the North Region are:
These
companies are competitors of the Piura plant.
Cementos
Pacasmayo S.A.A Piura plant produces different types of cement. It has placed in the National Market other trademark products to meet
the needs of diverse segments of the market. Table 31 shows the products in the Piura plant.
Table
34 Cement at Piura plant
| Business Name |
Use |
Comment |
| Cemento Portland |
|
|
| Cement Type I |
Cement of general use. |
The average result of resistance to compression is higher than the minimum requirement set forth in the technical standard NTP 334.009 / ASTM C150. |
| Cemento Portland Added |
|
|
| Cement Fortimax |
Ideal for Works which require moderate hydratation heat, for Works exposed to sulphate action and for Works near to large water sources (sea, lakes, rivers, etc.) |
The average result of resistance to compression is higher than the minimum requirement set forth in technical standard NTP 334.082 / ASTM C1157. |
| Cement Extra Forte |
Ideal for the execution of structural Works, repairs, remodelings, home applications, floors, levelings, grouts, tips, prefabricated elements of small and medium size and concrete elements which require special characteristics. |
The average result of resistance to compression is higher than the minimum requirement set forth in technical standard NTP 334.090. |
| Hydraulic Cements specified by performance |
|
|
| Line Mochica MS |
For structures in contact with environement and humid and salty soils. |
|
The
sale prices of cement in the Peruvian market vary according to their type and geographical location.
The
price difference of each type is explained primarily by the dosifications of raw materials and additives. The variations for geographical
location are caused by the freights for the distribution to the points of sale.
At
the domestic level, the cement price in 2023 was, on average, 690.59 S/ x t. Figure 15 shows the historical prices of cement in Peru.
Figure
15 Historic prices of cement in Peru
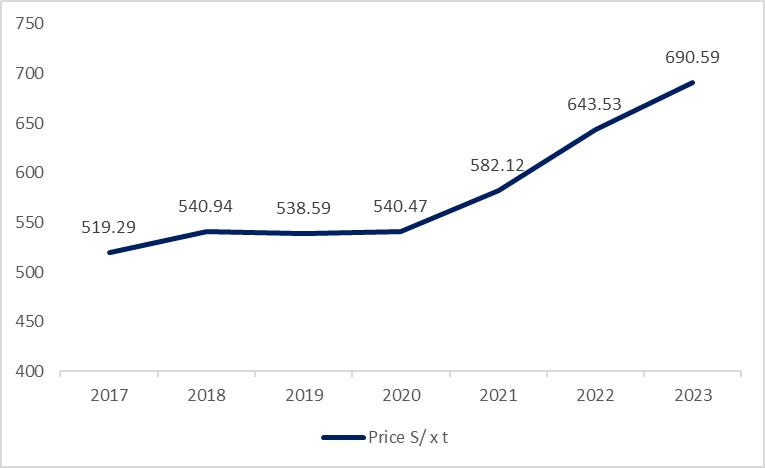
Source:
Ministerio de Vivienda, Construcción y Saneamiento (December 2023).
Figure
15 shows the sustained growth of the price of more than 4% per year, from 2017 until 2018, it fell slightly in 2019 to climb back up
again in 2020.
| 16.5. | Current
and future demand |
Cement
demand at the national level is met by local shipments (local production), for the most part, and by imports. In 2023, 11.20 M tonnes
were shiped locally; 13.6% less than in the same period of 2022 (12.97 M). Imports amounted to 0.21 M tonnes during 2023; 21.9% below
the 2022 figure (0.27 M).
Figure
16 shows the evolution of the national demand of cement, expressed in thousand of tonnes, since 2017.
Figure
16 Evolution of the national demand of cement

Source:
ASOCEM
It
is noted that domestic demand has been growing, on average, at a rate of 3% per year, with the exception of 2020, which is considered
an atypical year due to the adverse effects of the pandemic and the confinement measures, to then take a historic leap in 2021 with an
annual increase of 38%. During 2023, shipments decreased by 13.8% compared to 2022 as a result of the political and social situation
in the country.
According
to our internal information, in terms of regional distribution, the Northern Region accounts for approximately 25.6% of domestic cement
demand, the Central Region for 54.5%, and the Southern Region for 19.9%.
Cementos
Pacasmayo’s cement shipments (3 plants) reached 2,936.6 thousand tonnes in 2023, capturing a 24.1% share of total shipments in
Peru and 93.8% in the Northern Region. This is 15% less than in 2022 (3,436.8 thousand tonnes).
Despite
the decline in cement dispatches in 2023, demand is expected to increase due to the high infrastructure deficit in the northern region.
Table
35 shows the projection of future demand or shipments of cement for the Piura plant. These projections are based on the 2024 shipments,
and a sustained growth of 2% per year until the maximum capacity of cement production is reached.
Table
35 Forecast of future demand for Piura cement plant
| Year | |
Cement Shipments (Tonnes) | | |
Variation
(%) | |
| 2024P | |
| 847,382 | | |
| | |
| 2025P | |
| 1,030,460 | | |
| 22 | % |
| 2026P | |
| 1,051,069 | | |
| 2 | % |
| 2027P | |
| 1,356,464 | | |
| 29 | % |
| 2028P | |
| 1,424,976 | | |
| 5 | % |
| 2029P | |
| 1,494,859 | | |
| 5 | % |
| 2030P | |
| 1,566,140 | | |
| 5 | % |
| 2031P | |
| 1,638,846 | | |
| 5 | % |
| 2032P* | |
| 1,600,000 | | |
| -2 | % |
| 2033P | |
| 1,600,000 | | |
| 0 | % |
| 2034P | |
| 1,600,000 | | |
| 0 | % |
| 2035P | |
| 1,600,000 | | |
| 0 | % |
| 2036P | |
| 1,600,000 | | |
| 0 | % |
| 2037P | |
| 1,600,000 | | |
| 0 | % |
| 2038P | |
| 1,600,000 | | |
| 0 | % |
| 2039P | |
| 1,600,000 | | |
| 0 | % |
| 2040P | |
| 1,600,000 | | |
| 0 | % |
| 2041P | |
| 1,600,000 | | |
| 0 | % |
| 2042P | |
| 1,600,000 | | |
| 0 | % |
| 2043P | |
| 1,600,000 | | |
| 0 | % |
| 2044P | |
| 1,600,000 | | |
| 0 | % |
| 2045P | |
| 1,600,000 | | |
| 0 | % |
| 2046P | |
| 1,600,000 | | |
| 0 | % |
| 2047P | |
| 1,600,000 | | |
| 0 | % |
| 2048P | |
| 1,600,000 | | |
| 0 | % |
| 2049P | |
| 1,600,000 | | |
| 0 | % |
| 2050P | |
| 1,600,000 | | |
| 0 | % |
| 2051P | |
| 1,600,000 | | |
| 0 | % |
| 2052P | |
| 1,600,000 | | |
| 0 | % |
| 2053P | |
| 1,600,000 | | |
| 0 | % |
| * | As
of 2032, Piura plant reaches its maximum production of cement.
|
| 17. | Environmental
studies, permitting, and plans, negotiations, or agreements with local individual or groups. |
| 17.1. | Environmental
Aspects |
Cementos
Pacasmayo S.A.A has corporate policies applied to the operations of quarries and cement plants. Relevant policies include Safety Occupational
Health Policy, Quality Policy, and Environmental Policy.
Cementos
Pacasmayo S.A.A. carries out activities in Virrila quarry and Piura plant according to the environmental legislation. It has an environmental
authority in the industrial sector and another authority (Ministry of Energy and Mines) that issues an opinion for the Closure of quarries.
Likewise,
Cementos Pacasmayo complies with the provisions of the Regulation with Superno Decree No. 033-2005-EM - Regulation of the Mine Closure
Law.
On
February 02, 2023, by Directorial Resolution No. 031-2023-PRODUCE/DGAAMI, the Sixth Supporting Technical Report (ITS) of the Project
to Modify the Project for the Exploitation of the Virrila Quarry, was approved, through which the modification of the area of exploitation
zone 2 and 4 of the Virrila quarry was requested and the execution of 198 drillings in exploitation zone 2 and 395 drillings in exploitation
zone 4.
According
to current legislation, there is the Regulation of Environmental Management of the Manufacturing Industry and Internal Trade, approved
with Supreme Decree No. 017-2015-PRODUCE. This standard establishes the environmental management of the activities contemplated in Ministerial
Resolution No. 157- 2011-MINAM, table of the first update of the list of inclusion of investment projects subject to the National Environmental
Impact Assessment System (SEIA) and its amendments.
The
Directorial Resolution Number 548-2015-PRODUCE/DVMYPE-I/DIGGAM approved the Closure Plan of the mining unit Virrila quarry.
About
water management, it is essential to mention that Virrila quarry does not have generate effluent discharges. The small water consumption
is only for green area irrigation and road maintenance.
The
Closure Plan submitted by Cementos Pacasmayo S.A.A. has included the necessary measures to ensure effectiveness or consistency with the
requirements required to protect public health and the environment. The initial strategy has continued with the components of the Virrila
quarry, establishing temporary, progressive, final, and post-Closure activities at the end and/or closure of operations.
Environmental
closure activities include measures to ensure physical stability at the mine, geochemical stability, water management facilities, decommissioning
for the removal of equipment and machinery, demolition of infrastructure, reclamation, disposal of waste, the establishment of geographical
features, habitat rehabilitation and social and revegetation programs.
Cementos
Pacasmayo S.A.A. will carry out Post-closure activities such as physical, geochemical, hydrological, and biological maintenance. Post-closure
monitoring activities include physical stability monitoring, geochemical stability monitoring, water management monitoring, biological
monitoring and social monitoring.
Considering
that the land use before mining production was a barren area typical of the coastal geography of the Piura Region, forestation activities
with native species have been considered part of the post-closure activities. Likewise, Cementos Pacasmayo S.A.A. will fulfill the commitments
included in the Closure Plan approved by the above authority.
The
approval of the Mine Closure Plan involves the constitution of guarantees to ensure that the owner of the mining activity complies with
the obligations derived from the Mine Closure Plan by environmental protection regulations.
Cementos
Pacasmayo has a guarantee of faithful compliance with the mine closure plan for the Tembladera quarry according to the approval of the
updated mine closure plan for an amount of 60,907.70 USD.
We
have a strong relationship with our communities and have identified their main needs such as health, education, urban development and
local development.
In
this regard, we have a social investment program that contributes to dealing with their necessities based on good dialog and compliance
with our commitments.
The
communities are a priority for Cementos Pacasmayo. For this reason, we promote periodic meetings with their representatives, and we create
opportunities for dialog to know their expectations. Also, we have established public and private alliances for development projects
and programs to contribute to better life quality and strengthen our relations. In 2023, CPSAA worked in partnership with the district
governments of Piura and Sechura.
CPSAA
has no commitments for local procurement and hiring although it does its best to hire local talent and do business with local businesses.
About
water management, it is essential to mention that Piura plant does not have any discharges.
The small water consumption is only for green area irrigation.
The
Environmental Management regulation of the Manufacturing Industry and Domestic Trade, approved by Supreme Decree N° 017-2015-PRODUCE,
companies that produce cement are required to submit Closure Plans when executing Decommissioning activities. Cementos Pacasmayo S.A.A
in compliance with Peruvian legislation will submit the Closure Plan on time.
| 17.2. | Solid
waste disposal |
Cementos
Pacasmayo S.A.A. has a Solid Waste Minimization and Disposal Plan for our production activities at the Piura plant and Virrila quarry.
Annually, our company declares the generation, storage, collection, and final disposal of hazardous and non-hazardous solid waste in
compliance with environmental legislation.
The
solid waste minimization plan (2023), Cementos Pacasmayo S.A.A. declared 1.9 tons of hazardous waste and 3.1 tonnes of non-hazardous
waste for the Virrila quarry.
Likewise,
Cementos Pacasmayo S.A.A. declared 54.1 tonnes of hazardous waste for the Piura plant and 382.4 tonnes of non-hazardous waste disposed
of in accordance with environmental legislation.
| 17.3. | Qualified
Person’s Opinion |
Cementos
Pacasmayo S.A.A. complies with national environmental standards in the industrial sector. In the Virrila quarry, coquina is produced,
a raw material used for the manufacture of cement.
For
the industrial and mining sector, our company complies with the Environmental Management Standards for the Manufacturing Industry and
Internal Trade approved with Supreme Decree No. 017-2015-PRODUCE and its amendments that regulate the environmental management of the
activities indicated in the Resolution Ministerial No. 157-2011-MINAM and investment projects subject to the National Environmental Impact
Assessment System (SEIA), considered in Annex II of the Regulation of Law No. 27446, approved by Supreme Decree No. 019-2009- MINAM.
Cementos
Pacasmayo S.A.A. semiannually reports the environmental commitments assumed in its Environmental Management Plan and its monitoring program
to the Environmental Assessment Body - OEFA.
The
monitoring is carried out through external laboratories that provide comprehensive monitoring and analysis services and have double accreditation
by the international IAS (International Accreditation Service) and the national INACAL (National Institute of Quality), both signatories
of the ILAC-MRA global Mutual Recognition Agreement.
Cementos
Pacasmayo S.A.A. strictly complies with the different protocols in compliance with environmental legislation and are reported to the
OEFA, according to the frequency established in its approved Environmental Instruments.
The
qualified person believes that CPSAA’s current plans and management strategies are adequate for addressing any issues related to
environmental compliance and maintaining its environmental permits. In addition, the qualified person believes that CPSAA has a good
relationship with the local communities and that its social investment plans are adequate for reducing any social risks to the project.
| 18. | Capital
and operations costs |
| 18.1. | Basis
for operating and capital cost for the quarry and plant |
This
section presents the operating costs of the Virrila quarry for the production of coquina, the primary raw material used in cement production
at the Piura plant. It also exhibits the plant’s operating costs, for the whole industrial process, from the reception of raw material
to its conversion to the final product (cement). Cost forecast is mainly based on actual historical costs.
Similarly,
this section reports the detail of the capital investments made in the quarry and plant and the forecasted plan of assets required to
sustain all the activities in the quarry and plant to assure the supply of coquina Reserves for the necessary products to support forecasted
cement shipments of the Piura plant.
Table
36 depicts the main components of the cost structure of the Virrila quarry and Piura plant and the sources used in their forecasts.
Table
36 Concepts about cost structure of Virrila quarry and Piura plant
| Concept |
Description |
Source |
| Quarry Operating Cost |
Mineral Production, processing, fuel, Materials (Explosives), Maintenance, Insurances and Services |
·
Real, historic costs
·
Suppliers´ quotes |
| Quarry Operating Cost |
Royalties |
· Contract of mining
royalty payment
with regional/state entities |
| Quarry Operating Cost |
Energy |
·
Historic, real costs
·
Supply Contract
·
Suppliers´quote |
| Plant Operating Cost |
Fuel, Materials, Maintenance, Wages and Insurances |
·
Historic, real costs
·
Suppliers´quote |
| Plant Operating Cost |
Energy |
·
Historic, real costs
·
Supply Contract
·
Suppliers´quote |
Considering
that the Virrila quarry and the Piura plant are currently operating, the historical costs are the principal basis for estimating forecasted
costs.
In
this regard, the actual costs in some cases are maintained, and in other cases, are appropriately adjusted for factors specific to the
quarry operation, conditions, and obligations stipulated in supply and concession contracts.
On
the other hand, macroeconomic factors such as inflation and devaluation of the local currency against the US dollar could indirectly
impact future operating costs estimation.
| 18.2. | Capital
and Operating Cost Estimates |
Table
37 show the operating costs of quarry and plant for the year 2023, and 30 years of forecast:
Table
37 Operating costs forecast of quarry and plant
| | |
Production Data | | |
| | |
| |
| | |
Extracted Mineral | | |
Cement Production | | |
Total Operating Cost | | |
Cost per tonne of product | |
| | |
tonnes ’000 | | |
tonnes ’000 | | |
S/ ’000 | | |
S/ x tonne | |
| | |
| | |
| | |
| | |
| |
| 2023 | |
| 891 | | |
| 1,032 | | |
| 289,774 | | |
| 280.82 | |
| 2024 | |
| 1,430 | | |
| 847 | | |
| 251,749 | | |
| 297.09 | |
| 2025 | |
| 919 | | |
| 1,030 | | |
| 318,409 | | |
| 309.00 | |
| 2026 | |
| 937 | | |
| 1,051 | | |
| 328,325 | | |
| 312.37 | |
| 2027 | |
| 956 | | |
| 1,356 | | |
| 419,386 | | |
| 309.18 | |
| 2028 | |
| 975 | | |
| 1,425 | | |
| 451,019 | | |
| 316.51 | |
| 2029 | |
| 994 | | |
| 1,495 | | |
| 477,409 | | |
| 319.37 | |
| 2030 | |
| 1,014 | | |
| 1,566 | | |
| 510,551 | | |
| 325.99 | |
| 2031 | |
| 1,035 | | |
| 1,639 | | |
| 560,111 | | |
| 341.77 | |
| 2032 | |
| 1,055 | | |
| 1,600 | | |
| 574,359 | | |
| 358.97 | |
| 2033 | |
| 1,076 | | |
| 1,600 | | |
| 589,839 | | |
| 368.65 | |
| 2034 | |
| 1,098 | | |
| 1,600 | | |
| 603,312 | | |
| 377.07 | |
| 2035 | |
| 1,120 | | |
| 1,600 | | |
| 614,684 | | |
| 384.18 | |
| 2036 | |
| 1,142 | | |
| 1,600 | | |
| 630,597 | | |
| 394.12 | |
| 2037 | |
| 1,165 | | |
| 1,600 | | |
| 649,823 | | |
| 406.14 | |
| 2038 | |
| 1,188 | | |
| 1,600 | | |
| 660,045 | | |
| 412.53 | |
| 2039 | |
| 1,212 | | |
| 1,600 | | |
| 673,365 | | |
| 420.85 | |
| 2040 | |
| 1,236 | | |
| 1,600 | | |
| 691,826 | | |
| 432.39 | |
| 2041 | |
| 1,261 | | |
| 1,600 | | |
| 708,042 | | |
| 442.53 | |
| 2042 | |
| 1,286 | | |
| 1,600 | | |
| 726,893 | | |
| 454.31 | |
| 2043 | |
| 1,312 | | |
| 1,600 | | |
| 747,116 | | |
| 466.95 | |
| 2044 | |
| 1,338 | | |
| 1,600 | | |
| 764,392 | | |
| 477.74 | |
| 2045 | |
| 1,365 | | |
| 1,600 | | |
| 785,014 | | |
| 490.63 | |
| 2046 | |
| 1,392 | | |
| 1,600 | | |
| 809,031 | | |
| 505.64 | |
| 2047 | |
| 1,420 | | |
| 1,600 | | |
| 828,653 | | |
| 517.91 | |
| 2048 | |
| 1,449 | | |
| 1,600 | | |
| 851,103 | | |
| 531.94 | |
| 2049 | |
| 1,478 | | |
| 1,600 | | |
| 877,000 | | |
| 548.13 | |
| 2050 | |
| 1,484 | | |
| 1,600 | | |
| 898,557 | | |
| 561.60 | |
| 2051 | |
| 1,487 | | |
| 1,600 | | |
| 922,047 | | |
| 576.28 | |
| 2052 | |
| 1,490 | | |
| 1,600 | | |
| 946,872 | | |
| 591.79 | |
| 2053 | |
| 1,493 | | |
| 1,600 | | |
| 970,281 | | |
| 606.43 | |
Table
37 shows the forecast for the next 30 years, according to the production plan for 30 years of Reserves. Costs are adjusted annually by
applying a 2.90% inflation rate to the cost/tonne.
Costs
described in this chapter are applied to estimate the Mineral Resources and Reserves of the Virrila quarry as part of the analysis.
Table
38 shows the detail of capital investments in the quarry and plant, by type of investment, for one year of historical result (2023) and
30 years of projection:
Table
38 Investment forecast in quarry and plant
| | |
Total Investments | |
| | |
S/ ’000 | |
| | |
| |
| 2023 | |
| 14,341 | |
| 2024 | |
| 15,492 | |
| 2025 | |
| 15,938 | |
| 2026 | |
| 16,400 | |
| 2027 | |
| 16,875 | |
| 2028 | |
| 17,365 | |
| 2029 | |
| 17,868 | |
| 2030 | |
| 18,386 | |
| 2031 | |
| 18,920 | |
| 2032 | |
| 19,468 | |
| 2033 | |
| 20,033 | |
| 2034 | |
| 20,614 | |
| 2035 | |
| 21,212 | |
| 2036 | |
| 21,827 | |
| 2037 | |
| 22,460 | |
| 2038 | |
| 23,111 | |
| 2039 | |
| 23,781 | |
| 2040 | |
| 24,471 | |
| 2041 | |
| 25,181 | |
| 2042 | |
| 25,911 | |
| 2043 | |
| 26,662 | |
| 2044 | |
| 27,436 | |
| 2045 | |
| 28,231 | |
| 2046 | |
| 29,050 | |
| 2047 | |
| 29,892 | |
| 2048 | |
| 30,759 | |
| 2049 | |
| 31,651 | |
| 2050 | |
| 32,569 | |
| 2051 | |
| 33,514 | |
| 2052 | |
| 34,486 | |
| 2053 | |
| 35,486 | |
In
recent years, there have been no significant variations in capital investment, mainly for maintenance and replacement of equipment in
the quarry and plant to sustain operations.
The
Company´s investment plan does not consider any unusual or expansion activity. The sole plan is to perform the necessary replacement
for quarry support and the maintenance of operations in the plant. The investments are kept at levels similar to those registered throughout
the last years
| 18.3. | Capital
and Operating cost estimation risks |
There
is a low risk associated with capital and production costs because mine production and cement plant will continue in the same geological
deposit, using the same mining and industrial methods.
An
assessment of the accuracy of estimation methods is reflected in the sensitivity analysis in Section 19.
For
purposes of the Preliminary Feasibility Study completed relative to the Virrila quarry and Piura plant, capital and operating costs are
estimated to an accuracy of +/- 25%.
| 19.1. | Methodology:
for Discounted Cash flow (Free) |
The
Economic Analysis chapter describes the assumptions, parameters and methodology used to demonstrate the economic viability or profitability
of extracting the Mineral Reserves and Resources. The economic analysis at the Pre-feasibility level supports the determination of Mineral
Resources and Reserves through a business valuation through the Discounted (Free or Economic) Cash Flow method.
For
the cash flow projection, the forecast horizon is considered to be consistent with the quarry’s life, which is calculated based on the
total declared Reserves and the annual production of the quarry. The cash flow for each period is approximated indirectly from the EBITDA
(the latter is constructed in the Profit and Loss Statement), and the corresponding adjustments are made for taxes and capital costs
(CapEx).
Finally,
we work with the free cash flow for this economic analysis since it does not incorporate the financing structure. We apply the weighted
average cost of capital (WACC) to discount said future cash flows.
The
economic analysis considered the same evaluation criteria for Resource and Reserves estimation.
| 19.2.1. | General
and Macroeconomic Assumptions |
The
general and macroeconomic assumptions used for the projection of economic cash flows and the valuation are:
| ● | Projection horizon: 30 years (2024 to 2053), according to
the estimated years of quarry life. |
| ● | The annual escalation rate; 2.90%, based on The International
Monetary Fund as of October 2023: applies equally to the sales price, production costs, and expenses. |
| ● | Capital cost projections were determined using a historical
ratio of annual investments and maintenance costs, which also considers the increase in production volume. |
| ● | The company’s capital structure is being considered in the
discount rate (WACC); 11.56%. |
| ● | Income tax rate: effective rate of actual (historical) business
results, 29% - 30%. |
| ● | Workers’ Profit Sharing: 10%. |
| ● | Exchange rate: exchange rate is assumed to remain at 3.80
(USD/PEN) |
| 19.2.2. | Income
and Cost Assumptions |
| ● | The sales price of cement, expressed as S/ x t, is the sales
price of Piura plant to Distribuidora Norte Pacasmayo, FOB at Piura plant; and it is lower than the sales price to the final customer
in the market. The distribution freight explains this difference to the multiple points of sale and the selling expenses associated with
distribution and promotion in the different commercial channels. |
| ● | The base price used in the projection is an estimate for
the year 2024 (497.8 S/ x t), which has been determined based on current market conditions and cement demand for 2024, among other factors. |
| ● | Starting in 2025 (year 2 of the projection), an annual price
escalation rate of 2.9% is applied to the sales preice. |
| ● | The cost of cement production, expressed as S/ x t, has been
estimated for 2024 based on actual operating costs, the market situation of local materials and services, plant demand for imported clinker,
and other factors. The cost of production for the year 2024 is 297.1 S/ x t. |
| ● | Starting in 2025, an annual cost escalation rate of 2.9%
is applied to the cost. |
| ● | The initial stock of products in the quarry and plant is
assumed to be zero. |
| 19.3. | Results
of financial model |
The
following financial parameters were calculated:
| ● | NPV
of 1,664 million soles at a discount rate of 11.56%. |
| ● | Average
plant throughput for cement production: 1.5 million tonnes per year over the 30-year projection. |
| ● | Average
sales price: 687.8 soles per ton of cement, an average of the 30-year projection, at nominal
values. |
| ● | Revenues:
1,046 million soles, an average of the 30-year projection. |
| ● | Average
cash production cost: 428.6 soles per ton of cement, an average of the 30-year projection,
at nominal values. |
Table
39 shows the forecast of the Profit and Loss Statement of the operation of Virrila quarry and Piura plant:
Table
39 Profit and Loss Statement
| | |
Shipments (tonnes) | | |
Revenue
S/ x t | | |
Gross
Profit
S/ ’000 | | |
Gross
Margin
S/ x t | | |
Gross
Mg % | | |
Operating
Profit | | |
(+) Depreciation | | |
EBITDA Piura Plant | | |
EBITDA
Mg % | |
| | |
| | |
| | |
| | |
| | |
| | |
| | |
| | |
| | |
| |
| 2024P | |
| 847,382 | | |
| 497.8 | | |
| 146,458 | | |
| 172.8 | | |
| 35 | % | |
| 94,588 | | |
| 34,983 | | |
| 129,571 | | |
| 31 | % |
| 2025P | |
| 1,030,460 | | |
| 470.1 | | |
| 155,453 | | |
| 150.9 | | |
| 32 | % | |
| 102,024 | | |
| 51,460 | | |
| 153,484 | | |
| 32 | % |
| 2026P | |
| 1,051,069 | | |
| 482.6 | | |
| 166,691 | | |
| 158.6 | | |
| 33 | % | |
| 113,001 | | |
| 48,456 | | |
| 161,456 | | |
| 32 | % |
| 2027P | |
| 1,356,464 | | |
| 495.4 | | |
| 237,151 | | |
| 174.8 | | |
| 35 | % | |
| 181,723 | | |
| 47,765 | | |
| 229,488 | | |
| 34 | % |
| 2028P | |
| 1,424,976 | | |
| 508.5 | | |
| 256,872 | | |
| 180.3 | | |
| 35 | % | |
| 198,561 | | |
| 46,888 | | |
| 245,450 | | |
| 34 | % |
| 2029P | |
| 1,494,859 | | |
| 522.0 | | |
| 284,837 | | |
| 190.5 | | |
| 37 | % | |
| 225,914 | | |
| 44,295 | | |
| 270,209 | | |
| 35 | % |
| 2030P | |
| 1,566,140 | | |
| 535.8 | | |
| 309,150 | | |
| 197.4 | | |
| 37 | % | |
| 248,680 | | |
| 44,361 | | |
| 293,041 | | |
| 35 | % |
| 2031P | |
| 1,638,846 | | |
| 550.0 | | |
| 320,528 | | |
| 195.6 | | |
| 36 | % | |
| 257,104 | | |
| 44,526 | | |
| 301,630 | | |
| 33 | % |
| 2032P | |
| 1,600,000 | | |
| 564.6 | | |
| 308,134 | | |
| 192.6 | | |
| 34 | % | |
| 244,415 | | |
| 45,487 | | |
| 289,902 | | |
| 32 | % |
| 2033P | |
| 1,600,000 | | |
| 579.6 | | |
| 315,763 | | |
| 197.4 | | |
| 34 | % | |
| 250,325 | | |
| 46,665 | | |
| 296,989 | | |
| 32 | % |
| 2034P | |
| 1,600,000 | | |
| 594.9 | | |
| 325,895 | | |
| 203.7 | | |
| 34 | % | |
| 257,162 | | |
| 42,624 | | |
| 299,786 | | |
| 31 | % |
| 2035P | |
| 1,600,000 | | |
| 610.7 | | |
| 338,850 | | |
| 211.8 | | |
| 35 | % | |
| 269,244 | | |
| 41,067 | | |
| 310,311 | | |
| 32 | % |
| 2036P | |
| 1,600,000 | | |
| 626.9 | | |
| 347,824 | | |
| 217.4 | | |
| 35 | % | |
| 276,558 | | |
| 41,416 | | |
| 317,974 | | |
| 32 | % |
| 2037P | |
| 1,600,000 | | |
| 643.5 | | |
| 354,161 | | |
| 221.4 | | |
| 34 | % | |
| 279,826 | | |
| 41,829 | | |
| 321,656 | | |
| 31 | % |
| 2038P | |
| 1,600,000 | | |
| 660.5 | | |
| 370,208 | | |
| 231.4 | | |
| 35 | % | |
| 295,114 | | |
| 37,786 | | |
| 332,900 | | |
| 31 | % |
| 2039P | |
| 1,600,000 | | |
| 678.0 | | |
| 383,720 | | |
| 239.8 | | |
| 35 | % | |
| 306,778 | | |
| 34,167 | | |
| 340,945 | | |
| 31 | % |
| 2040P | |
| 1,600,000 | | |
| 696.0 | | |
| 392,837 | | |
| 245.5 | | |
| 35 | % | |
| 312,682 | | |
| 32,403 | | |
| 345,085 | | |
| 31 | % |
| 2041P | |
| 1,600,000 | | |
| 714.5 | | |
| 405,097 | | |
| 253.2 | | |
| 35 | % | |
| 324,080 | | |
| 32,898 | | |
| 356,977 | | |
| 31 | % |
| 2042P | |
| 1,600,000 | | |
| 733.4 | | |
| 415,324 | | |
| 259.6 | | |
| 35 | % | |
| 332,443 | | |
| 33,313 | | |
| 365,756 | | |
| 31 | % |
| 2043P | |
| 1,600,000 | | |
| 752.8 | | |
| 425,063 | | |
| 265.7 | | |
| 35 | % | |
| 338,986 | | |
| 31,769 | | |
| 370,755 | | |
| 31 | % |
| 2044P | |
| 1,600,000 | | |
| 772.8 | | |
| 438,739 | | |
| 274.2 | | |
| 35 | % | |
| 351,782 | | |
| 31,738 | | |
| 383,520 | | |
| 31 | % |
| 2045P | |
| 1,600,000 | | |
| 793.3 | | |
| 449,838 | | |
| 281.1 | | |
| 35 | % | |
| 361,045 | | |
| 32,293 | | |
| 393,338 | | |
| 31 | % |
| 2046P | |
| 1,600,000 | | |
| 814.3 | | |
| 458,370 | | |
| 286.5 | | |
| 35 | % | |
| 366,333 | | |
| 32,864 | | |
| 399,197 | | |
| 31 | % |
| 2047P | |
| 1,600,000 | | |
| 835.9 | | |
| 472,345 | | |
| 295.2 | | |
| 35 | % | |
| 379,384 | | |
| 33,452 | | |
| 412,836 | | |
| 31 | % |
| 2048P | |
| 1,600,000 | | |
| 858.0 | | |
| 484,237 | | |
| 302.6 | | |
| 35 | % | |
| 389,296 | | |
| 34,056 | | |
| 423,353 | | |
| 31 | % |
| 2049P | |
| 1,600,000 | | |
| 880.7 | | |
| 494,127 | | |
| 308.8 | | |
| 35 | % | |
| 395,849 | | |
| 34,679 | | |
| 430,528 | | |
| 31 | % |
| 2050P | |
| 1,600,000 | | |
| 904.1 | | |
| 509,426 | | |
| 318.4 | | |
| 35 | % | |
| 410,094 | | |
| 35,319 | | |
| 445,413 | | |
| 31 | % |
| 2051P | |
| 1,600,000 | | |
| 928.0 | | |
| 523,574 | | |
| 327.2 | | |
| 35 | % | |
| 422,081 | | |
| 35,027 | | |
| 457,108 | | |
| 31 | % |
| 2052P | |
| 1,600,000 | | |
| 952.6 | | |
| 537,384 | | |
| 335.9 | | |
| 35 | % | |
| 432,326 | | |
| 32,584 | | |
| 464,909 | | |
| 31 | % |
| 2053P | |
| 1,600,000 | | |
| 977.9 | | |
| 553,826 | | |
| 346.1 | | |
| 35 | % | |
| 447,544 | | |
| 33,026 | | |
| 480,570 | | |
| 31 | % |
Cement
sales at the Piura plant are, on average, S/ 1,046 million per year (for the period 2024-2053), and the average EBITDA margin for the
same period is 32%.
The
EBITDA margin remains relatively stable in the 30-year projection. The slight variations in the margin are mainly explained by the cost
of remunerations, which has a behavior with peaks every three years due to union negotiations.
Table
40 shows the Free Cash Flow projection and the valuation of the cement business of the Piura plant:
Table
40 Free Cash Flow and valuation
| | |
FCF - Valuation (Thousand S/) | |
| | |
(-) Taxes (EBIT*t) | | |
(-) CapEx | | |
EBITDA Planta Pacasmayo | | |
Free Cash Flow | |
| | |
| | |
| | |
| | |
| |
| 2024P | |
| -35,476 | | |
| -15,488 | | |
| 139,332 | | |
| 88,367 | |
| 2025P | |
| -41,798 | | |
| -15,938 | | |
| 162,619 | | |
| 104,884 | |
| 2026P | |
| -44,430 | | |
| -16,400 | | |
| 171,473 | | |
| 110,643 | |
| 2027P | |
| -65,344 | | |
| -16,875 | | |
| 241,057 | | |
| 158,837 | |
| 2028P | |
| -71,048 | | |
| -17,365 | | |
| 257,410 | | |
| 168,998 | |
| 2029P | |
| -80,970 | | |
| -17,868 | | |
| 283,543 | | |
| 184,705 | |
| 2030P | |
| -88,795 | | |
| -18,386 | | |
| 307,358 | | |
| 200,177 | |
| 2031P | |
| -91,206 | | |
| -18,920 | | |
| 315,968 | | |
| 205,842 | |
| 2032P | |
| -88,098 | | |
| -19,468 | | |
| 304,740 | | |
| 197,175 | |
| 2033P | |
| -90,628 | | |
| -20,033 | | |
| 312,631 | | |
| 201,969 | |
| 2034P | |
| -92,979 | | |
| -20,614 | | |
| 315,883 | | |
| 202,290 | |
| 2035P | |
| -97,783 | | |
| -21,212 | | |
| 327,775 | | |
| 208,780 | |
| 2036P | |
| -100,948 | | |
| -21,827 | | |
| 336,490 | | |
| 213,715 | |
| 2037P | |
| -102,294 | | |
| -22,460 | | |
| 340,598 | | |
| 215,845 | |
| 2038P | |
| -108,257 | | |
| -23,111 | | |
| 353,369 | | |
| 222,001 | |
| 2039P | |
| -112,617 | | |
| -23,781 | | |
| 362,696 | | |
| 226,297 | |
| 2040P | |
| -115,005 | | |
| -24,471 | | |
| 367,421 | | |
| 227,945 | |
| 2041P | |
| -119,961 | | |
| -25,181 | | |
| 380,815 | | |
| 235,673 | |
| 2042P | |
| -123,640 | | |
| -25,911 | | |
| 390,845 | | |
| 241,294 | |
| 2043P | |
| -125,805 | | |
| -26,662 | | |
| 396,237 | | |
| 243,770 | |
| 2044P | |
| -130,757 | | |
| -27,436 | | |
| 410,304 | | |
| 252,111 | |
| 2045P | |
| -134,251 | | |
| -28,231 | | |
| 420,956 | | |
| 258,474 | |
| 2046P | |
| -135,894 | | |
| -29,050 | | |
| 427,025 | | |
| 262,081 | |
| 2047P | |
| -140,774 | | |
| -29,892 | | |
| 441,793 | | |
| 271,127 | |
| 2048P | |
| -144,467 | | |
| -30,759 | | |
| 453,142 | | |
| 277,916 | |
| 2049P | |
| -146,458 | | |
| -31,651 | | |
| 460,439 | | |
| 282,330 | |
| 2050P | |
| -151,719 | | |
| -32,569 | | |
| 476,463 | | |
| 292,175 | |
| 2051P | |
| -156,077 | | |
| -33,514 | | |
| 489,098 | | |
| 299,508 | |
| 2052P | |
| -159,344 | | |
| -34,486 | | |
| 497,218 | | |
| 303,389 | |
| 2053P | |
| -164,936 | | |
| -35,486 | | |
| 514,082 | | |
| 313,661 | |
| WACC | |
| 11.56 | % |
| Economic NPV (Thousand S/) | |
| 1,663,683 | |
The
net present value (NPV) of Piura plant cement business amounts to more than S/ 1,664 million at a discount rate of 11.56% and is made
up of the sum of the discounted cash flows of each period, for the 30-year projection. For the discount rate of the cash flows, the QPs
applied the weighted average cost of capital (WACC) of the company.
| 19.4. | Sensitivity
Analysis |
The
sensitivity analysis considers a variation of +/- 5 and 10% in the variables that have the greatest impact on the NPV and EBITDA. These
variables are the cement sales price, operating cost, and CapEx.
Tables
41 and 42 detail the sensitivity of the EBITDA and NPV to each variable, respectively. Figures 17 and 18 show the results of the sensitivity
of NPV and EBITDA, respectively, to the three variables.
Table
41 Sensitivity analysis of the Net Present Value
| Variable / Variation |
-10% |
-5% |
0% |
+5% |
+10% |
| Price |
-28.7 |
-14.3 |
0 |
14.3 |
28.7 |
| Cost |
21 |
10.5 |
0 |
-10.5 |
-21 |
| CapEx |
1 |
0.5 |
0 |
-0.5 |
-1 |
Table
42 Sensitivity analysis of EBITDA
| Variable / Variation |
-10% |
-5% |
0% |
+5% |
+10% |
| Price |
-31.7 |
-15.9 |
0 |
15.9 |
31.7 |
| Cost |
21.1 |
10.5 |
0 |
-10.5 |
-21.1 |
| CapEx |
0.1 |
0 |
0 |
0 |
-0.1 |
Figure
17 Sensitivity of Net Present Value
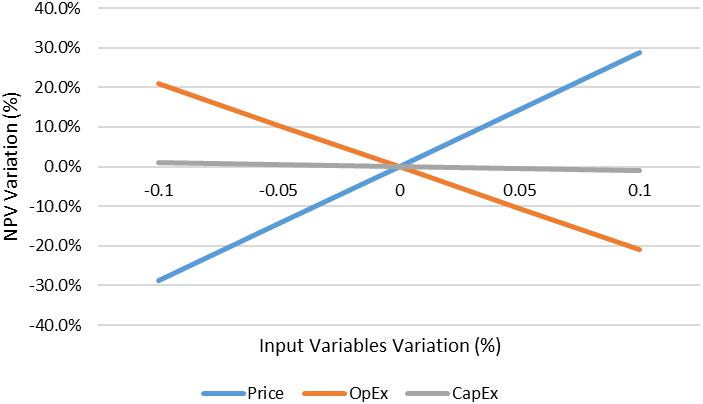
Figure
18 Sensitivity of EBITDA
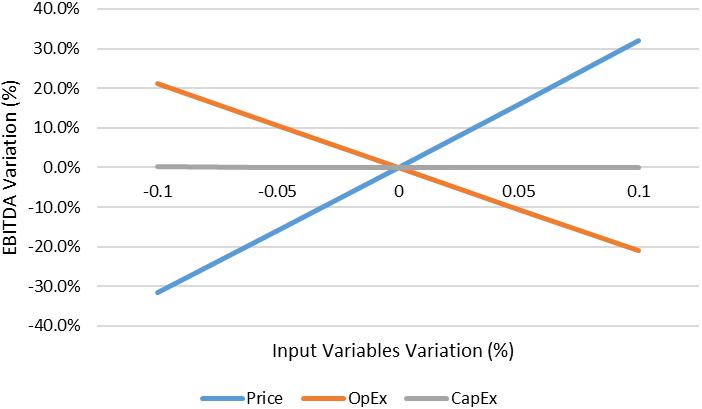
Based
on these results, the NPV is most sensitive to cement price, followed by operating cost, and least susceptible to the CapEx. EBITDA has
a similar sensitivity to NPV, being most exposed to cement price, followed by operating cost but shows no sensitivity towards variations
to the CapEx.
The
information in this chapter was obtained from the competent authority Instituto Geológico, Minero Metalúrgico (INGEMMET).
Figure 19 shows adjacent mineral concessions.To the north of the Cementos Pacasmayo S.A.A., concession is the Bayovar N° 7 concession
owned by Americas Potash Peru S.A. To the east of the concession are concessions Virrila 12, Virrila 19, and Virrila 23, owned by Cementos
Pacasmayo S.A.A. To the west are concessions Virrila 6, Virrila 9 and Virrila 14 owned by Cementos Pacasmayo S.A.A. and to the north
is the Virrila 16 concession owned by Cementos Pacasmayo S.A.A.
Figure
19 Adjacent properties map
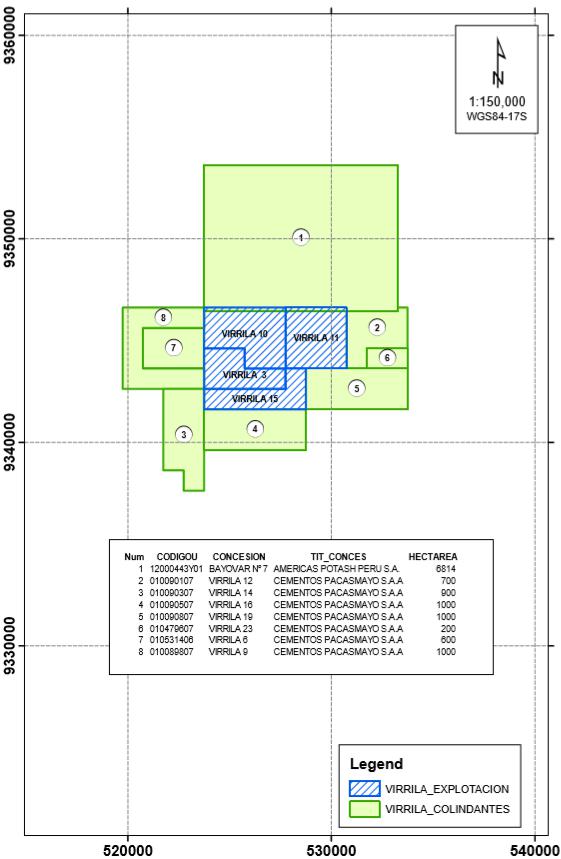
| 21. | Other
relevant data and information |
Not
applicable.
| 22. | Interpretation
and conclusions |
| ● | From
a legal viewpoint, Cementos Pacasmayo S.A.A. has mining rights for the areas of exploration, development, and production of coquina to
supply the cement plants for normal production during the quarry’s life. It also has an agreement with Fundación Comunal San Martín
de Sechura for the right of usufruct, surface and easement for the area of operations at the Virrila quarry. |
| ● | Cementos
Pacasmayo S.A.A. has been complying with ISO-9001 (Quality) standards since 2015 and has implemented Quality Assurance and Quality Control
(QAQC). The controls are applied for the construction of the Geological Model, Resource Estimation and Reserves Estimation. |
| ● | Cementos
Pacasmayo S.A.A. has a quality assurance system in its operations that includes sample preparation
methods, procedures, analysis and security, which comply with the best practices in the industry. |
| ● | The
information verification and validation processes are carried out following the procedures
indicated in the information flows. The validated information is congruent with the one that
generated the geological models, which are the fundamental basis for the estimation of Resources. |
| ● | The
geological modeling of the coquina deposit is consistent with the relationship between the
information and the geological model. |
| ● | The
Mineral Resources and Reserves estimation consider the geologic characteristics and modifying
factors as well as due consideration of risk: geologic and associated with evaluation of
modifiying factors. The main quality variable is the CaO content which is very stable in
the deposit, also present are other secondary variables that determine the quality of the
Reserves. |
| ● | In
the process of estimating Mineral Reserves and in the production plans of the quarry these
variables have been adequately considered in the mining plan, properly sequenced and with
blending processes. There are sufficient proven and probable Reserves for the next 30 years. |
| ● | Table
43 shows the Mineral Resources of the Virrila quarry and the results of Mineral Resource
classification. Likewise, the Mineral Reserves and the results of Mineral Reserves classification
are shown in Table 44. |
Table
43 Resources at the Virrila quarry in millions of tonnes (exclusive of Reserves)
| |
Resources |
Tonnes
M |
CaO (%) |
SO3 (%) |
MgO (%) |
SiO2 (%) |
Na2O (%) |
K2O (%) |
Cl (ppm) |
| Coquina |
Measured |
19.9 |
49.68 |
0.61 |
0.66 |
7.21 |
0.23 |
0.20 |
0.08 |
| Indicated |
28.0 |
48.92 |
1.11 |
1.17 |
7.42 |
0.21 |
0.22 |
0.08 |
| Measured + Indicated |
47.9 |
49.24 |
0.90 |
0.96 |
7.33 |
0.22 |
0.21 |
0.08 |
| Inferred |
4.4 |
46.67 |
2.15 |
1.61 |
9.80 |
0.23 |
0.25 |
0.06 |
Table
44 Mineral Reserves expressed in millions of tonnes
| |
Reserves |
Tonnes
M |
CaO (%) |
SO3 (%) |
MgO (%) |
SiO2 (%) |
Na2O (%) |
K2O (%) |
Cl (ppm) |
| Coquina |
Proven |
40.3 |
51.87 |
0.35 |
0.70 |
5.02 |
0.29 |
0.16 |
0.032 |
| Probable |
2.7 |
49.78 |
1.08 |
1.42 |
6.45 |
0.25 |
0.20 |
0.096 |
| Total |
43.0 |
51.73 |
0.40 |
0.74 |
5.11 |
0.29 |
0.16 |
0.036 |
| ● | The
cement plant located in Piura has all the equipment and facilities available to produce cement, using coquina from the Virrila quarry
and other necessary materials. |
| ● | Cementos
Pacasmayo S.A.A. has the SSOMASIG department, which manage the environmental aspects for quarry and cement operations in compliance with
current environmental legislation and in accordance with the company’s corporate policies. |
| ● | Through
its Social Responsibility unit, Cementos Pacasmayo S.A.A. has generated relationships of
trust with the communities surrounding its operations, which have translated into a solid
relationship with our communities, identifying their primary needs in health, education,
urban development, and local development. |
| ● | Infrastructure-wise,
the operation at the Virrila quarry and Piura plant is technically and economically feasible due to the quarry’s life. The sensitivity
analysis shows that the operation is economically robust. |
| ● | Develop
a geological exploration program surrounding the Virrila quarry to discover new coquiniferous zones and other materials related to cement
production. |
| ● | Maintain
the QaQc program for exploration, development and production activities associated with cement production. |
| ● | It
is recommended to carry out the geological interpretation of the data generated during the 2023 diamond drilling campaign, which considered
the confirmation of reserves in zone 2 and zone 4, so that they can be incorporated into the respective models, which will provide them
with greater support and robustness. |
| ● | Update
and standardize the geological model with the information generated by the diamond drilling campaign, considering that some areas have
test wells and other perforations as a source of information. |
| ● | Update
the geological model and standardize the information for the estimation of Mineral Resources and Reserves, considering that some areas
have test pits and other drillings as a source of information. |
| ● | Control
the stripping ratio during the operation in order to achieve a reduction in production costs. |
DCR
Ingenieros S.R.Ltda. (2013). Estudio De Ingenieria para la Estabilidad Fisica de la Cantera Calcarea Virrila – Sechura –
Piura
Empresa
de Ingeniería y Desarrollo S.A.C. (2012). Estudio
Hidrogeológico para Abastecimiento de Agua a la Cantera Virrila – CPSAA
Geoservice
Ingenieria S.A.C. (2012). Estudio de Impacto ambiental de la Planta de fabricación de Cementos Piura.
Tecnología
XXI S.A. (2016). Informe Técnico Sustentatorio para la modificación del proyecto de explotación Cantera de Virrila.
Consorcio
Andes Group S.A.C. (2019). Segundo Informe Técnico Sustentatorio del Proyecto modificación del proyecto de explotación
Cantera de Virrila.
Ram
Perú S.A.C. (2015). Investigaciones Hidrogeologicas en la Perforacion de 02 Piezometros para Abastecimiento de Agua para la
Actividad Extractiva en la “Cantera Virrila”
Umbrella
EcoConsulting S.A.C (2012). DIA del Proyecto de Exploración de Calcáreos.
| 25. | Reliance
on information provided by the registrant |
In
preparing this report, the qualified persons relied upon the registrant’s data, written reports, and statements in accordance with 17
CFR § 229.1302(f). After carefully reviewing the information provided, the QPs have no reason to believe that any material facts
have been withheld or misstated. Cementos Pacasmayo provided the information as summarized in Table 42.
Table
42 List of Cementos Pacasmayo S.A.A. information.
| Chapter |
Chapter name |
Information provided by CPSAA |
| 3 |
Property description |
Legal matters related to property rights and the authority “Instituto Geológico, Minero y Metalúrgico INGEMMET” |
| 16 |
Market studies |
Marketing information, ASOCEM, INEI and BCRP |
| 17 |
Environmental studies, permitting, and plans, negotiations, or agreements with local individuals or groups |
Community Relations and agreements with stakeholders |
| 18 |
Capital and operating costs |
Historical data about cost, price and investments |
| 19 |
Economic analysis |
The International Monetary Fund, Economic model, Macroeconomic trends, data, and assumptions, and interest rates |
| 20 |
Adjacent properties |
Legal matters related to property rights and the authority “Instituto Geológico, Minero y Metalúrgico “INGEMMET” |
97
Exhibit
96.3
CEMENTOS
SELVA S.A.C.
Technical
Report Summary (TRS)
Tioyacu
Quarry
and
Rioja
Cement Plant
20-F
229.601 (Item 601)
Exhibit
96
Index
| 1. |
Executive Summary |
1 |
| |
1.1. |
Location and access |
1 |
| |
1.2. |
Climate |
1 |
| |
1.3. |
History |
1 |
| |
1.4. |
Geological environment and mineralization |
2 |
| |
1.5. |
Exploration |
3 |
| |
1.6. |
Preparation of samples, analysis and security |
3 |
| |
1.7. |
Data verification |
4 |
| |
1.8. |
Mineral processing and metallurgical test |
4 |
| |
1.9. |
Mineral Resources and Reserves |
5 |
| |
1.10. |
Mining Methods |
6 |
| |
1.11. |
Processing Plant and Infrastructure |
7 |
| |
1.12. |
Market studies |
7 |
| |
1.13. |
Capital, Operating costs and Economic Analysis |
9 |
| |
1.14. |
Adjacent properties |
11 |
| |
1.15. |
Conclusions |
12 |
| |
1.16. |
Recommendations |
14 |
| 2. |
Introduction |
15 |
| |
2.1. |
Participants |
15 |
| |
2.2. |
Terms of Reference |
15 |
| |
2.3. |
Conventions |
17 |
| |
2.4. |
Previous Work and Sources of Information |
18 |
| |
2.5. |
Details of QP Personal Inspection |
18 |
| |
2.6. |
Previously Filed Technical Report Summary |
18 |
| 3. |
Property description |
19 |
| |
3.1. |
Tioyacu quarry |
19 |
| |
3.2. |
Rioja plant |
22 |
| 4. |
Accesibility, climate, local resources,
infrastructure and physiography |
24 |
| |
4.1. |
Tioyacu quarry and Rioja plant |
24 |
| 5. |
History |
26 |
| 6. |
Geological setting, mineralization, and deposit |
27 |
| |
6.1. |
Regional geology |
27 |
| |
6.2. |
Local geology |
27 |
| |
6.3. |
Characteristics of the deposit |
28 |
| 7. |
Exploration |
30 |
| |
7.1. |
Drilling |
30 |
| |
7.3. |
Geotechnical studies |
30 |
| 8. |
Sample preparation, analysis, and security |
31 |
| |
8.1. |
Geology and quarry |
31 |
| |
|
8.1.1. |
Preparation of samples, procedures, assays
and laboratories |
31 |
| |
|
8.1.2. |
Quality Assurance Actions |
32 |
| |
|
8.1.3. |
Quality Plan |
32 |
| |
|
8.1.4. |
Sample security |
33 |
| |
|
8.1.5. |
Chain custody |
33 |
| |
|
8.1.6. |
Qualified person’s opinion on quarry
QaQc |
33 |
| |
8.2. |
Rioja plant |
34 |
| |
|
8.2.1. |
Sample preparation, procedures, assays
and laboratories |
34 |
| |
|
|
8.2.1.1. |
Raw materials sample preparation |
34 |
| |
|
|
8.2.1.2. |
Laboratory Analysis |
34 |
| |
|
8.2.2. |
Quality Assurance Actions |
35 |
| |
|
8.2.3. |
Sample security |
36 |
| |
|
8.2.4. |
Qualified Person’s Opinion on cement
plant QaQc |
36 |
| 9. |
Data verification |
37 |
| |
9.1. |
Geology and quarry |
37 |
| |
|
9.1.1. |
Data Verification procedure |
37 |
| |
|
9.1.2. |
Data collection |
37 |
| |
|
9.1.3. |
Management and Validation of Database |
37 |
| |
|
9.1.4. |
Tracking Data |
37 |
| |
|
9.1.5. |
Validation of Data |
38 |
| |
|
9.1.6. |
Qualified Person’s Opinion Geologic
Data |
39 |
| |
9.2. |
Rioja plant |
39 |
| |
|
9.2.1. |
Data verification procedures |
39 |
| |
|
9.2.2. |
Data validation |
40 |
| |
|
9.2.3. |
Qualified Person’s Opinion on cement
plant |
40 |
| 10. |
Mineral processing and metallurgical testing |
41 |
| |
10.1. |
Nature of Testing Program |
41 |
| |
10.2. |
Cement Manufacturing Test Results |
42 |
| |
10.3. |
Qualified Person’s Opinion of the
Adequacy of the Test Data |
42 |
| 11. |
Mineral Resources estimates |
43 |
| |
11.1. |
Database |
44 |
| |
11.2. |
Density |
45 |
| |
11.3. |
Composting |
45 |
| |
11.4. |
Basic statistics of the data (Assay –
Composites) |
45 |
| |
11.5. |
Extreme values |
46 |
| |
11.6. |
Variogram Analysis |
46 |
| |
11.7. |
Interpolation |
47 |
| |
11.8. |
Resources estimation |
48 |
| |
|
11.8.1. |
Cut-off |
49 |
| |
|
11.8.2. |
Reasonable Prospects of Economic Extraction |
49 |
| |
|
11.8.3. |
Mineral Resources classification |
50 |
| |
11.9. |
Qualified Person’s Opinion |
50 |
| 12. |
Mineral Reserves estimates |
51 |
| |
12.1. |
Criteria for Mineral Reserves estimation |
51 |
| |
|
12.1.1. |
Run of Mine (ROM) determination criteria |
51 |
| |
|
12.1.2. |
Cement Plant recovery |
52 |
| |
12.2. |
Reserves estimation methodology |
52 |
| |
12.3. |
Reserves estimates |
52 |
| |
12.4. |
QP’s Opinion on Risk Factors affecting
Reserve Estimates |
53 |
| 13. |
Mining methods |
53 |
| |
13.1. |
Mining methods and equipment |
53 |
| |
13.2. |
Geotechnical models |
55 |
| |
13.3. |
Hydrological models |
56 |
| |
13.4. |
Other Mine Design and Planning Parameters |
56 |
| |
13.5. |
Anual production rate |
57 |
| |
13.6. |
Mining plan |
57 |
| |
13.7. |
Life of Mine |
58 |
| |
13.8. |
Staff |
58 |
| 14. |
Processing and recovery methods |
59 |
| |
14.1. |
Process Plant |
59 |
| |
14.2. |
Raw materials for the cement production |
59 |
| |
14.3. |
Flow sheet |
60 |
| |
14.4. |
Main equipment |
61 |
| |
14.5. |
Material balance cement plant |
61 |
| |
|
14.5.1. |
Material balance |
62 |
| |
14.6. |
Process losses |
62 |
| |
14.7. |
Water consumption |
62 |
| |
14.8. |
Fossil fuel consumption |
63 |
| |
14.9. |
Electric power consumption |
63 |
| |
14.10. |
Maintenance Plan |
63 |
| |
14.11. |
Staff |
63 |
| 15. |
Infrastructure |
64 |
| |
15.1. |
Tioyacu quarry |
64 |
| |
15.2. |
Rioja Plant |
64 |
| 16. |
Market Studies |
65 |
| |
16.1. |
The cement market in Peru |
65 |
| |
16.2. |
Industry and Macroeconomic Analysis |
66 |
| |
16.3. |
The North Region Market |
68 |
| |
16.4. |
Cement price |
70 |
| |
16.5. |
Current and future demand |
70 |
| 17. |
Environmental studies, permitting, and
plans, negotiations, or agreements with local individuals or groups. |
73 |
| |
17.1. |
Environmental Aspects |
73 |
| |
|
17.1.1. |
Tioyacu quarry |
73 |
| |
|
17.1.2. |
Rioja plant |
76 |
| |
17.2. |
Solid waste disposal |
76 |
| |
17.3. |
Qualified Person’s Opinion |
76 |
| 18. |
Capital and operations costs |
77 |
| |
18.1. |
Basis for operating and capital costs for
the quarry and plant |
77 |
| |
18.2. |
Capital and Operating Cost Estimates |
79 |
| |
18.3. |
Capital and Operating Cost Estimation Risks |
81 |
| 19. |
Economic Analysis |
81 |
| |
19.1. |
Methodology: Discounted Cash Flow (Free) |
81 |
| |
19.2. |
Assumptions |
81 |
| |
|
19.2.1. |
General and Macroeconomic Assumptions |
81 |
| |
|
19.2.2. |
Income and Cost Assumptions |
82 |
| |
19.3. |
Financial Model Results |
82 |
| |
19.4. |
Sensitivity Analysis |
85 |
| 20. |
Adjacent properties |
87 |
| 21. |
Other relevant data and information |
88 |
| 22. |
Interpretation and conclusions |
88 |
| 23. |
Recommendations |
90 |
| 24. |
References |
91 |
| 25. |
Reliance on information provided by registrant |
92 |
Index
of tables
| Table 1 |
Mineral Resources (exclusive of Reserves) of Tioyacu quarry |
5 |
| Table 2 |
Mineral Reserves of Tioyacu quarry |
6 |
| Table 3 |
Projection of demand and price for the next 24 years |
8 |
| Table 3 |
Free Cash Flow and valuation |
10 |
| Table 5 |
Mineral Resources (exclusive of Reserves) of Tioyacu quarry |
13 |
| Table 6 |
Mineral Reserves of Tioyacu quarry |
13 |
| Table 7 |
List of Cementos Pacasmayo S.A.A. Professionals |
16 |
| Table 7 |
QP’s field visit |
18 |
| Table 9 |
UEA Rioja Concessions |
19 |
| Table 10 |
UEA Rioja Concessions |
20 |
| Table 11 |
Central coordinates of the UEA Rioja property |
20 |
| Table 11 |
Central coordinates of the Rioja plant |
22 |
| Table 13 |
Characteristics of Tioyacu quarry |
28 |
| Table 14 |
Drilling campaigns in Tioyacu quarry |
30 |
| Table 15 |
Quality Plan of the Tioyacu quarry |
32 |
| Table 16 |
Tests and frequency for each stage of the process |
35 |
| Table 17 |
Quality Plan of Rioja plant |
36 |
| Table 18 |
Lithologic units of the Tioyacu quarry geological model |
43 |
| Table 19 |
Rioja plant material restrictions |
44 |
| Table 20 |
Characteristics of the block model |
44 |
| Table 21 |
Limestone density per horizon |
45 |
| Table 22 |
Basic statistics of the limestone horizon data |
46 |
| Table 23 |
Basic statistics of the data of the marly limestone horizon. |
46 |
| Table 24 |
Variogram modeling parameters |
47 |
| Table 25 |
Ordinary Kriging Estimation Parameters CaO |
48 |
| Table 26 |
Resource categorization (exclusive of Reserves) at the Tioyacu quarry |
48 |
| Table 27 |
Criteria for Resource categorization |
50 |
| Table 28 |
Mineral Reserves expressed in millions of tonnes |
52 |
| Table 29 |
Equipment of the Tioyacu quarry |
55 |
| Table 30 |
Tioyacu quarry design criteria |
55 |
| Table 31 |
Stability Analysis |
56 |
| Table 32 |
2021 piezometric data |
56 |
| Table 33 |
Summary of Tioyacu quarry design parameters |
56 |
| Table 34 |
Mining plan for the next 24 years |
57 |
| Table 35 |
Main equipment in Rioja plant |
61 |
| Table 36 |
Balance for crude production |
62 |
| Table 37 |
Balance for cement production. |
62 |
| Table 38 |
Fuel consumption in Rioja plant |
63 |
| Table 39 |
Cement shipments at domestic level (in thousands of tonnes) |
66 |
| Table 40 |
Types of products of Rioja plant |
69 |
| Table 41 |
Forecast of future demand for Rioja cement plant |
72 |
| Table 42 |
Concepts about cost structure of Tioyacu quarry and Rioja plant |
78 |
| Table 43 |
Operating costs forecast of quarry and plant |
79 |
| Table 44 |
Investment forecast in quarry and plant |
80 |
| Table 45 |
Profit and Loss Statement |
83 |
| Table 46 |
Free Cash Flow and valuation |
84 |
| Table 47 |
Sensitivity analysis of the Net Present Value |
85 |
| Table 48 |
Sensitivity analysis of the EBITDA |
85 |
| Table 49 |
Mineral Resources (exclusice of Reserves) of Tioyacu quarry |
89 |
| Table 50 |
Mineral Reserves of Tioyacu quarry |
89 |
| Table 51 |
List of Cementos Selva S.A.C. information. |
92 |
Index
of figures
| Figure 1 |
Tioyacu quarry mining sequence |
6 |
| Figure 1 |
Sensitivity of Net Present Value |
11 |
| Figure 2 |
Sensitivity of EBITDA |
11 |
| Figure 4 |
UEA Rioja map |
21 |
| Figure 4 |
Rioja plant map |
23 |
| Figure 6 |
Regional stratigraphic column |
27 |
| Figure 7 |
Local stratigraphic column of the Tioyacu quarry. |
28 |
| Figure 8 |
Geological Section of the Tioyacu quarry |
29 |
| Figure 9 |
Tioyacu quarry mining sequence |
54 |
| Figure 10 |
Tioyacu quarry final pit |
58 |
| Figure 11 |
Rioja plant process block diagram |
61 |
| Figure 12 |
Segmentation of the cement market in Peru |
65 |
| Figure 13 |
Construction sector GDP variation |
67 |
| Figure 14 |
Historic prices of cement in Peru |
70 |
| Figure 15 |
Evolution of the national demand of cement |
71 |
| Figure 16 |
Sensitivity of Net Present Value |
86 |
| Figure 17 |
Sensitivity of EBITDA |
86 |
| Figure 18 |
Concession Calizas Tioyacu and adjacent concessions. |
87 |
Cementos
Selva S.A.C. (CSSAC), a wholly-owned subsidiary of Cementos Pacasmayo S. A.A., is a Peruvian company whose corporate purpose is the production
of cement and other products associated with the construction sector. This Technical Report Summary summarizes the Pre-feasibility study
of the Tioyacu quarry located in the San Martin Region and the Rioja plant located in the same region, both owned by CSAAC. Qualified
professionals from Cementos Pacasmayo have prepared the report to support the Resources and Reserves Estimates.
The
Tioyacu quarry contains limestone, a non-metallic mineral that is primarily used as raw material in cement production. This quarry is
located in the district of Elías Soplin Vargas, Rioja Province, San Martin Region. The access route to this quarry is by land
through the Fernando Belaunde Terry highway. The cement plant located in the city of Rioja is adjacent to the Tioyacu quarry.
The
vegetation is evergreen with lianas and vines, many of which are covered by epiphytes of the Bromeliaceae family. The forests have a
very heterogeneous floristic composition.
The
climate in this Amazon region in northern Peru is mainly influenced by the following factors: the Intertropical Convergence Zone (ITCZ),
the presence of the Eastern Cordillera of the Andes and the Extratropical Fronts.
On
February 6, 1998, the public auction of the Rioja Cement Plant was held, and Consorcio Pacasmayo was awarded the contract. To comply
with the terms of the auction, Consorcio incorporated and subsequently transferred ownership of the plant to Cementos Rioja S.A. The
award mentioned above included, by public deed dated April 8, 1998, the non-metallic mining concession “Calizas Tioyacu.”
The Tioyacu quarry began operations as Cementos Rioja S.A. in 2000.
As
historical information about the quarry, a campaign of 460 meters of drilling was carried out in 05 drill holes located in the eastern
flank of the “Tioyacu” limestone-dolomitic massif executed by the company Andes Diamantina S.R.L., at the end of 1982 into
early 1983. The objective was to determine the feasibility of a new portland cement plant in the region of San Martin. The exploration
study identified significant limestone material suitable for cement manufacturing.
In
2015, Cementos Selva S.A. commissioned Geosym Consultores S.A.C. to carry out prospecting work through drilling. A total of 06 mixed
drill holes were drilled, conveniently located and distributed along the Tioyacu quarry: 02 drill holes in the southern sector, 03 drill
holes in the central area, and 01 drill hole in the northern sector, to geologically evaluate the deposit and know its conditions at
depth. These 06 drillings carried out in the campaign in conjunction with blast hole information and geological evaluation work allowed
the inventory of Mineral Resources and Reserves to be updated.
From
2018 to the present, Cementos Selva S.A., with the help and support of mining software such as Leapfrog and Minesight has developed the
updated estimates of its Resources and Reserves at the Tioyacu quarry.
On
March 1, 2022, Cementos Selva S.A. changed its corporate name to Cementos Selva S.A.C. (CSSAC).
From
October to November, 2023, the Rioja plant stop its operations because there was general power outage in the area.
In
December 2023, Cementos Selva started a diamond drilling campaign of 6 drill holes to confirm Resources and Reserves.
1.4. Geological environment and mineralization
The
strata of the district of Elias Soplin Vargas, province of Rioja, San Martin region consists of Paleozoic/Mesozoic Age sedimentary formations
of the Mitu Group, Pucara Group, Chambara Formation, Celendín Formation, Aramachay Formation, Condorsinga Formation, Ipururo Formation,
and Quaternary Deposits.
Cementos
Selva S.A.C. did not carry out any exploration activities at the Tioyacu quarry during the current year. The exploration activities described
in section 1.3 describe the exploration work at the Tioyacu quarry till date.
During
2023, Cementos Selva performed a drilling campaign in the Tioyacu quarry in order to estimate Reserves, the drilling activities will
continue during the 2024.
| 1.6. | Preparation
of samples, analysis and security |
Cementos
Selva S.A.C. has implemented international standards in all its operations such as quarries and plants. The ISO 9001 standards has been
implemented and certified since 2015. The certification is renewed annually through an external audit.
The
SSOMASIG (Security, Occupational Health, Environment and Management Systems) department, is part of the team that determines and gives
the necessary support for the maintenance of the ISO 9001 and the scope is in all the company’s activities.
Cementos
Selva S.A.C. has implemented QaQc protocols to develop exploration and production activities in the Tioyacu quarry and Rioja plant to
ensure the quality of the information used for estimation of limestone Resources and Reserves.
With
respect to the geology, CSSAC uses the XRF technique and other analytical methods to analyze the main chemical components in the limestone.
In the cement plant, the raw materials for the production of clinker and cement are analyzed using methods specified in the A.S.T.M.
and Peruvian Technical Standards for cement testing. The laboratory in the cement plant has properly calibrated equipment and a periodic
maintenance plan.
On
the other hand, the Rioja plant, through its Quality Assurance and Control area, has implemented a sampling and data verification plan,
which applies to the processes of receiving minerals, crushing of materials, drying of raw materials, grinding of crude, clinkerization,
grinding of cement and cement packaging
CSSAC
Concerning geological activities, CPSAA has a data verification department for the geological database. This deparment has as its main
function, the verification of data to be used in the estimation of Mineral Resources and Reserves. For the appropriate administration
of information, internal protocols have been implemented that are subject to internal audits. The stages within the verification activities
for the geologic data are the data collection, the administration and validation of data received from internal and external laboratories,
data tracking through the confirmation of custody chains and finally, validation of data in the database that will allow the development
of the Mineral Resources and Reserves model.
For
data verification activities at the cement plant, the Plan, Do, Check and Act (PDCA) methodology is used. This is applied to the technical
information received from the company’s internal and external customers. The quality control laboratory compares the results with
national and international laboratories as part of the verification procedures.
| 1.8. | Mineral
processing and metallurgical test |
Cementos
Pacasmayo has procedures for developing products at the laboratory level and scaling at the industrial level (including at Cementos Selva
S.A.C. operations). It has guidelines for preparing, reviewing, insurance, and controlling laboratory test reports. Cemento Pacasmayo
has a research and development laboratory located in the Pacasmayo plant to evaluate the technical aspects of cement plants and quarry
operations.
At
the Pacasmayo plant, the studies conducted in the Research and Development laboratory and the Quality Control area include the substitution
of fossil fuels for rice husks at the Rioja plant.
The
main objective of the substitution of fossil fuels is the reduction of CO2 or greenhouse gas emissions.
In
2023, CSSAC used 4,645 t of Alternative Fuel (measured as coal equivalent) in the Rioja plant. This result represented 10.82% of the
total fuels used by the plant for cement production and a reduction in emissions of 12,194 t of CO2.
A
significant percentage of Research and Development activities are focused on evaluating different ratios between clinker-mineral additions
providing the best functional characteristics to our products and at the same time balancing the benefits generated for the company.
Another objective is to identify other additions that can substitute for clinker: slag, pozzolana, fly ash, calcined clays, etc., to
reduce its environmental footprint and the cost of cement production. Based on this work, the laboratory has determined (and confirmed
with production estimates) that 1 tonne of limestone yields 0.79 tonnes of clinker and the clinker/cement factor of the main cements
with additions is 0.72.
The
Research Laboratory issues technical reports following the criteria of international standards to the operations area, which evaluates
the convenience of implementing the tests industrially and validating what is reported at the laboratory level.
| 1.9. | Mineral
Resources and Reserves |
Cementos
Pacasmayo’s QPs have developed the estimation of limestone Resources and Reserves. For the evaluation, information from exploration
activities carried out until 2023 has been used.
The
limestone Resources are presented in Table 1. The result of the estimation of Resources considered the quality restrictions of limestone
received at Rioja plant, accessibility to the Resources and legal limits inherent to the mining concessions, relevant economic and technical
factors.
The
minimum quality accepted is 49% CaO to be used as raw material for production. Considering the selling prices of cement at the Rioja
plant, the economic evaluation used for the estimates of Resources and Reserves is shown in Chapter 19.
Table
1 Mineral Resources (exclusive of Reserves) of Tioyacu quarry
| |
Resources |
Tonnes
M |
CaO
(%) |
Al2O3
(%) |
MgO
(%) |
SiO2
(%) |
K2O
(%) |
| Limestone |
Measured |
0.05 |
50.10 |
0.60 |
1.01 |
5.82 |
0.22 |
| Indicated |
0.5 |
48.01 |
0.67 |
3.32 |
6.23 |
0.19 |
| Measured
+ Indicated |
0.5 |
48.20 |
0.67 |
3.11 |
6.19 |
0.20 |
| Inferred |
19.8 |
46.34 |
0.37 |
5.97 |
2.67 |
0.14 |
| * | No
economic evaluation was performed for the Tioyacu quarry because
it only has inferred resources. |
The
Reserves calculation considered the Resources results and the quality criteria, modifying factors, and limestone extraction costs.
The
mining method used is open pit mining. The financial results are shown in Chapter 19. Table 2 presents the estimation of Reserves.
Table
2 Mineral Reserves of Tioyacu quarry
| |
Reserves |
Tonnes
M |
CaO
(%) |
Al2O3
(%) |
MgO
(%) |
SiO2
(%) |
K2O
(%) |
| Limestone |
Proven |
5.9 |
50.17 |
0.61 |
1.01 |
5.86 |
0.22 |
| Probable |
4.4 |
48.07 |
0.72 |
2.18 |
6.84 |
0.21 |
| Total |
10.3 |
49.28 |
0.66 |
1.51 |
6.28 |
0.22 |
Cementos
Selva S.A.C., a wholly-owned subsidiary of Cementos Pacasmayo S.A.A, is the current owner of the Tioyacu quarry. Cementos Selva S.A.C.
carries out the planning, production, supervision and quality control of the quarry to verify the activities and production according
to the requirements of Rioja plant.
Figure
1 Tioyacu quarry mining sequence
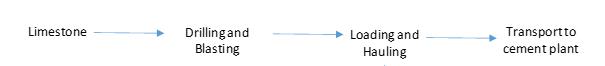
The
major equipment used for the production of limestone in the Tioyacu quarry is a track drill, excavator, front loader, and dump truck.
Also, auxiliary equipment is necessary, like pickups, lubricator trucks, and other equipment.
The
mining plan of the Tioyacu quarry considers an average annual production of 0.4 million tonnes of limestone for the next 24 years.
Based
on the plant requirements and sales projection for the next 24 years, the pit design parameters for the Tioyacu quarry are inter-ramp
bench slope angle, bench height, safety bench and width of ramps.
| 1.11. | Processing
Plant and Infrastructure |
Cement
production considers the stages of raw material extraction, grinding, homogenization, clinkerization, cement grinding, silo storage and
packaging, loading, and transportation. Cement is moved through conveyor belts to bagging systems to be packed in bags and then loaded
onto trucks operated by third parties for distribution.
The
raw materials for cement production are Limestone, Sand, Iron, Clay, Coal. The mixture of these raw materials is crude and is fed to
the calcination kiln to produce clinker.
Limestone
represents 73.26% by weight of the crude. Anthracite coal is also used as part of the raw material for the production of clinker. Clinker
and additions are used to produce cement. The additions used in cement production are slag, pozzolana, and gypsum. Currently, the cement
plant in Rioja has a clinker/cement factor of 0.76.
The
Rioja plant has an electrical substation with a capacity of 12 MVA. Rioja plant uses electric power, which is supplied from the national
grid.
Cementos
Selva has implemented a preventive and corrective maintenance plan for equipment to prevent interruptions to cement production. Additionally,
operating efficiency controls costs and operating margins.
The
Peruvian cement market is geographically segmented by regions: north region, central region and south region. Diverse companies supply
each region.
The
main companies that comprise the cement market in Peru are: Cementos Pacasmayo S.A.A., UNION Andina de Cementos S.A.A., Yura S.A. and
Cementos Selva S.A.C. Additionally, there are companies that import cement or clinker, such as Caliza Cemento Inca S.A., Distribuidora
Cemento Nacional S.A.C., CEMEX Perú S.A., and Cal & Cemento Sur S.A., amongst others.
Companies
that market cement in Peru follow the Peruvian Technical Standards associated with cement technical specifications.
The
types of cement produced by the main cement companies of the country are Type I, Type V, Type ICO, Type IL, Type GU, Type MS (MH), Type
HS, Type HE, Type MH.
Cementos
Pacasmayo, a leading company in the production and sales of cement in the North Region, has market presence in the following cities:
Cajamarca, Chiclayo, Chimbote, Jaén, Pacasmayo, Piura, Rioja, Tarapoto, Trujillo, Tumbes, Yurimaguas and Iquitos. The company
has a Market share of over 93.8% in the north region of the country.
For
Cementos Selva S.A.C. the overall shipments of the Rioja plant for 2023 were 257 thousand tonnes. It supplied 8.2% of the country’s
North Region cement demand, and its cement sales represented 8.8% of the three cement plant’s overall shipments.
Table
3 shows the projected demand and price per ton of cement for the next 24 years.
Table
3 Projection of demand and price for the next 24 years
| | |
Shipments
(tonnes) | | |
Revenue
S/ x t | |
| | |
| | |
| |
| 2024P | |
| 308,242 | | |
| 561.2 | |
| 2025P | |
| 374,838 | | |
| 540.6 | |
| 2026P | |
| 382,335 | | |
| 554.9 | |
| 2027P | |
| 383,000 | | |
| 569.7 | |
| 2028P | |
| 383,000 | | |
| 584.8 | |
| 2029P | |
| 383,000 | | |
| 600.2 | |
| 2030P | |
| 383,000 | | |
| 616.2 | |
| 2031P | |
| 383,000 | | |
| 632.5 | |
| 2032P | |
| 383,000 | | |
| 649.2 | |
| 2033P | |
| 383,000 | | |
| 666.4 | |
| 2034P | |
| 383,000 | | |
| 684.1 | |
| 2035P | |
| 383,000 | | |
| 702.2 | |
| 2036P | |
| 383,000 | | |
| 720.8 | |
| 2037P | |
| 383,000 | | |
| 739.9 | |
| 2038P | |
| 383,000 | | |
| 759.6 | |
| 2039P | |
| 383,000 | | |
| 779.7 | |
| 2040P | |
| 383,000 | | |
| 800.3 | |
| 2041P | |
| 383,000 | | |
| 821.6 | |
| 2042P | |
| 383,000 | | |
| 843.3 | |
| 2043P | |
| 383,000 | | |
| 865.7 | |
| 2044P | |
| 383,000 | | |
| 888.6 | |
| 2045P | |
| 383,000 | | |
| 912.2 | |
| 2046P | |
| 383,000 | | |
| 936.3 | |
| 2047P | |
| 383,000 | | |
| 961.1 | |
| 1.13. | Capital,
Operating costs and Economic Analysis |
This
document presents the cash flow analysis and an economic evaluation of the project based on the current operating costs of the Rioja
plant and using information on the Tioyacu quarry for limestone production.
For
the Reserves evaluation, the general and macroeconomic assumptions used for the projection of the free/economic cash flows and for the
valuation are:
| ● | Projection
horizon: 24 years (2024 to 2047) according to the estimated years of quarry life. |
| ● | The
annual escalatioin rate; 2.90%, based on based on The International Monetary Fund as of October
2023: applies equally to the sales price, costs, and expenses. |
| ● | Capital
cost projections were determined using a historical ratio of annual investments and maintenance
costs, which also considers the increase in production volume. |
| ● | The
company’s financing structure is being considered in the discount rate (WACC), which
is 11.56%, not in the cash flows. |
| ● | Income
tax rate: effective rate of actual (historical) business results, 29% - 30%. |
| ● | Workers’
Profit Sharing: 10%. |
| ● | Exchange
rate: exchange rate is assumed to remain at 3.80 (USD/PEN). |
The
economic analysis considers the same evaluation criteria for estimating Resources and Reserves, considering that the Tioyacu quarry is
one location using the same infrastructure and mining methods. The main variables considered in the economic model for the sensitivity
analysis were cement price, production cost, and Capex.
The
free cash flow is constructed for the economic analysis, which does not incorporate the financing structure. The latter is considered
in the weighted average cost of capital of the company (WACC) to discount future cash flows. The following financial parameters were
calculated:
| ● | Average
plant throughput of 0.4 million tonnes per year over the 24-year projection. |
| ● | Average
sales price of 724.6 soles per ton of cement, on average for the 24-year projection, at nominal
values. |
| ● | Revenues
of 275 million soles, on average for the 24-year projection. |
| ● | Average
cash production cost of 469.4 soles per ton of cement, on average for the 24-year projection,
at nominal values. |
The
cash flow of the project is presented in Table 3 below. The NPV at a discount rate of 11.56%, is 363 million soles.
Table
3 Free Cash Flow and valuation
| | |
FCF
- Valuation (Thousand S/) | |
| | |
(-)
Taxes (EBIT*t) | | |
(-)
CapEx | | |
EBITDA
Planta Pacasmayo | | |
Free
Cash Flow | |
| | |
| | |
| | |
| | |
| |
| 2024P | |
| -18,995 | | |
| -5,139 | | |
| 62,295 | | |
| 38,161 | |
| 2025P | |
| -19,398 | | |
| -5,288 | | |
| 63,961 | | |
| 39,274 | |
| 2026P | |
| -21,344 | | |
| -5,441 | | |
| 68,459 | | |
| 41,674 | |
| 2027P | |
| -22,095 | | |
| -5,599 | | |
| 70,203 | | |
| 42,508 | |
| 2028P | |
| -22,235 | | |
| -5,762 | | |
| 69,933 | | |
| 41,937 | |
| 2029P | |
| -23,287 | | |
| -5,929 | | |
| 72,991 | | |
| 43,775 | |
| 2030P | |
| -23,870 | | |
| -6,101 | | |
| 74,831 | | |
| 44,860 | |
| 2031P | |
| -23,762 | | |
| -6,277 | | |
| 74,698 | | |
| 44,659 | |
| 2032P | |
| -24,914 | | |
| -6,460 | | |
| 77,904 | | |
| 46,531 | |
| 2033P | |
| -25,463 | | |
| -6,647 | | |
| 79,896 | | |
| 47,786 | |
| 2034P | |
| -25,425 | | |
| -6,840 | | |
| 79,921 | | |
| 47,656 | |
| 2035P | |
| -27,187 | | |
| -7,038 | | |
| 83,291 | | |
| 49,066 | |
| 2036P | |
| -28,368 | | |
| -7,242 | | |
| 85,457 | | |
| 49,846 | |
| 2037P | |
| -28,376 | | |
| -7,452 | | |
| 85,649 | | |
| 49,820 | |
| 2038P | |
| -29,681 | | |
| -7,668 | | |
| 89,188 | | |
| 51,839 | |
| 2039P | |
| -30,482 | | |
| -7,891 | | |
| 91,522 | | |
| 53,149 | |
| 2040P | |
| -30,694 | | |
| -8,119 | | |
| 91,896 | | |
| 53,083 | |
| 2041P | |
| -32,186 | | |
| -8,355 | | |
| 95,622 | | |
| 55,081 | |
| 2042P | |
| -33,050 | | |
| -8,597 | | |
| 98,142 | | |
| 56,495 | |
| 2043P | |
| -33,175 | | |
| -8,846 | | |
| 98,705 | | |
| 56,684 | |
| 2044P | |
| -34,527 | | |
| -9,103 | | |
| 102,622 | | |
| 58,992 | |
| 2045P | |
| -35,440 | | |
| -9,367 | | |
| 105,341 | | |
| 60,535 | |
| 2046P | |
| -35,633 | | |
| -9,639 | | |
| 106,107 | | |
| 60,835 | |
| 2047P | |
| -37,061 | | |
| -9,918 | | |
| 110,231 | | |
| 63,252 | |
| WACC | |
| 11.56 | % |
| Economic NPV (Thousand S/) | |
| 362,968 | |
Sensitivity
analysis was also performed to show the influence of changes in prices, operating costs, and capital costs on NPV.
Figure
1 Sensitivity of Net Present Value
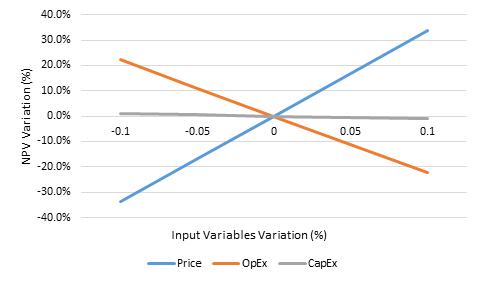
Figure
2 Sensitivity of EBITDA

The
Calizas Tioyacu borders to the north of the Cementos Selva S.A.C concession is the Rioja 2 concession owned by Cementos Selva S.A.C;
to the east of the mining concession is the Rioja 4 concession owned by Cementos Selva S.A.C, to the southwest is the Rioja 3 concession
owned by Cementos Selva S.A.C
| ● | From
a legal point of view, Cementos Selva S.A.C has the ownership of the mining properties for
the exploration, development and production of limestone to supply the cement plants for
normal production during the life of the quarry. |
| ● | Cementos
Selva S.A.C has been complying with international ISO-9001 standards since 2015 and has implemented
Quality Assurance and Quality Control (QAQC). The controls are applied for the construction
of the Geological Model, Resource estimation and Reserves estimation. |
| ● | Cementos
Selva S.A.C has a quality assurance system in its operations that includes sample preparation
methods, procedures, analysis and security, which comply with the best practices in the industry. |
| ● | The
information verification and validation processes are carried out following the procedures
indicated in the information flows. The validated information is congruent with the one that
generated the geological models, and is the fundamental basis for the estimation of Resources. |
| ● | The
geological modeling of the limestone deposit is consistent with the relationship between
the information and the geological model. |
| ● | The
Reserves estimates consider the geologic and modifying factors as well as risk. The quality
variable is the CaO content which is very stable in the deposit. There also are other secondary
variables that determine the quality of the Reserves. |
| ● | In
the process of calculating Mineral Reserves and in the production plans of the quarry, these
variables have been adequately considered in the mining plan, properly sequenced and with
blending processes. There are sufficient proven and probable Mineral Reserves for the next
24 years. |
| ● | Table
5 shows the Mineral Resources of the Tioyacu quarry. Likewise, the Mineral Reserves are shown
in Table 6. |
Table
5 Mineral Resources (exclusive of Reserves) of Tioyacu quarry
| |
Resources |
Tonnes
M |
CaO
(%) |
Al2O3
(%) |
MgO
(%) |
SiO2
(%) |
K2O
(%) |
| Limestone |
Measured |
0.05 |
50.10 |
0.60 |
1.01 |
5.82 |
0.22 |
| Indicated |
0.5 |
48.01 |
0.67 |
3.32 |
6.23 |
0.19 |
| Measured
+ Indicated |
0.5 |
48.20 |
0.67 |
3.11 |
6.19 |
0.20 |
| Inferred |
19.8 |
46.34 |
0.37 |
5.97 |
2.67 |
0.14 |
| * | No
economic evaluation was performed for the Tioyacu quarry because
it only has inferred resources. |
Table
6 Mineral Reserves of Tioyacu quarry
| |
Reserves |
Tonnes
M |
CaO
(%) |
Al2O3
(%) |
MgO
(%) |
SiO2
(%) |
K2O
(%) |
| Limestone |
Proven |
5.9 |
50.17 |
0.61 |
1.01 |
5.86 |
0.22 |
| Probable |
4.4 |
48.07 |
0.72 |
2.18 |
6.84 |
0.21 |
| Total |
10.3 |
49.28 |
0.66 |
1.51 |
6.28 |
0.22 |
| ● | The
cement plant located in Rioja has equipment and facilities available for cement production,
using limestone from the Tioyacu quarry and other necessary materials. |
| ● | The
Health, Safety and Environment department is in charge of supervising compliance with the
Company’s corporate policies and the various legal requirements of the national regulatory
bodies by all company áreas. |
| ● | Through
its Social Responsibility area, Cementos Selva S.A.C has generated relationships of trust
with the communities surrounding its operations. We have a solid relationship with their
communities, which includes identifying their primary needs in health, education, urban development,
and local development. |
| ● | The
operation in Tioyacu quarry and Rioja plant, with respect to infrastructure, is technically
and economically feasible due to the life of the quarry. |
| ● | The
sensitivity analysis shows that the operation is economically robust. |
| ● | Maintain
the QAQC program for exploration, development and production activities associated with cement
production. |
| ● | Include
QAQC plans and density control for the subsequent diamond drilling campaigns. |
| ● | It
is recommended to finish the drilling campaign that began in 2023 and carry out the geological
interpretation of the data generated during the campaign, so that it can be incorporated
into the Resource and Reserve model, which will provide greater support and robustness to
these model. |
| ● | Implement
the Geotechnical Monitoring Plan of the quqrry componets with the installation of slope displacement
control lamdmarks. |
| ● | Maintain
a permanent monitoring of the installed piezometers both for water levels and water quality,
to evaluate the evolution of levels during the production of the Tioyacu quarry. |
| ● | It
is recommended that a geophysical study using the Georadar method to identify karst cavities
within the quarry area be conducted, especially in areas of structural anomalies. |
This
Technical Summary Report (TRS) was prepared for Cementos Selva by qualified persons (QP’s) who work for Cementos Selva and Cementos
Pacasmayo, who according to their qualifications and experience developed the chapters based on their expertise. Likewise, the aforementioned
QPs used the Company’s information sources, information validated and approved by the competent authorities in Peru and public
information sources. Table 7 shows the qualified persons who prepared this document, as well as the chapters and information under their
responsibility.
Marco
Carrasco, who holds the position of Project Manager of Cementos Pacasmayo and is certified by the Mining and Metallurgical Society of
America (MMSA) of the United States as a QP, served as the supervising QP. He acted as Project Manager, whose primary role was to compile
the information received from the QPs of each chapter to have an integrated document. Each QP is responsible for the section they wrote.
This
technical report summary was prepared as an exhibit to support disclosure of Mineral Resources and Reserves by Cementos Selva, a wholly-owned
subsidiary of Cementos Pacasmayo SAA. This report summarizes the results of the Pre-feasibility study of the “Calizas Tioyacu”
property for the production of limestone using open pit mining methods. The report is effective December 31, 2023.
The
limestone producted from the Calizas Tioyacu property supplies raw material for the Rioja plant, located in the city of the same name,
Cementos Selva produces cement. The annual cement production is 0.4 million tonnes per year (mtpy). Actual operating costs have been
considered for the estimates and used as a basis for economic projections within the economic analysis. This technical report summary
estimates Mineral Resources and Reserves according to the regulations published in Securities Exchange Commission (SEC) Form 20-F and
under subpart 1300 of Regulation S-K.
The
report was prepared by the qualified persons listed in Table 7 using available studies and, in some cases (see Chapter 25), relying on
information provided by Cementos Pacasmayo, the registrant.
Table
7 List of Cementos Pacasmayo S.A.A. Professionals
| Item | |
Chapter | |
First
and Last Names | |
Job
Position | |
Profession |
| 0 | |
Compiled
all | |
Marco
Carrasco (*) | |
Project
Manager | |
Chemical
Engineer |
| 1 | |
Executive
summary | |
All
QPs (**) | |
| |
|
| 2 | |
Introduction | |
All
QPs(**) | |
| |
|
| 3 | |
Property
description | |
Henry
Vargas (***) | |
Environmental
Coordinator | |
Environmental
Engineer |
| 4 | |
Accessibility,
climate, local Resources, infrastructure and physiography | |
Henry
Vargas (***) | |
Environmental
Coordinator | |
Environmental
Engineer |
| 5 | |
History | |
Marco
Alarcón | |
Quarry
Superintendent | |
Mining
Engineering |
| 5 | |
History | |
Jhonson
Rodríguez | |
Senior
Geologist | |
Geological
Engineer |
| 6 | |
Geological
setting, mineralization, and deposit | |
Jhonson
Rodríguez | |
Senior
Geologist | |
Geological
Engineer |
| 7 | |
Exploration | |
Jhonson
Rodríguez | |
Senior
Geologist | |
Geological
Engineer |
| 8 | |
Sample
preparation, analyses, and security | |
Jhonson
Rodríguez | |
Senior
Geologist | |
Geological
Engineer |
| 8 | |
Sample
preparation, analyses, and security | |
Marco
Alarcón | |
Quarry
Superintendent | |
Mining
Engineering |
| 9 | |
Data
verification | |
Jhonson
Rodríguez | |
Senior
Geologist | |
Geological
Engineer |
| 9 | |
Data
verification | |
Marco
Alarcón | |
Quarry
Superintendent | |
Mining
Engineering |
| 10 | |
Mineral
processing and metallurgical testing | |
Marco
Alarcón | |
Quarry
Superintendent | |
Mining
Engineering |
| 11 | |
Mineral
resource estimates | |
Jason
Gamio (****) | |
Chief
of Planning and Evaluation of Resources and Reserves | |
Geological
Engineer |
| 12 | |
Mineral
reserve estimates | |
Jason
Gamio (****) | |
Chief
of Planning and Evaluation of Resources and Reserves | |
Geological
Engineer |
| 13 | |
Mining
methods | |
Marco
Alarcón | |
Quarry
Superintendent | |
Mining
Engineering |
| 14 | |
Processing
and recovery methods | |
Marco
Alarcón | |
Quarry
Superintendent | |
Mining
Engineering |
| 15 | |
Infrastructure | |
Marco
Alarcón | |
Quarry
Superintendent | |
Mining
Engineering |
| 16 | |
Market
studies | |
Jason
Gamio (****) | |
Chief
of Planning and Evaluation of Resources and Reserves | |
Geological
Engineer |
| 17 | |
Environmental
studies, permitting, and plans, negotiations, or agreements with local individuals or groups | |
Henry
Vargas (***) | |
Environmental
Coordinator | |
Environmental
Engineer |
| 18 | |
Capital
and operating costs | |
Jason
Gamio (****) | |
Chief
of Planning and Evaluation of Resources and Reserves | |
Geological
Engineer |
| 19 | |
Economic
analysis | |
Jason
Gamio (****) | |
Chief
of Planning and Evaluation of Resources and Reserves | |
Geological
Engineer |
| 20 | |
Adjacent
properties | |
Henry
Vargas (***) | |
Environmental
Coordinator | |
Environmental
Engineer |
| 21 | |
Other
relevant data and information | |
All
QPs (**) | |
| |
|
| 22 | |
Interpretation
and conclusions | |
All
QPs (**) | |
| |
|
| 23 | |
Recommendations | |
All
QPs (**) | |
| |
|
| 24 | |
References | |
All
QPs (**) | |
| |
|
| 25 | |
Reliance
on information provided by the registrant | |
All
QPs (**) | |
| |
|
| (*) | Marco
Carrasco, who holds the position of Project Manager of Cementos Pacasmayo compiled the information
received from the QPs of each chapter to have an integrated report. Each QP is responsible
for the section they wrote. |
| (**) | Henry
Vargas, Jhonson Rodríguez, Marco Alarcón and Jason Gamio |
| (***) | Henry
Vargas joined Cementos Pacasmayo as Environmental
Coordinator in (December 2022). |
| (****) | Jason
Gamio assumed new responsibilities as Chief
of Planning and Evaluation of Resources and Reserves in
April 2023. |
Unless
otherwise indicated in the report, all currencies are in soles and all measurements and units are in the metric system. The Tioyacu quarry
is located within the boundaries of the WGS84 two-dimensional geographic coordinate reference system, in the UTM 18S (Universal Transverse
Mercator) zone. All coordinates referenced in this report and in the accompanying figures, tables, maps and sections are provided in
the WGS84 coordinate system, UTM 18S zone, unless otherwise indicated.
| 2.4. | Previous
Work and Sources of Information |
The
information used is sufficient to allow this TRS to be completed with the level of detail required by Regulation S-K subpart 1300. The
information used included exploration results from the various drilling campaigns, actual information from Cementos Selva’s operations,
information submitted to and approved by the corresponding authorities, and public information in organizations specialized in the cement
industry. The list of sources of information is presented in Chapter 24 of this report.
| 2.5. | Details
of QP Personal Inspection |
The
QP’s who developed this document visited the Tioyacu quarry and the Rioja plant as part of their activities for 2023.
Table
7 QP’s field visit
| Item | |
First
and Last Names | |
Job
Position | |
Profession | |
Field
visit |
| 1 | |
Henry
Vargas | |
Environmental
Coordinator | |
Environmental
Engineer | |
Mr. Vargas
has visited the Tioyacu quarry and Rioja plant multiple times. The last visit to the Tioyacu quarry and Rioja Plant was in October
2023. During this visit, Mr. Vargas inspected the environmental monitoring points, solid waste areas, raw material warehouse, and
the administrative area of the Pacasmayo plant and Tembladera quarry to verify the environmental controls. |
| | |
| |
| |
| |
|
| 2 | |
Jhonson
Rodríguez | |
Senior
Geologist | |
Geological
Engineer | |
Mr. Rodríguez has
regularly visited the Tioyacu quarry and Rioja plant, most recently in November 2022. He visited core facilities and discussed grade
control, geological mapping, exploration and delineation drill practices, diamond drill core logging, quality assurance, quality
control (QA/QC), and laboratories. During 2023, he coordinated with operational staff about the items above. |
| | |
| |
| |
| |
|
| 3 | |
Marco
Alarcon | |
Quarry’s
Superintendent | |
Mining
Engineering | |
Rioja plant and Tioyacu
quarry, all year as part of his duties. |
| | |
| |
| |
| |
|
| 4 | |
Jason
Gamio | |
Chief
of planning and evaluation of resources and reserves | |
Geological
Engineer | |
Mr. Gamio has regularly
visited the Tioyacu quarry and Rioja plant, most recently in November 2022, visiting core facilities, discussing grade control, geological
mapping, exploration, and delineation drill practices, diamond drill core logging, quality assurance, and quality control (QA/QC),
raw material storage and mineral reserve estimation practices. |
| 2.6. | Previously
Filed Technical Report Summary |
This
Technical Report Summary (TRS) updates the previously filed technical report summary for the property. The previously filed TRS is the
“Technical Report Summary (TRS), Tioyacu Quarry and Rioja Cement Plant 20-F 229.601”, which was filed as Exhibit 96.3 of
the CPSAA’s Annual Report on Form 20-F filed with the SEC on April 28, 2022 (File No. 001-35401).
The
quarry is located in Elías Soplin Vargas District, Rioja Province, San Martin Region close to the Rioja plant.
The
Peruvian State granted the mining right to Cementos Selva S.A.C. to carry out exploration and production activities that allow non-metallic
minerals found in the subsurface through mining concessions.
The
mining rights registered with the authority, Instituto Geológico Minero y Metalúrgico (INGEMMET) are as follows Moyobamba
98, Pajonal 2, Rioja 1, Rioja 2, Rioja 3, Rioja 5, Rioja 6, Rioja 7, Rioja 8, Rioja 9, Calizas Tioyacu, Arcillas el Pajonal, Pajonal
3 and Pajonal 4. The area of the mining property is 9,600 hectares.
The
mining rights (the mining concession title) are granted by INGEMMET of the Energy and Mines Sector through a Presidential Resolution.
It is determined to include the mining rights in the Rioja Economic-Administrative Unit (UEA).
On
March 15, 2016, by Presidential Resolution No. 0140-2016-INGEMMET/PCD/PM, the competent authority granted to Cementos Selva S.A.C the
Riojaa Economic-Administrative Unit (UEA), with code No. 01-00005-04-U of Cementos Selva S.A.C. These mining rights included 15 mining
concessions.
Table
9 UEA Rioja Concessions
| N° |
Code |
Name |
Hectares |
Material |
| 1 |
10912695 |
ARCILLAS EL PAJONAL |
200 |
Non Metallic |
| 2 |
10912495 |
CALIZAS TIOYACU |
400 |
Non Metallic |
| 3 |
10062498 |
MOYOBAMBA 98 |
100 |
Non Metallic |
| 4 |
10133998 |
PAJONAL 2 |
400 |
Non Metallic |
| 5 |
10073705 |
PAJONAL 3 |
800 |
Non Metallic |
| 6 |
10073605 |
PAJONAL 4 |
300 |
Non Metallic |
| 7 |
10157996 |
RIOJA 1 |
1,000 |
Non Metallic |
| 8 |
10158096 |
RIOJA 2 |
1,000 |
Non Metallic |
| 9 |
10158196 |
RIOJA 3 |
1,000 |
Non Metallic |
| 10 |
10158296 |
RIOJA 4 |
800 |
Non Metallic |
| 11 |
10158396 |
RIOJA 5 |
1,000 |
Non Metallic |
| 12 |
10158496 |
RIOJA 6 |
400 |
Non Metallic |
| 13 |
10158596 |
RIOJA 7 |
1,000 |
Non Metallic |
| 14 |
10158696 |
RIOJA 8 |
1,000 |
Non Metallic |
| 15 |
10158796 |
RIOJA 9 |
1,000 |
Non Metallic |
On
February 09, 2022, by Report No. 1003-2022-INGEMMET/DCM/UTM, the competent authority has notified the exclusion of the Rioja 4 concession
with code 10158296 from the Rioja UEA with code No. 01-00005-04-U.
The
UEA Rioja is conformed by the following concessions:
Table
10 UEA Rioja Concessions
| N° |
Code |
Name |
Hectares |
Material |
| 1 |
10912695 |
ARCILLAS EL PAJONAL |
200 |
Non Metallic |
| 2 |
10912495 |
CALIZAS TIOYACU |
400 |
Non Metallic |
| 3 |
10062498 |
MOYOBAMBA 98 |
100 |
Non Metallic |
| 4 |
10133998 |
PAJONAL 2 |
400 |
Non Metallic |
| 5 |
10073705 |
PAJONAL 3 |
800 |
Non Metallic |
| 6 |
10073605 |
PAJONAL 4 |
300 |
Non Metallic |
| 7 |
10157996 |
RIOJA 1 |
1,000 |
Non Metallic |
| 8 |
10158096 |
RIOJA 2 |
1,000 |
Non Metallic |
| 9 |
10158196 |
RIOJA 3 |
1,000 |
Non Metallic |
| 10 |
10158396 |
RIOJA 5 |
1,000 |
Non Metallic |
| 11 |
10158496 |
RIOJA 6 |
400 |
Non Metallic |
| 12 |
10158596 |
RIOJA 7 |
1,000 |
Non Metallic |
| 13 |
10158696 |
RIOJA 8 |
1,000 |
Non Metallic |
| 14 |
10158796 |
RIOJA 9 |
1,000 |
Non Metallic |
Table
11 shows the UTM central coordinates of the Rioja Economic Administrative Unit (UEA).
Table
11 Central coordinates of the UEA Rioja property
| North | |
East | | |
Radius | | |
Zone | |
| 9,340,000 | |
| 246,000 | | |
| 20,000 | | |
| 18 | |
In
accordance with this, the Rioja UEA includes fourteen (14) non-metallic mining rights with an extension of 9,600.00 hectares, in favor
of Cementos Selva S.A.C., owner of said rights; located in the Districts of Rioja / Awajun / Elias Soplin Vargas / Nueva Cajamarca /
Posic, Province of Rioja and department of San Martin.
Cementos
Selva S.A.C. complies annually with the payments for the rights to the UEA Rioja concessions.
These
payments must be made from the first business day of January to June 30 of each year, CSSAC provides the Financial Entities in charge
of receiving the payments with the SINGLE CODE (see Table 10) of its mining rights, to comply with its obligation.
In
the case of Rioja concessions, the payment is equivalent to US$3 per hectare.
Likewise,
Cementos Selva S.A.C. pays royalties to the State as established by the Authority in Law N° 28258 and its amendment N° 29788.
Figure
4 UEA Rioja map
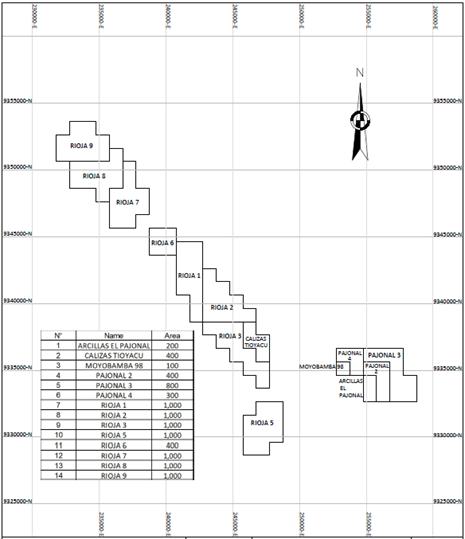
The
Rioja plant is located in the district of Elías Soplin Vargas, province of Rioja, San Martin region; on land owned by the Company
that occupies a total area of 28.16 hectares, duly registered in File No. 4273, Electronic Record No. 05004085 of the Land Registry of
Moyobamba, Registry Zone No. III, Moyobamba Headquarters.
Table
11 shows the UTM coordinate of the centroid of the Rioja plant.
Table
11 Central coordinates of the Rioja plant
| North | |
East | | |
Radius | | |
Zone | |
| 248338.19 | |
| 9336658.96 | | |
| 200.00 | | |
| 18 | |
According
to the Organic Law of Municipalities (Law 27972), Cementos Selva S.A.C. must pay the annual property tax for the property described above.
Figure
4 Rioja plant map
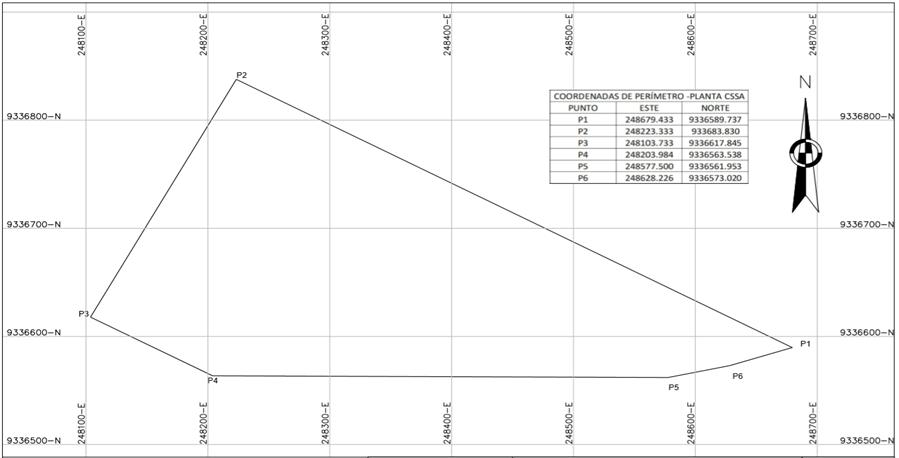
| 4. | Accesibility,
climate, local resources, infrastructure and physiography |
| 4.1. | Tioyacu
quarry and Rioja plant |
Cementos
Selva S.A.C. is an industrial company dedicated to the production of cement. Its Tioyacu quarry provides limestone as raw material for
cement production.
The
Tioyacu quarry is geographically located in the district of Elías Soplín Vargas, province of Rioja, department of San Martín,
approximately 14.46 km from the city of Rioja.
Topography
The
study area consists mainly of hillsides with slopes ranging from 25% to more than 75%, terraces of alluvial origin, with slopes of less
than 8% and slightly undulating, and small hillsides. The Tioyacu quarry has an average altitude of 900 meters above sea level.
Vegetation
The
vegetation is evergreen with lianas and vines, many of which are covered by epiphytes of the Bromeliaceae family. The forests present
a very heterogeneous flora composition.
Access
By
air is from Lima – Tarapoto in a 1.5 hour flight, and by land from Tarapoto to Tioyacu quarry for a journey of 3 hours.
Access
to the Tioyacu quarry is via the Fernando Belaunde Terry highway, which crosses the district of Elías Soplin Vargas from south
to north.
Climate
The
climate in this Amazon region in northern Peru is mainly influenced by the following factors: the Intertropical Convergence Zone (ITCZ),
the presence of the Eastern Cordillera of the Andes and the Extratropical Fronts.
Physiography
The
study area has landforms that have been generally classified as large plains landscape and mountainous landscape (mountain slopes).
Local
Resources
The
Tioyacu quarry is operated by Cementos Selva S.A.C personnel. The quarry is located 13.7 kilometers from the town of Rioja, which has
the resources of a city.
Power
is supplied by the 60 kV Rioja - Nueva Cajamarca transmission line owned by Electro Oriente.
The
company has a water use license for industrial purposes, with its water catchment point located in the Tioyacu River. The National Water
Authority issued the authorization R.A. Nº 100-2010-ANA-ALA ALTOMAYO.
On
February 6, 1998, the public auction of the Rioja plant was held, and Consorcio Pacasmayo was awarded the contract. To comply with the
terms of the auction, Consorcio incorporated and subsequently transferred ownership of the plant to Cementos Rioja S.A. The award mentioned
above included, by public deed dated April 8, 1998, the non-metallic mining concession “Calizas Tioyacu.” The Tioyacu quarry
began operations as Cementos Rioja S.A. in 2000.
At
the end of 1982 and beginning of 1983 a campaign of 460 meters of drilling was carried out in 05 drill holes located in the eastern flank
of the “Tioyacu” limestone-dolomitic massif executed by Andes Diamantina S.R.L. The objective was to determine the feasibility
of a new portland cement plant in the department of San Martin. The exploration study identified limestone suitable for cement manufacturing.
In
2015, Cementos Selva S.A.C. commissioned Geosym Consultores S.A.C. to carry out prospecting work through drilling. A total of 06 drill
holes were drilled, conveniently located and distributed along the Tioyacu quarry (02 holes in the southern sector, 03 holes in the central
área, and 01 hole in the northern sector) to geologically evaluate the deposit and know its characteristics at depth.
These
06 drillings together with blast holes information and geological evaluation work allowed Cementos Pacasmayo to update the inventory
of Mineral Resources and Reserves.
From
2018 to the present, Cementos Selva S.A.C., with the help and support of mining software such as Leapfrog and Minesight has updated its
Resources and Reserves at the Tioyacu quarry.
On
March 1, 2022, Cementos Selva S.A. changed its corporate name to Cementos Selva S.A.C. (CSSAC).
From
October to November, 2023, the Rioja plant stop its operations because there was general power outage in the area. During 2023, Cementos
Selva performed a drilling campaign in the Tioyacu quarry in order to confirm Reserves.
| 6. | Geological
setting, mineralization, and deposit |
The
strata of the district of Elias Soplin Vargas, province of Rioja, San Martin region consists of Paleozoic/Mesozoic Age sedimentary strata
of the Mitu Group, Pucara Group, Chambara Formation, Celendín Formation, Aramachay Formation, Condorsinga Formation, Ipururo Formation,
and Quaternary Deposits.
Figure
6 Regional stratigraphic column
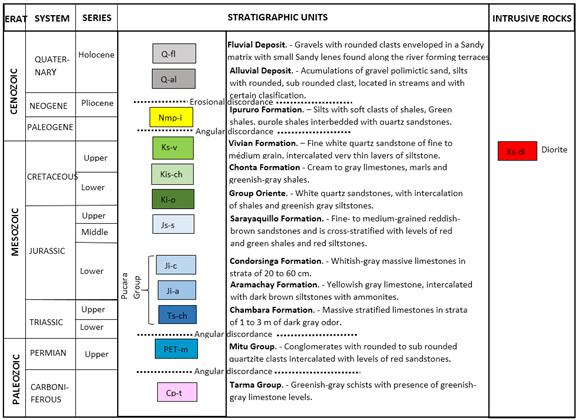
A
lithological series of continental marine facies of limestones, marls, and dolomites have been identified in the quarry area. The classification
of carbonate rocks based on the percentage of magnesium carbonate and clays, proposed by J.R.V Brooks (1896) and modified by J.A. Martinez-Alvarez,
was used.
In
the Tioyacu quarry, ten types of rocks were classified, corresponding to a sequence of limestones, magnesian limestones, dolomitic limestones,
dolomitic marly limestones, marly limestones, marls, calcareous marls, clayey marls, dolomites, and calcareous dolomites. Overlying this
formation are recent Quaternary deposits, consisting mainly of alluvial deposits comprised of colluvium and terraces with blocks and
gravels in a sandy clay matrix.
Figure
7 Local stratigraphic column of the Tioyacu quarry.
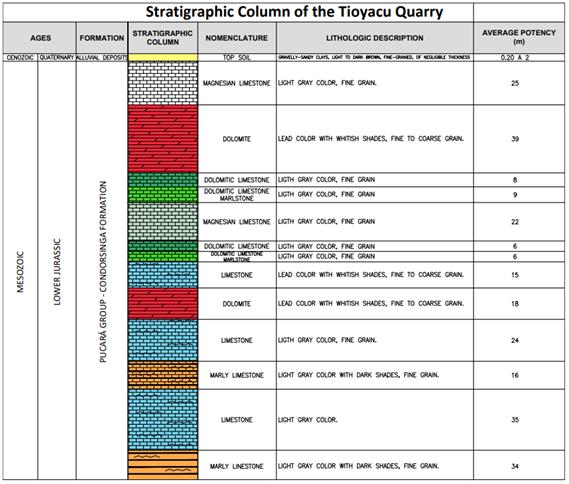
| 6.3. | Characteristics
of the deposit |
Table
13 shows the main characteristics of the deposit.
Table
13 Characteristics of Tioyacu quarry
| Quarry |
Average Width (m) |
Total Length (m) |
Thickness (m) |
Average depth (m) |
Continuity |
| Top Elevation |
Lower elevation |
| Tioyacu |
450 |
1200 |
150 |
1000 |
820 |
It is a sedimentary limestone deposit whose continuity is controlled longitudinally by the limestone outcrop, laterally by fault structures and at depth by the water table. |
Figure
8 Geological Section of the Tioyacu quarry
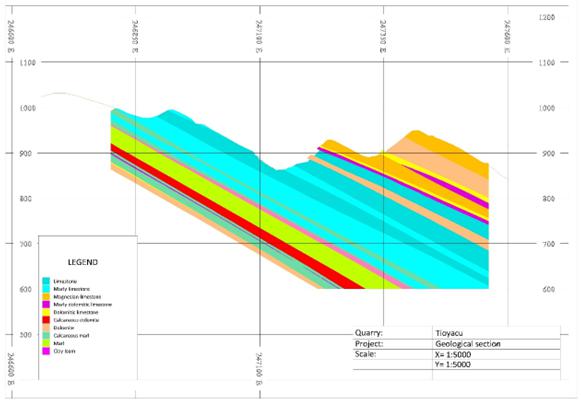
Cementos
Selva’s exploration activities at the Tioyacu quarry property involve drilling to characterize the geology adequately.
Table
14 Drilling campaigns in Tioyacu quarry
| Drilling Campaign |
Date |
N° of holes |
Holes dimeter |
Type of sampling |
Objective |
| 1 |
1983 |
5 |
HQ |
Core sampling |
Exploration |
| 2 |
2015 |
6 |
HQ |
Core sampling |
Exploration |
| 3 |
2023 |
6 |
HQ |
Core sampling |
Reserves Confirmation |
During
2023, Cementos Selva did not conduct hydrogeological studies. The last hydrogeological studies were conducted during 2015 and the information
was presented in the previously filed TRS titled “Technical Report Summary (TRS), Tioyacu Quarry and Rioja Cement Plant 20-F 229.601”,
which was filed as Exhibit 96.3 of the CPSAA’s Annual Report on Form 20-F filed with the SEC on April 28, 2022 (File No. 001-35401).
As
stated in the previous TRS, Cementos Pacasmayo hired Geosym Consultores S.A.C (2015) to developed the investigations through 04 hydrogeological
borings with piezometers, 19 Lefranc and Lugeon permeability tests were executed, 01 Slug Test, and 02 Air Lift tests, physical-chemical
parameter readings, gauging with use of current meter and groundwater sampling. The hydrogeological study included the evaluation of
04 piezometers. Geosym Consultores S.A.C concluded that the groundwater is above the current topographic elevation.
As
per the previous TRS, CPSAA hired Consultora Minera Minconsult S.R.L to define the hydrogeological characteristics of the quarry.
During
2023, Cementos Pacasmayo did not conduct geotechnical studies. The last geotechnical studies were conducted during 2015 and the information
was presented in the previously filed TRS titled “Technical Report Summary (TRS), Tioyacu Quarry and Rioja Cement Plant 20-F 229.601”,
which was filed as Exhibit 96.3 of the CPSAA’s Annual Report on Form 20-F filed with the SEC on April 28, 2022 (File No. 001-35401).
As
per the previously filed TRS, the geotechnical studies concluded, based on the geotechnical test work that the current slopes at the
Tioyacu quarry are stable for static and pseudo-static loading conditions, with safety factors above the minimum recommended for operating
conditions. The studies also recommended geotechnical design criteria including a single bench height between 4 and 6 m, inter-ramp angles
between 35° and 44°. The recommended bank angles and bench angles are 65°.
| 8. | Sample
preparation, analysis, and security |
This
Chapter describes the preparation, analysis and security of the samples used for the geology, quarry and cement plant operations.
Cementos
Selva S.A.C. has implemented international standards in all its operations such as quarries and plants. The ISO 9001 standard has been
implemented and certified since 2015. The certification is renewed annually through an external audit.
The
SSOMASIG deparment (Security, Occupational Health, Environment and Management Systems), is part of the team that determines and gives
the necessary support for the maintenance of the ISO 9001 and the scope is in all the company’s activities.
The
Geology deparment has protocols for the activities of sample preparation methods, quality control procedues, security and other activities.
| 8.1.1. | Preparation
of samples, procedures, assays and laboratories |
Samples
obtained from the drill holes are placed in holders to be duly coded, cut, bagged and sent to the laboratory at the Rioja plant and are
occasionally sent to an external laboratory following the company’s procedures.
Certimin
S.A. is used as an external laboratory for chemical analysis. Certimin S.A. is a Peruvian laboratory that is certified in ISO 9001, ISO
14001, ISO 45001, NTP-ISO/IEC 17025 Accreditation, and has a membership in ASTM. This laboratory has modern facilities for the development
of mining services associated with the cement industry and technical support in the geochemical field for national and international
companies.
For
the limestone samples, the laboratory analyses evaluate CaO, MgO, Al2O3, SiO2, Fe2O3,
SO3 and Cl. Once received in the laboratory, the properties of the limestone to be used in cement production are analyzed.
| 8.1.2. | Quality
Assurance Actions |
Cementos
Selva S.A.C has developed quality assurance actions, which guarantees the accuracy of the results in the sampling, in the preparation
and analysis of the samples.
Cementos
Selva S.A.C. has implemented QAQC protocols for the development of exploration and production activities in the Tioyacu quarry in order
to ensure the quality of the information used in the estimation of Resources and Reserves.
Based
on the information and samples from the 2015 drilling campaign were re-analyzed to re-evaluate the deposit. As part of the procedure,
twin and duplicate samples were inserted, representing 5.16% and 10.32% as insertion ratio. Calcium (CaO), which is the main component
of the limestone for cement production, was analyzed. The quality control (CaO) results showed that the Twin samples had an error of
3.08%, which is within the acceptable range (30%). The percentage of good samples was 100%. On the other hand, the quality control results
of the duplicate samples showed an error of 0.94% (Coarse Duplicate) and 1.72% (Fine Duplicate), which is below the allowable error of
20%. The percentage of acceptable samples was 100%.
The
quality plan implemented by Cementos Selva for the quarries includes the insertion of blanks, duplicates and standards, in order to control
the precision, accuracy and contamination in the samples.
Table
15 Quality Plan of the Tioyacu quarry
| Blanks |
Duplicates |
Standards |
Remark |
| 1
control sample for each batch of 20 samples. |
2
control sample for each batch of 20 samples. |
1
control sample for each batch of 20 samples. |
Cementos
Pacasmayo protocol ¨OM-GL-PRT-0023-R0¨. |
Cementos
Selva S.A.C. has implemented QAQC protocols for the development of exploration and production activities in the Tioyacu quarry in order
to ensure the quality of the information that allows the estimation of Resources and Reserves.
Cementos
Selva S.A.C. has a specific area for the storage of the samples obtained during the drilling campaigns; the samples are properly stored
in order to preserve their quality.
The
necessary materials for storage and transport of the samples were provided. Sampling cards were also implemented with information on
the name of the project, name of the borehole to be sampled, date of sampling, sampling interval, sampling management, sampling and type
of sample or control sample.
All
samples were labeled and a photographic record is available. The photographic record of each sampling bag is made together with the weighing
of the sample.
Cementos
Selva S.A.C has implemented actions to ensure the physical security of samples, data and associated records; the traceability of the
sample from its generation to its analysis and subsequent conservation of rejects and pulps. At the Tioyacu quarry, core samples are
duly stored in the coreshack.
| 8.1.6. | Qualified
person’s opinion on quarry QaQc |
In
the authors’ opinion, Cementos Selva S.A.C. has been complying with the international standards of ISO-9001 since 2015 and implemented
Quality Assurance and Quality Control (QAQC). Cementos Selva S.A.C. has used a QAQC check program comprising blank, standard and duplicate
samples. The QAQC shipping rate used complies with accepted industry standards for insertion rates, as well as the actual sample storage
areas and procedures are consistent with industry standards.
Protocols
in the different exploration and production processes are strictly complied with. There is information on sample preparation methods,
quality control measures, sample security and these results are accurate and free of significant error. The information in this report
is adequate for use in the construction of the Geological Model, Resource estimation and Reserve estimation.
| 8.2.1. | Sample
preparation, procedures, assays and laboratories |
Cementos
Selva S.A.C. has a quality plan for each of its operations, part of the corporate quality system.
Within
the quality plan (S-CC-D-05 - Quality Plan), samples of raw materials such as limestone, clay, iron and coal are evaluated in the Rioja
plant laboratory, where they are analyzed to determine the chemical composition of each material for the production of cement.
The
procedures applied are wet chemical analysis of clinker and cement, wet physical and chemical analysis of crude and raw materials, general
XRF procedures, physical-chemical analysis for coal samples, and physical tests for cements based on ASTM, NTP (Peruvian Technical Standard),
and ISO standards.
| 8.2.1.1. | Raw
materials sample preparation |
For
preparation of samples, staff follow the sample collection and preparation procedure, which consists of primary and secondary crushing,
and reduction of the sample size by coning and quartering followed by pulverizing the sample in a ring mill.
| 8.2.1.2. | Laboratory
Analysis |
The
laboratory at Rioja plant has implemented the ISO 9001 standard; also, it has calibrated equipment, with a calibration and maintenance
program established by the laboratory area. The main equipments in the laboratory at Rioja plant are the XRF fluorescence equipment and
the compressive strength press, which are maintained annually and have inter-daily verification.
The
tests for air content, fineness, autoclave expansion, compressive strength and setting time, and Vicat are made for all types of cements.
The autoclave expansion, 14-day mortar expansion, SO3, MgO, loss on ignition, insoluble residue, and C3A and 2 C3A+ C4AF tests
only apply to some specific cements.
| 8.2.2. | Quality
Assurance Actions |
The
sampling plan, frecuency of tests and data verification applies to the processes of reception of raw materials, crushing of materials,
drying of raw materials, grinding of raw materials, clinkerization, grinding of cement and packaging of cement.
Table
16 Tests and frequency for each stage of the process
| Stage |
Tests |
Frequency |
| Reception of raw materials |
X-ray Chemical Analysis, Moisture, Sulfur / Total Moisture, Ash, Calorific power, Chemical Analysis by XRF, R.I. (weekly). |
Daily 1 time. |
| Crushing raw materials |
Chemical Analysis by XRF, Moisture (every 2 hours), P.F (8 hours composite). |
Every hour. |
| Drying raw materials |
Moisture |
Every 2 hours. |
| Crude grinding |
XRF Chemical Analysis, Moisture (Every 2 hours), P.F , RM-170. |
Each 2 hour up to 8 hours. |
| Clinkerization |
Chemical Analysis by XRF, P.F, f-CaO / Liter Weight. |
Every 2 hours. |
| Cement grinding |
Chemical Analysis by XRF, P.F, f-CaO, Blaine, R.I., RM 325, RM 450, Setting time, Autoclave Expansion, Compressive Strength. |
Every 2 hours up to 1 time per Silo. |
| Cement packing |
Chemical Analysis by FRX, P.F, f-CaO, R.I. (in type I) / Blaine, RM 325, Setting, Autoclave Expansion, Compressive Strength, Air Content, Density and Expansion of the Mortar Bar (only in type GU). |
1 time per day per type of cement. |
The
quality plan implemented by Cementos Selva for the cement plants includes the insertion of blanks, duplicates and standards, in order
to control the precision, accuracy and pollution in the samples.
Table
17 Quality Plan of Rioja plant
| Blanks |
Duplicate |
Standard |
Comment |
| 50 |
250 |
11
for cement (NIST)
01
for coal (LeCo) |
Blanks
only apply when spot-checks are performed by Classical methods |
The
Rioja plant has a QAQC plan, which includes the items mentioned in Table 17. Likewise, the results for the period 2023 show 50 blank
samples, 250 duplicate samples, and 16 standard samples. They are below the error limits.
As
part of the quality plan, the laboratory evaluates its performance through external interlaboratory; in this sense, the laboratory participates
in 02 interlaboratory:
| ● | CCRL:
Compliance greater than 97% in qualification Z Score > 4 |
| ● | XAMTEC:
Qualification greater than 99%. |
Likewise,
quality actions includes control of finished products, control on non-conforming products, validation of silos, density analysis, QaQc
program, quality plan and quality control parameters for raw materials received at the Rioja Plant.
Cementos
Selva S.A.C. has implemented QaQc protocols for the development of cement production activities at the Rioja plant, in order to ensure
the quality of the information that allows the estimation of the Resources and Reserves of the deposit.
Sample
preparation methods are; Sampling and preparation of crude, clinker, and cement samples, Sampling and preparation of raw material samples,
and Preparation of coal samples for laboratory analysis.
The
testing procedures are wet chemical analysis of clinker and cement, general XRF procedures, wet physical and chemical analysis of crude
and raw materials, physical-chemical analysis for coal samples, physical tests for cements and quality plan.
Likewise,
the control parameters are for raw material input, crude production, clinker production, cement grinding, sampling plan, frequency of
tests for raw materials, and sampling plan and frequency of tests for cement.
| 8.2.4. | Qualified
Person’s Opinion on cement plant QaQc |
Cementos
Selva S.A.C. has a Quality Assurance unit, which ensures compliance with the requirements for finished products specified in the technical
product standards, based on Peruvian technical standards and traceable to the American Society for Testing and Materials (ASTM).
In
this sense, in the author’s opinion, the quality assurance system at the Rioja plant, which includes preparation methods, procedures,
analysis and security, complies with the best practices in the industry, thus ensuring that the final customer has confidence in the
quality level of the products marketed by Cementos Selva
This
Chapter shows the data verification activities for the geology, quarry and cement plant.
| 9.1.1. | Data
Verification procedure |
CSSA
has a unit specialized in the compilation, verification and standardization of information for the geological database. Its main function
is the validation of the data to be used in the estimation of Mineral Resources and Reserves. For the proper management of the information,
internal protocols have been implemented which are subject to internal audits.
The
Data collection applies to exploration activities. For diamond drilling, the process flow for planning and execution of drillings, survey
methods for reporting drill collars and ddh / verification of the quality of information and recovery process of the core information.
In addition, for geological sampling activities, the processes flowsheet, validation and consistency of sample information, sample preparation
and testing, density, registration process and digital photographic storage are used.
| 9.1.3. | Management
and Validation of Database |
The
stages for management and validation of database are the recovery, processing and storage of the database. Which includes database development
process flow, information standardization and integration process, information storage strategy, appropriate database technology, structure
and practicality of the database system that allows a fast and flexible access and input of information, and validation of chemical results,
which includes the QaQc report.
The
consistency between the database records and the original registry was verified by the QPs 2023. No differences were detected between
the database and the log files. A digital copy of all records is kept as pdf files. Digital certificates support the chemical analysis
data.
The
collection of the information considered the following: drill collars, survey, lithology, samples and assays.
The
geology department provided copies of all Tioyacu quarry drilling records, including Excel spreadsheets, driller’s logs, field
geologist’s logs, quality results sheets from the Rioja laboratory, collar sheets, and survey sheets. Data for each hole was individually
checked in the database to confirm accuracy.
The
reviews included:
| ● | Drillhole
lithology database comparison to geophysical logs |
| ● | Sample
quality database comparison to quality certificates |
| ● | Core
photographic record. |
Typical
errors may impact reserve and resource estimation related to discrepancies in original data entry. These errors may include:
| ● | Incorrect
drillhole coordinates (including elevation). |
| ● | Mislabeled
drillhole lithology. |
| ● | Unnoticed
erroneous quality analyses where duplicate analyses were not requested. |
| ● | Unrecorded
drillhole core loss. |
Data
validation follows the field operational procedures that collect information from the source (collar, survey, lithology, samples, and
assays).
Finally,
when the information is transmitted and uploaded to the mining software for geological modeling and estimation, it is double-checked
to eliminate any additional errors.
| 9.1.6. | Qualified
Person’s Opinion Geologic Data |
The
qualified persons followed the defined processes for information flows to support Resource and Reserve estimation. The qualified person
followed the same process as a means of verifying and validating the geologic data. They found that the validated information is congruent
in the interpretations of the same, with which the fundamental base geological models were generated for the estimation of the Resources.
No
findings have been found that could invalidate the estimation of the Resources and Reserves of the unit.
The
Quality Control Plan contemplates the following aspects: PDCA cycle, customer, person in charge, activities, risks, control methods,
monitoring, measurement, analysis, evaluation and documentary evidence.
The
PDCA cycle is:
| - | Plan;
during this stage the following activities are considered: determination of characteristics
of raw materials, product in process and finished product, elaboration of control and matrices
parameters and determination of activities and results assurance program. |
| - | Do;
during this stage the following activities are considered: verification and compliance with
the requirements and matrices, sampling and preparation. |
| - | Check:
during this stage the following activities are considered: chemical analysis by XRF, chemical
analysis, physical analyses, recording of results, taking action on non-conformities. |
| - | Act,
during this stage the following activity is considered, acting to improve. |
| - | The
Quality Assurance Plan is applied to the following customers: production, quarry, provisions
chain and external customer. |
| 9.2.1. | Data
verification procedures |
The
XRF analysis, chemical analysis and physical analysis are made to verify the results of the samples, as part of the Quality Control Plan.
The
data resulting from these three types of analysis are recorded and evaluated in order to determine whether or not they comply with the
technical specifications.
Data
verification procedures include internal audits, check lists, statistical tables, reports, validation of data, certificates, interlaboratory
test reports and compliance with quality protocols.
Cementos
Pacasmayo S.A.A. (Included Cementos Selva S.A.C.) through its quality assurance and control area participates in evaluations with international
laboratories such as CCRL/ASTM (Concrete and Cement Reference Laboratory), which is an international reference laboratory for construction
materials, and Xamtec of Colombia, an international interlaboratory, in order to report reliable data.
The
Quality Control laboratories endorse their analysis methods by participating in interlaboratory analysis programs, which compare the
results with national and foreign laboratories. The methods of analysis compared are X-ray fluorescence (XRF) and the physical cement
tests, which are the methods used to control cement quality. In all the results of these interlaboratory programs, the companies always
obtain the best results for each test.
| 9.2.3. | Qualified
Person’s Opinion on cement plant |
In
the author’s opinion, the methodologies used for collection and processing data at the cement plant are accurate and free of significant
errors. The information can be used for model construction and estimates for cement production. Considering that the analyses of the
main chemical components and physical properties of the raw materials and final products are completed by external laboratories, the
quality of the information is adequate for preparing Mineral Resource and Reserve estimates.
| 10. | Mineral
processing and metallurgical testing |
| 10.1. | Nature
of Testing Program |
Cementos
Pacasmayo S.A.A. (included Cementos Selva S.A.C) has Quality Assurance, Research and Development department. The objective of these department
is to develop, evaluate and research procedures for the development of products at laboratory scale and their scaling up to industrial
scale. Another objective is to identify evaluations of fuel substitutes to reduce energy costs.
Cementos
Pacasmayo S.A.A has also implemented their own procedures for the preparation, review, issuance and control of test reports associated
with cement production.
The
laboratory at Pacasmayo plant has implemented the ISO 9001 standard since 2015. The Research and Development laboratory located at the
Pacasmayo plant is responsible for technical aspects of cement plant and quarriy operations (including Tioyacu quarry and Rioja Plant).
Cementos
Pacasmayo applies the procedures:
| - | P-ID-P-04
Preparation of raw materials. |
| - | P-ID-P-05
Sampling of cement and raw materials. |
| - | P-ID-P-13
Input, storage and disposal of samples. |
A
permanent control is carried out with other laboratories to give greater reliability to the results. Likewise, interlaboratory reports
are issued with external laboratories such as CCRL (Cement and Concrete Reference Laboratory), which is a reference laboratory for construction
materials at international level, and Xamtec from Colombia, an internal interlaboratory.
Cementos
Pacasmayo S.A.A. has also obtained the certification that certifies compliance with Supreme Decree No. 001-2022, which validates compliance
with the Technical Regulation on Hydraulic Cement used in Buildings and General Construction.
Cementos
Pacasmayo SAA opted for the highest and most rigorous certification model (Type 5) granted by ICONTEC, which has extensive experience
in the certification of products and services.
A
significant percentage of R&D activities are focused on the evaluation of alternative fuels such as rice husks. Laboratory tests
are developed always seeking to generate an operational benefit for the company. Based on this work, the laboratory has determined (and
confirmed with production estimates) that 1 tonne of limestone yields 0.77 tonnes of clinker and the clinker/cement factor with
additions is 0.72.
The
R&D Laboratory located at the Pacasmayo plant provides analysis and research services to all of the company’s cement plants.
| 10.2. | Cement
Manufacturing Test Results |
To
determine the cement design, which includes the clinker/cement factor, CPSAA uses the tests outlined in national technical standards
such as NTP 334.009, NTP 334.090, and NTP 334.082. The cement design is modified when some of the chemical or physical requirements present
a trend that could lead to non-compliance (non-conforming product). For the clinker/cement factor, priority is given to the compressive
strength test at all ages (1, 3, 7, and 28 days). If the compressive strength shows a negative trend, even modifying the operating variables
to correct it, the clinker/cement factor is modified.
At
the Pacasmayo plant, the studies conducted in the Research and Development laboratory and the Quality Control units include the substitution
of fossil fuels for rice husks at the Rioja plant.
The
main objective of the substitution of fossil fuels is the reduction of CO2 or greenhouse gas emissions.
In
2023, CSSAC used 4,645 t of Alternative Fuel (rice husk measured as coal equivalent) in the Rioja plant. This result represented 10.82%
of the total fuels used by the plant for cement production and a reduction in emissions of 12,194 t of CO2.
10.3.
Qualified Person’s Opinion of the Adequacy of the Test Data
The
Research Laboratory issues technical reports following the criteria of international standards for the operations area, identifying the
correct data, defining the requirements that may vary but include accuracy, consistency, and validity through an evaluation of the data
and implementation of solutions, and finally, validating the adequacy of the data.
The
operations area then evaluates the convenience of industrially implementing the tests and validating what is reported at the laboratory
level.The reliability in the integrity and adequacy of The data reported by the area is based not only on the technical competencies
of the collaborators but also on the high scores obtained in the external interlaboratory of recognized entities such as XAMTEC and CCRL
in their different programs.
| 11. | Mineral
Resources estimates |
The
geological model was developed and structured using Leapfrog software; the solids were generated considering the quality of the lithology
based on the results of the analysis of the samples taken.
Because
the deposit is a sedimentary one, the qualified persons interpreted the geological model with the help of a set of regularly-spaced sections
parallel to and perpendicular to strike of the deposit shape.
According
to the lithological characteristics and descriptions, ten lithological horizons were recognized.
The
lithological units have been grouped by assigning a numerical code in the mining software to simplify the modeling. Table 18 shows the
lithological units with their respective numerical codes.
Table
18 Lithologic units of the Tioyacu quarry geological model
| Lithologic
Units |
Lithology
Code |
| Limestone |
1 |
| Marly
limestone |
2 |
| Magnesian
limestone |
3 |
| Marly
dolomitic limestone |
4 |
| Dolomitic
limestone |
5 |
| Calcareous
dolomite |
7 |
| Dolomite |
6 |
| Calcareous
marl |
8 |
| Marl |
9 |
| Clay
loam |
10 |
The
main criteria for geological modeling is the quality, such as the content of oxides in limestones.
The
lithological criteria is based on the macroscopic physical characteristics of the limestone horizons and the percentage of essential
elements in its composition (oxides) that determine the quality of the limestones. Based on the quality and specifications of the cement
plant, the qualified persons used a cut off 51% of CaO.
Table
19 shows the referential cut-off of the oxides that determine the classification of the final limestone rock products.
Table
19 Rioja plant material restrictions
| |
|
Limestone
Type I |
| CaO
(%) |
Min. |
51.0 |
| Max. |
- |
| SiO2
(%) |
Min. |
- |
| Max. |
3.8 |
| MgO
(%) |
Min. |
- |
| Max. |
1.6 |
| K2O
(%) |
Min. |
- |
| Max. |
0.4 |
The
qualified persons built a block model based on the dimensions and spatial distribution of the deposits containing the material of economic
interest. Table 20 shows the characteristics of the model.
Table
20 Characteristics of the block model
| |
Minimum
(m) |
Maximum
(m) |
Size
(m) |
Number |
| X |
246,789 |
247,637 |
4 |
212 |
| Y |
9,335,804 |
9,337,080 |
4 |
319 |
| Z |
720 |
1048 |
4 |
82 |
A
total of 341 samples from 11 drill holes were used for resource estimation. Additionally, 7,855 blast hole control samples were used
to strengthen the variogram analysis of the primary variable CaO.
The
data is managed in a database, where it is extracted and then loaded and used in MineSight software.
For
the bulk density of the rocks, diamond drilling samples were collected at the Tioyacu quarry, from which the bulk densities were determined
by the wax method. The results of this determination and the bulk densities by lithological domain are shown in Table 21.
Table
21 Limestone density per horizon
| Lithology |
Density
(g/cm3) |
| Limestone |
2.71 |
| Marly
limestone |
2.73 |
| Magnesian
limestone |
2.69 |
| Marly
dolomitic limestone |
2.69 |
| Dolomitic
limestone |
2.73 |
| Calcareous
dolomite |
2.70 |
| Dolomite |
2.64 |
| Calcareous
marl |
2.61 |
| Marl |
2.62 |
| Clay
loam |
2.10 |
The
compositing was performed using control of the GEO Item (file 11 MS). In general, each geological unit is estimated from the information
of the composites belonging to that unit. The composites should not cross “hard” boundaries between different geological
units.
For
compositing, the QPs assumed each initial core section has uniform grades in order to composite the grade profile of each borehole. During
compositing, the goal was to preserve the original nature (variability) of the samples.
The
calculated values considered in the compositing were for CaO, MgO, SO3, SiO2, Fe2O3, Al2O3,
and K2O.
Composites
were made at different lengths to determine the optimum compositing length. The 4 m composite is the size that best fits the nature of
the original sample and so was used in resource estimation.
In
addition, the modeling considered the length of the composites based on an exact multiple of the block height, which coincided with the
bench height.
11.4. Basic statistics of the data (Assay
– Composites)
Tables
22 and 23 show the results of the basic statistics of the elements CaO, SiO2, MgO, SO3, K2O, Na2O,
and Cl for the original and composite data. The statistical analysis was done separately for each defined orebody (limestone horizon).
Tables
22 and 23 show the statistics of the limestone and marly limestone horizons as these are the main ones for the estimation of the Resources
and Reserves.
Table
22 Basic statistics of the limestone horizon data
| Components |
Origin |
Valid |
Rejected |
Minimum |
Maximum |
Mean |
Std.
Devn. |
Variance |
Co.
Of Vartiation |
| SiO2 |
Assay |
2,596 |
6 |
0.18 |
32.04 |
3.39 |
3.02 |
9.14 |
0.89 |
| Composite |
5,150 |
10 |
0.18 |
32.04 |
3.45 |
3.05 |
9.32 |
0.89 |
| Al2O3 |
Assay |
2,596 |
6 |
0.01 |
5.73 |
0.41 |
0.46 |
0.21 |
1.12 |
| Composite |
5,150 |
10 |
0.01 |
5.73 |
0.42 |
0.47 |
0.22 |
1.12 |
| CaO |
Assay |
2,601 |
1 |
30.49 |
55.38 |
51.84 |
2.22 |
4.94 |
0.04 |
| Composite |
5,160 |
0 |
30.49 |
55.38 |
51.79 |
2.24 |
5.01 |
0.04 |
| K2O |
Assay |
2,596 |
6 |
0.00 |
9.00 |
0.17 |
0.31 |
0.09 |
1.80 |
| Composite |
5,150 |
10 |
0.00 |
9.00 |
0.17 |
0.31 |
0.10 |
791.0 |
| MgO |
Assay |
2,596 |
6 |
0.07 |
10.21 |
1.18 |
0.54 |
0.29 |
0.46 |
| Composite |
5,150 |
10 |
0.07 |
10.21 |
1.20 |
0.54 |
0.29 |
0.45 |
Table
23 Basic statistics of the data of the marly limestone horizon.
| Components |
Origin |
Valid |
Rejected |
Minimum |
Maximum |
Mean |
Std.
Devn. |
Variance |
Co.
Of Vartiation |
| SiO2 |
Assay |
746 |
2 |
0.60 |
19.45 |
8.43 |
3.78 |
14.27 |
0.45 |
| Composite |
1,358 |
2 |
0.63 |
19.45 |
8.18 |
3.79 |
14.33 |
0.46 |
| Al2O3 |
Assay |
746 |
2 |
0.12 |
4.43 |
0.94 |
0.63 |
0.39 |
0.67 |
| Composite |
1,358 |
2 |
0.12 |
4.43 |
0.94 |
0.62 |
0.39 |
0.66 |
| CaO |
Assay |
746 |
2 |
37.67 |
54.18 |
48.55 |
2.67 |
7.15 |
0.06 |
| Composite |
1,358 |
2 |
37.67 |
54.18 |
48.67 |
2.70 |
7.29 |
0.06 |
| K2O |
Assay |
746 |
2 |
0.06 |
2.28 |
0.42 |
0.35 |
0.12 |
0.83 |
| Composite |
1,358 |
2 |
0.06 |
1.96 |
0.43 |
0.35 |
0.12 |
0.81 |
| MgO |
Assay |
746 |
2 |
0.25 |
6.30 |
0.82 |
0.39 |
0.15 |
0.47 |
| Composite |
1,358 |
2 |
0.25 |
6.30 |
0.82 |
0.39 |
0.15 |
0.47 |
Extreme
values are considered to be those analysis results that are not representative of the unit being studied and are defined in this work
to be those that are above the mean plus twice the standard deviation.
In
the analysis of the extreme values in the laboratory results for the calcareous lithologic units that are being estimated, no deviation
has been found, all the results are coherent and representative of the levels to which they correspond.
In
the variogram analysis of the composited data, each level corresponded to a body of economic interest at the Tioyacu quarry. From the
variogram analysis, it was concluded that acceptable experimental variograms could only be obtained in two lithologies due to the amount
of data.
The
QPs considered an experimental variogram to be acceptable if the number of pairs used to estimate the semi-variances are greater than
or equal to 200. The variogram modeling consisted of fitting the experimental variograms to valid variogram models in MineSight. Of these
models, the most representative was the spherical model, present in 85% of the structures, followed by the Gaussian model. Table 24 shows
the results of variogram modeling.
Table
24 Variogram modeling parameters
| Type
of Variogram Model |
Spherical |
| Nugget
effect |
0.87 |
| Total
Sill |
1.16 |
| Range |
82 |
The
Ordinary Kriging Interpolation (OK) method was used for the primary CaO variable, Inverse of the Distance (ID2) for the secondary variables,
and Nearest Neighbor (NN) for validations. Table 25 shows the main parameters used to determine the interpolations of the primary CaO
variable of the Limestone and Magnesian Limestone horizons.
| - | The
interpolations were performed in two consecutive passes. |
| - | The
first with a search radius of twice the variogram range. |
| - | The
second with a search radius equal to the range. |
During
interpolation, a mínimum of two and a maximum of 20 composites were used to estimate block qualities. Additionally, the QPs restricted
the interpolation to using a maximum of two composites from each drill hole in all the passes.
Table
25 Ordinary Kriging Estimation Parameters CaO
| Comment |
PASS
1 |
PASS
2 |
PASS
3 |
| Search
dis. Block on Model -X |
90 |
|
|
135 |
|
|
180 |
|
|
| Search
dis. Block on Model -Y |
90 |
|
|
135 |
|
|
180 |
|
|
| Search
dis. Block on Model -Z |
90 |
|
|
135 |
|
|
180 |
|
|
| Max
distance accept data |
90 |
|
|
135 |
|
|
180 |
|
|
| Min
# comps a Block |
4 |
|
|
3 |
|
|
2 |
|
|
| Max
# comps a Block |
10 |
|
|
20 |
|
|
20 |
|
|
| Max
# comps per hole |
2 |
|
|
2 |
|
|
1 |
|
|
| Variable
Model |
CA1 |
|
|
CA1 |
|
|
CA1 |
|
|
| Variable
comp |
CAO |
|
|
CAO |
|
|
CAO |
|
|
| Variable
pasada |
PSCA1 |
|
|
PSCA1 |
|
|
PSCA1 |
|
|
| Pasada |
PASS1 |
|
|
PASS2 |
|
|
PASS3 |
|
|
| Store
distance |
DICA1 |
|
|
DICA1 |
|
|
DICA1 |
|
|
| Store
max # comp |
NCCA1 |
|
|
NCCA1 |
|
|
NCCA1 |
|
|
| Store
max # drillholes |
NDCA1 |
|
|
NDCA1 |
|
|
NDCA1 |
|
|
| Store
krigeage variance |
SDCA1 |
|
|
SDCA1 |
|
|
SDCA1 |
|
|
| Model
type variogram |
SPH |
SPH |
SPH |
SPH |
SPH |
SPH |
SPH |
SPH |
SPH |
| Nugget
effect |
0.293 |
|
|
0.293 |
|
|
0.293 |
|
|
| Sill |
0.038 |
0.278 |
0.391 |
0.038 |
0.278 |
0.391 |
0.038 |
0.278 |
0.391 |
| Range
along major axis |
82 |
22 |
10 |
82 |
22 |
10 |
82 |
22 |
10 |
| Range
along minor axis |
82 |
22 |
10 |
82 |
22 |
10 |
82 |
22 |
10 |
| Range
along vertical axis |
16 |
6 |
2 |
16 |
6 |
2 |
16 |
6 |
2 |
| Direction
major axis |
10 |
38 |
82 |
10 |
38 |
82 |
10 |
38 |
82 |
| Plunge
mayor axis |
-4 |
-8 |
-16 |
-4 |
-8 |
-16 |
-4 |
-8 |
-16 |
| Dip |
25 |
46 |
82 |
25 |
46 |
82 |
25 |
46 |
82 |
| Distance
along major |
90 |
|
|
135 |
|
|
180 |
|
|
| Distance
along minor |
90 |
|
|
135 |
|
|
180 |
|
|
| Distance
along vert |
12 |
|
|
16 |
|
|
32 |
|
|
| ROT |
157.66 |
|
|
157.66 |
|
|
157.66 |
|
|
| DIPN |
-7.22 |
|
|
-7.22 |
|
|
-7.22 |
|
|
| DIPE |
32.29 |
|
|
32.29 |
|
|
32.29 |
|
|
| Limiting
Variable model |
RT1 |
|
|
RT1 |
|
|
RT1 |
|
|
| Code
limiting variable |
1 |
|
|
1 |
|
|
1 |
|
|
| Code
matching conmp vs model |
GEO |
|
|
GEO |
|
|
GEO |
|
|
| 11.8. | Resources
estimation |
Mineral
Resource estimates are effective December 31, 2023. All Mineral Resources are estimated as quantities at cement plant. For the estimation
of Mineral Resources, the CaO content was considered and the impurity content. The impurities are restrictions determined by the cement
production plant. Table 26 shows the Resources and the average values of their quality.
Table
26 Resource categorization (exclusive of Reserves) at the Tioyacu quarry
| |
Resources |
Tonnes
M |
CaO
(%) |
Al2O3
(%) |
MgO
(%) |
Si2O
(%) |
K2O
(%) |
| Limestone |
Measured |
0.05 |
50.10 |
0.60 |
1.01 |
5.82 |
0.22 |
| Indicated |
0.5 |
48.01 |
0.67 |
3.32 |
6.23 |
0.19 |
| Measured
+ Indicated |
0.5 |
48.20 |
0.67 |
3.11 |
6.19 |
0.20 |
| Inferred |
19.8 |
46.34 |
0.37 |
5.97 |
2.67 |
0.14 |
The
main factor for the determination of Resources is quality. The costs of production, transportation, cement processing, and cement dispatch
were considered to determine the Resources. The costs are based on real sources of the current operations of Cementos Selva S.A.C. Chapter
19 shows the economical analysis for determining the mineral Resources.
| 11.8.2. | Reasonable
Prospects of Economic Extraction |
The
Mineral Resource evaluation has considered relevant economic and technical factors such as limestone production costs, cement sales prices,
and environmental and social viability at our operations.
The
area associated with the Resource estimate is located at the lower boundary of the mining concession. Complement the geological information
towards the S-SW zone of the quarry, considering future production activities.
The
Resource estimate considers the Tioyacu deposit as 90 m. thickness, defined by quality and continuity.
The
all material produced in the Tioyacu quarry is blended to be sent to the plant. The quality of this material is analyzed in the Rioja
plant laboratory before blending.
Update
the geomechanical and hydrogeological studies of the quarry to consider future open-pit mining to the south.
The
information that supports the estimation of the quarry’s Resources is consistent, which allows obtaining a robust resource model.
From
the environmental and social point of view, Cementos Pacasmayo (included Cementos Selva) has been developing activities in Peru for more
than 60 years and is recognized as a Peruvian company with a high reputation, therefore, it is expected that the environmental and social
viability will continue.
| 11.8.3. | Mineral
Resources classification |
Cementos
Selva S.A.C. obtained the parameters for classifying Resources based on staff´s experience designing the optimal drilling grid
for sampling by geostatistical methods. Additionally, the variogram analysis was used as reference. Based on these, the following basic
criterio is used to define the Resource classes:
| - | Measured
Resource: 1/3 of the distance of the variogram range. |
| - | Indicated
Resource: 2/3 of the distance of the variogram range. |
| - | Inferred
Resource: The total distance of the variogram range. |
Several
configurations have been defined from this basic configuration, taking into account the number of drill holes and the average search
distance.
Associated
with the uncertainty, QP considered the criteria in Table 27 to categorize the Resources. The table shows the number of composites, drill
holes and distance used for the various resource categories.
Table
27 Criteria for Resource categorization
| |
Measured |
Indicate |
Inferred |
| Minimum
number of composites |
2 |
2 |
1 |
| Maximum
number of composites |
20 |
20 |
20 |
| Number
of composites drillhole |
2 |
2 |
1 |
| Average
distance of composites (m) |
90 |
135 |
180 |
| 11.9. | Qualified
Person’s Opinion |
The
QP has considered the quality and geological characteristics of the limestone horizons to develop the geological model. Likewise, the
QP’s interpretation of the deposit was based on the diamond drill holes obtained in the drilling campaigns. The opinion of the
QP is that there is consistency between the information and the geological model. As a producing mine, most of the relevant technical
and economic factors have already been resolved.
The
expansion of the pit towards the southern area of the deposit is necessary to guarantee the production of limestone in the future. It
is important to start the development and preparation in that direction with the construction of the access ramp to complement the second
phase of the diamond drilling campaign that started at the end of the year (2023), to allow the update that makes the geological model
more robust and helps reduce uncertainty, as well as allowing the confirmation of resources and recategorizing inferred resources.
| 12. | Mineral
Reserves estimates |
Total
Mineral Reserves estimated at the Tioyacu quarry are 10.3 million tonnes, as detailed in Table 24 in their different categories.
Additionally,
the periodic update of the Mineral Reserves of the Tioyacu quarry takes into account the Reserves extracted when updating the Mineral
Resources and Reserves models, any new “modifying factors”, or the change and entry of any new data.
The
calcium oxide (CaO) content is the primary variable in the Mineral Resources and Reserves estimation. Its specific values depend on the
lithological domain, with its concentration higher in some lithologies than in others.
The
calculated Reserves in the limestone deposit was 5.9 M mt. of proven Reserves with 50.17% CaO and 4.4 M mt. of probable Reserves with
48.07% CaO for a total of 11.3 M mt. of Reserves with 49.28% CaO that support the mining plans for production and supply to the Cementos
Selva S.A.C. plant.
Based
on the estimated Reserves and the plant’s projected limestone consumption, the QPs estimate a life of mine of 24 years for the
quarry.
| 12.1. | Criteria
for Mineral Reserves estimation |
The
criteria used for the determination of Mineral Reserves are described below.
| 12.1.1. | Run
of Mine (ROM) determination criteria |
ROM
is considered to be all material produced in the quarry that complies with the specifications and will be sent to the plant for cement
production. For determining ROM tonnage, dilution was considered to be negligible. The recovery in the quarry was assumed to be 100%.
| 12.1.2. | Cement
Plant recovery |
The
limestone received at the Rioja plant is properly stored and then mixed with other raw materials to obtain the raw meal feed (kiln feed).
The crude contains 73.26% limestone. After the crude is obtained, it is fed to the calcination kiln to obtain clinker. Finally, the clinker
is mixed with additives to obtain cement.
| 12.2. | Reserves
estimation methodology |
The
Mineral Reserve estimation considers the costs of production, transportation, cement processing, and the quality restrictions of the
raw material. The costs are based on actual costs from the current operations of Cementos Selva S.A.C. at the Tioyacu quarry and Rioja
plant. Chapter 19 shows the economical analysis used to determine the Mineral Reserves.
| ● | Proven
and Probable Reserves are derived from Measured and Indicated Resources, respectively. |
| ● | Proven
and Probable Reserves are within the pit designed for the Tioyacu quarry. |
| ● | Reserves
are those for which economic viability has been demonstrated by discounted cash flow analysis
based on estimated capital and operating costs. |
| ● | Cementos
Selva S.A.C. has permits for limestone production at the Tioyacu quarry. All material considered
to be Mineral Reserves are material for which CSSAC has mining permits. |
| ● | The
effective date of the Reserve estimate is December 31, 2023. |
| ● | The
Reserve estimate is the final product placed in the Rioja plant. |
Reserves
are expressed in tons and are shown in Table 28.
Table
28 Mineral Reserves expressed in millions of tonnes
| |
Reserves |
Tonnes
M |
CaO
(%) |
Al2O3
(%) |
MgO
(%) |
SiO2
(%) |
K2O
(%) |
| Limestone |
Proven |
5.9 |
50.17 |
0.61 |
1.01 |
5.86 |
0.22 |
| Probable |
4.4 |
48.07 |
0.72 |
2.18 |
6.84 |
0.21 |
| Total |
10.3 |
49.28 |
0.66 |
1.51 |
6.28 |
0.22 |
| 12.4. | QP’s
Opinion on Risk Factors affecting Reserve Estimates |
In
the QP’s opinion, the Reserves estimated for the quarry from the Resources consider the relevant risk factors and modifying factors
which affect the tonnage and quality estimates. The primary variable is considered to be CaO, which is very stable in the deposit. SiO2
is viewed as a secondary variable that, without adequate control, can have an inverse effect on the CaO content in the Reserves.
MgO is a secondary control variable that is also taken into account to define the reserves, in the current report its average is slightly
above the recommended level, which with an efficient mixing process is manageable, also with the objective of improving the quality support
in the reserves it is planned to carry out a diamond drilling program in the quarry.
In
estimating Reserves and the production plans for the quarry, these variables have been adequately considered with production sequencing
and blending processes.
Because
the Cementos Selva has been operating the Tioyacu quarry for 23 years and the deposit is relatively stable in the main quality metrics,
the QP is of the opinión that the risks associated with the Reserve estimate is low.
In
addition to quality factors, ore reserves could change from operating performance-controlled production costs, allowing for maximization
of the use of resources in the extractive processes for the use of resources in the extractive processes for the industrialists, guaranteeing
the LOM of the quarry.
Cementos
Selva S.A.C., a wholly-owned subsidiary of Cementos Pacasmayo S.A.A, is the current owner of the Tioyacu quarry. Cementos Selva S.A.C.
carries out the planning, production, supervision and quality control of the quarry to verify the activities and production according
to the requirements of Rioja plant.
| 13.1. | Mining
methods and equipment |
The
production of the deposit begins with the drilling and blasting. The fragmented material is pushed with a dozzer to create muckpiles
before loading the material into dump trucks using a front loader. The material is transported to the cement plant.
The
quarry activities allow the production of fragmented limestone smaller than 12” in diameter, with carbonate grades according to
the plant’s needs.
The
sequence of limestone extraction is by benches, which are produced sequentially according to the annual requirement of the plant.
Figure
9 Tioyacu quarry mining sequence
Limestone
mining at the Tioyacu quarry comprises the following unit operations:
Drilling
activities at Tioyacu quarry are carried out with one diesel-powered drilling rig and one as stand-by.
Blasting
allows the rock to be fragmented to a size suitable for loading, hauling, and crushing unit operations. Non-electric detonators and connectors
are used to avoid vibration and sound.
| ● | Loading
and Transportation |
There
are 04 Volvo dump trucks of 14 m3 capacity, 02 excavator CAT and 01 front loader CAT 962L.
The
main equipment used to carry out mining activities at the Tioyacu quarry are shown in Table 29.
Table
29 Equipment of the Tioyacu quarry
| Equipment |
Quantity |
Function |
Description |
| Track
Drill and RockDrill |
02 |
Drilling |
These
machines are used to drill holes for blasting. |
| Front
End Loader CATERPILLAR 962L (3.6 m³ bucket capacity) |
01 |
Material
Loading and Stacking |
Material
handling equipment. |
| Excavator
(1.16-2.69 m3 bucket capacity) |
02 |
Material
Loading and Stacking |
Material
handling equipment. |
| Dump
truck |
04 |
Material
hauling |
Equipment
for conveying material from the production areas to the primary crusher. Their capacity is 14 m3. |
In
2022, Cementos Selva SAC hired Magma Consulting S.A.C, to carry out hydrological, hydrogeological, geotechnical and seismic risk of the
Tioyacu quarry.
The
study determined the maximum and minimum bank slope angles and inter-ramp angles based on stability analysis and kinematic analysis.
As
a result of the study seven structural domains were defined. The Table 30 shows the design criteria in each geotechnical domain of the
quarry.
Table
30 Tioyacu quarry design criteria
| Domain |
Bench
height (m) |
Design |
Berm
width (m) |
| BFA
(°) |
IRA
(°) |
| Domain
01 |
8 |
65 |
43 |
4.84 |
| Domain
02 |
8 |
65 |
43 |
4.84 |
| Domain
03 |
Clay |
8 |
60 |
35 |
7 |
| Rock |
8 |
65 |
43 |
4.84 |
| Domain
04 |
8 |
65 |
47 |
4.54 |
| Domain
05 |
8 |
70 |
47 |
4.54 |
| Domain
06 |
8 |
65 |
44 |
4.55 |
| Domain
07 |
8 |
65 |
43 |
4.84 |
BFA:
Face slope angle
IRA:
Inter ramp angle
Magma
Consulting S.A.C (2022), performed stability analyses, the results are shown in Table 31.
Table
31 Stability Analysis
| Section |
Description |
Bench
face angle |
| Static |
Pseudo-static
K=0.078g |
| S-1 |
Golbal
Fault |
2.85 |
2.54 |
| S-2 |
Golbal
Fault |
2.67 |
2.37 |
| S-3 |
Golbal
Fault |
2.58 |
2.32 |
| S-4 |
Golbal
Fault |
2.67 |
2.35 |
| S-5 |
Golbal
Fault |
2.08 |
1.87 |
| S-6 |
Golbal
Fault |
2.80 |
2.52 |
| S-7 |
Golbal
Fault |
4.01 |
3.64 |
| S-8 |
Golbal
Fault |
4.35 |
3.96 |
| S-9 |
Golbal
Fault |
5.02 |
4.55 |
In
2021 the hydrogeological study was conducted by Magma Consulting S.A.C. The objectives of the hydrogeological study was to track the
installed piezometric levels and evaluate the variations until the end of 2021.
Table
32 2021 piezometric data
| Code |
Water
level (msnm) |
Date |
Type |
| DH-02 |
834.75 |
16/10/2021 |
Piezometer |
| DH-03 |
825.25 |
16/10/2021 |
Piezometer |
| DH-06 |
836.30 |
16/10/2021 |
Piezometer |
| 13.4. | Other
Mine Design and Planning Parameters |
The
limestone production reached by December 2023 is 351,643.6 tonnes, and no waste rock was removed. Based on the plant requirements and
sales projection for the next 24 years, the pit design parameters for the Tioyacu quarry are presented in Table 33.
Table
33 Summary of Tioyacu quarry design parameters
| Description |
Value |
| Safety
bench |
Rock |
4.54
- 4.84 m |
| Rock
and clay |
7
m |
| Bench
slope angle |
60°
- 70° |
| Bench
height |
8
m |
| Width
of ramps |
12
m |
| 13.5. | Anual
production rate |
Considering
that the cement plant demands an average of 0.4 million tonnes per year of limestone, the plan for the next 24 years is shown in Table
34.
The
proposed mining plan for the next 24 years is presented in Table 34.
Table
34 Mining plan for the next 24 years
| Year | | |
Tonnes | | |
CaO | | |
SiO2 | | |
MgO | | |
Al2O3 | | |
K2O | |
| 2024 | | |
| 412,000 | | |
| 49.06 | | |
| 7.40 | | |
| 0.98 | | |
| 0.69 | | |
| 0.22 | |
| 2025 | | |
| 428,173 | | |
| 49.12 | | |
| 7.34 | | |
| 1.03 | | |
| 0.70 | | |
| 0.22 | |
| 2026 | | |
| 434,862 | | |
| 49.18 | | |
| 7.35 | | |
| 0.90 | | |
| 0.69 | | |
| 0.22 | |
| 2027 | | |
| 434,982 | | |
| 49.16 | | |
| 7.49 | | |
| 0.91 | | |
| 0.66 | | |
| 0.24 | |
| 2028 | | |
| 434,982 | | |
| 49.26 | | |
| 6.08 | | |
| 1.69 | | |
| 0.66 | | |
| 0.18 | |
| 2029 | | |
| 434,982 | | |
| 49.05 | | |
| 6.42 | | |
| 1.68 | | |
| 0.52 | | |
| 0.20 | |
| 2030 | | |
| 434,982 | | |
| 49.14 | | |
| 3.72 | | |
| 3.13 | | |
| 0.47 | | |
| 0.15 | |
| 2031 | | |
| 434,982 | | |
| 49.05 | | |
| 7.14 | | |
| 1.16 | | |
| 0.83 | | |
| 0.16 | |
| 2032 | | |
| 434,982 | | |
| 49.05 | | |
| 7.85 | | |
| 0.83 | | |
| 0.60 | | |
| 0.22 | |
| 2033 | | |
| 434,982 | | |
| 49.01 | | |
| 7.17 | | |
| 1.22 | | |
| 0.73 | | |
| 0.23 | |
| 2034 | | |
| 434,982 | | |
| 49.07 | | |
| 4.47 | | |
| 2.70 | | |
| 0.59 | | |
| 0.20 | |
| 2035 | | |
| 434,982 | | |
| 49.00 | | |
| 5.61 | | |
| 2.08 | | |
| 0.55 | | |
| 0.19 | |
| 2036 | | |
| 434,982 | | |
| 49.07 | | |
| 7.01 | | |
| 1.25 | | |
| 0.85 | | |
| 0.30 | |
| 2037 | | |
| 434,982 | | |
| 49.35 | | |
| 6.19 | | |
| 1.57 | | |
| 0.54 | | |
| 0.18 | |
| 2038 | | |
| 434,982 | | |
| 49.16 | | |
| 4.56 | | |
| 2.37 | | |
| 0.82 | | |
| 0.34 | |
| 2039 | | |
| 434,982 | | |
| 49.02 | | |
| 7.53 | | |
| 1.03 | | |
| 0.83 | | |
| 0.12 | |
| 2040 | | |
| 434,982 | | |
| 49.36 | | |
| 7.45 | | |
| 0.85 | | |
| 0.60 | | |
| 0.19 | |
| 2041 | | |
| 434,982 | | |
| 49.02 | | |
| 5.04 | | |
| 2.36 | | |
| 0.68 | | |
| 0.25 | |
| 2042 | | |
| 434,982 | | |
| 49.22 | | |
| 4.27 | | |
| 2.53 | | |
| 0.60 | | |
| 0.23 | |
| 2043 | | |
| 434,982 | | |
| 49.22 | | |
| 7.64 | | |
| 0.92 | | |
| 0.61 | | |
| 0.22 | |
| 2044 | | |
| 434,982 | | |
| 49.13 | | |
| 6.06 | | |
| 1.74 | | |
| 0.69 | | |
| 0.29 | |
| 2045 | | |
| 434,982 | | |
| 50.36 | | |
| 5.88 | | |
| 0.99 | | |
| 0.57 | | |
| 0.18 | |
| 2046 | | |
| 434,982 | | |
| 50.04 | | |
| 5.89 | | |
| 1.06 | | |
| 0.82 | | |
| 0.26 | |
| 2047 | | |
| 328,723 | | |
| 51.07 | | |
| 4.85 | | |
| 1.08 | | |
| 0.48 | | |
| 0.17 | |
| Total | | |
| 10,303,398 | | |
| 49.28 | | |
| 6.28 | | |
| 1.51 | | |
| 0.66 | | |
| 0.22 | |
| * | Limestones
that contain elements out of the design range, a dosage is made for the crude in the cement
production. |
Figure
10 Tioyacu quarry final pit
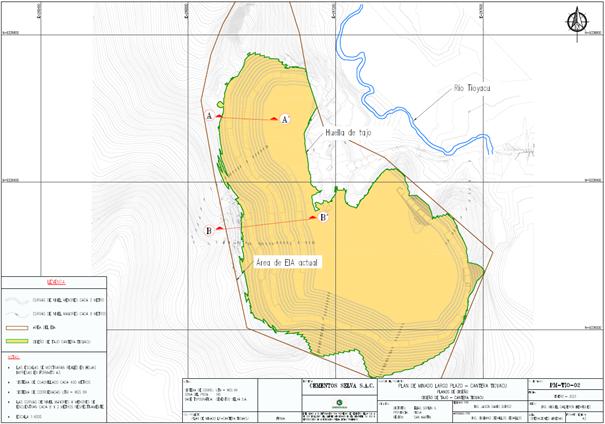
The
life of the Tioyacu quarry is 24 years.
Cementos
Selva S.A.C. personnel develop its operations at the Tioyacu quarry with its staff and contractors.
| 14. | Processing
and recovery methods |
Cement
production involves the following stages:
Production
of raw materials. Limestone is produced from the Tioyacu quarry, as described in Chapter 13.
Milling
and homogenization. Once the limestone is received at the plant, it is dosed to the raw mill with clay, iron, and coal. The mixture must
meet the quality standards to be sent to a storage silo from where it is fed to the crude storage silo. The crude is fed to the kiln
for clinker production.
Clinkerization.
The mixture is pelletized and then enters the vertical kiln where it reaches a temperature of approximately 1,450 degrees Celsius, the
product of which is clinker. The clinker is then cooled to about 200 degrees Celsius and stored in silos or storage bins.
Cement
grinding. After being cooled, the clinker, together with gypsum and some additives, is fed into a mill to obtain cement.
Storage
in silos. After passing through the mills, the cement is transferred to conveyor channels and stored in concrete silos to preserve its
quality until distribution.
Packing,
loading, and transportation. Cement is transferred through chutes from the silo to be packed into 42.5-kilogram bags in bagging machines,
and then stored or loaded onto trucks operated by third parties for distribution. Bulk cement is transported by trucks.
| 14.2. | Raw
materials for the cement production |
The
following raw materials and additives are used in the Rioja plant to produce cement.
Raw
Materials
Limestone,
is composed mainly of calcium carbonate and is used as raw material and an additive in cement production.
Iron,
is inert material composed basically of iron oxide (Fe2O3).
Clay,
is inert material composed of silicon, aluminum, and a low proportion of alkalis such as potassium and sodium.
Coal,
is a solid, black, or dark brown mineral that is essentially carbon with small amounts of hydrogen, oxygen and nitrogen.
Gypsum.
It is a material composed of calcium sulfate hydrates. When gypsum is mixed with the clinker, it controls the setting time when the cement
initiates the hydration reactions.
Crude,
is an artificial mixture of limestone, clay, iron, and coal used to produce clinker.
Clinker
is a product obtained from limestone, clay, iron, and coal.
Additives
Limestone.It
is a material composed mainly of calcium carbonate, which, when finely ground, is used as an additive in cement production.
Gypsum.
It is a material composed of calcium sulfate hydrates. When gypsum is mixed with the clinker, it controls the setting time when the cement
initiates the hydration reactions.
The
following is the block diagram of the cement plant for raw material processing, clinker and cement production.
Figure
11 Rioja plant process block diagram
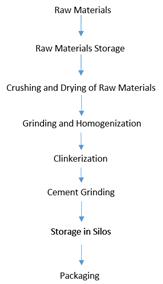
Table
35 shows the design and production capacities for clinker and cement.
Table
35 Main equipment in Rioja plant
| Equipment |
Product |
Capacity
of production* |
Unit |
| Crusher |
Limestone
Iron
Gypsum |
792,000 |
tonnes/year |
| Dryer
1 |
Limestone
Clay |
792,000 |
tonnes/year |
| Dryer
2 |
396,000 |
tonnes/year |
| Raw
meal mill 1 |
Raw
meal |
198,000
440,000 |
tonnes/year |
| Raw
meal mill 2 |
Raw
meal |
475,200 |
tonnes/year |
| Kiln
1 |
Clinker |
43,560 |
tonnes/year |
| Kiln
2 |
Clinker |
79,200 |
tonnes/year |
| Kiln
3 |
Clinker |
83,160 |
tonnes/year |
| Kiln
4 |
Clinker |
83,160 |
tonnes/year |
| Cement
mill 1 |
Cement |
55,440 |
tonnes/year |
| Cement
mill 2 |
Cement |
118,800 |
tonnes/year |
| Cement
mill 3 |
Cement |
265,760 |
tonnes/year |
| Bagging
system 1 |
Cement |
8,316,000 |
Bags/year |
| Bagging
system 2 |
Cement |
8,316,000 |
Bags/year |
| * | The
equipment capacities consider 330 days of production. |
| 14.5. | Material
balance cement plant |
The
following section presents information on the material balance at Rioja plant for cement production.
Below
is the clinker production balance at the Rioja plant, considering the use of limestone obtained from the Tioyacu quarry,results of Mineral Resource classification. Likewise, the Mineral Reserves an clay, iron,
and coal as part of the raw material for clinker production. Likewise, the balance for cement production is presented considering the
additives used for the mixture with clinker and consequently cement production for the year 2023.
Table
36 Balance for crude production
| Raw
material |
Annual
quantity (tonnes/year) |
Dosage |
| Limestone |
253,617 |
73.26% |
| Others |
92,581 |
26.74% |
| Crude |
346,198 |
100% |
Crude
is fed to the vertical kiln. The production of 0.57 tons of clinker requires one ton of crude.
Table
37 Balance for cement production.
| Raw
Material |
Annual
quantity (tonnes/year) |
Dosage |
| Clinker |
196,793 |
76.12% |
| Additions |
61,730 |
23.88% |
| Cement |
258,523 |
100% |
Losses
in the cement production process associated with the raw material (limestone) are 1.68% due to handling and transport of the material
during the production process.
Water
is mainly used for cooling in the milling processes and for the pelletizing process of the crude before it enters the vertical kilns.
It is also used for watering green areas and accesses and restrooms. It is also used to irrigate green areas and accesses. 106,295 m3
of water was consumed at the Pacasmayo Plant during its operations in 2023.
| 14.8. | Fossil
fuel consumption |
The
cement production process consumes liquid fuels for heavy equipment within the operation. Biomass is used as energy in the raw material
drying process.
Table
38 Fuel consumption in Rioja plant
| Fuel |
Consumption
(tonnes/year) |
Description |
| Diesel |
283.34 |
P.Cal
9845 Kcal/kg |
| 14.9. | Electric
power consumption |
The
Rioja plant has an electrical substation with a capacity of 12MVA, which uses electrical energy supplied from the national grid. 120,314
GJ of energy was consumed at the Rioja plant during its operations in 2023.
Cementos
Selva S.A.C. has implemented a preventive and corrective maintenance plan to prevent interruptions to the cement production process.
Cementos Selva S.A.C. maintains operating efficiency to control costs and operating margins. Cementos Selva S.A.C. has initiatives to
diversify energy sources and secure supply when possible. The equipment is in good condition and operational.
Cementos
Selva S.A.C. personnel develop its operations at the Rioja plant with its staff and contractors.
The
Tioyacu quarry uses the infrastructure of the Rioja plant, such as administrative offices, workshops, utilities and other services. The
quarry is located adjacent to the cement plant.
Explosive
storage: Given the proximity of a military fort, the explosive storage is located inside the military fort and is very well guarded.
Cementos Selva S.A.C. has to retrieve explosives every time it needs to blast in the quarry.
The
use of electrical energy is required; there is a high voltage electrical energy supply system of 60 Kv, 60 Hz transmission for the industrial
facilities of Cementos Selva S.A.C.
There
is a derivation from the 60 kV Rioja - Nueva Cajamarca transmission line owned by Electro Oriente, which runs in front of CSSAC’s
facilities at a distance of 345.8 m.
On
the other hand, the company has a license to use water for industrial purposes. The National Water Authority issued the Alto Mayo Local
Water Administration (R.A. Nº 100-2010-ANA-ALA ALTOMAYO).
Water
supply at the Rioja plant is provided by a groundwater well, Cementos Selva is allow to draw 567,648
m3 per year.
Cementos
Selva S.A.C is a subsidiary of Cementos Pacasmayo. Cementos Pacasmayo is a leading company in the cement production and other construction
materials in the north of Peru. This chapter describes the cement market, as well as the macro and microeconomic factors that define
it.
For
the description of the cement market in Peru, public information has been collected from different sources, such as the Central Reserve
Bank of Peru (BCRP), National Institute of Statistics and Informatics (INEI), Association of Cement Producers (ASOCEM), Ministry of Housing,
Construction and Sanitation, Superintendence of Tax Administration and the Peruvian Construction Chamber. In addition to this information,
this chapter also relies on statistics provided by the company (CPSAA) to provide a better understanding of its specific market.
| 16.1. | The
cement market in Peru |
The
Peruvian cement market is geographically segmented by regions: north, central and south. Diverse companies supply each region. Figure
12 is an illustration of the Peruvian map and of its 3 regions, according to the segmentation of the cement market, where each region
is the main area of influence of domestic cement companies.
Figure
12 Segmentation of the cement market in Peru

The
main companies that comprise the cement market in Peru are: Cementos Pacasmayo S.A.A., UNION Andina de Cementos S.A.A., Yura S.A. and
Cementos Selva S.A.C. Additionally, there are companies that import cement or clinker, such as Caliza Cemento Inca S.A., Distribuidora
Cemento Nacional S.A.C., CEMEX Perú S.A., Cal & Cemento Sur S.A., amongst others.
Table
39 shows the domestic cement shipments (in thousands of tonnes):
Table
39 Cement shipments at domestic level (in thousands of tonnes)
| | |
2021 | | |
2022 | | |
2023 | |
| National
cement shipments | |
| 12,500.0 | | |
| 14,113.3 | | |
| 12,175.7 | |
| Overall
cement shipments (CPSAA/CSSAC 3 plants) | |
| 3,625.2 | | |
| 3,436.8 | | |
| 2,936.6 | |
| Rioja
plant shipments | |
| 336.8 | | |
| 305.8 | | |
| 257.1 | |
Sources:
ASOCEM, CPSAA/CSSAC
The
types of cement produced by the main cement companies in the country are Type I, Type V, Type ICO, Type IL, Type GU, Type MS (MH), Type
HS, Type HE, Type MH.
It
is important to mention that, according to the main requirement standards, Peruvian Technical Standards, cements are divided into five
types:
| ● | NTP
334. 009 2013. Cements Portland. Requirement. (ASTM C 150). |
| ● | NTP
334. 090 2013. Cements Portland Added. Requirements. (ASTM C595). |
| ● | NTP
334. 082 2011. Cements Portland. Performance Specification. (ASTM C1157). |
| ● | NTP
334. 050 2004. Cements Portland White. Requirements. (ASTM C150). |
| ● | NTP
334. 069 2007. Building Cements. Requirements. (ASTM C091). |
For
Cementos Selva’s cement products, only the first 3 NTP standards apply.
| 16.2. | Industry
and Macroeconomic Analysis |
Producers
and trading companies of cement compete mainly within the limits of their area of influence, which is determined by the geographical
location of their plants, giving rise to segmentation of the national market. However, the northern region presents a high demand potential
because of the infrastructure gap, the housing deficit and a higher capillarity in terms of important cities adjacent to one another
and with an urbanization level lower than in the central and southern region. On the other hand, it is important to note the importance
of transportation in the structure of cement costs, which are composed primarily of raw materials, fuels and transportion.
The
cement market and industry in Peru have the following characteristics:
| ● | Base
of consumers highly segmented, informal and of low resources. |
| ● | Low
costs of energy and raw materials. |
| ● | Zone
of influence / distribution determined by geographical location of the plant. |
| ● | High
correlation between public and private investment, and self-construction. |
The
construction sector and cement industry have a behavior directly related to the Gross Domestic Product (GDP) and Private Consumption.
Figure 13 shows how the GDP of the construction sector (monthly variation %) tracks the cyclic behavior of the Global GDP (monthly variation
%), showing variations of lower significance than those of the Global GDP, but in the same direction. It is also noted that, in May 2020,
the GDP of the construction sector had a positive variation of more than 200% (compared to the previous month), whilst Global GDP went
up only 10%. This was due to the reactivation of economic activity and consumption once the confinement measures given by the Government
to counter the Covid-19 pandemic were loosened. This reactivation was motivated primarily by private-construction sector consumption.
In the face of the uncertainty caused by the health and economic crisis in 2020, consumers showed savings behaviors, which meant that
people preferred consumption of goods for home improvement, amongst them, cement. This trend was maintained throughout 2021. However,
in 2023 there was a decrease in demand for public and private investment due to the political and social situation. As a result, cement
volumes are returning to pre-covid levels.
Figure
13 Construction sector GDP variation

Source:
INEI 2021
The
cement industry is also motivated by housing sector growth, public and private investment in infrastructure, mining projects, shopping
centers, construction of transportation systems, etc. Thus, one of the variables with more impact on cement industry and future demand
is the infrastructure gap which remains high in the country.
For
the 2016 – 2025 period, the infrastructure gap is estimated to be US$ 160 billion and this is present in the main economic sectors
and services of public supply, that is: Transportation (36%), Energy (19%), Telecommunications (17%), Health (12%), Sewage System (8%),
Irrigation (5%) and Education (3%). The 90% of the roads not included in the large national road network still remain without pavement.
Only 40% of schools have access to basic services such as water, electricity and sewage system. There are only 15 hospital beds for every
10,000 individuals compared to 27 beds recommended by the WHO.
In
2023, the cement market contracted by 14% compared to 2022, while it grew by 20% in 2019 (pre-pandemic). However, by 2024, it is expected
to have x% growth compared to 2023. Climatic (cyclone Yaku) and social (protests and blockades) factors impacted domestic cement dispatches.
In addition, regional and local and local governments began new administrations with lower-than-expected public spending than expected.
Given
greater stability in the sector, a moderate growth of 2% in cement shipments is expected by 2024.
16.3. The North Region Market
Cementos
Pacasmayo, a leading company in the production and sales of cement in the North Region, has market presence in the following cities:
Cajamarca, Chiclayo, Chimbote, Jaén, Pacasmayo, Piura, Rioja, Tarapoto, Trujillo, Tumbes, Yurimaguas and Iquitos. The company
has a Market share of over 93.8% in the northern region of the country.
Cementos
Selva S.A.C.’s overall shipments from the Rioja plant were 257,132 tonnes. It supplied 8.2% of the country’s North Region
cement demand, and its cement sales represented 8.8% of the Company’s overall shipments.
Other
companies with lower presence in the cement market of the North Region are:
These
companies are competitiors of the Rioja plant.
Cementos
Selva S.A.C.’s Rioja plant produces different types of cement and it has placed in the National Market different trademark products
to meet the needs of diverse segments of the market. Table 40 shows the products in Rioja plant.
Table
40 Types of products of Rioja plant
| Cement
type |
Use |
Comment |
| Cemento
Portland |
|
|
| Cement
Type I |
Cement
of general use. |
The
average result of resistance to compression is higher than the minimum requirement set forth in the technical standard NTP 334.009
/ ASTM C150. |
| Cemento
Portland with additives |
|
|
| Cement
Extra Forte |
Ideal
for the execution of structural Works, repairs, remodelings home applications, floors, leveling, grouts, tips, prefabricated elements
of small and medium size and concrete elements which require special characteristics. |
The
average result of resistance to compression is higher than the minimum requirement set forth in technical standard NTP 334.090. |
Hydraulic
Cements specified by performance
|
|
|
| Mochica
GU Line |
For
structures in contact with environement and humid and salty soils.
|
|
| Amazonico
GU Line |
Cement
for general purpose. |
|
The
sale prices of cement in the Peruvian market vary pursuant to their type and their geographical location. The price difference between
each type is explained primarily by the dosifications of raw materials and additives, whilst the variations for geographical location
are caused by the freights for the distribution to the points of sale.
At
domestic level, the cement price in 2023 was, on average, 690.59 S/ x t. Figure 14 shows the historical prices of cement in Peru.
Figure
14 Historic prices of cement in Peru

Source:
Ministerio de Vivienda, Construcción y Saneamiento (December 2023).
Figure
14 shows the sustained growth of the price of more than 4% per year, from 2017 until 2018, it fell slightly in 2019 to climb back up
again in 2020.
| 16.5. | Current
and future demand |
Cement
demand at the national level is met by local shipments (local production), for the most part, and by imports. In 2023, 11.20 M tonnes
were shiped locally; 13.6% less than in the same period of 2022 (12.97 M). Imports amounted to 0.21 M tonnes during 2023; 21.9% below
the 2022 figure (0.27 M).
Figure
15 shows the evolution of the national demand of cement, expressed in thousand of tonnes, since 2017.
Figure
15 Evolution of the national demand of cement
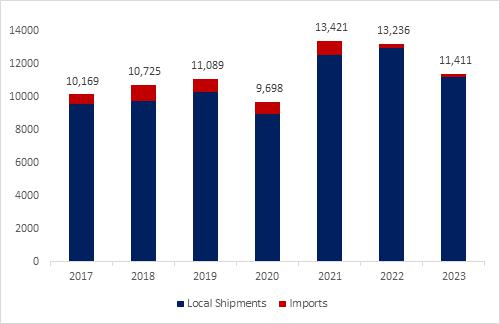
Source:
ASOCEM
It
is noted that domestic demand has been growing, on average, at a rate of 3% per year, with the exception of 2020, which is considered
an atypical year due to the adverse effects of the pandemic and the confinement measures, to then take a historic leap in 2021 with an
annual increase of 38%. During 2023, shipments decreased by 13.8% compared to 2022 as a result of the political and social situation
in the country.
According
to our internal information, in terms of regional distribution, the Northern Region accounts for approximately 25.6% of domestic cement
demand, the Central Region for 54.5%, and the Southern Region for 19.9%.
Cementos
Pacasmayo’s cement shipments (3 plants) reached 2,936.6 thousand tonnes in 2023, capturing a 24.1% share of total shipments in
Peru and 93.8% in the Northern Region. This is 15% less than in 2022 (3,436.8 thousand tonnes).
Despite
the decrease in the volume of shipments in 2023, future demand is optimistic for the region due to the high infrastructure deficit.
Table
41 shows the projection of future demand or cement shipments for Cementos Selva S.A.C (Rioja plant). These projections are based on the
2024 estimated shipments.
Table
41 Forecast of future demand for Rioja cement plant
| Year | | |
Cement
Shipments
(Tonnes) | | |
Variation
(%) | |
| 2024 | | |
308,242 | | |
ppto | |
| 2025 | | |
| 374,838 | | |
| 22 | % |
| 2026 | | |
| 382,335 | | |
| 2 | % |
| 2027 | | |
| 383,000 | | |
| 0 | % |
| 2028 | | |
| 383,000 | | |
| 0 | % |
| 2029 | | |
| 383,000 | | |
| 0 | % |
| 2030 | | |
| 383,000 | | |
| 0 | % |
| 2031 | | |
| 383,000 | | |
| 0 | % |
| 2032 | | |
| 383,000 | | |
| 0 | % |
| 2033 | | |
| 383,000 | | |
| 0 | % |
| 2034 | | |
| 383,000 | | |
| 0 | % |
| 2035 | | |
| 383,000 | | |
| 0 | % |
| 2036 | | |
| 383,000 | | |
| 0 | % |
| 2037 | | |
| 383,000 | | |
| 0 | % |
| 2038 | | |
| 383,000 | | |
| 0 | % |
| 2039 | | |
| 383,000 | | |
| 0 | % |
| 2040 | | |
| 383,000 | | |
| 0 | % |
| 2041 | | |
| 383,000 | | |
| 0 | % |
| 2042 | | |
| 383,000 | | |
| 0 | % |
| 2043 | | |
| 383,000 | | |
| 0 | % |
| 2044 | | |
| 383,000 | | |
| 0 | % |
| 2045 | | |
| 383,000 | | |
| 0 | % |
| 2046 | | |
| 383,000 | | |
| 0 | % |
| 2047 | | |
| 383,000 | | |
| 0 | % |
| 17. | Environmental
studies, permitting, and plans, negotiations, or agreements with local individuals or groups. |
| 17.1. | Environmental
Aspects |
Cementos
Pacasmayo has Corporate Policies that apply to the operations of quarries and cement plants. Relevant policies include Safety Occupational
Health Policy, Quality Policy, and Environmental Policy.
On
May 19, 2022, through Directorial Resolution No. 215-2022-PRODUCE/DGAAMI, the authority approved the Update of the Environmental Impact
Study of “Tioyacu quarry limestone” in compliance with the obligations established in environmental legislation, assuming
commitments in order to guarantee the environmental viability of operations in the quarry.
Subsequently,
on November 24, 2022, through Directorial Resolution No. 545-2022-PRODUCE/DGAAMI, the authority approved the Supporting Technical Report
for the “Estimation of reserves” project in the Tioyacu Limestone Quarry to determine the existence of greater reserves of
limestone for subsequent exploitation through diamond drilling.
In
2023, CSSAC carried out environmental monitoring through the Laboratorio Envinmental Testing Laboratory S.A.C. - Envirotest, a company
with accreditation before the International Accreditation Service (IAS) and the National Quality Institute (INACAL), both signatories
of the ILAC-MRA International Mutual Recognition Agreement.
Envirotest
was in charge of collecting and analyzing the samples, and presenting the results through reports to the Environmental Assessment and
Enforcement Agency - OEFA, an institution of the Peruvian State in charge of reviewing and validating the information presented by the
owner. At the Tioyacu quarry, parameters of gaseous emissions and particulate matter for air quality were measured every six months.
The results obtained in 2023 are below the values established in the Environmental Quality Standard (ECA) for air approved
with Supreme Decree No. 003-2017-MINAM.
The
results obtained from the environmental noise measurement activities in 2023 are below the Environmental Quality Standard Limit (ECA)
in compliance with the provisions of Supreme Decree N°085-2003-PCM.
The
biological and hydrobiological monitoring in the Tioyacu quarry was carried out by the Analytical Laboratory Laboratorio E.I.R.L. - ALAB
and Environmental Testing Laboratory S.A.C. - Environmental test. The objective was to characterize the Vegetation, Herpetofauna, Avifauna
and Mastofauna. The results showed an abundance of birdlife, a species typical of this type of vegetation where forest predominates.
About
water management, it is essential to mention that Tioyacu quarry does not have any discharges. The small water consumption is only for
green area irrigation and road maintenance.
The
Environmental Management of the Manufacturing Industry and Domestic Trade, Supreme Decree No. 017-2015-PRODUCE, establishes the environmental
management procedures covered by Ministerial Resolution No. 157-2011-MINAM for investment projects subject to the National System of
Environmental Impact Assessment (SEIA) and its amendments.
Law
No. 28090 and its Regulation approved by Supreme Decree No. 033-2005-EM establishes the closure measures for non-metallic quarries.
Directorial Resolution No. 178-2016-MEM-DGAAM, the Update of the Closure Plan of the Tioyacu quarry mining unit was approved, which establishes
measures at the end of the useful life of the quarry.
The
Closure Plan submitted by Cementos Selva S.A.C. has included the necessary measures to ensure effectiveness or consistency with the requirements
necessary for the protection of public health and the environment. The initial strategy has continued with the Closure of the components
of Tioyacu quarry mining unit, establishing temporary, progressive, final and post-Closure activities at the end and/or closure of operations.
Environmental
closure activities have included physical stability in the mine, geochemical stability, water management facilities, decommissioning
for the removal of equipment and machinery. Also infrastructure demolition, reclamation, waste disposal, landform establishment, habitat
rehabilitation, revegetation and social programs.
Post-closure
activities such as physical maintenance, geochemical maintenance, hydrological maintenance, and biological maintenance will be carried
out, and post-closure monitoring activities include physical stability monitoring, geochemical stability monitoring, water management
monitoring, biological monitoring, and social monitoring.
Considering
that the land use before mining production was a secondary forest which was affected by other activities, forestation activities with
native species have been considered part of the post-closure activities. Likewise, CSSAC will fulfill the commitments included in the
Closure Plan approved by the above authority.
It
is important to mention that the approval of the Mine Closure Plan involves the constitution of guarantees to ensure that the owner of
the mining activity complies with the obligations derived from the Mine Closure Plan, in accordance with environmental protection regulations.
Cementos
Pacasmayo has a guarantee of faithful compliance with the mine closure plan for the Tembladera quarry according to the approval of the
updated mine closure plan for an amount of 441,584.00 USD.
We
have a solid relationship with our communities and we have identified its main needs in health, education, urban development and local
development.
We
have a social investment program which contributes to dealing with their needs, based on good dialog and our compliance to our commitments
to our communities.
The
communities are a priority for Cementos Selva. For this reason, we promote periodic meetings with their representatives and we create
opportunities for dialog to know their expectations. Also, we have established public and private alliances for development projects
and programs to contribute to a better quality of life and to strengthen our relationship. In 2023, CSSAC worked in partnership with
the district governments of Elias Soplin Vargas and Rioja.
CSSAC
has no commitments for local procurement and hiring although it does its best to hire local talent and do business with local businesses.
On
August 3, 2022, through Directorial Resolution No. 346-2022-PRODUCE/DGAAMI, the Supporting Technical Report (ITS) of the project “Expansion
of surface components of the Rioja cement plant” for the expansion of storage areas was approved of raw materials, bagging and
materials that are received in said areas.
About
water management, it is essential to mention that Rioja plant does not have any discharges.
The small water consumption is only for green area irrigation.
Finally,
in accordance with environmental regulations and according to the Regulation of Environmental Management of the Manufacturing Industry
and Domestic Trade, Supreme Decree N° 017-2015-PRODUCE, companies that produce cement are required to submit Closure Plans when executing
Decommissioning activities. To meet that requirement, Cementos Selva in compliance with Peruvian legislation will submit the Closure
Plan in a timely manner.
| 17.2. | Solid
waste disposal |
Cementos
Selva S.A.C. has a Solid Waste Minimization and Disposal Plan for our production activities at the Rioja plant and Tioyacu quarry. Annually,
our company declares the generation, storage, collection, and final disposal of hazardous and non-hazardous solid waste in compliance
with environmental legislation.
The
solid waste minimization plan (2023), we declared 0.2 tonnes of hazardous waste and 1 tonnes of non-hazardous waste for the Tioyacu quarry.
Likewise, for the Rioja plant we declared 14.2 tonnes of hazardous waste and 771.6 tonnes of non-hazardous waste, which were disposed
of in accordance with environmental legislation.
| 17.3. | Qualified
Person’s Opinion |
Cementos
Selva S.A.C. complies with national environmental standards in the industrial sector and to the International Standard Industrial Classification
- ISIC 2694 for the non-metallic production of the limestone material for the manufacture of cement.
For
the industrial and mining sector, the company specifically complies with the Environmental Management Regulations for the Manufacturing
Industry and Domestic Trade, Supreme Decree No. 017-2015-PRODUCE, which is the rule that regulates the environmental management of the
activities indicated in Ministerial Resolution No. 157-2011-MINAM and investment projects subject to the National System of Environmental
Impact Assessment (SEIA), considered in Annex II of the Regulations of Law No. 27446, approved by Supreme Decree No. 019-2009-MINAM.
The
company reports the environmental commitments, semiannually and quarterly to the Environmental Evaluation Agency - OEFA. The monitoring
is carried out through external laboratories that provide comprehensive monitoring and analysis services and have double accreditation,
by the international IAS (International Accreditation Service) and the national INACAL (National Institute of Quality), both signatories
of the ILAC-MRA international Mutual Recognition Agreement.
Cementos
Selva S.A.C. strictly complies with the protocols in the different processes in compliance with environmental legislation and reporting
to the OEFA.
The
qualified person believes that CSSAC’s current plans and management strategies are adequate for addressing any issues related to
environmental compliance and maintaining its environmental permits. In addition, the qualified person believes that CSSAC has a good
relationship with the local communities and that its social investment plans are adequate for reducing any social risks to the project.
| 18. | Capital
and operations costs |
| 18.1. | Basis
for operating and capital costs for the quarry and plant |
In
a tabular manner, this section presents the operating costs of Tioyacu quarry for the production of limestone - the primary raw material
used for cement production at the Rioja plant. It also exhibits the plant’s operating costs, for the whole industrial process;
from the reception of raw material, to its conversion to the final product (cement). Cost forecast is mainly based on actual historical
costs.
Similarly,
this section reports the detail of the capital investments made in the quarry and plant, and the forecasted investment plan required
to sustain all the activities in the quarry and plant and to assure the supply of limestone Reserves necessary to achieve the production
levels according to the forecasted cement shipments of the Rioja plant.
Table
42 depicts the main components of the cost structure of Tioyacu quarry and Rioja plant and the sources used in their forecasts:
Table
42 Concepts about cost structure of Tioyacu quarry and Rioja plant
| Concept |
Description |
Source |
| Quarry
Operating Cost |
Mineral
Extraction /Exploitation, Processing, Fuel, Materials (Explosives), Maintenance, Insurance and Services |
●
Real, historic costs
●
Suppliers´ quotes |
| Quarry
Operating Cost |
Royalties |
●
Contract of mining royalty payment with regional/state entities |
| Quarry
Operating Cost |
Energy |
●
Historic, real costs
●
Supply Contract
●
Suppliers’ quote |
| Plant
Operating Cost |
Fuel,
Materials, Maintenance, Wages and Insurance |
●
Historic, real costs
●
Suppliers’ quote |
| Plant
Operating Cost |
Energy |
●
Historic, real costs
●
Supply Contract
●
Suppliers’ quote |
Considering
that the Tioyacu quarry and the Rioja plant are in operation, the historical costs are the principal basis for estimating forecasted
costs.
In
this sense, the actual costs in some cases are maintained, and in other cases, are appropriately adjusted for factors specific to the
quarry operation, conditions, and obligations stipulated in supply and concession contracts.
On
the other hand, macroeconomic factors such as inflation and devaluation of the local currency against the US dollar could indirectly
impact future operating costs estimation.
| 18.2. | Capital
and Operating Cost Estimates |
Table
43 details the operating costs of quarry and plant for the year 2023, and 24 years of forecast:
Table
43 Operating costs forecast of quarry and plant
| | |
| Production
Data | | |
| Total | | |
| Cost
per | |
| | |
| Extracted
Mineral | | |
| Cement
Production | | |
| Operating
Cost | | |
| tonne
of
product | |
| | |
| tonnes’ 000 | | |
| tonnes’ 000 | | |
| S/
’000 | | |
| S/
x tonne | |
| | |
| | | |
| | | |
| | | |
| | |
| 2023 | |
| 381 | | |
| 260 | | |
| 96,683 | | |
| 371.16 | |
| 2024 | |
| 552 | | |
| 308 | | |
| 105,561 | | |
| 342.46 | |
| 2025 | |
| 358 | | |
| 375 | | |
| 133,888 | | |
| 357.19 | |
| 2026 | |
| 364 | | |
| 382 | | |
| 138,161 | | |
| 361.36 | |
| 2027 | |
| 364 | | |
| 383 | | |
| 141,665 | | |
| 369.88 | |
| 2028 | |
| 364 | | |
| 383 | | |
| 146,308 | | |
| 382.01 | |
| 2029 | |
| 364 | | |
| 383 | | |
| 148,635 | | |
| 388.08 | |
| 2030 | |
| 364 | | |
| 383 | | |
| 152,618 | | |
| 398.48 | |
| 2031 | |
| 364 | | |
| 383 | | |
| 158,523 | | |
| 413.90 | |
| 2032 | |
| 364 | | |
| 383 | | |
| 161,309 | | |
| 421.17 | |
| 2033 | |
| 364 | | |
| 383 | | |
| 165,755 | | |
| 432.78 | |
| 2034 | |
| 364 | | |
| 383 | | |
| 171,936 | | |
| 448.92 | |
| 2035 | |
| 364 | | |
| 383 | | |
| 174,621 | | |
| 455.93 | |
| 2036 | |
| 364 | | |
| 383 | | |
| 178,374 | | |
| 465.73 | |
| 2037 | |
| 364 | | |
| 383 | | |
| 184,948 | | |
| 482.89 | |
| 2038 | |
| 364 | | |
| 383 | | |
| 188,190 | | |
| 491.36 | |
| 2039 | |
| 364 | | |
| 383 | | |
| 193,003 | | |
| 503.93 | |
| 2040 | |
| 364 | | |
| 383 | | |
| 199,651 | | |
| 521.28 | |
| 2041 | |
| 364 | | |
| 383 | | |
| 202,919 | | |
| 529.81 | |
| 2042 | |
| 364 | | |
| 383 | | |
| 208,195 | | |
| 543.59 | |
| 2043 | |
| 364 | | |
| 383 | | |
| 215,488 | | |
| 562.63 | |
| 2044 | |
| 364 | | |
| 383 | | |
| 219,687 | | |
| 573.59 | |
| 2045 | |
| 364 | | |
| 383 | | |
| 225,417 | | |
| 588.56 | |
| 2046 | |
| 364 | | |
| 383 | | |
| 233,329 | | |
| 609.21 | |
| 2047 | |
| 364 | | |
| 383 | | |
| 238,113 | | |
| 621.70 | |
Table
44 shows the projection for the next 24 years, according to the production plan for 24 years of Reserves. Costs are adjusted annually
by applying a 2.90% inflation rate to the cost/tonne.
Costs
described in this chapter are applied to estimate the Mineral Resources and Reserves of the Tioyacu quarry as part of the analysis.
Table
44 shows the detail of capital investments in the quarry and plant, by type of investment, for one year of historical result (2023),
and 24 years of projection:
Table
44 Investment forecast in quarry and plant
| | |
Total | |
| | |
Investments | |
| | |
S/
’000 | |
| 2023 | |
| 2,169 | |
| 2024 | |
| 5,139 | |
| 2025 | |
| 5,288 | |
| 2026 | |
| 5,441 | |
| 2027 | |
| 5,599 | |
| 2028 | |
| 5,762 | |
| 2029 | |
| 5,929 | |
| 2030 | |
| 6,101 | |
| 2031 | |
| 6,277 | |
| 2032 | |
| 6,460 | |
| 2033 | |
| 6,647 | |
| 2034 | |
| 6,840 | |
| 2035 | |
| 7,038 | |
| 2036 | |
| 7,242 | |
| 2037 | |
| 7,452 | |
| 2038 | |
| 7,668 | |
| 2039 | |
| 7,891 | |
| 2040 | |
| 8,119 | |
| 2041 | |
| 8,355 | |
| 2042 | |
| 8,597 | |
| 2043 | |
| 8,846 | |
| 2044 | |
| 9,103 | |
| 2045 | |
| 9,367 | |
| 2046 | |
| 9,639 | |
| 2047 | |
| 9,918 | |
| 2048 | |
| 5,139 | |
| 2049 | |
| 5,288 | |
| 2050 | |
| 5,441 | |
In
recent years, there have been no significant variations in capital investment, which correspond mainly to maintenance and replacement
of equipment in the quarry and plant to sustain operations. The Company´s investment plan does not consider any unusual or expansion
activity. It is solely planned to perform the necessary replacement for the quarry support and the maintenance of operations in the plant.
The investments are kept at levels similar to those registered throughout the last few years.
| 18.3. | Capital
and Operating Cost Estimation Risks |
There
is a low risk associated with capital and production costs because mine production and cement plant operation will continue in the same
geological deposit and using the same mining and industrial methods.
An
assessment of the accuracy of estimation methods is reflected in the sensitivity analysis in Section 19.
For
purposes of the Preliminary Feasibility Study completed relative to the Tioyacu quarry and Rioja plant, capital and operating costs are
estimated to an accuracy of +/- 25%.
| 19.1. | Methodology:
Discounted Cash Flow (Free) |
The
Economic Analysis chapter describes the assumptions, parameters and methodology used to demonstrate the economic viability or profitability
of extracting the mineral Reserves. That is, the pre-feasibility level support for the determination of mineral Resources and Reserves,
by means of a business valuation through the Discounted (Free or Economic) Cash Flow method.
The
horizon of the cash flow projection is consistent with the life of the quarry, which is calculated based on the total declared Reserves
and the annual production at the quarry. Each period’s cash flow is approximated indirectly from the EBITDA (the latter is constructed
in the Profit and Loss Statement), and the corresponding adjustments are made for taxes and capital costs (CapEx).
Finally,
for this economic analysis we use the free cash flow, since it does not incorporate the company’s capital structure, and we apply
the weighted average cost of capital (WACC) for discounting future cash flows.
| 19.2.1. | General
and Macroeconomic Assumptions |
The
general and macroeconomic assumptions used for the projection of economic cash flows and the valuation are:
| ● | Projection
horizon: 24 years (2024 to 2047) according to the estimated years of quarry life. |
| ● | The
annual escalatioin rate; 2.90%, based on The International Monetary Fund as of October 2023:
applies equally to the sales price, costs, and expenses. |
| ● | Capital
cost projections were determined using a historical ratio of annual investments and maintenance
costs, which also considers the increase in production volume. |
| ● | The
company’s financing structure is being considered in the discount rate (WACC), which
is 11.56%. |
| ● | Income
tax rate: effective rate of actual (historical) business results, 29% - 30%. |
| ● | Workers’
Profit Sharing: 10%. |
| ● | Exchange
rate: exchange rate is assumed to remain at 3.80 (USD/PEN). |
| 19.2.2. | Income
and Cost Assumptions |
| ● | The
sales price of cement, expressed as S/ x t, is the sales price of the Rioja plant to Dino
Selva Iquitos, FOB at Rioja plant; which is lower than the sales price to the final customer
in the market. The distribution freight explains this difference to the multiple points of
sale and the selling expenses associated with distribution and promotion in the different
commercial channels. |
| ● | The
base price used in the projection is an estimate for the year 2024 (561.2 S/ x t), which
has been determined based on current market conditions and cement demand for 2024, among
other factors. |
| ● | Starting
in 2025 (year 2 of the projection), an annual price escalation rate of 2.9% is applied the
sales prices. |
| ● | The
cost of cement production, expressed as S/ x t, has been estimated for 2024 based on actual
operating expenses, the market situation of local materials and services, plant demand for
imported clinker, and other factors. The cost of production for year 2024 is 342.5 S/ x t. |
| ● | Starting
in 2025, an annual cost escalation rate of 2.9% is applied to the cost. |
| ● | The
initial stock of products in the quarry and plant is assumed to be zero. |
| 19.3. | Financial
Model Results |
The
following financial parameters were calculated:
| ● | NPV
of 363 million Soles at a discount rate of 11.56%. |
| ● | 24-year
mine life, because of the update of the maximum capacities of the vertical kilns of Planta
Rioja. |
| ● | Average
plant throughput of 0.4 million tonnes per year over the 24-year projection. |
| ● | Average
sales price of 724.6 Soles per ton of cement, on average for the 24-year projection, at nominal
values. |
| ● | Revenues
of 275 million Soles, on average for the 24-year projection. |
| ● | Average
cash production cost of 469.4 Soles per ton of cement, on average for the 24-year projection,
at nominal values. |
Table
45 shows the forecasted Profit and Loss Statement for the Tioyacu quarry and Rioja plant operation:
Table
45 Profit and Loss Statement
| | |
Shipments
(tonnes) | | |
Revenue
S/ x t | | |
Gross
Profit
S/ ’000 | | |
Gross
Margin
S/ x t | | |
Gross
Mg
% | | |
Operating
Profit | | |
(+)
Depreciation | | |
EBITDA
Rioja Plant | | |
EBITDA
Mg % | |
| | |
| | |
| | |
| | |
| | |
| | |
| | |
| | |
| | |
| |
| 2024P | |
| 308,242 | | |
| 561.2 | | |
| 61,290 | | |
| 198.8 | | |
| 35 | % | |
| 47,698 | | |
| 9,959 | | |
| 57,657 | | |
| 33 | % |
| 2025P | |
| 374,838 | | |
| 540.6 | | |
| 62,213 | | |
| 166.0 | | |
| 31 | % | |
| 48,157 | | |
| 11,121 | | |
| 59,278 | | |
| 29 | % |
| 2026P | |
| 382,335 | | |
| 554.9 | | |
| 66,957 | | |
| 175.1 | | |
| 32 | % | |
| 52,487 | | |
| 10,869 | | |
| 63,356 | | |
| 30 | % |
| 2027P | |
| 383,000 | | |
| 569.7 | | |
| 69,208 | | |
| 180.7 | | |
| 32 | % | |
| 54,397 | | |
| 10,517 | | |
| 64,914 | | |
| 30 | % |
| 2028P | |
| 383,000 | | |
| 584.8 | | |
| 70,230 | | |
| 183.4 | | |
| 31 | % | |
| 54,991 | | |
| 9,596 | | |
| 64,586 | | |
| 29 | % |
| 2029P | |
| 383,000 | | |
| 600.2 | | |
| 73,508 | | |
| 191.9 | | |
| 32 | % | |
| 57,774 | | |
| 9,599 | | |
| 67,373 | | |
| 29 | % |
| 2030P | |
| 383,000 | | |
| 616.2 | | |
| 75,421 | | |
| 196.9 | | |
| 32 | % | |
| 59,157 | | |
| 9,922 | | |
| 69,079 | | |
| 29 | % |
| 2031P | |
| 383,000 | | |
| 632.5 | | |
| 75,730 | | |
| 197.7 | | |
| 31 | % | |
| 58,912 | | |
| 10,058 | | |
| 68,970 | | |
| 28 | % |
| 2032P | |
| 383,000 | | |
| 649.2 | | |
| 79,032 | | |
| 206.3 | | |
| 32 | % | |
| 61,652 | | |
| 10,257 | | |
| 71,909 | | |
| 29 | % |
| 2033P | |
| 383,000 | | |
| 666.4 | | |
| 80,976 | | |
| 211.4 | | |
| 32 | % | |
| 63,011 | | |
| 10,759 | | |
| 73,769 | | |
| 29 | % |
| 2034P | |
| 383,000 | | |
| 684.1 | | |
| 81,489 | | |
| 212.8 | | |
| 31 | % | |
| 63,002 | | |
| 10,792 | | |
| 73,795 | | |
| 28 | % |
| 2035P | |
| 383,000 | | |
| 702.2 | | |
| 85,353 | | |
| 222.9 | | |
| 32 | % | |
| 66,329 | | |
| 10,513 | | |
| 76,842 | | |
| 29 | % |
| 2036P | |
| 383,000 | | |
| 720.8 | | |
| 88,411 | | |
| 230.8 | | |
| 32 | % | |
| 68,836 | | |
| 9,928 | | |
| 78,763 | | |
| 29 | % |
| 2037P | |
| 383,000 | | |
| 739.9 | | |
| 89,068 | | |
| 232.6 | | |
| 31 | % | |
| 68,928 | | |
| 10,019 | | |
| 78,946 | | |
| 28 | % |
| 2038P | |
| 383,000 | | |
| 759.6 | | |
| 92,939 | | |
| 242.7 | | |
| 32 | % | |
| 72,219 | | |
| 9,946 | | |
| 82,166 | | |
| 28 | % |
| 2039P | |
| 383,000 | | |
| 779.7 | | |
| 95,558 | | |
| 249.5 | | |
| 32 | % | |
| 74,240 | | |
| 10,063 | | |
| 84,303 | | |
| 28 | % |
| 2040P | |
| 383,000 | | |
| 800.3 | | |
| 96,690 | | |
| 252.5 | | |
| 32 | % | |
| 74,758 | | |
| 9,868 | | |
| 84,627 | | |
| 28 | % |
| 2041P | |
| 383,000 | | |
| 821.6 | | |
| 101,093 | | |
| 264.0 | | |
| 32 | % | |
| 78,539 | | |
| 9,446 | | |
| 87,985 | | |
| 28 | % |
| 2042P | |
| 383,000 | | |
| 843.3 | | |
| 103,862 | | |
| 271.2 | | |
| 32 | % | |
| 80,664 | | |
| 9,635 | | |
| 90,299 | | |
| 28 | % |
| 2043P | |
| 383,000 | | |
| 865.7 | | |
| 104,994 | | |
| 274.1 | | |
| 32 | % | |
| 81,122 | | |
| 9,696 | | |
| 90,817 | | |
| 27 | % |
| 2044P | |
| 383,000 | | |
| 888.6 | | |
| 109,152 | | |
| 285.0 | | |
| 32 | % | |
| 84,589 | | |
| 9,808 | | |
| 94,397 | | |
| 28 | % |
| 2045P | |
| 383,000 | | |
| 912.2 | | |
| 112,126 | | |
| 292.8 | | |
| 32 | % | |
| 86,848 | | |
| 10,049 | | |
| 96,897 | | |
| 28 | % |
| 2046P | |
| 383,000 | | |
| 936.3 | | |
| 113,329 | | |
| 295.9 | | |
| 32 | % | |
| 87,316 | | |
| 10,300 | | |
| 97,616 | | |
| 27 | % |
| 2047P | |
| 383,000 | | |
| 961.1 | | |
| 117,605 | | |
| 307.1 | | |
| 32 | % | |
| 90,836 | | |
| 10,562 | | |
| 101,398 | | |
| 28 | % |
Cement
sales at Rioja plant are, on average, S/ 275 million per year (for the period 2024-2047), and the average EBITDA margin for the same
period is 29%. Due to the increase in cement shipments, the installed capacity of clinker is exceeded, and it is necessary to start importing
a minimum quantity from year 2026 until year 2047.
Table
46 shows the Free Cash Flow projection and the valuation of the cement business of Rioja plant:
Table
46 Free Cash Flow and valuation
| | |
FCF
- Valuation (Thousand S/) | |
| | |
(-)
Taxes (EBIT*t) | | |
(-)
CapEx | | |
EBITDA
Planta Pacasmayo | | |
Free
Cash Flow | |
| | |
| | |
| | |
| | |
| |
| 2024P | |
| -18,995 | | |
| -5,139 | | |
| 62,295 | | |
| 38,161 | |
| 2025P | |
| -19,398 | | |
| -5,288 | | |
| 63,961 | | |
| 39,274 | |
| 2026P | |
| -21,344 | | |
| -5,441 | | |
| 68,459 | | |
| 41,674 | |
| 2027P | |
| -22,095 | | |
| -5,599 | | |
| 70,203 | | |
| 42,508 | |
| 2028P | |
| -22,235 | | |
| -5,762 | | |
| 69,933 | | |
| 41,937 | |
| 2029P | |
| -23,287 | | |
| -5,929 | | |
| 72,991 | | |
| 43,775 | |
| 2030P | |
| -23,870 | | |
| -6,101 | | |
| 74,831 | | |
| 44,860 | |
| 2031P | |
| -23,762 | | |
| -6,277 | | |
| 74,698 | | |
| 44,659 | |
| 2032P | |
| -24,914 | | |
| -6,460 | | |
| 77,904 | | |
| 46,531 | |
| 2033P | |
| -25,463 | | |
| -6,647 | | |
| 79,896 | | |
| 47,786 | |
| 2034P | |
| -25,425 | | |
| -6,840 | | |
| 79,921 | | |
| 47,656 | |
| 2035P | |
| -27,187 | | |
| -7,038 | | |
| 83,291 | | |
| 49,066 | |
| 2036P | |
| -28,368 | | |
| -7,242 | | |
| 85,457 | | |
| 49,846 | |
| 2037P | |
| -28,376 | | |
| -7,452 | | |
| 85,649 | | |
| 49,820 | |
| 2038P | |
| -29,681 | | |
| -7,668 | | |
| 89,188 | | |
| 51,839 | |
| 2039P | |
| -30,482 | | |
| -7,891 | | |
| 91,522 | | |
| 53,149 | |
| 2040P | |
| -30,694 | | |
| -8,119 | | |
| 91,896 | | |
| 53,083 | |
| 2041P | |
| -32,186 | | |
| -8,355 | | |
| 95,622 | | |
| 55,081 | |
| 2042P | |
| -33,050 | | |
| -8,597 | | |
| 98,142 | | |
| 56,495 | |
| 2043P | |
| -33,175 | | |
| -8,846 | | |
| 98,705 | | |
| 56,684 | |
| 2044P | |
| -34,527 | | |
| -9,103 | | |
| 102,622 | | |
| 58,992 | |
| 2045P | |
| -35,440 | | |
| -9,367 | | |
| 105,341 | | |
| 60,535 | |
| 2046P | |
| -35,633 | | |
| -9,639 | | |
| 106,107 | | |
| 60,835 | |
| 2047P | |
| -37,061 | | |
| -9,918 | | |
| 110,231 | | |
| 63,252 | |
| WACC | |
| 11.56 | % |
| Economic
NPV (Thousand S/) | |
| 362,968 | |
The
net present value (NPV) of Rioja plant cement business amounts to almost S/ 363 million and it is made up of the sum of the discounted
cash flows of each period, for the 24-year projection.
For
discounting of the cash flows, the weighted average cost of capital of the company (WACC for its acronym in English) was applied.
| 19.4. | Sensitivity
Analysis |
The
sensitivity analysis considers a variation of +/- 5 and 10% in the variables that have the greatest impact on the NPV and EBITDA. These
variables are the cement sales price, operating cost and CapEx.
Tables
47 and 48 detail the sensitivity of the NPV and EBITDA to each variable, respectively, when the variables are varied independently. Figures
16 and 17 show the results of the sensitivity of NPV and EBITDA, respectively, to the three variables:
Table
47 Sensitivity analysis of the Net Present Value
| Variable
/ Variation |
-10% |
-5% |
0% |
+5% |
+10% |
| Price |
-33.6 |
-16.8 |
0 |
18.8 |
33.6 |
| Cost |
22.1 |
11.1 |
0 |
-11.1 |
-22.1 |
| CapEx |
1.1 |
0.5 |
0 |
-0.5 |
-1.1 |
Table
48 Sensitivity analysis of the EBITDA
| Variable
/ Variation |
-10% |
-5% |
0% |
+5% |
+10% |
| Price |
-32.1 |
-16 |
0 |
16 |
32.1 |
| Cost |
21.2 |
10.6 |
0 |
-10.6 |
-21.2 |
| CapEx |
-0.1 |
0 |
0 |
0 |
0.1 |
Figure
16 Sensitivity of Net Present Value

Figure
17 Sensitivity of EBITDA
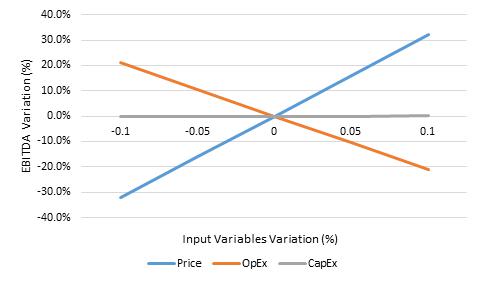
Based
on these results, the NPV is most sensitive to cement price, followed by operating cost, and least susceptible to the CapEx. EBITDA has
a similar sensitivity to NPV, being most exposed to cement price, followed by operating cost, but shows no sensitivity towards variations
to the CapEx.
The
information in this chapter was obtained from the competent authority: Instituto Geológico, Minero Metalúrgico (INGEMMET).
The only public information obtained is shown in the Figure below.
To
the north of the Cementos Selva S.A.C. concession is the Rioja 2 concession owned by Cementos Selva S.A.C.; to the east of the mining
concession is the Rioja 4 concession owned by Cementos Selva S.A.C., and to the southwest is the Rioja 3 concession owned by Cementos
Selva S.A.C.
Figure
18 Concession Calizas Tioyacu and adjacent concessions.
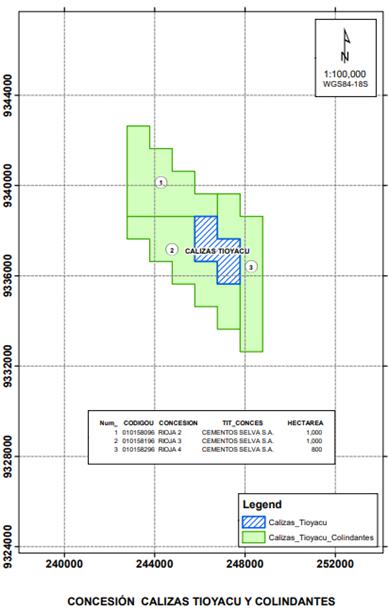
| 21. | Other
relevant data and information |
Not
applicable.
| 22. | Interpretation
and conclusions |
| ● | From
a legal point of view, Cementos Selva S.A.C. has the ownership of the mining properties for
the exploration, development and production of limestone to supply the cement plants for
normal production during the life of the quarry. |
| ● | Cementos
Selva S.A.C. has been complying with international ISO-9001 standards since 2015 and has
implemented Quality Assurance and Quality Control (QAQC). The controls are applied for the
construction of the Geological Model, Resource estimation and Reserves estimation. |
| ● | Cementos
Selva S.A.C. has a quality assurance system in its operations that includes sample preparation
methods, procedures, analysis and security, which comply with the best practices in the industry. |
| ● | The
information verification and validation processes are carried out following the procedures
indicated in the information flows. The validated information is congruent with the one that
generated the geological models, which is the fundamental basis for the estimation of Resources. |
| ● | The
geological modeling of the limestone deposit is consistent with the relationship between
the information and the geological model. |
| ● | The
Mineral Resource and Reserves estimation considers the geologic charateristic and modifying
factors as well as due consideration of risk: geologic and associated with evaluation of
modifiying factors. The main quality variable is the CaO content which is very stable in
the deposit. There are other secondary variables that determine the quality of the Reserves. |
| ● | In
the process of estimating Mineral Reserves and in the production plans of the quarry these
variables have been adequately considered in the mining plan, properly sequenced, and with
blending processes. There are sufficient proven and probable Reserves for the next 24 years. |
| ● | Table
49 shows the Mineral Resources of the Tioyacu quarry the results of Mineral Resource classification.
Likewise, the Mineral Reserves and the results of Mineral Reserve classification are shown
in Table 50. |
Table
49 Mineral Resources (exclusice of Reserves) of Tioyacu quarry
| |
Resources |
Tonnes
M |
CaO
(%) |
Al2O3
(%) |
MgO
(%) |
SiO2
(%) |
K2O
(%) |
| Limestone |
Measured |
0.05 |
50.10 |
0.60 |
1.01 |
5.82 |
0.22 |
| Indicated |
0.5 |
48.01 |
0.67 |
3.32 |
6.23 |
0.19 |
| Measured
+ Indicated |
0.5 |
48.20 |
0.67 |
3.11 |
6.19 |
0.20 |
| Inferred |
19.8 |
46.34 |
0.37 |
5.97 |
2.67 |
0.14 |
| * | No
economic evaluation was performed for the Tioyacu quarry because it only has inferred resources. |
Table
50 Mineral Reserves of Tioyacu quarry
| |
Reserves |
Tonnes
M |
CaO
(%) |
Al2O3
(%) |
MgO
(%) |
SiO2
(%) |
K2O
(%) |
| Limestone |
Proven |
5.9 |
50.17 |
0.61 |
1.01 |
5.86 |
0.22 |
| Probable |
4.4 |
48.07 |
0.72 |
2.18 |
6.84 |
0.21 |
| Total |
10.3 |
49.28 |
0.66 |
1.51 |
6.28 |
0.22 |
| ● | The
cement plant located in Rioja has equipment and facilities available for cement production,
using limestone from the Tioyacu quarry and other necessary materials. |
| ● | The
Health, Safety and Environment department is in charge of supervising and ensuring compliance
with the Company’s corporate policies and the various legal requirements of the national
regulatory bodies by all company departments. |
| ● | Through
its Social Responsibility department, Cementos Selva S.A.C. has built relationships of trust
with the communities surrounding its operations, identifying their primary needs in health,
education, urban development and local development. |
| ● | Infrastructure-wise,
the operation in Tioyacu quarry and Rioja plant, in relation to infrastructure, is technically
and economically feasible due to the life of the quarry. |
| ● | The
sensitivity analysis shows that the operation is economically robust. |
| ● | Maintain
the QaQc program for exploration, development and production activities associated with cement
production. |
| ● | Include
QaQc plans and density control for the subsequent diamond drilling campaigns. |
| ● | It
is recommended to finish the drilling campaign that began in 2023 and carry out the geological
interpretation of the data generated during the campaign, so that it can be incorporated
into the Resource and Reserve model, which will provide greater support and robustness to
these model. |
| ● | Implement
the Geotechnical Monitoring Plan of the quqrry componets with the installation of slope displacement
control lamdmarks. |
| ● | Maintain
a permanent monitoring of the installed piezometers both for water levels and water quality,
to evaluate the evolution of levels during the production of the Tioyacu quarry. |
| ● | It
is recommended that a geophysical study using the Georadar method to identify karst cavities
within the quarry area be conducted, especially in areas of structural anomalies. |
Environmental
Hygiene & Safety S.R.L. (2104). “Almacen de Materias Primas en Exteriores de Planta de Fabricación de Cementos –
Rioja”.
GEOSYM
CONSULTORES S.A.C (2016). Estudio Geológico, Geotécnico, Hidrológicos e Hidrogeológicos de La Cantera
“Tioyacu” – Volumen I: Estudio Geológico.
GEOSYM
CONSULTORES S.A.C (2016). Estudio Geológico, Geotécnico, Hidrológicos e Hidrogeológicos de La Cantera
“Tioyacu” – Volumen II: Estudio Hidrogeológico.
GEOSYM
CONSULTORES S.A.C (2016). Estudio Geológico, Geotécnico, Hidrológicos e Hidrogeológicos de La Cantera
“Tioyacu” – Volumen III: Estudio Geotécnico.
GEOSYM
CONSULTORES S.A.C (2016). Estudio Geológico, Geotécnico, Hidrológicos e Hidrogeológicos de La Cantera
“Tioyacu” – Volumen IV: Estudio Hidrológico.
MINCONSULT
S.R.Ltda, (2012). Plan de Minado.
SEGECO
S.A. (1998). Estudio de Impacto Ambiental De La Cantera de Calizas “Tioyacu” de Cementos Selva S.A.C.
SEGECO
S.A. (2011). Estudio de Impacto Ambiental “Ampliación de Producción Línea 3 – Cementos Selva”.
SEGECO
S.A. (2012). Estudio de Impacto Ambiental “Ampliación de Explotación de la Cantera Tioyacu”.
Walsh
Perú S.A. (2000). Diagnóstico Ambiental Preliminar (DAP) de la Planta Industrial Rioja.
| 25. | Reliance
on information provided by registrant |
In
preparing this report, the qualified persons relied upon data, written reports and statements provided by the registrant in accordance
with 17 CFR § 229.1302(f). After careful review of the information provided, the QPs have no reason to believe that any material
facts have been withheld or misstated. Cementos Selva provided the information as summarized in Table 51.
Table
51 List of Cementos Selva S.A.C. information.
| Chapter |
Chapter
name |
Information
provided by CPSAA |
| 3 |
Property
description |
Legal
matters related to property rights and the authority “Instituto Geológico, Minero y Metalúrgico INGEMMET” |
| 16 |
Market
studies |
Marketing
information, CPSAA information, CSSA information, ASOCEM, INEI and BCRP |
| 17 |
Environmental
studies, permitting, and plans, negotiations, or agreements with local individuals or groups |
Community
Relations and agreements with stakeholders |
| 18 |
Capital
and operating costs |
Historical
data about cost, price and investments |
| 19 |
Economic
analysis |
The
International Monetary Fund, Economic model, Macroeconomic trends, data, assumptions, and interest rates |
| 20 |
Adjacent
properties |
Legal
matters related to property rights and the authority “Instituto Geológico, Minero y Metalúrgico “INGEMMET” |
92
Exhibit 97
INCENTIVE COMPENSATION CLAWBACK POLICY
(As Adopted on November 17, 2023 Pursuant to
NYSE Rule 303A.14)
1. Overview. The Board of Directors (the “Board”)
of Cementos Pacasmayo S.A.A. (the “Company”) has adopted this Incentive Compensation Clawback Policy (the “Policy”)
which requires the recoupment of certain incentive-based compensation in accordance with the terms herein and is intended to comply with
Section 303A.14 of The New York Stock Exchange Listed Company Manual, as such section may be amended from time to time (the “Listing
Rules”). Capitalized terms not otherwise defined herein shall have the meanings assigned to such terms under Section 12 of this
Policy.
2. Interpretation and Administration. The Committee shall have
full authority to interpret and enforce the Policy; provided, however, that the Policy shall be interpreted in a manner consistent with
its intent to meet the requirements of the Listing Rules. As further set forth in Section 10 below, this Policy is intended to supplement
any other clawback policies and procedures that the Company may have in place from time to time pursuant to other applicable law, plans,
policies or agreements.
3. Covered Executives. The Policy applies to each current and
former Executive Officer of the Company who serves or served as an Executive Officer at any time during a performance period in respect
of which Incentive Compensation is Received, to the extent that any portion of such Incentive Compensation is (a) Received by the Executive
Officer during the last three completed Fiscal Years or any applicable Transition Period preceding the date that the Company is required
to prepare a Restatement (regardless of whether any such Restatement is actually filed) and (b) determined to have included Erroneously
Awarded Compensation. For purposes of determining the relevant recovery period referenced in the preceding clause (a), the date that the
Company is required to prepare a Restatement under the Policy is the earlier to occur of (i) the date that the Board, a committee of the
Board, or the officer or officers of the Company authorized to take such action if Board action is not required, concludes, or reasonably
should have concluded, that the Company is required to prepare a Restatement or (ii) the date a court, regulator, or other legally authorized
body directs the Company to prepare a Restatement. Executive Officers subject to this Policy pursuant to this Section 3 are referred to
herein as “Covered Executives.”
4. Recovery of Erroneously Awarded Compensation. If any Erroneously
Awarded Compensation is Received by a Covered Executive, the Company shall reasonably promptly take steps to recover such Erroneously
Awarded Compensation in a manner described under Section 5 of this Policy.
5. Forms of Recovery. The Committee shall determine, in its
sole discretion and in a manner that effectuates the purpose of the Listing Rules, one or more methods for recovering any Erroneously
Awarded Compensation hereunder in accordance with Section 4 above, which may include, without limitation: (a) requiring cash reimbursement;
(b) seeking recovery or forfeiture of any gain realized on the vesting, exercise, settlement, sale, transfer or other disposition of any
equity-based awards; (c) offsetting the amount to be recouped from any compensation otherwise owed by the Company to the Covered Executive;
(d) cancelling outstanding vested or unvested equity awards; or (e) taking any other remedial and recovery action permitted by law, as
determined by the Committee. To the extent the Covered Executive refuses to pay to the Company an amount equal to the Erroneously Awarded
Compensation, the Company shall have the right to sue for repayment and/or enforce the Covered Executive’s obligation to make payment
through the reduction or cancellation of outstanding and future compensation. Any reduction, cancellation or forfeiture of compensation
shall be done in compliance with Section 409A of the Internal Revenue Code of 1986, as amended, and the regulations promulgated thereunder.
6. No Indemnification.The Company shall not indemnify any Covered
Executive against the loss of any Erroneously Awarded Compensation for which the Committee has determined to seek recoupment pursuant
to this Policy.
7. Exceptions to the Recovery Requirement. Notwithstanding anything
in this Policy to the contrary, Erroneously Awarded Compensation need not be recovered pursuant to this Policy if the Committee (or, if
the Committee is not composed solely of Independent Directors, a majority of the Independent Directors serving on the Board) determines
that recovery would be impracticable as a result of any of the following:
(a)
the direct expense paid to a third party to assist in enforcing the Policy would exceed the amount to be recovered; provided that, before
concluding that it would be impracticable to recover any amount of Erroneously Awarded Compensation based on expense of enforcement, the
Company must make a reasonable attempt to recover such Erroneously Awarded Compensation, document such reasonable attempt(s) to recover,
and provide that documentation to the Exchange;
(b) recovery would violate
home country law where that law was adopted prior to November 28, 2022; provided that, before concluding that it would be impracticable
to recover any amount of Erroneously Awarded Compensation based on violation of home country law, the Company must obtain an opinion
of home country counsel, acceptable to the Exchange, that recovery would result in such a violation, and must provide such opinion to
the Exchange; or
(c)
recovery would likely cause an otherwise tax-qualified retirement plan, under which benefits are broadly available to employees of the
Company, to fail to meet the requirements of 26 U.S.C. 401(a)(13) or 26 U.S.C. 411(a) and the regulations thereunder.
8. Committee Determination Final. Any determination by the Committee
with respect to the Policy shall be final, conclusive and binding on all interested parties.
9. Amendment. The Policy may be amended by the Committee from
time to time, to the extent permitted under the Listing Rules.
10. Non-Exclusivity. Nothing in the Policy shall be viewed as
limiting the right of the Company or the Committee to pursue additional remedies or recoupment under or as required by any similar policy
adopted by the Company or under the Company’s compensation plans, award agreements, employment agreements or similar agreements
or the applicable provisions of any law, rule or regulation which may require or permit recoupment to a greater degree or with respect
to additional compensation as compared to this Policy (but without duplication as to any recoupment already made with respect to Erroneously
Awarded Compensation pursuant to this Policy). This Policy shall be interpreted in all respects to comply with the Listing Rules.
11. Successors. The Policy shall be binding and enforceable
against all Covered Executives and their beneficiaries, heirs, executors, administrators or other legal representatives.
12. Defined Terms.
“Covered Executives” shall have the meaning
set forth in Section 3 of this Policy.
“Erroneously Awarded Compensation” shall
mean the amount of Incentive Compensation actually Received that exceeds the amount of Incentive Compensation that otherwise would have
been Received had it been determined based on the restated amounts, and computed without regard to any taxes paid. For Incentive Compensation
based on stock price or total shareholder return, where the amount of erroneously awarded Incentive Compensation is not subject to mathematical
recalculation directly from the information in a Restatement:
(A) The calculation of Erroneously Awarded Compensation
shall be based on a reasonable estimate of the effect of the Restatement on the stock price or total shareholder return upon which the
Incentive Compensation was Received; and
(B) The Company shall maintain documentation of
the determination of that reasonable estimate and provide such documentation to the Exchange.
“Exchange” shall mean [The New York Stock
Exchange] [The Nasdaq Stock Market].
“Executive Officer” shall mean the Company’s
president, principal financial officer, principal accounting officer (or if there is no such accounting officer, the controller), any
vice-president of the Company in charge of a principal business unit, division, or function (such as sales, administration, or finance),
any other officer who performs a policy-making function, or any other person who performs similar policy-making functions for the Company.
Executive officers of the Company’s parent(s) or subsidiaries shall be deemed executive officers of the Company if they perform
such policy-making functions for the Company.
“Financial Reporting Measures” shall mean
measures that are determined and presented in accordance with the accounting principles used in preparing the Company’s financial
statements, and any measures that are derived wholly or in part from such measures, including, without limitation, stock price and total
shareholder return (in each case, regardless of whether such measures are presented within the Company’s financial statements or
included in a filing with the Securities and Exchange Commission).
“Fiscal Year” shall mean the Company’s
fiscal year; provided that a Transition Period between the last day of the Company’s previous fiscal year end and the first day
of its new fiscal year that comprises a period of nine to 12 months will be deemed a completed fiscal year.
“Incentive Compensation” shall mean any compensation
(whether cash or equity-based) that is granted, earned, or vested based wholly or in part upon the attainment of a Financial Reporting
Measure, and may include, but shall not be limited to, performance bonuses and long-term incentive awards such as stock options, stock
appreciation rights, restricted stock, restricted stock units, performance share units or other equity-based awards. For the avoidance
of doubt, Incentive Compensation does not include (i) awards that are granted, earned and vested exclusively upon completion of a specified
employment period, without any performance condition, and (ii) bonus awards that are discretionary or based on subjective goals or goals
unrelated to Financial Reporting Measures. Notwithstanding the foregoing, compensation amounts shall not be considered “Incentive
Compensation” for purposes of the Policy unless such compensation is Received (1) while the Company has a class of securities listed
on a national securities exchange or a national securities association and (2) on or after October 2, 2023, the effective date of the
Listing Rules.
“Independent Director” shall mean a director
who is determined by the Board to be “independent” for Board or Committee membership, as applicable, under the rules of the
Exchange, as of any determination date.
“Listing Rules” shall have the meaning set
forth in Section 1 of this Policy.
Incentive Compensation shall be deemed “Received”
in the Company’s fiscal period during which the Financial Reporting Measure specified in the Incentive Compensation award is attained,
even if the payment or grant of the Incentive Compensation occurs after the end of that period.
“Restatement” shall mean an accounting restatement
due to the material noncompliance of the Company with any financial reporting requirement under the securities laws, including any required
accounting restatement to correct an error in previously issued financial statements that is material to the Company’s previously
issued financial statements, or that would result in a material misstatement if the error were corrected in the current period or left
uncorrected in the current period.
“Transition Period” shall mean any transition
period that results from a change in the Company’s Fiscal Year within or immediately following the three completed Fiscal Years
immediately preceding the Company’s requirement to prepare a Restatement.