 | CHCT | ||||
| LISTED | |||||
| NYSE | |||||
| (State or other jurisdiction of incorporation) | (Commission File Number) | (I.R.S. Employer Identification No.) | ||||||||||||
| (Address of principal executive offices) (Zip Code) | ||
| Title of each Class | Trading Symbol | Name of each exchange on which registered | ||||||||||||
| Exhibit No. | Description | ||||
| 99.1 | Press release dated April 30, 2024 | ||||
| 99.2 | Supplemental Information - First Quarter 2024 | ||||
| 104 | Cover Page Interactive Data File (the cover page XBRL tags are embedded within the inline XBRL document) | ||||
| COMMUNITY HEALTHCARE TRUST INCORPORATED | ||||||||
| By: | /s/ William G. Monroe IV | |||||||
| William G. Monroe IV | ||||||||
| Executive Vice President and Chief Financial Officer | ||||||||
| April 30, 2024 | ||||||||
| (Unaudited) | |||||||||||
| March 31, 2024 | December 31, 2023 | ||||||||||
ASSETS | |||||||||||
Real estate properties: | |||||||||||
Land and land improvements | $ | 142,120 | $ | 136,532 | |||||||
Buildings, improvements, and lease intangibles | 948,253 | 913,416 | |||||||||
Personal property | 317 | 299 | |||||||||
Total real estate properties | 1,090,690 | 1,050,247 | |||||||||
Less accumulated depreciation | (211,058) | (200,810) | |||||||||
Total real estate properties, net | 879,632 | 849,437 | |||||||||
Cash and cash equivalents | 3,805 | 3,491 | |||||||||
Restricted cash | 1,141 | 1,142 | |||||||||
| Real estate properties held for sale | 7,466 | 7,466 | |||||||||
Other assets, net | 90,657 | 83,876 | |||||||||
Total assets | $ | 982,701 | $ | 945,412 | |||||||
LIABILITIES AND STOCKHOLDERS' EQUITY | |||||||||||
Liabilities | |||||||||||
Debt, net | $ | 442,320 | $ | 403,256 | |||||||
Accounts payable and accrued liabilities | 11,775 | 12,032 | |||||||||
Other liabilities, net | 16,960 | 16,868 | |||||||||
Total liabilities | 471,055 | 432,156 | |||||||||
Commitments and contingencies | |||||||||||
Stockholders' Equity | |||||||||||
Preferred stock, $0.01 par value; 50,000 shares authorized; none issued and outstanding | — | — | |||||||||
Common stock, $0.01 par value; 450,000 shares authorized; 27,701 and 27,613 shares issued and outstanding at March 31, 2024 and December 31, 2023, respectively | 277 | 276 | |||||||||
Additional paid-in capital | 690,491 | 688,156 | |||||||||
Cumulative net income | 92,521 | 88,856 | |||||||||
Accumulated other comprehensive gain | 21,490 | 16,417 | |||||||||
Cumulative dividends | (293,133) | (280,449) | |||||||||
Total stockholders’ equity | 511,646 | 513,256 | |||||||||
Total liabilities and stockholders' equity | $ | 982,701 | $ | 945,412 | |||||||
| The Consolidated Balance Sheets do not include all of the information and footnotes required by accounting principles generally accepted in the United States of America for complete financial statements. | ||
| Three Months Ended March 31, | |||||||||||
| 2024 | 2023 | ||||||||||
| (Unaudited) | |||||||||||
| REVENUES | |||||||||||
| Rental income | $ | 28,342 | $ | 26,128 | |||||||
| Other operating interest | 991 | 1,048 | |||||||||
| 29,333 | 27,176 | ||||||||||
| EXPENSES | |||||||||||
| Property operating | 5,791 | 4,873 | |||||||||
General and administrative (1) | 4,554 | 16,205 | |||||||||
| Depreciation and amortization | 10,262 | 9,018 | |||||||||
| 20,607 | 30,096 | ||||||||||
| OTHER INCOME (EXPENSE) | |||||||||||
| Impairment of real estate asset | — | — | |||||||||
| Interest expense | (5,062) | (3,992) | |||||||||
| Deferred income tax expense | — | (35) | |||||||||
| Interest and other income, net | 1 | 25 | |||||||||
| (5,061) | (4,002) | ||||||||||
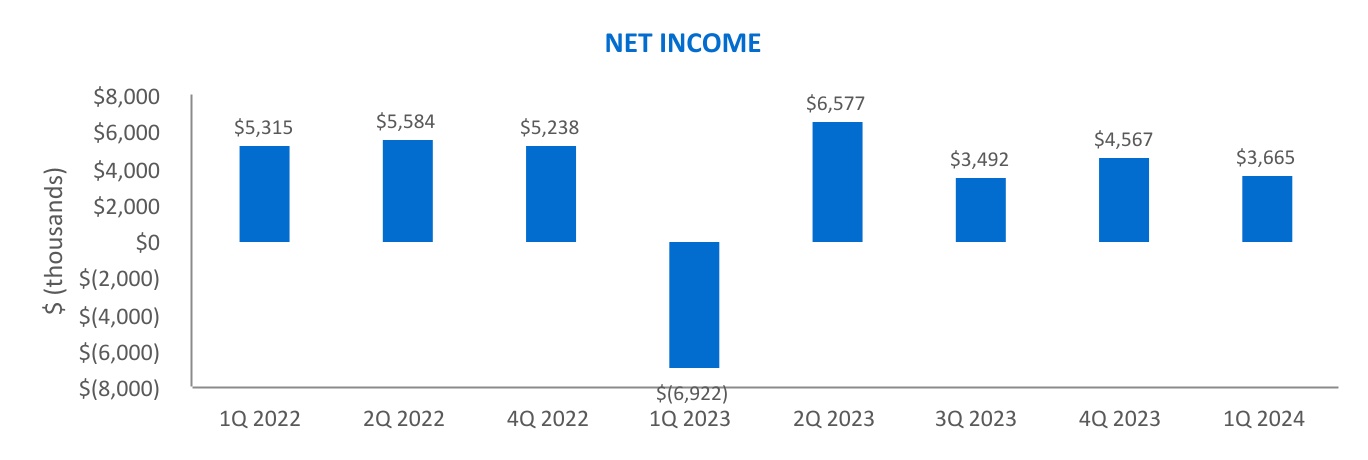
| NET INCOME (LOSS) | $ | 3,665 | $ | (6,922) | |||||||
NET INCOME (LOSS) PER COMMON SHARE (1): | |||||||||||
| Net income (loss) per common share - Basic | $ | 0.11 | $ | (0.32) | |||||||
| Net income (loss) per common share - Diluted | $ | 0.11 | $ | (0.32) | |||||||
| WEIGHTED AVERAGE COMMON SHARES OUTSTANDING-BASIC | 26,297 | 24,227 | |||||||||
| WEIGHTED AVERAGE COMMON SHARES OUTSTANDING-DILUTED | 26,297 | 24,227 | |||||||||
| ___________ | |||||||||||
(1)General and administrative expenses for the three months ended March 31, 2024 included stock-based compensation expense totaling approximately $2.4 million. General and administrative expenses for the three months ended March 31, 2023 included stock-based compensation expense totaling approximately $14.3 million, including the accelerated amortization of stock-based compensation totaling approximately $11.8 million, or $0.49 per diluted common share, recognized upon the passing of our former CEO and President. | |||||||||||
| The Consolidated Statements of Income do not include all of the information and footnotes required by accounting principles generally accepted in the United States of America for complete financial statements. | ||
| Three Months Ended March 31, | |||||||||||
| 2024 | 2023 | ||||||||||
| Net income (loss) | $ | 3,665 | $ | (6,922) | |||||||
| Real estate depreciation and amortization | 10,378 | 9,088 | |||||||||
| FFO | $ | 14,043 | $ | 2,166 | |||||||
| Straight-line rent | (755) | (917) | |||||||||
| Stock-based compensation | 2,424 | 2,547 | |||||||||
Accelerated amortization of stock-based compensation (2) | — | 11,799 | |||||||||
| AFFO | $ | 15,712 | $ | 15,595 | |||||||
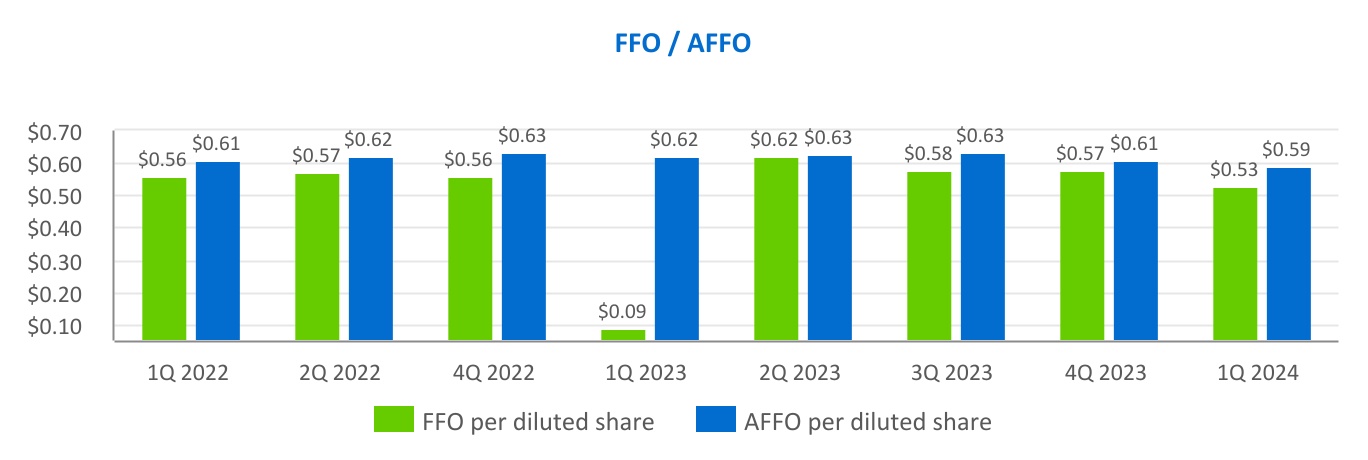
FFO per Common Share-Diluted | $ | 0.53 | $ | 0.09 | |||||||
| AFFO per Common Share-Diluted | $ | 0.59 | $ | 0.62 | |||||||
Weighted Average Common Shares Outstanding-Diluted (3) | 26,707 | 25,298 | |||||||||
| (1) | Historical cost accounting for real estate assets implicitly assumes that the value of real estate assets diminishes predictably over time. However, since real estate values have historically risen or fallen with market conditions, many industry investors deem presentations of operating results for real estate companies that use historical cost accounting to be insufficient by themselves. For that reason, the Company considers funds from operations ("FFO") and adjusted funds from operations ("AFFO") to be appropriate measures of operating performance of an equity real estate investment trust ("REIT"). In particular, the Company believes that AFFO is useful because it allows investors, analysts and Company management to compare the Company's operating performance to the operating performance of other real estate companies and between periods on a consistent basis without having to account for differences caused by unanticipated items and other events. The Company uses the National Association of Real Estate Investment Trusts, Inc. ("NAREIT") definition of FFO. FFO is an operating performance measure adopted by NAREIT. NAREIT defines FFO as the most commonly accepted and reported measure of a REIT’s operating performance equal to net income (calculated in accordance with GAAP), excluding gains or losses from the sale of certain real estate assets, gains and losses from change in control, impairment write-downs of certain real estate assets and investments in entities when the impairment is directly attributable to decreases in the value of depreciable real estate held by the entity, plus depreciation and amortization related to real estate properties, and after adjustments for unconsolidated partnerships and joint ventures. NAREIT also provides REITs with an option to exclude gains, losses and impairments of assets that are incidental to the main business of the REIT from the calculation of FFO. In addition to FFO, the Company presents AFFO and AFFO per share. The Company defines AFFO as FFO, excluding certain expenses related to closing costs of properties acquired accounted for as business combinations and mortgages funded, excluding straight-line rent and the amortization of stock-based compensation, and including or excluding other non-cash items from time to time. AFFO presented herein may not be comparable to similar measures presented by other real estate companies due to the fact that not all real estate companies use the same definition. FFO and AFFO should not be considered as alternatives to net income (determined in accordance with GAAP) as indicators of the Company's financial performance or as alternatives to cash flow from operating activities (determined in accordance with GAAP) as measures of the Company’s liquidity, nor are they necessarily indicative of sufficient cash flow to fund all of the Company’s needs. The Company believes that in order to facilitate a clear understanding of the consolidated historical operating results of the Company, FFO and AFFO should be examined in conjunction with net income as presented elsewhere herein. | ||||
| (2) | In the first quarter of 2023, the Company accelerated the amortization of stock-based compensation upon the passing of our former CEO and President, impacting FFO per diluted share by $0.47. | ||||
| (3) | Diluted weighted average common shares outstanding for FFO and AFFO are calculated based on the treasury method, rather than the 2-class method used to calculate earnings per share. | ||||
| CHCT | ||||
| LISTED | |||||
| NYSE | |||||
SUPPLEMENTAL INFORMATION Q1 2024 | ||
| Community Healthcare Trust | 1Q 2024 | Supplemental Information | |||||||
| ||
Portfolio Diversification | |||||
| Community Healthcare Trust | 1Q 2024 | Supplemental Information | |||||||
| ||
| March 31, 2024 | |||||
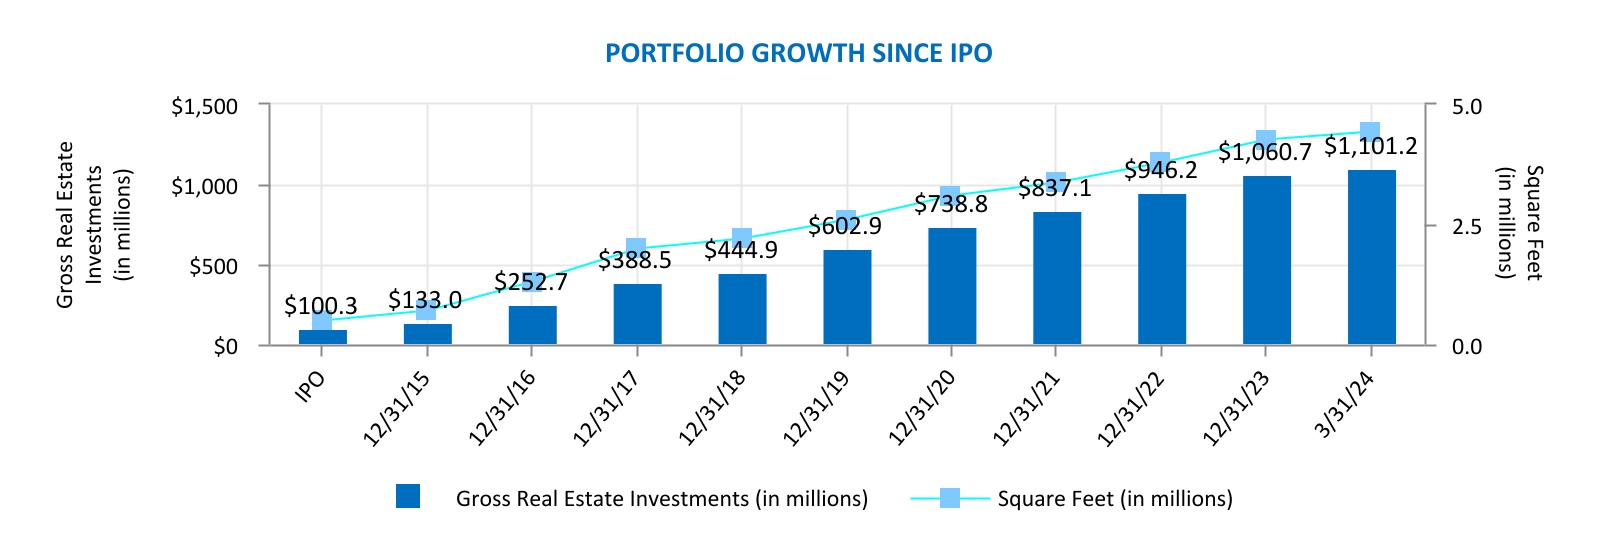
Gross real estate investments (in thousands) (1) | $1,101,171 | ||||
| Total properties | 197 | ||||
% Leased (2) | 92.3 | % | |||
| Total square feet owned | 4,418,834 | ||||
| Weighted Average remaining lease term (years) | 6.9 | ||||
| Cash and cash equivalents and restricted cash (in thousands) | $4,946 | ||||
| Debt to Total Capitalization | 38.0 | % | |||
| Weighted average interest rate per annum on Revolving Line of Credit | 7.1 | % | |||
| Weighted average interest rate per annum on Term Loans | 4.4 | % | |||
| Equity market cap (in millions) | $735.5 | ||||
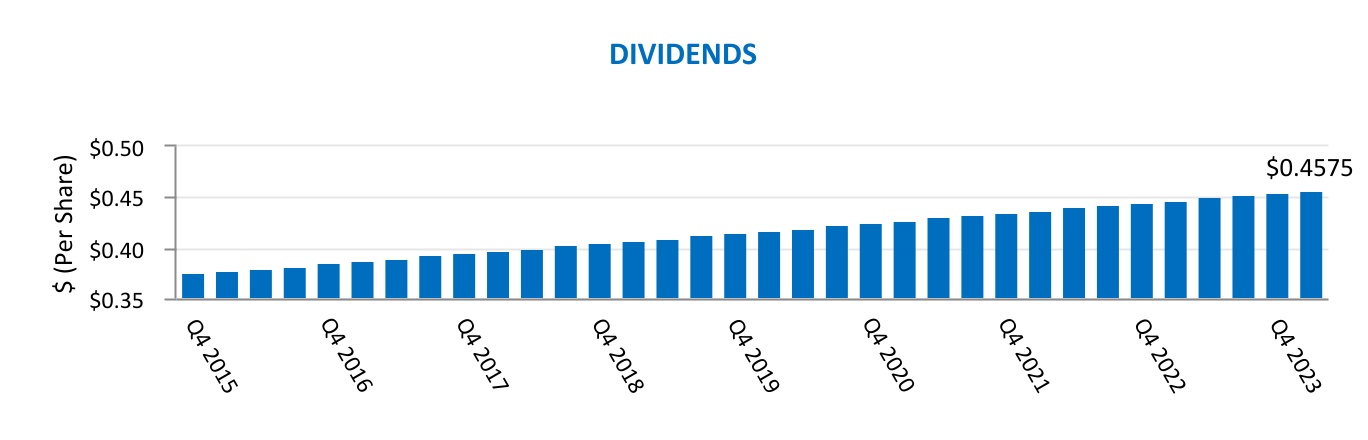
| Quarterly dividend paid in the period (per share) | $0.4575 | ||||
| Quarter end stock price (per share) | $26.55 | ||||
| Dividend yield | 6.89 | % | |||
| Common shares outstanding | 27,701,196 | ||||
| ___________ | |||||
(1) Includes a portion of one property accounted for as a sales-type lease and two properties classified as held for sale. | |||||
(2) Excludes real estate assets held for sale. | |||||
| Community Healthcare Trust | Page | 3 | 1Q 2024 | Supplemental Information | ||||||
| ||
| Community Healthcare Trust Incorporated | |||||||||||||||||
| 3326 Aspen Grove Drive, Suite 150 | |||||||||||||||||
| Franklin, TN 37067 | |||||||||||||||||
| Phone: 615-771-3052 | |||||||||||||||||
| E-mail: Investorrelations@chct.reit | |||||||||||||||||
Website: www.chct.reit | |||||||||||||||||
| BOARD OF DIRECTORS | |||||||||||||||||
| Alan Gardner | Robert Hensley | Claire Gulmi | R. Lawrence Van Horn | Cathrine Cotman | David H. Dupuy | ||||||||||||
| Chairman of the Board | Audit Committee Chair | Compensation Committee Chair | ESG Committee Chair | Board member | Board member | ||||||||||||
| EXECUTIVE MANAGEMENT TEAM | |||||||||||
| David H. Dupuy | William G. Monroe IV | Leigh Ann Stach | Timothy L. Meyer | ||||||||
| Chief Executive Officer and President | Executive Vice President Chief Financial Officer | Executive Vice President Chief Accounting Officer | Executive Vice President Asset Management | ||||||||
| COVERING ANALYSTS | |||||
| A. Goldfarb - Piper Sandler | M. Lewis - Truist Securities | ||||
| J. Kammert - Evercore ISI | R. Stevenson - Janney Capital Markets | ||||
| W. Golladay - Baird | B. Oxford - Colliers International Securities | ||||
| PROFESSIONAL SERVICES | |||||
| Independent Registered Public Accounting Firm | Transfer Agent | ||||
| BDO USA, P.C. | Equiniti Trust Company, LLC | ||||
| 501 Commerce Street, Suite 1400 | Operations Center | ||||
| Nashville, TN 37203 | 6201 15th Avenue | ||||
| Brooklyn, NY 11219 | |||||
| 1-800-937-5449 | |||||
| Community Healthcare Trust | Page | 4 | 1Q 2024 | Supplemental Information | ||||||
| ||
| Three Months Ended | ||||||||||||||||||||
| 1Q 2024 | 4Q 2023 | 3Q 2023 | 2Q 2023 | 1Q 2023 | ||||||||||||||||
| (Unaudited and in thousands, except per share data) | ||||||||||||||||||||
| STATEMENTS OF OPERATIONS ITEMS | ||||||||||||||||||||
| Revenues | $ | 29,333 | $ | 29,124 | $ | 28,735 | $ | 27,810 | $ | 27,176 | ||||||||||
Net income (loss) (1)(2)(3) | $ | 3,665 | $ | 4,567 | $ | 3,492 | $ | 6,577 | $ | (6,922) | ||||||||||
| NOI | $ | 23,542 | $ | 23,526 | $ | 23,279 | $ | 23,024 | $ | 22,303 | ||||||||||
EBITDAre | $ | 18,989 | $ | 19,834 | $ | 19,664 | $ | 19,986 | $ | 6,123 | ||||||||||
Adjusted EBITDAre | $ | 21,413 | $ | 21,863 | $ | 21,562 | $ | 20,972 | $ | 20,469 | ||||||||||
FFO (2) | $ | 14,043 | $ | 14,914 | $ | 14,969 | $ | 15,870 | $ | 2,166 | ||||||||||
| AFFO | $ | 15,712 | $ | 16,071 | $ | 16,423 | $ | 16,037 | $ | 15,595 | ||||||||||
| Per Diluted Share: | ||||||||||||||||||||
| Net income (loss) attributable to common shareholders | $ | 0.11 | $ | 0.15 | $ | 0.11 | $ | 0.24 | $ | (0.32) | ||||||||||
| FFO | $ | 0.53 | $ | 0.57 | $ | 0.58 | $ | 0.62 | $ | 0.09 | ||||||||||
| AFFO | $ | 0.59 | $ | 0.61 | $ | 0.63 | $ | 0.63 | $ | 0.62 | ||||||||||
| ___________ | ||||||||||||||||||||
(1) Net loss for the first quarter of 2023 included accelerated amortization of deferred compensation upon the passing of our former CEO and President of approximately $11.8 million, or $0.47 per diluted common share and $0.46 FFO per diluted share. | ||||||||||||||||||||
| (2) Net income for the second quarter of 2023 includes a $0.7 million net casualty gain recognized from insurance proceeds received related to one property that was vandalized, increasing FFO by $0.03 per diluted share. | ||||||||||||||||||||
(3) Net income for the third quarter of 2023 included accelerated amortization of lease intangibles on the two GenesisCare properties where the leases have been rejected of approximately $1.5 million, or $0.06 per diluted common share. | ||||||||||||||||||||
| Community Healthcare Trust | Page | 5 | 1Q 2024 | Supplemental Information | ||||||
| ||
| As of | ||||||||||||||||||||
| 1Q 2024 | 4Q 2023 | 3Q 2023 | 2Q 2023 | 1Q 2023 | ||||||||||||||||
| (Unaudited and dollars in thousands) | ||||||||||||||||||||
| BALANCE SHEET ITEMS | ||||||||||||||||||||
| ASSETS | ||||||||||||||||||||
| Total real estate properties | $ | 1,090,690 | $ | 1,050,247 | $ | 1,044,893 | $ | 986,948 | $ | 971,026 | ||||||||||
| Total assets | $ | 982,701 | $ | 945,412 | $ | 955,126 | $ | 900,466 | $ | 886,294 | ||||||||||
| CAPITALIZATION | ||||||||||||||||||||
| Net debt | $ | 442,320 | $ | 403,256 | $ | 401,192 | $ | 368,127 | $ | 365,061 | ||||||||||
| Total capitalization | $ | 1,165,024 | $ | 1,117,322 | $ | 1,116,448 | $ | 1,055,221 | $ | 1,033,922 | ||||||||||
| Net debt/total capitalization | 38.0 | % | 36.1 | % | 35.9 | % | 34.9 | % | 35.3 | % | ||||||||||
| Market valuation | $ | 735,467 | $ | 735,603 | $ | 809,760 | $ | 876,392 | $ | 961,617 | ||||||||||
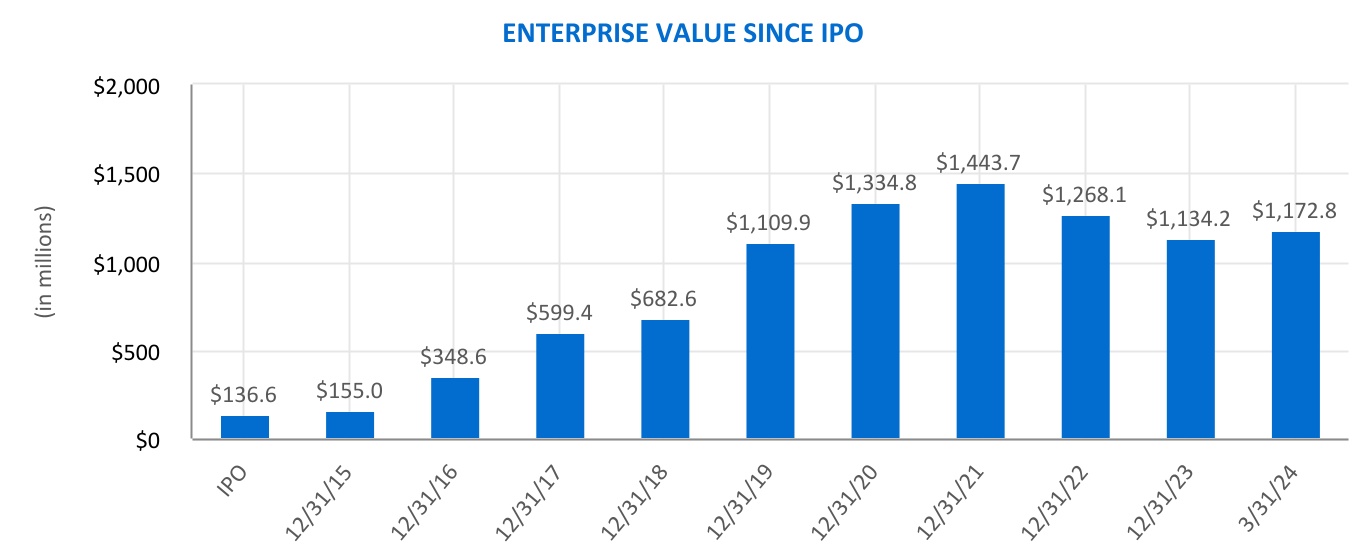
| Enterprise value | $ | 1,172,841 | $ | 1,134,226 | $ | 1,206,019 | $ | 1,240,843 | $ | 1,322,053 | ||||||||||
| Community Healthcare Trust | Page | 6 | 1Q 2024 | Supplemental Information | ||||||
| ||
| As of | |||||||||||||||||
| 1Q 2024 | 4Q 2023 | 3Q 2023 | 2Q 2023 | 1Q 2023 | |||||||||||||
ASSETS | (Unaudited; Dollars and shares in thousands, except per share data) | ||||||||||||||||
Real estate properties | |||||||||||||||||
Land and land improvements | $ | 142,120 | $ | 136,532 | $ | 135,809 | $ | 127,433 | $ | 122,702 | |||||||
Buildings, improvements, and lease intangibles | 948,253 | 913,416 | 908,788 | 859,231 | 848,060 | ||||||||||||
Personal property | 317 | 299 | 296 | 284 | 264 | ||||||||||||
Total real estate properties | 1,090,690 | 1,050,247 | 1,044,893 | 986,948 | 971,026 | ||||||||||||
Less accumulated depreciation | (211,058) | (200,810) | (192,962) | (181,769) | (174,346) | ||||||||||||
Total real estate properties, net | 879,632 | 849,437 | 851,931 | 805,179 | 796,680 | ||||||||||||
Cash and cash equivalents | 3,805 | 3,491 | 3,885 | 2,627 | 3,666 | ||||||||||||
Restricted cash | 1,141 | 1,142 | 1,048 | 1,049 | 959 | ||||||||||||
| Real estate properties held for sale | 7,466 | 7,466 | 1,115 | 1,252 | — | ||||||||||||
Other assets, net | 90,657 | 83,876 | 97,147 | 90,359 | 84,989 | ||||||||||||
Total assets | $ | 982,701 | $ | 945,412 | $ | 955,126 | $ | 900,466 | $ | 886,294 | |||||||
LIABILITIES AND STOCKHOLDERS' EQUITY | |||||||||||||||||
Liabilities | |||||||||||||||||
Debt, net | $ | 442,320 | $ | 403,256 | $ | 401,192 | $ | 368,127 | $ | 365,061 | |||||||
Accounts payable and accrued liabilities | 11,775 | 12,032 | 15,446 | 10,605 | 10,478 | ||||||||||||
Other liabilities, net | 16,960 | 16,868 | 16,194 | 16,409 | 16,240 | ||||||||||||
Total liabilities | 471,055 | 432,156 | 432,832 | 395,141 | 391,779 | ||||||||||||
Commitments and contingencies | |||||||||||||||||
Stockholders' Equity | |||||||||||||||||
Preferred stock, $0.01 par value; 50,000 shares authorized | — | — | — | — | — | ||||||||||||
Common stock, $0.01 par value; 450,000 shares authorized | 277 | 276 | 273 | 265 | 263 | ||||||||||||
Additional paid-in capital | 690,491 | 688,156 | 676,716 | 657,057 | 648,384 | ||||||||||||
Cumulative net income | 92,521 | 88,856 | 84,289 | 80,797 | 74,220 | ||||||||||||
Accumulated other comprehensive gain | 21,490 | 16,417 | 29,038 | 23,085 | 15,684 | ||||||||||||
Cumulative dividends | (293,133) | (280,449) | (268,022) | (255,879) | (244,036) | ||||||||||||
Total stockholders’ equity | 511,646 | 513,256 | 522,294 | 505,325 | 494,515 | ||||||||||||
Total liabilities and stockholders' equity | $ | 982,701 | $ | 945,412 | $ | 955,126 | $ | 900,466 | $ | 886,294 | |||||||
| Community Healthcare Trust | Page | 7 | 1Q 2024 | Supplemental Information | ||||||
| ||
| Three Months Ended | |||||||||||||||||
| 1Q 2024 | 4Q 2023 | 3Q 2023 | 2Q 2023 | 1Q 2023 | |||||||||||||
(Unaudited; Dollars and shares in thousands, except per share data) | |||||||||||||||||
REVENUES | |||||||||||||||||
Rental income | $ | 28,342 | $ | 28,100 | $ | 27,690 | $ | 26,764 | $ | 26,128 | |||||||
Other operating interest | 991 | 1,024 | 1,045 | 1,046 | 1,048 | ||||||||||||
| 29,333 | 29,124 | 28,735 | 27,810 | 27,176 | |||||||||||||
EXPENSES | |||||||||||||||||
Property operating | 5,791 | 5,598 | 5,456 | 4,786 | 4,873 | ||||||||||||
General and administrative (1) (2) | 4,554 | 3,728 | 3,618 | 3,787 | 16,205 | ||||||||||||
Depreciation and amortization | 10,262 | 10,248 | 11,208 | 9,219 | 9,018 | ||||||||||||
| 20,607 | 19,574 | 20,282 | 17,792 | 30,096 | |||||||||||||
| OTHER INCOME (EXPENSE) | |||||||||||||||||
| Impairment of real estate asset | — | — | (102) | — | — | ||||||||||||
| Interest expense | (5,062) | (5,019) | (4,641) | (4,140) | (3,992) | ||||||||||||
| Deferred income tax expense | — | — | (221) | (50) | (35) | ||||||||||||
| Interest and other income, net | 1 | 36 | 3 | 749 | 25 | ||||||||||||
| $ | (5,061) | $ | (4,983) | $ | (4,961) | $ | (3,441) | $ | (4,002) | ||||||||
| NET INCOME (LOSS) | $ | 3,665 | $ | 4,567 | $ | 3,492 | $ | 6,577 | $ | (6,922) | |||||||
NET INCOME (LOSS) PER DILUTED COMMON SHARE | $ | 0.11 | $ | 0.15 | $ | 0.11 | $ | 0.24 | $ | (0.32) | |||||||
WEIGHTED AVERAGE COMMON SHARES OUTSTANDING | 26,297 | 25,981 | 25,514 | 25,065 | 24,227 | ||||||||||||
DIVIDENDS DECLARED, PER COMMON SHARE, IN THE PERIOD | $ | 0.4575 | $ | 0.4550 | $ | 0.4525 | $ | 0.4500 | $ | 0.4475 | |||||||
(1) GENERAL AND ADMINISTRATIVE EXPENSES: | |||||||||||||||||
| Non-cash vs. Cash: | |||||||||||||||||
Non-cash (stock-based compensation) | 53.2 | % | 54.4 | % | 52.5 | % | 44.7 | % | 57.8 | % | |||||||
Cash | 46.8 | % | 45.6 | % | 47.5 | % | 55.3 | % | 42.2 | % | |||||||
| As a % of Revenue: | |||||||||||||||||
Non-cash (stock-based compensation) | 8.3 | % | 6.9 | % | 6.6 | % | 5.9 | % | 9.3 | % | |||||||
Cash | 7.3 | % | 5.8 | % | 6.0 | % | 7.3 | % | 6.8 | % | |||||||
(2) General and administrative expenses for the three months ended March 31, 2023 includes the accelerated amortization of stock-based compensation totaling $11.8 million recognized upon the passing of our former CEO and President but the accelerated amortization is not included in the calculations above in footnote (1). | |||||||||||||||||
| Community Healthcare Trust | Page | 8 | 1Q 2024 | Supplemental Information | ||||||
| ||
| Three Months Ended | ||||||||||||||||||||
| 1Q 2024 | 4Q 2023 | 3Q 2023 | 2Q 2023 | 1Q 2023 | ||||||||||||||||
(Unaudited; Dollars and shares in thousands, except per share data) | ||||||||||||||||||||
| NET INCOME (LOSS) | $ | 3,665 | $ | 4,567 | $ | 3,492 | $ | 6,577 | $ | (6,922) | ||||||||||
| Real estate depreciation and amortization | 10,378 | 10,347 | 11,375 | 9,293 | 9,088 | |||||||||||||||
| Impairment of real estate asset | — | — | 102 | — | — | |||||||||||||||
| Total adjustments | 10,378 | 10,347 | 11,477 | 9,293 | 9,088 | |||||||||||||||
| FFO (1) | $ | 14,043 | $ | 14,914 | $ | 14,969 | $ | 15,870 | $ | 2,166 | ||||||||||
| Straight-line rent | (755) | (872) | (444) | (819) | (917) | |||||||||||||||
| Stock-based compensation | 2,424 | 2,029 | 1,898 | 1,692 | 2,547 | |||||||||||||||
| Accelerated amortization of stock-based compensation | — | — | — | — | 11,799 | |||||||||||||||
| Net gain from insurance recovery on casualty loss | — | — | — | (706) | — | |||||||||||||||
| AFFO | $ | 15,712 | $ | 16,071 | $ | 16,423 | $ | 16,037 | $ | 15,595 | ||||||||||
| FFO PER COMMON SHARE (1) | $ | 0.53 | $ | 0.57 | $ | 0.58 | $ | 0.62 | $ | 0.09 | ||||||||||
| AFFO PER COMMON SHARE | $ | 0.59 | $ | 0.61 | $ | 0.63 | $ | 0.63 | $ | 0.62 | ||||||||||
| WEIGHTED AVERAGE COMMON SHARES OUTSTANDING | 26,707 | 26,346 | 26,025 | 25,650 | 25,298 | |||||||||||||||
| ________________ | ||||||||||||||||||||
| (1) FFO for the second quarter of 2023 includes a $0.7 million net casualty gain from insurance proceeds received related to one property that was vandalized. The net gain increased FFO by $0.03 per diluted share for the three months ended June 30, 2023. | ||||||||||||||||||||
| AFFO, ADJUSTED FOR ACQUISITIONS (1) | ||||||||||||||||||||
| AFFO | $ | 15,712 | $ | 16,071 | $ | 16,423 | $ | 16,037 | $ | 15,595 | ||||||||||
| Revenue on Properties Acquired in the period (2) | 774 | 15 | 757 | 308 | 383 | |||||||||||||||
| Property operating expense adjustment (2) | (71) | (5) | (149) | (71) | (104) | |||||||||||||||
| Interest expense adjustment (3) | (205) | (3) | (165) | (68) | (65) | |||||||||||||||
| AFFO, ADJUSTED FOR ACQUISITIONS | $ | 16,210 | $ | 16,078 | $ | 16,866 | $ | 16,206 | $ | 15,809 | ||||||||||
| (1) AFFO is adjusted to reflect acquisitions as if they had occurred on the first day of the applicable period. | ||||||||||||||||||||
| (2) Revenue and expense adjustments are calculated based on expected returns and leases in place at acquisition. | ||||||||||||||||||||
| (3) Assumes that acquisitions were 40% funded with debt and the remainder funded with equity. The interest expense adjustment was calculated using the weighted average interest rate on the Company's revolving credit facility for the period. | ||||||||||||||||||||
| AMORTIZATION OF STOCK-BASED COMPENSATION (1) | ||||||||||||||||||||
| Amortization Required by GAAP (2) | $ | 2,107 | $ | 2,029 | $ | 1,898 | $ | 1,692 | $ | 2,547 | ||||||||||
| Amortization Based on Legal Vesting Periods | 1,746 | 1,563 | 1,540 | 1,430 | 1,830 | |||||||||||||||
| Acceleration of Amortization | $ | 361 | $ | 466 | $ | 358 | $ | 262 | $ | 717 | ||||||||||
| (1) Excludes the accelerated amortization totaling $11.8 million recognized in the first quarter of 2023 upon the passing of our former CEO and President. | ||||||||||||||||||||
| (2) GAAP requires that deferred compensation be amortized over the earlier of the vesting or retirement eligibility date. | ||||||||||||||||||||
| Community Healthcare Trust | Page | 9 | 1Q 2024 | Supplemental Information | ||||||
| ||
| Three Months Ended | ||||||||||||||||||||
| 1Q 2024 | 4Q 2023 | 3Q 2023 | 2Q 2023 | 1Q 2023 | ||||||||||||||||
(Unaudited; Dollars and shares in thousands, except per share data) | ||||||||||||||||||||
| NET OPERATING INCOME | ||||||||||||||||||||
| Net income (loss) | $ | 3,665 | $ | 4,567 | $ | 3,492 | $ | 6,577 | $ | (6,922) | ||||||||||
| General and administrative | 4,554 | 3,728 | 3,618 | 3,787 | 4,406 | |||||||||||||||
| Accelerated amortization of stock-based compensation | — | — | — | — | 11,799 | |||||||||||||||
| Depreciation and amortization | 10,262 | 10,248 | 11,208 | 9,219 | 9,018 | |||||||||||||||
| Impairment of real estate asset | — | — | 102 | — | — | |||||||||||||||
| Interest expense | 5,062 | 5,019 | 4,641 | 4,140 | 3,992 | |||||||||||||||
| Deferred Income tax expense | — | — | 221 | 50 | 35 | |||||||||||||||
| Interest and other income, net | (1) | (36) | (3) | (749) | (25) | |||||||||||||||
| NOI | $ | 23,542 | $ | 23,526 | $ | 23,279 | $ | 23,024 | $ | 22,303 | ||||||||||
EBITDAre and ADJUSTED EBITDAre | ||||||||||||||||||||
EBITDAre | ||||||||||||||||||||
| Net income (loss) | $ | 3,665 | $ | 4,567 | $ | 3,492 | $ | 6,577 | $ | (6,922) | ||||||||||
| Interest expense | 5,062 | 5,019 | 4,641 | 4,140 | 3,992 | |||||||||||||||
| Depreciation and amortization | 10,262 | 10,248 | 11,208 | 9,219 | 9,018 | |||||||||||||||
| Deferred Income tax expense | — | — | 221 | 50 | 35 | |||||||||||||||
| Impairment of real estate asset | — | — | 102 | — | — | |||||||||||||||
EBITDAre | $ | 18,989 | $ | 19,834 | $ | 19,664 | $ | 19,986 | $ | 6,123 | ||||||||||
| Non-cash stock-based compensation expense | 2,424 | 2,029 | 1,898 | 1,692 | 2,547 | |||||||||||||||
| Accelerated amortization of stock-based compensation | — | — | — | — | 11,799 | |||||||||||||||
| Net gain from insurance recovery on casualty loss | — | — | — | (706) | — | |||||||||||||||
ADJUSTED EBITDAre | $ | 21,413 | $ | 21,863 | $ | 21,562 | $ | 20,972 | $ | 20,469 | ||||||||||
ADJUSTED EBITDAre ANNUALIZED (1) | $ | 85,652 | ||||||||||||||||||
| (1) | Adjusted EBITDAre multiplied by 4. This annualized amount may differ significantly from the actual full year results. | ||||
| Community Healthcare Trust | Page | 10 | 1Q 2024 | Supplemental Information | ||||||
| ||
| Three Months Ended | ||||||||||||||||||||
| 1Q 2024 | 4Q 2023 | 3Q 2023 | 2Q 2023 | 1Q 2023 | ||||||||||||||||
(Unaudited; Dollars and shares in thousands, except per share data) | ||||||||||||||||||||
| WEIGHTED AVERAGE COMMON SHARES OUTSTANDING | ||||||||||||||||||||
| Weighted average common shares outstanding | 27,680 | 27,355 | 26,823 | 26,358 | 26,043 | |||||||||||||||
Unvested restricted shares | (1,383) | (1,374) | (1,309) | (1,293) | (1,816) | |||||||||||||||
Weighted average common shares outstanding - EPS | 26,297 | 25,981 | 25,514 | 25,065 | 24,227 | |||||||||||||||
Weighted average common shares outstanding - FFO Basic | 26,297 | 25,981 | 25,514 | 25,065 | 24,227 | |||||||||||||||
| Dilutive potential common shares (from below) | 410 | 365 | 511 | 585 | 1,071 | |||||||||||||||
| Weighted average common shares outstanding - FFO Diluted | 26,707 | 26,346 | 26,025 | 25,650 | 25,298 | |||||||||||||||
| TREASURY SHARE CALCULATION | ||||||||||||||||||||
| Unrecognized deferred compensation-end of period | $ | 28,564 | $ | 26,776 | $ | 28,814 | $ | 24,780 | $ | 24,465 | ||||||||||
| Unrecognized deferred compensation-beginning of period | $ | 26,776 | $ | 28,814 | $ | 24,780 | $ | 24,465 | $ | 33,652 | ||||||||||
| Average unrecognized deferred compensation | $ | 27,670 | $ | 27,795 | $ | 26,797 | $ | 24,623 | $ | 29,059 | ||||||||||
| Average share price per share | $ | 26.36 | $ | 27.54 | $ | 33.56 | $ | 34.78 | $ | 39.01 | ||||||||||
| Treasury shares | 1,049 | 1,009 | 798 | 708 | 745 | |||||||||||||||
| Unvested restricted shares | (1,383) | (1,374) | (1,309) | (1,293) | (1,816) | |||||||||||||||
| Unvested restricted share units | (76) | — | — | — | — | |||||||||||||||
| Treasury shares | 1,049 | 1,009 | 798 | 708 | 745 | |||||||||||||||
| Dilutive potential common shares | 410 | 365 | 511 | 585 | 1,071 | |||||||||||||||
| Community Healthcare Trust | Page | 11 | 1Q 2024 | Supplemental Information | ||||||
| ||
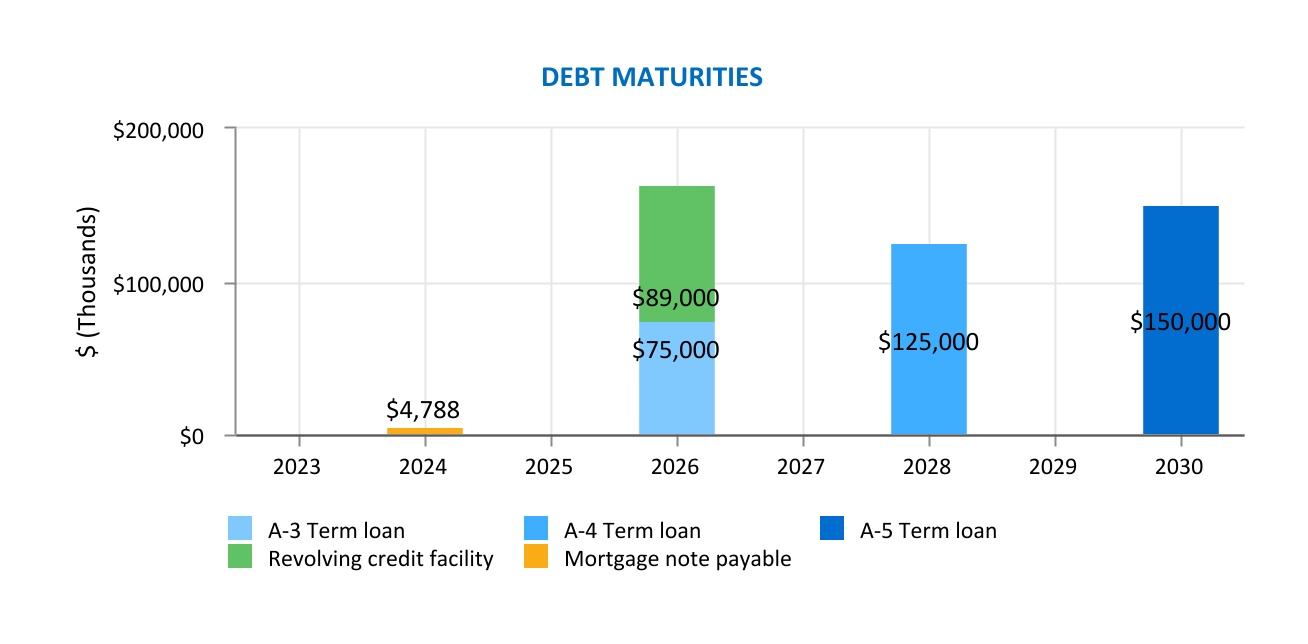
As of March 31, 2024 | |||||||||||
| Principal Balance | Stated Rate | Hedged Rate | |||||||||
| (in thousands) | |||||||||||
| Revolving credit facility | $ | 89,000 | 7.06 | % | — | ||||||
| Term loan A-3 | 75,000 | 4.29 | % | ||||||||
| Term loan A-4 | 125,000 | 3.35 | % | ||||||||
| Term loan A-5 | 150,000 | 5.36 | % | ||||||||
| Total Credit Facility | 439,000 | ||||||||||
| Secured mortgage loan | 4,788 | 4.98 | % | — | |||||||
| Debt | 443,788 | ||||||||||
| Deferred Financing Costs, net | (1,468) | ||||||||||
| Debt, net | $ | 442,320 | |||||||||
| Select Covenants | Required | 1Q 2024 | ||||||
| Leverage ratio | ≤ 60.0% | 39.1 | % | |||||
| Fixed charge coverage ratio | ≥ 1.50x | 4.2 | ||||||
| Tangible net worth (in thousands) | ≥ $499,262 | $691,103 | ||||||
| Secured indebtedness | ≤ 30.0% | 0.4 | % | |||||
| Minimum debt service coverage ratio | ≥ 2.0 | 4.7 | ||||||
| Community Healthcare Trust | Page | 12 | 1Q 2024 | Supplemental Information | ||||||
| ||
| Property | Market | Property Type | Date Acquired | % Leased at Acquisition | Purchase Price (in thousands) | Square Feet | ||||||||||||||
| Hospital of SE Mass. | New Bedford, MA | LTACH | 1/31/2024 | 100.0 | % | $ | 6,500 | 70,657 | ||||||||||||
| Northbay Professional Pavilion | Elkton, MA | MOB | 3/25/2024 | 89.5 | % | 4,500 | 19,656 | |||||||||||||
| Sanford Health Bemidji 1611 | Bemidji, MN | MOB | 3/29/2024 | 100.0 | % | 16,534 | 45,800 | |||||||||||||
| Sanford Health Bemidji 1705 | Bemidji, MN | MOB | 3/29/2024 | 100.0 | % | 6,666 | 28,900 | |||||||||||||
| 98.6 | % | $ | 34,200 | 165,013 | ||||||||||||||||
| Community Healthcare Trust | Page | 13 | 1Q 2024 | Supplemental Information | ||||||
| ||
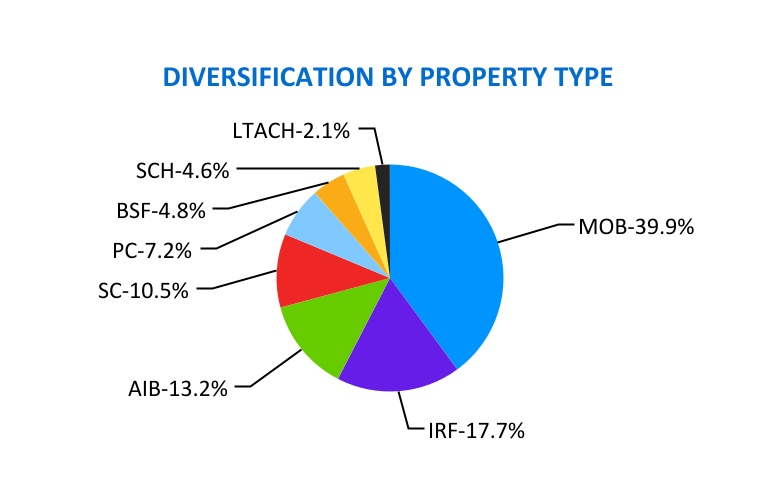
| Property Type | Annualized Rent (%) | ||||
| Medical Office Building (MOB) | 39.9 | % | |||
| Inpatient Rehabilitation Facilities (IRF) | 17.7 | % | |||
| Acute Inpatient Behavioral (AIB) | 13.2 | % | |||
| Specialty Centers (SC) | 10.5 | % | |||
| Physician Clinics (PC) | 7.2 | % | |||
| Behavioral Specialty Facilities (BSF) | 4.8 | % | |||
| Surgical Centers and Hospitals (SCH) | 4.6 | % | |||
| Long-term Acute Care Hospitals (LTACH) | 2.1 | % | |||
| Total | 100.0 | % | |||
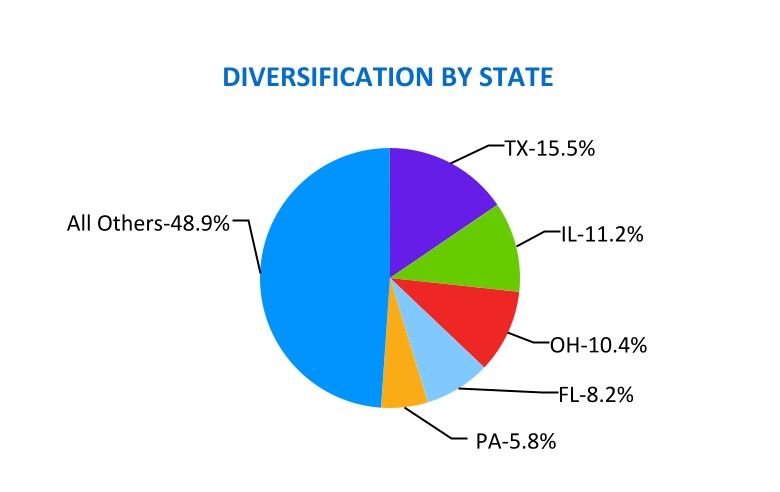
| State | Annualized Rent (%) | ||||
| Texas (TX) | 15.5 | % | |||
| Illinois (IL) | 11.2 | % | |||
| Ohio (OH) | 10.4 | % | |||
| Florida (FL) | 8.2 | % | |||
| Pennsylvania (PA) | 5.8 | % | |||
| All Others | 48.9 | % | |||
| Total | 100.0 | % | |||
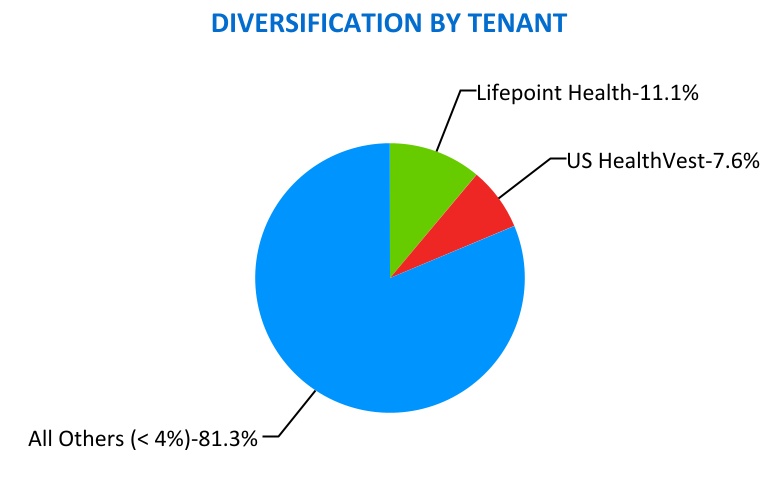
| Tenant | Annualized Rent (%) | ||||
| Lifepoint Health | 11.1 | % | |||
| US HealthVest | 7.6 | % | |||
| All Others (less than 4%) | 81.3 | % | |||
| Total | 100.0 | % | |||
| Community Healthcare Trust | Page | 14 | 1Q 2024 | Supplemental Information | ||||||
| ||
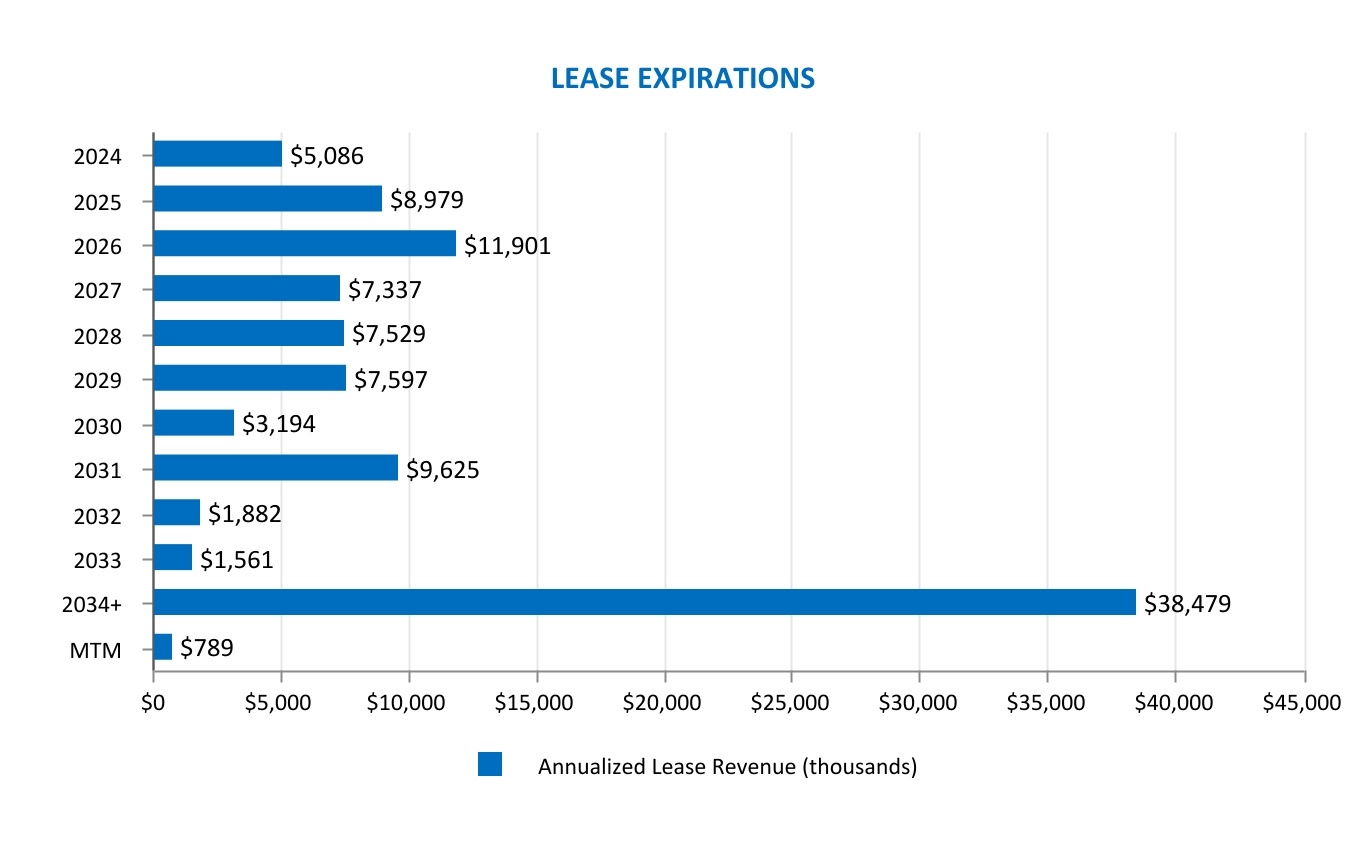
| Total Leased Sq. Ft. | Annualized Rent | |||||||||||||||||||
| Year | Number of Leases Expiring | Amount (thousands) | Percent (%) | Amount ($) (thousands) | Percent (%) | |||||||||||||||
| 2024 | 52 | 243 | 6.0 | % | $ | 5,086 | 4.9 | % | ||||||||||||
| 2025 | 56 | 335 | 8.3 | % | 8,979 | 8.6 | % | |||||||||||||
| 2026 | 69 | 555 | 13.8 | % | 11,901 | 11.4 | % | |||||||||||||
| 2027 | 57 | 347 | 8.6 | % | 7,337 | 7.1 | % | |||||||||||||
| 2028 | 59 | 372 | 9.3 | % | 7,529 | 7.2 | % | |||||||||||||
| 2029 | 30 | 295 | 7.3 | % | 7,597 | 7.3 | % | |||||||||||||
| 2030 | 15 | 112 | 2.8 | % | 3,194 | 3.1 | % | |||||||||||||
| 2031 | 25 | 356 | 8.8 | % | 9,625 | 9.3 | % | |||||||||||||
| 2032 | 11 | 133 | 3.3 | % | 1,882 | 1.8 | % | |||||||||||||
| 2033 | 12 | 75 | 1.9 | % | 1,561 | 1.5 | % | |||||||||||||
| Thereafter | 44 | 1,161 | 28.8 | % | 38,479 | 37.0 | % | |||||||||||||
| Month-to-Month | 10 | 43 | 1.1 | % | 789 | 0.8 | % | |||||||||||||
| Totals | 440 | 4,027 | 100.0 | % | $ | 103,959 | 100.0 | % | ||||||||||||
| Community Healthcare Trust | Page | 15 | 1Q 2024 | Supplemental Information | ||||||
| ||
| Property Name | Property Type | Area | % of Square Feet | Annualized Rent ($000's) | % of Annualized Rent | Population | MSA/MISA | Rank | ||||||||||||||||||
| Lancaster MOB | MOB | 10,646 | 0.24 | % | $ | 335.6 | 0.32 | % | 12,799,100 | Los Angeles-Long Beach-Anaheim, CA | 2 | |||||||||||||||
| Congress Medical Building 350 | MOB | 17,543 | 0.40 | % | $ | 404.5 | 0.39 | % | 9,262,825 | Chicago-Naperville-Elgin, IL-IN | 3 | |||||||||||||||
| Congress Medical Building 390 | MOB | 30,855 | 0.70 | % | $ | 460.3 | 0.44 | % | 9,262,825 | Chicago-Naperville-Elgin, IL-IN | 3 | |||||||||||||||
| Oak Lawn Medical Plaza | MOB | 33,356 | 0.75 | % | $ | 375.1 | 0.36 | % | 9,262,825 | Chicago-Naperville-Elgin, IL-IN | 3 | |||||||||||||||
| Chicago Behavioral Hospital | AIB | 85,000 | 1.92 | % | $ | 2,182.5 | 2.10 | % | 9,262,825 | Chicago-Naperville-Elgin, IL-IN | 3 | |||||||||||||||
| Future Diagnostics Group | SC | 8,876 | 0.20 | % | $ | 390.9 | 0.38 | % | 9,262,825 | Chicago-Naperville-Elgin, IL-IN | 3 | |||||||||||||||
| Gurnee Medical Office Building | MOB | 22,968 | 0.52 | % | $ | 239.6 | 0.23 | % | 9,262,825 | Chicago-Naperville-Elgin, IL-IN | 3 | |||||||||||||||
| Joliet Oncology-Hematology Associates | PC | 7,905 | 0.18 | % | $ | 385.0 | 0.37 | % | 9,262,825 | Chicago-Naperville-Elgin, IL-IN | 3 | |||||||||||||||
| Morris Cancer Center | MOB | 18,470 | 0.42 | % | $ | 623.4 | 0.60 | % | 9,262,825 | Chicago-Naperville-Elgin, IL-IN | 3 | |||||||||||||||
| Presence | PC | 14,863 | 0.34 | % | $ | 310.8 | 0.30 | % | 9,262,825 | Chicago-Naperville-Elgin, IL-IN | 3 | |||||||||||||||
| Presence Regional Cancer Center | SC | 44,888 | 1.02 | % | $ | 1,453.1 | 1.40 | % | 9,262,825 | Chicago-Naperville-Elgin, IL-IN | 3 | |||||||||||||||
| Skin MD | PC | 13,565 | 0.31 | % | $ | 512.2 | 0.49 | % | 9,262,825 | Chicago-Naperville-Elgin, IL-IN | 3 | |||||||||||||||
| US HealthVest - Lake | AIB | 83,658 | 1.89 | % | $ | 2,964.5 | 2.85 | % | 9,262,825 | Chicago-Naperville-Elgin, IL-IN | 3 | |||||||||||||||
| Texas Rehabilitation Hospital of Fort Worth, LLC | IRF | 39,761 | 0.90 | % | $ | 2,028.0 | 1.95 | % | 8,100,037 | Dallas-Fort Worth-Arlington, TX | 4 | |||||||||||||||
| Bayside Medical Center | MOB | 50,593 | 1.14 | % | $ | 1,104.1 | 1.06 | % | 7,510,253 | Houston-Pasadena-The Woodlands, TX | 5 | |||||||||||||||
| Clear Lake Institute for Rehabilitation | IRF | 55,646 | 1.26 | % | $ | 2,986.0 | 2.87 | % | 7,510,253 | Houston-Pasadena-The Woodlands, TX | 5 | |||||||||||||||
| Gessner Road MOB | MOB | 14,360 | 0.32 | % | $ | 356.8 | 0.34 | % | 7,510,253 | Houston-Pasadena-The Woodlands, TX | 5 | |||||||||||||||
| Northwest Surgery Center | SCH | 11,200 | 0.25 | % | $ | — | — | % | 7,510,253 | Houston-Pasadena-The Woodlands, TX | 5 | |||||||||||||||
| Clinton Towers MOB | MOB | 37,344 | 0.85 | % | $ | 966.8 | 0.93 | % | 6,304,975 | Washington-Arlington-Alexandria, DC-VA-MD-WV | 7 | |||||||||||||||
| 2301 Research Boulevard | MOB | 93,079 | 2.11 | % | $ | 2,038.5 | 1.96 | % | 6,304,975 | Washington-Arlington-Alexandria, DC-VA-MD-WV | 7 | |||||||||||||||
| Haddon Hill Professional Center | MOB | 25,118 | 0.57 | % | $ | 278.2 | 0.27 | % | 6,246,160 | Philadelphia-Camden-Wilmington, PA-NJ-DE-MD | 8 | |||||||||||||||
| Hopebridge - Westlake | BSF | 15,057 | 0.34 | % | $ | 232.7 | 0.22 | % | 6,246,160 | Philadelphia-Camden-Wilmington, PA-NJ-DE-MD | 8 | |||||||||||||||
| Continuum Wellness Center | MOB | 8,227 | 0.19 | % | $ | 161.0 | 0.15 | % | 5,070,110 | Phoenix-Mesa-Chandler, AZ | 10 | |||||||||||||||
| Desert Endoscopy Center | SCH | 11,722 | 0.27 | % | $ | — | — | % | 5,070,110 | Phoenix-Mesa-Chandler, AZ | 10 | |||||||||||||||
| Mountain View Surgery Center | SCH | 14,046 | 0.32 | % | $ | 519.7 | 0.50 | % | 5,070,110 | Phoenix-Mesa-Chandler, AZ | 10 | |||||||||||||||
| Community Healthcare Trust | Page | 16 | 1Q 2024 | Supplemental Information | ||||||
| ||
| Property Name | Property Type | Area | % of Square Feet | Annualized Rent ($000's) | % of Annualized Rent | Population | MSA/MISA | Rank | ||||||||||||||||||
| Associated Surgical Center of Dearborn | SCH | 12,400 | 0.28 | % | $ | 361.3 | 0.35 | % | 4,342,304 | Detroit-Warren-Dearborn, MI | 14 | |||||||||||||||
| Berry Surgical Center | SCH | 27,217 | 0.62 | % | $ | 627.7 | 0.60 | % | 4,342,304 | Detroit-Warren-Dearborn, MI | 14 | |||||||||||||||
| Smokey Point Behavioral Hospital | AIB | 70,100 | 1.59 | % | $ | 2,772.8 | 2.67 | % | 4,044,837 | Seattle-Tacoma-Bellevue, WA | 15 | |||||||||||||||
| Sanford Health Bemidji 1611 | MOB | 45,800 | 1.04 | % | $ | 1,523.5 | 1.47 | % | 3,712,020 | Minneapolis-St. Paul-Bloomington, MN-WI | 16 | |||||||||||||||
| Sanford Health Bemidji 1705 | MOB | 28,900 | 0.65 | % | $ | 624.3 | 0.60 | % | 3,712,020 | Minneapolis-St. Paul-Bloomington, MN-WI | 16 | |||||||||||||||
| Bay Area Physicians Surgery Center | MOB | 17,943 | 0.41 | % | $ | 290.1 | 0.28 | % | 3,342,963 | Tampa-St. Petersburg-Clearwater, FL | 17 | |||||||||||||||
| Sanderling Dialysis | SC | 11,300 | 0.26 | % | $ | 427.0 | 0.41 | % | 3,269,973 | San Diego-Chula Vista-Carlsbad, CA | 18 | |||||||||||||||
| Liberty Dialysis | SC | 8,450 | 0.19 | % | $ | 275.9 | 0.27 | % | 3,005,131 | Denver-Aurora-Centennial, CO | 19 | |||||||||||||||
| Waters Edge Medical | MOB | 23,388 | 0.53 | % | $ | 392.0 | 0.38 | % | 2,834,316 | Baltimore-Columbia-Towson, MD | 20 | |||||||||||||||
| Northbay Professional Pavilion | MOB | 19,656 | 0.44 | % | $ | 479.0 | 0.46 | % | 2,834,316 | Baltimore-Columbia-Towson, MD | 20 | |||||||||||||||
| Righttime Medical Care | SC | 6,236 | 0.14 | % | $ | 347.4 | 0.33 | % | 2,834,316 | Baltimore-Columbia-Towson, MD | 20 | |||||||||||||||
| Bassin Center For Plastic-Surgery-Villages | PC | 2,894 | 0.07 | % | $ | 170.2 | 0.16 | % | 2,817,933 | Orlando-Kissimmee-Sanford, FL | 21 | |||||||||||||||
| Bassin Center For Plastic Surgery-Orlando | PC | 2,420 | 0.05 | % | $ | 142.3 | 0.14 | % | 2,817,933 | Orlando-Kissimmee-Sanford, FL | 21 | |||||||||||||||
| Kissimmee Physicians Clinic | PC | 4,902 | 0.11 | % | $ | 110.3 | 0.11 | % | 2,817,933 | Orlando-Kissimmee-Sanford, FL | 21 | |||||||||||||||
| Orthopaedic Associates of Osceola | PC | 15,167 | 0.34 | % | $ | 357.6 | 0.34 | % | 2,817,933 | Orlando-Kissimmee-Sanford, FL | 21 | |||||||||||||||
| Medical Village at Wintergarden | MOB | 21,532 | 0.49 | % | $ | 606.9 | 0.58 | % | 2,817,933 | Orlando-Kissimmee-Sanford, FL | 21 | |||||||||||||||
| Eyecare Partners | PC | 6,487 | 0.15 | % | $ | — | — | % | 2,796,999 | St. Louis, MO-IL | 23 | |||||||||||||||
| Eyecare Partners | PC | 5,560 | 0.13 | % | $ | 52.8 | 0.05 | % | 2,796,999 | St. Louis, MO-IL | 23 | |||||||||||||||
| Eyecare Partners | SCH | 16,608 | 0.38 | % | $ | 310.6 | 0.30 | % | 2,796,999 | St. Louis, MO-IL | 23 | |||||||||||||||
| Eyecare Partners | PC | 6,311 | 0.14 | % | $ | 49.5 | 0.05 | % | 2,796,999 | St. Louis, MO-IL | 23 | |||||||||||||||
| Baptist Health | PC | 13,500 | 0.31 | % | $ | 403.1 | 0.39 | % | 2,703,999 | San Antonio-New Braunfels, TX | 24 | |||||||||||||||
| San Antonio Head & Neck Surgical Associates | PC | 6,500 | 0.15 | % | $ | 187.9 | 0.18 | % | 2,703,999 | San Antonio-New Braunfels, TX | 24 | |||||||||||||||
| JDH Professional Building | MOB | 12,376 | 0.28 | % | $ | 261.9 | 0.25 | % | 2,703,999 | San Antonio-New Braunfels, TX | 24 | |||||||||||||||
| Butler Medical Center | MOB | 10,116 | 0.23 | % | $ | 273.3 | 0.26 | % | 2,422,725 | Pittsburgh, PA | 27 | |||||||||||||||
| The Heart & Vascular Center | MOB | 15,878 | 0.36 | % | $ | 315.5 | 0.30 | % | 2,422,725 | Pittsburgh, PA | 27 | |||||||||||||||
| Forefront Dermatology Building | MOB | 15,650 | 0.35 | % | $ | 342.0 | 0.33 | % | 2,422,725 | Pittsburgh, PA | 27 | |||||||||||||||
| Greentree Primary Care | MOB | 34,077 | 0.77 | % | $ | 885.6 | 0.85 | % | 2,422,725 | Pittsburgh, PA | 27 | |||||||||||||||
| Vascular Access Centers of Southern Nevada | SC | 4,800 | 0.11 | % | $ | 97.9 | 0.09 | % | 2,336,573 | Las Vegas-Henderson-North Las Vegas, NV | 29 | |||||||||||||||
| Assurance Health System | BSF | 14,381 | 0.33 | % | $ | 555.4 | 0.53 | % | 2,271,479 | Cincinnati, OH-KY-IN | 30 | |||||||||||||||
| Community Healthcare Trust | Page | 17 | 1Q 2024 | Supplemental Information | ||||||
| ||
| Property Name | Property Type | Area | % of Square Feet | Annualized Rent ($000's) | % of Annualized Rent | Population | MSA/MISA | Rank | ||||||||||||||||||
| Cavalier Medical & Dialysis Center | MOB | 17,614 | 0.40 | % | $ | 218.7 | 0.21 | % | 2,271,479 | Cincinnati, OH-KY-IN | 30 | |||||||||||||||
| 51 Cavalier Blvd | MOB | 17,935 | 0.41 | % | $ | 182.8 | 0.18 | % | 2,271,479 | Cincinnati, OH-KY-IN | 30 | |||||||||||||||
| Anderson Ferry Plaza | MOB | 43,671 | 0.99 | % | $ | 497.6 | 0.48 | % | 2,271,479 | Cincinnati, OH-KY-IN | 30 | |||||||||||||||
| Liberty Rehabilitation Hospital | IRF | 37,720 | 0.85 | % | $ | 2,444.9 | 2.35 | % | 2,271,479 | Cincinnati, OH-KY-IN | 30 | |||||||||||||||
| Davita Commercial Way | SC | 4,980 | 0.11 | % | $ | — | — | % | 2,271,479 | Cincinnati, OH-KY-IN | 30 | |||||||||||||||
| Fresenius Florence Dialysis Center | MOB | 17,845 | 0.40 | % | $ | 254.5 | 0.24 | % | 2,271,479 | Cincinnati, OH-KY-IN | 30 | |||||||||||||||
| Prairie Star Medical Facility I | MOB | 24,724 | 0.56 | % | $ | 628.5 | 0.60 | % | 2,221,343 | Kansas City, MO-KS | 31 | |||||||||||||||
| Prairie Star Medical Facility II | MOB | 24,840 | 0.56 | % | $ | 87.9 | 0.08 | % | 2,221,343 | Kansas City, MO-KS | 31 | |||||||||||||||
| Court Street Surgery Center | SCH | 7,787 | 0.18 | % | $ | 80.2 | 0.08 | % | 2,180,271 | Columbus, OH | 32 | |||||||||||||||
| Ravines Edge | MOB | 16,751 | 0.38 | % | $ | 263.9 | 0.25 | % | 2,180,271 | Columbus, OH | 32 | |||||||||||||||
| Hopebridge - Columbus | BSF | 13,969 | 0.32 | % | $ | 173.0 | 0.17 | % | 2,180,271 | Columbus, OH | 32 | |||||||||||||||
| Sedalia Medical Center | MOB | 19,324 | 0.44 | % | $ | 295.0 | 0.28 | % | 2,180,271 | Columbus, OH | 32 | |||||||||||||||
| Brook Park Medical Building | MOB | 18,444 | 0.42 | % | $ | 283.2 | 0.27 | % | 2,158,932 | Cleveland, OH | 33 | |||||||||||||||
| Assurance - Hudson | BSF | 13,290 | 0.30 | % | $ | 570.8 | 0.55 | % | 2,158,932 | Cleveland, OH | 33 | |||||||||||||||
| Smith Road | MOB | 16,802 | 0.38 | % | $ | 318.3 | 0.31 | % | 2,158,932 | Cleveland, OH | 33 | |||||||||||||||
| Rockside Medical Center | MOB | 55,316 | 1.25 | % | $ | 1,023.1 | 0.98 | % | 2,158,932 | Cleveland, OH | 33 | |||||||||||||||
| Assurance Health, LLC | BSF | 10,200 | 0.23 | % | $ | 372.9 | 0.36 | % | 2,138,468 | Indianapolis-Carmel-Greenwood, IN | 34 | |||||||||||||||
| Assurance Health System | BSF | 13,722 | 0.31 | % | $ | 510.6 | 0.49 | % | 2,138,468 | Indianapolis-Carmel-Greenwood, IN | 34 | |||||||||||||||
| Kindred Hospital Indianapolis North | LTACH | 37,270 | 0.84 | % | $ | 1,566.9 | 1.51 | % | 2,138,468 | Indianapolis-Carmel-Greenwood, IN | 34 | |||||||||||||||
| Virginia Orthopaedic & Spine Specialists | PC | 8,445 | 0.19 | % | $ | 153.1 | 0.15 | % | 1,787,169 | Virginia Beach-Chesapeake-Norfolk, VA-NC | 37 | |||||||||||||||
| Hospital of SE Mass. | LTACH | 70,657 | 1.60 | % | $ | 633.8 | 0.61 | % | 1,677,803 | Providence-Warwick, RI-MA | 39 | |||||||||||||||
| Warwick Oncology Center | SC | 10,236 | 0.23 | % | $ | 393.5 | 0.38 | % | 1,677,803 | Providence-Warwick, RI-MA | 39 | |||||||||||||||
| South County Hospital | PC | 13,268 | 0.30 | % | $ | 317.5 | 0.31 | % | 1,677,803 | Providence-Warwick, RI-MA | 39 | |||||||||||||||
| Ortho Rhode Island - Warwick | PC | 7,340 | 0.17 | % | $ | 217.0 | 0.21 | % | 1,677,803 | Providence-Warwick, RI-MA | 39 | |||||||||||||||
| Mercy Rehabilitation Hospital | IRF | 39,637 | 0.90 | % | $ | 2,028.0 | 1.95 | % | 1,477,926 | Oklahoma City, OK | 42 | |||||||||||||||
| Memphis Center | MOB | 11,669 | 0.26 | % | $ | 232.3 | 0.22 | % | 1,335,674 | Memphis, TN-MS-AR | 45 | |||||||||||||||
| Sanderling Dialysis | SC | 10,133 | 0.23 | % | $ | 552.4 | 0.53 | % | 1,335,674 | Memphis, TN-MS-AR | 45 | |||||||||||||||
| Gardendale MOB | MOB | 12,956 | 0.29 | % | $ | 325.7 | 0.31 | % | 1,184,290 | Birmingham, AL | 47 | |||||||||||||||
| Sterling Medical Center | MOB | 28,685 | 0.65 | % | $ | 520.8 | 0.50 | % | 1,155,604 | Buffalo-Cheektowaga, NY | 50 | |||||||||||||||
| Glastonbury | MOB | 49,593 | 1.12 | % | $ | 673.3 | 0.65 | % | 1,151,543 | Hartford-West Hartford-East Hartford, CT | 51 | |||||||||||||||
| Los Alamos Professional Plaza | MOB | 43,395 | 0.98 | % | $ | 563.2 | 0.54 | % | 898,471 | McAllen-Edinburg-Mission, TX | 65 | |||||||||||||||
| Community Healthcare Trust | Page | 18 | 1Q 2024 | Supplemental Information | ||||||
| ||
| Property Name | Property Type | Area | % of Square Feet | Annualized Rent ($000's) | % of Annualized Rent | Population | MSA/MISA | Rank | ||||||||||||||||||
| El Paso Rehabilitation Hospital | IRF | 38,000 | 0.86 | % | $ | 2,138.5 | 2.06 | % | 873,331 | El Paso, TX | 68 | |||||||||||||||
| UMass Memorial Health Cancer Center | SC | 20,046 | 0.45 | % | $ | 861.4 | 0.83 | % | 866,866 | Worcester, MA | 69 | |||||||||||||||
| Worcester Behavioral | AIB | 81,972 | 1.86 | % | $ | 2,690.9 | 2.59 | % | 866,866 | Worcester, MA | 69 | |||||||||||||||
| Columbia Gastroenterology Surgery Center | MOB | 17,016 | 0.39 | % | $ | 344.1 | 0.33 | % | 858,302 | Columbia, SC | 70 | |||||||||||||||
| Cape Coral Suite 3 | SC | 12,130 | 0.27 | % | $ | 450.4 | 0.43 | % | 834,573 | Cape Coral-Fort Myers, FL | 72 | |||||||||||||||
| Cape Coral Suite 3A | MOB | 2,023 | 0.05 | % | $ | 39.0 | 0.04 | % | 834,573 | Cape Coral-Fort Myers, FL | 72 | |||||||||||||||
| Cape Coral Suite 5 & 6 | MOB | 6,379 | 0.14 | % | $ | 98.1 | 0.09 | % | 834,573 | Cape Coral-Fort Myers, FL | 72 | |||||||||||||||
| Colonial Blvd Office | SC | 46,356 | 1.05 | % | $ | — | — | % | 834,573 | Cape Coral-Fort Myers, FL | 72 | |||||||||||||||
| Corporate Office 3660 | MOB | 22,104 | 0.50 | % | $ | 620.5 | 0.60 | % | 834,573 | Cape Coral-Fort Myers, FL | 72 | |||||||||||||||
| Corporate Annex Building | MOB | 16,000 | 0.36 | % | $ | 310.1 | 0.30 | % | 834,573 | Cape Coral-Fort Myers, FL | 72 | |||||||||||||||
| Genesis Care - Bonita Springs | SC | 4,445 | 0.10 | % | $ | 289.0 | 0.28 | % | 834,573 | Cape Coral-Fort Myers, FL | 72 | |||||||||||||||
| Wildwood Hammock RPET Facility | SC | 10,832 | 0.25 | % | $ | 429.1 | 0.41 | % | 834,573 | Cape Coral-Fort Myers, FL | 72 | |||||||||||||||
| Wildwood Hammock - Diagnostic Imaging | SC | 9,376 | 0.21 | % | $ | 405.6 | 0.39 | % | 834,573 | Cape Coral-Fort Myers, FL | 72 | |||||||||||||||
| Wildwood Hammock - Northland | MOB | 1,201 | 0.03 | % | $ | 13.2 | 0.01 | % | 834,573 | Cape Coral-Fort Myers, FL | 72 | |||||||||||||||
| Eye Health of America 4101 | MOB | 43,322 | 0.98 | % | $ | 1,005.0 | 0.97 | % | 834,573 | Cape Coral-Fort Myers, FL | 72 | |||||||||||||||
| Eye Health of America 2665 | MOB | 3,200 | 0.07 | % | $ | 54.7 | 0.05 | % | 834,573 | Cape Coral-Fort Myers, FL | 72 | |||||||||||||||
| Eye Health of America 1320 | MOB | 6,757 | 0.15 | % | $ | 79.7 | 0.08 | % | 834,573 | Cape Coral-Fort Myers, FL | 72 | |||||||||||||||
| Parkway Professional Plaza | MOB | 41,909 | 0.95 | % | $ | 986.5 | 0.95 | % | 818,330 | Lakeland-Winter Haven, FL | 75 | |||||||||||||||
| Davita Turner Road | SC | 18,125 | 0.41 | % | $ | 358.2 | 0.34 | % | 814,363 | Dayton-Kettering-Beavercreek, OH | 76 | |||||||||||||||
| Davita Springboro Pike | SC | 10,510 | 0.24 | % | $ | 185.6 | 0.18 | % | 814,363 | Dayton-Kettering-Beavercreek, OH | 76 | |||||||||||||||
| Davita Business Center Court | SC | 12,988 | 0.29 | % | $ | 233.0 | 0.22 | % | 814,363 | Dayton-Kettering-Beavercreek, OH | 76 | |||||||||||||||
| Mercy One Physicians Clinic | PC | 17,318 | 0.39 | % | $ | 390.4 | 0.38 | % | 737,164 | Des Moines-West Des Moines, IA | 81 | |||||||||||||||
| Daytona Medical Office | MOB | 20,193 | 0.46 | % | $ | 373.9 | 0.36 | % | 721,796 | Deltona-Daytona Beach-Ormond Beach, FL | 83 | |||||||||||||||
| Debary Professional Plaza | MOB | 21,874 | 0.50 | % | $ | 274.1 | 0.26 | % | 721,796 | Deltona-Daytona Beach-Ormond Beach, FL | 83 | |||||||||||||||
| Novus Clinic | SCH | 14,315 | 0.32 | % | $ | 300.7 | 0.29 | % | 698,398 | Akron, Oh | 85 | |||||||||||||||
| UH Walden Health Center | PC | 11,000 | 0.25 | % | $ | — | — | % | 698,398 | Akron, Oh | 85 | |||||||||||||||
| UW Health Clinic- Portage | PC | 14,000 | 0.32 | % | $ | 325.1 | 0.31 | % | 694,345 | Madison, WI | 87 | |||||||||||||||
| Cypress Medical Center | MOB | 39,746 | 0.90 | % | $ | 382.0 | 0.37 | % | 652,939 | Wichita, KS | 90 | |||||||||||||||
| Family Medicine East | PC | 16,581 | 0.38 | % | $ | 331.6 | 0.32 | % | 652,939 | Wichita, KS | 90 | |||||||||||||||
| Grene Vision Center | PC | 18,681 | 0.42 | % | $ | — | — | % | 652,939 | Wichita, KS | 90 | |||||||||||||||
| Community Healthcare Trust | Page | 19 | 1Q 2024 | Supplemental Information | ||||||
| ||
| Property Name | Property Type | Area | % of Square Feet | Annualized Rent ($000's) | % of Annualized Rent | Population | MSA/MISA | Rank | ||||||||||||||||||
| Bassin Center For Plastic Surgery-Melbourne | PC | 5,228 | 0.12 | % | $ | 307.4 | 0.30 | % | 643,979 | Palm Bay-Melbourne-Titusville, FL | 91 | |||||||||||||||
| Penn State Health - Camp Hill | SC | 8,400 | 0.19 | % | $ | 178.2 | 0.17 | % | 606,055 | Harrisburg-Carlisle, PA | 95 | |||||||||||||||
| Penn State Health - Harrisburg | SC | 10,000 | 0.23 | % | $ | 195.0 | 0.19 | % | 606,055 | Harrisburg-Carlisle, PA | 95 | |||||||||||||||
| Assurance - Toledo | BSF | 13,290 | 0.30 | % | $ | 536.4 | 0.52 | % | 600,141 | Toledo, OH | 97 | |||||||||||||||
| Perrysburg Medical Arts Building | MOB | 25,930 | 0.59 | % | $ | 443.4 | 0.43 | % | 600,141 | Toledo, OH | 97 | |||||||||||||||
| St. Vincent Mercy Medical Center, Inc. | PC | 23,368 | 0.53 | % | $ | 326.2 | 0.31 | % | 600,141 | Toledo, OH | 97 | |||||||||||||||
| Granite Circle | MOB | 17,164 | 0.39 | % | $ | 237.7 | 0.23 | % | 600,141 | Toledo, OH | 97 | |||||||||||||||
| Mercy Rehabilitation Hospital - Northwest Arkansas | IRF | 38,817 | 0.88 | % | $ | 2,228.7 | 2.14 | % | 590,337 | Fayetteville-Springdale-Rogers, AR | 98 | |||||||||||||||
| Eynon Surgery Center | SCH | 6,500 | 0.15 | % | $ | 183.8 | 0.18 | % | 569,413 | Scranton--Wilkes-Barre, PA | 100 | |||||||||||||||
| Riverview Medical Center | MOB | 26,199 | 0.59 | % | $ | 450.8 | 0.43 | % | 569,413 | Scranton--Wilkes-Barre, PA | 100 | |||||||||||||||
| Northeast Eye Institute | MOB | 22,743 | 0.51 | % | $ | 409.4 | 0.39 | % | 569,413 | Scranton--Wilkes-Barre, PA | 100 | |||||||||||||||
| Northeast Eye Institute | MOB | 15,768 | 0.36 | % | $ | 304.9 | 0.29 | % | 569,413 | Scranton--Wilkes-Barre, PA | 100 | |||||||||||||||
| Cardiology Associates of Greater Waterbury | PC | 16,793 | 0.38 | % | $ | 323.3 | 0.31 | % | 568,158 | New Haven, CT | 101 | |||||||||||||||
| Grandview Plaza | MOB | 20,000 | 0.45 | % | $ | 310.3 | 0.30 | % | 558,589 | Lancaster, PA | 104 | |||||||||||||||
| Pinnacle Health | PC | 10,753 | 0.24 | % | $ | 246.0 | 0.24 | % | 558,589 | Lancaster, PA | 104 | |||||||||||||||
| Manteca Medical Group Building | PC | 10,564 | 0.24 | % | $ | 306.1 | 0.29 | % | 551,430 | Modesto, CA | 105 | |||||||||||||||
| Treasure Coast Medical Pavilion | MOB | 55,844 | 1.26 | % | $ | 879.4 | 0.85 | % | 536,901 | Port St. Lucie, FL | 106 | |||||||||||||||
| Gulf Coast Cancer Centers-Brewton | SC | 3,971 | 0.09 | % | $ | — | — | % | 530,090 | Pensacola-Ferry Pass-Brent, FL | 107 | |||||||||||||||
| Temple Rehabilitation Hospital | IRF | 38,817 | 0.88 | % | $ | 2,280.3 | 2.19 | % | 501,333 | Killeen-Temple, TX | 110 | |||||||||||||||
| Martin Foot & Ankle Clinic | PC | 27,100 | 0.61 | % | $ | 423.3 | 0.41 | % | 464,640 | York-Hanover, PA | 116 | |||||||||||||||
| UPMC Specialty Care | MOB | 25,982 | 0.59 | % | $ | 453.4 | 0.44 | % | 425,969 | Youngstown-Warren, OH | 128 | |||||||||||||||
| Biltmore Medical Office | SC | 10,850 | 0.25 | % | $ | — | — | % | 417,202 | Asheville, NC | 131 | |||||||||||||||
| Genesis Care - Weaverville | SC | 10,696 | 0.24 | % | $ | 456.3 | 0.44 | % | 417,202 | Asheville, NC | 131 | |||||||||||||||
| Behavioral Hospital of Lafayette | MOB | 31,650 | 0.72 | % | $ | 1,360.9 | 1.31 | % | 414,288 | Lafayette, LA | 132 | |||||||||||||||
| Affinity Health Center | MOB | 47,366 | 1.07 | % | $ | 506.7 | 0.49 | % | 399,474 | Canton-Massillon, OH | 138 | |||||||||||||||
| Hills & Dales Professional Center | MOB | 27,920 | 0.63 | % | $ | 356.3 | 0.34 | % | 399,474 | Canton-Massillon, OH | 138 | |||||||||||||||
| Prattville Town Center Medical Office Bldg | MOB | 13,319 | 0.30 | % | $ | 385.0 | 0.37 | % | 385,480 | Montgomery, AL | 143 | |||||||||||||||
| Bristol Pediatric Associates | MOB | 10,804 | 0.24 | % | $ | 183.5 | 0.18 | % | 313,025 | Kingsport-Bristol, TN-VA | 167 | |||||||||||||||
| Wellmont Bristol Urgent Care | SC | 4,548 | 0.10 | % | $ | 76.2 | 0.07 | % | 313,025 | Kingsport-Bristol, TN-VA | 167 | |||||||||||||||
| Wellmont Norton Urgent Care | SC | 4,843 | 0.11 | % | $ | 57.9 | 0.06 | % | 313,025 | Kingsport-Bristol, TN-VA | 167 | |||||||||||||||
| Community Healthcare Trust | Page | 20 | 1Q 2024 | Supplemental Information | ||||||
| ||
| Property Name | Property Type | Area | % of Square Feet | Annualized Rent ($000's) | % of Annualized Rent | Population | MSA/MISA | Rank | ||||||||||||||||||
| Norton Medical Plaza | MOB | 32,757 | 0.74 | % | $ | 359.1 | 0.35 | % | 313,025 | Kingsport-Bristol, TN-VA | 167 | |||||||||||||||
| Londonderry Centre | MOB | 21,115 | 0.48 | % | $ | 286.9 | 0.28 | % | 304,865 | Waco, TX | 169 | |||||||||||||||
| Westlake Medical Office | MOB | 14,100 | 0.32 | % | $ | 252.9 | 0.24 | % | 304,865 | Waco, TX | 169 | |||||||||||||||
| Bluewater Orthopedics Center | MOB | 10,255 | 0.23 | % | $ | 218.2 | 0.21 | % | 304,818 | Crestview-Fort Walton Beach-Destin, FL | 170 | |||||||||||||||
| Longview Rehabilitation Hospital | IRF | 38,817 | 0.88 | % | $ | 2,280.3 | 2.19 | % | 293,498 | Longview, TX | 173 | |||||||||||||||
| Gulf Coast Cancer Centers-Foley | SC | 6,146 | 0.14 | % | $ | 172.2 | 0.17 | % | 253,507 | Daphne-Fairhope-Foley, AL | 194 | |||||||||||||||
| Gulf Coast Cancer Centers- Gulf Shores | SC | 6,398 | 0.14 | % | $ | 134.4 | 0.13 | % | 253,507 | Daphne-Fairhope-Foley, AL | 194 | |||||||||||||||
| Monroe Surgical Hospital | SCH | 58,121 | 1.32 | % | $ | 2,413.3 | 2.32 | % | 221,885 | Monroe, LA | 214 | |||||||||||||||
| Meridian Behavioral Health Systems | AIB | 132,430 | 3.00 | % | $ | 3,136.8 | 3.02 | % | 203,164 | Charleston, WV | 228 | |||||||||||||||
| Fresenius Ft. Valley | SC | 4,920 | 0.11 | % | $ | 83.6 | 0.08 | % | 200,779 | Warner Robins, GA | 232 | |||||||||||||||
| Tuscola Professional Building | MOB | 25,500 | 0.58 | % | $ | 610.2 | 0.59 | % | 187,782 | Saginaw, MI | 239 | |||||||||||||||
| Redding Oncology Center | SC | 12,206 | 0.28 | % | $ | 607.0 | 0.58 | % | 180,366 | Redding, CA | 247 | |||||||||||||||
| Kedplasma | SC | 12,870 | 0.29 | % | $ | 272.1 | 0.26 | % | 179,165 | Burlington, NC | 249 | |||||||||||||||
| Decatur Morgan Hospital Medical Office Building | MOB | 35,933 | 0.81 | % | $ | 583.0 | 0.56 | % | 158,635 | Decatur, AL | 271 | |||||||||||||||
| Provena Medical Center | MOB | 54,894 | 1.24 | % | $ | 775.6 | 0.75 | % | 105,940 | Kankakee, IL | 351 | |||||||||||||||
| Parkside Family & Davita Clinics | MOB | 15,637 | 0.35 | % | $ | 216.8 | 0.21 | % | 98,808 | Victoria, TX | 366 | |||||||||||||||
| Cub Lake Square | MOB | 49,059 | 1.11 | % | $ | 1,127.3 | 1.08 | % | 109,175 | Show Low, AZ | n/a | |||||||||||||||
| Cub Lake Square - Building B | MOB | — | — | % | $ | — | — | % | 109,175 | Show Low, AZ | n/a | |||||||||||||||
| Cub Lake Square - Building C | MOB | — | — | % | $ | — | — | % | 109,175 | Show Low, AZ | n/a | |||||||||||||||
| Emory Healthcare | MOB | 61,301 | 1.39 | % | $ | 897.9 | 0.86 | % | 104,821 | LaGrange, GA-AL | n/a | |||||||||||||||
| Emory Southern Orthopedics | MOB | 31,473 | 0.71 | % | $ | 570.4 | 0.55 | % | 104,821 | LaGrange, GA-AL | n/a | |||||||||||||||
| Emory Southern Orthopedics | MOB | 2,972 | 0.07 | % | $ | 61.5 | 0.06 | % | 104,821 | LaGrange, GA-AL | n/a | |||||||||||||||
| Emory Healthcare | MOB | 5,600 | 0.13 | % | $ | 82.0 | 0.08 | % | 104,821 | LaGrange, GA-AL | n/a | |||||||||||||||
| Nesbitt Place | MOB | 56,003 | 1.27 | % | $ | 1,105.5 | 1.06 | % | 104,821 | Lawrence County, PA | n/a | |||||||||||||||
| Davita Etowah Dialysis Center | SC | 4,720 | 0.11 | % | $ | 68.8 | 0.07 | % | 69,369 | Athens, TN | n/a | |||||||||||||||
| Marion Medical Plaza | MOB | 27,246 | 0.62 | % | $ | 346.9 | 0.33 | % | 64,851 | Marion, OH | n/a | |||||||||||||||
| Davita Dialysis | MOB | 12,545 | 0.28 | % | $ | 457.8 | 0.44 | % | 55,720 | Pahrump, NV | n/a | |||||||||||||||
| Fresenius Dialysis Center | MOB | 17,746 | 0.40 | % | $ | 355.7 | 0.34 | % | 55,635 | Corsicana, TX | n/a | |||||||||||||||
| Arkansas Valley Surgery Center | MOB | 10,853 | 0.25 | % | $ | 271.0 | 0.26 | % | 50,318 | Cañon City, CO | n/a | |||||||||||||||
| Sanford West Behavioral Facility | BSF | 96,886 | 2.19 | % | $ | 1,338.5 | 1.29 | % | 45,365 | Grand Rapids, MN | n/a | |||||||||||||||
| Fremont Medical Office Building & Surgery Ctr | MOB | 13,050 | 0.30 | % | $ | 328.2 | 0.32 | % | 37,187 | Fremont, NE | n/a | |||||||||||||||
| Community Healthcare Trust | Page | 21 | 1Q 2024 | Supplemental Information | ||||||
| ||
| Property Name | Property Type | Area | % of Square Feet | Annualized Rent ($000's) | % of Annualized Rent | Population | MSA/MISA | Rank | ||||||||||||||||||
| Baylor Scott & White Clinic | PC | 37,354 | 0.85 | % | $ | 490.7 | 0.47 | % | 37,007 | Brenham, TX | n/a | |||||||||||||||
| Eyecare Partners | PC | 8,421 | 0.19 | % | $ | 134.3 | 0.13 | % | 36,673 | Centralia, IL | n/a | |||||||||||||||
| Ottumwa Medical Clinic | MOB | 68,895 | 1.56 | % | $ | 755.8 | 0.73 | % | 35,166 | Ottumwa, IA | n/a | |||||||||||||||
| Ottumwa Medical Clinic | MOB | 6,850 | 0.16 | % | $ | 92.5 | 0.09 | % | 35,166 | Ottumwa, IA | n/a | |||||||||||||||
| Fresenius Gallipolis Dialysis Center | SC | 15,110 | 0.34 | % | $ | 157.9 | 0.15 | % | 28,986 | Gallipolis, OH | n/a | |||||||||||||||
| Sanderling Dialysis Center | SC | 4,186 | 0.09 | % | $ | 303.9 | 0.29 | % | 26,589 | Crescent City, CA | n/a | |||||||||||||||
| Andalusia Medical Plaza | SC | 10,373 | 0.23 | % | $ | 407.0 | 0.39 | % | County: 37,049 | Rural - No CBSA | n/a | |||||||||||||||
| Russellville Medical Plaza | MOB | 29,129 | 0.66 | % | $ | 163.5 | 0.16 | % | County: 31,362 | Rural - No CBSA | n/a | |||||||||||||||
| Batesville Regional Medical Center | MOB | 9,263 | 0.21 | % | $ | 49.5 | 0.05 | % | County: 34,192 | Rural - No CBSA | n/a | |||||||||||||||
| Tri Lakes Behavioral | BSF | 58,400 | 1.32 | % | $ | 696.0 | 0.67 | % | County: 34,192 | Rural - No CBSA | n/a | |||||||||||||||
| Dahlonega Medical Mall | MOB | 22,804 | 0.52 | % | $ | 400.2 | 0.39 | % | County: 33,610 | Rural - No CBSA | n/a | |||||||||||||||
| Lexington Carilion Clinic | PC | 15,820 | 0.36 | % | $ | 376.7 | 0.36 | % | County: 22,573 | Rural - No CBSA | n/a | |||||||||||||||
| North Mississippi Health Services | MOB | 17,629 | 0.40 | % | $ | 94.3 | 0.09 | % | County: 35,252 | Rural - No CBSA | n/a | |||||||||||||||
| North Mississippi Health Services | MOB | 27,743 | 0.63 | % | $ | 148.4 | 0.14 | % | County: 35,252 | Rural - No CBSA | n/a | |||||||||||||||
| North Mississippi Health Services | MOB | 18,074 | 0.41 | % | $ | 96.7 | 0.09 | % | County: 35,252 | Rural - No CBSA | n/a | |||||||||||||||
| North Mississippi Health Services | MOB | 9,890 | 0.22 | % | $ | 52.9 | 0.05 | % | County: 35,252 | Rural - No CBSA | n/a | |||||||||||||||
| North Mississippi Health Services | MOB | 3,378 | 0.08 | % | $ | 18.1 | 0.02 | % | County: 35,252 | Rural - No CBSA | n/a | |||||||||||||||
| Princeton Cancer Center | SC | 7,236 | 0.16 | % | $ | 205.1 | 0.20 | % | County: 58,758 | Rural - No CBSA | n/a | |||||||||||||||
| Rettig Family Healthcare | PC | 12,000 | 0.27 | % | $ | 180.0 | 0.17 | % | County: 23,437 | Rural - No CBSA | n/a | |||||||||||||||
| Sanderling Dialysis Center | SC | 5,217 | 0.12 | % | $ | 278.9 | 0.27 | % | County: 13,279 | Rural - No CBSA | n/a | |||||||||||||||
| Wellmont Lebanon Urgent Care | SC | 8,369 | 0.19 | % | $ | 104.6 | 0.10 | % | County: 26,586 | Rural - No CBSA | n/a | |||||||||||||||
| Community Healthcare Trust | Page | 22 | 1Q 2024 | Supplemental Information | ||||||
| ||
| Community Healthcare Trust | Page | 23 | 1Q 2024 | Supplemental Information | ||||||
| ||
| Community Healthcare Trust | Page | 24 | 1Q 2024 | Supplemental Information | ||||||
| ||
| Community Healthcare Trust | Page | 25 | 1Q 2024 | Supplemental Information | ||||||
| ||
| Community Healthcare Trust | Page | 26 | 1Q 2024 | Supplemental Information | ||||||