well-202404290000766704false00007667042024-04-292024-04-290000766704us-gaap:CommonStockMember2024-04-292024-04-290000766704well:NotesDue20284.800Member2024-04-292024-04-290000766704well:NotesDue20344.500Member2024-04-292024-04-29
UNITED STATES
SECURITIES AND EXCHANGE COMMISSION
Washington, D.C. 20549
FORM 8-K
CURRENT REPORT
Pursuant to Section 13 OR 15(d) of
The Securities Exchange Act of 1934
Date of Report (Date of earliest event reported): April 29, 2024
Welltower Inc.
(Exact name of registrant as specified in its charter)
| | | | | | | | | | | | | | | | | | | | |
| Delaware | | 1-8923 | | 34-1096634 |
(State or other jurisdiction
of Incorporation) | | (Commission
File Number) | | (IRS Employer
Identification No.) |
| | | | | | |
| 4500 Dorr Street, | Toledo, | Ohio | | | 43615 |
| (Address of principal executive offices) | | | (Zip Code) |
Registrant's telephone number, including area code: (419) 247-2800
Not Applicable
(Former name or former address, if changed since last report.)
Check the appropriate box below if the Form 8-K filing is intended to simultaneously satisfy the filing obligation of the registrant under any of the following provisions (see General Instruction A.2. below):
☐ Written communications pursuant to Rule 425 under the Securities Act (17 CFR 230.425)
☐ Soliciting material pursuant to Rule 14a-12 under the Exchange Act (17 CFR 240.14a-12)
☐ Pre-commencement communications pursuant to Rule 14d-2(b) under the Exchange Act (17 CFR 240.14d-2(b))
☐ Pre-commencement communications pursuant to Rule 13e-4(c) under the Exchange Act (17 CFR 240.13e-4(c))
Securities registered pursuant to Section 12(b) of the Act:
| | | | | | | | | | | | | | |
| Title of each class | | Trading Symbol(s) | | Name of each exchange on which registered |
| Common stock, $1.00 par value per share | | WELL | | New York Stock Exchange |
| Guarantee of 4.800% Notes due 2028 issued by Welltower OP LLC | | WELL/28 | | New York Stock Exchange |
| Guarantee of 4.500% Notes due 2034 issued by Welltower OP LLC | | WELL/34 | | New York Stock Exchange |
Indicate by check mark whether the registrant is an emerging growth company as defined in Rule 405 of the Securities Act of 1933 (§230.405 of this chapter) or Rule 12b-2 of the Securities Exchange Act of 1934 (§240.12b-2 of this chapter).
Emerging growth company ☐
If an emerging growth company, indicate by check mark if the registrant has elected not to use the extended transition period for complying with any new or revised financial accounting standards provided pursuant to Section 13(a) of the Exchange Act. ☐
Item 2.02 Results of Operations and Financial Condition.
On April 29, 2024, Welltower Inc. (the “Company”) issued a press release that announced operating results for its first quarter ended March 31, 2024. The press release refers to a supplemental information package that is available on the Company's website (www.welltower.com), free of charge. Copies of the press release and supplemental information package have been furnished as Exhibits 99.1 and 99.2, respectively, to this Current Report, and are incorporated herein by reference.
The information included in this Item 2.02, including Exhibits 99.1 and 99.2, shall not be deemed “filed” for purposes of Section 18 of the Securities Exchange Act of 1934, as amended (the “Exchange Act”), and shall not be incorporated by reference into any filing of the Company under the Securities Act of 1933, as amended, or the Exchange Act, regardless of any general incorporation language in such filing.
Item 9.01 Financial Statements and Exhibits.
(d) Exhibits.
104 Cover Page Interactive Data File - the cover page XBRL tags are embedded within the Inline XBRL document.
SIGNATURE
Pursuant to the requirements of the Securities Exchange Act of 1934, the registrant has duly caused this report to be signed on its behalf by the undersigned hereunto duly authorized.
| | | | | |
| WELLTOWER INC. |
| |
| By: | /s/ Matthew McQueen |
| Name: | Matthew McQueen |
| Title: | Executive Vice President – General Counsel & Corporate Secretary |
| |
Dated: April 29, 2024
Document
'
FOR IMMEDIATE RELEASE
April 29, 2024
For more information contact:
Tim McHugh (419) 247-2800
Welltower Reports First Quarter 2024 Results
Toledo, Ohio, April 29, 2024…..Welltower Inc. (NYSE:WELL) today announced results for the quarter ended March 31, 2024.
Recent Highlights
•Reported net income attributable to common stockholders of $0.22 per diluted share
•Reported quarterly normalized funds from operations ("FFO") attributable to common stockholders of $1.01 per diluted share, an increase of 18.8% over the prior year
•Reported total portfolio year-over-year same store NOI ("SSNOI") growth of 12.9%, driven by SSNOI growth in our Seniors Housing Operating ("SHO") portfolio of 25.5%
•SHO portfolio year-over-year same store revenue increased 10.3% in the first quarter, with 340 basis points ("bps") of year-over-year average occupancy growth and Revenue per Occupied Room ("RevPOR") growth of 4.8%
•During the first quarter, we completed $449 million of pro rata gross investments, including $208 million in acquisitions and loan funding and $241 million in development funding
•Since the beginning of the year, we have closed or have definitive agreements to close $2.8 billion in pro rata acquisitions and loan funding across 28 transactions
•Improved net debt to Adjusted EBITDA to 4.03x at March 31, 2024
•As of March 31, 2024, we had approximately $6.5 billion of available liquidity inclusive of $2.5 billion of available cash and restricted cash and full capacity under our $4.0 billion line of credit
Capital Activity and Liquidity
During the first quarter, net debt to consolidated enterprise value improved to 17.4% at March 31, 2024 from 20.9% at December 31, 2023. We sourced over $2.5 billion of attractively priced capital, including equity and proceeds from dispositions and loan repayments to fund accretive capital deployment opportunities and to further strengthen our already robust liquidity profile. Additionally during the quarter, we extinguished $1.35 billion of senior unsecured notes at maturity and $167 million of pro rata secured debt utilizing cash on hand. As of March 31, 2024, our share of variable rate debt was approximately 7.6%.
Investment Activity Completed During the Quarter
In the first quarter, we completed $449 million of pro rata gross investments, including $208 million in acquisitions and loan funding and $241 million in development funding. We opened ten development projects, including partial conversions and expansions, for an aggregate pro rata investment amount of $166 million. Additionally, during the first quarter we completed pro rata property dispositions and loan repayments of $107 million.
Announced Future Investment Activity
Subsequent to quarter end we have closed or are under contract to close on $2.6 billion in pro rata acquisitions and loan funding across 15 transactions. Transactions under contract and not yet closed are subject to customary closing conditions.
Affinity Living Communities As previously disclosed, we entered into a definitive agreement to acquire a portfolio of 25 age-restricted active adult communities for $969 million through a privately negotiated, off-market transaction, subject to customary closing conditions. The transaction is expected to be funded through cash and the assumption of $523 million of below market rate debt with an average interest rate of 3.8% and a nine-year weighted average maturity.
Revera Joint Venture As previously disclosed, we entered into definitive agreements to dissolve our existing Revera joint venture relationship across the U.S., United Kingdom and Canada. The transaction included acquiring the remaining interests in 110 properties from Revera while simultaneously selling interests in 31 properties to Revera. During 2023, we closed the U.S. and U.K. portions of the transaction. On April 1, 2024, we closed the Canadian portion, which included acquiring Revera's interests in 71 properties and selling our interests in 14 properties in a largely cash neutral transaction. Operations for the 71 retained properties previously
| | | | | | | | | | | |
| 1Q24 | Earnings Release | | April 29, 2024 |
transitioned to new operators. The Revera joint venture has been fully dissolved following the completion of the Canadian portion of the transaction.
Environmental, Social and Governance (“ESG”) In recognition of our leading environmental efforts, Welltower earned the 2024 ENERGY STAR® Partner of the Year Award for the sixth consecutive year and received recognition at the level of Sustained Excellence, the Environmental Protection Agency's highest honor in the ENERGY STAR program, for the fourth consecutive year.
Dividend On April 29, 2024, the Board of Directors declared a cash dividend for the quarter ended March 31, 2024 of $0.61 per share. This dividend, which will be paid on May 22, 2024 to stockholders of record as of May 13, 2024, will be our 212th consecutive quarterly cash dividend. The declaration and payment of future quarterly dividends remains subject to review and approval by the Board of Directors.
Outlook for 2024 Net income attributable to common stockholders guidance has been revised to a range of $1.48 to $1.61 per diluted share from the previous range of $1.21 to $1.37 per diluted share, primarily due to a change in projected gains/losses/impairments and depreciation and amortization. We increased the guidance range of full year normalized FFO attributable to common stockholders to a range of $4.02 to $4.15 per diluted share from the previous range of $3.94 to $4.10 per diluted share. In preparing our guidance, we have updated or confirmed the following assumptions:
•Same Store NOI: We expect average blended SSNOI growth of 9% to 12%, which is comprised of the following components:
◦Seniors Housing Operating approximately 17% to 22%
◦Seniors Housing Triple-net approximately 2.5% to 4.0%
◦Outpatient Medical approximately 2% to 3%
◦Long-Term/Post-Acute Care approximately 2% to 3%
•Investments: Our earnings guidance includes only those acquisitions announced or closed to date. Furthermore, no transitions or restructures beyond those announced to date are included.
•General and Administrative Expenses: We anticipate general and administrative expenses to be approximately $201 million to $209 million and stock-based compensation expense to be approximately $39 million.
•Development: We anticipate funding an additional $660 million of development in 2024 relating to projects underway on March 31, 2024.
•Dispositions: We expect pro rata disposition proceeds of $1.2 billion at a blended yield of 5.4% in the next twelve months. This includes approximately $1.0 billion of consideration from expected property sales and $110 million of expected proceeds from loan repayments.
•Pandemic Relief Funds: Our initial 2024 earnings guidance did not include the recognition of any pandemic relief funds which may be received during the year. During the three months ended March 31, 2024, we recognized approximately $1 million at our share related to Provider Relief Funds and similar programs in the United Kingdom and Canada. Our updated guidance does not include any additional funds in 2024. In 2023, we recognized approximately $13 million at our share relating to Provider Relief Funds and similar programs in the United Kingdom and Canada.
Our guidance does not include any additional investments, dispositions or capital transactions beyond those we have announced, nor any other expenses, impairments, unanticipated additions to the loan loss reserve or other additional normalizing items. Please see the Supplemental Reporting Measures section for further discussion and our definition of normalized FFO and SSNOI and Exhibit 3 for a reconciliation of the outlook for net income available to common stockholders to normalized FFO attributable to common stockholders. We will provide additional detail regarding our 2024 outlook and assumptions on the first quarter 2024 conference call.
Conference Call Information We have scheduled a conference call on Tuesday, April 30, 2024 at 9:00 a.m. Eastern Time to discuss our first quarter 2024 results, industry trends and portfolio performance. Telephone access will be available by dialing (888) 340-5024 or (646) 960-0135 (international). For those unable to listen to the call live, a taped rebroadcast will be available beginning two hours after completion of the call through May 7, 2024. To access the rebroadcast, dial (800) 770-2030 or (609) 800-9909 (international). The conference ID number is 8230248. To participate in the webcast, log on to www.welltower.com 15 minutes before the call to download the necessary software. Replays will be available for 90 days.
Supplemental Reporting Measures We believe that net income and net income attributable to common stockholders ("NICS"), as defined by U.S. generally accepted accounting principles ("U.S. GAAP"), are the most appropriate earnings measurements. However, we consider funds from operations ("FFO"), normalized FFO, net operating income ("NOI"), same store NOI ("SSNOI"), revenue per occupied room ("RevPOR"), same store RevPOR ("SS RevPOR"), expense per occupied room ("ExpPOR"), same store ExpPOR ("SS ExpPOR"), EBITDA and Adjusted EBITDA to be useful supplemental measures of our operating performance. Excluding EBITDA and Adjusted EBITDA, these supplemental measures are disclosed on our pro rata ownership basis. Pro rata amounts are derived by reducing consolidated amounts for minority partners’ noncontrolling ownership interests and adding our minority ownership share of unconsolidated amounts. We do not control unconsolidated investments. While we consider pro rata disclosures useful, they may not accurately depict the legal and economic implications of our joint venture arrangements and should be used with caution.
| | | | | | | | | | | |
| 1Q24 | Earnings Release | | April 29, 2024 |
Historical cost accounting for real estate assets in accordance with U.S. GAAP implicitly assumes that the value of real estate assets diminishes predictably over time as evidenced by the provision for depreciation. However, since real estate values have historically risen or fallen with market conditions, many industry investors and analysts have considered presentations of operating results for real estate companies that use historical cost accounting to be insufficient. In response, the National Association of Real Estate Investment Trusts ("NAREIT") created FFO as a supplemental measure of operating performance for REITs that excludes historical cost depreciation from net income. FFO attributable to common stockholders, as defined by NAREIT, means net income attributable to common stockholders, computed in accordance with U.S. GAAP, excluding gains (or losses) from sales of real estate and impairments of depreciable assets, plus real estate depreciation and amortization, and after adjustments for unconsolidated entities and noncontrolling interests. Normalized FFO attributable to common stockholders represents FFO attributable to common stockholders adjusted for certain items detailed in Exhibit 2. We believe that normalized FFO attributable to common stockholders is a useful supplemental measure of operating performance because investors and equity analysts may use this measure to compare the operating performance of Welltower between periods or as compared to other REITs or other companies on a consistent basis without having to account for differences caused by unanticipated and/or incalculable items.
We define NOI as total revenues, including tenant reimbursements, less property operating expenses. Property operating expenses represent costs associated with managing, maintaining and servicing tenants for our properties. These expenses include, but are not limited to, property-related payroll and benefits, property management fees paid to managers, marketing, housekeeping, food service, maintenance, utilities, property taxes and insurance. General and administrative expenses represent general overhead costs that are unrelated to property operations and unallocable to the properties. These expenses include, but are not limited to, payroll and benefits related to corporate employees, professional services, office expenses and depreciation of corporate fixed assets. SSNOI is used to evaluate the operating performance of our properties using a consistent population which controls for changes in the composition of our portfolio. As used herein, same store is generally defined as those revenue-generating properties in the portfolio for the relevant year-over-year reporting periods. Acquisitions and development conversions are included in the same store amounts five full quarters after acquisition or being placed into service. Land parcels, loans and sub-leases, as well as any properties sold or classified as held for sale during the period, are excluded from the same store amounts. Redeveloped properties (including major refurbishments of a Seniors Housing Operating property where 20% or more of units are simultaneously taken out of commission for 30 days or more or Outpatient Medical properties undergoing a change in intended use) are excluded from the same store amounts until five full quarters post completion of the redevelopment. Properties undergoing operator transitions and/or segment transitions are also excluded from the same store amounts until five full quarters post completion of the operator transition or segment transition. In addition, properties significantly impacted by force majeure, acts of God or other extraordinary adverse events are excluded from same store amounts until five full quarters after the properties are placed back into service. SSNOI excludes non-cash NOI and includes adjustments to present consistent property ownership percentages and to translate Canadian properties and UK properties using a consistent exchange rate. Normalizers include adjustments that in management’s opinion are appropriate in considering SSNOI, a supplemental, non-GAAP performance measure. None of these adjustments, which may increase or decrease SSNOI, are reflected in our financial statements prepared in accordance with U.S. GAAP. Significant normalizers (defined as any that individually exceed 0.50% of SSNOI growth per property type) are separately disclosed and explained. We believe NOI and SSNOI provide investors relevant and useful information because they measure the operating performance of our properties at the property level on an unleveraged basis. We use NOI and SSNOI to make decisions about resource allocations and to assess the property level performance of our properties. No reconciliation of the forecasted range for SSNOI on a combined basis or by property type is included in this release because we are unable to quantify certain amounts that would be required to be included in the comparable GAAP financial measure without unreasonable efforts, and we believe such reconciliation would imply a degree of precision that could be confusing or misleading to investors.
RevPOR represents the average revenues generated per occupied room per month and ExpPOR represents the average expenses per occupied room per month at our Seniors Housing Operating properties. These metrics are calculated as our pro rata version of total resident fees and services revenues or property operating expenses from the income statement, divided by average monthly occupied room days. SS RevPOR and SS ExpPOR are used to evaluate the RevPOR and ExpPOR performance of our properties under a consistent population, which eliminates changes in the composition of our portfolio. They are based on the same pool of properties used for SSNOI and includes any revenue or expense normalizations used for SSNOI. We use RevPOR, ExpPOR, SS RevPOR and SS ExpPOR to evaluate the revenue-generating capacity and profit potential of our Seniors Housing Operating portfolio independent of fluctuating occupancy rates. They are also used in comparison against industry and competitor statistics, if known, to evaluate the quality of our Seniors Housing Operating portfolio.
We measure our credit strength both in terms of leverage ratios and coverage ratios. The leverage ratios indicate how much of our balance sheet capitalization is related to long-term debt, net of cash and restricted cash. We expect to maintain capitalization ratios and coverage ratios sufficient to maintain a capital structure consistent with our current profile. The ratios are based on EBITDA and Adjusted EBITDA. EBITDA is defined as earnings (net income per income statement) before interest expense, income taxes, depreciation and amortization. Adjusted EBITDA is defined as EBITDA excluding unconsolidated entities and including adjustments for stock-based compensation expense, provision for loan losses, gains/losses on extinguishment of debt, gains/losses/impairments on properties, gains/losses on derivatives and financial instruments, other expenses, other impairment charges and other adjustments deemed appropriate in management's opinion. We believe that EBITDA and Adjusted EBITDA, along with net income, are important
| | | | | | | | | | | |
| 1Q24 | Earnings Release | | April 29, 2024 |
supplemental measures because they provide additional information to assess and evaluate the performance of our operations. Our leverage ratios include net debt to Adjusted EBITDA and consolidated enterprise value. Net debt is defined as total long-term debt, excluding operating lease liabilities, less cash and cash equivalents and restricted cash. Consolidated enterprise value represents the sum of net debt, the fair market value of our common stock and noncontrolling interests.
Our supplemental reporting measures and similarly entitled financial measures are widely used by investors, equity and debt analysts and ratings agencies in the valuation, comparison, rating and investment recommendations of companies. Our management uses these financial measures to facilitate internal and external comparisons to historical operating results and in making operating decisions. Additionally, they are utilized by the Board of Directors to evaluate management. The supplemental reporting measures do not represent net income or cash flow provided from operating activities as determined in accordance with U.S. GAAP and should not be considered as alternative measures of profitability or liquidity. Finally, the supplemental reporting measures, as defined by us, may not be comparable to similarly entitled items reported by other real estate investment trusts or other companies. Please see the exhibits for reconciliations of supplemental reporting measures and the supplemental information package for the quarter ended March 31, 2024, which is available on Welltower's website (www.welltower.com), for information and reconciliations of additional supplemental reporting measures.
About Welltower Welltower Inc. (NYSE:WELL), a real estate investment trust ("REIT") and S&P 500 company headquartered in Toledo, Ohio, is driving the transformation of health care infrastructure. Welltower invests with leading seniors housing operators, post-acute providers and health systems to fund the real estate infrastructure needed to scale innovative care delivery models and improve people’s wellness and overall health care experience. Welltower owns interests in properties concentrated in major, high-growth markets in the United States, Canada and the United Kingdom, consisting of seniors housing and post-acute communities and outpatient medical properties. More information is available at www.welltower.com. We routinely post important information on our website at www.welltower.com in the “Investors” section, including corporate and investor presentations and financial information. We intend to use our website as a means of disclosing material, non-public information and for complying with our disclosure obligations under Regulation FD. Such disclosures will be included on our website under the heading “Investors”. Accordingly, investors should monitor such portion of our website in addition to following our press releases, public conference calls and filings with the Securities and Exchange Commission. The information on our website is not incorporated by reference in this press release, and our web address is included as an inactive textual reference only.
Forward-Looking Statements and Risk Factors This press release contains “forward-looking statements” as defined in the Private Securities Litigation Reform Act of 1995. When Welltower uses words such as “may,” “will,” “intend,” “should,” “believe,” “expect,” “anticipate,” “project,” “pro forma,” “estimate” or similar expressions that do not relate solely to historical matters, Welltower is making forward-looking statements. Forward-looking statements are not guarantees of future performance and involve risks and uncertainties that may cause Welltower’s actual results to differ materially from Welltower’s expectations discussed in the forward-looking statements. This may be a result of various factors, including, but not limited to: the status of the economy; the status of capital markets, including availability and cost of capital; issues facing the health care industry, including compliance with, and changes to, regulations and payment policies, responding to government investigations and punitive settlements and operators’/tenants’ difficulty in cost effectively obtaining and maintaining adequate liability and other insurance; changes in financing terms; competition within the health care and seniors housing industries; negative developments in the operating results or financial condition of operators/tenants, including, but not limited to, their ability to pay rent and repay loans; Welltower’s ability to transition or sell properties with profitable results; the failure to make new investments or acquisitions as and when anticipated; natural disasters, health emergencies (such as the COVID-19 pandemic) and other acts of God affecting Welltower’s properties; Welltower’s ability to re-lease space at similar rates as vacancies occur; Welltower’s ability to timely reinvest sale proceeds at similar rates to assets sold; operator/tenant or joint venture partner bankruptcies or insolvencies; the cooperation of joint venture partners; government regulations affecting Medicare and Medicaid reimbursement rates and operational requirements; liability or contract claims by or against operators/tenants; unanticipated difficulties and/or expenditures relating to future investments or acquisitions; environmental laws affecting Welltower’s properties; changes in rules or practices governing Welltower’s financial reporting; the movement of U.S. and foreign currency exchange rates; Welltower’s ability to maintain its qualification as a REIT; key management personnel recruitment and retention; and other risks described in Welltower’s reports filed from time to time with the SEC. Welltower undertakes no obligation to update or revise publicly any forward-looking statements, whether because of new information, future events or otherwise, or to update the reasons why actual results could differ from those projected in any forward-looking statements.
| | | | | | | | | | | |
| 1Q24 | Earnings Release | | April 29, 2024 |
Welltower Inc.
Financial Exhibits
| | | | | | | | | | | | | | |
| Consolidated Balance Sheets (unaudited) |
| (in thousands) |
| | | March 31, |
| | | 2024 | | 2023 |
| Assets | | | | |
| Real estate investments: | | | | |
| Land and land improvements | | $ | 4,754,699 | | | $ | 4,324,541 | |
| Buildings and improvements | | 37,841,775 | | | 34,161,466 | |
| Acquired lease intangibles | | 2,158,915 | | | 1,990,830 | |
| Real property held for sale, net of accumulated depreciation | | 422,225 | | | 215,583 | |
| Construction in progress | | 1,342,410 | | | 1,121,446 | |
| Less accumulated depreciation and intangible amortization | | (9,537,562) | | | (8,417,151) | |
| Net real property owned | | 36,982,462 | | | 33,396,715 | |
| Right of use assets, net | | 348,892 | | | 322,896 | |
| Real estate loans receivable, net of credit allowance | | 1,426,094 | | | 954,156 | |
| Net real estate investments | | 38,757,448 | | | 34,673,767 | |
| Other assets: | | | | |
| Investments in unconsolidated entities | | 1,719,646 | | | 1,596,413 | |
| Goodwill | | 68,321 | | | 68,321 | |
| Cash and cash equivalents | | 2,388,488 | | | 571,902 | |
| Restricted cash | | 89,847 | | | 66,894 | |
| Straight-line rent receivable | | 469,976 | | | 357,359 | |
| Receivables and other assets | | 1,059,859 | | | 1,159,233 | |
| Total other assets | | 5,796,137 | | | 3,820,122 | |
| Total assets | | $ | 44,553,585 | | | $ | 38,493,889 | |
| | | | |
| Liabilities and equity | | | | |
| Liabilities: | | | | |
| Unsecured credit facility and commercial paper | | $ | — | | | $ | — | |
| Senior unsecured notes | | 12,171,913 | | | 12,486,229 | |
| Secured debt | | 2,033,232 | | | 2,474,837 | |
| Lease liabilities | | 381,320 | | | 415,169 | |
| Accrued expenses and other liabilities | | 1,419,212 | | | 1,521,499 | |
| Total liabilities | | 16,005,677 | | | 16,897,734 | |
| Redeemable noncontrolling interests | | 300,915 | | | 392,195 | |
| Equity: | | | | |
| Common stock | | 592,637 | | | 497,928 | |
| Capital in excess of par value | | 35,105,097 | | | 27,160,014 | |
| Treasury stock | | (114,842) | | | (112,925) | |
| Cumulative net income | | 9,272,190 | | | 8,830,623 | |
| Cumulative dividends | | (17,126,302) | | | (15,815,926) | |
| Accumulated other comprehensive income | | (180,837) | | | (111,559) | |
| Total Welltower Inc. stockholders’ equity | | 27,547,943 | | | 20,448,155 | |
| Noncontrolling interests | | 699,050 | | | 755,805 | |
| Total equity | | 28,246,993 | | | 21,203,960 | |
| Total liabilities and equity | | $ | 44,553,585 | | | $ | 38,493,889 | |
| | | | | | | | | | | |
| 1Q24 | Earnings Release | | April 29, 2024 |
| | | | | | | | | | | | | | | | | | | | | | | | | | |
| Consolidated Statements of Income (unaudited) | | | | |
| (in thousands, except per share data) | | | | |
| | | | | Three Months Ended | | |
| | | | | March 31, | | |
| | | | | 2024 | | 2023 | | | | |
| Revenues: | | | | | | | | |
| | | Resident fees and services | | $ | 1,360,274 | | | $ | 1,131,685 | | | | | |
| | | Rental income | | 417,652 | | | 384,059 | | | | | |
| | | Interest income | | 52,664 | | | 36,405 | | | | | |
| | | Other income | | 29,151 | | | 8,580 | | | | | |
| | Total revenues | | 1,859,741 | | | 1,560,729 | | | | | |
| Expenses: | | | | | | | | |
| | | Property operating expenses | | 1,096,913 | | | 957,753 | | | | | |
| | | Depreciation and amortization | | 365,863 | | | 339,112 | | | | | |
| | | Interest expense | | 147,318 | | | 144,403 | | | | | |
| | | General and administrative expenses | | 53,318 | | | 44,371 | | | | | |
| | | Loss (gain) on derivatives and financial instruments, net | | (3,054) | | | 930 | | | | | |
| | | Loss (gain) on extinguishment of debt, net | | 6 | | | 5 | | | | | |
| | Provision for loan losses, net | | 1,014 | | | 777 | | | | | |
| | | Impairment of assets | | 43,331 | | | 12,629 | | | | | |
| | | Other expenses | | 14,131 | | | 22,745 | | | | | |
| | | Total expenses | | 1,718,840 | | | 1,522,725 | | | | | |
| Income (loss) from continuing operations before income taxes | | | | | | | | |
| | | and other items | | 140,901 | | | 38,004 | | | | | |
| Income tax (expense) benefit | | (6,191) | | | (3,045) | | | | | |
| Income (loss) from unconsolidated entities | | (7,783) | | | (7,071) | | | | | |
| Gain (loss) on real estate dispositions, net | | 4,707 | | | 747 | | | | | |
| Income (loss) from continuing operations | | 131,634 | | | 28,635 | | | | | |
| | | | | | | | |
| Net income (loss) | | 131,634 | | | 28,635 | | | | | |
| Less: | | Net income (loss) attributable to noncontrolling interests (1) | | 4,488 | | | 2,962 | | | | | |
| Net income (loss) attributable to common stockholders | | $ | 127,146 | | | $ | 25,673 | | | | | |
| Average number of common shares outstanding: | | | | | | | | |
| | | Basic | | 574,049 | | | 492,061 | | | | | |
| | | Diluted | | 577,530 | | | 494,494 | | | | | |
| Net income (loss) attributable to common stockholders per share: | | | | | | | | |
| | | Basic | | $ | 0.22 | | | $ | 0.05 | | | | | |
| | | Diluted(2) | | $ | 0.22 | | | $ | 0.05 | | | | | |
| Common dividends per share | | $ | 0.61 | | | $ | 0.61 | | | | | |
| | | | | | | | | | |
(1) Includes amounts attributable to redeemable noncontrolling interests. |
(2) Includes adjustment to the numerator for income (loss) attributable to OP Units and DownREIT Units. |
| | | | | | | | | | | |
| 1Q24 | Earnings Release | | April 29, 2024 |
| | | | | | | | | | | | | | | | | | | | | | | | | | | | | | | | |
| FFO Reconciliations | | | | Exhibit 1 | | | | | |
| (in thousands, except per share data) | | Three Months Ended | | | |
| | | | | March 31, | | | |
| | | | | 2024 | | 2023 | | | | | |
| Net income (loss) attributable to common stockholders | | $ | 127,146 | | $ | 25,673 | | | | | |
| Depreciation and amortization | | 365,863 | | 339,112 | | | | | |
| Impairments and losses (gains) on real estate dispositions, net | | 38,624 | | 11,882 | | | | | |
Noncontrolling interests(1) | | (11,996) | | (13,327) | | | | | |
Unconsolidated entities(2) | | 37,066 | | 22,722 | | | | | |
| NAREIT FFO attributable to common stockholders | | 556,703 | | 386,062 | | | | | |
Normalizing items, net(3) | | 28,505 | | 33,471 | | | | | |
| Normalized FFO attributable to common stockholders | | $ | 585,208 | | $ | 419,533 | | | | | |
| | | | | | | | | | | | |
| Average diluted common shares outstanding | | 577,530 | | 494,494 | | | | | |
| | | | | | | | | | | | |
| Per diluted share data attributable to common stockholders: | | | | | | | | | |
| Net income (loss)(4) | | $ | 0.22 | | $ | 0.05 | | | | | |
| NAREIT FFO | | $ | 0.96 | | $ | 0.78 | | | | | |
| Normalized FFO | | $ | 1.01 | | $ | 0.85 | | | | | |
| | | | | | | | | | | | |
| | | | | | | | | | | | |
| Normalized FFO Payout Ratio: | | | | | | | | | |
| Dividends per common share | | $ | 0.61 | | $ | 0.61 | | | | | |
| Normalized FFO attributable to common stockholders per share | | $ | 1.01 | | $ | 0.85 | | | | | |
| | Normalized FFO payout ratio | | 60% | | 72% | | | | | |
| | | | | | | | | | | | |
Other items:(5) | | | | | | | | | |
Net straight-line rent and above/below market rent amortization(6) | | $ | (35,004) | | $ | (33,384) | | | | | |
Non-cash interest expenses(7) | | 9,386 | | 5,878 | | | | | |
| Recurring cap-ex, tenant improvements, and lease commissions | | (51,616) | | (36,913) | | | | | |
| Stock-based compensation | | 11,342 | | 9,124 | | | | | |
| |
| (1) Represents noncontrolling interests' share of net FFO adjustments. | |
| (2) Represents Welltower's share of net FFO adjustments from unconsolidated entities. | |
| (3) See Exhibit 2. | |
| (4) Includes adjustment to the numerator for income (loss) attributable to OP Units and DownREIT Units. | |
| (5) Amounts presented net of noncontrolling interests' share and including Welltower's share of unconsolidated entities. | |
| (6) Excludes normalized other impairment (see Exhibit 2). | |
| (7) Excludes normalized foreign currency loss (gain) (see Exhibit 2). | |
| |
| | | | | | | | | | | |
| 1Q24 | Earnings Release | | April 29, 2024 |
| | | | | | | | | | | | | | | | | | | | | | | |
| Normalizing Items | | Exhibit 2 | | | |
| (in thousands, except per share data) | | Three Months Ended | | | |
| | March 31, | | | |
| | 2024 | | 2023 | | | | | |
| Loss (gain) on derivatives and financial instruments, net | | $ | (3,054) | | (1) | $ | 930 | | | | | | |
| Loss (gain) on extinguishment of debt, net | | 6 | | | 5 | | | | | | |
| Provision for loan losses, net | | 1,014 | | (2) | 777 | | | | | | |
| Income tax benefits | | — | | | (246) | | | | | | |
| Other impairment | | 9,356 | | (3) | — | | | | | | |
| Other expenses | | 14,131 | | (4) | 22,745 | | | | | | |
| | | | | | | | | |
| Casualty losses, net of recoveries | | 2,158 | | (5) | 4,487 | | | | | | |
| Foreign currency loss (gain) | | 609 | | (6) | (227) | | | | | | |
| Normalizing items attributable to noncontrolling interests and unconsolidated entities, net | | 4,285 | | (7) | 5,000 | | | | | | |
| Net normalizing items | | $ | 28,505 | | | $ | 33,471 | | | | | | |
| | | | | | | | | |
| Average diluted common shares outstanding | | 577,530 | | | 494,494 | | | | | | |
| Net normalizing items per diluted share | | $ | 0.05 | | | $ | 0.07 | | | | | | |
| | | | | | | | | |
| (1) Primarily related to mark-to-market of the equity warrants received as part of the Safanad/HC-One transactions. | |
| (2) Primarily related to reserves for loan losses under the current expected credit losses accounting standard. | |
| |
| (3) Represents the write off of straight-line rent receivable balances relating to leases placed on cash recognition. | |
| (4) Primarily related to non-capitalizable transaction costs. | |
| (5) Primarily relates to casualty losses net of any insurance recoveries. | |
| (6) Primarily relates to foreign currency gains and losses related to accrued interest on intercompany loans and third party debt denominated in a foreign currency. | |
| (7) Primarily related to hypothetical liquidation at book value adjustments related to in substance real estate investments. | |
| | | | | | | | | | | | | | | | | | | | | | | | | | | | | | | | |
| Outlook Reconciliation: Year Ending December 31, 2024 | Exhibit 3 | |
| (in millions, except per share data) | | | Prior Outlook | | Current Outlook | |
| | | Low | | High | | Low | | High | |
| FFO Reconciliation: | | | | | | | | | |
| Net income attributable to common stockholders | | $ | 694 | | | $ | 785 | | | $ | 879 | | | $ | 957 | | |
Impairments and losses (gains) on real estate dispositions, net(1,2) | | (78) | | | (78) | | | (154) | | | (154) | | |
Depreciation and amortization(1) | | 1,636 | | | 1,636 | | | 1,638 | | | 1,638 | | |
| NAREIT FFO attributable to common stockholders | | 2,252 | | | 2,343 | | | 2,363 | | | 2,441 | | |
Normalizing items, net(1,3) | | — | | | — | | | 29 | | | 29 | | |
| Normalized FFO attributable to common stockholders | | $ | 2,252 | | | $ | 2,343 | | | $ | 2,392 | | | $ | 2,470 | | |
| | | | | | | | | | |
| Diluted per share data attributable to common stockholders: | | | | | | | | | |
| Net income | | $ | 1.21 | | | $ | 1.37 | | | $ | 1.48 | | | $ | 1.61 | | |
| NAREIT FFO | | $ | 3.94 | | | $ | 4.10 | | | $ | 3.97 | | | $ | 4.10 | | |
| Normalized FFO | | $ | 3.94 | | | $ | 4.10 | | | $ | 4.02 | | | $ | 4.15 | | |
| | | | | | | | | | |
Other items:(1) | | | | | | | | | |
| Net straight-line rent and above/below market rent amortization | | $ | (138) | | | $ | (138) | | | $ | (138) | | | $ | (138) | | |
| Non-cash interest expenses | | 36 | | | 36 | | | 48 | | | 48 | | |
| Recurring cap-ex, tenant improvements, and lease commissions | | (226) | | | (226) | | | (235) | | | (235) | | |
| Stock-based compensation | | 39 | | | 39 | | | 40 | | | 40 | | |
| | |
| (1) Amounts presented net of noncontrolling interests' share and Welltower's share of unconsolidated entities. | |
| (2) Includes estimated gains on projected dispositions. | |
| (3) See Exhibit 2. | |
| |
| | | | | | | | | | | |
| 1Q24 | Earnings Release | | April 29, 2024 |
| | | | | | | | | | | | | | | | | | | | | | | | | | |
| SSNOI Reconciliation | | | | | | Exhibit 4 | |
| (in thousands) | | Three Months Ended | | | |
| | | March 31, | | | |
| | | 2024 | | 2023 | | % growth | |
| Net income (loss) | | $ | 131,634 | | | $ | 28,635 | | | | |
| Loss (gain) on real estate dispositions, net | | (4,707) | | | (747) | | | | |
| Loss (income) from unconsolidated entities | | 7,783 | | | 7,071 | | | | |
| Income tax expense (benefit) | | 6,191 | | | 3,045 | | | | |
| Other expenses | | 14,131 | | | 22,745 | | | | |
| Impairment of assets | | 43,331 | | | 12,629 | | | | |
| Provision for loan losses, net | | 1,014 | | | 777 | | | | |
| Loss (gain) on extinguishment of debt, net | | 6 | | | 5 | | | | |
| Loss (gain) on derivatives and financial instruments, net | | (3,054) | | | 930 | | | | |
| General and administrative expenses | | 53,318 | | | 44,371 | | | | |
| Depreciation and amortization | | 365,863 | | | 339,112 | | | | |
| Interest expense | | 147,318 | | | 144,403 | | | | |
| Consolidated NOI | | 762,828 | | | 602,976 | | | | |
NOI attributable to unconsolidated investments(1) | | 32,090 | | | 26,354 | | | | |
NOI attributable to noncontrolling interests(2) | | (22,796) | | | (25,057) | | | | |
| Pro rata NOI | | 772,122 | | | 604,273 | | | | |
Non-cash NOI attributable to same store properties | | (11,530) | | | (28,727) | | | | |
NOI attributable to non-same store properties | | (222,298) | | | (101,335) | | | | |
Currency and ownership adjustments(3) | | (713) | | | 3,779 | | | | |
Normalizing adjustments, net(4) | | 1,558 | | | (545) | | | | |
| Same Store NOI (SSNOI) | | $ | 539,139 | | | $ | 477,445 | | | 12.9% | |
| | | | | | | |
| Seniors Housing Operating | | 266,907 | | | 212,749 | | | 25.5% | |
| Seniors Housing Triple-net | | 93,740 | | | 90,310 | | | 3.8% | |
| Outpatient Medical | | 119,184 | | | 116,879 | | | 2.0% | |
| Long-Term/Post-Acute Care | | 59,308 | | | 57,507 | | | 3.1% | |
Total SSNOI | | $ | 539,139 | | | $ | 477,445 | | | 12.9% | |
| | | | | | | | |
| (1) Represents Welltower's interests in joint ventures where Welltower is the minority partner. | |
| (2) Represents minority partners' interests in joint ventures where Welltower is the majority partner. | |
| (3) Includes adjustments to reflect consistent property ownership percentages and foreign currency exchange rates for properties in the U.K. and Canada. | |
| (4) Includes other adjustments described in the accompanying Supplement. | |
| |
| | | | | | | | | | | |
| 1Q24 | Earnings Release | | April 29, 2024 |
| | | | | | | | | | | | | | | | | |
| Reconciliation of SHO SS RevPOR Growth | Exhibit 5 | |
| (in thousands except SS RevPOR) | Three Months Ended | | |
| March 31, | | |
| 2024 | | 2023 | | |
| Consolidated SHO revenues | $ | 1,366,760 | | | $ | 1,136,681 | | | |
Unconsolidated SHO revenues attributable to WELL(1) | 63,581 | | | 59,581 | | | |
SHO revenues attributable to noncontrolling interests(2) | (43,523) | | | (52,518) | | | |
SHO pro rata revenues(3) | 1,386,818 | | | 1,143,744 | | | |
| Non-cash and non-RevPOR revenues on same store properties | (1,295) | | | (1,935) | | | |
| Revenues attributable to non-same store properties | (381,958) | | | (239,416) | | | |
Currency and ownership adjustments(4) | (1,317) | | | 6,049 | | | |
| | | | | |
| | | | | |
| | | | | |
SHO SS RevPOR revenues(5) | $ | 1,002,248 | | | $ | 908,442 | | | |
| | | | | |
Average occupied units/month(6) | 59,502 | | | 57,143 | | | |
SHO SS RevPOR(7) | $ | 5,630 | | | $ | 5,373 | | | |
| SS RevPOR YOY growth | 4.8 | % | | | | |
| | | | | |
| | | | | |
| | | | | |
| | | | | |
| | | | | |
| | | | | |
| | | | | |
| | | | | |
| | | | | |
| | | | | |
| | | | | |
| | | | | |
| | | | | |
| | | | | |
| | | | | |
| | | | | |
| | | | | |
| | | | | |
| | | | | |
| | | | | |
| | | | | |
| | | | | |
| | | | | |
| | | | | |
| | | | | |
(1) Represents Welltower's interests in joint ventures where Welltower is the minority partner. | | |
| (2) Represents minority partners' interests in joint ventures where Welltower is the majority partner. | |
| (3) Represents SHO revenues at Welltower pro rata ownership. | | |
(4) Includes where appropriate adjustments to reflect consistent property ownership percentages, to translate Canadian properties at a USD/CAD rate of 1.36 and to translate UK properties at a GBP/USD rate of 1.25. | |
| |
| | |
| (5) Represents SS SHO RevPOR revenues at Welltower pro rata ownership. | | |
| (6) Represents average occupied units for SS properties on a pro rata basis. | | |
| (7) Represents pro rata SS average revenues generated per occupied room per month. | | |
| | | | | | | | | | | |
| 1Q24 | Earnings Release | | April 29, 2024 |
| | | | | | | | | | | | | | | | | | | | | | | | | | |
| Net Debt to Adjusted EBITDA Reconciliation | | Exhibit 6 | | | | | |
| (in thousands) | | Three Months Ended | |
| | | | | March 31, 2024 | | | | | |
| Net income (loss) | | $ | 131,634 | | | | | | |
| Interest expense | | 147,318 | | | | | | |
| Income tax expense (benefit) | | 6,191 | | | | | | |
| Depreciation and amortization | | 365,863 | | | | | | |
| EBITDA | | 651,006 | | | | | | |
| Loss (income) from unconsolidated entities | | 7,783 | | | | | | |
| Stock-based compensation | | 11,342 | | | | | | |
| Loss (gain) on extinguishment of debt, net | | 6 | | | | | | |
| Loss (gain) on real estate dispositions, net | | (4,707) | | | | | | |
| Impairment of assets | | 43,331 | | | | | | |
| Provision for loan losses, net | | 1,014 | | | | | | |
| Loss (gain) on derivatives and financial instruments, net | | (3,054) | | | | | | |
| Other expenses | | 14,131 | | | | | | |
| | | | | | | |
| Casualty losses, net of recoveries | | 2,158 | | | | | | |
Other impairment(1) | | 9,356 | | | | | | |
| Adjusted EBITDA | | $ | 732,366 | | | | | | |
| | | | | | | |
Total debt(2) | | $ | 14,285,686 | | | | | | |
| Cash and cash equivalents and restricted cash | | (2,478,335) | | | | | | |
| Net debt | | $ | 11,807,351 | | | | | | |
| | | | | | | |
| Adjusted EBITDA annualized | | $ | 2,929,464 | | | | | | |
| Net debt to Adjusted EBITDA ratio | | 4.03x | | | | | |
| | | | | | | | |
| (1) Represents the write off of straight-line rent receivable balances for leases placed on cash recognition. | |
(2) Amounts include unamortized premiums/discounts, other fair value adjustments and financing lease liabilities. Excludes operating lease liabilities related to ASC 842 of $300,779,000 for the three months ended March 31, 2024. | |
| | | | | | | | | | |
| | | | | | | | | | | | | | | | | | | | |
| Net Debt to Consolidated Enterprise Value | | | | Exhibit 7 | |
| (in thousands, except share price) | | | |
| | | March 31, 2024 | | December 31, 2023 | |
| Common shares outstanding | | 590,934 | | | 564,241 | | |
| Period end share price | | $ | 93.44 | | | $ | 90.17 | | |
| Common equity market capitalization | | $ | 55,216,873 | | | $ | 50,877,611 | | |
| | | | | |
| | | | | |
| | | | | |
| Net debt | | $ | 11,807,351 | | | $ | 13,739,143 | | |
| | | | | | |
Noncontrolling interests(1) | | 999,965 | | | 967,351 | | |
| Consolidated enterprise value | | $ | 68,024,189 | | | $ | 65,584,105 | | |
| Net debt to consolidated enterprise value | | 17.4 | % | | 20.9 | % | |
| | | | | | |
| |
| (1) Includes amounts attributable to both redeemable noncontrolling interests and noncontrolling interests as reflected on our consolidated balance sheets. | |
| | | | | | |
| | | | | |
Overview | |
| |
Portfolio | |
| |
Investment | |
| |
Financial | |
| |
Glossary | |
| |
Supplemental Reporting Measures | |
| |
Forward Looking Statements and Risk Factors | |
| | | | | | | | | | | | | | | | | | | | | | | | | | | | | | | | | | | | | | | | | | | | | | | |
| (dollars and occupancy at Welltower pro rata ownership; dollars in thousands) | | |
| | | | | | | | | | | | | | | |
Portfolio Composition(1) | | Beds/Unit Mix |
| Average Age | | Properties | | Total | | Wellness Housing | | Independent Living | | Assisted Living | | Memory Care | | Long-Term/ Post-Acute Care |
| Seniors Housing Operating | 17 | | 994 | | 120,401 | | 20,767 | | 45,676 | | 37,958 | | 15,370 | | 630 |
| Seniors Housing Triple-net | 18 | | 360 | | 27,842 | | — | | 5,001 | | 13,671 | | 8,791 | | 379 |
| Outpatient Medical | 18 | | 450 | | 26,680,153 | (2) | n/a | | n/a | | n/a | | n/a | | n/a |
| Long-Term/Post-Acute Care | 32 | | 292 | | 37,225 | | — | | — | | 1,022 | | — | | 36,203 |
| Total | 19 | | 2,096 | | | | | | | | | | | | |
| | | | | | | | | | | | | | | | | | | | | | | | | | | | | | | | | | | | | | | | | | | | | |
| NOI Performance | Same Store(3) | | In-Place Portfolio(4) | |
| | Properties | | 1Q23 NOI | | 1Q24 NOI | | % Change | | Properties | | Annualized
In-Place NOI | | % of Total | |
| Seniors Housing Operating | 665 | | $ | 212,749 | | | $ | 266,907 | | | 25.5 | % | | 899 | | $ | 1,344,032 | | | 51.5 | % | |
| Seniors Housing Triple-net | 332 | | 90,310 | | | 93,740 | | | 3.8 | % | | 357 | | 407,064 | | | 15.6 | % | |
| Outpatient Medical | 378 | | 116,879 | | | 119,184 | | | 2.0 | % | | 422 | | 526,384 | | | 20.2 | % | |
| Long-Term/Post-Acute Care | 195 | | 57,507 | | 59,308 | | | 3.1 | % | | 259 | | 332,320 | | | 12.7 | % | |
| Total | 1,570 | | $ | 477,445 | | | $ | 539,139 | | | 12.9 | % | | 1,937 | | $ | 2,609,800 | | | 100.0 | % | |
| | | | | | | | | | | | | | | | | | | | | | | | | | | | | | | | | | | | | | | | | |
| Portfolio Performance | | | | Facility Revenue Mix |
Stable Portfolio(5) | Occupancy | | EBITDAR Coverage(6) | | EBITDARM Coverage(6) | | Private Pay | | Medicaid | | Medicare | | Other Government(7) |
| Seniors Housing Operating | 83.9 | % | | n/a | | n/a | | 97.6 | % | | 1.0 | % | | 0.4 | % | | 1.0 | % |
| Seniors Housing Triple-net | 83.2 | % | | 1.02 | | 1.23 | | 88.6 | % | | 4.2 | % | | 0.5 | % | | 6.7 | % |
| Outpatient Medical | 94.2 | % | | n/a | | n/a | | 100.0 | % | | — | | | — | | | — | |
Long-Term/Post-Acute Care (8) | 79.3 | % | | 1.23 | | 1.62 | | 27.6 | % | | 47.7 | % | | 24.7 | % | | — | % |
| Total | | | 1.06 | | 1.31 | | 93.0 | % | | 3.9 | % | | 1.7 | % | | 1.4 | % |
Notes:
(1) Includes land parcels and properties under development.
(2) Indicates the total square footage of Outpatient Medical properties.
(3) See pages 17 and 18 for reconciliation. (4) Excludes land parcels, loans, developments and investments held for sale. See page 17 for reconciliation. (5) Data as of March 31, 2024 for Seniors Housing Operating and Outpatient Medical and December 31, 2023 for remaining asset types.
(6) Represents trailing twelve month coverage metrics.
(7) Represents various federal and local reimbursement programs in the United Kingdom and Canada.
(8) Long-Term/Post Acute Care coverage now includes 95 properties leased to Integra Healthcare Properties with EBITDARM and EBITDAR coverage of 1.58x and 1.13x, respectively, on a trailing twelve month basis as of December 31, 2023. Excluding these properties, Long-Term/Post-Acute Care EBITDARM and EBITDAR coverage is 1.67x and 1.36x, respectively, on a trailing twelve month basis as of December 31, 2023.
| | | | | | | | | | | | | | | | | | | | | | | | | | | | | | | | | | | | | | | | | |
| (dollars in thousands at Welltower pro rata ownership) |
In-Place NOI Diversification(1) |
| By Partner: | Total Properties | | Seniors Housing Operating | | Seniors Housing
Triple-net | | Outpatient
Medical | | Long-Term/ Post-Acute Care | | Total | | % of Total |
| Cogir Management Corporation | 105 | | | $ | 176,880 | | | $ | — | | | $ | — | | | $ | — | | | $ | 176,880 | | | 6.8 | % |
| Sunrise Senior Living | 91 | | | 170,568 | | | — | | | — | | | — | | | 170,568 | | | 6.5 | % |
| Integra Healthcare Properties | 147 | | | — | | | — | | | — | | | 156,272 | | | 156,272 | | | 6.0 | % |
| Avery Healthcare | 91 | | | 76,420 | | | 69,700 | | | — | | | — | | | 146,120 | | | 5.6 | % |
| Oakmont Management Group | 63 | | | 112,844 | | | — | | | — | | | — | | | 112,844 | | | 4.3 | % |
| Aspire | 53 | | | — | | | — | | | — | | | 84,572 | | | 84,572 | | | 3.2 | % |
| Belmont Village | 21 | | | 81,564 | | | — | | | — | | | — | | | 81,564 | | | 3.1 | % |
| Sagora Senior Living | 43 | | | 56,396 | | | 24,492 | | | — | | | — | | | 80,888 | | | 3.1 | % |
| StoryPoint Senior Living | 81 | | | 51,360 | | | 25,832 | | | — | | | — | | | 77,192 | | | 3.0 | % |
| Atria Senior Living | 91 | | | 76,808 | | | — | | | — | | | — | | | 76,808 | | | 2.9 | % |
| Remaining | 1,151 | | | 541,192 | | | 287,040 | | | 526,384 | | | 91,476 | | | 1,446,092 | | | 55.5 | % |
| Total | 1,937 | | | $ | 1,344,032 | | | $ | 407,064 | | | $ | 526,384 | | | $ | 332,320 | | | $ | 2,609,800 | | | 100.0 | % |
| | | | | | | | | | | | | |
| By Country: | | | | | | | | | | | | | |
| United States | 1,674 | | | $ | 1,061,112 | | | $ | 327,168 | | | $ | 526,384 | | | $ | 325,496 | | | $ | 2,240,160 | | | 85.8 | % |
| United Kingdom | 129 | | | 118,344 | | | 76,472 | | | — | | | — | | | 194,816 | | | 7.5 | % |
| Canada | 134 | | | 164,576 | | | 3,424 | | | — | | | 6,824 | | | 174,824 | | | 6.7 | % |
| Total | 1,937 | | | $ | 1,344,032 | | | $ | 407,064 | | | $ | 526,384 | | | $ | 332,320 | | | $ | 2,609,800 | | | 100.0 | % |
| | | | | | | | | | | | | |
| By MSA: | | | | | | | | | | | | | |
| Los Angeles | 74 | | $ | 90,316 | | | $ | 20,580 | | | $ | 42,336 | | | $ | 2,220 | | | $ | 155,452 | | | 6.0 | % |
| New York / New Jersey | 76 | | 74,284 | | | 14,412 | | | 38,764 | | | 3,608 | | | 131,068 | | | 5.0 | % |
| Dallas | 71 | | 62,816 | | | 6,608 | | | 29,960 | | | 4,496 | | | 103,880 | | | 4.0 | % |
| Greater London | 49 | | 72,720 | | | 17,380 | | | — | | | — | | | 90,100 | | | 3.5 | % |
| Washington D.C. | 40 | | 44,668 | | | 6,648 | | | 12,424 | | | 18,548 | | | 82,288 | | | 3.2 | % |
| Houston | 38 | | 13,044 | | | 3,684 | | | 48,516 | | | — | | | 65,244 | | | 2.5 | % |
| Philadelphia | 45 | | 13,036 | | | 5,476 | | | 20,920 | | | 23,756 | | | 63,188 | | | 2.4 | % |
| Montréal | 25 | | 56,364 | | | — | | | — | | | — | | | 56,364 | | | 2.2 | % |
| Chicago | 49 | | 30,064 | | | 6,400 | | | 10,204 | | | 5,944 | | | 52,612 | | | 2.0 | % |
| San Francisco | 24 | | 29,476 | | | 11,012 | | | 1,600 | | | 4,044 | | | 46,132 | | | 1.8 | % |
| Raleigh | 13 | | 9,320 | | | 29,736 | | | 3,200 | | | — | | | 42,256 | | | 1.6 | % |
| Charlotte | 29 | | 7,308 | | | 10,412 | | | 23,840 | | | — | | | 41,560 | | | 1.6 | % |
| San Diego | 17 | | 20,012 | | | 7,084 | | | 9,740 | | | 2,980 | | | 39,816 | | | 1.5 | % |
| Seattle | 30 | | 19,472 | | | 3,656 | | | 15,304 | | | 336 | | | 38,768 | | | 1.5 | % |
| Tampa | 37 | | 860 | | | 3,624 | | | 5,968 | | | 27,904 | | | 38,356 | | | 1.5 | % |
| Miami | 41 | | 2,372 | | | 1,416 | | | 15,196 | | | 13,780 | | | 32,764 | | | 1.3 | % |
| Minneapolis | 21 | | 328 | | | 18,344 | | | 13,856 | | | — | | | 32,528 | | | 1.2 | % |
| Pittsburgh | 27 | | 16,164 | | | 4,900 | | | 3,764 | | | 7,324 | | | 32,152 | | | 1.2 | % |
| Baltimore | 16 | | 5,528 | | | 1,776 | | | 12,596 | | | 11,900 | | | 31,800 | | | 1.2 | % |
| Boston | 20 | | 21,404 | | | 5,412 | | | 2,492 | | | — | | | 29,308 | | | 1.1 | % |
| Remaining | 1,195 | | | 754,476 | | 228,504 | | 215,704 | | 205,480 | | 1,404,164 | | 53.7 | % |
| Total | 1,937 | | | $ | 1,344,032 | | | $ | 407,064 | | | $ | 526,384 | | | $ | 332,320 | | | $ | 2,609,800 | | | 100.0 | % |
| | | | | | | | | | | | | |
Notes:
(1) Represents current quarter annualized In-Place NOI. See page 17 for reconciliation.
| | | | | | | | | | | | | | | | | | | | | | | | | | | | | | | | | | | |
| (dollars, units and occupancy at Welltower pro rata ownership; dollars in thousands) |
| Seniors Housing Operating | | | | | | | | |
| | | | | | | | | | | |
Total Portfolio Performance(1) | | 1Q23 | | 2Q23 | | 3Q23 | | 4Q23 | | 1Q24 |
| Properties | | | 885 | | | 886 | | | 883 | | | 915 | | | 935 | |
| Units | | | 89,240 | | | 89,932 | | | 90,953 | | | 99,387 | | | 101,395 | |
| Total occupancy | | | 79.0 | % | | 79.6 | % | | 80.7 | % | | 82.2 | % | | 82.5 | % |
| Total revenues | | | $ | 1,143,744 | | | $ | 1,178,975 | | | $ | 1,221,753 | | | $ | 1,287,666 | | | $ | 1,386,818 | |
| Operating expenses | | | 894,981 | | | 902,068 | | | 933,463 | | | 982,077 | | | 1,034,982 | |
| NOI | | | $ | 248,763 | | | $ | 276,907 | | | $ | 288,290 | | | $ | 305,589 | | | $ | 351,836 | |
| NOI margin | | | 21.7 | % | | 23.5 | % | | 23.6 | % | | 23.7 | % | | 25.4 | % |
| Recurring cap-ex | | | $ | 26,848 | | | $ | 32,791 | | | $ | 31,685 | | | $ | 49,297 | | | $ | 37,104 | |
| Other cap-ex | | | $ | 45,557 | | | $ | 66,002 | | | $ | 68,281 | | | $ | 85,506 | | | $ | 70,428 | |
| | | | | | | | | | | | | | | | | | | | | | | | | | | | | | | | | | | |
Same Store Performance(2) | | 1Q23 | | 2Q23 | | 3Q23 | | 4Q23 | | 1Q24 |
| Properties | | | 665 | | | 665 | | | 665 | | | 665 | | | 665 | |
| Units | | | 71,396 | | | 71,396 | | | 71,397 | | | 71,340 | | | 71,341 | |
| Occupancy | | | 80.0 | % | | 80.8 | % | | 82.2 | % | | 83.5 | % | | 83.4 | % |
| Same store revenues | | | $ | 909,268 | | | $ | 935,048 | | | $ | 962,566 | | | $ | 980,403 | | | $ | 1,003,135 | |
| Compensation | | | 405,757 | | | 411,465 | | | 419,371 | | | 428,978 | | | 427,507 | |
| Utilities | | | 49,419 | | | 41,362 | | | 48,072 | | | 44,909 | | | 49,072 | |
| Food | | | 35,847 | | | 37,503 | | | 38,155 | | | 39,878 | | | 39,180 | |
| Repairs and maintenance | | 26,274 | | | 27,565 | | | 29,135 | | | 28,582 | | | 28,457 | |
| Property taxes | | | 36,782 | | | 36,190 | | | 36,125 | | | 35,034 | | | 37,359 | |
| All other | | | 142,440 | | | 149,249 | | | 149,454 | | | 157,684 | | | 154,653 | |
| Same store operating expenses | | 696,519 | | | 703,334 | | | 720,312 | | | 735,065 | | | 736,228 | |
| Same store NOI | | | $ | 212,749 | | | $ | 231,714 | | | $ | 242,254 | | | $ | 245,338 | | | $ | 266,907 | |
| Same store NOI margin % | | | 23.4 | % | | 24.8 | % | | 25.2 | % | | 25.0 | % | | 26.6 | % |
| Year over year NOI growth rate | | | | | | | | | | | 25.5 | % |
| Year over year revenue growth rate | | | | | | | | 10.3 | % |
| | | | | | | | | | | | | | | | | | | | | | | | | | | | | | | | | | | | | | |
Partners(3) | | Properties | | Pro Rata Units | | Welltower Ownership %(4) | | Top Markets | | 1Q24 NOI | | % of Total |
| Cogir Management Corporation | | 105 | | | 15,533 | | | 85.6 | % | | Southern California | | $ | 32,634 | | | 9.3 | % |
| Sunrise Senior Living | | 91 | | | 8,096 | | | 96.1 | % | | Northern California | | 19,709 | | | 5.6 | % |
| Oakmont Management Group | | 63 | | | 6,557 | | | 100.0 | % | | New York / New Jersey | | 18,426 | | | 5.2 | % |
| Belmont Village | | 21 | | | 2,804 | | | 95.0 | % | | Greater London, UK | | 18,191 | | | 5.2 | % |
| Atria Senior Living | | 91 | | | 10,728 | | | 100.0 | % | | Dallas | | 15,365 | | | 4.4 | % |
| Avery Healthcare | | 41 | | | 3,245 | | | 97.6 | % | | Montréal | | 15,074 | | | 4.3 | % |
| Legend Senior Living | | 40 | | | 3,198 | | | 93.8 | % | | Washington D.C. | | 12,611 | | | 3.6 | % |
| Brandywine Living | | 29 | | | 2,722 | | | 100.0 | % | | Toronto | | 8,200 | | | 2.3 | % |
| Sagora Senior Living | | 21 | | | 3,194 | | | 99.6 | % | | Chicago | | 7,401 | | | 2.1 | % |
| StoryPoint Senior Living | | 60 | | | 6,973 | | | 100.0 | % | | Boston | | 5,637 | | | 1.6 | % |
| Care UK | | 26 | | | 1,870 | | | 100.0 | % | | Top Markets | | 153,248 | | | 43.6 | % |
| Clover | | 36 | | | 3,950 | | | 90.4 | % | | All Other | | 198,588 | | | 56.4 | % |
| Pegasus | | 30 | | | 3,348 | | | 99.7 | % | | Total | | $ | 351,836 | | | 100.0 | % |
| Senior Resource Group | | 12 | | | 1,258 | | | 46.6 | % | | | | | | |
| Remaining | | 233 | | | 24,595 | | | | | | | | | |
| Total | | 899 | | | 98,071 | | | | | | | | | |
Notes:
(1) Properties, units and occupancy exclude land parcels and properties under development.
(2) See pages 17 and 18 for reconciliation. (3) Represents partner concentration based on annualized In-Place NOI for the quarter ended March 31, 2024. Property count and pro rata units represent the In-Place portfolio.
(4) Welltower ownership percentage weighted based on In-Place NOI. See page 17 for reconciliation.
| | | | | | | | | | | | | | | | | | | | | | | | | | | | | | | | | | | | | | | | | | | | | | | |
| (dollars in thousands at Welltower pro rata ownership) |
| Payment Coverage Stratification | | |
| EBITDARM Coverage(1) | | EBITDAR Coverage(1) |
| % of In-Place NOI | Seniors Housing Triple-net | Long-Term/ Post- Acute Care | Total | | Weighted Average Maturity | | Number of Leases | | Seniors Housing Triple-net | Long-Term/ Post- Acute Care | Total | | Weighted Average Maturity | | Number of Leases |
| <.85x | 0.4 | % | — | % | 0.4 | % | | 9 | | | 2 | | | 2.6 | % | — | % | 2.6 | % | | 9 | | | 4 | |
| .85x-.95x | — | % | — | % | — | % | | — | | | — | | | 1.5 | % | 1.3 | % | 2.8 | % | | 5 | | | 5 | |
| .95x-1.05x | 2.3 | % | — | % | 2.3 | % | | 9 | | | 2 | | | 2.6 | % | — | % | 2.6 | % | | 17 | | | 4 | |
| 1.05x-1.15x | 1.9 | % | 0.4 | % | 2.3 | % | | 5 | | | 4 | | | 3.5 | % | 3.0 | % | 6.5 | % | | 8 | | | 5 | |
| 1.15x-1.25x | 2.1 | % | 0.9 | % | 3.0 | % | | 11 | | | 3 | | | 2.9 | % | — | % | 2.9 | % | | 10 | | | 2 | |
| 1.25x-1.35x | 5.7 | % | 0.1 | % | 5.8 | % | | 8 | | | 5 | | | — | % | — | % | — | % | | — | | | — | |
| >1.35 | 1.2 | % | 4.3 | % | 5.5 | % | | 17 | | | 13 | | | 0.5 | % | 1.4 | % | 1.9 | % | | 15 | | | 9 | |
| Total | 13.6 | % | 5.7 | % | 19.3 | % | | 11 | | | 29 | | | 13.6 | % | 5.7 | % | 19.3 | % | | 11 | | | 29 | |
|
| | | | | | | | | | | | | | | | | | | | | | | | | | | | | | | | | | | | | | |
Revenue and Lease Maturity(2) | | | | | | |
| | Rental Income | | | | | | |
| Year | | Seniors Housing
Triple-net | | Outpatient Medical | | Long-Term / Post-Acute Care | | Interest
Income | | Total
Revenues | | % of Total |
| 2024 | | $ | 13,495 | | | $ | 50,449 | | | $ | — | | | $ | 39,088 | | | $ | 103,032 | | | 6.9 | % |
| 2025 | | 5,837 | | | 40,593 | | | 720 | | | 16,667 | | | 63,817 | | | 4.3 | % |
| 2026 | | 3,304 | | | 49,666 | | | 9,287 | | | 40,118 | | | 102,375 | | | 6.8 | % |
| 2027 | | — | | | 45,040 | | | 1,232 | | | 11,953 | | | 58,225 | | | 3.9 | % |
| 2028 | | — | | | 46,576 | | | 6,404 | | | 103,633 | | | 156,613 | | | 10.4 | % |
| 2029 | | 1,035 | | | 42,595 | | | — | | | 3,322 | | | 46,952 | | | 3.1 | % |
| 2030 | | 42,330 | | | 39,955 | | | 29,031 | | | 361 | | | 111,677 | | | 7.4 | % |
| 2031 | | 6,571 | | | 52,905 | | | 4,430 | | | 233 | | | 64,139 | | | 4.3 | % |
| 2032 | | 94,226 | | | 44,474 | | | — | | | 351 | | | 139,051 | | | 9.3 | % |
| 2033 | | 55,028 | | | 32,495 | | | — | | | — | | | 87,523 | | | 5.8 | % |
| Thereafter | | 154,579 | | | 129,182 | | | 280,219 | | | 1,718 | | | 565,698 | | | 37.8 | % |
| | $ | 376,405 | | | $ | 573,930 | | | $ | 331,323 | | | $ | 217,444 | | | $ | 1,499,102 | | | 100.0 | % |
| | | | | | | | | | | | |
| Weighted Avg Maturity Years | | 10 | | | 7 | | | 14 | | | 3 | | | 9 | | | |
| | | | | | | | | | | | |
Notes:
(1) Represents trailing twelve month coverage metrics as of December 31, 2023 for stable portfolio only. Agreements included represent 69% of total Seniors Housing Triple-net and Long-Term/Post-Acute Care In-Place NOI. See page 17 for a reconciliation. Agreements with mixed units use the predominant type based on investment balance. (2) Excludes all land parcels, developments and investments held for sale. Rental income represents annualized cash base rent for effective lease agreements. The amounts are derived from the current contracted monthly cash base rent, net of collectability reserves, if applicable. Rental income does not include common area maintenance charges, the amortization of above/below market lease intangibles or other non cash income. Interest income represents contractual rate of interest for loans, net of collectability reserves if applicable.
| | | | | | | | | | | | | | | | | | | | | | | | | | | | | | | | |
| (dollars, square feet and occupancy at Welltower pro rata ownership; dollars in thousands except per square feet) |
| Outpatient Medical |
Total Portfolio Performance(1) | | 1Q23 | | 2Q23 | | 3Q23 | | 4Q23 | | 1Q24 |
| Properties | | 419 | | | 420 | | | 422 | | | 426 | | | 427 | |
| Square feet | | 20,188,159 | | | 20,236,315 | | | 20,748,969 | | | 21,043,557 | | | 21,148,949 | |
| Occupancy | | 94.0 | % | | 94.4 | % | | 94.5 | % | | 94.5 | % | | 94.2 | % |
| Total revenues | | $ | 185,190 | | | $ | 186,802 | | | $ | 195,136 | | | $ | 192,822 | | | $ | 203,849 | |
| Operating expenses | | 58,977 | | | 59,358 | | | 63,831 | | | 55,060 | | | 65,162 | |
| NOI | | $ | 126,213 | | | $ | 127,444 | | | $ | 131,305 | | | $ | 137,762 | | | $ | 138,687 | |
| NOI margin | | 68.2 | % | | 68.2 | % | | 67.3 | % | | 71.4 | % | | 68.0 | % |
| Revenues per square foot | | $ | 36.69 | | | $ | 36.92 | | | $ | 37.62 | | | $ | 36.65 | | | $ | 38.55 | |
| NOI per square foot | | $ | 25.01 | | | $ | 25.19 | | | $ | 25.31 | | | $ | 26.19 | | | $ | 26.23 | |
| Recurring cap-ex | | $ | 10,666 | | | $ | 7,400 | | | $ | 18,340 | | | $ | 21,106 | | | $ | 14,512 | |
| Other cap-ex | | $ | 5,118 | | | $ | 4,397 | | | $ | 8,545 | | | $ | 10,151 | | | $ | 7,826 | |
| | | | | | | | | | | | | | | | | | | | | | | | | | | | | | | | |
Same Store Performance(2) | | 1Q23 | | 2Q23 | | 3Q23 | | 4Q23 | | 1Q24 |
| Properties | | 378 | | | 378 | | | 378 | | | 378 | | | 378 | |
| Occupancy | | 94.7 | % | | 94.9 | % | | 95.0 | % | | 94.8 | % | | 94.7 | % |
| Same store revenues | | $ | 172,500 | | | $ | 171,576 | | | $ | 174,464 | | | $ | 167,390 | | | $ | 176,084 | |
| Same store operating expenses | | 55,621 | | | 53,748 | | | 56,714 | | | 47,070 | | | 56,900 | |
| Same store NOI | | $ | 116,879 | | | $ | 117,828 | | | $ | 117,750 | | | $ | 120,320 | | | $ | 119,184 | |
| NOI margin | | 67.8 | % | | 68.7 | % | | 67.5 | % | | 71.9 | % | | 67.7 | % |
| Year over year NOI growth rate | | | | | | | | | | 2.0 | % |
| | | | | | | | | | | | | | | | | | | | | | | |
Portfolio Diversification by Tenant(3) | | Rental Income | | % of Total | | Quality Indicators | |
| Kelsey-Seybold | | $ | 45,543 | | | 7.9 | % | | Health system affiliated properties as % of NOI(3) | 88.9 | % |
| UnitedHealth | | 18,404 | | | 3.2 | % | | Health system affiliated tenants as % of rental income(3) | 60.4 | % |
| Common Spirit Health | | 17,976 | | | 3.1 | % | | Investment grade tenants as % of rental income | 55.6 | % |
| Novant Health | | 17,485 | | | 3.0 | % | | Retention (trailing twelve months)(3) | 92.7 | % |
| Providence Health & Services | | 16,739 | | | 2.9 | % | | In-house managed properties as % of square feet(3,4) | 86.0 | % |
| Remaining portfolio | | 457,783 | | | 79.9 | % | | Average remaining lease term (years)(3) | 6.6 | |
| Total | | $ | 573,930 | | | 100.0 | % | | Average building size (square feet)(3) | 59,095 | |
| | | | | | Average age (years) | 18 | |
| | | | | | | | | | | | | | | | | | | | | | | | | | | | | | | | | | | | | | |
Expirations(3) | | 2024 | | 2025 | | 2026 | | 2027 | | 2028 | | Thereafter |
| Occupied square feet | | 1,696,000 | | | 1,335,971 | | | 1,785,862 | | | 1,588,107 | | | 1,652,794 | | | 11,863,093 | |
| % of occupied square feet | | 8.5 | % | | 6.7 | % | | 9.0 | % | | 8.0 | % | | 8.3 | % | | 59.5 | % |
| | | | | | | | | | | | |
Notes:
(1) Property count, occupancy, square feet and per square foot metrics exclude properties under development and all land parcels. Per square foot amounts are annualized.
(2) Includes 378 same store properties representing 18,642,638 square feet. See pages 17 and 18 for reconciliation. (3) Excludes all land parcels, developments and investments held for sale. Rental income represents annualized cash base rent for effective lease agreements. The amounts are derived from the current contracted monthly cash base rent, net of collectability reserves, if applicable. Rental income does not include common area maintenance charges, the amortization of above/below market lease intangibles or other non cash income. Retention includes month-to-month tenants retained.
(4) Excludes tenant managed properties.
(dollars in thousands at Welltower pro rata ownership)
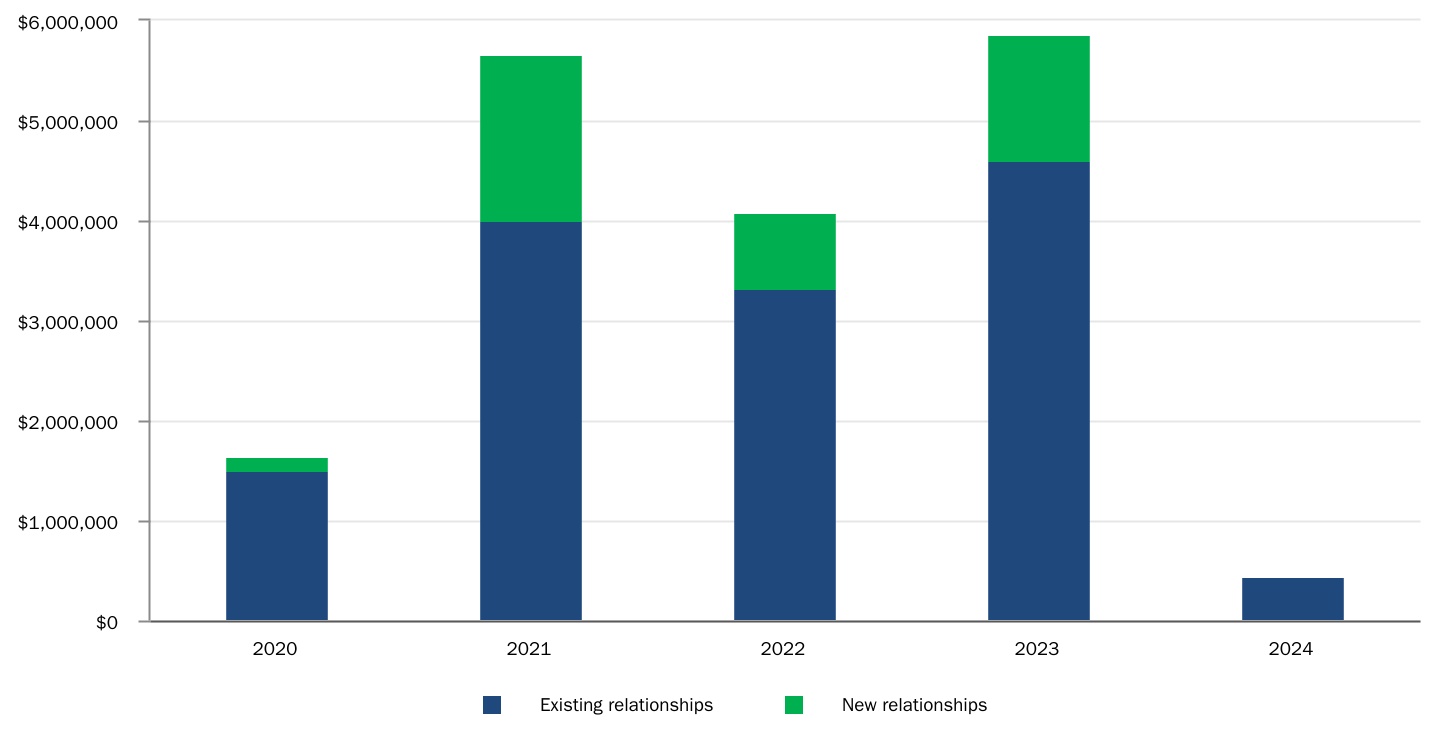
Relationship Investment History
| | | | | | | | | | | | | | | | | | | | | | | | | | | | | | | | | | | | | | | | | | | | | |
Detail of Acquisitions/JVs(1) | |
| 2020 | | 2021 | | 2022 | | 2023 | | | | | | | | 1Q24 | | 20-24 Total | |
| Count | | 12 | | | 35 | | | 27 | | | 52 | | | | | | | | | 3 | | 129 | | |
| Total | | $ | 910,217 | | | $ | 4,101,534 | | | $ | 2,785,739 | | | $ | 4,222,706 | | | | | | | | | $ | 61,034 | | | $ | 12,081,230 | | |
| Low | | 6,201 | | | 5,000 | | | 6,485 | | | 2,950 | | | | | | | | | 6,786 | | | 2,950 | | |
| Median | | 48,490 | | | 45,157 | | | 66,074 | | | 65,134 | | | | | | | | | 23,753 | | | 48,875 | | |
| High | | 235,387 | | | 1,576,642 | | | 389,149 | | | 644,443 | | | | | | | | | 30,495 | | | 1,576,642 | | |
| | | | | | | | | | | | | | | | | | | | | | | | | | | | | | | | | |
| Investment Timing | |
| | Acquisitions and Loan Funding(2) | Yield | | | | | Construction Conversions(3) | Year 1 Yield | | Dispositions and Loan Repayments | Yield | |
| January | | $ | 66,655 | | 6.7 | % | | | | | $ | 98,565 | | 5.5 | % | | $ | 77,834 | | 4.2 | % | |
| February | | 75,547 | | 6.9 | % | | | | | 47,853 | | 1.3 | % | | 29,050 | | 7.0 | % | |
| March | | 65,732 | | 6.8 | % | | | | | 19,185 | | 0.6 | % | | 110 | | 7.5 | % | |
| Total | | $ | 207,934 | | 6.8 | % | | | | | $ | 165,603 | | 3.7 | % | | $ | 106,994 | | 5.0 | % | |
Notes:
(1) Includes non-yielding asset acquisitions.
(2) Excludes land acquisitions and includes advances for non-real estate loans and excludes advances for development loans.
(3) Includes expansion conversions.
| | | | | | | | | | | | | | | | | | | | | | | | | | | | | | | | |
| (dollars in thousands at Welltower pro rata ownership, except per bed / unit / square foot) |
| Gross Investment Activity |
| | | | | | | | | | |
| First Quarter 2024 |
| Properties | | Beds / Units / Square Feet | | Investment Per
Bed / Unit /
SqFt | | Pro Rata
Amount | | Yield |
Acquisitions and Loan Funding(1) | | | | | | | | | | |
| Seniors Housing Operating | 3 | | 363 | | units | | $ | 168,138 | | | $ | 61,034 | | | |
| | | | | | | | | | |
| | | | | | | | | | |
| | | | | | | | | | |
| Loan funding | | | | | | | | 146,900 | | | |
Total acquisitions and loan funding(2) | 3 | | | | | | | 207,934 | | | 6.8 | % |
| | | | | | | | | | |
Development Funding(3) | | | | | | | | | | |
| Development projects: | | | | | | | | | | |
| Seniors Housing Operating | 37 | | 6,298 | units | | | | 162,798 | | | |
| | | | | | | | | | |
| Outpatient Medical | 14 | | 1,154,635 | sf | | | | 73,130 | | | |
| | | | | | | | | | |
| Total development projects | 51 | | | | | | | 235,928 | | | |
| Redevelopment and expansion projects: | | | | | | | | | | |
| Seniors Housing Operating | 3 | | 293 | units | | | | 2,371 | | | |
| | | | | | | | | | |
| Outpatient Medical | 2 | | 24,097 | sf | | | | 2,996 | | | |
| Total redevelopment and expansion projects | 5 | | | | | | | 5,367 | | | |
| | | | | | | | | | |
| Total development funding | 56 | | | | | | | 241,295 | | | 7.1 | % |
| | | | | | | | | | |
| Total gross investments | | | | | | | | 449,229 | | | 6.9 | % |
| | | | | | | | | | |
Dispositions and Loan Repayments(4) | | | | | | | | | | |
| Seniors Housing Operating | 10 | | 907 | units | | 281,147 | | | 70,522 | | | |
| | | | | | | | | | |
| | | | | | | | | | |
| | | | | | | | | | |
| Loan repayments | | | | | | | | 36,472 | | | |
| | | | | | | | | | |
Total dispositions and loan repayments(5) | 10 | | | | | | | 106,994 | | | 5.0 | % |
| | | | | | | | | | |
| Net investments (dispositions) | | | | | | | | $ | 342,235 | | | |
Notes:
(1) Acquisitions represent purchase price excluding accounting adjustments pursuant to U.S. GAAP for all consolidated and unconsolidated property acquisitions and pro rata amounts include joint venture real estate loans receivable. Loan advances represent cash funded for real estate and non-real estate loans receivable, excluding development loans.
(2) Acquisition yields represents annualized contractual or projected cash rent/NOI to be generated divided by investment amount, excluding land parcels. Loan funding yield represents annualized contractual interest divided by investment amount.
(3) Amounts represent cash funded for all developments/expansions including construction in progress, loans and in-substance real estate. Yield represents projected annualized cash rent/NOI to be generated upon conversion/stabilization divided by commitment amount.
(4) Amounts represent proceeds received for loan repayments and consolidated and unconsolidated property sales.
(5) Yield represents annualized cash rent/interest/NOI that was being generated pre-disposition divided by proceeds. Pro rata amounts include joint venture real estate loans receivable.
| | | | | | | | | | | | | | | | | | | | | | | | | | | | | | | | | | | | | | | | | | |
| (dollars in thousands at Welltower pro rata ownership) |
Development Summary(1) | | | | |
| | | Unit Mix | | | | | | |
| Facility MSA | | Total | Wellness Housing | Independent Living | Assisted Living | Memory Care | | | Commitment Amount | | Future Funding | | Estimated Conversion(2) |
| | | | | | | | | | | | | | |
| Seniors Housing Operating | | | | | | | | | | | |
| Phoenix, AZ | | 204 | | 204 | | — | | — | | — | | | | $ | 51,179 | | | $ | 2,870 | | | 4Q23 - 2Q24 |
| San Diego, CA | | 96 | | — | | — | | 56 | | 40 | | | | 42,340 | | | 656 | | | 2Q24 |
| Houston, TX | | 130 | | 130 | | — | | — | | — | | | | 34,216 | | | 603 | | | 3Q23 - 2Q24 |
| Hartford, CT | | 128 | | 128 | | — | | — | | — | | | | 22,058 | | | — | | | 2Q24 |
| Hartford, CT | | 122 | | 122 | | — | | — | | — | | | | 20,650 | | | — | | | 2Q24 |
| Cincinnati, OH | | 122 | | 122 | | — | | — | | — | | | | 15,602 | | | 1,474 | | | 2Q24 |
| Washington D.C. | | 302 | | — | | 190 | | 89 | | 23 | | | | 157,660 | | | 17,116 | | | 3Q24 |
| Vancouver, BC | | 85 | | — | | — | | 45 | | 40 | | | | 58,597 | | | 2,635 | | | 3Q24 |
| Dallas, TX | | 55 | | 55 | | — | | — | | — | | | | 17,280 | | | 1,538 | | | 1Q24 - 3Q24 |
| Norwich, UK | | 80 | | — | | — | | 52 | | 28 | | | | 9,669 | | | 2,903 | | | 3Q24 |
| Boston, MA | | 160 | | — | | 82 | | 37 | | 41 | | | | 149,274 | | | 23,904 | | | 4Q24 |
| Kansas City, MO | | 265 | | 265 | | — | | — | | — | | | | 70,864 | | | 29,820 | | | 4Q24 |
| Miami, FL | | 91 | | — | | — | | 55 | | 36 | | | | 69,951 | | | 24,185 | | | 4Q24 |
| Phoenix, AZ | | 199 | | 199 | | — | | — | | — | | | | 51,794 | | | 2,312 | | | 2Q24 - 4Q24 |
| Tampa, FL | | 206 | | 206 | | — | | — | | — | | | | 49,646 | | | 13,139 | | | 2Q24 - 4Q24 |
| Sacramento, CA | | 100 | | — | | — | | 70 | | 30 | | | | 43,815 | | | 15,869 | | | 4Q24 |
| Kansas City, MO | | 134 | | 134 | | — | | — | | — | | | | 20,980 | | | — | | | 4Q24 |
| Little Rock, AR | | 283 | | 283 | | — | | — | | — | | | | 13,456 | | | 3,430 | | | 3Q24 - 4Q24 |
| Cambridge, UK | | 70 | | — | | — | | 45 | | 25 | | | | 10,284 | | | 4,999 | | | 4Q24 |
| San Jose, CA | | 685 | | 509 | | — | | 143 | | 33 | | | | 175,381 | | | 4,242 | | | 1Q25 |
| Washington D.C. | | 137 | | — | | 53 | | 47 | | 37 | | | | 120,793 | | | 33,549 | | | 1Q25 |
| Chattanooga, TN | | 243 | | 243 | | — | | — | | — | | | | 62,116 | | | 46,838 | | | 3Q24 - 1Q25 |
| San Jose, CA | | 158 | | — | | — | | 158 | | — | | | | 61,929 | | | 29,042 | | | 1Q25 |
| Phoenix, AZ | | 110 | | 110 | | — | | — | | — | | | | 40,195 | | | 18,520 | | | 3Q24 - 1Q25 |
| Columbus, OH | | 409 | | 409 | | — | | — | | — | | | | 82,069 | | | 36,815 | | | 2Q25 |
| Sherman, TX | | 237 | | 237 | | — | | — | | — | | | | 75,618 | | | 43,779 | | | 3Q24 - 2Q25 |
| Naples, FL | | 188 | | 188 | | — | | — | | — | | | | 52,568 | | | 19,356 | | | 4Q24 - 2Q25 |
| London, UK | | 62 | | — | | — | | 40 | | 22 | | | | 8,903 | | | 5,339 | | | 3Q25 |
| Dallas, TX | | 141 | | 141 | | — | | — | | — | | | | 47,261 | | | 36,580 | | | 4Q24 - 4Q25 |
| Brighton and Hove, UK | | 70 | | — | | — | | 45 | | 25 | | | | 11,023 | | | 7,101 | | | 4Q25 |
| Birmingham, UK | | 77 | | — | | — | | 18 | | 59 | | | | 18,375 | | | 14,765 | | | 1Q26 |
| Killeen, TX | | 256 | | 256 | | — | | — | | — | | | | 68,505 | | | 44,591 | | | 4Q23 - 3Q26 |
| Tallahassee, FL | | 206 | | 206 | | — | | — | | — | | | | 48,469 | | | 44,089 | | | 4Q25 - 3Q26 |
| Various(3) | | 272 | | 76 | | 196 | | — | | — | | | | 28,569 | | | 11,016 | | | 1Q24 - 4Q24 |
| | | | | | | | | | | | | | |
| | | | | | | | | | | | | | |
| | | | | | | | | | | | | | |
| | | | | | | | | | | | | | |
| | | | | | | | | | | | | | |
| Subtotal | | 6,083 | | 4,223 | | 521 | | 900 | | 439 | | | | 1,811,089 | | | 543,075 | | | |
| | | | | | | | | | | | | | |
| | | | | | | | | | | |
| | | | | | | | | | | | | | |
| | | | | | | | | | | | | | |
| | | | | | | | | | | | | | |
| Outpatient Medical | | Rentable Square Ft | Preleased % | Health System Affiliation | | | Commitment Amount | | Future Funding | | Estimated Conversion |
| Houston, TX | | | | 156,462 | | 100 | % | Yes | | | 113,125 | | 32,982 | | | 1Q24 - 2Q24 |
| Oklahoma City, OK | | | | 134,285 | | 100 | % | Yes | | | 88,912 | | 7,774 | | | 2Q24 |
| Santa Fe, NM | | | | 90,000 | | 100 | % | Yes | | | 45,977 | | 18,027 | | | 3Q24 |
| Houston, TX | | | | 51,134 | | 100 | % | Yes | | | 28,723 | | | 14,616 | | | 3Q24 |
| Houston, TX | | | | 135,255 | | 100 | % | Yes | | | 86,559 | | | 49,790 | | | 4Q24 |
| Houston, TX | | | | 111,803 | | 100 | % | Yes | | | 78,282 | | | 48,942 | | | 4Q24 |
| Houston, TX | | | | 36,248 | | 100 | % | Yes | | | 32,991 | | | 17,698 | | | 4Q24 |
| Houston, TX | | | | 50,323 | | 100 | % | Yes | | | 30,156 | | | 18,480 | | | 4Q24 |
| Dallas, TX | | | | 12,000 | | 100 | % | Yes | | | 6,330 | | | 4,279 | | | 4Q24 |
| Houston, TX | | | | 116,000 | | 100 | % | Yes | | | 76,800 | | | 65,719 | | | 1Q25 |
| Durango, CO | | | | 33,290 | | 100 | % | Yes | | | 24,112 | | | 19,556 | | | 3Q24 - 1Q25 |
| Oklahoma City, OK | | | | 47,636 | | 100 | % | Yes | | | 40,543 | | | 29,976 | | | 2Q25 |
| Dallas, TX | | | | 141,269 | | 59 | % | Yes | | | 57,896 | | | 54,724 | | | 3Q25 |
| Subtotal | | | | 1,115,705 | | | | | | 710,406 | | | 382,563 | | | |
| | | | | | | | | | | | | | |
| Total Development Projects | | | | | $ | 2,521,495 | | | $ | 925,638 | | | |
| | | | | | | | | | | | | | |
| | | | | | | | | | |
| | | | | | | | | |
| | | | | | | | | | | | | | |
| | | | | | | | | | | | | | |
(1) Includes development and redevelopment projects (construction in progress, development loans and in-substance real estate) but excludes expansion projects. Commitment amount represents current cash amount funded plus unfunded commitments to complete development, but excludes capitalized interest.
(2) Estimated conversion ranges relate to projects to be delivered in phases.
(3) Includes two redevelopment projects.
| | | | | | | | | | | | | | | | | | | | | | | | | | | | | | | | | | | | | | | | | |
| (dollars in thousands at Welltower pro rata ownership) | | |
Development Funding Projections(1) | | | | | | | | |
| | | | | | | Projected Future Funding | | |
| Projects | | Beds / Units / Square Feet | | Stable Yields(2) | | 2024 Funding | | Funding Thereafter | | Total Unfunded Commitments | | Committed Balances |
| Seniors Housing Operating | 35 | | 6,083 | | 7.3 | % | | $ | 351,697 | | | $ | 191,378 | | | $ | 543,075 | | | $ | 1,811,089 | |
| | | | | | | | | | | | | |
| Outpatient Medical | 13 | | 1,115,705 | | 6.3 | % | | 308,716 | | | 73,847 | | | 382,563 | | | 710,406 | |
| Total | 48 | | | | 7.0 | % | | $ | 660,413 | | | $ | 265,225 | | | $ | 925,638 | | | $ | 2,521,495 | |
| | | | | | | | | | | | | | | | | | | | | | | | | | | | | | | | | | | | | | | | | | | | |
Development Project Conversion Estimates(1) | | | |
| Quarterly Conversions | | Annual Conversions |
| | Amount | | Year 1 Yields(2) | | Stable Yields(2) | | | | Amount | | Year 1 Yields(2) | | Stable Yields(2) |
| 1Q24 actual | | $ | 162,557 | | | 3.7 | % | | 6.6 | % | | 2024 actual | | $ | 162,557 | | | 3.7 | % | | 6.6 | % |
| 2Q24 estimate | | 388,082 | | 2.9 | % | | 6.5 | % | | 2024 estimate | | 1,448,939 | | | 1.9 | % | | 7.1 | % |
| 3Q24 estimate | | 317,906 | | 0.6 | % | | 7.7 | % | | 2025 estimate | | 937,207 | | | 2.9 | % | | 6.8 | % |
| 4Q24 estimate | | 742,951 | | 2.0 | % | | 7.1 | % | | 2026 estimate | | 135,349 | | — | % | | 8.0 | % |
| 1Q25 estimate | | 561,326 | | 4.0 | % | | 7.0 | % | | Total | | $ | 2,684,052 | | | 2.3 | % | | 7.0 | % |
| 2Q25 estimate | | 250,798 | | 1.7 | % | | 6.3 | % | | | | | | | | |
| 3Q25 estimate | | 66,799 | | 0.7 | % | | 6.9 | % | | | | | | | | |
| 4Q25 estimate | | 58,284 | | (0.3) | % | | 7.2 | % | | | | | | | | |
| 1Q26 estimate | | 18,375 | | (3.4) | % | | 10.9 | % | | | | | | | | |
| | | | | | | | | | | | | | |
| 3Q26 estimate | | 116,974 | | 0.5 | % | | 7.5 | % | | | | | | | | |
| | | | | | | | | | | | | | |
| | | | | | | | | | | | | | |
| | | | | | | | | | | | | | |
| Total | | $ | 2,684,052 | | | 2.3 | % | | 7.0 | % | | | | | | | | |
| | | | | | | | | | | | | | |
| | | | | | | | | | | | | | | | | | | | | | | | | | | | | | | | | | | | | | |
| Unstabilized Properties | | |
| | 12/31/2023 Properties | | Stabilizations | | Construction Conversions(3) | | Acquisitions/ Dispositions | | 03/31/2024 Properties | | Beds / Units |
| Seniors Housing Operating | | 44 | | (2) | | | 1 | | — | | | 43 | | 6,194 |
| Seniors Housing Triple-net | | 10 | | (3) | | | — | | — | | | 7 | | 934 |
| | | | | | | | | | | | |
| Total | | 54 | | (5) | | | 1 | | — | | | 50 | | 7,128 |
| | | | | | | | | | | | | | | | | | | | | | | | | | | | | | | | | | | | | | |
| Occupancy | | 12/31/2023 Properties | | Stabilizations | | Construction Conversions(3) | | Acquisitions/ Dispositions | | Progressions | | 03/31/2024 Properties |
| 0% - 50% | | 21 | | | — | | | — | | | — | | | (5) | | | 16 | |
| 50% - 70% | | 21 | | | (1) | | | 1 | | | — | | | (1) | | | 20 | |
| 70% + | | 12 | | | (4) | | | — | | | — | | | 6 | | | 14 | |
| Total | | 54 | | | (5) | | | 1 | | | — | | | — | | | 50 | |
| | | | | | | | | | | | |
| Occupancy | | 03/31/2024 Properties | | Months In Operation | | Revenues | | % of Total Revenues(4) | | Gross Investment Balance | | % of Total Gross Investment |
| 0% - 50% | | 16 | | | 11 | | | $ | 88,874 | | | 1.2 | % | | $ | 866,877 | | | 1.8 | % |
| 50% - 70% | | 20 | | | 24 | | | 172,291 | | | 2.3 | % | | 938,069 | | | 2.0 | % |
| 70% + | | 14 | | | 29 | | | 165,498 | | | 2.2 | % | | 559,736 | | | 1.2 | % |
| Total | | 50 | | | 21 | | | $ | 426,663 | | | 5.7 | % | | $ | 2,364,682 | | | 5.0 | % |
| | | | | | | | | | | | |
Notes:
(1) Includes development and redevelopment projects (construction in progress, development loans and in substance real estate) and excludes expansion projects. Projects expected to be delivered in phases over multiple quarters are reflected in the last quarter.
(2) Actual yields may vary.
(3) Includes expansion and development loan conversions.
(4) Percent of total revenues based on current quarter annualized pro rata total revenues on page 11.
| | | | | | | | | | | | | | | | | | | | |
| (dollars in thousands at Welltower pro rata ownership) | | | | |
| Components of NAV | | | | |
| | | | | | |
| Stabilized NOI | | | | Pro rata beds/units/square feet |
Seniors Housing Operating(1) | | $ | 1,344,032 | | | 98,071 | | units | |
| Seniors Housing Triple-net | | 407,064 | | | 26,144 | | units | |
| Outpatient Medical | | 526,384 | | | 20,935,057 | | square feet | |
| Long-Term/Post-Acute Care | | 332,320 | | | 31,554 | | beds | |
Total In-Place NOI(2) | | 2,609,800 | | | | | |
Incremental stabilized NOI(3) | | 116,098 | | | | | |
| Total stabilized NOI | | $ | 2,725,898 | | | | | |
| | | | | | |
| Obligations | | | | | | |
Lines of credit and commercial paper(4) | | $ | — | | | | | |
Senior unsecured notes(4) | | 12,328,089 | | | | | |
Secured debt(4) | | 2,905,614 | | | | | |
| Financing lease liabilities | | 80,541 | | | | | |
| Total debt | | $ | 15,314,244 | | | | | |
| Add (Subtract): | | | | | | |
Other liabilities (assets), net(5) | | $ | 424,081 | | | | | |
| Cash and cash equivalents and restricted cash | | (2,478,335) | | | | | |
| Net obligations | | $ | 13,259,990 | | | | | |
| | | | | | |
| Other Assets | | | | | | |
Land parcels(6) | | $ | 427,215 | | | Effective Interest Rate(9) |
Real estate loans receivable(7) | | 2,147,555 | | | 11.0% | | |
Non-real estate loans receivable(8) | | 290,619 | | | 10.7% | | |
Joint venture real estate loans receivables(10) | | 269,190 | | | 5.8% | | |
| | | | | | |
Property dispositions(11) | | 1,043,796 | | | | | |
Development properties:(12) | | | | | | |
| Current balance | | 1,606,448 | | | | | |
| Unfunded commitments | | 933,157 | | | | | |
| Committed balances | | $ | 2,539,605 | | | | | |
| Projected yield | | 7.0 | % | | | | |
| Projected NOI | | $ | 177,772 | | | | | |
| | | | | | |
Common Shares Outstanding(13) | | 593,424 | | | | | |
| | | | | | |
| | | | | | |
Notes:
(1) Includes $3,272,000 attributable to our proportional share of income (loss) from unconsolidated management company investments.
(2) See page 17 for reconciliation. (3) Represents incremental NOI from Seniors Housing Operating unstabilized properties.
(4) Represents principal amounts due and do not include unamortized premiums/discounts, deferred loan expenses or other fair value adjustments as reflected on the balance sheet. Includes $827,372,000 of foreign secured debt.
(5) Includes liabilities / (assets) that impact cash or NOI and excludes non real estate loans and non-cash items such as the following (in thousands):
| | | | | | | | |
| Unearned revenues | | $ | 369,726 | |
| Below market tenant lease intangibles, net | | 21,202 | |
| Deferred taxes, net | | (29,848) | |
| Intangible assets, net | | (153,211) | |
| Other non-cash liabilities / (assets), net | | 6,015 | |
| Total non-cash liabilities/(assets), net | | $ | 213,884 | |
| | |
(6) Includes land parcels, predevelopment projects and redevelopment projects.
(7) Represents $2,169,850,000 of real estate loans, excluding development loans and including certain in substance real estate developments and held to maturity debt securities, and net of $22,295,000 of credit allowances.
(8) Represents $461,945,000 of non-real estate loans, net of $171,326,000 of credit allowances.
(9) Average cash-pay interest rates are 7.6%, 1.0% and 5.8% for real estate, non-real estate loans and joint venture real estate loans, respectively. Rates exclude non-accrual/interest-free loans.
(10) Represents our partners' share of Welltower loans made to select joint ventures secured by the joint venture owned properties.
(11) Represents proceeds from expected property dispositions in the next twelve months.
(12) See pages 8-9. Includes expansion projects. Includes partial conversions to date. (13) Includes OP Units and DownREIT Units.
| | | | | | | | | | | | | | | | | | | | | | | | | | | | | | | | |
| (dollars in thousands at Welltower pro rata ownership) |
Net Operating Income(1) | | | | | | | | | | |
| | 1Q23 | | 2Q23 | | 3Q23 | | 4Q23 | | 1Q24 |
| Revenues: | | | | | | | | | | |
| Seniors Housing Operating | | | | | | | | | | |
| Resident fees and services | | $ | 1,138,916 | | | $ | 1,173,630 | | | $ | 1,216,368 | | | $ | 1,280,154 | | | $ | 1,379,295 | |
| | | | | | | | | | |
| Interest income | | 2,318 | | | 1,850 | | | 1,928 | | | 2,968 | | | 4,716 | |
| Other income | | 2,510 | | | 3,495 | | | 3,457 | | | 4,544 | | | 2,807 | |
| Total revenues | | 1,143,744 | | | 1,178,975 | | | 1,221,753 | | | 1,287,666 | | | 1,386,818 | |
| | | | | | | | | | |
| Seniors Housing Triple-net | | | | | | | | | | |
| | | | | | | | | | |
| Rental income | | 119,786 | | | 118,115 | | | 110,705 | | | 115,615 | | | 110,967 | |
| Interest income | | 31,540 | | | 32,657 | | | 33,523 | | | 36,150 | | | 35,478 | |
| Other income | | 1,675 | | | 1,202 | | | 1,168 | | | 924 | | | 955 | |
| Total revenues | | 153,001 | | | 151,974 | | | 145,396 | | | 152,689 | | | 147,400 | |
| | | | | | | | | | |
| Outpatient Medical | | | | | | | | | | |
| Rental income | | 182,044 | | | 185,133 | | | 192,732 | | | 190,211 | | | 200,593 | |
| Interest income | | 91 | | | 95 | | | 98 | | | 382 | | | 852 | |
| Other income | | 3,055 | | | 1,574 | | | 2,306 | | | 2,229 | | | 2,404 | |
| Total revenues | | 185,190 | | | 186,802 | | | 195,136 | | | 192,822 | | | 203,849 | |
| | | | | | | | | | |
| Long-Term/Post-Acute Care | | | | | | | | | | |
| Rental income | | 80,423 | | | 75,766 | | | 77,516 | | | 96,146 | | | 104,046 | |
| Interest income | | 6,367 | | | 8,264 | | | 10,981 | | | 15,784 | | | 15,823 | |
| Other income | | 193 | | | 65,490 | | | 315 | | | 6 | | | 244 | |
| Total revenues | | 86,983 | | | 149,520 | | | 88,812 | | | 111,936 | | | 120,113 | |
| | | | | | | | | | |
| Corporate | | | | | | | | | | |
| Other income | | 5,147 | | | 16,807 | | | 33,802 | | | 30,021 | | | 28,729 | |
| Total revenues | | 5,147 | | | 16,807 | | | 33,802 | | | 30,021 | | | 28,729 | |
| | | | | | | | | | |
| Total | | | | | | | | | | |
| Rental income | | 382,253 | | | 379,014 | | | 380,953 | | | 401,972 | | | 415,606 | |
| Resident fees and services | | 1,138,916 | | | 1,173,630 | | | 1,216,368 | | | 1,280,154 | | | 1,379,295 | |
| Interest Income | | 40,316 | | | 42,866 | | | 46,530 | | | 55,284 | | | 56,869 | |
| Other Income | | 12,580 | | | 88,568 | | | 41,048 | | | 37,724 | | | 35,139 | |
| Total revenues | | 1,574,065 | | | 1,684,078 | | | 1,684,899 | | | 1,775,134 | | | 1,886,909 | |
| | | | | | | | | | |
| Property operating expenses: | | | | | | | | | | |
| Seniors Housing Operating | | 894,981 | | | 902,068 | | | 933,463 | | | 982,077 | | | 1,034,982 | |
| Seniors Housing Triple-net | | 7,917 | | | 7,996 | | | 7,849 | | | 6,662 | | | 7,559 | |
| Outpatient Medical | | 58,977 | | | 59,358 | | | 63,831 | | | 55,060 | | | 65,162 | |
| Long-Term/Post-Acute Care | | 4,040 | | | 2,827 | | | 2,386 | | | 3,298 | | | 3,448 | |
| Corporate | | 3,877 | | | 4,135 | | | 3,980 | | | 5,957 | | | 3,636 | |
| Total property operating expenses | | 969,792 | | | 976,384 | | | 1,011,509 | | | 1,053,054 | | | 1,114,787 | |
| | | | | | | | | | |
| Net operating income: | | | | | | | | | | |
| Seniors Housing Operating | | 248,763 | | | 276,907 | | | 288,290 | | | 305,589 | | | 351,836 | |
| Seniors Housing Triple-net | | 145,084 | | | 143,978 | | | 137,547 | | | 146,027 | | | 139,841 | |
| Outpatient Medical | | 126,213 | | | 127,444 | | | 131,305 | | | 137,762 | | | 138,687 | |
| Long-Term/Post-Acute Care | | 82,943 | | | 146,693 | | | 86,426 | | | 108,638 | | | 116,665 | |
| Corporate | | 1,270 | | | 12,672 | | | 29,822 | | | 24,064 | | | 25,093 | |
| Net operating income | | $ | 604,273 | | | $ | 707,694 | | | $ | 673,390 | | | $ | 722,080 | | | $ | 772,122 | |
|
| | | | | | | | | | |
Note:
(1) Please see discussion of Supplemental Reporting Measures on page 16. Includes amounts from investments sold or held for sale. NOI related to DownREITs included at 100%.
| | | | | | | | | | | | | | |
| (dollars in thousands) |
Leverage and EBITDA Reconciliations(1) | | |
| | Twelve Months Ended | | Three Months Ended |
| | March 31, 2024 | | March 31, 2024 |
| Net income (loss) | | $ | 461,138 | | | $ | 131,634 | |
| Interest expense | | 610,761 | | | 147,318 | |
| Income tax expense (benefit) | | 9,510 | | | 6,191 | |
| Depreciation and amortization | | 1,427,852 | | | 365,863 | |
| EBITDA | | 2,509,261 | | | 651,006 | |
| Loss (income) from unconsolidated entities | | 54,154 | | | 7,783 | |
| Stock-based compensation | | 38,829 | | | 11,342 | |
| Loss (gain) on extinguishment of debt, net | | 8 | | | 6 | |
| Loss (gain) on real estate dispositions, net | | (71,858) | | | (4,707) | |
| Impairment of assets | | 66,799 | | | 43,331 | |
| Provision for loan losses, net | | 10,046 | | | 1,014 | |
| Loss (gain) on derivatives and financial instruments, net | | (6,104) | | | (3,054) | |
| Other expenses | | 99,727 | | | 14,131 | |
Leasehold interest termination(2) | | (65,485) | | | — | |
| Casualty losses, net of recoveries | | 7,778 | | | 2,158 | |
Other impairment(3) | | 25,998 | | | 9,356 | |
| Total adjustments | | 159,892 | | | 81,360 | |
| Adjusted EBITDA | | $ | 2,669,153 | | | $ | 732,366 | |
| | | | |
| Interest Coverage Ratios | | | | |
| Interest expense | | $ | 610,761 | | | $ | 147,318 | |
| Capitalized interest | | 54,173 | | | 13,809 | |
| Non-cash interest expense | | (27,695) | | | (9,284) | |
| Total interest | | $ | 637,239 | | | $ | 151,843 | |
| EBITDA | | $ | 2,509,261 | | | $ | 651,006 | |
| Interest coverage ratio | | 3.94 | x | | 4.29 | x |
| Adjusted EBITDA | | $ | 2,669,153 | | | $ | 732,366 | |
| Adjusted Interest coverage ratio | | 4.19 | x | | 4.82 | x |
| | | | |
| Fixed Charge Coverage Ratios | | | | |
| Total interest | | $ | 637,239 | | | $ | 151,843 | |
| Secured debt principal amortization | | 51,021 | | | 11,887 | |
| Total fixed charges | | $ | 688,260 | | | $ | 163,730 | |
| EBITDA | | $ | 2,509,261 | | | $ | 651,006 | |
| Fixed charge coverage ratio | | 3.65 | x | | 3.98 | x |
| Adjusted EBITDA | | $ | 2,669,153 | | | $ | 732,366 | |
| Adjusted Fixed charge coverage ratio | | 3.88 | x | | 4.47 | x |
|
| Net Debt to EBITDA Ratios |
Total debt(4) | | | | $ | 14,285,686 | |
| Less: cash and cash equivalents and restricted cash | | | | (2,478,335) | |
| Net debt | | | | $ | 11,807,351 | |
| EBITDA Annualized | | | | $ | 2,604,024 | |
| Net debt to EBITDA ratio | | | | 4.53 | x |
| Adjusted EBITDA Annualized | | | | $ | 2,929,464 | |
| Net debt to Adjusted EBITDA ratio | | | | 4.03 | x |
|
Notes:
(1) Please see discussion of Supplemental Reporting Measures on page 16. (2) Primarily related to the gain associated with the loss of control and derecognition of leasehold interests in 7 properties.
(3) Represents the write off of straight-line rent receivable balances relating to leases placed on cash recognition.
(4) Includes unamortized premiums/discounts, other fair value adjustments and financing lease liabilities of $80,541,000. Excludes operating lease liabilities of $300,779,000 related to ASC 842 adoption.
| | | | | | | | | | | | | | | | | |
| (in thousands except share price) |
Leverage and Current Capitalization(1) |
| | | | % of Total |
| Book capitalization | | | | | |
Lines of credit and commercial paper(2) | | | $ | — | | | — | % |
Long-term debt obligations(2)(3) | | | 14,285,686 | | | 35.40 | % |
| Cash and cash equivalents and restricted cash | | | (2,478,335) | | | (6.14) | % |
| Net debt to consolidated book capitalization | | | $ | 11,807,351 | | | 29.26 | % |
Total equity(4) | | | 28,547,908 | | | 70.74 | % |
| Consolidated book capitalization | | | $ | 40,355,259 | | | 100.00 | % |
Joint venture debt, net(5) | | | 834,838 | | | |
| Total book capitalization | | | $ | 41,190,097 | | | |
| | | | | |
| Undepreciated book capitalization | | | | | |
Lines of credit and commercial paper(2) | | | $ | — | | | — | % |
Long-term debt obligations(2)(3) | | | 14,285,686 | | | 28.64 | % |
| Cash and cash equivalents and restricted cash | | | (2,478,335) | | | (4.97) | % |
| Net debt to consolidated undepreciated book capitalization | | | $ | 11,807,351 | | | 23.67 | % |
| Accumulated depreciation and amortization | | | 9,537,562 | | | 19.12 | % |
Total equity(4) | | | 28,547,908 | | | 57.21 | % |
| Consolidated undepreciated book capitalization | | | $ | 49,892,821 | | | 100.00 | % |
Joint venture debt, net(5) | | | 834,838 | | | |
| Total undepreciated book capitalization | | | $ | 50,727,659 | | | |
| | | | | |
| Enterprise value | | | | | |
Lines of credit and commercial paper(2) | | | $ | — | | | — | % |
Long-term debt obligations(2)(3) | | | 14,285,686 | | | 21.00 | % |
| Cash and cash equivalents and restricted cash | | | (2,478,335) | | | (3.64) | % |
| Net debt to consolidated enterprise value | | | $ | 11,807,351 | | | 17.36 | % |
| Common shares outstanding | | | 590,934 | | | |
| Period end share price | | | 93.44 | | | |
| Common equity market capitalization | | | $ | 55,216,873 | | | 81.17 | % |
Noncontrolling interests(4) | | | 999,965 | | | 1.47 | % |
| Consolidated enterprise value | | | $ | 68,024,189 | | | 100.00 | % |
Joint venture debt, net(5) | | | 834,838 | | | |
| Total enterprise value | | | $ | 68,859,027 | | | |
| | | | | |
| Secured debt as % of total assets | | | | | |
Secured debt(2) | | | $ | 2,033,232 | | | 3.76 | % |
Gross asset value(6) | | | $ | 54,091,147 | | | |
| | | | | |
| Total debt as % of gross asset value | | | | | |
Total debt(2)(3) | | | $ | 14,285,686 | | | 26.41 | % |
Gross asset value(6) | | | $ | 54,091,147 | | | |
| | | | | |
| Unsecured debt as % of unencumbered assets | | | | | |
Unsecured debt(2) | | | $ | 12,171,913 | | | 25.07 | % |
| | | | | |
| | | | | |
| | | | | |
Unencumbered gross assets(7) | | | $ | 48,557,528 | | | |
| | | | | |
Notes:
(1) Please see discussion of Supplemental Reporting Measures on page 16. (2) Amounts include unamortized premiums/discounts and other fair value adjustments as reflected on the balance sheet.
(3) Includes financing lease liabilities of $80,541,000 and excludes operating lease liabilities of $300,779,000 related to ASC 842 adoption.
(4) Includes all noncontrolling interests (redeemable and permanent) as reflected on our balance sheet.
(5) Net of Welltower's share of unconsolidated debt and minority partners' share of Welltower consolidated debt.
(6) Gross asset value equals total assets plus accumulated depreciation as reflected on the balance sheet.
(7) Unencumbered gross assets equals gross asset value for consolidated properties that are not financed with secured debt.
| | | | | | | | | | | | | | | | | | | | | | | | | | | | | | | | | | | | | | | | | | | | | | | | | | | | | |
| (dollars in thousands) | | | | | | | | | | |
Debt Maturities and Scheduled Principal Amortization(1) |
| Year | | Lines of Credit and Commercial Paper(2) | | Senior Unsecured Notes(3,4,5,6,7) | | Consolidated Secured Debt | | Share of Unconsolidated Secured Debt | | Noncontrolling Interests' Share of Consolidated Secured Debt | | Combined Debt(8) | | % of Total | | Wtd. Avg. Interest Rate (9) |
| 2024 | | $ | — | | | $ | — | | | $ | 307,236 | | | $ | 143,300 | | | $ | (50,027) | | | $ | 400,509 | | | 2.63 | % | | 4.75 | % |
| 2025 | | — | | | 1,260,000 | | | 379,484 | | | 507,757 | | | (32,087) | | | 2,115,154 | | | 13.88 | % | | 4.03 | % |
| 2026 | | — | | | 700,000 | | | 152,652 | | | 48,961 | | | (20,132) | | | 881,481 | | | 5.79 | % | | 4.03 | % |
| 2027 | | — | | | 1,906,204 | | | 206,191 | | | 118,661 | | | (33,157) | | | 2,197,899 | | | 14.43 | % | | 4.66 | % |
| 2028 | | — | | | 2,480,035 | | | 105,956 | | | 26,112 | | | (15,013) | | | 2,597,090 | | | 17.05 | % | | 3.79 | % |
| 2029 | | — | | | 1,050,000 | | | 318,012 | | | 36,367 | | | (1,150) | | | 1,403,229 | | | 9.21 | % | | 3.81 | % |
| 2030 | | — | | | 750,000 | | | 57,066 | | | 34,356 | | | (124) | | | 841,298 | | | 5.52 | % | | 3.13 | % |
| 2031 | | — | | | 1,350,000 | | | 6,978 | | | 33,415 | | | (130) | | | 1,390,263 | | | 9.13 | % | | 2.77 | % |
| 2032 | | — | | | 1,050,000 | | | 47,952 | | | 3,929 | | | (135) | | | 1,101,746 | | | 7.23 | % | | 3.38 | % |
| 2033 | | — | | | — | | | 395,502 | | | 7,229 | | | (35,360) | | | 367,371 | | | 2.41 | % | | 4.88 | % |
| Thereafter | | — | | | 1,781,850 | | | 93,747 | | | 66,997 | | | (4,931) | | | 1,937,663 | | | 12.74 | % | | 5.04 | % |
| Totals | | $ | — | | | $ | 12,328,089 | | | $ | 2,070,776 | | | $ | 1,027,084 | | | $ | (192,246) | | | $ | 15,233,703 | | | 100.00 | % | | |
| | | | | | | | | | | | | | | | | |
Weighted Avg. Interest Rate(9) | | — | | | 3.94 | % | | 4.62 | % | | 3.66 | % | | 3.91 | % | | 4.02 | % | | | | |
| | | | | | | | | | | | | | | | | |
| Weighted Avg. Maturity Years | | — | | | 6.3 | | 4.8 | | 4.4 | | 3.7 | | 6.0 | | | | |
| | | | | | | | | | | | | | | | | |
% Floating Rate Debt(8) | | 100.00 | % | | 5.63 | % | | 23.15 | % | | 0.88 | % | | 16.13 | % | | 7.56 | % | | | | |
| | | | | | | | | | | | | | | | | | | | | | | | | | | | | | | | | | | | | | | | | | | | | | | |
Debt by Local Currency(1) |
| | | Lines of Credit and Commercial Paper(2) | | Senior Unsecured Notes(3,4,5,6,7) | | Consolidated Secured Debt | | Share of Unconsolidated Secured Debt | | Noncontrolling Interests' Share of Consolidated Secured Debt | | Combined Debt(8) | | Investment Hedges(10) |
| United States | | $ | — | | | $ | 10,595,000 | | | $ | 1,354,921 | | | $ | 764,284 | | | $ | (40,963) | | | $ | 12,673,242 | | | $ | — | |
| United Kingdom | | — | | | 1,326,885 | | | — | | | — | | | — | | | 1,326,885 | | | 2,098,637 | |
| Canada | | — | | | 406,204 | | | 715,855 | | | 262,800 | | | (151,283) | | | 1,233,576 | | | 1,920,236 | |
| Totals | | $ | — | | | $ | 12,328,089 | | | $ | 2,070,776 | | | $ | 1,027,084 | | | $ | (192,246) | | | $ | 15,233,703 | | | $ | 4,018,873 | |
| | | | | | | | | | | | | | | |
Notes:
(1) Represents principal amounts due excluding unamortized premiums/discounts or other fair value adjustments as reflected on the balance sheet.
(2) Our unsecured commercial paper program and our unsecured revolving credit facility had a zero balance as of March 31, 2024. The unsecured revolving credit facility is comprised of a $1,000,000,000 tranche that matures on June 4, 2026 and a $3,000,000,000 tranche that matures on June 4, 2025. Both tranches may be extended for two successive terms of six months at our option. Commercial paper borrowings are backstopped by the unsecured revolving credit facility.
(3) 2027 includes a $1,000,000,000 unsecured term loan and a CAD $250,000,000 unsecured term loan (approximately $184,638,000 USD at March 31, 2024). The loans mature on July 19, 2026. The interest rates on the loans are adjusted SOFR + 0.85% for USD and CDOR + 0.85% for CAD. Both term loans may be extended for two successive terms of six months at our option.
(4) 2027 includes CAD $300,000,000 of 2.95% senior unsecured notes (approximately $221,566,000 USD at March 31, 2024) that matures on January 15, 2027.
(5) 2028 includes $1,035,000,000 of 2.75% exchangeable senior unsecured notes that mature on May 15, 2028 unless earlier exchanged, purchased or redeemed.
(6) 2028 includes £550,000,000 of 4.80% senior unsecured notes (approximately $695,035,000 USD at March 31, 2024). The notes mature on November 20, 2028.
(7) Thereafter includes £500,000,000 of 4.50% senior unsecured notes (approximately $631,850,000 USD at March 31, 2024). The notes mature on December 1, 2034.
(8) Excludes operating lease liabilities of $300,779,000 and finance lease liabilities of $80,541,000 related to ASC 842.
(9) Based on variable interest rates and foreign currency exchange rates in effect as of March 31, 2024. The interest rate on the unsecured revolving credit facility is adjusted SOFR + 0.775%. Commercial paper, senior notes and secured debt average interest rate represents the face value note rate. Includes the impact of notional swaps and caps to convert fixed rate debt to SOFR-based floating rate debt, and SOFR-based floating rate debt and CDOR-based floating rate debt to fixed rate debt.
(10) Represents notional value of foreign currency derivative contracts at end of period spot FX rates. The fair market value of the gains (losses) of these contracts is currently USD $33,743,000, as represented in other assets (liabilities) on the balance sheet. We supplement our local currency debt with foreign currency derivative contracts to offset the translation and economic exposures related to our international investments. Currently, our foreign currency derivatives are comprised of cross-currency swaps.
Age: Current year, less the year built, adjusted for major renovations. Average age is weighted by pro rata NOI.
Cap-ex, Tenant Improvements, Leasing Commissions: Represents amounts incurred for: 1) recurring and non-recurring capital expenditures required to maintain and re-tenant our properties; 2) second generation tenant improvements; and 3) leasing commissions paid to third party leasing agents to secure new tenants.
Construction Conversion: Represents completed construction projects that were placed into service and began generating NOI.
EBITDAR: Earnings before interest, taxes, depreciation, amortization and rent. The company uses unaudited, periodic financial information provided solely by tenants/borrowers to calculate EBITDAR and has not independently verified the information.
EBITDAR Coverage: Represents the ratio of EBITDAR to contractual rent for leases or interest and principal payments for loans. EBITDAR coverage is a measure of a property’s ability to generate sufficient cash flows for the operator/borrower to pay rent and meet other obligations. The coverage shown excludes properties that are unstabilized, closed or for which data is not available or meaningful.
EBITDARM: Earnings before interest, taxes, depreciation, amortization, rent and management fees. The company uses unaudited, periodic financial information provided solely by tenants/borrowers to calculate EBITDARM and has not independently verified the information.
EBITDARM Coverage: Represents the ratio of EBITDARM to contractual rent for leases or interest and principal payments for loans. EBITDARM coverage is a measure of a property’s ability to generate sufficient cash flows for the operator/borrower to pay rent and meet other obligations, assuming that management fees are not paid. The coverage shown excludes properties that are unstabilized, closed or for which data is not available or meaningful.
Health System - Affiliated: Outpatient medical properties are considered affiliated with a health system if one or more of the following conditions are met: 1) the land parcel is contained within the physical boundaries of a hospital campus; 2) the land parcel is located adjacent to the campus; 3) the building is physically connected to the hospital regardless of the land ownership structure; 4) a ground lease is maintained with a health system entity; 5) a master lease is maintained with a health system entity; 6) significant square footage is leased to a health system entity; 7) the property includes an ambulatory surgery center with a hospital partnership interest; or (8) a significant square footage is leased to a physician group that is either employed, directly or indirectly by a health system, or has a significant clinical and financial affiliation with the health system.
Long-Term/Post-Acute Care: Includes all skilled nursing, rehabilitation and long-term/post-acute care facilities where the majority of individuals require 24-hour nursing or medical care. Generally, these properties are licensed for Medicaid and/or Medicare reimbursement and are subject to triple-net operating leases. Most of these facilities focus on higher acuity patients and offer rehabilitation units specializing in cardiac, orthopedic, dialysis, neurological or pulmonary rehabilitation.
MSA: For the United States and Canada, we use the Metropolitan Statistical Area as defined by the U.S. Census Bureau and the Census Metropolitan Areas as defined by Statistics Canada, respectively. For the United Kingdom, we generally use the Metro Region as defined by EuroStat with Greater London defined as a 55-mile radius around the city’s center.
Occupancy: Outpatient Medical occupancy represents the percentage of total rentable square feet leased and occupied, including month-to-month leases, as of the date reported. Occupancy for all other property types represents average quarterly operating occupancy based on the most recent quarter of available data and excludes properties that are unstabilized, closed or for which data is not available or meaningful. The company uses unaudited, periodic financial information provided solely by tenants/borrowers to calculate occupancy and has not independently verified the information. Occupancy metrics are reflected at our pro rata share.
Outpatient Medical: Outpatient medical buildings include properties offering ambulatory medical services such as primary and secondary care, outpatient surgery, diagnostic procedures and rehabilitation. These properties are typically affiliated with a health system and may be located on a hospital campus. They are specifically designed and constructed for use by health care professionals to provide services to patients. They also include medical office buildings that typically contain sole and group physician practices and may provide laboratory and other specialty services.
Seniors Housing Operating (SHO): Includes independent, assisted living and dementia care properties in the U.S. and Canada and all care homes in the U.K. generally structured to take advantage of the REIT Investment Diversification and Empowerment Act of 2007, as well as Wellness Housing properties.
Seniors Housing Triple-net (SH-NNN): Includes independent, assisted living and dementia care properties in the U.S. and Canada and all care homes in the U.K. subject to triple-net operating leases and loans receivable.
Square Feet: Net rentable square feet calculated utilizing Building Owners and Managers Association measurement standards.
Stable: Generally, a triple-net rental property is considered stable (versus unstabilized or under development) when it has achieved EBITDAR coverage of 1.00x or greater for three consecutive months or, if targeted performance has not been achieved, 12 months following the budgeted stabilization date. Triple-net properties for which income is recognized on a cash basis and for which substantially all contractual rent during the period has not been collected are excluded from the stable portfolio. A Seniors Housing Operating facility is considered stable upon the earliest of 90% occupancy, NOI at or above the underwritten target or 12 months past the underwritten stabilization date. Excludes assets held for sale and assets disposed of during the current quarter.
Unstabilized: An acquisition that does not meet the stable criteria upon closing or a construction property that has opened but not yet reached stabilization.
| | | | | |
| Supplemental Reporting Measures | |
We believe that revenues and net income, as defined by U.S. generally accepted accounting principles ("U.S. GAAP"), are the most appropriate earnings measurements. However, we consider EBITDA, Adjusted EBITDA, RevPOR, ExpPOR, SS RevPOR, SS ExpPOR, NOI, In-Place NOI ("IPNOI") and Same Store NOI ("SSNOI") to be useful supplemental measures of our operating performance. Excluding EBITDA and Adjusted EBITDA, these supplemental measures are disclosed on our pro rata ownership basis. Pro rata amounts are derived by reducing consolidated amounts for minority partners’ noncontrolling ownership interests and adding our minority ownership share of unconsolidated amounts. We do not control unconsolidated investments. While we consider pro rata disclosures useful, they may not accurately depict the legal and economic implications of our joint venture arrangements and should be used with caution.
We define NOI as total revenues, including tenant reimbursements, less property operating expenses. Property operating expenses represent costs associated with managing, maintaining and servicing tenants for our properties. These expenses include, but are not limited to, property-related payroll and benefits, property management fees paid to managers, marketing, housekeeping, food service, maintenance, utilities, property taxes and insurance. General and administrative expenses represent general overhead costs that are unrelated to property operations and are unallocable to the properties. These expenses include, but are not limited to, payroll and benefits related to corporate employees, professional services, office expenses and depreciation of corporate fixed assets. IPNOI represents NOI excluding interest income, other income and non-IPNOI and adjusted for timing of current quarter portfolio changes such as acquisitions, development conversions, segment transitions, dispositions and investments held for sale. SSNOI is used to evaluate the operating performance of our properties using a consistent population which controls for changes in the composition of our portfolio. As used herein, same store is generally defined as those revenue-generating properties in the portfolio for the relevant year-over-year reporting periods. Acquisitions and development conversions are included in the same store amounts five full quarters after acquisition or being placed into service. Land parcels, loans and sub-leases, as well as any properties sold or classified as held for sale during the period, are excluded from the same store amounts. Redeveloped properties (including major refurbishments of a Seniors Housing Operating property where 20% or more of units are simultaneously taken out of commission for 30 days or more or Outpatient Medical properties undergoing a change in intended use) are excluded from the same store amounts until five full quarters post completion of the redevelopment. Properties undergoing operator transitions and/or segment transitions are also excluded from the same store amounts until five full quarters post completion of the operator transition or segment transition. In addition, properties significantly impacted by force majeure, acts of God or other extraordinary adverse events are excluded from same store amounts until five full quarters after the properties are placed back into service. SSNOI excludes non-cash NOI and includes adjustments to present consistent property ownership percentages and to translate Canadian properties and UK properties using a consistent exchange rate. Normalizers include adjustments that in management’s opinion are appropriate in considering SSNOI, a supplemental, non-GAAP performance measure. None of these adjustments, which may increase or decrease SSNOI, are reflected in our financial statements prepared in accordance with U.S. GAAP. Significant normalizers (defined as any that individually exceed 0.50% of SSNOI growth per property type) are separately disclosed and explained. We believe NOI, IPNOI and SSNOI provide investors relevant and useful information because they measure the operating performance of our properties at the property level on an unleveraged basis. We use NOI, IPNOI and SSNOI to make decisions about resource allocations and to assess the property level performance of our properties.
RevPOR represents the average revenues generated per occupied room per month and ExpPOR represents the average expenses per occupied room at our Seniors Housing Operating properties. These metrics are calculated as our pro rata version of total resident fees and services revenues or property operating expenses from the income statement divided by average monthly occupied room days. SS RevPOR and SS ExpPOR are used to evaluate the RevPOR and ExpPOR performance of our properties under a consistent population which eliminates changes in the composition of our portfolio. They are based on the same pool of properties used for SSNOI and includes any revenue or expense normalizations used for SSNOI. We use RevPOR, ExpPOR, SS RevPOR and SS ExpPOR to evaluate the revenue-generating capacity and profit potential of our Seniors Housing Operating portfolio independent of fluctuating occupancy rates. They are also used in comparison against industry and competitor statistics, if known, to evaluate the quality of our Seniors Housing Operating portfolio.
We measure our credit strength both in terms of leverage ratios and coverage ratios. The leverage ratios indicate how much of our balance sheet capitalization is related to long-term debt, net of cash and restricted cash. We expect to maintain capitalization ratios and coverage ratios sufficient to maintain a capital structure consistent with our current profile. The ratios are based on EBITDA and Adjusted EBITDA. EBITDA is defined as earnings (net income per income statement) before interest expense, income taxes, depreciation and amortization. Adjusted EBITDA is defined as EBITDA excluding unconsolidated entities and including adjustments for stock-based compensation expense, provision for loan losses, gains/losses on extinguishment of debt, gains/losses/impairments on properties, gains/losses on derivatives and financial instruments, other expenses, other impairment charges and other adjustments deemed appropriate in management's opinion. We believe that EBITDA and Adjusted EBITDA, along with net income, are important supplemental measures because they provide additional information to assess and evaluate the performance of our operations. We primarily use these measures to determine our interest coverage ratio, which represents EBITDA and Adjusted EBITDA divided by total interest, and our fixed charge coverage ratio, which represents EBITDA and Adjusted EBITDA divided by fixed charges. Fixed charges include total interest and secured debt principal amortization. Our leverage ratios include net debt to Adjusted EBITDA, book capitalization, undepreciated book capitalization and consolidated enterprise value. Book capitalization represents the sum of net debt (defined as total long-term debt, excluding operating lease liabilities, less cash and cash equivalents and restricted cash), total equity and redeemable noncontrolling interests. Undepreciated book capitalization represents book capitalization adjusted for accumulated depreciation and amortization. Consolidated enterprise value represents book capitalization adjusted for the fair market value of our common stock. Our leverage ratios are defined as the proportion of net debt to total capitalization.
Our supplemental reporting measures and similarly entitled financial measures are widely used by investors, equity and debt analysts and rating agencies in the valuation, comparison, rating and investment recommendations of companies. Our management uses these financial measures to facilitate internal and external comparisons to historical operating results and in making operating decisions. Additionally, these measures are utilized by the Board of Directors to evaluate management. None of the supplemental reporting measures represent net income or cash flow provided from operating activities as determined in accordance with U.S. GAAP and should not be considered as alternative measures of profitability or liquidity. Finally, the supplemental reporting measures, as defined by us, may not be comparable to similarly entitled items reported by other real estate investment trusts or other companies. Multi-period amounts may not equal the sum of the individual quarterly amounts due to rounding.
| | | | | |
| Supplemental Reporting Measures | |
| | | | | | | | | | | | | | | | | | | | | | | | | | | | | | | | | | | | | | | | | |
| (dollars in thousands) | | | | | | | | |
| Non-GAAP Reconciliations | | | | | | | | |
| | | | | | | | | | | | | |
| NOI Reconciliation | | 1Q23 | | 2Q23 | | 3Q23 | | 4Q23 | | 1Q24 |
| Net income (loss) | | $ | 28,635 | | | $ | 106,342 | | | $ | 134,722 | | | $ | 88,440 | | | $ | 131,634 | |
| Loss (gain) on real estate dispositions, net | | (747) | | | 2,168 | | | (71,102) | | | 1,783 | | | (4,707) | |
| Loss (income) from unconsolidated entities | | 7,071 | | | 40,332 | | | 4,031 | | | 2,008 | | | 7,783 | |
| Income tax expense (benefit) | | 3,045 | | | 3,503 | | | 4,584 | | | (4,768) | | | 6,191 | |
| Other expenses | | 22,745 | | | 11,069 | | | 38,220 | | | 36,307 | | | 14,131 | |
| Impairment of assets | | 12,629 | | | 1,086 | | | 7,388 | | | 14,994 | | | 43,331 | |
| Provision for loan losses, net | | 777 | | | 2,456 | | | 4,059 | | | 2,517 | | | 1,014 | |
| Loss (gain) on extinguishment of debt, net | | 5 | | | 1 | | | 1 | | | — | | | 6 | |
| Loss (gain) on derivatives and financial instruments, net | | 930 | | | 1,280 | | | 2,885 | | | (7,215) | | | (3,054) | |
| General and administrative expenses | | 44,371 | | | 44,287 | | | 46,106 | | | 44,327 | | | 53,318 | |
| Depreciation and amortization | | 339,112 | | | 341,945 | | | 339,314 | | | 380,730 | | | 365,863 | |
| Interest expense | | 144,403 | | | 152,337 | | | 156,532 | | | 154,574 | | | 147,318 | |
| Consolidated net operating income | | 602,976 | | | 706,806 | | | 666,740 | | | 713,697 | | | 762,828 | |
NOI attributable to unconsolidated investments(1) | | 26,354 | | | 25,150 | | | 29,488 | | | 30,785 | | | 32,090 | |
NOI attributable to noncontrolling interests(2) | | (25,057) | | | (24,262) | | | (22,838) | | | (22,402) | | | (22,796) | |
Pro rata net operating income (NOI)(3) | | $ | 604,273 | | | $ | 707,694 | | | $ | 673,390 | | | $ | 722,080 | | | $ | 772,122 | |
| | | | | | | | | | | | | | | | | | | | | | | | | | | | | | | | | | | | | | |
| In-Place NOI Reconciliation |
| At Welltower pro rata ownership | | Seniors Housing Operating | | Seniors Housing Triple-net | | Outpatient Medical | | Long-Term
/Post-Acute Care | | Corporate | | Total |
| Revenues | | $ | 1,386,818 | | | $ | 147,400 | | | $ | 203,849 | | | $ | 120,113 | | | $ | 28,729 | | | $ | 1,886,909 | |
| Property operating expenses | | (1,034,982) | | | (7,559) | | | (65,162) | | | (3,448) | | | (3,636) | | | (1,114,787) | |
NOI(3) | | 351,836 | | | 139,841 | | | 138,687 | | | 116,665 | | | 25,093 | | | 772,122 | |
| Adjust: | | | | | | | | | | | | |
| Interest income | | (4,716) | | | (35,478) | | | (852) | | | (15,823) | | | — | | | (56,869) | |
| Other income | | (2,666) | | | (106) | | | 35 | | | (244) | | | (24,087) | | | (27,068) | |
| Sold / held for sale | | (7,329) | | | (17) | | | (1,229) | | | 191 | | | — | | | (8,384) | |
Non operational(4) | | 3,581 | | | 1 | | | (1,018) | | | (643) | | | — | | | 1,921 | |
Non In-Place NOI(5) | | (6,289) | | | (2,475) | | | (4,046) | | | (17,066) | | | (1,006) | | | (30,882) | |
Timing adjustments(6) | | 1,591 | | | — | | | 19 | | | — | | | — | | | 1,610 | |
| Total adjustments | | (15,828) | | | (38,075) | | | (7,091) | | | (33,585) | | | (25,093) | | | (119,672) | |
| In-Place NOI | | 336,008 | | | 101,766 | | | 131,596 | | | 83,080 | | | — | | | 652,450 | |
| Annualized In-Place NOI | | $ | 1,344,032 | | | $ | 407,064 | | | $ | 526,384 | | | $ | 332,320 | | | $ | — | | | $ | 2,609,800 | |
| | | | | | | | | | | | |
| | | | | | | | | | | | | | | | | | | | | | | | | | | | | | | | |
| Same Store Property Reconciliation |
| | Seniors Housing Operating | | Seniors Housing
Triple-net | | Outpatient Medical | | Long-Term
/Post-Acute Care | | Total |
| Total properties | | 994 | | | 360 | | | 450 | | | 292 | | | 2,096 | |
Recent acquisitions/ development conversions(7) | | (69) | | | (11) | | | (40) | | | (58) | | | (178) | |
| Under development | | (34) | | | — | | | (13) | | | — | | | (47) | |
Under redevelopment(8) | | (5) | | | — | | | (2) | | | (4) | | | (11) | |
| Current held for sale | | (37) | | | — | | | (6) | | | (29) | | | (72) | |
| Land parcels, loans and sub-leases | | (15) | | | (4) | | | (8) | | | — | | | (27) | |
Transitions(9) | | (159) | | | (13) | | | — | | | (2) | | | (174) | |
Other(10) | | (10) | | | — | | | (3) | | | (4) | | | (17) | |
| Same store properties | | 665 | | | 332 | | | 378 | | | 195 | | | 1,570 | |
Notes:
(1) Represents Welltower's interests in joint ventures where Welltower is the minority partner.
(2) Represents minority partners' interests in joint ventures where Welltower is the majority partner.
(3) Represents Welltower's pro rata share of NOI. See page 11 for more information. (4) Primarily includes development properties and land parcels.
(5) Primarily represents non-cash NOI.
(6) Represents timing adjustments for current quarter acquisitions, construction conversions and segment or operator transitions.
(7) Acquisitions and development conversions will enter the same store pool five full quarters after acquisition or certificate of occupancy.
(8) Redevelopment properties will enter the same store pool after five full quarters of operations post redevelopment completion.
(9) Transitioned properties will enter the same store pool after five full quarters of operations with the new operator In-Place or under the new structure.
(10) Represents properties that are either closed or being closed.
| | | | | |
| Supplemental Reporting Measures | |
| | | | | | | | | | | | | | | | | | | | | | | | | | | | | | | | | | | | | | |
| (dollars in thousands at Welltower pro rata ownership) | | |
| | | | | | | | | | | | |
| Same Store NOI Reconciliation | | 1Q23 | | 2Q23 | | 3Q23 | | 4Q23 | | 1Q24 | | Y/o/Y |
| Seniors Housing Operating | | | | | | | | | | | | |
| NOI | | $ | 248,763 | | | $ | 276,907 | | | $ | 288,290 | | | $ | 305,589 | | | $ | 351,836 | | | |
| Non-cash NOI on same store properties | | (851) | | | (783) | | | (242) | | | (186) | | | (195) | | | |
| NOI attributable to non-same store properties | | (35,153) | | | (36,448) | | | (42,435) | | | (61,368) | | | (86,107) | | | |
Currency and ownership adjustments(1) | | 357 | | | 303 | | | 113 | | | 437 | | | (374) | | | |
| | | | | | | | | | | | |
Normalizing adjustment for management fee(2) | | (4,298) | | | (4,709) | | | (895) | | | (702) | | | — | | | |
| | | | | | | | | | | | |
Normalizing adjustment for casualty related expenses, net(3) | | 3,931 | | | 1,791 | | | 284 | | | 715 | | | 1,945 | | | |
| | | | | | | | | | | | |
| | | | | | | | | | | | |
Other normalizing adjustments(4) | | — | | | (5,347) | | | (2,861) | | | 853 | | | (198) | | | |
| SSNOI | | 212,749 | | | 231,714 | | | 242,254 | | | 245,338 | | | 266,907 | | | 25.5 | % |
| | | | | | | | | | | | |
| Seniors Housing Triple-net | | | | | | | | | | | | |
| NOI | | 145,084 | | | 143,978 | | | 137,547 | | | 146,027 | | | 139,841 | | | |
| Non-cash NOI on same store properties | | (12,010) | | | (9,667) | | | (9,150) | | | (4,731) | | | 2,510 | | | |
| NOI attributable to non-same store properties | | (43,201) | | | (43,594) | | | (36,016) | | | (48,832) | | | (48,268) | | | |
Currency and ownership adjustments(1) | | 437 | | | (112) | | | (317) | | | 56 | | | (343) | | | |
| | | | | | | | | | | | |
| | | | | | | | | | | | |
| | | | | | | | | | | | |
| | | | | | | | | | | | |
Other normalizing adjustments(4) | | — | | | — | | | — | | | 308 | | | — | | | |
| SSNOI | | 90,310 | | | 90,605 | | | 92,064 | | | 92,828 | | | 93,740 | | | 3.8 | % |
| | | | | | | | | | | | |
| Outpatient Medical | | | | | | | | | | | | |
| NOI | | 126,213 | | | 127,444 | | | 131,305 | | | 137,762 | | | 138,687 | | | |
| Non-cash NOI on same store properties | | (5,167) | | | (4,730) | | | (4,605) | | | (5,527) | | | (3,253) | | | |
| NOI attributable to non-same store properties | | (6,984) | | | (7,451) | | | (10,143) | | | (12,117) | | | (16,081) | | | |
Currency and ownership adjustments(1) | | 2,995 | | | 2,293 | | | 818 | | | 42 | | | 20 | | | |
| | | | | | | | | | | | |
Normalizing adjustment for casualty related expenses, net(3) | | 361 | | | 272 | | | 375 | | | 160 | | | (189) | | | |
| | | | | | | | | | | | |
Other normalizing adjustments(4) | | (539) | | | — | | | — | | | — | | | — | | | |
| SSNOI | | 116,879 | | | 117,828 | | | 117,750 | | | 120,320 | | | 119,184 | | | 2.0 | % |
| | | | | | | | | | | | |
| Long-Term/Post-Acute Care | | | | | | | | | | | | |
| NOI | | 82,943 | | | 146,693 | | | 86,426 | | | 108,638 | | | 116,665 | | | |
| Non-cash NOI on same store properties | | (10,699) | | | (13,815) | | | (11,733) | | | (11,672) | | | (10,592) | | | |
| NOI attributable to non-same store properties | | (14,727) | | | (75,160) | | | (16,649) | | | (39,015) | | | (46,749) | | | |
Currency and ownership adjustments(1) | | (10) | | | (22) | | | (25) | | | — | | | (16) | | | |
| | | | | | | | | | | | |
| | | | | | | | | | | | |
| | | | | | | | | | | | |
Other normalizing adjustments(4) | | — | | | — | | | (122) | | | — | | | — | | | |
| SSNOI | | 57,507 | | | 57,696 | | | 57,897 | | | 57,951 | | | 59,308 | | | 3.1 | % |
| | | | | | | | | | | | |
| Corporate | | | | | | | | | | | | |
| NOI | | 1,270 | | | 12,672 | | | 29,822 | | | 24,064 | | | 25,093 | | | |
| NOI attributable to non-same store properties | | (1,270) | | | (12,672) | | | (29,822) | | | (24,064) | | | (25,093) | | | |
| SSNOI | | — | | | — | | | — | | | — | | | — | | | |
| | | | | | | | | | | | |
| Total | | | | | | | | | | | | |
| NOI | | 604,273 | | | 707,694 | | | 673,390 | | | 722,080 | | | 772,122 | | | |
| Non-cash NOI on same store properties | | (28,727) | | | (28,995) | | | (25,730) | | | (22,116) | | | (11,530) | | | |
| NOI attributable to non-same store properties | | (101,335) | | | (175,325) | | | (135,065) | | | (185,396) | | | (222,298) | | | |
Currency and ownership adjustments(1) | | 3,779 | | | 2,462 | | | 589 | | | 535 | | | (713) | | | |
| Normalizing adjustments, net | | (545) | | | (7,993) | | | (3,219) | | | 1,334 | | | 1,558 | | | |
| SSNOI | | $ | 477,445 | | | $ | 497,843 | | | $ | 509,965 | | | $ | 516,437 | | | $ | 539,139 | | | 12.9 | % |
| | | | | | | | | | | | |
Notes:
(1) Includes adjustments to reflect consistent property ownership percentages, to translate Canadian properties at a USD/CAD rate of 1.36 and to translate UK properties at a GBP/USD rate of 1.25.
(2) Represents normalizing adjustment related to the disposition of our ownership interest in three Seniors Housing Operating management company investments.
(3) Represents normalizing adjustment for casualty related expenses net of any insurance reimbursements.
(4) Represents aggregate normalizing adjustments which are individually less than 0.50% of SSNOI growth per property type.
| | | | | |
| Supplemental Reporting Measures | |
| | | | | | | | | | | | | | | | | | | | | | | | | | |
| (dollars in thousands, except RevPOR, SS RevPOR and SSNOI/unit) | | |
| | | | |
| SHO RevPOR Reconciliation | | United States | | United Kingdom | | Canada | | Total |
| Consolidated SHO revenues | | $ | 1,100,895 | | | $ | 117,242 | | | $ | 148,623 | | | $ | 1,366,760 | |
Unconsolidated SHO revenues attributable to Welltower(1) | | 32,397 | | | 2,937 | | | 28,247 | | | 63,581 | |
SHO revenues attributable to noncontrolling interests(2) | | (17,503) | | | (292) | | | (25,728) | | | (43,523) | |
Pro rata SHO revenues(3) | | 1,115,789 | | | 119,887 | | | 151,142 | | | 1,386,818 | |
| SHO interest and other income | | (3,923) | | | (71) | | | (1,894) | | | (5,888) | |
| SHO revenues attributable to sold and held for sale properties | | (3,511) | | | — | | | (26,065) | | | (29,576) | |
Currency and ownership adjustments(4) | | (2,878) | | | (1) | | | (2,046) | | | (4,925) | |
| SHO local revenues | | 1,105,477 | | | 119,815 | | | 121,137 | | | 1,346,429 | |
| Average occupied units/month | | 61,801 | | | 3,998 | | | 14,743 | | | 80,542 | |
| RevPOR/month in USD | | $ | 5,979 | | | $ | 10,017 | | | $ | 2,746 | | | $ | 5,588 | |
RevPOR/month in local currency(4) | | | | £ | 8,348 | | | $ | 3,762 | | | |
| | | | | | | | | | | | | | | | | | | | | | | | | | | | | | | | | | | | | | | | | | | | | | | |
| Reconciliations of SHO SS RevPOR Growth, SSNOI Growth and SSNOI/Unit |
| | | | | | | |
| United States | | United Kingdom | | Canada | | Total |
| 1Q23 | | 1Q24 | | 1Q23 | | 1Q24 | | 1Q23 | | 1Q24 | | 1Q23 | | 1Q24 |
| SHO SS RevPOR Growth | | | | | | | | | | | | | | | |
| Consolidated SHO revenues | $ | 913,152 | | | $ | 1,100,895 | | | $ | 109,328 | | | $ | 117,242 | | | $ | 114,201 | | | $ | 148,623 | | | $ | 1,136,681 | | | $ | 1,366,760 | |
Unconsolidated SHO revenues attributable to WELL(1) | 35,175 | | | 32,397 | | | 1,174 | | | 2,937 | | | 23,232 | | | 28,247 | | | 59,581 | | | 63,581 | |
SHO revenues attributable to noncontrolling interests(2) | (18,433) | | | (17,503) | | | (11,234) | | | (292) | | | (22,851) | | | (25,728) | | | (52,518) | | | (43,523) | |
SHO pro rata revenues(3) | 929,894 | | | 1,115,789 | | | 99,268 | | | 119,887 | | | 114,582 | | | 151,142 | | | 1,143,744 | | | 1,386,818 | |
| Non-cash and non-RevPOR revenues on same store properties | (1,702) | | | (881) | | | — | | | (33) | | | (233) | | | (381) | | | (1,935) | | | (1,295) | |
| Revenues attributable to non-same store properties | (116,244) | | | (215,771) | | | (53,638) | | | (65,159) | | | (69,534) | | | (101,028) | | | (239,416) | | | (381,958) | |
Currency and ownership adjustments(4) | 4,420 | | | 150 | | | 1,154 | | | (1,006) | | | 475 | | | (461) | | | 6,049 | | | (1,317) | |
| | | | | | | | | | | | | | | |
| | | | | | | | | | | | | | | |
| | | | | | | | | | | | | | | |
| | | | | | | | | | | | | | | |
SHO SS RevPOR revenues(5) | $ | 816,368 | | | $ | 899,287 | | | $ | 46,784 | | | $ | 53,689 | | | $ | 45,290 | | | $ | 49,272 | | | $ | 908,442 | | | $ | 1,002,248 | |
Avg. occupied units/month(6) | 48,991 | | | 50,941 | | | 1,952 | | | 2,065 | | | 6,200 | | | 6,496 | | | 57,143 | | | 59,502 | |
SHO SS RevPOR(7) | $ | 5,632 | | | $ | 5,901 | | | $ | 8,100 | | | $ | 8,690 | | | $ | 2,469 | | | $ | 2,535 | | | $ | 5,373 | | | $ | 5,630 | |
| SS RevPOR YOY growth | | | 4.8 | % | | | | 7.3 | % | | | | 2.7 | % | | | | 4.8 | % |
| | | | | | | | | | | | | | | |
| SHO SSNOI Growth | | | | | | | | | | | | | | | |
| Consolidated SHO NOI | $ | 203,132 | | | $ | 268,650 | | | $ | 19,197 | | | $ | 29,726 | | | $ | 30,568 | | | $ | 49,037 | | | $ | 252,897 | | | $ | 347,413 | |
Unconsolidated SHO NOI attributable to WELL(1) | 5,859 | | | 10,335 | | | (558) | | | 480 | | | 6,825 | | | 10,967 | | | 12,126 | | | 21,782 | |
SHO NOI attributable to noncontrolling interests(2) | (8,860) | | | (9,744) | | | (1,962) | | | (547) | | | (5,438) | | | (7,068) | | | (16,260) | | | (17,359) | |
SHO pro rata NOI(3) | 200,131 | | | 269,241 | | | 16,677 | | | 29,659 | | | 31,955 | | | 52,936 | | | 248,763 | | | 351,836 | |
| Non-cash NOI on same store properties | (851) | | | (177) | | | — | | | — | | | — | | | (18) | | | (851) | | | (195) | |
| NOI attributable to non-same store properties | (11,389) | | | (37,321) | | | (8,078) | | | (16,328) | | | (15,686) | | | (32,458) | | | (35,153) | | | (86,107) | |
Currency and ownership adjustments(4) | (96) | | | 56 | | | 219 | | | (246) | | | 234 | | | (184) | | | 357 | | | (374) | |
| | | | | | | | | | | | | | | |
Normalizing adjustment for management fee(8) | (4,195) | | | — | | | — | | | — | | | (103) | | | — | | | (4,298) | | | — | |
| | | | | | | | | | | | | | | |
Normalizing adjustment for casualty related expenses(9) | 3,931 | | | 2,233 | | | — | | | — | | | — | | | (288) | | | 3,931 | | | 1,945 | |
| | | | | | | | | | | | | | | |
| | | | | | | | | | | | | | | |
Other normalizing adjustments(10) | — | | | (198) | | | — | | | — | | | — | | | — | | | — | | | (198) | |
SHO pro rata SSNOI(5) | $ | 187,531 | | | $ | 233,834 | | | $ | 8,818 | | | $ | 13,085 | | | $ | 16,400 | | | $ | 19,988 | | | $ | 212,749 | | | $ | 266,907 | |
| SHO SSNOI growth | | | 24.7 | % | | | | 48.4 | % | | | | 21.9 | % | | | | 25.5 | % |
| | | | | | | | | | | | | | | |
| SHO SSNOI/Unit | | | | | | | | | | | | | | | |
Trailing four quarters' SSNOI(5) | | | $ | 864,375 | | | | | $ | 45,590 | | | | | $ | 76,248 | | | | | $ | 986,213 | |
Average units in service(11) | | | 61,453 | | | | | 2,469 | | | | | 7,419 | | | | | 71,341 | |
| SSNOI/unit in USD | | | $ | 14,066 | | | | | $ | 18,465 | | | | | $ | 10,277 | | | | | $ | 13,824 | |
SSNOI/unit in local currency(4) | | | | | | | £ | 15,388 | | | | | $ | 14,078 | | | | | |
Notes:
(1) Represents Welltower's interests in joint ventures where Welltower is the minority partner.
(2) Represents minority partners' interests in joint ventures where Welltower is the majority partner.
(3) Represents SHO revenues/NOI at Welltower pro rata ownership. See page 11 for more information. (4) Includes where appropriate adjustments to reflect consistent property ownership percentages, to translate Canadian properties at a USD/CAD rate of 1.36 and to translate UK properties at a GBP/USD rate of 1.25.
(5) Represents SS SHO RevPOR revenues/SSNOI at Welltower pro rata ownership. See page 18 for more information. (6) Represents average occupied units for SS properties related solely to referenced country on a pro rata basis.
(7) Represents pro rata SS average revenues generated per occupied room per month.
(8) Represents normalizing adjustment related to the disposition of our ownership interest in three Seniors Housing Operating management company investments.
(9) Represents normalizing adjustment for casualty related expenses net of any insurance reimbursements.
(10) Represents aggregate normalizing adjustments which are individually less than .50% of SSNOI growth.
(11) Represents average units in service for SS properties related solely to referenced country on a pro rata basis.
| | | | | |
| Forward-Looking Statement and Risk Factors | |
Forward-Looking Statements and Risk Factors
This document contains “forward-looking statements” as defined in the Private Securities Litigation Reform Act of 1995. When Welltower uses words such as “may,” “will,” “intend,” “should,” “believe,” “expect,” “anticipate,” “project,” “pro forma,” “estimate” or similar expressions that do not relate solely to historical matters, Welltower is making forward-looking statements. Forward-looking statements are not guarantees of future performance and involve risks and uncertainties that may cause Welltower’s actual results to differ materially from Welltower’s expectations discussed in the forward-looking statements. This may be a result of various factors, including, but not limited to: the status of the economy; the status of capital markets, including availability and cost of capital; issues facing the health care industry, including compliance with, and changes to, regulations and payment policies, responding to government investigations and punitive settlements and operators’/tenants’ difficulty in cost effectively obtaining and maintaining adequate liability and other insurance; changes in financing terms; competition within the health care and seniors housing industries; negative developments in the operating results or financial condition of operators/tenants, including, but not limited to, their ability to pay rent and repay loans; Welltower’s ability to transition or sell properties with profitable results; the failure to make new investments or acquisitions as and when anticipated; natural disasters, health emergencies (such as the COVID-19 pandemic) and other acts of God affecting Welltower’s properties; Welltower’s ability to re-lease space at similar rates as vacancies occur; Welltower’s ability to timely reinvest sale proceeds at similar rates to assets sold; operator/tenant or joint venture partner bankruptcies or insolvencies; the cooperation of joint venture partners; government regulations affecting Medicare and Medicaid reimbursement rates and operational requirements; liability or contract claims by or against operators/tenants; unanticipated difficulties and/or expenditures relating to future investments or acquisitions; environmental laws affecting Welltower’s properties; changes in rules or practices governing Welltower’s financial reporting; the movement of U.S. and foreign currency exchange rates; Welltower’s ability to maintain its qualification as a REIT; key management personnel recruitment and retention; and other risks described in Welltower’s reports filed from time to time with the SEC. Welltower undertakes no obligation to update or revise publicly any forward-looking statements, whether because of new information, future events or otherwise, or to update the reasons why actual results could differ from those projected in any forward-looking statements.
Additional Information
The information in this supplemental information package should be read in conjunction with our Annual Report on Form 10-K, Quarterly Reports on Form 10-Q, Current Reports on Form 8-K, our earnings press release dated April 29, 2024 and other information filed with, or furnished to, the SEC. The Supplemental Reporting Measures and reconciliations of Non-GAAP measures are an integral part of the information presented herein.
You can access our Annual Report on Form 10-K, Quarterly Reports on Form 10-Q, Current Reports on Form 8-K and amendments to those reports filed or furnished pursuant to Section 13(a) or 15(d) of the Exchange Act at www.welltower.com as soon as reasonably practicable after they are filed with, or furnished to, the SEC. You can also review these SEC filings and other information by accessing the SEC’s website at http://www.sec.gov. We routinely post important information on our website at www.welltower.com in the “Investors” section, including corporate and investor presentations and financial information. We intend to use our website as a means of disclosing material, non-public information and for complying with our disclosure obligations under Regulation FD. Such disclosures will be included on our website under the heading “Investors.” Accordingly, investors should monitor such portion of our website in addition to following our press releases, public conference calls and filings with the SEC. The information on or connected to our website is not, and shall not be deemed to be, a part of, or incorporated into this supplemental information package.
About Welltower
Welltower Inc. (NYSE:WELL), a REIT and S&P 500 company headquartered in Toledo, Ohio, is driving the transformation of health care infrastructure. Welltower invests with leading seniors housing operators, post-acute providers and health systems to fund the real estate and infrastructure needed to scale innovative care delivery models and improve people’s wellness and overall health care experience. Welltower owns interests in properties concentrated in major, high-growth markets in the United States, Canada and the United Kingdom, consisting of seniors housing and post-acute communities and outpatient medical properties. More information is available at www.welltower.com.