
UNITED STATES
SECURITIES AND EXCHANGE COMMISSION
Washington, D.C. 20549
_________________
FORM
_________________
CURRENT REPORT
Pursuant to Section 13 or 15(d)
of the Securities Exchange Act of 1934
Date of Report (Date of earliest event reported):
_______________________________
(Exact name of registrant as specified in its charter)
_______________________________
| (State or Other Jurisdiction of Incorporation) | (Commission File Number) | (I.R.S. Employer Identification No.) |
(Address of Principal Executive Offices) (Zip Code)
(
(Registrant's telephone number, including area code)
Not applicable
(Former name or former address, if changed since last report)
_______________________________
Check the appropriate box below if the Form 8-K filing is intended to simultaneously satisfy the filing obligation of the registrant under any of the following provisions:
| Written communications pursuant to Rule 425 under the Securities Act (17 CFR 230.425) | |
| Soliciting material pursuant to Rule 14a-12 under the Exchange Act (17 CFR 240.14a-12) | |
| Pre-commencement communications pursuant to Rule 14d-2(b) under the Exchange Act (17 CFR 240.14d-2(b)) | |
| Pre-commencement communications pursuant to Rule 13e-4(c) under the Exchange Act (17 CFR 240.13e-4(c)) |
Securities registered pursuant to Section 12(b) of the Act:
| Title of each class | Trading Symbol(s) | Name of each exchange on which registered |
Indicate by check mark whether the registrant is an emerging growth company as defined in Rule 405 of the Securities Act of 1933 (§230.405 of this chapter) or Rule 12b-2 of the Securities Exchange Act of 1934 (§240.12b-2 of this chapter).
Emerging growth company
If an emerging growth company,indicate by check mark if the registrant has elected not to use the extended transition period for complying with any new or revised financial accounting standards provided pursuant to Section 13(a) of the Exchange Act. ☐
On April 24, 2024, the Board of Directors of Brookline Bancorp, Inc. (the “Company”) issued a press release announcing its earnings for the quarter ended March 31, 2024. Additionally, the Company announced the approval by its Board of Directors of a regular quarterly dividend of $0.135 per share payable on May 24, 2024 to stockholders of record on May 10, 2024. A copy of that press release is attached hereto as Exhibit 99.1 and is hereby incorporated by reference herein.
In connection with the press release announcing the Company’s quarter earnings, the Company posted an investor presentation to its website at www.brooklinebancorp.com. A copy of the investor presentation is attached hereto as Exhibit 99.2 and is hereby incorporated by reference herein.
| 99.1 | Press release of Brookline Bancorp, Inc. reporting earnings and dividend approval, issued April 24, 2024 | |||
| 99.2 | Investor Presentation of Brookline Bancorp, Inc., issued April 24, 2024 | |||
| 104 | Cover Page Interactive Data File (embedded within the Inline XBRL document) |
SIGNATURE
Pursuant to the requirements of the Securities Exchange Act of 1934, the registrant has duly caused this report to be signed on its behalf by the undersigned hereunto duly authorized.
| BROOKLINE BANCORP, INC. | ||
| Date: April 24, 2024 | By: | /s/ Carl M. Carlson |
| Carl M. Carlson | ||
| Co-President, Chief Financial & Strategy Officer | ||
EXHIBIT INDEX
The following exhibits are furnished as part of this report:
| Exhibit No. | Description | |||
| 99.1 | Press release of Brookline Bancorp, Inc. reporting earnings and dividend approval, issued April 24, 2024 | |||
| 99.2 | Investor Presentation of Brookline Bancorp, Inc., issued April 24, 2024 | |||
| 104 | Cover Page Interactive Data File (embedded within the Inline XBRL document) |
EXHIBIT 99.1
Brookline Bancorp Announces First Quarter Results
Net Income of $14.7 million, EPS of $0.16
Quarterly Dividend of $0.135
BOSTON, April 24, 2024 (GLOBE NEWSWIRE) -- Brookline Bancorp, Inc. (NASDAQ: BRKL) (the “Company”) today announced net income of $14.7 million, or $0.16 per basic and diluted share, for the first quarter of 2024, compared to net income of $22.9 million, or $0.26 per basic and diluted share, for the fourth quarter of 2023, and net income of $7.6 million, or $0.09 per basic and diluted share, for the first quarter of 2023.
Paul Perrault, Chairman and CEO, commented on the Company’s first quarter earnings, “Our Company, along with the rest of the banking industry, continues to face margin pressure. As we look ahead to the second quarter we are optimistic about the overall economic outlook in our markets. We remain active in our communities and our dedicated team of bankers continues to provide our customers with the exceptional service they have come to appreciate.”
BALANCE SHEET
Total assets at March 31, 2024 were $11.5 billion, representing an increase of $160.5 million from $11.4 billion at December 31, 2023, and an increase of $20.2 million from March 31, 2023. At March 31, 2024, total loans and leases were $9.7 billion, representing an increase of $13.5 million from December 31, 2023, and an increase of $408.1 million from March 31, 2023.
Total investment securities at March 31, 2024 decreased $50.8 million to $865.8 million from $916.6 million at December 31, 2023, and decreased $201.2 million from $1.1 billion at March 31, 2023. Total cash and cash equivalents at March 31, 2024 increased $168.9 million to $301.9 million from $133.0 million at December 31, 2023, and decreased $184.4 million from $486.3 million at March 31, 2023. As of March 31, 2024, total investment securities and total cash and cash equivalents represented 10.1 percent of total assets compared to 9.2 percent and 13.5 percent as of December 31, 2023 and March 31, 2023, respectively.
Total deposits at March 31, 2024 increased $170.5 million to $8.7 billion from $8.5 billion at December 31, 2023, consisting of an $80.8 million increase in customer deposits and an $89.8 million increase in brokered deposits, and increased $262.2 million from $8.5 billion at March 31, 2023, driven by growth in customer deposits.
Total borrowed funds at March 31, 2024 decreased $14.8 million to $1.4 billion from December 31, 2023, and decreased $268.2 million from $1.6 billion at March 31, 2023.
The ratio of stockholders’ equity to total assets was 10.35 percent at March 31, 2024, compared to 10.53 percent at December 31, 2023, and 10.11 percent at March 31, 2023. The ratio of tangible stockholders’ equity to tangible assets (non-GAAP) was 8.25 percent at March 31, 2024, as compared to 8.39 percent at December 31, 2023, and 7.94 percent at March 31, 2023. Tangible book value per common share (non-GAAP) decreased $0.03 from $10.50 at December 31, 2023 to $10.47 at March 31, 2024, and increased $0.39 from $10.08 at March 31, 2023.
NET INTEREST INCOME
Net interest income decreased $2.0 million to $81.6 million during the first quarter of 2024 from $83.6 million for the quarter ended December 31, 2023. The net interest margin decreased 9 basis points to 3.06 percent for the three months ended March 31, 2024 from 3.15 percent for the three months ended December 31, 2023, primarily driven by higher funding costs.
NON-INTEREST INCOME
Total non-interest income for the quarter ended March 31, 2024 decreased $1.7 million to $6.3 million from $8.0 million for the quarter ended December 31, 2023. The decrease was primarily driven by a decline of $1.1 million in other non-interest income which was primarily driven by the mark to market on interest rate swaps on participated loans of $0.8 million, a $0.4 million decline in gain on sales of loans and leases, and a $0.3 million decline in loan derivative income, net, partially offset by an increase of $0.3 million in loan fees.
PROVISION FOR CREDIT LOSSES
The Company recorded a provision for credit losses of $7.4 million for the quarter ended March 31, 2024, compared to $3.8 million for the quarter ended December 31, 2023. The increase in provision was largely driven by an increase in expected losses in the Company’s equipment finance businesses.
Total net charge-offs for the first quarter of 2024 were $8.8 million compared to $7.1 million in the fourth quarter of 2023. The $8.8 million in net charge-offs were largely driven by $4.7 million in commercial loans, the majority of which was previously specifically reserved for, and $3.5 million in equipment financing. The equipment financing charge-offs were largely small dollar specialty vehicle charge-offs. The ratio of net loan and lease charge-offs to average loans and leases on an annualized basis increased to 36 basis points for the first quarter of 2024 from 30 basis points for the fourth quarter of 2023.
The allowance for loan and lease losses represented 1.24 percent of total loans and leases at March 31, 2024, compared to 1.22 percent at December 31, 2023, and 1.31 percent at March 31, 2023.
ASSET QUALITY
The ratio of nonperforming loans and leases to total loans and leases was 0.42 percent at March 31, 2024, a decrease from 0.45 percent at December 31, 2023. Total nonaccrual loans and leases decreased $3.0 million to $40.7 million at March 31, 2024 from $43.6 million at December 31, 2023. The ratio of nonperforming assets to total assets was 0.37 percent at March 31, 2024, a decrease from 0.40 percent at December 31, 2023. Total nonperforming assets decreased $2.8 million to $42.5 million at March 31, 2024 from $45.3 million at December 31, 2023.
NON-INTEREST EXPENSE
Non-interest expense for the quarter ended March 31, 2024 increased $1.8 million to $61.0 million from $59.2 million for the quarter ended December 31, 2023. The increase was primarily driven by increases of $1.2 million in compensation and employee benefits expense, $0.8 million in advertising and marketing expense, $0.6 million in occupancy expense, and $0.5 million in professional services expense, partially offset by decreases of $0.9 million in other non-interest expense, $0.3 million in amortization of identified intangible assets expense, and $0.2 million in equipment and data processing expense.
PROVISION FOR INCOME TAXES
The effective tax rate was 24.7 percent for the three months ended March 31, 2024 compared to 19.9 percent for the three months ended December 31, 2023 and 12.8 percent for the three months ended March 31, 2023.
RETURNS ON AVERAGE ASSETS AND AVERAGE EQUITY
The annualized return on average assets decreased to 0.51 percent during the first quarter 2024 from 0.81 percent for the fourth quarter of 2023.
The annualized return on average stockholders' equity decreased to 4.88 percent during the first quarter of 2024 from 7.82 percent for the fourth quarter of 2023. The annualized return on average tangible stockholders’ equity decreased to 6.26 percent for the first quarter of 2024 from 10.12 percent for the fourth quarter of 2023.
DIVIDEND DECLARED
The Company’s Board of Directors approved a dividend of $0.135 per share for the quarter ended March 31, 2024. The dividend will be paid on May 24, 2024 to stockholders of record on May 10, 2024.
CONFERENCE CALL
The Company will conduct a conference call/webcast at 1:30 PM Eastern Time on Thursday, April 25, 2024 to discuss the results for the quarter, business highlights and outlook. A copy of the Earnings Presentation is available on the Company’s website, www.brooklinebancorp.com. To listen to the call and view the Company’s Earnings Presentation, please join the call via https://events.q4inc.com/attendee/249109629. To listen to the call without access to the slides, interested parties may dial 833-470-1428 (United States) or 404-975-4839 (internationally) and ask for the Brookline Bancorp, Inc. conference call (Access Code 923783). A recorded playback of the call will be available for one week following the call on the Company’s website under “Investor Relations” or by dialing 866-813-9403 (United States) or 929-458-6194 (internationally) and entering the passcode: 815015.
ABOUT BROOKLINE BANCORP, INC.
Brookline Bancorp, Inc., a bank holding company with $11.5 billion in assets and branch locations in Massachusetts, Rhode Island, and the Lower Hudson Valley of New York State, is headquartered in Boston, Massachusetts and operates as the holding company for Brookline Bank, Bank Rhode Island, and PCSB Bank (the "banks"). The Company provides commercial and retail banking services, cash management and investment services to customers throughout Central New England and the Lower Hudson Valley of New York State. More information about Brookline Bancorp, Inc. and its banks can be found at the following websites: www.brooklinebank.com, www.bankri.com and www.pcsb.com.
FORWARD-LOOKING STATEMENTS
Certain statements contained in this press release that are not historical facts may constitute forward-looking statements within the meaning of Section 27A of the Securities Act of 1933, as amended, and Section 21E of the Securities Exchange Act of 1934, as amended, and are intended to be covered by the safe harbor provisions of the Private Securities Litigation Reform Act of 1995. We may also make forward-looking statements in other documents we file with the Securities and Exchange Commission ("SEC"), in our annual reports to shareholders, in press releases and other written materials, and in oral statements made by our officers, directors or employees. You can identify forward looking statements by the use of the words “believe,” “expect,” “anticipate,” “intend,” “estimate,” “assume,” “outlook,” “will,” “should,” and other expressions that predict or indicate future events and trends and which do not relate to historical matters, including statements regarding the Company’s business, credit quality, financial condition, liquidity and results of operations. Forward-looking statements may differ, possibly materially, from what is included in this press release due to factors and future developments that are uncertain and beyond the scope of the Company’s control. These include, but are not limited to, changes in interest rates; general economic conditions (including inflation and concerns about liquidity) on a national basis or in the local markets in which the Company operates; turbulence in the capital and debt markets; competitive pressures from other financial institutions; changes in consumer behavior due to changing political, business and economic conditions, or legislative or regulatory initiatives; changes in the value of securities and other assets in the Company’s investment portfolio; increases in loan and lease default and charge-off rates; the adequacy of allowances for loan and lease losses; decreases in deposit levels that necessitate increases in borrowing to fund loans and investments; operational risks including, but not limited to, cybersecurity incidents, fraud, natural disasters, and future pandemics; changes in regulation; the possibility that future credit losses may be higher than currently expected due to changes in economic assumptions and adverse economic developments; the risk that goodwill and intangibles recorded in the Company’s financial statements will become impaired; and changes in assumptions used in making such forward-looking statements. Forward-looking statements involve risks and uncertainties which are difficult to predict. The Company’s actual results could differ materially from those projected in the forward-looking statements as a result of, among others, the risks outlined in the Company’s Annual Report on Form 10-K, as updated by its Quarterly Reports on Form 10-Q and other filings submitted to the SEC. The Company does not undertake any obligation to update any forward-looking statement to reflect circumstances or events that occur after the date the forward-looking statements are made.
BASIS OF PRESENTATION
The Company's consolidated financial statements have been prepared in conformity with generally accepted accounting principles (“GAAP”) as set forth by the Financial Accounting Standards Board in its Accounting Standards Codification and through the rules and interpretive releases of the SEC under the authority of federal securities laws. Certain amounts previously reported have been reclassified to conform to the current period's presentation.
NON-GAAP FINANCIAL MEASURES
The Company uses certain non-GAAP financial measures, such as operating earnings after tax, operating earnings per common share, operating return on average assets, operating return on average tangible assets, operating return on average stockholders' equity, operating return on average tangible stockholders' equity, tangible book value per common share, tangible stockholders’ equity to tangible assets, return on average tangible assets (annualized) and return on average tangible stockholders' equity (annualized). These non-GAAP financial measures provide information for investors to effectively analyze financial trends of ongoing business activities, and to enhance comparability with peers across the financial services sector. A detailed reconciliation table of the Company's GAAP to the non-GAAP measures is attached.
INVESTOR RELATIONS:
| Contact: | Carl M. Carlson Brookline Bancorp, Inc. Co-President and Chief Financial and Strategy Officer (617) 425-5331 carl.carlson@brkl.com |
| BROOKLINE BANCORP, INC. AND SUBSIDIARIES | ||||||||||||||||
| Selected Financial Highlights (Unaudited) | ||||||||||||||||
| At and for the Three Months Ended | ||||||||||||||||
| March 31, 2024 | December 31, 2023 | September 30, 2023 | June 30, 2023 | March 31, 2023 | ||||||||||||
| (Dollars In Thousands Except per Share Data) | ||||||||||||||||
| Earnings Data: | ||||||||||||||||
| Net interest income | $ | 81,588 | $ | 83,555 | $ | 84,070 | $ | 86,037 | $ | 86,049 | ||||||
| Provision for credit losses on loans | 7,423 | 3,851 | 2,947 | 5,726 | 25,344 | |||||||||||
| Provision (credit) for credit losses on investments | (44 | ) | (76 | ) | 84 | 133 | 198 | |||||||||
| Non-interest income | 6,284 | 8,027 | 5,508 | 5,462 | 12,937 | |||||||||||
| Non-interest expense | 61,014 | 59,244 | 57,679 | 57,825 | 64,776 | |||||||||||
| Income before provision for income taxes | 19,479 | 28,563 | 28,868 | 27,815 | 8,668 | |||||||||||
| Net income | 14,665 | 22,888 | 22,701 | 21,850 | 7,560 | |||||||||||
| Performance Ratios: | ||||||||||||||||
| Net interest margin (1) | 3.06 | % | 3.15 | % | 3.18 | % | 3.26 | % | 3.36 | % | ||||||
| Interest-rate spread (1) | 2.21 | % | 2.39 | % | 2.45 | % | 2.51 | % | 2.66 | % | ||||||
| Return on average assets (annualized) | 0.51 | % | 0.81 | % | 0.81 | % | 0.78 | % | 0.27 | % | ||||||
| Return on average tangible assets (annualized) (non-GAAP) | 0.53 | % | 0.83 | % | 0.83 | % | 0.79 | % | 0.28 | % | ||||||
| Return on average stockholders' equity (annualized) | 4.88 | % | 7.82 | % | 7.78 | % | 7.44 | % | 2.61 | % | ||||||
| Return on average tangible stockholders' equity (annualized) (non-GAAP) | 6.26 | % | 10.12 | % | 10.09 | % | 9.67 | % | 3.43 | % | ||||||
| Efficiency ratio (2) | 69.44 | % | 64.69 | % | 64.39 | % | 63.20 | % | 65.44 | % | ||||||
| Per Common Share Data: | ||||||||||||||||
| Net income — Basic | $ | 0.16 | $ | 0.26 | $ | 0.26 | $ | 0.25 | $ | 0.09 | ||||||
| Net income — Diluted | 0.16 | 0.26 | 0.26 | 0.25 | 0.09 | |||||||||||
| Cash dividends declared | 0.135 | 0.135 | 0.135 | 0.135 | 0.135 | |||||||||||
| Book value per share (end of period) | 13.43 | 13.48 | 13.03 | 13.11 | 13.14 | |||||||||||
| Tangible book value per share (end of period) (non-GAAP) | 10.47 | 10.50 | 10.02 | 10.07 | 10.08 | |||||||||||
| Stock price (end of period) | 9.96 | 10.91 | 9.11 | 8.74 | 10.50 | |||||||||||
| Balance Sheet: | ||||||||||||||||
| Total assets | $ | 11,542,731 | $ | 11,382,256 | $ | 11,180,555 | $ | 11,206,078 | $ | 11,522,485 | ||||||
| Total loans and leases | 9,655,086 | 9,641,589 | 9,380,782 | 9,340,799 | 9,246,965 | |||||||||||
| Total deposits | 8,718,653 | 8,548,125 | 8,566,013 | 8,517,013 | 8,456,462 | |||||||||||
| Total stockholders’ equity | 1,194,231 | 1,198,644 | 1,157,871 | 1,162,308 | 1,165,066 | |||||||||||
| Asset Quality: | ||||||||||||||||
| Nonperforming assets | $ | 42,489 | $ | 45,324 | $ | 51,540 | $ | 46,925 | $ | 28,962 | ||||||
| Nonperforming assets as a percentage of total assets | 0.37 | % | 0.40 | % | 0.46 | % | 0.42 | % | 0.25 | % | ||||||
| Allowance for loan and lease losses | $ | 120,124 | $ | 117,522 | $ | 119,081 | $ | 125,817 | $ | 120,865 | ||||||
| Allowance for loan and lease losses as a percentage of total loans and leases | 1.24 | % | 1.22 | % | 1.27 | % | 1.35 | % | 1.31 | % | ||||||
| Net loan and lease charge-offs | $ | 8,781 | $ | 7,141 | $ | 10,974 | $ | 1,097 | $ | 451 | ||||||
| Net loan and lease charge-offs as a percentage of average loans and leases (annualized) | 0.36 | % | 0.30 | % | 0.47 | % | 0.05 | % | 0.02 | % | ||||||
| Capital Ratios: | ||||||||||||||||
| Stockholders’ equity to total assets | 10.35 | % | 10.53 | % | 10.36 | % | 10.37 | % | 10.11 | % | ||||||
| Tangible stockholders’ equity to tangible assets (non-GAAP) | 8.25 | % | 8.39 | % | 8.16 | % | 8.16 | % | 7.94 | % | ||||||
| (1) Calculated on a fully tax-equivalent basis. | ||||||||||||||||
| (2) Calculated as non-interest expense as a percentage of net interest income plus non-interest income. | ||||||||||||||||
| BROOKLINE BANCORP, INC. AND SUBSIDIARIES | |||||||||||||||
| Consolidated Balance Sheets (Unaudited) | |||||||||||||||
| March 31, 2024 | December 31, 2023 | September 30, 2023 | June 30, 2023 | March 31, 2023 | |||||||||||
| ASSETS | (In Thousands Except Share Data) | ||||||||||||||
| Cash and due from banks | $ | 45,708 | $ | 34,514 | $ | 33,506 | $ | 44,323 | $ | 30,782 | |||||
| Short-term investments | 256,178 | 98,513 | 127,495 | 180,109 | 455,538 | ||||||||||
| Total cash and cash equivalents | 301,886 | 133,027 | 161,001 | 224,432 | 486,320 | ||||||||||
| Investment securities available-for-sale | 865,798 | 916,601 | 880,412 | 910,210 | 1,067,032 | ||||||||||
| Total investment securities | 865,798 | 916,601 | 880,412 | 910,210 | 1,067,032 | ||||||||||
| Allowance for investment security losses | (398 | ) | (441 | ) | (517 | ) | (433 | ) | (301 | ) | |||||
| Net investment securities | 865,400 | 916,160 | 879,895 | 909,777 | 1,066,731 | ||||||||||
| Loans and leases held-for-sale | 6,717 | — | — | — | — | ||||||||||
| Loans and leases: | |||||||||||||||
| Commercial real estate loans | 5,755,239 | 5,764,529 | 5,669,768 | 5,670,771 | 5,610,414 | ||||||||||
| Commercial loans and leases | 2,416,904 | 2,399,668 | 2,241,375 | 2,193,027 | 2,147,149 | ||||||||||
| Consumer loans | 1,482,943 | 1,477,392 | 1,469,639 | 1,477,001 | 1,489,402 | ||||||||||
| Total loans and leases | 9,655,086 | 9,641,589 | 9,380,782 | 9,340,799 | 9,246,965 | ||||||||||
| Allowance for loan and lease losses | (120,124 | ) | (117,522 | ) | (119,081 | ) | (125,817 | ) | (120,865 | ) | |||||
| Net loans and leases | 9,534,962 | 9,524,067 | 9,261,701 | 9,214,982 | 9,126,100 | ||||||||||
| Restricted equity securities | 74,709 | 77,595 | 65,460 | 71,421 | 86,230 | ||||||||||
| Premises and equipment, net of accumulated depreciation | 89,707 | 89,853 | 90,476 | 90,685 | 87,799 | ||||||||||
| Right-of-use asset operating leases | 33,133 | 30,863 | 31,619 | 31,774 | 30,067 | ||||||||||
| Deferred tax asset | 60,484 | 56,952 | 74,491 | 77,704 | 75,028 | ||||||||||
| Goodwill | 241,222 | 241,222 | 241,222 | 241,222 | 241,222 | ||||||||||
| Identified intangible assets, net of accumulated amortization | 22,499 | 24,207 | 26,172 | 28,126 | 30,080 | ||||||||||
| Other real estate owned and repossessed assets | 1,817 | 1,694 | 299 | 602 | 508 | ||||||||||
| Other assets | 310,195 | 286,616 | 348,219 | 315,353 | 292,400 | ||||||||||
| Total assets | $ | 11,542,731 | $ | 11,382,256 | $ | 11,180,555 | $ | 11,206,078 | $ | 11,522,485 | |||||
| LIABILITIES AND STOCKHOLDERS' EQUITY | |||||||||||||||
| Deposits: | |||||||||||||||
| Demand checking accounts | $ | 1,629,371 | $ | 1,678,406 | $ | 1,745,137 | $ | 1,843,516 | $ | 1,899,370 | |||||
| NOW accounts | 654,748 | 661,863 | 647,476 | 699,119 | 757,411 | ||||||||||
| Savings accounts | 1,727,893 | 1,669,018 | 1,625,804 | 1,464,054 | 1,268,375 | ||||||||||
| Money market accounts | 2,065,569 | 2,082,810 | 2,161,359 | 2,166,570 | 2,185,971 | ||||||||||
| Certificate of deposit accounts | 1,670,147 | 1,574,855 | 1,491,844 | 1,410,905 | 1,362,970 | ||||||||||
| Brokered deposit accounts | 970,925 | 881,173 | 894,393 | 932,849 | 982,365 | ||||||||||
| Total deposits | 8,718,653 | 8,548,125 | 8,566,013 | 8,517,013 | 8,456,462 | ||||||||||
| Borrowed funds: | |||||||||||||||
| Advances from the FHLB | 1,150,153 | 1,223,226 | 899,304 | 1,043,381 | 1,458,457 | ||||||||||
| Subordinated debentures and notes | 84,223 | 84,188 | 84,152 | 84,116 | 84,080 | ||||||||||
| Other borrowed funds | 127,505 | 69,256 | 151,612 | 98,773 | 87,565 | ||||||||||
| Total borrowed funds | 1,361,881 | 1,376,670 | 1,135,068 | 1,226,270 | 1,630,102 | ||||||||||
| Operating lease liabilities | 34,235 | 31,998 | 32,807 | 33,021 | 31,373 | ||||||||||
| Mortgagors’ escrow accounts | 16,245 | 17,239 | 12,578 | 17,207 | 17,080 | ||||||||||
| Reserve for unfunded credits | 15,807 | 19,767 | 21,497 | 22,789 | 23,112 | ||||||||||
| Accrued expenses and other liabilities | 201,679 | 189,813 | 254,721 | 227,470 | 199,290 | ||||||||||
| Total liabilities | 10,348,500 | 10,183,612 | 10,022,684 | 10,043,770 | 10,357,419 | ||||||||||
| Stockholders' equity: | |||||||||||||||
| Common stock, $0.01 par value; 200,000,000 shares authorized; 96,998,075 shares issued, 96,998,075 shares issued, 96,998,075 shares issued, 96,998,075 shares issued, and 96,998,075 shares issued, respectively | 970 | 970 | 970 | 970 | 970 | ||||||||||
| Additional paid-in capital | 903,726 | 902,659 | 901,376 | 905,084 | 904,174 | ||||||||||
| Retained earnings | 441,285 | 438,722 | 427,937 | 417,328 | 407,528 | ||||||||||
| Accumulated other comprehensive income | (60,841 | ) | (52,798 | ) | (81,541 | ) | (66,156 | ) | (52,688 | ) | |||||
| Treasury stock, at cost; | |||||||||||||||
| 7,354,399, 7,354,399, 7,350,981, 7,734,891, and 7,734,891 shares, respectively | (90,909 | ) | (90,909 | ) | (90,871 | ) | (94,918 | ) | (94,918 | ) | |||||
| Total stockholders' equity | 1,194,231 | 1,198,644 | 1,157,871 | 1,162,308 | 1,165,066 | ||||||||||
| Total liabilities and stockholders' equity | $ | 11,542,731 | $ | 11,382,256 | $ | 11,180,555 | $ | 11,206,078 | $ | 11,522,485 | |||||
| BROOKLINE BANCORP, INC. AND SUBSIDIARIES | |||||||||||||||
| Consolidated Statements of Income (Unaudited) | |||||||||||||||
| Three Months Ended | |||||||||||||||
| March 31, 2024 | December 31, 2023 | September 30, 2023 | June 30, 2023 | March 31, 2023 | |||||||||||
| (In Thousands Except Share Data) | |||||||||||||||
| Interest and dividend income: | |||||||||||||||
| Loans and leases | $ | 145,265 | $ | 142,948 | $ | 136,561 | $ | 132,299 | $ | 121,931 | |||||
| Debt securities | 6,878 | 6,945 | 6,799 | 8,034 | 7,870 | ||||||||||
| Restricted equity securities | 1,492 | 1,333 | 1,310 | 1,673 | 1,255 | ||||||||||
| Short-term investments | 1,824 | 1,093 | 2,390 | 3,351 | 1,495 | ||||||||||
| Total interest and dividend income | 155,459 | 152,319 | 147,060 | 145,357 | 132,551 | ||||||||||
| Interest expense: | |||||||||||||||
| Deposits | 56,884 | 54,034 | 49,116 | 43,147 | 29,368 | ||||||||||
| Borrowed funds | 16,987 | 14,730 | 13,874 | 16,173 | 17,134 | ||||||||||
| Total interest expense | 73,871 | 68,764 | 62,990 | 59,320 | 46,502 | ||||||||||
| Net interest income | 81,588 | 83,555 | 84,070 | 86,037 | 86,049 | ||||||||||
| Provision for credit losses on loans | 7,423 | 3,851 | 2,947 | 5,726 | 25,344 | ||||||||||
| Provision (credit) for credit losses on investments | (44 | ) | (76 | ) | 84 | 133 | 198 | ||||||||
| Net interest income after provision for credit losses | 74,209 | 79,780 | 81,039 | 80,178 | 60,507 | ||||||||||
| Non-interest income: | |||||||||||||||
| Deposit fees | 2,897 | 3,064 | 3,024 | 2,866 | 2,657 | ||||||||||
| Loan fees | 789 | 515 | 639 | 491 | 391 | ||||||||||
| Loan level derivative income, net | 437 | 778 | 376 | 363 | 2,373 | ||||||||||
| Gain on investment securities, net | — | — | — | 3 | 1,701 | ||||||||||
| Gain on sales of loans and leases held-for-sale | — | 410 | 225 | 308 | 1,638 | ||||||||||
| Other | 2,161 | 3,260 | 1,244 | 1,431 | 4,177 | ||||||||||
| Total non-interest income | 6,284 | 8,027 | 5,508 | 5,462 | 12,937 | ||||||||||
| Non-interest expense: | |||||||||||||||
| Compensation and employee benefits | 36,629 | 35,401 | 33,491 | 33,438 | 36,565 | ||||||||||
| Occupancy | 5,769 | 5,127 | 4,983 | 4,870 | 5,223 | ||||||||||
| Equipment and data processing | 7,031 | 7,245 | 6,766 | 6,531 | 6,462 | ||||||||||
| Professional services | 1,900 | 1,442 | 2,368 | 1,986 | 1,430 | ||||||||||
| FDIC insurance | 1,884 | 1,839 | 2,152 | 2,609 | 1,244 | ||||||||||
| Advertising and marketing | 1,574 | 758 | 1,174 | 1,382 | 1,410 | ||||||||||
| Amortization of identified intangible assets | 1,708 | 1,965 | 1,955 | 1,954 | 1,966 | ||||||||||
| Merger and acquisition expense | — | — | — | 1,002 | 6,409 | ||||||||||
| Other | 4,519 | 5,467 | 4,790 | 4,053 | 4,067 | ||||||||||
| Total non-interest expense | 61,014 | 59,244 | 57,679 | 57,825 | 64,776 | ||||||||||
| Income before provision for income taxes | 19,479 | 28,563 | 28,868 | 27,815 | 8,668 | ||||||||||
| Provision for income taxes | 4,814 | 5,675 | 6,167 | 5,965 | 1,108 | ||||||||||
| Net income | $ | 14,665 | $ | 22,888 | $ | 22,701 | $ | 21,850 | $ | 7,560 | |||||
| Earnings per common share: | |||||||||||||||
| Basic | $ | 0.16 | $ | 0.26 | $ | 0.26 | $ | 0.25 | $ | 0.09 | |||||
| Diluted | $ | 0.16 | $ | 0.26 | $ | 0.26 | $ | 0.25 | $ | 0.09 | |||||
| Weighted average common shares outstanding during the period: | |||||||||||||||
| Basic | 88,894,577 | 88,867,159 | 88,795,270 | 88,665,135 | 86,563,641 | ||||||||||
| Diluted | 89,181,508 | 89,035,505 | 88,971,210 | 88,926,543 | 86,837,806 | ||||||||||
| Dividends paid per common share | $ | 0.135 | $ | 0.135 | $ | 0.135 | $ | 0.135 | $ | 0.135 | |||||
| BROOKLINE BANCORP, INC. AND SUBSIDIARIES | |||||||||||||||
| Asset Quality Analysis (Unaudited) | |||||||||||||||
| At and for the Three Months Ended | |||||||||||||||
| March 31, 2024 | December 31, 2023 | September 30, 2023 | June 30, 2023 | March 31, 2023 | |||||||||||
| (Dollars in Thousands) | |||||||||||||||
| NONPERFORMING ASSETS: | |||||||||||||||
| Loans and leases accounted for on a nonaccrual basis: | |||||||||||||||
| Commercial real estate mortgage | $ | 18,394 | $ | 19,608 | $ | 23,263 | $ | 8,737 | $ | 4,589 | |||||
| Multi-family mortgage | — | — | 1,318 | — | — | ||||||||||
| Construction | — | — | 2,316 | 3,828 | 3,883 | ||||||||||
| Total commercial real estate loans | 18,394 | 19,608 | 26,897 | 12,565 | 8,472 | ||||||||||
| Commercial | 3,096 | 3,886 | 5,406 | 16,023 | 5,495 | ||||||||||
| Equipment financing | 13,668 | 14,984 | 13,974 | 12,809 | 9,908 | ||||||||||
| Condominium association | — | — | — | — | 51 | ||||||||||
| Total commercial loans and leases | 16,764 | 18,870 | 19,380 | 28,832 | 15,454 | ||||||||||
| Residential mortgage | 4,563 | 4,292 | 4,249 | 4,343 | 3,449 | ||||||||||
| Home equity | 950 | 860 | 713 | 583 | 1,079 | ||||||||||
| Other consumer | 1 | — | 2 | — | — | ||||||||||
| Total consumer loans | 5,514 | 5,152 | 4,964 | 4,926 | 4,528 | ||||||||||
| Total nonaccrual loans and leases | 40,672 | 43,630 | 51,241 | 46,323 | 28,454 | ||||||||||
| Other real estate owned | 780 | 780 | — | — | — | ||||||||||
| Other repossessed assets | 1,037 | 914 | 299 | 602 | 508 | ||||||||||
| Total nonperforming assets | $ | 42,489 | $ | 45,324 | $ | 51,540 | $ | 46,925 | $ | 28,962 | |||||
| Loans and leases past due greater than 90 days and still accruing | $ | 363 | $ | 228 | $ | 1,175 | $ | 490 | $ | 726 | |||||
| Nonperforming loans and leases as a percentage of total loans and leases | 0.42 | % | 0.45 | % | 0.55 | % | 0.50 | % | 0.31 | % | |||||
| Nonperforming assets as a percentage of total assets | 0.37 | % | 0.40 | % | 0.46 | % | 0.42 | % | 0.25 | % | |||||
| PROVISION AND ALLOWANCE FOR LOAN AND LEASE LOSSES: | |||||||||||||||
| Allowance for loan and lease losses at beginning of period | $ | 117,522 | $ | 119,081 | $ | 125,817 | $ | 120,865 | $ | 98,482 | |||||
| Charge-offs | (5,390 | ) | (7,722 | ) | (10,978 | ) | (1,690 | ) | (845 | ) | |||||
| Recoveries | 309 | 581 | 4 | 593 | 394 | ||||||||||
| Net charge-offs | (5,081 | ) | (7,141 | ) | (10,974 | ) | (1,097 | ) | (451 | ) | |||||
| Provision for loan and lease losses excluding unfunded commitments * | 7,683 | 5,582 | 4,238 | 6,049 | 22,834 | ||||||||||
| Allowance for loan and lease losses at end of period | $ | 120,124 | $ | 117,522 | $ | 119,081 | $ | 125,817 | $ | 120,865 | |||||
| Allowance for loan and lease losses as a percentage of total loans and leases | 1.24 | % | 1.22 | % | 1.27 | % | 1.35 | % | 1.31 | % | |||||
| NET CHARGE-OFFS: | |||||||||||||||
| Commercial real estate loans | $ | 606 | $ | 1,087 | $ | (3 | ) | $ | (6 | ) | $ | (6 | ) | ||
| Commercial loans and leases ** | 8,179 | 6,061 | 10,958 | 1,108 | 457 | ||||||||||
| Consumer loans | (4 | ) | (7 | ) | 19 | (5 | ) | — | |||||||
| Total net charge-offs | $ | 8,781 | $ | 7,141 | $ | 10,974 | $ | 1,097 | $ | 451 | |||||
| Net loan and lease charge-offs as a percentage of average loans and leases (annualized) | 0.36 | % | 0.30 | % | 0.47 | % | 0.05 | % | 0.02 | % | |||||
| *Provision for loan and lease losses does not include (credit) provision of $(0.3 million), $(1.7 million), $(1.3 million), $(0.3 million), and $2.5 million for credit losses on unfunded commitments during the three months ended March 31, 2024, December 31, 2023, September 30, 2023, June 30, 2023, and March 31, 2023, respectively. | |||||||||||||||
| ** The balance at March 31, 2024 includes a $3.7 million charge-off on a letter of credit which impacted the provision. | |||||||||||||||
| BROOKLINE BANCORP, INC. AND SUBSIDIARIES | |||||||||||||||||||||||
| Average Yields / Costs (Unaudited) | |||||||||||||||||||||||
| Three Months Ended | |||||||||||||||||||||||
| March 31, 2024 | December 31, 2023 | March 31, 2023 | |||||||||||||||||||||
| Average Balance | Interest (1) | Average Yield/ Cost | Average Balance | Interest (1) | Average Yield/ Cost | Average Balance | Interest (1) | Average Yield/ Cost | |||||||||||||||
| (Dollars in Thousands) | |||||||||||||||||||||||
| Assets: | |||||||||||||||||||||||
| Interest-earning assets: | |||||||||||||||||||||||
| Investments: | |||||||||||||||||||||||
| Debt securities (2) | $ | 893,228 | $ | 6,927 | 3.10 | % | $ | 876,350 | $ | 6,986 | 3.19 | % | $ | 1,029,068 | $ | 7,974 | 3.10 | % | |||||
| Restricted equity securities (2) | 76,335 | 1,493 | 7.82 | % | 67,567 | 1,334 | 7.90 | % | 76,911 | 1,255 | 6.53 | % | |||||||||||
| Short-term investments | 130,768 | 1,824 | 5.58 | % | 85,790 | 1,093 | 5.09 | % | 147,654 | 1,495 | 4.05 | % | |||||||||||
| Total investments | 1,100,331 | 10,244 | 3.72 | % | 1,029,707 | 9,413 | 3.66 | % | 1,253,633 | 10,724 | 3.42 | % | |||||||||||
| Loans and Leases: | |||||||||||||||||||||||
| Commercial real estate loans (3) | 5,761,735 | 81,049 | 5.56 | % | 5,727,930 | 81,653 | 5.58 | % | 5,579,977 | 67,667 | 4.85 | % | |||||||||||
| Commercial loans (3) | 1,026,467 | 17,507 | 6.75 | % | 969,603 | 16,296 | 6.58 | % | 892,522 | 14,017 | 6.28 | % | |||||||||||
| Equipment financing (3) | 1,374,426 | 26,895 | 7.83 | % | 1,347,589 | 25,211 | 7.48 | % | 1,226,717 | 21,213 | 6.92 | % | |||||||||||
| Consumer loans (3) | 1,482,819 | 19,978 | 5.40 | % | 1,475,580 | 19,888 | 5.37 | % | 1,452,072 | 19,070 | 5.28 | % | |||||||||||
| Total loans and leases | 9,645,447 | 145,429 | 6.03 | % | 9,520,702 | 143,048 | 6.01 | % | 9,151,288 | 121,967 | 5.33 | % | |||||||||||
| Total interest-earning assets | 10,745,778 | 155,673 | 5.79 | % | 10,550,409 | 152,461 | 5.78 | % | 10,404,921 | 132,691 | 5.10 | % | |||||||||||
| Non-interest-earning assets | 671,407 | 721,532 | 726,166 | ||||||||||||||||||||
| Total assets | $ | 11,417,185 | $ | 11,271,941 | $ | 11,131,087 | |||||||||||||||||
| Liabilities and Stockholders' Equity: | |||||||||||||||||||||||
| Interest-bearing liabilities: | |||||||||||||||||||||||
| Deposits: | |||||||||||||||||||||||
| NOW accounts | $ | 671,914 | 1,261 | 0.75 | % | $ | 657,134 | 1,146 | 0.69 | % | $ | 810,333 | 901 | 0.45 | % | ||||||||
| Savings accounts | 1,694,220 | 11,352 | 2.69 | % | 1,658,144 | 10,684 | 2.56 | % | 1,160,003 | 2,514 | 0.88 | % | |||||||||||
| Money market accounts | 2,076,303 | 15,954 | 3.09 | % | 2,140,225 | 16,239 | 3.01 | % | 2,366,235 | 12,140 | 2.08 | % | |||||||||||
| Certificates of deposit | 1,624,118 | 16,672 | 4.13 | % | 1,530,772 | 14,517 | 3.76 | % | 1,346,761 | 7,456 | 2.25 | % | |||||||||||
| Brokered deposit accounts | 896,784 | 11,645 | 5.22 | % | 880,604 | 11,448 | 5.16 | % | 534,527 | 6,357 | 4.82 | % | |||||||||||
| Total interest-bearing deposits | 6,963,339 | 56,884 | 3.29 | % | 6,866,879 | 54,034 | 3.12 | % | 6,217,859 | 29,368 | 1.92 | % | |||||||||||
| Borrowings | |||||||||||||||||||||||
| Advances from the FHLB | 1,164,534 | 14,633 | 4.97 | % | 965,846 | 11,943 | 4.84 | % | 1,264,523 | 14,531 | 4.60 | % | |||||||||||
| Subordinated debentures and notes | 84,206 | 1,377 | 6.54 | % | 84,170 | 1,381 | 6.56 | % | 84,062 | 1,354 | 6.44 | % | |||||||||||
| Other borrowed funds | 93,060 | 977 | 4.22 | % | 136,566 | 1,406 | 4.09 | % | 158,499 | 1,249 | 3.20 | % | |||||||||||
| Total borrowings | 1,341,800 | 16,987 | 5.01 | % | 1,186,582 | 14,730 | 4.86 | % | 1,507,084 | 17,134 | 4.55 | % | |||||||||||
| Total interest-bearing liabilities | 8,305,139 | 73,871 | 3.58 | % | 8,053,461 | 68,764 | 3.39 | % | 7,724,943 | 46,502 | 2.44 | % | |||||||||||
| Non-interest-bearing liabilities: | |||||||||||||||||||||||
| Demand checking accounts | 1,631,472 | 1,723,849 | 1,930,162 | ||||||||||||||||||||
| Other non-interest-bearing liabilities | 278,670 | 323,855 | 316,347 | ||||||||||||||||||||
| Total liabilities | 10,215,281 | 10,101,165 | 9,971,452 | ||||||||||||||||||||
| Stockholders’ equity | 1,201,904 | 1,170,776 | 1,159,635 | ||||||||||||||||||||
| Total liabilities and equity | $ | 11,417,185 | $ | 11,271,941 | $ | 11,131,087 | |||||||||||||||||
| Net interest income (tax-equivalent basis) /Interest-rate spread (4) | 81,802 | 2.21 | % | 83,697 | 2.39 | % | 86,189 | 2.66 | % | ||||||||||||||
| Less adjustment of tax-exempt income | 214 | 142 | 140 | ||||||||||||||||||||
| Net interest income | $ | 81,588 | $ | 83,555 | $ | 86,049 | |||||||||||||||||
| Net interest margin (5) | 3.06 | % | 3.15 | % | 3.36 | % | |||||||||||||||||
| (1) Tax-exempt income on debt securities, equity securities and revenue bonds included in commercial real estate loans is included on a tax-equivalent basis. | |||||||||||||||||||||||
| (2) Average balances include unrealized gains (losses) on investment securities. Dividend payments may not be consistent and average yield on equity securities may vary from month to month. | |||||||||||||||||||||||
| (3) Loans on nonaccrual status are included in the average balances. | |||||||||||||||||||||||
| (4) Interest rate spread represents the difference between the yield on interest-earning assets and the cost of interest-bearing liabilities. | |||||||||||||||||||||||
| (5) Net interest margin represents net interest income (tax-equivalent basis) divided by average interest-earning assets on an actual/actual basis. | |||||||||||||||||||||||
| BROOKLINE BANCORP, INC. AND SUBSIDIARIES | |||||||||||||||
| Non-GAAP Financial Information (Unaudited) | |||||||||||||||
| Three Months Ended March 31, | |||||||||||||||
| 2024 | 2023 | ||||||||||||||
| Reconciliation Table - Non-GAAP Financial Information | (Dollars in Thousands Except Share Data) | ||||||||||||||
| Reported Pretax Income | $ | 19,479 | $ | 8,668 | |||||||||||
| Less: | |||||||||||||||
| Security gains | — | 1,701 | |||||||||||||
| Add: | |||||||||||||||
| Day 1 PCSB CECL provision | — | 16,744 | |||||||||||||
| Merger and acquisition expense | — | 6,409 | |||||||||||||
| Operating Pretax Income | $ | 19,479 | $ | 30,120 | |||||||||||
| Effective tax rate | 24.7 | % | 22.7 | % | |||||||||||
| Provision for income taxes | 4,814 | 6,837 | |||||||||||||
| Operating earnings after tax | $ | 14,665 | $ | 23,283 | |||||||||||
| Operating earnings per common share: | |||||||||||||||
| Basic | $ | 0.16 | $ | 0.27 | |||||||||||
| Diluted | $ | 0.16 | $ | 0.27 | |||||||||||
| Weighted average common shares outstanding during the period: | |||||||||||||||
| Basic | 88,894,577 | 86,563,641 | |||||||||||||
| Diluted | 89,181,508 | 86,837,806 | |||||||||||||
| Return on average assets * | 0.51 | % | 0.27 | % | |||||||||||
| Less: | |||||||||||||||
| Security gains (after-tax) * | — | % | 0.05 | % | |||||||||||
| Add: | |||||||||||||||
| Day 1 PCSB CECL provision (after-tax) * | — | % | 0.47 | % | |||||||||||
| Merger and acquisition expense (after-tax) * | — | % | 0.18 | % | |||||||||||
| Operating return on average assets * | 0.51 | % | 0.87 | % | |||||||||||
| Return on average tangible assets * | 0.53 | % | 0.28 | % | |||||||||||
| Less: | |||||||||||||||
| Security gains (after-tax) * | — | % | 0.05 | % | |||||||||||
| Add: | |||||||||||||||
| Day 1 PCSB CECL provision (after-tax) * | — | % | 0.48 | % | |||||||||||
| Merger and acquisition expense (after-tax) * | — | % | 0.18 | % | |||||||||||
| Operating return on average tangible assets * | 0.53 | % | 0.89 | % | |||||||||||
| Return on average stockholders' equity * | 4.88 | % | 2.61 | % | |||||||||||
| Less: | |||||||||||||||
| Security gains (after-tax) * | — | % | 0.45 | % | |||||||||||
| Add: | |||||||||||||||
| Day 1 PCSB CECL provision (after-tax) * | — | % | 4.46 | % | |||||||||||
| Merger and acquisition expense (after-tax) * | — | % | 1.71 | % | |||||||||||
| Operating return on average stockholders' equity * | 4.88 | % | 8.33 | % | |||||||||||
| Return on average tangible stockholders' equity * | 6.26 | % | 3.43 | % | |||||||||||
| Less: | |||||||||||||||
| Security gains (after-tax) * | — | % | 0.60 | % | |||||||||||
| Add: | |||||||||||||||
| Day 1 PCSB CECL provision (after-tax) * | — | % | 5.87 | % | |||||||||||
| Merger and acquisition expense (after-tax) * | — | % | 2.25 | % | |||||||||||
| Operating return on average tangible stockholders' equity * | 6.26 | % | 10.95 | % | |||||||||||
| * Ratios at and for the three months ended are annualized. | |||||||||||||||
| At and for the Three Months Ended | |||||||||||||||
| March 31, 2024 | December 31, 2023 | September 30, 2023 | June 30, 2023 | March 31, 2023 | |||||||||||
| (Dollars in Thousands) | |||||||||||||||
| Net income, as reported | $ | 14,665 | $ | 22,888 | $ | 22,701 | $ | 21,850 | $ | 7,560 | |||||
| Average total assets | $ | 11,417,185 | $ | 11,271,941 | $ | 11,180,635 | $ | 11,272,672 | $ | 11,131,087 | |||||
| Less: Average goodwill and average identified intangible assets, net | 264,536 | 266,225 | 268,199 | 270,147 | 278,135 | ||||||||||
| Average tangible assets | $ | 11,152,649 | $ | 11,005,716 | $ | 10,912,436 | $ | 11,002,525 | $ | 10,852,952 | |||||
| Return on average tangible assets (annualized) | 0.53 | % | 0.83 | % | 0.83 | % | 0.79 | % | 0.28 | % | |||||
| Average total stockholders’ equity | $ | 1,201,904 | $ | 1,170,776 | $ | 1,167,727 | $ | 1,174,167 | $ | 1,159,635 | |||||
| Less: Average goodwill and average identified intangible assets, net | 264,536 | 266,225 | 268,199 | 270,147 | 278,135 | ||||||||||
| Average tangible stockholders’ equity | $ | 937,368 | $ | 904,551 | $ | 899,528 | $ | 904,020 | $ | 881,500 | |||||
| Return on average tangible stockholders’ equity (annualized) | 6.26 | % | 10.12 | % | 10.09 | % | 9.67 | % | 3.43 | % | |||||
| Total stockholders’ equity | $ | 1,194,231 | $ | 1,198,644 | $ | 1,157,871 | $ | 1,162,308 | $ | 1,165,066 | |||||
| Less: | |||||||||||||||
| Goodwill | 241,222 | 241,222 | 241,222 | 241,222 | 241,222 | ||||||||||
| Identified intangible assets, net | 22,499 | 24,207 | 26,172 | 28,126 | 30,080 | ||||||||||
| Tangible stockholders' equity | $ | 930,510 | $ | 933,215 | $ | 890,477 | $ | 892,960 | $ | 893,764 | |||||
| Total assets | $ | 11,542,731 | $ | 11,382,256 | $ | 11,180,555 | $ | 11,206,078 | $ | 11,522,485 | |||||
| Less: | |||||||||||||||
| Goodwill | 241,222 | 241,222 | 241,222 | 241,222 | 241,222 | ||||||||||
| Identified intangible assets, net | 22,499 | 24,207 | 26,172 | 28,126 | 30,080 | ||||||||||
| Tangible assets | $ | 11,279,010 | $ | 11,116,827 | $ | 10,913,161 | $ | 10,936,730 | $ | 11,251,183 | |||||
| Tangible stockholders’ equity to tangible assets | 8.25 | % | 8.39 | % | 8.16 | % | 8.16 | % | 7.94 | % | |||||
| Tangible stockholders' equity | $ | 930,510 | $ | 933,215 | $ | 890,477 | $ | 892,960 | $ | 893,764 | |||||
| Number of common shares issued | 96,998,075 | 96,998,075 | 96,998,075 | 96,998,075 | 96,998,075 | ||||||||||
| Less: | |||||||||||||||
| Treasury shares | 7,354,399 | 7,354,399 | 7,350,981 | 7,734,891 | 7,734,891 | ||||||||||
| Unvested restricted shares | 749,099 | 749,099 | 780,859 | 598,049 | 598,049 | ||||||||||
| Number of common shares outstanding | 88,894,577 | 88,894,577 | 88,866,235 | 88,665,135 | 88,665,135 | ||||||||||
| Tangible book value per common share | $ | 10.47 | $ | 10.50 | $ | 10.02 | $ | 10.07 | $ | 10.08 | |||||
PDF available: http://ml.globenewswire.com/Resource/Download/81402621-8c44-400b-8185-4cc49db48cb6
Exhibit 99.2
April 25, 2024 1 1Q 2024 Financial Results
Forward Looking Statements 2 Certain statements contained in this press release that are not historical facts may constitute forward - looking statements within the meaning of Section 27A of the Securities Act of 1933, as amended, and Section 21E of the Securities Exchange Act of 1934, as amended, and are intended to be covered by the safe harbor provisions of the Private Securities Litigation Reform Act of 1995. We may also make forward - looking statements in other documents we file with the Securities and Exchange Commission ("SEC"), in our annual reports to shareholders, in press releases and other written materials, and in oral statements made by our officers, directors or employees. You can identify forward looking statements by the use of the words “believe,” “expect,” “anticipate,” “intend,” “estimate,” “assume,” “outlook,” “will,” “should,” and other expressions that predict or indicate future events and trends and which do not relate to historical matters, including statements regarding the Company’s business, credit quality, financial condition, liquidity and results of operations. Forward - looking statements may differ, possibly materially, from what is included in this press release due to factors and future developments that are uncertain and beyond the scope of the Company’s control. These include, but are not limited to, changes in interest rates; general economic conditions (including inflation and concerns about liquidity) on a national basis or in the local markets in which the Company operates; turbulence in the capital and debt markets; competitive pressures from other financial institutions; changes in consumer behavior due to changing political, business and economic conditions, or legislative or regulatory initiatives; changes in the value of securities and other assets in the Company’s investment portfolio; increases in loan and lease default and charge - off rates; the adequacy of allowances for loan and lease losses; decreases in deposit levels that necessitate increases in borrowing to fund loans and investments; operational risks including, but not limited to, cybersecurity incidents, fraud, natural disasters, and future pandemics; changes in regulation; the possibility that future credit losses may be higher than currently expected due to changes in economic assumptions and adverse economic developments; the risk that goodwill and intangibles recorded in the Company’s financial statements will become impaired; and changes in assumptions used in making such forward - looking statements. Forward - looking statements involve risks and uncertainties which are difficult to predict. The Company’s actual results could differ materially from those projected in the forward - looking statements as a result of, among others, the risks outlined in the Company’s Annual Report on Form 10 - K, as updated by its Quarterly Reports on Form 10 - Q and other filings submitted to the SEC. The Company does not undertake any obligation to update any forward - looking statement to reflect circumstances or events that occur after the date the forward - looking statements are made.
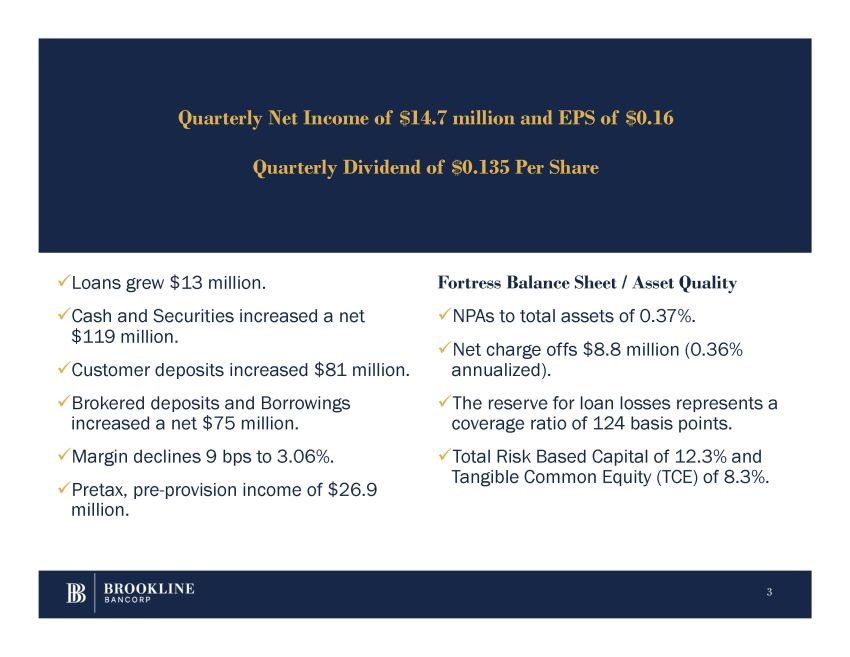
x Loans grew $13 million. x Cash and Securities increased a net $119 million. x Customer deposits increased $81 million. x Brokered deposits and Borrowings increased a net $75 million. x Margin declines 9 bps to 3.06%. x Pretax, pre - provision income of $26.9 million. 3 Fortress Balance Sheet / Asset Quality x NPAs to total assets of 0.37%. x Net charge offs $8.8 million (0.36% annualized). x The reserve for loan losses represents a coverage ratio of 124 basis points. x Total Risk Based Capital of 12.3% and Tangible Common Equity (TCE) of 8.3%. Quarterly Net Income of $14.7 million and EPS of $0.16 Quarterly Dividend of $0.135 Per Share
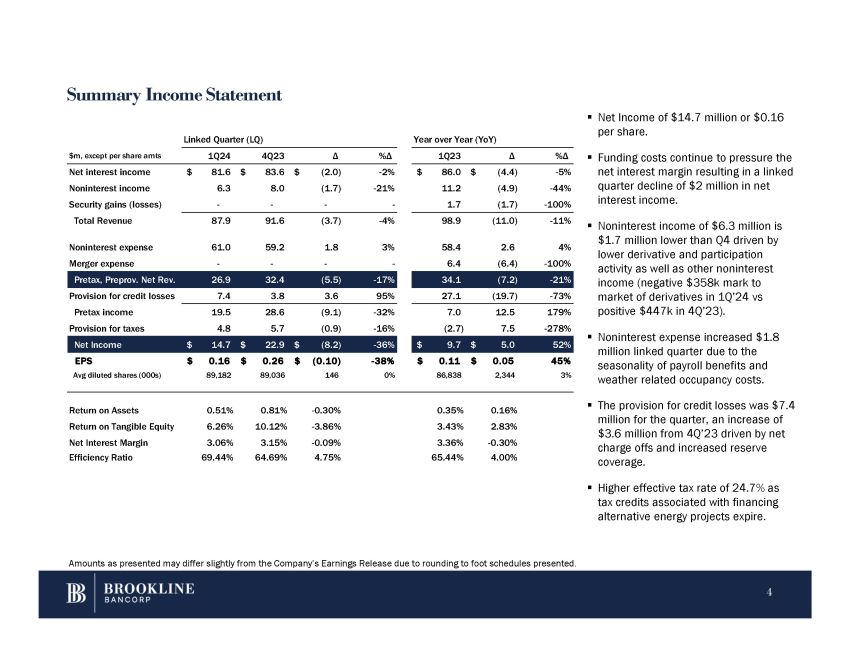
Summary Income Statement ▪ Net Income of $14.7 million or $0.16 per share. ▪ Funding costs continue to pressure the net interest margin resulting in a linked quarter decline of $2 million in net interest income. ▪ Noninterest income of $6.3 million is $1.7 million lower than Q4 driven by lower derivative and participation activity as well as other noninterest income (negative $358k mark to market of derivatives in 1Q’24 vs positive $447k in 4Q’23). 179% 12.5 7.0 - 32% (9.1) 28.6 19.5 Pretax income - 278% 7.5 (2.7) - 16% (0.9) 5.7 4.8 Provision for taxes ▪ 52% $ 5.0 $ 9.7 - 36% $ (8.2) $ 22.9 $ 14.7 Net Income 45% $ 0.05 $ 0.11 - 38% $ (0.10) $ 0.26 $ 0.16 EPS 3% 2,344 86,838 0% 146 89,036 89,182 Avg diluted shares (000s) ▪ 0.16% 0.35% - 0.30% 0.81% 0.51% Return on Assets 2.83% 3.43% - 3.86% 10.12% 6.26% Return on Tangible Equity - 0.30% 3.36% - 0.09% 3.15% 3.06% Net Interest Margin 4.00% 65.44% 4.75% 64.69% 69.44% Efficiency Ratio ▪ Noninterest expense increased $1.8 million linked quarter due to the seasonality of payroll benefits and weather related occupancy costs. The provision for credit losses was $7.4 million for the quarter, an increase of $3.6 million from 4Q’23 driven by net charge offs and increased reserve coverage. Higher effective tax rate of 24 . 7 % as tax credits associated with financing alternative energy projects expire . %Δ Δ 1Q23 %Δ Δ 4Q23 1Q24 $m, except per share amts - 5% $ (4.4) $ 86.0 - 2% $ (2.0) $ 83.6 $ 81.6 Net interest income - 44% (4.9) 11.2 - 21% (1.7) 8.0 6.3 Noninterest income - 100% (1.7) 1.7 - - - Security gains (losses) - - 11% (11.0) 98.9 - 4% (3.7) 91.6 Total Revenue 87.9 4% 2.6 58.4 3% 1.8 59.2 Noninterest expense 61.0 - 100% (6.4) 6.4 - - - Merger expense - - 21% (7.2) 34.1 - 17% (5.5) 32.4 Pretax, Preprov. Net Rev. 26.9 Provision for credit losses 7.4 3.8 3.6 95% 27.1 (19.7) - 73% Linked Quarter (LQ) Year over Year (YoY) Amounts as presented may differ slightly from the Company’s Earnings Release due to rounding to foot schedules presented. 4
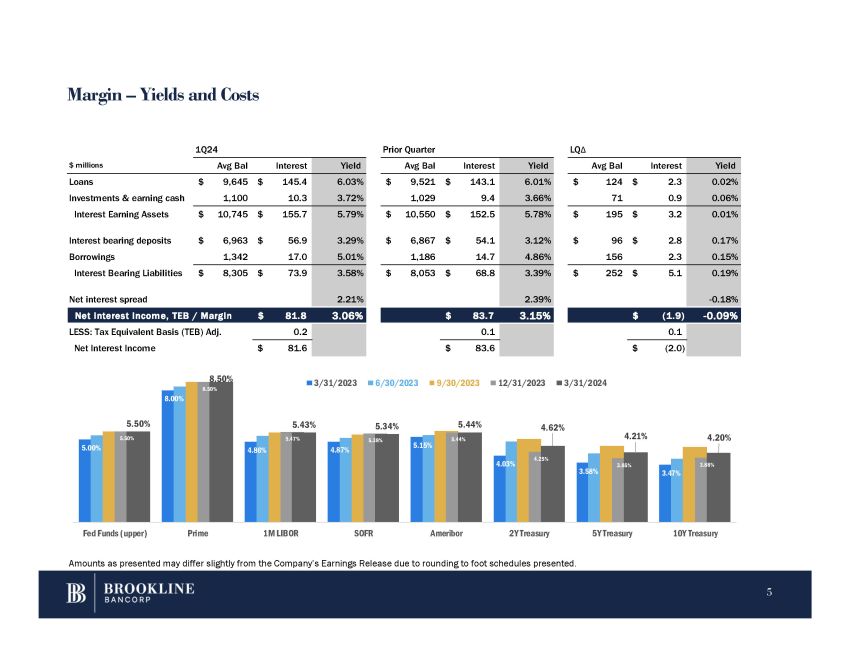
Margin – Yields and Costs LQ Δ Prior Quarter 1Q24 Yield Interest Avg Bal Yield Interest Avg Bal Yield Interest Avg Bal $ millions 0.02% $ 2.3 $ 124 6.01% $ 143.1 $ 9,521 6.03% $ 145.4 $ 9,645 Loans 0.06% 0.9 71 3.66% 9.4 1,029 3.72% 10.3 1,100 Investments & earning cash 0.01% $ 3.2 $ 195 5.78% $ 152.5 $ 10,550 5.79% $ 155.7 $ 10,745 Interest Earning Assets 0.17% $ 2.8 $ 96 3.12% $ 54.1 $ 6,867 3.29% $ 56.9 $ 6,963 Interest bearing deposits 0.15% 2.3 156 4.86% 14.7 1,186 5.01% 17.0 1,342 Borrowings 0.19% $ 5.1 $ 252 3.39% $ 68.8 $ 8,053 3.58% $ 73.9 $ 8,305 Interest Bearing Liabilities - 0.18% 2.39% 2.21% Net interest spread - 0.09% $ (1.9) 3.15% $ 83.7 3.06% $ 81.8 Net interest income, TEB / Margin 0.1 0.1 0.2 LESS: Tax Equivalent Basis (TEB) Adj. (2.0) $ 83.6 $ 81.6 $ Net Interest Income 5.00% 8.00% 4.86% 4.87% 5.15% 4.03% 3.58 % 3.4 7% % 5.50 % 8.50 5.47 % 5.3 8% 5.44% 4.25% 3.8 5% 3.8 8% 5.50% 8.50% 5.43% 5.34% 5.44% 4.62% 4.21% 4.20% Fed Funds (upper) Prime 1M LIBOR SOFR Ameribor 2Y Treasury 5Y Treasury 10Y Treasury 3/31/2023 6/30/2023 9/30/2023 12/31/2023 3/31/2024 Amounts as presented may differ slightly from the Company’s Earnings Release due to rounding to foot schedules presented. 5
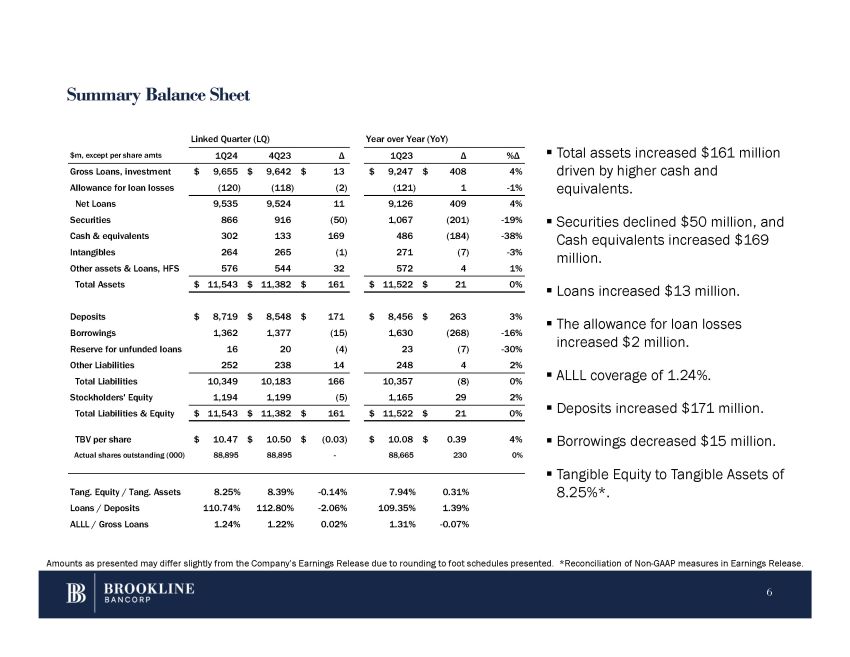
Summary Balance Sheet 61 million ▪ Total assets increased $1 %Δ Δ 1Q23 Δ 4Q23 1Q24 $m, except per share amts driven by higher cash and 4% $ 408 $ 9,247 $ 13 $ 9,642 $ 9,655 Gross Loans, investment equivalents. - 1% 1 (121) (2) (118) (120) Allowance for loan losses 4% 409 9,126 11 9,524 9,535 Net Loans ▪ Securities declined $50 million, and Cash equivalents increased $169 million. ▪ Loans increased $13 million. ▪ The allowance for loan losses increased $2 million. ▪ ALLL coverage of 1.24%. ▪ Deposits increased $171 million. ▪ Borrowings decreased $15 million. ▪ Tangible Equity to Tangible Assets of 8.25%*. 0.31% 7.94% - 0.14% 8.39% 8.25% Tang. Equity / Tang. Assets 1.39% 109.35% - 2.06% 112.80% 110.74% Loans / Deposits - 0.07% 1.31% 0.02% 1.22% 1.24% ALLL / Gross Loans - 19% (201) 1,067 (50) 916 866 Securities - 38% (184) 486 169 133 302 Cash & equivalents - 3% (7) 271 (1) 265 264 Intangibles 1% 0% 4 $ 21 572 $ 11,522 32 $ 161 544 $ 11,382 576 $ 11,543 Other assets & Loans, HFS Total Assets 3% $ 263 $ 8,456 $ 171 $ 8,548 $ 8,719 Deposits - 16% (268) 1,630 (15) 1,377 1,362 Borrowings - 30% (7) 23 (4) 20 16 Reserve for unfunded loans 2% 4 248 14 238 252 Other Liabilities 0% (8) 10,357 166 10,183 10,349 Total Liabilities 2% 29 1,165 (5) 1,199 1,194 Stockholders' Equity 0% $ 21 $ 11,522 $ 161 $ 11,382 $ 11,543 Total Liabilities & Equity 4% $ 0.39 $ 10.08 $ (0.03) $ 10.50 $ 10.47 TBV per share 0% 230 88,665 - 88,895 88,895 Actual shares outstanding (000) Linked Quarter (LQ) Year over Year (YoY) Amounts as presented may differ slightly from the Company’s Earnings Release due to rounding to foot schedules presented. *Reconciliation of Non - GAAP measures in Earnings Release. 6
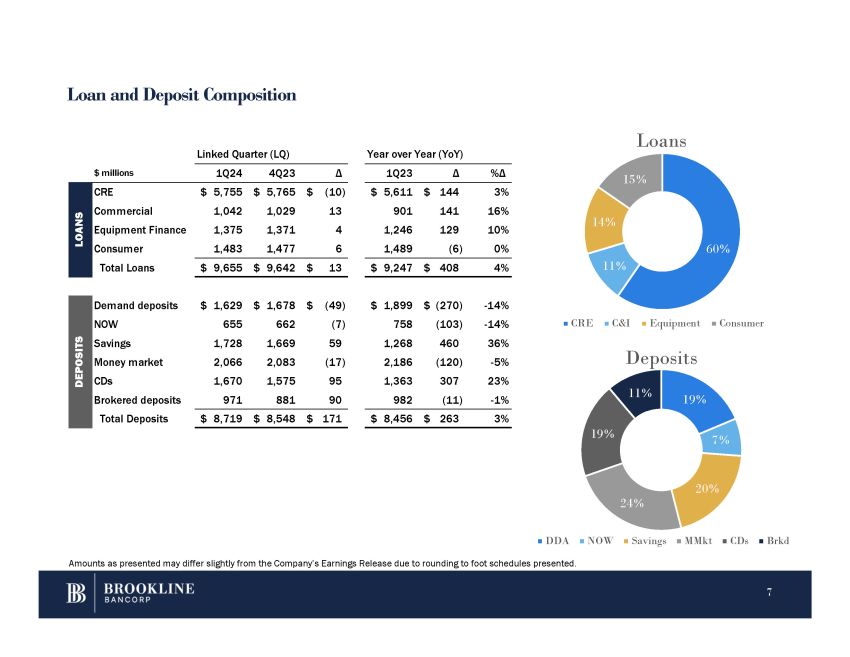
Loan and Deposit Composition 15% 14% 60% 11% Loans 19% 7% 20% 24% 19% 11% CRE C&I Equipment Consumer Deposits DDA NOW Savings MMkt CDs Brkd Amounts as presented may differ slightly from the Company’s Earnings Release due to rounding to foot schedules presented. %Δ Δ 1Q23 Δ 4Q23 1Q24 $ millions 3% $ 144 $ 5,611 $ (10) $ 5,765 $ 5,755 CRE 16% 141 901 13 1,029 1,042 Commercial S 10% 129 1,246 4 1,371 1,375 Equipment Finance OA N 0% (6) 1,489 6 1,477 1,483 Consumer L Total Loans $ 9,655 $ 9,642 $ 13 $ 9,247 $ 408 4% Demand deposits NOW Savings Money market CDs Brokered deposits Total Deposits $ 1,629 655 1,728 2,066 1,670 971 $ 1,678 $ (49) 662 (7) 1,669 59 2,083 (17) 1,575 95 881 90 $ 1,899 758 1,268 2,186 1,363 982 $ (270) - 14% (103) - 14% 460 36% (120) - 5% 307 23% (11) - 1% $ 8,719 $ 8,548 $ 171 $ 8,456 $ 263 3% Linked Quarter (LQ) Year over Year (YoY) DEPOSITS 7
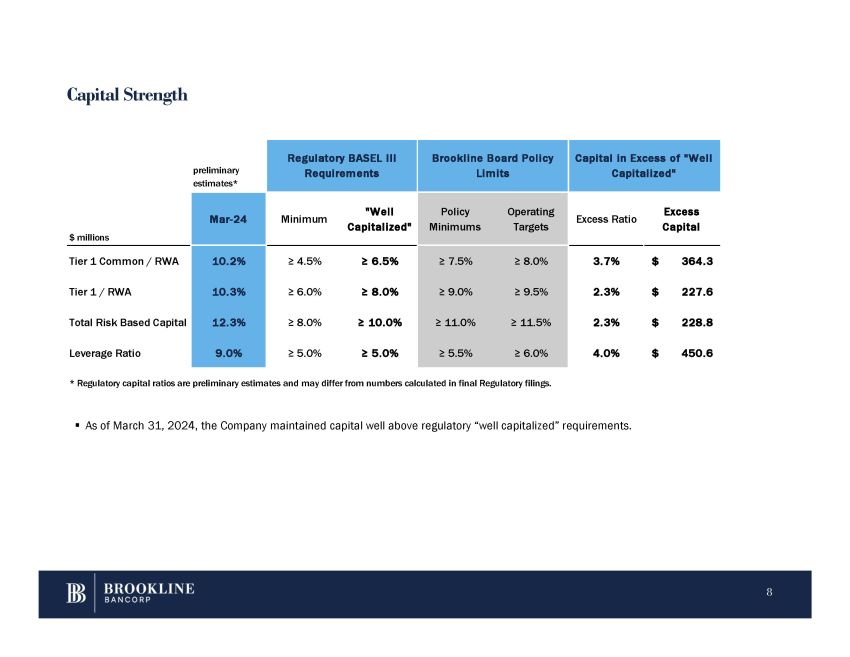
Capital Strength 8 ▪ As of March 31, 2024, the Company maintained capital well above regulatory “well capitalized” requirements. Capital in Excess of "Well Capitalized" Brookline Board Policy Limits Regulatory BASEL III Requirements preliminary estimates* Excess Capital Excess Ratio Operating Targets Policy Minimums "Well Capitalized" Minimum Mar - 24 $ millions $ 364.3 3.7% ≥ 8.0% ≥ 7.5% ≥ 6.5% ≥ 4.5% 10.2% Tier 1 Common / RWA $ 227.6 2.3% ≥ 9.5% ≥ 9.0% ≥ 8.0% ≥ 6.0% 10.3% Tier 1 / RWA $ 228.8 2.3% ≥ 11.5% ≥ 11.0% ≥ 10.0% ≥ 8.0% 12.3% Total Risk Based Capital $ 450.6 4.0% ≥ 6.0% ≥ 5.5% ≥ 5.0% ≥ 5.0% 9.0% Leverage Ratio * Regulatory capital ratios are preliminary estimates and may differ from numbers calculated in final Regulatory filings.
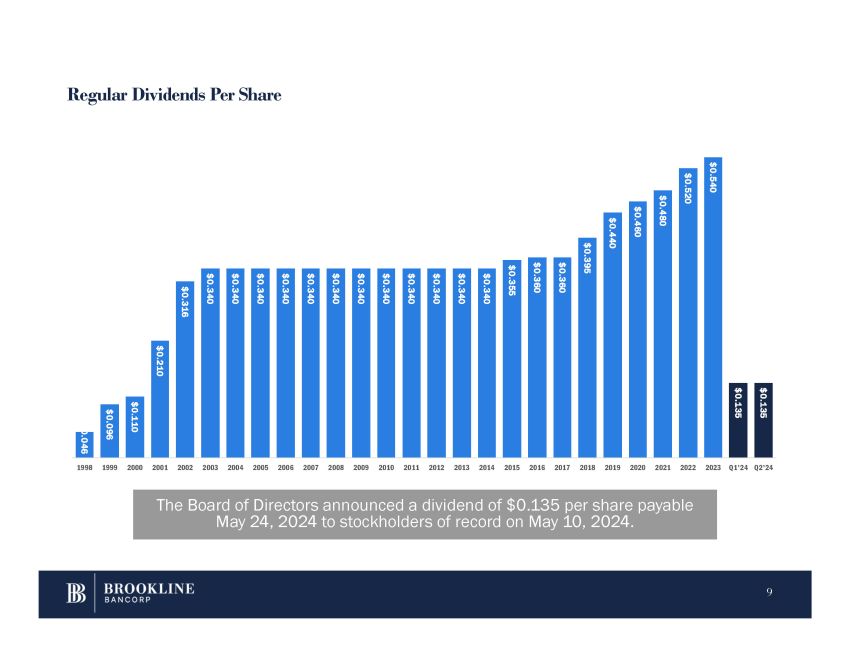
Regular Dividends Per Share The Board of Directors announced a dividend of $0.135 per share payable May 24, 2024 to stockholders of record on May 10, 2024. $0.046 9 $0.096 $0.110 $0.210 $0.316 $0.340 $0.340 $0.340 $0.340 $0.340 $0.340 $0.340 $0.340 $0.340 $0.340 $0.340 $0.340 $0.355 $0.360 $0.360 $0.395 $0.440 $0.460 $0.480 $0.520 $0.540 $0.135 $0.135 1998 1999 2000 2001 2002 2003 2004 2005 2006 2007 2008 2009 2010 2011 2012 2013 2014 2015 2016 2017 2018 2019 2020 2021 2022 2023 Q1'24 Q2'24

QUESTIONS Paul A. Perrault, Chairman and Chief Executive Officer Carl M. Carlson, Co - President, Chief Financial and Strategy Officer Thank You. 10
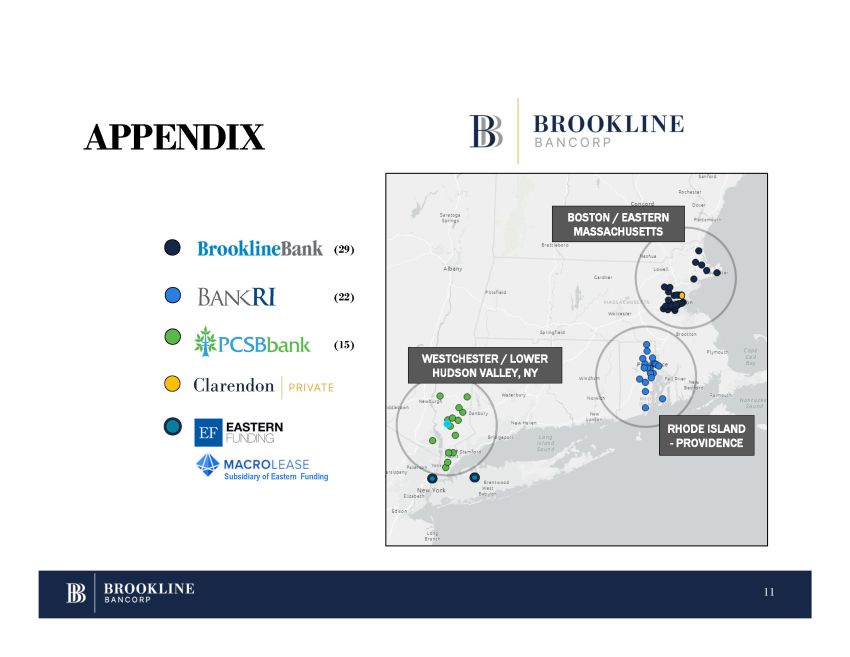
APPENDIX RHODE ISLAND - PROVIDENCE BOSTON / EASTERN MASSACHUSETTS (15) WESTCHESTER / LOWER HUDSON VALLEY, NY (29) (22) Subsidiary of Eastern Funding 11
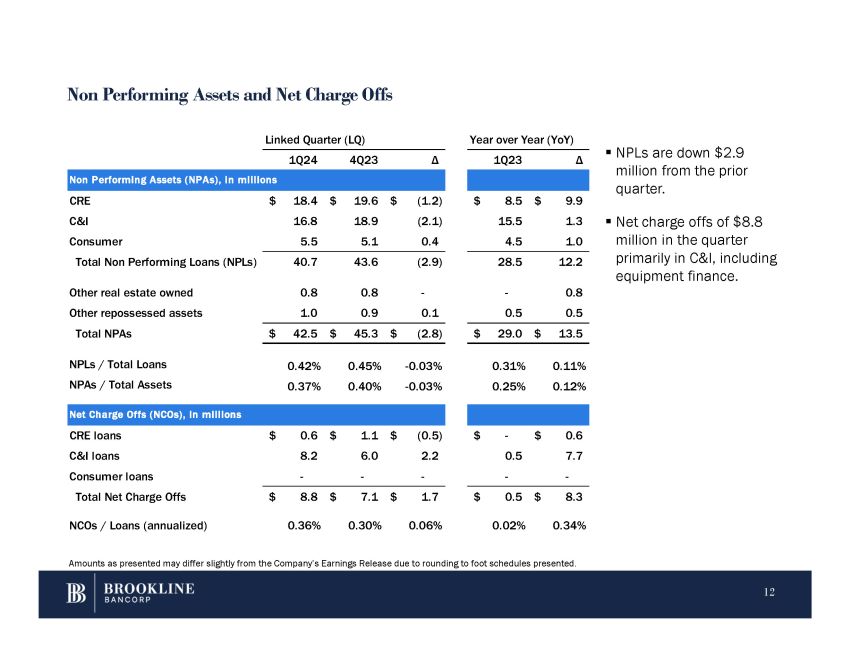
Non Performing Assets and Net Charge Offs Linked Quarter (LQ) 1Q24 4Q23 Δ Year over Year (YoY) 1Q23 Δ Non Performing Assets (NPAs), in millions Amounts as presented may differ slightly from the Company’s Earnings Release due to rounding to foot schedules presented. 12 ▪ NPLs are down $ 2 . 9 million from the prior quarter . $ 9.9 $ 8.5 $ (1.2) $ 19.6 $ 18.4 CRE ▪ Net charge offs of $8.8 1.3 15.5 (2.1) 18.9 16.8 C&I million in the quarter 1.0 4.5 0.4 5.1 5.5 Consumer primarily in C&I, includin equipment finance. 12.2 28.5 (2.9) 43.6 Total Non Performing Loans (NPLs) 40.7 0.8 - - 0.8 Other real estate owned 0.8 0.5 0.5 0.1 0.9 Other repossessed assets 1.0 $ 13.5 $ 29.0 $ (2.8) $ 45.3 Total NPAs $ 42.5 0.11% 0.31% - 0.03% 0.45% NPLs / Total Loans 0.42% 0.12% 0.25% - 0.03% 0.40% NPAs / Total Assets 0.37% Net Charge Offs (NCOs), in millions $ 0.6 $ - $ (0.5) $ 1.1 $ 0.6 CRE loans 7.7 0.5 2.2 6.0 8.2 C&I loans - - - - - Consumer loans $ 8.3 $ 0.5 $ 1.7 $ 7.1 $ 8.8 Total Net Charge Offs 0.34% 0.02% 0.06% 0.30% 0.36% NCOs / Loans (annualized) g
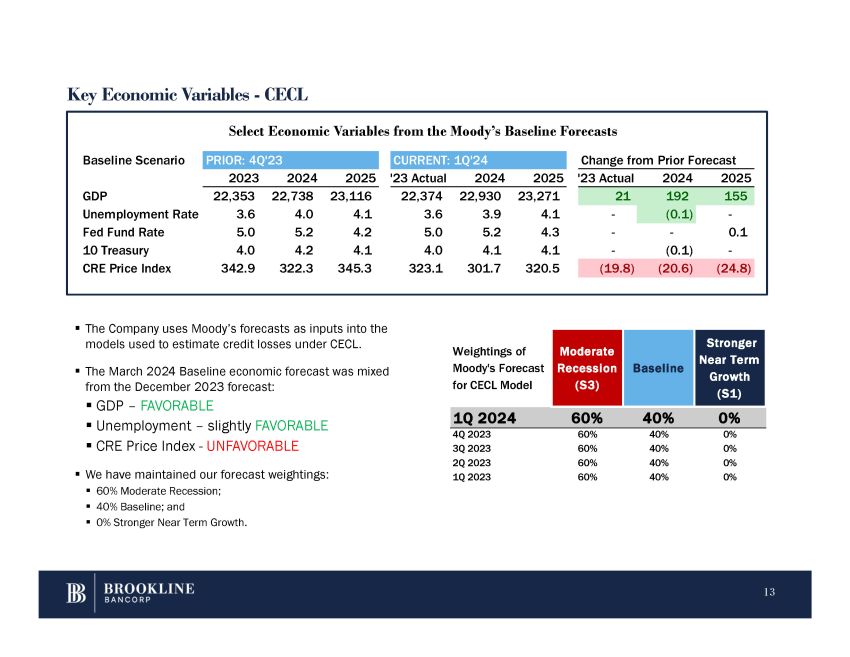
Key Economic Variables - CECL Select Economic Variables from the Moody’s Baseline Forecasts ▪ The Company uses Moody’s forecasts as inputs into the models used to estimate credit losses under CECL. ▪ The March 2024 Baseline economic forecast was mixed from the December 2023 forecast: ▪ GDP – FAVORABLE ▪ Unemployment – slightly FAVORABLE ▪ CRE Price Index - UNFAVORABLE ▪ We have maintained our forecast weightings: ▪ 60% Moderate Recession; ▪ 40% Baseline; and ▪ 0% Stronger Near Term Growth. orecast om Prior F Change fr 1Q'24 CURRENT: '23 PRIOR: 4Q Baseline Scenario 2025 2024 '23 Actual 2025 2024 '23 Actual 2025 2024 2023 155 192 21 23,271 22,930 22,374 23,116 22,738 22,353 GDP - (0.1) - 4.1 3.9 3.6 4.1 4.0 3.6 Unemployment Rate 0.1 - - 4.3 5.2 5.0 4.2 5.2 5.0 Fed Fund Rate - (0.1) - 4.1 4.1 4.0 4.1 4.2 4.0 10 Treasury (24.8) (20.6) (19.8) 320.5 301.7 323.1 345.3 322.3 342.9 CRE Price Index 13 Stronger Near Term Growth (S1) Baseline Moderate Recession (S3) Weightings of Moody's Forecast for CECL Model 1Q 2024 60% 40% 0% 0% 40% 60% 4Q 2023 0% 40% 60% 3Q 2023 0% 40% 60% 2Q 2023 0% 40% 60% 1Q 2023
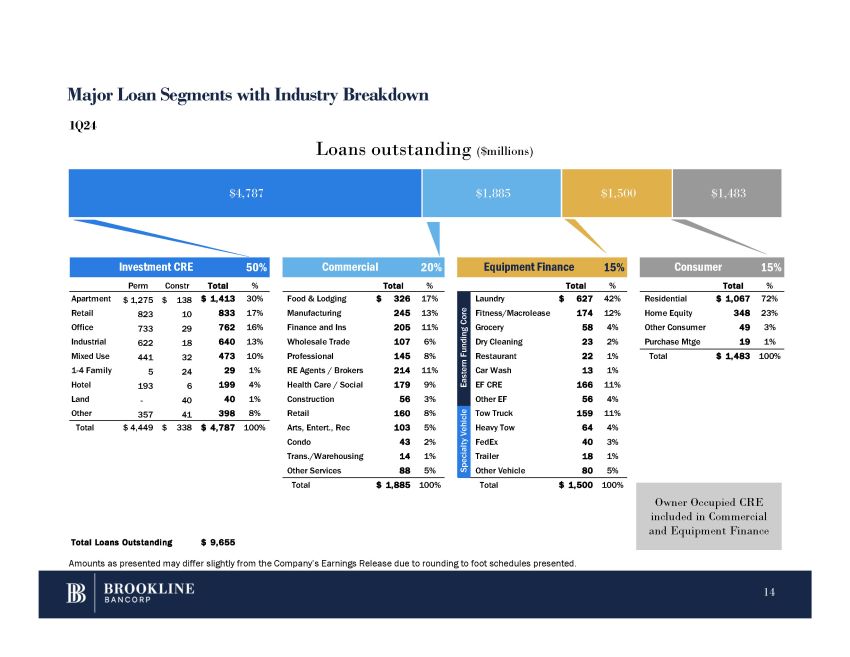
Investment CRE 50% Commercial 20% Equipment Finance 15% Consumer 15% Perm Constr Total % Total % Total % Total % Food & Lodging Manufacturing Finance and Ins Wholesale Trade Professional RE Agents / Brokers Health Care / Social Construction Retail Arts, Entert., Rec Condo Trans./Warehousing Other Services $ 326 17% 245 13% 205 11% 107 6% 145 8% 214 11% 179 9% 56 3% 160 8% 103 5% 43 2% 14 1% 88 5% Residential Home Equity Other Consumer Purchase Mtge $ 1,067 72% 348 23% 49 3% 19 1% Total $ 1,483 100% - Apartment Retail Office Industrial Mixed Use 1 - 4 Family Hotel Land Other 357 $ 1,275 $ 138 823 10 733 29 622 18 441 32 5 24 193 6 40 41 $ 1,413 30% 833 17% 762 16% 640 13% 473 10% 29 1% 199 4% 40 1% 398 8% Total $ 4,449 $ 338 $ 4,787 100% Total $ 1,885 100% Total $ 1,500 100% 42% $ 627 Laundry Eastern Funding Core 12% 174 Fitness/Macrolease 4% 58 Grocery 2% 23 Dry Cleaning 1% 22 Restaurant 1% 13 Car Wash 11% 166 EF CRE 4% 56 Other EF 11% 159 Tow Truck Specialty Vehicle 4% 64 Heavy Tow 3% 40 FedEx 1% 18 Trailer 5% 80 Other Vehicle Total Loans Outstanding $ 9,655 Amounts as presented may differ slightly from the Company’s Earnings Release due to rounding to foot schedules presented. Major Loan Segments with Industry Breakdown $4,787 $1,885 $1,500 $1,483 1Q24 Loans outstanding ($millions) Owner Occupied CRE included in Commercial and Equipment Finance 14
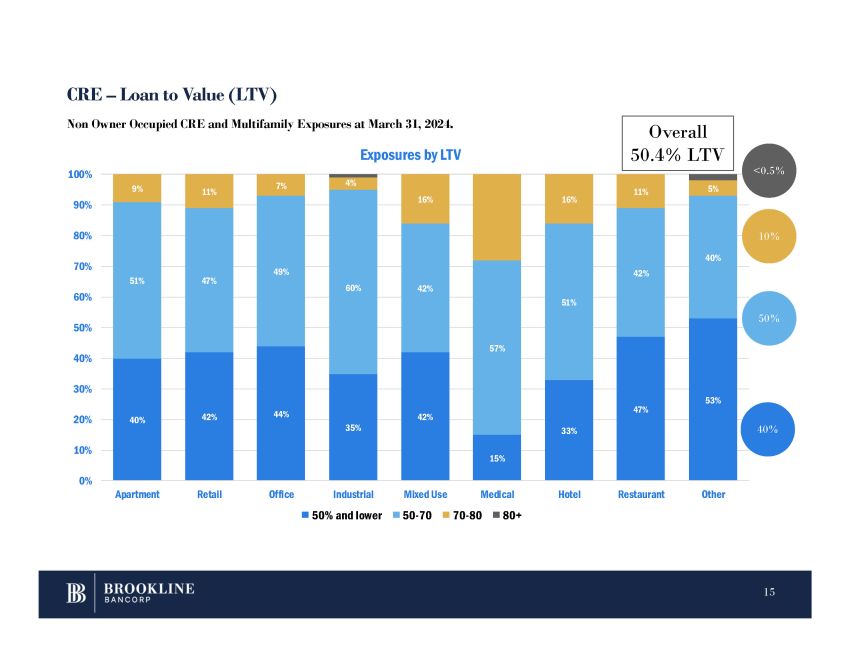
CRE – Loan to Value (LTV) 40% 42% 44% 35% 42% 15% 33% 47% 53% 51% 47% 49% 60% 42% 57% 51% 42% 40% 9% 11% 7% 4% 16% 16% 11% 5% 0% 10% 20% 30% 40% 50% 60% 70% 80% 90% 100% Apartment Retail Office Medical Hotel Restaurant Other Exposures by LTV Industrial 50% and lower Mixed Use 50 - 70 70 - 80 80+ Non Owner Occupied CRE and Multifamily Exposures at March 31, 2024. 40% 50% <0.5% 10% Overall 50.4% LTV 15
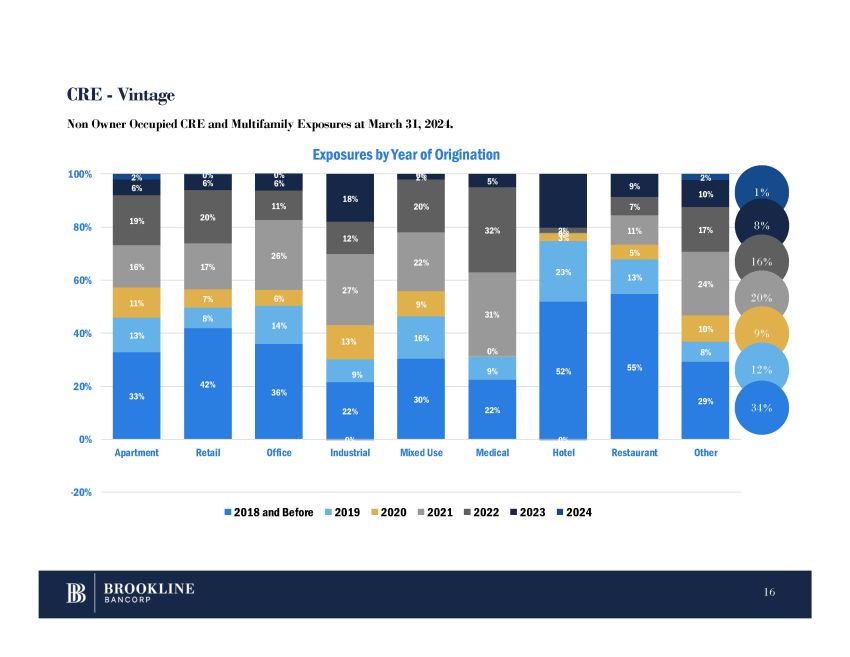
33% 42% 36% 22% 30% 22% 52% 55% 29% 13% 8% 14% 9% 16% 9% 23% 13% 8% 11% 7% 6% 13% 9% 0% 3% 5% 10% 16% 17% 26% 27% 22% 31% 11% 24% 19% 20% 11% 12% 20% 32% 0 2% 7% 17% 6% 6% 6% 18% 5% 9% 10% 2% 0% 0% 0% 2 0% 0% 2% - 20% 0% 20% 40% 60% 80% 100% Apartment Retail Office Industrial Mixed Use Medical Hotel Restaurant Other Non Owner Occupied CRE and Multifamily Exposures at March 31, 2024. Exposures by Year of Origination 2018 and Before 2019 2020 2021 2022 2023 2024 1 % CRE - Vintage 8 % 16 % 20 % 9 % 12 % 34 % 16
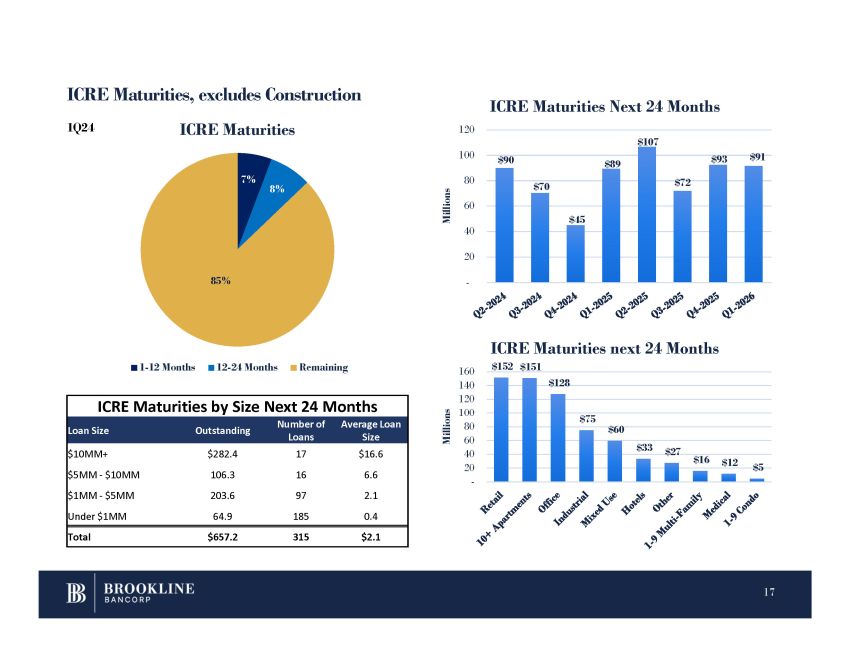
ICRE Maturities, excludes Construction ICRE Maturities by Size Next 24 Months Average Loan Size Number of Loans Outstanding Loan Size $16.6 17 $282.4 $10MM+ 6.6 16 106.3 $5MM - $10MM 2.1 97 203.6 $1MM - $5MM 0.4 185 64.9 Under $1MM $2.1 315 $657.2 Total 7% 8% 85% ICRE Maturities 1 - 12 Months 12 - 24 Months Remaining $90 $70 $45 $89 $107 $72 $93 $91 - 40 20 60 80 100 120 Millions ICRE Maturities Next 24 Months ICRE Maturities next 24 Months $152 $151 $128 $75 $60 $33 $27 $16 $12 $5 - 160 140 120 100 80 60 40 20 Millions 17 1Q24
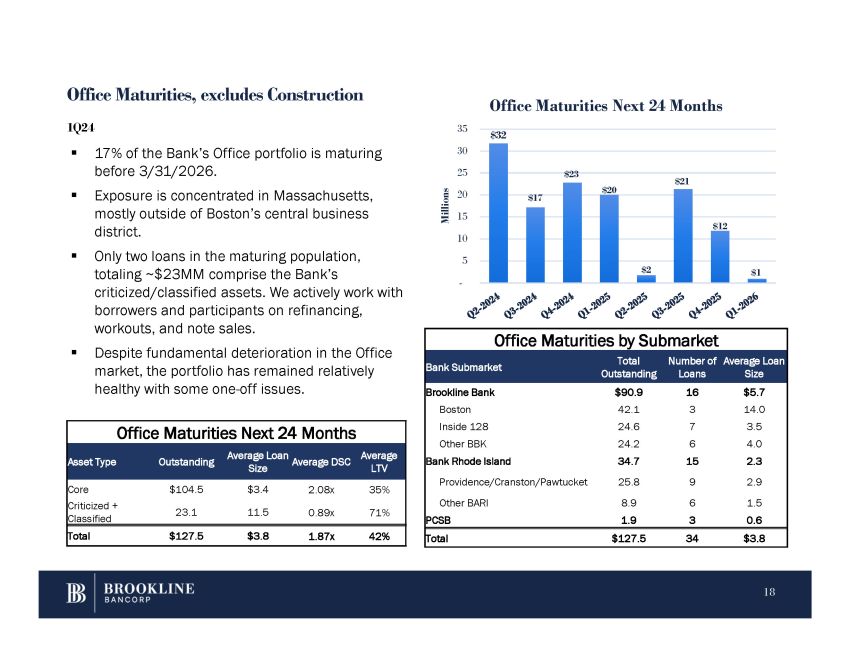
Office Maturities, excludes Construction Office Maturities by Submarket Average Loan Size Number of Loans Total Outstanding Bank Submarket $5.7 16 $90.9 Brookline Bank 14.0 3 42.1 Boston 3.5 7 24.6 Inside 128 4.0 6 24.2 Other BBK 2.3 15 34.7 Bank Rhode Island 2.9 9 25.8 Providence/Cranston/Pawtucket 1.5 6 8.9 Other BARI 0.6 3 1.9 PCSB $3.8 34 $127.5 Total Office Maturities Next 24 Months $32 $17 $23 $20 $2 $21 $12 $1 - 35 30 25 20 15 10 5 Millions 18 Office Maturities Next 24 Months Average LTV Average Loan Average DSC Size Outstanding Asset Type 35% 2.08x $3.4 $104.5 Core 71% 0.89x 11.5 23.1 Criticized + Classified 42% 1.87x $3.8 $127.5 Total ▪ 17 % of the Bank’s Office portfolio is maturing before 3 / 31 / 2026 . ▪ Exposure is concentrated in Massachusetts, mostly outside of Boston’s central business district . ▪ Only two loans in the maturing population, totaling ~$23MM comprise the Bank’s criticized/classified assets. We actively work with borrowers and participants on refinancing, workouts, and note sales. ▪ Despite fundamental deterioration in the Office market, the portfolio has remained relatively healthy with some one - off issues. 1Q24
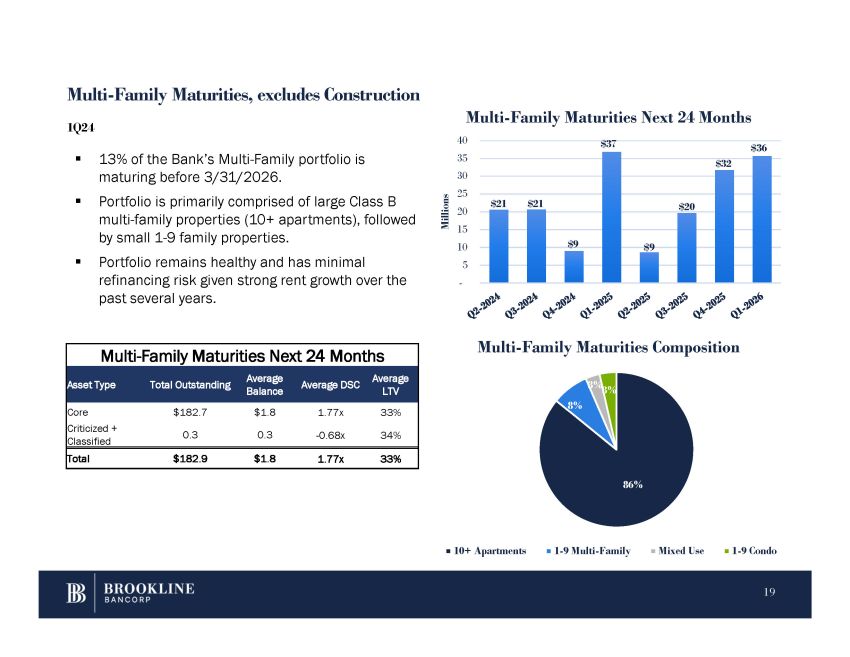
Multi - Family Maturities, excludes Construction 86% 8% 3% 3% Multi - Family Maturities Composition 10+ Apartments 1 - 9 Multi - Family Mixed Use 1 - 9 Condo $21 $21 $9 $37 $9 $20 $32 $36 - 40 35 30 25 20 15 10 5 Millions 19 Multi - Family Maturities Next 24 Months Multi - Family Maturities Next 24 Months Average LTV Average DSC Average Balance Total Outstanding Asset Type 33% 1.77x $1.8 $182.7 Core 34% - 0.68x 0.3 0.3 Criticized + Classified 33% 1.77x $1.8 $182.9 Total ▪ 13% of the Bank’s Multi - Family portfolio is maturing before 3/31/2026. ▪ Portfolio is primarily comprised of large Class B multi - family properties (10+ apartments), followed by small 1 - 9 family properties. ▪ Portfolio remains healthy and has minimal refinancing risk given strong rent growth over the past several years. 1Q24
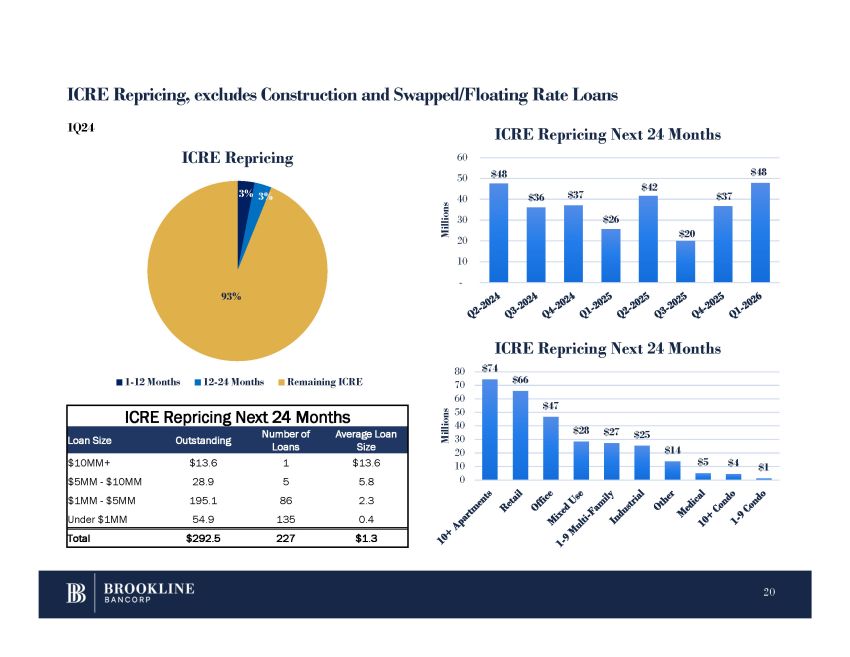
ICRE Repricing, excludes Construction and Swapped/Floating Rate Loans ICRE Repricing Next 24 Months Average Loan Size Number of Loans Outstanding Loan Size $13.6 1 $13.6 $10MM+ 5.8 5 28.9 $5MM - $10MM 2.3 86 195.1 $1MM - $5MM 0.4 135 54.9 Under $1MM $1.3 227 $292.5 Total 3% 3% 93% ICRE Repricing 1 - 12 Months 12 - 24 Months Remaining ICRE $48 $36 $37 $26 $42 $20 $37 $48 - 60 50 40 30 20 10 Millions ICRE Repricing Next 24 Months $66 $47 $28 $27 $25 $14 $5 $4 $1 ICRE Repricing Next 24 Months $74 80 70 60 50 40 30 20 10 0 Millions 20 1Q24
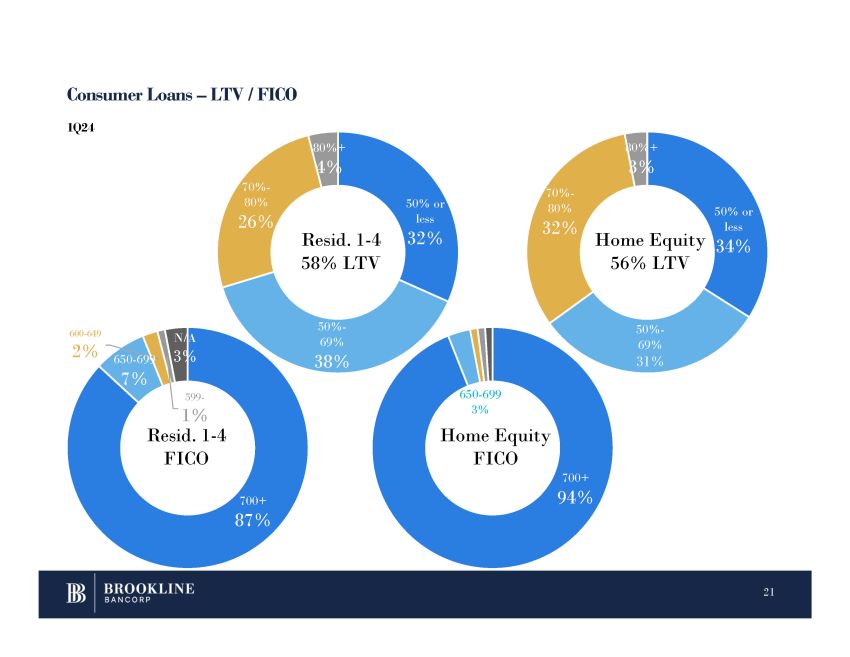
Consumer Loans – LTV / FICO 21 700+ 87% 650 - 699 7% 600 - 649 2% 599 - N/A 3% 50% or less 32% 50% - 69% 38% 70% - 80% 26% 80%+ 4% 700+ 94% 50% or less 50% - 69% 31% 70% - 80% 32% 80%+ 3% Resid. 1 - 4 58% LTV 1% Resid. 1 - 4 FICO 650 - 699 3% Home Equity FICO Home Equity 34% 56% LTV 1Q24
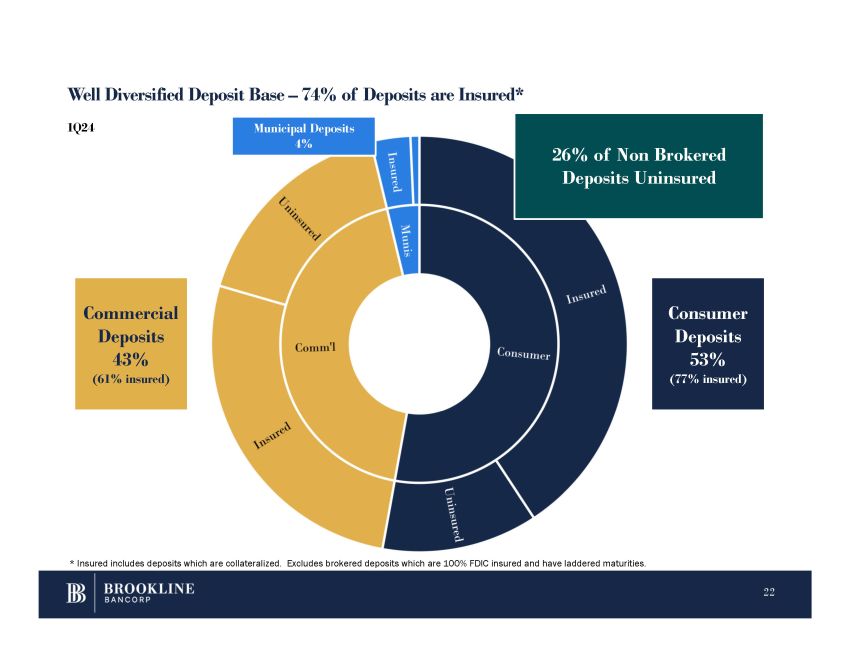
Well Diversified Deposit Base – 74% of Deposits are Insured* Consumer Deposits 53% (77% insured) Commercial Deposits 43% (61% insured) Municipal Deposits 4% * Insured includes deposits which are collateralized. Excludes brokered deposits which are 100% FDIC insured and have laddered maturities. 26% of Non Brokered Deposits Uninsured 22 1Q24
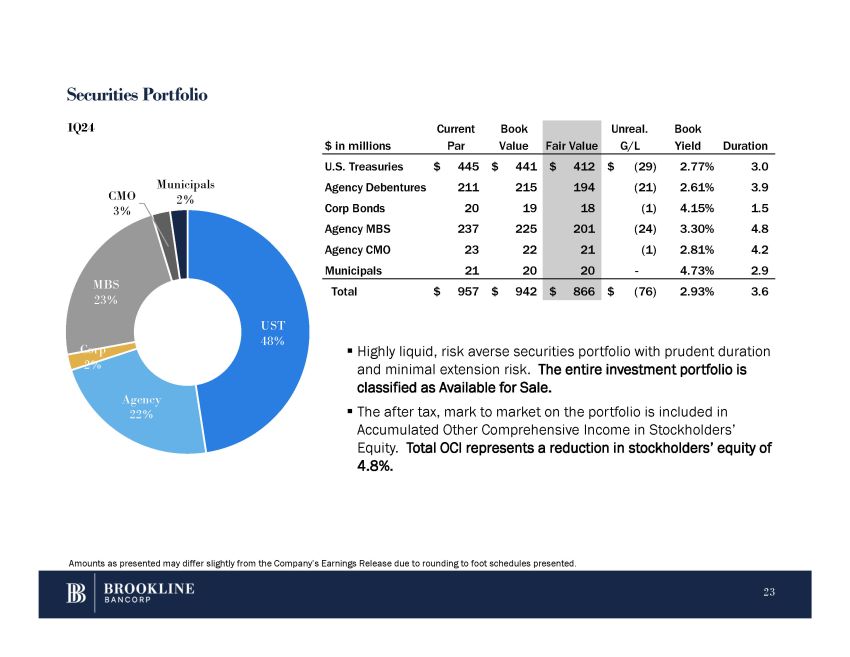
Securities Portfolio ▪ Highly liquid, risk averse securities portfolio with prudent duration and minimal extension risk. The entire investment portfolio is classified as Available for Sale. ▪ The after tax, mark to market on the portfolio is included in Accumulated Other Comprehensive Income in Stockholders’ Equity. Total OCI represents a reduction in stockholders’ equity of 4.8%. UST 48% 23 Agency 22% Corp 2% MBS 23% CMO 3% Municipals 2% 1Q24 Amounts as presented may differ slightly from the Company’s Earnings Release due to rounding to foot schedules presented. Duration Book Yield Unreal. G/L Fair Value Book Value Current Par $ in millions 3.0 2.77% $ (29) $ 412 $ 441 $ 445 U.S. Treasuries 3.9 2.61% (21) 194 215 211 Agency Debentures 1.5 4.15% (1) 18 19 20 Corp Bonds 4.8 3.30% (24) 201 225 237 Agency MBS 4.2 2.81% (1) 21 22 23 Agency CMO 2.9 4.73% - 20 20 21 Municipals 3.6 2.93% $ (76) $ 866 $ 942 $ 957 Total
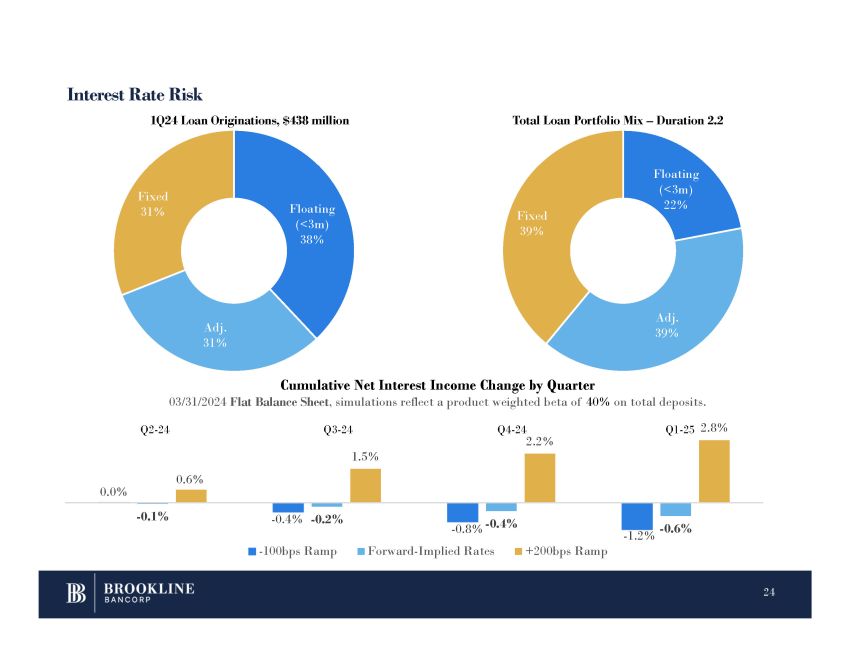
Interest Rate Risk Floating (<3m) 38% Adj. 31% Fixed 31% 1Q24 Loan Originations, $438 million Total Loan Portfolio Mix – Duration 2.2 - 1.2% - 0.1% - 0.4% - 0.2% - 0.8% - 0.4% - 0.6% 0.6% 0.0% 1.5% Q4 - 24 2.2% Q1 - 25 2.8% Cumulative Net Interest Income Change by Quarter 03/31/2024 Flat Balance Sheet , simulations reflect a product weighted beta of 40% on total deposits. - 100bps Ramp Forward - Implied Rates +200bps Ramp Q2 - 24 Q3 - 24 Floating (<3m) 22% 24 Adj. 39% Fixed 39%
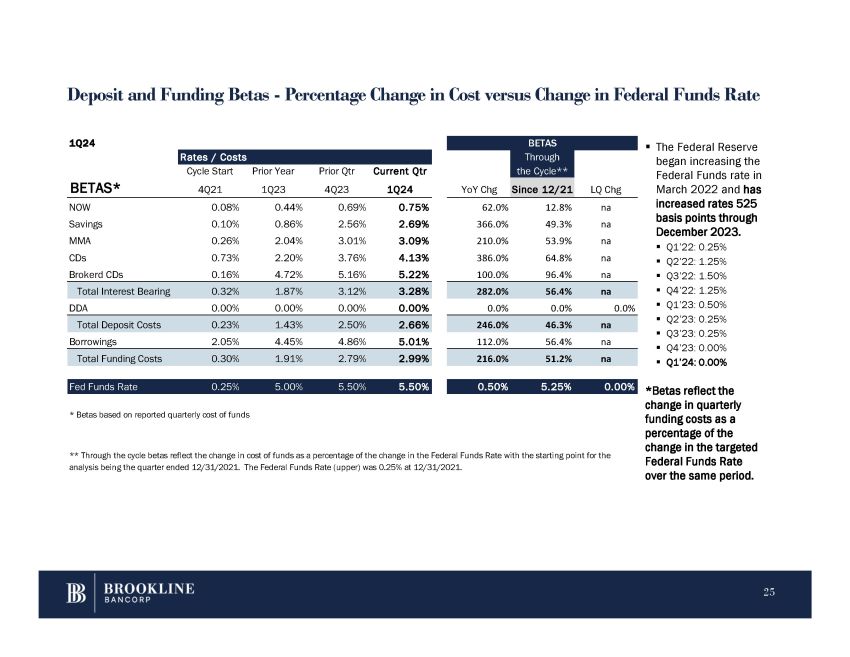
Deposit and Funding Betas - Percentage Change in Cost versus Change in Federal Funds Rate ▪ The Federal Reserve began increasing the Federal Funds rate in March 2022 and has increased rates 525 basis points through December 2023. ▪ Q1’22: 0.25% ▪ Q2’22: 1.25% ▪ Q3’22: 1.50% ▪ Q4’22: 1.25% ▪ Q1’23: 0.50% ▪ Q2’23: 0.25% ▪ Q3’23: 0.25% ▪ Q4’23: 0.00% ▪ Q1’24: 0.00% *Betas reflect the change in quarterly funding costs as a percentage of the change in the targeted Federal Funds Rate over the same period. na 12.8% 62.0% 0.75% 0.69% 0.44% 0.08% NOW na 49.3% 366.0% 2.69% 2.56% 0.86% 0.10% Savings na 53.9% 210.0% 3.09% 3.01% 2.04% 0.26% MMA na 64.8% 386.0% 4.13% 3.76% 2.20% 0.73% CDs na 96.4% 100.0% 5.22% 5.16% 4.72% 0.16% Brokerd CDs na 56.4% 282.0% 3.28% 3.12% 1.87% 0.32% Total Interest Bearing 0.0% 0.0% 0.0% 0.00% 0.00% 0.00% 0.00% DDA na 46.3% 246.0% 2.66% 2.50% 1.43% 0.23% Total Deposit Costs na 56.4% 112.0% 5.01% 4.86% 4.45% 2.05% Borrowings na 51.2% 216.0% 2.99% 2.79% 1.91% 0.30% Total Funding Costs BETAS LQ Chg Through the Cycle** YoY Chg Since 12/21 1Q24 Rates / Costs Cycle Start 4Q21 Prior Year 1Q23 Prior Qtr 4Q23 Current Qtr 1Q24 BETAS* Fed Funds Rate 0.25% 5.00% 5.50% 5.50% 0.50% 5.25% 0.00% * Betas based on reported quarterly cost of funds ** Through the cycle betas reflect the change in cost of funds as a percentage of the change in the Federal Funds Rate with the starting point for the analysis being the quarter ended 12/31/2021. The Federal Funds Rate (upper) was 0.25% at 12/31/2021. 25