February 2, 2024
VIA EDGAR
United States Securities and Exchange Commission
Division of Corporation Finance
Office of Industrial Applications and Services
100 F Street, N.E.
Washington, D.C. 20549
Attention: Ken Schuler, Craig Arakawa, Jeanne Baker and Terence O’Brien
|
Re:
|
Tronox Holdings plc
Form 10-K for the year ended December 31, 2022
Filed on February 22, 2023
File No. 001-35573
|
Dear Mr. Schuler, Mr. Arakawa, Ms. Baker and Mr. O’Brien,
On behalf of Tronox Holdings plc (“Tronox,” the “Company,” “we,” “us” and, with correlative meaning, “our”), the
following responses are provided to the comments submitted to Tronox by the staff of the Securities and Exchange Commission (the “Staff”) in a letter dated December 22, 2023 (the “Letter”) relating to Tronox’s Annual Report on Form 10-K for the year ended December 31, 2022 (the “2022 Form 10‑K”),
in compliance with the extension period granted by the Staff in a telephone conference on December 26, 2023. Terms not defined herein shall have the meaning set forth in the 2022 Form 10-K. We have restated below in italics the comments from the
Letter and have supplied our response to the comment immediately thereafter.
The Company proposes to comply with these comments for the first time in its Annual Report on Form 10-K for the fiscal year ended December 31, 2023 (the “2023 Form 10‑K”). The Company respectfully submits that, given the proximity to the filing of the 2023 Form 10-K, this
approach would be more appropriate to best aid investor understanding and reduce the risk of investor confusion with multiple filings, as the Staff reviews and evaluates the proposed illustrative disclosures contained herein. The Company does not believe this approach would be prejudicial to investors, as the Company believes that all material information relating to these properties is already contained in the 2022 Form 10-K and previously
filed technical report summaries (“TRSs”), taken as a whole, and any
additional information provided with respect to prior periods will be available to investors in the 2023 Form 10-K.
|
Tronox Holdings plc
263 Tresser Blvd., Suite 1100
Stamford, CT 06901 USA
T +1 203 705 3800
www.tronox.com
|
|
Securities and Exchange Commission
Division of Corporation Finance
Page 2
|
To that end, the Company has endeavored to provide the Staff with proposed preliminary disclosure in the appendices hereto reflecting certain information and data of the Company as of and for the fiscal year ended
December 31, 2023, which information and data are not yet final as of the date hereof and are thus set forth herein as placeholders for illustrative purposes. Appendix A provides the
proposed structure for the summary property disclosure and individual property disclosure for the 2023 Form 10-K. In addition, as further discussed herein, the Company respectfully advises the Staff that there have been no material changes in the
mineral reserves or mineral resources for the properties described in each of the TRSs incorporated by reference as Exhibit 96.1, 96.2, 96.3 and 96.4 to the 2022 Form 10-K since December 31, 2021, the effective date of each such TRS. The Company has therefore provided the Staff with certain supplemental information as of and for the fiscal year ended on such effective date, which it proposes to include in
amendments to the respective TRSs that will be filed as exhibits to the 2023 Form 10-K in response to the Staff’s comments. Appendices B, C, D and E (collectively with Appendix A, the “Appendices”) provide such supplemental disclosure for such TRS amendments to be filed
as Exhibits 96.1, 96.2, 96.3 and 96.4 to the 2023 Form 10-K, respectively.
Form 10-K
Mining Operations, page 27
1. The summary disclosures should encompass all your properties, including both material and non-material properties, and should appear in advance of and
incremental to, the individual property disclosures. The requirements for individual property disclosures are more extensive and detailed in comparison and are applicable for material properties, as determined pursuant to Item 1301 of Regulation
S-K. For example, the summary disclosures should describe the locations of each operating, development, and exploration property to comply with Item 1303(b)(2)(ii)(A); while the individual property disclosures should
include comparable details along with a map for each property, showing its particular location, that is accurate to within one mile, using an easily recognizable coordinate system, to comply with Item 1304(b)(1)(i). Please revise your filing to include and differentiate between the summary and individual property disclosures to comply with the aforementioned guidance.
Response:
The Company respectfully acknowledges the Staff’s interpretation of Items 1303 and 1304 of Regulation S-K and
will include in Part I, Item 2 “Properties” of the 2023 Form 10-K finalized summary and individual property disclosure that is substantially in the form of the illustrative disclosure set forth in Appendix A.
The Company respectfully submits to the Staff in an effort to place in context the following responses that it had considered these matters in preparing the 2022 Form 10-K and,
based on its initial interpretation of Item 601(b)(96) and subpart 1300 of Regulation S-K, the Company provided the information required by such Item and subpart in the 2022 Form 10‑K and TRSs, considered
together, with the exception of certain information that it did not believe to be material to investors given that the Company is a vertically integrated manufacturer of TiO2 pigment. With respect to the material properties, for example,
certain portions of the information required under Item 1304 of Regulation S-K, such as the requisite descriptions of the properties, including maps accurate to within one mile, existing infrastructure, the
Company’s ownership interest in the property and the history of the property, were provided only in the respective TRSs for each such property. Nonetheless, the Company recognizes that subpart 1300 of Regulation S-K applies to vertically
integrated companies with mining operations, and the Company will therefore include the additional information set forth in Appendix A in the 2023 Form 10-K.
|
Securities and Exchange Commission
Division of Corporation Finance
Page 3
|
The Company further advises the Staff that it has assessed the materiality of its mining operations as required by Item 1301 of Regulation S-K, using the principles set forth in Release No. 34-84509
(Oct. 31, 2018). Based on this analysis, the Company has determined that the following of its mining operations are material: Cooljarloo, Atlas-Campaspe, Namakwa Sands and KZN Sands. The Company has also determined that the following of its mining
operations are not material: Dongara, Port Durnford, Wonnerup, Ginkgo-Crayfish Dredge and Kara/Cylinder.
Mineral Sands – South Africa and Australia, page 30
2. Please revise your filing to report each individual property’s production by product such as heavy metals, ilmenite, rutile, leucoxene, and zircon, as required
by Item 1303(b)(2)(i) of Regulation S-K.
Response:
The Company respectfully informs the Staff that, based on its interpretation of Item 1303(b)(2)(i) of Regulation S‑K, which requires to “aggregate annual production for the properties,” the
Company provided its aggregate mineral production for each of the three years ended December 31, 2022 on pages 30 and 31 the 2022 Form 10-K.1 Nonetheless, the Company respectfully acknowledges the
Staff’s comment and provides the illustrative disclosure showing the Company’s aggregate annual production by property as set forth in Appendix A on page A-2. The Company will comply with this comment by including finalized disclosure in
Part I, Item 2 “Properties” of the 2023 Form 10-K.
Heavy Metal Reserves, page 32
3. Please include the commodity price used, metallurgical recovery, and the cutoff grade with your resource and reserve disclosures as required by Item 1303(b)(3)
of Regulation S-K.
1 This interpretation is consistent with the Release No. 34-84509 (Oct. 31, 2018), which states that “in a change from the proposed rules, which required the disclosure of the total production from
each of the registrant’s top 20 properties by asset value for the three most recently completed fiscal years, the final rules require that the overview must include annual production on an aggregated basis for the registrant’s mining properties
during each of the three most recently completed fiscal years” (footnotes omitted).
|
Securities and Exchange Commission
Division of Corporation Finance
Page 4
|
Response:
The Company respectfully acknowledges the Staff’s comment and provides the illustrative disclosure setting forth the commodity price used, saleable product yield (recovery) and the cutoff grade with our reserves and
resources disclosures, as set forth in Appendix A on pages A-3 and A-4. The Company will include finalized disclosure in the 2023 Form 10-K. The Company respectfully informs the Staff that Tronox uses the term “saleable product yield (recovery)” to refer to the conversion of contained, in-situ mineral to saleable products, which is equivalent to the term “metallurgical or processing recoveries” used in subpart 1300 of
Regulation S-K.
4. Please state whether your qualified persons (QP’s) are employees of your company and provide the additional information required by Item 1302(b)(5) of
Regulation S-K.
The Company confirms that each of the QPs who prepared the TRSs incorporated by reference as Exhibits 96.1, 96.2, 96.3 and 96.4 to the 2022 Form 10-K is an employee of an
indirect wholly owned subsidiary of the Company. This information will be included in Part I, Item 2 “Properties” of the 2023 Form 10-K, as indicated in Appendix A on page A-1.
Tronox Mineral Sands – 2022 Resources, page 34
5. Please clearly state your mineral resources are exclusive of reserves as required by Item 1303(b)(3) of Regulation S-K.
Response:
The Company confirms that its mineral resources are exclusive of reserves. This information will be included in Part I, Item 2 “Properties” of the 2023 Form 10-K, as indicated in Appendix A beginning on page
A-4.
6. Please modify your filing and provide a more detailed reconciliation of your resources/reserves as reported this year to last year, as required by Item 1303(e)
of Regulation S‑K.
Response:
The Company respectfully acknowledges the Staff’s comment and respectfully submits that the last columns of the tables on page 33 and 34 of the 2022 Form 10-K indicate the changes in our reserves/resources compared to
2021. As indicated in these tables there has been no material variation in the Company’s reported reserves and resources, and the changes reported are predominantly due to depletion, as indicated in the footnotes to these tables. For these reasons,
the Company believes that form of presentation satisfies the requirements of Item 1304(e). Nonetheless, the Company acknowledges the Staff’s interpretation of Item 1304, and provides an illustrative more detailed reconciliation of resources and
reserves from 2023 to 2022 as set forth in Appendix A for all of our mining operations beginning on page A-3 and for each of our material mining operations beginning on pages A-7, A-13, A-16 and A-19. The Company will comply with this comment in Part
I, Item 2 “Properties” of the 2023 Form 10-K.
|
Securities and Exchange Commission
Division of Corporation Finance
Page 5
|
7. Please modify your filing here and elsewhere to state the book value of your material properties as required by Item 1304(b)(2)(iii) of Regulation S-K.
Response:
The Company acknowledges the Staff’s comment and provides the illustrative disclosure regarding the book values of each our material properties and mining operations, inclusive of
plant, property and equipment, as set forth in Appendix A on pages A-5, A-10, A-15 and A-18. The Company will comply with this comment in the 2023 Form 10-K.
Exhibits 96.1, 96.2, 96.3, and 96.4
Property Description, page E-1
Property Description, page E-1
8. Please modify your exhibits and locate your property within one-mile using an easily recognizable coordinate system as required by
Item 601(b)(96)(iii)(B)(3)(i) of Regulation S-K.
Response:
The Company respectfully acknowledges the Staff’s comment. Please refer to the maps on page 2 of each of Exhibit 96.1, 96.2, 96.3 and 96.4 of the 2022 Form 10-K, which the
Company respectfully submits to the Staff are in compliance with requirements to locate each property within one-mile using an easily recognizable coordinate system pursuant to Item 601(b)(96)(iii)(B)(3)(i) of Regulation S-K. In response to the
Staff’s comment, the Company additionally provides the coordinates of each property as shown in Appendix A on pages A-6, A-10, A-15 and A-18. The Company will amend the TRSs to include this information, and will file such amendments as Exhibits to
the 2023 Form 10-K.
Exhibits 96.1, 96.2, 96.3, and 96.4
Geological Setting, Mineralisation and Deposit, page E-2
Geological Setting, Mineralisation and Deposit, page E-2
9. Please modify your filings and ensure you have provided at least one stratigraphic column and one cross-section of the local geology as required by Item
601(b)(96)(iii)(B)(6)(iii) of Regulation S-K.
Response:
The Company respectfully refers the Staff to the cross-sections of the local geology on page 5 of Exhibit 96.1, page 4 of Exhibit 96.2, page 6 of Exhibit 96.3 and page 9 of Exhibit 96.4 of the 2022 Form 10-K, which the Company respectfully submits to the Staff are in compliance with requirements of Item 601(b)(96)(iii)(B)(6)(iii) of Regulation S-K. In response to the Staff’s comment, the Company provides the
stratigraphic columns as shown in the Appendices on pages B-1, C-1, D-1 and E-1. The Company will amend the TRSs to include this information, and will file such amendments as Exhibits to the 2023 Form 10-K.
|
Securities and Exchange Commission
Division of Corporation Finance
Page 6
|
Exhibits 96.1, 96.2, 96.3, and 96.4
Sample Preparation, Analyses and Security, page E-3
Sample Preparation, Analyses and Security, page E-3
10. Please modify your filing and provide the opinion of the QP regarding the adequacy of the sample preparation, security, and analytical procedures as required
by Item 601(b)(96)(iii)(B)(8)(iv) of Regulation S-K.
Response:
The Company respectfully acknowledges the Staff’s comment. Each QP has confirmed to the Company that the general opinion reflected on Section 22 – Interpretation and Conclusions of each TRS (on page 19 of Exhibit 96.1,
page 21 of Exhibit 96.2, page 24 of Exhibit 96.3 and page 24 of Exhibit 96.4 of the 2022 Form 10-K) reflects such QP’s view with respect to the adequacy of the sample preparation, security and analytical
procedures. Nonetheless, the Company respectfully acknowledges the Staff’s interpretation and the QPs will revise their TRSs to include a statement to the effect that it is the QPs view that the sample preparation, security and analytical
procedures are adequate.
Exhibits 96.1, 96.2, 96.3, and 96.4
Mineral Processing and Metallurgical Testing, page E-4
Mineral Processing and Metallurgical Testing, page E-4
11. We reviewed the Mineral Processing and Metallurgical Testing section of your technical report summary. Please modify your filing to disclose your estimated
metallurgical recoveries with the QP’s opinion on the adequacy of the metallurgical data as required by Item 601(b)(96)(iii)(B)(10)(v) of Regulation S-K.
Response:
The Company respectfully acknowledges the Staff’s comment and provides the disclosure as shown in the Appendices on pages B-1, C-1, D-1 and E-2. The Company will amend the TRSs to include this information, and will file
such amendments as Exhibits to the 2023 Form 10-K.
Exhibits 96.1, 96.2, 96.3, and 96.4
Mineral Resource Estimates, page E-5
Mineral Resource Estimates, page E-5
12. Please modify your filing and disclose the cutoff grade for your resource estimates with all the parameters used to prepare this calculation. This would
include your commodity price, operating costs, and metallurgical recovery. See Item 601(b)(96)(iii)(B)(11)(iii) of Regulation S‑K.
|
Securities and Exchange Commission
Division of Corporation Finance
Page 7
|
Response:
The Company respectfully acknowledges the Staff’s comment and provides the disclosure as shown in the Appendices on pages B-2, C-1, D-2 and E-2. The Company will amend the TRSs to include this information, and will file
such amendments as Exhibits to the 2023 Form 10-K.
13. Please modify your filing and revise your resource and reserve summaries in your exhibits to clarify whether your cutoff grades are a breakeven and
internal/marginal cutoff grade.
Response:
The Company respectfully acknowledges the Staff’s comment and provides a discussion of the applicable cutoff grades used by the Company in the Appendices on pages B-2, C-1, D-2 and E-2. The Company will amend the TRSs to
include this information, and will file such amendments as Exhibits to the 2023 Form 10-K.
14. Please modify your filing and disclose the QP’s opinion on whether all issues related to resource technical and/or economic factors influencing economic
extraction can be resolved with further work. See Item 601(b)(96)(iii)(B)(11)(vii) of Regulation S-K.
Response:
The Company respectfully acknowledges the Staff’s comment. Each QP has confirmed to the Company that the general opinion reflected on Section 22 – Interpretation and Conclusions of each TRS (on page 19 of Exhibit 96.1,
page 21 of Exhibit 96.2, page 24 of Exhibit 96.3 and page 24 of Exhibit 96.4 of the 2022 Form 10-K) reflects such QP’s view that all issues related to resource technical and
economic factors influencing economic extraction can be resolved with further work. Nonetheless, the Company respectfully acknowledges the Staff’s interpretation and provides the QP’s opinion as shown in the Appendices on pages B-2, C-2, D-2 and E-3.
The Company will amend the TRSs to include this information, and will file such amendments as Exhibits to the 2023 Form 10-K.
Exhibits 96.1, 96.2, 96.3, and 96.4
Mineral Reserve Estimates, page E-6
Mineral Reserve Estimates, page E-6
15. Please modify your filing and disclose the cutoff grade for your reserve estimates along with all the parameters used to prepare this calculation. See Item
601(b)(96)(iii)(B)(12)(iii) of Regulation S-K.
Response:
The Company respectfully acknowledges the Staff’s comment and provides the disclosure as shown in the Appendices on pages B-2, C-1, D-2 and E-2. The Company will amend the TRSs to include this information, and will file
such amendments as Exhibits to the 2023 Form 10-K.
|
Securities and Exchange Commission
Division of Corporation Finance
Page 8
|
16. We note you did not state a commodity sales price for your resource and reserve estimates. Please state the price used to determine your resources/reserves
and disclose, with particularity, the reasons this price was selected and any assumptions underlying this selection. See Item 601(b)(96)(iii)(B)(12)(iii) of Regulation S-K.
The Company respectfully acknowledges the Staff’s comment and provides the commodity sales prices as shown in the Appendices on pages B-2, C-2, D-3 and E‑3. The Company will amend the TRSs to include this information,
and will file such amendments as Exhibits to the 2023 Form 10-K.
Exhibits 96.1, 96.2, 96.3, and 96.4 A
Mining Methods, page E-7
Mining Methods, page E-7
17. Please provide annual numerical values for your life of mine production schedule. This would include annual processed ore with associated grades for the life
of mine. See Item 601(b)(96)(iii)(B)(13) of Regulation S-K.
Response:
The Company respectfully acknowledges the Staff’s comment and provides the disclosure as shown in the Appendices on pages B-3, C-3, D-3 and E-3. The Company will amend the TRSs to include this information, and will file
such amendments as Exhibits to the 2023 Form 10-K.
Exhibits 96.1, 96.2, 96.3, and 96.4 A
Processing and Recovery Methods, page E-8
Processing and Recovery Methods, page E-8
18. We note your property has been in operation for several years. Please disclose your annual plant throughput and recoveries over
the last 3 years. Item 601(b)(96)(iii)(B)(14)(ii) of Regulation S-K.
Response:
The Company respectfully acknowledges the Staff’s comment. Please refer to the respective Section 14 – Processing and Recovery Methods of each TRS, on page 15 of Exhibit 96.1, page 14 of Exhibit 96.2, page 17 of Exhibit
96.3 and page 15 of Exhibit 96.4 of the 2022 Form 10-K where plant throughput and saleable product yield (recovery) are described.
|
Securities and Exchange Commission
Division of Corporation Finance
Page 9
|
The Company respectfully advises the Staff that in its view Item 601(b)(96)(iii)(B)(14)(ii) of Regulation S-K requires only a description of the current or proposed mineral processing methods and the reasons for
selecting these methods as the most suitable for extracting the valuable products from the mineralization under consideration, which must include plant throughput and design, equipment characteristics and specifications. The Company respectfully
advises the Staff that it does not believe Item 601(b)(96)(iii)(B)(14)(ii) of Regulation S-K requires annual throughput and recovery statistics over the last three years. Nonetheless, the Company acknowledges the Staff’s interpretation and provides
the disclosure as shown in the Appendices on pages B-3, C-3, D-3 and E-3. The Company will amend the TRSs to include this information, and will file such amendments as Exhibits to the 2023 Form 10-K.
Exhibits 96.1, 96.2, 96.3, and 96.4 A
Market Studies, page E-9
Market Studies, page E-9
19. Please provide the relevant market price projections for your life of mine and include the 5-year historic prices with your forecast pricing as required by
Item 601(b)(96)(iii)(B)(16) of Regulation S-K.
Response:
The Company respectfully advises the Staff that it did not provide this information based on its initial interpretation of Item 601(b)(96)(iii)(B)(16) of Regulation S-K, which does not require “5-year historic prices.”
Nonetheless the Company respectfully acknowledges the Staff’s interpretation and provides the disclosure as shown in the Appendices on pages B-2, C-2, D-3 and E-3. The Company will amend the TRSs to include this information, and will file such
amendments as Exhibits to the 2023 Form 10-K.
Exhibits 96.1, 96.2, 96.3, and 96.4 A
Environmental studies, permitting and plans, negotiations, or agreements with local individuals or groups, page E-10
Environmental studies, permitting and plans, negotiations, or agreements with local individuals or groups, page E-10
20. We reviewed the Environmental Studies, Permitting, And Plans, Negotiations, Or Agreements with Local Individuals or Groups section of your technical report
summary. Please modify your filing and include the QP’s opinion as to the adequacy of current plans for environmental compliance, permitting, and addressing issues with local individuals or groups required by Item 601(b)(96)(iii)(B)(17)(vi) of
Regulation S-K.
|
Securities and Exchange Commission
Division of Corporation Finance
Page 10
|
Response:
The Company respectfully acknowledges the Staff’s comment. Each QP has confirmed to the Company that the general opinion reflected on Section 22 – Interpretation and Conclusions of each TRS (on page 19 of Exhibit 96.1,
page 21 of Exhibit 96.2, page 24 of Exhibit 96.3 and page 24 of Exhibit 96.4 of the 2022 Form 10-K) reflects such QP’s view with respect to the adequacy of current plans for
environmental compliance, permitting and addressing issues with local individuals or groups. Nonetheless, the Company respectfully acknowledges the Staff’s interpretation and provides the QP’s opinion as shown in the Appendices on pages B-3, C-3,
D-4 and E-4. The Company will amend the TRSs to include this information, and will file such amendments as Exhibits to the 2023 Form 10-K.
Exhibits 96.1, 96.2, 96.3, and 96.4 A
Capital and Operating Cost, page E-11
Capital and Operating Cost, page E-11
21. Please revise to provide a tabulation of all the operating and capital costs for your life of mine used to prepare your economic analysis. See Item
601(b)(96)(iii)(B)(18)(i) of Regulation S-K.
Response:
The Company respectfully acknowledges the Staff’s comment and provides the disclosure as shown in the Appendices on pages B-3, C-3, D-4 and E-4. The Company will amend the TRSs to include this information, and will file
such amendments as Exhibits to the 2023 Form 10-K.
22. Please modify your filing and define the accuracy of your capital and operating costs estimates as required by Item 601(b)(96)(iii)(B)(18)(i) of Regulation
S-K.
Response:
The Company respectfully acknowledges the Staff’s comment and provides the disclosure as shown in the Appendices on pages B-4, C-3, D-4 and E-4. The Company will amend the TRSs to include this information, and will file
such amendments as Exhibits to the 2023 Form 10-K.
23. Please modify your filings to disclose your closing/reclamation costs as required by Item 601(b)(96)(iii)(B)(18)(i) of Regulation S-K.
Response:
The Company respectfully acknowledges the Staff’s comment and provides the disclosure as shown in the Appendices on pages B-4, C-4, D-4 and E-4. The Company will amend the TRSs to include this information, and will file
such amendments as Exhibits to the 2023 Form 10-K.
|
Securities and Exchange Commission
Division of Corporation Finance
Page 11
|
Exhibits 96.1, 96.2, 96.3, and 96.4 A
Economic Analysis, page E-12
Economic Analysis, page E-12
24. We note you did not disclose an economic analysis for your reserves in this section. Please modify your filing to provide an annual cash flow, summarizing the
results on an after-tax basis. Your financial analysis should disclose your production, prices, revenues, capital, sustaining capital, reclamation, operating costs, royalties, taxes, DD&A, pre- and post-tax cash flows for the life of your
property’s reserves. This information should be clearly related to information developed and disclosed in previous sections, such as reserve quantities, mine/plant recoveries, prices, operating costs, capital expenditures, royalties, taxes, and
other line items necessary to define your after-tax cash flow. See Item 601(b)(96)(iii)(B)(19)(ii) of Regulation S‑K.
Response:
The Company respectfully acknowledges the Staff’s comment and provides the disclosure as shown in the Appendices on pages B-5, C-4, D-5 and E-5. The Company will amend the TRSs to include this information, and will file
such amendments as Exhibits to the 2023 Form 10-K.
25. Please include a sensitivity analysis and discuss the impact on your cash flow analysis as required by Item 601(b)(96)(iii)(B)(19)(iii) of Regulation S-K.
Response:
The Company respectfully acknowledges the Staff’s comment and provides the disclosure as shown in the Appendices on pages B-5, C-5, D-5 and E-5. The Company will amend the TRSs to include this information, and will file
such amendments as Exhibits to the 2023 Form 10-K.
* * * *
|
Securities and Exchange Commission
Division of Corporation Finance
Page 12
|
If you require additional information, please do not hesitate to contact Jonathan Flood or the undersigned at (203)
705-3800.
|
Very truly yours,
|
|
|
/s/ John Srivisal
|
|
|
John Srivisal
|
|
|
Senior Vice President and Chief Financial Officer
|
|
* * * *
Appendix A
ITEM 2. PROPERTIES
Summary Disclosure Supplements
Figure 1 Showing global site and offices including locations with resources and reserves.2
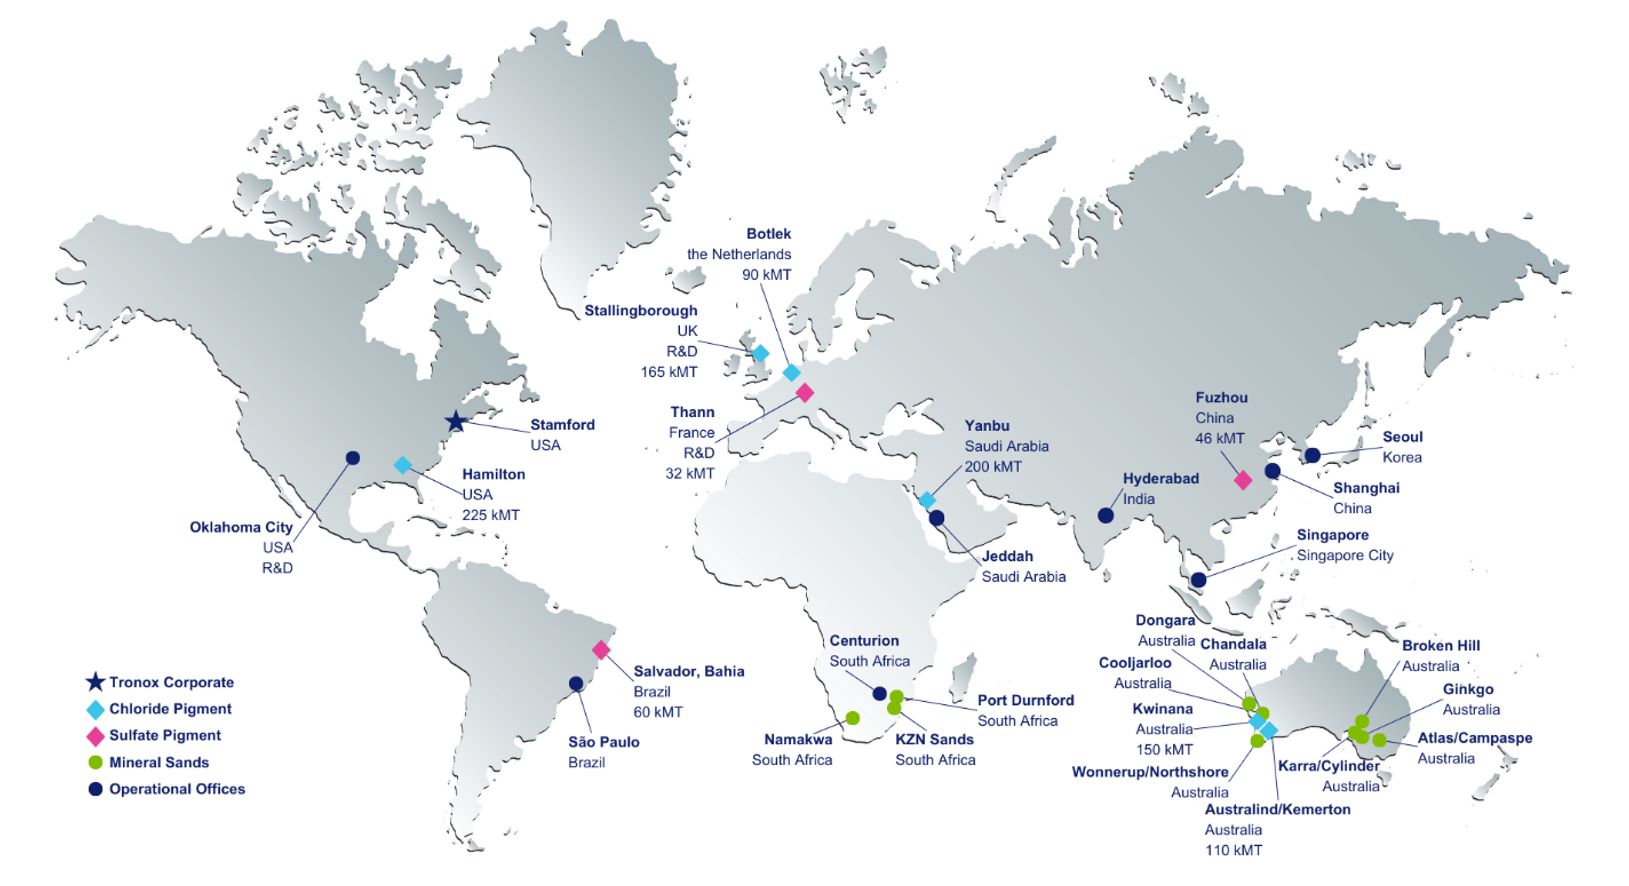
2 The Company supplementally advises the Staff that our Paraiba, Brazil mining operations were removed from Figure 1 because such operations ceased during 2020 in line with our life of mine plan.
A-1
|
Securities and Exchange Commission
Division of Corporation Finance
Appendix A – Page A-2
|
|
TRONOX MINERAL SANDS - 2023 AGGREGATE MINERAL PRODUCTION FOR THE PAST THREE YEARS (metric tons per year)
|
||||||||||||
|
2023
|
2022
|
2021
|
||||||||||
|
Rutile(1)
|
||||||||||||
|
Australia
|
||||||||||||
|
18,850
|
25,519
|
|||||||||||
|
Atlas-Campaspe
|
-
|
-
|
||||||||||
|
South Africa
|
||||||||||||
|
Namakwa Sands
|
31,304
|
28,994
|
||||||||||
|
KZN Sands
|
16,326
|
21,478
|
||||||||||
|
All Other Properties
|
92,644
|
65,603
|
||||||||||
|
Total
|
159,124
|
141,594
|
||||||||||
|
Ilmenite(2)
|
||||||||||||
|
Australia
|
||||||||||||
|
Cooljarloo
|
143,049
|
185,481
|
||||||||||
|
Atlas-Campaspe
|
-
|
-
|
||||||||||
|
South Africa
|
||||||||||||
|
Namakwa Sands
|
567,050
|
408,471
|
||||||||||
|
KZN Sands
|
290,407
|
429,271
|
||||||||||
|
All Other Properties
|
155,593
|
167,758
|
||||||||||
|
Total
|
1,156,099
|
1,190,981
|
||||||||||
|
Zircon(3)
|
||||||||||||
|
Australia
|
||||||||||||
|
Cooljarloo
|
21,694
|
27,490
|
||||||||||
|
Atlas-Campaspe
|
-
|
-
|
||||||||||
|
South Africa
|
||||||||||||
|
Namakwa Sands
|
107,967
|
112,844
|
||||||||||
|
KZN Sands
|
31,839
|
40,368
|
||||||||||
|
All Other Properties
|
38,233
|
39,123
|
||||||||||
|
Total
|
199,733
|
219,825
|
||||||||||
|
HMC(4)
|
||||||||||||
|
Australia
|
||||||||||||
|
Cooljarloo
|
265,982
|
316,942
|
||||||||||
|
Atlas-Campaspe
|
-
|
-
|
||||||||||
|
South Africa
|
||||||||||||
|
Namakwa Sands
|
1,576,618
|
1,663,243
|
||||||||||
|
KZN Sands
|
429,521
|
498,502
|
||||||||||
|
All Other Properties
|
321,902
|
436,146
|
||||||||||
|
Total
|
2,591,023
|
2,914,833
|
||||||||||
(1) includes natural rutile + leucoxene
(2) includes multiple grades of TiO2 grades of ilmenite
(3) includes multiple grades of zircon
(4) HMC = Heavy Mineral Concentrate
The following tables summarize our reserves and resources as well as their contained in-situ total heavy minerals (THM) and heavy mineral (HM) assemblages as of December 31, 2023 based on long-term price
assumptions. The sole purpose of the operational and related financial data presented is to demonstrate the economic feasibility of the mineral reserves for the purpose of reporting in accordance with subpart 1300 of Regulation S-K, and should not be
used for other purposes. The information presented originates from comprehensive techno-economic modelling, which is subject to change as assumptions and inputs are updated, and as a result does not guarantee future operational or financial
performance. Consistent with industry standards, Tronox values its mineral reserves based on the prices at which its titanium and zircon mineral products would sell on freely traded markets, as forecasted by third-party industry consultancies.
The decrease in resources at all operating sites in 2023 as compared to 2022 is primarily attributed to mining depletion. In addition, as of December 31, 2023 the remaining resources for Crayfish, Ginkgo and Wonnerup
were removed from the resources table because they were considered unlikely to ever be economically viable due to their being either too low in grade, too deeply buried, sterilized by previous mining operations or located within environmentally
sensitive locations.
Securities and Exchange Commission
Division of Corporation Finance
Appendix A – Page A-3
The decrease in reserves at all operating sites in 2023 as compared to 2022 is primarily attributed to mining depletion. In July 2023, mining ceased at Crayfish due to poor project economics. The remaining Crayfish
material was removed from reserves.
|
Mineral Assemblage (% of THM)
|
||||||||||||||||||||||||
|
2023
|
2022
|
|||||||||||||||||||||||
|
MINE /
DEPOSIT
|
Resource
Category
|
Material
(million
tons)
|
HM%
|
Ilmenite
|
Rutile
and
Leucoxene
|
Zircon
|
Change (+/-)
from 2022
(%)
|
Material
(million tons)
|
HM%
|
Ilmenite
|
Rutile
and Leucoxene
|
Zircon
|
||||||||||||
|
Namakwa Sands Dry Mine – Western Cape RSA(2)
|
||||||||||||||||||||||||
|
Measured
|
104
|
8.0%
|
30.2
|
5.9
|
6.9
|
|||||||||||||||||||
|
Indicated
|
86
|
6.5%
|
28.3
|
5.6
|
6.9
|
|||||||||||||||||||
|
Measured + Indicated
|
191
|
7.3%
|
29.3
|
5.8
|
6.9
|
|||||||||||||||||||
|
Inferred
|
110
|
5.5%
|
35.1
|
8.1
|
6.6
|
|||||||||||||||||||
|
Total
|
300
|
6.7%
|
31.4
|
6.6
|
6.7
|
|||||||||||||||||||
|
KZN Sands Hydraulic Mine – KwaZulu-Natal RSA(3)
|
||||||||||||||||||||||||
|
Measured
|
48
|
4.2%
|
64.3
|
8.1
|
7.7
|
|||||||||||||||||||
|
Indicated
|
1
|
2.0%
|
53.5
|
7.0
|
7.5
|
|||||||||||||||||||
|
Measured + Indicated
|
49
|
4.1%
|
64.1
|
8.1
|
7.6
|
|||||||||||||||||||
|
Inferred
|
56
|
3.4%
|
54.6
|
6.9
|
7.1
|
|||||||||||||||||||
|
Total
|
105
|
3.7%
|
59.1
|
7.4
|
7.3
|
|||||||||||||||||||
|
Cooljarloo – Dredge Mine – Western Australia(4)
|
||||||||||||||||||||||||
|
Measured
|
10
|
1.6%
|
59.3
|
7.7
|
9.8
|
|||||||||||||||||||
|
Indicated
|
282
|
1.5%
|
61.4
|
6.7
|
10.5
|
|||||||||||||||||||
|
Measured + Indicated
|
292
|
1.5%
|
61.3
|
6.8
|
10.4
|
|||||||||||||||||||
|
Inferred
|
12
|
2.9%
|
58.0
|
7.3
|
9.0
|
|||||||||||||||||||
|
Total
|
304
|
1.6%
|
61.1
|
6.8
|
10.4
|
|||||||||||||||||||
|
Dongara Planned Dry Mine – Western Australia(5)
|
||||||||||||||||||||||||
|
Measured
|
109
|
4.1%
|
50.2
|
9.0
|
10.8
|
|||||||||||||||||||
|
Indicated
|
31
|
3.5%
|
53.7
|
9.1
|
12.4
|
|||||||||||||||||||
|
Measured + Indicated
|
140
|
3.9%
|
52.0
|
9.1
|
11.6
|
|||||||||||||||||||
|
Inferred
|
46
|
3.7%
|
56.1
|
8.9
|
9.2
|
|||||||||||||||||||
|
Total
|
186
|
3.9%
|
52.1
|
9.0
|
10.7
|
|||||||||||||||||||
|
Atlas-Campaspe Dry Mine – New South Wales Australia(6)
|
||||||||||||||||||||||||
|
Measured
|
27
|
2.5%
|
58.8
|
10.9
|
11.7
|
|||||||||||||||||||
|
Indicated
|
-
|
-%
|
-
|
-
|
-
|
|||||||||||||||||||
|
Measured + Indicated
|
27
|
2.5%
|
58.8
|
10.9
|
11.7
|
|||||||||||||||||||
|
Inferred
|
83
|
3.1%
|
60.1
|
5.8
|
13.1
|
|||||||||||||||||||
|
Total
|
110
|
3.0%
|
59.8
|
6.9
|
12.8
|
|||||||||||||||||||
|
Port Durnford – KwaZulu-Natal RSA(7)
|
||||||||||||||||||||||||
|
Measured
|
143
|
4.5%
|
67.6
|
6.0
|
9.3
|
|||||||||||||||||||
|
Indicated
|
340
|
4.1%
|
67.4
|
6.1
|
9.3
|
|||||||||||||||||||
|
Measured + Indicated
|
483
|
4.2%
|
67.5
|
6.1
|
9.3
|
|||||||||||||||||||
|
Inferred
|
466
|
3.5%
|
71.8
|
6.3
|
10.0
|
|||||||||||||||||||
|
Total
|
949
|
3.9%
|
69.4
|
6.2
|
9.6
|
|||||||||||||||||||
|
Wonnerup Dry Mine – Western Australia(8)
|
||||||||||||||||||||||||
|
Measured
|
13
|
4.6%
|
77.5
|
12.0
|
8.8
|
|||||||||||||||||||
|
Indicated
|
6
|
4.8%
|
86.9
|
3.3
|
7.6
|
|||||||||||||||||||
|
Measured + Indicated
|
19
|
4.6%
|
80.5
|
9.2
|
8.4
|
|||||||||||||||||||
|
Inferred
|
3
|
4.4%
|
84.0
|
4.0
|
8.3
|
|||||||||||||||||||
|
Total
|
22
|
4.6%
|
81.0
|
8.5
|
8.4
|
|||||||||||||||||||
|
Ginkgo-Crayfish Dredge/ Dry Mines - New South Wales Australia(9)
|
||||||||||||||||||||||||
|
Measured
|
78
|
1.3%
|
47.9
|
18.2
|
12.4
|
|||||||||||||||||||
|
Indicated
|
-
|
-%
|
-
|
-
|
-
|
|||||||||||||||||||
|
Measured + Indicated
|
78
|
1.3%
|
47.9
|
18.2
|
12.4
|
|||||||||||||||||||
|
Inferred
|
59
|
1.1%
|
47.9
|
17.9
|
13.0
|
|||||||||||||||||||
|
Total
|
137
|
1.2%
|
47.9
|
18.1
|
12.6
|
|||||||||||||||||||
|
Kara/Cylinder - New South Wales Australia(10)
|
||||||||||||||||||||||||
|
Measured
|
-
|
-%
|
-
|
-
|
-
|
|||||||||||||||||||
|
Indicated
|
165
|
4.4%
|
49.4
|
12.9
|
12.0
|
|||||||||||||||||||
|
Measured + Indicated
|
165
|
4.4%
|
49.4
|
12.9
|
12.0
|
|||||||||||||||||||
|
Inferred
|
26
|
2.8%
|
54.4
|
24.4
|
14.2
|
|||||||||||||||||||
|
Total
|
191
|
4.1%
|
49.8
|
13.9
|
12.2
|
|||||||||||||||||||
|
Total Resources
|
||||||||||||||||||||||||
|
Measured
|
532
|
4.4%
|
49.9
|
7.5
|
8.8
|
|||||||||||||||||||
|
Indicated
|
911
|
3.6%
|
55.6
|
7.7
|
9.7
|
|||||||||||||||||||
|
Measured + Indicated
|
1,443
|
3.9%
|
53.2
|
7.6
|
9.3
|
|||||||||||||||||||
|
Inferred
|
861
|
3.5%
|
60.6
|
7.5
|
9.5
|
|||||||||||||||||||
|
Total
|
2,304
|
3.8%
|
55.8
|
7.6
|
9.4
|
|||||||||||||||||||
(See footnotes below the following table.)
Securities and Exchange Commission
Division of Corporation Finance
Appendix A – Page A-4
TRONOX MINERAL SANDS – 2023-2022 RESERVES
|
Mineral Assemblage (% of THM)
|
||||||||||||||||||||||||
|
2023
|
2022
|
|||||||||||||||||||||||
|
MINE /
DEPOSIT
|
Reserve
Category
|
Material
(million
tons)
|
HM%
|
Ilmenite
|
Rutile
and
Leucoxene
|
Zircon
|
Change (+/-)
from 2022
(%)
|
Material
(million tons)
|
HM%
|
Ilmenite
|
Rutile
and Leucoxene |
Zircon
|
||||||||||||
|
Namakwa Sands Dry Mine – Western Cape RSA(2)
|
||||||||||||||||||||||||
|
Proven
|
136
|
7.4%
|
37.6
|
8.7
|
9.0
|
|||||||||||||||||||
|
Probable
|
551
|
5.4%
|
53.8
|
11.2
|
11.4
|
|||||||||||||||||||
|
Total
|
687
|
5.8%
|
49.7
|
10.6
|
10.8
|
|||||||||||||||||||
|
KZN Sands Hydraulic Mine – KwaZulu-Natal RSA(3)
|
||||||||||||||||||||||||
|
Proven
|
198
|
5.6%
|
61.7
|
7.4
|
7.6
|
|||||||||||||||||||
|
Probable
|
11
|
3.7%
|
51.8
|
5.0
|
7.0
|
|||||||||||||||||||
|
Total
|
209
|
5.5%
|
61.3
|
7.3
|
7.6
|
|||||||||||||||||||
|
Cooljarloo – Dredge Mine – Western Australia(4)
|
||||||||||||||||||||||||
|
Proven
|
210
|
1.6%
|
61.5
|
7.7
|
10.7
|
|||||||||||||||||||
|
Probable
|
130
|
2.0%
|
60.5
|
8.3
|
12.3
|
|||||||||||||||||||
|
Total
|
340
|
1.8%
|
61.1
|
8.0
|
11.4
|
|||||||||||||||||||
|
Atlas-Campaspe Dry Mine – New South Wales Australia(6)
|
||||||||||||||||||||||||
|
Proven
|
110
|
6.3%
|
60.7
|
11.8
|
12.5
|
|||||||||||||||||||
|
Probable
|
-
|
-%
|
-
|
-
|
-
|
|||||||||||||||||||
|
Total
|
110
|
6.3%
|
60.7
|
11.8
|
12.5
|
|||||||||||||||||||
|
Wonnerup Dry Mine – Western Australia(8)
|
||||||||||||||||||||||||
|
Proven
|
9
|
5.3%
|
70.1
|
19.1
|
9.6
|
|||||||||||||||||||
|
Probable
|
4
|
5.7%
|
77.5
|
11.4
|
8.8
|
|||||||||||||||||||
|
Total
|
13
|
5.4%
|
72.6
|
16.5
|
9.4
|
|||||||||||||||||||
|
Ginkgo-Crayfish Dredge/ Dry Mines – New South Wales Australia(9)
|
||||||||||||||||||||||||
|
Proven
|
26
|
1.9%
|
51.5
|
16.3
|
12.7
|
|||||||||||||||||||
|
Probable
|
-
|
-
|
-
|
-
|
-
|
|||||||||||||||||||
|
Total
|
26
|
1.9%
|
51.5
|
16.3
|
12.7
|
|||||||||||||||||||
|
Total Resources
|
||||||||||||||||||||||||
|
Proven
|
689
|
4.7%
|
54.0
|
9.1
|
9.5
|
|||||||||||||||||||
|
Probable
|
696
|
4.7%
|
54.4
|
10.9
|
11.4
|
|||||||||||||||||||
|
Total
|
1,385
|
4.7%
|
54.2
|
10.0
|
10.5
|
|||||||||||||||||||
| (3) |
For KZN Sands, price assumptions used for resource and reserve estimations are $ per metric ton of Zircon, $ per metric ton of Ilmenite and $ per metric ton of Rutile. The
cutoff grade used for the resource estimate is based on a break-even cutoff of % ilmenite. Reserves are defined by a complex optimization process which is explained in detail in the Namakwa Sands TRS. Saleable product yield
(recovery) used for our reserve estimates were % per metric ton of Zircon, % per metric ton of Ilmenite and % per metric ton of Rutile.
|
| (4) |
For Cooljarloo, price assumptions used for resource and reserve estimations are $ per metric ton of Zircon, $ per metric ton of Chloride Ilmenite, $ per metric ton of Rutile
and $ per metric ton of Leucoxene. The cutoff grade used for the resource estimate is based on a nominal bottom cut of % HM. Reserves are defined by a complex optimization process which is explained in detail in the
Cooljarloo TRS. Saleable product yield (recovery) used for our reserve estimates were % per metric ton of Zircon, % per metric ton of Chloride Ilmenite, % per metric ton of Rutile and % per metric ton
of Leucoxene.
|
| (5) |
For Dongara, price assumptions used for preliminary resource economic assessments are $ per metric ton of Zircon, $ per metric ton of Chloride Ilmenite, $ per metric ton of
Rutile and $ per metric ton of Leucoxene.
|
| (6) |
For Atlas-Campaspe, price assumptions used for resource and reserve estimations are $ per metric ton of Zircon, $ per metric ton of Chloride Ilmenite, $ per metric ton of
Sulfate Ilmenite, $ per metric ton of Rutile and $ per metric ton of Leucoxene (East). The cutoff grade used for the resource estimate is based on a nominal bottom cut of % HM. Reserves are defined by a complex
optimization process which is explained in detail in the Atlas-Campaspe TRS. Saleable product yield (recovery) used for our reserve estimates were % per metric ton of Zircon, % per metric ton of Ilmenite, % per
metric ton of Rutile and % per metric ton of Leucoxene.
|
| (7) |
For Port Durnford, price assumptions used for preliminary resource economic assessments are $ per metric ton of Zircon, $ per metric ton of Ilmenite and $ per metric ton of
Rutile.
|
| (8) |
For Wonnerup, price assumptions used for resource and reserve estimations are $ per metric ton of Zircon, $ per metric ton of Chloride Ilmenite, $ per metric ton of Sulfate
Ilmenite, $ per metric ton of Secondary Ilmenite and $ per metric ton of Leucoxene.
|
| (9) |
For Ginkgo-Crayfish, price assumptions used for resource and reserve estimations are $ per metric ton of Zircon, $ per metric ton of Chloride Ilmenite, $ per metric ton of
Sulfate Ilmenite, $ per metric ton of Rutile and $ per metric ton of Leucoxene (East).
|
| (10) |
For Kara/Cylinder, price assumptions used for preliminary resource economic assessments are $ per metric ton of Zircon, $ per metric ton of Chloride Ilmenite, $ per metric ton
of Sulfate Ilmenite, $ per metric ton of Rutile and $ per metric ton of Leucoxene (East).
|
Securities and Exchange Commission
Division of Corporation Finance
Appendix A – Page A-5
Individual Property Disclosure
Tronox Northern Operations (Cooljarloo)
Tronox Management Pty Ltd is a subsidiary of Tronox Holdings plc and is the operator of Tronox Northern Operations which includes:
| • |
| • |
Cooljarloo West and Osprey deposits, which conjoin the Cooljarloo Mine operations;
|
| • |
Chandala Processing Plant, 60 km north of Perth, where the heavy mineral concentrates (HMC) are separated into saleable mineral products and also where ilmenite is further upgraded to synthetic rutile;
|
| • |
The laboratory and mineral testing facility is also located at the Chandala site.
|
Mining tenements in Australia are managed at the State or Territorial level. In Western Australia, Mining Leases, Exploration Licenses and Retention Licenses are granted and administered by the Western
Australian Department of Mines, Industry Regulation and Safety.
Tronox operates under four (4) mining leases which are 100% held by Tronox Management Pty Ltd., a wholly owned subsidiary of Tronox Holdings plc as shown in the Table below.
Mining Tenement Schedule
|
Region
|
Tenement
|
Tenement Type
|
Area (Ha)
|
Grant Date
|
Expiry/ Renewal Date
|
Commitment US$/a
|
Rent U$/a
|
Status of Rights
|
|
|
Cooljarloo
|
M70/1398
|
Mining Lease
|
9,744
|
2-Mar-20
|
1-Mar-41
|
701,600
|
138,900
|
Active Mining Lease
|
|
|
(Previously MSA 268)
|
|||||||||
|
Cooljarloo (West)
|
M70/1314
|
Mining Lease
|
3,782
|
18-Mar-15
|
17-Mar-36
|
272,300
|
53,915
|
EPA approval pending
|
|
|
Cooljarloo (West)
|
M70/1333
|
Mining Lease
|
420
|
4-Apr-16
|
3-Apr-37
|
30,310
|
6,000
|
EPA approval pending
|
|
|
Osprey
|
M70/1413
|
Mining Lease
|
1,319
|
5-Jul-22
|
4-Jul-23
|
132,000
|
31,680
|
Approvals process commenced
|
Tronox has one active mine site at Cooljarloo that was originally controlled by a State Agreement Act with the State of Western Australia. This area was covered by State Agreement Act MSA 268 which was
originally granted in 1989 for a period of 21 years. It was extended for a further 10-year term which expired in 2020. MSA 268 was replaced by Mining Lease M70/1398 which will expire in 2041.
Cooljarloo West is located within Mining Leases 70/1314 and 70/1333. Osprey is located within Mining Lease 70/1413. Granting of rights to mine are pending environmental approval.
The minerals in Western Australia belong to the Crown (the State of Western Australia) and Tronox is obligated to pay a 5% revenue- based royalty on saleable mineral products. This is factored into the
valuation models and optimisations conducted by Tronox.
A private royalty of 10c/t of VHM is paid for a portion of the northern section of the Cooljarloo tenement. Based on the current mine plan, mining in this royalty agreement area will cease by 2025 and
the amounts paid are not material to the business.
On Mining Lease 70/1333 Tronox agrees to pay the previous holder of the exploration lease a royalty of 1% of a previously agreed price for each tonne of Valuable Heavy Mineral recovered from the Mining
Lease. The cost will also be immaterial to the business.
Securities and Exchange Commission
Division of Corporation Finance
Appendix A – Page A-6
The Cooljarloo Mine is located at coordinates latitude 30°39'S and longitude 115°27'E.
Location of Western Australian Operations
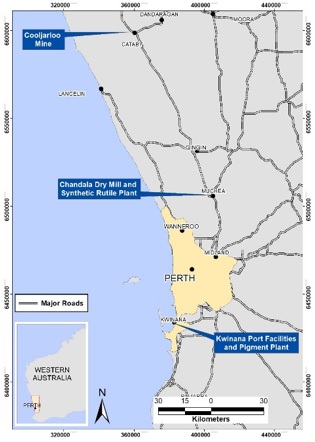
The Brand Highway is a major bitumen road running from Muchea, just North of Perth up to Geraldton, a provincial city 450 km north of Perth. The road runs just past the Western boundary of the Chandala
site and just past the Eastern boundary of the Cooljarloo mine site. It is suitable for all weather and wide loads.
There is a 132 kV power line that also runs from Perth to Geraldton which passes near the Chandala site and through the mine site. Tronox has a substation on its property that draws and reticulates 22
kV power from the sub-station connected to the main high voltage distribution line. At the various locations power is ultimately transformed down to 415 V. The same situation exists for Chandala and it gets power from the same main line.
Two gas pipelines run just a kilometer to the West of the Chandala site. They are referred to as the Dampier to Bunbury Natural Gas pipeline (DBNG) and also the Parmelia line which originates just south
of Geraldton. The Chandala Mineral Separation Plant currently gets supply for driers and re-heaters from the Parmelia line.
The countryside surrounding both Chandala and Cooljarloo is relatively flat. This made the construction of buildings and fixed plant straightforward. Storage ponds for solid waste from the MSP were able
to be made quite shallow only being a few meters above natural ground level.
Securities and Exchange Commission
Division of Corporation Finance
Appendix A – Page A-7
There is a large freshwater aquifer (Yarragadee) immediately to the west of the Brand highway adjacent to the Chandala site. Tronox has a borefield there that supplies the licensed 1 megaliter per annum
of water that the site requires. Even in times of severe drought, supply from this aquifer has never been at risk. Cooljarloo draws from an extensive field of relatively shallow bores and also an extension of the Yarragadee aquifer. To limit
pumping distances, it has been preferable to have multiple smaller bores around the site since the dredging operation has travelled more than 40 km within the mining lease area since 1989. Tailings disposal at Cooljarloo is all placed behind the
dredging operations and incorporated into the rehabilitated profile. There is a registered waste disposal pit where wastes from the MSP, the Synthetic Rutile plant and from the Kwinana pigment plant are licensed to be stored. These pits cells are
constructed above the water table and are clay lined. When each cell is full it is capped to minimize the ingress and egress of water.
The Chandala operation utilizes two port facilities. The Port of Fremantle is used for export of bagged and containerized mineral products and the Port of Bunbury is used for bulk shipments. Tronox
rents storage and warehousing facilities at or nearby to those sites.
For Cooljarloo there is a well-equipped modern permanent single person’s quarters (SPQ), capable of accommodating up to 160 people or approximately 70% of the work force. At Chandala, employees and
contractors are primarily sourced from the Perth metropolitan and surrounding areas.
History
Cooljarloo
The Cooljarloo tenements were originally pegged in 1972 by Kamilaroi Oil Company following the discovery of the Eneabba Deposits. They were subsequently obtained by Yalgoo Minerals Pty Ltd and Tific Pty
Ltd in 1985 which became part of TiO2 Corporation NL (TiO2).
In 1988 prior to mining commencing, the Cooljarloo Joint Venture was formed between Kerr-McGee Chemical Corp and Minproc Ltd, subsequent reorganizations of both partners led to 100% ownership under
Tronox in 2012.
No geological data generated by owners prior to the formation of the Cooljarloo Joint Venture is in use.
Cooljarloo West
In 1990 drilling by Peko Exploration Ltd delineated a zone of deep low-grade mineralisation but further drilling failed to intercept economic mineralisation. The tenements were relinquished in 1992.
Image Resources later pegged the area which were acquired by Tronox in 2005. Drilling completed by Tronox in 2007 delineated the deposits named Woolka Road, Harrier and Kestrel and Resources and
Reserves are based only on data generated by Tronox.
Cooljarloo Summary of Mineral Resources as of December 31, 2023
|
Mineral Assemblage
|
||||||||||||
|
Deposit
|
Mineral Resource
Classification
|
Tons of Material
(Mt)
|
Grade
HM% |
Ilmenite
(% of HM)
|
Rutile +
Leucoxene (%
of HM)
|
Zircon (% of
HM)
|
||||||
|
Cooljarloo
|
Measured
|
|||||||||||
|
Indicated
|
||||||||||||
|
Inferred
|
||||||||||||
|
Cooljarloo West
|
Measured
|
|||||||||||
|
Indicated
|
||||||||||||
|
Inferred
|
||||||||||||
|
Total Mineral Resources
|
||||||||||||
| (1) |
Mineral resources are exclusive of mineral reserves.
|
| (2) |
Price assumptions used for resource and reserve estimations are $ per metric ton of zircon, $ per metric ton of Chloride Ilmenite, $ per metric ton of Rutile and $
per metric ton of Leucoxene. Mineral prices used in Reserve estimation are substantially in line with the prices for each of our products published quarterly by independent consulting companies.
|
Securities and Exchange Commission
Division of Corporation Finance
Appendix A – Page A-8
For a comparison of the reported resources as of December 31, 2023 with the resources as of December 31, 2022, see table on page A-3. The decrease in resources in 2023 as compared to 2022
is primarily attributable to mining depletion.
Cooljarloo Summary of Mineral Reserves as of December 31, 2023
|
Mineral Assemblage
|
||||||||||||||
|
Deposit
|
Mineral Resource
Classification
|
Tons of Material
(Mt)
|
Grade
HM% |
Ilmenite
(% of HM)
|
Rutile +
Leucoxene (%
of HM)
|
Zircon (% of
HM)
|
Change
From 2022
|
|||||||
|
Cooljarloo
|
Proved
|
|||||||||||||
|
Probable
|
||||||||||||||
|
Cooljarloo West
|
Proved
|
|||||||||||||
|
Probable
|
||||||||||||||
|
Total Mineral Resources
|
||||||||||||||
For a comparison of the reported reserves as of December 31, 2023 with the resources as of December 31, 2022, see table on page A-4. The
decrease in reserves in 2023 as compared to 2022 is primarily attributable to mining depletion.
The Cooljarloo project was established in 1988. Being situated on an historical coastline, the ore body is made up of conventional mineral sands strandlines and eminently suited to dredge mining and
gravity concentration.
Since commencement, the operation has been running continuously and has thus far consumed 640 Mt of ore at approximately 2.8% HM grade. The current reserves are 307 Mt tons at 1.8% HM grade, which gives
a further 15 years of life. The current resources, which are exclusive of reserves, are 295 Mt at 1.6% HM.
Extensive and systematic exploration drilling activities are conducted at Cooljarloo and adjacent deposits on an annual basis to upgrade resources and reserves. Final reserve delineation drilling is
completed to a 50m x 40m or 50m x 20m spacing depending on the geological complexities of the orebody. Final drilling is completed three or more years in advance of the mining face to allow timely and accurate mine planning to be completed. Over
the past 13 years there has been an average of 52,000 meters of drilling completely annually at Cooljarloo. Drilling will continue is 2024.
Securities and Exchange Commission
Division of Corporation Finance
Appendix A – Page A-9
Cooljarloo mine has operated with 2 dredges in the one pond since 1999. The original Ellicott Cooljarloo1 dredge operates in tandem with the smaller capacity Neumann built Pelican dredge which was
brought into service in 2012. These bucket wheel dredges operate in a purpose-built pond which sits within the ore mining limit. The original dredge and concentrator were sized to operate at 12 Mt per annum but the original dredge has progressively
been expanded and addition of the second dredge has seen the project expand to a maximum of 25Mt per annum to counteract the impact of lower ore grades and also enable improved resource utilization through economies of scale and increased product
values.
A wet concentrator also floats in the dredge pond and is on two pontoons covering 2,250 square meters. Spiral gravity concentrators separate the higher density valuable minerals from the lower density
trash mineral and lowest density tailings quartz grains. The spiral circuit consists of five stages. Roughers, middlings, cleaners, recleaners and classifiers. Both dredges pump their feed simultaneously to the floating wet concentrator via
floating pipelines and high voltage cables for power.
Over the past 36 years of operation the metallurgical circuitry of the wet plant has remained relatively unchanged save for expanding the throughput to approximately 2850 tph. This allowed the
processing of lower grade ore which has been shown to have a better revenue to cost ratio compared to the original project assumptions. At the time of the capacity increase, spirals that were at the end of their useful life were replaced with more
modern units, of higher efficiency, to cope with both additional throughputs, the lower average feed grade, higher clay fines in the ore and maintain an acceptable mineral recovery.
HMC at Cooljarloo is loaded by front end loader into 93 tonne triple road trains for haulage to the Chandala Mineral Separation Plant (MSP). Both the mine and MSP are based on physical separation
processes. There is no need for chemical or physical alteration to achieve good product recovery and quality. Attritioning is a critical process step to ensure clean mineral surfaces that are responsive to the electrostatic HT separators. The
attritioned HMC is presented by filter belt to a natural gas fired drier that not only removes the moisture but heats the mineral so that it is most responsive to the primary stage electrostatic separation circuit.
The unit operations at the MSP are many and varied but the significant ones are as follows:
| • |
vibrating and reciprocating woven wire screening;
|
| • |
mechanical slurry attritioning;
|
| • |
gas fired fluid bed drying, reheating and cooling;
|
| • |
HT Roll, Coronastat and Plate electrostatic separators;
|
| • |
Rare Earth Drum, Rare Earth Roll, Induced Roll and Semi-Lift magnetic separators;
|
| • |
Hydrosizing; and
|
| • |
spiral gravity and centrifugal jig concentrators.
|
The equipment and infrastructure at both Cooljarloo and Chandala are in good order having been upgraded several times such that the total throughput of the mining operation now averages 21 Mt per annum
and whilst the Mineral Separation Plant has not needed capacity increase, updated technology and implementation of continuous improvement programmes have resulted in significant increases in mineral recoveries.
Securities and Exchange Commission
Division of Corporation Finance
Appendix A – Page A-10
Since Cooljarloo is an operating mine and processing plant, capital is mostly a sunk cost. There is minor stay in business capital incurred annually and there is US$55M of capital forecast with the move
to the nearby Cooljarloo West dredging orebody expected in approximately 2033.
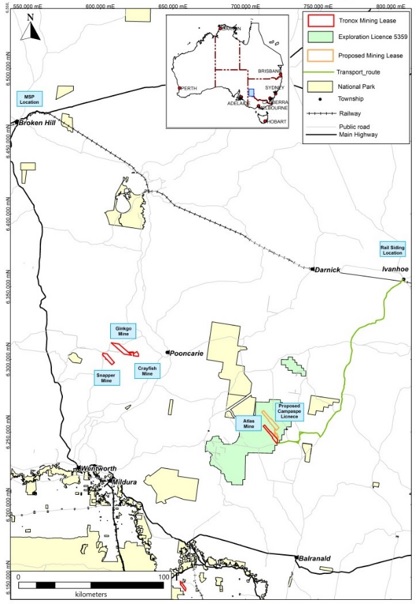
Tronox Eastern Operations (Atlas-Campaspe)
Tronox Mining Australia Ltd is a subsidiary of Tronox Holdings plc and is the operator of Tronox Eastern Operations which includes:
| • |
The Ginkgo Mine, 110 km north of Wentworth in southwestern New South Wales, where heavy mineral concentrates are currently produced from dredge mining operations;
|
| • |
The Snapper and Crayfish rehabilitation sites, adjacent to Ginkgo where former mineral sands mines are undergoing restoration following the completion of mining;
|
| • |
The Atlas-Campaspe project in southwestern New South Wales, 120 km northeast of Mildura, where heavy mineral concentrates are currently produced from dry mining operations at Atlas and site development
and approval activities have commenced for future mining operations at Campaspe;
|
| • |
A rail siding and HMC stockpile facility at Ivanhoe, approximately 140 km northeast of the Atlas Mine, where HMC is dispatched to Broken Hill for further processing.
|
| • |
Broken Hill Mineral Separation Plant in southwestern New South Wales, where the heavy mineral concentrates (HMC) are separated into mineral products and either railed approximately 430 km to the Port of
Adelaide or railed directly to Western Australia using the Trans Australian Railway;
|
| • |
Port of Adelaide, South Australia, where bulk mineral sands products from Broken Hill are loaded for export.
|
Mining tenements in Australia are managed at the State or Territorial level. In New South Wales, Mining Leases, Exploration Licenses and Assessment Leases are granted and administered by the New South
Wales Department of Primary Industries Mineral Resources Division.
The Development Consent for Atlas and Campaspe was granted in June 2014 and construction of the Atlas Project was completed in early 2023. The Atlas deposit is secured by Mining Lease 1767. The Campaspe
deposit is secured by the Atlas/Campaspe Mineral Sands Project Development Consent SSD_5012 from the Government of New South Wales. In November 2023 a mining lease application (MLA 639) was lodged over the Campaspe deposit, Grant of this tenement
is pending.
The minerals in New South Wales belong to the Crown (the State of NSW) and Tronox is obligated to pay a 4% revenue-based royalty on all saleable minerals produced.
All the land encompassing the intended mining area has been purchased by Tronox so no mining compensation payments to landowners will be required as part of the Atlas-Campaspe Project.
The net book value of Atlas-Campaspe, inclusive of mining and beneficiary equipment located in New South Wales as well as relevant mining tenements, as of December 31, 2023 was $
.
The Atlas mine is located at coordinates latitude 33°53’S and longitude 143°21’E. The Campaspe mine is located at coordinates latitude 33°49’S and longitude 143°22’E.
Securities and Exchange Commission
Division of Corporation Finance
Appendix A – Page A-11
Regional location of Atlas/Campaspe Project
Infrastructure
Atlas
The Atlas minesite is located in southwestern New South Wales, 120 km northeast of Mildura and 90 km north of Balranald. Access to the licence area is via the Balranald Ivanhoe Hwy, the
Boree Plains —Gol Gol road and then through the official Atlas Mine Access Road. The Atlas mine consists of a centrally based Wet Concentrator Plant (WCP) and a Dry Mining Unit (DMU) both rated to 500 tph.
An on-site 200-person accommodation village has been constructed to house the workforce and consists of permanent and demountable buildings and facilities such as: Administration and Office Building;
Workshops; Process Area Crib Room and Amenities; Gymnasium; Basketball Court and Main Store. Electrical power is supplied directly from a centralized 5 Mwh diesel generation system.
Hydrological investigations identified a bore field location at the Northern end of the mine path, approximately 5km from the central start-up pit location. This bore field supplies water for the mining
operations and ancillaries. A total of seven bore pumps supply the required volume.
Securities and Exchange Commission
Division of Corporation Finance
Appendix A – Page A-12
A RO Plant and potable water treatment plant sized to deliver 115m3/hour has been installed to supply wash water for the HMC and potable water for site buildings, wash pads and the accommodation
village.
A communication building is located adjacent to the communication tower for telecom and the Local Area Network (LAN). Data and telephone connection between the communications
building, process area, administration area and accommodation village are via a buried fiber optic cable.
HMC from the Atlas mine is transported by a combination of trucks and train. The road network consists of approximately 37 km of existing unsealed roads between the Atlas-Campaspe
Mine site access road and the intersection with the sealed Balranald-Ivanhoe Road. The remaining section is a 138 km long bitumen road leading to the Ivanhoe rail siding. HMC is loaded into a train for transport to the Broken Hill Mineral
Separation Plant (BH MSP) over approximately 301 km of railway.
Campaspe Project Status and Site Development Works
At the conclusion of mining at Atlas production will transition to Campaspe. Detailed mine planning and final approvals are underway. The development of the Campaspe site and
required plant to operate includes:
| • |
fencing of the mine lease (47 km);
|
| • |
construction of the access road (11 km);
|
| • |
construction of the mine corridor road (5.4 km);
|
| • |
construction of the process water dam (210,000 m3);
|
| • |
development of the mining pit;
|
| • |
development of the bore field and water reticulation systems;
|
| • |
relocation of workshops and amenities;
|
| • |
expansion of the accommodation village from 200 to 300 beds;
|
| • |
construction of a Primary Concentration Plant (PCP); and
|
| • |
relocation of Ginkgo/Snapper field booster pumps and piping.
|
History
In the Murray Basin fine heavy mineral occurrences were identified from 1982 to 1986 by Rio Tinto. Subsequently many smaller, coarser and high-grade deposits were also identified, and these formed the
first mineral sands mines to be developed in the region. Bemax Resources discovered the Ginkgo, Snapper and Crayfish deposits at Pooncarie in the early to mid-2000’s. Mining commenced at Ginkgo in 2005 and Snapper in 2010. Mining at Snapper was
completed in April 2022 and Crayfish was completed in July 2023. Ginkgo is still being mined today by Tronox.
The Atlas-Campaspe Project replaces production from the completed Snapper and Crayfish deposits and the Ginkgo mining operation when it ceases production in mid-2024. Atlas commenced full production in
early 2023.
Securities and Exchange Commission
Division of Corporation Finance
Appendix A – Page A-13
Summary of Resources and Reserves
Atlas-Campaspe Summary of Mineral Resources as of December 31, 2023
|
Deposit
|
Mineral Reserve
Classification
|
Ore Tons (Mt)
|
Grade
HM%
|
Mineral Assemblage
|
||||||||
|
Ilmenite +
Leucoxene (% of
HM)
|
Rutile (%
of HM)
|
Zircon (%
of HM) |
||||||||||
|
Atlas
|
Measured
|
|||||||||||
|
Indicated
|
||||||||||||
|
Inferred
|
||||||||||||
|
Campaspe
|
Measured
|
|||||||||||
|
Indicated
|
||||||||||||
|
Inferred
|
||||||||||||
|
Total Mineral Resources
|
||||||||||||
| (1) |
Mineral resources are exclusive of mineral reserves.
|
For a comparison of the reported resources as of December 31, 2023 with the resources as of December 31, 2022, see table on page A-3. The
decrease in resources in 2023 as compared to 2022 is primarily attributable to mining depletion.
Atlas-Campaspe Summary of Mineral Reserves as of December 31, 2023
|
Deposit
|
Mineral Reserve
Classification
|
Ore Tons
(Mt)
|
Grade
HM%
|
Mineral Assemblage
|
Change from
2022
|
|||||||||
|
Ilmenite +
Leucoxene (% of
HM)
|
Rutile (% of HM)
|
Zircon (%
of HM)
|
||||||||||||
|
Atlas
|
Proved
|
|||||||||||||
|
|
Probable
|
|||||||||||||
|
Campaspe
|
Proved
|
|||||||||||||
|
Probable
|
||||||||||||||
|
Total Mineral Reserves
|
||||||||||||||
| (1) |
Price assumptions used for resource and reserve estimations are $ per metric ton of zircon, $ per metric ton of Chloride Ilmenite, $ per metric ton of Sulfate Ilmenite,
$ per metric ton of Rutile and $ per metric ton of Leucoxene (East). Mineral prices used in reserve estimation are substantially in line with the prices for each of our products, published quarterly by independent
consulting companies.
|
| (2) |
Conversion of in ground grade to saleable product yield (recovery), considering all the losses during mining and processing, is typically % for ilmenite, % for rutile, %
for Leucoxene and % for zircon.
|
For a comparison of the reported reserves as of December 31, 2023 with the resources as of December 31, 2022, see table on page A-4. The decrease in reserves in 2023 as compared to 2022 is primarily attributable to mining depletion.
Condition of Property
Construction at Atlas commenced in 2022 and ramped up to full production in the first quarter of 2023. The Atlas deposit is mined using a dry mining method for both the overburden stripping and
ore extraction.
As the equipment and infrastructure (including the DMU, WCP and all associated infrastructure) at Atlas is new and within its first year of operational life it is in good condition.
Dry mining at Campaspe will replace production from Atlas when Atlas finishes in 2027. Detailed design work and additional approvals are presently being undertaken.
Securities and Exchange Commission
Division of Corporation Finance
Appendix A – Page A-14
Extensive and systematic exploration drilling activities have been conducted at Atlas and Campaspe on an annual basis to upgrade resources and reserves. Final reserve delineation drilling is
completed to 100m x 20m spacing. Final drilling is completed three or more years in advance of the mining face to allow timely and accurate mine planning to be completed. As such, all drilling has been completed at Atlas. Final infill drilling
has also been completed for the first five (5) years of mining at Campaspe. Over the past 13 years there has been an average of 50,000 meters of drilling completed annually at Tronox’s Eastern Operations. Drilling will continue at Campaspe and
surrounding areas in 2024.
Namakwa Mine
Tronox Mineral Sands Pty Ltd is a subsidiary of Tronox Holdings Plc and holds 100% of the rights at the Namakwa Sands Operations, which is located along the west coast of the Western Cape province,
South Africa. The Namakwa Sands Operations includes:
| • |
The Northern operations consisting of the Namakwa Sands Mine at Brand-se-Baai and the Mineral Separation Plant at Koekenaap.
|
| • |
The Southern operations that consist of the Smelting Operations at Saldanha Bay along with administrative headquarters.
|
Run of mine production at the Namakwa Sands Mine comes from two shallow open-cast mines where excavators and front-end loaders extract free-flowing and lightly cemented sand. The ore is conveyed to
two primary concentrator plants (PCP) that utilize wet spirals to produce a heavy mineral concentrate. These concentrates are pumped to a secondary concentrator plant (SCP) where wet high-intensity magnetic separators (WHIMS) and spirals are
used to produce a zircon-rich non-magnetic concentrate, and a magnetic concentrate comprising mainly ilmenite. An ilmenite rich secondary stream from the SCP is reprocessed at a separate plant called the UMM Plant to produce a crude ilmenite.
SCP and UMM concentrates are separately trucked to and treated at the mineral separation plant (MSP) near Koekenaap, where a series of magnetic and electrical high-tension separators are employed to produce finale saleable ilmenite, rutile,
and zircon products. These products are transported from the Mineral Separation Plant to the Smelter using the Saldanha-Sishen railway network.
The Southern Operations consist of the administrative headquarters and smelter operations and are located 3 km from the Saldanha export harbour. The smelting process comprises the carbonaceous
reduction of ilmenite using DC arc furnaces to produce titanium slag and pig iron. The received rutile and zircon products as well as the titanium slag are stored in on-site silos from where it is distributed in bag, container, or bulk shipment
format.
Mining tenements in South Africa are managed at a national level. In the Western Cape, Mining Rights and Prospecting Rights are granted and administered by the South African Department of Mineral
Resources and Energy (DMR&E).
The Mining Rights for Namakwa are shown in the table and figure below.
Tronox Mining Rights, west coast of South Africa
|
Area/Farm
|
DMRE Ref. no.
|
Area (ha)
|
Current status
|
|||
|
Goeraap 140 Portion 17
|
WC 30/5/1/2/2/114 MR
|
250
|
active, expires 17 August 2038
|
|||
|
Graauwduinen 152 Portion 1
|
WC 30/5/1/2/2/114 MR
|
2,978
|
active, expires 17 August 2038
|
|||
|
Hartebeeste Kom 156 Portion 1 & 2
|
WC 30/5/1/2/2/114 MR
|
3,903
|
active, expires 17 August 2038
|
|||
|
Rietfontein Ext 151 Portion 1 & 2
|
WC 30/5/1/2/2/114 MR
|
2,084
|
active, expires 17 August 2038
|
|||
|
Hartebeeste Kom 156 Portion 3
|
WC 30/5/1/2/2/113 MR
|
1,790
|
active, expires 17 August 2038
|
|||
|
Houtkraal 143 Portion 3
|
WC 30/5/1/2/2/113 MR
|
1,780
|
active, expires 17 August 2038
|
|||
|
Graauwduinen 152 Portion 2
|
WC 30/5/1/2/2/10040 MR
|
599
|
active, expires 29 March 2046
|
|||
|
Graauwduinen 152 Remaining Extent
|
WC 30/5/1/2/2/10040 MR
|
1,776
|
active, expires 29 March 2046
|
|||
|
Rietfontein Ext 151 Remaining Extent
|
WC 30/5/1/2/2/10040 MR
|
2,536
|
active, expires 29 March 2046
|
|||
|
Houtkraal 143 Remainder of Portion 2
|
WC 30/5/1/2/2/10040 MR
|
645
|
active, expires 29 March 2046
|
|||
|
Houtkraal 143 Remaining Extent
|
WC 30/5/1/2/2/10040 MR
|
864
|
active, expires 29 March 2046
|
Securities and Exchange Commission
Division of Corporation Finance
Appendix A – Page A-15
The net book value of the Namakwa Sands mine, inclusive of mining and beneficiary equipment located in the Western Cape of South Africa as well as relevant mining tenements, as of
December 31, 2023 was $ . The Namakwa Sands Mine is located at coordinates 31°16’S and 17°54’E.
Location of Western Cape operations
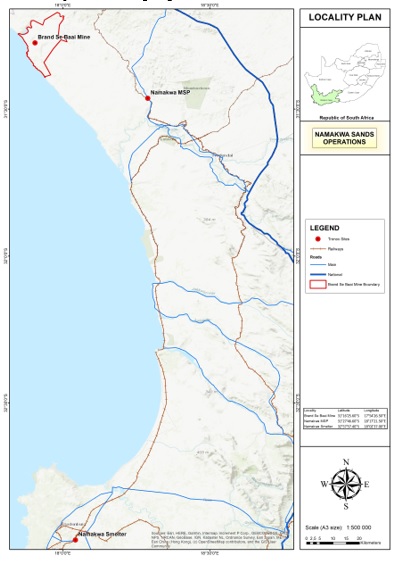
Infrastructure
Potable water is sourced from the Olifants River Irrigation Scheme canal system. Water is distributed to the MSP and Brand-se-Baai (BsB) for process and domestic use. Water is pumped to BsB via a 56
km pipeline at the rate of 280 m3/h. This line also provides water to farmers along the line and rehabilitation areas at the Namakwa Sands Mine. Namakwa Sands holds servitude rights in the area adjacent to the tar sealed road between the
Mineral Separation Plant and the Mine. Seawater is used in the primary and secondary separation processes and is pumped via the seawater pump station installation close to the Namakwa Sands Mine.
ESCOM supplies the MSP via the 132 kV line from the Juno substation. A 132/22 kV, 20 MVA transformer from ESCOM supplies both the MSP and a local farm.
Securities and Exchange Commission
Division of Corporation Finance
Appendix A – Page A-16
The minerals are transported with purpose-built trailers and trucks between the Namakwa Sands and the MSP at Koekenaap. The trucks travel on a tar seal road constructed for this purpose. A
Sishen-Saldanha railway line connects the MSP and Smelter sites. The minerals are transported from the MSP to the Smelter/port storage in closed container trucks, to prevent mineral losses and contamination.
History
Exploration for heavy minerals along the coastal strip of southwest Africa led to the discovery and subsequent delineation of the Namakwa Sands deposit near Brand-se-Baai in 1987. In September 1994
Anglo Operations Ltd commenced mining and processing at the West mine ore body. In 2008 Exxaro Resources acquired the Namakwa operations from Anglo and then in 2012 Tronox acquired 74% of Namakwa Mineral Sands Pty Ltd. In 2021 Tronox acquired
the whole of Namakwa Mineral Sands Pty Ltd.
Summary of Resources and Reserves
Namakwa Sands Summary of Mineral Resources at the End of the Fiscal Year Ended 2023
|
Mineral Resources
Category
|
Material Tons Mt
|
HM Grade (%)
|
Mineral Assemblage
|
|||||||
|
Ilmenite Grade (%)
|
Rutile +
Leucoxene
Grade (%)
|
Zircon Grade (%)
|
||||||||
|
Measured
|
||||||||||
|
Indicated
|
||||||||||
|
Measured + Indicated
|
||||||||||
|
Inferred
|
||||||||||
|
TOTAL
|
||||||||||
| (1) |
Cutoff grade applied is % zircon
|
| (2) |
Mineral Resources are exclusive of mineral reserves. Price assumptions used for resource and reserve estimations are $ per metric ton of zircon, $ per metric ton of Ilmenite and
$ per metric ton of Rutile.
|
For a comparison of the reported resources as of December 31, 2023 with the resources as of December 31, 2022, see table on page A-3. The
decrease in resources in 2023 as compared to 2022 is primarily attributable to mining depletion.
Namakwa Sands Summary of Mineral Reserves at the End of the Fiscal Year Ended 2023
|
Mineral Resources
Category
|
Material Tons Mt
|
THM Grade (%)
|
Mineral Assemblage
|
Change from
2022
|
||||||||
|
Ilmenite Grade (%)
|
Rutile +
Leucoxene
Grade (%)
|
Zircon Grade (%)
|
||||||||||
|
Proven
|
||||||||||||
|
Probable
|
||||||||||||
|
TOTAL
|
||||||||||||
| (1) |
Price assumptions used for resource and reserve estimations are $ per metric ton of zircon, $ per metric ton of Ilmenite and $ per metric ton of Rutile. Mineral prices
used in Reserve estimation are substantially in line with the prices for each of our products published quarterly by third-party industry consultancies.
|
| (2) |
Conversion of in ground grade to saleable product yield (recovery), considering all the losses during mining and processing, is typically % for ilmenite, % for rutile, and
% for zircon.
|
For a comparison of the reported reserves as of December 31, 2023 with the resources as of December 31, 2022, see table on page A-4. The
decrease in reserves in 2023 as compared to 2022 is primarily attributable to mining depletion.
Securities and Exchange Commission
Division of Corporation Finance
Appendix A – Page A-17
Condition of Property
The operations at Namakwa Sands were originally established by Anglo in 1996 and have operated continuously since that time. Open-cast mining, also known as strip mining, both classified as surface
mining techniques, takes place in two distinct areas known as the East and West Mines. The East Mine comprises predominantly shallow mineral sands stripping, whereas the West Mine entails shallow stripping of mineral sands followed by a deeper
open-cast mining operation recovering lightly cemented materials to about 40 meters.
More than 200,000 meters of drilling has been completed to date, to define the pre-mine Namakwa mineral resources base from surface down to bedrock. In-fill drilling, assaying and metallurgical test
work will continue over the next decade with the strategy to upgrade current mineral resources to fully measured status, as well as converting mineral resources to mineral reserves, with a focus on proven mineral reserves realization.
The mining and mineral processing flowsheet and equipment of the Northern Operations have remained basically the same since the last throughput upgrade in 2008. The equipment and infrastructure at
both mines are in sound working order, having been upgraded such that the total throughput of the mining operations now averages around 23 Mt per annum. A major mine development project, expected to be operational in 2026 is currently in the
execution stage to extract and beneficiate the deeper lying ore in the East Mine beneath the shallow sands that are nearing its end of life.
Other changes include minor equipment replacements and technology updates, as well as circuit re-configurations as part of an embedded continuous improvement drive. Most recently, a small standalone
scavenger plant has been added to the SCP flowsheet to augment attritioned magnetic concentrate production by consuming excess unattritioned ilmenite produced from the WHIMS circuit. Routine work maintenance programs are solidly entrenched,
being directed by physical asset care plans targeting the maximum life and efficiency of plant, property and equipment holistically.
KZN Sands
Tronox KZN Sands Operations, which are located along the east coast of the Kwa-Zulu Natal province, South Africa are wholly owned subsidiaries of Tronox Holdings Plc, and include the:
| • |
Fairbreeze Mine, immediately south of the Mtunzini township with the Primary Wet Plant (PWP) situated a further 8 km south of Mtunzini.
|
| • |
Central Processing Complex (CPC), 50 road km north of Mtunzini, just outside the town of Empangeni, is where heavy mineral concentrates are processed into mineral products and ilmenite is further
converted to titanium rich slag and pig iron in two direct current arc furnaces. The laboratory and mineral testing facilities are also located at CPC.
|
A hybrid mining method is employed at Fairbreeze Mine, utilizing track dozers to break lightly cemented ore layers in combination with high- pressure hydraulic mining using water monitor guns to
pump slurried ore to the Primary Wet Concentrator (PWP) for wet gravity recovery of heavy minerals.
The resultant heavy mineral concentrate is trucked to the CPC, which is configured with relatively standard equipment to produce saleable ilmenite, rutile and zircon products. The ilmenite is
dispatched to the bordering smelting process encompassing the carbonaceous reduction of ilmenite using DC arc furnaces to produce titanium slag and pig iron. The rutile and zircon products as well as the titanium slag are stored in on-site
silos from where it is distributed in bag, container, or bulk shipment format destined for the Richards Bay harbor.
Mining tenements in South Africa are managed at a national government level. In KwaZulu-Natal, Mining Rights and Prospecting Rights are granted and administered by the regional office of the South
African Department of Mineral Resources and Energy (DMRE).
The Mining Rights for Fairbreeze are shown in the table and figure below.
Securities and Exchange Commission
Division of Corporation Finance
Appendix A – Page A-18
Tronox Mining Rights for Fairbreeze
|
Area/Farm
|
DMRE Ref. no.
|
Area (ha)
|
Current status
|
|||
|
Fairbreeze A, B, C, D
|
KZN 30/5/1/2/2/123 MR
|
3,810
|
expires 24 March 2035
|
|||
|
Fairbreeze CX
|
KZN 30/5/1/2/2/164 MR
|
231
|
expires 04 August 2039
|
The net book value of the Fairbreeze mine, inclusive of mining and beneficiary equipment located in the Kwa-Zulu Natal province of South Africa as well as relevant mining tenements,
as of December 31, 2023 was $ . The Fairbreeze Mine is located at coordinates 29°00’S and 31°42’E.
Mining Rights and Surface Ownership
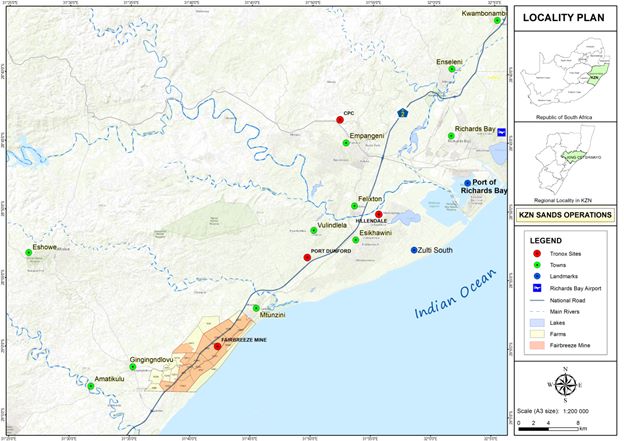
Infrastructure
Fresh water is sourced from the uMhlatuze River upgraded installation that originally supplied the Hillendale Mine. This system was upgraded to a pipeline of 750 mm nominal diameter over
approximately 33 km to the Fairbreeze Mine and discharging into the raw water dam, from where it is further distributed for mining and minerals processing, as well as potable use.
Bulk electricity supply for the Fairbreeze Mine is from 88 kV and 132 kV ESCOM power lines that run adjacent to the residue storage facilities and feeds the Fairbreeze substation.
Access to the PWP is from off ramps at Bridge 4 on the national highway N2, south of the town of Mtunzini. Road transport for HMC to the MSP at Empangeni, a distance of 50 km, is along the N2 highway utilizing side
tipping trucks. Gypsum waste and MSP sand tailings are returned on the backhaul. There is another route between Fairbreeze and the MSP along the R102 that can be used in emergencies. Railway networks in
and around the region are suitable for the cargo requirements of the harbor and local industry and are directly connected to the national network for import/export purposes. The Richards Bay harbor operates a very large coal-handling terminal
and controls a wide range of import and export cargos. Durban also has port facilities that Tronox uses to export containerized and bagged product from.
Securities and Exchange Commission
Division of Corporation Finance
Appendix A – Page A-19
History
Natal Mineral Sands (NMS), prospected for mineral sands on Hillendale and Fairbreeze in the northern coast of KwaZulu-Natal during the 1980’s. Iscor Limited purchased NMS in 1994 and mining
activities commenced in 2001 at the Hillendale Mine. In 2012, Tronox announced the acquisition of 74% of KZN Mineral Sands operations. Production commenced at Fairbreeze in 2015 and in 2021 Tronox acquired the whole of the remaining portion it
did not own of the KZN Sands operations.
Summary of Resources and Reserves
Fairbreeze Summary of Mineral Resources at the End of the Fiscal Year Ended 2023
|
Mineral Resources
Category
|
Material Tons Mt
|
HM Grade (%)
|
Mineral Assemblage
|
|||||||
|
Ilmenite Grade (%)
|
Rutile +
Leucoxene
Grade (%)
|
Zircon Grade (%)
|
||||||||
|
Measured
|
||||||||||
|
Indicated
|
||||||||||
|
Measured + Indicated
|
||||||||||
|
Inferred
|
||||||||||
|
TOTAL
|
||||||||||
| (1) |
Cutoff grade applied is % zircon.
|
| (2) |
Mineral Resources are exclusive of mineral reserves. Price assumptions used for resource and reserve estimations are $ per metric ton of zircon, $ per metric ton of Ilmenite and
$ per metric ton of Rutile.
|
For a comparison of the reported resources as of December 31, 2023 with the resources as of December 31, 2022, see table on page A-3. The
decrease in resources in 2023 as compared to 2022 is primarily attributable to mining depletion.
Fairbreeze Summary of Mineral Reserves at the End of the Fiscal Year Ended 2023
|
Mineral Resources
Category
|
Material Tons Mt
|
HM Grade (%)
|
Mineral Assemblage
|
Change from
2022
|
||||||||
|
Ilmenite Grade (%)
|
Rutile +
Leucoxene
Grade (%)
|
Zircon Grade (%)
|
||||||||||
|
Proven
|
||||||||||||
|
Probable
|
||||||||||||
|
TOTAL
|
||||||||||||
| (1) |
Price assumptions used for resource and reserve estimations are $ per metric ton of zircon, $ per metric ton of Ilmenite and $ per metric ton of Rutile. Mineral prices
used in Reserve estimation are substantially in line with the prices for each of our products published quarterly by third-party industry consultancies.
|
| (2) |
Conversion of in ground grade to saleable product yield (recovery), considering all the losses during mining and processing, is typically % for ilmenite, % for rutile, and
% for zircon.
|
For a comparison of the reported reserves as of December 31, 2023 with the resources as of December 31, 2022, see table on page A-4. The
decrease in reserves in 2023 as compared to 2022 is primarily attributable to mining depletion.
Securities and Exchange Commission
Division of Corporation Finance
Appendix A – Page A-20
Condition of Property
In 2001, the Hillendale Mine started to supply HMC concentrate to the CPC, in Empangeni for further minerals processing to saleable mineral products. In 2015 after its useful life, and a
production-break, most of the Hillendale Mine’s useful, movable equipment was transferred to the nearby newly established Fairbreeze Mine. Mining at Hillendale Mine was exclusively hydraulic mining, but due to the partially semi-consolidated
nature of the Fairbreeze ore bodies, a hybrid open-cast mining method is employed at Fairbreeze Mine, utilizing track dozers to break up the ore where required to assist high- pressure hydraulic mining using water monitor guns to pump slurried
ore to the PWP for wet gravity recovery of heavy minerals.
Close to 90 000 meters of drilling has been completed to date to define the pre-mine Fairbreeze mineral resources base from surface down to bedrock. Drilling, assaying and metallurgical test work
will continue over the next decade with the strategy to upgrade current mineral resources to fully measured status, as well as converting mineral resources to mineral reserves, with a focus on proven mineral reserves realization. The equipment
and infrastructure of the Fairbreeze Mine and PWP are in sound working order, having been upgraded as such that the total throughput of the mining operation averaged around 10 Mt per annum for the initial Phase 1 upgrade. Freshly supplied HMC
continued to utilize the existing infrastructure at the CPC, Empangeni, being a fully functional mineral separation plant for zircon, ilmenite and rutile products and smelting operations using two DC arc furnaces to produce of TiO2 slag and pig
iron, on the same site.
More recently a Phase 2 expansion of the operation at Fairbreeze Mine was commissioned in order to maintain heavy mineral concentrate (HMC) production due to lower THM grades in the ore. The
expansion involves increasing the mining and PWP processing rate to about 16 Mt per annum, which require upgrades to the upfront desliming circuit, a further upgrade of the clay fines thickening and residue disposal equipment, rougher spiral
capacity, increased concentrator building and additional process water pumping capacity. Mineral recoveries will be maintained following the expansion as will product quality. A residue storage facility (RSF) called MegaSebeka is currently in
place and operational, however with the recent increase in mineral reserves, mine life and planned mining rate, an adjacent area called the Everglades RSF will be constructed nearby.
Otherwise, the Mineral Separation Plant (MSP) used to convert HMC into saleable mineral products is the same that was used for the KZN project’s original mining at Hillendale. Other changes include
minor equipment replacements and technology updates, as well as circuit re-configurations as part of an embedded continuous improvement drive. Routine work maintenance programs are solidly entrenched, being directed by physical asset care plans
targeting the maximum life and efficiency of plant, property and equipment holistically.
* * * *
Appendix B
Illustrative Disclosure to the Amendments to Exhibit 96.1 – Technical Report
Summary for Cooljarloo
Illustrative disclosure in response to comment 9:
Section 6 of the TRS will be amended to include the following paragraph:
Stratigraphic column of the Perth Basin as of December 31, 2021:
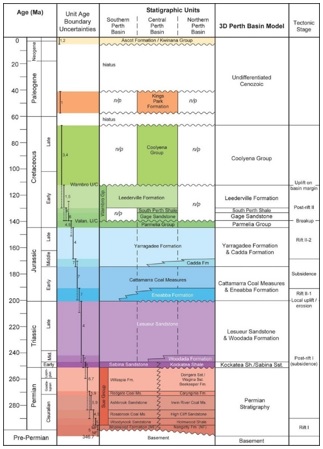
Illustrative disclosure in response to comment 11:
Section 14 of the TRS will be amended to include the following paragraphs:
Estimated saleable product yield (recovery) for the year ended December 31, 2021:
|
Description
|
Total Recovery %
|
||
|
Ilmenite
|
84.7
|
||
|
Zircon
|
83.2
|
||
|
Rutile
|
88.0
|
||
|
Leucoxene
|
78.7
|
In the opinion of the QP, the methodology employed in this section was appropriate and the data derived from the testing activities described above are adequate for the purposes of defining a
Mineral Resource as of the effective date of this report.
B-1
Securities and Exchange Commission
Division of Corporation Finance
Appendix B – Page B-2
Illustrative disclosure in response to comments 12, 13 and 15:
Section 11 of the TRS will be amended to include the following paragraphs:
Cutoff Grade (for the year ended December 31, 2021)
The nominal cutoff grade used to estimate resources in Tronox’s Northern Operations is generally 1% HM. This is between the breakeven grade for the minerals production side of the business and the
marginal cost grade where certain material needs to be moved and it is cheaper to process and receive revenue than it is to extract it with earth moving equipment and transport it the waste dump. The 1% HM cutoff grade generally follows a
natural geological boundary and allows smooth geometric shapes to be modelled. The 1% HM cutoff also captures all material within the deposit which has the potential to be economic.
The reserve estimates are calculated during a resource optimization process using a series of complex mathematical routines. Inputs to the optimization process include mineral pricing, saleable
product yield (recovery), variable costs and fixed costs. When the optimization process is run over the three-dimensional resource model, which contains variable HM grades, variable mineralogy, variable clay and rock content, variable orebody
thickness and variable depth of burial the optimization process determines which parts of the resource should be converted to reserves. As such, it is not possible to quote a single cutoff grade as the reserve at any given location is a
combination of HM%, clay%, mineralogy, orebody thickness and depth of burial.
The base assumptions used in this optimization process are:
| ● |
Saleable product yield (recovery): ilmenite 84.7%, rutile 88%, zircon 83.2% and leucoxene 78.7%
|
| ● |
Commodity prices: $235/metric ton for chloride ilmenite, $932/metric ton for rutile, $1,318/metric ton for zircon and $873/metric ton for leucoxene
|
| ● |
Operating cost: $2.85 per metric ton ore mined
|
| ● |
Mineral prices used are substantially in line with the prices for each of our products published quarterly by third-party independent consultancies.
|
Illustrative disclosure in response to comment 14:
In the Qualified Person’s opinion, all issues relating to relevant technical and economic factors likely to influence the prospect of economic extraction can be resolved with further work.
Illustrative disclosure in response to comments 16 and 19:
Section 19 of the TRS will be amended to include the following paragraph:
Long term real pricing used in the economic analysis (US$/MT, 2021 real terms, rounded).
|
Product
|
2016
|
2017
|
2018
|
2019
|
2020
|
2021
|
Forecast
2022 –
2026
(annual
average)
|
Forecast
2027 –
2031
(annual
average)
|
Forecast
2022 –
2036
(annual
average)
|
Forecast
2037 –
2040
(annual
average)
|
|
|
Chloride Ilmenite
|
165
|
158
|
159
|
250
|
230
|
235
|
293
|
312
|
313
|
314
|
|
|
Rutile
|
750
|
735
|
819
|
851
|
992
|
932
|
973
|
984
|
960
|
941
|
|
|
Leucoxene
|
608
|
686
|
690
|
755
|
844
|
873
|
911
|
922
|
900
|
882
|
|
|
Zircon
|
1,000
|
882
|
1,364
|
1,587
|
1,564
|
1,318
|
1,378
|
1,454
|
1,501
|
1,524
|
Consistent with industry standards, Tronox values its mineral reserves based on the prices at which its titanium and zircon mineral products would sell on freely traded markets, as forecasted by
third-party industry consultancies.
Securities and Exchange Commission
Division of Corporation Finance
Appendix B – Page B-3
Illustrative disclosure in response to comment 17:
Section 19 of the TRS will be amended to include the following paragraph:
LOM Plan Summary (for the year ended December 31, 2021)
|
Annual Averages(1)
|
2022-2026
|
2027-2031
|
2032-2036
|
2037-2040
|
|
|
Ore Mined (kt)
|
21,024
|
23,143
|
23,278
|
23,045
|
|
|
HM (%)
|
1.9
|
1.7
|
2.0
|
1.6
|
|
|
Ilmenite (in HM%)
|
58.4
|
61.5
|
59.3
|
61.7
|
|
|
Rutile (in HM%)
|
5.3
|
5.5
|
5.3
|
5.1
|
|
|
Leucoxene (in HM%)
|
1.7
|
2.4
|
2.9
|
2.9
|
|
|
Zircon (in HM%)
|
8.5
|
11.1
|
12.2
|
12.5
|
| (1) |
Amounts presented are based on weighted averages.
|
Illustrative disclosure in response to comment 18:
Section 19 of the TRS will be amended to include the following paragraph:
|
Annual Total
|
2019
|
2020
|
2021
|
|
|
Plant Throughput (kt)
|
23,808
|
25,104
|
23,558
|
|
|
Ilmenite saleable product yield (recovery) (%)
|
75.6
|
80.2
|
95.8
|
|
|
Rutile saleable product yield (recovery) (%)
|
89.6
|
93.9
|
92.3
|
|
|
Zircon saleable product yield (recovery) (%)
|
69.5
|
75.5
|
89.7
|
|
|
Leucoxene saleable product yield (recovery) (%)
|
74.7
|
90.0
|
90.9
|
Illustrative disclosure in response to comment 20:
In the Qualified Person’s opinion, Tronox’s current plans to address any issues related to environmental compliance, permitting and local individuals or groups are adequate.
Illustrative disclosure in response to comment 21:
Section 19 of the TRS will be amended to include the following paragraph:
Our projected average annual operating and capital costs from our Cooljarloo life of mine model at December 31, 2021 were as follows:
|
Average Annual Capital Cost Estimate (US$/Mpa, 2021 real terms, rounded)
|
||||||
|
Life of Mine Estimate (2022 – 2040)
|
||||||
|
Category
|
2022-2026
|
2027-2031
|
2032-2036
|
2037-2040
|
LOM Total
|
|
|
Sustaining Capital
|
14
|
14
|
14
|
14
|
248
|
|
|
Major Infrastructure Investment
|
0
|
3
|
13
|
0
|
82
|
|
|
Total Capital Expenditure
|
14
|
17
|
27
|
14
|
330
|
|
Securities and Exchange Commission
Division of Corporation Finance
Appendix B – Page B-4
|
Average Annual Operating Cost Estimate (US$/Mpa, 2021 real terms, rounded)
|
||||||
|
Life of Mine Estimate (2022 – 2040)
|
||||||
|
Category
|
2022-2026
|
2027-2031
|
2032-2036
|
2037-2040
|
LOM Total
|
|
|
Mining and Concentration
|
44
|
42
|
49
|
40
|
804
|
|
|
Dry Mill
|
14
|
14
|
15
|
15
|
265
|
|
|
Realization
|
5
|
6
|
8
|
6
|
109
|
|
|
Total Operating Expenses
|
63
|
62
|
72
|
61
|
1,178
|
|
Illustrative disclosure in response to comment 22:
Section 19 of the TRS will be amended to include the following paragraph:
For this report, capital and operating costs for the year ended December 31, 2021 have been estimated to an accuracy of +/-15%.
Illustrative disclosure in response to comment 23:
Section 19 of the TRS will be amended to include the following paragraph:
Closure Costs (for the year ended December 31, 2021)
Cooljarloo is situated on land that was either private property cleared for farming, or Unallocated Crown Land (UCL) comprising native vegetation occasionally used for bee keeping or flower and
seed picking. Tronox has determined, in consultation with key stakeholders that the UCL within the Mining Lease will be rehabilitated back to a state that is broadly representative of native vegetation communities.
Tronox proposes to rehabilitate the freehold land to mixed agriculture land-use after mining.
Tronox’s overarching closure objectives are to establish safe and stable landforms capable of supporting:
| ● |
Sustainable native ecosystems on UCL like that which occurs in adjacent UCL areas: and
|
| ● |
Productive agricultural land on Mullering Farm.
|
Following the cessation of mining, some activities will continue that will require active management of environmental aspects. The rehabilitation programme will still require some significant
earthmoving activities, decommissioning works will require specialist teams to disconnect, modularize and remove equipment. There will continue to be requirements for water and power. The closure works will not be on the scale of the mining
operations in terms of amount of machinery or personnel used.
Tronox has developed and implemented an EMS to identify and manage environmental aspects at Cooljarloo. The EMS will continue to be applied during the closure phase to ensure management of
continuing activities. Adequate resources will be provided during closure to fulfil the requirement of this Plan.
The closure provision is established based on estimates, which include the closure and rehabilitation costs to be incurred after mining operations have ceased.
The mine closure cost provision in Tronox’s books is based on the most recent management cost review and is fully provided for. The balance of the provision represents the present value of the
future estimated mine closure cost which is reviewed by management each year. The mine closure cost provision is increased each month as the discount is unwound with the time period to mine closure decreasing, thus ensuring the mine closure
costs are fully provided for at the end of mine life.
Given the progressive nature of rehabilitation, a considerable amount of data is available upon which the cost assumptions for individual closure tasks can be based.
This is further supported by an external consultant review which is conducted every five years. Key assumptions relevant to closure cost estimation and provisioning at Cooljarloo are listed below:
Disturbed areas will be progressively rehabilitated over the life of mine with a minimum area of around 1,250 ha required for active working and operations (i.e. infrastructure and voids).
Securities and Exchange Commission
Division of Corporation Finance
Appendix B – Page B-5
At the end of mining, it is expected that a 20 ha dredge void will be backfilled using previously constructed overburden dumps on Mullering Farm or other equivalent areas. In total, mining and
ancillary activities will have disturbed up to a total of 7800 ha by the time mining is complete in 2040 and final rehabilitation of all disturbed areas is expected by 2045. At closure it is expected that sufficient slime drying cells will be
constructed to allow for the storage and drying of any clay fines produced in the last years of production (~100 ha). Land farming and rehabilitation requirements will be aligned with agreed completion criteria for UCL and farm areas.
In 2020 when the Cooljarloo Act was replaced with Mining Lease 70/1398 Tronox became required to lodge a sum of approximately US$280 thousand to a Western Australian State based Mining
Rehabilitation Fund. This is an annual fee based on open area of the active mine at Cooljarloo and used to fund the rehabilitation of legacy mined out areas around the State. This has nothing to do with Tronox rehabilitation performance, which
is in good standing. The total of the mine closure provision is currently estimated to be US$34 million in real terms.
Illustrative disclosure in response to comment 24:
Section 19 of the TRS will be amended to include the following paragraph:
Average Annual Cash Flow Analysis of Cooljarloo (for the year ended December 31, 2021)
|
Cash Flow (US$
million)
|
2022-2026
|
2027-2031
|
2032-2036
|
2037-2040
|
LOM Total
|
|
|
Chloride Ilmenite
|
58
|
63
|
71
|
63
|
1,149
|
|
|
Zircon
|
38
|
52
|
66
|
58
|
956
|
|
|
Rutile
|
20
|
21
|
21
|
17
|
360
|
|
|
Leucoxene
|
2
|
3
|
10
|
10
|
108
|
|
|
Revenue
|
118
|
139
|
168
|
148
|
2,573
|
|
|
Operating Costs
|
63
|
62
|
72
|
61
|
1,178
|
|
|
EBITDA
|
55
|
77
|
96
|
87
|
1,395
|
|
|
Income Tax (-)
|
0
|
0
|
0
|
6
|
19
|
|
|
Capital Expenses (-)
|
14
|
17
|
27
|
14
|
330
|
|
|
Free Cash Flow
|
41
|
60
|
69
|
67
|
1,046
|
The sole purpose of the operational and related financial data presented is to demonstrate the economic feasibility of the mineral reserves for the purpose of reporting in accordance with subpart
1300 of Regulation S-K, and should not be used for other purposes. The information presented originates from comprehensive techno-economic modelling, which is subject to change as assumptions and inputs are updated, and as a result does not
guarantee future operational or financial performance. Consistent with industry standards, Tronox values its mineral reserves based on the prices at which its titanium and zircon mineral products would sell on freely traded markets, as
forecasted by third-party industry consultancies.
Illustrative disclosure in response to comment 25:
Section 19 of the TRS will be amended to include the following paragraph:
Sensitivity Analysis (for the year ended December 31, 2021)
Economic sensitivity analysis results are presented below based on variations in significant input parameters and assumptions.
|
Ave Annual
Cashflow (US$Mpa)
|
-25%
|
-10%
|
Reference
|
+10%
|
+25%
|
||||||
|
Commodity Price
|
23
|
43
|
55
|
65
|
80
|
||||||
|
Operating Costs
|
71
|
61
|
55
|
49
|
40
|
||||||
|
Capital Costs
|
60
|
57
|
55
|
53
|
51
|
||||||
|
Ore Grade
|
25
|
44
|
55
|
64
|
78
|
||||||
|
Exchange Rate
|
43
|
50
|
55
|
60
|
67
|
* * * *
Appendix C
Illustrative Disclosure to the Amendments to Exhibit 96.2 – Technical Report Summary for Atlas-Campaspe
Illustrative disclosure in response to comment 9:
Section 6 of the TRS will be amended to include the following paragraph:
Stratigraphic column the Murray Basin as of December 31, 2021:
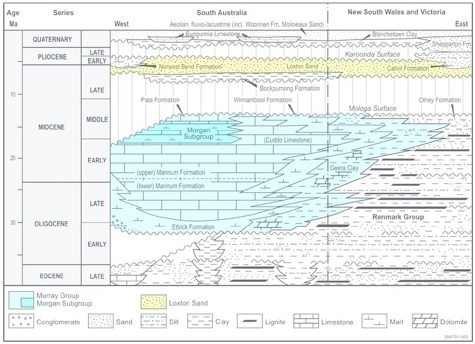
Illustrative disclosure in response to comment 11:
Section 14 of the TRS will be amended to include the following paragraphs:
Estimated saleable product yield (recovery) for the year ended December 31, 2021:
|
Description
|
Total Recovery %
|
|
Ilmenite
|
96.0
|
|
Zircon
|
78.8
|
|
Rutile
|
92.2
|
|
Leucoxene
|
87.4
|
In the opinion of the QP, the methodology employed in this section was appropriate and the data derived from the testing activities described above are adequate for the purposes of defining a
Mineral Resource as of the effective date of this report.
Illustrative disclosure in response to comments 12, 13 and 15:
Section 11 of the TRS will be amended to include the following paragraphs:
Cutoff Grade (for the year ended December 31, 2021)
The nominal cutoff grade used to estimate resources in Tronox’s Eastern Operations is generally 1% HM. This is between the breakeven grade for the minerals production side of the business and
the marginal cost grade where certain material needs to be moved and it is cheaper to process and receive revenue than it is to extract it with earth moving equipment and transport it the waste dump. The 1% HM cutoff grade generally follows
a natural geological boundary and allows smooth geometric shapes to be modelled. The 1% HM cutoff also captures all material within the deposit which has the potential to be economic.
C-1
Securities and Exchange Commission
Division of Corporation Finance
Appendix C – Page C-2
The reserve estimates are calculated during a resource optimization process using a series of complex mathematical routines. Inputs to the optimization process include mineral pricing, saleable
product yield (recovery), variable costs and fixed costs. When the optimization process is run over the three-dimensional resource model, which contains variable HM grades, variable mineralogy, variable clay and rock content, variable
orebody thickness and variable depth of burial the optimization process determines which parts of the resource should be converted to reserves. As such, it is not possible to quote a single cutoff grade as the reserve at any given location
is a combination of HM%, clay%, mineralogy, orebody thickness and depth of burial.
The base assumptions used in this optimization process are:
| ● |
Saleable product yield (recovery): ilmenite 96%, rutile 92.2%, zircon 78.8% and leucoxene 87.4%
|
| ● |
Commodity prices: $234/metric ton for chloride ilmenite, $162/metric ton for sulfate ilmenite, $1,059/metric ton for rutile, $1,512/metric ton for zircon and $300/metric ton for
leucoxene
|
| ● |
Operating cost: $14 per metric ton ore mined
|
| ● |
Mineral prices used are substantially in line with the prices for each of our products published quarterly by third-party independent consultancies.
|
Illustrative disclosure in response to comment 14:
In the Qualified Person’s opinion, all issues relating to relevant technical and economic factors likely to influence the prospect of economic extraction can be resolved with further work.
Illustrative disclosure in response to comments 16 and 19:
Section 19 of the TRS will be amended to include the following paragraph:
Long term real pricing used in the economic analysis (US$/MT, 2021 real terms, rounded).
|
Product
|
2021
|
Forecast 2022-2026 (annual
average)
|
Forecast 2027-2031 (annual average)
|
2032
|
|
Chloride Ilmenite
|
234
|
246
|
254
|
254
|
|
Sulfate Ilmenite
|
162
|
162
|
180
|
180
|
|
Leucoxene (East)
|
300
|
314
|
322
|
322
|
|
Rutile
|
1,059
|
1,088
|
1,008
|
953
|
|
Zircon
|
1,512
|
1,495
|
1,493
|
1,490
|
Consistent with industry standards, Tronox values its mineral reserves based on the prices at which its titanium and zircon mineral products would sell on freely traded markets, as forecasted
by third-party industry consultancies.
Historic prices are not presented because production at Atlas-Campaspe had not yet commenced at the end of 2021.
Securities and Exchange Commission
Division of Corporation Finance
Appendix C – Page C-3
Illustrative disclosure in response to comment 17:
Section 19 of the TRS will be amended to include the following paragraph:
LOM Plan Summary (for the year ended December 31, 2021)
|
Annual Averages(1)
|
2022-2026
|
2027-2031
|
2032
|
|
Ore Mined (kt)
|
5,744
|
11,248
|
10,867
|
|
HM (%)
|
11.8
|
4.9
|
6.8
|
|
Ilmenite (in HM%)
|
55.5
|
53.9
|
56.6
|
|
Rutile (in HM%)
|
14.2
|
11.6
|
11.9
|
|
Leucoxene (in HM%)
|
4.6
|
5.7
|
4.8
|
|
Zircon (in HM%)
|
11.8
|
13.1
|
11.3
|
| (1) |
Amounts presented are based on weighted averages.
|
Illustrative disclosure in response to comment 18:
Section 19 of the TRS will be amended to include the following paragraph:
Production at Atlas-Campaspe had not commenced at the end of 2021, and therefore no production data is available.
Illustrative disclosure in response to comment 20:
In the Qualified Person’s opinion, Tronox’s current plans to address any issues related to environmental compliance, permitting and local individuals or groups are adequate.
Illustrative disclosure in response to comment 21:
Section 19 of the TRS will be amended to include the following paragraph:
Our projected average annual operating and capital costs from our Atlas-Campaspe life of mine model at December 31, 2021 were as follows:
Average Annual Capital Cost Estimate (US$/Mpa, 2021 real terms, rounded)
|
Life of Mine Estimate (2022 – 2032)
|
||||
|
Category
|
2022-2026
|
2027-2031
|
2032
|
LOM Total
|
|
Sustaining Capital
|
1
|
2
|
1
|
18
|
|
Major Infrastructure Investment
|
30
|
0
|
0
|
151
|
|
Total Capital Expenditure
|
31
|
2
|
1
|
169
|
Average Annual Operating Cost Estimate (US$/Mpa, 2021 real terms, rounded)
|
Life of Mine Estimate (2022 – 2033)
|
||||
|
Category
|
2022-2026
|
2027-2031
|
2032
|
LOM Total
|
|
Mining and Concentration
|
65
|
78
|
76
|
788
|
|
Dry Mill
|
20
|
25
|
31
|
254
|
|
Realization
|
25
|
28
|
34
|
302
|
|
Total Operating Expenses
|
110
|
131
|
141
|
1,344
|
Illustrative disclosure in response to comment 22:
Section 19 of the TRS will be amended to include the following paragraph:
For this report, capital and operating costs for the year ended December 31, 2021 have been estimated to an accuracy of +/-15%.
Securities and Exchange Commission
Division of Corporation Finance
Appendix C – Page C-4
Illustrative disclosure in response to comment 23:
Section 19 of the TRS will be amended to include the following paragraph:
Closure Costs (for the year ended December 31, 2021)
Rehabilitation will be completed to the satisfaction of the Resource Regulator and be prepared in consultation with the Department, BCD, DRG, DPIE Water, BSC and CDSC. A Rehabilitation
Management Plan must be submitted to the Resource Regulator for approval prior to commencing mining operations on the site.
Rehabilitation requirements are extensively outlined in the Environmental Impact Statement and associated management plans stipulated in Appendix 5 of the Atlas/Campaspe Mineral Sands Project
Development Consent SSD_5012 from the Government of New South Wales.
Progressive rehabilitation of disturbed areas will be conducted where applicable, and at the completion of mining all remaining disturbed grounds will be rehabilitated. All reasonable and
feasible measures must be taken to minimize the total area exposed for dust generation at any time.
Rehabilitation consists of covering all slurried material, such as tailings, with dry overburden which is sourced from the overburden dumps and subsequently capped with subsoil and topsoil
sourced from subsoil and topsoil stockpiles which have been established during construction.
For Atlas, the total of the mine closure provision is currently estimated to be US$5.8 million in real terms.
Final closure provisions for Campaspe will be estimated during the mine construction phase.
Illustrative disclosure in response to comment 24:
Section 19 of the TRS will be amended to include the following paragraph:
Average Annual Cash Flow Analysis of Atlas-Campaspe (for the year ended December 31, 2021)
|
Cash Flow (US$ million)
|
2022-2026
|
2027-2031
|
2032
|
LOM Total
|
|
Chloride Ilmenite
|
40
|
30
|
42
|
394
|
|
Sulfate Ilmenite
|
23
|
33
|
44
|
323
|
|
Zircon
|
69
|
88
|
101
|
899
|
|
Rutile
|
78
|
55
|
61
|
734
|
|
Leucoxene (East)
|
4
|
12
|
18
|
98
|
|
Revenue
|
214
|
218
|
266
|
2,448
|
|
Operating Costs
|
110
|
131
|
141
|
1,344
|
|
EBITDA
|
104
|
87
|
125
|
1,104
|
|
Income Tax (-)
|
23
|
18
|
27
|
230
|
|
Capital Expenses (-)
|
31
|
2
|
1
|
169
|
|
Free Cash Flow
|
50
|
67
|
97
|
705
|
The sole purpose of the operational and related financial data presented is to demonstrate the economic feasibility of the mineral reserves for the purpose of reporting in accordance with
subpart 1300 of Regulation S-K, and should not be used for other purposes. The information presented originates from comprehensive techno-economic modelling, which is subject to change as assumptions and inputs are updated, and as a
result does not guarantee future operational or financial performance. Consistent with industry standards, Tronox values its mineral reserves based on the prices at which its titanium and zircon mineral products would sell on freely
traded markets, as forecasted by third-party industry consultancies.
Securities and Exchange Commission
Division of Corporation Finance
Appendix C – Page C-5
Illustrative disclosure in response to comment 25:
Section 19 of the TRS will be amended to include the following paragraph:
Economic sensitivity analysis results are presented below based on variations in significant input parameters and assumptions.
|
Ave Annual Cashflow (US$Mpa)
|
-25%
|
-10%
|
Reference
|
+10%
|
+25%
|
|
Commodity Price
|
18
|
44
|
62
|
79
|
105
|
|
Operating Costs
|
97
|
76
|
62
|
48
|
26
|
|
Capital Costs
|
66
|
63
|
62
|
60
|
58
|
|
Ore Grade
|
26
|
48
|
62
|
73
|
80
|
|
Exchange Rate
|
34
|
51
|
62
|
73
|
89
|
* * * *
Appendix D
Illustrative Disclosure to the Amendments to Exhibit 96.3 – Technical Report Summary for Namakwa
Illustrative disclosure in response to comment 9:
Section 6 of the TRS will be amended to include the following paragraph:
Stratigraphic column of the West Coast Group as of December 31, 2021:
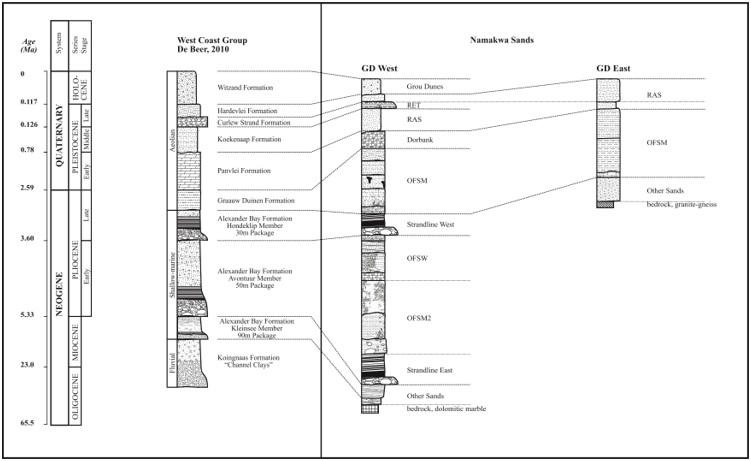
Illustrative disclosure in response to comment 11:
Section 14 of the TRS will be amended to include the following paragraphs:
Estimated saleable product yield (recovery) for the year ended December 31, 2021:
|
Description
|
Total Recovery %
|
|
Ilmenite
|
68
|
|
Rutile
|
63
|
|
Zircon
|
63
|
In the opinion of the QP, the methodology employed in this section was appropriate and the data derived from the testing activities described above are adequate for the purposes of defining a
Mineral Resource as of the effective date of this report.
D-1
Securities and Exchange Commission
Division of Corporation Finance
Appendix D – Page D-2
Illustrative disclosure in response to comments 12, 13 and 15:
Section 11 of the TRS will be amended to include the following paragraphs:
Cutoff Grade (for the year ended December 31, 2021)
The estimated breakeven economic cutoff grade of 0.3% zircon is utilized for mineral resource reporting purposes and were applied for conversion to mineral reserves has been calculated using a
revenue cost breakeven calculation and are based on the following key assumptions:
| ● |
Saleable product yield (recovery): ilmenite 68%, rutile 63% and zircon 63%
|
| ● |
Commodity prices: $194/metric ton for ilmenite, $925/metric ton for rutile and $1,499/metric ton for zircon
|
| ● |
Operating cost: rounded $7 per metric ton ore mined.
|
Mineral prices used are substantially in line with the prices for each of our products published quarterly by third-party independent consultancies.
Although a zircon-only cutoff grade is employed, due to the poly metallic nature of the mineralization, the economic contribution from all the economic minerals (ilmenite, zircon and rutile)
are used to delineate mineral resources, rather than just zircon grade. This also allows for a broader consideration of mineralization of surrounding areas. As costs change over time and long-term revenue values change, new reviews are
conducted which may lead to a modified mining plan becoming optimal.
The Qualified Person utilized this information as the basis for determining reasonable prospects for economic extraction, according to the definition for mineral resources in the SK-1300
regulation. To qualify for recognition to mineral resources, there must be a valid existing prospecting or a mining right. Mineral reserves only consider properties with a valid mining right or where a mining right is under application.
Subsequently, mineral resources are classified into measured, indicated and inferred categories based on the confidence in the geological analyses, the geological complexity evident in the
various stratigraphic units, and the borehole distribution and spacing.
The same break-even cutoff grade of 0.3% zircon is maintained for the mineral resources to reserves conversion process. Mineral reserves are subsets of mineral resources, having used the same
modelling processes but with a higher grade and financial outcome metric applied, i.e. more stringent practical and economic considerations are applied.
The mineral resource block models are constrained into mineral reserve block models discounting the mineral resources (i.e. the exclusive mineral resources) that cannot be mined due to existing
infrastructure, geotechnical parameters, geological floor and other mining method limitations.
The long term mine plan and reserve estimates are derived from detailed techno-economic models created from geological, mining and analytical databases and optimized with respect to anticipated
revenues and costs. Cost assumptions are developed from our extensive operating experience and include mining parameters, processing performance, and rehabilitation costs. Predicted mining and processing metrics are reconciled with actual
production and recovery data on a regular basis.
First, several life of mine production schedules are produced and run through a techno-economic model. An optimization process is performed using different cutoff grades to create a series of
nested shells. Mining block sequences are created for each of the shells tonnages and mineral assemblage information as well as mining costs, processing costs and mineral revenues. In the optimization process, modifying factors including
recoveries, ore loss assumptions, operating costs and mineral sales pricing are used to seek the maximum value for a shell.
The material scheduled previously classified as measured mineral resources will be converted to proven reserves, material previously classified as indicated mineral resources will be converted
to probable reserves whereas inferred mineral resources remain unconverted according to definition as set out in the SK regulation. If any liabilities e.g., legislative, environmental, etc. exists, proven resources will be downgraded to
probable reserves, even though geological confidence is high.
Illustrative disclosure in response to comment 14:
In the Qualified Person’s opinion, all issues relating to relevant technical and economic factors likely to influence the prospect of economic extraction can be resolved with further work.
Securities and Exchange Commission
Division of Corporation Finance
Appendix D – Page D-3
Illustrative disclosure in response to comments 16 and 19:
Section 19 of the TRS will be amended to include the following paragraph:
Long term real pricing used in the economic analysis (US$/MT, 2021 real terms, rounded).
|
Product
|
2016
|
2017
|
2018
|
2019
|
2020
|
2021
|
Forecast
2022 - 2026
(annual
average) |
Forecast
2027 - 2031
(annual
average) |
Forecast
2022 - 2036
(annual
average)
|
Forecast
2037 - 2041
(annual
average)
|
Forecast
2042 - 2046 (annual
average)
|
Forecast
2047 - 2051
(annual
average)
|
Forecast
2052 - 2053
(annual
average)
|
|
Ilmenite
|
95
|
160
|
175
|
176
|
211
|
261
|
248
|
205
|
205
|
205
|
205
|
205
|
205
|
|
Rutile
|
725
|
755
|
900
|
1,103
|
1,211
|
1,201
|
1,328
|
1,183
|
1,183
|
1,183
|
1,183
|
1,183
|
1,183
|
|
Zircon
|
900
|
1,080
|
1,470
|
1,520
|
1,360
|
1,500
|
1,840
|
1,554
|
1,554
|
1,554
|
1,554
|
1,554
|
1,554
|
Consistent with industry standards, Tronox values its mineral reserves based on the prices at which its titanium and zircon mineral products would sell on freely traded markets, as forecasted
by third-party industry consultancies.
Illustrative disclosure in response to comment 17:
Section 19 of the TRS will be amended to include the following paragraph:
LOM Plan Summary (for the year ended December 31, 2021)
|
Annual Averages(1)
|
2022-2026
|
2027-2031
|
2032-2036
|
2037-2046
|
2042-2046
|
2047-2051
|
2052-2053
|
|
Ore Mined (kt)
|
21,510
|
22,121
|
22,173
|
22,152
|
22,152
|
11,840
|
8,612
|
|
HM (%)
|
8.7
|
7.0
|
6.4
|
5.6
|
4.6
|
3.9
|
4.4
|
|
Ilmenite (in HM %)
|
39.7
|
42.1
|
45.3
|
49.0
|
56.5
|
67.9
|
72.7
|
|
Rutile+Leucoxene (in HM %)
|
8.8
|
9.7
|
9.9
|
10.4
|
11.8
|
12.5
|
12.1
|
|
Zircon (in HM %)
|
9.1
|
10.2
|
9.7
|
10.0
|
11.1
|
13.4
|
14.4
|
| (1) |
Amounts presented are based on weighted averages.
|
Illustrative disclosure in response to comment 18:
Section 19 of the TRS will be amended to include the following paragraph:
Historic Plant Throughput and Saleable product yield (recovery) (for each of the three years ended December 31, 2021)
|
Annual Total
|
2019
|
2020
|
2021
|
|
Plant Throughput (kt)
|
20,008
|
19,171
|
21,457
|
|
Ilmenite saleable product yield (recovery) (%)
|
63
|
72
|
76
|
|
Rutile saleable product yield (recovery) (%)
|
65
|
61
|
60
|
|
Zircon saleable product yield (recovery) (%)
|
63
|
67
|
67
|
Securities and Exchange Commission
Division of Corporation Finance
Appendix D – Page D-4
Illustrative disclosure in response to comment 20:
In the Qualified Person’s opinion, Tronox’s current plans to address any issues related to environmental compliance, permitting and local individuals or groups are adequate.
Illustrative disclosure in response to comment 21:
Section 19 of the TRS will be amended to include the following paragraph:
Our projected average annual operating and capital costs from our Namakwa life of mine model at December 31, 2021 were as follows:
Average Annual Capital Cost Estimate (US$/Mpa, 2021 real terms, rounded)
|
Life of Mine Estimate (2022 – 2053)
|
||||||||
|
Category
|
2022-2026
|
2027-2031
|
2032-2036
|
2037-2041
|
2042-2046
|
2047-2051
|
2052-2053
|
LOM Total
|
|
Sustaining Capital
|
6
|
12
|
7
|
7
|
6
|
10
|
8
|
261
|
|
Major Infrastructure Investment
|
35
|
0
|
0
|
0
|
0
|
0
|
0
|
173
|
|
Total Capital Expenditure
|
41
|
12
|
7
|
7
|
6
|
10
|
8
|
435
|
Average Annual Operating Cost Estimate (US$/Mpa, 2021 real terms, rounded)
|
Life of Mine Estimate (2022 – 2053)
|
||||||||
|
Category
|
2022-2026
|
2027-2031
|
2032-2036
|
2037-2041
|
2042-2046
|
2047-2051
|
2052-2053
|
LOM Total
|
|
Mining and Concentration
|
92
|
101
|
101
|
101
|
101
|
101
|
88
|
3,161
|
|
Dry Mill
|
31
|
31
|
31
|
30
|
30
|
30
|
19
|
952
|
|
Realization
|
22
|
19
|
18
|
17
|
16
|
16
|
15
|
559
|
|
Total Operating Expenses
|
145
|
151
|
149
|
148
|
146
|
147
|
122
|
4,672
|
Illustrative disclosure in response to comment 22:
Section 19 of the TRS will be amended to include the following paragraph:
Capital and operating costs for the year ended December 31, 2021 have been estimated to an accuracy of +/-15%.
Illustrative disclosure in response to comment 23:
Section 19 of the TRS will be amended to include the following paragraphs:
Closure Costs (for the year ended December 31, 2021)
GN R1147 GG 39425 refers to the Regulations Pertaining to the Financial Provision for Prospecting, Exploration, Mining or Production Operations under the National Environmental Management
(NEMA) Act. These regulations were published by the Department of Environmental Affairs on 20 November 2015. The purpose of these regulations is to regulate the determination and making of financial provision for the costs associated with
the management, rehabilitation and remediation of environmental impacts from prospecting, exploration, mining or production operations throughout their lifespan. This includes potential latent or residual environmental impacts that may
become known in the future. The regulations require an applicant or holder of a permit or right to determine and make financial provision to guarantee the availability of sufficient funds for the rehabilitation and remediation of adverse
environmental impacts. The financial provision must be determined through a detailed itemization of all the activities and costs, which are calculated by the actual cost of implementing measures required for annual rehabilitation, final
rehabilitation, decommissioning, closure, and remediation of latent or residual environmental impacts. The financial provision can be made through a financial guarantee, a deposit into an account administered by the Minister or a
contribution to a trust fund established in terms of applicable legislation.
NEMA GN R1147 prescribes that mine closure planning should be done over the total scheduled LOM. This requirement necessitates the inclusion and differentiation of the rehabilitation, the
decommissioning and finally, the aftercare phase. In agreement with NEMA GN R1147, mine closure provision has been estimated on the basis of functional domains and risks. Rehabilitation of mined out areas are planned to be conducted
continuously through the life of mine. Consultants have estimated mine closure cost, using an internationally accepted closure assessment method. The unscheduled closure cost is calculated as the cost of immediate, unplanned closure of all
domains inclusive of decommissioning and restoration. The scheduled closure cost liability is made up of closure costs incurred during the scheduled LOM, followed by final closure, rehabilitation and or aftercare phases.
Unscheduled closure cost is estimated at US$14.5 million.
Securities and Exchange Commission
Division of Corporation Finance
Appendix D – Page D-5
Illustrative disclosure in response to comment 24:
Section 19 of the TRS will be amended to include the following paragraph:
Cash Flow Analysis of Namakwa Sands (for the year ended December 31, 2021)
|
Cash Flow (US$ million)
|
2022-
2026
|
2027-
2031
|
2032-
2036 |
2037-
2041
|
2042-
2046
|
2047-
2051
|
2052-
2053 |
LOM Total
|
|
Revenue - Ilmenite
|
118
|
90
|
90
|
87
|
84
|
82
|
75
|
2,912
|
|
Revenue - Rutile
|
41
|
35
|
32
|
30
|
27
|
26
|
25
|
1,005
|
|
Revenue - Zircon
|
192
|
150
|
130
|
118
|
109
|
121
|
112
|
4,324
|
|
Revenue
|
351
|
275
|
252
|
235
|
221
|
230
|
212
|
8,241
|
|
Operating Costs
|
-145
|
-151
|
-149
|
-148
|
-146
|
-147
|
-122
|
-4,672
|
|
EBITDA
|
206
|
124
|
103
|
88
|
74
|
83
|
90
|
3,569
|
|
Income Tax
|
-54
|
-30
|
-24
|
-20
|
-16
|
-19
|
-21
|
-861
|
|
Capital Expenses
|
-41
|
-12
|
-7
|
-7
|
-6
|
-10
|
-8
|
-435
|
|
Free Cash Flow
|
111
|
82
|
71
|
60
|
51
|
55
|
61
|
2,273
|
The sole purpose of the operational and related financial data presented is to demonstrate the economic feasibility of the mineral reserves for the purpose of reporting in accordance with
subpart 1300 of Regulation S-K, and should not be used for other purposes. The information presented originates from comprehensive techno-economic modelling, which is subject to change as assumptions and inputs are updated, and as a result
does not guarantee future operational or financial performance. Consistent with industry standards, Tronox values its mineral reserves based on the prices at which its titanium and zircon mineral products would sell on freely traded
markets, as forecasted by third-party industry consultancies.
Illustrative disclosure in response to comment 25:
Section 19 of the TRS will be amended to include the following paragraph:
Sensitivity Analysis (for the year ended December 31, 2021)
Economic sensitivity analysis results are presented below based on variations in significant input parameters and assumptions.
|
Cashflow (US$Mpa)
|
-25%
|
-10%
|
Reference
|
+10%
|
+25%
|
|
Commodity Price
|
827
|
1,695
|
2,273
|
2,852
|
3,720
|
|
Operating Costs
|
3,441
|
2,741
|
2,273
|
1,806
|
1,105
|
|
Capital Costs
|
2,382
|
2,317
|
2,273
|
2,230
|
2,165
|
|
Ore Grade
|
1,672
|
2,033
|
2,273
|
2,511
|
2,867
|
|
Exchange Rate
|
1,103
|
1,883
|
2,273
|
2,593
|
2,976
|
* * * *
Appendix E
Illustrative Disclosure to the Amendments to Exhibit 96.4 – Technical Report Summary for KZN
Illustrative disclosure in response to comment 9:
Section 6 of the TRS will be amended to include the following paragraph:
Stratigraphic column of the Maputaland Group as of December 31, 2021:
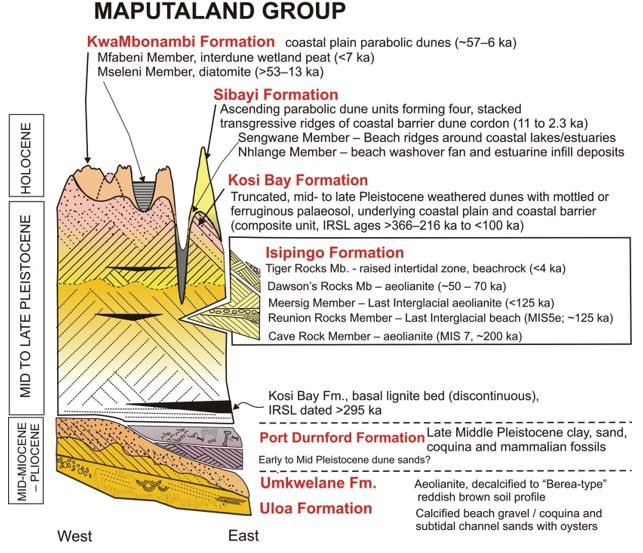
E-1
Securities and Exchange Commission
Division of Corporation Finance
Appendix E – Page E-2
Illustrative disclosure in response to comment 11:
Section 14 of the TRS will be amended to include the following paragraphs:
Estimated saleable product yield (recovery) for the year ended December 31, 2021:
|
Description
|
Total Recovery %
|
|
Ilmenite
|
76
|
|
Rutile
|
75
|
|
Zircon
|
80
|
In the opinion of the QP, the methodology employed in this section was appropriate and the data derived from the testing activities described above are adequate for the purposes of defining a
Mineral Resource as of the effective date of this report.
Illustrative disclosure in response to comments 12, 13 and 15:
Section 11 of the TRS will be amended to include the following paragraphs:
Cutoff Grade (for the year ended December 31, 2021)
The estimated breakeven economic cutoff grades of 1.5% ilmenite is utilized for mineral resource reporting purposes and were applied for conversion to mineral reserves has been calculated using
a revenue cost breakeven calculation and are based on the following key assumptions:
| ● |
Saleable product yield (recovery): ilmenite 66%, rutile 75% and zircon 80%
|
| ● |
Commodity prices: $205/metric ton for ilmenite, $1,183/metric ton for rutile and $1,554/metric ton for zircon
|
| ● |
Operating cost: abbreviated $5 per metric ton ore mined
|
Mineral prices used are substantially in line with the prices for each of our products published quarterly by third-party independent consultancies.
Although an ilmenite-only cutoff grade is employed, due to the poly metallic nature of the mineralization, the economic contribution from all the economic minerals (ilmenite, zircon and rutile)
are used to delineate mineral resources, rather than just zircon grade. This also allows for a broader consideration of mineralization of surrounding areas. As costs change over time and long-term revenue values change, new reviews are
conducted which may lead to a modified mining plan becoming optimal.
The Qualified Person utilized this information as the basis for determining reasonable prospects for economic extraction, according to the definition for mineral resources in the SK-1300
regulation. To qualify for recognition to mineral resources, there must be a valid existing prospecting or a mining right. Mineral reserves only consider properties with a valid mining right or where a mining right is under application.
Subsequently, mineral resources are classified into measured, indicated and inferred categories based on the confidence in the geological analyses, the geological complexity evident in the
various stratigraphic units, and the borehole distribution and spacing.
The same break-even cutoff grade of 1.5% ilmenite is maintained for the mineral resources to reserves conversion process. Mineral reserves are subsets of mineral resources, having used the same
modelling processes but with a higher grade and financial outcome metric applied, i.e., more stringent practical and economic considerations are applied.
The mineral resource block models are constrained into mineral reserve block models discounting the mineral resources (i.e. the exclusive mineral resources) that cannot be mined due to existing
infrastructure, geotechnical parameters, geological floor and other mining method limitations.
The long term mine plan and reserve estimates are derived from detailed techno-economic models created from geological, mining and analytical databases and optimized with respect to anticipated
revenues and costs. Cost assumptions are developed from our extensive operating experience and include mining parameters, processing performance, and rehabilitation costs. Predicted mining and processing metrics are reconciled with actual
production and recovery data on a regular basis.
First, several life of mine production schedules are produced and run through a techno-economic model. An optimisation process is performed using different cutoff grades to create a series of
nested shells. Mining block sequences are created for each of the shells tonnages and mineral assemblage information as well as mining costs, processing costs and mineral revenues. In the optimization process, modifying factors including
recoveries, ore loss assumptions, operating costs and mineral sales pricing are used to seek the maximum value for a shell.
The material scheduled previously classified as measured mineral resources will be converted to proven reserves, material previously classified as indicated mineral resources will be converted
to probable reserves whereas inferred mineral resources remain unconverted according to definition as set out in the SK regulation. If any liabilities e.g., legislative, environmental, etc. exists, proven resources will be downgraded to
probable reserves, even though geological confidence is high.
Securities and Exchange Commission
Division of Corporation Finance
Appendix E – Page E-3
Illustrative disclosure in response to comment 14:
In the Qualified Person’s opinion, all issues relating to relevant technical and economic factors likely to influence the prospect of economic extraction can be resolved with further work.
Illustrative disclosure in response to comments 16 and 19:
Section 19 of the TRS will be amended to include the following paragraph:
Long term real pricing used in the economic analysis (US$/MT, 2021 real terms, rounded).
|
Product
|
2016
|
2017
|
2018
|
2019
|
2020
|
2021
|
Forecast
2022 -
2026
(annual
average)
|
Forecast
2027 -
2031
(annual
average)
|
Forecast
2022 -
2037
(annual
average)
|
|
Ilmenite
|
95
|
160
|
175
|
176
|
211
|
261
|
248
|
205
|
205
|
|
Rutile
|
725
|
755
|
900
|
1,103
|
1,211
|
1,201
|
1,328
|
1,183
|
1,183
|
|
Zircon
|
900
|
1,080
|
1,470
|
1,520
|
1,360
|
1,500
|
1,835
|
1,554
|
1,554
|
Consistent with industry standards, Tronox values its mineral reserves based on the prices at which its titanium and zircon mineral products would sell on freely traded markets, as forecasted
by third-party industry consultancies.
Illustrative disclosure in response to comment 17:
Section 19 of the TRS will be amended to include the following paragraph:
LOM Plan Summary (for the year ended December 31, 2021)
|
Annual Averages(1)
|
2022-2026
|
2027-2031
|
2032-2036
|
2037
|
|
Ore Mined (kt)
|
14,861
|
16,380
|
16,344
|
1,178
|
|
HM (%)
|
5.4
|
6.2
|
4.4
|
3.9
|
|
Ilmenite (in HM %)
|
62.8
|
61.3
|
59.3
|
53.6
|
|
Rutile+Leucoxene (in HM %)
|
6.3
|
7.4
|
7.2
|
6.5
|
|
Zircon (in HM %)
|
8.1
|
7.3
|
7.5
|
5.7
|
| (1) |
Amounts presented are based on weighted averages.
|
Illustrative disclosure in response to comment 18:
Section 19 of the TRS will be amended to include the following paragraph:
Historic Plant Throughput and Saleable product yield (recovery) (for each of the three years ended December 31, 2021)
|
Annual Total
|
2019
|
2020
|
2021
|
|
Plant Throughput (kt)
|
9,506
|
9,882
|
9,219
|
|
Ilmenite saleable product yield (recovery) (%)
|
83
|
87
|
75
|
|
Rutile saleable product yield (recovery) (%)
|
73
|
81
|
78
|
|
Zircon saleable product yield (recovery) (%)
|
78
|
83
|
78
|
Securities and Exchange Commission
Division of Corporation Finance
Appendix E – Page E-4
Illustrative disclosure in response to comment 20:
In the Qualified Person’s opinion, Tronox’s current plans to address any issues related to environmental compliance, permitting and local individuals or groups are adequate.
Illustrative disclosure in response to comment 21:
Section 19 of the TRS will be amended to include the following paragraph:
Our projected average annual operating and capital costs from our KZN life of mine model at December 31, 2021 were as follows:
Average Annual Capital Cost Estimate (US$/Mpa, 2021 real terms, rounded)
|
Life of Mine Estimate (2022 – 2037)
|
|||||
|
Category
|
2022-2026
|
2027-2031
|
2032-2036
|
2037
|
LOM Total
|
|
Sustaining Capital
|
2
|
3
|
2
|
0
|
34
|
|
Major Infrastructure Investment
|
24
|
0
|
0
|
0
|
118
|
|
Total Capital Expenditure
|
25
|
3
|
2
|
0
|
152
|
Average Annual Operating Cost Estimate (US$/Mpa, 2021 real terms, rounded)
|
Life of Mine Estimate (2022 – 2037)
|
|||||
|
Category
|
2022-2026
|
2027-2031
|
2032-2036
|
2037
|
LOM Total
|
|
Mining and Concentration
|
50
|
48
|
50
|
4
|
743
|
|
Dry Mill
|
20
|
21
|
20
|
17
|
320
|
|
Realization
|
11
|
11
|
11
|
8
|
172
|
|
Total Operating Expenses
|
80
|
80
|
81
|
29
|
1,235
|
Illustrative disclosure in response to comment 22:
Section 19 of the TRS will be amended to include the following paragraph:
Capital and operating costs for the year ended December 31, 2021 have been estimated to an accuracy of +/-15%.
Illustrative disclosure in response to comment 23:
Section 19 of the TRS will be amended to include the following paragraphs:
Closure Costs (for the year ended December 31, 2021)
GN R1147 GG 39425 refers to the Regulations Pertaining to the Financial Provision for Prospecting, Exploration, Mining or Production Operations under the National Environmental Management
(NEMA) Act. These regulations were published by the Department of Environmental Affairs on 20 November 2015. The purpose of these regulations is to regulate the determination and making of financial provision for the costs associated with
the management, rehabilitation, and remediation of environmental impacts from prospecting, exploration, mining or production operations throughout their lifespan. This includes potential latent or residual environmental impacts that may
become known in the future. The regulations require an applicant or holder of a permit or right to determine and make financial provision to guarantee the availability of sufficient funds for the rehabilitation and remediation of adverse
environmental impacts. The financial provision must be determined through a detailed itemization of all the activities and costs, which are calculated by the actual cost of implementing measures required for annual rehabilitation, final
rehabilitation, decommissioning, closure, and remediation of latent or residual environmental impacts. The financial provision can be made through a financial guarantee, a deposit into an account administered by the Minister or a
contribution to a trust fund established in terms of applicable legislation.
The South African regulated NEMA GN R1147 prescribes that mine closure planning should be done over the total scheduled LOM. This requirement necessitates the inclusion and differentiation of
the rehabilitation, the decommissioning and, finally, the aftercare phase. In agreement with NEMA GN R1147, mine closure provision has been estimated on the basis of functional domains and risks. Rehabilitation of mined out areas are
planned to be carried out continuously through the life of mine.
Securities and Exchange Commission
Division of Corporation Finance
Appendix E – Page E-5
Consultants have estimated mine closure cost, using internationally accepted closure assessment method. In the event of unscheduled closure a provision of US$12 million inclusive of
contingency, preliminary and general, post closure as well as risk based and regulatory costs, have been allowed for.
Illustrative disclosure in response to comment 24:
Section 19 of the TRS will be amended to include the following paragraph:
Cash Flow Analysis of KZN Sands (for the year ended December 31, 2021)
|
Cash Flow (US$ million)
|
2022-
2026
|
2027-
2031
|
2032-
2036
|
2037
|
LOM Total
|
|
Revenue - Ilmenite
|
82
|
83
|
80
|
61
|
1,288
|
|
Revenue - Rutile
|
31
|
40
|
39
|
31
|
583
|
|
Revenue - Zircon
|
87
|
76
|
78
|
61
|
1,266
|
|
Revenue
|
200
|
199
|
197
|
153
|
3,138
|
|
Operating Costs
|
-80
|
-80
|
-81
|
-29
|
-1,235
|
|
EBITDA
|
120
|
119
|
117
|
124
|
1,903
|
|
Income Tax
|
-27
|
-27
|
-23
|
-21
|
-407
|
|
Capital Expenses
|
-25
|
-3
|
-2
|
0
|
-152
|
|
Free Cash Flow
|
68
|
90
|
91
|
103
|
1,344
|
The sole purpose of the operational and related financial data presented is to demonstrate the economic feasibility of the mineral reserves for the purpose of reporting in accordance with
subpart 1300 of Regulation S-K, and should not be used for other purposes. The information presented originates from comprehensive techno-economic modelling, which is subject to change as assumptions and inputs are updated, and as a result
does not guarantee future operational or financial performance. Consistent with industry standards, Tronox values its mineral reserves based on the prices at which its titanium and zircon mineral products would sell on freely traded
markets, as forecasted by third-party industry consultancies.
Illustrative disclosure in response to comment 25:
Section 19 of the TRS will be amended to include the following paragraph:
Sensitivity Analysis (for the year ended December 31, 2021)
Economic sensitivity analysis results are presented below based on variations in significant input parameters and assumptions.
|
Cashflow (US$Mpa)
|
-25%
|
-10%
|
Reference
|
+10%
|
+25%
|
|
Commodity Price
|
808
|
1,130
|
1,344
|
1,559
|
1,881
|
|
Operating Costs
|
1,647
|
1,460
|
1,344
|
1,211
|
1,025
|
|
Capital Costs
|
1,374
|
1,351
|
1,344
|
1,321
|
1,298
|
|
Ore Grade
|
821
|
1,134
|
1,344
|
1,530
|
1,818
|
|
Exchange Rate
|
1,066
|
1,246
|
1,344
|
1,409
|
1,498
|
* * * *