|
|
ANNUAL REPORT PURSUANT TO SECTION 13 OR 15(d) OF THE SECURITIES EXCHANGE ACT OF 1934
|
|
|
TRANSITION REPORT PURSUANT TO SECTION 13 OR 15(d) OF THE SECURITIES EXCHANGE ACT OF 1934
|
|
For the transition period from ________________ to ________________
|
|
|
|
|
|
(State or other jurisdiction of incorporation of organization)
|
(I.R.S. Employer Identification No.)
|
|
500 North Shoreline, Ste. 800, Corpus Christi, Texas, U.S.A.
|
78401
|
|
|
(U.S. corporate headquarters)
|
(Zip Code)
|
|
|
|
|
|
(Canadian corporate headquarters)
|
(Zip Code)
|
|
(
|
||
|
(Registrant’s telephone number, including
area code)
|
|
Title of each class:
|
Trading Symbol(s)
|
Name of each exchange on which registered:
|
|
|
|
|
|
☒
|
☐ Accelerated filer
|
|
☐ Non-accelerated filer
|
|
|
|
|
Country
|
State/Province
|
Project
|
Location
(Latitude)
|
Location
(Longitude)
|
Equity
Interest
|
Operator
|
Stage
|
Mining
Method
|
Mineralization
Style
|
|
|
|
Allemand-Ross
|
43.3101
|
-105.7787
|
100%
|
UEC
|
Exploration Stage
|
ISR
|
Roll-Front
|
|
Antelope
|
42.2263
|
-107.9095
|
100%
|
UEC
|
Exploration Stage
|
ISR
|
Roll-Front
|
||
|
Barge
|
43.2729
|
-105.5905
|
100%
|
UEC
|
Exploration Stage
|
ISR
|
Roll-Front
|
||
|
Black Hills
|
44.7764
|
-104.8831
|
100%
|
UEC
|
Exploration Stage
|
ISR
|
Roll-Front
|
||
|
Brown Ranch
|
43.7377
|
-105.9684
|
100%
|
UEC
|
Exploration Stage
|
ISR
|
Roll-Front
|
||
|
Bull Springs
|
42.1584
|
-107.6305
|
100%
|
UEC
|
Exploration Stage
|
ISR
|
Roll-Front
|
||
|
Central Shirley Basin
|
42.3378
|
-106.4100
|
100%
|
UEC
|
Exploration Stage
|
ISR
|
Roll-Front
|
||
|
Charlie
|
43.8274
|
-106.0594
|
100%
|
UEC
|
Exploration Stage
|
ISR
|
Roll-Front
|
||
|
Christensen Ranch
|
43.7982
|
-106.0235
|
100%
|
UEC
|
Exploration Stage
|
ISR
|
Roll-Front
|
||
|
Clarkson Hills
|
42.6593
|
-106.7006
|
100%
|
UEC
|
Exploration Stage
|
ISR
|
Roll-Front
|
||
|
Crooks Creek
|
42.2867
|
-107.7660
|
100%
|
UEC
|
Exploration Stage
|
ISR
|
Roll-Front
|
||
|
Crook's Mountain
|
42.3840
|
-107.9060
|
100%
|
UEC
|
Exploration Stage
|
ISR
|
Roll-Front
|
||
|
Crossroads
|
43.0040
|
-105.6364
|
100%
|
UEC
|
Exploration Stage
|
ISR
|
Roll-Front
|
||
|
Cyclone Rim
|
42.2943
|
-108.3332
|
100%
|
UEC
|
Exploration Stage
|
ISR
|
Roll-Front
|
||
|
East Shirley Basin
|
42.3192
|
-106.1616
|
100%
|
UEC
|
Exploration Stage
|
ISR
|
Roll-Front
|
||
|
Gas Hills
|
42.7094
|
-107.6521
|
100%
|
UEC
|
Exploration Stage
|
ISR
|
Roll-Front
|
||
| United States | Wyoming |
Horse Creek
|
42.5957
|
-106.9867
|
100%
|
UEC
|
Exploration Stage
|
ISR
|
Roll-Front
|
|
Irigaray
|
43.8683
|
-106.1186
|
100%
|
UEC
|
Exploration Stage
|
ISR
|
Roll-Front
|
||
|
Jab/West Jab
|
42.2209/42.2611
|
-108.0439/
-108.1225
|
100%
|
UEC
|
Exploration Stage
|
ISR
|
Roll-Front
|
||
|
Ludeman
|
42.9119
|
-105.6277
|
100%
|
UEC
|
Exploration Stage
|
ISR
|
Roll-Front
|
||
|
Moore Ranch
|
43.5652
|
-105.8480
|
100%
|
UEC
|
Exploration Stage
|
ISR
|
Roll-Front
|
||
|
Mule Creek
|
42.2118
|
-105.8143
|
100%
|
UEC
|
Exploration Stage
|
ISR
|
Roll-Front
|
||
|
Niles Ranch
|
43.8024
|
-105.7961
|
100%
|
UEC
|
Exploration Stage
|
ISR
|
Roll-Front
|
||
|
Nine Mile Lake
|
42.9807
|
-106.3278
|
100%
|
UEC
|
Exploration Stage
|
ISR
|
Roll-Front
|
||
|
Pine Ridge
|
43.4591
|
-106.0725
|
100%
|
UEC
|
Exploration Stage
|
ISR
|
Roll-Front
|
||
|
Pine Tree U1
|
43.6173
|
-105.7860
|
100%
|
UEC
|
Exploration Stage
|
ISR
|
Roll-Front
|
||
|
Pumpkin Creek
|
43.8163
|
-105.8955
|
100%
|
UEC
|
Exploration Stage
|
ISR
|
Roll-Front
|
||
|
Red Rim
|
41.6502
|
-107.5755
|
100%
|
UEC
|
Exploration Stage
|
ISR
|
Roll-Front
|
||
|
Reno Creek
|
43.6796
|
-105.7226
|
100%
|
UEC
|
Exploration Stage
|
ISR
|
Roll-Front
|
||
|
Ross Flats
|
43.5224
|
-105.8861
|
100%
|
UEC
|
Exploration Stage
|
ISR
|
Roll-Front
|
||
|
Sand Creek
|
42.7007
|
-105.2645
|
100%
|
UEC
|
Exploration Stage
|
ISR
|
Roll-Front
|
||
|
South Pine Ridge
|
43.1204
|
-105.9251
|
100%
|
UEC
|
Exploration Stage
|
ISR
|
Roll-Front
|
||
|
South Reno Creek
|
43.6440
|
-105.6199
|
100%
|
UEC
|
Exploration Stage
|
ISR
|
Roll-Front
|
|
Country
|
State/Province
|
Project
|
Location
(Latitude)
|
Location
(Longitude)
|
Equity
Interest
|
Operator
|
Stage
|
Mining
Method
|
Mineralization
Style
|
|
Uranium Projects
|
|||||||||
|
South Sweetwater
|
41.9694
|
-107.9820
|
100%
|
UEC
|
Exploration Stage
|
ISR
|
Roll-Front
|
||
|
Stewart Creek
|
43.3124
|
-105.7342
|
100%
|
UEC
|
Exploration Stage
|
ISR
|
Roll-Front
|
||
|
Taylor Ranch
|
43.5578
|
-106.0098
|
100%
|
UEC
|
Exploration Stage
|
ISR
|
Roll-Front
|
||
|
Twin Buttes
|
42.2316
|
-107.7205
|
100%
|
UEC
|
Exploration Stage
|
ISR
|
Roll-Front
|
||
|
West Beaver Rim
|
42.5967
|
-108.1568
|
100%
|
UEC
|
Exploration Stage
|
ISR
|
Roll-Front
|
||
|
West Crook's Creek
|
42.2984
|
-107.8603
|
100%
|
UEC
|
Exploration Stage
|
ISR
|
Roll-Front
|
||
|
West Sweetwater
|
42.1318
|
-108.0931
|
100%
|
UEC
|
Exploration Stage
|
ISR
|
Roll-Front
|
||
|
|
Burke Hollow
|
27.6756
|
-97.5176
|
100%
|
UEC
|
Exploration Stage
|
ISR
|
Roll-Front
|
|
|
Goliad
|
28.8686
|
-97.3433
|
100%
|
UEC
|
Exploration Stage
|
ISR
|
Roll-Front
|
||
| Texas |
La Palangana
|
28.2638
|
-98.3959
|
100%
|
UEC
|
Exploration Stage
|
ISR
|
Roll-Front
|
|
|
Salvo
|
28.2632
|
-97.7889
|
100%
|
UEC
|
Exploration Stage
|
ISR
|
Roll-Front
|
||
|
Longhorn
|
28.1700
|
-98.1200
|
100%
|
UEC
|
Exploration Stage
|
ISR
|
Roll-Front
|
||
|
|
Anderson
|
34.1829
|
-113.1632
|
100%
|
UEC
|
Exploration Stage
|
Conventional
|
Tabular
|
|
| Arizona |
Los Cuatros
|
33.548
|
-112.322
|
100%
|
UEC
|
Exploration Stage
|
Conventional
|
Tabular
|
|
|
Workman Creek
|
33.50
|
-110.57
|
100%
|
UEC
|
Exploration Stage
|
Conventional
|
Tabular
|
||
|
New Mexico
|
C de Baca
|
34.18
|
-107.15
|
100%
|
UEC
|
Exploration Stage
|
Conventional
|
Tabular
|
|
|
Dalton Pass
|
35.40
|
-108.14
|
100%
|
UEC
|
Exploration Stage
|
Conventional
|
Tabular
|
||
|
|
|
Alexandra
|
58.023
|
-109.789
|
21.05%
|
Orano Canada Inc.
|
Exploration Stage
|
Conventional
|
Unconformity Related
|
|
Axis Lake
|
59.304
|
-106.136
|
100.00%
|
UEC
|
Exploration Stage
|
Conventional
|
Unconformity Related
|
||
|
Beatty River
|
57.897
|
-109.542
|
32.76%
|
Orano Canada Inc.
|
Exploration Stage
|
Conventional
|
Unconformity Related
|
||
|
Black Lake
|
59.1167
|
-105.905
|
51.43%
|
UEC
|
Exploration Stage
|
Conventional
|
Unconformity Related
|
||
|
Brander Lake
|
58.2895
|
-109.888
|
49.10%
|
Orano Canada Inc.
|
Exploration Stage
|
Conventional
|
Unconformity Related
|
||
|
Candle Lake
|
57.9969
|
-104.93
|
12.50%
|
Denison Mines Corp.
|
Exploration Stage
|
Conventional
|
Unconformity Related
|
||
|
Christie Lake
|
57.8128
|
-104.86
|
82.77%
|
UEC
|
Exploration Stage
|
Conventional
|
Unconformity Related
|
||
|
Close Lake
|
57.9729
|
-105.082
|
5.16%
|
Orano Canada Inc.
|
Exploration Stage
|
Conventional
|
Unconformity Related
|
||
| Canada | Saskatchewan |
Cree Extension
|
57.5881
|
-105.551
|
15.05%
|
Cameco Corporation
|
Exploration Stage
|
Conventional
|
Unconformity Related
|
|
Diabase
Peninsula
|
57.4294
|
-106.913
|
100.00%
|
UEC
|
Exploration Stage
|
Conventional
|
Unconformity Related
|
||
|
Erica
|
58.1465
|
-109.731
|
49.10%
|
Orano Canada Inc.
|
Exploration Stage
|
Conventional
|
Unconformity Related
|
||
|
Hidden Bay
|
58.157
|
-103.88
|
100.00%
|
UEC
|
Exploration Stage
|
Conventional
|
Unconformity Related
|
||
|
Horseshoe-Raven
|
58.1331
|
-103.76
|
100.00%
|
UEC
|
Exploration Stage
|
Conventional
|
Unconformity Related
|
||
|
Key West
|
57.2731
|
-106.217
|
100.00%
|
UEC
|
Exploration Stage
|
Conventional
|
Unconformity Related
|
||
|
Laurie
|
57.6579
|
-108.721
|
32.99%
|
Orano Canada Inc.
|
Exploration Stage
|
Conventional
|
Unconformity Related
|
||
|
Millennium
|
57.5138
|
-105.639
|
15.05%
|
Cameco Corporation
|
Exploration Stage
|
Conventional
|
Unconformity Related
|
||
|
Mirror River
|
57.6078
|
-108.423
|
32.34%
|
Orano Canada Inc.
|
Exploration Stage
|
Conventional
|
Unconformity Related
|
||
|
Moon Lake
|
57.4669
|
-105.634
|
10.07%
|
Orano Canada Inc.
|
Exploration Stage
|
Conventional
|
Unconformity Related
|
||
|
Moore Tomblin
|
57.4512
|
-105.135
|
6.80%
|
Orano Canada Inc.
|
Exploration Stage
|
Conventional
|
Unconformity Related
|
||
|
Nikita
|
58.0107
|
-109.574
|
12.72%
|
Orano Canada Inc.
|
Exploration Stage
|
Conventional
|
Unconformity Related
|
||
|
Country
|
State/Province
|
Project
|
Location (Latitude)
|
Location (Longitude)
|
Equity Interest
|
Operator
|
Stage
|
Mining
Method
|
Mineralization Style
|
|
Uranium Projects
|
|||||||||
|
Riou Lake
|
59.0491
|
-106.156
|
100.00%
|
UEC
|
Exploration Stage
|
Conventional
|
Unconformity Related
|
||
|
Roughrider
|
58.3374
|
-104.021
|
100.00%
|
UEC
|
Exploration Stage
|
Conventional
|
Unconformity Related
|
||
|
Shea Creek
|
58.1804
|
-109.49
|
49.10%
|
Orano Canada Inc.
|
Exploration Stage
|
Conventional
|
Unconformity Related
|
||
|
Uchrich
|
57.7196
|
-108.483
|
30.48%
|
Orano Canada Inc.
|
Exploration Stage
|
Conventional
|
Unconformity Related
|
||
|
Waterfound
River
|
58.4588
|
-104.548
|
12.90%
|
Orano Canada Inc.
|
Exploration Stage
|
Conventional
|
Unconformity Related
|
||
|
West Bear
|
57.8744
|
-103.975
|
100.00%
|
UEC
|
Exploration Stage
|
Conventional
|
Unconformity Related
|
||
|
Wheeler River
|
57.5000
|
-105.421
|
5.00%
|
Denison Mines Corp.
|
Development
|
Conventional
|
Unconformity Related
|
||
|
Wolly
|
58.3927
|
-103.799
|
6.38%
|
Orano Canada Inc.
|
Exploration Stage
|
Conventional
|
Unconformity Related
|
||
|
Nunavut
|
Kiggavik
|
64.3752
|
-97.7685
|
16.91%
|
Orano Canada Inc.
|
Exploration Stage
|
Conventional
|
Unconformity Related
|
|
|
Paraguay
|
Yuty
|
25.2702
|
56.3125
|
100.00%
|
UEC
|
Exploration Stage
|
ISR
|
Roll-Front
|
|
|
Oviedo
|
25.2702
|
56.2828
|
100.00%
|
UEC
|
Exploration Stage
|
ISR
|
Roll-Front
|
||
|
Titanium Projects
|
|||||||||
|
Paraguay
|
Alto Parana
|
24.8147
|
54.9083
|
100.00%
|
UEC
|
Exploration Stage
|
Conventional
|
Surficial
|
|
|
Acres
|
Hectares
|
State Leases
|
Fee Mineral Leases
|
Federal Lode Mining Claims
|
Provincial Mineral Dispositions
|
Provincial Mining
Leases
|
|||||||||||||
|
Country
|
State/Province
|
Project
|
Total
|
Total
|
Number
|
Acres
|
Expiration Date
|
Number
|
Acres
|
Expiration Date
|
Number
|
Acres
|
Expiration Date
|
Number
|
Hectares
|
Expiration Date
|
Number
|
Hectares
|
Expiration Date
|
|
Uranium Projects
|
|||||||||||||||||||
|
|
|
Allemand-Ross
|
13,331.72
|
5,395.16
|
3
|
958
|
Annual
|
7
|
3,333.72
|
July 2025 - Feb 2029 (variable
|
452
|
9,040
|
Annual
|
||||||
|
Antelope
|
13,220
|
5,349.94
|
1
|
640
|
Annual
|
629
|
12,580
|
Annual
|
|||||||||||
|
Barge
|
7,480
|
3,027.05
|
1
|
640
|
Annual
|
342
|
6,840
|
Annual
|
|||||||||||
|
Black Hills
|
1,280
|
518.00
|
1
|
640
|
Annual
|
32
|
640
|
Annual
|
|||||||||||
|
Brown Ranch
|
3,640
|
1,473.06
|
1
|
640
|
Annual
|
150
|
3,000
|
Annual
|
|||||||||||
|
Bull Springs
|
5,702.8
|
2,307.84
|
2
|
1,922.8
|
Annual
|
189
|
3,780
|
Annual
|
|||||||||||
|
Central Shirley Basin
|
2,380
|
963.15
|
2
|
760
|
Annual
|
81
|
1,620
|
Annual
|
|||||||||||
|
Charlie
|
820
|
331.84
|
1
|
720
|
Annual
|
5
|
100
|
Annual
|
|||||||||||
| United States | Wyoming |
Christensen Ranch
|
11,140
|
4,508.20
|
1
|
1,280
|
Annual
|
1
|
720
|
Annual
|
358
|
9,140
|
Annual
|
||||||
|
Clarkson Hills
|
400
|
161.87
|
20
|
400
|
Annual
|
||||||||||||||
|
Crooks Creek
|
6,979.25
|
2,824.40
|
6
|
2,599.25
|
Annual
|
219
|
4,380
|
Annual
|
|||||||||||
|
Crook's Mountain
|
2,480
|
1,003.62
|
2
|
1,280
|
Annual
|
60
|
1,200
|
Annual
|
|||||||||||
|
Crossroads
|
5,680
|
2,298.61
|
2
|
1,280
|
Annual
|
220
|
4,400
|
Annual
|
|||||||||||
|
Cyclone Rim
|
4,280
|
1,732.06
|
0
|
0
|
214
|
4,280
|
Annual
|
||||||||||||
|
East Shirley Basin
|
4,599.90
|
1,861.51
|
4
|
2,099.9
|
Annual
|
125
|
2,500
|
Annual
|
|||||||||||
|
Gas Hills
|
6,114.76
|
2,474.56
|
5
|
3,394.76
|
Annual
|
136
|
2,720
|
Annual
|
|||||||||||
| Acres | Hectares | State Leases | Fee Mineral Leases | Federal Lode Mining Claims | Provincial Mineral Dispositions |
Provincial
Mining Leases
|
|||||||||||||
|
Country
|
State/Province
|
Project
|
Total
|
Total
|
Number
|
Acres
|
Expiration Date
|
Number
|
Acres
|
Expiration Date
|
Number
|
Acres
|
Expiration Date
|
Number
|
Hectares
|
Expiration Date
|
Number
|
Hectares
|
Expiration Date
|
|
Horse Creek
|
540
|
218.53
|
27
|
540
|
Annual
|
||||||||||||||
|
Irigaray
|
2,320
|
938.87
|
2
|
480
|
Annual
|
92
|
1,840
|
Annual
|
|||||||||||
|
Jab/West Jab
|
5,300
|
2,144.83
|
3
|
960
|
Annual
|
217
|
4,340
|
Annual
|
|||||||||||
|
Ludeman
|
18,101.89
|
7,325.57
|
4
|
1,440
|
Annual
|
2
|
1,741.89
|
Sept. 2026 and Jan. 2029
|
746
|
14,920
|
Annual
|
||||||||
|
Moore Ranch
|
4,180
|
1,691.59
|
3
|
1,280
|
Annual
|
4
|
1,180
|
Aug. 2025 through Mar. 2027 (variable)
|
86
|
1,720
|
Annual
|
||||||||
|
Mule Creek
|
260
|
105.22
|
13
|
260
|
Annual
|
||||||||||||||
|
Niles Ranch
|
3,560
|
1,440.68
|
6
|
2,560
|
Annual
|
50
|
1,000
|
Annual
|
|||||||||||
|
Nine Mile Lake
|
2,620
|
1,060.28
|
3
|
1,280
|
Annual
|
67
|
1,340
|
Annual
|
|||||||||||
|
Pine Ridge
|
3,780
|
1,529.71
|
2
|
720
|
Annual
|
153
|
3,060
|
Annual
|
|||||||||||
|
Pine Tree U1
|
1,540
|
623.22
|
1
|
80
|
Annual
|
73
|
1,460
|
Annual
|
|||||||||||
|
Pumpkin Creek
|
1,000
|
404.69
|
50
|
1,000
|
Annual
|
||||||||||||||
|
Red Rim
|
680
|
275.19
|
34
|
680
|
Annual
|
||||||||||||||
|
Reno Creek
|
18,763
|
7,593.12
|
4
|
3,200
|
Annual
|
36
|
4,583
|
Variable
|
549
|
10,980
|
Annual
|
||||||||
|
Ross Flats
|
5,480
|
2,217.68
|
3
|
1,040
|
Annual
|
3
|
1,680
|
Mar. 2027
|
138
|
2,760
|
Annual
|
||||||||
|
Sand Creek
|
3,000
|
1,214.06
|
3
|
1,920
|
Annual
|
54
|
1,080
|
Annual
|
|||||||||||
|
South Pine Ridge
|
4,020
|
1,626.84
|
5
|
2,360
|
Annual
|
83
|
1,660
|
Annual
|
|||||||||||
|
South Reno Creek
|
2,580
|
1,044.09
|
1
|
80
|
Annual
|
125
|
2,500
|
Annual
|
|||||||||||
|
South Sweetwater
|
1,120
|
453.25
|
1
|
640
|
Annual
|
24
|
480
|
Annual
|
|||||||||||
|
Stewart Creek
|
2,460
|
995.53
|
1
|
640
|
Annual
|
91
|
1,820
|
Annual
|
|||||||||||
|
Taylor Ranch
|
3,940
|
1,594.46
|
7
|
2,880
|
Annual
|
53
|
1,060
|
Annual
|
|||||||||||
|
Twin Buttes
|
7,740
|
3,132.27
|
3
|
1,600
|
Annual
|
307
|
6,140
|
Annual
|
|||||||||||
|
West Beaver Rim
|
1,900
|
768.90
|
1
|
640
|
Annual
|
63
|
1,260
|
Annual
|
|||||||||||
|
West Crook's Creek
|
1,520
|
615.12
|
1
|
640
|
Annual
|
44
|
880
|
Annual
|
|||||||||||
|
West Sweetwater
|
1,080
|
437.06
|
54
|
1,080
|
Annual
|
||||||||||||||
|
|
Burke Hollow
|
17,511
|
7,086
|
1
|
17,511
|
2032
|
|||||||||||||
|
Goliad
|
636
|
257
|
7
|
636
|
2024 & 2025
|
||||||||||||||
| Texas |
Palangana
|
6,969
|
2,820
|
12
|
6,969
|
2025 thru 2032
|
|||||||||||||
|
Salvo
|
800
|
324
|
2
|
800
|
2026 & 2027
|
||||||||||||||
|
Longhorn
|
594
|
240
|
40
|
594
|
2027 thru 2028
|
||||||||||||||
|
Arizona
|
Anderson
|
8,268
|
3,346
|
1
|
640
|
2024
|
386
|
7,628
|
2024
|
||||||||||
|
Los Cuatros
|
640
|
259
|
1
|
640
|
2024
|
||||||||||||||
| Acres | Hectares | State Leases | Fee Mineral Leases | Federal Lode Mining Claims | Provincial Mineral Dispositions |
Provincial Mining
Leases
|
|||||||||||||
|
Country
|
State/Province
|
Project
|
Total
|
Total
|
Number
|
Acres
|
Expiration Date
|
Number
|
Acres
|
Expiration Date
|
Number
|
Acres
|
Expiration Date
|
Number
|
Hectares
|
Expiration Date
|
Number
|
Hectares
|
Expiration Date
|
|
Workman Creek
|
4,036
|
1,374
|
198
|
4,036
|
2024
|
||||||||||||||
|
New
Mexico
|
C de Baca
|
600
|
243
|
30
|
600
|
2024
|
|||||||||||||
|
Dalton Pass
|
1,020
|
413
|
51
|
1,020
|
2024
|
||||||||||||||
|
|
|
Alexandra
|
36,485
|
14,765
|
6
|
14,765
|
Oct. 4042
|
||||||||||||
|
Axis Lake
|
13,045
|
5,279
|
3
|
5,279
|
Aug. 2023
|
||||||||||||||
|
Beatty River
|
16,526
|
6,688
|
7
|
6,688
|
Sept. 2027
|
||||||||||||||
| Canada | Saskatchewan |
Black Lake
|
78,335
|
31,701
|
13
|
31,701
|
Nov. 2024
|
||||||||||||
|
Brander Lake
|
34,577
|
13,993
|
9
|
13,993
|
Apr. 2035
|
||||||||||||||
|
Candle Lake
|
6,412
|
2,595
|
1
|
2,595
|
Oct. 2038
|
||||||||||||||
|
Christie Lake
|
19,575
|
7,922
|
6
|
7,922
|
Mar. 2044
|
||||||||||||||
|
Christie West
|
813
|
329
|
2
|
329
|
Jun. 2023
|
||||||||||||||
|
Close Lake
|
95,578
|
38,679
|
21
|
38,679
|
Oct. 2023
|
||||||||||||||
|
Cree Extension
|
30,115
|
12,187
|
11
|
12,187
|
Aug. 2040
|
||||||||||||||
|
Diabase Peninsula
|
77,164
|
31,227
|
22
|
31,227
|
|||||||||||||||
|
Erica
|
91,409
|
36,992
|
20
|
36,992
|
Nov. 2036
|
||||||||||||||
|
Hidden Bay
|
126,933
|
51,368
|
45
|
51,368
|
Aug. 2037
|
||||||||||||||
|
Horseshoe-Raven
|
11,085
|
4,486
|
1
|
4,486
|
Feb. 2041
|
||||||||||||||
|
Key West
|
31,827
|
12,880
|
4
|
12,880
|
Apr. 2024
|
||||||||||||||
|
Laurie
|
21,691
|
8,778
|
4
|
8,778
|
May 2027
|
||||||||||||||
|
Millennium
|
1,458
|
590
|
1
|
590
|
Feb. 2039
|
||||||||||||||
|
Mirror River
|
42,996
|
17,400
|
5
|
17,400
|
Apr. 2024
|
||||||||||||||
|
Moon Lake
|
9,385
|
3,798
|
5
|
3,798
|
Oct. 2039
|
||||||||||||||
|
Moore Tomblin
|
3,249
|
1,315
|
2
|
1,315
|
May 2028
|
||||||||||||||
|
Nikita
|
37,390
|
15,131
|
6
|
15,131
|
Jun. 2043
|
||||||||||||||
|
Riou Lake
|
27,634
|
11,183
|
14
|
11,183
|
Nov. 2023
|
||||||||||||||
|
Roughrider
|
1,475
|
597
|
1
|
597
|
Jan. 2028
|
||||||||||||||
|
Shea Creek
|
81,451
|
32,962
|
18
|
32,962
|
Mar. 2035
|
||||||||||||||
|
Uchrich
|
5,592
|
2,263
|
1
|
2,263
|
May 2027
|
||||||||||||||
|
Waterfound River
|
28,837
|
11,670
|
25
|
11,670
|
Jul. 2031
|
||||||||||||||
|
West Bear
|
27,439
|
11,104
|
26
|
10,807
|
Feb 2043
|
1
|
297
|
June 2035
|
|||||||||||
|
Wheeler River
|
28,961
|
11,720
|
19
|
11,720
|
Oct. 2041
|
||||||||||||||
|
Wolly
|
58,564
|
23,700
|
17
|
23,700
|
Nov. 2038
|
||||||||||||||
|
Nunavut
|
Kiggavik
|
45,638
|
18,469
|
37
|
18,469
|
Oct. 2038
|
|||||||||||||
|
Paraguay
|
Yuty
|
289,687
|
117,232
|
||||||||||||||||
|
Oviedo
|
223,754
|
90,550
|
|||||||||||||||||
|
Titanium Projects
|
|||||||||||||||||||
|
Paraguay
|
Alto Parana
|
174,204
|
70,498
|
||||||||||||||||
|
Uranium Projects
|
||||||||||
|
Texas
|
||||||||||
|
Property
|
Fully
Permitted to
Mine
|
Partially
Permitted to
Mine
|
Not
Permitted
to Mine
|
RRC
Exploration
Permit
|
TCEQ Class 1
Well Permits
|
TCEQ
Injection
Control
Permit
|
TCEQ Area
Permit
|
TCEQ/EPA
Aquifer
Exemption
|
TCEQ
Radioactive
Materials
License
|
Notes
|
|
Burke Hollow
|
X
|
Yes
|
2
|
Yes
|
Yes
|
Yes
|
Yes
|
Has all major permits, waiting on final production authorization
|
||
|
Goliad
|
X
|
Yes
|
2
|
Yes
|
Yes
|
Yes
|
Yes
|
Has all major permits and first production authorization
|
||
|
La Palangana
|
X
|
Yes
|
2
|
Yes
|
Yes
|
Yes
|
Yes
|
Has all major permits and four production authorizations
|
||
|
Salvo
|
X
|
No
|
0
|
No
|
No
|
No
|
No
|
|||
|
Longhorn
|
X
|
No
|
0
|
No
|
No
|
No
|
No
|
|||
|
Wyoming
|
||||||||||
|
Property
|
Fully
Permitted to
Mine
|
Partially
Permitted to
Mine
|
Not
Permitted
to Mine
|
Class III UIC
Permit
to Mine
|
WDEQ Class 1
Well Permits
|
Source and
Byproduct
Materials
License
|
BLM Plan
of
Operations
|
WDEQ/EPA
Aquifer
Exemption
|
Notes
|
|
|
Allemand-Ross
|
X
|
Drilling Notification DN339
|
||||||||
|
Antelope
|
X
|
Yes
|
Drilling Notification DN353
|
|||||||
|
Barge
|
X
|
|||||||||
|
Black Hills
|
X
|
|||||||||
|
Brown Ranch
|
X
|
|||||||||
|
Bull Springs
|
X
|
|||||||||
|
Central Shirley Basin
|
X
|
|||||||||
|
Charlie
|
X
|
Permitted as an open pit mine not ISR
|
||||||||
|
Christensen Ranch
|
X
|
Yes
|
Yes
|
Yes
|
Yes
|
|||||
|
Clarkson Hill
|
X
|
|||||||||
|
Crooks Creek
|
X
|
|||||||||
|
Crook's Mountain
|
X
|
|||||||||
|
Crossroads
|
X
|
|||||||||
|
Cyclone Rim
|
X
|
|||||||||
|
East Shirley Basin
|
X
|
|||||||||
|
Gas Hills
|
X
|
|||||||||
|
Horse Creek
|
X
|
|||||||||
|
Irigaray Project
|
X
|
Yes
|
Yes
|
Yes
|
Yes
|
Irigaray mine expansion to north and south will require a permit revision.
Drilling Notification DN342
|
||||
|
Jab/West Jab
|
X
|
Drilling Notification DN353
|
||||||||
|
Ludeman
|
X
|
Yes
|
Yes
|
Yes
|
||||||
|
Moore Ranch
|
X
|
Yes
|
Yes
|
Yes
|
Yes
|
|||||
|
Mule Creek
|
X
|
|||||||||
|
Niles Ranch
|
X
|
|||||||||
|
Nine Mile Lake
|
X
|
Drilling Notification DN339
|
||||||||
|
Pine Ridge
|
X
|
Drilling Notification DN342
|
||||||||
|
Pine Tree U1
|
X
|
Drilling Notification DN342
|
||||||||
|
Pumpkin Creek
|
X
|
Drilling Notification DN342
|
||||||||
|
Red Rim
|
X
|
|||||||||
|
Reno Creek
|
X
|
Yes
|
Yes
|
Yes
|
Yes
|
North Reno Creek and SW Reno Creek Resource areas are permitted.
|
||||
|
Ross Flat
|
X
|
Drilling Notification DN342
|
||||||||
|
Sand Creek
|
X
|
|||||||||
|
South Pine Ridge
|
X
|
|||||||||
|
South Reno Creek
|
X
|
|||||||||
|
South Sweetwater
|
X
|
|||||||||
|
Stewart Creek
|
X
|
|||||||||
|
Taylor Ranch
|
X
|
Drilling Notification DN342
|
||||||||
|
Twin Buttes
|
X
|
|||||||||
|
West Beaver Rim
|
X
|
|||||||||
|
West Crook's Creek
|
X
|
|||||||||
|
West Sweetwater
|
X
|
|||||||||
|
Arizona
|
||||||||||
|
Property
|
Fully
Permitted to
Mine
|
Partially
Permitted to
Mine
|
Not
Permitted
to Mine
|
Class III UIC
Permit to
Mine
|
WDEQ Class 1
Well Permits
|
Source and
Byproduct
Materials
License
|
BLM Plan
of
Operations
|
WDEQ/EPA
Aquifer
Exemption
|
Notes
|
|
|
Anderson
|
X
|
|||||||||
|
Los Cuatros
|
X
|
|||||||||
|
Workman Creek
|
X
|
|||||||||
|
New Mexico
|
||||||||||
|
Property
|
Fully
Permitted to
Mine
|
Partially
Permitted to
Mine
|
Not
Permitted
to Mine
|
Class III UIC
Permit to
Mine
|
WDEQ Class 1
Well Permits
|
Source and
Byproduct
Materials
License
|
BLM Plan
of
Operations
|
WDEQ/EPA
Aquifer
Exemption
|
Notes
|
|
|
C de Baca
|
X
|
|||||||||
|
Dalton Pass
|
X
|
|||||||||
|
Canada
|
||||||||||
|
Property
|
Fully
Permitted to
Mine
|
Partially
Permitted to
Mine
|
Not
Permitted
to Mine
|
Notes
|
||||||
|
Alexandra
|
X
|
Exploration-Stage Project with no resources
|
||||||||
|
Axis Lake
|
X
|
Exploration-Stage Project with no resources
|
||||||||
|
Beatty River
|
X
|
Exploration-Stage Project with no resources
|
||||||||
|
Black Lake
|
X
|
Exploration-Stage Project with no resources
|
||||||||
|
Brander Lake
|
X
|
Exploration-Stage Project with no resources
|
||||||||
|
Candle Lake
|
X
|
Exploration-Stage Project with no resources
|
||||||||
|
Christie Lake
|
X
|
Exploration-Stage Project with resources
|
||||||||
|
Christie West
|
X
|
Exploration-Stage Project with no resources
|
||||||||
|
Close Lake
|
X
|
Exploration-Stage Project with no resources
|
||||||||
|
Cree Extension
|
X
|
Exploration-Stage Project with no resources
|
||||||||
|
Diabase Peninsula
|
X
|
Exploration-Stage Project with no resources
|
||||||||
|
Erica
|
X
|
Exploration-Stage Project with no resources
|
||||||||
|
Hidden Bay
|
X
|
Exploration-Stage Project with no resources
|
||||||||
|
Horseshoe-Raven
|
X
|
Exploration-Stage Project with resources
|
||||||||
|
Key West
|
X
|
Exploration-Stage Project with no resources
|
||||||||
|
Laurie
|
X
|
Exploration-Stage Project with no resources
|
||||||||
|
Millennium
|
X
|
Exploration-Stage Project with resources
|
||||||||
|
Mirror River
|
X
|
Exploration-Stage Project with no resources
|
||||||||
|
Moon Lake
|
X
|
Exploration-Stage Project with no resources
|
||||||||
|
Moore Tomblin
|
X
|
Exploration-Stage Project with no resources
|
||||||||
|
Nikita
|
X
|
Exploration-Stage Project with no resources
|
||||||||
|
Riou Lake
|
X
|
Exploration-Stage Project with no resources
|
||||||||
|
Roughrider
|
X
|
Exploration-Stage Project with resources
|
||||||||
|
Shea Creek
|
X
|
Exploration-Stage Project with resources
|
||||||||
|
Uchrich
|
X
|
Exploration-Stage Project with no resources
|
||||||||
|
Waterfound River
|
X
|
Exploration-Stage Project with no resources
|
||||||||
|
West Bear
|
X
|
Exploration-Stage Project with no resources
|
|
Wheeler River
|
X
|
Feasibility Field Test mining completed
|
||||||||
|
Wolly
|
X
|
Exploration-Stage Project with no resources
|
||||||||
|
Kiggavik
|
X
|
Development-Stage, not permitted to mine
|
||||||||
|
Paraguay
|
||||||||||
|
Property
|
Fully
Permitted to
Mine
|
Partially Permitted to Mine
|
Not
Permitted
to Mine
|
Notes
|
||||||
|
Yuty
|
X
|
Exploration-Stage Project with resources
|
||||||||
|
Oviedo
|
X
|
Exploration-Stage Project with no resources
|
||||||||
|
Titanium Projects
|
||||||||||
|
Paraguay
|
||||||||||
|
Property
|
Fully
Permitted to
Mine
|
Partially Permitted to Mine
|
Not
Permitted
to Mine
|
Notes
|
||||||
|
Alto Parana
|
X
|
Exploration-Stage Project with no resources
|
||||||||
|
State/Province
|
Plant
|
Location (Latitude)
|
Location (Longitude)
|
Equity Interest
|
Operator
|
Status
|
Annual Permitted Production Capacity
|
Fully Permitted
to Mine
|
Partially Permitted
to Mine
|
Not
Permitted
to Mine
|
WDEQ Class 1 Well Permits
|
TCEQ Radioactive Materials License
|
|
Wyoming
|
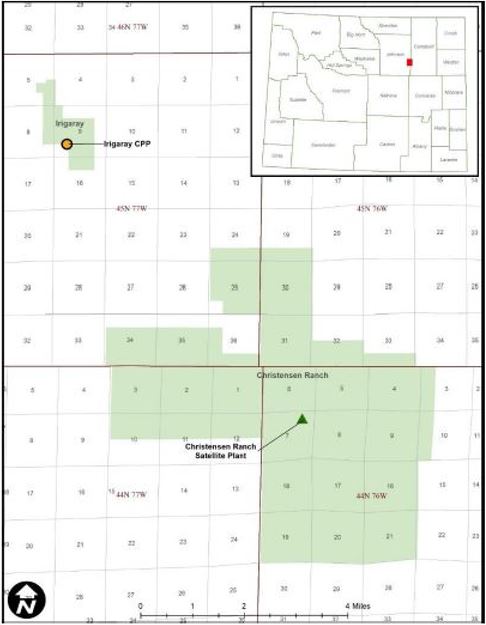
Irigaray Central Processing Plant
|
100%
|
UEC
|
Production Suspended
|
2.5 Mlb/year
|
X
|
2
|
Yes
|
||||
|
Christensen Ranch Satellite Production Plant
|
100%
|
UEC
|
Standby
|
9,000 gpm
|
X
|
4
|
Yes
|
|||||
|
State/Province
|
Plant
|
Location (Latitude)
|
Location (Longitude)
|
Equity Interest
|
Operator
|
Status
|
Annual Permitted Production Capacity
|
Fully Permitted
to Mine
|
Partially Permitted
to Mine
|
Not
Permitted
to Mine
|
TCEQ Class 1 Well Permits
|
TCEQ Radioactive Materials License
|
|
Texas
|
Hobson Central Processing Plant
|
28.945
|
-97.989
|
100%
|
UEC
|
Production Suspended
|
4.0 Mlb/year
|
X
|
2
|
Yes
|
|
Uranium Oxide Mineral Resources
|
||||||||||||||
|
Country
|
State/Province
|
Project
|
Measured
|
Indicated
|
Inferred
|
|||||||||
|
Tons
('000's)
|
Tonnes
('000's) |
Grade
(% U3O8) |
Pounds
U3O8
('000's)
|
Tons
('000's)
|
Tonnes
('000's) |
Grade
(% U3O8) |
Pounds
U3O8 ('000's)
|
Tons
('000's)
|
Tonnes
('000's) |
Grade
(% U3O8) |
Pounds
U3O8 ('000's)
|
|||
|
|
|
Allemand-Ross
|
246
|
223
|
0.09%
|
417
|
32
|
29
|
0.07%
|
42
|
1,275
|
1,157
|
0.10%
|
2,496
|
|
Barge
|
4,301
|
3,902
|
0.05%
|
4,361
|
||||||||||
|
Charlie
|
1,255
|
1,139
|
0.12%
|
3,100
|
411
|
373
|
0.12%
|
988
|
||||||
|
Christensen Ranch
|
6,555
|
5,947
|
0.07%
|
9,596
|
||||||||||
|
Clarkson Hill
|
957
|
868
|
0.06%
|
1,113
|
||||||||||
|
Irigaray
|
3,881
|
3,521
|
0.08%
|
5,899
|
104
|
94
|
0.07%
|
141
|
||||||
| Wyoming |
Jab/West Jab
|
1,621
|
1,471
|
0.07%
|
2,335
|
253
|
230
|
0.08%
|
392
|
1,402
|
1,272
|
0.06%
|
1,677
|
|
|
Ludeman
|
2,674
|
2,426
|
0.09%
|
5,017
|
2,660
|
2,413
|
0.09%
|
4,697
|
866
|
786
|
0.07%
|
1,258
|
||
|
Moore Ranch
|
2,675
|
2,427
|
0.06%
|
3,210
|
46
|
42
|
0.05%
|
44
|
||||||
|
Nine Mile Lake
|
3,405
|
3,089
|
0.04%
|
4,308
|
||||||||||
|
Red Rim
|
337
|
306
|
0.17%
|
1,142
|
473
|
429
|
0.16%
|
1,539
|
||||||
| United States |
Reno Creek
|
14,990
|
13,599
|
0.04%
|
12,920
|
16,980
|
15,404
|
0.04%
|
13,070
|
1,920
|
1,742
|
0.04%
|
1,490
|
|
|
Wyoming Total
|
22,206
|
20,145
|
0.05%
|
23,899
|
36,254
|
32,889
|
0.06%
|
42,299
|
10,859
|
9,851
|
0.07%
|
15,054
|
||
|
|
Burke Hollow
|
70
|
64
|
0.08%
|
115
|
1,337
|
1,213
|
0.09%
|
2,209
|
2,494
|
2,263
|
0.10%
|
4,859
|
|
|
Goliad
|
1,595
|
1,447
|
0.05%
|
2,668
|
1,504
|
1,364
|
0.10%
|
3,492
|
333
|
302
|
0.20%
|
1,225
|
||
| Texas |
Palangana
|
232
|
210
|
0.13%
|
643
|
302
|
274
|
0.18%
|
1,001
|
|||||
|
Salvo
|
1125
|
1,020
|
0.09%
|
2,839
|
||||||||||
|
Texas Total
|
1,665
|
1,510
|
0.08%
|
2,783
|
3,073
|
2,788
|
0.10%
|
6,344
|
5,469
|
4,961
|
0.09%
|
9,924
|
||
|
|
Anderson
|
16,175
|
14,674
|
0.10%
|
32,055
|
|||||||||
| Arizona |
Workman Creek
|
1,981
|
1,797
|
0.11%
|
4,459
|
|||||||||
|
Arizona Total
|
16,175
|
14,674
|
0.10%
|
32,055
|
1,981
|
1,797
|
0.11%
|
4,459
|
||||||
|
United States Total
|
23,871
|
21,655
|
0.06%
|
26,682
|
55,502
|
50,351
|
0.07%
|
80,698
|
18,309
|
16,610
|
0.08%
|
29,437
|
||
|
|
|
Christie Lake
|
537
|
488
|
1.57%
|
16,836
|
||||||||
|
Roughrider
|
429
|
389
|
3.25%
|
27,842
|
396
|
359
|
4.55%
|
36,043
|
||||||
| Canada | Saskatchewan |
Horseshoe-Raven
|
11,412
|
10,353
|
0.16%
|
37,426
|
||||||||
|
Shea Creek
|
1,113
|
1,009
|
1.49%
|
33,175
|
679
|
616
|
1.02%
|
13,775
|
||||||
|
Millennium
|
239
|
217
|
2.39%
|
11,423
|
68
|
62
|
3.19%
|
4,364
|
||||||
|
Canada Total
|
13,192
|
11,968
|
0.42%
|
109,867
|
1,681
|
1,525
|
2.11%
|
71,019
|
||||||
|
Paraguay
|
Yuty
|
9,074
|
8,232
|
0.05%
|
8,962
|
2,733
|
2,479
|
0.04%
|
2,203
|
|||||
|
Total Resources
|
23,871
|
21,655
|
0.06%
|
26,682
|
77,768
|
70,550
|
0.13%
|
199,527
|
22,797
|
20,681
|
0.23%
|
102,658
|
||
|
1.
|
The Mineral Resource estimates in this table meet S-K 1300 definitions.
|
|
|
2.
|
Mineral Resources are not Mineral Reserves and do not have demonstrated economic viability.
|
|
|
3.
|
The point of reference for mineral resources is in-situ at the Project.
|
|
|
4.
|
Mineral Resources are estimated using a long-term uranium price of $40 per pound for ISR projects and $65 per pound for conventional projects, except for the Canadian projects where a price of $56 per pound was used for the Roughrider Project, a price of $75 per pound was used for the Horseshoe-Raven Project, a price of $50 per pound was used for the Shea Creek Project, a price of $50 per pound was used for the Christie Lake Project and a price of $62 per pound was used for the Millennium Project.
|
|
|
5.
|
Mineral Resources in the table above are 100% attributable to the Company. Where JV projects have resources that are attributable to other companies, these resources are not listed in this table.
|
|
|
6.
|
Numbers may not add due to rounding.
|
|
Uranium Oxide Resources
|
|||||||||||
|
FY 2022
|
FY 2023
|
YOY Change
|
|||||||||
|
Country
|
State/Province
|
Project
|
Measured
Pounds
U3O8 ('000's)
|
Indicated
Pounds
U3O8 ('000's)
|
Inferred
Pounds
U3O8
('000's)
|
Measured Pounds
U3O8
('000's)
|
Indicated
Pounds
U3O8
('000's)
|
Inferred
Pounds
U3O8
('000's)
|
% Change
in
Measured
Pounds
|
% Change in
Indicated
Pounds
|
% Change in
Inferred
Pounds
|
|
|
|
Allemand-Ross
|
417
|
42
|
2,496
|
417
|
42
|
2,496
|
0%
|
0%
|
0%
|
|
Barge
|
4,361
|
4,361
|
0%
|
||||||||
|
Charlie
|
3,100
|
988
|
3,100
|
988
|
0%
|
0%
|
|||||
|
Christensen Ranch
|
9,596
|
9,596
|
0%
|
||||||||
|
Clarkson Hill
|
1,113
|
1,113
|
0%
|
||||||||
|
Irigaray
|
5,899
|
141
|
5,899
|
141
|
0%
|
0%
|
|||||
| Wyoming |
Jab/West Jab
|
2,335
|
392
|
1,677
|
2,335
|
392
|
1,677
|
0%
|
0%
|
0%
|
|
|
Ludeman
|
5,017
|
4,697
|
1,258
|
5,017
|
4,697
|
1,258
|
0%
|
0%
|
0%
|
||
|
Moore Ranch
|
3,210
|
44
|
3,210
|
44
|
0%
|
0%
|
|||||
| United States |
Nine Mile Lake
|
4,308
|
4,308
|
0%
|
|||||||
|
Red Rim
|
1,142
|
1,539
|
1,142
|
1,539
|
0%
|
0%
|
|||||
|
Reno Creek
|
12,920
|
13,070
|
1,490
|
12,920
|
13,070
|
1,490
|
0%
|
0%
|
0%
|
||
|
Wyoming Total
|
23,899
|
42,299
|
15,054
|
23,899
|
42,299
|
15,054
|
0%
|
0%
|
0%
|
||
|
|
Burke Hollow
|
115
|
2,209
|
4,859
|
115
|
2,209
|
4,859
|
0%
|
0%
|
0%
|
|
| Texas |
Goliad
|
2,668
|
3,492
|
1,225
|
2,668
|
3,492
|
1,225
|
0%
|
0%
|
0%
|
|
|
Palangana
|
643
|
1,001
|
643
|
1,001
|
0%
|
0%
|
|||||
|
Salvo
|
2,839
|
2,839
|
0%
|
||||||||
|
Texas Total
|
2,783
|
6,344
|
9,924
|
2,783
|
6,344
|
9,924
|
0%
|
0%
|
0%
|
||
|
|
Anderson
|
32,055
|
32,055
|
0%
|
|||||||
| Arizona |
Workman Creek
|
4,459
|
4,459
|
0%
|
|||||||
|
Arizona Total
|
32,055
|
4,459
|
32,055
|
4,459
|
0%
|
0%
|
|||||
|
United States Total
|
26,682
|
80,698
|
29,437
|
26,682
|
80,698
|
29,437
|
0%
|
0%
|
0%
|
||
|
|
|
Christie Lake
|
16,836
|
100%
|
|||||||
|
Roughrider
|
27,842
|
36,043
|
100%
|
100%
|
|||||||
| Canada | Saskatchewan |
Horseshoe-Raven
|
37,426
|
100%
|
|||||||
|
Shea Creek
|
33,175
|
13,775
|
100%
|
100%
|
|||||||
|
Millennium
|
11,423
|
4,364
|
100%
|
100%
|
|||||||
|
Canada Total
|
109,867
|
71,019
|
100%
|
100%
|
|||||||
|
Paraguay
|
Yuty
|
8,962
|
2,203
|
8,962
|
2,203
|
0%
|
0%
|
||||
|
Total Resources
|
26,682
|
89,660
|
31,640
|
26,682
|
199,527
|
102,658
|
0%
|
123%
|
224%
|
||
|
1.
|
The Mineral Resource estimates in this table meet S-K 1300 definitions.
|
|
|
2.
|
Mineral Resources are not Mineral Reserves and do not have demonstrated economic viability.
|
|
|
3.
|
The point of reference for mineral resources is in-situ at the Project.
|
|
|
4.
|
Mineral Resources are estimated using a long-term uranium price of $40 per pound for ISR projects and $65 per pound for conventional projects, except for the Canadian projects where a price of $56 per pound was used for the Roughrider Project, a price of $75 per pound was used for the Horseshoe-Raven Project, a price of $50 per pound was used for the Shea Creek Project, a price of $50 per pound was used for the Christie Lake Project and a price of $62 per pound was used for the Millennium Project..
|
|
|
5.
|
Mineral Resources are 100% attributable to the Company. Where JV projects have resources that are attributable to other companies, these resources are not listed in this table.
|
|
|
6.
|
Numbers may not add due to rounding.
|
|
●
|
The Tullock member consists of sandstone, siltstone and sparse coal and carbonaceous shale;
|
|
●
|
The Lebo member consists of abundant drab gray mudstone, minor siltstone and sandstone and sparse coal and carbonaceous shale beds; and
|
|
●
|
The Tongue River member consists of interbedded sandstone, conglomerate, siltstone, mudstone, limestone, anomalously thick coal beds and carbonaceous shale beds. This member has been mined extensively for its coal beds, which can be hundreds of feet thick.
|
|
Year
|
Company
|
Operations/Activity
|
Amount
(No. of Drill holes)
|
Results of Work
|
|
1969
|
Homestake Mining (“Homestake”)
|
Original controller of the Irigaray Project Area.
|
Approximately 1,340
|
Right to mine secured. Preliminary delineation of mineralized areas.
|
|
1975
|
Westinghouse Electric Corporation (“Westinghouse”)
|
Acquired property from Homestake. The project was licensed for ISR production in 1978 and was operated by Wyoming Mineral Corporation, a subsidiary of Westinghouse. Operations ceased in 1982 due to market trends.
|
Approximately 470
|
Delineation of mineralized areas. Began ISR production.
|
|
1987
|
Malapai Resources Company (“Malapai”)
|
Acquired property from Westinghouse.
|
None
|
Ownership transition.
|
|
1990
|
Total Minerals Corporation (“TOMIN”) and Électricité de France (“EDF”)
|
Acquired property from Malapai. TOMIN acted as project operator.
|
None
|
Ownership transition.
|
|
1993
|
COGEMA Resources, Inc. (“COGEMA”) (now Orano S.A.)/Areva
|
Replaced TOMIN as project operator in partnership with EDF. COGEMA acquired interests from TOMIN.
|
Approximately 20
|
0.74 million lb. of U3O8 produced from 1978 through 2000.
|
|
2010
|
Uranium One
|
Dried many millions of pounds from Christensen Ranch and through toll milling.
|
N/A
|
Decommissioned Irigaray wellfields.
|
|
2021
|
UEC
|
Irigaray Project Area acquired by UEC from Uranium One.
|
N/A
|
Ownership transition.
|
|
Classification
|
Tons Ore
(000’s)
|
Tonnes Ore
(1000’s)
|
Average
Grade
(% eU3O8)
|
Pounds
eU3O8
(000’s)
|
|
Measured
|
-
|
-
|
-
|
-
|
|
Indicated
|
3,881
|
3,521
|
0.076
|
5,899.0
|
|
Total M&I
|
3,881
|
3,521
|
0.076
|
5,899.0
|
|
Inferred
|
104
|
94
|
0.068
|
141.0
|
|
Total Resources
|
3,985
|
3,615
|
0.076
|
6,040.0
|
|
1.
|
The sum of resource tons and lbs. may not add up to the reported total due to rounding.
|
|
|
2.
|
Measured, indicated and inferred mineral resources as defined in 17 CFR § 229.1300.
|
|
|
3.
|
GT Cutoff = 0.25 ft% eU3O8.
|
|
|
4.
|
All reported resources occur below the static water table.
|
|
|
5.
|
The point of reference for mineral resources is in-situ at the Project.
|
|
|
6.
|
Mineral resources that are not mineral reserves do not have demonstrated economic viability.
|
|
|
7.
|
A long-term uranium price of $40/lb U3O8 and an 80% metallurgical recovery factor were considered for the purposes of determining the reasonable prospect of economic extraction.
|

|
Year
|
Company
|
Operations/Activity
|
Amount
(No. of Drill
holes)
|
Results of Work
|
|
1967
|
Independent Operators
|
Assembled as a large land package by independent operators.
|
Approximately 4,860
|
Right to mine secured. Preliminary delineation of mineralized areas.
|
|
1979
|
Arizona Public Services (“APS”), parent company of Malapai
|
APS became a 50% partner in 1979.
|
Approximately 2,220
|
Delineation of mineralized areas.
|
|
1981
|
Malapai
|
Malapai assumed sole ownership of the Christensen Ranch Project Area by acquiring the interests of Wold Energy (“Wold”) and Western Nuclear Corporation (“WNC”). Malapai purchased the Irigaray Project Area from Westinghouse in 1987, and the Christensen Ranch Project Area was licensed for operations under the Irigaray U.S. NRC and Wyoming Department of Environmental Quality (“WDEQ”) license/permit in 1988. Uranium production by ISR was started by Malapai in 1989 and was placed on standby in 1990.
|
Approximately 1,460
|
Delineation of mineralized areas. Began ISR production.
|
|
1990
|
TOMIN and EDF
|
EDF acquired the Irigaray and Christensen Ranch Project Areas from Malapai in 1990. TOMIN acted as project operator for EDF under a joint participation agreement. TOMIN restarted ISR operations in 1991.
|
Approximately 2,270
|
Delineation of mineralized areas. Restarted ISR production.
|
|
1993
|
COGEMA and EDF
|
In 1993, COGEMA acquired the assets of TOMIN and changed the name of the operating entity to COGEMA Mining, Inc. EDF (now Malapai) was still owner of 29%, COGEMA, as operator, owned 71% through the joint participation agreement.
|
Approximately 3,690
|
3.70 million lbs of U3O8 produced from 1989 through 2000.
|
|
2000
|
COGEMA and Malapai
|
Groundwater restoration of Mine Units 2 through 6 was completed. The Christensen Ranch Project Area was placed on standby from 2006 through 2010, at which time COGEMA and Malapai sold the project to Uranium One and Uranium One USA, Inc. (collectively, “Uranium One”).
|
N/A
|
188,000 lbs of U3O8 produced during restoration.
|
|
2010
|
Uranium One
|
Mine Units 7, 8 and 10 were installed and operated. A ramp up occurred in 2011, and a ramp down occurred in 2013 (all wellfield development ceased). Low production mode occurred in 2014 through 2018, and production ended in 2018, at which time the Christensen Ranch Project Area was placed on care and maintenance.
|
N/A
|
2.6 million lbs of U3O8 produced.
|
|
2021
|
UEC
|
The Christensen Ranch Project Area acquired by UEC from Uranium One.
|
N/A
|
Ownership transition.
|
|
Classification
|
Tons Ore
(000’s)
|
Tonnes Ore
(1000’s)
|
Average
Grade
(% eU3O8)
|
Pounds
eU3O8
(000’s)
|
|
Measured
|
-
|
-
|
-
|
-
|
|
Indicated
|
6,555
|
5,947
|
0.073
|
9,596
|
|
Total M&I
|
6,555
|
5,947
|
0.073
|
9,596
|
|
Inferred
|
-
|
-
|
-
|
-
|
|
Total Resources
|
6,555
|
5,947
|
0.073
|
9,596
|
|
1.
|
The sum of resource tons and lbs. may not add up to the reported total due to rounding.
|
|
|
2.
|
Measured, indicated, and inferred mineral resources as defined in 17 CFR § 229.1300.
|
|
|
3.
|
GT Cutoff = 0.25 ft% eU3O8.
|
|
|
4.
|
All reported resources occur below the static water table.
|
|
|
5.
|
The point of reference for mineral resources is in-situ at the Project.
|
|
|
6.
|
Mineral resources that are not mineral reserves do not have demonstrated economic viability.
|
|
|
7.
|
A long-term uranium price of $40/lb U3O8 and an 80% metallurgical recovery factor were considered for the purposes of determining the reasonable prospect of economic extraction.
|
|
Year
|
Company
|
Operations/Activity
|
Amount
(No. of Drill holes)
|
Results of Work
|
|
1971
|
Conoco Minerals (“Conoco”) and Kerr-McGee Corporation (“Kerr-McGee”)
|
Conoco and Kerr-McGee operated as a joint venture. Of the joint venture, Conoco controlled 50% of the Moore Ranch Project Area and served as the operator.
|
Approximately 2,700 rotary drill holes
Approximately 130 core holes
|
Discovery and delineation of mineralized areas. Permitting and licensing of a proposed uranium processing facility known as Sand Rock Mill was completed through the WDEQ/LQD and the NRC.
|
|
1983
|
Wold and Kerr-McGee
|
Conoco sold its interests to Wold in 1983. Kerr-McGee retained the rights with Wold. Assessment drilling was conducted.
|
None
|
Retained mining claims. Mining claim assessment drilling.
|
|
1989
|
Rio Algom Mining Corp.
(“Rio Algom”) |
Rio Algom acquired the project in 1989. Rio Algom conducted mining claim assessment drilling to retain mining claims through 1992, which was the last year to allow mining claim assessment drilling.
|
None
|
Retained mining claims. Mining claim assessment drilling.
|
|
1992
|
Rio Algom
|
Claim maintenance paid directly to the BLM. No further drilling conducted.
|
None
|
Mining claims retained through payment.
|
|
2002
|
Power Resources, Inc. (“PRI”)
(now Cameco Resources) |
Rio Algom acquired by PRI.
|
None
|
Ownership transition.
|
|
2004
|
Energy Metals Corporation (“EMC”)
|
EMC acquired most of the mining claims and state leases.
|
N/A
|
Secured right to mine.
|
|
2007
|
Uranium One
|
Uranium One acquired EMC and all rights to the Moore Ranch Project Area. Uranium One completed verification and resource enhancement drilling, coring, baseline monitor wells, and pump test wells. The Moore Ranch Project Area is fully permitted by WDEQ/LQD in 2011 and the NRC in 2013.
|
Approximately 800
|
Exploration efforts focused on developing and upgrading mineral resources.
|
|
2021
|
UEC
|
Moore Ranch Project Area acquired by UEC from Uranium One.
|
N/A
|
Ownership transition.
|
|
Classification
|
Tons Ore
(000’s)
|
Tonnes Ore
(1000’s)
|
Average
Grade
(% eU3O8)
|
Pounds
eU3O8
(000’s)
|
|
Measured
|
2,675
|
2,427
|
0.06
|
3,210.0
|
|
Indicated
|
-
|
-
|
-
|
-
|
|
Total M&I
|
2,675
|
2,427
|
0.06
|
3,210.0
|
|
Inferred
|
46
|
42
|
0.047
|
43.7
|
|
Total Resources
|
2,721
|
2,469
|
0.06
|
3,253.7
|
|
1.
|
The sum of resource tons and lbs. may not add up to the reported total due to rounding.
|
|
|
2.
|
Measured, indicated, and inferred mineral resources as defined in 17 CFR § 229.1300.
|
|
|
3.
|
GT Cutoff = 0.3 ft% eU3O8.
|
|
|
4.
|
All reported resources occur below the static water table.
|
|
|
5.
|
The point of reference for mineral resources is in-situ at the Project.
|
|
|
6.
|
Mineral resources that are not mineral reserves do not have demonstrated economic viability.
|
|
|
7.
|
A long-term uranium price of $40/lb U3O8 and an 80% metallurgical recovery factor were considered for the purposes of determining the reasonable prospect of economic extraction.
|
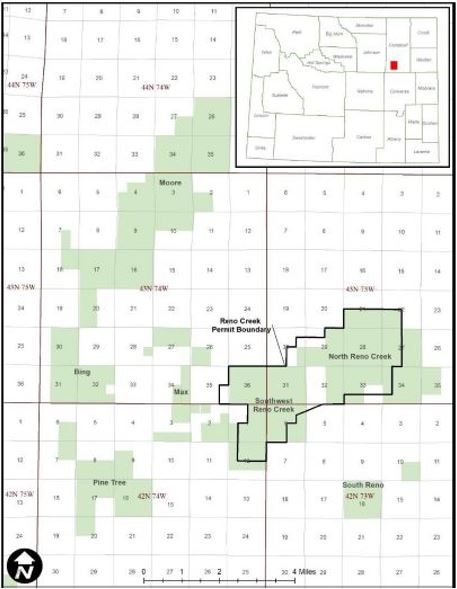
|
Year
|
Company
|
Operations/Activity
|
Amount
(No. of Drill holes)
|
Results of Work
|
|
Reno Creek – North Reno Creek
|
||||
|
Late 1960s
|
Rocky Mountain Energy Company (“RME”)
|
Drilled exploration holes at and around North Reno Creek resource area.
|
Approximately 5,800
|
Delineated Approximately 10 miles of roll-front deposits.
|
|
Mid 1970s
|
RME, Mono Power Company (“Mono”) and Halliburton Services
|
Partnership formed to develop North Reno Creek Resource Area using ISR methods.
|
N/A
|
Acquisition of the Reno Creek Project Area.
|
|
1992
|
Energy Fuels Nuclear Inc./International Uranium Corporation
|
Energy Fuels Nuclear Inc. acquired RME’s North Reno Creek Resource Area and later became International Uranium Corporation.
|
N/A
|
Acquisition of the Reno Creek Project Area.
|
|
2001
|
Rio Algom
|
Rio Algom acquired International Uranium Corporation’s property.
|
N/A
|
Acquisition of the Reno Creek Project Area.
|
|
2001
|
PRI
|
PRI acquired North Reno Creek Area and dropped claims in 2003.
|
N/A
|
Acquisition of the Reno Creek Project Area and mining claims dropped.
|
|
2004
|
Strathmore Minerals Corporation and American Uranium Corporation (“AUCA”)
|
Re-staked and filed new mining claims on approximately 16,000 acres.
|
N/A
|
Refiled mining claims and secured right to mine.
|
|
2007
|
AUCA
|
Advanced project through acquisition of most major permits and required authorizations.
|
N/A
|
Acquisition of the Reno Creek Project Area and secured permits and authorizations.
|
|
2017
|
UEC
|
Consolidated ownership of multiple resource areas and oversaw technical reporting and auditing of Project resources.
|
N/A
|
Consolidation of ownership. Auditing of project resources.
|
|
Reno Creek – Southwest Reno Creek
|
||||
|
Pre-2007
|
AUCA and Tennessee Valley Authority JV
|
Controlled Southwest Reno Creek and drilled exploration holes.
|
Approximately 700
|
Delineation of mineralized areas.
|
|
2007
|
AUCA
|
Advanced project through acquisition of most major permits and required authorizations.
|
N/A
|
Secured permits and required authorizations.
|
|
2017
|
UEC
|
Consolidated ownership of multiple Resource Areas and oversaw technical reporting and auditing of Project resources.
|
N/A
|
Consolidation of ownership. Auditing of the Reno Creek Project Area resources.
|
|
Reno Creek – Moore, Pine Tree, and Bing
|
||||
|
1960s
|
Utah International Mining Company
|
Exploration on Moore and Pine Tree Resource Areas.
|
N/A
|
Delineation of mineralized areas.
|
|
Late 1970s
|
Pathfinder Mines, Inc.
|
Utah International Mining Company becomes Pathfinder Mines, Inc. and continues exploration on Moore and Pine Tree Resource Areas.
|
>1,560
|
Delineation of mineralized areas.
|
|
1980s
|
RME
|
Obtained ownership of Moore Area, continued exploration drilling until the 1990s.
|
>400
|
Acquired the Reno Creek Project Area. Delineation of mineralized areas.
|
|
1960s
|
Cleveland-Cliffs Iron Company
|
Exploration of Bing Area, drilled several hundred exploration holes and conducted limited hydrologic testing in the 1970s.
|
177
|
Delineation of mineralized areas through drilling and conducted hydrologic testing.
|
|
2007
|
AUCA
|
Consolidated the Resource Areas under one owner.
|
N/A
|
Consolidated ownership.
|
|
2017
|
UEC
|
Oversaw technical reporting and auditing of project resources.
|
N/A
|
Auditing of the Reno Creek Project Area resources.
|
|
Classification
|
Tons Ore
(000’s)
|
Tonnes Ore
(1000’s)
|
Average
Grade
(% eU3O8)
|
Pounds
eU3O8
(000’s)
|
|
Measured
|
14,990
|
13,599
|
0.043
|
12,920.0
|
|
Indicated
|
16,980
|
15,404
|
0.039
|
13,070.0
|
|
Total M&I
|
31,970
|
29,003
|
0.041
|
25,990.0
|
|
Inferred
|
1,920
|
1,742
|
0.039
|
1,490.0
|
|
Total Resources
|
33,890
|
30,745
|
0.041
|
27,480.0
|
|
1.
|
The sum of resources tons and lbs. may not add up to the reported total due to rounding.
|
|
|
2.
|
Measured, indicated, and inferred mineral resources as defined in 17 CFR § 229.1300.
|
|
|
3.
|
GT Cutoff = 0.20 ft% eU3O8.
|
|
|
4.
|
All reported resources occur below the static water table.
|
|
|
5.
|
The point of reference for mineral resources is in-situ at the Project.
|
|
|
6.
|
Mineral resources that are not mineral reserves do not have demonstrated economic viability.
|
|
|
7.
|
A long-term uranium price of $40/lb U3O8 and an 80% metallurgical recovery factor were considered for the purposes of determining the reasonable prospect of economic extraction.
|
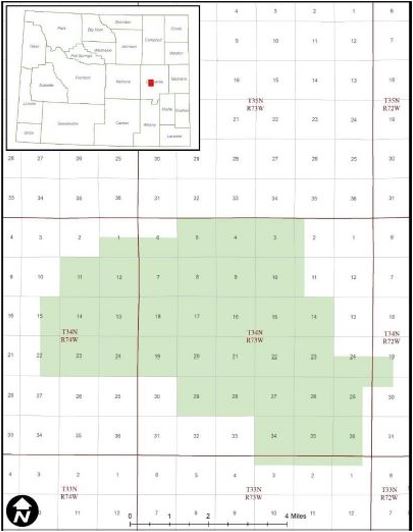
|
Year
|
Company
|
Operations/Activity
|
Amount
(No. of Drill holes)
|
Results of Work
|
|
1960s-1970s
|
Cordero Mining
|
Numerous exploration companies including Teton Exploration (“Teton”), PRI, Uranium Resources, Inc. (“URI”) and Malapai (a subsidiary of APS) collectively explored in the Ludeman Project Area.
|
Approximately 5,420
|
Explored for uranium roll-front mineralization and delineated deposits in the Ludeman Project Area.
|
|
1980
|
United Nuclear Corp. (“UNC”) and partner Teton
|
Constructed and operated the Leuenberger ISR pilot test facility for 12 months. Groundwater restoration was completed following production and a commercial permit to mine was granted. Due to a decline in the market, the permitted mine was not placed into commercial operation and the permit expired.
|
N/A
|
Produced 12,800 lbs of U3O8 from the pilot facility.
|
|
1981
|
URI
|
Constructed and operated the North Platte ISR project on a portion of the Ludeman Project Area. The pilot test facility produced for five months during 1982.
|
N/A
|
Produced 1,515 lbs of U3O8 from the pilot facility.
|
|
1980s
|
Malapai
|
Permitted the Peterson Project for pilot operations but was never operated.
|
N/A
|
Facility was never operated.
|
|
1985-Early 1990s
|
Central Electrical Generating Board of England (known as PRI)
|
Nedco and Union Pacific properties were consolidated into the Teton Leuenberger Project. PRI purchased the property and added to the acreage through the purchase of adjacent claim blocks owned by Kerr-McGee.
|
N/A
|
Ownership transition and growth in acreage through acquisitions.
|
|
Late 1990s
|
PRI
|
Leuenberger properties were released due to declining market trends. Some claims reverted to previous owners.
|
N/A
|
Decrease in claims and generally the Ludeman Project Area.
|
|
Early
to Mid- 2000s
|
High Plains Uranium (“HPU”) and EMC
|
HPU held most claims and leases in the Ludeman Project Area. Energy Metals held the remaining claims in the Ludeman Project Area.
|
N/A
|
Claims and leases increased in the Ludeman Project Area.
|
|
2007
|
EMC
|
EMC acquired HPU.
|
N/A
|
Consolidation through acquisition.
|
|
2007
|
Uranium One
|
Uranium One acquired Energy Metals in late 2007 and continued exploration of the Ludeman Project Area from 2007 through 2012. The primary goals of drilling included exploration to establish continuity of regional ore trends, development drilling to determine the lateral extents of the ore body, stratigraphic investigation, confirmation of the location and nature of mineralization, and collection of cores for leach testing and analysis of uranium, mineralogy, trace metals, disequilibrium, permeability, porosity and density. Acquired the WDEQ/LQD mine permit and NRC license.
|
Approximately 2,180
|
Continued exploration of the Ludeman Project Area. Additional holes included boreholes, core holes, and monitor wells.
|
|
2021
|
UEC
|
The Ludeman Project Area acquired by UEC from Uranium One.
|
N/A
|
Ownership transition.
|
|
Classification
|
Tons Ore
(000’s)
|
Tonnes Ore
(1000’s)
|
Average
Grade
(% eU3O8)
|
Pounds
eU3O8
(000’s)
|
|
Measured
|
2,674
|
2,426
|
0.094
|
5,016.9
|
|
Indicated
|
2,660
|
2,413
|
0.088
|
4,696.9
|
|
Total M&I
|
5,334
|
4,839
|
0.091
|
9,713.8
|
|
Inferred
|
866
|
786
|
0.073
|
1,258.0
|
|
Total Resources
|
6,200
|
5,625
|
0.088
|
10,971.8
|
|
1.
|
The sum of measured and indicated tons and lbs. may not add up to the reported total due to rounding.
|
|
|
2.
|
Measured and indicated mineral resources as defined in 17 CFR § 229.1300.
|
|
|
3.
|
GT Cutoff = 0.25 ft% eU3O8.
|
|
|
4.
|
All reported resources occur below the static water table.
|
|
|
5.
|
The point of reference for mineral resources is in-situ at the Project.
|
|
|
6.
|
Mineral resources that are not mineral reserves do not have demonstrated economic viability.
|
|
|
7.
|
A long-term uranium price of $40/lb U3O8 and an 80% metallurgical recovery factor were considered for the purposes of determining the reasonable prospect of economic extraction.
|
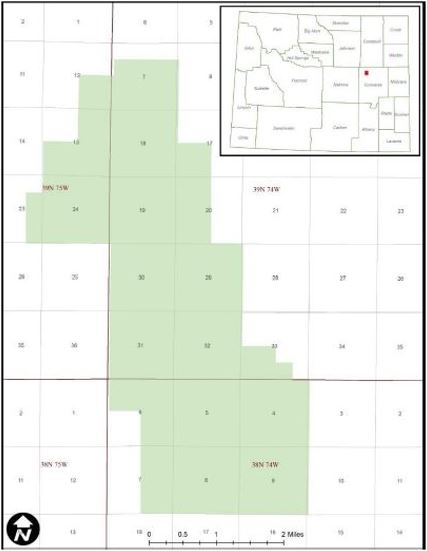
|
Year
|
Company
|
Operations/Activity
|
Amount
(No. of Drill holes)
|
Results of Work
|
|
1967
|
Kerr-McGee, Homestake, Teton
|
Early uranium exploration was completed by the three companies in the Allemand-Ross Project Area. Exploration was typically for shallower mineralization (<1,000 ft).
|
Approximately 100
|
Exploration of shallow mineralization (<1,000 ft).
|
|
1971
|
Conoco
|
Conoco staked lode mining claims in 1969. In 1970, Conoco entered an agreement with National Resources Corporation to earn in on the Allemand-Ranch land holdings. National Resources Corporation’s interests were acquired by Pioneer Nuclear in 1972 and the joint venture partnership was maintained until 1975. In 1979, Conoco continued to operate the drilling program. Conoco closed its mineral department in 1984.
|
Approximately 1,180
|
A significant amount of the mineralization within the Allemand-Ross Project Area was delineated.
|
|
1984
|
Power Reactor and Nuclear Fuel Development Corporation (“PNC”)
|
PNC assumed control of the Allemand-Ross Project Area and continued exploration.
|
Approximately 50
|
Additional exploration completed by PNC.
|
|
Early
1990s
|
PNC
|
Mineral rights were allowed to lapse due to further declining uranium market conditions.
|
N/A
|
Lost mineral rights.
|
|
Early
2000s-2005
|
HPU and EMC
|
Claims and leases were acquired during the uranium market upswing. HPU held most claims and leases and EMC holding the remainder of the Allemand-Ross Project Area.
|
N/A
|
Mineral rights were acquired.
|
|
2007
|
EMC
|
EMC acquired HPU. The properties were consolidated.
|
N/A
|
Properties consolidated.
|
|
2007
|
Uranium One
|
Uranium One acquired EMC. Uranium One proceeded to conduct verification and resource enhancement drilling. Most drilling was completed between 2008 and 2010.
|
Approximately 300
|
Additional exploration completed within the Allemand-Ross Project Area with average depths ranging from 1,118 ft to 1,546 ft.
|
|
2021
|
UEC
|
The Allemand-Ross Project Area acquired by UEC from Uranium One.
|
N/A
|
Ownership transition.
|
|
Classification
|
Tons Ore
(000’s)
|
Tonnes Ore
(1000’s)
|
Average
Grade
(% eU3O8)
|
Pounds
eU3O8
(000’s)
|
|
Measured
|
246
|
223
|
0.085
|
417.0
|
|
Indicated
|
32
|
29
|
0.066
|
42.4
|
|
Total M&I
|
278
|
252
|
0.083
|
459.4
|
|
Inferred
|
1,275
|
1,157
|
0.098
|
2,496.0
|
|
Total Resources
|
1,553
|
1,409
|
0.095
|
2,955.4
|
|
1.
|
The sum of resource tons and lbs. may not add up to the reported total due to rounding.
|
|
|
2.
|
Measured and indicated mineral resources as defined in 17 CFR § 229.1300.
|
|
|
3.
|
GT Cutoff = 0.25 ft% eU3O8.
|
|
|
4.
|
All reported resources occur below the static water table.
|
|
|
5.
|
The point of reference for mineral resources is in-situ at the Project.
|
|
|
6.
|
Mineral resources that are not mineral reserves do not have demonstrated economic viability.
|
|
|
7.
|
A long-term uranium price of $40/lb U3O8 and an 80% metallurgical recovery factor were considered for the purposes of determining the reasonable prospect of economic extraction.
|
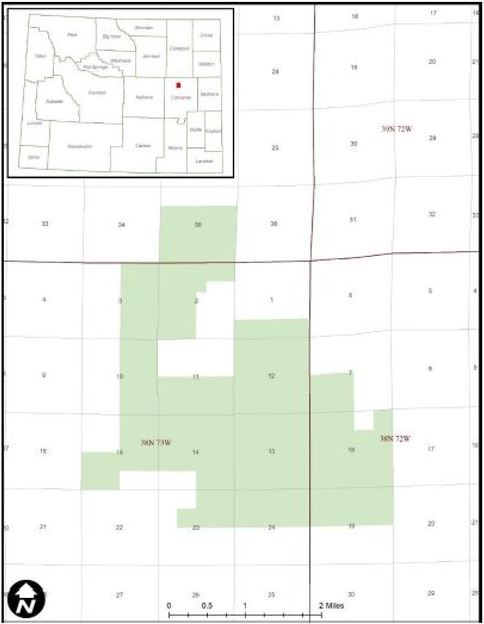
|
Year
|
Company
|
Operations/Activity
|
Amount
(No. of Drill holes)
|
Results of Work
|
|
1969
|
Mono and RME
|
Under a joint venture, Mono and RME conducted the initial exploration program through drilling. Upon successful exploration, the Bear Creek Uranium Company was formed under general partnership between Mono and RME.
|
Unspecified and included in the total estimate.
|
Successful exploration led to joint venture and mill construction.
|
|
1975-1982
|
Bear Creek Uranium Company
|
A mill was constructed in 1975. Open pit mining operations began in 1977 until 1982. Mining claims were dropped after 1982.
|
Approximately 6,880
|
4.7 million tons of material from open pit mining processed at the Bear Creek mill.
|
|
2006
|
EMC
|
EMC located the unpatented mining claims and acquired the state mineral leases.
|
N/A
|
Lapsed mineral leases acquired.
|
|
2007
|
Uranium One
|
Uranium One acquired EMC and all rights to the Barge Project Area.
|
None as of 2019.
|
No exploration had been completed.
|
|
2021
|
UEC
|
Barge Project Area acquired by UEC from Uranium One.
|
N/A
|
Ownership.
|
|
Classification
|
Tons Ore (000’s)
|
Tonnes Ore
(1000’s)
|
Average Grade
(% eU3O8)
|
Pounds
eU3O8 (000’s)
|
|
Measured
|
-
|
-
|
-
|
-
|
|
Indicated
|
4,301
|
3,902
|
0.051
|
4,361.0
|
|
Total M&I
|
4,301
|
3,902
|
0.051
|
4,361.0
|
|
Inferred
|
-
|
-
|
-
|
-
|
|
Total Resources
|
4,301
|
3,902
|
0.051
|
4,361.0
|
|
1.
|
The sum of measured and indicated tons and lbs. may not add up to the reported total due to rounding.
|
|
|
2.
|
Measured and indicated mineral resources as defined in 17 CFR § 229.1300.
|
|
|
3.
|
GT Cutoff = 0.25 ft% eU3O8.
|
|
|
4.
|
All reported resources occur below the static water table.
|
|
|
5.
|
The point of reference for mineral resources is in-situ at the Project.
|
|
|
6.
|
Mineral resources that are not mineral reserves do not have demonstrated economic viability.
|
|
|
7.
|
A long-term uranium price of $40/lb U3O8 and an 80% metallurgical recovery factor were considered for the purposes of determining the reasonable prospect of economic extraction.
|
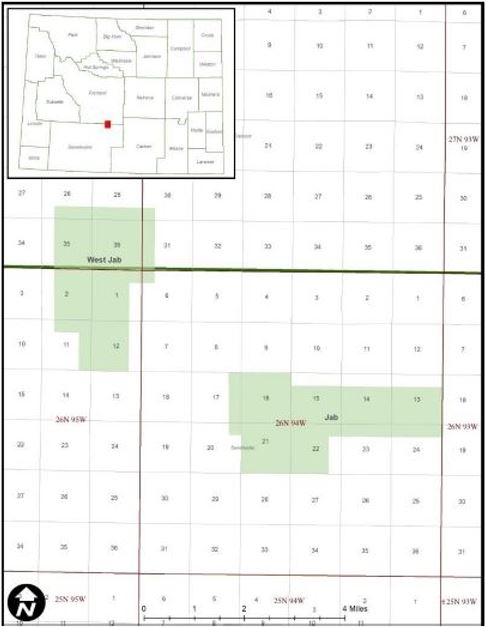
|
Year
|
Company
|
Operations/Activity
|
Amount
(No. of Drill holes)
|
Results of Work
|
|
Jab
|
||||
|
Unspecified
|
Silverbell Industries
|
Originator of the Jab/West Jab Project Area.
|
Not specified.
|
The Jab/West Jab Project Area initially developed.
|
|
1972
|
Union Carbide Corporation (“UCC”)
|
Delineated an area of shallow oxidized mineralization and completed feasibility studies for open pit mining. The plan was not executed, and a mining permit was prepared for the WDEQ/LQD. The permit was withdrawn due to the declining uranium market in 1982.
|
Approximately 1,830
|
Delineation of shallow oxidized material.
|
|
1985-2000
|
Yellowstone Fuels
|
Property held until a decline in the uranium market in 2000. No data developed by Yellowstone Fuels were available for evaluation.
|
No data available.
|
The Jab/West Jab Project Area held but not substantially developed.
|
|
West Jab
|
||||
|
Unspecified
|
AMAX Petroleum Company
|
Originator of the Jab/West Jab Project Area.
|
Not specified.
|
The Jab/West Jab Project Area initially developed.
|
|
1975-1983
|
WNC
|
WNC drilled the Jab/West Jab Project Area until 1983 when uranium markets had dropped. WNC terminated claim. AMAX Petroleum Company regained control until the claims were dropped.
|
Approximately 1,020
|
Exploration completed by WNC.
|
|
Jab/West Jab
|
||||
|
2006
|
EMC
|
Identified the unpatented mining claims and acquired the state mineral leases.
|
N/A
|
Secured right to mine.
|
|
2007
|
Uranium One
|
Uranium One acquired EMC and all rights to the Jab/West Jab Project Area.
|
None as of 2019
|
No exploration had been completed. Right to mine secured.
|
|
2021
|
UEC
|
The Jab/West Jab Project Area acquired by UEC from Uranium One.
|
N/A
|
Ownership transition.
|
|
Classification
|
Tons Ore (000’s)
|
Tonnes Ore
(1000’s)
|
Average Grade
(% eU3O8)
|
Pounds
eU3O8 (000’s)
|
|
Measured
|
1,621
|
1,471
|
0.072
|
2,335.0
|
|
Indicated
|
253
|
230
|
0.077
|
392.0
|
|
Total M&I
|
1,874
|
1,701
|
0.073
|
2,727.0
|
|
Inferred
|
1,402
|
1,272
|
0.06
|
1,677.0
|
|
Total Resources
|
3,276
|
2,973
|
0.067
|
4,404.0
|
|
1.
|
The sum of resource tons and lbs. may not add up to the reported total due to rounding.
|
|
|
2.
|
Measured, indicated, and inferred mineral resources as defined in 17 CFR § 229.1300.
|
|
|
3.
|
GT Cutoff = 0.25 ft% eU3O8.
|
|
|
4.
|
Measured and indicated resources occur below the static water table. The inferred resources at Jab/West Jab occur above the water table and may not be amenable to ISR.
|
|
|
5.
|
The point of reference for mineral resources is in-situ at the Project.
|
|
|
6.
|
Mineral resources that are not mineral reserves do not have demonstrated economic viability.
|
|
|
7.
|
A long-term uranium price of $40/lb U3O8 and an 80% metallurgical recovery factor were considered for the purposes of determining the reasonable prospect of economic extraction.
|
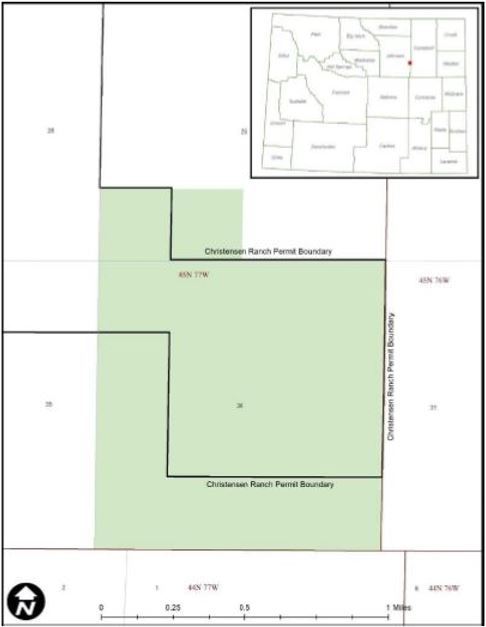
|
Year
|
Company
|
Operations/Activity
|
Amount
(No. of Drill
holes)
|
Results of Work
|
|
1966
|
Preston Oil Co. (“Preston Oil”)
|
Awarded the state lease for 720 acres.
|
None.
|
Right to mine secured.
|
|
1966
|
Inexco Oil Company (“Inexco”)
|
Inexco assigned lease from Preston Oil in 1966 and conducted exploration drilling program in 1969 and 1970.
|
215
|
Delineation of mineralized areas.
|
|
1974
|
Uranerz USA
|
Inexco formed a joint venture with Uranerz USA who became the operator. Over the next two years, Uranerz expanded the drilling program, including core drilling.
|
715
|
Delineation of mineralized areas.
|
|
Not specified
|
Cotter Corporation (“Cotter”)
|
Cotter acquired the property and evaluated both conventional open pit and in situ mining methods. Cotter obtained a surface mining permit in 1979. A 200-foot-deep test pit was excavated in 1981 in a small mineralization area. The pit was subsequently reclaimed, but the state mining permit remains active.
|
Not specified
|
Falling uranium prices in the 1980’s halted
further development.
|
|
1994
|
Cotter and PRI
|
PRI entered a joint venture agreement with Cotter and completed a feasibility study for development as an ISR mine (PRI, 1995). Completed additional drilling in 1994.
|
Not specified
|
The feasibility study was positive; however, the Charlie Project Area did not proceed, and the joint venture agreement expired.
|
|
2014
|
Cotter
|
In 2014 Cotter sought to convert the permit to ISR mining; however, that process has not been completed.
|
None
|
Unknown.
|
|
2018
|
Anfield Energy Inc. (“Anfield”)
|
Anfield acquired the Charlie Project Area from Cotter.
|
None
|
Oversaw technical reporting and auditing of Charlie Project Area resources.
|
|
2021
|
UEC
|
UEC acquired the Charlie Project Area from Anfield.
|
N/A
|
Ownership transition.
|
|
Classification
|
Tons Ore (000’s)
|
Tonnes Ore
(1000’s)
|
Average Grade
(% eU3O8)
|
Pounds
eU3O8 (000’s)
|
|
Measured
|
-
|
-
|
-
|
-
|
|
Indicated
|
1,255
|
1,139
|
0.123
|
3,100.0
|
|
Total M&I
|
1,255
|
1,139
|
0.123
|
3,100.0
|
|
Inferred
|
411
|
373
|
0.120
|
988.0
|
|
Total Resources
|
1,666
|
1,512
|
0.123
|
4,088.0
|
|
1.
|
The sum of resource tons and lbs. may not add up to the reported total due to rounding.
|
|
|
2.
|
Measured, indicated, and inferred mineral resources as defined in 17 CFR § 229.1300.
|
|
|
3.
|
GT Cutoff = 0.20 ft% eU3O8.
|
|
|
4.
|
All reported resources occur below the static water table.
|
|
|
5.
|
The point of reference for mineral resources is in-situ at the Project.
|
|
|
6.
|
Mineral resources that are not mineral reserves do not have demonstrated economic viability.
|
|
|
7.
|
A long-term uranium price of $40/lb U3O8 and an 80% metallurgical recovery factor were considered for the purposes of determining the reasonable prospect of economic extraction.
|
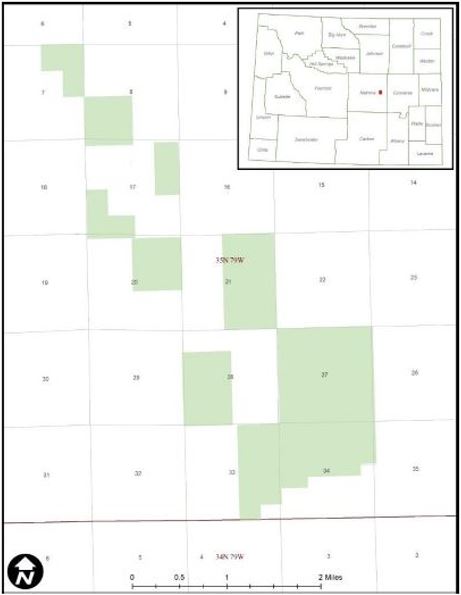
|
Year
|
Company
|
Operations/Activity
|
Amount
(No. of Drill holes)
|
Results of
Work
|
|
Early 1950s
|
Independent operator
|
An internal report from 1969 states a Mr. Vickers reportedly discovered surficial mineralization and mined approximately 100 tons U3O8 at an average grade of 0.30%. Uranium was shipped to the AEC buying station at Edgemont, South Dakota.
|
None
|
Exploration and production of 100 tons U3O8.
|
|
1972
|
RME
|
RME acquired interest in the project in 1972 and conducted extensive drilling through 1978. Pilot scale ISR mining was conducted using four seven-spot patterns with a 50-foot radius. The first 3 patterns used sulfuric acid as the primary lixiviant and the fourth sodium carbonate-bicarbonate as the primary lixiviant. The U.S. Bureau of Mines assisted RME in conducting the pilot testing and documented the results in a publication titled “Case History of a Pilot-Scale Acidic In Situ Uranium Leaching Experiment” (Nigbor, N. T., et al, 1982). RME controlled the project until the late 1980s when the mineral interests were dropped due to declining uranium prices.
|
Approximately 1,100
|
Exploration and pilot scale ISR mining.
|
|
2005 and
2006
|
EMC
|
EMC located unpatented mining lode claims and secured mineral leases and surface agreements within the area formerly held by RME. EMC conducted exploratory drilling and compiled previous data and maps for the project.
|
Approximately 45
|
Secured right to mine.
|
|
2008
|
Uranium One
|
EMC was acquired by Uranium One.
|
None
|
Ownership transition.
|
|
2016
|
Anfield
|
Anfield purchased Nine Mile Lake Project from Uranium One.
|
None
|
Oversaw technical reporting and auditing of project resources.
|
|
2022
|
UEC
|
UEC acquired the Nine Mile Lake Project from Anfield.
|
N/A
|
Ownership transition.
|
|
Classification
|
Tons Ore (000’s)
|
Tonnes Ore
(1000’s)
|
Average Grade
(% eU3O8)
|
Pounds
eU3O8 (000’s)
|
|
Measured
|
-
|
-
|
-
|
-
|
|
Indicated
|
-
|
-
|
-
|
-
|
|
Total M&I
|
-
|
-
|
-
|
-
|
|
Inferred
|
3,405
|
3,089
|
0.036
|
4,308.0
|
|
Total Resources
|
3,405
|
3,089
|
0.036
|
4,308.0
|
|
1.
|
The sum of resource tons and lbs. may not add up to the reported total due to rounding.
|
|
|
2.
|
Measured, indicated, and inferred mineral resources as defined in 17 CFR § 229.1300.
|
|
|
3.
|
GT Cutoff = 0.25 ft% eU3O8.
|
|
|
4.
|
All reported resources occur below the static water table.
|
|
|
5.
|
The point of reference for mineral resources is in-situ at the Project.
|
|
|
6.
|
Mineral resources that are not mineral reserves do not have demonstrated economic viability.
|
|
|
7.
|
A long-term uranium price of $40/lb U3O8 and an 80% metallurgical recovery factor were considered for the purposes of determining the reasonable prospect of economic extraction.
|
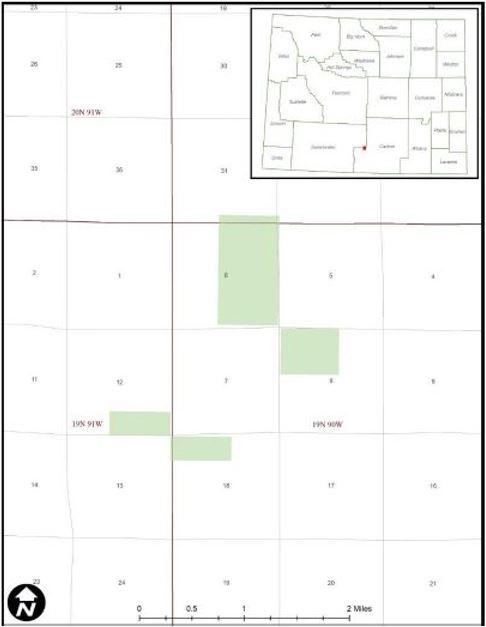
|
Year
|
Company
|
Operations/Activity
|
Amount
(No. of Drill holes)
|
Results of Work
|
|
1970
|
Kerr McGee Corp. and UCC
|
Both companies located claims in the vicinity and conducted exploration and drilling programs. The claims were dropped by 1973.
|
Not specified.
|
Exploration is reported to have encountered alteration and mineralization at depth.
|
|
1974
|
Timberline Minerals and Wold
|
Both companies located claims in the vicinity.
|
None.
|
Secured federal mining claims.
|
|
1976
|
UCC
|
UCC leased the Timberline Minerals property and entered a joint venture agreement with RME, a subsidiary of the Union Pacific Railroad, for the alternate sections of railroad grant lands in the area. UCC relinquished their mineral interests at Red Rim in 1986 and the mining claims reverted to Timberline Minerals, which subsequently dropped the claims.
|
138
|
Conducted an exploration and drilling program. Of the 138 drill holes on the current Red Rim Project Area, 42 are barren or contain trace mineralization and the remaining 96 are mineralized.
|
|
2004
|
EMC
|
Located 49 unpatented mining lode claims that comprise the current Red Rim Project Area.
|
None.
|
Secured federal mining claims.
|
|
2007
|
Uranium One
|
Uranium One Inc. acquired EMC. Through subsequent transactions, Uranium One Inc. became Uranium One Americas, Inc.
|
None.
|
Ownership transition.
|
|
2016
|
Anfield
|
Anfield purchased Red Rim Project from Uranium One.
|
None.
|
Oversaw technical reporting and auditing of project resources.
|
|
2022
|
UEC
|
UEC acquired the Red Rim project from Anfield.
|
N/A
|
Ownership transition.
|
|
Classification
|
Tons Ore (000’s)
|
Tonnes Ore
(1000’s)
|
Average Grade
(% eU3O8)
|
Pounds
eU3O8 (000’s)
|
|
Measured
|
-
|
-
|
-
|
-
|
|
Indicated
|
337
|
306
|
0.170
|
1,142.0
|
|
Total M&I
|
337
|
306
|
0.170
|
1,142.0
|
|
Inferred
|
473
|
429
|
0.163
|
1,539.0
|
|
Total Resources
|
810
|
735
|
0.165
|
2,681.0
|
|
1.
|
The sum of resource tons and lbs. may not add up to the reported total due to rounding.
|
|
|
2.
|
Measured, indicated, and inferred mineral resources as defined in 17 CFR § 229.1300.
|
|
|
3.
|
GT Cutoff = 0.25 ft% eU3O8.
|
|
|
4.
|
All reported resources occur below the static water table.
|
|
|
5.
|
The point of reference for mineral resources is in-situ at the Project.
|
|
|
6.
|
Mineral resources that are not mineral reserves do not have demonstrated economic viability.
|
|
|
7.
|
A long-term uranium price of $40/lb U3O8 and an 80% metallurgical recovery factor were considered for the purposes of determining the reasonable prospect of economic extraction.
|
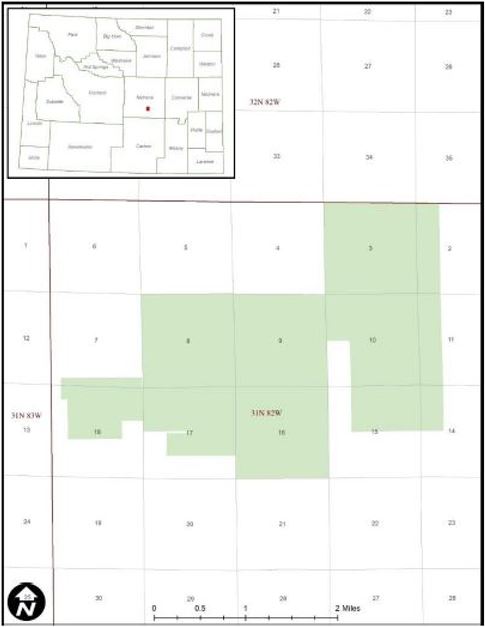
|
Year
|
Company
|
Operations/Activity
|
Amount
(No. of Drill holes)
|
Results of Work
|
|
1959
|
Utah Construction and Mining
|
Conducted uranium exploration drilling.
|
Not specified.
|
Unknown.
|
|
1968
|
Minerals Exploration Company (“MEC”) and Nuclear Reserves Inc.
|
MEC performed exploratory drilling between 1968 and 1981. In 1969, MEC and Nuclear Reserves Inc. entered into a joint venture. MEC held the Clarkson Hill Project Area through the mid-1980s, when they dropped the claims due to declining uranium prices.
|
250
|
Delineation of mineralized areas. Falling uranium prices in the 1980’s halted further development.
|
|
Unknown
|
EMC
|
EMC performed initial staking of 14 claims and compiled relevant data for the Clarkson Hill Project Area. EMC optioned the Clarkson Hill Project Area to Artha Resources, who conducted limited verification drilling during 2008. The Clarkson Hill Project Area reverted from Artha to EMC.
|
5
|
Unknown.
|
|
2008
|
Uranium One
|
EMC was acquired by Uranium One Inc. Through subsequent transactions Uranium One Inc. became Uranium One Americas Inc.
|
None.
|
Ownership transition.
|
|
2016
|
Anfield Resources, Inc. (now Anfield Energy, Inc.)
|
Anfield purchased the Clarkson Hill Project Area from Uranium One.
|
None.
|
Oversaw technical reporting and auditing of the Clarkson Hill Project Area resources.
|
|
2022
|
UEC
|
UEC acquire the Clarkson Hill Project Area from Anfield.
|
N/A
|
Ownership transition.
|
|
Classification
|
Tons Ore (000’s)
|
Tonnes Ore (1000’s)
|
Average Grade (% eU3O8)
|
Pounds eU3O8 (000’s)
|
|
Measured
|
-
|
-
|
-
|
-
|
|
Indicated
|
-
|
-
|
-
|
-
|
|
Total M&I
|
-
|
-
|
-
|
-
|
|
Inferred
|
957
|
868
|
0.058
|
1,113.0
|
|
Total Resources
|
957
|
868
|
0.058
|
1,113.0
|
|
1.
|
The sum of resource tons and lbs. may not add up to the reported total due to rounding.
|
|
|
2.
|
Measured, indicated, and inferred mineral resources as defined in 17 CFR § 229.1300.
|
|
|
3.
|
GT Cutoff = 0.25 ft% eU3O8.
|
|
|
4.
|
All reported resources occur below the static water table.
|
|
|
5.
|
The point of reference for mineral resources is in-situ at the Project.
|
|
|
6.
|
Mineral resources that are not mineral reserves do not have demonstrated economic viability.
|
|
|
7.
|
A long-term uranium price of $40/lb U3O8 and an 80% metallurgical recovery factor were considered for the purposes of determining the reasonable prospect of economic extraction.
|
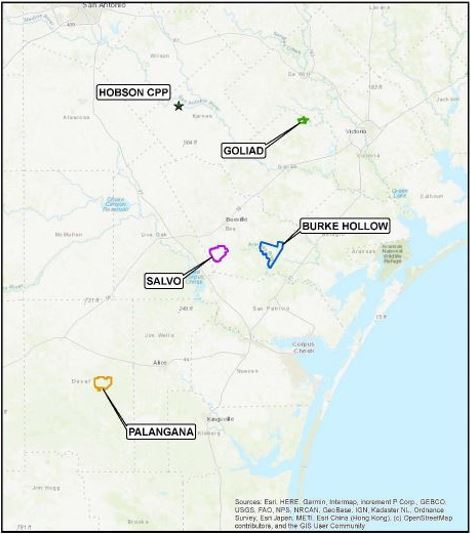
|
●
|
the TCEQ will require UEC to apply for and obtain a radioactive material license pursuant to Title 30 Texas Administrative Code Chapters 305 and 336. The application must address a number of matters including, but not limited to, site characteristics (ecology, geology, topography, hydrology, meteorology, historical and cultural landmarks and archaeology), radiological and non-radiological impacts, environmental effects of accidents, decommissioning, decontamination and reclamation;
|
|
●
|
to produce uranium from subsurface deposits, an operator must obtain an area permit and production area authorization (PAA) pursuant to the Texas Water Code, Chapter 27. Underground injection activities cannot commence until the TCEQ has issued an area permit and PAA to authorize such activities. In addition, all portions of the proposed production zone in groundwater with a total dissolved solids concentration less than 10,000 mg/L, which will be affected by mining solutions, are included within an aquifer exemption approved by TCEQ and the EPA. The PAA application may be developed concurrently with or after the area permit application. As additional production areas are proposed to be activated within the area permit, additional PAA applications must be submitted to the TCEQ for processing and issuance before injecting within the production area;
|
|
●
|
in 1975, the Texas Legislature gave the RRC jurisdiction to regulate surface mining for coal and uranium. No surface mining for uranium is currently conducted at the Project, but uranium exploration for ISR operations is administered by the Surface Mining and Reclamation Division of the RRC. Active uranium exploration sites are inspected monthly (RRC, 2023). The RRC requires exploration permits for any uranium exploration in the state;
|
|
●
|
Texas state law does not provide any agency with the authority to regulate the use or production of groundwater unless the location lies within a water conservation district (WCD). Burke Hollow and Salvo are both located in the Bee County WCD, Goliad is located in the Goliad County WCD and Palangana resides in the Duval County WCD. Prior to initiating uranium recovery at the Project, UEC will need to acquire industrial permits to withdraw groundwater from the host sandstones. Please refer to the TRS report for the Texas Hub and Spoke Project for further details.; and
|
|
●
|
Class I and III injection wells are also regulated by the TCEQ. Therefore, UEC will need to acquire the appropriate permits in order to construct and operate these wells.
|
|
Year
|
Company
|
Operations/Activity
|
Amount
(No. of Drill holes) |
Results of Work
|
|
1979-1988
|
Everest Minerals Corporation (later Everest Exploration, Inc. (EEI))
|
Hobson facility constructed.
|
N/A
|
N/A
|
|
2005
|
Standard Uranium
|
N/A
|
N/A
|
N/A
|
|
2006
|
EMC
|
Standard Uranium and EMC merger.
Extensive renovation of the plant. |
N/A
|
N/A
|
|
2007
|
Uranium One
|
Renovation of the plant.
|
N/A
|
CPP capable of processing 1.5 million lbs per year.
|
|
2009
|
UEC
|
Acquires the Hobson Plant through acquisition of South Texas Mining Venture (STMV)/Uranium One.
|
N/A
|
N/A
|
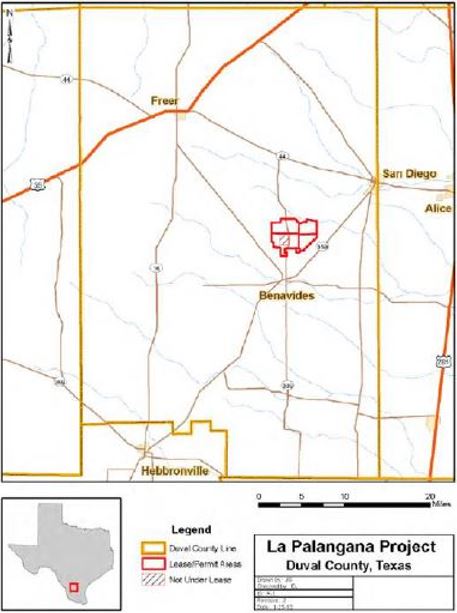
|
Year
|
Company
|
Operations/Activity
|
Amount
(# of Drill holes) |
Results of Work
|
|
1952
|
CSI
|
Original controller of Palangana Project Area.
|
Records of CSI’s exploration work was unavailable
|
Right to mine secured. Uranium mineralization was discovered during potash exploration drilling of the Palangana Dome in 1952 by CSI. CSI conducted active uranium exploration drilling on the property starting in March 1956. CSI and the AEC estimated underground mineable uranium resources. The estimation method included identifying 0.15% eU3O8, a minimum mining thickness of 3 ft, and exploration was widely spaced drilling on a nominal 200 ft exploration grid.
|
|
1958
|
UCC
|
UCC acquired the Palangana Project Area in 1958 and ceased operations shortly after until 1967, when operations resumed for over a decade due to new technology. UCC placed the Palangana Project Area up for lease in 1980.
|
Over 1,000 exploration and development holes in 1960s and 70s (296 cores)
Over 3,000 injection-production holes |
Early development work was quickly abandoned because of concentrations of Hydrogen Sulfide (H2S) gas. The property was reacquired in 1967 after emerging ISR mining technologies were available. ISR operation occurred from 1977 through 1979. About 340,000 lbs of U3O8 were produced from portions of a 31-acre wellfield block. The production pounds indicate a 32% to 34% recovery rate. The ISR work was conducted at a research level in contrast to the current level of knowledge. Historic production lies on the western flank of the dome and is not part of this resource estimate.
|
|
1981
– Unknown
|
Chevron
|
Chevron acquired the UCC leases and conducted their own resource evaluation.
|
N/A
|
Chevron resource evaluation indicated that an estimated 8 million lbs (non-CIM compliant) of eU3O8 existed on the entire site within unclassified material containing 0.125% eU3O8.
|
|
Unknown
to late
1990’s
|
General Atomics
|
General Atomics acquired the Palangana Project Area for restoration work.
|
N/A
|
General Atomics acquired the property and dismantled the process plant in a property-wide restoration effort. Upon formal approval of the clean up by the Texas Natural Resources Conservation Commission and the NRC, the property was returned to the landowners in the late 1990s.
|
|
Late 1990’s
to 2005
|
N/A
|
The Palangana Project Area returned to surface rights landowners.
|
N/A
|
N/A
|
|
2005
|
EEI and Energy Metals/Uranium One
|
EEI acquires Palangana and joint ventured with Energy Metals by forming the STMV. In 2008, Energy Metals was acquired by Uranium One.
|
Approximately 236 exploration and confirmation holes.
|
Blackstone (2005) estimated 5.7 million lbs of inferred resources in the area referred to as the Dome trend proximal to the dome on the west side, north of the prior UCC leach field. In 2006 and 2007, Energy Metals drilled approximately 200 additional confirmation and delineation holes. The PA-1 and PA-2 areas were delineated during this drilling program. During 2008 and 2009, the remainder of the holes were drilled by Uranium One. During this time, five exploration trends on the east side of the dome were identified and partially delineated.
|
|
2009
|
UEC
|
Palangana Project Area acquired by UEC from Uranium One.
|
N/A
|
UEC acquires Palangana. SRK was retained by UEC in 2010 to provide an independent resource and reserve evaluation on PA-1 and PA-2 and adjacent exploration areas. SRK concluded the sandstone, roll-front deposits on the east side of the Palangana Dome contain significant resources of eU3O8. Specifically, PA-1 and PA-2 bodies are adequately delineated for the calculation of Measured and Indicated Resources. SRK developed resource estimates within distinct sand and roll-front zones utilizing detailed computer block modeling of grade and GT modeling. The results of the resource estimation are complex and presented in more detail in this report. In 2010, UEC resumed production at Palangana. Approximately 563,600 pounds were produced from 2010 to 2016 in PA-1, PA-2 and PA-3.
|
|
Classification
|
Tons Ore
(000’s)
|
Tonnes Ore
(1000’s)
|
Average
Grade
(% eU3O8)
|
Pounds
eU3O8
(000’s)
|
|
Measured
|
-
|
-
|
-
|
-
|
|
Indicated
|
232
|
210
|
0.134
|
643.1
|
|
Total M&I
|
232
|
210
|
0.134
|
643.1
|
|
Inferred – PA-1 and PA-2
|
96
|
87
|
0.100
|
192.5
|
|
Inferred – Dome, NE Garcia, SW Garcia, CC Brine, Jemison Fence, Jemison East
|
206
|
187
|
0.110 – 0.300
|
808.8
|
|
Total Resources
|
534
|
484
|
0.154
|
1,644.4
|
|
1.
|
Pounds reported with Disequilibrium Factor (DEF) applied.
|
|
|
2.
|
A range of grades is presented for the Palangana inferred mineral because the resource estimation methods differed between PA-1/PA-2 and the rest of the trends. There was no cutoff for PA-1 and PA-2 block models. See Section 11.1 of the Texas Hub and Spoke TRS for a more detailed explanation.
|
|
|
3.
|
The sum of resource tons and lbs may not add up to the reported total due to rounding.
|
|
|
4.
|
Measured, indicated, and inferred mineral resources as defined in 17 CFR § 229.1300.
|
|
|
5.
|
Delineation drilling conducted at Palangana after 2010 was not incorporated into the resource estimate as in the experience of the QP, this type of drilling does not generally substantially change the resource estimates.
|
|
|
6.
|
All reported resources occur below the static water table.
|
|
|
7.
|
The point of reference for mineral resources is in-situ at the Project.
|
|
|
8.
|
Mineral resources that are not mineral reserves do not have demonstrated economic viability.
|
|
|
9.
|
A long-term uranium price of $40/lb U3O8 and an 80% metallurgical recovery factor were considered for the purposes of determining the reasonable prospect of economic extraction.
|
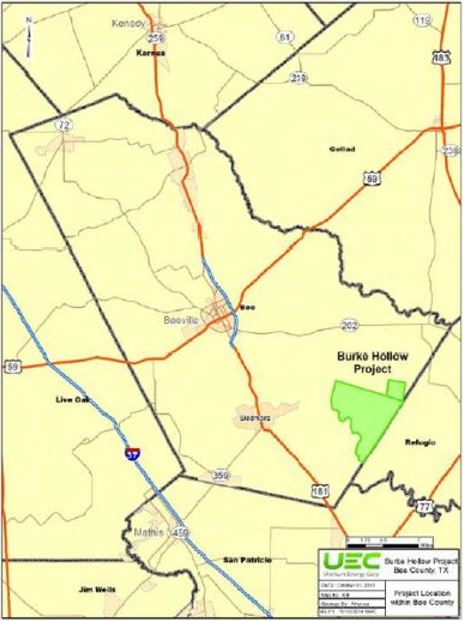
|
Year
|
Company
|
Operations/Activity
|
Amount
(No. of Drill holes) |
Results of Work
|
|
1982
|
Nufuels
|
Original controller of the Burke Hollow Project Area.
|
18 exploration holes on or nearby the Welder Lease
|
Nufuels drilled 18 exploration holes on or nearby UEC’s 1,825-acre Welder lease in conjunction with a larger regional program, which was conducted by Nufuels. Exploration holes were drilled to approximately 1,100 ft bgs and tested the entire prospective Goliad Formation. Results showed the presence of a reduction-oxidation interface in sands of the lower Goliad Formation, but there was insufficient data to link economically viable uranium mineralization.
|
|
1993
|
TOMIN
|
Exploration program.
|
12 exploration holes on or near the Thomson-Barrow Lease.
|
TOMIN conducted a short reconnaissance exploration drilling program on the Thomson-Barrow lease. TOMIN drilled a total of 12 holes on permitted acreage that they negotiated for exploration. 11 of the 12 drill holes intersected anomalous gamma ray log signatures indicative of uranium mineralization, but there was insufficient data to link economically viable uranium mineralization.
|
|
2011
|
UEC
|
The Burke Hollow Project Area was acquired by UEC from TOMIN.
|
From 2012-2017, 707 uranium exploration drill holes, including 30 monitor wells completed at the Welder lease (Kurrus et al. 2014).
|
The historic data package was obtained and reviewed by UEC for portions of the current Burke Hollow Project Area (Kurrus and Yancy, 2017). Based on the limited number of drill holes, no meaningful resource or reserve determination was made using the historic exploration data. However, the actual drilling and geophysical logging results were determined to be properly conducted, per industry standards. UEC completed two drilling campaigns to delineate the opened ended Lower B1 and B2 trends (Carothers et al., 2013). The results of historic and contemporary borehole gamma-ray, SP and resistance logs, as well as PFN logs indicate that uranium mineralization occurs in the upper to lower Goliad Formation sand/sandstone units below the water table at depths from approximately 180 to 1,100 ft bgs. Evidence indicate ISR would likely be the most suitable mining method for this project. In 2017, UEC estimated an Inferred Mineral Resource of 4,064,575 tons grading 0.088% pU3O8 (PFN determination) containing approximately 7.09 million pounds U3O8 in the combined Graben and Eastern Lower B trends.
|
|
2019
|
UEC
|
Exploration program.
|
In 2019, 129 delineation holes were drilled.
From 2021-2022, 168 delineation and exploration holes were drilled. |
In 2019, UEC completed 129 drill holes, mostly focusing on delineating the Lower B1 and Lower B2 sands in the proposed PA-1. In addition, UEC began installing perimeter monitor wells in proposed PA-1. In total, 57 holes were drilled solely for delineation and exploration purposes and 72 holes were drilled for monitoring purposes. From 2021 to 2022, UEC conducted another drilling program to upgrade a portion of their resources from inferred to measured and indicated, to better define the ore body in proposed PA-1 and to install monitor wells. 168 delineation and exploration holes were drilled as of March 7, 2022. 24 of these holes were also used as monitor wells. This drilling program is ongoing for the purpose of completing more monitor wells. The first production area authorization application has been submitted and 533 exploration and delineation holes have been drilled within PA-2 area as of July 31, 2023.
|
|
Classification
|
Tons Ore (000’s)
|
Tonnes Ore
(1000’s)
|
Average Grade
(% eU3O8)
|
Pounds
eU3O8 (000’s)
|
|
Measured
|
70
|
64
|
0.082
|
114.7
|
|
Indicated
|
1,337
|
1,213
|
0.087
|
2,209.0
|
|
Total M&I
|
1,407
|
1,277
|
0.083
|
2,323.7
|
|
Inferred
|
2,494
|
2,263
|
0.095
|
4,859.0
|
|
Total Resources
|
3,901
|
3,540
|
0.092
|
7,182.7
|
|
1.
|
Pounds reported with Disequilibrium Factor (DEF) applied.
|
|
|
2.
|
The sum of resource tons and lbs. may not add up to the reported total due to rounding.
|
|
|
3.
|
Measured, indicated, and inferred mineral resources as defined in 17 CFR § 229.1300.
|
|
|
4.
|
GT Cutoff = 0.30 ft% eU3O8.
|
|
|
5.
|
All reported resources occur below the static water table.
|
|
|
6.
|
The point of reference for mineral resources is in-situ at the Project.
|
|
|
7.
|
Mineral resources that are not mineral reserves do not have demonstrated economic viability.
|
|
|
8.
|
A long-term uranium price of $40/lb U3O8 and an 80% metallurgical recovery factor were considered for the purposes of determining the reasonable prospect of economic extraction.
|
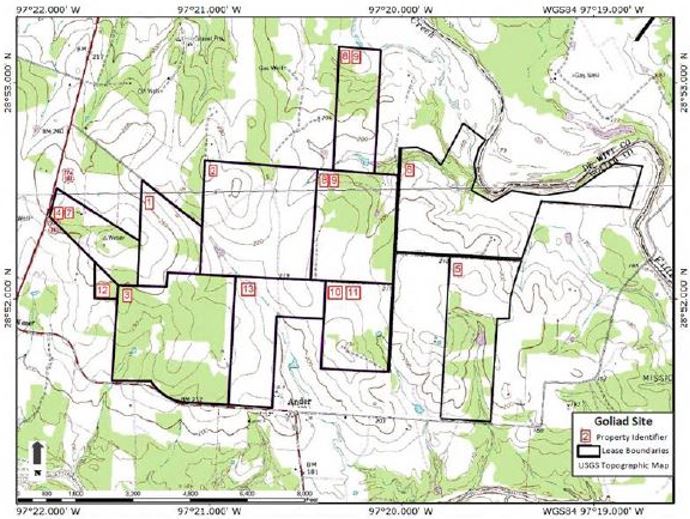
|
Year
|
Company
|
Operations/Activity
|
Amount
(No. of Drill holes) |
Results of Work
|
|
1979
|
Coastal Uranium, Inc. (Coastal Uranium)
|
Exploration program.
|
12 exploration holes.
|
Coastal Uranium drilled widely spaced exploration holes in the region as part of the Coastal States wide-spaced drilling exploration effort. Eight of these holes were drilled at or near the Goliad Project Area. Additional information on the exploration is described below.
|
|
1980
|
Moore Energy Corporation
|
Review of data and leases from Coastal Uranium and exploration program.
|
479 exploration and delineation holes.
|
Moore Energy Corporation reviewed the Coastal States exploration data and soon after acquired several leases from Coastal Uranium, including several in the Goliad Project Area. From March 1983 through August 1984, Moore Energy Corporation conducted an exploration program at Goliad. All of the boreholes were drilled using truck-mounted drilling rigs contracted with various drilling companies. Samples were taken by the driller for review and logged by a geologist. The holes were logged for gamma ray, self-potential and resistance by contract logging companies. No down-hole deviation tool was available. Historical resource estimates were prepared by Moore Energy Corporation from data gathered in 1983-1985. For each drill hole, a Grade x Thickness (GT) was determined, and the mineral was outlined with a 0.3 GT contour. The average GT of the holes within the contoured outline was used to estimate the resources meeting the specified criteria. Moore Energy Corporation’s historical resource estimated approximately 3,366,000 tons at an average grade of 0.05% (eU3O8 and an average DEF of 1.494 (Moore, 1986). This equates to approximately 5.2 million lbs of uranium.
|
|
2006
|
UEC
|
Exploration program.
|
360 exploration and delineation holes.
|
UEC obtained mine leases by assignment from Brad A. Moore for the current Goliad Project Area in 2006. UEC drilled 360 more holes at the property from May 2006 through June 2007. These holes include closer-spaced delineation work on the areas drilled by Moore Energy Corporation. Additionally, several of the UEC holes were drilled to further exploration on contiguous leases to the east of the property. A 2007/2008 report by Thomas Carothers, PG estimated historical mineral resources based on the UEC 2006-2007 confirmation drilling results and the Moore Energy Corporation historical estimate. The author concluded that significant uranium resources from the work in 1983-85 described by Moore Energy Corporation appears to be backed and supported by the more recent UEC exploration data.
|
|
2014
|
UEC
|
Exploration and water well program.
|
33 exploration holes and two water wells drilled.
|
In 2014, UEC conducted a drilling program at the Goliad Project Area for exploration and water wells. 35 holes were drilled and logged for exploration and water supply purposes with a majority of the holes being drilled in PA-1 and PA-2.
|
|
Classification
|
Tons Ore (000’s)
|
Tonnes Ore
(1000’s)
|
Average Grade
(% eU3O8)
|
Pounds
eU3O8 (000’s)
|
|
Measured
|
1,595
|
1,447
|
0.053
|
2,667.9
|
|
Indicated
|
1,504
|
1,364
|
0.102
|
3,492.0
|
|
Total M&I
|
3,099
|
2,811
|
0.085
|
6,159.9
|
|
Inferred
|
333
|
302
|
0.195
|
1,224.8
|
|
Total Resources
|
3,432
|
3,113
|
0.079
|
7,384.7
|
|
1.
|
Pounds reported with Disequilibrium Factor (DEF) applied.
|
|
|
2.
|
The sum of resource tons and lbs. may not add up to the reported total due to rounding.
|
|
|
3.
|
Measured, indicated, and inferred mineral resources as defined in 17 CFR § 229.1300.
|
|
|
4.
|
GT Cutoff = 0.20 ft% eU3O8.
|
|
|
5.
|
All reported resources occur below the static water table.
|
|
|
6.
|
The point of reference for mineral resources is in-situ at the Project.
|
|
|
7.
|
Mineral resources that are not mineral reserves do not have demonstrated economic viability.
|
|
|
8.
|
A long-term uranium price of $40/lb U3O8 and an 80% metallurgical recovery factor were considered for the purposes of determining the reasonable prospect of economic extraction.
|
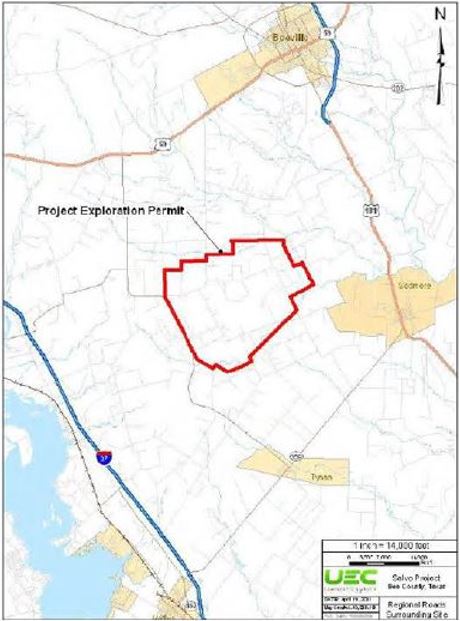
|
Year
|
Company
|
Operations/Activity
|
Amount
(No. of Drill holes)
|
Results of Work
|
|
Unknown
to 1983
|
Nufuels
|
Original controller of the Salvo Project Area.
|
111 exploration holes.
|
Nufuels discovered uranium mineralization in La Para sands of the Miocene-aged Goliad Formation in 1982 in Bee County, Texas. Mobil’s reconnaissance drilling located two areas of interest, known as the Salvo and Segar projects. Mobil had drilled a total of 111 exploration holes at Salvo and Seger in 1982. Shortly after conducting their exploration drilling in this area, Mobil elected to discontinue their uranium exploration efforts and sell their uranium production facilities. The early Salvo exploration drilling conducted by Nufuels indicated significant uranium mineralization was present.
|
|
1983
|
URI joint venture with Saaberg Interplan Uran Gmbh (“SIPU”) (“URI/SIPU”)
|
URI formed a joint venture exploration program with SIPU, a German utility. URI/SIPU acquired Salvo from Mobil, along with the Seger Project, an eastward extension along the same geochemical roll-front system. URI/SIPU leased the property until about 1993 when secondary lease expired.
|
295 exploration and delineation holes in 1984.
19 exploration holes at the nearby Seger Project. |
URI/SIPU calculated a resource of approximately 1.5 million pounds U3O8 at Salvo using a 0.5 GT cutoff in 1984. Average GT was modeled at 0.989, with a ratio of 0.194, width of 45 ft, length of 140 ft, and tonnage factor of 1.236 lbs/ft2. Due to low uranium prices, URI/SIPU elected not to permit the project at that time (R.B. Smith, unpublished report, 2005). URI utilized a Monte Carlo-based computer simulation to calculate the historic resource (URI, 1984).
|
|
2005
|
R.B. Smith & Associates Inc. (“R.B. Smith”)
|
Review of past exploration data.
|
N/A
|
R.B. Smith (2005) completed an evaluation of the Goliad Formation trend project data at the Salvo and Seger projects. Data were on loan from URI/SIPU. Smith did not retain copies of maps or electric logs, and the original data set of logs and maps was returned to URI. URI held the data in storage until 2010.
|
|
2010
|
UEC
|
The Salvo Project Area was acquired by UEC from URI/SIPU. UEC negotiated a purchase of available data from URI. URI and UEC reached agreement on sales of Salvo and Seger project data in 2010. The adjacent Seger property is no longer included in UEC’s Salvo leases.
|
N/A
|
Ownership transition. UEC received 425 exploration log files, and several drill hole location maps and land maps. The 425 log files include good quality electric logs from Mobil’s activities at Seger and Salvo in 1982, as well as URI/SIPU’s drill hole logs from exploration activities in 1984. Each log file also contains a detailed lithological report based on drill hole cuttings prepared by Mobil’s and later by URI’s field geologists supervising and monitoring drilling activity. Four core holes were drilled by URI, and core analysis reports were included in the appropriate log files. Eight holes were logged by Princeton Gamma-Tech (PGT, and early form of PFN), a logging company which specialized in uranium chemical assay logging. The PGT logs were utilized and verified as having excellent correlation to actual chemical uranium content by several south Texas ISR mining operations. These results are believed to be pertinent to the understanding of this deposit and indicated a generally positive DEF like other known Goliad Formation sandstones in the region. The historic mineralized intercepts from URI exploration boreholes were presented in the initial NI 43-101 UEC Salvo Project TRS dated July 16, 2010. The estimated historic uranium resource (URI 1984 classification only) of approximately 1.5 million pounds eU3O8 was determined but was not verified independently. However, it was presented in the initial 43-101 TRS.
|
|
Classification
|
Tons Ore (000’s)
|
Tonnes Ore
(1000’s)
|
Average Grade
(% eU3O8)
|
Pounds
eU3O8 (000’s)
|
|
Measured
|
-
|
-
|
-
|
-
|
|
Indicated
|
-
|
-
|
-
|
-
|
|
Total M&I
|
-
|
-
|
-
|
-
|
|
Inferred
|
1,125
|
1,020
|
0.091
|
2,839.0
|
|
Total Resources
|
1,125
|
1,020
|
0.091
|
2,839.0
|
|
1.
|
Pounds reported with Disequilibrium Factor (DEF) applied.
|
|
|
2.
|
The sum of resource tons and lbs. may not add up to the reported total due to rounding.
|
|
|
3.
|
Measured, indicated, and inferred mineral resources as defined in 17 CFR § 229.1300.
|
|
|
4.
|
GT Cutoff = 0.30 ft% eU3O8.
|
|
|
5.
|
All reported resources occur below the static water table.
|
|
|
6.
|
The point of reference for mineral resources is in-situ at the Project.
|
|
|
7.
|
Mineral resources that are not mineral reserves do not have demonstrated economic viability.
|
|
|
8.
|
A long-term uranium price of $40/lb U3O8 and an 80% metallurgical recovery factor were considered for the purposes of determining the reasonable prospect of economic extraction.
|
|
●
|
all exploration and mining activities must comply with the National Environmental Policy Act (NEPA); and
|
|
●
|
required environmental permits and licenses would include but may not be limited to:
|
|
●
|
Mine Land Reclamation Plan; Arizona State Mine Inspector;
|
|
●
|
Exploration Permit; Arizona State Land Department;
|
|
●
|
Plan of Operations; Bureau of Land Management;
|
|
●
|
Source Material License; U.S. Nuclear Regulatory Commission;
|
|
●
|
Water Wells and Appropriations; Arizona Department of Water Resources;
|
|
●
|
Dams and Impoundments; Arizona Department of Water Resources;
|
|
●
|
Air Quality Control Permit; Arizona Department of Environmental Quality;
|
|
●
|
Water and Stormwater Discharge Permits; Arizona Department of Environmental Quality;
|
|
●
|
Hazardous Waste; Arizona Department of Environmental Quality and EPA;
|
|
●
|
Solid Waste; Arizona Department of Environmental Quality;
|
|
●
|
Mine Safety and Health; Arizona State Mine Inspector and MSHA; and
|
|
●
|
County Zoning and Construction Permits.
|
|
●
|
Precambrian or Jurassic granitic basement complex;
|
|
●
|
Lacustrine clastic and volcanic members of the Palaeocene-Eocene Artillery Peak Formation;
|
|
●
|
Arrastra Volcanic Complex, including dacitic intrusions, andesitic flows and volcaniclastic members of Paleogene age;
|
|
●
|
Chapin Wash Formation, Anderson Mine lacustrine sediments of Miocene age;
|
|
●
|
Conglomeratic-sandstone unit, possibly equivalent to upper Chapin Wash Formation;
|
|
●
|
Miocene basalt;
|
|
●
|
Pliocene-Pleistocene conglomerate; and
|
|
●
|
Quaternary alluvium.
|
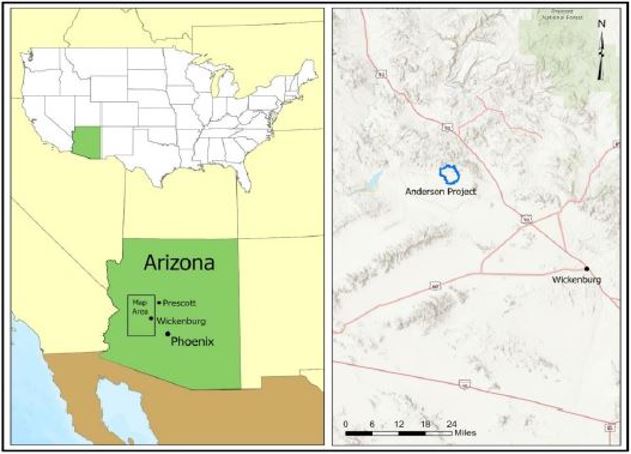
|
●
|
Crystalline Intrusive Rocks: coarse-grained to pegmatitic Precambrian granite;
|
|
●
|
Felsic to Intermediate Volcanic: flows, breccias, tuffs and minor intrusive;
|
|
●
|
Felsic to Intermediate Volcaniclastic: ash flows, tuffaceous beds and arkosic sandstone;
|
|
●
|
Andesitic Volcanic: porphyritic andesitic flows with a paleosurface and locally reddish-brown paleosols;
|
|
●
|
Lacustrine Sedimentary rocks: micaceous siltstones and mudstone, calcareous siltstones and silty limestone, thin beds of carbonaceous siltstone and lignitic material and host of uranium mineralization, averaging about 60 to 100 meters thick;
|
|
●
|
Lower Sandstone Conglomerate: arkosic sandstones and conglomerate, averaging about 60 to 100 meters thick;
|
|
●
|
Basaltic Flows and Dikes: amygdular basalt, averaging about 20 meters thick;
|
|
●
|
Upper Conglomerate: cobble and boulder conglomerate, partly indurate and locally calcite cemented, averaging about zero to 60 meters thick; and
|
|
●
|
Quaternary Alluvium: unconsolidated sand and gravel, caliche formed where calcite cemented.
|
|
Classification
|
Tons Ore (000’s)
|
Tonnes Ore
(1000’s)
|
Average Sum
Thickness (ft)
|
Average Grade
(% eU3O8)
|
Pounds eU3O8 (000’s)
|
|
Measured
|
-
|
-
|
-
|
-
|
-
|
|
Indicated – Zone A
|
862
|
782
|
3.8
|
0.111
|
1,907
|
|
Indicated – Zone B
|
7,347
|
6,665
|
9.5
|
0.108
|
15,816
|
|
Indicated – Zone C
|
6,211
|
5,634
|
10.4
|
0.094
|
11,730
|
|
Indicated – Zone D
|
760
|
689
|
3.2
|
0.093
|
1,421
|
|
Indicated – Zone E
|
911
|
826
|
7.6
|
0.060
|
1,095
|
|
Indicated – Zone F
|
84
|
76
|
4.6
|
0.051
|
86
|
|
Total M&I
|
16,175
|
14,673
|
8.2
|
0.099
|
32,055
|
|
Inferred
|
-
|
-
|
-
|
-
|
-
|
|
Total Resources
|
16,175
|
14,673
|
8.2
|
0.099
|
32,055
|
|
1.
|
The sum of resource tons and lbs. may not add up to the reported total due to rounding.
|
|
|
2.
|
Measured, indicated, and inferred mineral resources as defined in 17 CFR § 229.1300.
|
|
|
3.
|
GT Cutoff = 0.1 ft% eU3O8 and metallurgical Recovery estimated at 90%.
|
|
|
4.
|
Economic factors have been applied to the estimates in consideration of reasonable prospects for economic extraction.
|
|
|
5.
|
The point of reference for mineral resources is in-situ at the Project.
|
|
|
6.
|
Mineral resources that are not mineral reserves do not have demonstrated economic viability.
|
|
|
7.
|
A long-term uranium price of $65/lb U3O8 was considered for the purposes of determining the reasonable prospect of economic extraction.
|
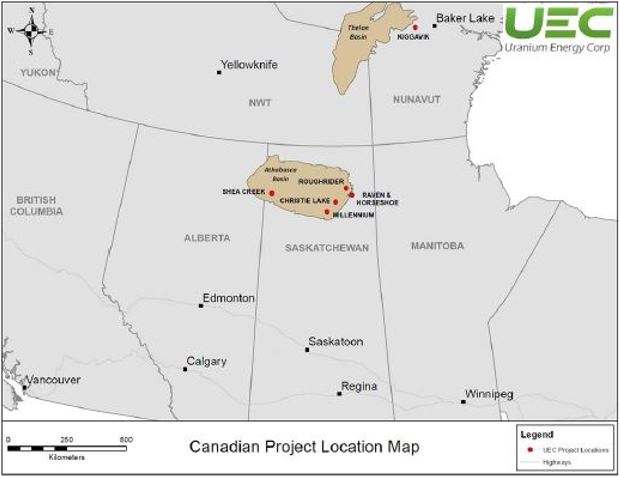
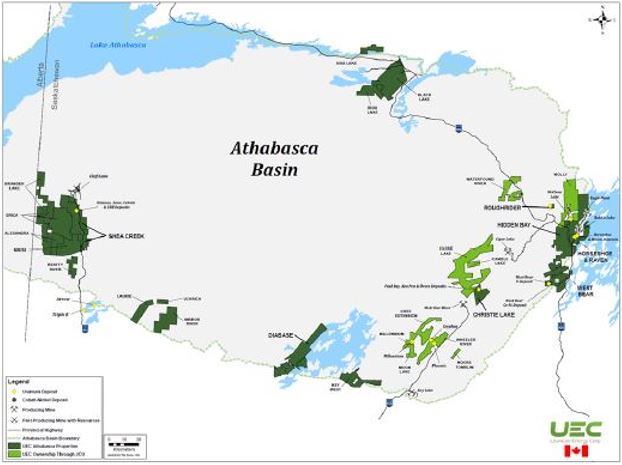
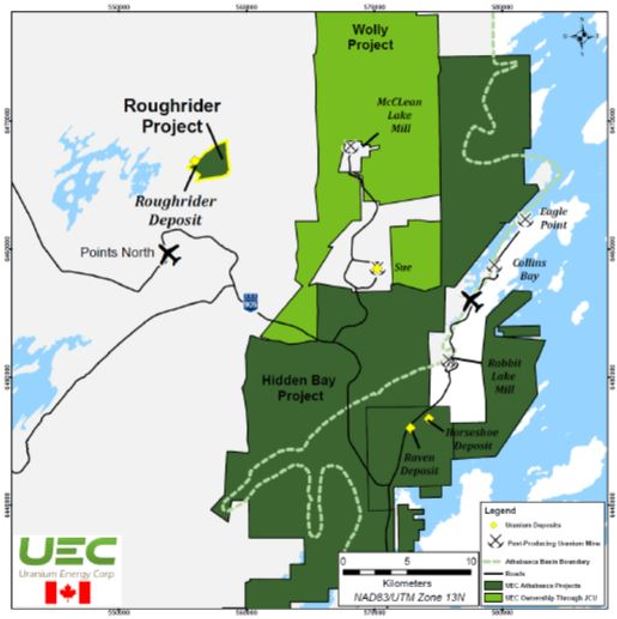
|
Mining Scenario
|
Deposit
|
Classification
|
Tons (‘000’s)
|
Tonnes
(‘000s)
|
Grade
(% U3O8) |
Pounds
U3O8 (‘000s)
|
|
Cut & Fill
|
RRW
|
Indicated
|
44
|
40
|
3.38
|
3,000
|
|
Inferred
|
12
|
11
|
3.64
|
800
|
||
|
Long Hole Open
Stope
|
RRW
|
Indicated
|
176
|
160
|
4.62
|
16,200
|
|
Inferred
|
75
|
68
|
6.06
|
9,100
|
||
|
RRE
|
Indicated
|
-
|
-
|
-
|
-
|
|
|
Inferred
|
256
|
232
|
4.41
|
22,600
|
||
|
RRFE
|
Indicated
|
208
|
189
|
2.07
|
8,600
|
|
|
Inferred
|
53
|
48
|
3.26
|
3,500
|
||
|
Combined RRW, RRE, and RRFE
|
||||||
|
Total
|
Indicated
|
429
|
389
|
3.25
|
27,800
|
|
|
Inferred
|
396
|
359
|
4.55
|
36,000
|
||
|
1.
|
Mineral Resources are not Mineral Reserves and do not have demonstrated economic viability.
|
|
|
2.
|
Mineral Resources are reported exclusive of Mineral Reserves. There are no Mineral Reserves for the Project.
|
|
|
3.
|
Mineral Resources are reported on a 100% ownership basis.
|
|
|
4.
|
Mineral Resources are reported diluted within the MSO shapes based on a U3O8 price of US$56/1b of U3O8 and metallurgical recovery of 97%. Cut and Fill (“C&F”) and long-hole open stoping (“LHOS”) scenario cut-off grades are 0.52% U3O8 and 0.45% U3O8 respectively.
|
|
|
5.
|
The Mineral Resources were estimated by SRK, a third-party QP under the definitions defined by S-K 1300.The tonnage (presented in metric tonnes), grade (%), and contained metal (metric tonnes and imperial pounds) have been rounded to reflect the accuracy of the estimates.
|
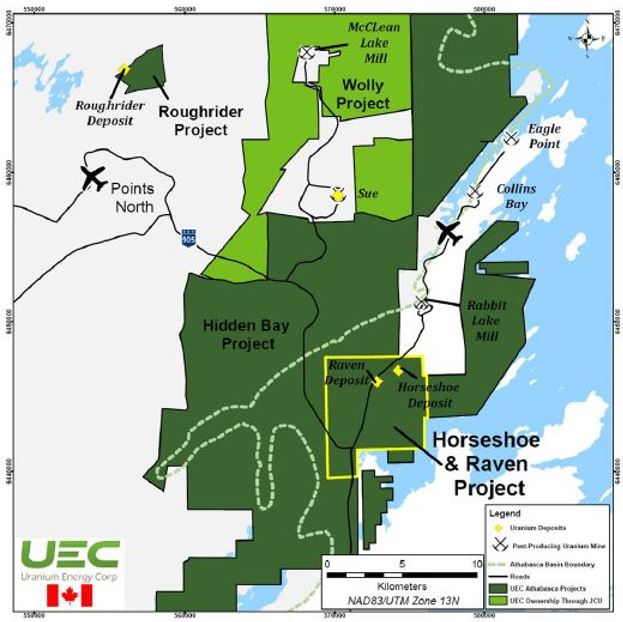
|
●
|
a basal pelitic gneiss composed of coarse, mature quarzitic to arkosic metasedimentary rocks;
|
|
●
|
a meta-pelite, commonly graphitic and interlayered with quartzitic semi-pelite and calc-silicate;
|
|
●
|
a thick meta-arkose interlayered with minor calc-silicate and pelite; and
|
|
●
|
upper amphibole-quartzite interlayered with calcareous metasedimentary rocks and graphitic pelite, known as the Hidden Bay assemblage.
|
|
Deposit
|
Classification
|
Tons (‘000s)
|
Tonnes
(‘000s)
|
Grade
(% U3O8) |
Pounds
U3O8 (‘000s)
|
|
Horseshoe
|
Indicated
|
5,493
|
4,983
|
0.215
|
23,600
|
|
Raven
|
Indicated
|
5,919
|
5,370
|
0.117
|
13,800
|
|
1.
|
Mineral resources are not mineral reserves and have not demonstrated economic viability.
|
|
|
2.
|
There is no certainty that all or any part of the mineral resource will be converted into mineral reserves.
|
|
|
3.
|
All figures are rounded to reflect the relative accuracy of the estimates.
|
|
|
4.
|
Resources were estimated using a COG of 0.05% U3O8. COG was determined using a uranium price of $75 / lb and metallurgical recovery of 95%.
|
|
|
5.
|
Mineral Resources are reported on a 100% ownership basis.
|
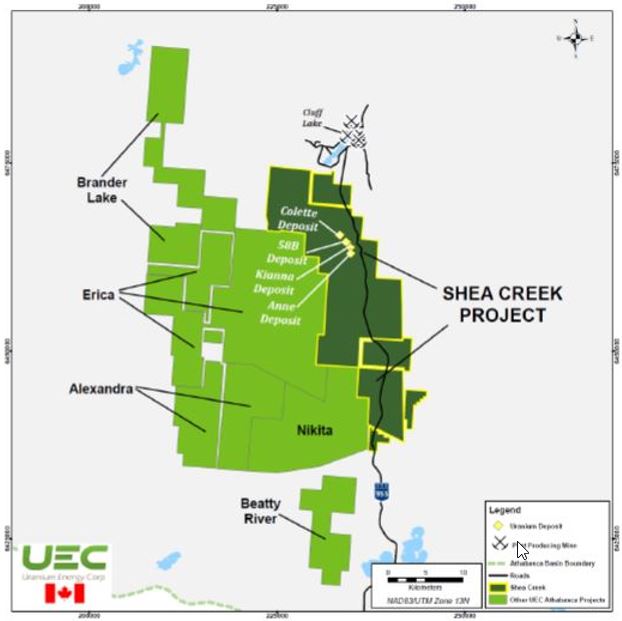
|
Deposit
|
Classification
|
Tons (000’s)
|
Tonnes
(‘000s)
|
Grade
(% U3O8) |
Pounds
U3O8 (‘000s)
|
|
Collette
|
Indicated
|
360
|
327
|
0.787
|
2,786
|
|
Inferred
|
542
|
492
|
0.717
|
3,814
|
|
|
58B
|
Indicated
|
156
|
142
|
0.773
|
1,188
|
|
Inferred
|
89
|
81
|
0.510
|
445
|
|
|
Kianna
|
Indicated
|
1,132
|
1,027
|
1.535
|
17,058
|
|
Inferred
|
603
|
547
|
1.390
|
8,235
|
|
|
Anne
|
Indicated
|
617
|
560
|
2.002
|
12,144
|
|
Inferred
|
148
|
134
|
0.883
|
1,282
|
|
|
TOTAL
|
Indicated
|
2,266
|
2,056
|
1.491
|
33,175
|
|
Inferred
|
1,382
|
1,254
|
1.015
|
13,775
|
|
1.
|
Mineral resources are not mineral reserves and have not demonstrated economic viability.
|
|
|
2.
|
There is no certainty that all or any part of the mineral resource will be converted into mineral reserves.
|
|
|
3.
|
Figures are rounded to reflect the relative accuracy of the estimates.
|
|
|
4.
|
Resources were estimated using a cut-off grade of 0.30% U3O8, a $50 uranium price, and a metallurgical recovery of 95% was used.
|
|
|
5.
|
UEC's share of mineral resources is calculated based on UEC's 49.0975% equity in the project.
|
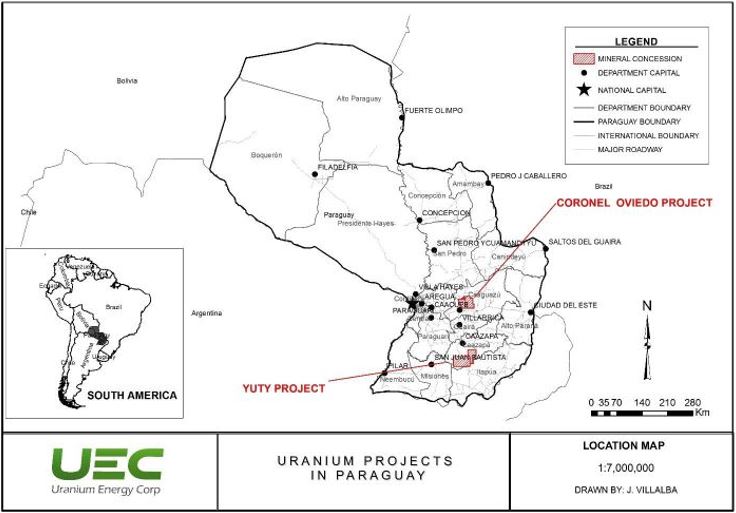
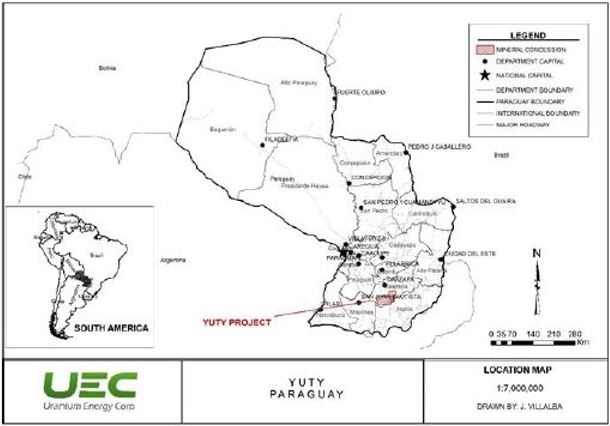
|
●
|
Cabacua Formation: 200 meters thick;
|
|
●
|
Tapyata Formation: 125 meters thick;
|
|
●
|
Tacuary Formation: 280 meters thick; and
|
|
●
|
San Miguel Formation: 20 to 90 meters thick.
|
|
●
|
Upper Sand Unit: Estimated to be approximately 50 meters thick;
|
|
●
|
Alternating Sandstone and Shale Unit: Estimated to be approximately 150 meters thick;
|
|
●
|
Massive Sand Unit: Estimated to be 60 to 100 meters thick;
|
|
●
|
Fine-grained Sand Unit: Estimated to be up to 15 meters thick; and
|
|
●
|
Wavy Unit: Estimated to be up to 20 meters thick.
|
|
Category
|
Tons Ore
(000’s)
|
Tonnes Ore
(1000’s)
|
Weighted
Average
Grade
(% eU3O8)
|
Pounds
eU3O8 (000’s)
|
|
Measured
|
-
|
-
|
-
|
-
|
|
Indicated – Massive Sand Unit
|
7,233
|
6,562
|
0.048
|
6,969
|
|
Indicated – Fine-Grained and Wavy Sand Units
|
1,842
|
1,671
|
0.054
|
1,994
|
|
Total M&I
|
9,074
|
8,232
|
0.049
|
8,962
|
|
Inferred – Massive Sand Unit
|
1690
|
1533
|
0.045
|
1,528
|
|
Inferred – Fine Grained and Wavy Sand Units
|
1043
|
946
|
0.032
|
675
|
|
Total Resources
|
2,733
|
2,479
|
0.040
|
2,203
|
|
1.
|
The sum of resource tons and lbs. may not add up to the reported total due to rounding.
|
|
|
2.
|
Measured, indicated, and inferred mineral resources as defined in 17 CFR § 229.1300.
|
|
|
3.
|
Resources estimated using a 0.02% eU3O8 grade cutoff and a 0.1 ft% GT cutoff.
|
|
|
4.
|
Mineral Resources are estimated using a long-term uranium price of $65 per pound and a metallurgical recovery of 70%.
|
|
|
5.
|
The point of reference for mineral resources is in-situ at the Project.
|
|
|
6.
|
Mineral resources that are not mineral reserves do not have demonstrated economic viability.
|
|
Exhibit
Number
|
Description of Exhibit
|
|
2.1
|
|
|
2.2
|
|
|
2.3
|
|
|
2.4
|
|
|
2.5
|
|
|
2.6
|
|
|
3.1
|
|
|
3.1.1
|
|
|
3.2
|
|
|
4.1
|
|
|
4.2
|
|
|
4.3
|
|
|
4.4
|
|
|
4.5
|
|
|
4.6
|
|
|
4.7
|
|
|
10.1
|
|
|
10.2
|
|
|
10.3
|
|
|
10.4
|
|
|
10.5
|
|
|
10.6
|
|
|
10.7
|
|
|
10.8
|
|
|
10.9
|
|
|
10.10
|
|
|
10.11
|
|
|
10.12
|
|
|
10.13
|
|
|
10.14
|
|
|
10.15
|
|
|
10.16
|
|
|
10.17
|
|
|
10.18
|
|
|
10.19
|
|
|
10.20
|
|
|
10.21
|
|
|
10.22
|
|
|
10.23
|
|
|
10.24
|
|
10.25
|
|
|
10.26
|
|
|
10.27
|
|
|
10.28
|
|
|
10.29
|
|
|
10.30
|
|
|
10.31
|
|
|
10.32
|
|
|
10.33
|
|
|
10.34
|
|
|
10.35
|
|
|
10.36
|
|
|
10.37
|
|
|
10.38
|
|
|
10.39
|
|
|
10.40
|
|
|
10.41
|
|
|
10.42
|
|
|
10.43
|
|
|
10.44
|
|
|
10.45
|
|
|
10.46
|
|
|
10.47
|
|
|
10.48
|
|
|
10.49
|
|
|
10.50
|
|
|
10.51
|
|
|
10.52
|
|
|
10.53
|
|
|
10.54
|
|
|
10.55
|
|
|
10.56
|
|
|
10.57
|
|
|
10.58
|
|
|
10.59
|
|
|
10.60
|
|
|
10.61
|
|
|
10.62
|
|
|
10.63
|
|
|
10.64
|
|
|
10.65
|
|
|
10.66
|
|
10.67
|
|
|
10.68
|
|
|
10.69
|
|
|
10.70
|
|
|
10.71
|
|
|
10.72
|
|
|
10.73
|
|
|
10.74
|
|
|
10.75
|
|
|
10.76
|
|
|
10.77
|
|
|
10.78
|
|
|
10.79
|
|
|
10.80
|
|
|
10.81
|
|
|
10.82
|
|
|
10.83
|
|
|
10.84
|
|
|
10.85
|
|
|
10.86
|
|
|
10.87
|
|
|
10.88
|
|
|
10.89
|
|
|
21.1
|
|
|
23.1
|
|
|
23.2
|
|
|
23.3
|
|
|
23.4
|
|
|
23.5
|
|
|
23.6
|
|
|
23.7
|
|
|
23.8
|
|
|
23.9
|
|
|
23.10
|
|
|
23.11
|
|
|
23.12
|
|
|
23.13
|
|
|
23.14
|
|
|
31.1
|
|
|
31.2
|
|
32.1
|
|
|
96.1
|
|
|
96.2
|
|
|
96.3
|
|
|
96.4
|
|
|
96.5
|
|
|
96.6
|
|
|
96.7
|
|
|
96.8
|
|
|
96.9
|
|
|
96.10
|
|
|
99.1
|
|
|
99.2
|
|
|
99.3
|
|
|
101.1NS
|
Inline XBRL Instance Document
|
|
101.SCH
|
Inline XBRL Taxonomy Extension Schema Document
|
|
101.CAL
|
Inline XBRL Taxonomy Extension Calculation Linkbase Document
|
|
101.DEF
|
Inline XBRL Taxonomy Extension Definitions Linkbase Document
|
|
101.LAB
|
Inline XBRL Taxonomy Extension Label Linkbase Document
|
|
101.PRE
|
Inline XBRL Taxonomy Extension Presentation Linkbase Document
|
|
104
|
Cover Page Interactive Data File (formatted as Inline XBRL and contained in Exhibit 101)
|
|
*
|
Filed herewith.
|
|
†
|
Previously filed as an exhibit to our Annual Report on Form 10-K filed with the SEC on September 29, 2022.
|
|
‡
|
Portions of this exhibit have been omitted.
|
|
(1)
|
Incorporated by reference to our Registration Statement on Form SB-2 filed with the SEC on August 4, 2005.
|
|
(2)
|
Incorporated by reference to our Current Report on Form 8-K filed with the SEC on February 9, 2006.
|
|
(3)
|
Incorporated by reference to our Current Report on Form 8-K filed with the SEC on May 4, 2007.
|
|
(4)
|
Incorporated by reference to our Current Report on Form 8-K filed with the SEC on October 9, 2007.
|
|
(5)
|
Incorporated by reference to our Current Report on Form 8-K filed with the SEC on November 6, 2007.
|
|
(6)
|
Incorporated by reference to our Current Report on Form 8-K filed with the SEC on January 16, 2009.
|
|
(7)
|
Incorporated by reference to our Current Report on Form 8-K filed with the SEC on June 2, 2009.
|
|
(8)
|
Incorporated by reference to our Current Report on Form 8-K filed with the SEC on June 9, 2009.
|
|
(9)
|
Incorporated by reference to our Current Report on Form 8-K filed with the SEC on July 27, 2009.
|
|
(10)
|
Incorporated by reference to our Registration Statement on Form S-8 filed with the SEC on October 1, 2009.
|
|
(11)
|
Incorporated by reference to our Annual Report on Form 10-K/A filed with the SEC on April 21, 2010.
|
|
(12)
|
Incorporated by reference to our Current Report on Form 8-K filed with the SEC on February 23, 2010.
|
|
(13)
|
Incorporated by reference to our Registration Statement on Form S-8 filed with the SEC on February 7, 2011.
|
|
(14)
|
Incorporated by reference to our Current Report on Form 8-K filed with the SEC on January 10, 2011.
|
|
(15)
|
Incorporated by reference to our Current Report on Form 8-K filed with the SEC on May 11, 2011.
|
|
(16)
|
Incorporated by reference to our Current Report on Form 8-K filed with the SEC on May 17, 2011.
|
|
(17)
|
Incorporated by reference to our Current Report on Form 8-K filed with the SEC on July 11, 2011.
|
|
(18)
|
Incorporated by reference to our Current Report on Form 8-K filed with the SEC on October 31, 2011.
|
|
(19)
|
Incorporated by reference to our Current Report on Form 8-K filed with the SEC on November 8, 2011.
|
|
(20)
|
Incorporated by reference to our Current Report on Form 8-K filed with the SEC on March 5, 2012.
|
|
(21)
|
Incorporated by reference to our Current Report on Form 8-K filed with the SEC on August 5, 2013.
|
|
(22)
|
Incorporated by reference to our Current Report on Form 8-K filed with the SEC on October 2, 2013.
|
|
(23)
|
Incorporated by reference to our Current Report on Form 8-K filed with the SEC on October 23, 2013.
|
|
(24)
|
Incorporated by reference to our Registration Statement on Form S-3 filed with the SEC on November 19, 2013.
|
|
(25)
|
Incorporated by reference to our Registration Statement on Form S-8 filed with the SEC on November 21, 2013.
|
|
(26)
|
Incorporated by reference to our Current Report on Form 8-K/A filed with the SEC on December 6, 2013.
|
|
(27)
|
Incorporated by reference to our Registration Statement on Form S-3 filed with the SEC on December 27, 2013.
|
|
(28)
|
Incorporated by reference to our Current Report on Form 8-K filed with the SEC on December 31, 2013.
|
|
(29)
|
Incorporated by reference to our Current Report on Form 8-K filed with the SEC on March 19, 2014.
|
|
(30)
|
Incorporated by reference to our Annual Report on Form 10-K filed with the SEC on October 14, 2014.
|
|
(31)
|
Incorporated by reference to our Registration Statement on Form S-8 filed with the SEC on January 9, 2015.
|
|
(32)
|
Incorporated by reference to our Quarterly Report on Form 10-Q filed with the SEC on March 12, 2015.
|
|
(33)
|
Incorporated by reference to our Schedule 14A Definitive Proxy Statement filed with the SEC on June 19, 2015.
|
|
(34)
|
Incorporated by reference to our Current Report on Form 8-K filed with the SEC on June 25, 2015.
|
|
(35)
|
Incorporated by reference to our Quarterly Report on Form 10-Q filed with the SEC on December 8, 2015.
|
|
(36)
|
Incorporated by reference to our Current Report on Form 8-K filed with the SEC on February 16, 2016
|
|
(37)
|
Incorporated by reference to our Current Report on Form 8-K filed with the SEC on March 10, 2016.
|
|
(38)
|
Incorporated by reference to our Current Report on Form 8-K filed with the SEC on March 10, 2016.
|
|
(39)
|
Incorporated by reference to our Registration Statement on Form S-8 filed with the SEC on September 2, 2016.
|
|
(40)
|
Incorporated by reference to our Registration Statement on Form S-3 filed with the SEC on January 5, 2017.
|
|
(41)
|
Incorporated by reference to our Current Report on Form 8-K filed with the SEC on January 17, 2017.
|
|
(42)
|
Incorporated by reference to our Current Report on Form 8-K filed with the SEC on March 9, 2017.
|
|
(43)
|
Incorporated by reference to our Quarterly Report on Form 10-Q filed with the SEC on June 9, 2017.
|
|
(44)
|
Incorporated by reference to our Current Report on Form 8-K filed with the SEC on August 11, 2017.
|
|
(45)
|
Incorporated by reference to our Registration Statement on Form S-3 filed with the SEC on September 8, 2017.
|
|
(46)
|
Incorporated by reference to our Annual Report on Form 10-K filed with the SEC on October 16, 2017.
|
|
(47)
|
Incorporated by reference to our Current Report on Form 8-K filed with the SEC on November 6, 2017.
|
|
(48)
|
Incorporated by reference to our Annual Report on Form 10-K filed with the SEC on October 15, 2018.
|
|
(49)
|
Incorporated by reference to our Registration Statement on Form S-8 filed with the SEC on August 27, 2018.
|
|
(50)
|
Incorporated by reference to our Current Report on Form 8-K filed with the SEC on October 1, 2018.
|
|
(51)
|
Incorporated by reference to our Current Report on Form 8-K filed with the SEC on December 7, 2018.
|
|
(52)
|
Incorporated by reference to our Current Report on Form 8-K filed with the SEC on March 18, 2019.
|
|
(53)
|
Incorporated by reference to our Current Report on Form 8-K filed with the SEC on April 9, 2019.
|
|
(54)
|
Incorporated by reference to our Registration Statement on Form S-8 filed with the SEC on September 12, 2019.
|
|
(55)
|
Incorporated by reference to our Current Report on Form 8-K filed with the SEC on March 19, 2020.
|
|
(56)
|
Incorporated by reference to our Current Report on Form 8-K filed with the SEC on September 21, 2020.
|
|
(57)
|
Incorporated by reference to our Current Report on Form 8-K filed with the SEC on March 19, 2021.
|
|
(58)
|
Incorporated by reference to our Current Report on Form 8-K filed with the SEC on April 8, 2021.
|
|
(59)
|
Incorporated by reference to our Registration Statement on Form S-3 filed with the SEC on May 17, 2021.
|
|
(60)
|
Incorporated by reference to our Current Report on Form 8-K filed with the SEC on November 9, 2021.
|
|
(61)
|
Incorporated by reference to our Current Report on Form 8-K filed with the SEC on February 8, 2022.
|
|
(62)
|
Incorporated by reference to our Current Report on Form 8-K filed with the SEC on April 5, 2022.
|
|
(63)
|
Incorporated by reference to our Current Report on Form 8-K filed with the SEC on June 13, 2022.
|
|
(64)
|
Incorporated by reference to our Current Report on Form 8-K filed with the SEC on June 17, 2022.
|
|
(65)
|
Incorporated by reference to our Current Report on Form 8-K filed with the SEC on August 17, 2022.
|
|
(66)
|
Incorporated by reference to our Current Report on Form 8-K filed with the SEC on August 11, 2022.
|
|
(67)
|
Incorporated by reference to our Current Report on Form 8-K filed with the SEC on August 15, 2022.
|
|
(68)
|
Incorporated by reference to our Current Report on Form 8-K filed with the SEC on October 13, 2022.
|
|
(69)
|
Incorporated by reference to our Current Report on Form 8-K filed with the SEC on January 11, 2023.
|
|
(70)
|
Incorporated by reference to our Current Report on Form 8-K filed with the SEC on January 23, 2023.
|
|
(71)
|
Incorporated by reference to our Current Report on Form 8-K filed with the SEC on March 13, 2023.
|
|
(72)
|
Incorporated by reference to our Current Report on Form 8-K filed with the SEC on March 14, 2023.
|
|
(73)
|
Incorporated by reference to our Amendment to our Annual Report on Form 10-K/A filed with the SEC on April 3, 2023.
|
|
(74)
|
Incorporated by reference to our Current Report on Form 8-K filed with the SEC on May 1, 2023.
|
|
(75)
|
Incorporated by reference to our Current Report on Form 8-K filed with the SEC on May 11, 2023.
|
|
(76)
|
Previously filed as an exhibit to our Annual Report on Form 10-K filed with the SEC on September 29, 2023.
|
|
URANIUM ENERGY CORP.
|
|||
|
By:
|
/s/ Amir Adnani
|
||
|
Amir Adnani, President, Chief Executive
Officer and Director
|
|||
|
(Principal Executive Officer)
|
|||
|
Date: April 2, 2024.
|
|||
Exhibit 23.2
CONSENT OF BENJAMIN J. SCHIFFER
I consent to the use of my name, or any quotation from, or summarization of the technical report summary entitled “Technical Report Summary S-K 1300 Initial Assessment Mineral Resource Report Reno Creek Project Campbell County, WY USA” dated January 31, 2022, prepared by me, included or incorporated by reference in:
|
(i) |
the Annual Report on Form 10-K/A for the period ended July 31, 2023 (the “Form 10-K/A”) of Uranium Energy Corp. (the “Company”) being filed with the United States Securities and Exchange Commission, and any amendments or supplements thereto; |
|
(ii) |
the Company’s Form S-3 Registration Statements (File Nos. 333-220404, 333-267992 and 333-268417), and any amendments or supplements thereto; and |
|
(iii) |
the Company’s Form S-8 Registration Statements (File Nos. 333-147626, 333-162264, 333-172092, 333-192462, 333-201423, 333-213500, 333-227023, 333-233736, 333-249679, 333-262197 and 333-273321); and any amendments or supplements thereto. |
I further consent to the filing of the technical report summary as an exhibit to the Form 10-K/A.
|
/s/ Benjamin J. Schiffer |
Benjamin J. Schiffer, P.G.
Date: April 2, 2024
Exhibit 23.3
CONSENT OF WESTERN WATER CONSULTANTS, INC.
We consent to the use of our name, or any quotation from, or summarization of the technical report summary entitled “Amended S-K 1300 Technical Report Summary for the Texas Hub and Spoke ISR Project, TX USA” date March 9, 2023; and the technical report summary entitled “Amended S-K 1300 Technical Report Summary for the Wyoming In-Situ Recovery Hub and Spoke Project, WY, USA” dated March 9, 2023, that we prepared, included or incorporated by reference in:
|
(i) |
the Annual Report on Form 10-K/A for the period ended July 31, 2023 (the “Form 10-K/A”) of Uranium Energy Corp. (the “Company”) being filed with the United States Securities and Exchange Commission, and any amendments or supplements thereto; |
|
(ii) |
the Company’s Form S-3 Registration Statements (File Nos. 333-220404, 333-267992 and 333-268417), and any amendments or supplements thereto; and |
|
(iii) |
the Company’s Form S-8 Registration Statements (File Nos. 333-147626, 333-162264, 333-172092, 333-192462, 333-201423, 333-213500, 333-227023, 333-233736, 333-249679, 333-262197 and 333-273321); and any amendments or supplements thereto. |
We further consent to the filing of the technical report summaries as exhibits to the Form 10-K/A.
Western Water Consultants, Inc.
d.b.a. WWC Engineering
Per: /s/ Brady S. Lewis
Brady S. Lewis, President/CEO
Western Water Consultants, Inc.
d.b.a. WWC Engineering
Date: April 2, 2024
Exhibit 23.4
CONSENT OF DOUGLAS L. BEAHM
I consent to the use of my name, or any quotation from, or summarization of the technical report summary entitled “Anderson Uranium Project Initial Assessment US SEC Subpart 1300 Regulation S-K Report, Yavapai County, Arizona, USA” dated March 9, 2023; the technical report summary entitled “Yuty Uranium Project Initial Assessment US SEC Subpart 1300 Regulation S-K Report Paraguay, SA” dated March 9, 2023; and the technical report summary entitled “2022 Initial Assessment on the Workman Creek Project US SEC Subpart 1300 Regulation S-K Report Gila County, Arizona, USA” dated February 14, 2023, prepared by me, included or incorporated by reference in:
|
(i) |
the Annual Report on Form 10-K/A for the period ended July 31, 2023 (the “Form 10-K/A”) of Uranium Energy Corp. (the “Company”) being filed with the United States Securities and Exchange Commission, and any amendments or supplements thereto; |
|
(ii) |
the Company’s Form S-3 Registration Statements (File Nos. 333-220404, 333-267992 and 333-268417), and any amendments or supplements thereto; and |
|
(iii) |
the Company’s Form S-8 Registration Statements (File Nos. 333-147626, 333-162264, 333-172092, 333-192462, 333-201423, 333-213500, 333-227023, 333-233736, 333-249679, 333-262197 and 333-273321); and any amendments or supplements thereto. |
I further consent to the filing of the technical report summaries as exhibits to the Form 10-K/A.
|
/s/ Douglas L. Beahm |
Douglas L. Beahm, P.E., P.G., SME Registered Member
Date: April 2, 2024
Exhibit 23.5
CONSENT OF CLYDE L. YANCEY
I consent to the use of my name, or any quotation from, or summarization of the technical report summary entitled “Anderson Uranium Project Initial Assessment US SEC Subpart 1300 Regulation S-K Report, Yavapai County, Arizona, USA” dated March 9, 2023; the technical report summary entitled “Yuty Uranium Project Initial Assessment US SEC Subpart 1300 Regulation S-K Report Paraguay, SA” dated March 9, 2023; and the technical report summary entitled “2022 Initial Assessment on the Workman Creek Project US SEC Subpart 1300 Regulation S-K Report Gila County, Arizona, USA” dated February 14, 2023, prepared by me, included or incorporated by reference in:
|
(i) |
the Annual Report on Form 10-K/A for the period ended July 31, 2023 (the “Form 10-K/A”) of Uranium Energy Corp. (the “Company”) being filed with the United States Securities and Exchange Commission, and any amendments or supplements thereto; |
|
(ii) |
the Company’s Form S-3 Registration Statements (File Nos. 333-220404, 333-267992 and 333-268417), and any amendments or supplements thereto; and |
|
(iii) |
the Company’s Form S-8 Registration Statements (File Nos. 333-147626, 333-162264, 333-172092, 333-192462, 333-201423, 333-213500, 333-227023, 333-233736, 333-249679, 333-262197 and 333-273321); and any amendments or supplements thereto. |
I further consent to the filing of the technical report summaries as exhibits to the Form 10-K/A.
|
/s/ Clyde L. Yancey |
Clyde L. Yancey, P.G., SME Registered Member
Date: April 2, 2024
Exhibit 23.6
CONSENT OF BRS, INC.
We consent to the use of our name, or any quotation from, or summarization of the technical report summary entitled “Anderson Uranium Project Initial Assessment US SEC Subpart 1300 Regulation S-K Report, Yavapai County, Arizona, USA” dated March 9, 2023; and the technical summary report entitled “Yuty Uranium Project Initial Assessment US SEC Subpart 1300 Regulation S-K Report Paraguay, SA” dated March 9, 2023, that we prepared, included or incorporated by reference in:
|
(i) |
the Annual Report on Form 10-K/A for the period ended July 31, 2023 (the “Form 10-K/A”) of Uranium Energy Corp. (the “Company”) being filed with the United States Securities and Exchange Commission, and any amendments or supplements thereto; |
|
(ii) |
the Company’s Form S-3 Registration Statements (File Nos. 333-220404, 333-267992 and 333-268417), and any amendments or supplements thereto; and |
|
(iii) |
the Company’s Form S-8 Registration Statements (File Nos. 333-147626, 333-162264, 333-172092, 333-192462, 333-201423, 333-213500, 333-227023, 333-233736, 333-249679, 333-262197 and 333-273321); and any amendments or supplements thereto. |
We further consent to the filing of the technical report summaries as exhibits to the Form 10-K/A.
BRS, Inc.
|
Per: /s/ Douglas L. Beahm |
Douglas L. Beahm, President, P.E., P.G., SME Registered Member
Date: April 2, 2024
Exhibit 23.7
CONSENT OF VICTOR FERNANDEZ-CROSA
I consent to the use of my name, or any quotation from, or summarization of the technical report summary entitled “2022 Technical Report on the Shea Creek Project, Saskatchewan” dated December 30, 2022; and the technical report summary entitled “2024 Technical Report on the Horseshoe-Raven Project, Saskatchewan” dated March 1, 2024, prepared by me, included or incorporated by reference in:
|
(i) |
the Annual Report on Form 10-K/A for the period ended July 31, 2023 (the “Form 10-K/A”) of Uranium Energy Corp. (the “Company”) being filed with the United States Securities and Exchange Commission, and any amendments or supplements thereto; |
|
(ii) |
the Company’s Form S-3 Registration Statements (File Nos. 333-220404, 333-267992 and 333-268417), and any amendments or supplements thereto; and |
|
(iii) |
the Company’s Form S-8 Registration Statements (File Nos. 333-147626, 333-162264, 333-172092, 333-192462, 333-201423, 333-213500, 333-227023, 333-233736, 333-249679, 333-262197 and 333-273321); and any amendments or supplements thereto. |
I further consent to the filing of the technical report summaries as exhibits to the Form 10-K/A.
|
/s/ Victor Fernandez-Crosa |
Victor Fernandez-Crosa,
Paraguay Manager, Company
Date: April 2, 2024
Exhibit 23.8
CONSENT OF CHRISTOPHER J. HAMEL
I consent to the use of my name, or any quotation from, or summarization of the technical report summary entitled “2022 Technical Report on the Shea Creek Project, Saskatchewan” dated December 30, 2022; and the technical report summary entitled “2024 Technical Report on the Horseshoe-Raven Project, Saskatchewan” dated March 1, 2024, prepared by me, included or incorporated by reference in:
|
(i) |
the Annual Report on Form 10-K/A for the period ended July 31, 2023 (the “Form 10-K/A”) of Uranium Energy Corp. (the “Company”) being filed with the United States Securities and Exchange Commission, and any amendments or supplements thereto; |
|
(ii) |
the Company’s Form S-3 Registration Statements (File Nos. 333-220404, 333-267992 and 333-268417), and any amendments or supplements thereto; and |
|
(iii) |
the Company’s Form S-8 Registration Statements (File Nos. 333-147626, 333-162264, 333-172092, 333-192462, 333-201423, 333-213500, 333-227023, 333-233736, 333-249679, 333-262197 and 333-273321); and any amendments or supplements thereto. |
I further consent to the filing of the technical report summaries as exhibits to the Form 10-K/A.
| /s/ Christopher J. Hamel | |
| Christopher J. Hamel, P.Geo., APEGS Registered Member | |
Date: April 2, 2024
Exhibit 23.9
CONSENT OF JAMES N. GRAY
I consent to the use of my name, or any quotation from, or summarization of the technical report summary entitled “2022 Technical Report on the Shea Creek Project, Saskatchewan” dated December 30, 2022, prepared by me, included or incorporated by reference in:
|
(i) |
the Annual Report on Form 10-K/A for the period ended July 31, 2023 (the “Form 10-K/A”) of Uranium Energy Corp. (the “Company”) being filed with the United States Securities and Exchange Commission, and any amendments or supplements thereto; |
|
(ii) |
the Company’s Form S-3 Registration Statements (File Nos. 333-220404, 333-267992 and 333-268417), and any amendments or supplements thereto; and |
|
(iii) |
the Company’s Form S-8 Registration Statements (File Nos. 333-147626, 333-162264, 333-172092, 333-192462, 333-201423, 333-213500, 333-227023, 333-233736, 333-249679, 333-262197 and 333-273321); and any amendments or supplements thereto. |
I further consent to the filing of the technical report summary as an exhibit to the Form 10-K/A.
| /s/ James N. Gray | |
| James N. Gray, P.Geo., EGBC Registered Member |
Date: April 2, 2024
Exhibit 23.10
CONSENT OF DAVID A. RHYS
I consent to the use of my name, or any quotation from, or summarization of the technical report summary entitled “2022 Technical Report on the Shea Creek Project, Saskatchewan” dated December 30, 2022, prepared by me, included or incorporated by reference in:
|
(i) |
the Annual Report on Form 10-K/A for the period ended July 31, 2023 (the “Form 10-K/A”) of Uranium Energy Corp. (the “Company”) being filed with the United States Securities and Exchange Commission, and any amendments or supplements thereto; |
|
(ii) |
the Company’s Form S-3 Registration Statements (File Nos. 333-220404, 333-267992 and 333-268417), and any amendments or supplements thereto; and |
|
(iii) |
the Company’s Form S-8 Registration Statements (File Nos. 333-147626, 333-162264, 333-172092, 333-192462, 333-201423, 333-213500, 333-227023, 333-233736, 333-249679, 333-262197 and 333-273321); and any amendments or supplements thereto. |
I further consent to the filing of the technical report summary as an exhibit to the Form 10-K/A.
| /s/ David A. Rhys | |
| David A. Rhys, P.Geo., PGO Registered Member |
Date: April 2, 2024
Exhibit 23.11
CONSENT OF NATHAN A. BARSI
I consent to the use of my name, or any quotation from, or summarization of the technical report summary entitled “2024 Technical Report on the Horseshoe-Raven Project, Saskatchewan” dated March 1, 2024, prepared by me, included or incorporated by reference in:
|
(i) |
the Annual Report on Form 10-K/A for the period ended July 31, 2023 (the “Form 10-K/A”) of Uranium Energy Corp. (the “Company”) being filed with the United States Securities and Exchange Commission, and any amendments or supplements thereto; |
|
(ii) |
the Company’s Form S-3 Registration Statements (File Nos. 333-220404, 333-267992 and 333-268417), and any amendments or supplements thereto; and |
|
(iii) |
the Company’s Form S-8 Registration Statements (File Nos. 333-147626, 333-162264, 333-172092, 333-192462, 333-201423, 333-213500, 333-227023, 333-233736, 333-249679, 333-262197 and 333-273321); and any amendments or supplements thereto. |
I further consent to the filing of the technical report summary as an exhibit to the Form 10-K/A
| /s/ Nathan A. Barsi | |
| Nathan A. Barsi, P.Geo., APEGS Registered Member |
Date: April 2, 2024
Exhibit 23.12
CONSENT OF ROGER M. LEMAITRE
I consent to the use of my name, or any quotation from, or summarization of the technical report summary entitled “2024 Technical Report on the Horseshoe-Raven Project, Saskatchewan” dated March 1, 2024, prepared by me, included or incorporated by reference in:
|
(i) |
the Annual Report on Form 10-K/A for the period ended July 31, 2023 (the “Form 10-K/A”) of Uranium Energy Corp. (the “Company”) being filed with the United States Securities and Exchange Commission, and any amendments or supplements thereto; |
|
(ii) |
the Company’s Form S-3 Registration Statements (File Nos. 333-220404, 333-267992 and 333-268417), and any amendments or supplements thereto; and |
|
(iii) |
the Company’s Form S-8 Registration Statements (File Nos. 333-147626, 333-162264, 333-172092, 333-192462, 333-201423, 333-213500, 333-227023, 333-233736, 333-249679, 333-262197 and 333-273321); and any amendments or supplements thereto. |
I further consent to the filing of the technical report summary as an exhibit to the Form 10-K/A.
| /s/ Roger M. Lemaitre | |
| Roger M. Lemaitre, P.Eng., P.Geo., APEGS Registered Member | |
Date: April 2, 2024
Exhibit 23.13
CONSENT OF CARL DAVID WARREN
I consent to the use of my name, or any quotation from, or summarization of the technical report summary entitled “2022 Initial Assessment on the Workman Creek Project US SEC Subpart 1300 Regulation S-K Report Gila County, Arizona, USA”, dated February 14, 2023, prepared by me, included or incorporated by reference in:
|
(i) |
the Annual Report on Form 10-K/A for the period ended July 31, 2023 (the “Form 10-K/A”) of Uranium Energy Corp. (the “Company”) being filed with the United States Securities and Exchange Commission, and any amendments or supplements thereto; |
|
(ii) |
the Company’s Form S-3 Registration Statements (File Nos. 333-220404, 333-267992 and 333-268417), and any amendments or supplements thereto; and |
|
(iii) |
the Company’s Form S-8 Registration Statements (File Nos. 333-147626, 333-162264, 333-172092, 333-192462, 333-201423, 333-213500, 333-227023, 333-233736, 333-249679, 333-262197 and 333-273321); and any amendments or supplements thereto. |
I further consent to the filing of the technical report summary as an exhibit to the Form 10-K/A.
| /s/ Carl David Warren | |
| Carl David Warren, P.E., P.G., SME Registered Member |
Date: April 2, 2024
Exhibit 23.14
CONSENT OF SRK CONSULTING (UK) LIMITED
We consent to the use of our name, or any quotation from, or summarization of the technical report summary entitled “Technical Report Summary: Roughrider Uranium Project, Saskatchewan, Canada” dated April 25, 2023, that we prepared, included or incorporated by reference in:
|
(i) |
the Annual Report on Form 10-K/A for the period ended July 31, 2023 (the “Form 10-K/A”) of Uranium Energy Corp. (the “Company”) being filed with the United States Securities and Exchange Commission, and any amendments or supplements thereto; |
|
(ii) |
the Company’s Form S-3 Registration Statements (File Nos. 333-220404, 333-267992 and 333-268417), and any amendments or supplements thereto; and |
|
(iii) |
the Company’s Form S-8 Registration Statements (File Nos. 333-147626, 333-162264, 333-172092, 333-192462, 333-201423, 333-213500, 333-227023, 333-233736, 333-249679, 333-262197 and 333-273321); and any amendments or supplements thereto. |
We further consent to the filing of the technical report summary as an exhibit to the Form 10-K/A.
SRK CONSULTING (UK) LIMITED
| Per: | /s/ Guy Dishaw | |
| Guy Dishaw, P.Geo | ||
Date: April 2, 2024
Exhibit 31.1
CERTIFICATION PURSUANT TO SECTION 302 OF SARBANES-OXLEY ACT OF 2002
I, Amir Adnani, certify that:
1. I have reviewed this Amendment No. 1 to Form 10-K of Uranium Energy Corp.; and
2. Based on my knowledge, this report does not contain any untrue statement of a material fact or omit to state a material fact necessary to make the statements made, in light of the circumstances under which such statements were made, not misleading with respect to the period covered by this report.
Date: April 2, 2024
|
By: |
/s/ Amir Adnani |
|
Amir Adnani |
|
|
President, Chief Executive Officer (Principal Executive Officer) and Director |
__________
Exhibit 31.2
CERTIFICATION PURSUANT TO SECTION 302 OF SARBANES-OXLEY ACT OF 2002
I, Pat Obara, certify that:
1. I have reviewed this Amendment No. 1 to Form 10-K of Uranium Energy Corp.; and
2. Based on my knowledge, this report does not contain any untrue statement of a material fact or omit to state a material fact necessary to make the statements made, in light of the circumstances under which such statements were made, not misleading with respect to the period covered by this report.
Date: April 2, 2024
|
By: |
/s/ Pat Obara |
|
Pat Obara |
|
|
Secretary, Treasurer and Chief Financial Officer (Principal Financial Officer and Principal Accounting Officer) |
__________
Exhibit 96.4
2024 TECHNICAL REPORT ON THE HORSESHOE-RAVEN PROJECT, SASKATCHEWAN
Uranium Energy Corp.
Effective Date: March 1, 2024

Nathan A. Barsi, P.Geo.
Christopher J. Hamel, P.Geo.
Roger Lemaitre, P.Eng., P.Geo.
March 1, 2024
| TABLE OF CONTENTS | PAGE # |
|
1 |
EXECUTIVE SUMMARY |
1 |
|
1.1 |
Introduction |
1 |
|
1.2 |
Property Description and Ownership |
1 |
|
1.3 |
History |
2 |
|
1.4 |
Geology and Mineralization |
2 |
|
1.5 |
Exploration |
3 |
|
1.6 |
Development and Operations |
4 |
|
1.7 |
Sample Preparation, Analyses and Security |
4 |
|
1.8 |
Data Verification |
4 |
|
1.9 |
Metallurgy |
4 |
|
1.10 |
Mineral Resource and Mineral Reserve Estimates |
4 |
|
1.11 |
Recovery Methods |
7 |
|
1.12 |
Adjacent Properties |
8 |
|
1.13 |
Permitting Requirements |
8 |
|
1.14 |
Conclusions and Recommendations |
8 |
|
2 |
INTRODUCTION |
10 |
|
2.1 |
Work Program |
10 |
|
2.2 |
Basis of the Technical Report |
10 |
|
2.3 |
Qualifications of Authors and UEX Team |
10 |
|
2.4 |
Site Visit |
11 |
|
2.5 |
Previous Reports |
11 |
|
2.6 |
Key Definitions |
11 |
|
2.7 |
Declaration |
11 |
|
3 |
PROPERTY DESCRIPTION |
12 |
|
3.1 |
Mineral Tenure |
13 |
|
3.2 |
Mining Rights in Saskatchewan |
15 |
|
3.3 |
Underlying Agreements |
15 |
|
3.4 |
Permits and Authorization |
15 |
|
3.5 |
Environmental Considerations |
15 |
|
4 |
ACCESSIBILITY, CLIMATE, LOCAL RESOURCES, INFRASTRUCTURE AND PHYSIOGRAPHY |
16 |
|
4.1 |
Accessibility |
16 |
|
4.2 |
Local Resources and Infrastructure |
16 |
|
4.3 |
Climate |
17 |
|
4.4 |
Physiography |
17 |
|
5 |
HISTORY |
19 |
|
5.1 |
Property Ownership |
19 |
|
5.2 |
Exploration and Development History |
19 |
|
5.3 |
Early Uranium Exploration (1968 to 2002) |
20 |
|
5.4 |
Historical Mineral Resource Estimates |
21 |
|
5.5 |
Historical Production |
22 |
|
6 |
GEOLOGICAL SETTING AND MINERALIZATION |
23 |
|
6.1 |
Regional Geology |
23 |
|
6.2 |
Geology of the Horseshoe-Raven Property: Distribution of Lithologies |
27 |
|
6.3 |
Pre-Athabasca Lithologies on the Hidden Bay Property: Wollaston Group |
28 |
|
6.3.1 |
Lower Pelitic Gneiss |
28 |
|
6.3.2 |
Meta-Arkose Unit |
28 |
|
6.3.3 |
Carbonate and Calc-Silicate Units at the top of the Meta-Arkose Sequence |
29 |
|
6.3.4 |
Hidden Bay Assemblage |
29 |
|
6.3.5 |
Granitic Rocks and Other Igneous Lithologies in the Region |
29 |
|
6.3.6 |
The Collins Bay and McClean Lake Domes: Possible Archean Basement |
29 |
|
6.3.7 |
Granite Sills and Dykes in the Wollaston Group |
30 |
|
6.3.8 |
Granitic Gneiss in Quartzite of Hidden Bay Assemblage |
30 |
|
6.3.9 |
Pegmatite Sills and Dykes |
32 |
|
6.3.10 |
Post-Metamorphic Sediments: Athabasca Sandstone |
32 |
|
6.3.11 |
Paleoweathering/Saprolite at the Top of the Basement Rocks |
32 |
|
6.4 |
Structural Setting of the Horseshoe-Raven Property |
33 |
|
6.4.1 |
Penetrative Deformation and Folding |
33 |
|
6.4.2 |
D1 Deformation |
33 |
|
6.4.3 |
D2 Deformation |
33 |
|
6.5 |
Mineralization |
34 |
|
6.6 |
Local Geology of the Horseshoe and Raven Deposits |
35 |
|
6.6.1 |
Host Lithologies to the Horseshoe and Raven Deposits |
35 |
|
6.6.2 |
Structural Setting - Metamorphic Structural Architecture |
35 |
|
6.6.3 |
Mineralization |
35 |
|
6.7 |
Athabasca Uranium Deposits |
36 |
|
6.7.1 |
Sandstone-Hosted Deposits |
37 |
|
6.7.2 |
Basement-Hosted Deposits |
37 |
|
7 |
EXPLORATION |
40 |
|
7.1 |
Geophysics in the Horseshoe and Raven Deposit Area |
40 |
|
7.2 |
Drilling in the Horseshoe and Raven Deposit Area |
41 |
|
7.2.1 |
Historical Drilling by Gulf in the Horseshoe and Raven Area |
43 |
|
7.3 |
Drilling (Mid-2009 – 2012) |
44 |
|
7.4 |
Core Handling, Drillhole Surveys and Logistical Considerations during the Mid-2009 – 2012 Drilling Programs |
67 |
|
7.4.1 |
Drillhole Field Locations and Surveys |
68 |
|
7.4.2 |
Downhole Surveys |
68 |
|
7.4.3 |
Drill Core Handling Procedures |
68 |
|
7.4.4 |
Core Recovery |
69 |
|
7.4.5 |
Drill Core Logging |
69 |
|
7.4.6 |
Geotechnical Logging |
70 |
|
7.4.7 |
Radiometric Probing of Drillholes |
71 |
|
7.4.8 |
Relationship between Sample Length and True Thickness |
71 |
|
7.4.9 |
Hydrogeology |
72 |
|
8 |
SAMPLE PREPARATION, ANALYSES AND SECURITY |
73 |
|
8.1 |
Horseshoe and Raven Geochemical Sample Collection |
73 |
|
8.2 |
Drillhole Sampling Quality and Representativeness |
74 |
|
8.3 |
Shipping and Security |
75 |
|
8.4 |
Geochemical Analyses |
75 |
|
8.4.1 |
Analytical Procedures |
75 |
|
8.4.2 |
SRC Geoanalytical Laboratories U3O8 Method Summary |
76 |
|
8.4.3 |
Laboratory Audits |
76 |
|
8.5 |
Uranium Equivalent Grades |
76 |
|
8.6 |
Dry Bulk Density Samples |
77 |
|
8.6.1 |
Analytical Methods |
78 |
|
8.7 |
Summary |
80 |
|
8.7.1 |
Verifications of Analytical Quality Control Data |
81 |
|
9 |
DATA VERIFICATION |
91 |
|
9.1 |
Qualified Person Data Verification |
91 |
|
9.2 |
Database Verification |
91 |
|
9.3 |
Logging and Sampling Procedure Review |
92 |
|
9.4 |
Collar Position |
92 |
|
9.4.1 |
Downhole Surveys, Collar and Lithology Review |
92 |
|
9.5 |
Assay and Bulk Densities Databases |
93 |
|
9.6 |
Independent Samples |
93 |
|
9.7 |
Conclusion |
94 |
|
9.8 |
QP Comments |
94 |
|
10 |
MINERAL PROCESSING AND METALLURGICAL TESTING |
95 |
|
11 |
MINERAL RESOURCE ESTIMATE |
97 |
|
11.1 |
Introduction |
97 |
|
11.2 |
Mineral Resource Estimation Methodology |
97 |
|
11.3 |
Resource Database |
98 |
|
11.4 |
Geological Modelling |
99 |
|
11.5 |
Specific Gravity |
101 |
|
11.6 |
Composites |
104 |
|
11.7 |
Capping |
104 |
|
11.8 |
Block Model Definition |
107 |
|
11.9 |
Search Ellipsoid |
107 |
|
11.10 |
Estimation Strategy |
108 |
|
11.11 |
Block Model Validation |
109 |
|
11.11.1 |
Block Volume/Solid Volume Comparison |
109 |
|
11.11.2 |
Visual Validation of Sections |
109 |
|
11.11.3 |
Swath Plots |
111 |
|
11.11.4 |
Validation Author Statement |
113 |
|
11.12 |
Mineral Resource Classification |
113 |
|
11.13 |
Grade Sensitivity Analysis |
116 |
|
11.14 |
Resource Uncertainty and Prospect of Economic Extraction |
117 |
|
12 |
MINERAL RESERVE ESTIMATES |
118 |
|
13 |
MINING METHODS |
119 |
|
14 |
PROCESS AND RECOVERY METHODS |
120 |
|
15 |
INFRASTRUCTURE |
121 |
|
16 |
MARKET STUDIES |
122 |
|
17 |
ENVIRONMENTAL STUDIES, PERMITTING, PLANS, NEGOTIATIONS OR AGREEMENTS WITH LOCAL INDIVIDUALS OR GROUPS |
123 |
|
18 |
CAPITAL AND OPERATING COSTS |
124 |
|
19 |
ECONOMIC ANALYSIS |
125 |
|
20 |
ADJACENT PROPERTIES |
126 |
|
21 |
OTHER RELEVANT DATA AND INFORMATION |
127 |
|
22 |
INTERPRETATION AND CONCLUSIONS |
128 |
|
23 |
RECOMMENDATIONS |
129 |
|
23.1 |
Preliminary Economic Assessment |
129 |
|
23.2 |
Additional Field Duplicate Sampling |
129 |
|
23.3 |
Advanced Metallurgy |
129 |
|
24 |
REFERENCES |
131 |
|
25 |
RELIANCE ON OTHER EXPERTS |
137 |
|
26 |
DATE AND SIGNATURE PAGES |
138 |
| LIST OF FIGURES | Page # |
|
Figure 3‑1: Location of the Horseshoe-Raven Property in Saskatchewan, Canada |
12 |
|
Figure 3‑2: Land Tenure Map of the Horseshoe-Raven Property |
14 |
|
Figure 4‑1: Typical Landscape in the Horseshoe-Raven Property Area |
18 |
|
Figure 6‑1: Regional Geology Setting |
24 |
|
Figure 6‑2: Horseshoe-Raven Local Area Stratigraphy |
25 |
|
Figure 6‑3: Geological Sketch Map of the Athabasca Basin. The eastern Athabasca Basin is defined as that part of the basin east of the Snowbird tectonic zone and is shown in reference to the major basement domains and stratigraphy of the Athabasca Basin, after Card et al. 2007, Portella and Annesley (2000), Ramaekers et al. (2007) and Thomas et al. (2002). |
26 |
|
Figure 6‑4: A) Idealized cross-section through the eastern Cree Lake zone, suggesting the possible structural relationship between Archean basement and Paleoproterozoic metasedimentary cover during the early stages of Hudsonian deformation (after Tran, 2001); B) Geological cross-section through the Athabasca Basin (after Ramaekers, 1990; Ramaekers et al. 2007). For location see Figure 6-3. |
27 |
|
Figure 6‑5: Horseshoe-Raven Property Local Geology |
31 |
|
Figure 6‑6: Types of Unconformity-Type Uranium Deposits |
39 |
|
Figure 7‑1: Horseshoe and Raven Drillhole Collars |
42 |
|
Figure 7‑2: Recent Historical Drilling on the Horseshoe-Raven Property |
45 |
|
Figure 8‑1: Logarithmic Plot of Dry Bulk Density versus Uranium Grade in Corresponding Geochemical Samples |
79 |
|
Figure 8‑2: Quantile - Quantile Plot of Laboratory Bulk Density Replicated for Batches Submitted for all Seasons Prior to September 2008 |
79 |
|
Figure 8‑3: Quantile - Quantile Plot of Laboratory Bulk Density Replicated for Batches Submitted between September 2008 and June 2009 |
80 |
|
Figure 8‑4: Control Chart for Reference Material CG51509* analyzed for Uranium at SRC |
84 |
|
Figure 8‑5: Control Chart for Reference Material CAR110 analyzed for Uranium at SRC |
85 |
|
Figure 8‑6: Control Chart for Reference Material BL-2a analyzed for %U3O8 at SRC |
85 |
|
Figure 8‑7: Control Chart for Reference Material BL-3* analyzed for Uranium and %U3O8 at SRC |
86 |
|
Figure 8‑8: Control Chart for Reference Material BL-4a* analyzed for Uranium and %U3O8 at SRC |
86 |
|
Figure 8‑9: Control Chart for Reference Material UEX08* analyzed for Uranium and %U3O8 at SRC |
87 |
|
Figure 8‑10: Control Chart for Reference Material UEX02* analyzed for Uranium and %U3O8 at SRC |
87 |
|
Figure 8‑11: XY Chart for Lab Replicates Analyzed for Uranium at SRC 2009 |
89 |
|
Figure 8‑12: RPD Chart for Lab Replicates Analyzed for Uranium at SRC 2009 |
89 |
|
Figure 8‑13: XY Chart for Lab Replicates Analyzed for Uranium SRC 2011 |
90 |
|
Figure 8‑14: RPD Chart for Lab Replicates Analyzed for Uranium SRC 2011 |
90 |
|
Figure 11‑1: Horseshoe Wireframe Plan View (Looking Down) |
100 |
|
Figure 11‑2: Horseshoe Wireframe Isometric View (Looking NNE) |
100 |
|
Figure 11‑3: Raven Wireframe Plan View (Looking Down) |
101 |
|
Figure 11‑4: Raven Wireframe Isometric View (Looking NNE) |
101 |
|
Figure 11‑5: Horseshoe Density vs U3O8 |
102 |
|
Figure 11‑6: Raven Density vs U3O8 |
103 |
|
Figure 11‑7: Log Probability Plot for Horseshoe Composite and Trimmed Assays |
105 |
|
Figure 11‑8: Log Probability Plot for Raven Composite and Trimmed Assays |
106 |
|
Figure 11‑9: Horseshoe Visual Check of Drillhole Grades against Block Grades (Section Orientation of 335°) |
110 |
|
Figure 11‑10: Raven Visual Check of Drillhole Grades against Block Grades (Section Orientation of 345°) |
111 |
|
Figure 11‑11: Horseshoe Swath Plot in the X Direction |
112 |
|
Figure 11‑12: Raven Swath Plot in the X Direction |
112 |
| LIST OF TABLES | Page # |
|
Table 1‑1: Horseshoe and Raven Deposits Mineral Resource Estimates |
6 |
|
Table 1‑2: Grade Sensitivity Analysis Using Global Block Model Quantities and Grade Estimates at Various U3O8 Cut-Off Grades |
7 |
|
Table 3‑1: Mineral Tenure Information for the Horseshoe-Raven Property |
13 |
|
Table 5‑1: Historical Drilling by Other Companies on the Horseshoe-Raven Property |
20 |
|
Table 5‑2: 2022 Resource Estimate |
21 |
|
Table 7‑1: Summary of Drilling on the Horseshoe-Raven Property |
43 |
|
Table 7‑2: Summary of Drilling by UEX on the Horseshoe-Raven Project |
46 |
|
Table 7‑3: Assay Results Mid-2009 through 2012 |
48 |
|
Table 7‑4: UEX Lithology Legend |
69 |
|
Table 8‑1: Horseshoe Bulk Density (g/cm3) Statistics Grouped by Lithology |
77 |
|
Table 8‑2: Raven Bulk Density (g/cm3) Statistics Grouped by Lithology |
78 |
|
Table 8‑3: Average Dry Bulk Densities (g/cm3) by Grade Bins |
78 |
|
Table 8‑4: Number of Samples for Each Deposit by Year |
81 |
|
Table 8‑5: Summary of the Horseshoe and Raven QC Results for the Reporting Period 2005 to September 2008 (Baldwin, 2009) |
82 |
|
Table 8‑6: Summary of the Horseshoe and Raven QC Results for the Reporting Period September 2008 to June 2009 (Baldwin, 2009) |
83 |
|
Table 8‑7: Summary of Horseshoe and Raven QC Results for the Reporting Period July 2009 to 2011 |
84 |
|
Table 9‑1: Raven Collars, Comparison between QP's GPS and UEX Database |
92 |
|
Table 9‑2: Independent Samples taken by Golder at Horseshoe and Raven |
94 |
|
Table 11‑1: Horseshoe and Raven Deposits Exploration Drillholes |
98 |
|
Table 11‑2: Horseshoe Density Statistics |
102 |
|
Table 11‑3: Raven Density Statistics |
104 |
|
Table 11‑4: Basic Statistics for Mineralized Wireframes at Horseshoe and Raven |
106 |
|
Table 11‑5: Horseshoe and Raven Deposits Block Model Specifications |
107 |
|
Table 11‑6: Search Ellipse Parameters for Horseshoe and Raven Estimation |
107 |
|
Table 11‑7: Estimation Parameters for Horseshoe and Raven Deposits |
108 |
|
Table 11‑8: Volume Estimated per Pass for Each Deposit |
109 |
|
Table 11‑9: Wireframe Volume vs Block Model Volume |
109 |
|
Table 11‑10: Cut-Off Grade Determination |
115 |
|
Table 11‑11: Horseshoe and Raven Deposits Mineral Resource Estimates |
115 |
|
Table 11‑12: Global Block Model Quantities and Grade Estimates at Various U3O8 Cut-Off Grades |
116 |
|
Table 23‑1: Cost Break Down of Metallurgical Drill Program |
130 |
|
1. |
EXECUTIVE SUMMARY |
|
1.1 |
Introduction |
The Horseshoe-Raven Property (the “Property”) is in the Wollaston Lake area of Northern Saskatchewan, approximately 695 kilometres (“km”) north of Saskatoon, southwest of Wollaston Lake. The Property is located approximately four km south of the uranium mill at Rabbit Lake and 431 km north of the town of La Ronge. The Property is 100% owned by UEX Corporation (“UEX”), a wholly-owned subsidiary of Uranium Energy Corporation (“UEC” or the “Company”), and is 4,486 hectares comprised of one mineral claim as of the effective date of this Technical Report Summary, to which UEX has title.
The Property is in the eastern Athabasca uranium district, adjacent to several current and past producing uranium deposits on the Rabbit Lake property of Cameco Corporation (“Cameco”), and the McClean Lake property operated by Orano Canada Inc. (“Orano”). The Property is accessible year-round by Highway 905, a maintained all-weather gravel road, and by maintained access and mine roads to the Rabbit Lake and McClean Lake mining operations, which pass through the Property. Infrastructure is well developed in the local area, with two operating uranium ore processing facilities, Rabbit Lake and McClean Lake, located four km northeast and 22 km northwest of the Horseshoe and Raven Deposits, respectively. The principal hydroelectric transmission lines that service both facilities also pass through the property, over the Horseshoe and Raven Deposits.
This Technical Report Summary (the “TRS”) has been prepared for UEC by Mr. Nathan Barsi (UEX’s District Geologist), Mr. Chris Hamel (UEX’s VP Exploration and the Company’s Vice President Exploration, Canada) and Mr. Roger Lemaitre (UEX’s former President and CEO), pursuant to Regulation S-K Subpart 1300, “Modernization of Property Disclosures for Mining Registrants” (“S‑K 1300”). This TRS identifies and summarizes the scientific and technical information and conclusions reached concerning the Initial Assessment (“IA”) to support disclosure of mineral resources on the Property. The objective of this TRS is to disclose the mineral resources on the Property.
UEX became a wholly-owned subsidiary of UEC on August 19, 2022. Much of the technical work reported herein was completed prior to the acquisition of UEX by UEC. Thus, while the TRS will include statements such as “UEX completed”, or “UEX provided”, the reader is cautioned that when UEX is mentioned it should be interpreted that such work was completed prior to the completion of the acquisition.
|
1.2 |
Property Description and Ownership |
The Property is in the Wollaston Lake area of Northern Saskatchewan, approximately 695 km north of Saskatoon, southwest of Wollaston Lake. The Property measures approximately 4,486 hectares comprising one mineral claim as of the effective date of the TRS, to which UEX has title.
In Saskatchewan, mineral resources are owned by the Crown and managed by the Saskatchewan Ministry of the Economy through the Crown Minerals Act and the Mineral Tenure Registry Regulations, 2012. Staking for mineral dispositions in Saskatchewan is conducted through the online staking system, Mineral Administration Registry Saskatchewan (“MARS”). The mineral disposition for the Property was staked in 1977. Accordingly, ground staking methods were employed prior to the initiation of staking by the MARS system. These dispositions give the stakeholders the right to explore the lands within the disposition area for economic mineral deposits.
UEC’s wholly-owned subsidiary, UEX, holds a 100% interest in the Property, subject to standard royalties to the Government of Saskatchewan.
Access to the Property is via Highway 905, a well-maintained gravel road accessible year-round that passes through the central portion of the Property and over the west end of the Raven Deposit. Year-round access is possible by truck. The topography of the area is relatively flat characterized by undulating glacial moraine, outwash, and lacustrine plains.
|
1.3 |
History |
The Property was initially explored in the late 1960s as part of the greater Rabbit Lake Property after the discovery of the Rabbit Lake Uranium Deposit in 1968.
Early exploration for uranium was conducted by Gulf Minerals Canada Limited (“Gulf”), and Conwest Exploration Company Limited (Conwest). Eldorado Nuclear Limited acquired Conwest in 1979, Gulf in 1982 and amalgamated with Saskatchewan Mining and Development Corporation (“SMDC”) to form Cameco in 1988. Cameco transferred title to the Hidden Bay Property to UEX through an agreement reached with Pioneer Metals Corporation (“Pioneer”) in 2001.
The Horseshoe-Raven deposit was discovered in two stages, four years after the discovery of the Rabbit Lake Mine. In the fall of 1972, drill testing of a ground conductor became the discovery hole for the Raven Deposit. Subsequent drilling through 1973 and 1974 outlined the deposit. During the final year of the Raven Deposit drilling, the discovery hole of the Horseshoe Deposit intersected uranium mineralization to the east of the Raven Deposit while testing a geophysical anomaly similar to the Raven Deposit signature. Subsequent diamond drilling during the period of 1974 to mid-1975 succeeded in outlining the Horseshoe Deposit (Studer, 1984).
|
1.4 |
Geology and Mineralization |
The Property is located just east of the eastern margin of the Athabasca Basin. It is underlain by Paleoproterozoic metasedimentary gneiss and Archean granitic gneiss basement rocks of the Hearne Province. The basement rocks of the Property are within the Cree Lake zone of the Early Proterozoic Trans-Hudson orogenic belt. The Cree Lake zone is further subdivided into three transitional lithotectonic domains, of which the Property lies within one of them, the Wollaston Domain. Lithologies and foliation of the Wollaston Domain rocks of the Property trend northeast with predominantly moderate to steep southeast dips, although northwest dips occur as the result of the broad synform that is the host to uranium mineralization at Horseshoe and Raven.
The Wollaston Domain is composed of a mixed sequence of metamorphosed arkosic sandstones and pelitic to semi-pelitic gneisses that make up four successive lithostratigraphic units, of which the upper three are present in the deposit area:
|
● |
A basal pelitic gneiss composed of coarse, mature quarzitic to arkosic metasedimentary rocks; |
|
● |
A meta-pelite, commonly graphitic and interlayered with quartzitic semi-pelite and calc-silicate; |
|
● |
A thick meta-arkose interlayered with minor calc-silicate and pelite; and |
|
● |
Upper amphibole-quartzite interlayered with calcareous metasedimentary rocks and graphitic pelite, known as the Hidden Bay assemblage. |
The Horseshoe and Raven Deposits are hosted by the Hidden Bay Assemblage, which occurs within a complex northeast trending D2 synclinorium that sits structurally above and south of the underlying meta-arkose unit of the Daly River subgroup. The synclinorium is cored by quartzite that is succeeded outward concentrically from the core of the folds by other components of the Hidden Bay Assemblage, which include a mixed sequence of calc-arkose, additional quartzite, locally graphitic sillimanite-bearing pelitic schist and amphibolite.
Lithologies in the Horseshoe and Raven areas outline several significant, upright open D2 (F2) folds in the local area. These folds have steep to moderate southeasterly dipping axial planes and horizontal to shallow northeast plunging fold axes.
Mineralization at the Horseshoe Deposit has been defined over a strike length of approximately 800 m and occurs at depths between 100 m and 450 m below surface. Mineralization occurs in several stacked and shallow plunging shoots that generally follow the fold axis of a gently folded arkose-quartzite package. Uranium mineralization is often best developed along the dilational zones developed between the bedding units.
The Raven Deposit is located 500 m southwest of the Horseshoe Deposit and has been defined over a strike 1000 m and ranges between 100 m and 300 m in depth. The bulk of the uranium mineralization occurs in two sub-horizontal tabular zones that are oriented parallel to the axial plane of the folded arkose-quartzite package.
|
1.5 |
Exploration |
After acquiring the claims comprising the Property in 2002, UEX continued to explore various targets on the Property, utilizing a combination of airborne and ground electromagnetic (“EM”), magnetic, radiometric resistivity and gravity geophysical methods in more grassroots target areas to identify drilling targets, or direct follow-up drilling in areas where previous drilling had intersected alteration or mineralization.
UEX also initiated a re-evaluation of the Horseshoe and Raven deposits due to rising uranium prices. In 2005, drilling tested mineralization in selected areas of both deposits to test mineralization continuity between the widely-spaced historical holes drilled by Gulf. The success of that program led to subsequent drilling programs between 2006 and 2009, in which 376 diamond drillholes totaling 119,400 m were drilled at Horseshoe and 243 drillholes totaling 65,600 m were drilled at Raven. These programs not only established continuity of mineralization between the historical Gulf drilling, but expanded the deposit footprints into areas not historically drilled by Gulf.
Additional drilling was completed in the summer of 2009 and 2011, bringing the total drillholes for Horseshoe to 404 (128,179.8 m) and 311 drillholes (82,205.8 m) for Raven. The results of these holes were incorporated into the existing database and used to update the resource estimates, which are discussed in this TRS.
|
1.6 |
Development and Operations |
There is no permanent infrastructure or capacity to conduct mining operations on the Property.
|
1.7 |
Sample Preparation, Analyses and Security |
All samples from 2005, 2006, 2007, 2008, 2009 and 2011 drilling programs were submitted by ground courier to the Saskatchewan Research Council (“SRC”) in Saskatoon. SRC is accredited to the ISO 17025 standard by the Standards Council of Canada for a number of specific test procedures, including U3O8 analysis and specific gravity.
Chris Hamel, P.Geo. (APEGS#12985), co-author and Qualified Person (“QP”) of this TRS undertook the analysis of analytical control data for the Horseshoe and Raven Deposits. In the opinion of the QP, the sample preparation, security and analytical procedures for all assay data are suitable for use in mineral resource estimation.
|
1.8 |
Data Verification |
Exploration work completed by UEX in 2009 and 2011 was conducted using documented procedures and protocols involving extensive exploration data verifications and validation. During drilling, UEX geologists implemented industry-standard best practices designed to ensure the reliability and trustworthiness of the exploration data.
Mr. Nathan Barsi, P.Geo (UEX District Geologist) and Mr. Chris Hamel, P.Geo. (UEX Vice President, Exploration) visited the site from June 9 to June 17, 2021, to review and verify this historical work. All relevant information required for this TRS and resource model were reviewed by the QPs (core logging, sampling, database management) and the QPs are confident in the validity of the data provided within.
|
1.9 |
Metallurgy |
Preliminary metallurgy was completed in 2009. Based on the test work process, uranium recoveries are estimated to be 95%. Leach tests confirmed that the Horseshoe and Raven mineralization is easily leached under relatively mild atmospheric leach conditions.
In 2016, UEX conducted additional metallurgical testing of Horseshoe and Raven mineralization with the objective of evaluating the potential benefit of heap leach extraction in lieu of toll milling. The testing program was conducted at SGS Lakefield Laboratories and was successful at demonstrating the potential of heap leaching. UEC is encouraged by the results of the test work and will be conducting further investigations into heap leaching at Horseshoe and Raven in the future.
|
1.10 |
Mineral Resource and Mineral Reserve Estimates |
The resource estimation work was completed by Mr. Nathan Barsi, P.Geo. (APEGS #15012) and Mr. Roger Lemaitre P.Eng., P.Geo. (APEGS #10647) who, along with Chris Hamel, are appropriate QPs as defined under S-K 1300. The mineral resource model prepared by a QP considers 715 core boreholes (210,385 m) drilled by UEX during the period between 2005 to 2009 and 2011. The mineral resources reported herein were estimated using an inverse distance squared/block modelling approach informed from core borehole data constrained within uranium mineralization wireframes.
The geological model of the mineralization represents distinct irregularly shaped pods that are mappable continuously from borehole to borehole. The solid used to constrain the block model was defined using a traditional wireframe interpretation constructed from explicit modelling and sectional interpretation of the drilling data using a 0.02% U3O8 threshold. Using this threshold, a wireframe was constructed that defined the margins and continuity of the uranium mineralization at Horseshoe and Raven. Assays were composited to one m prior to construction of wireframes. Constructing a singular wireframe envelope for both deposits supersede the previous interpretation of 28 subzones for the Horseshoe Deposit and the 16 subzones from the Raven Deposit.
Upon completion of the wireframes, the assay sample database was trimmed to samples that only fall within the mineralized wireframe. Basic statistics, histograms and cumulative probability plots for each deposit were applied to determine appropriate capping grades. The Horseshoe Deposit grade was capped at 10%, while Raven was capped at 1.88%.
The resource estimate followed the block size criteria set forth in the 2009 N.I. 43-101 Horseshoe-Raven Mineral Resource Technical Report (the “2009 Report”) as a starting point, with a block size of five by five by 2.5 m for the mineralized wireframe. The blocks were visually checked by a QP in both two-dimensional (“2D”) and three-dimensional (“3D”), and it was deemed appropriate to use the existing block criteria as referenced above. Sub-cells, at 0.25 m resolution, were used to respect the geology of the modelled wireframe. Sub-cells were assigned the same grade as the parent cell. The block model was rotated on the Z-axis to honor the orientation of the mineralization.
Grade estimation used an inverse distance weighting squared estimation algorithm and three passes informed by the capped and trimmed to the uranium wireframe assay values. Validation checks confirm that the block estimates are a reasonable representation of the informing data set.
The QPs are satisfied that the geological modelling honors the current geological information and knowledge. The location of the samples and the assay data are sufficiently reliable to support resource evaluation. The sampling information was acquired by core drilling with pierce points between seven metres and 30 m apart, but generally at 10 m across section and 25 m along strike. The QPs are confident that they have modelled the overall spatial location of the uranium mineralization and that it is representative of the controls. Preliminary metallurgical data has been collected and has been disclosed above in the relevant section. The QPs consider all block estimates within the mineralized lenses to satisfy the Committee for Mineral Resources International Reporting Standards (“CRIRSCO”) classification criteria for an Indicated Mineral Resource.
The cut-off grade (“COG”) used to determine resources was calculated to be 0.05% U3O8 by a QP.
A QP determined COG by considering a cut-and-fill underground mining method for the two deposits. The limitations associated with typical cut-and-fill mining processes require that all rock present within a mineralized zone be mined and removed from the mining stope, regardless of whether or not that portion of rock is mineralized, partially mineralized or is considered to be waste rock. Thus, the cost to mine mineralized rock is equivalent to the cost of mining waste rock. In a cut-and-fill underground mining scenario, waste rock must be removed.
Processing, water treatment, general and administrative costs, along with mining and milling recoveries using heap leach extraction, were estimated by a QP for the Horseshoe and Raven deposits. The uranium price of US$75/lb U3O8 was used and is considered reasonable given the range of spot uranium prices reported by industry price expert TradeTech between September 15, 2023 and this TRS’ effective date of March 1, 2024. An exchange rate of C$1.00 to US$0.73 was used.
As the cost of mining waste rock and mineralized rock are the same in cut-and-fill underground extraction, marginal COGs are determined exclusively from the processing, water treatment and general and administrative costs.
The marginal COG was determined using the formula:
| COG = | Processing+Water Treat+G&A+ Mining Cost per tonne |
| Uranium Price (in CAD$ per t) x total recovery |
Criteria related to calculating COG are presented in Table 11-10. In the opinion of the QPs, the resource evaluation reported in Table 1-1 is a reasonable representation of the uranium mineralization at the Horseshoe and Raven Deposits.
Table 1‑1: Horseshoe and Raven Deposits Mineral Resource Estimates
|
Horseshoe Deposit Uranium Resource* |
||||
|
Deposit |
Category |
Quantity (Tonnes) |
Average Grade U3O8 (%) |
Total lb. U3O8 |
|
Horseshoe |
Indicated |
4,982,500 |
0.215 |
23,594,000 |
|
Raven Deposit Uranium Resources* |
||||
|
Deposit |
Category |
Quantity (Tonnes) |
Average Grade U3O8 (%) |
Total lb. U3O8 |
|
Raven |
Indicated |
5,370,000 |
0.117 |
13,832,400 |
*Mineral resources are not mineral reserves and have not demonstrated economic viability. There is no certainty that all or any part of the mineral resource will be converted into mineral reserves. All figures are rounded to reflect the relative accuracy of the estimates. Resources were estimated using a COG of 0.05% U3O8
The mineral resource model is relatively sensitive to the selection of the reporting uranium COG. To illustrate this sensitivity, the quantities and grade estimates are presented in Table 1-2 at various COGs. The reader is cautioned that the figures presented in this table should not be misconstrued with a Mineral Resource Statement. The tables are only presented to show the sensitivity of the block model estimate to the selection of U3O8 COG.
Table 1‑2: Grade Sensitivity Analysis Using Global Block Model Quantities and Grade Estimates at Various U3O8 Cut-Off Grades
|
Horseshoe Grade Sensitivity Analysis |
||||
|
Cut-Off |
Indicated Blocks |
|||
|
Grade |
Volume / Quantity |
Grade |
||
|
U3O8 |
Volume |
Tonnage |
U3O8 |
|
|
(%) |
(m3) |
(tonnes) |
(%) |
|
|
0.01 |
4,113,990 |
10,202,696 |
0.119 |
|
|
0.02 |
3,415,704 |
8,470,945 |
0.140 |
|
|
0.05 |
2,009,077 |
4,982,512 |
0.215 |
|
|
0.10 |
1,196,033 |
2,966,088 |
0.313 |
|
|
0.15 |
866,315 |
2,148,462 |
0.386 |
|
|
0.20 |
628,722 |
1,559,230 |
0.466 |
|
|
0.25 |
468,775 |
1,162,562 |
0.548 |
|
|
0.30 |
372,190 |
923,032 |
0.620 |
|
|
0.35 |
300,907 |
746,250 |
0.689 |
|
|
0.40 |
238,923 |
592,530 |
0.771 |
|
|
Raven Grade Sensitivity Analysis |
||||
|
Cut-Off |
Indicated Blocks |
|||
|
Grade |
Volume / Quantity |
Grade |
||
|
U3O8 |
Volume |
Tonnage |
U3O8 |
|
|
(%) |
(m3) |
(tonnes) |
(%) |
|
|
0.01 |
5,013,261 |
12,432,888 |
0.066 |
|
|
0.02 |
4,117,590 |
10,211,623 |
0.077 |
|
|
0.05 |
2,165,334 |
5,370,028 |
0.117 |
|
|
0.10 |
867,706 |
2,151,912 |
0.186 |
|
|
0.15 |
439,339 |
1,089,560 |
0.250 |
|
|
0.20 |
244,018 |
605,165 |
0.312 |
|
|
0.25 |
149,652 |
371,138 |
0.368 |
|
|
0.30 |
93,338 |
231,479 |
0.424 |
|
|
0.35 |
60,029 |
148,873 |
0.481 |
|
|
0.40 |
40,251 |
99,822 |
0.534 |
|
The sensitivity analysis indicates that a large portion of the resource for the deposits are of a lower grade.
|
1.11 |
Recovery Methods |
In 2016, UEX conducted additional metallurgical testing of Horseshoe and Raven uranium mineralization with the objective of evaluating the potential benefit of heap leach extraction in lieu of toll milling. The testing program was conducted at SGS Lakefield Laboratories and was successful at demonstrating the potential of heap leaching. UEX is encouraged by the results of the test work and will be conducting further investigations into heap leaching at Horseshoe and Raven in the future.
|
1.12 |
Adjacent Properties |
There are no applicable adjacent properties to the Horseshoe and Raven Deposits.
|
1.13 |
Permitting Requirements |
Mineral exploration on land administered by the Saskatchewan Ministry of Environment requires that surface disturbance permits be obtained before any exploration or development work is performed. The Saskatchewan Mineral Exploration and Government Advisory Committee (“SMEGAC”) has developed the Mineral Exploration Guidelines for Saskatchewan to mitigate environmental impacts from industry activity and facilitate government approval for such activities (SMEGAC, 2016). Applications to conduct an exploration work program need only to address the relevant topics of those listed in the guidelines. The types of activities are listed under the guide’s best management practices (“BMP”).
|
1.14 |
Conclusions and Recommendations |
The two wireframes constructed by a QP were developed using the former authors’ subzones for each deposit as a guide. The alternate section definition and the distribution of the drillholes and assays not previously incorporated into the geological interpretation resulted in the majority of the subzones being truncated by the new wireframes interpreted by that QP.
The Horseshoe Deposit is estimated to contain an indicated resource of 23,594,000 lbs U3O8 with an average grade of 0.215% U3O8 at a COG of 0.05% U3O8. The Raven Deposit is estimated to contain an indicated resource of 13,832,400 lbs U3O8, with an average grade of 0.117% U3O8 at a COG of 0.05% U3O8. No inferred resources have been estimated for either deposit.
This results in the Horseshoe deposit’s contained uranium in indicated resources in this estimate decreased by approximately 1.5%, but the average grade increased by approximately 9% at a COG of 0.05% U3O8 when compared to the global tonnage of the resource reported in the 2009 Report. This decrease is likely attributed to the wireframes in 28 subzones in the 2009 estimate being very thin and vein-like in their original construction.
A QP completed a conventional inverse distance squared interpolation approach to estimate the updated mineral resource for the Horseshoe and Raven Deposits. Mineral resource estimates were constrained within geological defined wireframes based on available information.
The QPs are confident in the modelling of the overall spatial location of the uranium mineralization and that it is representative of the Horseshoe and Raven Deposits. The QPs consider all block estimates within the mineralized wireframe to satisfy the classification criteria for Indicated Mineral Resources.
Based on the geological setting, character of the uranium mineralization delineated and exploration results to date, the QPs do not recommend any future exploration work within the immediate vicinity of the Horseshoe and Raven Deposits on the Property.
The QPs propose that a study be initiated to determine the potential economics and viability of mining the Horseshoe and Raven Deposits. The resource estimate presented in this TRS could be used to determine whether the projects warrant advancement towards a pre-feasibility study. Completing this assessment is estimated to cost CAD $150,000 - $200,000.
As part of this assessment, it is recommended that UEX undertake an additional sampling program to supplement the summer 2009 to 2011 exploration programs. The field duplicate data from that period could not be easily segregated and validated from the assay database. The QPs are confident that duplicate samples were taken, but an additional sample program would eliminate any doubt of the validity of the data from the 2009 to 2011 program and eliminate any future but very minor QA/QC concerns over this subpopulation, which comprises only 7.88% of the total sample database. It is recommended to take approximately 500 new samples across both deposits, as this would represent approximately 2% of the sample population to date. The majority of the costs associated with an additional sample program would be analytical costs as the sample pulps from the original assay samples may still be available from the laboratory. If the samples are available, the estimated cost of a check sampling program would be CAD $25,000. If the pulps are not available, the cost would increase by approximately 33%, as new samples would have to be collected from the historical drill core the next time an exploration program is active at the Raven camp where the core is stored. This would cost approximately CAD $35,000.
Preliminary metallurgy was completed for a 2011 project report completed for UEX long before UEX’s acquisition by UEC. UEX completed additional metallurgical work in 2015, focusing on the viability of using uranium heap leach recovery. It is recommended that UEX advance the heap leach metallurgical testing to the next phase by completing additional compositing of representative samples from the Horseshoe and Raven deposits to continue developing the parameters for recovering the mineralized material in a sellable product. A recommend minimum of six tonnes of material is required for this work. The cost of completing this work would be approximately CAD $2,350,000.
[The remainder of this page is intentionally left blank.]
|
2. |
INTRODUCTION |
The Property is a development-stage project located in Saskatchewan, Canada. UEX owns 100% of the Property and operates the Property. UEX is a wholly-owned subsidiary of UEC, who is the registrant (the “Registrant”) and responsible for commissioning this TRS.
This TRS is an IA of the Property and includes a Mineral Resource Estimate for the Property on the Property. This TRS identifies and summarizes the scientific and technical information and conclusions reached concerning the IA to support disclosure of mineral resources on the Property. The objective of this TRS is to disclose the mineral resources on the Property. Mineral resources were completed according to the CRIRSCO classification guidelines.
|
2.1 |
Work Program |
The Mineral Resource Estimate reported herein is an internal effort by UEC personnel that include the historical drillholes that were completed after the July 2009 Mineral Resource. The exploration database was compiled and maintained by UEX. The geological model and outlines for the uranium mineralization were constructed by a QP following the previous technical report’s recommendation (Palmer and Fielder, 2009) to create a singular wireframe for each deposit using a threshold grade of 0.02% U3O8. In the opinion of the QPs, the geological model is a reasonable representation of the distribution of the targeted mineralization at the current level of sampling. The geostatistical analysis and grade model was completed by a QP during the months of June 2021 through October 2021.
The Mineral Resource Estimate reported herein was prepared in conformity with the CRIRSCO classification criteria for an Indicated Mineral Resource and to the requirements of S‑K 1300.
The technical report was assembled at UEX’s regional office in Saskatoon during the period of May 2021 through October 2022, and revised in March 2024.
|
2.2 |
Basis of the Technical Report |
This TRS is based on information collected by UEX during the 2009, 2011 and 2012 drilling campaigns performed between July 4 to September 17, 2009, January 16 to April 15, 2011, July 4 to October 20, 2011 and February 2 to February 27, 2012, and on historical information collected by UEX during exploration programs. The QPs have no reason to doubt the reliability of the information. Other information was obtained from the public domain. This Report is based on the following sources of information:
|
● |
Inspection of the Property area, including outcrop and drill core; |
|
● |
Historical exploration data collected by UEX; and |
|
● |
Additional information from public domain sources. |
|
2.3 |
Qualifications of Authors and UEX Team |
Compilation of this TRS was completed by Christopher Hamel (APEGS#12985), Nathan Barsi, P.Geo. (APEGS#15012) and Roger Lemaitre P.Eng., P.Geo. (APEGS#10647) from UEX. The responsibility for the analytical control data analysis was assumed by Chris Hamel, P.Geo. (APEGS#12985) from UEX. All aspects of land status, dispositions and claims were completed by Susan Biss (APEGS#24643) and responsibility is assumed by Mr. Barsi. By virtue of their education, membership to a recognized professional association and relevant work experience, Mr. Hamel. Mr. Barsi and Mr. Lemaitre are each considered to be a QP as defined by S-K 1300.
|
2.4 |
Site Visit |
Nathan Barsi, P.Geo and Chris Hamel, P.Geo., visited the Property from June 9 to 17, 2021 as Senior Geologist and Exploration Manager, respectively. While there, the QPs reviewed drill core and cross sections through both Horseshoe and Raven deposits, resurveyed historical drill collars for accuracy, observed local geology in outcrop and checked on historical sampling intervals. Roger Lemaitre last visited the Property to inspect core and outcrop related to the Horseshoe and Raven, Deposits on July 23 through July 26, 2019, wherein Mr. Lemaitre was able to examine, along with the UEX technical team, the key features of the Horseshoe-Raven deposit geology and mineralizing processes in drill core. Mr. Lemaitre was the project lead and supervised the drill programs on the Property in 2002 through 2005.
|
2.5 |
Previous Reports |
This TRS is a revision to the report on the Property to the U.S. Securities and Exchange Commission that had an effective date of October 31, 2022. The Property has previously been reported upon in Canada.
|
2.6 |
Key Definitions |
For clarity, certain key entities that are referred to throughout this document are defined herewith.
UEX Corporation (“UEX”): registered owner of the Horseshoe and Raven uranium deposits located in the Athabasca Basin of Northern Saskatchewan. Prior to August 19, 2022, UEX was a Canadian publicly-listed company listed on the Toronto Stock Exchange and subject to Canadian National Instrument 43-101 regulations. On August 19, 2022, UEX became a wholly-owned subsidiary of Uranium Energy Corp.
Uranium Energy Corp. (“UEC” or the “Company”) is a NYSE, American-listed company based in Corpus Christie, Texas that owns several uranium projects, mines and processing facilities in the United States and has been the owner of UEX since August 19, 2022. UEC is the registrant to whom this IA has been prepared.
|
2.7 |
Declaration |
The QPs’ opinions contained herein and effective March 1, 2024 is based on information collected by UEX throughout the course of UEX’s exploration programs.
The information in turn reflects various technical and economic conditions at the time of writing this TRS. Given the nature of the mining business, these conditions can change significantly over relatively short periods of time. This TRS includes technical information that requires subsequent calculations to derive subtotals, totals and weighted averages. Such calculations inherently involve a degree of rounding and consequently may introduce a margin of error. Where these occur, the QPs do not consider them to be material.
|
3. |
PROPERTY DESCRIPTION |
The Property is in the Wollaston Lake area of Northern Saskatchewan, approximately 695 km north of Saskatoon, southwest of Wollaston Lake. The Property is located within the eastern Athabasca, approximately four km south of the uranium mill at Rabbit Lake, and 431 km north of the town of La Ronge. The centre of the Property is located at approximately 103°46’00” degrees longitude west and 58°08”10” degrees latitude north (Figure 3‑1).
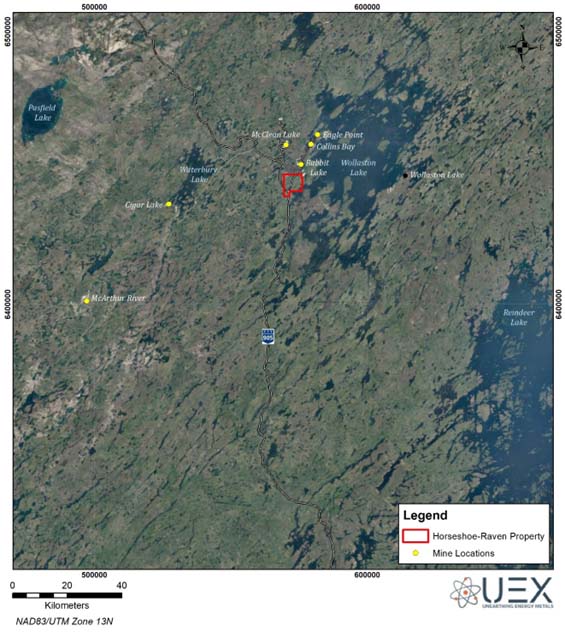
Figure 3‑1: Location of the Horseshoe-Raven Property in Saskatchewan, Canada
|
3.1 |
Mineral Tenure |
The Property is 100% owned by UEX/UEC and is 4,486 hectares comprised of one mineral claim as of the effective date of the TRS (Figure 3-2). The mineral rights exclude surface rights, which belong to the Government of Saskatchewan. Previously, the Horseshoe-Raven claim was part of the larger Hidden Bay property. In the first quarter of 2017, mineral claim S-106962 was separated from the Hidden Bay property to form the Property. The majority of the Property boundaries are surrounded by the 100% UEC owned Hidden Bay property.
Under Saskatchewan law, mineral claims or cells are map staked through an online registry. The map-designated coordinates of the cells are the legal limits of said claims, the physical limits can be verified by consulting the Government’s MARS website. The QPs were able to conduct a review of the mineral title of the Horseshoe-Raven mineral dispositions online using the publicly accessible Province of Saskatchewan’s MARS.
Annual assessment work and claim age is tabulated in Table 3-1. None of the dispositions are subject to any royalties, back in rights or encumbrances. No mining or waste disposal has occurred on the Property and, consequently, the Property is not subject to any liabilities due to previous mining activities. The only other encumbrances on the Property are the standard royalties to the Government of Saskatchewan.
Table 3‑1: Mineral Tenure Information for the Horseshoe-Raven Property
|
Disposition Number |
Record Date |
Area (Ha) |
Annual Assessment ($/Ha) |
Total Annual Assessment ($) |
Work Due / Lapse Date |
|
S-106962 |
12/1/1977 |
4,486 |
25 |
$112,150 |
2/28/2041 |
|
Total |
4,486 |
$112,150 |
|
[The remainder of this page is intentionally left blank.] |
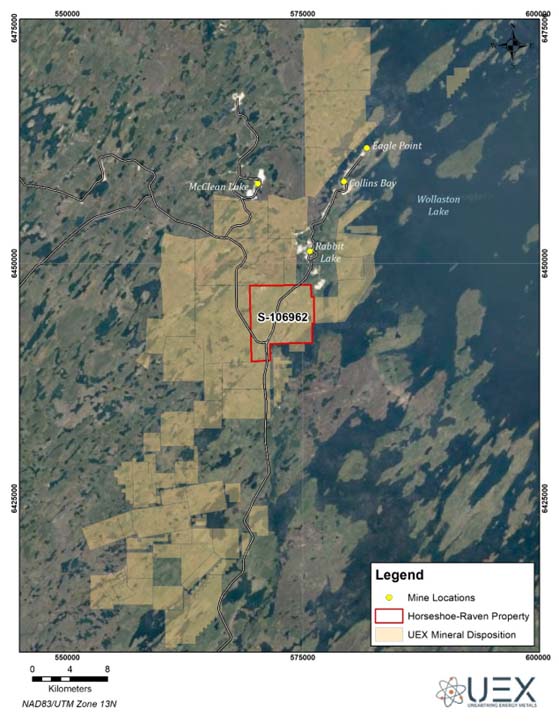
Figure 3‑2: Land Tenure Map of the Horseshoe-Raven Property
|
3.2 |
Mining Rights in Saskatchewan |
In Saskatchewan, mineral resources are owned by the Crown and managed by the Saskatchewan Ministry of the Economy through the Crown Minerals Act and the Mineral Tenure Registry Regulations, 2012. Staking for mineral dispositions in Saskatchewan is conducted through the online staking system, MARS. The mineral disposition for the Property was staked in 1977. Accordingly, ground staking methods were employed prior to the initiation of staking by the MARS system. These dispositions give the stakeholders the right to explore the lands within the disposition area for economic mineral deposits.
|
3.3 |
Underlying Agreements |
On behalf of UEX, the mineral claim that comprises the Property was investigated as part of a title opinion on September 7, 2021 by Robertson Stromberg, a Saskatoon, Saskatchewan-based law firm. Robertson Stromberg concluded that the claim is in good standing, is owned by UEX, and that as of September 7, 2021, there were no encumbrances, charges, security interests or instruments recorded against the claims.
|
3.4 |
Permits and Authorization |
Mineral exploration on land administered by the Ministry of Environment requires that surface disturbance permits be obtained before any work is performed. The SMEGAC has developed the Mineral Exploration Guidelines for Saskatchewan to mitigate environmental impacts from industry activity and facilitate governmental approval for such activities (SMEGAC, 2016). Applications to conduct exploration work need only to address the relevant topics of those listed in the guidelines. The types of activities are listed under the guide’s BMP. Given the historical nature of the exploration data used for the basis of this TRS and the changeover of staff at UEX, the QPs do not have any reason to believe that permits were not obtained for the historical work.
|
3.5 |
Environmental Considerations |
The Property, with the Horseshoe and Raven Deposits, is a mineral exploration project. The exploration work completed thus far has been limited primarily to drilling, geophysical surveys, mineral resource estimates and the establishment of a work camp with a subsequent surface lease.
The only known liability on the site is the temporary camp facilities. Once the camp is no longer useful, these will be removed from the site along with the septic field that is part of the present camp infrastructure.
|
4 |
ACCESSIBILITY, CLIMATE, LOCAL RESOURCES, INFRASTRUCTURE AND PHYSIOGRAPHY |
|
4.1 |
Accessibility |
The Property site is accessible by Highway 905, a well-maintained gravel road accessible year-round that passes through the central portion of the Property and over the west end of the Raven Deposit. Year-round access is possible by truck and all-terrain vehicles. Helicopters can also land at camp if necessary.
Two airstrips in the area, the Rabbit Lake airstrip and the Points North Landing airstrip, are serviced by several air carriers which provide scheduled flights to major population centres in Saskatchewan for mining operations, fishing and hunting lodges and road maintenance crews.
|
4.2 |
Local Resources and Infrastructure |
Power (hydroelectric) and telephone lines to the mine sites link the Property area to the Saskatchewan power grid and telephone system. Abundant fresh water is available from the numerous lake and rivers in the area and is not a constraining factor for exploration operations. All infrastructure currently on the Property is semi-permanent. A surface lease is currently in good standing until 2023.
La Ronge, Saskatchewan is approximately 441 km south of the Property accessible by road and is the main source for groceries, fuel, materials and medical services. Additional resources not available in La Ronge may be sourced from the cities of Prince Albert and Saskatoon. An airfield owned by the Points North Group of Companies is located 24 km west northwest of the Raven camp and offers freighting services for exploration and mining activities in the eastern part of the Athabasca basin. They also offer shipment of products and services to Prince Albert and Saskatoon.
The Rabbit Lake mill facility, located on the adjacent Rabbit Lake property, is a fully functional uranium ore processing facility owned and operated by Cameco that is located adjacent to the Horseshoe Raven property four km northeast of the Horseshoe and Raven deposits. A second mill facility, the Jeb Mill, operated by Orano, is located 22 km to the northwest of the Horseshoe and Raven Deposits. As the Property is located adjacent to existing mines and infrastructure that have operated since the 1970s, there is sufficient skilled mining personnel, supply chains and services required to operate exploration and possible future mining operations on the Property.
Given the size of the Property, the QPs have no reason to believe that there would not be sufficient room for any future necessary surface infrastructure required to support potential mining operations with facilities for mine waste, processing and process waste management.
In Saskatchewan, surface rights are granted after the application for a mining surface lease, this process is transparent and is handled by the provincial government.
|
4.3 |
Climate |
The Property is located within the Athabasca sedimentary basin region, coincident with the Athabasca Plain ecoregion and Boreal Shield Ecozone. The climate is characterized by short and cool summers with a maximum temperature of 30 degrees Celsius, and cold and long winters with a temperature low of negative 40 degrees Celsius. During the summer solstice, the period of daylight lasts nearly 18.5 hours. Winter season can start in late October and continue until May.
Precipitation varies during the year, reaching an average of 40 centimeters annually and is characterized by snowfall in the winter months and moderate rainfall in the summer months. Maximum precipitation occurs during the summer months of July to September.
Exploration activities can be carried out year-round. However, it is generally accepted practice in the province to demobilize for spring break up and also for freeze up in the fall.
|
4.4 |
Physiography |
The Athabasca sedimentary basin region is characterized by variable uplands and low-lying terrain with many lakes and wetlands where peatlands and bogs are common. Vegetation is typical of the Boreal Forest, including areas dominated by black spruce forests and feather mosses. Within the forests, Jack pines commonly occur on thin-soiled uplands and tamaracks on poorly drained lowlands (Figure 4-1).
The Athabasca Plain ecoregion has developed on sedimentary rocks of the Athabasca Group. Bedrock rarely outcrops and is generally overlain by hummocky deposits of glacial till, glaciolacustrine and glaciofluvial sediments. The topography of the area is relatively flat, characterized by undulating glacial moraine, outwash and lacustrine plains. The elevation range of the Athabasca Plain is from 485 m to 640 m. Drumlins, eskers and meltwater channels have a typical local relief of 30 m to 60 m and contribute to the rolling expression of the terrain dominated by sandy glacial sediment.
Over 40 species of mammals are found in the ecozone and dominantly include caribou, moose, black bear, grey wolf, red fox, red squirrel, lynx, beaver, otter, snowshoe hare, marten, mink and shrew. The bird species common to the ecozone include the raven, grey jay, spruce grouse, chickadee, woodpecker, bald eagle, osprey and ptarmigan. Fish species common to the area include the lake trout, whitefish, northern pike, walleye, longnose sucker, white sucker, burbot and arctic grayling.
[The remainder of this page is intentionally left blank.]
Figure 4‑1: Typical Landscape in the Horseshoe-Raven Property Area
[The remainder of this page is intentionally left blank.]
|
5 |
HISTORY |
|
5.1 |
Property Ownership |
Attention for uranium exploration was first focused on the Athabasca Sandstone of Northern Saskatchewan in 1967, when New Continental Oil Limited (“NCOL”) flew an airborne radiometric survey over the basin. Five permits were optioned in the Wollaston Lake area from NCOL in 1968 by Gulf Oil Canada Limited (later Gulf) who began investigating anomalies by prospecting, mapping, geophysical reconnaissance surveys and diamond drilling. The initial uranium discovery was made in 1968 at Rabbit Lake. The Rabbit Lake discovery led to extensive exploration on the Gulf permits. From 1969 until 1980, several deposits, including the Collins A, Collins B, Collins D, Eagle North and Eagle South deposits were discovered on the adjacent Rabbit Lake property. Subsequent to that, the Property was discovered and, later, the West Bear Uranium Deposit was made on what is today the nearby West Bear property. Jones (1980) documented the events leading to the discovery of the Collins Bay deposits that are closely associated with the Collins Bay thrust fault (Rhys, 2002).
Eldorado Resources Limited (“Eldorado”) acquired Gulf in October 1982. Eldorado then merged with the SMDC in 1988 to form Cameco. Previously, the Hidden Bay property was part of the lands comprising the historic Rabbit Lake property. Cameco divided the Rabbit Lake property into two parts, one consisting of the current mining property covering all the leases and active mining operations, and the consisting of all lands outside the current active operations. The second part became known as the Hidden Bay property, which at that time included the current day Property. Cameco transferred the Hidden Bay properties to UEX through an agreement reached with Pioneer in 2001. Cameco retained 100% ownership of the Rabbit Lake property lands occupied by the current mining operation. Cameco continued to oversee exploration for UEX on the Hidden Bay property between 2002 and 2005 under an exploration management service agreement. In the fall of 2005, UEX took over full operatorship.
Following the transfer of land from Cameco in 2002, UEX has acquired and added new dispositions to the Hidden Bay property. UEX separated the Raven and Horseshoe area and the West Bear area into independent UEX properties known as the Horseshoe-Raven Property (circa Q1, 2017) and the West Bear Property (circa 2018). UEX was subsequently acquired by UEC on August 19, 2022.
|
5.2 |
Exploration and Development History |
Previous operators have employed a number of exploration techniques to explore the Property since the late 1960s (Table 5-1). Geophysical techniques and surveys include airborne time domain surveys EM, magnetics and radiometrics, while ground surveys have included VLF EM, horizontal loop (“HLEM”), larger loop EM in a number of configurations, DC Resistivity and gravity data collection. Soil and radon sampling have also been performed, including track etch cups and radon in-water surveys.
Due to its proximity to producing mines and the identification of several deposits, the Property has been subject to numerous exploration programs since discovery of the Rabbit Lake Deposit in 1968. A review of the details of all the programs conducted on the area of the Property would be too exhaustive to be relevant to this TRS so, instead, the methods employed, significant discoveries made and summary details of the different types of programs that were completed are outlined below. The reader is referred to compilation reports by Andrade (1983a, 1983b) and Studer (1984) for further details on work completed up until 1983 on the Property and references to earlier work. Reports by Studer and Gudjurgis (1985), Studer (1986, 1987 and 1989), Studer and Nimeck (1989), Ogryzlo (1984, 1985, 1987a, 1987b, 1988), Forand and Nimeck (1992), Forand, Nimeck and Wasyluik (1994), Forand (1995 and 1999), Powell (1996) and Foster et al (1997) document work programs conducted between 1983 and 1998 and provide references to further work also conducted during those years. No exploration was carried out on the Property between 1999 and 2002.
The Horseshoe-Raven deposit was discovered in two stages, four years after the discovery of the Rabbit Lake Mine. In the fall of 1972, drill testing of a ground conductor became the discovery hole for the Raven Deposit. Subsequent drilling through 1973 and 1974 outlined the deposit. During the final year of the Raven Deposit drilling, the discovery hole of the Horseshoe Deposit intersected ore grade mineralization to the east of the Raven Deposit while testing a geophysical anomaly similar to the Raven Deposit signature. Subsequent diamond drilling during the period of 1974 to mid-1975 succeeded in outlining the Horseshoe Deposit (Studer, 1984).
Table 5‑1: Historical Drilling by Other Companies on the Horseshoe-Raven Property
|
Type |
Meters* |
||||||||
|
Year |
Total |
DDH |
RC |
Sonic |
Total |
DDH |
RC |
Sonic |
Company |
|
1972 |
15 |
15 |
2,701 |
2,701 |
Gulf |
||||
|
1973 |
26 |
26 |
6,593 |
6,593 |
Gulf |
||||
|
1974 |
141 |
141 |
32,331 |
32,331 |
Gulf |
||||
|
1975 |
84 |
84 |
21,763 |
21,763 |
Gulf |
||||
|
1976 |
156 |
32 |
124 |
9,402 |
7,861 |
1,540 |
Gulf |
||
|
1977 |
11 |
11 |
2,159 |
2,159 |
Gulf |
||||
|
1978 |
39 |
3 |
36 |
1,233 |
655 |
578 |
Gulf |
||
|
1984 |
1 |
1 |
82 |
82 |
Eldorado |
||||
|
1985 |
7 |
7 |
542 |
542 |
Eldorado |
||||
|
Total |
480 |
320 |
160 |
76,805 |
74,687 |
2,118 |
|||
|
5.3 |
Early Uranium Exploration (1968 to 2002) |
The location and methods of exploration applied on the Property have varied with the differing geological target models, exploration priorities and the new technologies developed since discovery of the Rabbit Lake Deposit in 1968. Initial exploration programs in the area were based on the basement‐hosted Rabbit Lake Deposit model, which involved the search for the coincidence of gravity and magnetic lows associated with the large, intense alteration zone and associated faulting at that deposit. These programs employed a multiple parameter search methodology (Whitford, 1971), employing: (i) initial airborne gamma ray spectrometric, EM, gravity and magnetic surveys conducted in the late 1960s; (ii) ground geological and geophysical checks of the airborne radiometric anomalies; (iii) surface prospecting, scintillometer and geochemical reconnaissance surveys, including radon in-water surveys; and (iv) follow‐up overburden and diamond drilling. Most of the Hidden Bay property was subject to these methods during the initial years of exploration, particularly in areas of exposed basement rocks to the southeast, where the potential for basement‐hosted Rabbit Lake type deposits was deemed greatest. These methods were used extensively by Gulf up until 1976, when discoveries elsewhere in the Athabasca Basin, particularly the Key Lake Deposit, where the spatial association between a string of deposits developed at the intersection between the sub‐Athabasca unconformity with graphitic gneiss‐hosted faults were recognized. The recognition of the probable genetic role of graphitic gneiss and associated faults in deposit localization shifted the emphasis to the use of ground-based EM surveys, such as HLEM, as the principal first pass geophysical survey in target areas. These EM surveys were used to detect conductive graphitic lithologies beneath overburden and the Athabasca sandstone. EM surveys still form the principal geophysical exploration tool, although the technologies currently used differ from the initial programs (e.g., fixed and moving loop) and have led to the targeting of many programs that have ultimately resulted in many new discoveries in the region during follow‐up drilling of anomalies.
Principal target areas for diamond drilling in the areas on and surrounding the Property targeted systematic drilling of major faults with known associated mineralization, including the Rabbit Lake, Telephone, Seal and Wolf Lake Faults, and concentrated areas of drilling in geologically and geochemically prospective areas (e.g., Vixen Lake‐Dragon Lake). Most diamond drilling campaigns have been initially targeted based on ground geophysical surveys and follow‐up to reverse circulation drilling anomalies. Reverse circulation drilling in 646 drillholes (9,062 m total) was conducted in several programs completed principally between 1976 and 1982 as a grid‐based testing of overburden and sandstone covering portions of central and northern parts of the Property. These programs aided in the definition of the location and depth of the Athabasca unconformity and allowed evaluation of geological and geochemical environments and located uranium anomalies in overburden and bedrock (Rhys, 2002).
|
5.4 |
Historical Mineral Resource Estimates |
A previous mineral resource estimate was published in January 2023 with an effective date of October 31, 2022. The mineral estimate previously reported was 4,982,500 tonnes grading 0.215% U3O8 for 23,594,000 Lb U3O8 Indicated in the Horseshoe Deposit and 5,370,000 tonnes grading 0.117% U3O8 for 13,832,400 Lb U3O8 as referenced in Table 5‑2.
Table 5‑2: 2022 Resource Estimate
|
Horseshoe Deposit Uranium Resource* |
||||
|
Deposit |
Category |
Quantity (Tonnes) |
Average Grade U3O8 (%) |
Total lb. U3O8 |
|
Horseshoe |
Indicated |
4,982,500 |
0.215 |
23,594,000 |
|
Raven Deposit Uranium Resources* |
||||
|
Deposit |
Category |
Quantity (Tonnes) |
Average Grade U3O8 (%) |
Total lb. U3O8 |
|
Raven |
Indicated |
5,370,000 |
0.117 |
13,832,400 |
*Mineral resources are not mineral reserves and have not demonstrated economic viability. There is no certainty that all or any part of the mineral resource will be converted into mineral reserves. All figures are rounded to reflect the relative accuracy of the estimates. Resources were estimated using a COG of 0.05% U3O8
. UEX completed previous mineral resources estimates for the Property under the Canadian National Instrument 43-101 in 2009, 2011 and 2021.
|
5.5 |
Historical Production |
There has been no production completed on this Property to date.
[The remainder of this page is intentionally left blank.]
|
6. |
GEOLOGICAL SETTING AND MINERALIZATION |
|
6.1 |
Regional Geology |
The Property is just east of the eastern margin of the Athabasca Basin. It is underlain by Paleoproterozoic metasedimentary gneiss and Archean granitic gneiss basement rocks of the Hearne Province (Figure 6‑1).
The basement rocks of the Property (Figure 6‑2) are within the Cree Lake zone of the Early Proterozoic Trans-Hudson orogenic belt. The Cree Lake zone is composed of Archean gneiss and overlying Early Proterozoic or Archean supracrustal rocks (Bickford et al., 1994), both of which are affected by amphibolite to locally, granulite facies metamorphism. The Cree Lake zone is further subdivided into three transitional lithotectonic domains, of which the Property lies within the Wollaston Domain. The central belt, the Mudjatik domain, is composed primarily of Archean granitic gneiss, often as domal bodies, which are separated by discontinuous zones of migmatitic, pelitic gneiss and mafic granulite (Lewry and Sibbald, 1980; Sibbald, 1983). The Wollaston Domain to the east is composed of a basal sequence of biotite-quartz-feldspar +/- graphite pelitic gneiss, which overlies domes of Archean granitoid gneiss in the Mudjatik domain and which is contiguous with pelitic gneiss sequences in the Mudjatik Domain (Wallis, 1971). The basal pelitic gneiss is structurally overlain successively by:
|
i. |
massive to weakly foliated meta-arkose, and |
|
ii. |
quartzite with interlayered amphibolite and calcareous meta-arkose (Wallis, 1971; Sibbald, 1983). |
The age of the Wollaston Group is poorly constrained. Zircons from various paragneiss units that yield ages between 2550-2700 Ma establish a maximum age of the group, but these dates may represent detrital zircons derived from an older source (Annesley et al., 1996). A minimum age is given by 1840-1850 Ma granitic sills and bodies that intrude the sequence (Figure 6‑1, Figure 6‑2, Figure 6‑3, Figure 6‑4, & Figure 6‑5).
[The remainder of this page is intentionally left blank.]
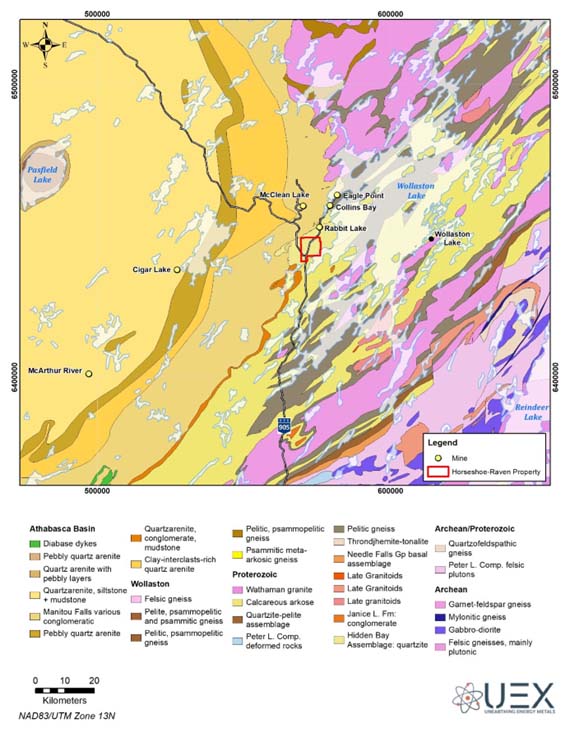
Figure 6‑1: Regional Geology Setting
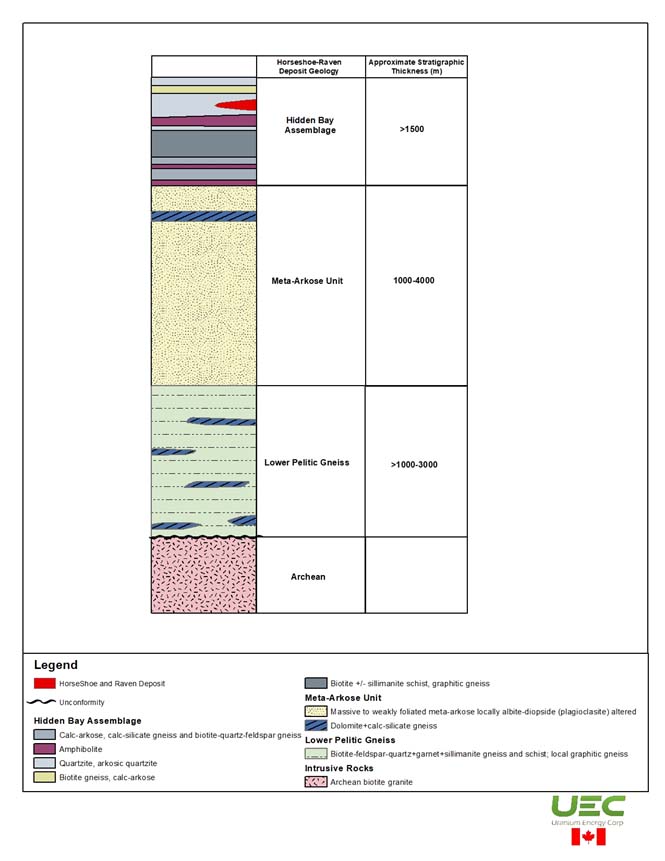
Figure 6‑2: Horseshoe-Raven Local Area Stratigraphy
At least two major phases of syn-metamorphic deformation affect rocks in the Wollaston and Mudjatik domains. Early, layer-parallel gneissosity (S1) is widespread and is the first recognizable structural fabric in the area (Wallis, 1971). However, no associated major folds have been identified with this event (Sibbald, 1983). This early fabric is overprinted and transposed by northeast-trending penetrative foliation (S2) that is axial planar to upright, tight folds having variably northeast and southwest plunging axes (Wallis, 1971).
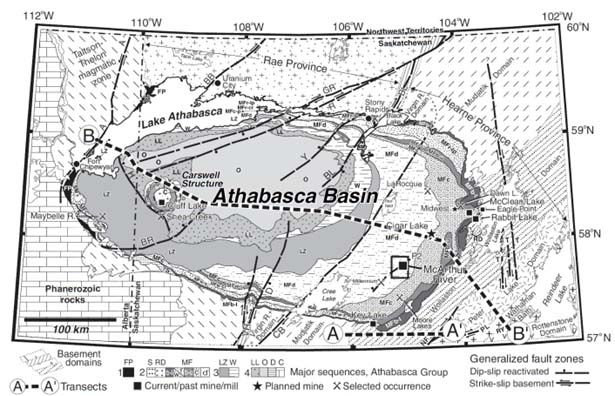
Figure 6‑3: Geological Sketch Map of the Athabasca Basin. The eastern Athabasca Basin is defined as that part of the basin east of the Snowbird tectonic zone and is shown in reference to the major basement domains and stratigraphy of the Athabasca Basin, after Card et al. 2007, Portella and Annesley (2000), Ramaekers et al. (2007) and Thomas et al. (2002).
The Mudjatik and Wollaston domains are affected by amphibolite to locally granulite facies metamorphism (M1) that accompanied D1 deformation, defining the main thermotectonic pulse of the Hudsonian orogeny. U-Pb zircon and monazite age dating indicates Hudsonian peak metamorphism occurred between approximately 1830-1800 Ma in the Wollaston and Mudjatik domains (Annesley et al., 1996). It was accompanied by the intrusion of grey, commonly porphyritic granite sills and by subsequent anatectic K-feldspar-quartz-biotite pegmatite sills (Annesley et al., 1996). A second metamorphic pulse may have accompanied D2 deformation between 1775-1795 Ma.
To the west of the Property, the folded Archean to Early Proterozoic metamorphic sequence is unconformably overlain by flat-lying to gently inclined quartz-rich sandstone of the Athabasca Group. U-Pb dates of authigenic apatite cement and Rb-Sr dating of the paleoweathered zone at the base of the sandstone suggest a depositional age of between 1600-1700 Ma (Cumming et al., 1987).
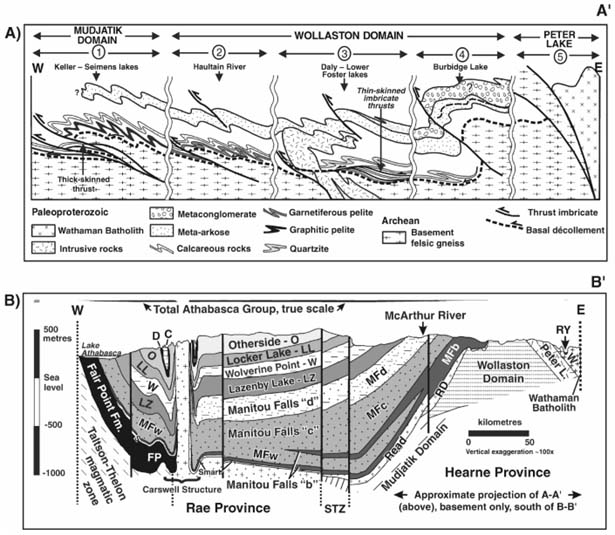
Figure 6‑4: A) Idealized cross-section through the eastern Cree Lake zone, suggesting the possible structural relationship between Archean basement and Paleoproterozoic metasedimentary cover during the early stages of Hudsonian deformation (after Tran, 2001); B) Geological cross-section through the Athabasca Basin (after Ramaekers, 1990; Ramaekers et al. 2007). For location see Figure 6-3.
Two dominant, post-metamorphic fault orientations occur in the region (Wallis, 1971). Concordant northeast-trending, semi-brittle and brittle reverse faults occur throughout the region. North-south trending, sinistral strike slip faults which represent western splays and parallel structures of the major Tabbernor fault system are also common.
|
6.2 |
Geology of the Horseshoe-Raven Property: Distribution of Lithologies |
Lithologies and foliation of the Wollaston Domain rocks of the Property trend northeast with predominantly moderate to steep southeast dips, although northwest dips occur as the result of the broad synform that is the host to uranium mineralization at the Property.
|
6.3 |
Pre-Athabasca Lithologies on the Hidden Bay Property: Wollaston Group |
A consistent sequence of gneiss and schist is developed in the Wollaston Group outward from granitic domes in the region. Primary sedimentary structures have generally been obliterated by regional metamorphism, but rare compositional grading of graphite and biotite-garnet rich lamina that may represent relict graded bedding face away from the Collins Bay Dome and suggest that the sequence is upright (Rhys, 2002).
|
6.3.1 |
Lower Pelitic Gneiss |
Lowermost lithologies of the Wollaston Group in the Property area comprise metapelitic gneiss and interlayered meta-arkose that surround, and directly overlie, the Collins Bay and McClean Lake domes (Sibbald, 1983). It is composed of biotite-quartz-feldspar +/- garnet +/- cordierite +/- graphite +/- sillimanite metapelitic gneiss and schist, with subordinate bands of graphite schist and calc-silicate units. Interlayers of fine- to medium-grained, weakly foliated biotite meta-arkose are often abundant. The lower pelitic sequence is variable in thickness; its apparent thickness in the area of the Property is greater than one km, and in some areas greater than three km, although structural repetition due to internal folding may significantly accentuate that thickness. Although it may occur throughout the sequence, graphite gneiss is particularly abundant in lower parts of the unit, particularly in its basal 50 m, where gneiss containing >5% disseminated fine-grained, and foliated graphite is common. Discontinuous calcsilicate and carbonate units occur throughout the pelitic gneiss unit.
|
6.3.2 |
Meta-Arkose Unit |
Massive to weakly foliated biotite-quartz-feldspar meta-arkose and calcareous meta-arkose overlies and interfingers with the lower pelitic unit of the Wollaston Group (Sibbald, 1983). Thickness of the unit varies along strike; it has an apparent thickness of one to four km in the area of the Property. The meta-arkose unit forms a northeast-trending aeromagnetic high due to the presence of disseminated magnetite and pyrrhotite.
Meta-arkose consists of granoblastic intergrowths of medium- to fine-grained plagioclase, microcline, quartz, biotite and hornblende. Diopside, hornblende and calcite/dolomite are abundant in compositional layers locally, and disseminated pyrite, magnetite, pyrrhotite and locally chalcopyrite are common accessory minerals. Alignment of biotite defines foliation. The unit is commonly homogenous and lacks well-developed gneissosity, although gross compositional layering is common.
Meta-arkose is frequently replaced by pervasive pale green to pale pink or white albitepyroxene-amphibole-quartz alteration, previously termed “plagioclasite” (Sibbald, 1983; Appleyard, 1984). Large areas of stratabound to locally discordant, massive albite-rich lithologies occur in meta-arkose north of the Rabbit Lake fault near the Rabbit Lake pit and to the northeast and southwest for up to several kilometers. This alteration style is often manifested in biotite meta-arkose as a series of coalescing, to pervasive irregular, anastomosing replacement veinlets and stringers of albite that are cored by diopside and hornblende (Appleyard, 1984). The veinlets coalesce to form massive domains of polygonal, granoblastic medium-grained albite with coarse disseminated grains and local stringers of diopside. The plagioclasite may have formed due to metasomatic interaction of meta-arkose units with adjacent carbonate and possible evaporite units to the south during peak metamorphism (Appleyard, 1984). Plagioclasite units show a spatial relationship to some uranium deposits (e.g. Rabbit Lake), but this may be an indirect relationship since the mineralization may instead be preferentially localized in calc-silicate and carbonate units to which the plagioclasite is spatially related.
|
6.3.3 |
Carbonate and Calc-Silicate Units at the top of the Meta-Arkose Sequence |
At the top of the meta-arkose sequence to the north of the Property at the Rabbit Lake deposit, and for several kilometers east and west along strike, impure dolomitic marble forms a continuous 20 to 180 m thick unit near the top of the meta-arkose sequence. The marble is pale grey to white or pink in color, and commonly contains disseminated, or compositional layers of pyroxene, amphibole, serpentine, scapolite and graphite. Above the marble unit, several hundred meters of interlayered meta-arkose and calc-silicate cap the meta-arkose unit in the Rabbit Lake pit area and form a transition from the meta-arkose sequence to the overlying Hidden Bay assemblage. Dolomitic marble with associated calc-silicates is also present in the Property area in the same stratigraphic position as at Rabbit Lake (Wallis, 1971).
|
6.3.4 |
Hidden Bay Assemblage |
The Hidden Bay Assemblage (Wallis, 1971; quartzite-amphibolite unit of Sibbald, 1983) is the host rocks for the Horseshoe and Raven Deposits and forms the uppermost portions of the Wollaston Group. The unit is characterized by sillimanite quartzite, calcareous meta-arkose/quartzite and amphibolite, with interlayered pelitic gneiss near its base. It occurs south of the Rabbit Lake deposit and is probably >1.5 km in true thickness (Sibbald, 1983). The Hidden Bay Assemblage in the study area is composed of, from bottom to top (Sibbald, 1983; Wallis, 1971): (i) a basal member of interlayered meta-arkose and pyroxene-amphibole-biotite +/- dolomite +/- scapolite calc-silicate, several hundred meters thick, the “hanging wall gneiss” of the Rabbit Lake pit (Hoeve and Sibbald, 1978), (ii) biotite-quartz-feldspar gneiss, in part graphitic, with interleaved biotite-sillimanite gneiss that is approximately 500 m thick, and (iii) approximately one km or more of sillimanite-biotite-feldspar bearing massive, fine- to medium-grained quartzite interlayered with amphibolite that is up to several hundred meters thick near the base of the quartzite unit and with pale green, laminated, diopside-bearing calcareous meta-arkose higher in the sequence (Figure 6‑5).
|
6.3.5 |
Granitic Rocks and Other Igneous Lithologies in the Region |
Igneous rocks in the region include possible Archean domes and several generations of granite and pegmatite sills, dykes and stocks that intrude the Wollaston Group.
|
6.3.6 |
The Collins Bay and McClean Lake Domes: Possible Archean Basement |
North of the Property, the McClean Lake and Collins Bay domes mark the transition from the Wollaston to the Mudjatik domains. They are composed of massive, grey biotite granite to tonalite that is medium- to fine-grained and generally equigranular. K-feldspar and/or irregularly shaped to round, ragged quartz phenocrysts are locally present. 10-15% fine-grained biotite flakes and approximately 20-25% quartz are ubiquitous. The intrusions may be foliated within 10 to 50 m of their contacts, with foliation defined by the alignment of biotite grains. Garnet is a local constituent, and sillimanite-rich patches and blebs are common near contacts. Regional aeromagnetic maps indicate spatial variations in the magnetic signature of the Collins Bay Dome that suggest the presence of more than one intrusive phase. The core of the dome forms a broad positive magnetic anomaly while parts of its margins are magnetically indistinguishable from the surrounding gneiss sequence. Annesley et al. (1995, 1996) report Archean U-Pb zircon ages for tonalitic gneiss on the margins of the McClean Lake dome.
|
6.3.7 |
Granite Sills and Dykes in the Wollaston Group |
Sills of equigranular, medium-grained grey to white biotite granite occur throughout the Wollaston Group. They commonly form leucosomes and sills less than 10 m thick in pelitic gneiss, but they may obtain a thickness of more than 100 m. K-feldspar and pink to red garnet locally occur as phenocrysts. Samples collected from several granite sills in the area have yielded U-Pb zircon dates ranging between 1804-1815 Ma (T. Krogh in Annesley et al., 1995).
|
6.3.8 |
Granitic Gneiss in Quartzite of Hidden Bay Assemblage |
South of the Horseshoe and Raven deposits, several sill-like bodies of biotite-bearing granitic or quartz monzonite gneiss that are up to several hundred meters thick occur in quartzite. These bodies have been dated at 2620 +/- 9 Ma by U-Pb zircon methods (Annesley and Madore, 1991). Their Archean age has prompted Annesley and Madore (1991) and Hubregtse and Duncan (1991) to interpret these lithologies as an Archean granite that forms the basement to the Wollaston Group. However, these bodies occur in the Hidden Bay Assemblage, the highest inferred stratigraphic level of the Wollaston Group, and would thus require both reinterpretation and revision of the entire Wollaston Group stratigraphy and the presence of complex tectonic interleaving. Alternatively, (i) the granite gneiss may represent a recrystallized metasedimentary unit (Wallis, 1971) and thus the age may be from detrital zircons, (ii) the zircons may represent xenocrysts in a younger intrusion, or (iii) the granite bodies may intrude the Wollaston Group, and if so, provide a minimum Archean age for the group.
[The remainder of this page is intentionally left blank.]
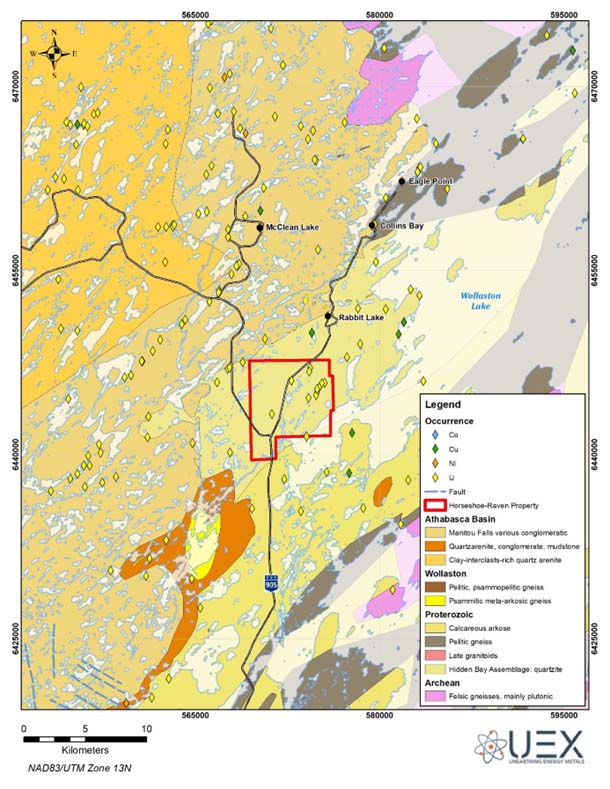
Figure 6‑5: Horseshoe-Raven Property Local Geology
|
6.3.9 |
Pegmatite Sills and Dykes |
Coarse-grained K-feldspar-quartz-biotite +/- tourmaline (schorl) +/- garnet pegmatite sills and dykes are common throughout the Wollaston group, especially in the lower portions of the sequence. Sills are typically 0.3 m to 20 m wide. The largest pegmatite body recognized to date in the area is 200 m thick and several hundred meters long; it occurs in lowermost parts of the Wollaston Group at the Eagle Point mine (Rhys, 1999), where it is host to much of the mineralization. At least four generations of pegmatite occur in the region, ranging from pre- and syn-metamorphic, syn-D2 sills, to less abundant late dykes. Pegmatite bodies in the area are locally radioactive and often contain minor quantities of U and Th-bearing minerals.
|
6.3.10 |
Post-Metamorphic Sediments: Athabasca Sandstone |
West and north of the Property is the quartz sandstone and conglomerate of the Athabasca Group that unconformably overlies the metamorphosed basement rocks and, except where disrupted by faulting effects, dips gently to the west as the basin thickens. The eastern boundary of the basin is erosional but is in part influenced by post-Athabasca faulting. Several outliers occur in the Hidden Bay property area (Ramaekers, 1983). U-Pb dates of 1650-1700 Ma obtained from apatite cement in the Athabasca Group by Cumming and Krstic (1992) provide a minimum age for the inception of sedimentation in the Athabasca Basin.
The Athabasca Group is composed mainly of orthoquartzite with a clay-rich matrix and a variable hematite content. Beds of quartz clast conglomerate occur frequently. Four marine transgressive sequences, overlying one thick fluvial regressive wedge (Manitou Falls Formation) are recognized in the Athabasca Group (Ramaekers, 1983). Diagenetic effects include quartz overgrowths on and minor pressure solution of the detrital quartz grains (Ramaekers ,1976). Some clay may be detrital, but clay minerals have replaced framework grains of biotite and feldspar. Diagenetic interstitial clays are usually composed of a mixture of dickite, illite and kaolinite (Hoeve and Quirt, 1985). Purple hematite impregnates the matrix through much of the sequence, often forming bands, and red and purple leisegang rings.
|
6.3.11 |
Paleoweathering/Saprolite at the Top of the Basement Rocks |
Widespread argillic alteration occurs in basement metamorphic rocks beneath the Athabasca sandstone that lies to the east and north of the Property. Thickness is variable, but typically ranges from 10 m to 40 m. This is limited at the Property, as the paleo-unconformity has been eroded and only the lower parts of the paleoweathering profile can be intermittently observed. The alteration is similar in geochemistry, mineralogy and zoning to that observed today in lateritic profiles, and consequently, has been commonly interpreted as a saprolitic (paleoweathering) profile related to pre-Athabasca erosion of the gneiss sequence (e.g. Hoeve and Sibbald, 1978). Alternatively, it could be related to the reaction of oxidized diagenetic fluids in the Athabasca sandstone with underlying basement rocks, or a superposition of both processes (D. Rhys et al., 2008). This sub-Athabasca alteration zone is referred to as “paleoweathering alteration” here, even though a post-Athabasca timing is possible. Argillic alteration associated with uranium mineralization is superimposed on this alteration.
The “paleoweathering” alteration often displays a vertical zonation in mineralogy and texture. At the top of the alteration profile, in basement rocks immediately beneath the unconformity, a white zone of intense kaolinite alteration is commonly developed within zero to five metres below the unconformity, followed downward by a hematitic, oxidized red zone, containing kaolinite +/- illite, which in turn gradationally overlies a reduced green zone containing illite and Fe-Mg trichlorite, which then grades into fresh rock at depth (Quirt, 1990). Graphite is often completely to partially depleted in the oxidized, generally kaolinite-bearing red zone, and metamorphic minerals are clay altered with chlorite, illite and kaolinite.
|
6.4 |
Structural Setting of the Horseshoe-Raven Property |
|
6.4.1 |
Penetrative Deformation and Folding |
Rocks on the Property are affected by at least two significant phases of Hudsonian penetrative deformation (D1 and D2) that are manifested as widespread penetrative tectonic fabrics. No strain asymmetry (i.e. rotational shear strain) can be determined from drill core or outcrop observations of D1 or D2 planar and linear fabrics that would indicate the presence of syn-Hudsonian shear zones in the Property area. Younger features include at one or more generations of phase of open folds (D3, D4?) and semi-brittle to brittle faults.
|
6.4.2 |
D1 Deformation |
The earliest recognizable deformation is manifested by ubiquitous gneissic compositional layering (S1) and a parallel shape fabric defined by alignment of peak metamorphic minerals (Wallis, 1971; Sibbald, 1983). S1 foliation strikes northeast with moderate southeast dips, and is parallel to, and in part defined by lithologies including compositional layers and granitic leucosomes. S1 is defined by unstrained peak metamorphic minerals but is also overgrown by porphyroblasts of garnet and cordierite, which contain inclusion trails aligned parallel to S1 (Wallis, 1971; Rhys, 1998). These relationships suggest that M1 peak metamorphism was synchronous with, but outlasted, D1 deformation and the formation of S1 foliation (Wallis, 1971). No major folds associated with the S1 foliation were positively identified in the study area. However, tight to isoclinal minor F1 folds are common in the drill core, suggesting the presence of larger F1 folds to which these are parasitic.
|
6.4.3 |
D2 Deformation |
D2 deformation is manifested by megascopic and minor folds (F2 folds), which have significantly influenced the map patterns of lithologies in the area, and by the development of S2 foliation, which is axial planar to F2 folds of S1/gneissosity and lithologies. S2 is inhomogenously developed and varies from an intense foliation that overprints and transposes S1 to a spaced cleavage that is only developed in the hinge zones of F2 folds. Where it is intense, S2 transposes S1 and consequently the two foliations are locally coplanar and indistinguishable. In some units, S2 also forms a spaced crenulation cleavage that is defined by re-oriented domains of S1 and by the alignment of new unstrained metamorphic minerals. S2 commonly wraps around garnet, cordierite, amphibole and pyroxene porphyroblasts and biotite and sillimanite porphyroblasts are commonly crenulated by minor F2 folds. These relationships indicate that D2 occurred after the earliest recognizable amphibolite grade (M1) metamorphic peak that accompanied the formation of S1. The presence of biotite porphyroblasts aligned parallel to S2 locally occurring in pressure shadows adjacent to garnet, cordierite, pyroxene and pyrite porphyroblasts and in D2 fold hinges, overgrowing earlier metamorphic assemblages and S1, suggests that a pulse of probable amphibolite-grade metamorphism (M2) accompanied D2. A mineral lineation (L2) may be developed at the intersection of S1 and S2, defined by the alignment of long axes of amphiboles, biotite, elliptical cordierite porphyroblasts and sillimanite bundles. It is often parallel to F2 fold axes (Rhys, 2002).
D2 fabrics and folds are developed inhomogeneously in both intensity and orientation. Near Wollaston Lake, minor F2 folds have subvertical to steep east-dipping dipping axial planes and fold axes generally plunge to the northeast. To the southwest, in the vicinity of the Horseshoe-Raven deposit, F2 axial planes and local S2 axial planar cleavage are generally shallower, and generally dip moderately to the east. This latter area is dominated by a series of inclined to overturned megascopic folds with southeasterly dipping axial planes that have wavelengths of 0.3-2 km and shallow northeast plunging fold axes that form the major map patterns in the Hidden Bay Assemblage. At a regional scale, D2 folds are noncylindrical, exhibit domal outlines and fold axes that have variable northeast and southwest plunges. Elliptical D2 folds are in part localized around granite domes, but variable fold axis plunges also occur in other areas. The parallelism of L2 elongation lineation with D2 fold axes suggests that significant stretching was accomplished parallel to the fold axes during folding, suggesting that the D2 folds may represent sheath-type folds (Rhys, 2002).
|
6.5 |
Mineralization |
Uranium mineralization in the Athabasca Basin is generally of Helikian age. Geochronological studies have determined that most deposits were formed in a restricted time interval between 1330-1380 Ma (Cumming and Krstic, 1992), and as early as 1590 Ma at the Millennium Deposit and 1521 Ma at the McArthur River Mine with ages of remobilization near 1350 Ma. The deposits generally occur at the unconformity between the lowermost Athabasca Group and the underlying crystalline basement rocks. They are commonly localized to the intersection of faults and the unconformity, or at a paleotopographic basement ridge.
Two major types of unconformity-related uranium orebody types have been identified in the Athabasca Basin. The first is polymetallic mineralization (uranium + Ni, Co, Cu, Mo, Zn, Pb, and As) mainly within the Athabasca Group sandstones, at the unconformity and locally upwards along steeply dipping faults (“perched mineralization”). Deposits of this type are associated with a paleotopographic ridge of basement rocks, often controlled by strike-slip faults (Cigar Lake Mine, Midwest Deposit). The second major type is a monomineralic mineralization (uranium oxides) structurally controlled by reverse faults affecting sandstone and basement (McArthur River Mine, Sue C Deposits).
Deposits within the Athabasca Basin are typically surrounded by alteration haloes that in the sandstones is dominated by silicification, hematization, precipitation of drusy quartz and argillization (illitization and chloritization) with massive quartz dissolution and intense fracturing; and in the basement, hydrothermal alteration consisting of illitization, chloritization and the development of dravite, which is superimposed upon and commonly obliterates the previous retrograde and regolithic alterations.
Post-Athabasca tectonic events have resulted in structural disruptions in the Athabasca Group and the Wollaston Group stratigraphy. These events are accompanied by hydrothermal alteration and associated uranium mineralization in both the Athabasca sandstone and basement. Primary targets for uranium mineralization are faulted graphitic zones in the metasedimentary basement that have been subjected to post-Athabasca reactivation, as well as in structurally disrupted sandstone and along the unconformity. Structural reactivation allowed for channeling of significant volumes of oxidized uraniferous fluids through a reduced environment, especially along, and proximal to packages of graphitic pelitic rocks. This allowed for the deposition of uranium at an oxidization-reduction front. Within the Property area, these post-Athabasca events have a north-east, north and north-west trend (Rhys, 2002).
|
6.6 |
Local Geology of the Horseshoe and Raven Deposits |
|
6.6.1 |
Host Lithologies to the Horseshoe and Raven Deposits |
The Horseshoe and Raven Deposits are hosted by the Hidden Bay Assemblage, which occurs within a complex northeast trending D2 synclinorium that sits structurally above and south of the underlying meta-arkose unit of the Daly River subgroup. The synclinorium is cored by quartzite that is succeeded outward concentrically from the core of the folds by other components of the Hidden Bay Assemblage, which include a mixed sequence of calc-arkose, additional quartzite, locally graphitic sillimanite-bearing pelitic schist and amphibolite (Figure 6‑5). While no Athabasca Sandstone is present above the Horseshoe and Raven Deposits since it has been eroded from the local area, sandstone outliers that occur to the southeast of the deposits and the local presence of paleoweathering in some drillholes south of the deposit area suggest that the sub-Athabasca unconformity was present just above the current surface.
|
6.6.2 |
Structural Setting - Metamorphic Structural Architecture |
Lithologies in the Horseshoe and Raven areas outline several significant, upright open D2 (F2) folds in the local area (Figure 6‑5). These folds have steep to moderate, southeasterly dipping axial planes and horizontal to shallow northeast plunging fold axes. A D2 timing is indicated since the folds affect both primary lithologic layering as well as lithology parallel S1 penetrative foliation. A spaced, vertical to southeast dipping S2 foliation is axial planar to the folds and locally crenulates older S1 foliation. No older, D1 folds were identified and, if they are present, they are similarly to be isoclinal and difficult to recognize but could have caused lateral and vertical thickness variations in host lithologies.
Principal folds in the immediate deposit areas include the Horseshoe anticline and adjacent Raven syncline. The Horseshoe anticline is cored by amphibolites south of the Raven Deposit and plunges to the northeast, where arkosic quartzite occurs in the hinge area in the Horseshoe Deposit (Figure 6‑5). Similarly, to other D2 folds in the area, this fold is non-cylindrical and varies in plunge, shallowing to the northeast, where it plunges very shallowly to sub horizontally to the northeast in the Horseshoe Deposit area. The adjacent Raven syncline, with its axial trace 250 m to 550 m northwest of the Horseshoe anticline, has a nearly horizontal fold axis and is cored along its length by arkosic quartzite forming the top of the local metamorphic stratigraphy. Uranium mineralization in both the Horseshoe and Raven Deposits is elongate parallel to the trend and plunge of these folds and at Raven preferentially exploits the core of the syncline, while at Horseshoe, mineralization extends between these two folds obliquely crossing the folded sequence.
Few significant offsets of lithologies occur in the Horseshoe and Raven Deposit areas and outside of clay alteration zones associated with uranium mineralization, lithologies are competent and generally lack any significant faulting.
|
6.6.3 |
Mineralization |
Based upon the recommendations of the authors of the 2009 Report, the Horseshoe and Raven deposits were wireframed using a cut-off of 0.02% U3O8. The new wireframe shells encompass all of the subzones that were originally utilized for the 2009 Report for both the Horseshoe and Raven deposits. Using a lower cut off for the wireframe has resulted in the subzones being contained within the newly modeled ore shell. The mineralization at the Horseshoe Deposit has been defined over a strike length of approximately 800 m and occurs at depths between 100 m to 450 m below surface. Mineralization occurs in several stacked and shallow plunging shoots that generally follow the fold axis of a gently folded arkose-quartzite package. Uranium mineralization is often best developed along the zones of dilation developed along bedding.
The Raven Deposit has been defined since 2005, by drilling for and by UEX, over a strike length of approximately 1000 m. Mineralization is developed mainly at consistent depths of between 100 m and 300 m below surface. The uranium mineralization is an elongate and east-northeast trending zone. Minor zones may extend upward to within a few tens of metres of surface, but these are not consistently present along the length of the deposit as it is currently defined by drilling. Mineralization is localized along the trace of the Raven syncline, particularly along the southeastern limb of the fold, and is developed extending downward from the base of the folded calc-arkose unit into the underlying quartzite and arkosic quartzite with no significant plunge.
Similar to Horseshoe, mineralization at Raven occurs in hematitic altered areas, which surround a steep to moderate southeast dipping zone of clay alteration, which obliquely crosses the southeastern, dominantly shallow northwest dipping limb of the Raven syncline. The structural position of the mineralization is consequently the same as Horseshoe with respect to the folded metamorphic stratigraphy. The clay alteration zone also shallows in dip to the east through the deposit, although it does not attain the shallow dips of the eastern Horseshoe clay alteration zone. It may also be controlled by pre- or syn-alteration/mineralization faulting, as evidenced by clay gouge seams up dip from the projection of the principal clay zone. Potential for offset lithologies across the clay zone at Raven is not as pronounced as it is at Horseshoe, with lithologic contacts often showing little or no significant deflection across the trace of the clay zone.
Uranium mineralization in the Horseshoe and Raven Deposits occurs along an east-northeast trending zone of illite-Mg-chlorite clay alteration that is developed over at least 2.5 km strike length extending along the southeast flank of the Raven syncline. Mineralization in each deposit surrounds, or is developed along, the generally southeast dipping clay alteration zone in multiple, generally shallow dipping lenses of disseminated and vein-like pitchblende-uranophane-boltwoodite mineralization that is associated with red-brown hematite alteration.
The two deposits are separated by approximately 0.5 km, laterally between which clay alteration is continuous and often intense, but in which widely-spaced historical holes have intersected only anomalous radioactivity.
|
6.7 |
Athabasca Uranium Deposits |
The Property is within the eastern Athabasca uranium district, one of the most prolific uranium producing districts in the world. UEX’s Raven and Horseshoe Deposits are situated on the Property that is adjacent to the Hidden Bay property. There are a number of deposits in the area surrounding the Property. UEX’s West Bear property to the south hosts both the West Bear Uranium Deposit and the West Bear Cobalt-Nickel Deposit. There are five past or currently producing mines to the north of the Property on the adjacent Rabbit Lake property (Rabbit Lake, A-zone, B-zone, D-zone, and Eagle Point). North of the adjacent Hidden Bay property are the Sue and JEB deposits on the McClean Lake property (Jefferson et al., 2007). Production is on hiatus at the Rabbit Lake property, and has ceased at the McClean Lake operation, with the mill currently processing ore from the Cigar Lake Operation.
These deposits named above collectively comprise different varieties of the unconformity associated uranium deposit type described by Jefferson et al. (2007), Ruzicka (1996) and previous workers. All are spatially related to the sub-Athabasca unconformity in the region, and are generally interpreted to result from interaction of oxidized diagenetic-hydrothermal fluids with either reduced basement rocks as is the case at the Property, and/or with reduced hydrothermal fluids along faults extending upward toward the unconformity in underlying basement rocks beneath the unconformity (e.g. Hoeve and Quirt, 1985). The common occurrence of uranium mineralization in the area, and associated alteration that overprints the regional signature of the Athabasca sandstone, indicates a post-Athabasca (<1,700 Ma) timing for uranium mineralization in the region. U-Pb age dates obtained from uraninite mineralization in deposits throughout the Athabasca Basin support a principal phase of mineralization between 1,600-1,500 Ma with a potential second event between 1,460-1,350 Ma and potential later periods of reworking indicated by younger ages (Fayek et al., 2002; Alexandre et al., 2003; Cumming and Krstic, 1992).
Uranium deposits in the area form three different, although commonly spatially related, types of unconformity type uranium deposits (Figure 6‑6).
|
6.7.1 |
Sandstone-Hosted Deposits |
Sandstone-hosted deposits developed at, or just above, the Athabasca unconformity in Athabasca sandstone along the trace of north-east trending faults. These deposits occur in sandstone in the footwall wedge to graphite-bearing graphitic gneiss overthrust on Athabasca sandstone (e.g. Collins Bay A, B and D-zones), or in gradational drops/humps in the unconformity above graphite-rich lithologies and faults (e.g. Sue A/B West Bear, McClean Lake). They are generally associated with non-calcareous graphitic and biotite gneiss. Mineralization occurs in pods and disseminations in intense hematite-clay-chlorite alteration, locally overprinting spatially associated breccias and zones of intense clay alteration that sit directly above mineralization in sandstone. Common structural sites include bends and steps in fault systems, or five to 20 m humps in the unconformity that may reflect the interaction of graphitic shear zones with faults of different orientations. These deposits are sometimes called complex deposits due to the poly-minerallic nature of the ore (i.e. U +/- Ni, Co, As, Pb) and are characterized by assemblages of Ni and Ni-Co arsenides and sulpharsenides that accompany uranium mineralization.
|
6.7.2 |
Basement-Hosted Deposits |
Basement-hosted deposits within or surrounding fault zones in predominantly non-calcareous gneiss. These deposits are exemplified by Eagle Point and Sue C/CQ, which are composed of veins, disseminations and pods that link or replace faults in or near graphitic bearing gneiss. Veins frequently occur in extensional fractures that may link individual faults (Sue CQ, Telephone zone), or occur in en-echelon steps in faults (Eagle Point). Unlike unconformity deposits described above, these deposits typically lack arsenide and sulpharsenide minerals in mineralized zones. Mineralization is composed of discrete pitchblende veins, planar replacements of fine-grained nodular pitchblende + clays, or undulating pitchblende/uraninite-bearing redox fronts surrounding clay veins and faults. A variation on this deposit type occurs at Horseshoe-Raven, where uranium mineralization occurs in hematitic redox fronts and veins surrounding large, semi-tabular clay alteration zones that are cored by probable faults. Horseshoe and Raven differ, however, from other basement deposits in the region in that they lack spatially associated graphitic gneiss units or carbonaceous fault zones, and consequently the average grade of the deposits is lower than its peers in the Athabasca Basin, but still comparable to average uranium deposit grades worldwide.
Basement-hosted deposits associated with hydrothermal breccias in calcareous gneiss adjacent to northeast-trending faults. The only example of an orebody of this type in the area is the Rabbit Lake deposit and the largest basement-hosted unconformity deposits in the Alligator River district of northern Australia are closely comparable. The Rabbit Lake deposit occurs perched above the Rabbit Lake Fault at its intersection with the North-South Fault, which is part of the Dragon Lake Tabbernor-type fault system. Mineralization occurs on the margins of a large hydrothermal, chlorite-matrix breccia body that affects dolomitic marble and adjacent lithologies, and that may have formed during dissolution collapse of the carbonate, forming a highly permeable zone. High- grade mineralization is superimposed on the northeastern margins of the breccia and associated silicification/dravitization along the trace of the North-South Fault.
[The remainder of this page is intentionally left blank.]
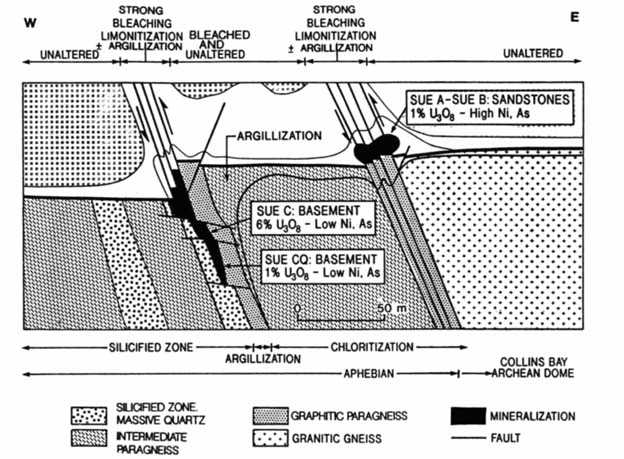
Figure 6‑6: Types of Unconformity-Type Uranium Deposits
Schematic cross section through the Sue zones, McClean Lake property showing two different styles of uranium mineralization. View is to the north, from Baudemont et al., (1993). The diagram illustrates the spatial association of basement (B-type) and unconformity (A-type) mineralization on parallel mineralized trends and the distribution of associated argillic alteration. Mineralization is developed in graphitic gneiss units that contain concordant faults.
[The remainder of this page is intentionally left blank.]
|
7. |
EXPLORATION |
Exploration conducted on the Horseshoe-Raven claim and the surrounding Hidden Bay property by Cameco for UEX between 2002 and 2005 under the exploration management service agreement and UEX as the operator after 2005, consisted of mainly diamond drilling and various geophysical surveys. Diamond drilling in the Horseshoe and Raven area during these periods is documented in Section 10.
Other forms of exploration conducted by, or on behalf of, UEX include several types of ground and airborne geophysical surveys, which are summarized below, and ground geochemical (soil) surveys, using conventional and partial extraction (MMI) techniques and reconnaissance surveys that were conducted to the south of the Horseshoe and Raven Deposits and to the northwest in the Vixen Lake area (Kos, 2004).
|
7.1 |
Geophysics in the Horseshoe and Raven Deposit Area |
Several airborne and ground geophysical surveys that have been conducted since UEX acquired the Hidden Bay property cover all or parts of the Horseshoe and Raven Deposit areas. These include:
|
● |
VTEM airborne EM surveys that were conducted between 2004 and 2006 over most of the Property area by Geotech Ltd. of Aurora, Ontario (Irvine, 2004; Cristall, 2005; Witherly, 2007; Cameron and Eriks, 2008b), which cover the Horseshoe and Raven areas. |
|
● |
Airborne radiometric and magnetic surveys were conducted in June 2008 by Geo Data Solutions Inc. of Laval, Quebec, which cover much of the Hidden Bay property. More detailed, northwest trending and 50 m spaced flight lines were conducted over the Horseshoe and Raven Deposit areas to aid in the identification of magnetic and radiometric patterns that could reflect both near-surface projection of mineralization and/or prospective faults potentially hosting mineralization. |
|
● |
A RESOLVE airborne EM and magnetic survey was conducted over selected parts of the Property by Fugro Airborne Surveys Corporation of Mississauga, Ontario, including Horseshoe-Raven and West Bear, in 2005 (Cameron and Eriks, 2008a). This outlined in particular the distribution of folded graphitic gneiss, which occurs to the southwest of the Raven Deposit and that could focus faulting that may control uranium mineralization. |
|
● |
A widely-spaced ground EM (Moving Loop) survey was conducted across the Horseshoe and Raven area in February – March 2002 by Quantec Geoscience Inc. of Porcupine, Ontario (Goldak and Powell, 2003). Like the RESOLVE survey, this identified EM targets in the local area mainly associated with graphitic gneiss to the south and west outside of the immediate area of the deposits. |
These surveys have provided further insight into the geological setting of the deposits, including identification of the location of potentially controlling faults and folding of favourable host lithologies (e.g. graphitic gneiss and competent quartzite-rich host rocks near faults) that may influence the position of mineralization.
In addition to the geophysical surveys summarized above, which were mainly of a regional nature, a detailed direct current resistivity (induced polarization) survey was carried out over the Horseshoe and Raven Deposits as well as the surrounding area by Peter E. Walcott and Associates Limited between October and December 2006 (Walcott and Walcott, 2008). The survey was conducted along 16 lines at an azimuth of 160° spaced at 200 m over and extending beyond areas of known uranium mineralization at Horseshoe and Raven. Measurements of apparent resistivity were made along these lines using the pole-dipole technique employing a 100 m dipole and taking one-half to one-tenth separation readings at half spacing intervals.
Airborne radiometric and magnetic surveys were conducted in June 2008 by Geo Data Solutions Inc. of Laval, Quebec, which cover much of the Hidden Bay and Horseshoe-Raven properties. More detailed, northwest trending and 50 m spaced flight lines were conducted over the Horseshoe and Raven Deposit areas to aid in the identification of magnetic and radiometric patterns that could reflect both near-surface projection of mineralization and/or prospective faults potentially hosting mineralization.
|
7.2 |
Drilling in the Horseshoe and Raven Deposit Area |
Drilling on the Property dates to the 1970s and was undertaken in a number of campaigns until mid-2009 (Figure 7‑1). All the historical drillholes targeted uranium mineralization and prospects. Between 1973 and 2009, a total of 951 diamond drilling boreholes (263,388 m) and 160 reverse circulation boreholes (2,118 m) were drilled through the Property by, Gulf, Eldorado, Cameco, and UEX, summarized in Table 7‑1. From mid-2009 to 2012, UEX drilled 105 diamond drillholes for 28,315 m.
Exploration/resource drilling completed at the Horseshoe and Raven Deposits post-2009 will be expanded upon below along with comments where necessary about the historical procedures that were followed on the Property at that time.
A review of the procedures, described below, respecting the core sizes, and procedures for logging and recording of core recoveries are considered standard industry practices and provide an acceptable basis for the geological and geotechnical interpretation of the deposits leading to the estimation of mineral resources and economic evaluation of the deposits. The QPs have no reason to believe that the listed procedures were not followed. The QPs interviewed one of the geotechnicians that worked on the Property during this period to gain an understanding of the processes and procedures followed by the UEX field team during these programs, which corresponded to the procedures and descriptions outlined below. The QPs believe that the historical data is accurate for the purposes of this TRS.
[The remainder of this page is intentionally left blank.]
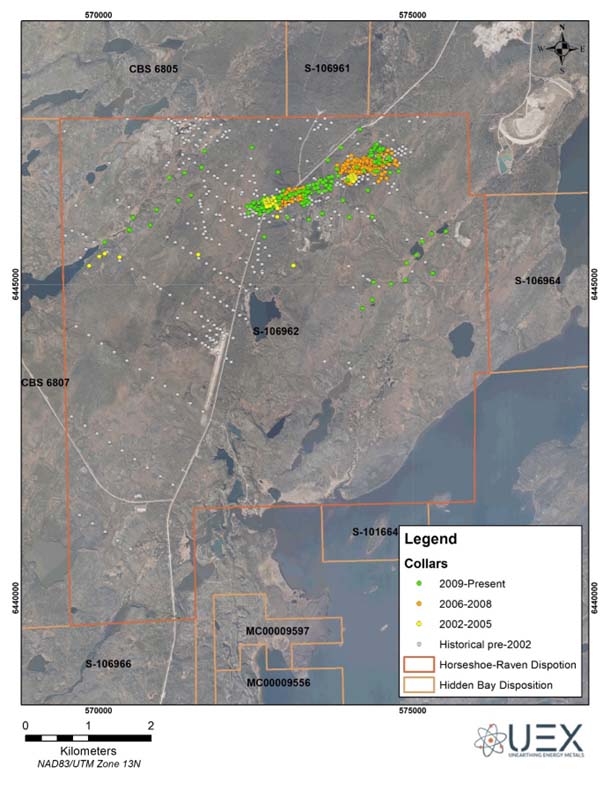
Figure 7‑1: Horseshoe and Raven Drillhole Collars
Table 7‑1: Summary of Drilling on the Horseshoe-Raven Property
| Type | Meters* | ||||||||
|
Year |
Total |
DDH |
RC |
Sonic |
Total |
DDH |
RC |
Sonic |
Company |
|
1972 |
15 |
15 |
2,701 |
2,701 |
Gulf |
||||
|
1973 |
26 |
26 |
6,593 |
6,593 |
Gulf |
||||
|
1974 |
141 |
141 |
32,331 |
32,331 |
Gulf |
||||
|
1975 |
84 |
84 |
21,763 |
21,763 |
Gulf |
||||
|
1976 |
156 |
32 |
124 |
9,402 |
7,861 |
1,541 |
Gulf |
||
|
1977 |
11 |
11 |
2,159 |
2,159 |
Gulf |
||||
|
1978 |
39 |
3 |
36 |
1,233 |
655 |
578 |
Gulf |
||
|
1984 |
1 |
1 |
82 |
82 |
Eldorado |
||||
|
1985 |
7 |
7 |
542 |
542 |
Eldorado |
||||
|
2002 |
3 |
3 |
1,350 |
1,350 |
Cameco** |
||||
|
2003 |
1 |
1 |
314 |
314 |
Cameco** |
||||
|
2004 |
4 |
4 |
648 |
648 |
Cameco** |
||||
|
2005 |
44 |
44 |
12,811 |
12,811 |
UEX |
||||
|
2006 |
27 |
27 |
8,617 |
8,617 |
UEX |
||||
|
2007 |
210 |
210 |
67,777 |
67,777 |
UEX |
||||
|
2008 |
232 |
232 |
63,261 |
63,261 |
UEX |
||||
|
2009 |
110 |
110 |
33,923 |
33,923 |
UEX |
||||
|
2009*** |
19 |
19 |
5,406 |
5,406 |
UEX |
||||
|
2011 |
76 |
76 |
20,011 |
20,011 |
UEX |
||||
|
2012 |
10 |
10 |
2,898 |
2,898 |
UEX |
||||
|
Total |
1,216 |
1,056 |
160 |
293,821 |
291,702 |
2,119 |
|||
* Rounded to the nearest metre
** Cameco Operated on behalf of UEX
***After cut-off for July 2009 Resource report
|
7.2.1 |
Historical Drilling by Gulf in the Horseshoe and Raven Area |
After initial discovery of the Raven Deposit, Gulf drilled a total of 53,329 m in 212 diamond drillholes over the Horseshoe and Raven Deposits between 1972 and 1978 (note Table 7‑1 tabulates totals for the whole Property, not just the deposit). Drillhole spacing of the Gulf holes is variable across the deposits, but generally varies from 30 m to 90 m and averages approximately 60 m in areas of mineralization. Historical collar locations of the Gulf drillholes are presented in Figure 7‑1. The Gulf drilling data has not been used in this resource estimate.
Eldorado, Cameco and UEX drilled a total of 639 boreholes for a total of 189,325 m through and around the Horseshoe and Raven deposits. Some of these holes were regional tests to assess for other pods of mineralization given their favourable geology, structure and geophysical signature. As of April 2009, the drillholes to that date comprised the basis for the database for the 2009 Palmer and Fielder Horseshoe and Raven Mineral Resource estimates.
|
7.3 |
Drilling (Mid-2009 – 2012) |
During the summer of 2009 after the updated mineral resource estimate was published, 19 drillholes totaling 5,406 m were completed to test targets peripheral to the Horseshoe and Raven deposits for possible extension of mineralization and to assess nearby geophysical and geological targets (Table 7‑2). Winter drilling in 2011 was 13 drillholes for 3,553.6 m to test for additional uranium targets adjacent to the known Horseshoe and Raven deposits. Drilling in the summer of 2011 consisted of mainly definition and step-out drilling in the Raven deposit and several infill drillholes at the Horseshoe Deposit for a total of 16,457 m in 63 drillholes. Drilling in the winter of 2012 (Figure 7‑2) targeted a regional conductor package south of the deposits with 10 holes for 2,898 m.
[The remainder of this page is intentionally left blank.]
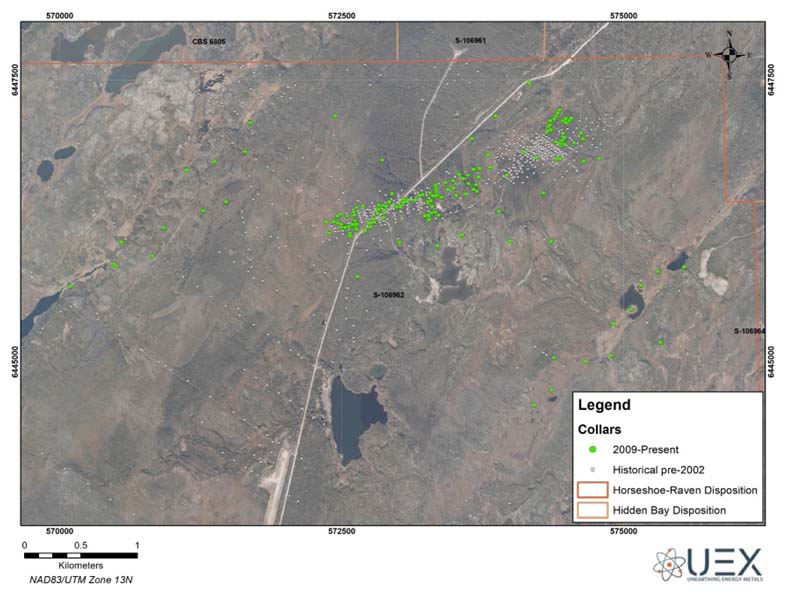
Figure 7‑2: Recent Historical Drilling on the Horseshoe-Raven Property
Table 7‑2: Summary of Drilling by UEX on the Horseshoe-Raven Project
|
Borehole ID |
Azimuth |
Dip |
Length (m) |
Easting* (m) |
Northing* (m) |
Elevation (m) |
Year |
|
HU-359 |
305 |
-45 |
300.0 |
573861.0 |
6447179.0 |
439.0 |
2009 |
|
HU-360 |
305 |
-45 |
300.0 |
574161.0 |
6447471.0 |
440.0 |
2009 |
|
HU-361 |
305 |
-77 |
270.0 |
574532.2 |
6447161.5 |
438.0 |
2009 |
|
HU-362 |
90 |
-45 |
291.0 |
574642.0 |
6446778.0 |
429.0 |
2009 |
|
HU-363 |
305 |
-63 |
639.0 |
574779.8 |
6446803.8 |
426.0 |
2009 |
|
HU-364 |
309 |
-46 |
537.0 |
574288.3 |
6446496.3 |
425.0 |
2009 |
|
HU-365 |
305 |
-45 |
399.0 |
573992.0 |
6446067.5 |
422.0 |
2009 |
|
HU-366 |
125 |
-45 |
324.0 |
574355.7 |
6446069.1 |
422.0 |
2009 |
|
HU-367 |
305 |
-65 |
489.5 |
574355.7 |
6446069.1 |
422.0 |
2009 |
|
RU-217 |
350 |
-65 |
81.0 |
573326.0 |
6446327.0 |
428.0 |
2009 |
|
RU-218 |
350 |
-90 |
72.0 |
573326.2 |
6446326.8 |
428.0 |
2009 |
|
RU-219 |
350 |
-65 |
81.0 |
573295.7 |
6446321.4 |
430.0 |
2009 |
|
RU-220 |
195 |
-90 |
72.0 |
573295.7 |
6446321.0 |
430.0 |
2009 |
|
RU-221 |
350 |
-65 |
81.0 |
573355.8 |
6446300.0 |
426.0 |
2009 |
|
RU-222 |
350 |
-90 |
72.0 |
573268.0 |
6446300.0 |
430.0 |
2009 |
|
RU-223 |
350 |
-72 |
411.0 |
573235.2 |
6446293.0 |
431.0 |
2009 |
|
RU-224 |
350 |
-58 |
549.0 |
573012.0 |
6446063.0 |
431.0 |
2009 |
|
RU-225 |
350 |
-51 |
222.0 |
572386.0 |
6446140.0 |
464.0 |
2009 |
|
RU-226 |
350 |
-74 |
219.0 |
572429.0 |
6446241.0 |
465.0 |
2009 |
|
VU-001 |
305 |
-52 |
400.0 |
571641.0 |
6446864.0 |
436.0 |
2009 |
|
VU-002 |
305 |
-45 |
366.0 |
571687.0 |
6447121.0 |
436.0 |
2009 |
|
VU-003 |
305 |
-60 |
549.0 |
571370.0 |
6446775.0 |
436.0 |
2009 |
|
VU-004 |
305 |
-61 |
391.0 |
571125.0 |
6446701.0 |
436.0 |
2009 |
|
HR-001 |
305 |
-48 |
299.0 |
573651.5 |
6446977.7 |
438.0 |
2011 |
|
HR-002 |
305 |
-47 |
300.0 |
572439.5 |
6447179.8 |
475.0 |
2011 |
|
HR-003 |
305 |
-47 |
299.0 |
571473.5 |
6446417.0 |
458.0 |
2011 |
|
HR-004 |
125 |
-45 |
388.0 |
571270.7 |
6446339.0 |
452.0 |
2011 |
|
HR-005 |
305 |
-49 |
90.6 |
575330.4 |
6445170.0 |
409.0 |
2011 |
|
HR-006 |
305 |
-45 |
309.0 |
575322.6 |
6445174.0 |
408.0 |
2011 |
|
HR-007 |
125 |
-45 |
313.0 |
570921.6 |
6446188.8 |
447.0 |
2011 |
|
HR-008 |
125 |
-50 |
67.0 |
570820.0 |
6445940.0 |
452.0 |
2011 |
|
HR-009 |
125 |
-60 |
69.0 |
570820.0 |
6445940.0 |
452.0 |
2011 |
|
HR-010 |
305 |
-60 |
122.0 |
570500.6 |
6445852.7 |
439.0 |
2011 |
|
HR-011 |
305 |
-75 |
464.0 |
570482.4 |
6445867.9 |
438.0 |
2011 |
|
HR-012 |
305 |
-70 |
411.0 |
570095.2 |
6445671.0 |
437.0 |
2011 |
|
HR-013 |
305 |
-70 |
422.0 |
570547.0 |
6446061.8 |
437.0 |
2011 |
|
HU-368 |
0 |
-60 |
270.0 |
573963.6 |
6446655.8 |
428.0 |
2011 |
|
HU-369 |
300 |
-60 |
231.0 |
574223.9 |
6446811.8 |
432.0 |
2011 |
|
HU-370 |
42 |
-61 |
381.0 |
574111.5 |
6446864.5 |
431.0 |
2011 |
|
HU-371 |
330 |
-80 |
393.0 |
574435.7 |
6446801.3 |
427.0 |
2011 |
|
HU-372 |
90 |
-57 |
402.0 |
574472.0 |
6446928.4 |
431.0 |
2011 |
|
HU-373 |
305 |
-90 |
30.0 |
573893.7 |
6446334.3 |
427.0 |
2011 |
|
RU-227 |
353 |
-90 |
321.0 |
573381.4 |
6446459.8 |
431.0 |
2011 |
|
RU-228 |
353 |
-60 |
291.0 |
573333.8 |
6446538.0 |
432.0 |
2011 |
|
RU-229 |
353 |
-60 |
270.0 |
573482.9 |
6446604.1 |
433.0 |
2011 |
|
RU-230 |
353 |
-60 |
222.0 |
573417.3 |
6446588.5 |
436.0 |
2011 |
|
RU-231 |
313 |
-60 |
219.0 |
573535.2 |
6446660.2 |
439.0 |
2011 |
|
RU-232 |
317 |
-60 |
291.0 |
573615.7 |
6446654.1 |
428.0 |
2011 |
|
RU-233 |
353 |
-50 |
291.0 |
573331.5 |
6446565.2 |
434.0 |
2011 |
|
RU-234 |
353 |
-60 |
291.0 |
573335.7 |
6446516.6 |
432.0 |
2011 |
|
RU-235 |
313 |
-60 |
282.0 |
573572.3 |
6446622.4 |
431.0 |
2011 |
|
Borehole ID |
Azimuth |
Dip |
Length (m) |
Easting* (m) |
Northing* (m) |
Elevation (m) |
Year |
|
RU-236 |
353 |
-60 |
294.0 |
573338.2 |
6446490.4 |
431.0 |
2011 |
|
RU-237 |
313 |
-60 |
336.0 |
573622.5 |
6446578.6 |
427.0 |
2011 |
|
RU-238 |
353 |
-60 |
282.0 |
573437.9 |
6446528.9 |
432.0 |
2011 |
|
RU-239 |
0 |
-60 |
270.0 |
573489.0 |
6446540.4 |
432.0 |
2011 |
|
RU-240 |
313 |
-60 |
328.0 |
573666.6 |
6446527.8 |
426.0 |
2011 |
|
RU-241 |
353 |
-60 |
330.0 |
573512.8 |
6446473.8 |
428.0 |
2011 |
|
RU-242 |
316 |
-70 |
317.0 |
573711.3 |
6446638.4 |
427.0 |
2011 |
|
RU-243 |
351 |
-73 |
270.0 |
573307.8 |
6446470.4 |
430.0 |
2011 |
|
RU-244 |
352 |
-65 |
249.0 |
573307.8 |
6446470.4 |
430.0 |
2011 |
|
RU-245 |
313 |
-60 |
252.0 |
573720.8 |
6446715.0 |
428.0 |
2011 |
|
RU-246 |
353 |
-60 |
252.0 |
573260.4 |
6446420.8 |
432.0 |
2011 |
|
RU-247 |
2 |
-56 |
162.0 |
573047.8 |
6446441.2 |
448.0 |
2011 |
|
RU-248 |
0 |
-54 |
261.0 |
573290.0 |
6446426.5 |
433.0 |
2011 |
|
RU-249 |
340 |
-61 |
150.0 |
572686.6 |
6446378.8 |
460.0 |
2011 |
|
RU-250 |
353 |
-64 |
222.0 |
573214.9 |
6446480.7 |
434.0 |
2011 |
|
RU-251 |
338 |
-73 |
339.0 |
572776.3 |
6446267.0 |
451.0 |
2011 |
|
RU-252 |
348 |
-68 |
222.0 |
673186.7 |
6446475.1 |
436.0 |
2011 |
|
RU-253 |
340 |
-62 |
339.0 |
572736.3 |
6446230.9 |
450.0 |
2011 |
|
RU-254 |
359 |
-86 |
300.0 |
573018.8 |
6446371.9 |
444.0 |
2011 |
|
RU-255 |
352 |
-59 |
351.0 |
572626.0 |
6446218.2 |
457.0 |
2011 |
|
RU-256 |
353 |
-84 |
300.0 |
572988.9 |
6446383.5 |
447.0 |
2011 |
|
RU-257 |
354 |
-67 |
180.0 |
572829.7 |
6446387.8 |
455.0 |
2011 |
|
RU-258 |
351 |
-73 |
297.0 |
573347.7 |
6446476.5 |
431.0 |
2011 |
|
RU-259 |
351 |
-60 |
282.0 |
573347.7 |
6446477.1 |
431.0 |
2011 |
|
RU-260 |
351 |
-56 |
321.0 |
572591.9 |
6446213.8 |
459.0 |
2011 |
|
RU-261 |
285 |
-50 |
306.0 |
572825.3 |
6446351.7 |
450.0 |
2011 |
|
RU-262 |
56 |
-57 |
351.0 |
572942.3 |
6446490.0 |
456.0 |
2011 |
|
RU-263 |
172 |
-58 |
201.0 |
572986.9 |
6446373.6 |
446.0 |
2011 |
|
RU-264 |
350 |
-70 |
150.0 |
573041.6 |
6446411.0 |
447.0 |
2011 |
|
RU-265 |
0 |
-74 |
159.0 |
573328.0 |
6446471.4 |
430.0 |
2011 |
|
RU-266 |
351 |
-90 |
54.0 |
572856.3 |
6446788.7 |
473.0 |
2011 |
|
RU-267 |
351 |
-90 |
45.0 |
572637.5 |
6445755.9 |
453.0 |
2011 |
|
RU-268 |
355 |
-59 |
347.0 |
572530.1 |
6446191.6 |
460.0 |
2011 |
|
RU-269 |
351 |
-90 |
201.0 |
573565.5 |
6446118.1 |
422.0 |
2011 |
|
RU-270 |
351 |
-90 |
30.0 |
573562.4 |
6446126.4 |
423.0 |
2011 |
|
RU-271 |
351 |
-90 |
201.0 |
573348.0 |
6446027.9 |
420.0 |
2011 |
|
RU-272 |
360 |
-64 |
342.0 |
572870.3 |
6446277.3 |
444.0 |
2011 |
|
RU-273 |
353 |
-85 |
282.0 |
573260.4 |
6446420.8 |
432.0 |
2011 |
|
RU-274 |
5 |
-77 |
276.0 |
573046.7 |
6446412.4 |
446.0 |
2011 |
|
RU-275 |
339 |
-75 |
309.0 |
572811.4 |
6446316.3 |
449.0 |
2011 |
|
RU-276 |
336 |
-83 |
291.0 |
572829.7 |
6446387.8 |
455.0 |
2011 |
|
RU-277 |
353 |
-77 |
318.0 |
572874.3 |
6446342.2 |
449.0 |
2011 |
|
RU-278 |
336 |
-67 |
216.0 |
572829.7 |
6446387.8 |
455.0 |
2011 |
|
RU-279 |
354 |
-67 |
210.0 |
572867.5 |
6446386.9 |
453.0 |
2011 |
|
RU-280 |
180 |
-86 |
318.0 |
572921.5 |
6446404.3 |
451.0 |
2011 |
|
RU-281 |
348 |
-75 |
237.0 |
572890.5 |
6446381.4 |
450.0 |
2011 |
|
RU-282 |
350 |
-72 |
318.0 |
572549.6 |
6446293.9 |
462.0 |
2011 |
|
RU-283 |
349 |
-77 |
204.0 |
572919.4 |
6446418.5 |
452.0 |
2011 |
|
HR-014 |
313.1 |
-72 |
288.0 |
574205.7 |
6444616.0 |
288.0 |
2012 |
|
HR-015 |
310.9 |
-72 |
288.0 |
574359.8 |
6444749.0 |
288.0 |
2012 |
|
HR-016 |
315.0 |
-72 |
291.0 |
574907.0 |
6445340.0 |
291.0 |
2012 |
|
HR-017 |
307.4 |
-72 |
291.0 |
575152.3 |
6445676.0 |
291.0 |
2012 |
|
HR-018 |
302.9 |
-74 |
291.0 |
575302.2 |
6445803.0 |
291.0 |
2012 |
|
Borehole ID |
Azimuth |
Dip |
Length (m) |
Easting* (m) |
Northing* (m) |
Elevation (m) |
Year |
|
HR-019 |
302.8 |
-72 |
291.0 |
575532.4 |
6445841.0 |
291.0 |
2012 |
|
HR-020 |
305.7 |
-72 |
291.0 |
575060.4 |
6445465.0 |
291.0 |
2012 |
|
HR-021 |
304.9 |
-72 |
286.5 |
574885.8 |
6445057.0 |
286.5 |
2012 |
|
HR-022 |
295.8 |
-72 |
289.4 |
574659.5 |
6445005.0 |
289.4 |
2012 |
|
HR-023 |
305.0 |
-70 |
291.0 |
574380.6 |
6445036.0 |
291.0 |
2012 |
|
Total |
30,025** |
* The North American Datum of 1983, zone 13N.
** Rounded up
Representative uranium assay results from the drilling campaigns after the July 2009 Resource report are summarized in Table 7‑3. These programs when drilled on the deposit confirmed continuity of mineralization or bounded mineralization down dip. Where mineralization was confirmed, it was determined that it would add incremental pounds to the deposits (Eriks and Hasegawa, 2014).
Table 7‑3: Assay Results Mid-2009 through 2012
|
Higher Grade Intervals Within Lower Grades Intersections |
||||||||
|
Borehole ID |
From* |
To* |
Length* |
%U3O8 |
From |
To |
Length |
%U3O8 |
|
HO-001 |
241.6 |
248.9 |
7.3 |
0.067 |
- |
- |
- |
- |
|
HO-002 |
246.5 |
250.0 |
3.5 |
0.114 |
- |
- |
- |
- |
|
HO-003 |
224.3 |
229.9 |
5.6 |
0.095 |
- |
- |
- |
- |
|
233.2 |
239.8 |
6.6 |
0.551 |
- |
- |
- |
- |
|
|
HO-004 |
184.1 |
201.5 |
17.4 |
0.332 |
- |
- |
- |
- |
|
222.3 |
230.6 |
8.3 |
0.377 |
- |
- |
- |
- |
|
|
HO-006 |
243.5 |
246.5 |
3.0 |
0.117 |
- |
- |
- |
- |
|
HO-007 |
232.5 |
237.9 |
5.4 |
0.255 |
- |
- |
- |
- |
|
HO-008 |
118.7 |
120.4 |
1.7 |
0.137 |
- |
- |
- |
- |
|
199.1 |
226.0 |
26.9 |
0.096 |
- |
- |
- |
- |
|
|
HO-009 |
149.9 |
153.1 |
3.2 |
2.557 |
- |
- |
- |
- |
|
HO-014 |
174.9 |
179.9 |
5.0 |
0.101 |
- |
- |
- |
- |
|
204.6 |
205.9 |
1.3 |
0.206 |
- |
- |
- |
- |
|
|
HO-015 |
150.3 |
160.9 |
10.6 |
0.109 |
- |
- |
- |
- |
|
168.3 |
174.5 |
6.2 |
0.102 |
- |
- |
- |
- |
|
|
186.6 |
200.0 |
13.4 |
0.305 |
- |
- |
- |
- |
|
|
HO-016 |
209.0 |
220.2 |
11.2 |
0.162 |
- |
- |
- |
- |
|
233.2 |
236.0 |
2.8 |
0.105 |
- |
- |
- |
- |
|
|
HS-001 |
159.4 |
183.5 |
24.1 |
0.015 |
- |
- |
- |
- |
|
228.0 |
231.6 |
3.6 |
0.076 |
- |
- |
- |
- |
|
|
239.3 |
249.9 |
10.6 |
0.014 |
- |
- |
- |
- |
|
|
258.5 |
260.6 |
2.1 |
0.177 |
- |
- |
- |
- |
|
|
HU-006 |
166.9 |
183.3 |
16.4 |
0.25 |
- |
- |
- |
- |
|
HU-007 |
163.6 |
175.7 |
12.1 |
0.39 |
- |
- |
- |
- |
|
HU-008 |
155.9 |
178.5 |
22.6 |
0.14 |
- |
- |
- |
- |
|
184.5 |
188.0 |
3.5 |
0.1 |
- |
- |
- |
- |
|
|
HU-009 |
190.9 |
192.0 |
1.1 |
0.2 |
- |
- |
- |
- |
|
HU-010 |
111.0 |
114.0 |
3.0 |
0.1 |
- |
- |
- |
- |
|
261.2 |
263.0 |
1.8 |
0.08 |
- |
- |
- |
- |
|
|
HU-011 |
240.7 |
243.6 |
2.9 |
0.19 |
- |
- |
- |
- |
|
253.3 |
258.5 |
5.2 |
0.72 |
- |
- |
- |
- |
|
|
HU-012 |
179.0 |
191.7 |
12.7 |
0.14 |
- |
- |
- |
- |
|
196.3 |
199.5 |
3.2 |
0.13 |
- |
- |
- |
- |
|
|
HU-013 |
239.0 |
242.6 |
3.6 |
0.34 |
- |
- |
- |
- |
|
Higher Grade Intervals Within Lower Grades Intersections |
||||||||
| Borehole ID | From* | To* | Length* | %U3O8 | From | To | Length | %U3O8 |
|
HU-014 |
168.7 |
169.5 |
0.8 |
0.28 |
- |
- |
- |
- |
|
179.9 |
181.7 |
1.8 |
0.38 |
- |
- |
- |
- |
|
|
207.9 |
209.6 |
1.7 |
0.13 |
- |
- |
- |
- |
|
|
HU-015 |
180.0 |
194.2 |
14.2 |
0.52 |
- |
- |
- |
- |
|
HU-016 |
199.6 |
213.9 |
14.3 |
3.97 |
201.5 |
213.9 |
12.4 |
4.53 |
|
204.8 |
208.2 |
3.4 |
10.3 |
|||||
|
204.8 |
205.4 |
0.6 |
22.17 |
|||||
|
HU-018 |
109.1 |
116.6 |
7.8 |
0.08 |
- |
- |
- |
- |
|
245.1 |
261.2 |
10.6 |
0.17 |
- |
- |
- |
- |
|
|
HU-019 |
93.9 |
95.6 |
1.7 |
0.14 |
- |
- |
- |
- |
|
205.7 |
210.0 |
4.3 |
0.15 |
- |
- |
- |
- |
|
|
220.5 |
221.4 |
0.9 |
0.18 |
- |
- |
- |
- |
|
|
225.8 |
229.6 |
3.8 |
0.13 |
- |
- |
- |
- |
|
|
252.7 |
253.8 |
1.1 |
0.53 |
- |
- |
- |
- |
|
|
259.0 |
261.7 |
2.7 |
0.48 |
- |
- |
- |
- |
|
|
276.0 |
279.5 |
3.5 |
0.29 |
- |
- |
- |
- |
|
|
284.5 |
285.5 |
1.0 |
0.23 |
- |
- |
- |
- |
|
|
HU-020 |
279.7 |
297.6 |
17.9 |
0.26 |
- |
- |
- |
- |
|
301.0 |
301.7 |
0.7 |
0.22 |
- |
- |
- |
- |
|
|
HU-021 |
310.0 |
313.0 |
3.0 |
0.16 |
- |
- |
- |
- |
|
318.7 |
320.5 |
1.8 |
0.11 |
- |
- |
- |
- |
|
|
HU-022 |
208.5 |
247.5 |
39.0 |
0.41 |
- |
- |
- |
- |
|
257.6 |
258.2 |
0.6 |
0.31 |
- |
- |
- |
- |
|
|
325.2 |
325.6 |
0.3 |
0.33 |
- |
- |
- |
- |
|
|
HU-023 |
174.0 |
176.8 |
2.8 |
0.17 |
- |
- |
- |
- |
|
HU-024 |
307.5 |
343.8 |
35.2 |
0.21 |
- |
- |
- |
- |
|
HU-025 |
166.5 |
173.3 |
6.8 |
0.07 |
- |
- |
- |
- |
|
209.1 |
210.3 |
1.2 |
0.16 |
- |
- |
- |
- |
|
|
HU-026 |
317.2 |
318.0 |
0.9 |
0.14 |
- |
- |
- |
- |
|
HU-027 |
309.6 |
311.7 |
2.1 |
0.34 |
- |
- |
- |
- |
|
HU-028 |
185.6 |
201.6 |
16.0 |
0.32 |
191.8 |
193.4 |
1.6 |
2.55 |
|
192.7 |
193.1 |
0.4 |
5.31 |
|||||
|
HU-029 |
188.0 |
194.0 |
6.0 |
0.06 |
- |
- |
- |
- |
|
205.7 |
209.3 |
3.6 |
0.06 |
- |
- |
- |
- |
|
|
HU-030 |
188.0 |
198.5 |
10.5 |
0.21 |
- |
- |
- |
- |
|
246.9 |
247.9 |
1.1 |
1.02 |
- |
- |
- |
- |
|
|
HU-032 |
193.8 |
200.6 |
6.8 |
0.58 |
- |
- |
- |
- |
|
HU-033 |
177.0 |
194.0 |
17.0 |
0.49 |
190.3 |
193.4 |
3.1 |
1.9 |
|
193.0 |
193.4 |
0.4 |
5.93 |
|||||
|
HU-034 |
170.7 |
187.2 |
16.5 |
0.07 |
- |
- |
- |
- |
|
HU-036 |
223.5 |
226.1 |
2.6 |
1.08 |
- |
- |
- |
- |
|
238.0 |
246.5 |
8.5 |
0.16 |
- |
- |
- |
- |
|
|
HU-037 |
181.0 |
194.4 |
13.4 |
0.74 |
181.0 |
184.9 |
3.9 |
1.97 |
|
184.3 |
184.9 |
0.6 |
5.27 |
|||||
|
211.3 |
212.3 |
1.0 |
0.79 |
- |
- |
- |
- |
|
|
HU-038 |
199.5 |
219.8 |
20.3 |
0.37 |
199.5 |
200.5 |
1.0 |
3.9 |
|
HU-039 |
136.9 |
139.4 |
2.5 |
0.29 |
- |
- |
- |
- |
|
150.6 |
163.4 |
12.8 |
0.63 |
162.8 |
163.4 |
0.6 |
7.55 |
|
|
204.5 |
205.9 |
1.4 |
0.16 |
- |
- |
- |
- |
|
|
HU-040 |
236.3 |
238.3 |
2.0 |
0.18 |
- |
- |
- |
- |
|
262.0 |
272.4 |
10.4 |
0.15 |
- |
- |
- |
- |
|
|
290.5 |
304.4 |
13.9 |
0.12 |
- |
- |
- |
- |
|
|
HU-041 |
183.5 |
190.3 |
6.8 |
0.08 |
- |
- |
- |
- |
|
212.8 |
214.0 |
1.2 |
0.22 |
- |
- |
- |
- |
|
|
HU-043 |
156.6 |
161.4 |
4.8 |
0.05 |
- |
- |
- |
- |
|
179.4 |
189.7 |
10.3 |
1.49 |
183.8 |
187.1 |
3.3 |
4.27 |
|
|
Higher Grade Intervals Within Lower Grades Intersections |
||||||||
| Borehole ID | From* | To* | Length* | %U3O8 | From | To | Length | %U3O8 |
|
184.2 |
184.7 |
0.5 |
10.59 |
|||||
|
240.9 |
243.6 |
2.7 |
0.17 |
- |
- |
- |
- |
|
|
260.8 |
262.4 |
1.6 |
0.09 |
- |
- |
- |
- |
|
|
297.9 |
298.4 |
0.5 |
0.19 |
- |
- |
- |
- |
|
|
HU-044 |
158.3 |
159.0 |
0.7 |
0.43 |
- |
- |
- |
- |
|
178.3 |
179.4 |
1.1 |
0.11 |
- |
- |
- |
- |
|
|
207.0 |
235.9 |
28.9 |
0.21 |
220.1 |
226.0 |
5.9 |
0.67 |
|
|
253.5 |
268.7 |
15.2 |
0.09 |
- |
- |
- |
- |
|
|
HU-045 |
163.0 |
164.3 |
1.3 |
0.3 |
- |
- |
- |
- |
|
172.0 |
191.0 |
19.0 |
0.58 |
172.0 |
172.8 |
0.8 |
1.94 |
|
|
175.4 |
179.7 |
4.3 |
0.9 |
|||||
|
190.0 |
191.0 |
1.0 |
2.72 |
|||||
|
HU-046 |
117.9 |
119.0 |
1.1 |
0.14 |
- |
- |
- |
- |
|
151.4 |
153.4 |
2.0 |
0.07 |
- |
- |
- |
- |
|
|
207.7 |
208.6 |
0.9 |
0.2 |
- |
- |
- |
- |
|
|
234.1 |
234.4 |
0.3 |
0.21 |
- |
- |
- |
- |
|
|
237.9 |
239.3 |
1.4 |
0.1 |
- |
- |
- |
- |
|
|
242.1 |
243.5 |
1.4 |
0.07 |
- |
- |
- |
- |
|
|
254.3 |
267.4 |
13.1 |
0.14 |
- |
- |
- |
- |
|
|
272.2 |
273.1 |
0.9 |
0.12 |
- |
- |
- |
- |
|
|
HU-047 |
247.0 |
249.0 |
2.0 |
0.14 |
- |
- |
- |
- |
|
279.0 |
294.0 |
15.0 |
0.23 |
- |
- |
- |
- |
|
|
HU-048 |
110.6 |
111.8 |
1.2 |
0.12 |
- |
- |
- |
- |
|
127.5 |
129.3 |
1.8 |
0.09 |
- |
- |
- |
- |
|
|
135.2 |
139.7 |
4.5 |
0.06 |
- |
- |
- |
- |
|
|
154.5 |
157.6 |
3.1 |
0.07 |
- |
- |
- |
- |
|
|
253.9 |
256.5 |
2.6 |
0.39 |
- |
- |
- |
- |
|
|
HU-049 |
180.9 |
197.3 |
16.4 |
0.21 |
- |
- |
- |
- |
|
HU-050 |
274.7 |
276.4 |
1.7 |
0.06 |
- |
- |
- |
- |
|
297.7 |
322.3 |
24.6 |
0.38 |
306.6 |
321.1 |
14.5 |
0.56 |
|
|
HU-051 |
175.0 |
198.0 |
23.0 |
0.31 |
197.0 |
197.5 |
0.5 |
5.66 |
|
HU-052 |
228.9 |
253.3 |
24.4 |
0.11 |
- |
- |
- |
- |
|
258.5 |
259.5 |
1.0 |
0.15 |
- |
- |
- |
- |
|
|
HU-053 |
131.2 |
132.5 |
1.3 |
0.09 |
- |
- |
- |
- |
|
152.7 |
154.0 |
1.3 |
0.15 |
- |
- |
- |
- |
|
|
HU-054 |
249.0 |
254.7 |
5.8 |
0.3 |
- |
- |
- |
- |
|
265.9 |
267.4 |
1.5 |
0.09 |
- |
- |
- |
- |
|
|
273.3 |
287.0 |
13.7 |
0.17 |
- |
- |
- |
- |
|
|
300.3 |
308.8 |
8.5 |
0.18 |
- |
- |
- |
- |
|
|
HU-056 |
137.5 |
139.5 |
2.0 |
0.06 |
- |
- |
- |
- |
|
161.8 |
170.3 |
8.5 |
0.09 |
- |
- |
- |
- |
|
|
221.8 |
228.3 |
6.5 |
0.4 |
- |
- |
- |
- |
|
|
HU-057 |
135.0 |
140.0 |
5.0 |
0.07 |
- |
- |
- |
- |
|
163.0 |
165.0 |
2.0 |
0.09 |
- |
- |
- |
- |
|
|
HU-058 |
254.9 |
260.1 |
5.2 |
0.13 |
- |
- |
- |
- |
|
264.0 |
264.7 |
0.7 |
0.09 |
- |
- |
- |
- |
|
|
267.6 |
269.2 |
1.6 |
0.18 |
- |
- |
- |
- |
|
|
307.0 |
322.4 |
15.4 |
0.1 |
- |
- |
- |
- |
|
|
HU-060 |
119.3 |
120.1 |
0.8 |
0.12 |
- |
- |
- |
- |
|
HU-061 |
156.9 |
183.5 |
26.6 |
0.5 |
162.5 |
173.9 |
11.4 |
0.99 |
|
HU-062 |
250.8 |
252.6 |
1.8 |
0.45 |
- |
- |
- |
- |
|
269.1 |
284.0 |
14.9 |
0.14 |
- |
- |
- |
- |
|
|
299.2 |
304.1 |
4.9 |
0.07 |
- |
- |
- |
- |
|
|
323.7 |
330.2 |
6.5 |
0.06 |
- |
- |
- |
- |
|
|
338.2 |
340.7 |
2.5 |
0.13 |
- |
- |
- |
- |
|
|
HU-063 |
322.4 |
383.3 |
60.9 |
0.18 |
- |
- |
- |
- |
|
Higher Grade Intervals Within Lower Grades Intersections |
||||||||
| Borehole ID | From* | To* | Length* | %U3O8 | From | To | Length | %U3O8 |
|
HU-065 |
281.0 |
292.0 |
11.0 |
0.2 |
- |
- |
- |
- |
|
312.4 |
314.0 |
1.6 |
0.11 |
- |
- |
- |
- |
|
|
331.3 |
331.9 |
0.6 |
0.34 |
- |
- |
- |
- |
|
|
402.6 |
420.3 |
17.7 |
0.61 |
407.1 |
420.3 |
13.2 |
0.8 |
|
|
408.4 |
413.6 |
5.2 |
1.58 |
|||||
|
HU-066 |
151.0 |
171.0 |
20.0 |
0.12 |
- |
- |
- |
- |
|
HU-067 |
264.5 |
275.0 |
10.5 |
0.06 |
- |
- |
- |
- |
|
300.0 |
301.0 |
1.0 |
0.1 |
- |
- |
- |
- |
|
|
325.0 |
328.0 |
3.0 |
0.07 |
- |
- |
- |
- |
|
|
363.0 |
369.5 |
6.5 |
0.11 |
- |
- |
- |
- |
|
|
HU-068 |
181.2 |
184.3 |
3.1 |
0.08 |
- |
- |
- |
- |
|
239.0 |
240.6 |
1.6 |
0.35 |
- |
- |
- |
- |
|
|
HU-069 |
421.0 |
421.3 |
0.3 |
0.19 |
- |
- |
- |
- |
|
HU-070 |
111.2 |
111.6 |
0.4 |
0.23 |
- |
- |
- |
- |
|
116.1 |
117.3 |
1.2 |
0.08 |
- |
- |
- |
- |
|
|
120.4 |
123.8 |
3.4 |
0.05 |
- |
- |
- |
- |
|
|
131.0 |
133.0 |
2.0 |
0.05 |
- |
- |
- |
- |
|
|
217.3 |
223.6 |
6.3 |
0.08 |
- |
- |
- |
- |
|
|
HU-071 |
245.6 |
246.5 |
0.9 |
0.3 |
- |
- |
- |
- |
|
278.3 |
280.5 |
2.2 |
0.23 |
- |
- |
- |
- |
|
|
HU-072 |
285.0 |
288.0 |
3.0 |
0.06 |
- |
- |
- |
- |
|
326.5 |
328.0 |
1.5 |
0.17 |
- |
- |
- |
- |
|
|
333.1 |
344.0 |
10.9 |
0.43 |
- |
- |
- |
- |
|
|
401.0 |
410.4 |
9.4 |
0.09 |
- |
- |
- |
- |
|
|
HU-075 |
257.5 |
259.0 |
1.5 |
0.47 |
- |
- |
- |
- |
|
HU-080 |
153.3 |
154.0 |
0.7 |
0.16 |
- |
- |
- |
- |
|
HU-081 |
265.1 |
267.0 |
1.9 |
0.51 |
- |
- |
- |
- |
|
279.8 |
280.2 |
0.4 |
0.33 |
- |
- |
- |
- |
|
|
315.0 |
324.8 |
9.8 |
0.5 |
- |
- |
- |
- |
|
|
334.0 |
343.0 |
9.0 |
0.14 |
- |
- |
- |
- |
|
|
401.0 |
407.0 |
6.0 |
0.17 |
- |
- |
- |
- |
|
|
411.0 |
412.0 |
1.0 |
0.06 |
- |
- |
- |
- |
|
|
HU-083 |
163.0 |
164.0 |
1.0 |
0.32 |
- |
- |
- |
- |
|
170.5 |
173.2 |
2.7 |
0.2 |
- |
- |
- |
- |
|
|
177.4 |
177.7 |
0.3 |
0.25 |
- |
- |
- |
- |
|
|
182.5 |
186.6 |
4.1 |
0.8 |
183.0 |
183.4 |
0.4 |
4.37 |
|
|
HU-084 |
178.8 |
193.3 |
14.5 |
0.15 |
- |
- |
- |
- |
|
197.0 |
198.0 |
1.0 |
0.06 |
- |
- |
- |
- |
|
|
HU-085 |
264.0 |
266.0 |
2.0 |
0.08 |
- |
- |
- |
- |
|
288.0 |
326.5 |
38.5 |
0.21 |
304.9 |
314.5 |
9.6 |
0.35 |
|
|
333.5 |
335.0 |
1.5 |
0.09 |
- |
- |
- |
- |
|
|
HU-087 |
279.0 |
280.0 |
1.0 |
0.6 |
- |
- |
- |
- |
|
HU-088 |
207.3 |
207.8 |
0.5 |
0.09 |
- |
- |
- |
- |
|
209.3 |
210.0 |
0.7 |
0.07 |
- |
- |
- |
- |
|
|
220.6 |
232.6 |
12.0 |
0.13 |
- |
- |
- |
- |
|
|
264.4 |
269.8 |
5.4 |
0.26 |
- |
- |
- |
- |
|
|
286.3 |
289.1 |
2.8 |
0.07 |
- |
- |
- |
- |
|
|
291.4 |
294.7 |
3.3 |
0.08 |
- |
- |
- |
- |
|
|
297.1 |
335.3 |
38.2 |
0.22 |
323.5 |
330.8 |
7.3 |
0.55 |
|
|
HU-089 |
201.3 |
213.4 |
12.1 |
0.17 |
- |
- |
- |
- |
|
243.2 |
243.6 |
0.4 |
0.13 |
- |
- |
- |
- |
|
|
251.0 |
256.0 |
5.0 |
0.05 |
- |
- |
- |
- |
|
|
263.8 |
270.0 |
6.2 |
0.37 |
- |
- |
- |
- |
|
|
HU-090 |
149.0 |
151.0 |
2.0 |
0.1 |
- |
- |
- |
- |
|
310.5 |
314.0 |
3.5 |
0.12 |
- |
- |
- |
- |
|
|
HU-091 |
173.3 |
174.5 |
1.2 |
0.09 |
- |
- |
- |
- |
|
Higher Grade Intervals Within Lower Grades Intersections |
||||||||
| Borehole ID | From* | To* | Length* | %U3O8 | From | To | Length | %U3O8 |
|
187.0 |
194.0 |
7.0 |
0.39 |
- |
- |
- |
- |
|
|
221.0 |
223.1 |
2.1 |
0.21 |
- |
- |
- |
- |
|
|
HU-092 |
162.0 |
164.0 |
2.0 |
0.11 |
- |
- |
- |
- |
|
215.0 |
227.0 |
12.0 |
0.15 |
- |
- |
- |
- |
|
|
243.0 |
245.5 |
2.5 |
0.28 |
- |
- |
- |
- |
|
|
289.0 |
291.0 |
2.0 |
0.07 |
- |
- |
- |
- |
|
|
HU-093 |
179.6 |
202.6 |
23.0 |
0.83 |
180.9 |
181.4 |
0.5 |
10.26 |
|
196.6 |
197.6 |
1.0 |
4.86 |
|||||
|
HU-094 |
249.0 |
254.6 |
5.6 |
0.15 |
- |
- |
- |
- |
|
259.2 |
274.0 |
14.8 |
0.09 |
260.5 |
262.5 |
2.0 |
0.28 |
|
|
293.7 |
295.4 |
1.7 |
0.16 |
- |
- |
- |
- |
|
|
HU-095 |
217.6 |
221.8 |
4.2 |
0.1 |
- |
- |
- |
- |
|
224.7 |
226.0 |
1.3 |
0.92 |
- |
- |
- |
- |
|
|
HU-096 |
140.6 |
142.0 |
1.4 |
0.15 |
- |
- |
- |
- |
|
172.0 |
174.0 |
2.0 |
0.06 |
- |
- |
- |
- |
|
|
181.6 |
186.0 |
4.4 |
0.13 |
- |
- |
- |
- |
|
|
HU-097 |
99.5 |
107.0 |
7.5 |
0.11 |
- |
- |
- |
- |
|
119.0 |
121.0 |
2.0 |
0.24 |
- |
- |
- |
- |
|
|
141.0 |
141.8 |
0.8 |
0.19 |
- |
- |
- |
- |
|
|
HU-098 |
194.0 |
219.4 |
25.4 |
0.22 |
209.5 |
219.4 |
9.9 |
0.41 |
|
236.7 |
243.5 |
6.8 |
0.4 |
236.7 |
258.0 |
21.3 |
0.19 |
|
|
HU-099 |
182.3 |
190.6 |
8.3 |
1.86 |
185.1 |
188.2 |
3.1 |
4.2 |
|
HU-100 |
153.0 |
184.5 |
31.5 |
0.35 |
162.8 |
164.0 |
1.2 |
3.45 |
|
171.4 |
173.0 |
1.6 |
2.13 |
|||||
|
194.0 |
196.0 |
2.0 |
0.27 |
- |
- |
- |
- |
|
|
HU-101 |
162.1 |
184.4 |
22.3 |
0.82 |
169.0 |
171.3 |
2.3 |
1.91 |
|
176.0 |
178.2 |
2.2 |
3.87 |
|||||
|
HU-102 |
196.5 |
203.5 |
7.0 |
0.91 |
- |
- |
- |
- |
|
223.0 |
244.0 |
21.0 |
0.68 |
229.0 |
234.5 |
5.5 |
1.57 |
|
|
256.0 |
264.0 |
8.0 |
0.1 |
- |
- |
- |
- |
|
|
HU-103 |
231.0 |
236.6 |
5.6 |
0.18 |
- |
- |
- |
- |
|
275.0 |
278.0 |
3.0 |
0.39 |
- |
- |
- |
- |
|
|
300.0 |
307.0 |
7.0 |
0.06 |
- |
- |
- |
- |
|
|
320.6 |
332.0 |
11.4 |
0.37 |
- |
- |
- |
- |
|
|
HU-104 |
136.8 |
138.8 |
2.0 |
0.1 |
- |
- |
- |
- |
|
140.3 |
141.8 |
1.5 |
0.08 |
- |
- |
- |
- |
|
|
147.8 |
149.6 |
1.8 |
0.06 |
- |
- |
- |
- |
|
|
151.6 |
169.5 |
17.9 |
0.12 |
- |
- |
- |
- |
|
|
177.3 |
178.4 |
1.1 |
0.12 |
- |
- |
- |
- |
|
|
196.3 |
200.6 |
4.3 |
0.09 |
- |
- |
- |
- |
|
|
HU-105 |
135.0 |
141.0 |
6.0 |
0.05 |
- |
- |
- |
- |
|
152.5 |
154.0 |
1.5 |
0.22 |
- |
- |
- |
- |
|
|
236.0 |
237.9 |
1.9 |
0.08 |
- |
- |
- |
- |
|
|
HU-106 |
180.8 |
185.1 |
4.3 |
2.2 |
- |
- |
- |
- |
|
211.5 |
213.7 |
2.2 |
0.12 |
- |
- |
- |
- |
|
|
HU-107 |
296.0 |
327.0 |
31.0 |
0.18 |
- |
- |
- |
- |
|
352.4 |
353.3 |
0.9 |
0.16 |
- |
- |
- |
- |
|
|
HU-108 |
251.8 |
266.8 |
15.0 |
0.32 |
- |
- |
- |
- |
|
317.8 |
319.8 |
2.0 |
0.11 |
- |
- |
- |
- |
|
|
HU-109 |
272.8 |
274.8 |
2.0 |
0.06 |
- |
- |
- |
- |
|
277.6 |
328.0 |
50.4 |
0.18 |
- |
- |
- |
- |
|
|
286.0 |
298.6 |
12.6 |
0.34 |
- |
- |
- |
- |
|
|
363.0 |
373.0 |
10.0 |
0.12 |
- |
- |
- |
- |
|
|
HU-110 |
172.0 |
173.5 |
1.5 |
0.06 |
- |
- |
- |
- |
|
186.0 |
189.0 |
3.0 |
0.09 |
- |
- |
- |
- |
|
|
266.0 |
267.5 |
1.5 |
0.07 |
- |
- |
- |
- |
|
|
Higher Grade Intervals Within Lower Grades Intersections |
||||||||
| Borehole ID | From* | To* | Length* | %U3O8 | From | To | Length | %U3O8 |
|
275.5 |
276.5 |
1.0 |
0.37 |
- |
- |
- |
- |
|
|
HU-111 |
163.5 |
183.9 |
20.4 |
0.36 |
179.2 |
183.9 |
4.7 |
1.27 |
|
204.6 |
206.7 |
2.1 |
0.42 |
- |
- |
- |
- |
|
|
HU-112 |
237.0 |
238.0 |
1.0 |
0.21 |
- |
- |
- |
- |
|
242.8 |
258.9 |
16.1 |
0.31 |
- |
- |
- |
- |
|
|
HU-113 |
256.5 |
271.9 |
15.4 |
0.73 |
256.5 |
259.0 |
2.5 |
1.78 |
|
266.4 |
271.9 |
5.5 |
1.2 |
|||||
|
270.2 |
271.6 |
1.4 |
3.33 |
|||||
|
HU-114 |
225.8 |
227.5 |
1.7 |
0.08 |
- |
- |
- |
- |
|
230.2 |
235.5 |
5.3 |
0.28 |
- |
- |
- |
- |
|
|
HU-115 |
299.7 |
302.0 |
2.3 |
0.1 |
- |
- |
- |
- |
|
HU-114 |
311.4 |
312.9 |
1.5 |
0.08 |
- |
- |
- |
- |
|
HU-116 |
139.7 |
140.3 |
0.6 |
0.26 |
- |
- |
- |
- |
|
304.7 |
310.0 |
5.3 |
0.2 |
- |
- |
- |
- |
|
|
HU-117 |
264.7 |
329.7 |
65.0 |
0.16 |
264.7 |
266.2 |
1.5 |
0.59 |
|
273.2 |
286.8 |
13.6 |
0.27 |
|||||
|
319.4 |
327.0 |
7.6 |
0.37 |
|||||
|
HU-118 |
170.9 |
187.0 |
16.1 |
0.34 |
180.2 |
187.0 |
6.8 |
0.68 |
|
192.0 |
195.0 |
3.0 |
0.07 |
- |
- |
- |
- |
|
|
HU-119 |
246.0 |
248.3 |
2.3 |
0.22 |
- |
- |
- |
- |
|
273.3 |
274.2 |
0.9 |
0.11 |
- |
- |
- |
- |
|
|
290.0 |
346.4 |
56.4 |
0.22 |
291.8 |
302.3 |
10.5 |
0.36 |
|
|
HU-120 |
131.6 |
132.8 |
1.2 |
0.39 |
- |
- |
- |
- |
|
172.2 |
174.7 |
2.5 |
0.08 |
- |
- |
- |
- |
|
|
178.2 |
179.0 |
0.8 |
0.14 |
- |
- |
- |
- |
|
|
194.6 |
195.9 |
1.3 |
0.23 |
- |
- |
- |
- |
|
|
207.1 |
207.5 |
0.4 |
0.3 |
- |
- |
- |
- |
|
|
HU-121 |
266.0 |
269.0 |
3.0 |
0.09 |
- |
- |
- |
- |
|
HU-121 |
345.0 |
347.3 |
2.3 |
0.22 |
- |
- |
- |
- |
|
HU-122 |
199.4 |
199.9 |
0.5 |
0.25 |
- |
- |
- |
- |
|
HU-123 |
285.0 |
317.0 |
32.0 |
0.26 |
296.7 |
308.6 |
11.9 |
0.51 |
|
HU-124 |
208.2 |
208.7 |
0.5 |
0.25 |
- |
- |
- |
- |
|
HU-126 |
190.5 |
213.6 |
23.1 |
0.65 |
199.9 |
205.0 |
5.2 |
1.89 |
|
HU-129 |
187.2 |
190.4 |
3.2 |
0.36 |
- |
- |
- |
- |
|
HU-130 |
288.9 |
304.9 |
16.0 |
0.64 |
298.4 |
304.1 |
5.7 |
1.15 |
|
HU-131 |
252.5 |
269.5 |
17.0 |
0.25 |
- |
- |
- |
- |
|
277.0 |
279.0 |
2.0 |
0.1 |
- |
- |
- |
- |
|
|
290.0 |
290.6 |
0.6 |
0.18 |
- |
- |
- |
- |
|
|
300.0 |
307.0 |
7.0 |
0.1 |
- |
- |
- |
- |
|
|
HU-132 |
272.6 |
274.6 |
2.0 |
0.14 |
- |
- |
- |
- |
|
290.0 |
291.3 |
1.3 |
0.08 |
- |
- |
- |
- |
|
|
314.7 |
319.3 |
4.6 |
0.14 |
- |
- |
- |
- |
|
|
HU-133 |
254.2 |
298.0 |
43.8 |
0.28 |
- |
- |
- |
- |
|
HU-134 |
136.4 |
138.2 |
1.8 |
0.08 |
- |
- |
- |
- |
|
211.0 |
213.4 |
2.4 |
0.14 |
- |
- |
- |
- |
|
|
225.0 |
226.8 |
1.8 |
0.16 |
- |
- |
- |
- |
|
|
243.9 |
281.5 |
37.6 |
0.65 |
248.6 |
280.3 |
31.7 |
0.75 |
|
|
272.2 |
278.3 |
6.1 |
3 |
|||||
|
HU-135 |
278.0 |
278.6 |
0.6 |
0.2 |
- |
- |
- |
- |
|
286.9 |
299.4 |
12.5 |
0.1 |
- |
- |
- |
- |
|
|
358.0 |
361.5 |
3.5 |
0.05 |
- |
- |
- |
- |
|
|
HU-136 |
257.5 |
279.0 |
21.5 |
0.27 |
257.5 |
262.0 |
4.5 |
0.75 |
|
295.0 |
296.0 |
1.0 |
0.25 |
- |
- |
- |
- |
|
|
302.5 |
313.0 |
10.5 |
0.36 |
- |
- |
- |
- |
|
|
325.0 |
326.0 |
1.0 |
0.21 |
- |
- |
- |
- |
|
|
HU-137 |
225.8 |
231.7 |
5.9 |
0.25 |
- |
- |
- |
- |
|
Higher Grade Intervals Within Lower Grades Intersections |
||||||||
| Borehole ID | From* | To* | Length* | %U3O8 | From | To | Length | %U3O8 |
|
259.3 |
260.7 |
1.4 |
0.67 |
- |
- |
- |
- |
|
|
HU-138 |
266.7 |
269.6 |
2.9 |
0.25 |
- |
- |
- |
- |
|
282.9 |
310.0 |
27.1 |
0.34 |
289.5 |
295.8 |
6.3 |
0.98 |
|
|
333.6 |
335.3 |
1.7 |
0.06 |
- |
- |
- |
- |
|
|
HU-139 |
187.2 |
191.9 |
4.7 |
0.05 |
- |
- |
- |
- |
|
200.6 |
212.0 |
11.4 |
0.32 |
- |
- |
- |
- |
|
|
HU-140 |
179.0 |
187.2 |
8.2 |
0.2 |
- |
- |
- |
- |
|
HU-143 |
319.5 |
321.8 |
2.3 |
0.1 |
- |
- |
- |
- |
|
327.3 |
329.0 |
1.7 |
0.4 |
- |
- |
- |
- |
|
|
HU-144 |
136.8 |
138.5 |
1.7 |
0.1 |
- |
- |
- |
- |
|
238.6 |
276.0 |
37.4 |
0.47 |
253.0 |
259.2 |
6.2 |
1.08 |
|
|
268.9 |
276.0 |
7.1 |
1 |
|||||
|
HU-145 |
157.6 |
167.6 |
10.0 |
0.06 |
- |
- |
- |
- |
|
196.0 |
201.3 |
5.3 |
0.1 |
- |
- |
- |
- |
|
|
HU-146 |
148.4 |
156.5 |
8.1 |
0.11 |
- |
- |
- |
- |
|
207.8 |
214.8 |
7.0 |
0.17 |
- |
- |
- |
- |
|
|
HU-147 |
276.0 |
277.1 |
1.1 |
0.17 |
- |
- |
- |
- |
|
281.1 |
303.3 |
22.2 |
0.22 |
- |
- |
- |
- |
|
|
HU-150 |
233.8 |
239.7 |
5.9 |
0.26 |
- |
- |
- |
- |
|
250.6 |
260.0 |
9.4 |
0.18 |
- |
- |
- |
- |
|
|
HU-151 |
107.8 |
109.5 |
1.7 |
0.07 |
- |
- |
- |
- |
|
132.8 |
134.5 |
1.7 |
0.11 |
- |
- |
- |
- |
|
|
225.9 |
236.0 |
10.1 |
0.12 |
- |
- |
- |
- |
|
|
257.5 |
262.0 |
4.5 |
0.31 |
- |
- |
- |
- |
|
|
273.0 |
273.9 |
0.9 |
0.14 |
- |
- |
- |
- |
|
|
HU-152 |
244.8 |
247.3 |
2.5 |
0.28 |
- |
- |
- |
- |
|
HU-153 |
153.7 |
156.7 |
3.0 |
0.06 |
- |
- |
- |
- |
|
281.0 |
299.0 |
18.0 |
0.12 |
- |
- |
- |
- |
|
|
311.9 |
315.5 |
3.6 |
0.26 |
- |
- |
- |
- |
|
|
331.1 |
333.9 |
2.8 |
0.44 |
- |
- |
- |
- |
|
|
HU-155 |
307.0 |
322.5 |
15.5 |
0.19 |
- |
- |
- |
- |
|
HU-156 |
168.8 |
187.0 |
18.2 |
1.01 |
- |
- |
- |
- |
|
HU-157 |
285.5 |
320.4 |
34.9 |
0.13 |
- |
- |
- |
- |
|
HU-158 |
257.1 |
265.7 |
8.6 |
0.21 |
- |
- |
- |
- |
|
306.6 |
330.0 |
23.4 |
0.34 |
317.2 |
317.7 |
0.5 |
3.83 |
|
|
HU-159 |
389.6 |
390.6 |
1.0 |
0.11 |
- |
- |
- |
- |
|
HU-160 |
270.0 |
280.9 |
10.9 |
0.07 |
- |
- |
- |
- |
|
287.5 |
293.0 |
5.5 |
0.07 |
- |
- |
- |
- |
|
|
313.4 |
314.5 |
1.1 |
0.09 |
- |
- |
- |
- |
|
|
440.5 |
443.2 |
2.7 |
0.12 |
- |
- |
- |
- |
|
|
452.5 |
463.2 |
10.7 |
0.14 |
- |
- |
- |
- |
|
|
HU-161 |
130.0 |
131.5 |
1.5 |
0.14 |
- |
- |
- |
- |
|
247.7 |
249.0 |
1.3 |
0.11 |
- |
- |
- |
- |
|
|
279.0 |
292.8 |
13.8 |
0.45 |
287.8 |
288.7 |
0.9 |
5.19 |
|
|
HU-162 |
131.3 |
133.8 |
2.5 |
0.1 |
- |
- |
- |
- |
|
220.7 |
221.8 |
1.1 |
0.4 |
- |
- |
- |
- |
|
|
HU-163 |
301.0 |
302.7 |
1.7 |
0.16 |
- |
- |
- |
- |
|
326.5 |
348.0 |
21.5 |
0.29 |
329.5 |
337.2 |
7.7 |
0.58 |
|
|
HU-164 |
155.4 |
164.0 |
8.6 |
0.08 |
- |
- |
- |
- |
|
245.2 |
247.0 |
1.8 |
0.09 |
- |
- |
- |
- |
|
|
263.0 |
266.5 |
3.5 |
0.1 |
- |
- |
- |
- |
|
|
276.5 |
284.0 |
7.9 |
0.21 |
- |
- |
- |
- |
|
|
HU-166 |
291.5 |
303.0 |
11.5 |
0.15 |
- |
- |
- |
- |
|
319.0 |
325.0 |
6.0 |
0.07 |
- |
- |
- |
- |
|
|
HU-167 |
243.0 |
244.0 |
1.0 |
0.15 |
- |
- |
- |
- |
|
HU-168 |
286.6 |
335.8 |
49.2 |
0.12 |
286.6 |
293.0 |
6.4 |
0.24 |
|
Higher Grade Intervals Within Lower Grades Intersections |
||||||||
| Borehole ID | From* | To* | Length* | %U3O8 | From | To | Length | %U3O8 |
|
HU-169 |
320.5 |
326.5 |
6.0 |
0.3 |
- |
- |
- |
- |
|
HU-170 |
309.8 |
312.6 |
2.8 |
0.42 |
- |
- |
- |
- |
|
HU-171 |
235.3 |
236.9 |
1.6 |
0.33 |
- |
- |
- |
- |
|
309.8 |
333.9 |
24.1 |
0.31 |
- |
- |
- |
- |
|
|
HU-173 |
243.0 |
250.8 |
7.8 |
0.07 |
- |
- |
- |
- |
|
258.2 |
258.7 |
0.5 |
0.09 |
- |
- |
- |
- |
|
|
271.0 |
273.3 |
2.3 |
0.17 |
- |
- |
- |
- |
|
|
287.0 |
296.6 |
9.6 |
0.21 |
- |
- |
- |
- |
|
|
305.0 |
309.5 |
4.5 |
0.07 |
- |
- |
- |
- |
|
|
319.6 |
329.0 |
9.4 |
0.08 |
- |
- |
- |
- |
|
|
HU-175 |
116.3 |
120.5 |
4.2 |
0.1 |
- |
- |
- |
- |
|
136.0 |
137.0 |
1.0 |
0.19 |
- |
- |
- |
- |
|
|
183.3 |
185.4 |
2.1 |
0.07 |
- |
- |
- |
- |
|
|
211.5 |
230.0 |
18.5 |
0.12 |
- |
- |
- |
- |
|
|
252.1 |
276.4 |
24.3 |
0.25 |
252.1 |
255.4 |
3.3 |
0.66 |
|
|
267.2 |
268.7 |
1.5 |
1.35 |
|||||
|
HU-177 |
400.4 |
402.5 |
2.1 |
0.09 |
- |
- |
- |
- |
|
HU-178 |
130.8 |
131.6 |
0.8 |
0.14 |
- |
- |
- |
- |
|
275.2 |
276.3 |
1.1 |
0.19 |
- |
- |
- |
- |
|
|
281.5 |
291.3 |
9.8 |
0.35 |
288.7 |
290.3 |
1.6 |
1.02 |
|
|
HU-180 |
216.0 |
217.4 |
1.4 |
0.09 |
- |
- |
- |
- |
|
220.8 |
221.7 |
0.9 |
0.08 |
- |
- |
- |
- |
|
|
244.1 |
252.4 |
8.3 |
0.1 |
- |
- |
- |
- |
|
|
261.0 |
279.6 |
18.6 |
0.32 |
- |
- |
- |
- |
|
|
HU-182 |
172.7 |
183.0 |
10.3 |
0.87 |
- |
- |
- |
- |
|
HU-183 |
106.9 |
112.7 |
5.8 |
0.17 |
- |
- |
- |
- |
|
115.9 |
117.0 |
1.1 |
0.2 |
- |
- |
- |
- |
|
|
240.9 |
243.0 |
2.1 |
0.09 |
- |
- |
- |
- |
|
|
269.3 |
275.3 |
6.0 |
0.22 |
- |
- |
- |
- |
|
|
HU-184 |
181.5 |
195.8 |
14.3 |
0.28 |
- |
- |
- |
- |
|
HU-185 |
182.4 |
186.7 |
4.3 |
0.31 |
- |
- |
- |
- |
|
HU-188 |
166.2 |
173.3 |
7.1 |
0.25 |
- |
- |
- |
- |
|
HU-189 |
164.5 |
166.0 |
1.5 |
0.12 |
- |
- |
- |
- |
|
176.9 |
188.0 |
11.1 |
0.18 |
- |
- |
- |
- |
|
|
HU-190 |
96.2 |
97.7 |
1.5 |
0.15 |
- |
- |
- |
- |
|
120.5 |
127.1 |
6.6 |
0.15 |
- |
- |
- |
- |
|
|
192.5 |
194.1 |
1.6 |
0.19 |
- |
- |
- |
- |
|
|
HU-192 |
166.0 |
167.0 |
1.0 |
0.13 |
- |
- |
- |
- |
|
192.5 |
194.5 |
2.0 |
0.2 |
- |
- |
- |
- |
|
|
HU-193 |
176.0 |
176.8 |
0.8 |
0.2 |
- |
- |
- |
- |
|
200.1 |
201.9 |
1.8 |
0.78 |
- |
- |
- |
- |
|
|
HU-193 |
206.5 |
207.2 |
0.7 |
0.45 |
- |
- |
- |
- |
|
HU-194 |
146.0 |
149.0 |
3.0 |
0.1 |
- |
- |
- |
- |
|
153.0 |
156.5 |
3.5 |
0.6 |
- |
- |
- |
- |
|
|
179.0 |
180.5 |
1.5 |
0.49 |
- |
- |
- |
- |
|
|
HU-195 |
195.7 |
196.6 |
0.9 |
0.43 |
- |
- |
- |
- |
|
HU-197 |
135.0 |
138.2 |
3.2 |
0.22 |
- |
- |
- |
- |
|
HU-198 |
155.0 |
157.0 |
2.0 |
0.11 |
- |
- |
- |
- |
|
166.8 |
168.5 |
1.7 |
0.07 |
- |
- |
- |
- |
|
|
209.8 |
210.4 |
0.6 |
0.73 |
- |
- |
- |
- |
|
|
HU-199 |
111.8 |
125.0 |
13.2 |
0.21 |
- |
- |
- |
- |
|
205.8 |
206.7 |
0.9 |
0.38 |
- |
- |
- |
- |
|
|
HU-200 |
99.5 |
100.0 |
0.5 |
0.65 |
- |
- |
- |
- |
|
140.0 |
142.0 |
2.0 |
0.13 |
- |
- |
- |
- |
|
|
221.7 |
230.2 |
8.5 |
0.15 |
- |
- |
- |
- |
|
|
HU-201 |
214.7 |
216.0 |
1.3 |
0.19 |
- |
- |
- |
- |
|
Higher Grade Intervals Within Lower Grades Intersections |
||||||||
| Borehole ID | From* | To* | Length* | %U3O8 | From | To | Length | %U3O8 |
|
HU-205 |
167.9 |
168.8 |
0.9 |
0.54 |
- |
- |
- |
- |
|
HU-208 |
243.7 |
248.0 |
4.3 |
0.12 |
- |
- |
- |
- |
|
288.5 |
302.1 |
13.6 |
0.23 |
- |
- |
- |
- |
|
|
HU-209 |
210.5 |
211.3 |
0.8 |
2.81 |
- |
- |
- |
- |
|
HU-212 |
137.0 |
138.5 |
1.5 |
0.12 |
- |
- |
- |
- |
|
211.0 |
212.6 |
1.6 |
0.39 |
- |
- |
- |
- |
|
|
243.0 |
245.6 |
2.6 |
0.08 |
- |
- |
- |
- |
|
|
252.8 |
272.4 |
19.6 |
0.34 |
- |
- |
- |
- |
|
|
HU-213 |
135.8 |
136.9 |
1.1 |
0.17 |
- |
- |
- |
- |
|
HU-214 |
131.2 |
132.2 |
1.0 |
0.64 |
- |
- |
- |
- |
|
137.9 |
139.5 |
1.6 |
0.87 |
- |
- |
- |
- |
|
|
171.3 |
173.0 |
1.7 |
0.18 |
- |
- |
- |
- |
|
|
HU-216 |
122.0 |
123.4 |
1.4 |
0.08 |
- |
- |
- |
- |
|
237.0 |
245.2 |
8.2 |
0.16 |
- |
- |
- |
- |
|
|
257.0 |
259.0 |
2.0 |
0.12 |
- |
- |
- |
- |
|
|
274.6 |
285.0 |
10.4 |
0.22 |
- |
- |
- |
- |
|
|
320.0 |
320.6 |
0.6 |
0.21 |
- |
- |
- |
- |
|
|
HU-217 |
187.4 |
205.5 |
18.1 |
0.29 |
- |
- |
- |
- |
|
HU-220 |
122.0 |
156.0 |
34.0 |
0.27 |
- |
- |
- |
- |
|
HU-221 |
134.9 |
137.0 |
2.1 |
0.12 |
- |
- |
- |
- |
|
278.5 |
281.5 |
3.0 |
0.09 |
- |
- |
- |
- |
|
|
286.7 |
307.6 |
20.9 |
0.16 |
- |
- |
- |
- |
|
|
HU-223 |
104.5 |
131.1 |
26.6 |
0.23 |
- |
- |
- |
- |
|
HU-225 |
155.7 |
162.8 |
7.1 |
0.39 |
- |
- |
- |
- |
|
183.3 |
184.2 |
0.9 |
0.77 |
- |
- |
- |
- |
|
|
HU-226 |
185.8 |
189.3 |
3.5 |
0.36 |
- |
- |
- |
- |
|
HU-228 |
132.0 |
135.0 |
3.0 |
0.05 |
- |
- |
- |
- |
|
142.0 |
143.0 |
1.0 |
0.21 |
- |
- |
- |
- |
|
|
HU-232 |
184.0 |
184.8 |
0.8 |
0.36 |
- |
- |
- |
- |
|
204.5 |
207.2 |
2.7 |
0.37 |
- |
- |
- |
- |
|
|
HU-235 |
167.0 |
185.0 |
18.0 |
0.1 |
- |
- |
- |
- |
|
HU-240 |
120.4 |
123.0 |
2.6 |
0.2 |
- |
- |
- |
- |
|
191.0 |
194.2 |
3.2 |
0.18 |
- |
- |
- |
- |
|
|
200.0 |
205.4 |
5.4 |
0.05 |
- |
- |
- |
- |
|
|
211.3 |
212.0 |
0.7 |
0.69 |
- |
- |
- |
- |
|
|
HU-242 |
192.0 |
193.8 |
1.8 |
2.84 |
- |
- |
- |
- |
|
HU-246 |
236.8 |
237.6 |
0.8 |
0.42 |
- |
- |
- |
- |
|
HU-247 |
131.7 |
134.0 |
2.3 |
0.09 |
- |
- |
- |
- |
|
175.0 |
177.0 |
2.0 |
0.07 |
- |
- |
- |
- |
|
|
206.6 |
216.2 |
9.6 |
0.81 |
- |
- |
- |
- |
|
|
HU-249 |
199.0 |
200.3 |
1.3 |
0.13 |
- |
- |
- |
- |
|
206.0 |
207.5 |
1.5 |
0.13 |
- |
- |
- |
- |
|
|
215.7 |
216.3 |
0.6 |
0.65 |
- |
- |
- |
- |
|
|
HU-252 |
224.3 |
225.5 |
1.2 |
0.07 |
- |
- |
- |
- |
|
HU-254 |
199.5 |
203.3 |
3.8 |
0.81 |
- |
- |
- |
- |
|
HU-257 |
208.3 |
209.7 |
1.4 |
0.7 |
- |
- |
- |
- |
|
290.4 |
291.5 |
1.1 |
0.13 |
- |
- |
- |
- |
|
|
296.4 |
296.9 |
0.5 |
0.38 |
- |
- |
- |
- |
|
|
318.3 |
319.5 |
1.2 |
0.1 |
- |
- |
- |
- |
|
|
HU-259 |
322.7 |
323.9 |
1.2 |
0.46 |
- |
- |
- |
- |
|
340.2 |
340.7 |
0.5 |
0.3 |
- |
- |
- |
- |
|
|
HU-269 |
128.6 |
129.2 |
0.6 |
0.499 |
- |
- |
- |
- |
|
HU-270 |
173.5 |
179.1 |
5.6 |
0.358 |
178.7 |
179.1 |
0.4 |
4.197 |
|
HU-281 |
211.9 |
213.2 |
1.3 |
0.234 |
- |
- |
- |
- |
|
HU-282 |
166.7 |
174.3 |
7.6 |
0.885 |
172.6 |
174.3 |
1.7 |
3.048 |
|
HU-283 |
296.2 |
297.1 |
0.9 |
0.629 |
- |
- |
- |
- |
|
Higher Grade Intervals Within Lower Grades Intersections |
||||||||
| Borehole ID | From* | To* | Length* | %U3O8 | From | To | Length | %U3O8 |
|
HU-284 |
133.5 |
171.2 |
37.7 |
0.073 |
155.4 |
157.4 |
2.0 |
0.378 |
|
183.2 |
185.0 |
1.8 |
0.081 |
- |
- |
- |
- |
|
|
HU-286 |
189.0 |
196.3 |
7.3 |
0.457 |
191.0 |
192.0 |
1.0 |
1.58 |
|
207.0 |
207.6 |
0.6 |
0.506 |
- |
- |
- |
- |
|
|
HU-287 |
160.7 |
162.4 |
1.7 |
0.094 |
- |
- |
- |
- |
|
255.0 |
258.0 |
3.0 |
0.058 |
- |
- |
- |
- |
|
|
285.0 |
285.7 |
0.7 |
0.391 |
- |
- |
- |
- |
|
|
HU-288 |
178.0 |
186.0 |
8.0 |
0.229 |
- |
- |
- |
- |
|
HU-289 |
232.0 |
239.7 |
7.7 |
0.58 |
232.0 |
233.9 |
1.9 |
1.492 |
|
315.9 |
317.5 |
1.6 |
0.196 |
- |
- |
- |
- |
|
|
350.1 |
373.1 |
23.0 |
0.567 |
354.9 |
358.7 |
3.8 |
1.28 |
|
|
355.8 |
356.5 |
0.7 |
4.598 |
|||||
|
369.1 |
372.8 |
3.7 |
1.903 |
|||||
|
369.6 |
370.2 |
0.6 |
5.706 |
|||||
|
HU-291 |
143.8 |
178.0 |
34.2 |
0.225 |
- |
- |
- |
- |
|
172.4 |
178.0 |
5.6 |
0.395 |
- |
- |
- |
- |
|
|
HU-292 |
276.5 |
277.5 |
1.0 |
0.117 |
- |
- |
- |
- |
|
331.5 |
332.0 |
0.5 |
1.486 |
- |
- |
- |
- |
|
|
HU-294 |
212.7 |
214.4 |
1.7 |
0.088 |
- |
- |
- |
- |
|
HU-295 |
154.5 |
155.5 |
1.0 |
0.134 |
- |
- |
- |
- |
|
174.6 |
179.0 |
4.4 |
0.129 |
- |
- |
- |
- |
|
|
287.0 |
287.4 |
0.4 |
1.191 |
- |
- |
- |
- |
|
|
296.4 |
296.8 |
0.4 |
0.495 |
- |
- |
- |
- |
|
|
HU-296 |
191.2 |
195.0 |
3.8 |
0.108 |
- |
- |
- |
- |
|
HU-297 |
274.5 |
276.1 |
1.6 |
0.358 |
- |
- |
- |
- |
|
281.9 |
285.0 |
3.1 |
0.055 |
- |
- |
- |
- |
|
|
292.4 |
294.0 |
1.6 |
0.198 |
- |
- |
- |
- |
|
|
308.1 |
333.1 |
25.0 |
0.176 |
- |
- |
- |
- |
|
|
339.5 |
344.0 |
4.5 |
0.135 |
- |
- |
- |
- |
|
|
HU-298 |
346.2 |
347.5 |
1.3 |
1.493 |
- |
- |
- |
- |
|
374.0 |
377.0 |
3.0 |
0.05 |
- |
- |
- |
- |
|
|
392.5 |
397.2 |
4.7 |
0.178 |
- |
- |
- |
- |
|
|
HU-300 |
303.8 |
305.6 |
1.8 |
0.085 |
- |
- |
- |
- |
|
313.6 |
314.9 |
1.3 |
0.147 |
- |
- |
- |
- |
|
|
HU-301 |
153.2 |
191.0 |
37.8 |
0.098 |
186.9 |
189.2 |
2.3 |
0.792 |
|
HU-302 |
342.5 |
384.0 |
41.5 |
0.258 |
342.5 |
345.5 |
3.0 |
0.814 |
|
357.9 |
358.6 |
0.7 |
3.985 |
|||||
|
377.0 |
384.0 |
7.0 |
0.449 |
|||||
|
413.5 |
414.5 |
1.0 |
0.154 |
- |
- |
- |
- |
|
|
HU-304 |
158.9 |
164.0 |
5.1 |
0.068 |
- |
- |
- |
- |
|
184.0 |
185.8 |
1.8 |
0.092 |
- |
- |
- |
- |
|
|
HU-305 |
224.0 |
225.5 |
1.5 |
0.111 |
- |
- |
- |
- |
|
261.5 |
266.5 |
5.0 |
0.089 |
- |
- |
- |
- |
|
|
HU-306 |
94.0 |
99.0 |
5.0 |
0.105 |
- |
- |
- |
- |
|
133.0 |
140.5 |
7.5 |
0.104 |
- |
- |
- |
- |
|
|
218.0 |
219.0 |
1.0 |
0.137 |
- |
- |
- |
- |
|
|
HU-307 |
152.6 |
154.7 |
2.1 |
0.111 |
- |
- |
- |
- |
|
166.7 |
168.3 |
1.6 |
0.08 |
- |
- |
- |
- |
|
|
177.1 |
189.0 |
11.9 |
0.055 |
- |
- |
- |
- |
|
|
HU-308 |
126.3 |
167.0 |
41.2 |
0.066 |
- |
- |
- |
- |
|
267.0 |
284.3 |
17.3 |
0.078 |
- |
- |
- |
- |
|
|
HU-310 |
317.8 |
325.6 |
7.8 |
0.073 |
- |
- |
- |
- |
|
341.0 |
352.0 |
11.0 |
0.089 |
- |
- |
- |
- |
|
|
363.0 |
364.0 |
1.0 |
0.22 |
- |
- |
- |
- |
|
|
HU-311 |
166.6 |
181.6 |
15.0 |
0.082 |
- |
- |
- |
- |
|
254.1 |
256.0 |
1.9 |
0.366 |
- |
- |
- |
- |
|
|
Higher Grade Intervals Within Lower Grades Intersections |
||||||||
| Borehole ID | From* | To* | Length* | %U3O8 | From | To | Length | %U3O8 |
|
HU-314 |
110.3 |
116.0 |
5.7 |
0.111 |
- |
- |
- |
- |
|
166.0 |
169.0 |
3.0 |
0.067 |
- |
- |
- |
- |
|
|
177.0 |
179.0 |
2.0 |
0.061 |
- |
- |
- |
- |
|
|
HU-315 |
300.0 |
303.0 |
3.0 |
0.093 |
- |
- |
- |
- |
|
323.7 |
325.0 |
1.3 |
0.079 |
- |
- |
- |
- |
|
|
377.6 |
378.2 |
0.6 |
0.656 |
- |
- |
- |
- |
|
|
HU-316 |
168.0 |
176.0 |
8.0 |
0.187 |
- |
- |
- |
- |
|
225.0 |
225.4 |
0.4 |
0.406 |
- |
- |
- |
- |
|
|
248.5 |
249.5 |
1.0 |
0.291 |
- |
- |
- |
- |
|
|
289.2 |
291.0 |
1.8 |
0.067 |
- |
- |
- |
- |
|
|
HU-317 |
145.0 |
146.0 |
1.0 |
0.212 |
- |
- |
- |
- |
|
157.6 |
157.9 |
0.3 |
0.891 |
- |
- |
- |
- |
|
|
174.7 |
181.7 |
7.0 |
0.071 |
- |
- |
- |
- |
|
|
HU-319 |
214.0 |
216.4 |
2.4 |
0.106 |
- |
- |
- |
- |
|
HU-320 |
385.0 |
386.0 |
1.0 |
0.111 |
- |
- |
- |
- |
|
HU-321 |
151.0 |
172.0 |
21.0 |
0.068 |
- |
- |
- |
- |
|
HU-323 |
211.0 |
213.0 |
2.0 |
0.107 |
- |
- |
- |
- |
|
HU-324 |
179.6 |
180.2 |
0.6 |
0.248 |
- |
- |
- |
- |
|
362.5 |
363.7 |
1.2 |
0.315 |
- |
- |
- |
- |
|
|
379.6 |
399.2 |
19.6 |
0.22 |
396.1 |
399.2 |
3.1 |
1.089 |
|
|
HU-327 |
273.4 |
275.2 |
1.8 |
0.084 |
- |
- |
- |
- |
|
HU-328 |
357.0 |
358.0 |
1.0 |
0.413 |
- |
- |
- |
- |
|
361.0 |
362.0 |
1.0 |
0.146 |
- |
- |
- |
- |
|
|
396.9 |
397.8 |
0.9 |
0.151 |
- |
- |
- |
- |
|
|
HU-329 |
33.0 |
33.7 |
0.7 |
0.613 |
- |
- |
- |
- |
|
41.0 |
43.1 |
2.1 |
0.23 |
- |
- |
- |
- |
|
|
HU-330 |
344.5 |
345.2 |
0.7 |
0.443 |
- |
- |
- |
- |
|
HU-331 |
295.5 |
321.0 |
25.5 |
0.192 |
295.5 |
297.0 |
1.5 |
1.517 |
|
HU-332 |
265.0 |
268.0 |
3.0 |
0.096 |
- |
- |
- |
- |
|
277.4 |
278.0 |
0.6 |
0.198 |
- |
- |
- |
- |
|
|
HU-333 |
138.0 |
140.2 |
2.2 |
0.077 |
- |
- |
- |
- |
|
147.0 |
156.0 |
9.0 |
0.068 |
- |
- |
- |
- |
|
|
168.5 |
175.5 |
7.0 |
0.05 |
- |
- |
- |
- |
|
|
186.5 |
196.5 |
10.0 |
0.051 |
- |
- |
- |
- |
|
|
HU-334 |
185.0 |
188.0 |
3.0 |
0.06 |
- |
- |
- |
- |
|
HU-337 |
102.0 |
104.0 |
2.0 |
0.055 |
- |
- |
- |
- |
|
HU-339 |
45.4 |
46.4 |
1.0 |
0.354 |
- |
- |
- |
- |
|
HU-341 |
216.0 |
218.0 |
2.0 |
0.07 |
- |
- |
- |
- |
|
HU-343 |
203.7 |
208.0 |
4.3 |
0.134 |
- |
- |
- |
- |
|
223.0 |
225.0 |
2.0 |
0.059 |
- |
- |
- |
- |
|
|
HU-345 |
180.0 |
182.0 |
2.0 |
0.058 |
- |
- |
- |
- |
|
HU-347 |
107.0 |
109.0 |
2.0 |
0.118 |
- |
- |
- |
- |
|
180.0 |
185.0 |
5.0 |
0.064 |
- |
- |
- |
- |
|
|
HU-348 |
143.5 |
147.0 |
3.5 |
0.077 |
- |
- |
- |
- |
|
HU-349 |
108.9 |
111.3 |
2.4 |
0.115 |
- |
- |
- |
- |
|
162.0 |
166.3 |
4.3 |
0.144 |
- |
- |
- |
- |
|
|
213.9 |
215.4 |
1.5 |
0.199 |
- |
- |
- |
- |
|
|
253.4 |
256.6 |
3.2 |
0.687 |
- |
- |
- |
- |
|
|
264.6 |
265.6 |
1.0 |
0.153 |
- |
- |
- |
- |
|
|
274.6 |
276.0 |
1.4 |
0.18 |
- |
- |
- |
- |
|
|
303.0 |
308.6 |
5.6 |
0.183 |
- |
- |
- |
- |
|
|
332.6 |
334.9 |
2.3 |
0.053 |
- |
- |
- |
- |
|
|
348.0 |
349.0 |
1.0 |
0.108 |
- |
- |
- |
- |
|
|
355.0 |
356.8 |
1.8 |
0.244 |
- |
- |
- |
- |
|
|
372.5 |
376.0 |
3.5 |
0.061 |
- |
- |
- |
- |
|
|
387.0 |
390.0 |
3.0 |
0.196 |
- |
- |
- |
- |
|
|
433.0 |
438.0 |
5.0 |
0.076 |
- |
- |
- |
- |
|
|
Higher Grade Intervals Within Lower Grades Intersections |
||||||||
| Borehole ID | From* | To* | Length* | %U3O8 | From | To | Length | %U3O8 |
|
476.0 |
503.0 |
27.0 |
0.068 |
- |
- |
- |
- |
|
|
HU-350 |
178.5 |
189.5 |
11.0 |
0.078 |
- |
- |
- |
- |
|
HU-361 |
71.0 |
72.0 |
1.0 |
0.032 |
- |
- |
- |
- |
|
120.0 |
124.0 |
4.0 |
0.076 |
- |
- |
- |
- |
|
|
133.0 |
136.0 |
3.0 |
0.107 |
- |
- |
- |
- |
|
|
133.4 |
135.5 |
2.1 |
0.14 |
- |
- |
- |
- |
|
|
220.5 |
223.0 |
2.5 |
0.034 |
- |
- |
- |
- |
|
|
HU-365 |
271.0 |
272.0 |
1.0 |
0.023 |
- |
- |
- |
- |
|
HU-368 |
176.0 |
188.0 |
12.0 |
0.177 |
184.0 |
188.0 |
4.0 |
0.279 |
|
213.0 |
227.0 |
14.0 |
0.054 |
- |
- |
- |
- |
|
|
232.0 |
233.0 |
1.0 |
0.123 |
- |
- |
- |
- |
|
|
240.0 |
245.0 |
5.0 |
0.182 |
- |
- |
- |
- |
|
|
259.5 |
263.0 |
3.5 |
0.072 |
- |
- |
- |
- |
|
|
HU-369 |
206.5 |
208.5 |
2.0 |
0.352 |
- |
- |
- |
- |
|
HU-370 |
318.0 |
319.0 |
1.0 |
0.104 |
- |
- |
- |
- |
|
332.0 |
364.0 |
32.0 |
0.098 |
- |
- |
- |
- |
|
|
332.5 |
340.0 |
7.5 |
0.199 |
- |
- |
- |
- |
|
|
HU-371 |
273.5 |
285.0 |
11.5 |
0.055 |
- |
- |
- |
- |
|
299.5 |
302.0 |
2.5 |
0.092 |
- |
- |
- |
- |
|
|
319.0 |
330.0 |
11.0 |
0.495 |
321.0 |
325.0 |
4.0 |
1.143 |
|
|
321.5 |
322.5 |
1.0 |
3.295 |
|||||
|
RU-001 |
84.0 |
88.8 |
4.8 |
0.13 |
- |
- |
- |
- |
|
114.8 |
170.0 |
55.2 |
0.09 |
- |
- |
- |
- |
|
|
RU-002 |
89.3 |
91.5 |
2.2 |
0.8 |
- |
- |
- |
- |
|
106.4 |
106.8 |
0.4 |
2.13 |
- |
- |
- |
- |
|
|
124.9 |
139.5 |
14.6 |
0.08 |
- |
- |
- |
- |
|
|
143.5 |
144.3 |
0.8 |
0.18 |
- |
- |
- |
- |
|
|
148.0 |
149.6 |
1.6 |
0.11 |
- |
- |
- |
- |
|
|
205.4 |
210.7 |
5.3 |
0.11 |
- |
- |
- |
- |
|
|
222.7 |
231.7 |
9.0 |
0.12 |
- |
- |
- |
- |
|
|
RU-003 |
197.8 |
218.0 |
20.2 |
0.1 |
- |
- |
- |
- |
|
RU-004 |
107.0 |
134.0 |
27.0 |
0.16 |
109.2 |
113.0 |
3.8 |
0.49 |
|
130.0 |
133.5 |
3.5 |
0.39 |
|||||
|
138.0 |
140.0 |
2.0 |
0.07 |
- |
- |
- |
- |
|
|
RU-005 |
97.6 |
99.0 |
1.4 |
0.09 |
- |
- |
- |
- |
|
224.9 |
238.2 |
13.3 |
0.25 |
- |
- |
- |
- |
|
|
RU-007 |
94.4 |
95.4 |
1.0 |
0.1 |
- |
- |
- |
- |
|
111.0 |
117.0 |
6.0 |
0.12 |
- |
- |
- |
- |
|
|
220.4 |
224.2 |
3.8 |
0.08 |
- |
- |
- |
- |
|
|
232.0 |
236.6 |
4.6 |
0.11 |
- |
- |
- |
- |
|
|
RU-009 |
185.0 |
193.0 |
8.0 |
0.06 |
- |
- |
- |
- |
|
RU-010 |
151.3 |
158.3 |
7.0 |
0.11 |
- |
- |
- |
- |
|
RU-011 |
63.2 |
64.2 |
1.0 |
0.13 |
- |
- |
- |
- |
|
70.2 |
72.2 |
2.0 |
0.15 |
- |
- |
- |
- |
|
|
155.2 |
157.7 |
2.5 |
0.06 |
- |
- |
- |
- |
|
|
RU-012 |
104.9 |
150.5 |
45.6 |
0.09 |
117.2 |
117.8 |
0.6 |
1.8 |
|
200.0 |
228.5 |
28.5 |
0.08 |
- |
- |
- |
- |
|
|
RU-013 |
191.2 |
193.2 |
2.0 |
0.06 |
- |
- |
- |
- |
|
213.7 |
216.3 |
2.6 |
0.15 |
- |
- |
- |
- |
|
|
287.1 |
287.7 |
0.6 |
0.18 |
- |
- |
- |
- |
|
|
RU-014 |
129.0 |
134.6 |
5.6 |
0.45 |
- |
- |
- |
- |
|
192.0 |
194.0 |
2.0 |
0.12 |
- |
- |
- |
- |
|
|
RU-015 |
78.2 |
79.0 |
0.8 |
0.22 |
- |
- |
- |
- |
|
95.0 |
95.6 |
0.6 |
0.19 |
- |
- |
- |
- |
|
|
100.6 |
136.8 |
36.2 |
0.09 |
- |
- |
- |
- |
|
|
Higher Grade Intervals Within Lower Grades Intersections |
||||||||
| Borehole ID | From* | To* | Length* | %U3O8 | From | To | Length | %U3O8 |
|
148.1 |
150.4 |
2.3 |
0.19 |
- |
- |
- |
- |
|
|
161.0 |
164.0 |
3.0 |
0.07 |
- |
- |
- |
- |
|
|
197.0 |
200.0 |
3.0 |
0.06 |
- |
- |
- |
- |
|
|
228.0 |
236.3 |
8.3 |
0.15 |
- |
- |
- |
- |
|
|
240.3 |
244.0 |
3.7 |
0.06 |
- |
- |
- |
- |
|
|
RU-016 |
163.2 |
165.1 |
1.9 |
0.24 |
- |
- |
- |
- |
|
RU-017 |
214.4 |
220.8 |
6.4 |
0.11 |
- |
- |
- |
- |
|
231.0 |
235.5 |
4.5 |
0.36 |
- |
- |
- |
- |
|
|
RU-018 |
79.7 |
81.4 |
1.7 |
0.13 |
- |
- |
- |
- |
|
104.9 |
105.9 |
1.0 |
0.1 |
- |
- |
- |
- |
|
|
RU-020 |
121.2 |
129.6 |
8.4 |
0.1 |
- |
- |
- |
- |
|
188.6 |
194.6 |
6.0 |
0.08 |
- |
- |
- |
- |
|
|
RU-021 |
193.0 |
194.0 |
1.0 |
0.56 |
- |
- |
- |
- |
|
199.0 |
200.0 |
1.0 |
0.1 |
- |
- |
- |
- |
|
|
RU-022 |
150.4 |
156.0 |
5.6 |
0.11 |
- |
- |
- |
- |
|
195.9 |
199.0 |
3.1 |
0.06 |
- |
- |
- |
- |
|
|
203.5 |
205.0 |
1.5 |
0.11 |
- |
- |
- |
- |
|
|
214.4 |
215.0 |
0.6 |
0.12 |
- |
- |
- |
- |
|
|
RU-023 |
222.0 |
226.1 |
4.1 |
0.51 |
225.3 |
226.1 |
0.8 |
1.73 |
|
RU-024 |
95.7 |
97.2 |
1.5 |
0.06 |
- |
- |
- |
- |
|
101.5 |
102.0 |
0.5 |
0.09 |
- |
- |
- |
- |
|
|
109.0 |
129.0 |
20.0 |
0.07 |
- |
- |
- |
- |
|
|
183.3 |
222.0 |
38.7 |
0.06 |
- |
- |
- |
- |
|
|
RU-025 |
151.4 |
185.0 |
33.6 |
0.1 |
152.1 |
152.9 |
0.8 |
0.99 |
|
226.6 |
231.5 |
4.9 |
0.15 |
- |
- |
- |
- |
|
|
RU-026 |
116.8 |
122.0 |
5.2 |
2.98 |
118.5 |
120.0 |
1.5 |
7.99 |
|
119.5 |
120.0 |
0.5 |
19.45 |
|||||
|
134.5 |
138.0 |
3.5 |
0.1 |
- |
- |
- |
- |
|
|
151.0 |
152.0 |
1.0 |
0.18 |
- |
- |
- |
- |
|
|
RU-027 |
73.2 |
73.4 |
0.2 |
0.96 |
- |
- |
- |
- |
|
102.6 |
112.1 |
9.5 |
0.2 |
- |
- |
- |
- |
|
|
217.7 |
227.6 |
9.9 |
0.05 |
- |
- |
- |
- |
|
|
RU-028 |
219.5 |
221.5 |
2.0 |
0.06 |
- |
- |
- |
- |
|
RU-029 |
112.1 |
125.4 |
13.3 |
0.08 |
- |
- |
- |
- |
|
188.0 |
193.8 |
5.8 |
0.14 |
- |
- |
- |
- |
|
|
RU-030 |
87.5 |
90.0 |
2.5 |
0.13 |
- |
- |
- |
- |
|
136.4 |
136.7 |
0.3 |
0.67 |
- |
- |
- |
- |
|
|
RU-031 |
162.7 |
164.1 |
1.4 |
0.17 |
- |
- |
- |
- |
|
RU-032 |
184.5 |
186.0 |
1.5 |
0.84 |
- |
- |
- |
- |
|
RU-033 |
105.7 |
107.3 |
1.6 |
0.52 |
- |
- |
- |
- |
|
RU-035 |
104.0 |
106.0 |
2.0 |
0.77 |
- |
- |
- |
- |
|
151.5 |
153.1 |
1.6 |
0.08 |
- |
- |
- |
- |
|
|
195.2 |
199.1 |
3.9 |
0.08 |
- |
- |
- |
- |
|
|
218.0 |
219.0 |
1.0 |
0.13 |
- |
- |
- |
- |
|
|
RU-036 |
106.5 |
113.0 |
6.5 |
0.15 |
- |
- |
- |
- |
|
118.0 |
155.5 |
37.5 |
0.13 |
- |
- |
- |
- |
|
|
258.0 |
260.0 |
2.0 |
0.08 |
- |
- |
- |
- |
|
|
RU-037 |
97.4 |
103.5 |
6.1 |
0.18 |
- |
- |
- |
- |
|
132.0 |
135.0 |
3.0 |
0.07 |
- |
- |
- |
- |
|
|
RU-038 |
121.5 |
122.5 |
1.0 |
0.17 |
- |
- |
- |
- |
|
127.0 |
128.5 |
1.5 |
0.43 |
- |
- |
- |
- |
|
|
163.3 |
164.5 |
1.2 |
1.23 |
- |
- |
- |
- |
|
|
RU-039 |
93.2 |
97.8 |
4.6 |
0.14 |
- |
- |
- |
- |
|
RU-040 |
91.5 |
93.5 |
2.0 |
0.28 |
- |
- |
- |
- |
|
RU-041 |
138.8 |
144.5 |
5.7 |
0.08 |
- |
- |
- |
- |
|
197.7 |
199.0 |
1.3 |
0.64 |
- |
- |
- |
- |
|
|
Higher Grade Intervals Within Lower Grades Intersections |
||||||||
| Borehole ID | From* | To* | Length* | %U3O8 | From | To | Length | %U3O8 |
|
212.0 |
218.8 |
6.8 |
0.09 |
- |
- |
- |
- |
|
|
RU-042 |
108.5 |
112.5 |
4.0 |
0.07 |
- |
- |
- |
- |
|
120.5 |
121.5 |
1.0 |
0.11 |
- |
- |
- |
- |
|
|
162.0 |
178.5 |
16.5 |
0.13 |
- |
- |
- |
- |
|
|
291.5 |
297.0 |
5.5 |
0.12 |
- |
- |
- |
- |
|
|
303.0 |
303.5 |
0.5 |
0.23 |
- |
- |
- |
- |
|
|
RU-043 |
104.8 |
106.7 |
1.9 |
0.13 |
- |
- |
- |
- |
|
213.6 |
221.3 |
7.7 |
0.43 |
- |
- |
- |
- |
|
|
214.1 |
216.6 |
2.8 |
0.76 |
- |
- |
- |
- |
|
|
RU-045 |
125.6 |
128.0 |
2.4 |
0.07 |
- |
- |
- |
- |
|
RU-047 |
105.5 |
129.5 |
24.0 |
0.13 |
- |
- |
- |
- |
|
141.5 |
153.0 |
11.5 |
0.11 |
- |
- |
- |
- |
|
|
184.0 |
187.5 |
3.5 |
0.46 |
- |
- |
- |
- |
|
|
254.0 |
256.0 |
2.0 |
0.15 |
- |
- |
- |
- |
|
|
266.0 |
273.0 |
7.0 |
0.09 |
- |
- |
- |
- |
|
|
RU-048 |
113.5 |
151.5 |
38.0 |
0.18 |
- |
- |
- |
- |
|
132.0 |
139.5 |
7.5 |
0.42 |
- |
- |
- |
- |
|
|
164.5 |
168.5 |
4.0 |
0.11 |
- |
- |
- |
- |
|
|
177.5 |
188.5 |
11.0 |
0.14 |
- |
- |
- |
- |
|
|
RU-051 |
95.3 |
96.3 |
1.0 |
0.2 |
- |
- |
- |
- |
|
111.3 |
121.3 |
10.0 |
0.34 |
118.1 |
120.1 |
2.0 |
0.9 |
|
|
RU-052 |
118.0 |
120.0 |
2.0 |
0.08 |
- |
- |
- |
- |
|
125.5 |
130.5 |
5.0 |
0.07 |
- |
- |
- |
- |
|
|
RU-054 |
252.5 |
257.4 |
4.9 |
0.17 |
- |
- |
- |
- |
|
RU-055 |
108.0 |
111.0 |
3.0 |
0.11 |
- |
- |
- |
- |
|
195.0 |
205.0 |
10.0 |
0.09 |
- |
- |
- |
- |
|
|
RU-056 |
218.0 |
224.0 |
6.0 |
0.09 |
- |
- |
- |
- |
|
RU-057 |
172.0 |
174.0 |
2.0 |
0.19 |
- |
- |
- |
- |
|
RU-058 |
103.0 |
125.5 |
22.5 |
0.16 |
- |
- |
- |
- |
|
143.0 |
147.0 |
4.0 |
0.09 |
- |
- |
- |
- |
|
|
167.0 |
189.5 |
22.5 |
0.07 |
- |
- |
- |
- |
|
|
RU-060 |
71.0 |
71.5 |
0.5 |
0.36 |
- |
- |
- |
- |
|
141.4 |
150.0 |
8.6 |
0.08 |
- |
- |
- |
- |
|
|
164.5 |
166.1 |
1.6 |
0.06 |
- |
- |
- |
- |
|
|
RU-063 |
206.0 |
208.5 |
2.5 |
0.06 |
- |
- |
- |
- |
|
212.0 |
213.0 |
1.0 |
0.15 |
- |
- |
- |
- |
|
|
231.7 |
234.6 |
2.9 |
0.05 |
- |
- |
- |
- |
|
|
242.7 |
243.6 |
0.9 |
0.12 |
- |
- |
- |
- |
|
|
246.0 |
253.0 |
7.0 |
0.08 |
- |
- |
- |
- |
|
|
RU-064 |
139.1 |
140.5 |
1.4 |
0.1 |
- |
- |
- |
- |
|
142.6 |
143.9 |
1.3 |
0.08 |
- |
- |
- |
- |
|
|
145.9 |
153.4 |
7.5 |
0.09 |
- |
- |
- |
- |
|
|
158.0 |
163.0 |
5.0 |
0.09 |
- |
- |
- |
- |
|
|
187.9 |
204.3 |
16.4 |
0.09 |
- |
- |
- |
- |
|
|
RU-065 |
209.0 |
213.0 |
4.0 |
0.09 |
- |
- |
- |
- |
|
218.7 |
223.0 |
4.3 |
0.1 |
- |
- |
- |
- |
|
|
RU-067 |
153.7 |
155.7 |
2.0 |
0.13 |
- |
- |
- |
- |
|
188.0 |
195.5 |
7.5 |
0.1 |
- |
- |
- |
- |
|
|
RU-068 |
108.0 |
130.2 |
22.2 |
0.09 |
- |
- |
- |
- |
|
207.2 |
210.0 |
2.8 |
0.07 |
- |
- |
- |
- |
|
|
RU-069 |
205.0 |
205.5 |
0.5 |
0.39 |
- |
- |
- |
- |
|
RU-070 |
179.1 |
180.1 |
1.0 |
0.53 |
- |
- |
- |
- |
|
194.5 |
199.2 |
4.7 |
0.11 |
- |
- |
- |
- |
|
|
225.5 |
226.7 |
1.2 |
0.21 |
- |
- |
- |
- |
|
|
RU-071 |
63.0 |
64.0 |
1.0 |
0.54 |
- |
- |
- |
- |
|
113.0 |
114.0 |
1.0 |
0.2 |
- |
- |
- |
- |
|
|
Higher Grade Intervals Within Lower Grades Intersections |
||||||||
| Borehole ID | From* | To* | Length* | %U3O8 | From | To | Length | %U3O8 |
|
121.0 |
141.0 |
20.0 |
0.09 |
- |
- |
- |
- |
|
|
146.0 |
147.0 |
1.0 |
0.2 |
- |
- |
- |
- |
|
|
167.0 |
178.0 |
11.0 |
0.3 |
- |
- |
- |
- |
|
|
185.0 |
186.0 |
1.0 |
0.35 |
- |
- |
- |
- |
|
|
RU-072 |
164.1 |
165.3 |
1.2 |
0.25 |
- |
- |
- |
- |
|
182.5 |
186.4 |
3.9 |
0.12 |
- |
- |
- |
- |
|
|
192.5 |
194.2 |
1.7 |
0.23 |
- |
- |
- |
- |
|
|
RU-073 |
162.3 |
165.1 |
2.8 |
0.1 |
- |
- |
- |
- |
|
RU-075 |
121.0 |
143.0 |
22.0 |
0.07 |
- |
- |
- |
- |
|
160.0 |
161.0 |
1.0 |
0.19 |
- |
- |
- |
- |
|
|
169.0 |
184.5 |
15.5 |
0.09 |
- |
- |
- |
- |
|
|
268.3 |
269.0 |
0.7 |
0.19 |
- |
- |
- |
- |
|
|
RU-076 |
62.7 |
64.0 |
1.3 |
0.08 |
- |
- |
- |
- |
|
127.0 |
128.6 |
1.6 |
0.07 |
- |
- |
- |
- |
|
|
148.0 |
149.1 |
1.1 |
0.1 |
- |
- |
- |
- |
|
|
154.4 |
156.2 |
1.8 |
0.26 |
- |
- |
- |
- |
|
|
RU-077 |
93.0 |
101.0 |
8.0 |
0.21 |
- |
- |
- |
- |
|
RU-078 |
106.3 |
111.6 |
5.3 |
0.12 |
- |
- |
- |
- |
|
197.0 |
199.8 |
2.8 |
0.09 |
- |
- |
- |
- |
|
|
RU-079 |
117.7 |
120.5 |
2.8 |
0.05 |
- |
- |
- |
- |
|
133.0 |
137.0 |
4.0 |
0.07 |
- |
- |
- |
- |
|
|
141.8 |
144.5 |
2.7 |
0.09 |
- |
- |
- |
- |
|
|
160.0 |
169.0 |
9.0 |
0.07 |
- |
- |
- |
- |
|
|
188.0 |
196.0 |
8.0 |
0.07 |
- |
- |
- |
- |
|
|
223.0 |
225.0 |
2.0 |
0.12 |
- |
- |
- |
- |
|
|
RU-080 |
129.9 |
132.5 |
2.6 |
0.1 |
- |
- |
- |
- |
|
216.3 |
219.6 |
3.3 |
0.21 |
- |
- |
- |
- |
|
|
RU-081 |
32.1 |
33.1 |
1.0 |
0.25 |
- |
- |
- |
- |
|
110.4 |
113.6 |
3.2 |
0.17 |
- |
- |
- |
- |
|
|
129.5 |
133.5 |
4.0 |
0.07 |
- |
- |
- |
- |
|
|
RU-083 |
123.0 |
132.0 |
9.0 |
0.08 |
- |
- |
- |
- |
|
RU-084 |
93.5 |
96.9 |
3.4 |
0.08 |
- |
- |
- |
- |
|
102.0 |
109.8 |
7.8 |
0.05 |
- |
- |
- |
- |
|
|
127.9 |
128.9 |
1.0 |
0.1 |
- |
- |
- |
- |
|
|
157.2 |
165.3 |
8.1 |
0.22 |
- |
- |
- |
- |
|
|
RU-087 |
98.0 |
111.5 |
13.5 |
0.17 |
- |
- |
- |
- |
|
133.0 |
138.0 |
5.0 |
0.06 |
- |
- |
- |
- |
|
|
237.0 |
245.5 |
8.5 |
0.21 |
- |
- |
- |
- |
|
|
RU-090 |
42.0 |
44.1 |
2.1 |
0.33 |
- |
- |
- |
- |
|
68.6 |
69.1 |
0.5 |
0.16 |
- |
- |
- |
- |
|
|
120.4 |
122.7 |
2.3 |
0.36 |
- |
- |
- |
- |
|
|
131.6 |
132.7 |
1.1 |
0.27 |
- |
- |
- |
- |
|
|
RU-091 |
152.5 |
167.0 |
14.5 |
0.1 |
- |
- |
- |
- |
|
187.0 |
198.0 |
11.0 |
0.16 |
- |
- |
- |
- |
|
|
210.0 |
220.0 |
10.0 |
0.07 |
- |
- |
- |
- |
|
|
RU-092 |
186.3 |
186.6 |
0.3 |
0.86 |
- |
- |
- |
- |
|
194.0 |
198.3 |
4.3 |
0.39 |
- |
- |
- |
- |
|
|
209.4 |
212.6 |
3.2 |
0.09 |
- |
- |
- |
- |
|
|
217.6 |
222.3 |
4.7 |
0.08 |
- |
- |
- |
- |
|
|
RU-093 |
65.3 |
67.3 |
2.0 |
0.16 |
- |
- |
- |
- |
|
103.7 |
117.8 |
14.1 |
0.08 |
- |
- |
- |
- |
|
|
RU-094 |
87.6 |
88.2 |
0.6 |
0.26 |
- |
- |
- |
- |
|
97.5 |
100.5 |
3.0 |
0.13 |
- |
- |
- |
- |
|
|
113.0 |
118.5 |
5.5 |
0.07 |
- |
- |
- |
- |
|
|
125.0 |
126.5 |
1.5 |
0.08 |
- |
- |
- |
- |
|
|
137.0 |
146.5 |
9.5 |
0.1 |
- |
- |
- |
- |
|
|
Higher Grade Intervals Within Lower Grades Intersections |
||||||||
| Borehole ID | From* | To* | Length* | %U3O8 | From | To | Length | %U3O8 |
|
227.0 |
228.5 |
1.5 |
0.07 |
- |
- |
- |
- |
|
|
241.0 |
245.0 |
4.0 |
0.09 |
- |
- |
- |
- |
|
|
260.0 |
263.0 |
3.0 |
0.09 |
- |
- |
- |
- |
|
|
RU-095 |
117.0 |
154.3 |
37.3 |
0.38 |
120.4 |
129.8 |
9.4 |
0.82 |
|
160.8 |
162.2 |
1.4 |
0.13 |
- |
- |
- |
- |
|
|
185.4 |
186.1 |
0.7 |
0.4 |
- |
- |
- |
- |
|
|
RU-096 |
183.0 |
185.0 |
2.0 |
0.16 |
- |
- |
- |
- |
|
188.0 |
191.0 |
3.0 |
0.06 |
- |
- |
- |
- |
|
|
RU-097 |
58.8 |
61.6 |
2.8 |
0.06 |
- |
- |
- |
- |
|
178.6 |
181.5 |
2.9 |
0.07 |
- |
- |
- |
- |
|
|
RU-098 |
93.9 |
95.2 |
1.3 |
0.18 |
- |
- |
- |
- |
|
124.4 |
125.0 |
0.6 |
0.17 |
- |
- |
- |
- |
|
|
RU-099 |
107.0 |
108.5 |
1.5 |
0.32 |
- |
- |
- |
- |
|
158.4 |
179.0 |
20.6 |
0.07 |
- |
- |
- |
- |
|
|
RU-100 |
89.7 |
92.5 |
2.8 |
0.05 |
- |
- |
- |
- |
|
234.3 |
241.8 |
7.5 |
0.07 |
- |
- |
- |
- |
|
|
RU-103 |
117.5 |
125.0 |
7.5 |
0.15 |
- |
- |
- |
- |
|
157.0 |
164.0 |
7.0 |
0.51 |
- |
- |
- |
- |
|
|
193.5 |
194.0 |
0.5 |
0.31 |
- |
- |
- |
- |
|
|
206.5 |
208.0 |
1.5 |
0.16 |
- |
- |
- |
- |
|
|
RU-104 |
79.0 |
80.9 |
1.9 |
1.04 |
- |
- |
- |
- |
|
RU-105 |
226.1 |
236.2 |
10.1 |
0.24 |
- |
- |
- |
- |
|
244.2 |
250.9 |
6.7 |
0.18 |
- |
- |
- |
- |
|
|
RU-109 |
131.7 |
143.0 |
11.3 |
0.31 |
- |
- |
- |
- |
|
RU-113 |
101.3 |
102.6 |
1.3 |
0.18 |
- |
- |
- |
- |
|
150.8 |
151.5 |
0.7 |
0.17 |
- |
- |
- |
- |
|
|
RU-115 |
226.0 |
231.2 |
5.2 |
0.14 |
- |
- |
- |
- |
|
254.0 |
258.7 |
4.7 |
0.19 |
- |
- |
- |
- |
|
|
RU-116 |
78.7 |
79.4 |
0.7 |
0.21 |
- |
- |
- |
- |
|
RU-118 |
117.1 |
136.9 |
19.8 |
0.52 |
- |
- |
- |
- |
|
RU-120 |
151.9 |
153.2 |
1.3 |
0.08 |
- |
- |
- |
- |
|
159.9 |
165.7 |
5.8 |
0.08 |
- |
- |
- |
- |
|
|
174.3 |
176.1 |
1.8 |
0.07 |
- |
- |
- |
- |
|
|
182.7 |
191.5 |
8.8 |
0.12 |
- |
- |
- |
- |
|
|
203.4 |
203.9 |
0.5 |
0.29 |
- |
- |
- |
- |
|
|
RU-121 |
308.2 |
315.2 |
7.0 |
0.06 |
- |
- |
- |
- |
|
RU-122 |
88.8 |
92.2 |
3.4 |
0.15 |
- |
- |
- |
- |
|
RU-123 |
129.1 |
133.8 |
4.7 |
0.11 |
- |
- |
- |
- |
|
280.6 |
304.0 |
23.4 |
0.08 |
- |
- |
- |
- |
|
|
RU-125 |
143.3 |
146.0 |
2.7 |
0.07 |
- |
- |
- |
- |
|
156.0 |
156.8 |
0.8 |
0.13 |
- |
- |
- |
- |
|
|
259.3 |
260.4 |
1.1 |
0.47 |
- |
- |
- |
- |
|
|
279.9 |
281.0 |
1.1 |
0.28 |
- |
- |
- |
- |
|
|
RU-126 |
153.0 |
155.7 |
2.7 |
0.09 |
- |
- |
- |
- |
|
170.9 |
178.0 |
7.1 |
0.09 |
- |
- |
- |
- |
|
|
313.0 |
314.0 |
1.0 |
0.11 |
- |
- |
- |
- |
|
|
RU-128 |
271.0 |
272.8 |
1.8 |
0.07 |
- |
- |
- |
- |
|
275.4 |
279.7 |
4.3 |
0.15 |
- |
- |
- |
- |
|
|
287.3 |
288.4 |
1.1 |
0.27 |
- |
- |
- |
- |
|
|
305.0 |
308.0 |
3.0 |
0.07 |
- |
- |
- |
- |
|
|
322.3 |
322.9 |
0.6 |
0.26 |
- |
- |
- |
- |
|
|
RU-130 |
106.0 |
119.1 |
10.9 |
0.14 |
- |
- |
- |
- |
|
136.7 |
137.2 |
0.5 |
1.29 |
- |
- |
- |
- |
|
|
144.6 |
149.0 |
4.4 |
0.16 |
- |
- |
- |
- |
|
|
RU-132 |
91.0 |
105.0 |
14.0 |
0.21 |
- |
- |
- |
- |
|
116.4 |
119.0 |
2.6 |
1.76 |
- |
- |
- |
- |
|
|
Higher Grade Intervals Within Lower Grades Intersections |
||||||||
| Borehole ID | From* | To* | Length* | %U3O8 | From | To | Length | %U3O8 |
|
RU-135 |
70.5 |
71.5 |
1.0 |
0.3 |
- |
- |
- |
- |
|
91.0 |
94.5 |
3.5 |
0.05 |
- |
- |
- |
- |
|
|
99.5 |
100.5 |
1.0 |
0.17 |
- |
- |
- |
- |
|
|
123.0 |
131.0 |
8.0 |
0.15 |
- |
- |
- |
- |
|
|
145.0 |
150.0 |
5.0 |
0.05 |
- |
- |
- |
- |
|
|
RU-136 |
144.0 |
147.0 |
3.0 |
0.06 |
- |
- |
- |
- |
|
153.0 |
155.0 |
2.0 |
0.13 |
- |
- |
- |
- |
|
|
232.0 |
233.3 |
1.3 |
0.09 |
- |
- |
- |
- |
|
|
RU-138 |
198.9 |
200.6 |
1.7 |
0.11 |
- |
- |
- |
- |
|
RU-139 |
70.0 |
74.0 |
4.0 |
0.64 |
- |
- |
- |
- |
|
101.0 |
103.0 |
2.0 |
0.12 |
- |
- |
- |
- |
|
|
109.0 |
112.0 |
3.0 |
0.11 |
- |
- |
- |
- |
|
|
127.0 |
128.0 |
1.0 |
0.68 |
- |
- |
- |
- |
|
|
RU-141 |
80.0 |
88.0 |
8.0 |
0.08 |
- |
- |
- |
- |
|
RU-142 |
203.6 |
207.0 |
3.4 |
0.18 |
- |
- |
- |
- |
|
RU-143 |
57.5 |
64.7 |
7.2 |
0.06 |
- |
- |
- |
- |
|
71.0 |
77.6 |
6.6 |
0.15 |
- |
- |
- |
- |
|
|
87.0 |
94.2 |
7.2 |
0.07 |
- |
- |
- |
- |
|
|
99.0 |
103.8 |
4.8 |
0.05 |
- |
- |
- |
- |
|
|
208.8 |
233.3 |
24.5 |
0.21 |
- |
- |
- |
- |
|
|
RU-144 |
113.5 |
114.0 |
0.5 |
0.05 |
- |
- |
- |
- |
|
118.5 |
119.0 |
0.5 |
0.07 |
- |
- |
- |
- |
|
|
RU-146 |
106.5 |
108.0 |
1.5 |
0.09 |
- |
- |
- |
- |
|
132.0 |
134.0 |
2.0 |
0.71 |
- |
- |
- |
- |
|
|
RU-150 |
187.5 |
189.0 |
1.5 |
0.17 |
- |
- |
- |
- |
|
RU-152 |
209.5 |
210.5 |
1.0 |
0.12 |
- |
- |
- |
- |
|
RU-156 |
68.4 |
69.4 |
1.0 |
0.19 |
- |
- |
- |
- |
|
RU-157 |
115.0 |
139.1 |
24.1 |
0.24 |
- |
- |
- |
- |
|
RU-159 |
251.9 |
258.9 |
7.0 |
0.1 |
- |
- |
- |
- |
|
RU-160 |
110.0 |
119.0 |
9.0 |
0.05 |
- |
- |
- |
- |
|
RU-161 |
232.3 |
237.3 |
5.0 |
0.133 |
- |
- |
- |
- |
|
260.4 |
261.5 |
1.1 |
0.343 |
- |
- |
- |
- |
|
|
270.4 |
271.5 |
1.1 |
0.276 |
- |
- |
- |
- |
|
|
RU-162 |
140.7 |
143.0 |
2.3 |
0.092 |
- |
- |
- |
- |
|
221.3 |
223.0 |
1.7 |
0.103 |
- |
- |
- |
- |
|
|
231.7 |
234.0 |
2.3 |
0.748 |
- |
- |
- |
- |
|
|
RU-163 |
137.3 |
145.0 |
7.7 |
0.09 |
- |
- |
- |
- |
|
RU-164 |
115.8 |
121.2 |
5.4 |
0.222 |
- |
- |
- |
- |
|
132.0 |
133.5 |
1.5 |
0.065 |
- |
- |
- |
- |
|
|
RU-167 |
296.2 |
298.0 |
1.8 |
0.06 |
- |
- |
- |
- |
|
309.0 |
313.0 |
4.0 |
0.068 |
- |
- |
- |
- |
|
|
321.4 |
322.3 |
0.9 |
0.12 |
- |
- |
- |
- |
|
|
RU-168 |
93.0 |
94.0 |
1.0 |
0.195 |
- |
- |
- |
- |
|
102.0 |
103.0 |
1.0 |
0.115 |
- |
- |
- |
- |
|
|
252.5 |
253.5 |
1.0 |
0.098 |
- |
- |
- |
- |
|
|
275.8 |
282.4 |
6.6 |
0.166 |
275.8 |
276.1 |
0.3 |
2.24 |
|
|
RU-169 |
163.0 |
169.2 |
6.2 |
0.191 |
- |
- |
- |
- |
|
187.8 |
190.0 |
2.2 |
0.079 |
- |
- |
- |
- |
|
|
201.0 |
219.4 |
18.4 |
0.425 |
214.3 |
217.4 |
3.1 |
1.095 |
|
|
RU-170 |
188.8 |
190.7 |
1.9 |
0.098 |
- |
- |
- |
- |
|
204.4 |
205.4 |
1.0 |
0.105 |
- |
- |
- |
- |
|
|
RU-171 |
149.0 |
151.0 |
2.0 |
0.072 |
- |
- |
- |
- |
|
157.0 |
158.2 |
1.2 |
0.098 |
- |
- |
- |
- |
|
|
215.0 |
218.0 |
3.0 |
0.241 |
- |
- |
- |
- |
|
|
225.9 |
226.5 |
0.6 |
0.362 |
- |
- |
- |
- |
|
|
RU-172 |
73.0 |
76.0 |
3.0 |
0.063 |
- |
- |
- |
- |
|
Higher Grade Intervals Within Lower Grades Intersections |
||||||||
| Borehole ID | From* | To* | Length* | %U3O8 | From | To | Length | %U3O8 |
|
88.0 |
111.0 |
23.0 |
0.141 |
- |
- |
- |
- |
|
|
209.0 |
217.0 |
8.0 |
0.083 |
- |
- |
- |
- |
|
|
RU-174 |
96.5 |
98.0 |
1.5 |
0.117 |
- |
- |
- |
- |
|
106.5 |
108.0 |
1.5 |
0.199 |
- |
- |
- |
- |
|
|
243.0 |
251.0 |
8.0 |
0.084 |
- |
- |
- |
- |
|
|
RU-175 |
144.7 |
174.7 |
30.0 |
0.108 |
- |
- |
- |
- |
|
RU-177 |
216.0 |
244.0 |
28.0 |
0.06 |
- |
- |
- |
- |
|
RU-179 |
105.0 |
108.5 |
3.5 |
0.072 |
- |
- |
- |
- |
|
146.0 |
149.0 |
3.0 |
0.132 |
- |
- |
- |
- |
|
|
171.0 |
194.0 |
23.0 |
0.169 |
- |
- |
- |
- |
|
|
221.0 |
228.0 |
7.0 |
0.298 |
- |
- |
- |
- |
|
|
240.0 |
243.5 |
3.5 |
0.074 |
- |
- |
- |
- |
|
|
RU-181 |
286.2 |
303.0 |
16.8 |
0.085 |
- |
- |
- |
- |
|
RU-182 |
185.0 |
187.0 |
2.0 |
0.078 |
- |
- |
- |
- |
|
212.4 |
223.0 |
10.6 |
0.066 |
- |
- |
- |
- |
|
|
RU-185 |
173.5 |
174.5 |
1.0 |
0.11 |
- |
- |
- |
- |
|
189.0 |
191.5 |
2.5 |
0.232 |
- |
- |
- |
- |
|
|
347.5 |
354.0 |
6.5 |
0.082 |
- |
- |
- |
- |
|
|
RU-186 |
134.5 |
138.5 |
4.0 |
0.046 |
- |
- |
- |
- |
|
RU-187 |
63.8 |
75.0 |
11.2 |
0.212 |
63.8 |
68.1 |
4.3 |
0.483 |
|
99.0 |
114.0 |
15.0 |
0.087 |
- |
- |
- |
- |
|
|
133.0 |
137.0 |
4.0 |
0.067 |
- |
- |
- |
- |
|
|
165.0 |
172.0 |
7.0 |
0.119 |
- |
- |
- |
- |
|
|
195.0 |
203.0 |
8.0 |
0.096 |
- |
- |
- |
- |
|
|
RU-189 |
165.4 |
167.0 |
1.6 |
0.277 |
- |
- |
- |
- |
|
RU-191 |
212.0 |
214.0 |
2.0 |
0.053 |
- |
- |
- |
- |
|
RU-192 |
123.5 |
127.0 |
3.5 |
0.147 |
- |
- |
- |
- |
|
158.5 |
183.5 |
25.0 |
0.12 |
- |
- |
- |
- |
|
|
RU-193 |
165.0 |
166.8 |
1.8 |
0.115 |
- |
- |
- |
- |
|
RU-194 |
225.0 |
227.0 |
2.0 |
0.122 |
- |
- |
- |
- |
|
258.0 |
260.5 |
2.5 |
0.046 |
- |
- |
- |
- |
|
|
RU-195 |
145.0 |
146.0 |
1.0 |
0.204 |
- |
- |
- |
- |
|
165.5 |
168.0 |
2.5 |
0.1 |
- |
- |
- |
- |
|
|
190.5 |
192.0 |
1.5 |
0.8 |
- |
- |
- |
- |
|
|
202.0 |
220.5 |
18.5 |
0.052 |
- |
- |
- |
- |
|
|
RU-197 |
132.0 |
144.0 |
12.0 |
0.138 |
- |
- |
- |
- |
|
206.0 |
208.0 |
2.0 |
0.215 |
- |
- |
- |
- |
|
|
RU-199 |
177.0 |
180.0 |
3.0 |
0.068 |
- |
- |
- |
- |
|
189.8 |
190.3 |
0.5 |
0.733 |
- |
- |
- |
- |
|
|
RU-200 |
311.0 |
315.8 |
4.8 |
0.081 |
- |
- |
- |
- |
|
RU-202 |
96.5 |
98.0 |
1.5 |
0.152 |
- |
- |
- |
- |
|
117.0 |
118.0 |
1.0 |
0.161 |
- |
- |
- |
- |
|
|
RU-206 |
149.0 |
151.0 |
2.0 |
0.054 |
- |
- |
- |
- |
|
232.2 |
242.5 |
10.3 |
0.228 |
233.4 |
237.1 |
3.7 |
0.474 |
|
|
295.5 |
300.0 |
4.5 |
0.12 |
- |
- |
- |
- |
|
|
RU-207 |
260.8 |
288.0 |
27.2 |
0.062 |
- |
- |
- |
- |
|
RU-209 |
153.0 |
155.0 |
2.0 |
0.059 |
- |
- |
- |
- |
|
228.5 |
231.5 |
3.0 |
0.075 |
- |
- |
- |
- |
|
|
RU-211 |
163.0 |
164.0 |
1.0 |
0.695 |
- |
- |
- |
- |
|
188.5 |
189.5 |
1.0 |
0.1 |
- |
- |
- |
- |
|
|
199.0 |
208.0 |
9.0 |
0.064 |
- |
- |
- |
- |
|
|
RU-213 |
109.3 |
116.0 |
6.7 |
0.038 |
- |
- |
- |
- |
|
220.5 |
221.0 |
0.5 |
0.364 |
- |
- |
- |
- |
|
|
RU-219 |
45.0 |
48.0 |
3.0 |
0.035 |
46.0 |
47.0 |
1.0 |
0.087 |
|
RU-225 |
179.5 |
180.5 |
1.0 |
0.061 |
- |
- |
- |
- |
|
183.4 |
192.6 |
9.2 |
0.062 |
187.2 |
191.6 |
4.4 |
0.107 |
|
|
Higher Grade Intervals Within Lower Grades Intersections |
||||||||
| Borehole ID | From* | To* | Length* | %U3O8 | From | To | Length | %U3O8 |
|
RU-226 |
112.0 |
113.0 |
1.0 |
0.04 |
- |
- |
- |
- |
|
138.4 |
143.0 |
4.6 |
0.12 |
- |
- |
- |
- |
|
|
RU-228 |
116.5 |
117.5 |
1.0 |
0.119 |
- |
- |
- |
- |
|
156.0 |
158.5 |
2.5 |
0.081 |
- |
- |
- |
- |
|
|
RU-234 |
170.0 |
171.5 |
1.5 |
0.081 |
- |
- |
- |
- |
|
209.0 |
210.0 |
1.0 |
0.149 |
- |
- |
- |
- |
|
|
RU-237 |
217.6 |
218.9 |
1.3 |
1.053 |
- |
- |
- |
- |
|
RU-239 |
120.0 |
122.5 |
2.5 |
0.081 |
- |
- |
- |
- |
|
RU-243 |
108.0 |
125.5 |
17.5 |
0.274 |
111.0 |
114.5 |
3.5 |
0.631 |
|
RU-246 |
117.0 |
137.5 |
20.5 |
0.445 |
118.5 |
121.6 |
3.1 |
0.761 |
|
128.0 |
137.5 |
9.5 |
0.666 |
|||||
|
131.0 |
133.1 |
2.1 |
1.676 |
|||||
|
RU-248 |
127.9 |
145.5 |
17.6 |
0.414 |
141.5 |
145.0 |
3.5 |
0.937 |
|
RU-251 |
248.5 |
249.0 |
0.5 |
0.282 |
- |
- |
- |
- |
|
301.7 |
303.0 |
1.3 |
0.127 |
- |
- |
- |
- |
|
|
RU-252 |
181.0 |
184.0 |
3.0 |
1.492 |
- |
- |
- |
- |
|
RU-254 |
96.0 |
114.5 |
18.5 |
0.119 |
104.3 |
107.5 |
3.2 |
0.579 |
|
132.0 |
153.0 |
21.0 |
0.125 |
137.0 |
143.0 |
6.0 |
0.196 |
|
|
209.5 |
214.0 |
4.5 |
0.158 |
- |
- |
- |
- |
|
|
259.4 |
260.0 |
0.6 |
0.182 |
- |
- |
- |
- |
|
|
RU-255 |
293.8 |
294.5 |
0.7 |
0.159 |
- |
- |
- |
- |
|
RU-256 |
99.8 |
105.0 |
5.2 |
0.34 |
99.8 |
102.0 |
2.2 |
0.602 |
|
220.0 |
231.0 |
11.0 |
0.111 |
- |
- |
- |
- |
|
|
RU-260 |
238.0 |
249.0 |
11.0 |
0.23 |
243.0 |
249.0 |
6.0 |
0.383 |
|
RU-261 |
254.0 |
257.5 |
3.5 |
0.055 |
- |
- |
- |
- |
|
264.5 |
276.0 |
11.5 |
0.091 |
- |
- |
- |
- |
|
|
294.5 |
297.0 |
2.5 |
0.128 |
- |
- |
- |
- |
|
|
RU-262 |
114.5 |
116.5 |
2.0 |
0.106 |
- |
- |
- |
- |
|
126.5 |
136.0 |
9.5 |
0.05 |
- |
- |
- |
- |
|
|
269.0 |
284.0 |
15.0 |
0.128 |
- |
- |
- |
- |
|
|
282.5 |
284.0 |
1.5 |
0.838 |
- |
- |
- |
- |
|
|
RU-268 |
150.0 |
153.0 |
3.0 |
0.108 |
- |
- |
- |
- |
|
306.5 |
307.0 |
0.5 |
0.245 |
- |
- |
- |
- |
|
|
RU-272 |
188.5 |
189.0 |
0.5 |
0.262 |
- |
- |
- |
- |
|
279.0 |
286.6 |
7.6 |
0.125 |
- |
- |
- |
- |
|
|
297.0 |
301.0 |
4.0 |
0.073 |
- |
- |
- |
- |
|
|
RU-273 |
88.5 |
92.5 |
4.0 |
0.063 |
- |
- |
- |
- |
|
153.0 |
155.0 |
2.0 |
0.055 |
- |
- |
- |
- |
|
|
169.0 |
171.0 |
2.0 |
0.062 |
- |
- |
- |
- |
|
|
RU-274 |
106.5 |
115.0 |
8.5 |
0.049 |
- |
- |
- |
- |
|
202.0 |
214.0 |
12.0 |
0.06 |
- |
- |
- |
- |
|
|
RU-275 |
263.0 |
276.0 |
13.0 |
0.097 |
- |
- |
- |
- |
|
RU-276 |
211.5 |
225.0 |
13.5 |
0.226 |
211.5 |
214.0 |
2.5 |
0.552 |
|
223.0 |
225.0 |
2.0 |
0.812 |
|||||
|
RU-277 |
258.0 |
265.0 |
7.0 |
0.117 |
- |
- |
- |
- |
|
283.0 |
286.5 |
3.5 |
0.058 |
- |
- |
- |
- |
|
|
RU-279 |
82.0 |
106.0 |
24.0 |
0.206 |
86.5 |
92.5 |
6.0 |
0.37 |
|
101.0 |
106.0 |
5.0 |
0.345 |
|||||
|
RU-280 |
135.0 |
137.0 |
2.0 |
0.131 |
- |
- |
- |
- |
|
RU-281 |
64.5 |
66.0 |
1.5 |
1.538 |
65.0 |
65.5 |
0.5 |
3.26 |
|
176.0 |
178.0 |
2.0 |
0.108 |
- |
- |
- |
- |
|
|
RU-282 |
202.0 |
209.0 |
7.0 |
0.07 |
- |
- |
- |
- |
|
RV-001 |
115.1 |
118.8 |
3.7 |
0.181 |
- |
- |
- |
- |
|
RV-002 |
144.9 |
146.8 |
1.9 |
0.086 |
- |
- |
- |
- |
|
RV-004 |
236.7 |
238.4 |
1.7 |
0.109 |
- |
- |
- |
- |
|
RV-005 |
283.2 |
286.2 |
3.0 |
0.083 |
- |
- |
- |
- |
|
Higher Grade Intervals Within Lower Grades Intersections |
||||||||
| Borehole ID | From* | To* | Length* | %U3O8 | From | To | Length | %U3O8 |
|
RV-006 |
39.0 |
39.2 |
0.2 |
1.29 |
- |
- |
- |
- |
|
45.9 |
46.2 |
0.3 |
0.64 |
- |
- |
- |
- |
|
|
105.4 |
106.0 |
0.6 |
0.219 |
- |
- |
- |
- |
|
|
RV-007 |
72.8 |
74.6 |
1.8 |
0.079 |
- |
- |
- |
- |
|
81.2 |
82.3 |
1.1 |
0.391 |
- |
- |
- |
- |
|
|
281.5 |
283.5 |
2.0 |
0.059 |
- |
- |
- |
- |
|
|
292.2 |
306.4 |
14.2 |
0.16 |
- |
- |
- |
- |
|
|
RV-008 |
211.5 |
212.4 |
0.9 |
0.347 |
- |
- |
- |
- |
|
216.5 |
218.0 |
1.5 |
0.137 |
- |
- |
- |
- |
|
|
235.6 |
239.5 |
3.9 |
0.084 |
- |
- |
- |
- |
|
|
RV-011 |
97.5 |
125.4 |
25.6 |
0.142 |
- |
- |
- |
- |
|
142.1 |
148.0 |
5.9 |
0.179 |
- |
- |
- |
- |
|
|
RV-012 |
131.8 |
133.4 |
1.6 |
0.132 |
- |
- |
- |
- |
|
150.8 |
151.7 |
0.9 |
0.197 |
- |
- |
- |
- |
|
|
RV-016 |
149.9 |
150.4 |
0.5 |
0.36 |
- |
- |
- |
- |
|
RV-017 |
177.3 |
178.7 |
1.4 |
0.14 |
- |
- |
- |
- |
|
200.1 |
200.6 |
0.5 |
1.27 |
- |
- |
- |
- |
|
|
RV-018 |
181.6 |
182.7 |
1.1 |
0.188 |
- |
- |
- |
- |
|
RV-019 |
224.0 |
236.2 |
12.2 |
0.187 |
- |
- |
- |
- |
|
RV-020 |
234.7 |
243.0 |
8.3 |
0.229 |
- |
- |
- |
- |
|
250.3 |
251.3 |
1.0 |
0.111 |
- |
- |
- |
- |
|
|
RV-021 |
273.2 |
279.1 |
5.9 |
0.101 |
- |
- |
- |
- |
|
RV-023 |
91.1 |
94.5 |
3.4 |
0.117 |
- |
- |
- |
- |
|
RV-024 |
148.1 |
149.4 |
1.3 |
0.11 |
- |
- |
- |
- |
|
169.6 |
171.1 |
1.5 |
0.138 |
- |
- |
- |
- |
|
|
185.0 |
192.0 |
7.0 |
0.274 |
- |
- |
- |
- |
|
|
203.3 |
207.2 |
3.9 |
0.262 |
- |
- |
- |
- |
|
|
RV-025 |
114.9 |
116.6 |
1.7 |
0.217 |
- |
- |
- |
- |
|
154.5 |
164.0 |
9.5 |
0.062 |
- |
- |
- |
- |
|
|
206.9 |
225.0 |
17.9 |
0.118 |
- |
- |
- |
- |
|
|
RV-026 |
177.3 |
180.2 |
2.9 |
0.061 |
- |
- |
- |
- |
|
197.7 |
200.5 |
2.8 |
0.25 |
- |
- |
- |
- |
|
|
215.7 |
224.0 |
8.3 |
0.126 |
- |
- |
- |
- |
|
|
238.0 |
255.4 |
17.4 |
0.13 |
- |
- |
- |
- |
|
|
RV-027 |
251.0 |
252.6 |
1.6 |
0.136 |
- |
- |
- |
- |
|
262.1 |
264.4 |
2.3 |
0.118 |
- |
- |
- |
- |
|
|
7.4 |
Core Handling, Drillhole Surveys and Logistical Considerations during the Mid-2009 – 2012 Drilling Programs |
The summer 2009 drilling program in the Horseshoe and Raven areas were performed by Driftwood Diamond Drilling Ltd. of Smithers, B.C., Canada. The 2011 winter drill program was completed by Lantech Drilling Services Inc. of Dieppe, New Brunswick, while the summer program was completed by Graham Brothers Drilling Ltd (“Graham Brothers”), of Fosston, Saskatchewan. Drilling in the winter of 2012 was completed by Graham Brothers. Drill programs were typically run with two rigs operating on a full-time basis during the summer-fall (June to November) and winter (January to April) seasons.
All of the drilling during these programs has been with NQ size core (48 mm core diameter).
|
7.4.1 |
Drillhole Field Locations and Surveys |
After completion of drilling, the drillhole collar locations are marked in the field with two metre high wooden pickets, which are visible in all seasons. The pickets are labelled with a permanent aluminum tag with the hole name, dip, azimuth and depth and clearly flagged with high visibility flagging tape.
Proposed hole collars are located in the field by chaining along grid lines from existing collars or located by a hand-held GPS unit. The proposed and completed collars are surveyed internally by UEX personnel with a hand-held Thales ProMark™3 GPS for preliminary interpretations. Independent checks have been completed on collar locations twice using Tri-City Surveys Ltd. (“Tri-City”), of Kindersley, Saskatchewan. Tri-City used a 5800/Trimble R8 Model 2 hand-held GPS with GNSS. Tri-City also relocated and surveyed the 2005 Cameco drillhole collars. The UEX and Tri-City collar readings are compared and, if any significant differences are noted, the Tri-City reading is re-surveyed; otherwise, it is adopted as the final collar reading.
Horseshoe and Raven were drilled on two separate, local project drilling grids. The Raven grid is rotated approximately 10° clockwise from the UTM WGS 84 (Zone 13) grid north and the Horseshoe grid is rotated approximately 35° anti-clockwise from the UTM WGS 84 (Zone 13) grid north. Surveying, however, is conducted in UTM grids.
LiDAR (Light Detection and Ranging), an optical remote sensing technology used primarily for typical digital terrain modelling (“DTM”), was flown over the Horseshoe-Raven and West Bear portions of the Hidden Bay property in August 2007, by LiDAR Services International of Calgary, Alberta. The LiDAR survey was performed to accurately determine the surface landforms in the Property areas and forms a cross check to the digital elevations of the surveyed drillhole collars. A surface DTM was created from the LiDAR and the collar locations were verified in Datamine. Drillhole collars with greater than one metre elevation difference were reviewed.
|
7.4.2 |
Downhole Surveys |
Downhole surveys were routinely collected on all holes using the Reflex EZ-Shot® tool at approximately every 25 m to 50 m downhole spacing in the 2006-2009 drilling at Horseshoe and Raven and were also collected during the 2005 drilling program, which was managed by Cameco (Lemaitre and Herman, 2006). Reflex EZ- Shot® is an electronic single shot instrument that measures six parameters in one single shot reading azimuth, inclination, magnetic tool face angle, gravity roll angle, magnetic field strength and temperature. These readings are transcribed onto a paper ticket book. Azimuth was recorded in magnetic north and then adjusted to true north with a correction factor of 10.2° of current magnetic declination added to the measured azimuth. This data was then entered in the drill logging database, with corrections if required. On some occasions, the magnetic field was outside of tolerance, and in this case, the measurement was ignored. The error rate where the azimuth had to be removed was 0.57% of all surveys and 0.3% of surveys had transcription errors which were resolved by UEX. Data is exported from the drill logging database and then imported into Datamine, where the drillholes are viewed in plan and section for accuracy.
|
7.4.3 |
Drill Core Handling Procedures |
At the drill rig, core is removed from the core barrel by the drillers and placed directly in wooden core boxes that are a standard 1.5 m long and a nominal 4.5 m capacity. Individual drill runs are identified with small wooden blocks, where the depth (metres) is recorded. Diamond drill core is transported at the end of each drill shift to an enclosed core-handling facility at the Raven camp on the Property. In general, the core handling procedures at the drill site are carried out to industry standard.
|
7.4.4 |
Core Recovery |
Every hole is measured from the start of the hole to the bottom to determine core recovery or block marking errors and for reference metre marks. Core recovery is determined by measuring the recovered core length and dividing this by the downhole drilled interval. Core loss is recorded routinely both on the core boxes and during core logging.
The QPs have reviewed core loss over all mineralized domains. Core recoveries through the mineralized subzones in the Horseshoe and Raven Deposits are generally very high, with 100% recovery common, even in mineralized intervals. Significant core loss has occurred mainly in the proximal non-mineralized clay alteration haloes to the deposit and in the oxidized zone below the overburden. Overall core recovery for the drillhole database is approximately 97%.
|
7.4.5 |
Drill Core Logging |
All of the surface holes were geologically logged and sampled by UEX field personnel. All holes were logged in accordance with the UEX legend (Table 7‑4) and geological logging procedure. Geological logging includes the detailed recording of lithology, alteration, mineralization, structure, veining and core recovery. Upon completion of logging a hole, the data is reviewed on a set of working cross-sections for dynamic interpretation of the geology and mineralization. The logging was completed under the guidance of the site senior geologist at the time. Logging data was entered in digitally into Lagger 3D Exploration (“Lagger”), developed by North Face Software, on laptop computers. Lagger can enter and edit drillhole and sample data and has a custom library of UEX geological codes to standardize the logging legend (Table 7‑4).
Principal lithologic units in the Horseshoe and Raven area, QZIT, CARK, ARKQ, SPLO, AMPH and CALC are described in Section 6. Many other units listed below are present on the Hidden Bay property, but not in the vicinity of the deposits.
Table 7‑4: UEX Lithology Legend
|
Codes |
UEX name |
Description |
|
OB |
Overburden |
Overburden |
|
CONG |
Conglomerate |
Conglomerate: maximum grain size >4mm |
|
MDST |
Mudstone |
Mudstone |
|
SDST |
Sandstone |
Sandstone: grain size 0.065-4 mm |
|
SLST |
Siltstone |
Siltstone |
|
UX |
Uranium mineralization |
Uranium mineralization |
|
CLAY |
Clay |
Clay alteration: hydrothermal or paleoweathering, protolith uncertain |
|
GOUG |
Fault gouge |
Fault gouge: unconsolidated cataclasite, clay matrix breccia, precurser lithology is unclear |
|
LOST |
Lost core |
Lost core |
|
AMPH |
Amphibolite |
>80% dark green to black amphibole; often massive to crudely banded. |
|
ARKS |
Meta-arkose |
Massive to weakly foliated or weakly gneissic feldspar > quartz-rich meta-sandstone, with weak to undeveloped gneissic compositional layering. Generally lower biotite content than semipelites |
|
ARKQ |
Arkosic Quartzite |
Arkosic Quartzite: >30% feldspar, finer grained, more easily altered than the QZIT, specific to Raven Horseshoe area |
|
CALC |
Calc-silicate gneiss |
Compositionally layered) with amphibole-pyroxene +/- garnet and psammitic (meta-arkosic) layers; may contain dolomite |
|
CARK |
Calc-arkose |
Arkosic rock with calc-silicate bands (where ARKS>CALC) |
|
DIAB |
Diabase |
Fine grained mafic dykes with sharp contacts, equigranular, post-metamorphic |
|
DIOR |
Diorite |
Mafic equigranular, usually medium-grained feldspar with biotite or amphibole-bearing intrusion; usually foliated |
|
DOLO |
Dolomite |
Grey to cream or pink, usually banded to laminated dolomite-rich unit often with calc-silicate, graphite, or arkosic lamina |
|
GABR |
Gabbro |
Mafic equigranular, usually medium-grained feldspar + pyroxene +/- amphibole-bearing intrusion; usually foliated |
|
GRAN |
Granite |
K-feldspar-quartz-biotite granite, massive to foliated; usually medium grained, non-porphyritic; pink to grey |
|
GRGN |
Granitic gneiss |
Impure granitic gneiss with foliated granitic and other compositional bands |
|
PEGM |
Pegmatite |
Coarse-grained K-feldspar-quartz-biotite pegmatite; also inludes quartz-dominant pegmatites |
|
PLAG |
Plagioclasite |
Albite-pyroxene +/- amphibole metasomatic unit after meta-arkose; may contain coarse pyroxene and resemble an intrusion; gradational contacts |
|
PEL0 |
Pelitic gneiss or schist |
Biotite quartz feldspar +/- garnet +/- sillimanite gneiss or schist (>50% biotite for schist) with >25% combined biotite, garnet, and/or sillimanite |
|
PEL1 |
" |
As above, 1-5% graphite |
|
PEL2 |
" |
As above, 5-20% graphite |
|
PEL3 |
" |
As above, >20% graphite |
|
SPL0 |
Semi-pelitic gneiss |
Biotite quartz feldspar gneiss with <25% combined biotite, garnet, sillimanite, often with abundant pegmatitic segregations |
|
SPL1 |
" |
As above, 1-5% graphite |
|
SPL2 |
" |
As above, 5-20% graphite |
|
SPL3 |
" |
As above, >20% graphite |
|
PYRX |
Pyroxenite |
>80% pyroxene, up to 20% amphibole; often massive to crudely banded. Grains up to 1.5 cm in diameter. |
|
QZIT |
Quartzite |
Pale grey to white, massive quartz rich meta-sandstone with >80% quartz, and subsidiary feldspar +/- biotite |
|
QZPL |
Quartz-rich pelite |
Quartz-rich pelite |
|
QV |
Quartz Vein |
Quartz vein >20cm (+ or - carbonate) NB: Clearly not pegmatoid related |
The primary purpose of a logging system is to provide a standard process for the geological logging procedures on the Hidden Bay exploration project.
The legend was developed to increase the amount and quality of geological data being collected and allow flexibility with data collection, so geologists can record all the information required without having to record one type of data at the expense of other data. The legend aims to simplify the interpretation of drillhole data and reduce the number of rock codes in the database to a manageable level.
The logging system is broken down into a series of tablets that are used to record the various forms of data required. These tablets include Lithology, Alteration/Paleoweathering, Veining/Structure and Veining/Structure Orientation Data. Each of the individual tablets is treated in isolation, such that geologists can refine the data being recorded depending on the types of geological data required for the specific task, e.g. resource definition, grade control and regional exploration.
A core reference library has been established on site and good communication between geologists allows for a consistent approach to geological logging. All core is routinely wet down and digitally photographed as a permanent record of the lithological history, in addition to the geological log, with a Canon Powershot A610 digital camera.
A review by the QPs of the Cameco logs and scissor holes of the 2005 Cameco drilling indicates that the geological information is complete and of good quality. The Cameco drillholes were logged using a similar legend under the guidance of Roger Lemaitre, P.Geo., from Cameco. Drillholes completed under the direction of Cameco in 2005 were also re-logged by UEX personnel in summer 2008 to standardize coding and logging data, to perform a second check on sampling intervals and to conduct infill sampling, where necessary.
|
7.4.6 |
Geotechnical Logging |
All geotechnical logging was completed by, or under the supervision of, Golder personnel with the Saskatoon, Saskatchewan and Mississauga, Ontario offices. All selected holes were logged geotechnically in accordance with the UEX Geotechnical Protocol developed by Golder. A selection of holes were logged with RQD, which is the percent of total core length recovered in solid pieces greater than 10 cm in length that correlates with fracture density. Numerous holes were tested for intact rock strength using a rating system based on hammer blows, fracture count per run and detailed total core recovery.
During 2007 and 2008, Golder personnel came to the site and conducted intact rock strength measurements on HQ core using a point load testing machine. Throughout the drill seasons, Golder has also conducted detailed geotechnical assessments of drill core. Logging was completed using the Q rock mass rating system. The QPs have not reviewed the results of the Golder assessments and cannot provide an assessment of the quality assurance (“QA”)/quality control (“QC”) procedures or interpret the results of the Q rock mass rating results.
In winter 2007/2008, Golder surveyed a series of holes in the Horseshoe area using a downhole televiewer. The aim of this was to determine geotechnical properties directly above the mineralized zones and around the peripheries of the deposit.
|
7.4.7 |
Radiometric Probing of Drillholes |
Downhole radiometric probing (gamma logging) with in-hole probing instruments is a routine task undertaken on all holes drilled at the Horseshoe and Raven projects. In uranium exploration, probing is integral in accurately detecting gamma radiation downhole which directly correlates to mineralized zones, since these probes can quantitatively measure radioactivity caused by the atomic decay of uranium. Using in-house correlation formulas determined from comparing geochemical sampling with probe data, the concentration of uranium in situ can be determined. The probe data is used to determine a uranium equivalent intersection which is used for planning of follow-up drillholes and to correlate intervals in the core boxes to guide geochemical sampling. A detailed radiation measurement is taken every 10 cm downhole and 10 cm up hole by passing a probe continuously down the drillhole immediately after its completion and measuring in situ radioactivity.
The probes are calibrated before each drill program at the SRC’s test pit facility in Saskatoon, Saskatchewan. The probing equipment was tested using a known low-grade radioactive source in the field before and after the probing of each hole to ensure that the equipment was functioning properly before and after the in-hole probing occurs. The radiometric logging was performed using a Mount Sopris Model 4MXA/1000 500 m winch, or Model 4MXC/1000 1000 m winch and MGX II Model 5MCA/PMA digital encoder. A Mount Sopris Modified Triple Gamma Probe consisting of a 2SMA-1000 Sonic Modem section (#3460 or #3461) and 2GHF-1000 Triple Gamma Probe section (#3431 or #3458) was used to probe all holes. Data was acquired using MSLog Version 7.43, a Mount Sopris computer recovery program. Data from the probe is then used to correlate mineralized zones with the drill core and identify zones for sampling and geochemical assay. A second check is to scan the drill core with a hand-held SPP2 scintillometer or a RS-120/125 super scintillometer. Detailed radiometric measurements are taken every 10 cm on the core in mineralized zones and recorded on the core and in accordance with standard procedure. At times, there are some discrepancies with the downhole probe interval and the core due to stretch in the winch cable, the counter wheel icing up or a differing zero depth between the core and the probe data.
The detailed radiometric readings from the hand-held scintillometer on the drill core are used as a guide by the geologist for geochemical sampling. The geologist marks the intervals on the individual sample and the sample numbers and location are recorded in drill logs.
|
7.4.8 |
Relationship between Sample Length and True Thickness |
Since the orientations of drillholes in the deposit vary, and the morphology of mineralized zones has variable orientation across the two deposits, the relationship of geochemical sample length in drillholes to the true thickness of mineralization is also variable. At both deposits, the steep orientation of most drillholes crosses the lens-shaped mineralized zones at or near to true thickness. The five metre to 30 m spaced drilling density, and geological confidence in the mineralization extent orientation and morphology has enabled 3D wireframe modelling of both deposits which accommodates for variations in sample length to local orientation of drillholes and mineralized zones.
|
7.4.9 |
Hydrogeology |
The Horseshoe and Raven Deposits are located adjacent to and east of the margin of the Athabasca Basin. The stratigraphy of the Athabasca Basin rocks consist of saturated sandstones, both from primary and secondary porosity and is a very porous aquifer. As the Property resides outside the Athabasca Basin, in crystalline metamorphic rocks, there is no anticipated hydrogeological concerns for mining identified at this time and is not considered material or relevant to the Property. As such, the QPs have not included the characterization of the hydrogeological environment in this TRS.
[The remainder of this page is intentionally left blank.]
|
8. |
SAMPLE PREPARATION, ANALYSES AND SECURITY |
Due to the historical nature of the time period of when this data and information were collected, the QPs have reviewed the descriptions of procedures for sample collection, preparation, security and analyses for this Property as provided by UEX/UEC in the exploration reports, in conjunction with interviews of some of the personnel responsible for data collection and agree that the work was completed to industry standards. The QPs have checked these work descriptions against UEX’s assessment reports from 2009 and 2011 and have found them to be identical. The QPs are confident that the descriptions provided in this section are accurate for the time that the data was collected. Mr. Barsi and Mr. Hamel reviewed the geochemistry sample intervals from selected drillholes during their site visit in June of 2021, but given the number of holes drilled on the deposit it was not possible to review the sample intervals for all drill holes. No errors or inconsistencies were found during this review. Where appropriate, the authors have updated the sample totals for the data collected in the latter half of 2009 and all of 2011.
A review of the procedures (described below) of the sampling method and approach used by UEX at the time indicates that they are of an industry standard, and provide an acceptable basis for the geological interpretation of the deposits leading to the estimation of mineral resources and economic evaluation of the deposits.
|
8.1 |
Horseshoe and Raven Geochemical Sample Collection |
Drill core sampling for geochemical assay is the primary sampling method. A combination of radiometric responses from hand-held scintillometer readings on drill core and recognition of visibly mineralized or altered areas guided sampling. Sampling has been conducted continuously across mineralized intervals within the mineralized zones. Samples were also collected from the non-mineralized core for at least several metres above and below mineralized intersections to confirm the location of the mineralization boundaries for each mineralized zone. In the case of multiple zones of mineralization in a hole, the internal non-mineralized section was generally sampled to provide a more continuous profile. In June 2008, UEX implemented a program of sampling weakly and non-mineralized core to clearly bracket mineralization with a nominal two metres of sampling below 0.02% U3O8 and any broad zones of internal waste were sampled. Re-sampling of holes was conducted at this time where previously sampled intervals were deemed too restricted in extent.
A representative length check on selective sample intervals was conducted on all of the HU and RU holes up until March 31, 2008. A total of 16,756 m of core was sampled representing 24,049 samples averaging 0.7 m in length. Sample intervals range from 0.1 m to 3.0 m with 261 samples or one percent of the total dataset greater or equal to 1.2 m in length. Note this excludes non-routine blanks and standards. Typically, the broader intervals were sampled over areas of low core recovery. An extra 1,635 samples, each approximately 10 cm in length, underwent spectral analysis with PIMA and were assayed with a full multi-element suite to spectrally and geochemically profile the alteration signature of the deposit. As of April 2009, the entire UEX drilled Horseshoe and Raven database includes 46,667 selective sample records and 3,002 systematic sample records (these numbers include routine standards and blanks). There have been 3,587 systematic sample records added to the database from July 2009 through 2011.
After core logging, all drill core marked for sampling is split longitudinally to obtain a representative half core sample for geochemical analysis. Splitting of core samples was undertaken by employees of UEX at the Raven Camp. Samples are split dry and not cut, using an electric hydraulic press with a “knife” and “V-block”. The splitter and sample trays are vacuumed clean to prevent contamination between each sample. One-half of the core was placed in a clear plastic sample bag, the bag top is rolled down and then securely taped to prevent any sample loss. Once a sample is split and placed in a sample bag, an additional level of QC is introduced where the radioactivity of the sample is measured by a SPP-2 scintillometer. These samples are then placed in approved pails and then sent to SRC Geoanalytical Laboratory for assaying. The second half is retained for geological documentation and record purposes and remains in the core box. A sample tag with the sample number is stapled into the core box to mark the location of the sample interval. All mineralized sections are kept in permanent wooden racks for easy access and review. After each hole is sampled, the splitting tent is cleaned to prevent hole to hole contamination and to minimize the amount of background radiation from dust.
A small representative portion of drill core has had the second half of the core removed for specific gravity and dry bulk density testing and some intersections have been taken for detailed metallurgical testing. The three HQ holes were bulk sampled for metallurgical testing and, as a result, no remaining core is available.
No inherent sampling biases exist in the longitudinal splitting of the core and sample processes are consistent from season to season. It is the opinion of the QPs that the samples are of good quality, representative and no material factors that may have resulted in sample biases. The sample data has been verified through correlation of probe, detailed radiometric SPP2 readings and a detailed assay comparison and QA/QC program.
|
8.2 |
Drillhole Sampling Quality and Representativeness |
The sampling methods and approach employed by UEX/UEC at the Horseshoe and Raven Deposits meet industry standards. The sampling of outlying targets was not reviewed by QPs but was carried out using the same protocols. There are no drilling, sampling, or recovery (core loss) factors that, in the opinion of the QPs, could materially impact the accuracy and reliability of the results. Sample locations and lengths are selected to appropriately represent mineralization distribution, with breaks between sample intervals made between obvious changes in geology or mineralization distribution. As a result, the sampling is considered to consistently represent the appropriate length and quantity of mineralization to determine a representative uranium grade independent of mineralization style.
All laboratory analyses of drilling samples for UEX, except for select check sampling, were conducted by the SRC. The SRC has an ISO/IEC 17025:2005 accredited quality management system (Scope of Accreditation #537), from the Standards Council of Canada (SRC, 2007). SRC’s Geoanalytical Laboratory is located at 125-15 Innovation Blvd., Saskatoon, Saskatchewan. The SRC laboratories are accredited by the Canadian Association for Laboratory Accreditation Inc. The SRC is independent of UEX or UEC.
Once the samples have arrived in Saskatoon, all elements of sample preparation are completed by employees of the SRC’s Geoanalytical lab. When samples arrive at the lab, no employee, officer, director, or associate of UEX/UEC, is or has been involved in any aspect of sample preparation and analysis. In the QPs’ opinion, the sample preparation, security and analytical procedures meet industry standards.
|
8.3 |
Shipping and Security |
Radioactive samples, mainly drill core, are shipped within Canada in compliance with pertinent federal regulations regarding their transport and handling. UEX has developed a procedure to detail requirements for exploration staff and others to ensure nuclear substances are shipped in compliance with regulatory requirements.
The transportation instructions are provided for the shipment of Dangerous Good Class 7, Radioactive Materials. Each shipment must meet all regulatory requirements of the Transportation of Dangerous Goods.
The samples are held in approved containers that are sealed with secure lids and meet the requirements of the CNSC Packaging and Transport of Nuclear Substances Regulations. Each shipping container is weighed and the level of the radioactivity is measured in compliance with the transportation of dangerous goods regulations to determine total activity of the container. The sealed shipping containers are temporarily stored outside the core shacks at the Raven Camps. Once a week, the shipment of radioactive samples is transported by road from the camp directly to SRC’s lab in Saskatoon. The pails are shipped in a closed vehicle under the exclusive use rules by our carrier, J.P. Enterprises Inc., based in La Ronge, Saskatchewan. In the authors’ opinion, there is little chance of tampering of samples as they are shipped directly to the lab from the camps.
|
8.4 |
Geochemical Analyses |
|
8.4.1 |
Analytical Procedures |
The resource data set uses U3O8 assay by ICPOES as the primary analytical method and ICP Total Digestion for lower grade samples (<1,000 parts per million (“ppm”) U).
On arrival at the SRC laboratory, all samples are received and sorted into their matrix types and received radioactivity levels. The samples are then dried overnight at 80°C in their original bags and then jaw crushed until 60% of the material is less than mm in size. A 100 g sub sample is split using a riffler, which is then ground (either puck and ring grinding mill or an agate grind) until 90% is minus 106 μm. The grinding mills are cleaned between sample using steel wool and compressed air, or in the case of clay rich samples, silica sand is used. The pulp is transferred to a labelled plastic snap top vial.
The samples are tested using validated procedures by trained personnel. All samples are digested prior to analysis by ICP and fluorimetry. All samples are subjected to multi-suite assay analysis, which includes U, Ni, Co, As, Pb by total and partial digestions. During initial phases of exploration, assaying using three separate digestions methods were tested: Boron, Partial and Total. In early winter 2007, routine analysis of Boron was discontinued. Boron analyses exist for 73 holes up to HU-053 and RU-020, and for drillholes completed during the 2005 program, which was managed by Cameco.
Total digestions are performed on an aliquot of sample pulp. The aliquot is digested to dryness on a hotplate in a Teflon beaker using a mixture of concentrated HF:HNO3:HClO4. The residue is dissolved in dilute HNO3 (SRC, 2007). Partial digestions are performed in an aliquot of sample pulp. The aliquot is digested in a mixture of concentrated HNO3: HCl in a hot water bath then diluted to 15 ml with DI water. Fluorimetry is used on low uranium samples (<100 ppm) as a comparison for ICPOES uranium results. Uranium is determined on the partial digestion. An aliquot of digestion solution is pipetted into a 90% Pt, 10% Rh dish and evaporated. A NaF/LiK pellet is placed on the dish, fused on a special propane rotary burner and then cooled to room temperature.
The SRC Geoanalytical laboratory reports uranium values in ppm. In order to convert the uranium values to weight percent U3O8, the reported values were divided by a conversion factor of 10,000 and then multiplied by another conversion factor of 1.17924.
The reader is referred to the SRC’s website (http://www.src.sk.ca/) for more details regarding the analytical techniques and sample handling procedures.
|
8.4.2 |
SRC Geoanalytical Laboratories U3O8 Method Summary |
All samples are received and entered into the Laboratory Information Management System (“LIMS”). In the case of uranium assay by ICPOES for UEX, a pulp is already generated from the first phase of preparation and assaying (discussed above). UEX routinely assays every sample above 1,000 ppm Uranium via ICP Total Digestion with ICPOES (Inductive Coupled Plasma – Optical Emission Spectrometry) Uranium assay. A 1,000 mg of sample is digested for one hour in an HCl: HNO3 acid solution. The totally digested sample solution is then made up to 100 ml and a 10-fold dilution is taken for the analysis by ICPOES. Instruments were calibrated using certified commercial solutions. The instruments used were Perkin Elmer Optima 300DV, Optima 4300DV or Optima 5300DV. The detection limit for U3O8 by this method is 0.001%. SRC management has developed QA procedures to ensure that all raw data generated in-house is properly documented, reported and stored to meet confidentiality requirements. All raw data is recorded on internally controlled data forms. Electronically generated data is calculated and stored on computers. All computer-generated data is backed up on a daily basis. Access to samples and raw data is restricted to authorized SRC Geoanalytical personnel at all times. All data is verified by key personnel prior to reporting results. Laboratory reports are generated using SRC’s LIMS.
|
8.4.3 |
Laboratory Audits |
Two detailed laboratory audits were completed on the primary laboratory, SRC in Saskatoon, by UEX personnel. A laboratory audit was conducted on September 24, 2007, and a follow-up review on June 5, 2008. The laboratory audit covered all aspects of the sample preparation and analytical process. The review is documented with an appropriate action plan for non-compliance or suggested action items. SRC and UEX have established an open relationship where the external QA/QC program and their interpretation of the laboratory’s internal QC program are discussed on a regular basis.
|
8.5 |
Uranium Equivalent Grades |
In late March 2009, logged mineralized intersections from two drillholes, which had not been sampled, were involved in a fire that destroyed the core splitting shack. The core, as per procedures, had been logged, photographed and had detailed SPP2-RS120/125 scintillometer radiometric readings collected every 10 cm on the core, prior to the incident. The drillholes had also been radiometrically probed.
A total of 228 samples were lost from the Raven and Horseshoe areas. All HU-344 samples and a portion of HU-347 were lost for a total of 92 samples at Horseshoe Northeast. The majority of RU-205 samples and a portion of RU-197 were lost for a total of 136 samples lost at Raven West. RU-197 did not intersect any of the interpreted mineralized subzones. Probe grades indicate that these holes intersected lower grade portions of the deposits.
This TRS did not use equivalent probe grades for any of the lost holes in the resource calculation.
|
8.6 |
Dry Bulk Density Samples |
In order to obtain bulk density estimates, UEX has taken a large selection of samples for dry bulk density measurement. These samples are systematically selected from different mineralized zones and a proportionately valid sample distribution of all rock types and alteration types, including different intensities of clay alteration.
Prior to September 1, 2008, a total of 2,615 samples from 33 holes underwent dry bulk density testing from Horseshoe and Raven. There were 1,845 samples from 33 Horseshoe (HU) holes and 770 samples from four Raven (RU) holes.
A further 1,109 samples, with a particular emphasis on the Raven Deposit, underwent dry bulk density testing during the period from September to June 2009, bringing the total number to 3,724 analyses. There are now results for 2,198 samples from 39 Horseshoe holes and 1,526 samples from 19 Raven holes with good spatial and lithological spread.
Average dry bulk density for Horseshoe and Raven lithologies is 2.48 g/cm3. The density statistics by rock type are listed in Table 8‑1 and Table 8‑2 for Horseshoe and Raven, respectively.
No further density sampling was completed past May 2009, as the current amount of information was sufficient for resource estimation.
Table 8‑1: Horseshoe Bulk Density (g/cm3) Statistics Grouped by Lithology
|
HORSESHOE |
|||||
|
Rock |
Count |
Mean |
Median |
Minimum |
Maximum |
|
ARKQ/S |
1455 |
2.47 |
2.5 |
1.45 |
3.14 |
|
CARK |
66 |
2.73 |
2.75 |
2.34 |
2.86 |
|
CLAY |
12 |
1.88 |
1.78 |
1.33 |
2.45 |
|
DIAB/DIOR |
14 |
2.71 |
2.73 |
2.27 |
2.85 |
|
GOUG |
2 |
1.98 |
1.98 |
1.75 |
2.21 |
|
PEGM |
94 |
2.37 |
2.41 |
1.89 |
2.65 |
|
PEL0 |
7 |
2.41 |
2.38 |
2.22 |
2.64 |
|
QZIT |
450 |
2.53 |
2.55 |
2.02 |
2.83 |
|
SPL0 |
6 |
2.57 |
2.53 |
2.44 |
2.75 |
|
UX |
92 |
2.49 |
2.49 |
1.75 |
2.95 |
|
Total |
2198 |
2.48 |
2.52 |
1.33 |
3.14 |
Table 8‑2: Raven Bulk Density (g/cm3) Statistics Grouped by Lithology
|
RAVEN |
|||||
|
Rock |
Count |
Mean |
Median |
Minimum |
Maximum |
|
ARKQ |
301 |
2.43 |
2.51 |
1.11 |
2.64 |
|
BX |
10 |
1.98 |
1.99 |
1.74 |
2.32 |
|
CARK |
413 |
2.44 |
2.42 |
1.98 |
2.93 |
|
GRAN |
17 |
2.32 |
2.4 |
1.64 |
2.58 |
|
PEGM |
53 |
2.41 |
2.44 |
1.58 |
2.89 |
|
PEL0 |
61 |
2.56 |
2.62 |
1.92 |
2.76 |
|
QZIT |
632 |
2.54 |
2.55 |
1.44 |
2.65 |
|
SPL0 |
39 |
2.50 |
2.5 |
2.24 |
2.67 |
|
Total |
1526 |
2.48 |
2.53 |
1.11 |
2.93 |
|
8.6.1 |
Analytical Methods |
Dry bulk density samples were collected from half-split core retained in the core box after geochemical sampling, since the dry bulk density process requires wax coating of the samples, which would affect the geochemical analysis. An approximately seven cm to 15 cm piece of half split core was submitted for each analysis. Samples were tagged and placed in sample bags on site, then shipped to SRC. Once received by SRC, samples are weighed dry and then covered in an impermeable barrier and then reweighed. The samples are then submersed in room temperature water and reweighed. The dry bulk density is calculated and reported.
As shown in Figure 8‑1 below, there is no correlation between grade and dry bulk density. The regression curve is flat. However, above 3% U3O8, there is a small inflection associated with a weak positive correlation between U3O8 grade dry bulk densities.
There is a strong negative correlation with logged proportions of clay in the core and bulk density. Table 8‑3 details the uranium grade ranges and specific gravity. Those samples not assayed for uranium are typically sitting distal to mineralization in less altered rock.
Table 8‑3: Average Dry Bulk Densities (g/cm3) by Grade Bins
|
U3O8% Grade range |
Number of samples |
SG average |
U3O8%average |
|
Not assayed |
539 |
2.58 |
Barren |
|
Assay to 0.05% |
1,885 |
2.47 |
0.02% |
|
0.05% to 0.1% |
385 |
2.47 |
0.07% |
|
0.1% to 1% |
770 |
2.45 |
0.33% |
|
>1% |
145 |
2.48 |
2.26% |
|
TOTAL |
3,724 |
2.48 |
0.21% |
[The remainder of this page is intentionally left blank.]
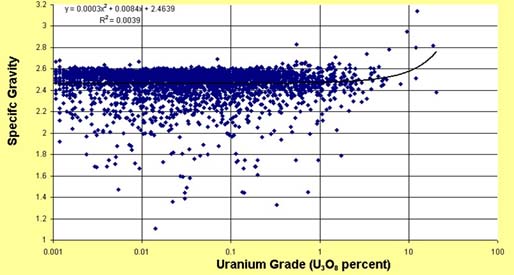
Figure 8‑1: Logarithmic Plot of Dry Bulk Density versus Uranium Grade in Corresponding Geochemical Samples
SRC has conducted 170 repeat analyses whereby in each batch at least one sample is repeated in every 40 samples. The repeats for this period were completed at a ratio of one repeat to 14 routine samples. All repeats passed the internal QC limit of +/- 0.02 g/cm3. The sample repeats have a strong positive correlation for both the period prior to September 2008 (Figure 8‑2) and the period from September 2008 to June 2009 (Figure 8‑3).
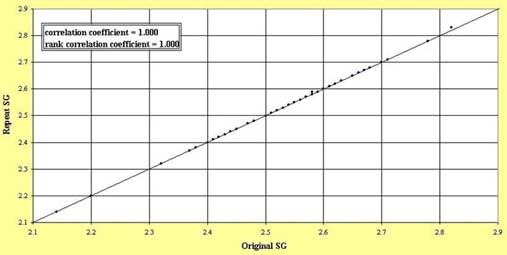
Figure 8‑2: Quantile - Quantile Plot of Laboratory Bulk Density Replicated for Batches Submitted for all Seasons Prior to September 2008
[The remainder of this page is intentionally left blank.]
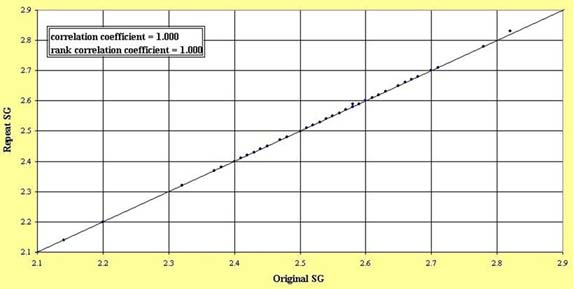
Figure 8‑3: Quantile - Quantile Plot of Laboratory Bulk Density Replicated for Batches Submitted between September 2008 and June 2009
As a check, prior to September 2008 a total of 52 samples, or one in 50, underwent wet bulk density measurements in parallel with dry bulk density measurement. The average wet density of the selected sample was 2.61 g/cm3 and the difference between the corresponding dry densities averaging 2.53 g/cm3 is 2.8%. One known standard, a piece of granite, was used for the wet density measurements and the three results were in the acceptable range of 2.71 g/cm3 +/- 0.01 g/cm3.
During the period from September 2008 to June 2009, a total of 51 samples, or one in 22, underwent wet density measurements in parallel with the dry bulk density measurement. The average wet density of the selected samples was 2.54 g/cm3 and the difference between the corresponding dry densities, which average 2.47 g/cm3, is 2.8%.
One known standard, a piece of granite, was used for the wet density measurements and the 11 results were in the acceptable range of 2.71 g/cm3 +/- 0.01 g/cm3.
|
8.7 |
Summary |
All samples were prepared and analyzed at SRC, an ISO 17025 accredited laboratory. In the opinion of the QPs, the sample preparation, security and analytical procedures for all assay data meet industry standards for QC and QA and are adequate for use in mineral resource estimation.
[The remainder of this page is intentionally left blank.]
Table 8‑4: Number of Samples for Each Deposit by Year
|
Horseshoe Sample Data |
|||
|
Year |
Number of Samples |
Total Sample Length for Year |
Percent of Total Data for Resource |
|
1974 |
38 |
40.4 |
0.2 |
|
2005 |
866 |
394.68 |
3.6 |
|
2006 |
2031 |
1145.47 |
8.4 |
|
2007 |
11576 |
8252.43 |
48.1 |
|
2008 |
5051 |
4087.6 |
21.0 |
|
2009 |
3894 |
3662.3 |
16.2 |
|
2009 |
135 |
128.7 |
0.6 |
|
2011 |
472 |
361.6 |
2.0 |
|
Total |
24063 |
18073.18 |
|
|
Raven Sample Data |
|||
|
Year |
Number of Samples |
Total Sample Length for Year |
Percent of Total Data for Resource |
|
2005 |
1577 |
853.6 |
7.3 |
|
2007 |
4485 |
3366.55 |
20.9 |
|
2008 |
7305 |
5671.6 |
34.0 |
|
2009 |
5116 |
4619.83 |
23.8 |
|
2009 |
159 |
136.6 |
0.7 |
|
2011 |
2821 |
2433.3 |
13.1 |
|
Total |
21463 |
17081.48 |
|
|
8.7.1 |
Verifications of Analytical Quality Control Data |
As part of UEX’s quality improvement programs (“UEX Batch Acceptance Procedure”), a rigorous QA/QC program was implemented during the 2007 summer drilling program and continues to be followed. All drill core samples are submitted to the SRC laboratories in Saskatoon for geochemical analysis. Inserted into each drill core sample batch submitted to SRC are a total of 20 samples for analysis. 16 samples are sawed half-core drill samples and four QA samples, which include a blank, a duplicate and two standard samples. The standard samples inserted into each batch are a commercially available standard (certified reference material), a blank, a field duplicate and a round robin pulp. Results are documented in Table 8‑5 and Table 8‑6. Most drillholes at both the Horseshoe and Raven Deposits that were completed under the management of UEX have been completed under this program. Prior to the implementation of this program, only blank samples were submitted routinely throughout the 2006 and early 2007 drilling programs. Additional QA/QC samples have been taken from the drillholes that were drilled prior to the UEX Batch Acceptance Procedure being implemented to improve the confidence in the earlier sampling. SPP2 radiometric readings have also been compared to the geochemical assays and a good correlation was noted.
To the knowledge of QPs from UEX, the same QA samples implemented in 2007 continued to be followed during the summer 2009 and 2011 drilling programs. However, review of the sample information in the sample database collected during the 2009 through 2011 programs did not indicate which samples were field duplicates and standards. As a result, Table 8‑7 includes only lab inserted standards and duplicates and does not include the number of field duplicates.
Table 8‑5: Summary of the Horseshoe and Raven QC Results for the Reporting Period 2005 to September 2008 (Baldwin, 2009)
|
QA/QC Sample |
Number |
Outside |
Percentage Outside of Tolerance |
|
CG515 standard (ICP) |
2016 |
0 |
0% |
|
Blanks (ICP) |
1033 |
6 |
0.60% |
|
Field Duplicates |
228 |
11 |
5% (outside of 30%) |
|
Laboratory Replicates |
1098 |
0 |
0% |
|
Laboratory Replicates (ICPOES) |
404 |
1 |
0.20% |
|
BL-2 (ICP) standard |
210 |
0 |
0% |
|
BL-3 (ICP) standard |
180 |
0 |
0% |
|
BL-4 (ICP) standard |
334 |
0 |
0% |
|
BL-4A (ICP) standard |
232 |
0 |
0% |
|
UEX08 (ICP) standard |
9 |
0 |
0% |
|
BL-1 (ICPOES) standard |
17 |
0 |
0% |
|
BL-2 (ICPOES) standard |
255 |
0 |
0% |
|
BL-2A (ICPOES) standard |
159 |
0 |
0% |
|
BL-3 (ICPOES) standard |
259 |
0 |
0% |
|
BL-4 (ICPOES) standard |
332 |
3 |
1% |
|
BL-4A (ICPOES) standard |
615 |
0 |
0% |
|
BL-5 (ICPOES) standard |
7 |
0 |
0% |
|
ICP vs ICPOES assay |
4,575 |
3 |
0.10% |
[The remainder of this page is intentionally left blank.]
Table 8‑6: Summary of the Horseshoe and Raven QC Results for the Reporting Period September 2008 to June 2009 (Baldwin, 2009)
|
QA/QC Sample |
Number |
Outside |
Percentage Outside of Tolerance |
|
CG515 standard (ICP) |
879 |
0 |
0% |
|
Blanks (ICP) |
261 |
1 |
0.40% |
|
Field Duplicates |
30 |
3 |
10% (outside of 30% |
|
Lab Replicates (ICP) |
516 |
0 |
0% |
|
Lab Replicates (ICPOES) |
116 |
0 |
0% |
|
BL-2 (ICP) standard |
5 |
0 |
0% |
|
BL-4A (ICP) standard |
520 |
1 |
0.20% |
|
UEX08 (ICP) standard |
516 |
5 |
1.00% |
|
BL-2 (ICPOES) standard |
16 |
0 |
0% |
|
BL-2A (ICPOES) standard |
25 |
0 |
0% |
|
BL-3 (ICPOES) standard |
6 |
0 |
0% |
|
BL-4A (ICPOES) standard |
251 |
0 |
0% |
|
UEX08 (ICPOES) standard |
144 |
1 |
0.70% |
|
ICP vs ICPOES assay |
696 |
4 |
0.6% (outside 10% |
In all cases, results outside of acceptable limits have been followed up through checking results from the batch with the laboratory or having the analysis repeated. In the case of the error repeating, the core was re-split and the new sample submitted for analysis.
Analysis of standards for the period from 2005 to September 2008 indicates that results were acceptable (within three standard deviations from the mean) for 100% of 965 standards submitted via U ppm ICP Total Digestion and 1,641 or 99.8% of the 1,644 standards submitted via the ICPOES U3O8 assay technique. Assay comparisons between three different assay techniques revealed a strong positive correlation for U ppm and U3O8.
Analysis of standards for the period from September 2008 to June 2009 indicates that results were acceptable (within three standard deviations from the mean) for 1913 or 99.6% of 1,920 standards submitted via U ppm ICP Total Digestion and 441 of the 442 standards submitted via the ICPOES U3O8 assay technique. Assay comparison between different assay techniques revealed a strong positive correlation for U ppm and U3O8.
Laboratory replicates correspond to a pulp analyzed in replicate as part of the laboratory’s internal QC measures to ensure reproducibility of assay results over time. Replicates also serve as a validation tool for batches with identified problems in either standards or blanks. The laboratory replicates are found to be in acceptable limits with a correlation coefficient close to one (R2> 0.999) and have very low dispersion for ICP and ICPOES analytical techniques.
Table 8‑7: Summary of Horseshoe and Raven QC Results for the Reporting Period July 2009 to 2011
|
QA/QC Sample |
Number |
Outside |
Percentage Outside of Tolerance |
|
Lab (ICP) Replicates |
160 |
0 |
0% |
|
Lab (ICPOES) Replicates |
58 |
0 |
0% |
|
CG515 (ICP) Standard |
23 |
0 |
0% |
|
CAR110 (ICP) Standard |
223 |
0 |
0% |
|
BL-2 (ICP) Standard |
13 |
9* |
1.7% |
|
BL-2 (ICPOES) Standard |
14 |
0 |
0% |
|
BL-2A (ICPOES) Standard |
13 |
0 |
0% |
|
BL-3 (ICP) Standard |
3 |
0 |
0% |
|
BL-3 (ICPOES) Standard |
20 |
0 |
0% |
|
BL-4A (ICP) Standard |
34 |
0 |
0% |
|
BL-4A (ICPOES) Standard |
55 |
0 |
0% |
|
UEX08 (ICP) Standard |
49 |
0 |
0% |
|
UEX08 (ICPOES) Standard |
49 |
0 |
0% |
*One standard was outside of the tolerance limits by 1.7% the rest were less than 1%.
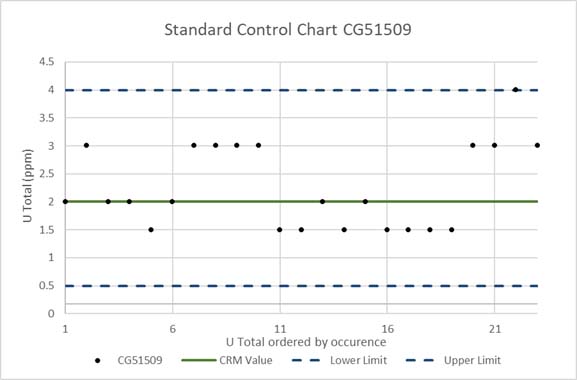
Figure 8‑4: Control Chart for Reference Material CG51509* analyzed for Uranium at SRC
*The lower limit for this standard in the QC data information is less than two. In order to plot the data, the lower limit was changed to 0.5 and samples that returned values of less than two were changed to 1.5.
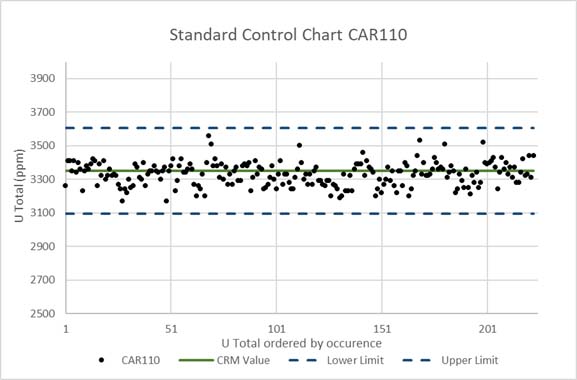
Figure 8‑5: Control Chart for Reference Material CAR110 analyzed for Uranium at SRC
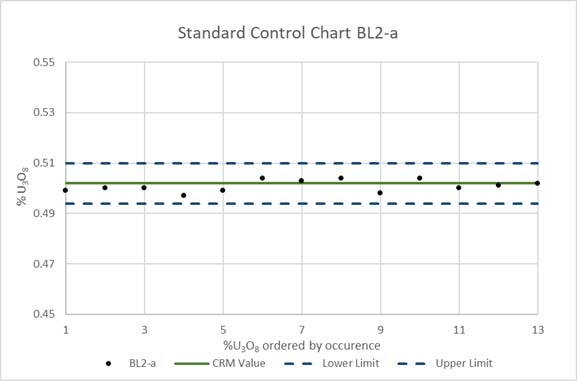
Figure 8‑6: Control Chart for Reference Material BL-2a analyzed for %U3O8 at SRC
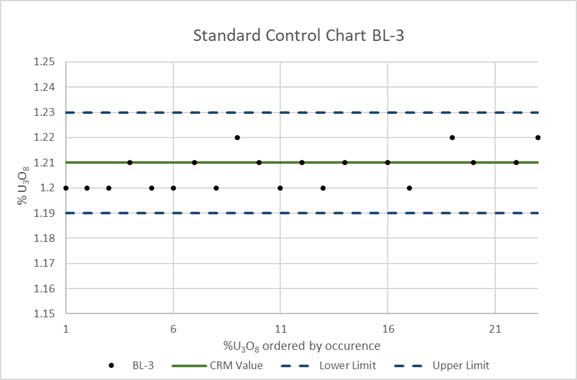
Figure 8‑7: Control Chart for Reference Material BL-3* analyzed for Uranium and %U3O8 at SRC
*Uranium Total values were converted to %U3O8 and plotted on the same graph.
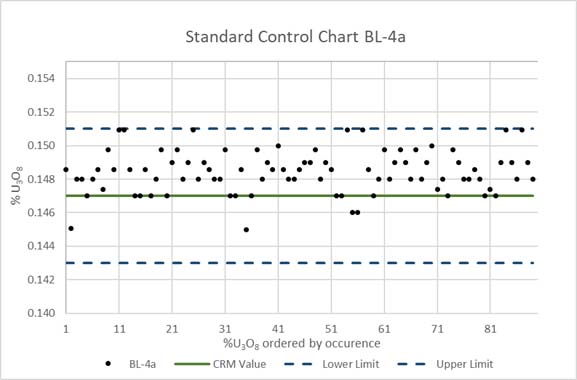
Figure 8‑8: Control Chart for Reference Material BL-4a* analyzed for Uranium and %U3O8 at SRC
*Uranium Total values were converted to %U3O8 and plotted on the same graph.
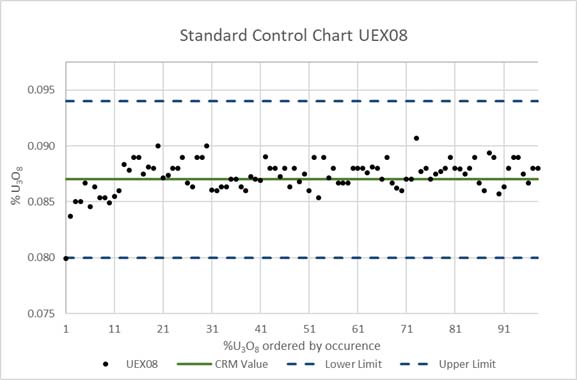
Figure 8‑9: Control Chart for Reference Material UEX08* analyzed for Uranium and %U3O8 at SRC
*Uranium Total values were converted to %U3O8 and plotted on the same graph.
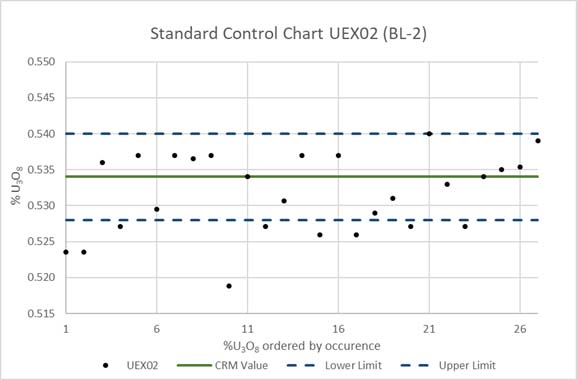
Figure 8‑10: Control Chart for Reference Material UEX02* analyzed for Uranium and %U3O8 at SRC
*Uranium Total values were converted to %U3O8 and plotted on the same graph.
Analysis of standards for the period July 2009 to 2011 indicates that results were acceptable (within three standard deviations from the mean) for 335 or 98% of 345 standards submitted via U ppm ICP Total Digestion and 151 of the 151 standards submitted via the ICPOES U3O8 assay technique (Figure 8‑4, Figure 8‑5, Figure 8‑6, Figure 8‑7, Figure 8‑8, Figure 8‑9, & Figure 8‑10).
The laboratory replicates are found to be in acceptable limits with a correlation coefficient close to one (R2 > 0.999) and have very low dispersion for ICP and ICPOES analytical techniques (Figure 8‑11, Figure 8‑12, Figure 8‑13, & Figure 8‑14).
Upon review of the geochemical sampling for mid-2009 and all of 2011, UEX was unable to discern which samples were the field duplicates. This is likely due to the fact that the database from that period which stored all the Horseshoe and Raven data did not specifically and discretely identify field duplicates and no current staff at UEX was able to use that database to separate out field duplicates. UEX also investigated the 2009 and 2011 assessment reports for this data, and it was not reported separately there either. The QPs are confident that the field duplicates were collected between 2009 and 2011 after having conversations with a geotechnician who split the samples and was responsible for running the sample shack, though his knowledge of the database is negligible.
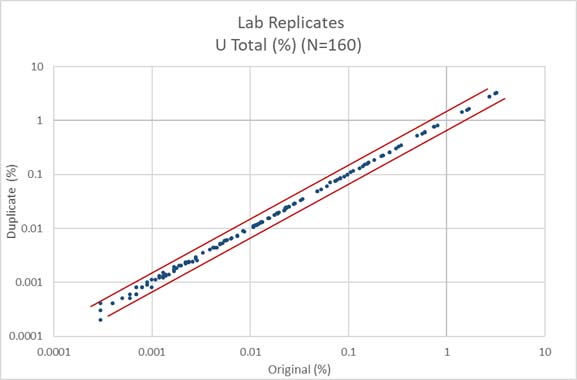
Figure 8‑11: XY Chart for Lab Replicates Analyzed for Uranium at SRC 2009
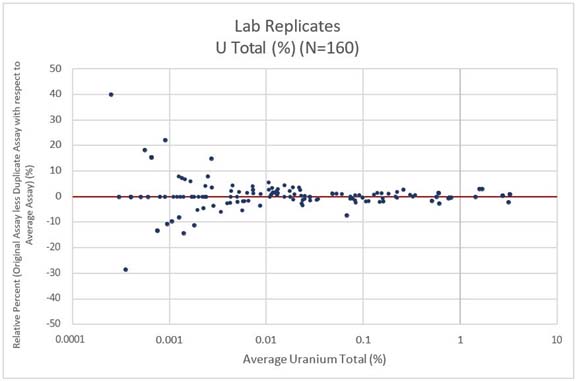
Figure 8‑12: RPD Chart for Lab Replicates Analyzed for Uranium at SRC 2009
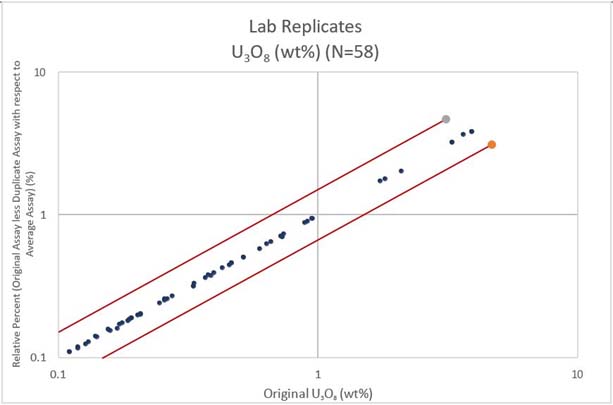
Figure 8‑13: XY Chart for Lab Replicates Analyzed for Uranium SRC 2011
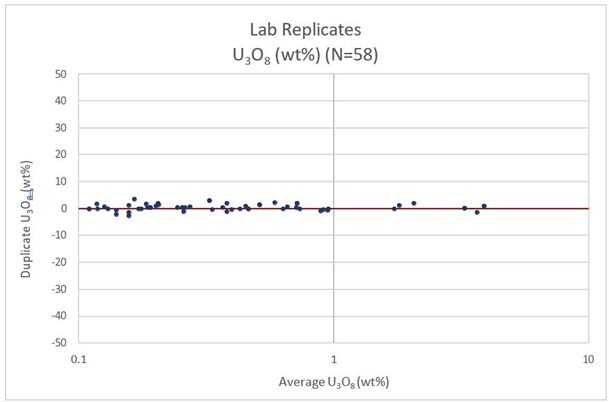
Figure 8‑14: RPD Chart for Lab Replicates Analyzed for Uranium SRC 2011
[The remainder of this page is intentionally left blank.]
|
9. |
DATA VERIFICATION |
|
9.1 |
Qualified Person Data Verification |
In order to verify that the data in the historical UEX database was acceptable for the Horseshoe and Raven Mineral Resource Estimates, the QPs reviewed the data from logging through to the final database. The assay data file from the database was checked against the Golder assay database from 2009 by randomly selecting drillholes and comparing results. No differences were found from the current assay database and the 2009 database. The recent historical drilling was checked against the assay files obtained from SRC, UEX’s primary laboratory. The data verification was carried out by Nathan Barsi (P.Geo.) with assistance from Chris Hamel (P.Geo.) and Susan Biss (P.Geo.), UEX’s Land and Geodatabase Administrator.
In the database, there are a total of 715 drillholes: 404 for Horseshoe and 311 for Raven. This includes 96 new drillholes, which have been added to the database since the completion of the previous estimates for Horseshoe and Raven in July 2009. These include 28 drillholes in Horseshoe and 68 drillholes in Raven drilled in summer 2009 and 2011. The QPs are confident that the assays database is up to date and correct.
|
9.2 |
Database Verification |
Exploration work completed by UEX between 2005 and 2012 was conducted using documented procedures and protocols involving extensive exploration data verifications and validation. During drilling, experienced UEX geologists implemented industry standard best practices designed to ensure the reliability and trustworthiness of the exploration data.
UEX monitored the analytical QC data on a regular basis. Failures of QC samples were investigated, and appropriate actions taken, including re-assaying of samples within batches containing a failure. Results from re-assayed batches replace the original assay of the failed batch.
Data verification was carried out on the resource estimation database, along with data and information from the drilling programs, radiometric probing of the drillholes, geological logging information, core recovery and sampling and the geochemical database. This consisted of verifying for selected holes that:
|
● |
Drillhole ID is unique. |
|
● |
Sample ID is unique. |
|
● |
Individual drillhole records must all be related to one unique Hole ID. |
|
● |
Data intervals do not overlap in space. |
|
● |
Selective core intervals were checked and corroborated against drillhole logging. |
|
● |
Sample intervals do not extend past the end of hole depth. |
|
● |
Downhole radiometric probing data correlate in space and pattern with scintillometer data. |
|
● |
End of hole depth is consistent with drill log information. |
|
● |
Core photos exist and corroborate the drillhole logging. |
|
● |
Drilling date, hole size, and casing length are consistent with the drill logs. |
UEX staff members (Chris Hamel, P.Geo., Nathan Barsi, P.Geo. and Susan Biss., P.Geo.) carried out the database audit and adjustments. Audits on collar, collar survey, downhole survey, casing, core recovery, density, geochemistry, sample measurements, geology, alteration and structure data were carried out. Inconsistencies and errors in the database were verified and corrected. A random selection of drillholes were resurveyed during the site visit to ensure accuracy. No errors were found by the QPs during a review of this database.
|
9.3 |
Logging and Sampling Procedure Review |
During the QPs site visit, the logging and sampling procedure were reviewed against the historical drill logs and were found to be consistent as those described in Section 7.
|
9.4 |
Collar Position |
During the QPs site visit, four drillhole collars were surveyed using Trimble R12 equipment by Mr. Hamel. The surveys were taken when the GPS indicated a minimum of one metre accuracy. The QP’s surveys were then compared to the collar positions in the UEX database. No significant differences were found between the survey collar positions provided by UEX and the GPS surveys complete by the QPs (Table 9‑1).
Table 9‑1: Raven Collars, Comparison between QP's GPS and UEX Database
|
BHID |
2021 Survey |
Original |
Difference |
|||||||
|
Y |
X |
Z |
Y |
X |
Z |
Y |
X |
Z |
||
|
RU-053 |
6446314.8 |
572964.7 |
442.1 |
6446311.9 |
572967.3 |
441.0 |
2.8 |
-2.6 |
1.1 |
|
|
RU-079,-083 |
6446315.1 |
572913.0 |
446.8 |
6446313.6 |
572914.3 |
446.0 |
1.5 |
-1.4 |
0.8 |
|
|
RU-111,-112 |
6446382.8 |
572888.9 |
450.3 |
6446382.8 |
572887.7 |
450.0 |
0.0 |
1.2 |
0.3 |
|
|
RU-272 |
6446278.7 |
572868.6 |
444.2 |
6446277.3 |
572870.3 |
444.0 |
1.4 |
-1.6 |
0.2 |
|
|
9.4.1 |
Downhole Surveys, Collar and Lithology Review |
Prior to conducting the mineral resource estimate, the downhole survey and lithology data were checked against the original survey files and logs and against the 2009 database used for the previous estimates. The QPs checked the validity of the modelling database against the digital lithology log sheets and downhole survey data supplied that existed in the previous resource estimate. No errors were noted in the new data and the minor differences between the old and new databases were due to updated information. The QPs exported all data from the UEX database and found it to be the same as the 2009 database by conducting spot checks of the current database against the 2009 database. Visual checks of the drillhole traces were completed in 3D. The new database was used in the resource estimation contained in this TRS.
In-hole downhole surveys for the UEX Horseshoe and Raven drillholes included dip and azimuth readings obtained from a Reflex EZ-Shot® downhole survey tool. The digital readings from this instrument are recorded on paper logs and corrected to true north prior to input into the database.
During the verification for the previous estimates a total of 1,208 entries in the survey data file were checked against the paper logs. No errors were found in the new drillhole database since the errors were corrected in 2009.
No significant discrepancies were noted in lithologies when comparing the core to the drill logs during the site visits.
The July 2009 downhole survey data from UEX database was checked against the original survey file by randomly selecting five holes from Horseshoe and three from Raven. The verification of survey data was conducted by visual checking of the database against original documents. The QPs visually compared the drillhole traces that were constructed in 3D, with the current database against the 2009 database and no discrepancies were found.
The lithology data from UEX database was checked against original log by randomly selecting three drillholes at Horseshoe and three at Raven. No errors were found.
|
9.5 |
Assay and Bulk Densities Databases |
The assay and bulk densities databases were rigorously checked in the 2009 resource report by Palmer and Fielder. All samples were cross checked with the original assay certificates from the lab. They were found to be appropriate for use in mineral resource estimation. This database was ‘locked in time’ by the previous resource estimate. Mr. Barsi compiled a current assay and densities database and checked it against the 2009 database and found no differences, except for the addition of the new assay data from mid-2009 and 2011. There were no additional density measurements added to the database.
The QPs checked the 2009 and 2011 data against the original SRC assay results sheets and found no differences.
Since no additional bulk density data was collect past the July 2009 resource report, the QPs are satisfied with this data set and for its use in resource estimation.
|
9.6 |
Independent Samples |
The QPs have independently verified the findings of the independent samples taken by Golder by reviewing the original assay values and the assay values obtained by Golder. The QPs agree with Golder’s summary below.
During the site visits in 2007 and 2008, a total of 15 samples were collected from the remaining half core for Horseshoe and Raven and submitted to SRC for assay analysis. These samples are to provide an independent verification of U3O8, mineralization on the Horseshoe and Raven Deposits. Each sample was analyzed by total digestion ICP Analysis. The assay values for the Golder samples compared to the UEX original samples are provided in Table 9‑2. Differences in the assay’s values are probably due to the sample size difference between the Golder samples and the UEX samples. The Golder samples for Horseshoe and Raven were between seven cm and 16 cm in length, whereas the UEX samples average was 70 cm. The samples do confirm the presence of U3O8, mineralization at Horseshoe and Raven deposits.
Table 9‑2: Independent Samples taken by Golder at Horseshoe and Raven
|
Golder |
Original |
||
|
Sample Id |
U3O8 (%) |
Sample Id |
U3O8 (%) |
|
G79037 |
0.100 |
87855 |
2.110 |
|
G79038 |
0.933 |
65068 |
0.348 |
|
G79040 |
0.295 |
69154 |
0.395 |
|
G79041 |
1.438 |
62657 |
0.520 |
|
G79042 |
4.339 |
89598 |
7.600 |
|
G019190 |
1.179 |
2007-901 |
0.528 |
|
G019191 |
5.742 |
G-2008-111 |
1.650 |
|
G019192 |
2.334 |
G-2008-145 |
1.880 |
|
G019193 |
2.134 |
G-2008-73 |
1.860 |
|
G019194 |
0.011 |
2007-1964 |
0.015 |
|
G019195 |
0.947 |
2007-1404 |
0.849 |
|
G013038 |
0.971 |
2007-1826 |
0.977 |
|
G013039 |
0.004 |
2007-1826 |
0.015 |
|
G013040 |
0.002 |
2007-397 |
0.002 |
|
G013041 |
6.732 |
2007-227 |
1.780 |
|
G013042 |
0.498 |
2007-1961 |
0.238 |
|
9.7 |
Conclusion |
The QPs verification indicates that the logging, sampling, shipping, sample security assessment, analytical procedures, inter-laboratory assay validation and validation by different techniques are comparable to industry standard practices.
The QPs recommend an additional check assay sampling program be instituted should the Company implement the recommendation to conduct an updated IA with an economic analysis that would increase the number of check assays for a higher degree of confidence in the summer 2009 and 2011 assay data. It is important to note that these holes were all infill holes and returned values that were within expected ranges for the mineralization that was being confirmed with closer spaced drill centres. The summer 2009 and 2011 data only represent 7.88% of the total assay sample population. Completing these check assays will eliminate future but very minor QA/QC concerns over this subpopulation of assays.
The databases are considered acceptable for Mineral Resource estimation of the Horseshoe and Raven Deposits.
|
9.8 |
QP Comments |
In the opinion of the QPs, the sample collection, preparation, security, and analytical procedures for all assay data for the historical data and the summer 2009 and 2011 drill programs comply with industry standards and are adequate to support mineral resource estimation. This data has been compiled in one current database. The QPs believe that the samples were collected properly, are representative of the material intersected in the holes and hence are representative of the Horseshoe and Raven deposits and can be used to estimate mineral resources in this Technical Report.
A review of the QA/QC program and results by the QPs indicate that the program meets industry standards and the data is sufficient for resource estimation.
|
10. |
MINERAL PROCESSING AND METALLURGICAL TESTING |
Metallurgical test work was completed on the Horseshoe and Raven deposits between 2006 and 2009. The details and analysis of the completed work outlined in this section was provided to the QPs by the Company and is found in:
|
● |
Palmer, K., and Fielder, B., 2009. Technical Report on the Hidden Bay Property, Saskatchewan, Canada, Including Updated Mineral Resource Estimates for Horseshoe and Raven Deposits. Report by Golder Associates Ltd to UEX. |
|
● |
Doerksen, G., Melis, L., Liskowich, M., Murphy, B., Palmer, K., and Pilotto, D., 2011. Preliminary Assessment Technical Report on the Horseshoe and Raven Deposits, Hidden Bay Project Saskatchewan, Canada. Report by SRK Consulting (Canada) Inc. to UEX. |
A summary of the metallurgical work reported in the Doerksen et al (2011) is found below. This has been reviewed and verified by the QP’s.
Metallurgical testing for UEX’s Hidden Bay project included test work on the Horseshoe-Raven deposits. Test work, completed at SGS Canada Inc.’s Lakefield Research facility in Lakefield, Ontario (SGS Lakefield) under the direction of Melis Engineering Ltd., was completed in 2009 on Horseshoe-Raven mineralization. The SGS Canada Lakefield Research facility is recognized across the mining industry as a global leader in metallurgical analysis.
Based on supporting metallurgical test work, process recoveries are estimated to be 95%.
Horseshoe-Raven test composites were prepared from assay rejects and from purpose-drilled HQ core. The elemental analyses of the composites showed that the Horseshoe and Raven uranium deposits are relatively low in deleterious elements such as arsenic, molybdenum, selenium and base metals. Five uranium carriers were identified, uraninite, boltwoodite, uranophane, coffinite and minor amounts of carnotite.
The Horseshoe-Raven composites were categorized as medium in hardness from the perspective of SAG milling, with an average SPI value of 69 minutes. The ball mill Bond Work Indices were all within a tight range of 16.1 to 17.7 kWh/t with an average value of 16.7 kWh/t, showing very little variation across the deposits and characterizing the Horseshoe-Raven mineralization as moderately hard for ball mill grinding.
Leach test results confirmed the Horseshoe-Raven mineralization is easily leached under relatively mild atmospheric leach conditions. Leach extractions of 98% or greater can be achieved for the Horseshoe and Raven mineralization under atmospheric leach conditions using a mesh-of-grind K80 (80% passing size) of approximately 145 µm, a leach temperature of 50ºC, a free acid concentration of 10 g H2SO4/L, representing an acid consumption of 45 kg H2SO4/t, an ORP of 500 mV, representing a sodium chlorate consumption of 0.6 kg NaClO3/t, and a leach retention time of eight to 12 hours. An overall uranium recovery of 95% was used in this study for all the cash flow analysis. Mine optimization work used 96% uranium extraction, prior to finalization of the recovery estimate.
The pregnant leach solution and residue from a Horseshoe bulk leach test were retained to generate waste raffinate and leach residue for waste treatment testing. The specific gravity of the generated tailings was measured at 2.59 t/m3. The tailings K80 was 136 µm and the K50 (50% passing size) was 54 µm.
Tailings supernatant aging tests resulted in elevated levels of radium and molybdenum in the supernatant. This was expected, and confirms that, like all uranium tailings supernatant, excess tailings water would be re-used and/or treated in the mill process and waste treatment circuits under normal operating conditions.
The concentrations of uranium (0.015 mg/L), arsenic (0.0067 mg/L), molybdenum (0.0115 mg/L), radium 226 (0.02 Bq/L) and selenium (0.009 mg/L) obtained in treated effluent are below typical regulatory limits set by the provincial and federal governments.
This TRS assumes that run of mine (“ROM”) material will be trucked to the Rabbit Lake processing facility for treatment. It is assumed that a toll treatment agreement could be reached with Cameco, the owner of the Rabbit Lake plant, which would allow Hidden Bay mineralization to be processed at an average rate of 1,000 tpd. It is also assumed that the Rabbit Lake facility would provide toll tailings deposition for the Hidden Bay ROM material.
[The remainder of this page is intentionally left blank.]
|
11. |
MINERAL RESOURCE ESTIMATE |
|
11.1 |
Introduction |
The Mineral Resource Estimate presented herein represents the first mineral resource evaluation prepared for the Horseshoe and Raven Deposits in accordance with S-K 1300.
Prior to UEC’s acquisition of UEX, the uranium deposits on the Property had previous resource estimates completed in accordance with Canadian National Instrument 43-101 requirements, as UEX was previously governed by Canadian regulations. UEC will not be disclosing those previous estimates in the TRS, as they did not comply with S-K 1300.
The mineral resource model prepared in this TRS by the QPs considers 404 core boreholes (128,180 m) drilled by UEX during the period of 2005 through 2009, and 2011 for the Horseshoe deposit and 311 core boreholes (82,205 m) for the Raven Deposit. The resource estimation work was completed by Mr. Nathan Barsi, P.Geo. (APEGS # 15012) under the supervision of Mr. Roger Lemaitre P.Eng., P.Geo. (APEGS #10647) who is an appropriate QP as this term is defined in S-K 1300. The effective date of the Mineral Resource Statement is October 31, 2021.
This section describes the resource estimation methodology and summarizes the key assumptions considered by the QPs. In the opinion of the QPs, the resource evaluation reported herein is a reasonable representation of the global uranium mineralization found at the Horseshoe and Raven Deposits at the current level of sampling. The mineral resources were estimated in conformity with the CRIRSCO classification criteria for an Indicated Mineral Resource and the requirements of S-K 1300. Mineral resources are not mineral reserves and have not demonstrated economic viability. There is no certainty that all or any part of the mineral resource will be converted into mineral reserve.
The database used to estimate the Horseshoe and Raven mineral resources consists of all the drill data compiled by UEX up to the end of the 2012. This database has been validated by the QPs. The QPs are of the opinion that the current drilling information is sufficiently reliable to interpret with confidence the boundaries for uranium mineralization and that the assay data is sufficiently reliable to support mineral resource estimation.
Datamine Studio RM software was used to construct the geological solids, prepare assay data for geostatistical analysis, construct the block model, estimate metal grades and tabulate mineral resources. Microsoft Excel was used for geostatistical analysis.
|
11.2 |
Mineral Resource Estimation Methodology |
The mineral resources reported herein were estimated using an inverse-distance squared interpolated block modelling approach informed from core borehole data constrained within uranium mineralization wireframes for both deposits. The geological model of the mineralization represents distinct irregularly shaped pods that are mappable continuously from borehole to borehole. The solid used to constrain the block model was defined using a traditional wireframe interpretation constructed from explicit modelling and sectional interpretation of the drilling data using a 0.02% U3O8 threshold. This threshold grade for the deposit modelling was used as it defined the margins and continuity of the uranium mineralization at the Horseshoe and Raven Deposits. Constructing a singular wireframe envelope for both deposits supersedes the 28 subzones for the Horseshoe Deposit and the 16 subzones from the Raven Deposit. However, in the resource estimate presented below, only blocks in the block model that exceeded the COG of 0.05% U3O8 were included in the estimate.
The evaluation of the mineral resources involved the following procedures:
|
● |
Database compilation and verification. |
|
● |
Construction of 3D wireframe models for the boundaries of the uranium mineralization using a 0.02% U3O8 threshold. |
|
● |
Data extraction and processing (capping), and statistical analysis. |
|
● |
Selection of estimation strategy and estimation parameters. |
|
● |
Block modelling and grade estimation. |
|
● |
Validation. |
|
● |
Preparation of the Mineral Resource Estimate. |
|
11.3 |
Resource Database |
All exploration data available to evaluate the mineral resources for the Horseshoe and Raven deposits are listed in Table 11‑1. These holes were drilled by UEX in 2005 through 2009 and 2011. These drillholes pierce the mineralization wireframe or are within the immediate vicinity of it.
Table 11‑1: Horseshoe and Raven Deposits Exploration Drillholes
|
Horseshoe Deposit |
||
|
# of Drillholes |
Metres |
Series of Holes |
|
404 |
128,180 |
HO-001 - H-016, HR-001 - HR-013, HS-001, HU001-HU-373, HU-318A |
|
Raven Deposit |
||
|
# of Drillholes |
Metres |
Series of Holes |
|
311 |
82,206 |
RV-001 - RV-028, RU-001 - RU-283 |
All drillhole collar locations were surveyed by Total station DGPS at the time of their completion.
UEX exported all the relevant borehole sampling data for the mineral estimation as CSV files from the DHLogger database, and Mr. Barsi imported it into Datamine Studio RM. The QP performed the following validation steps:
|
● |
checked minimum and maximum values for each quality value field and confirmed/edited those outside of expected ranges; |
|
● |
checked for gaps, overlaps and out of sequence intervals in assays tables; and |
|
● |
there were very few intervals that needed to be adjusted since the previous resource database was used. The QP spot checked records against the previous database with the current database and found no errors or anomalies. |
After these measures were implemented, no errors were found in the database. The QP is satisfied that the database is useable for mineral resource estimation.
|
11.4 |
Geological Modelling |
Detailed descriptions of the geological characteristics of the Horseshoe and Raven deposits are outlined in Section 6.6. Given the shape of the two deposits, the QPs considered that any future mining of the deposits would likely be by underground cut-and-fill mining methods, as it is one of the most selective underground mining methods in use and suitable for the extraction of non-tabular mineralized bodies. The Horseshoe Deposit dips moderately to the south and has a distinct plunge of mineralization to the northeast following dilational zones between the bedding planes of individual stratigraphic units. The Raven Deposit is more tabular and dips moderately to the southeast.
Due to the distribution of mineralization in each deposit, the continuity of each of the deposits was determined on a section-by-section basis during the process of generating the wireframes. Continuity of mineralization was established by a QP between holes within each individual section and then determined from section to section spaced at 25 m intervals. Sections were setup for each of the two deposits to be perpendicular to the controlling structure. The singular wireframes for both deposits were modeled independently of the stratigraphic units by creating wireframes interpolated from the mineralization assays. Every effort was made to exclude any material below the threshold grade of 0.02% U3O8, but in some cases samples below cut-off would have to be included to achieve the goal of a singular wireframe for each deposit, especially in situations when mineralization occurred along strike of such areas on the adjacent sections that exceeded the threshold grade. The singular strings that bounded the mineralization on each section generally follow the dip/orientation of the previous wireframed subzones resulting in strings that are generally irregular versions of lenticular, tabular and vein-like horizons. Once the strings outlining the mineralization on each section were completed, they were joined together to create a singular wireframe defined within the diamond drillhole pattern (Figure 11‑1, Figure 11‑2, Figure 11‑3, & Figure 11‑4). The authors have determined that given the density of drilling of both deposits that there would be areas between the sections within the wireframe that were not mineralized, given that the continuity of mineralization on each section was previously established. The wireframes show the deposits to be anastomosing bodies that are contiguous from section to section when appropriate. This is not surprising given that the mineralization is mostly a disseminated style with areas of higher grade being more vein type controlled. The Horseshoe wireframe dips moderately to the southeast and has a distinct plunge to the mineralization progressing from the southwest to northeast. The Raven wireframe is more tabular and dips moderately to the southeast. Upon completion of the wireframes, the assay sample database was trimmed to samples that only fall within the mineralized wireframe.
The continuity of the mineralization on each section and between sections was compared to the interpolated block model developed and described in Sections 11.8, 11.8, 11.10 and 11.11 below. As shown in Figures 11.9 and 11.10, good correlation between mineralized holes was observed and the interpolated block grades matched assay grades closely.
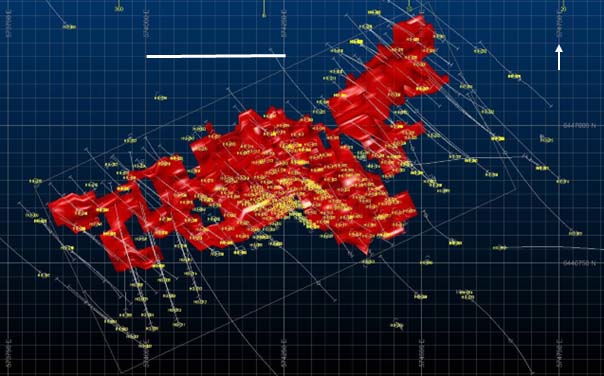
Figure 11‑1: Horseshoe Wireframe Plan View (Looking Down)
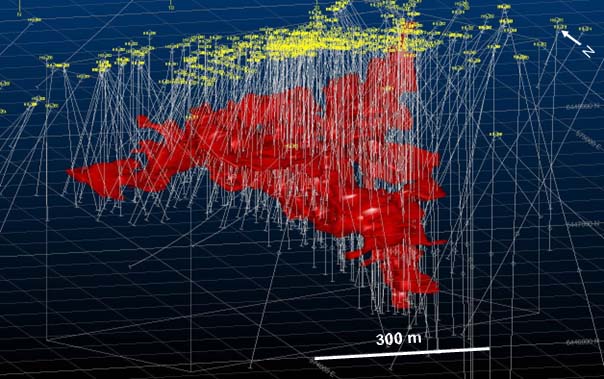
Figure 11‑2: Horseshoe Wireframe Isometric View (Looking NNE)
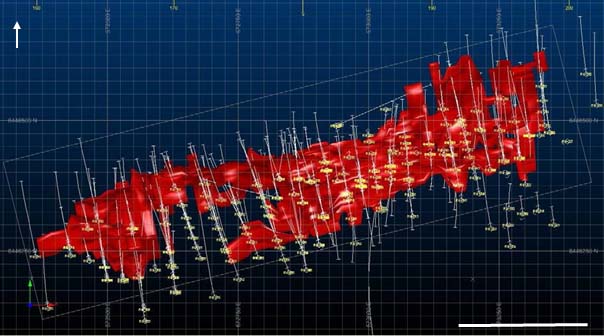
Figure 11‑3: Raven Wireframe Plan View (Looking Down)
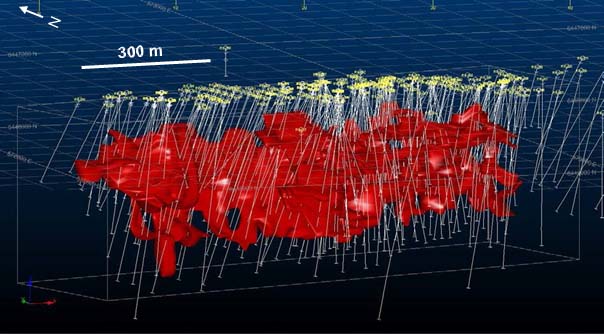
Figure 11‑4: Raven Wireframe Isometric View (Looking NNE)
|
11.5 |
Specific Gravity |
Specific gravity measurements were obtained by dry bulk density at the assay laboratory as part of the routine assaying protocol. A total of 2,198 specific gravity measurements were taken within the various stratigraphic units and in all types of alteration on the Horseshoe deposit, while 1,526 samples were taken on the Raven deposit. Due to the spatial location of the specific gravity measurements and the lack of correlation between the measurements and the metal content, a uniform specific gravity was applied to the uranium mineralization wireframes of 2.48 (Figure 11‑5 and Figure 11‑6) and (Table 11‑2 and Table 11‑3).
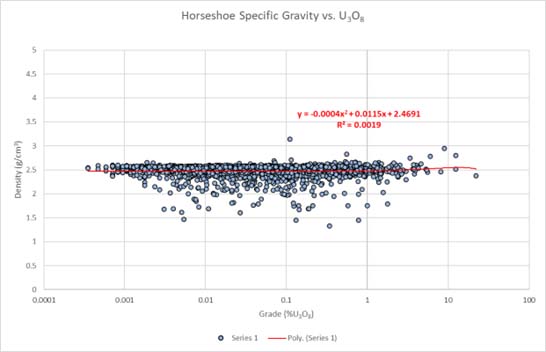
Figure 11‑5: Horseshoe Density vs U3O8
Table 11‑2: Horseshoe Density Statistics
|
Horseshoe Density Statistics |
|
|
Mean |
2.48 |
|
Standard Error |
0.00 |
|
Median |
2.52 |
|
Mode |
2.54 |
|
Standard Deviation |
0.15 |
|
Sample Variance |
0.02 |
|
Kurtosis |
10.98 |
|
Skewness |
-2.44 |
|
Range |
1.81 |
|
Minimum |
1.33 |
|
Maximum |
3.14 |
|
Sum |
5461.39 |
|
Count |
2198.00 |
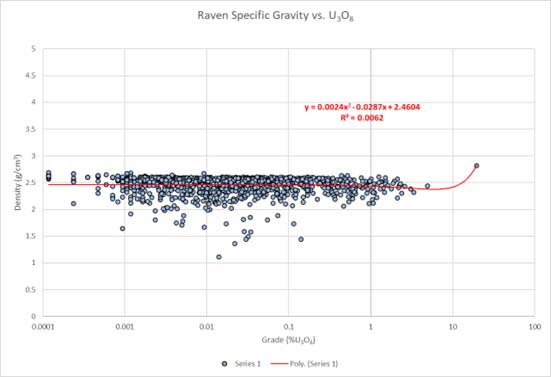
Figure 11‑6: Raven Density vs U3O8
|
[The remainder of this page is intentionally left blank.] |
Table 11‑3: Raven Density Statistics
|
Raven Density Statistics |
|
|
Mean |
2.48 |
|
Standard Error |
0.00 |
|
Median |
2.53 |
|
Mode |
2.57 |
|
Standard Deviation |
0.18 |
|
Sample Variance |
0.03 |
|
Kurtosis |
8.47 |
|
Skewness |
-2.24 |
|
Range |
1.82 |
|
Minimum |
1.11 |
|
Maximum |
2.93 |
|
Sum |
3780.93 |
|
Count |
1526.00 |
|
11.6 |
Composites |
Assays were composited to one metre lengths, which is the 80th percentile of the lengths contained within the mineralized wireframe. The minimum composite length allowed is 0.15 m. The compositing method chosen in Datamine Studio RM is the one whereby all samples are included in one of the composites. This is achieved by adjusting the composite length but trying to keep the length as close as possible to one metre. Compositing had the effect of slightly reducing the coefficient of variation.
|
11.7 |
Capping |
Basic statistics, histograms and cumulative probability plots for each metal were applied to determine appropriate capping grades. A QP capped the Horseshoe assays at 10% and the Raven assays at 1.88% after generating cumulative probability plots. These are illustrated in Figure 11‑7 and Figure 11‑8. Basic statistics for the uranium assays, composited assays, composite assays trimmed to inside the wireframe, and composite assays trimmed to the wireframe with capping applied, are summarized in Table 11‑4. A QP used the composite assayed that were capped and trimmed to the uranium wireframe assays to complete the block model estimations for each deposit.
[The remainder of this page is intentionally left blank.]
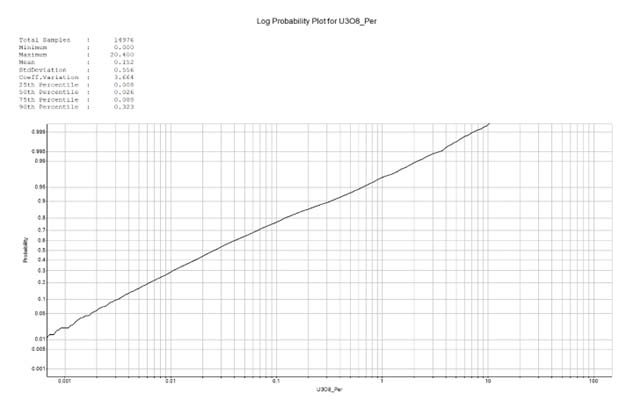
Figure 11‑7: Log Probability Plot for Horseshoe Composite and Trimmed Assays
[The remainder of this page is intentionally left blank.]
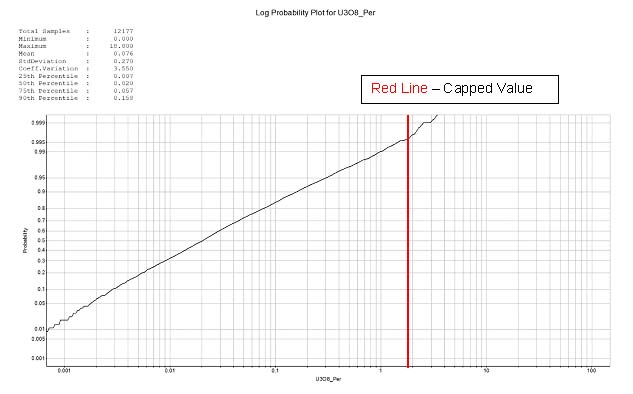
Figure 11‑8: Log Probability Plot for Raven Composite and Trimmed Assays
Table 11‑4: Basic Statistics for Mineralized Wireframes at Horseshoe and Raven
|
Horseshoe and Raven Deposits |
|||||||
|
Deposit |
Sample Count |
Minimum |
Maximum |
Mean |
Standard Deviation |
Coefficient of Variation |
Capped Count |
|
Assays |
|||||||
|
Horseshoe |
24068 |
0.0000 |
20.40 |
0.100 |
0.449 |
4.50 |
- |
|
Raven |
21463 |
0.0000 |
18.80 |
0.047 |
0.214 |
4.51 |
- |
|
Comp. Assays |
|||||||
|
Horseshoe |
23755 |
0.0000 |
20.40 |
0.100 |
0.449 |
4.48 |
- |
|
Raven |
20983 |
0.0001 |
18.80 |
0.048 |
0.211 |
4.42 |
- |
|
Comp. Trim. Assays |
|||||||
|
Horseshoe |
14976 |
0.0000 |
20.40 |
0.152 |
0.556 |
3.66 |
- |
|
Raven |
12177 |
0.0001 |
18.80 |
0.076 |
0.270 |
3.55 |
- |
|
Trim. Cap. Assays |
|||||||
|
Horseshoe |
14976 |
0.0000 |
10.00 |
0.150 |
0.513 |
3.42 |
8 |
|
Raven |
12177 |
0.0001 |
1.88 |
0.073 |
0.184 |
2.53 |
42 |
|
11.8 |
Block Model Definition |
As a starting point, the QPs followed the block size criteria set forth in the 2009 Report, with a block size of five by five by 2.5 m for the mineralized wireframe. The QPs visually checked the blocks in both 2D and 3D and deemed it appropriate to use the existing block criteria as referenced above. Sub-cells, at 0.25 m resolution, were used to respect the geology of the modelled wireframe. Sub-cells were assigned the same grade as the parent cell. The block model was rotated on the Z-axis to honor the orientation of the mineralization. The characteristics of the final block model are summarized in Table 11‑5.
Table 11‑5: Horseshoe and Raven Deposits Block Model Specifications
|
Horseshoe Deposit |
|||||||
|
Lenses |
Axis |
Block Size (m) |
Origin* |
Number of Cells |
Rotation Angles |
Rotation Priority |
|
|
Parent |
Sub-cell |
||||||
|
All |
X |
5 |
0.25 |
555,740 |
128 |
- |
- |
|
Y |
5 |
0.25 |
6,415,140 |
30 |
- |
- |
|
|
Z |
2 |
0.25 |
330 |
40 |
345 |
1 |
|
|
Raven Deposit |
|||||||
|
Lenses |
Axis |
Block Size (m) |
Origin* |
Number of Cells |
Rotation Angles |
Rotation Priority |
|
|
Parent |
Sub-cell |
||||||
|
All |
X |
5 |
0.25 |
555,740 |
128 |
- |
- |
|
Y |
5 |
0.25 |
6,415,140 |
30 |
- |
- |
|
|
Z |
2 |
0.25 |
330 |
40 |
345 |
1 |
|
|
* UTM grid (NAD 83 datum) |
|||||||
|
11.9 |
Search Ellipsoid |
The QPs chose search ellipsoids based on the controls of mineralization at both deposits. The X-axis was the long axis as it is parallel to the main trend of the axial plane that controls mineralization. The Y-axis was rotated to match the general dip of the units. The Z-axis was most restrictive to limit spreading/smearing of material between zones of higher-grade mineralization (Table 11‑6).
Table 11‑6: Search Ellipse Parameters for Horseshoe and Raven Estimation
|
Horseshoe Deposit |
||||||||
|
R1x |
R1y |
R1z |
Angle1 |
Angle1 |
Angle1 |
Axis |
Axis |
Axis |
|
(m) |
(m) |
(m) |
1 |
2 |
3 |
1 |
2 |
3 |
|
15 |
15 |
10 |
335 |
-40 |
0 |
3 |
1 |
3 |
|
Raven Deposit |
||||||||
|
R1x |
R1y |
R1z |
Angle1 |
Angle1 |
Angle1 |
Axis |
Axis |
Axis |
|
(m) |
(m) |
(m) |
1 |
2 |
3 |
1 |
2 |
3 |
|
25 |
25 |
10 |
345 |
-40 |
0 |
3 |
1 |
3 |
|
1 The rotation angles are shown in Datamine RM convention. |
||||||||
|
11.10 |
Estimation Strategy |
Table 11‑7 summarizes the general estimation parameters used for the uranium estimation. Grade estimation used an inverse distance weighting a squared estimation algorithm and three passes informed by composited, capped and trimmed to wireframe assays. The first pass was the most restrictive in terms of search radii required. Successive passes usually populate areas with less dense drilling, using less restrictive data requirements (Table 11‑8). Upon completion of the estimation, the QPs reviewed the resource estimate at each cross-section to visually ensure that the estimation was representative of the assay grades where the drillhole pierces/passes through the wireframe. For the first estimation pass, assays from at least five samples were required to estimate a block, though most blocks used the maximum numbers or assays allowable if it could get them.
Table 11‑7: Estimation Parameters for Horseshoe and Raven Deposits
|
Horseshoe Deposit |
|||
|
Parameter |
1st Pass |
2nd Pass |
3rd Pass |
|
Interpolation method |
ID2 |
ID2 |
ID2 |
|
Search range X (relative to ellipse) |
1X |
1X |
1X |
|
Search range Y (relative to ellipse) |
1X |
1X |
1X |
|
Search range Z (relative to ellipse) |
1X |
1X |
1X |
|
Minimum number of Assays |
5 |
3 |
3 |
|
Maximum number of Assays |
10 |
12 |
24 |
|
Raven Deposit |
|||
|
Parameter |
1st Pass |
2nd Pass |
3rd Pass |
|
Interpolation method |
ID2 |
ID2 |
ID2 |
|
Search range X (relative to ellipse) |
1X |
2X |
4X |
|
Search range Y (relative to ellipse) |
1X |
2X |
4X |
|
Search range Z (relative to ellipse) |
1X |
2X |
4X |
|
Minimum number of Assays |
5 |
3 |
3 |
|
Maximum number of Assays |
24 |
24 |
24 |
[The remainder of this page is intentionally left blank.]
Table 11‑8: Volume Estimated per Pass for Each Deposit
|
Horseshoe Deposit |
|||
|
Lenses |
Estimation |
Volume |
Percent |
|
Pass |
Estimation |
Estimated |
|
|
All |
1 |
196,577 |
70% |
|
2 |
81,913 |
29% |
|
|
3 |
1187 |
1% |
|
|
Raven Deposit |
|||
|
Lenses |
Estimation |
Volume |
Percent |
|
Pass |
Estimation |
Estimated |
|
|
All |
1 |
303,772 |
88% |
|
2 |
39,005 |
11% |
|
|
3 |
1159 |
1% |
|
|
11.11 |
Block Model Validation |
The resulting block models for both the Horseshoe and Raven Deposits were validated by:
|
● |
Comparison of block model volumes to volumes within solids. |
|
● |
Visual comparison of colour-coded block model grades with drillhole grades on section and plan plots. |
|
● |
Comparison of block model grades and drillhole grades using swath plots. |
|
11.11.1 |
Block Volume/Solid Volume Comparison |
The block model volumes were compared to the wireframe volumes (Table 11‑9). Both deposits returned nearly identical volumes for the block models versus the wireframes. The very small variation in volume is likely from using cubes to fill a complex irregular shape.
Table 11‑9: Wireframe Volume vs Block Model Volume
|
Horseshoe |
|
|
Wireframe Volume (m3) |
Block Model Volume (m3) |
|
4,495,576 |
4,495,127 |
|
Raven |
|
|
Wireframe Volume (m3) |
Block Model Volume (m3) |
|
5,174,080 |
5,174,176 |
|
11.11.2 |
Visual Validation of Sections |
The visual comparisons of block model grades with composite grades for both deposits show a reasonable correlation between the values. No significant discrepancies were apparent from each section that was reviewed. Examples of this process can be seen in Figure 11‑9 and Figure 11‑10.
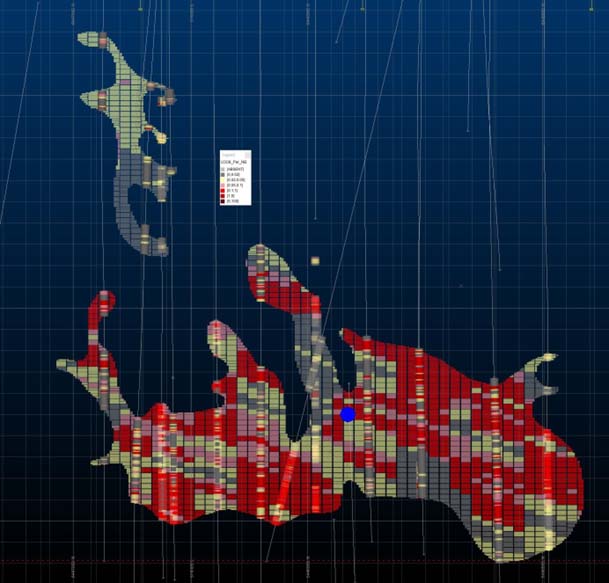
Figure 11‑9: Horseshoe Visual Check of Drillhole Grades against Block Grades (Section Orientation of 335°)
[The remainder of this page is intentionally left blank.]
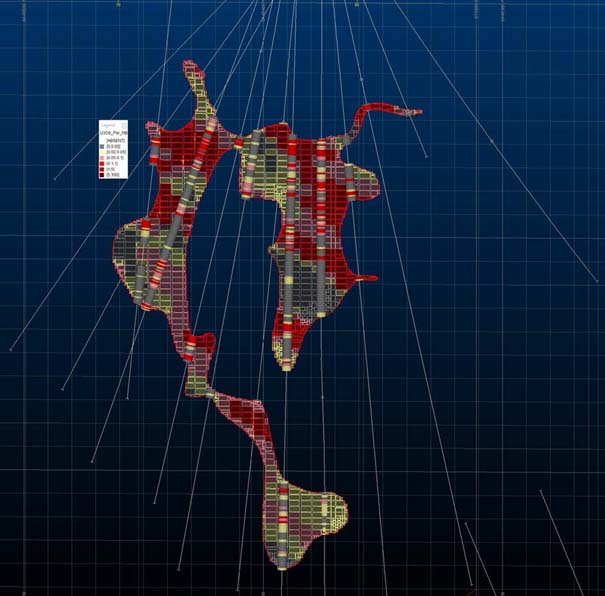
Figure 11‑10: Raven Visual Check of Drillhole Grades against Block Grades (Section Orientation of 345°)
|
11.11.3 |
Swath Plots |
Swath plots (Figure 11‑11 & Figure 11‑12) have been generated for the block model grades versus the drillholes assays for each wireframe. In general, the swath plots show a good correlation between drillholes and ID2 values. There are a few instances where the swath plot has discrete peaks that weakly correlate, but that is likely due to the irregular morphology of the deposits as it progresses along the X direction. The swath plots show that the block model is not exaggerating the localized high-grade uranium assays and was used as confirmation that the model is not over-estimating uranium grades.
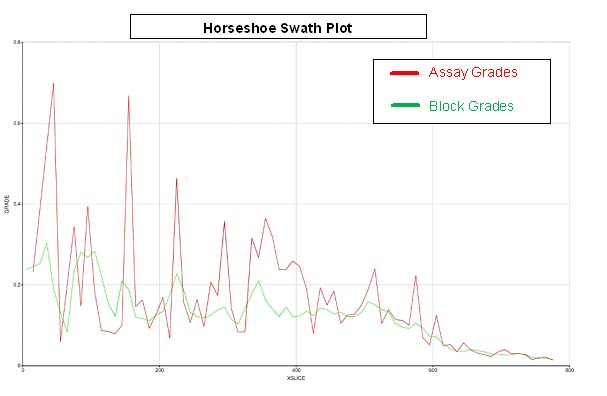
Figure 11‑11: Horseshoe Swath Plot in the X Direction
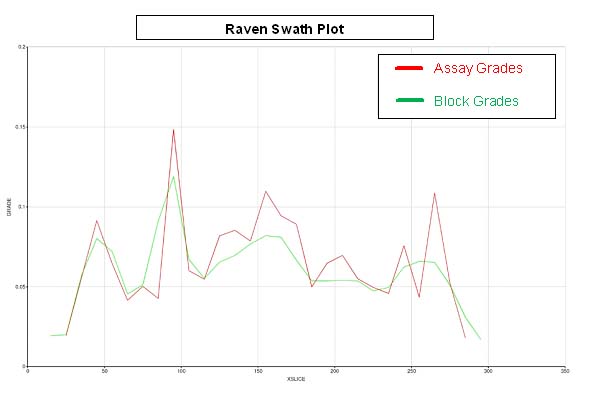
Figure 11‑12: Raven Swath Plot in the X Direction
|
11.11.4 |
Validation Author Statement |
Validation checks confirm that the block estimates are a reasonable representation of the informing data considering the current level of geological and geostatistical understanding of the Property.
|
11.12 |
Mineral Resource Classification |
Block model quantities and grade estimates were classified according to the CRIRSCO classification criteria for an Indicated Mineral Resource and the requirements of S-K 1300 by Mr. Nathan Barsi, P.Geo. (APEGS#15012) under the supervision of Mr. Roger Lemaitre P.Eng., P.Geo. (APEGS #10647).
The CRIRSCO definition for an Indicated Mineral Resource in the 2017 SME Guide is:
“A Mineral Deposit or part of a deposit may be classified as an Indicated Mineral Resource in a Public Report when the nature, quality, amount, and distribution of data are such as to allow the Competent Person determining the Mineral Resource to confidently interpret the geological framework and to assume physical continuity of mineralization. Confidence in the estimate is sufficient to allow the appropriate application of technical and economic parameters to prepare incremental mine plans (typically annual or phases) and production schedules and to enable an evaluation of economic viability. Overall confidence in the estimates is high, while local confidence is reasonable. The Competent Person should recognize the importance of the Indicated Mineral Resource class to the advancement of the project. An Indicated Mineral Resource estimate is of sufficient quality to support detailed technical and economic studies leading to Probable Mineral Reserves which can serve as the basis for major development decisions.
In assessing continuity between points of observation, the Competent Person should consider the likely cut-off grade and geometric limits that would be used to prepare incremental (e.g., annual or phased) mine plans.”
The 2017 SME Guide goes on to state that in regard to the QP’s choice for the appropriate class of mineral resource that for indicated resources:
“Confidence in the estimate is sufficient to allow the appropriate application of technical and economic parameters to prepare incremental plans (typically annual or phased) and production schedules and to enable an evaluation of economic viability”.
The QPs are satisfied that the geological modelling honors the current geological information and knowledge. The location of the samples and the assay data are sufficiently reliable to support resource evaluation. The sampling information was acquired by core drilling with pierce points between seven metres and 30 m apart, but generally at 10 m across section and 25 m along strike. The QPs are confident that it has modelled the overall spatial location of the uranium mineralization and that it is representative of the controls. Preliminary metallurgical data has been collected and has been disclosed in the relevant section. The QPs consider all block estimates within the mineralized lenses to satisfy the classification CRIRSCO criteria for an Indicated Mineral Resource.
The COG used to determine resources was calculated to be 0.05% U3O8 by the QPs.
The QPs determined COG by considering a cut-and-fill underground mining method for the two deposits. The mining parameters used to determine COG are listed in Table 11‑10. The limitations associated with typical cut-and-fill mining processes require that all rock present within a mineralized zone be mined and removed from the mining stope regardless of whether or not that portion of rock is mineralized, partially mineralized or is considered to be waste rock. Thus, the cost to mine mineralized rock is equivalent to the cost of mining waste rock. In a cut-and-fill underground mining scenario, waste rock must be removed.
The basis for the processing/water treatment and general and administrative costs provided by the Registrant, who completed a scoping level engineering analysis report of the Property using a heap leach recovery method and cut-and-fill mining. The QPs used the costs provided by the Registrant for processing and G&A that were dated in 2016 and inflated the costs using the Canadian Consumer Price Index to equivalent costs as of March 1, 2024. The mining costs were obtained from Canadian Mining Journal article on mechanized cut and fill mining. The inflated processing and G&A costs and the mining costs were used to help determine the resource estimate COG.
Processing, water treatment, general and administrative costs, along with mining and milling recoveries using heap leach extraction, were estimated for the Horseshoe and Raven deposits. The uranium price of US$75/lb U3O8 was used and is considered reasonable given the range of spot uranium prices reported by industry price expert TradeTech between September 15, 2023 and this TRS’ effective date of March 1, 2024. An exchange rate of C$1.00 to US$0.73 was used.
As the cost of mining waste rock and mineralized rock are the same in cut-and-fill underground extraction, marginal COGs are determined exclusively from the processing, water treatment and general and administrative costs.
The marginal COG was determined using the formula:
| COG = | Processing+Water Treat+G&A+ Mining Cost per tonne |
| Uranium Price (in CAD$ per t) x total recovery |
Criteria related to calculating COG is presented in Table 11‑10.
[The remainder of this page is intentionally left blank.]
Table 11‑10: Cut-Off Grade Determination
|
Assumptions |
||||||
|
Uranium Price |
$ 75.00 |
USD/lb U3O8 |
||||
|
$ 165,345 |
USD/t U3O8 |
|||||
|
$ 226,500 |
CAD/t U3O8 |
|||||
|
Mining Recovery |
95.0% |
|||||
|
Processing Recovery |
95.0% |
|||||
|
Total Recovery |
90.3% |
|||||
|
USD Exchange |
C$1.00 = |
$ 0.73 |
US |
|||
|
Mining, Processing and General Administrative Costs |
||||||
|
Mining Costs* |
$ 47.83 |
|||||
|
Processing/Water Treatment |
$ 32.75 |
|||||
|
General and Administrative |
$ 22.23 |
|||||
|
Total |
$ 102.81 |
|||||
|
Marginal Cut-Off Grade |
||||||
|
Cut-Off Grade = |
Processing Cost + Mining Cost |
|||||
|
Uranium Price (CAD$/t) x Total Recovery |
||||||
|
Cut-Off Grade = |
0.05% |
U3O8 |
||||
|
* In Cut-and-Fill Mining, cost to Mine Mineralization = cost to Mine Waste |
||||||
|
t Processing Costs in equation include water treatment and general and administrative costs |
||||||
Only blocks within the wireframe model that exceeded the COG of 0.05% U3O8 were included in the resource estimate.
Mineral resources are not mineral reserves and do not have demonstrated economic viability. There is no certainty that all or any part of the mineral resources will be converted into mineral reserve. The QPs are unaware of any environmental, permitting, legal, title, taxation, socio-economic, marketing and political or other relevant issues that may materially affect the mineral resources.
The Mineral Resource Estimate for the Horseshoe and Raven Deposits is presented in Table 11‑11.
Table 11‑11: Horseshoe and Raven Deposits Mineral Resource Estimates
|
Horseshoe Deposit Uranium Resource |
||||
|
Deposit |
Category |
Quantity (Tonnes) |
Average Grade U3O8 (%) |
Total lb. U3O8 |
|
Horseshoe |
Indicated |
4,982,500 |
0.215 |
23,594,000 |
|
Raven Deposit Uranium Resources |
||||
|
Deposit |
Category |
Quantity (Tonnes) |
Average Grade U3O8 (%) |
Total lb. U3O8 |
|
Raven |
Indicated |
5,370,000 |
0.117 |
13,832,400 |
*Mineral resources are not mineral reserves and have not demonstrated economic viability. There is no certainty that all or any part of the mineral resource will be converted into mineral reserves. All figures are rounded to reflect the relative accuracy of the estimates. Resources were estimated using a COG of 0.05% U3O8.
|
11.13 |
Grade Sensitivity Analysis |
The mineral resource model is relatively sensitive to the selection of the reporting uranium COG. To illustrate this sensitivity, the quantities and grade estimates are presented in Table 11‑12 at various COGs. The reader is cautioned that the figures presented in this table should not be misconstrued with a Mineral Resource Statement. The tables are only presented to show the sensitivity of the block model estimate to the selection of U3O8 COG.
Table 11‑12: Global Block Model Quantities and Grade Estimates at Various U3O8 Cut-Off Grades
|
Horseshoe Grade Sensitivity Analysis |
||||
|
Cut-Off |
Indicated Blocks |
|||
|
Grade |
Volume / Quantity |
Grade |
||
|
U3O8 |
Volume |
Tonnage |
U3O8 |
|
|
(%) |
(m3) |
(tonnes) |
(%) |
|
|
0.01 |
4,113,990 |
10,202,696 |
0.119 |
|
|
0.02 |
3,415,704 |
8,470,945 |
0.140 |
|
|
0.05 |
2,009,077 |
4,982,512 |
0.215 |
|
|
0.10 |
1,196,033 |
2,966,088 |
0.313 |
|
|
0.15 |
866,315 |
2,148,462 |
0.386 |
|
|
0.20 |
628,722 |
1,559,230 |
0.466 |
|
|
0.25 |
468,775 |
1,162,562 |
0.548 |
|
|
0.30 |
372,190 |
923,032 |
0.620 |
|
|
0.35 |
300,907 |
746,250 |
0.689 |
|
|
0.40 |
238,923 |
592,530 |
0.771 |
|
|
Raven Grade Sensitivity Analysis |
||||
|
Cut-Off |
Indicated Blocks |
|||
|
Grade |
Volume / Quantity |
Grade |
||
|
U3O8 |
Volume |
Tonnage |
U3O8 |
|
|
(%) |
(m3) |
(tonnes) |
(%) |
|
|
0.01 |
5,013,261 |
12,432,888 |
0.066 |
|
|
0.02 |
4,117,590 |
10,211,623 |
0.077 |
|
|
0.05 |
2,165,334 |
5,370,028 |
0.117 |
|
|
0.10 |
867,706 |
2,151,912 |
0.186 |
|
|
0.15 |
439,339 |
1,089,560 |
0.250 |
|
|
0.20 |
244,018 |
605,165 |
0.312 |
|
|
0.25 |
149,652 |
371,138 |
0.368 |
|
|
0.30 |
93,338 |
231,479 |
0.424 |
|
|
0.35 |
60,029 |
148,873 |
0.481 |
|
|
0.40 |
40,251 |
99,822 |
0.534 |
|
The sensitivity analysis indicates that a large portion of the resource for the deposits are lower grade pounds.
|
11.14 |
Resource Uncertainty and Prospect of Economic Extraction |
As shown in Table 11‑12, the tonnage of the mineral resource estimate is very sensitive to changes in COG. As COG was determined using marginal operating costs, uranium prices of US$75.00/lb U3O8, mining recovery of 95%, and milling recovery of 95%, these sources of uncertainty could have a material impact on the tonnage of the total indicated resources presented in Table 11‑11. As uranium prices are currently highly volatile, a significant decrease in uranium prices could have a significant decrease in the total tonnage of the indicated resources. Additional metallurgical heap leach extraction studies would be required to provide additional certainty to the metallurgical recovery before economic studies could be completed.
Sampling, drilling methods, data processing and handling, geological modeling and the estimation method used are not considered to be well constrained and understood and likely would not have a material impact on the tonnage of the indicated resources presented in Table 11‑11.
It is the opinion of the QPs that all issues related to the technical and economic factors that are likely to influence the prospect of economic extraction can be resolved with further work. The uncertainty of some of these factors may be resolved with the recommended work program outlined below in Section 23.
[The remainder of this page is intentionally left blank.]
|
12. |
MINERAL RESERVE ESTIMATES |
As this TRS is considered an IA, there are no mineral reserves for the Property.
[The remainder of this page is intentionally left blank.]
|
13. |
MINING METHODS |
As this TRS is considered an IA, detailed mining methods have not been determined for the Property.
[The remainder of this page is intentionally left blank.]
|
14. |
PROCESS AND RECOVERY METHODS |
As this TRS is considered an IA, detailed process and recovery methods have not been determined for the Property.
[The remainder of this page is intentionally left blank.]
|
15. |
INFRASTRUCTURE |
As this TRS is considered an IA, detailed infrastructure plans have not been determined for the Property.
[The remainder of this page is intentionally left blank.]
|
16. |
MARKET STUDIES |
As this TRS is considered an IA, detailed market studies have not been completed for the Property.
[The remainder of this page is intentionally left blank.]
|
17. |
ENVIRONMENTAL STUDIES, PERMITTING, PLANS, NEGOTIATIONS OR AGREEMENTS WITH LOCAL INDIVIDUALS OR GROUPS |
As this TRS is considered an IA, detailed environmental studies, plans, negotiations or agreements with local individuals or groups have not been completed for the Property.
[The remainder of this page is intentionally left blank.]
|
18. |
CAPITAL AND OPERATING COSTS |
As this TRS is considered an IA, detailed capital and operating cost studies have not been completed for the Property.
[The remainder of this page is intentionally left blank.]
|
19. |
ECONOMIC ANALYSIS |
As this TRS is considered an IA, an economic analysis has not been completed for the Property.
[The remainder of this page is intentionally left blank.]
|
20. |
ADJACENT PROPERTIES |
There are no applicable adjacent properties to the Horseshoe and Raven Deposits.
[The remainder of this page is intentionally left blank.]
|
21. |
OTHER RELEVANT DATA AND INFORMATION |
There is no other known relevant data and information at this stage of the project.
[The remainder of this page is intentionally left blank.]
|
22. |
INTERPRETATION AND CONCLUSIONS |
The singular wireframe constructed by the current QPs was developed using the former authors’ subzones for each deposit as a guide. The alternate section definition and the distribution of the drillholes and assays resulted in the majority of the subzones being truncated by the newly interpreted singular wireframes around the margin of the two deposits.
The Horseshoe Deposit is estimated to contain an indicated resource of 23,594,000 lbs U3O8 with an average grade of 0.215% U3O8 at a COG of 0.05% U3O8. The Raven Deposit is estimated to contain an indicated resource of 13,832,400 lbs U3O8 with an average grade of 0.117% U3O8 at a COG of 0.05% U3O8. No inferred resources have been estimated for either deposit.
The Raven deposit’s contained uranium in indicated resources in this estimate is increased by 0.1% along with the average grade increase at a cut-off of 0.05% U3O8 when compared to the combined indicated and inferred resources reported in the 2009 Report. The objective of the 2011 drill program at the Raven deposit was to confirm continuity of mineralization. The very small increase in resources estimated at the Raven deposit in this TRS, as well as the corresponding slight increase in grade is partly the result of the results of the 2011 drill program.
This updated mineral resource will be able to be used for any future development work on the Property given that all the drillhole data has been included and disclosed at effective date of this TRS.
The total tonnage of the mineral resource estimate presented above is very sensitive to changes in COG, and thus changes to marginal operating costs, uranium prices, mining recovery and milling recovery. As uranium prices are currently highly volatile, a significant decrease in uranium prices could have a significant decrease in the total tonnage of the indicated resources. Additional metallurgical heap leach extraction studies would be required to provide additional certainty to the metallurgical recovery before economic studies could be completed.
Most issues related to the technical and economic factors that are likely to influence the prospect of economic extraction can be resolved with further engineering work.
[The remainder of this page is intentionally left blank.]
|
23. |
RECOMMENDATIONS |
The QPs’ recommendations are as follows:
|
23.1 |
Preliminary Economic Assessment |
Given that the Horseshoe and Raven resource is in the indicated category, it is recommended than an IA with economic parameters be completed in order to determine the potential economics and viability of mining the Horseshoe and Raven Deposits. This document would determine whether the projects warrant advancing to a pre-feasibility study. Completing the economic parameters for an IA is estimated to cost CAD $150,000 - $200,000.
|
23.2 |
Additional Field Duplicate Sampling |
During the proposed IA work recommended in Section 22, it is recommended that UEC undertake an additional sampling program to supplement the summer 2009 to 2011 assay data as the field duplicate data could not be easily segregated and validated from the assay database. The QPs are confident that field duplicate samples were taken, but taking additional samples would eliminate any doubt of the validity of the data and eliminate future but very minor QA/QC concerns over this subpopulation (7.88% of the total sample database) as part of any future preliminary economic assessment, as recommended in Section 26.1.
It is recommended to take approximately 500 samples across both deposits, as this would be approximately 2% of the sample population to date. The majority of the costs associated with an additional sampling program would be analytical costs, as the sample pulps from the original assay sample pulps may still be available from the laboratory. If the samples are available, the estimated cost of an additional sampling program would be CAD $25,000. If they are not available, the cost would increase by approximately 33%, as new samples would have to be collected from the historical drill core the next time an exploration program is active at the Raven camp where the core is stored. This would cost approximately CAD $35,000.
|
23.3 |
Advanced Metallurgy |
Preliminary metallurgy was completed for the 2009 and 2011 technical reports. Additional metallurgical work was completed in 2015, focusing on the viability of using uranium heap leach recovery. It is recommended that UEC advance the heap leach metallurgical testing to the next phase by completing additional compositing of representative samples from the Horseshoe and Raven deposits to continue developing the parameters for recovering the mineralized material in a sellable product. A recommended minimum of six tonnes of material is required for this work. The cost of completing this work would be CAD $2,350,000, and is broken down in the Table 23‑1.
Table 23‑1: Cost Break Down of Metallurgical Drill Program
|
Description |
Total (C$ 000’s) |
|
Direct Costs |
|
|
Personnel |
220 |
|
Field Equipment Costs |
30 |
|
Analysis |
80 |
|
Travel and Transport |
15 |
|
Miscellaneous |
5 |
|
Subtotal |
350 |
|
Contractor Costs |
|
|
Diamond Drilling |
1,500 |
|
Camp Costs |
400 |
|
Other Contractor |
400 |
|
Subtotal |
2,000 |
|
Total |
2,350 |
[The remainder of this page is intentionally left blank.]
|
24. |
REFERENCES |
Alexandre, P., Kyser, and Polito, P., 2003. Geochronology of the Paleoproterozoic basement- hosted unconformity-type uranium deposits in northern Saskatchewan Canada, in Uranium Geochemistry 2003, International Conference, April 13-16, 2003, Proceedings, (eds.) M. Cuney; Unite Mixte de Recherche CNRS 7566 G2R, University Henri Poincare, Nancy, France, p. 37-40.
Andrade, N., 1983a. Project 564, South Block, Compilation and economic geology. Eldorado Resources Ltd., internal company report, 206 pages.
Andrade, N., 1983b. North Block, Compilation and economic geology. Eldorado Resources Ltd., internal company report, 217 pages.
Annesley, I.R., and Madore, C., 1991. The Wollaston Group and its underlying Archean basement. Final Report, SRC Publication R-1230-4-C-91.
Annesley, I., Madore, C., and Portella, P., 2005. Geology and thermotectonic evolution of the western margin of the Trans-Hudson orogen: evidence from the eastern sub- Athabasca basement, Saskatchewan. Canadian Journal of Earth Sciences, v. 42, p. 573-597.
Annesley, I.R., Madore, C., Quirt, D., Shi, r., and Dyck, J., 1995. Wollaston Eagle Project: Segment 1 Report. Saskatchewan Research Council Publication No. R-1230-16-C-95, 132 pages, plus appendices.
Annesley, I.R., Madore, C., Shi, R., Quirt, D., Dyck, J., Hajnal, Z., and Reilkoff, B., 1996. Wollaston Eagle Project: Segement 2 Report. Saskatchewan Research Council Publication No. R-1420-5-C-96, 184 pages, plus appendices.
Appleyard, E.C., 1984. The origin of plagioclasite in the vicinity of the Rabbit Lake uranium deposit; in Summary of Investigations, Saskatchewan Geological Survey, Saskatchewan Energy and Mines, Misc. Report 84-4, pp. 68-71.
Baldwin, D., 2009. Horseshoe and Raven Deposits, QAQC Summary Report for the Period September 2008 to June 2009, internal report to UEX, 27 pages.
Baudemont, D., Piquard, J.P., Ey, F., and Zimmerman, J., 1993. The Sue uranium deposits, Saskatchewan, Canada. Exploration and Mining Geology, Vol. 2, No. 3, pp. 179-202.
Bickford, M.E., Collerson, K.D., and Lewry, J.F., 1994. Crustal history of the Rae and Hearne provinces, southwestern Canadian Shield, Saskatchewan: constraints from geochronologic and isotopic data. Precambrian Research, v. 68, pp. 1-21.
Cameron, K., and Eriks, S., 2008a. Hidden Bay uranium project: Report on fall 2005 airborne resolve survey and results. UEX Corporation, assessment report, 25 pages.
Cameron, K., and Eriks, S., 2008b. Hidden Bay uranium project: Report on winter 2006 airborne VTEM survey and results. UEX Corporation, assessment report, 52 pages.
Cristall, J., 2005. Interpretation of the 2004 VTEM Electromagnetic Survey Tent-Seal, Post- Landing, Cunning Bay, West Rabbit Fault and West Bear Areas. Cameco Corporation, internal report to UEX Corporation, 17 pages plus appendices.
Cumming, G.L., and Krstic, D., 1992. The age of unconformity-related uranium mineralization in the Athabasca Basin, northern Saskatchewan. Canadian Journal of Earth Science, Vol. 29, pp. 1623-1639.
DiPrisco, G., 2008. Mineralogical characterization of U-rich drill core samples from the Horseshoe-Raven project, Northern Saskatchewan. Unpublished report to UEX Corporation, 19 pages.
Doerksen, G., Melis, L., Liskowich, M., Murphy, B., Palmer, K., and Pilotto, D., 2011. Preliminary Assessment Technical Report on the Horseshoe and Raven Deposits, Hidden Bay Project Saskatchewan, Canada. Report by SRK Consulting (Canada) Inc. to UEX Corporation.
Eldorado Resources Ltd., 1986. Uranium Resource Status Summary as of Dec. 31, 1986.Internal Report.
Eriks, S. 2012. Hidden Bay Project, Horseshoe Deposit Report on Summer 2009 Activities and Results, Saskatchewan. UEX Corporation, assessment report.
Eriks, S., Hasegawa, L. 2014. Hidden Bay Project, Horseshoe Deposit Report on Summer 2011 Activities and Results, Saskatchewan. UEX Corporation, assessment report.
Fayek, M., Harrison, T.M., Ewing, R.C., Grove, M., and Coath, C.D., 2002. O and Pb isotope analyses of uranium minerals by ion microprobe and U-Pb ages from the Cigar Lake deposit; Chemical Geology, v. 185, p. 205-225.
Forand, L., 1995. Rabbit Lake joint venture 1995 annual exploration report. Cameco Corporation, internal company report, 119 pages, plus appendices.
Forand, L., 1999. Rabbit Lake joint venture 1998 annual exploration activities report. Cameco Corporation, internal company report, 58 pages, plus appendices.
Forand, L., and Nimeck, G., 1992. Rabbit Lake exploration joint venture, annual report, 1992 exploration activities, CBS 6802, 6761, 6785-6789, 6804. Cameco Corporation, internal company report, 56 pages plus appendices.
Forand, L., Nimeck, G., and Wasyliuk, K., 1994. Rabbit Lake exploration joint venture, 1994 annual exploration report volume 1 of 2. Cameco Corporation, internal company report, 87 pages.
Foster, S., Wasyliuk, K., and Powell, B., 1997. Rabbit Lake joint venture 1997 exploration program. Cameco Corporation, 72 pages, plus appendices.
Goldak, D and Powell, B., 2003. Report on the 2002 Geophysical Activities, Horseshoe-Raven and Telephone Lake Grids, Mineral Dispositions S-106961, S-106962, and S-106981, NTS 64 L/4 and 64 L/5, Assessment Report submitted to Saskatchewan Industry and Resources, Cameco Corporation, 11 pages, plus appendices.
Gyorfi, I., Hajnal, Z., White, D.J., Takacs, E., Reilkoff, B., Annesley, I.R., Powell, B., Koch, R., 2007. High-resolution seismic survey from the McArthur River region: contributions to mapping of the complex P2 uranium ore zone, Athabasca Basin, Saskatchewan. In EXTECH IV: Geology and Uranium EXploration TECHnology of the Proterozoic Athabasca Basin, Saskatchewan and Alberta,(ed.) C.W. Jefferson and G. Delaney; Geological Survey of Canada, Bulletin 588 (also Saskatchewan Geological Society, Special Publication 18; Geological Association of Canada, Mineral Deposits Division, Special Publication 4), pp. 397-412.
Hasegawa, L., Eriks, S. 2014. Hidden Bay Project, Horseshoe Deposit Report on Winter 2011 Activities and Results, Saskatchewan. UEX Corporation, assessment report.
Hasegawa, L., Musienko, E. 2015. Hidden Bay Project, Horseshoe Deposit Report on Winter 2012 Activities and Results, Saskatchewan. UEX Corporation, assessment report.
Healey, C.M., and Ward, D.M., 1988. Cameco statement of ore reserves and mineral resources. Cameco Corporation, internal company report.
Hoeve, J., and Quirt, D.H., 1985. A stationary redox front as a critical factor in the formation of high-grade, unconformity type uranium ores in the Athabasca Basin, Saskatchewan, Canada. Bulletin Mineralogique, Volume 110, pp. 157-171.
Hoeve, J., and Sibbald, T.I.I., 1978. On the genesis of Rabbit Lake and other unconformity- type uranium deposits in northern Saskatchewan, Canada. Economic Geology, Vol. 73, pp. 1450-1473.
Hubregtse, J.J., and Duncan, B., 1991. Geological evaluation and petrography of the Raven Lake area and the Horseshoe-Raven Deposit area. Cameco Corporation, consultant’s report, 36 pages plus appendices.
Irvine, R., 2004. VTEM survey for UEX Corporation, Points North, Saskatchewan, Project 460. UEX Corporation, assessment report, 23 pages.
Jefferson, C., Thomas, D.J., Gandhi, S.S., Ramaekers, P., Delaney, G., Brisbin, D., Cutts, C., Portella, P., and Olson, R.A., 2007. Unconformity associated uranium deposits of the Athabasca Basin, Saskatchewan and Alberta. Geological Survey of Canada, Bulletin 588, p. 23-67.
Jones, B.E., 1980. The geology of the Collins Bay uranium deposit, Saskatchewan. Canadian Institute of Mining and Metallurgy, Bulletin 73, 818, pp. 90-94.
Kos, C., 2004. West Bear Mitchell Area 2004 MMI Survey (M-Solution) and Boulder Sampling Survey. Cameco Corporation, report UEX Corporation.
Lemaitre, R., 2006. 2005 Resource Estimate of the West Bear Deposit, Cameco Corporation, report prepared for UEX Corporation. 54 pages plus appendices, filed on SEDAR.
Lemaitre, R., and Herman, T., 2003. Hidden Bay project: 2002 and 2003 exploration report. Cameco Corporation, exploration report to UEX Corporation, 107 pages plus appendices.
Lemaitre, R., and Herman, T., 2006. Hidden Bay project: 2005 diamond drilling report. Cameco Corporation, exploration report to UEX Corporation, 97 pages plus appendices.
Lewry, J.F., and Sibbald, T.I.I., 1980. Thermotectonic evolution of the Churchill Province in northern Saskatchewan. Tectonophysics, v. 68, pp. 45-82.
McCready, K., 2007. U3O8 Method Summary. SRC Geoanalytical Laboratories, 2 pages. Ogryzlo, P.S., 1984. Project 564, South Block summary of activities 1984. Eldorado Resources Ltd., internal company report, 42 pages, plus appendices.
Ogryzlo, P.S., 1985. Project 564, South Block summary of activities 1985. Eldorado Resources Ltd., internal company report, 29 pages, plus appendices.
Ogryzlo, P.S., 1987. Project 602, Saskatchewan Mineral Venture, South Block fall program. Eldorado Resources Ltd., internal company report, 20 pages, plus appendices.
Ogryzlo, P.S., 1987. Project 602, Saskatchewan Mineral Venture, South Block winter program. Eldorado Resources Ltd., internal company report, 38 pages, plus appendices.
Ogryzlo, P.S., 1988. Project 602, Saskatchewan Mineral Venture, South Block. Eldorado Resources Ltd., internal company report, 36 pages, plus appendices.
Palmer, K.J., 2007. December 2007 Mineral resource estimate, West Bear Deposit. Golder Associates Ltd., report to UEX Corporation dated December 11, 2007, 4 pages.
Palmer, K.J., 2008. Technical Report on the Horseshoe and Raven Deposits, including a Mineral Resource estimate for the Horseshoe Deposit, Hidden Bay Property, Saskatchewan, Canada, Report to UEX Corporation, filed on SEDAR.
Palmer, K.J. and Fielder, B., 2009. Technical Report on the Hidden Bay Property, Saskatchewan, Canada, including a Mineral Resource Estimate for the Horseshoe, Raven and West Bear Deposits, Report to UEX Corporation, filed on SEDAR.
Powell, B., 1996. Assessment report Rabbit Lake project, Rhino Lake property 1996, geophysical program CBS 7252, S105327, S105328. Cameco Corporation, internal company report, 10 pages.
Quirt, D.H., 1990. Mineral deposit studies: Horseshoe-Raven uranium deposits, Project 3.12. Saskatchewan Research Council, 65 pages, plus appendices.
Ramaekers, P., and Dunne, C.E., 1976. Geology and geochemistry of the eastern margin of the Athabasca basin in Uranium in Saskatchewan, ed. C.E. Dunne, Saskatchewan Geological Society, Special Paper 3, pg. 297-322.
Ramaekers, P., Jefferson, C.W., Yeo, G.M., Collier, B., Long, D.G.F, Drever, G., McHardy, S., Jiricka, D., Cutts, C., Wheatley, K., Catuneanu, O., Bernier, S., Kupsch, B., and Post, R.T., 2007. Revised geological map and stratigraphy of the Athabasca Group, Saskatchewan and Alberta in EXTECH IV: Geology and uranium EXploration TECHnology of the Proterozoic Athabasca Basin, Saskatchewan and Alberta. (ed.).
Rhys, D. A., 2002. Geological Report on the Hidden Bay Property, Wollaston Lake Area, Northern Saskatchewan, report prepared for UEX Corporation by Panterra Geoservices Inc., p. 84, filed on SEDAR.
Rhys, D. A., and Ross, K.V., 1999. Structural setting and controls on uranium mineralization, Collins-Bay Rabbit Lake Fault system, Wollaston Lake to Thorburn Lake, northern Saskatchewan. Panterra Geoservices Inc., consulting report for Cameco Corporation, 278 pages.
Rhys, D. A., Horn, L., Baldwin, D., and Eriks, S. 2008. Technical Report on the Geology of, and Drilling Results from, the Horseshoe and Raven Uranium Deposits, Hidden Bay Property, Northern Saskatchewan, 131 pages, filed on SEDAR.
Rhys, D. A., Eriks, S. 2011. Hidden Bay Project, Horseshoe Deposit Report on Fall 2008 Activities and Results, Saskatchewan. UEX Corporation, assessment report.
Rhys, D. A., Eriks, S. 2012. Hidden Bay Project, Horseshoe Deposit Report on Winter 2009 Activities and Results, Saskatchewan. UEX Corporation, assessment report.
Ruzicka, V., 1996. Unconformity-associated uranium in Geology of Canadian mineral deposit types, ed. O.R. Eckstand, W.D. Sinclair and R.I. Thorpe, Geological Survey of Canada, Geology of Canada, no. 8, pp. 197-210.
Sibbald, T.I.I., 1983. Geology of the crystalline basement, NEA/IAEA Athabasca test area in Uranium Exploration in Athabasca Basin, Saskatchewan, Canada, ed. E.M. Cameron, Geological Survey of Canada, Paper 82-11, pp. 1-14.
Sopack, V.J., de Carle, A., Wray, E.M., and Cooper, B. 1983. Application of lithogeochemistry to the search for unconformity-type uranium deposits in the Athabasca Basin in Uranium Exploration in the Athabasca Basin, Saskatchewan, Canada, ed. E.M. Cameron, Geological Survey of Canada, Paper 82-11, pp. 191-205.
SMEGAC, 2016. Mineral Exploration Guidelines for Saskatchewan. http://saskmining.ca/ckfinder/userfiles/files/BMP%20August%202016_Draft.pdf, 137 pages.
SRC, 2007. Quality Assurance Report for UEX for the period 2006 – 2007. SRC Geoanalytical Laboratories, 12 pages.
SRC Website, 2021. Analytical techniques and sample handling procedures https://www.src.sk.ca/sites/default/files/files/resource/SRC_Geoanalytical_Services_S chedule_2019_FINAL%20web.pdf#page=11.
Studer, D., 1984. Project 565, Centre Block, Compilation and economic geology. Eldorado Resources Ltd., internal company report, 135 pages, plus appendices.
Studer, D., 1986. Project 565, Centre Block, Summary of activities 1985. Eldorado Resources Ltd., internal company report, 53 pages, plus appendices.
Studer, D., 1987. Project 604, Assessment report on CBS 6801-6805 inclusive and CBS 7255, Centre Block. Eldorado Resources Ltd., internal company report, 38 pages, plus appendices.
Studer, D., 1989. Saskatchewan Mineral Venture, South Block. Cameco Corporation, internal company report, 32 pages, plus appendices.
Studer, D., and Gudjurgis, P., 1985. Project 565, Centre Block, Summary of activities 1984. Eldorado Resources Ltd., internal company report, 80 pages, plus appendices.
Studer, D., and Nimeck, G., 1989. Centre Block annual report, Cameco Corporation, internal company report, 33 pages, plus appendices.
Terhune, B. Conventional versus mechanized cut and fill mining, Canadian Mining Journal, April 2021, https://www.canadianminingjournal.com/featured-article/conventional-versus-mechanized-cut-and-fill-mining.
UEX, 2023. 2022 Technical Report on the Horseshoe-Raven project, Saskatchewan, UEX Corporation, 145 pages.
Walcott, A., and Walcott, P., 2008. A geophysical report on resistivity surveying, Horseshoe- Raven property, Athabasca Basin, Northern Saskatchewan. Unpublished report for UEX Corporation, 16 pages.
Wallis, R.H., 1971. The geology of the Hidden Bay area, Saskatchewan. Saskatchewan Department of Mineral Resources, Report 137, 76 pages.
Whitford, K.G., 1971. Exploration report, Permit 8, northern Saskatchewan. Gulf Minerals Canada Ltd., internal report.
Witherly, K., 2007. Report on Processing and Analysis of VTEM 30 Hz EM and Magnetics Data, Hidden Bay Project, Athabasca Basin, Saskatchewan. Internal company report prepared by Condor Consulting of Lakewood, Colorado for UEX Corporation.
[The remainder of this page is intentionally left blank.]
|
25. |
RELIANCE ON OTHER EXPERTS |
The QPs are partially relying upon the Opinion of Title dated September 7, 2021 by Robertson Stromberg LLP, titled “UEX Corporation - Review of Certain Mineral Dispositions”, wherein section IV Item 3 it is stated that they are of the opinion that UEX is holder of 100% interest on the Horseshoe Raven claim. The QPs are in part relying upon this report as assurance of equity in the title of the claim. The equity stated in the report is consistent with the records indicated by UEX. This reliance applies to Section 3.3.
[The remainder of this page is intentionally left blank.]
|
26. |
DATE AND SIGNATURE PAGES |
This TRS titled "2024 Technical Report on the Horseshoe-Raven Project, Saskatchewan" with an effective date of March 1, 2024, and dated March 25, 2024, was prepared and signed by the following authors:
[The remainder of this page is intentionally left blank.]
CERTIFICATE OF QUALIFIED PERSON
To accompany the report entitled: 2024 Technical Report on the Horseshoe-Raven Project, Saskatchewan with an effective date of March 1, 2024, and a signature date of March 25, 2024.
I, Christopher Hamel, do hereby certify that:
|
1) |
I am Vice President Exploration, Canada with the firm of UEC Corporation with an office at 724 66th Street, Saskatoon, Saskatchewan, Canada. |
|
2) |
I am a graduate of the University of Saskatchewan in 2001, where I obtained a B.Sc. Geology. I have practiced my profession continuously since June 2001. I have been registered as a Professional Geoscientist since 2010. My experience that is relevant to the scope of this Technical Report is: |
|
● |
Exploration Manager for UEX Corporation from January to September 2021, Vice President, Exploration from October, 2021 to December 1, 2022, and Vice President Exploration, Canada from December 1, 2022 to present, where I guide field teams in the planning and execution of field programs and perform generative and evaluative work for the company. In these roles, I am the senior technical person of responsibility in the company. |
|
● |
Chief Geologist for UEX Corporation July 2017 to January 2021, where I supported field activities and performed generative and evaluative work for the company. In this role, I was a senior person of technical responsibility in the company. |
|
● |
Contract Geologist for UEX Corporation from January 2017 to June 2017, where I participated in the execution of the Christie Lake field program and performed property evaluation and regional compilation work. In this role, I was depended upon for significant participation and decision making. |
|
● |
Contract Geologist for Forum Uranium November 2016, where I participated in an exploration program to explore for uranium in Saskatchewan. |
|
● |
District Geologist, Cameco Corporation from April 2012 to October 2016, where I was regional management in support of multiple exploration project teams. I helped to design, implement, and allocate exploration budgets between projects to advance uranium exploration field programs in Saskatchewan, which included uranium discoveries on the Read Lake, Mann Lake, and Hughes Lake projects. I helped plan and oversee the drill program to evaluate the uranium resource at Cigar Lake Phase II. In this role, I was in a senior technical position of responsibility. |
|
● |
Project Geologist, Cameco Corporation from April 2008 to March 2012, where I was responsible for the project-level management of uranium exploration programs in northern Saskatchewan at the Rabbit Lake and McArthur River mine sites. My work at Rabbit Lake included the discovery and delineation of a new zone of mineralization at Eagle Point. My work at McArthur River was focused on the on-going evaluation of the P2 trend north and south from the mine workings. During this time, I was in a position of responsibility and was depended upon for significant participation and decision-making. |
|
● |
Geologist III for Cameco Corporation from Nov 2006 to Jan 2008, where I was responsible for uranium exploration projects in northern Saskatchewan, including what is now the LaRocque East property, the Dawn Lake property including evaluation drilling at the Tamarack Deposit and drilling at the Wolf Lake Zone on the Studer Option Property. This role is transitionary, moving a person from a role involving independent judgement to a role of participation and decision-making. |
|
● |
Geologist II, Cameco Corporation from April 2004 to March 2008, where I participated in the successful execution and management of uranium field exploration programs, including evaluation drilling at the Tamarack Deposit and exploration drilling at the Dawn Lake “11” and “14” zones on the Dawn Lake property and participated in exploration in Cameco’s Australian projects. This role requires the exhibition of independent judgement and occasionally decision-making with respect to the execution of exploration programs. |
|
● |
Exploration Geologist for DeBeers Canada Exploration June 2001 to March 2004, where I participated in and managed exploration programs to explore for, delineate and evaluate diamond deposits in Northwest Territory, Nunavut and Saskatchewan. |
|
3) |
I am a Professional Geoscientist registered with the Association of Professional Engineers & Geoscientists of Saskatchewan (APEGS#12985) since June 2010. |
|
4) |
I have personally inspected the subject project and was on site on between June 9 to 17, 2021. |
|
5) |
I have read the definition of “qualified person” set out in Subpart 1300 of Regulation S-K (S-K 1300) and certify that by reason of my education, professional registration and relevant work experience, I fulfill the requirements to be a “qualified person” for the purposes of S-K 1300. |
|
6) |
I have had no involvement with the subject property prior to my employment at UEX Corporation. |
|
7) |
As of the date of this certificate, to the best of my knowledge, information and belief, this technical report contains all scientific and technical information that is required to be disclosed to make the technical report not misleading. |
Dated at Saskatoon, Saskatchewan, this 25th day of March, 2024.
|
Saskatoon, Saskatchewan |
|
|
|
|
|
|
/s/ Christopher Hamel |
|
|
March 25, 2024 |
|
|
|
|
|
|
Christopher Hamel, P.Geo. (APEGS#12985) Vice President Exploration, Canada |
|
|
|
|
|
|
CERTIFICATE OF QUALIFIED PERSON
To accompany the report entitled: 2024 Technical Report on the Horseshoe-Raven Project, Saskatchewan with an effective date of March 1, 2024, and a signature date of March 25, 2024.
I, Nathan Barsi, do hereby certify that:
|
1) |
I am the Exploration Manager with the firm of UEX Corporation with an office at 724 66th Street Millar Avenue, Saskatoon, Saskatchewan, Canada. |
|
2) |
I am a graduate of the University of Saskatchewan in 2007, where I obtained a B.Sc. Geology. I have practiced my profession continuously since May 2007. I have been registered as a Professional Geoscientist since 2015. My experience that is relevant to the scope of this Technical Report is: |
|
● |
Exploration Manager, UEX Corporation from April 2023 to present, where I am responsible for managing all aspects of our exploration portfolio. I guide our exploration staff in the planning and execution of field programs, most recently Christie Lake and Roughrider projects. I perform generative work on our portfolio to build suitable exploration programs for our projects from early (greenfields) stage to late (brownfields) stage. With this role I am in a senior technical position of responsibility. |
|
● |
District Geologist, UEX Corporation from October 2021 to March 2023, where I am regional management in support of multiple exploration project teams. I helped to design, implement, and allocate exploration budgets between projects to advance uranium and cobalt nickel exploration field programs in Saskatchewan that included Christie Lake, Hidden Bay, and West Bear. In this role, I am in a senior technical position of responsibility. |
|
● |
Senior Geologist, UEX Corporation from February 2021 to October 2021, where I managed the West Bear and Hidden Bay exploration projects and lead the team that discovered the Michael Lake Cobalt and Nickel zone. I completed in house mineral resource estimates for various properties. In this role, I am in a senior technical position of responsibility. |
|
● |
Project Geologist for, UEX Corporation from 2018 to January 2021, where I was responsible for the project-level management of uranium exploration programs in northern Saskatchewan. I was responsible for managing and exploration on the West Bear Project from discovery of the maiden Cobalt Nickel Resource (2018) to resource definition drilling and mineral resource modelling and estimation of the deposits (2019). I also completed generative work for future drill programs on multiple projects in the Athabasca Basin and filled in as the Project Geologist for Christie Lake. During this time, I was in a position of responsibility and depended upon for significant participation and decision-making. |
|
● |
Contract Geologist, UEX Corporation from December 2016 to December 2017, where I participated in exploration program for uranium on the Christie Lake project. |
|
● |
Project Geologist, Cameco Corporation from April 2014 to October 2016, where I was responsible for the management of uranium field exploration programs in northern Saskatchewan. During this time, I was in a position of responsibility and depended upon for significant participation and decision-making. |
|
● |
Geologist III, Cameco Corporation from 2014 to 2011 Millennium, where I was responsible for uranium exploration projects in northern Saskatchewan, including mineral resource and geotechnical drilling at the Millennium deposit. In 2011, I worked in the Alligator River Uranium Field in the Northern Territory of Australia. I was an integral part of the exploration team that found the Angularli unconformity uranium deposit and developed further follow up targets with the team. This role is transitionary, moving a person from a role involving independent judgement to a role of participation and decision-making. |
|
● |
Geologist II, Cameco Corporation from 2011 to 2009, where I participated in the successful execution and management of uranium field exploration programs at the Centennial Deposit in the Athabasca Basin and the Otish Project in the Otish Basin in Quebec. I toured and reviewed the Matoush deposit model in the Otish Basin, a style of mineralization that was atypical of an unconformity or basement-hosted deposit. This role requires the exhibition of independent judgement and occasionally decision-making with respect to the execution of exploration programs. |
|
● |
Geologist I, Cameco Corporation from 2009 to 2007, where I participated in the successful execution and management of uranium field exploration programs, including resource drilling at the Millennium Deposit and Tamarack Deposit and exploration drilling at the surrounding property of the Millennium Deposit, Rabbit Lake Mine and Dawn Lake projects. I toured mining and milling facilities at Mcclean Lake Mine and Rabbit Lake Mine and have observed unconformity and basement uranium mineralization in mining stopes and pit walls. |
|
3) |
I am a professional Geoscientist registered with the Association of Professional Engineers & Geoscientists of Saskatchewan (APEGS#15012) since March of 2015. |
|
4) |
I have personally inspected the Horseshoe-Raven Project site and was on site on between June 9 to 17, 2021. |
|
5) |
I have not been involved with the Horseshoe-Raven Project prior to my employment at UEX Corporation. |
|
6) |
I have read the definition of “qualified person” set out in Subpart 1300 of Regulation S-K (S-K 1300) and certify that by reason of my education, professional registration and relevant work experience, I fulfill the requirements to be a “qualified person” for the purposes of S-K 1300. |
|
7) |
As of the date of this certificate, to the best of my knowledge, information and belief, this Technical Report contains all scientific and technical information that is required to be disclosed to make the Technical Report not misleading. |
Dated at Saskatoon, Saskatchewan, this 25th day of March, 2024.
|
Saskatoon, Saskatchewan |
|
|
|
|
|
|
/s/ Nathan Barsi |
|
|
March 25, 2024 |
|
|
|
|
|
|
Nathan Barsi, P.Geo. (APEGS#15012) District Geologist, Canada |
|
|
|
|
|
|
CERTIFICATE OF QUALIFIED PERSON
To accompany the report entitled: 2024 Technical Report on the Horseshoe-Raven Project, Saskatchewan with an effective date of March1, 2024, and a signature date of March 25, 2024.
I, Roger Lemaitre, P.Geo. P.Eng., do hereby certify that:
|
1) |
I am the former President and Chief Executive Officer of UEX Corporation (“UEX”) with an office at 724 66th Street, Saskatoon, Saskatchewan, Canada. |
|
2) |
I am a graduate of Queens University in 1992, where I obtained a B.Sc. (Applied) in Geological Engineering. |
|
3) |
I am graduate of McGill University in 1994, where I obtained an M.Sc. (Applied) in Geology – Mineral Resources and Exploration. |
|
4) |
I am a graduate of Athabasca University, where I obtained a Masters of Business Administration in 2011. |
|
5) |
I have been registered as a Professional Engineer continuously since 1997. I have been a registered Professional Engineer with the Association of Professional Engineers & Geoscientists of Saskatchewan since January 6, 1999 (APEGS #10647). Previously, I was registered as a Professional Engineer with Professional Engineers Ontario (former PEO #910472317) between March 11, 1997 and March 13, 2002. |
|
6) |
I have been a registered Professional Geoscientist with the Association of Professional Engineers and Geoscientists of Saskatchewan since January 6, 1999 (APEGS #10647). I am also a registered Professional Geoscientist with the Ordre des géologues du Québec since December 12, 2023 (OGQ Permit #10716). |
|
7) |
I have practiced my profession continuously since 1992. My experience that is relevant to the scope of this Technical Report includes direct involvement in generating, managing and conducting: (i) exploration activities, including the collection, supervision and review of geological, mineralization, exploration and drilling data; (ii) geological modeling; (iii) sampling, sample preparation, assaying and other resource-estimation related analyses; (iv) completion of quality control and quality assurance studies; and (v) mineral resource estimation for uranium, cobalt-nickel, zinc-lead and zinc-copper projects in Canada and worldwide. I am currently president and CEO of UEX, where since 2014 I have been responsible for managing UEX’s Athabasca uranium project portfolio and have been actively involved in review of UEX’s independent resource estimates of the West Bear Co-Ni Deposit and the Christie Lake Project, as well as the completion of internal mineral resource estimates during the evaluation of two acquisition opportunities. Prior to my role at UEX, I have had involvement with various other uranium and nickel projects, including acting as President and CEO of URU Metals Limited (“URU”), where I was responsible for URU’s uranium projects in Niger, Sweden and Canada and nickel projects in South Africa, and acting in various roles for Cameco Corporation (“Cameco”), including as director of worldwide exploration, where I was responsible for supervising Cameco’s global exploration portfolio, during which time I was responsible for the evaluation of uranium projects by conducting internal resource estimates on eleven global uranium deposits for potential acquisition by Cameco and the completion of the internal resource estimate of the Angularli deposit. |
|
8) |
I have personally been involved in managing drill programs for the Horseshoe-Raven Project between 2002 and 2005 and since have inspected the subject project and visited the property several times in 2019. I last visited the Horseshoe-Raven Site to inspect core and outcrop related to the Horseshoe and Raven Deposits on July 23 through July 26, 2019. I was able to examine, along with the UEX technical team, the key features of the Horseshoe-Raven deposit geology and mineralizing processes in drill core. |
|
9) |
I have read the definition of “qualified person” set out in Subpart 1300 of Regulation S-K (S-K 1300) and certify that by reason of my education, professional registration and relevant work experience, I fulfill the requirements to be a “qualified person” for the purposes of S-K 1300. |
|
10) |
As of the date of this certificate, to the best of my knowledge, information and contains all scientific and technical information that is required to be disclosed to make the Technical Report Summary not misleading. |
Dated at Saskatoon, Saskatchewan, this 25th day of March, 2024.
|
Saskatoon, Saskatchewan |
|
|
|
|
|
|
/s/ Roger Lemaitre |
|
|
March 25, 2024 |
|
|
|
|
|
|
Roger Lemaitre, P.Geo. (APEGS#10647) Former President and CEO, Canada |
|
|
|
|
|
|