
| (State or other jurisdiction | (Commission File Number) | (I.R.S. Employer | ||||||||||||
| of incorporation or organization) | Identification No.) | |||||||||||||
| (Address of principal executive offices) | (Zip Code) | |||||||||||||||||||||||||
| Registrant's telephone number, including area code: | ||||||||||||||||||||||||||
Former name or former address, if changed since last report: Not Applicable | ||||||||||||||||||||||||||
| Written communications pursuant to Rule 425 under Securities Act (17 CFR 230.425) | |||||
| Soliciting material pursuant to Rule 14a-12 under the Exchange Act (17 CFR 240.14a-12) | |||||
| Pre-commencement communications pursuant to Rule 14d-2(b) under the Exchange Act (17 CFR 240.14d-2(b)) | |||||
| Pre-commencement communications pursuant to Rule 13e-4(c) under the Exchange Act (17 CFR 240.13e-4(c)) | |||||
| Title of each class | Trading Symbol | Name of each exchange on which registered | ||||||||||||
| News release issued by Jones Lang LaSalle Incorporated on | |||||
| financial results for the fourth quarter ended December 31, 2023. | |||||
| 104 | Cover Page Interactive Data File (embedded within the Inline XBRL document) | ||||
| Dated: | |||||||||||
| Jones Lang LaSalle Incorporated | |||||||||||
| By: /s/ Karen Brennan | |||||||||||
| Name: Karen Brennan | |||||||||||
| Title: Chief Financial Officer | |||||||||||
| News Release |  | |||||||||||||
Summary Financial Results ($ in millions, except per share data, “LC” = local currency) | Three Months Ended December 31, | Year Ended December 31, | |||||||||||||||||||||||||||||||||
| 2023 | 2022 | % Change in USD | % Change in LC | 2023 | 2022 | % Change in USD | % Change in LC | ||||||||||||||||||||||||||||
| Revenue | $ | 5,881.4 | $ | 5,604.8 | 5 | % | 4 | % | $ | 20,760.8 | $ | 20,862.1 | — | % | — | % | |||||||||||||||||||
Fee revenue1 | 2,180.4 | 2,214.1 | (2) | (2) | 7,403.1 | 8,302.0 | (11) | (11) | |||||||||||||||||||||||||||
| Net income attributable to common shareholders | $ | 172.4 | $ | 174.8 | (1) | % | 1 | % | $ | 225.4 | $ | 654.5 | (66) | % | (64) | % | |||||||||||||||||||
Adjusted net income attributable to common shareholders1 | 204.5 | 210.6 | (3) | (1) | 357.5 | 775.1 | (54) | (53) | |||||||||||||||||||||||||||
| Diluted earnings per share | $ | 3.57 | $ | 3.62 | (1) | % | 1 | % | $ | 4.67 | $ | 13.27 | (65) | % | (63) | % | |||||||||||||||||||
Adjusted diluted earnings per share1 | 4.23 | 4.36 | (3) | (2) | 7.40 | 15.71 | (53) | (52) | |||||||||||||||||||||||||||
Adjusted EBITDA1 | $ | 306.4 | $ | 338.5 | (9) | % | (9) | % | $ | 736.7 | $ | 1,247.3 | (41) | % | (40) | % | |||||||||||||||||||
Free Cash Flow5 | $ | 680.2 | $ | 532.0 | 28 | % | n/a | $ | 388.9 | $ | (5.9) | n.m. | n/a | ||||||||||||||||||||||
Consolidated ($ in millions, “LC” = local currency) | Three Months Ended December 31, | % Change in USD | % Change in LC | Year Ended December 31, | % Change in USD | % Change in LC | |||||||||||||||||||||||||||||||||||||||||
| 2023 | 2022 | 2023 | 2022 | ||||||||||||||||||||||||||||||||||||||||||||
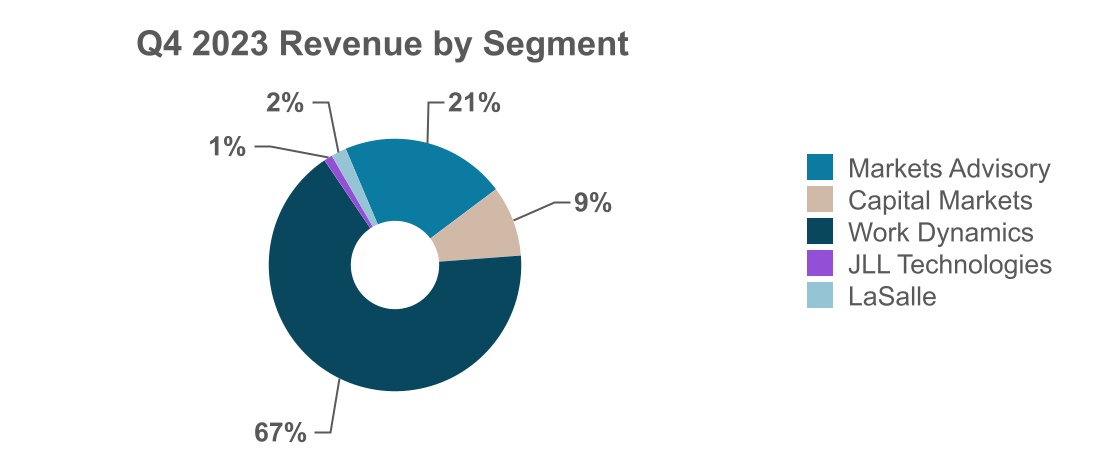
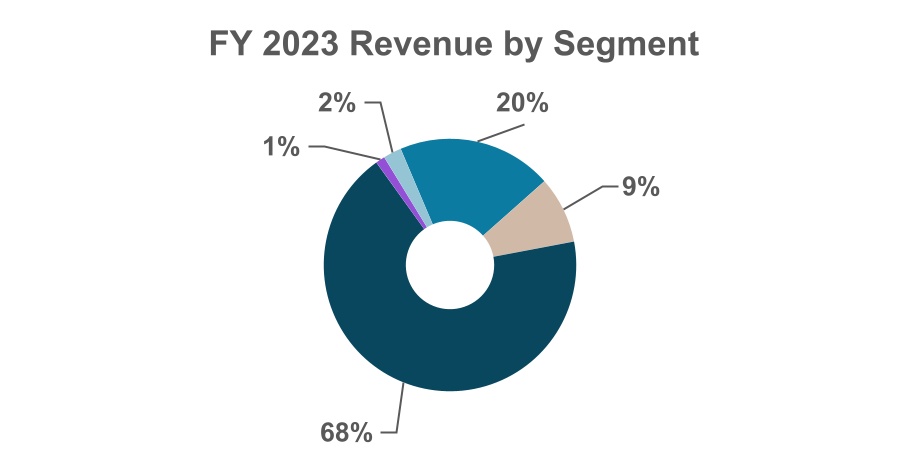
| Markets Advisory | $ | 1,197.4 | $ | 1,186.3 | 1 | % | — | % | $ | 4,121.6 | $ | 4,415.5 | (7) | % | (6) | % | |||||||||||||||||||||||||||||||
| Capital Markets | 537.1 | 607.9 | (12) | (13) | 1,778.0 | 2,488.2 | (29) | (29) | |||||||||||||||||||||||||||||||||||||||
| Work Dynamics | 3,966.1 | 3,634.6 | 9 | 8 | 14,131.1 | 13,268.5 | 7 | 7 | |||||||||||||||||||||||||||||||||||||||
| JLL Technologies | 65.5 | 57.3 | 14 | 14 | 246.4 | 213.9 | 15 | 15 | |||||||||||||||||||||||||||||||||||||||
| LaSalle | 115.3 | 118.7 | (3) | (4) | 483.7 | 476.0 | 2 | 2 | |||||||||||||||||||||||||||||||||||||||
| Total revenue | $ | 5,881.4 | $ | 5,604.8 | 5 | % | 4 | % | $ | 20,760.8 | $ | 20,862.1 | — | % | — | % | |||||||||||||||||||||||||||||||
Gross contract costs1 | (3,709.7) | (3,392.5) | 9 | 9 | (13,375.9) | (12,549.1) | 7 | 7 | |||||||||||||||||||||||||||||||||||||||
| Net non-cash MSR and mortgage banking derivative activity | 8.7 | 1.8 | (383) | (381) | 18.2 | (11.0) | (265) | (266) | |||||||||||||||||||||||||||||||||||||||
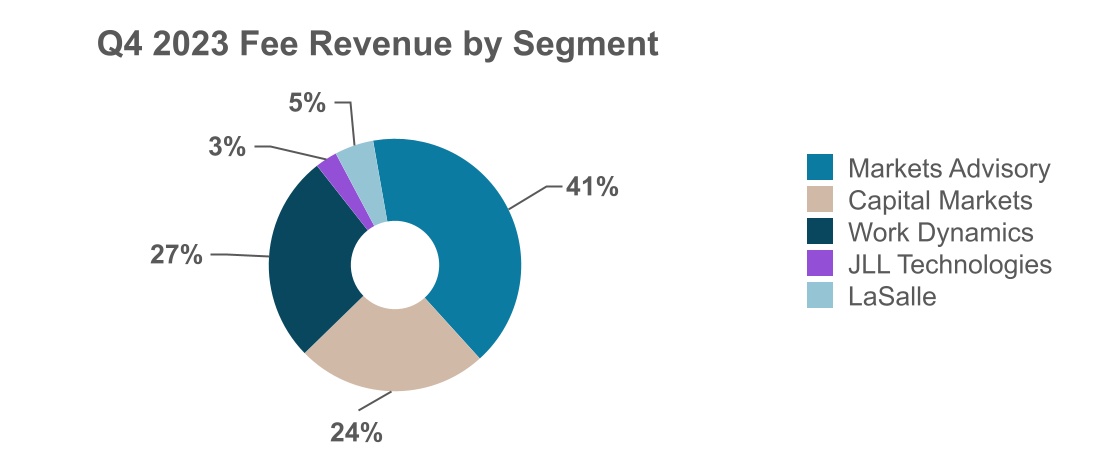
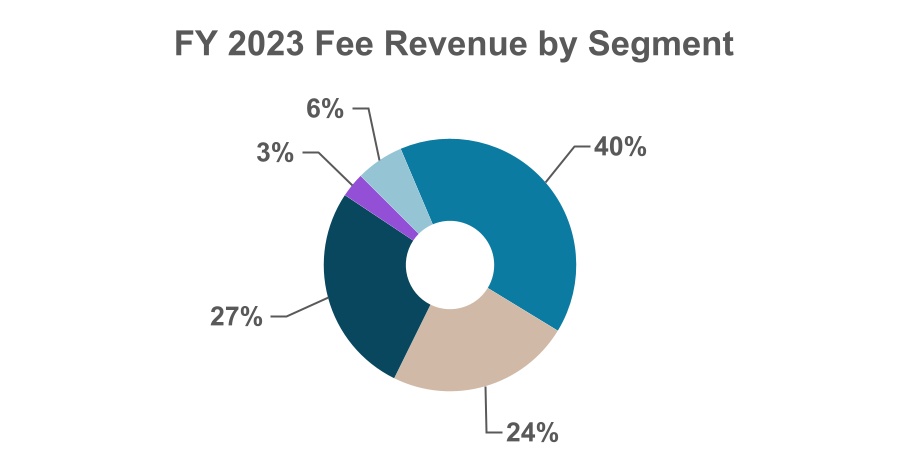
Total fee revenue1 | $ | 2,180.4 | $ | 2,214.1 | (2) | % | (2) | % | $ | 7,403.1 | $ | 8,302.0 | (11) | % | (11) | % | |||||||||||||||||||||||||||||||
| Markets Advisory | 895.6 | 915.3 | (2) | (3) | 2,968.0 | 3,360.2 | (12) | (11) | |||||||||||||||||||||||||||||||||||||||
| Capital Markets | 532.2 | 598.9 | (11) | (12) | 1,748.7 | 2,430.2 | (28) | (28) | |||||||||||||||||||||||||||||||||||||||
| Work Dynamics | 582.2 | 534.3 | 9 | 8 | 1,999.7 | 1,864.7 | 7 | 7 | |||||||||||||||||||||||||||||||||||||||
| JLL Technologies | 62.0 | 54.2 | 14 | 14 | 231.9 | 200.2 | 16 | 16 | |||||||||||||||||||||||||||||||||||||||
| LaSalle | 108.4 | 111.4 | (3) | (4) | 454.8 | 446.7 | 2 | 2 | |||||||||||||||||||||||||||||||||||||||
| Operating income | $ | 290.4 | $ | 254.7 | 14 | % | 15 | % | $ | 576.5 | $ | 868.1 | (34) | % | (33) | % | |||||||||||||||||||||||||||||||
| Equity (losses) earnings | $ | (76.8) | $ | (21.6) | (256) | % | (256) | % | $ | (194.1) | $ | 51.0 | (481) | % | (480) | % | |||||||||||||||||||||||||||||||
Adjusted EBITDA1 | $ | 306.4 | $ | 338.5 | (9) | % | (9) | % | $ | 736.7 | $ | 1,247.3 | (41) | % | (40) | % | |||||||||||||||||||||||||||||||
| Net income margin attributable to common shareholders (USD basis) | 2.9 | % | 3.1 | % | (20) bps | n/a | 1.1 | % | 3.1 | % | (200) bps | n/a | |||||||||||||||||||||||||||||||||||
| Adjusted EBITDA margin (local currency basis) | 14.3 | % | 15.3 | % | (120) bps | (100) bps | 10.0 | % | 15.0 | % | (500) bps | (500) bps | |||||||||||||||||||||||||||||||||||
| Adjusted EBITDA margin (USD basis) | 14.1 | % | 10.0 | % | |||||||||||||||||||||||||||||||||||||||||||
Note: For discussion and reconciliation of non-GAAP financial measures, see the Notes following the Financial Statements in this news release. Percentage variances in the Performance Highlights below are calculated and presented on a local currency basis, unless otherwise noted. | |||||||||||||||||||||||||||||||||||||||||||||||
| December 31, 2023 | September 30, 2023 | December 31, 2022 | |||||||||||||||
| Total Net Debt (in millions) | $ | 1,150.3 | 1,698.6 | 1,244.0 | |||||||||||||
| Net Leverage Ratio | 1.6x | 2.2x | 1.0x | ||||||||||||||
| Corporate Liquidity (in billions) | $ | 3.1 | 2.1 | 2.6 | |||||||||||||
Markets Advisory ($ in millions, “LC” = local currency) | Three Months Ended December 31, | % Change in USD | % Change in LC | Year Ended December 31, | % Change in USD | % Change in LC | |||||||||||||||||||||||||||||||||||||||||
| 2023 | 2022 | 2023 | 2022 | ||||||||||||||||||||||||||||||||||||||||||||
| Revenue | $ | 1,197.4 | $ | 1,186.3 | 1 | % | — | % | $ | 4,121.6 | $ | 4,415.5 | (7) | % | (6) | % | |||||||||||||||||||||||||||||||
Gross contract costs1 | (301.8) | (271.0) | 11 | 11 | (1,153.6) | (1,055.3) | 9 | 11 | |||||||||||||||||||||||||||||||||||||||
Fee revenue1 | $ | 895.6 | $ | 915.3 | (2) | % | (3) | % | $ | 2,968.0 | $ | 3,360.2 | (12) | % | (11) | % | |||||||||||||||||||||||||||||||
| Leasing | 709.3 | 739.9 | (4) | (5) | 2,322.3 | 2,736.7 | (15) | (15) | |||||||||||||||||||||||||||||||||||||||
| Property Management | 155.2 | 136.5 | 14 | 12 | 551.7 | 500.2 | 10 | 11 | |||||||||||||||||||||||||||||||||||||||
| Advisory, Consulting and Other | 31.1 | 38.9 | (20) | (20) | 94.0 | 123.3 | (24) | (23) | |||||||||||||||||||||||||||||||||||||||
| Segment operating income | $ | 142.9 | $ | 127.4 | 12 | % | 12 | % | $ | 351.9 | $ | 448.0 | (21) | % | (22) | % | |||||||||||||||||||||||||||||||
Adjusted EBITDA1 | $ | 160.5 | $ | 150.2 | 7 | % | 6 | % | $ | 416.6 | $ | 527.5 | (21) | % | (21) | % | |||||||||||||||||||||||||||||||
| Adjusted EBITDA margin (local currency basis) | 18.0 | % | 16.4 | % | 150 bps | 160 bps | 14.1 | % | 15.7 | % | (170) bps | (160) bps | |||||||||||||||||||||||||||||||||||
| Adjusted EBITDA margin (USD basis) | 17.9 | % | 14.0 | % | |||||||||||||||||||||||||||||||||||||||||||
| Note: For discussion and reconciliation of non-GAAP financial measures, see the Notes following the Financial Statements in this news release. Percentage variances in the Performance Highlights below are calculated and presented on a local currency basis, unless otherwise noted. | |||||||||||||||||||||||||||||||||||||||||||||||
Capital Markets ($ in millions, “LC” = local currency) | Three Months Ended December 31, | % Change in USD | % Change in LC | Year Ended December 31, | % Change in USD | % Change in LC | |||||||||||||||||||||||||||||||||||||||||
| 2023 | 2022 | 2023 | 2022 | ||||||||||||||||||||||||||||||||||||||||||||
| Revenue | $ | 537.1 | $ | 607.9 | (12) | % | (13) | % | $ | 1,778.0 | $ | 2,488.2 | (29) | % | (29) | % | |||||||||||||||||||||||||||||||
Gross contract costs1 | (13.6) | (10.8) | 26 | 23 | (47.5) | (47.0) | 1 | 1 | |||||||||||||||||||||||||||||||||||||||
| Net non-cash MSR and mortgage banking derivative activity | 8.7 | 1.8 | (383) | (381) | 18.2 | (11.0) | (265) | (266) | |||||||||||||||||||||||||||||||||||||||
Fee revenue1 | $ | 532.2 | $ | 598.9 | (11) | % | (12) | % | $ | 1,748.7 | $ | 2,430.2 | (28) | % | (28) | % | |||||||||||||||||||||||||||||||
| Investment Sales, Debt/Equity Advisory and Other | 391.0 | 458.1 | (15) | (16) | 1,245.0 | 1,906.7 | (35) | (35) | |||||||||||||||||||||||||||||||||||||||
| Value and Risk Advisory | 103.1 | 103.7 | (1) | (2) | 351.1 | 365.6 | (4) | (3) | |||||||||||||||||||||||||||||||||||||||
| Loan Servicing | 38.1 | 37.1 | 3 | 3 | 152.6 | 157.9 | (3) | (3) | |||||||||||||||||||||||||||||||||||||||
| Segment operating income | $ | 49.3 | $ | 96.8 | (49) | % | (49) | % | $ | 81.1 | $ | 389.3 | (79) | % | (79) | % | |||||||||||||||||||||||||||||||
| Equity earnings | $ | 0.6 | $ | 1.0 | (40) | % | (42) | % | $ | 6.7 | $ | 3.1 | 116 | % | 114 | % | |||||||||||||||||||||||||||||||
Adjusted EBITDA1 | $ | 76.1 | $ | 115.9 | (34) | % | (34) | % | $ | 173.1 | $ | 444.0 | (61) | % | (61) | % | |||||||||||||||||||||||||||||||
| Adjusted EBITDA margin (local currency basis) | 14.5 | % | 19.4 | % | (510) bps | (490) bps | 9.9 | % | 18.3 | % | (840) bps | (840) bps | |||||||||||||||||||||||||||||||||||
| Adjusted EBITDA margin (USD basis) | 14.3 | % | 9.9 | % | |||||||||||||||||||||||||||||||||||||||||||
| Note: For discussion and reconciliation of non-GAAP financial measures, see the Notes following the Financial Statements in this news release. Percentage variances in the Performance Highlights below are calculated and presented on a local currency basis, unless otherwise noted. | |||||||||||||||||||||||||||||||||||||||||||||||
| Note: "Valuation Advisory" was changed to "Value and Risk Advisory" in the third quarter of 2023. | |||||||||||||||||||||||||||||||||||||||||||||||
Work Dynamics ($ in millions, “LC” = local currency) | Three Months Ended December 31, | % Change in USD | % Change in LC | Year Ended December 31, | % Change in USD | % Change in LC | |||||||||||||||||||||||||||||||||||||||||
| 2023 | 2022 | 2023 | 2022 | ||||||||||||||||||||||||||||||||||||||||||||
| Revenue | $ | 3,966.1 | $ | 3,634.6 | 9 | % | 8 | % | $ | 14,131.1 | $ | 13,268.5 | 7 | % | 7 | % | |||||||||||||||||||||||||||||||
Gross contract costs1 | (3,383.9) | (3,100.3) | 9 | 8 | (12,131.4) | (11,403.8) | 6 | 7 | |||||||||||||||||||||||||||||||||||||||
Fee revenue1 | $ | 582.2 | $ | 534.3 | 9 | % | 8 | % | $ | 1,999.7 | $ | 1,864.7 | 7 | % | 7 | % | |||||||||||||||||||||||||||||||
| Workplace Management | 239.9 | 202.3 | 19 | 17 | 806.4 | 752.8 | 7 | 7 | |||||||||||||||||||||||||||||||||||||||
| Project Management | 258.2 | 250.1 | 3 | 2 | 928.4 | 850.7 | 9 | 9 | |||||||||||||||||||||||||||||||||||||||
| Portfolio Services and Other | 84.1 | 81.9 | 3 | 1 | 264.9 | 261.2 | 1 | 1 | |||||||||||||||||||||||||||||||||||||||
| Segment operating income | $ | 100.1 | $ | 64.6 | 55 | % | 55 | % | $ | 183.8 | $ | 158.4 | 16 | % | 15 | % | |||||||||||||||||||||||||||||||
Adjusted EBITDA1 | $ | 120.5 | $ | 83.9 | 44 | % | 44 | % | $ | 264.0 | $ | 230.1 | 15 | % | 14 | % | |||||||||||||||||||||||||||||||
| Adjusted EBITDA margin (local currency basis) | 21.0 | % | 15.7 | % | 500 bps | 530 bps | 13.1 | % | 12.3 | % | 90 bps | 80 bps | |||||||||||||||||||||||||||||||||||
| Adjusted EBITDA margin (USD basis) | 20.7 | % | 13.2 | % | |||||||||||||||||||||||||||||||||||||||||||
| Note: For discussion and reconciliation of non-GAAP financial measures, see the Notes following the Financial Statements in this news release. Percentage variances in the Performance Highlights below are calculated and presented on a local currency basis, unless otherwise noted. | |||||||||||||||||||||||||||||||||||||||||||||||
JLL Technologies ($ in millions, “LC” = local currency) | Three Months Ended December 31, | % Change in USD | % Change in LC | Year Ended December 31, | % Change in USD | % Change in LC | |||||||||||||||||||||||||||||||||||||||||
| 2023 | 2022 | 2023 | 2022 | ||||||||||||||||||||||||||||||||||||||||||||
| Revenue | $ | 65.5 | $ | 57.3 | 14 | % | 14 | % | $ | 246.4 | $ | 213.9 | 15 | % | 15 | % | |||||||||||||||||||||||||||||||
Gross contract costs1 | (3.5) | (3.1) | 13 | 13 | (14.5) | (13.7) | 6 | 6 | |||||||||||||||||||||||||||||||||||||||
Fee revenue1 | $ | 62.0 | $ | 54.2 | 14 | % | 14 | % | $ | 231.9 | $ | 200.2 | 16 | % | 16 | % | |||||||||||||||||||||||||||||||
Segment operating income (loss)(a) | $ | 2.1 | $ | (22.4) | 109 | % | 110 | % | $ | (35.0) | $ | (112.9) | 69 | % | 68 | % | |||||||||||||||||||||||||||||||
| Equity (losses) earnings | $ | (75.0) | $ | (17.9) | (319) | % | (317) | % | $ | (177.0) | $ | 46.6 | (480) | % | (480) | % | |||||||||||||||||||||||||||||||
Adjusted EBITDA1 | $ | (68.9) | $ | (36.2) | (90) | % | (90) | % | $ | (196.1) | $ | (50.9) | (285) | % | (286) | % | |||||||||||||||||||||||||||||||
| Adjusted EBITDA margin (local currency basis) | (111.3) | % | (66.8) | % | (4,430) bps | (4,450) bps | (84.9) | % | (25.4) | % | (5,920) bps | (5,950) bps | |||||||||||||||||||||||||||||||||||
| Adjusted EBITDA margin (USD basis) | (111.1) | % | (84.6) | % | |||||||||||||||||||||||||||||||||||||||||||
| Note: For discussion and reconciliation of non-GAAP financial measures, see the Notes following the Financial Statements in this news release. Percentage variances in the Performance Highlights below are calculated and presented on a local currency basis, unless otherwise noted. | |||||||||||||||||||||||||||||||||||||||||||||||
(a) Included in Segment operating income (loss) for JLL Technologies is a reduction in carried interest expense of $4.4 million and $13.8 million for the three and twelve months ended December 31, 2023, respectively. There was no carried interest for the three months ended December 31, 2022, and $16.6 million of expense for the twelve months ended December 31, 2022, related to Equity earnings of the segment. | |||||||||||||||||||||||||||||||||||||||||||||||
LaSalle ($ in millions, “LC” = local currency) | Three Months Ended December 31, | % Change in USD | % Change in LC | Year Ended December 31, | % Change in USD | % Change in LC | |||||||||||||||||||||||||||||||||||||||||
| 2023 | 2022 | 2023 | 2022 | ||||||||||||||||||||||||||||||||||||||||||||
| Revenue | $ | 115.3 | $ | 118.7 | (3) | % | (4) | % | $ | 483.7 | $ | 476.0 | 2 | % | 2 | % | |||||||||||||||||||||||||||||||
Gross contract costs1 | (6.9) | (7.3) | (5) | (6) | (28.9) | (29.3) | (1) | (2) | |||||||||||||||||||||||||||||||||||||||
Fee revenue1 | $ | 108.4 | $ | 111.4 | (3) | % | (4) | % | $ | 454.8 | $ | 446.7 | 2 | % | 2 | % | |||||||||||||||||||||||||||||||
| Advisory fees | 92.8 | 96.0 | (3) | (4) | 377.2 | 380.3 | (1) | — | |||||||||||||||||||||||||||||||||||||||
| Transaction fees and other | 7.4 | 5.9 | 25 | 22 | 30.1 | 39.8 | (24) | (22) | |||||||||||||||||||||||||||||||||||||||
| Incentive fees | 8.2 | 9.5 | (14) | (14) | 47.5 | 26.6 | 79 | 79 | |||||||||||||||||||||||||||||||||||||||
| Segment operating income | $ | 17.6 | $ | 26.7 | (34) | % | (31) | % | $ | 95.4 | $ | 90.1 | 6 | % | 7 | % | |||||||||||||||||||||||||||||||
| Equity (losses) earnings | $ | (1.7) | $ | (3.6) | 53 | % | 50 | % | $ | (24.7) | $ | 0.4 | n.m. | n.m. | |||||||||||||||||||||||||||||||||
Adjusted EBITDA1 | $ | 18.2 | $ | 24.7 | (26) | % | (23) | % | $ | 79.1 | $ | 96.6 | (18) | % | (17) | % | |||||||||||||||||||||||||||||||
| Adjusted EBITDA margin (local currency basis) | 17.7 | % | 22.2 | % | (540) bps | (450) bps | 17.5 | % | 21.6 | % | (420) bps | (410) bps | |||||||||||||||||||||||||||||||||||
| Adjusted EBITDA margin (USD basis) | 16.8 | % | 17.4 | % | |||||||||||||||||||||||||||||||||||||||||||
| Note: For discussion and reconciliation of non-GAAP financial measures, see the Notes following the Financial Statements in this news release. Percentage variances in the Performance Highlights below are calculated and presented on a local currency basis, unless otherwise noted. | |||||||||||||||||||||||||||||||||||||||||||||||
| Connect with us |    | ||||
| Live Webcast | Conference Call | ||||||||||
Management will offer a live webcast for shareholders, analysts and investment professionals on Tuesday, February 27, 2023, at 9:00 a.m. Eastern. Following the live broadcast, an audio replay will be available. The link to the live webcast and audio replay can be accessed at the Investor Relations website: ir.jll.com. | The conference call can be accessed live over the phone by dialing (888) 660-6392; the conference ID number is 5398158. Listeners are asked to please dial in 10 minutes prior to the call start time and provide the conference ID number to be connected. | ||||||||||
| Supplemental Information | Contact | ||||||||||
Supplemental information regarding the fourth quarter 2023 earnings call has been posted to the Investor Relations section of JLL's website: ir.jll.com. | If you have any questions, please contact Scott Einberger, Investor Relations Officer. | ||||||||||
Phone: | +1 312 252 8943 | ||||||||||
Email: | JLLInvestorRelations@am.jll.com | ||||||||||
| JONES LANG LASALLE INCORPORATED | |||||||||||||||||||||||
| Consolidated Statements of Operations (Unaudited) | |||||||||||||||||||||||
| Three Months Ended December 31, | Year Ended December 31, | ||||||||||||||||||||||
| (in millions, except share and per share data) | 2023 | 2022 | 2023 | 2022 | |||||||||||||||||||
| Revenue | $ | 5,881.4 | $ | 5,604.8 | $ | 20,760.8 | $ | 20,862.1 | |||||||||||||||
| Operating expenses: | |||||||||||||||||||||||
| Compensation and benefits | $ | 2,666.1 | $ | 2,549.4 | $ | 9,770.7 | $ | 10,010.8 | |||||||||||||||
| Operating, administrative and other | 2,841.4 | 2,699.7 | 10,074.5 | 9,650.3 | |||||||||||||||||||
| Depreciation and amortization | 61.9 | 62.6 | 238.4 | 228.1 | |||||||||||||||||||
Restructuring and acquisition charges2 | 21.6 | 38.4 | 100.7 | 104.8 | |||||||||||||||||||
| Total operating expenses | $ | 5,591.0 | $ | 5,350.1 | $ | 20,184.3 | $ | 19,994.0 | |||||||||||||||
| Operating income | $ | 290.4 | $ | 254.7 | $ | 576.5 | $ | 868.1 | |||||||||||||||
| Interest expense, net of interest income | 31.5 | 26.1 | 135.4 | 75.2 | |||||||||||||||||||
| Equity (losses) earnings | (76.8) | (21.6) | (194.1) | 51.0 | |||||||||||||||||||
| Other income | 3.0 | 14.3 | 4.9 | 150.3 | |||||||||||||||||||
| Income before income taxes and noncontrolling interest | 185.1 | 221.3 | 251.9 | 994.2 | |||||||||||||||||||
| Income tax provision | 12.7 | 45.4 | 25.7 | 200.8 | |||||||||||||||||||
| Net income | 172.4 | 175.9 | 226.2 | 793.4 | |||||||||||||||||||
Net income attributable to noncontrolling interest(a) | — | 1.1 | 0.8 | 138.9 | |||||||||||||||||||
| Net income attributable to common shareholders | $ | 172.4 | $ | 174.8 | $ | 225.4 | $ | 654.5 | |||||||||||||||
| Basic earnings per common share | $ | 3.63 | $ | 3.68 | $ | 4.73 | $ | 13.51 | |||||||||||||||
| Basic weighted average shares outstanding (in 000's) | 47,548 | 47,480 | 47,628 | 48,453 | |||||||||||||||||||
| Diluted earnings per common share | $ | 3.57 | $ | 3.62 | $ | 4.67 | $ | 13.27 | |||||||||||||||
| Diluted weighted average shares outstanding (in 000's) | 48,324 | 48,263 | 48,288 | 49,341 | |||||||||||||||||||
| Please reference accompanying financial statement notes. | |||||||||||||||||||||||
| (a) During the second quarter of 2022, Other income included a $142.3 million gain by a consolidated variable interest entity in which the company held no equity interest. This gain, therefore, is also included in the period's net income attributable to noncontrolling interest. As a result, there is no net impact to Net income attributable to common shareholders (or other measures like Adjusted EBITDA, Adjusted net income and Adjusted diluted earnings per share). | |||||||||||||||||||||||
| JONES LANG LASALLE INCORPORATED | |||||||||||||||||||||||
| Selected Segment Financial Data (Unaudited) | |||||||||||||||||||||||
| Three Months Ended December 31, | Year Ended December 31, | ||||||||||||||||||||||
| (in millions) | 2023 | 2022 | 2023 | 2022 | |||||||||||||||||||
| MARKETS ADVISORY | |||||||||||||||||||||||
| Revenue | $ | 1,197.4 | $ | 1,186.3 | $ | 4,121.6 | $ | 4,415.5 | |||||||||||||||
Gross contract costs1 | (301.8) | (271.0) | (1,153.6) | (1,055.3) | |||||||||||||||||||
Fee revenue1 | $ | 895.6 | $ | 915.3 | $ | 2,968.0 | $ | 3,360.2 | |||||||||||||||
| Compensation and benefits, excluding gross contract costs | $ | 639.6 | $ | 654.0 | $ | 2,178.2 | $ | 2,433.7 | |||||||||||||||
| Operating, administrative and other, excluding gross contract costs | 94.9 | 112.4 | 368.3 | 405.0 | |||||||||||||||||||
| Depreciation and amortization | 18.2 | 21.5 | 69.6 | 73.5 | |||||||||||||||||||
| Segment fee-based operating expenses | 752.7 | 787.9 | 2,616.1 | 2,912.2 | |||||||||||||||||||
Gross contract costs1 | 301.8 | 271.0 | 1,153.6 | 1,055.3 | |||||||||||||||||||
| Segment operating expenses | $ | 1,054.5 | $ | 1,058.9 | $ | 3,769.7 | $ | 3,967.5 | |||||||||||||||
| Segment operating income | $ | 142.9 | $ | 127.4 | $ | 351.9 | $ | 448.0 | |||||||||||||||
| Add: | |||||||||||||||||||||||
| Equity losses | (0.8) | (1.0) | (0.5) | (0.3) | |||||||||||||||||||
Depreciation and amortization(a) | 17.1 | 20.6 | 65.6 | 70.6 | |||||||||||||||||||
| Other income | 2.0 | 10.0 | 2.5 | 142.9 | |||||||||||||||||||
| Net income attributable to noncontrolling interest | — | (0.8) | (0.8) | (138.2) | |||||||||||||||||||
| Adjustments: | |||||||||||||||||||||||
| Net loss on disposition | — | — | 0.9 | 10.5 | |||||||||||||||||||
| Interest on employee loans, net of forgiveness | (0.7) | (6.0) | (3.0) | (6.0) | |||||||||||||||||||
Adjusted EBITDA1 | $ | 160.5 | $ | 150.2 | $ | 416.6 | $ | 527.5 | |||||||||||||||
| CAPITAL MARKETS | |||||||||||||||||||||||
| Revenue | $ | 537.1 | $ | 607.9 | $ | 1,778.0 | $ | 2,488.2 | |||||||||||||||
Gross contract costs1 | (13.6) | (10.8) | (47.5) | (47.0) | |||||||||||||||||||
| Net non-cash MSR and mortgage banking derivative activity | 8.7 | 1.8 | 18.2 | (11.0) | |||||||||||||||||||
Fee revenue1 | $ | 532.2 | $ | 598.9 | $ | 1,748.7 | $ | 2,430.2 | |||||||||||||||
| Compensation and benefits, excluding gross contract costs | $ | 394.6 | $ | 408.4 | $ | 1,337.7 | $ | 1,727.1 | |||||||||||||||
| Operating, administrative and other, excluding gross contract costs | 62.5 | 76.5 | 246.1 | 263.2 | |||||||||||||||||||
| Depreciation and amortization | 17.1 | 15.4 | 65.6 | 61.6 | |||||||||||||||||||
| Segment fee-based operating expenses | 474.2 | 500.3 | 1,649.4 | 2,051.9 | |||||||||||||||||||
Gross contract costs1 | 13.6 | 10.8 | 47.5 | 47.0 | |||||||||||||||||||
| Segment operating expenses | $ | 487.8 | $ | 511.1 | $ | 1,696.9 | $ | 2,098.9 | |||||||||||||||
| Segment operating income | $ | 49.3 | $ | 96.8 | $ | 81.1 | $ | 389.3 | |||||||||||||||
| Add: | |||||||||||||||||||||||
| Equity earnings | 0.6 | 1.0 | 6.7 | 3.1 | |||||||||||||||||||
| Depreciation and amortization | 17.1 | 15.4 | 65.6 | 61.6 | |||||||||||||||||||
| Other income | 1.0 | 4.6 | 2.5 | 4.7 | |||||||||||||||||||
| Adjustments: | |||||||||||||||||||||||
| Net non-cash MSR and mortgage banking derivative activity | 8.7 | 1.8 | 18.2 | (11.0) | |||||||||||||||||||
| Interest on employee loans, net of forgiveness | (0.6) | (3.7) | (0.6) | (3.7) | |||||||||||||||||||
| Gain on disposition | — | — | (0.4) | — | |||||||||||||||||||
Adjusted EBITDA1 | $ | 76.1 | $ | 115.9 | $ | 173.1 | $ | 444.0 | |||||||||||||||
| (a) This adjustment excludes the noncontrolling interest portion of amortization of acquisition-related intangibles which is not attributable to common shareholders. | |||||||||||||||||||||||
| JONES LANG LASALLE INCORPORATED | |||||||||||||||||||||||
| Selected Segment Financial Data (Unaudited) Continued | |||||||||||||||||||||||
| Three Months Ended December 31, | Year Ended December 31, | ||||||||||||||||||||||
| (in millions) | 2023 | 2022 | 2023 | 2022 | |||||||||||||||||||
| WORK DYNAMICS | |||||||||||||||||||||||
| Revenue | $ | 3,966.1 | $ | 3,634.6 | $ | 14,131.1 | $ | 13,268.5 | |||||||||||||||
Gross contract costs1 | (3,383.9) | (3,100.3) | (12,131.4) | (11,403.8) | |||||||||||||||||||
Fee revenue1 | $ | 582.2 | $ | 534.3 | $ | 1,999.7 | $ | 1,864.7 | |||||||||||||||
| Compensation and benefits, excluding gross contract costs | $ | 346.2 | $ | 331.5 | $ | 1,305.1 | $ | 1,202.3 | |||||||||||||||
| Operating, administrative and other, excluding gross contract costs | 115.6 | 118.2 | 431.6 | 432.9 | |||||||||||||||||||
| Depreciation and amortization | 20.3 | 20.0 | 79.2 | 71.1 | |||||||||||||||||||
| Segment fee-based operating expenses | 482.1 | 469.7 | 1,815.9 | 1,706.3 | |||||||||||||||||||
Gross contract costs1 | 3,383.9 | 3,100.3 | 12,131.4 | 11,403.8 | |||||||||||||||||||
| Segment operating expenses | $ | 3,866.0 | $ | 3,570.0 | $ | 13,947.3 | $ | 13,110.1 | |||||||||||||||
| Segment operating income | $ | 100.1 | $ | 64.6 | $ | 183.8 | $ | 158.4 | |||||||||||||||
| Add: | |||||||||||||||||||||||
| Equity earnings (losses) | 0.1 | (0.1) | 1.4 | 1.2 | |||||||||||||||||||
| Depreciation and amortization | 20.3 | 20.0 | 79.2 | 71.1 | |||||||||||||||||||
| Other expense | — | (0.3) | — | (0.2) | |||||||||||||||||||
| Net income attributable to noncontrolling interest | — | (0.3) | (0.4) | (0.4) | |||||||||||||||||||
Adjusted EBITDA1 | $ | 120.5 | $ | 83.9 | $ | 264.0 | $ | 230.1 | |||||||||||||||
| JLL TECHNOLOGIES | |||||||||||||||||||||||
| Revenue | $ | 65.5 | $ | 57.3 | $ | 246.4 | $ | 213.9 | |||||||||||||||
Gross contract costs1 | (3.5) | (3.1) | (14.5) | (13.7) | |||||||||||||||||||
Fee revenue1 | $ | 62.0 | $ | 54.2 | $ | 231.9 | $ | 200.2 | |||||||||||||||
Compensation and benefits, excluding gross contract costs(a) | $ | 45.4 | $ | 54.6 | $ | 200.7 | $ | 240.3 | |||||||||||||||
| Operating, administrative and other, excluding gross contract costs | 10.5 | 18.0 | 50.3 | 57.4 | |||||||||||||||||||
| Depreciation and amortization | 4.0 | 4.0 | 15.9 | 15.4 | |||||||||||||||||||
| Segment fee-based operating expenses | 59.9 | 76.6 | 266.9 | 313.1 | |||||||||||||||||||
Gross contract costs1 | 3.5 | 3.1 | 14.5 | 13.7 | |||||||||||||||||||
| Segment operating expenses | $ | 63.4 | $ | 79.7 | $ | 281.4 | $ | 326.8 | |||||||||||||||
| Segment operating income (loss) | $ | 2.1 | $ | (22.4) | $ | (35.0) | $ | (112.9) | |||||||||||||||
| Add: | |||||||||||||||||||||||
| Equity (losses) earnings | (75.0) | (17.9) | (177.0) | 46.6 | |||||||||||||||||||
| Depreciation and amortization | 4.0 | 4.0 | 15.9 | 15.4 | |||||||||||||||||||
| Other income | — | 0.1 | — | 3.0 | |||||||||||||||||||
| Adjustments: | |||||||||||||||||||||||
| Gain on disposition | — | — | — | (3.0) | |||||||||||||||||||
Adjusted EBITDA1 | $ | (68.9) | $ | (36.2) | $ | (196.1) | $ | (50.9) | |||||||||||||||
(a) Included in Compensation and benefits expense for JLL Technologies is carried interest benefit of $4.4 million and $13.8 million for the three and twelve months ended December 31, 2023, respectively. There was no carried interest expense for the three months ended December 31, 2022 and $16.6 million for the twelve months ended December 31, 2022, related to Equity earnings of the segment. | |||||||||||||||||||||||
| JONES LANG LASALLE INCORPORATED | |||||||||||||||||||||||
| Selected Segment Financial Data (Unaudited) Continued | |||||||||||||||||||||||
| Three Months Ended December 31, | Year Ended December 31, | ||||||||||||||||||||||
| (in millions) | 2023 | 2022 | 2023 | 2022 | |||||||||||||||||||
| LASALLE | |||||||||||||||||||||||
| Revenue | $ | 115.3 | $ | 118.7 | $ | 483.7 | $ | 476.0 | |||||||||||||||
Gross contract costs1 | (6.9) | (7.3) | (28.9) | (29.3) | |||||||||||||||||||
Fee revenue1 | $ | 108.4 | $ | 111.4 | $ | 454.8 | $ | 446.7 | |||||||||||||||
| Compensation and benefits, excluding gross contract costs | $ | 72.2 | $ | 64.7 | $ | 288.7 | $ | 290.4 | |||||||||||||||
| Operating, administrative and other, excluding gross contract costs | 16.3 | 18.3 | 62.6 | 59.7 | |||||||||||||||||||
| Depreciation and amortization | 2.3 | 1.7 | 8.1 | 6.5 | |||||||||||||||||||
| Segment fee-based operating expenses | 90.8 | 84.7 | 359.4 | 356.6 | |||||||||||||||||||
Gross contract costs1 | 6.9 | 7.3 | 28.9 | 29.3 | |||||||||||||||||||
| Segment operating expenses | $ | 97.7 | $ | 92.0 | $ | 388.3 | $ | 385.9 | |||||||||||||||
| Segment operating income | $ | 17.6 | $ | 26.7 | $ | 95.4 | $ | 90.1 | |||||||||||||||
| Add: | |||||||||||||||||||||||
| Equity (losses) earnings | (1.7) | (3.6) | (24.7) | 0.4 | |||||||||||||||||||
| Depreciation and amortization | 2.3 | 1.7 | 8.1 | 6.5 | |||||||||||||||||||
| Other expense | — | (0.1) | (0.1) | (0.1) | |||||||||||||||||||
| Net loss (income) attributable to noncontrolling interest | — | — | 0.4 | (0.3) | |||||||||||||||||||
Adjusted EBITDA1 | $ | 18.2 | $ | 24.7 | $ | 79.1 | $ | 96.6 | |||||||||||||||
| JONES LANG LASALLE INCORPORATED | ||||||||||||||||||||||||||
| Consolidated Statement of Cash Flows (Unaudited) | ||||||||||||||||||||||||||
| Year Ended December 31, | Year Ended December 31, | |||||||||||||||||||||||||
| (in millions) | 2023 | 2022 | 2023 | 2022 | ||||||||||||||||||||||
| Cash flows from operating activities: | Cash flows from investing activities: | |||||||||||||||||||||||||
| Net income | $ | 226.2 | $ | 793.4 | Net capital additions – property and equipment | $ | (186.9) | $ | (205.8) | |||||||||||||||||
| Reconciliation of net income to net cash used in operating activities: | Net investment asset activity (less than wholly-owned) | — | 134.8 | |||||||||||||||||||||||
| Depreciation and amortization | 238.4 | 228.1 | Business acquisitions, net of cash acquired | (13.6) | (5.7) | |||||||||||||||||||||
| Equity losses (earnings) | 194.1 | (51.0) | Capital contributions to investments | (109.4) | (167.3) | |||||||||||||||||||||
| Net loss (gain) on dispositions | 0.5 | (133.9) | Distributions of capital from investments | 23.7 | 24.4 | |||||||||||||||||||||
| Distributions of earnings from investments | 12.4 | 21.2 | Other, net | (4.2) | (23.5) | |||||||||||||||||||||
| Provision for loss on receivables and other assets | 20.3 | 27.0 | Net cash used in investing activities | (290.4) | (243.1) | |||||||||||||||||||||
| Amortization of stock-based compensation | 78.3 | 85.8 | Cash flows from financing activities: | |||||||||||||||||||||||
| Net non-cash mortgage servicing rights and mortgage banking derivative activity | 18.2 | (11.0) | Proceeds from borrowings under credit facility | 7,684.0 | 7,560.0 | |||||||||||||||||||||
| Accretion of interest and amortization of debt issuance costs | 4.3 | 4.8 | Repayments of borrowings under credit facility | (8,284.0) | (6,485.0) | |||||||||||||||||||||
| Other, net | 17.5 | 5.9 | Proceeds from senior notes | 400.0 | — | |||||||||||||||||||||
| Change in: | Repayments of senior notes | — | (275.0) | |||||||||||||||||||||||
| Receivables | 11.1 | (291.3) | Net (repayments of) proceeds from short-term borrowings | (24.8) | 20.1 | |||||||||||||||||||||
| Reimbursable receivables and reimbursable payables | (93.3) | (52.2) | Payments of deferred business acquisition obligations and earn-outs | (26.6) | (12.6) | |||||||||||||||||||||
| Prepaid expenses and other assets | (24.0) | 39.9 | Shares repurchased for payment of employee taxes on stock awards | (30.6) | (87.2) | |||||||||||||||||||||
| Income taxes receivable, payable and deferred | (138.8) | (105.1) | Repurchase of common stock | (61.6) | (601.2) | |||||||||||||||||||||
| Accounts payable, accrued liabilities and other liabilities | 78.5 | (78.4) | Deconsolidation of variable interest entity | — | (20.4) | |||||||||||||||||||||
| Accrued compensation (including net deferred compensation) | (67.9) | (283.3) | Noncontrolling interest distributions, net | (6.5) | (142.7) | |||||||||||||||||||||
| Net cash provided by operating activities | $ | 575.8 | $ | 199.9 | Other, net | (24.2) | 30.9 | |||||||||||||||||||
| Net cash used in financing activities | (374.3) | (13.1) | ||||||||||||||||||||||||
| Effect of currency exchange rate changes on cash, cash equivalents and restricted cash | 6.3 | (39.3) | ||||||||||||||||||||||||
| Net change in cash, cash equivalents and restricted cash | $ | (82.6) | $ | (95.6) | ||||||||||||||||||||||
| Cash, cash equivalents and restricted cash, beginning of the period | 746.0 | 841.6 | ||||||||||||||||||||||||
| Cash, cash equivalents and restricted cash, end of the period | $ | 663.4 | $ | 746.0 | ||||||||||||||||||||||
| Please reference accompanying financial statement notes. | ||||||||||||||||||||||||||
| JONES LANG LASALLE INCORPORATED | ||||||||||||||||||||||||||||||||||||||
| Consolidated Balance Sheets | ||||||||||||||||||||||||||||||||||||||
| December 31, | December 31, | December 31, | December 31, | |||||||||||||||||||||||||||||||||||
| (in millions, except share and per share data) | 2023 | 2022 | 2023 | 2022 | ||||||||||||||||||||||||||||||||||
| ASSETS | LIABILITIES AND EQUITY | |||||||||||||||||||||||||||||||||||||
| Current assets: | Current liabilities: | |||||||||||||||||||||||||||||||||||||
| Cash and cash equivalents | $ | 410.0 | $ | 519.3 | Accounts payable and accrued liabilities | $ | 1,406.7 | $ | 1,236.8 | |||||||||||||||||||||||||||||
| Trade receivables, net of allowance | 2,095.8 | 2,148.8 | Reimbursable payables | 1,796.9 | 1,579.5 | |||||||||||||||||||||||||||||||||
| Notes and other receivables | 446.4 | 469.5 | Accrued compensation and benefits | 1,698.3 | 1,749.8 | |||||||||||||||||||||||||||||||||
| Reimbursable receivables | 2,321.7 | 2,005.7 | Short-term borrowings | 147.9 | 164.2 | |||||||||||||||||||||||||||||||||
| Warehouse receivables | 677.4 | 463.2 | Short-term contract liability and deferred income | 226.4 | 216.5 | |||||||||||||||||||||||||||||||||
| Short-term contract assets, net of allowance | 338.3 | 359.7 | Short-term acquisition-related obligations | 19.6 | 23.1 | |||||||||||||||||||||||||||||||||
| Prepaid and other | 567.4 | 603.5 | Warehouse facilities | 662.7 | 455.3 | |||||||||||||||||||||||||||||||||
| Total current assets | 6,857.0 | 6,569.7 | Short-term operating lease liability | 161.9 | 156.4 | |||||||||||||||||||||||||||||||||
| Property and equipment, net of accumulated depreciation | 613.9 | 582.9 | Other | 325.7 | 330.5 | |||||||||||||||||||||||||||||||||
| Operating lease right-of-use asset | 730.9 | 776.3 | Total current liabilities | 6,446.1 | 5,912.1 | |||||||||||||||||||||||||||||||||
| Goodwill | 4,587.4 | 4,528.0 | Noncurrent liabilities: | |||||||||||||||||||||||||||||||||||
| Identified intangibles, net of accumulated amortization | 785.0 | 858.5 | Credit facility, net of debt issuance costs | 610.6 | 1,213.8 | |||||||||||||||||||||||||||||||||
| Investments | 816.6 | 873.8 | Long-term debt, net of debt issuance costs | 779.3 | 372.8 | |||||||||||||||||||||||||||||||||
| Long-term receivables | 363.8 | 331.1 | Long-term deferred tax liabilities, net | 44.8 | 194.0 | |||||||||||||||||||||||||||||||||
| Deferred tax assets, net | 497.4 | 379.6 | Deferred compensation | 580.0 | 492.4 | |||||||||||||||||||||||||||||||||
| Deferred compensation plans | 604.3 | 517.9 | Long-term acquisition-related obligations | 51.1 | 76.3 | |||||||||||||||||||||||||||||||||
| Other | 208.5 | 175.9 | Long-term operating lease liability | 754.5 | 775.8 | |||||||||||||||||||||||||||||||||
| Total assets | $ | 16,064.8 | $ | 15,593.7 | Other | 388.5 | 407.0 | |||||||||||||||||||||||||||||||
| Total liabilities | $ | 9,654.9 | $ | 9,444.2 | ||||||||||||||||||||||||||||||||||
| Redeemable noncontrolling interest | $ | — | $ | 7.0 | ||||||||||||||||||||||||||||||||||
| Company shareholders' equity | ||||||||||||||||||||||||||||||||||||||
| Common stock | 0.5 | 0.5 | ||||||||||||||||||||||||||||||||||||
| Additional paid-in capital | 2,019.7 | 2,022.6 | ||||||||||||||||||||||||||||||||||||
| Retained earnings | 5,795.6 | 5,590.4 | ||||||||||||||||||||||||||||||||||||
| Treasury stock | (920.1) | (934.6) | ||||||||||||||||||||||||||||||||||||
| Shares held in trust | (10.4) | (9.8) | ||||||||||||||||||||||||||||||||||||
| Accumulated other comprehensive loss | (591.5) | (648.2) | ||||||||||||||||||||||||||||||||||||
| Total company shareholders' equity | 6,293.8 | 6,020.9 | ||||||||||||||||||||||||||||||||||||
| Noncontrolling interest | 116.1 | 121.6 | ||||||||||||||||||||||||||||||||||||
| Total equity | 6,409.9 | 6,142.5 | ||||||||||||||||||||||||||||||||||||
| Total liabilities and equity | $ | 16,064.8 | $ | 15,593.7 | ||||||||||||||||||||||||||||||||||
| Please reference accompanying financial statement notes. | ||||||||||||||||||||||||||||||||||||||
| Three Months Ended December 31, | Year Ended December 31, | ||||||||||||||||||||||
| (in millions) | 2023 | 2022 | 2023 | 2022 | |||||||||||||||||||
| Revenue | $ | 5,881.4 | $ | 5,604.8 | $ | 20,760.8 | $ | 20,862.1 | |||||||||||||||
Gross contract costs1 | (3,709.7) | (3,392.5) | (13,375.9) | (12,549.1) | |||||||||||||||||||
| Net non-cash MSR and mortgage banking derivative activity | 8.7 | 1.8 | 18.2 | (11.0) | |||||||||||||||||||
| Fee revenue | $ | 2,180.4 | $ | 2,214.1 | $ | 7,403.1 | $ | 8,302.0 | |||||||||||||||
| Operating expenses | $ | 5,591.0 | $ | 5,350.1 | $ | 20,184.3 | $ | 19,994.0 | |||||||||||||||
Gross contract costs1 | (3,709.7) | (3,392.5) | (13,375.9) | (12,549.1) | |||||||||||||||||||
| Fee-based operating expenses | $ | 1,881.3 | $ | 1,957.6 | $ | 6,808.4 | $ | 7,444.9 | |||||||||||||||
| Three Months Ended December 31, | Year Ended December 31, | ||||||||||||||||||||||
| (in millions) | 2023 | 2022 | 2023 | 2022 | |||||||||||||||||||
| Net income attributable to common shareholders | $ | 172.4 | $ | 174.8 | $ | 225.4 | $ | 654.5 | |||||||||||||||
| Add: | |||||||||||||||||||||||
| Interest expense, net of interest income | 31.5 | 26.1 | 135.4 | 75.2 | |||||||||||||||||||
| Income tax provision | 12.7 | 45.4 | 25.7 | 200.8 | |||||||||||||||||||
Depreciation and amortization(a) | 60.8 | 61.7 | 234.4 | 225.2 | |||||||||||||||||||
| EBITDA | $ | 277.4 | $ | 308.0 | $ | 620.9 | $ | 1,155.7 | |||||||||||||||
| Adjustments: | |||||||||||||||||||||||
Restructuring and acquisition charges2 | 21.6 | 38.4 | 100.7 | 104.8 | |||||||||||||||||||
| Net loss on disposition | — | — | 0.5 | 7.5 | |||||||||||||||||||
| Net non-cash MSR and mortgage banking derivative activity | 8.7 | 1.8 | 18.2 | (11.0) | |||||||||||||||||||
| Interest on employee loans, net of forgiveness | (1.3) | (9.7) | (3.6) | (9.7) | |||||||||||||||||||
| Adjusted EBITDA | $ | 306.4 | $ | 338.5 | $ | 736.7 | $ | 1,247.3 | |||||||||||||||
| Three Months Ended December 31, | Year Ended December 31, | ||||||||||||||||||||||
| (In millions, except share and per share data) | 2023 | 2022 | 2023 | 2022 | |||||||||||||||||||
| Net income attributable to common shareholders | $ | 172.4 | $ | 174.8 | $ | 225.4 | $ | 654.5 | |||||||||||||||
| Diluted shares (in thousands) | 48,324 | 48,263 | 48,288 | 49,341 | |||||||||||||||||||
| Diluted earnings per share | $ | 3.57 | $ | 3.62 | $ | 4.67 | $ | 13.27 | |||||||||||||||
| Net income attributable to common shareholders | $ | 172.4 | $ | 174.8 | $ | 225.4 | $ | 654.5 | |||||||||||||||
| Adjustments: | |||||||||||||||||||||||
Restructuring and acquisition charges2 | 21.6 | 38.4 | 100.7 | 104.8 | |||||||||||||||||||
| Net non-cash MSR and mortgage banking derivative activity | 8.7 | 1.8 | 18.2 | (11.0) | |||||||||||||||||||
Amortization of acquisition-related intangibles(a) | 16.1 | 17.9 | 66.0 | 67.4 | |||||||||||||||||||
| Net loss on disposition | — | — | 0.5 | 7.5 | |||||||||||||||||||
| Interest on employee loans, net of forgiveness | (1.3) | (9.7) | (3.6) | (9.7) | |||||||||||||||||||
Tax impact of adjusted items(b) | (13.0) | (12.6) | (49.7) | (38.4) | |||||||||||||||||||
| Adjusted net income attributable to common shareholders | $ | 204.5 | $ | 210.6 | $ | 357.5 | $ | 775.1 | |||||||||||||||
| Diluted shares (in thousands) | 48,324 | 48,263 | 48,288 | 49,341 | |||||||||||||||||||
| Adjusted diluted earnings per share | $ | 4.23 | $ | 4.36 | $ | 7.40 | $ | 15.71 | |||||||||||||||
| Year Ended December 31, | |||||||||||
| (in millions) | 2023 | 2022 | |||||||||
| Net cash provided by operating activities | $ | 575.8 | $ | 199.9 | |||||||
| Net capital additions - property and equipment | (186.9) | (205.8) | |||||||||
Free Cash Flow5 | $ | 388.9 | $ | (5.9) | |||||||
| Three Months Ended December 31, | Year Ended December 31, | ||||||||||||||||||||||
| ($ in millions) | 2023 | % Change | 2023 | % Change | |||||||||||||||||||
| Revenue: | |||||||||||||||||||||||
| At current period exchange rates | $ | 5,881.4 | 5 | % | $ | 20,760.8 | — | % | |||||||||||||||
| Impact of change in exchange rates | (44.3) | n/a | 74.3 | n/a | |||||||||||||||||||
| At comparative period exchange rates | $ | 5,837.1 | 4 | % | $ | 20,835.1 | — | % | |||||||||||||||
| Fee revenue: | |||||||||||||||||||||||
| At current period exchange rates | $ | 2,180.4 | (2) | % | $ | 7,403.1 | (11) | % | |||||||||||||||
| Impact of change in exchange rates | (20.4) | n/a | 11.5 | n/a | |||||||||||||||||||
| At comparative period exchange rates | $ | 2,160.0 | (2) | % | $ | 7,414.6 | (11) | % | |||||||||||||||
| Operating income: | |||||||||||||||||||||||
| At current period exchange rates | $ | 290.4 | 14 | % | $ | 576.5 | (34) | % | |||||||||||||||
| Impact of change in exchange rates | 2.9 | n/a | 4.5 | n/a | |||||||||||||||||||
| At comparative period exchange rates | $ | 293.3 | 15 | % | $ | 581.0 | (33) | % | |||||||||||||||
| Adjusted EBITDA: | |||||||||||||||||||||||
| At current period exchange rates | $ | 306.4 | (9) | % | $ | 736.7 | (41) | % | |||||||||||||||
| Impact of change in exchange rates | 1.5 | n/a | 7.5 | n/a | |||||||||||||||||||
| At comparative period exchange rates | $ | 307.9 | (9) | % | $ | 744.2 | (40) | % | |||||||||||||||
| Three Months Ended December 31, | Year Ended December 31, | ||||||||||||||||||||||
| (in millions) | 2023 | 2022 | 2023 | 2022 | |||||||||||||||||||
| Severance and other employment-related charges | $ | 14.2 | $ | 23.5 | $ | 62.1 | $ | 44.5 | |||||||||||||||
| Restructuring, pre-acquisition and post-acquisition charges | 11.3 | 18.4 | 43.0 | 63.6 | |||||||||||||||||||
| Fair value adjustments that resulted in a net decrease to earn-out liabilities from prior-period acquisition activity | (3.9) | (3.5) | (4.4) | (3.3) | |||||||||||||||||||
| Total Restructuring and acquisition charges | $ | 21.6 | $ | 38.4 | $ | 100.7 | $ | 104.8 | |||||||||||||||
| Three Months Ended December 31, 2023 | |||||||||||||||||||||||||||||||||||||||||||||||||||||||||||||||||||||||
| (in millions) | Markets Advisory | Capital Markets | Work Dynamics | ||||||||||||||||||||||||||||||||||||||||||||||||||||||||||||||||||||
| Leasing | Property Mgmt | Advisory, Consulting and Other | Total Markets Advisory | Invt Sales, Debt/Equity Advisory and Other | Value and Risk Advisory | Loan Servicing | Total Capital Markets | Workplace Mgmt | Project Mgmt | Portfolio Services and Other | Total Work Dynamics | JLLT | LaSalle | Total | |||||||||||||||||||||||||||||||||||||||||||||||||||||||||
| Revenue | $ | 717.5 | 445.8 | 34.1 | $ | 1,197.4 | $ | 391.3 | 107.7 | 38.1 | $ | 537.1 | $ | 3,018.5 | 798.3 | 149.3 | $ | 3,966.1 | $ | 65.5 | $ | 115.3 | $ | 5,881.4 | |||||||||||||||||||||||||||||||||||||||||||||||
Gross contract costs1 | (8.2) | (290.6) | (3.0) | (301.8) | (9.0) | (4.6) | — | (13.6) | (2,778.6) | (540.1) | (65.2) | (3,383.9) | (3.5) | (6.9) | (3,709.7) | ||||||||||||||||||||||||||||||||||||||||||||||||||||||||
| Net non-cash MSR and mortgage banking derivative activity | — | — | — | — | 8.7 | — | — | 8.7 | — | — | — | — | — | — | 8.7 | ||||||||||||||||||||||||||||||||||||||||||||||||||||||||
| Fee revenue | $ | 709.3 | 155.2 | 31.1 | $ | 895.6 | $ | 391.0 | 103.1 | 38.1 | $ | 532.2 | $ | 239.9 | 258.2 | 84.1 | $ | 582.2 | $ | 62.0 | $ | 108.4 | $ | 2,180.4 | |||||||||||||||||||||||||||||||||||||||||||||||
| Three Months Ended December 31, 2022 | |||||||||||||||||||||||||||||||||||||||||||||||||||||||||||||||||||||||
| (in millions) | Markets Advisory | Capital Markets | Work Dynamics | ||||||||||||||||||||||||||||||||||||||||||||||||||||||||||||||||||||
| Leasing | Property Mgmt | Advisory, Consulting and Other | Total Markets Advisory | Invt Sales, Debt/Equity Advisory and Other | Value and Risk Advisory | Loan Servicing | Total Capital Markets | Workplace Mgmt | Project Mgmt | Portfolio Services and Other | Total Work Dynamics | JLLT | LaSalle | Total | |||||||||||||||||||||||||||||||||||||||||||||||||||||||||
| Revenue | $ | 746.6 | 398.8 | 40.9 | $ | 1,186.3 | $ | 464.6 | 106.2 | 37.1 | $ | 607.9 | $ | 2,635.7 | 856.9 | 142.0 | $ | 3,634.6 | $ | 57.3 | $ | 118.7 | $ | 5,604.8 | |||||||||||||||||||||||||||||||||||||||||||||||
Gross contract costs1 | (6.7) | (262.3) | (2.0) | (271.0) | (8.3) | (2.5) | — | (10.8) | (2,433.4) | (606.8) | (60.1) | (3,100.3) | (3.1) | (7.3) | (3,392.5) | ||||||||||||||||||||||||||||||||||||||||||||||||||||||||
| Net non-cash MSR and mortgage banking derivative activity | — | — | — | — | 1.8 | — | — | 1.8 | — | — | — | — | — | — | 1.8 | ||||||||||||||||||||||||||||||||||||||||||||||||||||||||
| Fee revenue | $ | 739.9 | 136.5 | 38.9 | $ | 915.3 | $ | 458.1 | 103.7 | 37.1 | $ | 598.9 | $ | 202.3 | 250.1 | 81.9 | $ | 534.3 | $ | 54.2 | $ | 111.4 | $ | 2,214.1 | |||||||||||||||||||||||||||||||||||||||||||||||
| Year Ended December 31, 2023 | |||||||||||||||||||||||||||||||||||||||||||||||||||||||||||||||||||||||
| (in millions) | Markets Advisory | Capital Markets | Work Dynamics | ||||||||||||||||||||||||||||||||||||||||||||||||||||||||||||||||||||
| Leasing | Property Mgmt | Advisory, Consulting and Other | Total Markets Advisory | Invt Sales, Debt/Equity Advisory and Other | Value and Risk Advisory | Loan Servicing | Total Capital Markets | Workplace Mgmt | Project Mgmt | Portfolio Services and Other | Total Work Dynamics | JLLT | LaSalle | Total | |||||||||||||||||||||||||||||||||||||||||||||||||||||||||
| Revenue | $ | 2,343.6 | 1,675.1 | 102.9 | $ | 4,121.6 | $ | 1,261.6 | 363.8 | 152.6 | $ | 1,778.0 | $ | 10,706.2 | 2,924.8 | 500.1 | $ | 14,131.1 | $ | 246.4 | $ | 483.7 | $ | 20,760.8 | |||||||||||||||||||||||||||||||||||||||||||||||
Gross contract costs1 | (21.3) | (1,123.4) | (8.9) | (1,153.6) | (34.8) | (12.7) | — | (47.5) | (9,899.8) | (1,996.4) | (235.2) | (12,131.4) | (14.5) | (28.9) | (13,375.9) | ||||||||||||||||||||||||||||||||||||||||||||||||||||||||
| Net non-cash MSR and mortgage banking derivative activity | — | — | — | — | 18.2 | — | — | 18.2 | — | — | — | — | — | — | 18.2 | ||||||||||||||||||||||||||||||||||||||||||||||||||||||||
| Fee revenue | $ | 2,322.3 | 551.7 | 94.0 | $ | 2,968.0 | $ | 1,245.0 | 351.1 | 152.6 | $ | 1,748.7 | $ | 806.4 | 928.4 | 264.9 | $ | 1,999.7 | $ | 231.9 | $ | 454.8 | $ | 7,403.1 | |||||||||||||||||||||||||||||||||||||||||||||||
| Year Ended December 31, 2022 | |||||||||||||||||||||||||||||||||||||||||||||||||||||||||||||||||||||||
| (in millions) | Markets Advisory | Capital Markets | Work Dynamics | ||||||||||||||||||||||||||||||||||||||||||||||||||||||||||||||||||||
| Leasing | Property Mgmt | Advisory, Consulting and Other | Total Markets Advisory | Invt Sales, Debt/Equity Advisory and Other | Value and Risk Advisory | Loan Servicing | Total Capital Markets | Workplace Mgmt | Project Mgmt | Portfolio Services and Other | Total Work Dynamics | JLLT | LaSalle | Total | |||||||||||||||||||||||||||||||||||||||||||||||||||||||||
| Revenue | $ | 2,759.2 | 1,525.3 | 131.0 | $ | 4,415.5 | $ | 1,955.4 | 374.9 | 157.9 | $ | 2,488.2 | $ | 9,819.2 | 2,972.3 | 477.0 | $ | 13,268.5 | $ | 213.9 | $ | 476.0 | $ | 20,862.1 | |||||||||||||||||||||||||||||||||||||||||||||||
Gross contract costs1 | (22.5) | (1,025.1) | (7.7) | (1,055.3) | (37.7) | (9.3) | — | (47.0) | (9,066.4) | (2,121.6) | (215.8) | (11,403.8) | (13.7) | (29.3) | (12,549.1) | ||||||||||||||||||||||||||||||||||||||||||||||||||||||||
| Net non-cash MSR and mortgage banking derivative activity | — | — | — | — | (11.0) | — | — | (11.0) | — | — | — | — | — | — | (11.0) | ||||||||||||||||||||||||||||||||||||||||||||||||||||||||
| Fee revenue | $ | 2,736.7 | 500.2 | 123.3 | $ | 3,360.2 | $ | 1,906.7 | 365.6 | 157.9 | $ | 2,430.2 | $ | 752.8 | 850.7 | 261.2 | $ | 1,864.7 | $ | 200.2 | $ | 446.7 | $ | 8,302.0 | |||||||||||||||||||||||||||||||||||||||||||||||