
UNITED STATES
SECURITIES AND EXCHANGE COMMISSION
Washington, D.C. 20549
_________________
FORM
_________________
CURRENT REPORT
Pursuant to Section 13 or 15(d)
of the Securities Exchange Act of 1934
Date of Report (Date of earliest event reported):
_______________________________
(Exact name of registrant as specified in its charter)
_______________________________
| (State or Other Jurisdiction of Incorporation) | (Commission File Number) | (I.R.S. Employer Identification No.) |
(Address of Principal Executive Offices) (Zip Code)
(
(Registrant's telephone number, including area code)
Not Applicable
(Former name or former address, if changed since last report)
_______________________________
Check the appropriate box below if the Form 8-K filing is intended to simultaneously satisfy the filing obligation of the registrant under any of the following provisions:
| Written communications pursuant to Rule 425 under the Securities Act (17 CFR 230.425) | |
| Soliciting material pursuant to Rule 14a-12 under the Exchange Act (17 CFR 240.14a-12) | |
| Pre-commencement communications pursuant to Rule 14d-2(b) under the Exchange Act (17 CFR 240.14d-2(b)) | |
| Pre-commencement communications pursuant to Rule 13e-4(c) under the Exchange Act (17 CFR 240.13e-4(c)) |
Securities registered pursuant to Section 12(b) of the Act:
| Title of each class | Trading Symbol(s) | Name of each exchange on which registered |
Indicate by check mark whether the registrant is an emerging growth company as defined in Rule 405 of the Securities Act of 1933 (§230.405 of this chapter) or Rule 12b-2 of the Securities Exchange Act of 1934 (§240.12b-2 of this chapter).
Emerging growth company
If an emerging growth company, indicate by check mark if the registrant has elected not to use the extended transition period for complying with any new or revised financial accounting standards provided pursuant to Section 13(a) of the Exchange Act. ☐
On August 3, 2023, Clearfield, Inc. (the “Company”) issued a press release announcing the results of its third quarter of fiscal 2023 ended June 30, 2023. A copy of that press release is furnished hereto as Exhibit 99.1 and is hereby incorporated by reference. Also furnished hereto as Exhibit 99.2 is the slide presentation that is part of the Company’s “Earnings Presentation” to be used by Cheryl Beranek, the Company’s President and Chief Executive Officer, and Daniel Herzog, the Company’s Chief Financial Officer, during the live webcast and telephone conference relating to the third quarter ended June 30, 2023 results.
The information in this Item 2.02, including Exhibits 99.1 and 99.2, is being furnished and shall not be deemed “filed” for purposes of Section 18 of the Securities Exchange Act of 1934, as amended (the “Exchange Act”), nor shall it be deemed incorporated by reference into any Company filing under the Securities Act of 1933, as amended, or the Exchange Act, except as shall be expressly set forth by specific reference in such filing.
(d) Exhibits.
The following exhibits are being furnished herewith:
99.1 Press release of Clearfield, Inc. dated August 3, 2023
99.2 Presentation of Clearfield, Inc. for August 3, 2023 Live Webcast and Telephone Conference
104 Cover Page Interactive Data File (included within the Inline XBRL document).
SIGNATURE
Pursuant to the requirements of the Securities Exchange Act of 1934, the registrant has duly caused this report to be signed on its behalf by the undersigned hereunto duly authorized.
| CLEARFIELD, INC. | ||
| Date: August 3, 2023 | By: | /s/ Cheryl Beranek |
| Cheryl Beranek | ||
| Chief Executive Officer | ||
EXHIBIT 99.1
Clearfield Reports Fiscal Third Quarter 2023 Results
MINNEAPOLIS, Aug. 03, 2023 (GLOBE NEWSWIRE) -- Clearfield, Inc. (NASDAQ: CLFD), a leader in fiber connectivity, reported results for the third quarter of fiscal 2023.
| Fiscal Q3 2023 Financial Summary | |||||||||||
| (in millions except per share data and percentages) | Q3 2023 | vs. Q3 2022 | Change | Change (%) | |||||||
| Net Sales | $ | 61.3 | $ | 71.3 | $ | (10.0 | ) | -14 | % | ||
| Gross Profit ($) | $ | 19.1 | $ | 29.3 | $ | (10.2 | ) | -35 | % | ||
| Gross Profit (%) | 31.1 | % | 41.1 | % | -10.0 | % | -24 | % | |||
| Income from Operations | $ | 5.6 | $ | 16.6 | $ | (11.0 | ) | -66 | % | ||
| Income Tax Expense | $ | 1.8 | $ | 3.9 | $ | (2.0 | ) | -53 | % | ||
| Net Income | $ | 5.2 | $ | 12.7 | $ | (7.5 | ) | -59 | % | ||
| Net Income per Diluted Share | $ | 0.33 | $ | 0.92 | $ | (0.59 | ) | -64 | % | ||
| Fiscal Q3 YTD 2023 Financial Summary | |||||||||||
| (in millions except per share data and percentages) | 2023 YTD | vs. 2022 YTD | Change | Change (%) | |||||||
| Net Sales | $ | 219.0 | $ | 175.9 | $ | 43.2 | 25 | % | |||
| Gross Profit ($) | $ | 73.3 | $ | 75.4 | $ | (2.2 | ) | -3 | % | ||
| Gross Profit (%) | 33.5 | % | 42.9 | % | -9.4 | % | -22 | % | |||
| Income from Operations | $ | 35.6 | $ | 41.6 | $ | (6.0 | ) | -14 | % | ||
| Income Tax Expense | $ | 8.5 | $ | 9.5 | $ | (1.0 | ) | -10 | % | ||
| Net Income | $ | 29.8 | $ | 32.4 | $ | (2.5 | ) | -8 | % | ||
| Net Income per Diluted Share | $ | 2.00 | $ | 2.33 | $ | (0.33 | ) | -14 | % | ||
Management Commentary
“Our third quarter fiscal 2023 results came in relatively in-line with our expectations,” said Company President and CEO Cheri Beranek. “Based on conversations with our customers, we expect service providers to continue working through inventory for the next several quarters. Additionally, our community broadband customers are adopting a cautious approach with respect to deploying capital until they have better visibility into the timing of government funded deployments. While we expect these dynamics will impact our near-term performance, likely into fiscal 2024, we continue to focus on positioning the company for long-term growth, right-sizing capacity levels, and designing products that address our customers’ biggest pain points. With government funding initiatives underway and significant rural broadband builds expected in the coming years, we anticipate strong demand for our core products once order patterns return to normalized levels. By investing in our people, modernizing our systems, and targeting expansion into new markets like Europe, we are positioning Clearfield for continued success which we believe will drive significant shareholder value over the long term."
“Clearfield's strong balance sheet and strategic approach with service providers enable us to pursue growth opportunities and enhance our product portfolio," said CFO Dan Herzog. “We continue to invest in capital equipment with faster processing capability to reduce costs and improve margins. Finally, we are reiterating our full-year fiscal 2023 revenue guidance and increasing our full year net income per share guidance.”
Financial Results for the Three Months Ended June 30, 2023
Net sales for the third quarter of fiscal 2023 decreased 14% to $61.3 million from $71.3 million in the same year-ago quarter. Organic revenue decreased 33% year over year to $47.9 million, while Nestor Cables generated revenue of $13.4 million.
As of June 30, 2023, order backlog (defined as purchase orders received but not yet fulfilled) was $74.7 million, a decrease of $32.9 million, or 31% compared to $107.6 million as of March 31, 2023, and a decrease of $82.0 million, or 52%, from June 30, 2022. The sequential decrease was due to a lull in demand as customers digest previously purchased products.
Gross margin for the quarter was 31.1%, compared to 41.1% in the third quarter of fiscal 2022. Gross margin was negatively affected by excess production capacity as well as Nestor’s inclusion in the quarter. The Company continues to realign capacity to current market conditions.
Operating expenses for the quarter increased 6% to $13.4 million, or 22% of net sales, from $12.7 million, or 18% of net sales in the same year-ago quarter.
Net income for the quarter totaled $5.2 million, or $0.33 per diluted share, compared to $12.7 million, or $0.92 per diluted share, in the same year-ago quarter.
Outlook
The Company is reiterating its fiscal 2023 revenue guidance and is raising its net income per share guidance due to better-than-expected product margin as well as cost saving initiatives. Clearfield continues to expect its full year fiscal 2023 net sales to be within a range of $260 to $275 million, and now expects net income per share to be in the range of $2.05 to $2.15, up from $1.80 to $2.10 previously.
Conference Call
Management will hold a conference call today, August 3, 2023, at 5:00 p.m. Eastern Time (4:00 p.m. Central Time) to discuss these results and provide an update on business conditions.
Clearfield’s President and CEO Cheri Beranek and CFO Dan Herzog will host the presentation, followed by a question-and-answer period.
U.S. dial-in: 1-844-826-3033
International dial-in: 1-412-317-5185
Conference ID: 8040539
The live webcast of the call can be accessed at the Clearfield Investor Relations website along with the company's earnings press release and presentation.
Please see the Earnings Presentation for recharacterized customer segment revenue.
A replay of the call will be available after 8:00 p.m. Eastern Time on the same day through August 17, 2023, while an archived version of the webcast will be available on the Investor Relations website for 90 days.
U.S. replay dial-in: 1-844-512-2921
International replay dial-in: 1-412-317-6671
Replay ID: 10177264
About Clearfield, Inc.
Clearfield, Inc. (NASDAQ: CLFD) designs, manufactures, and distributes fiber optic management, protection, and delivery products for communications networks. Our “fiber to anywhere” platform serves the unique requirements of leading incumbent local exchange carriers (traditional carriers), competitive local exchange carriers (alternative carriers), and MSO/cable TV companies, while also catering to the broadband needs of the utility/municipality, enterprise, data center, and military markets. Headquartered in Minneapolis, MN, Clearfield deploys more than a million fiber ports each year. For more information, visit www.SeeClearfield.com.
Cautionary Statement Regarding Forward-Looking Information
Forward-looking statements contained herein and in any related presentation or in the related Earnings Presentation are made pursuant to the safe harbor provisions of the Private Litigation Reform Act of 1995. Words such as “may,” “will,” “expect,” “believe,” “anticipate,” “estimate,” “outlook,” or “continue” or comparable terminology are intended to identify forward-looking statements. Such forward looking statements include, for example, statements about the Company’s future revenue and operating performance, expected customer ordering patterns, anticipated shipping on backlog and future lead times, future availability of components and materials from the Company’s supply chain, future availability of labor impacting our customers’ network builds, the impact of the Rural Digital Opportunity Fund (RDOF) or other government programs on the demand for the Company’s products or timing of customer orders, the Company’s ability to match capacity to meet demand, expansion into new markets and trends in and growth of the FTTx markets, market segments or customer purchases and other statements that are not historical facts. These statements are based upon the Company's current expectations and judgments about future developments in the Company's business. Certain important factors could have a material impact on the Company's performance, including, without limitation: the COVID-19 pandemic has significantly impacted worldwide economic conditions and could have a material adverse effect on our business, financial condition and operating results; inflationary price pressures and uncertain availability of components, raw materials, labor and logistics used by us and our suppliers could negatively impact our profitability; we rely on single-source suppliers, which could cause delays, increase costs or prevent us from completing customer orders; we depend on the availability of sufficient supply of certain materials and global disruptions in the supply chain for these materials could prevent us from meeting customer demand for our products; we rely on our manufacturing operations to produce product to ship to customers and manufacturing constraints and disruptions could result in decreased future revenue; a significant percentage of our sales in the last three fiscal years have been made to a small number of customers, and the loss of these major customers could adversely affect us; further consolidation among our customers may result in the loss of some customers and may reduce sales during the pendency of business combinations and related integration activities; we may be subject to risks associated with acquisitions, and the risks could adversely affect future operating results; we have exposure to movements in foreign currency exchange rates; if we are unable to integrate acquired businesses, our financial results could be materially and adversely affected; adverse global economic conditions and geopolitical issues could have a negative effect on our business, and results of operations and financial condition; our planned growth may strain our business infrastructure, which could adversely affect our operations and financial condition; product defects or the failure of our products to meet specifications could cause us to lose customers and sales or to incur unexpected expenses; we are dependent on key personnel; cyber-security incidents on our information technology systems, including ransomware, data breaches or computer viruses, could disrupt our business operations, damage our reputation, and potentially lead to litigation; our business is dependent on interdependent management information systems; to compete effectively, we must continually improve existing products and introduce new products that achieve market acceptance; if the telecommunications market does not continue to expand, our business may not grow as fast as we expect, which could adversely impact our business, financial condition and operating results; changes in U.S. government funding programs may cause our customers and prospective customers to delay, reduce, or accelerate purchases, leading to unpredictable and irregular purchase cycles; intense competition in our industry may result in price reductions, lower gross profits and loss of market share; our success depends upon adequate protection of our patent and intellectual property rights; we face risks associated with expanding our sales outside of the United States; and other factors set forth in Part I, Item IA. Risk Factors of Clearfield's Annual Report on Form 10-K for the year ended September 30, 2022 as well as other filings with the Securities and Exchange Commission. The Company undertakes no obligation to update these statements to reflect actual events unless required by law.
Investor Relations Contact:
Greg McNiff
The Blueshirt Group
773-485-7191
clearfield@blueshirtgroup.com
| CLEARFIELD, INC. | |||||||||||||
| CONSOLIDATED STATEMENTS OF OPERATIONS | |||||||||||||
| (UNAUDITED) | |||||||||||||
| (IN THOUSANDS, EXCEPT SHARE DATA) | |||||||||||||
| (Unaudited) | (Unaudited) | ||||||||||||
| Three Months Ended | Nine Months Ended | ||||||||||||
| June 30, | June 30, | ||||||||||||
| 2023 | 2022 | 2023 | 2022 | ||||||||||
| Net sales | $ | 61,284 | $ | 71,250 | $ | 219,035 | $ | 175,854 | |||||
| Cost of sales | 42,210 | 41,943 | 145,750 | 100,411 | |||||||||
| Gross profit | 19,074 | 29,307 | 73,285 | 75,443 | |||||||||
| Operating expenses | |||||||||||||
| Selling, general and | |||||||||||||
| administrative | 13,449 | 12,721 | 37,714 | 33,877 | |||||||||
| Income from operations | 5,625 | 16,586 | 35,571 | 41,566 | |||||||||
| Net investment income | 1,630 | 43 | 3,328 | 284 | |||||||||
| Interest expense | (195 | ) | - | (551 | ) | - | |||||||
| Income before income taxes | 7,060 | 16,629 | 38,348 | 41,850 | |||||||||
| Income tax expense | 1,842 | 3,884 | 8,511 | 9,480 | |||||||||
| Net income | $ | 5,218 | $ | 12,745 | $ | 29,837 | $ | 32,370 | |||||
| Net income per share: | |||||||||||||
| Basic | $ | 0.33 | $ | 0.93 | $ | 2.01 | $ | 2.35 | |||||
| Diluted | $ | 0.33 | $ | 0.92 | $ | 2.00 | $ | 2.33 | |||||
| Weighted average shares outstanding: | |||||||||||||
| Basic | 15,254,341 | 13,772,269 | 14,880,666 | 13,760,950 | |||||||||
| Diluted | 15,254,341 | 13,899,698 | 14,929,405 | 13,900,019 | |||||||||
| Clearfield, Inc. | ||||||||||
| Consolidated Statement of Cashflows | ||||||||||
| (Unaudited) | ||||||||||
| Nine Months Ended | Nine Months Ended | |||||||||
| June 30, | June 30, | |||||||||
| 2023 | 2022 | |||||||||
| Cash flows from operating activities | ||||||||||
| Net income | $ | 29,837 | $ | 32,370 | ||||||
| Adjustments to reconcile net income to cash provided | ||||||||||
| by (used in) operating activities: | ||||||||||
| Depreciation and amortization | 4,411 | 2,205 | ||||||||
| Amortization of discount on investments | (2,429 | ) | (31 | ) | ||||||
| Stock-based compensation | 2,504 | 1,647 | ||||||||
| Changes in operating assets and liabilities | ||||||||||
| Accounts receivable | 24,519 | (12,156 | ) | |||||||
| Inventories, net | (21,510 | ) | (41,816 | ) | ||||||
| Other assets | (3,525 | ) | (187 | ) | ||||||
| Accounts payable and accrued expenses | (20,326 | ) | 8,677 | |||||||
| Net cash provided by (used in) operating activities | 13,481 | (9,289 | ) | |||||||
| Cash flows from investing activities: | ||||||||||
| Purchases of property, plant and equipment and | ||||||||||
| intangible assets | (6,529 | ) | (6,764 | ) | ||||||
| Purchase of investments | (210,923 | ) | (248 | ) | ||||||
| Proceeds from sales and maturities of investments | 105,077 | 17,386 | ||||||||
| Net cash (used in) provided by investing activities | (112,375 | ) | 10,374 | |||||||
| Cash flows from financing activities: | ||||||||||
| Repayment of long-term debt | (16,700 | ) | - | |||||||
| Proceeds from issuance of common stock under | 611 | 544 | ||||||||
| employee stock purchase plan | ||||||||||
| Repurchase of shares for payment of withholding taxes | (954 | ) | (274 | ) | ||||||
| for vested restricted stock grants | ||||||||||
| Tax withholding and proceeds related to exercise of stock options | (491 | ) | (379 | ) | ||||||
| Issuance of stock under equity compensation plans | 954 | - | ||||||||
| Net proceeds from issuance of common stock | 130,262 | - | ||||||||
| Net cash provided by (used in) financing activities | 113,682 | (109 | ) | |||||||
| Effect of exchange rates on cash | (54 | ) | - | |||||||
| Increase in cash and cash equivalents | 14,734 | 976 | ||||||||
| Cash and cash equivalents, beginning of period | 16,650 | 13,216 | ||||||||
| Cash and cash equivalents, end of period | $ | 31,385 | $ | 14,192 | ||||||
| Supplemental disclosures for cash flow information | ||||||||||
| Cash paid for income taxes | $ | 12,589 | $ | 9,913 | ||||||
| Cash paid for interest | $ | 360 | $ | - | ||||||
| Non-cash financing activities | ||||||||||
| Cashless exercise of stock options | $ | 566 | $ | 276 | ||||||
| Clearfield, Inc. | ||||||||||
| Consolidated Statement of Cashflows | ||||||||||
| (Unaudited) | ||||||||||
| Nine Months Ended | Nine Months Ended | |||||||||
| June 30, | June 30, | |||||||||
| 2023 | 2022 | |||||||||
| Cash flows from operating activities | ||||||||||
| Net income | $ | 29,837 | $ | 32,370 | ||||||
| Adjustments to reconcile net income to cash provided | ||||||||||
| by (used in) operating activities: | ||||||||||
| Depreciation and amortization | 4,411 | 2,205 | ||||||||
| Amortization of discount on investments | (2,429 | ) | (31 | ) | ||||||
| Stock-based compensation | 2,504 | 1,647 | ||||||||
| Changes in operating assets and liabilities | ||||||||||
| Accounts receivable | 24,519 | (12,156 | ) | |||||||
| Inventories, net | (21,510 | ) | (41,816 | ) | ||||||
| Other assets | (3,525 | ) | (185 | ) | ||||||
| Accounts payable and accrued expenses | (20,326 | ) | 8,677 | |||||||
| Net cash provided by (used in) operating activities | 13,481 | (9,289 | ) | |||||||
| Cash flows from investing activities: | ||||||||||
| Purchases of property, plant and equipment and | ||||||||||
| intangible assets | (6,529 | ) | (6,764 | ) | ||||||
| Purchase of investments | (210,923 | ) | (248 | ) | ||||||
| Proceeds from sales and maturities of investments | 105,077 | 17,386 | ||||||||
| Net cash (used in) provided by investing activities | (112,375 | ) | 10,374 | |||||||
| Cash flows from financing activities: | ||||||||||
| Repayment of long-term debt | (16,700 | ) | - | |||||||
| Proceeds from issuance of common stock under | 612 | 544 | ||||||||
| employee stock purchase plan | ||||||||||
| Repurchase of shares for payment of withholding taxes | (954 | ) | (274 | ) | ||||||
| for vested restricted stock grants | ||||||||||
| Tax withholding and proceeds related to exercise of stock options | (493 | ) | (379 | ) | ||||||
| Issuance of stock under equity compensation plans | 954 | - | ||||||||
| Net proceeds from issuance of common stock | 130,262 | - | ||||||||
| Net cash provided by (used in) financing activities | 113,681 | (109 | ) | |||||||
| Effect of exchange rates on cash | (52 | ) | - | |||||||
| Increase in cash and cash equivalents | 14,735 | 976 | ||||||||
| Cash and cash equivalents, beginning of period | 16,650 | 13,216 | ||||||||
| Cash and cash equivalents, end of period | $ | 31,385 | $ | 14,192 | ||||||
| Supplemental disclosures for cash flow information | ||||||||||
| Cash paid for income taxes | $ | 12,589 | $ | 9,913 | ||||||
| Cash paid for interest | $ | 360 | $ | - | ||||||
| Non-cash financing activities | ||||||||||
| Cashless exercise of stock options | $ | 566 | $ | 276 | ||||||
Exhibit 99.2
Clearfield Earnings Presentation: Fiscal Q3 2023 Earnings Call August 3, 2023 1
Important Cautions Regarding Forward - Looking Statements 2 Forward - looking statements contained herein and in any related presentation or in the related Earnings Release are made pursuant to the safe harbor provisions of the Private Litigation Reform Act of 1995. Words such as “may,” “will,” “expect,” “believe,” “anticipate,” “estimate,” “outlook,” or “continue” or comparab le terminology are intended to identify forward - looking statements. Such forward looking statements include, for example, statements about the Company’s future revenue and operating performance , expected customer ordering patterns, anticipated shipping on backlog and future lead times, future availability of components and materials from the Company’s supply chain, future ava ila bility of labor impacting our customers’ network builds, the impact of the Rural Digital Opportunity Fund (RDOF) or other government programs on the demand for the Company’s products or tim ing of customer orders, the Company’s ability to match capacity to meet demand, expansion into new markets and trends in and growth of the FTTx markets, market segments or customer purchases and other statements that are not historical facts. These statements are based upon the Company's current expectations and judgments about future developments in the Company's b usi ness. Certain important factors could have a material impact on the Company's performance, including, without limitation: the COVID - 19 pandemic has significantly impacted worldwide e conomic conditions and could have a material adverse effect on our business, financial condition and operating results; inflationary price pressures and uncertain availability of compon ent s, raw materials, labor and logistics used by us and our suppliers could negatively impact our profitability; we rely on single - source suppliers, which could cause delays, increase costs or preve nt us from completing customer orders; we depend on the availability of sufficient supply of certain materials and global disruptions in the supply chain for these materials could p rev ent us from meeting customer demand for our products; we rely on our manufacturing operations to produce product to ship to customers and manufacturing constraints and disruptions could resu lt in decreased future revenue; a significant percentage of our sales in the last three fiscal years have been made to a small number of customers, and the loss of these major customers cou ld adversely affect us; further consolidation among our customers may result in the loss of some customers and may reduce sales during the pendency of business combinations and related integr ati on activities; we may be subject to risks associated with acquisitions, and the risks could adversely affect future operating results; we have exposure to movements in foreign currenc y e xchange rates; if we are unable to integrate acquired businesses, our financial results could be materially and adversely affected; adverse global economic conditions and geopolitical issues cou ld have a negative effect on our business, and results of operations and financial condition; our planned growth may strain our business infrastructure, which could adversely affect our operatio ns and financial condition; product defects or the failure of our products to meet specifications could cause us to lose customers and sales or to incur unexpected expenses; we are dependent on key personnel; cyber - security incidents on our information technology systems, including ransomware, data breaches or computer viruses, could disrupt our business operations, damage ou r r eputation, and potentially lead to litigation; our business is dependent on interdependent management information systems; to compete effectively, we must continually improve existing prod uct s and introduce new products that achieve market acceptance; if the telecommunications market does not continue to expand, our business may not grow as fast as we expect, whi ch could adversely impact our business, financial condition and operating results; changes in U.S. government funding programs may cause our customers and prospective customers to delay, re duc e, or accelerate purchases, leading to unpredictable and irregular purchase cycles; intense competition in our industry may result in price reductions, lower gross profits and loss o f m arket share; our success depends upon adequate protection of our patent and intellectual property rights; we face risks associated with expanding our sales outside of the United States; and oth er factors set forth in Part I, Item IA. Risk Factors of Clearfield's Annual Report on Form 10 - K for the year ended September 30, 2022 as well as other filings with the Securities and Exchange Commi ssion. The Company undertakes no obligation to update these statements to reflect actual events unless required by law. © Copyright 2023 Clearfield, Inc. All Rights Reserved.

3 Enabling the lifestyle better broadband provides
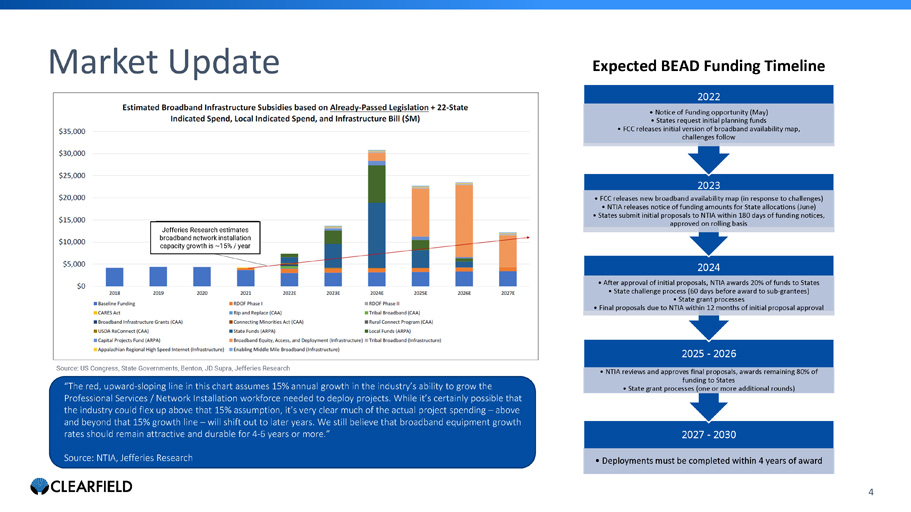
Market Update 4 “The red, upward - sloping line in this chart assumes 15% annual growth in the industry’s ability to grow the Professional Services / Network Installation workforce needed to deploy projects. While it’s certainly possible that the industry could flex up above that 15% assumption, it’s very clear much of the actual project spending – above and beyond that 15% growth line – will shift out to later years. We still believe that broadband equipment growth rates should remain attractive and durable for 4 - 6 years or more.” Source: NTIA, Jefferies Research 2027 - 2030 • Deployments must be completed within 4 years of award 2025 - 2026 • NTIA reviews and approves final proposals, awards remaining 80% of funding to States • State grant processes (one or more additional rounds) 2024 • After approval of initial proposals, NTIA awards 20% of funds to States • State challenge process (60 days before award to sub - grantees) • State grant processes • Final proposals due to NTIA within 12 months of initial proposal approval 2023 • FCC releases new broadband availability map (in response to challenges) • NTIA releases notice of funding amounts for State allocations (June) • States submit initial proposals to NTIA within 180 days of funding notices, approved on rolling basis 2022 • Notice of Funding opportunity (May) • States request initial planning funds • FCC releases initial version of broadband availability map, challenges follow Expected BEAD Funding Timeline Jefferies Research estimates broadband network installation capacity growth is ~15% / year Source: US Congress, State Governments, Benton, JD Supra, Jefferies Research

5 Financial Performance
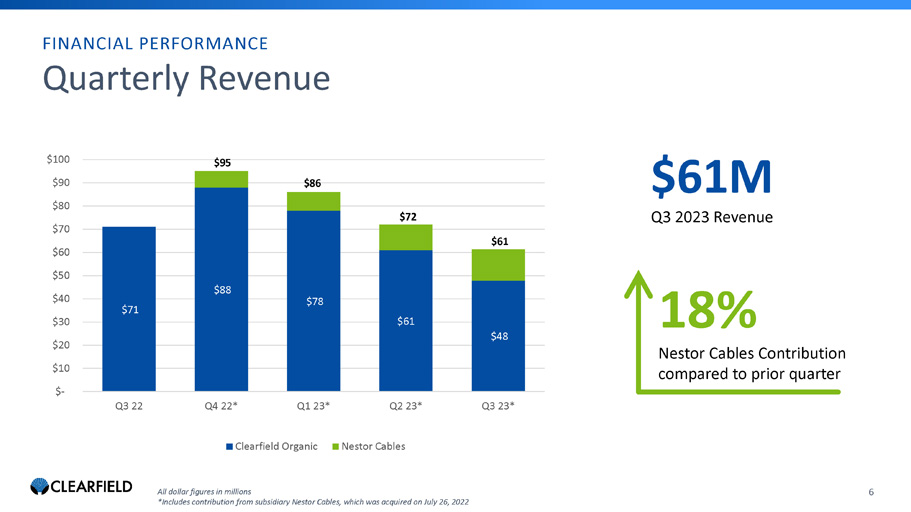
Quarterly Revenue $71 $88 $78 $61 $48 $- $10 $20 $30 $40 $50 $60 $70 $80 $90 $100 Q3 22 Q4 22* Q1 23* Q2 23* Q3 23* Clearfield Organic Nestor Cables FINANCIAL PERFORMANCE 18% Nestor Cables Contribution compared to prior quarter $ 61 M Q3 2023 Revenue 6 $95 $ 86 $72 All dollar figures in millions *Includes contribution from subsidiary Nestor Cables, which was acquired on July 26, 2022 $ 61
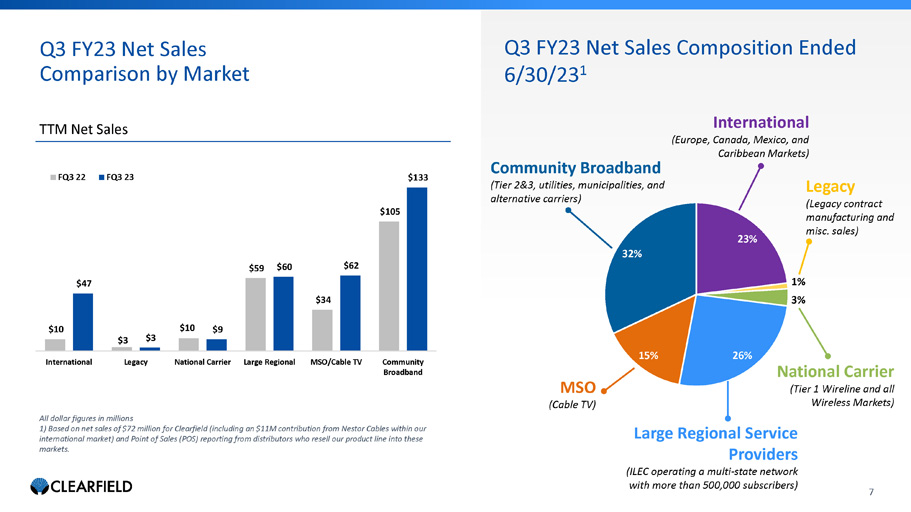
NASDAQ:CLFD $10 $3 $10 $59 $34 $105 $47 $3 $9 $60 $62 $133 International Legacy National Carrier Large Regional MSO/Cable TV Community Broadband FQ3 22 FQ3 23 Q3 FY23 Net Sales Comparison by Market TTM Net Sales All dollar figures in millions 1) Based on net sales of $72 million for Clearfield (including an $11M contribution from Nestor Cables within our international market) and Point of Sales (POS) reporting from distributors who resell our product line into these markets. Q3 FY23 Net Sales Composition Ended 6/30/23 1 Legacy (Legacy contract manufacturing and misc. sales) 23% 1% 3% 26% 15% 32% Community Broadband (Tier 2&3, utilities, municipalities, and alternative carriers) MSO (Cable TV) International (Europe, Canada, Mexico, and Caribbean Markets) 7 National Carrier (Tier 1 Wireline and all Wireless Markets) Large Regional Service Providers (ILEC operating a multi - state network with more than 500,000 subscribers)
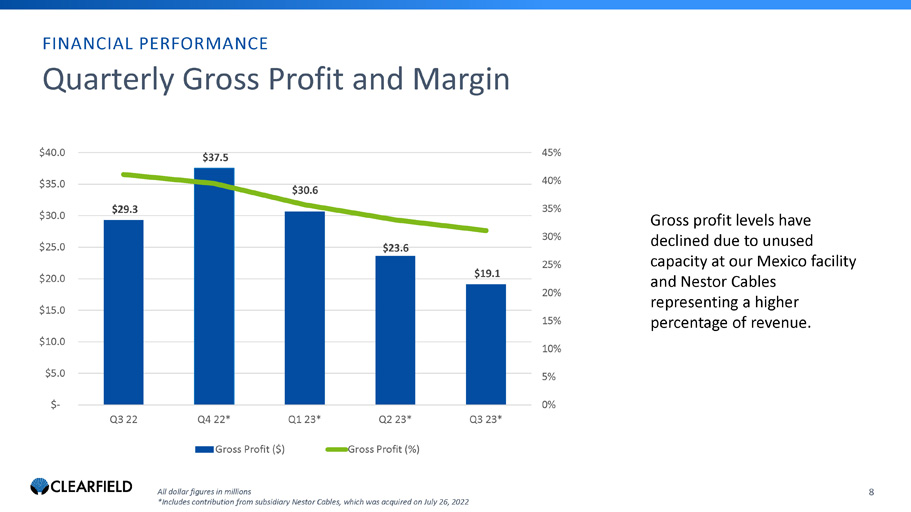
Quarterly Gross Profit and Margin $29.3 $37.5 $30.6 $23.6 $19.1 0% 5% 10% 15% 20% 25% 30% 35% 40% 45% $- $5.0 $10.0 $15.0 $20.0 $25.0 $30.0 $35.0 $40.0 Q3 22 Q4 22* Q1 23* Q2 23* Q3 23* Gross Profit ($) Gross Profit (%) FINANCIAL PERFORMANCE 8 Gross profit levels have declined due to unused capacity at our Mexico facility and Nestor Cables representing a higher percentage of revenue. All dollar figures in millions *Includes contribution from subsidiary Nestor Cables, which was acquired on July 26, 2022
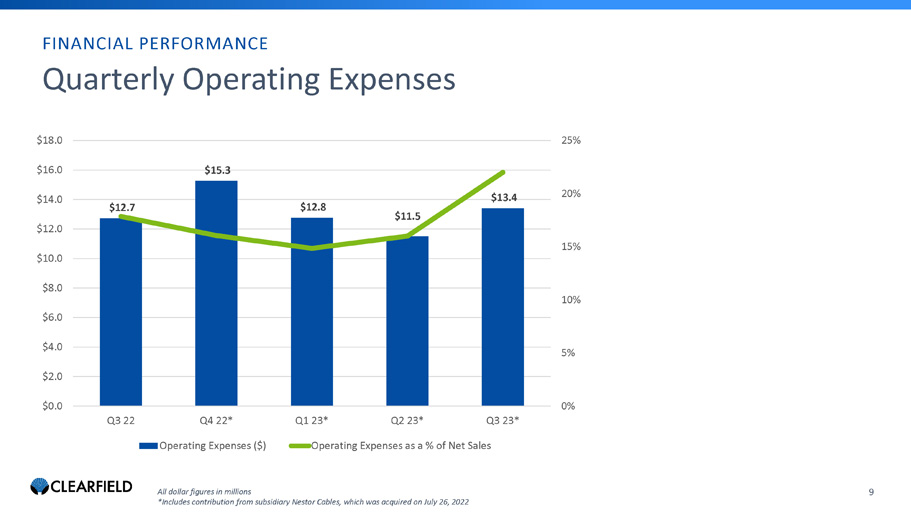
$12.7 $15.3 $12.8 $11.5 $13.4 0% 5% 10% 15% 20% 25% $0.0 $2.0 $4.0 $6.0 $8.0 $10.0 $12.0 $14.0 $16.0 $18.0 Q3 22 Q4 22* Q1 23* Q2 23* Q3 23* Operating Expenses ($) Operating Expenses as a % of Net Sales FINANCIAL PERFORMANCE 9 Quarterly Operating Expenses All dollar figures in millions *Includes contribution from subsidiary Nestor Cables, which was acquired on July 26, 2022
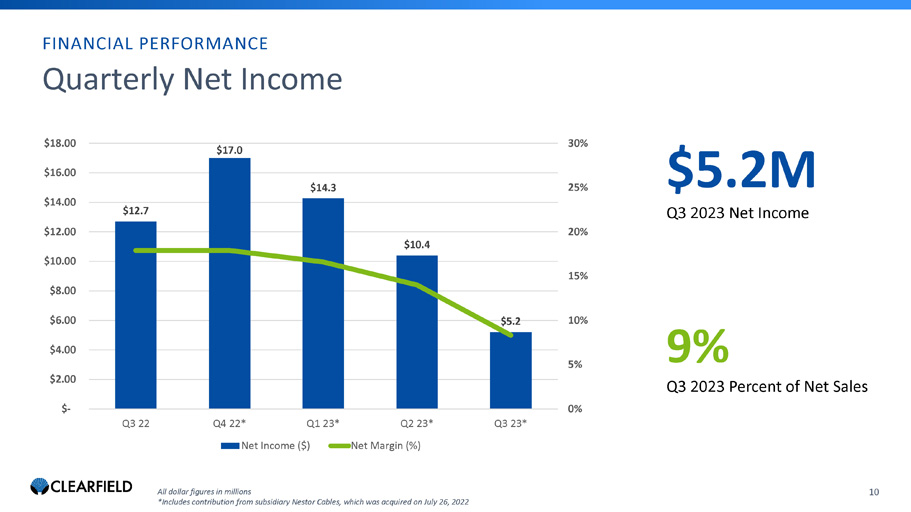
$12.7 $17.0 $14.3 $10.4 $5.2 0% 5% 10% 15% 20% 25% 30% $- $2.00 $4.00 $6.00 $8.00 $10.00 $12.00 $14.00 $16.00 $18.00 Q3 22 Q4 22* Q1 23* Q2 23* Q3 23* Net Income ($) Net Margin (%) $5 .2 M Q3 2023 Net Income 9% Q3 2023 Percent of Net Sales FINANCIAL PERFORMANCE 10 Quarterly Net Income All dollar figures in millions *Includes contribution from subsidiary Nestor Cables, which was acquired on July 26, 2022
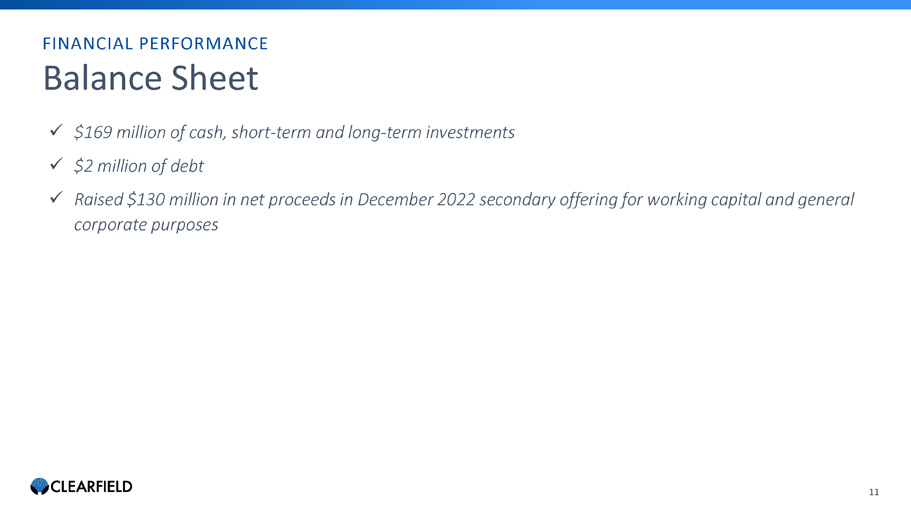
Balance Sheet FINANCIAL PERFORMANCE 11 x $169 million of cash, short - term and long - term investments x $2 million of debt x Raised $130 million in net proceeds in December 2022 secondary offering for working capital and general corporate purposes
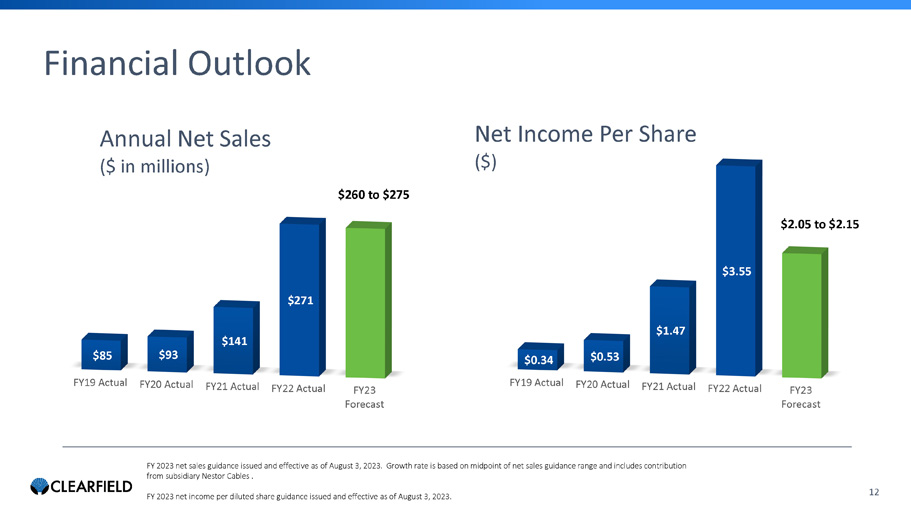
FY19 Actual FY20 Actual FY21 Actual FY22 Actual FY23 Forecast $85 $93 $141 $271 $260 to $275 NASDAQ:CLFD FY 2023 net sales guidance issued and effective as of August 3 , 2023. Growth rate is based on midpoint of net sales guidance range and includes contribution from subsidiary Nestor Cables . FY 2023 net income per diluted share guidance issued and effective as of August 3 , 2023. Annual Net Sales ($ in millions) 12 Financial Outlook $380 - $393 FY19 Actual FY20 Actual FY21 Actual FY22 Actual FY23 Forecast $0.34 $0.53 $1.47 $3.55 $2.05 to $2.15 Net Income Per Share ($)

13 Business Update
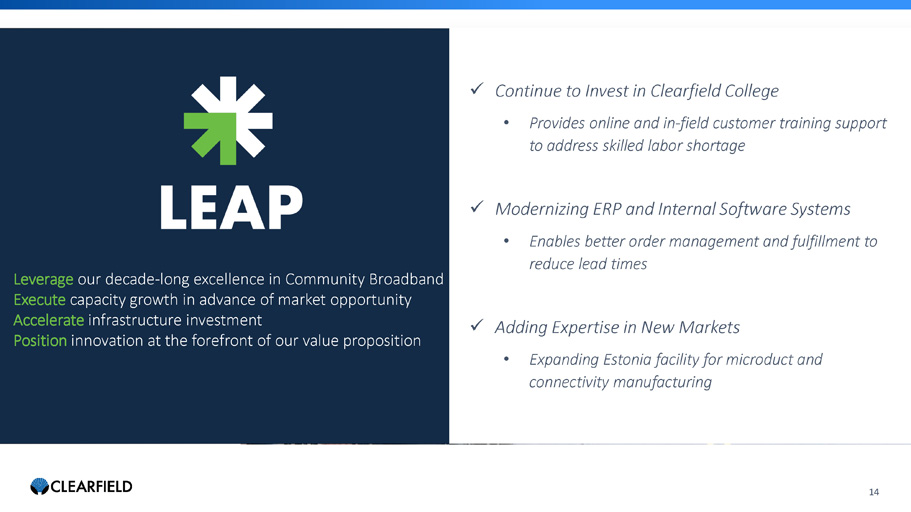
14 Leverage our decade - long excellence in Community Broadband Execute capacity growth in advance of market opportunity Accelerate infrastructure investment Position innovation at the forefront of our value proposition x Continue to Invest in Clearfield College • Provides online and in - field customer training support to address skilled labor shortage x Modernizing ERP and Internal Software Systems • Enables better order management and fulfillment to reduce lead times x Adding Expertise in New Markets • Expanding Estonia facility for microduct and connectivity manufacturing

Cheri Beranek PRESIDENT & CEO Dan Herzog CHIEF FINANCIAL OFFICER Q&A 15 Kevin Morgan CHIEF MARKETING OFFICER
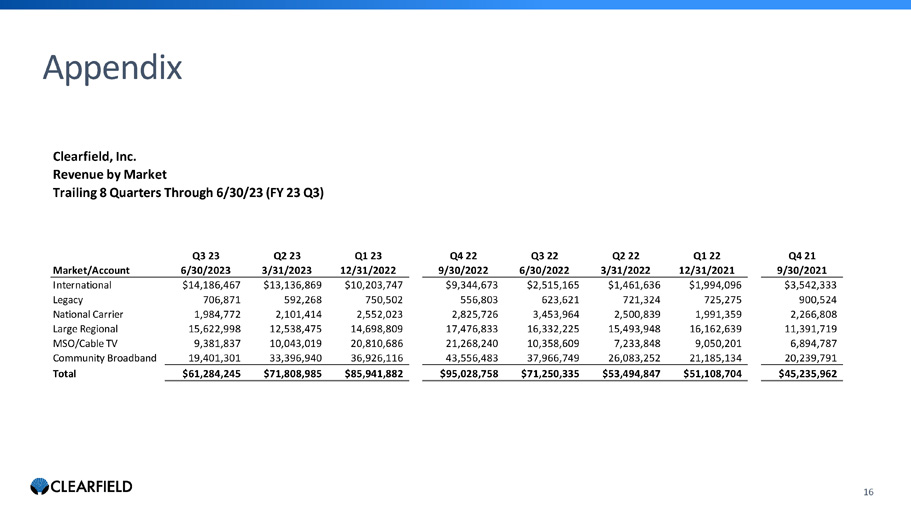
NASDAQ:CLFD 16 Appendix Clearfield, Inc. Revenue by Market Trailing 8 Quarters Through 6/30/23 (FY 23 Q3) Market/Account Q3 23 6/30/2023 Q2 23 3/31/2023 Q1 23 12/31/2022 Q4 22 9/30/2022 Q3 22 6/30/2022 Q2 22 3/31/2022 Q1 22 12/31/2021 Q4 21 9/30/2021 International $14,186,467 $13,136,869 $10,203,747 $9,344,673 $2,515,165 $1,461,636 $1,994,096 $3,542,333 Legacy 706,871 592,268 750,502 556,803 623,621 721,324 725,275 900,524 National Carrier 1,984,772 2,101,414 2,552,023 2,825,726 3,453,964 2,500,839 1,991,359 2,266,808 Large Regional 15,622,998 12,538,475 14,698,809 17,476,833 16,332,225 15,493,948 16,162,639 11,391,719 MSO/Cable TV 9,381,837 10,043,019 20,810,686 21,268,240 10,358,609 7,233,848 9,050,201 6,894,787 Community Broadband 19,401,301 33,396,940 36,926,116 43,556,483 37,966,749 26,083,252 21,185,134 20,239,791 Total $61,284,245 $71,808,985 $85,941,882 $95,028,758 $71,250,335 $53,494,847 $51,108,704 $45,235,962

17 Contact Us COMPANY CONTACT: Cheri Beranek President & CEO Clearfield, Inc. IR@seeclearfield.com INVESTOR RELATIONS: The Blueshirt Group Greg McNiff T: 773 - 485 - 7191 clearfield@blueshirtgroup.com