UNITED STATES
SECURITIES AND EXCHANGE COMMISSION
Washington, D.C. 20549
FORM
CURRENT REPORT
Pursuant to Section 13 or 15(d) of the
Securities Exchange Act of 1934
Date of Report (Date of earliest event reported):
(Exact name of registrant as specified in its charter)
|
| |||
(State or other jurisdiction |
| (Commission |
| (IRS Employer |
| ||
(Address of principal executive offices) |
| (Zip Code) |
(
(Registrant’s telephone number, including area code)
Not Applicable
(Former Name or Former Address, if changed since last report)
Check the appropriate box below if the Form 8-K filing is intended to simultaneously satisfy the filing obligation of the registrant under any of the following provisions:
Written communications pursuant to Rule 425 under the Securities Act (17 CFR 230.425) |
Soliciting material pursuant to Rule 14a-12 under the Exchange Act (17 CFR 240.14a-12) |
Pre-commencement communications pursuant to Rule 14d-2(b) under the Exchange Act (17 CFR 240.14d-2(b)) |
Pre-commencement communications pursuant to Rule 13e-4(c) under the Exchange Act (17 CFR 240.13e-4(c)) |
Securities registered pursuant to Section 12(b) of the Act:
Title of Each Class | Trading Symbol(s) | Name of Each Exchange on Which |
|
Indicate by check mark whether the registrant is an emerging growth company as defined in Rule 405 of the Securities Act of 1933 (§ 230.405 of this chapter) or Rule 12b-2 of the Securities Exchange Act of 1934 (§ 240.12b-2 of this chapter).
Emerging growth company
If an emerging growth company, indicate by check mark if the registrant has elected not to use the extended transition period for complying with any new or revised financial accounting standards provided pursuant to Section 13(a) of the Exchange Act. ☐
Item 2.02. Results of Operations and Financial Condition.
On May 9, 2023, WhiteHorse Finance, Inc. (the “Company”) issued a press release announcing a quarterly distribution and its financial results for the quarter ended March 31, 2023. A copy of the press release is furnished as Exhibit 99.1 to this Current Report on Form 8-K and is incorporated herein by reference.
The information in Item 2.02 of this Current Report on Form 8-K, including Exhibit 99.1 furnished herewith, is being furnished and shall not be deemed “filed” for any purpose of Section 18 of the Securities Exchange Act of 1934, as amended (the “Exchange Act”), or otherwise subject to the liabilities of such Section. The information in Item 2.02 of this Current Report on Form 8-K, including Exhibit 99.1 furnished herewith, shall not be deemed to be incorporated by reference into any filing under the Securities Act of 1933, as amended (the “Securities Act”), or the Exchange Act, except as shall be expressly set forth by specific reference in such filing.
Item 7.01. Regulation FD Disclosure.
A copy of an earnings presentation that is intended to be used by representatives of the Company is furnished as Exhibit 99.2 to this Current Report on Form 8-K and is incorporated herein by reference.
The information in Item 7.01 of this Current Report on Form 8-K, including Exhibit 99.2 furnished herewith, is being furnished and shall not be deemed “filed” for any purpose of Section 18 of the Exchange Act, or otherwise subject to the liabilities of such Section. The information in Item 7.01 of this Current Report on Form 8-K, including Exhibit 99.2 furnished herewith, shall not be deemed to be incorporated by reference into any filing under the Securities Act or the Exchange Act, except as shall be expressly set forth by specific reference in such filing.
Forward-Looking Statements
This Current Report on Form 8-K may contain “forward-looking statements” within the meaning of the Private Securities Litigation Reform Act of 1995. Statements other than statements of historical facts included in this Current Report on Form 8-K may constitute forward-looking statements and are not guarantees of future performance or results and involve a number of risks and uncertainties. Actual results may differ materially from those in the forward-looking statements as a result of a number of factors, including those described from time to time in filings with the Securities and Exchange Commission. The Company undertakes no duty to update any forward-looking statement made herein. All forward-looking statements speak only as of the date of this Current Report on Form 8-K.
Item 9.01. Financial Statements and Exhibits
(d) Exhibits
99.1 | Press Release of WhiteHorse Finance, Inc. dated May 9, 2023. | |||
|
| |||
99.2 | ||||
104 | Cover Page Interactive Data File (embedded within the Inline XBRL document) | |||
SIGNATURE
Pursuant to the requirements of the Securities Exchange Act of 1934, the registrant has duly caused this report to be signed on its behalf by the undersigned hereunto duly authorized.
Dated: May 9, 2023 | WHITEHORSE FINANCE, INC. | |
|
|
|
| By: | /s/ Joyson C. Thomas |
|
| Joyson C. Thomas |
|
| Chief Financial Officer |
Exhibit 99.1

WhiteHorse Finance, Inc. Announces First Quarter 2023 Earnings Results and Increases Quarterly Distribution to $0.37 Per Share and Introduces Quarterly Variable Supplemental Dividend Policy
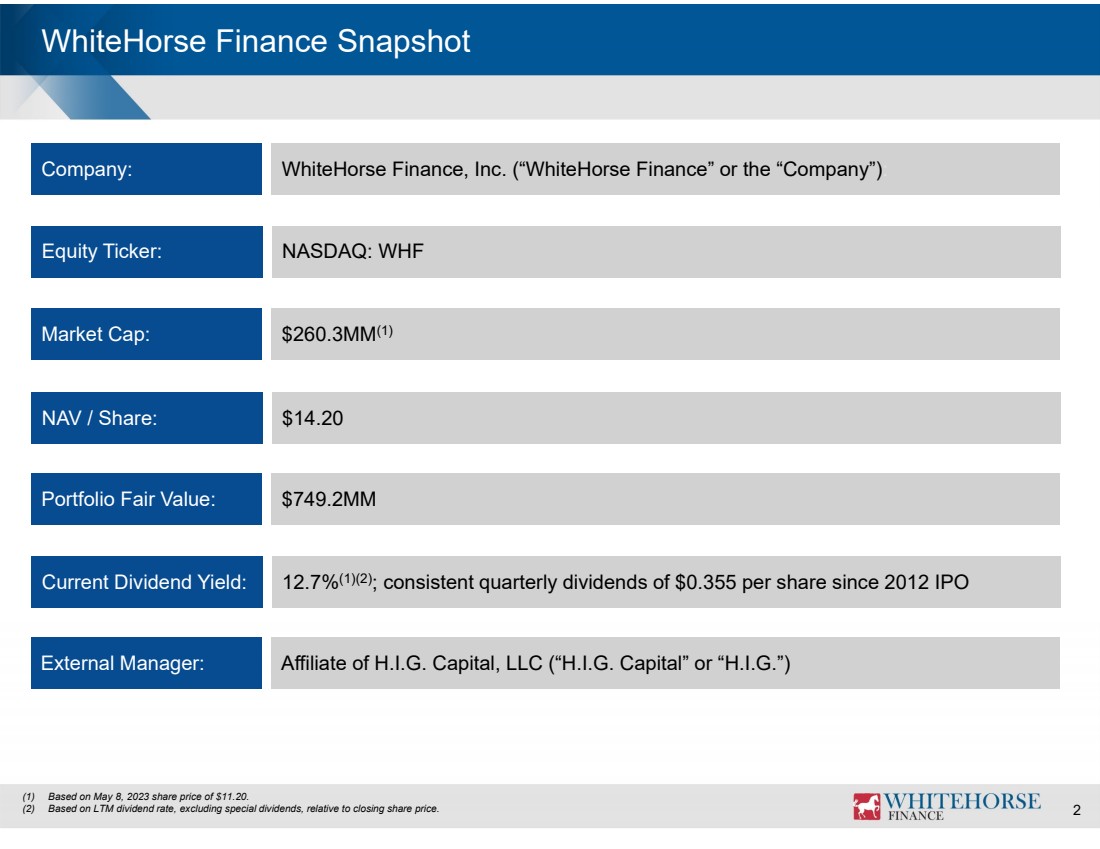
NEW YORK, May 9, 2023 /PRNewswire/ -- WhiteHorse Finance, Inc. (“WhiteHorse Finance” or the “Company”) (Nasdaq: WHF) today announced its financial results for the quarter ended March 31, 2023. In addition, the Company’s board of directors has declared a distribution of $0.37 per share with respect to the quarter ending March 31, 2023. The distribution will be payable on July 5, 2023 to stockholders of record as of June 21, 2023. Going forward, in addition to a quarterly base distribution of $0.37 per share, the Company’s board of directors expects to also declare, when applicable, a formula-based quarterly variable supplemental dividend in an amount to be determined each quarter.
First Quarter 2023 Summary Highlights
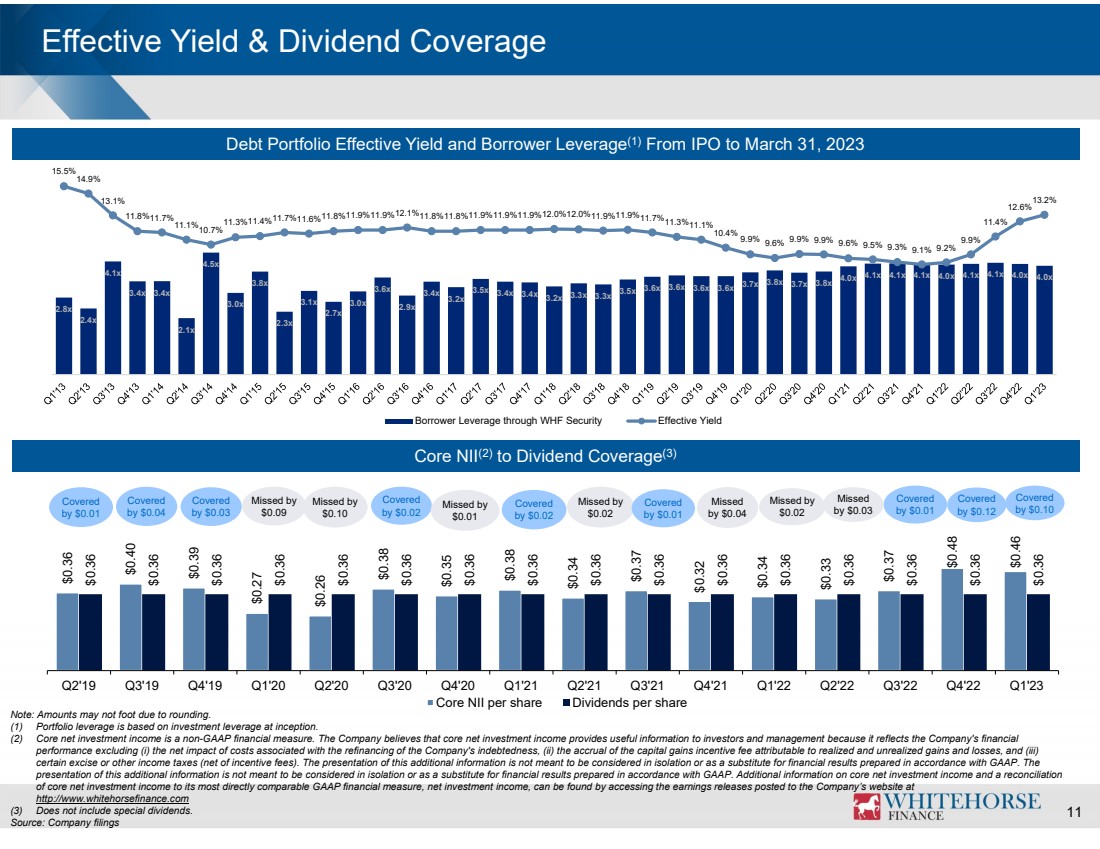
Stuart Aronson, WhiteHorse Finance’s Chief Executive Officer, commented, “I am pleased to report WhiteHorse recorded another strong quarter with core net investment income well above our dividend. Given the increase in base rates and the corresponding increase in our portfolio’s earning power, the Company’s board of directors has elected to increase the BDC’s regular dividend to $0.37 per share and to also introduce a variable supplemental dividend. This new dividend policy will allow WhiteHorse Finance to maximize distributions to shareholders while preserving the stability of our Net Asset Value, a factor we believe to be an important driver of shareholder economics over time. Barring circumstances that are currently unforeseen, management is confident in the ability to reliably earn the revised dividend on an annual basis. While some assets were marked down during the quarter, we have always underwritten at very conservative levels and factored in downside scenarios. As demonstrated by our successful exit from a formerly troubled asset subsequent to the end of the quarter, we are also well-positioned to help troubled credits navigate challenging market environments with the support of our sponsor, H.I.G. Capital, and its restructuring and private equity expertise. The current market environment continues to offer exceptionally attractive terms, and we are being cautious in the face of a weakening economy and remain focused on credits with compelling risk return characteristics. WhiteHorse is equipped to take advantage of the current lender friendly market conditions as our pipeline activity remains high, and our three-tier architecture continues to provide the BDC differentiated sourcing capabilities. The strength of the pipeline enables us to be highly selective, giving us confidence in the BDC’s ability to consistently generate sustainable earnings to cover our increased regular dividend and maximize shareholder returns through incremental dividends.”
Portfolio and Investment Activity
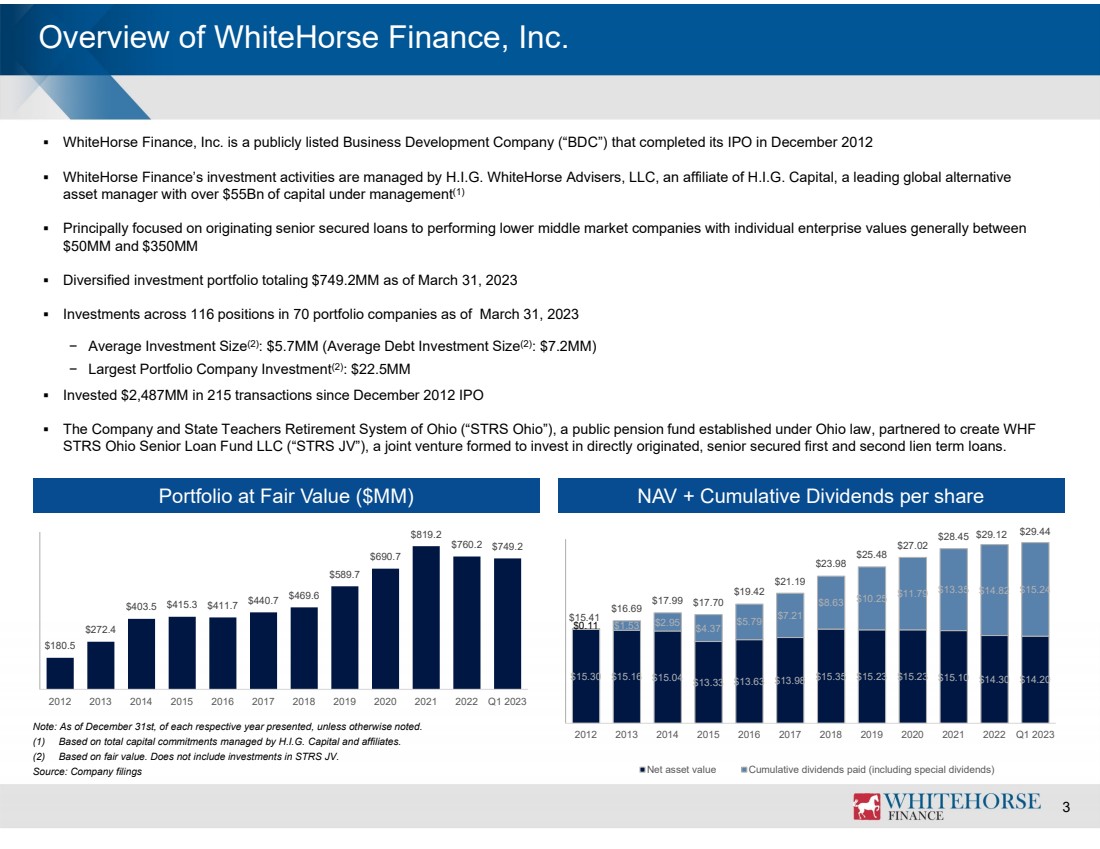
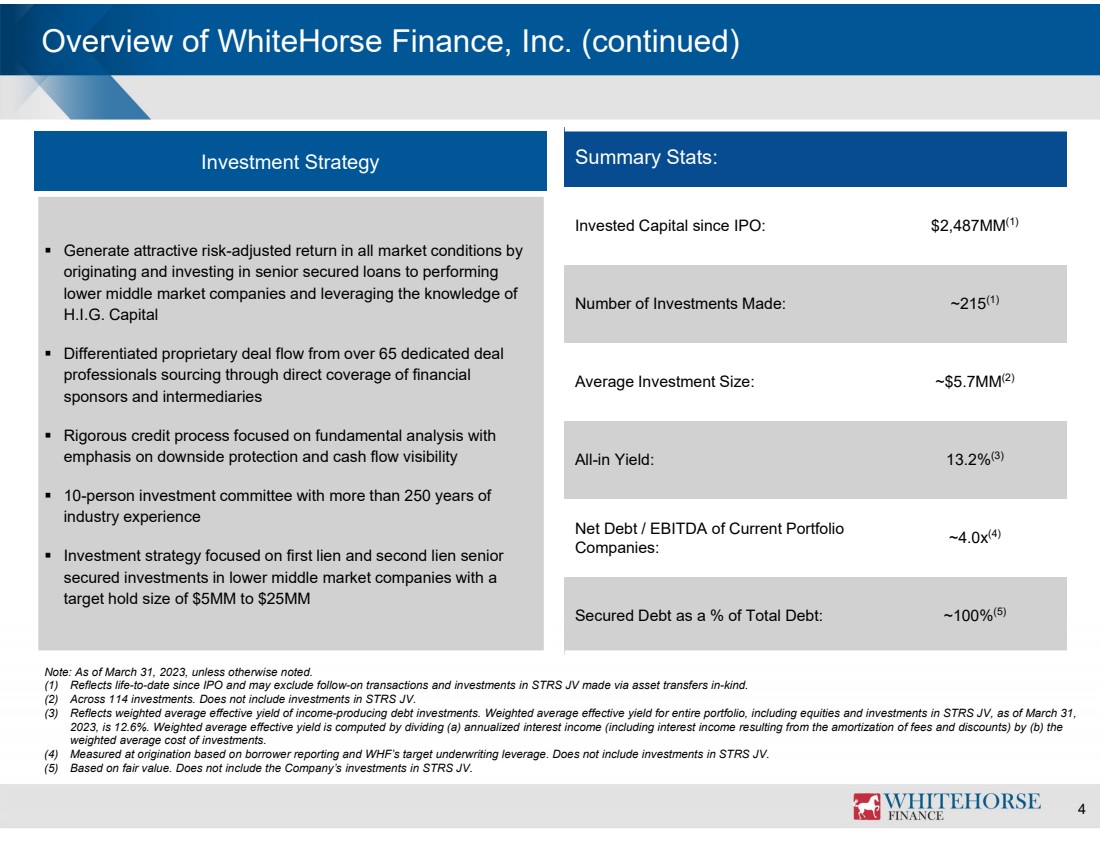
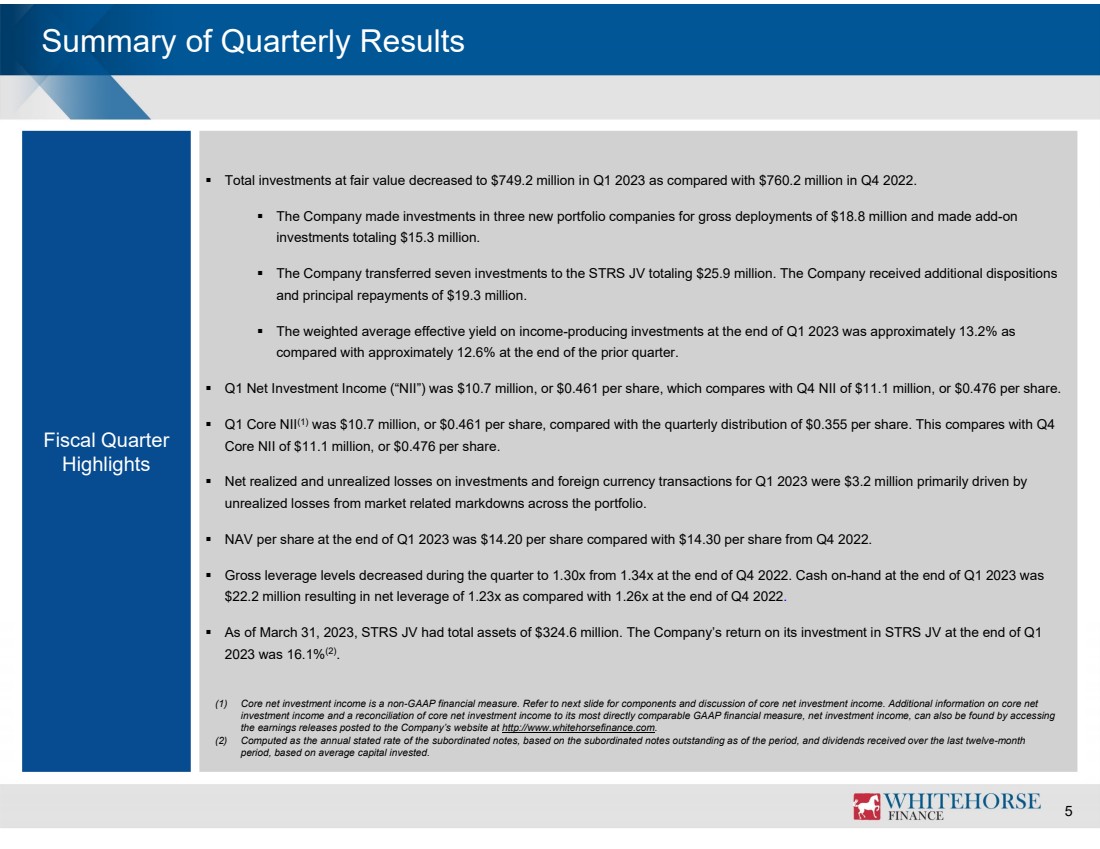
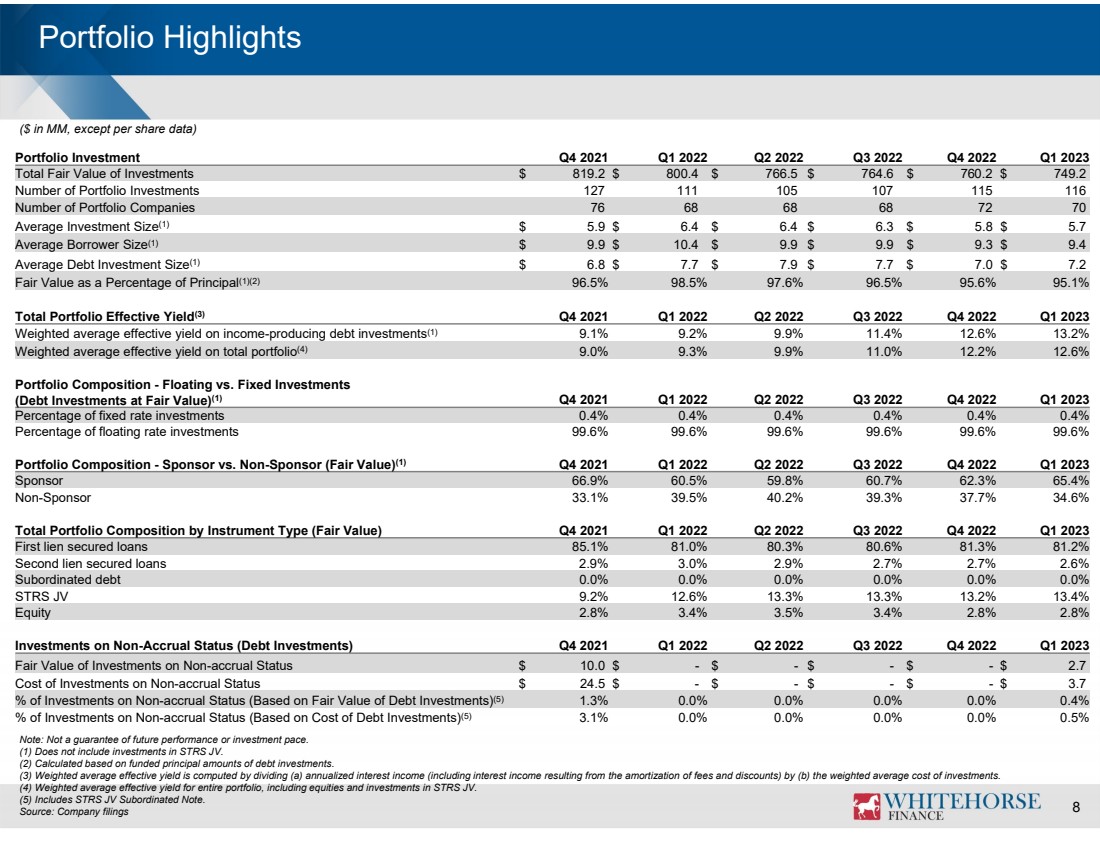
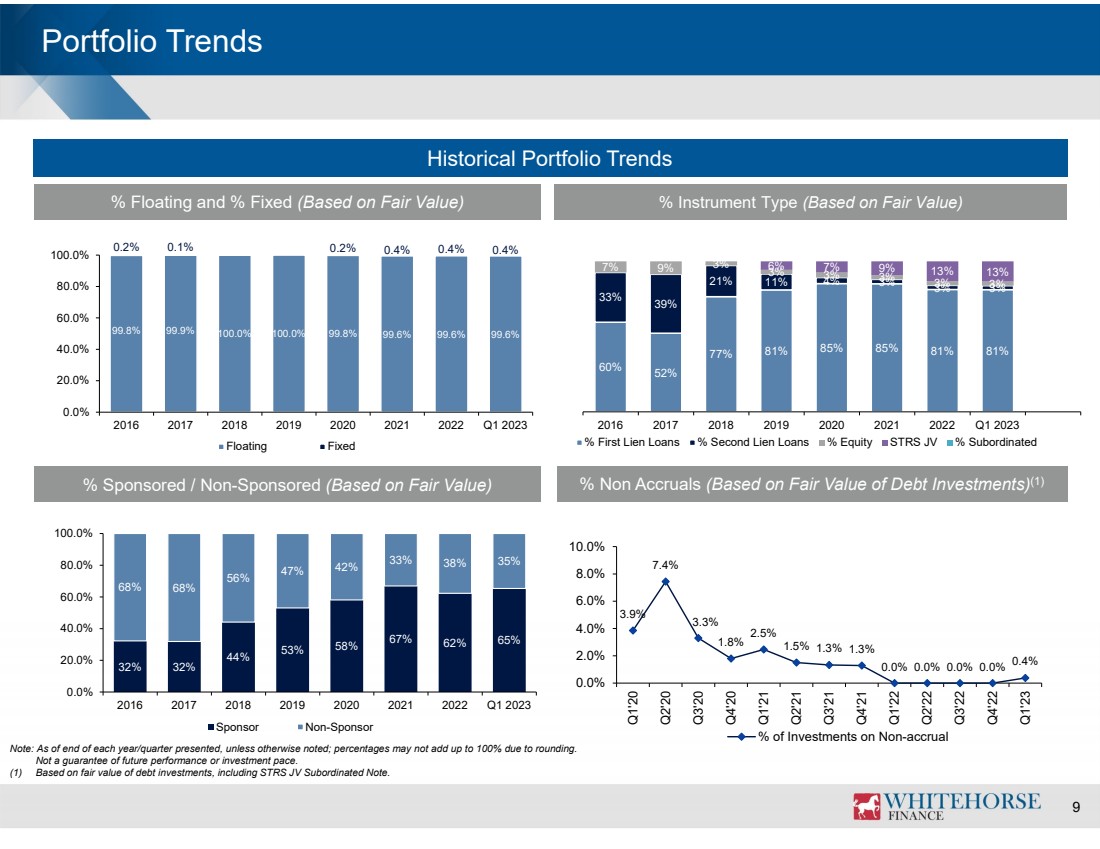
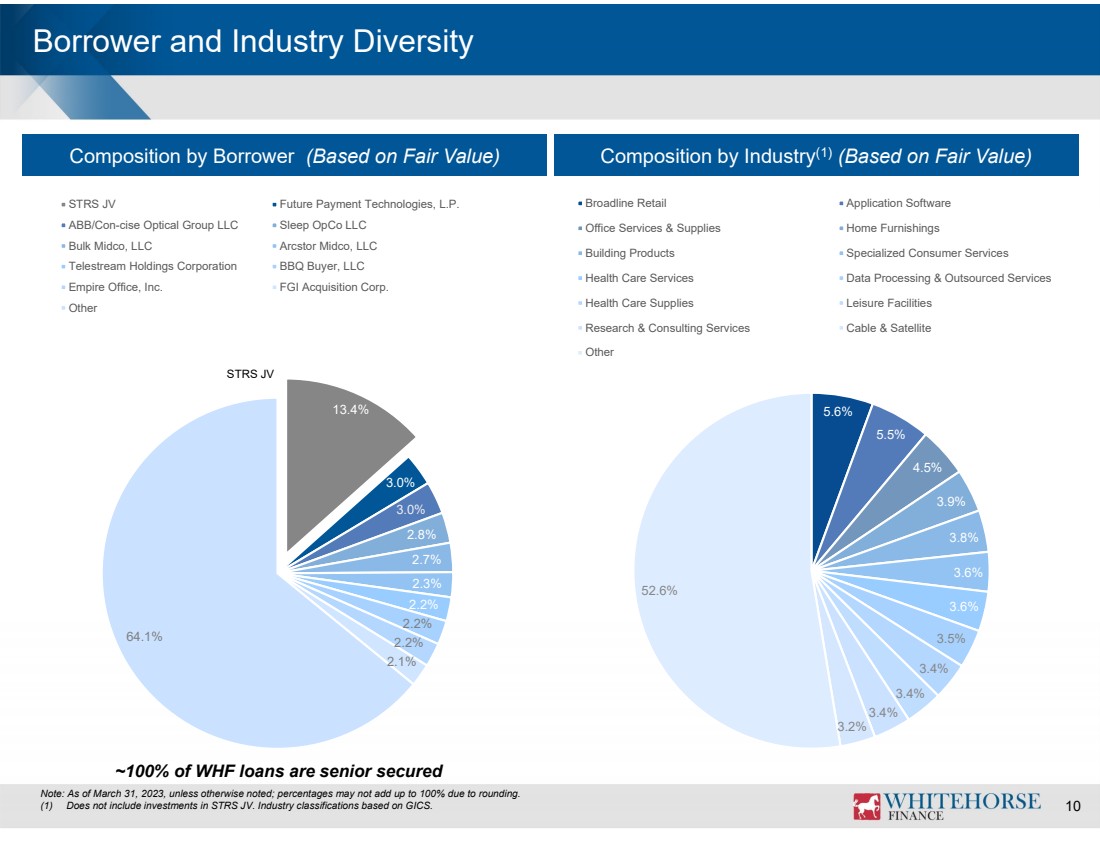
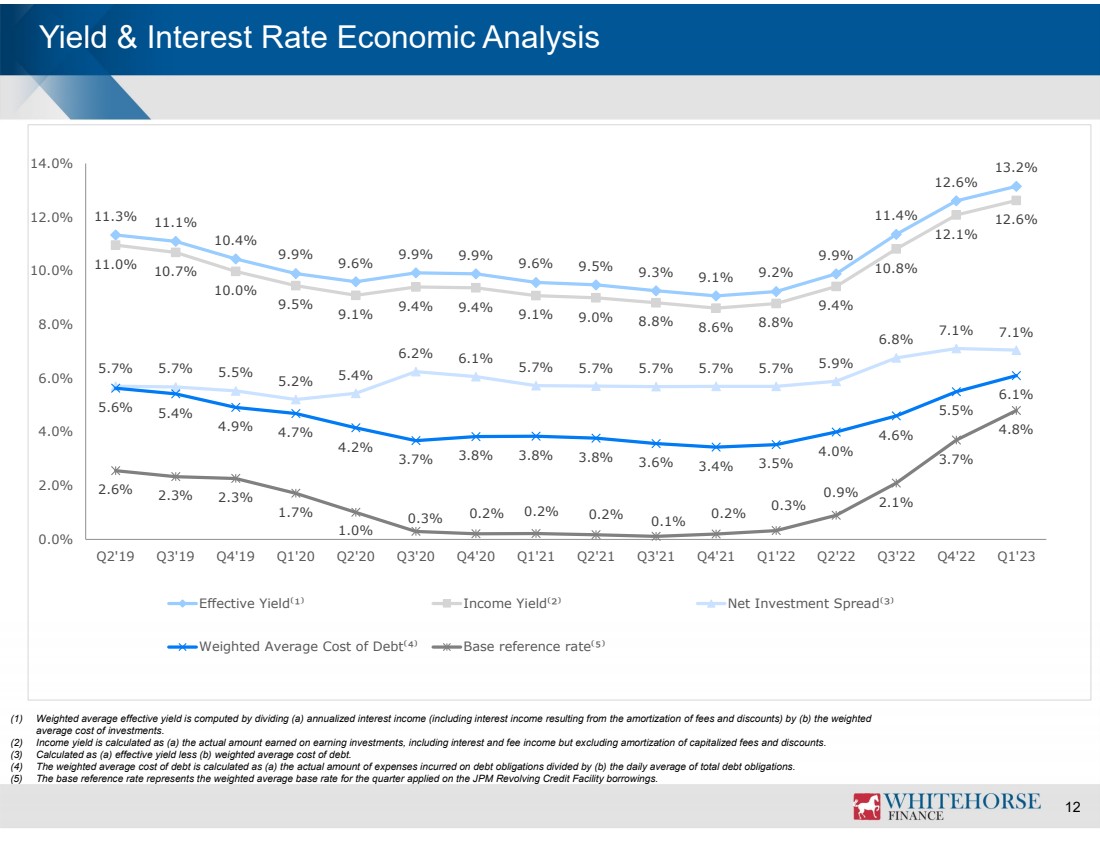
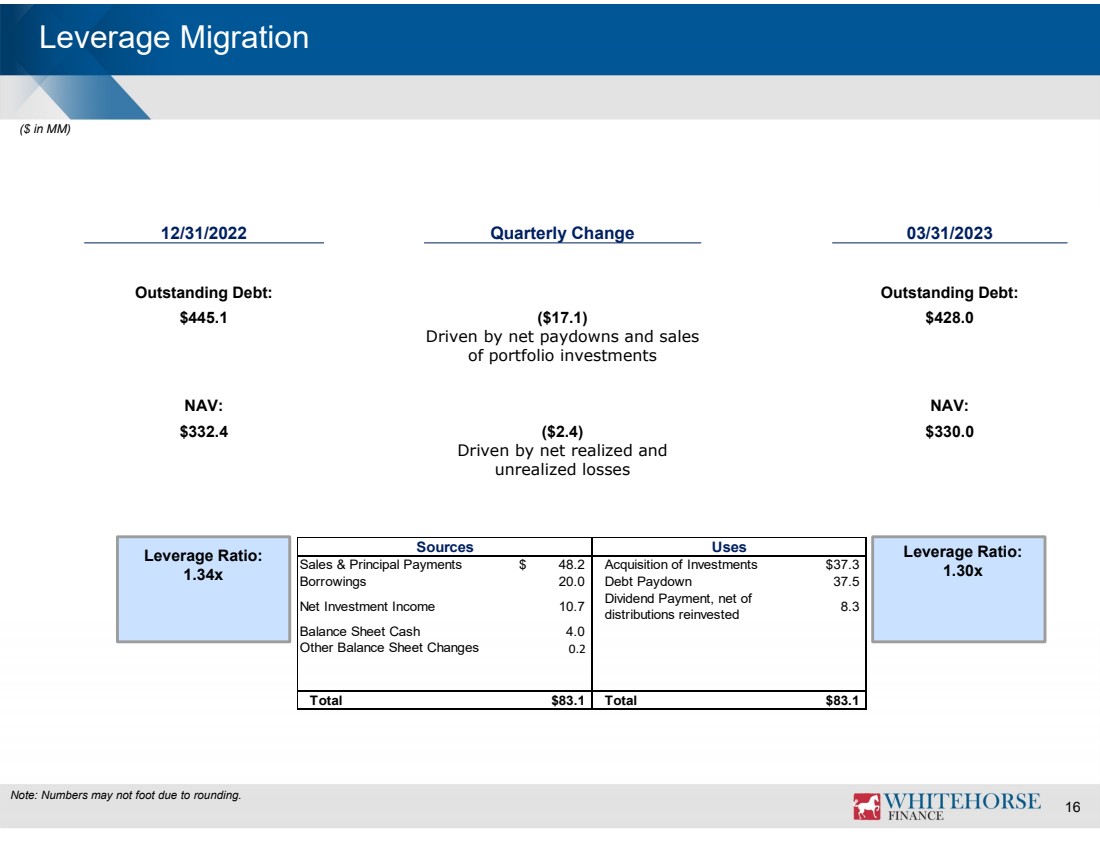
As of March 31, 2023, the fair value of WhiteHorse Finance’s investment portfolio was $749.2 million, compared with $760.2 million as of December 31, 2022. The portfolio as of March 31, 2023 consisted of 116 positions across 70 companies with a weighted average effective yield of 13.2% on income-producing debt investments. The average debt investment size (excluding investments in STRS JV (as defined below)) was $7.2 million with the overall portfolio comprised of approximately 81.2% first lien secured loans, 2.6% second lien secured loans, 2.8% equity and 13.4% in investments in STRS JV. Almost all loans were variable rate investments (primarily indexed to the London Interbank Offered Rate or Secured Overnight Financing Rate) with fixed rate securities representing only 0.4% of loans at fair value. Nearly all performing floating rate investments have interest rate floors.
During the three months ended March 31, 2023, WhiteHorse Finance made investments in three new portfolio companies for a total of $18.8 million, added a total of $15.3 million to existing portfolio companies, and made net fundings of $0.7 million to revolver loans. Proceeds from sales and repayments totaled approximately $19.3 million for the three months ended March 31, 2023, driven by one full realization in True Blue Car Wash, LLC.
In addition to the transactions discussed above, during the three months ended March 31, 2023, WhiteHorse Finance transferred assets comprised of three new portfolio companies and four add-on investments, totaling $25.9 million to STRS JV in exchange for cash proceeds.
WHF STRS Ohio Senior Loan Fund LLC
As of March 31, 2023, STRS JV’s portfolio totaled $308.9 million, consisted of 30 portfolio companies and had a weighted average effective yield of 11.8% on its portfolio.
Results of Operations
For the three months ended March 31, 2023, the Company’s net investment income was approximately $10.7 million, compared with approximately $8.5 million for the same period in the prior year, representing an increase of approximately 25.9%. The increase in net investment income for the year-over-year period was primarily attributable to higher investment income from interest income and STRS JV due to an increase in base rates. This was partially offset by an increase in interest expense, due to higher base rates, and higher incentive fee due to higher pre-incentive fee net investment income in the current period, slightly offset by a reversal of capital gains incentive fee accrual for the three months ended March 31, 2022. For the three months ended March 31, 2023, the Company’s investment in STRS JV generated an annualized, gross investment yield of approximately 16.1%.
For the three months ended March 31, 2023, core net investment income(3) was $10.7 million, or $0.461 per share, compared with $7.9 million, or $0.344 per share for the same period in the prior year.
For the three months ended March 31, 2023, WhiteHorse Finance reported a net realized and unrealized loss on investments and foreign currency transactions of $3.2 million. This compares with the three months ended March 31, 2021 net realized and unrealized loss on investments and foreign currency transactions of $2.8 million. The decrease for the year-over-year period was primarily attributable to markdowns on the portfolio in the current quarter.
WhiteHorse Finance reported a net increase in net assets resulting from operations of approximately $7.5 million for the three months ended March 31, 2023, which compares with a net increase of $5.7 million for the three months ended March 31, 2022.
WhiteHorse Finance’s net asset value was $330.0 million, or $14.20 per share, as of March 31, 2023, compared with $332.4 million, or $14.30 per share, as of December 31, 2022.
Liquidity and Capital Resources
As of March 31, 2023, WhiteHorse Finance had cash and cash equivalents of $22.2 million, compared with $26.3 million as of December 31, 2022, inclusive of restricted cash. As of March 31, 2023, the Company also had $97.0 million of undrawn capacity under its revolving credit facility.
Distributions
The Company's board of directors has declared a distribution of $0.37 per share with respect to the quarter ending March 31, 2023. The distributions will be payable on July 5, 2023 to stockholders of record as of June 21, 2023. Going forward, in addition to a quarterly base distribution of $0.37 per share, the Company’s board of directors expects to also declare, when applicable, a formula-based quarterly variable supplemental dividend in an amount to be determined each quarter.
On March 2, 2023, the Company declared a distribution of $0.355 per share for the quarter ended March 31, 2023, consistent with distributions declared for the forty-second consecutive quarter since the Company’s initial public offering. Additionally, on March 2, 2023, a special distribution of $0.07 per share was declared for the quarter ended March 31, 2023. These distributions were paid on March 24, 2023 to stockholders of record as of April 4, 2023.
Distributions are paid from taxable earnings and may include return of capital and/or capital gains. The specific tax characteristics of the distributions will be reported to stockholders on Form 1099-DIV after the end of the calendar year and in the Company’s periodic reports filed with the Securities and Exchange Commission.
Conference Call
WhiteHorse Finance will host a conference call to discuss its first quarter results for the period ended March 31, 2023 at 1:00 p.m. ET on Tuesday, March 9, 2023. To access the teleconference, please dial 800-274-8461 (domestic and international) approximately 10 minutes before the teleconference’s scheduled start time and reference ID #WHFQ123. Investors may also access the call on the investor relations portion of the Company’s website www.whitehorsefinance.com.
If you are unable to access the live teleconference, a replay will be available beginning approximately two hours after the call’s completion through March 16, 2023. The teleconference replay can be accessed by dialing 800-938-1602 (domestic and international). A webcast replay will also be available on the investor relations portion of the Company’s website at www.whitehorsefinance.com.
About WhiteHorse Finance, Inc.
WhiteHorse Finance is a business development company that originates and invests in loans to privately held, lower middle market companies across a broad range of industries. The Company’s investment activities are managed by H.I.G. WhiteHorse Advisers, LLC, an affiliate of H.I.G. Capital, LLC, (“H.I.G. Capital”). H.I.G. Capital is a leading global alternative asset manager with $55 billion of capital under management(4) across a number of funds focused on the small and mid-cap markets. For more information about H.I.G. Capital, please visit http://www.higcapital.com. For more information about the Company, please visit http://www.whitehorsefinance.com.
Forward-Looking Statements
This press release may contain “forward-looking statements” within the meaning of the Private Securities Litigation Reform Act of 1995. Statements other than statements of historical facts included in this press release may constitute forward-looking statements and are not guarantees of future performance or results and involve a number of risks and uncertainties. Actual results may differ materially from those in the forward-looking statements as a result of a number of factors, including those described from time to time in filings with the Securities and Exchange Commission. The Company undertakes no duty to update any forward-looking statement made herein. All forward-looking statements speak only as of the date of this press release.
(1) Includes investments in WHF STRS Ohio Senior Loan Fund LLC (“STRS JV”), an unconsolidated joint venture, totaling $100.3 million, at fair value.
(2) Excludes investments made in STRS JV.
(3) “Core net investment income” is a non-GAAP financial measure. The Company believes that core net investment income provides useful information to investors and management because it reflects the Company’s financial performance excluding (i) the net impact of costs associated with the refinancing of the Company’s indebtedness, (ii) the accrual of the capital gains incentive fee attributable to net realized and unrealized gains and losses, and (iii) excise and other income taxes related to such net realized gains and losses (net of incentive fees). The presentation of this additional information is not meant to be considered in isolation or as a substitute for financial results prepared in accordance with GAAP. Additional information on core net investment income and a reconciliation of core net investment income to its most directly comparable GAAP financial measure, net investment income, are set forth in Schedule 1 hereto.
(4) Based on total capital commitments managed by H.I.G. Capital and affiliates.
SCHEDULE 1
As a supplement to GAAP financial measures, the Company has provided information relating to core net investment income, which is a non-GAAP measure. This measure is provided in addition to, but not as a substitute for, net investment income determined in accordance with GAAP. The Company’s non-GAAP measures may differ from similar measures by other companies, even if similar terms are used to identify such measures. Core net investment income represents net investment income adjusted to exclude the net impact of costs associated with the refinancing of the Company’s indebtedness, the accrual of the capital gains incentive fee attributable to net realized and unrealized gains and losses, and excise or other income taxes related to such net realized gains and losses (net of incentive fees). There were no excise or other income taxes related to net realized gains and losses for the quarters ended March 31, 2023 and March 31, 2022.
The following table provides a reconciliation of net investment income to core net investment income for the three months ended March 31, 2023 and March 31, 2022 (in thousands, except per share data):
| | March 31, 2023 | | | March 31, 2022 | | ||||||||||
| | Amount | | | Per Share | | | Amount | | | Per Share | | ||||
| | | | | | Amounts | | | | | | | Amounts | | ||
Net investment income | | $ | 10,704 | | | $ | 0.461 | | | $ | 8,539 | | | $ | 0.368 | |
Net impact of costs associated with refinancing of indebtedness | | | - | | | | - | | | | - | | | | - | |
Accrual for capital gains incentive fee | | | - | | | | - | | | | (566) | | | | (0.024) | |
Net impact of excise tax expense related to net realized gains and losses | | | - | | | | - | | | | - | | | | - | |
Core net investment income | | $ | 10,704 | | | $ | 0.461 | | | $ | 7,973 | | | $ | 0.344 | |
WhiteHorse Finance, Inc.
Consolidated Statements of Assets and Liabilities
(in thousands, except share and per share data)
|
| | March 31, 2023 |
| | December 31, 2022 |
| | | (Unaudited) | | | |
Assets |
| | |
| |
|
Investments, at fair value |
| |
|
| |
|
Non-controlled/non-affiliate company investments | | $ | 623,927 | | $ | 650,535 |
Non-controlled affiliate company investments | | | 12,098 | | | 9,533 |
Controlled affiliate company investments | | | 113,198 | | | 100,160 |
Total investments, at fair value (amortized cost $774,944 and $782,429, respectively) | | | 749,223 | | | 760,228 |
Cash and cash equivalents | | | 11,748 | | | 9,508 |
Restricted cash and cash equivalents | | | 9,921 | | | 14,683 |
Restricted foreign currency (cost of $583 and $2,066, respectively) | | | 579 | | | 2,073 |
Interest and dividend receivable | | | 7,501 | | | 7,814 |
Amounts receivable on unsettled investment transactions | | | 343 | | | 283 |
Escrow receivable | | | 711 | | | 711 |
Prepaid expenses and other receivables | | | 989 | | | 1,174 |
Unrealized appreciation on foreign currency forward contracts | | | 3 | | | — |
Total assets | | $ | 781,018 | | $ | 796,474 |
| | | | | | |
Liabilities | | |
| | |
|
Debt (net of unamortized debt issuance costs of $4,327 and $4,718, respectively) | | $ | 423,663 | | $ | 440,427 |
Distributions payable | | | 9,878 | | | 8,251 |
Management fees payable | | | 3,711 | | | 3,860 |
Incentive fees payable | | | 7,603 | | | 5,618 |
Interest payable | | | 4,085 | | | 2,774 |
Accounts payable and accrued expenses | | | 1,400 | | | 2,329 |
Advances received from unfunded credit facilities | | | 663 | | | 825 |
Unrealized depreciation on foreign currency forward contracts | | | — | | | 3 |
Total liabilities | | | 451,003 | | | 464,087 |
| | | | | | |
Commitments and contingencies | | |
| | |
|
| | | | | | |
Net assets | | |
| | |
|
Common stock, 23,243,088 and 23,243,088 shares issued and outstanding, par value $0.001 per share, respectively, and 100,000,000 shares authorized | | | 23 | | | 23 |
Paid-in capital in excess of par | | | 339,240 | | | 339,240 |
Accumulated earnings (losses) | | | (9,248) | | | (6,876) |
Total net assets | | | 330,015 | | | 332,387 |
Total liabilities and total net assets | | $ | 781,018 | | $ | 796,474 |
Number of shares outstanding | | | 23,243,088 | | | 23,243,088 |
Net asset value per share | | $ | 14.20 | | $ | 14.30 |
| | | | | | |
WhiteHorse Finance, Inc.
Consolidated Statements of Operations (Unaudited)
(in thousands, except share and per share data)
| | | Three months ended March 31, | |||
|
| | 2023 | | | 2022 |
Investment income | | | | | | |
From non-controlled/non-affiliate company investments |
| |
|
| |
|
Interest income | | $ | 19,621 | | $ | 16,209 |
Payment-in-kind income | | | 1,232 | | | 532 |
Fee income | | | 1,033 | | | 462 |
Dividend income | | | 15 | | | 89 |
From non-controlled affiliate company investments | | | | | | |
Interest income | | | — | | | 10 |
Payment-in-kind income | | | (49) | | | 50 |
Dividend income | | | 84 | | | 131 |
From controlled affiliate company investments | | | | | | |
Interest income | | | 2,210 | | | 1,127 |
Payment-in-kind income | | | 412 | | | — |
Dividend income | | | 1,606 | | | 1,424 |
Total investment income | | | 26,164 | | | 20,034 |
Expenses | | |
| | |
|
Interest expense | | | 7,525 | | | 4,774 |
Base management fees | | | 3,711 | | | 3,952 |
Performance-based incentive fees | | | 2,676 | | | 1,427 |
Administrative service fees | | | 171 | | | 171 |
General and administrative expenses | | | 1,127 | | | 947 |
Total expenses | | | 15,210 | | | 11,271 |
Net investment income before excise tax | | | 10,954 | | | 8,763 |
Excise tax | | | 250 | | | 224 |
Net investment income after excise tax | | | 10,704 | | | 8,539 |
| | | | | | |
Realized and unrealized gains (losses) on investments and foreign currency transactions | | | | | |
|
Net realized gains (losses) | | |
| | |
|
Non-controlled/non-affiliate company investments | | | 331 | | | (18,184) |
Foreign currency transactions | | | 361 | | | (281) |
Foreign currency forward contracts | | | (7) | | | — |
Net realized gains (losses) | | | 685 | | | (18,465) |
Net change in unrealized appreciation (depreciation) | | |
| | |
|
Non-controlled/non-affiliate company investments | | | (2,097) | | | 17,117 |
Non-controlled affiliate company investments | | | (1,500) | | | (1,621) |
Controlled affiliate company investments | | | 79 | | | 169 |
Translation of assets and liabilities in foreign currencies | | | (371) | | | (28) |
Foreign currency forward contracts | | | 6 | | | (4) |
Net change in unrealized appreciation (depreciation) | | | (3,883) | | | 15,633 |
Net realized and unrealized gains (losses) on investments and foreign currency transactions | | | (3,198) | | | (2,832) |
Net increase in net assets resulting from operations | | $ | 7,506 | | $ | 5,707 |
| | | | | | |
Per Common Share Data | | | | | | |
Basic and diluted earnings per common share | | $ | 0.32 | | $ | 0.25 |
Dividends and distributions declared per common share | | $ | 0.43 | | $ | 0.36 |
Basic and diluted weighted average common shares outstanding | | | 23,243,088 | | | 23,190,656 |
WhiteHorse Finance, Inc.
Consolidated Schedule of Investments (Unaudited)
March 31, 2023
(in thousands)
Issuer |
| Investment Type(1) |
| Floor |
| Reference Rate(2) |
| Spread |
| Interest |
| Acquisition |
| Maturity |
| Principal/ |
| Amortized |
| Fair |
| Fair Value |
| ||
|---|---|---|---|---|---|---|---|---|---|---|---|---|---|---|---|---|---|---|---|---|---|---|---|---|---|
Debt Investments | | | | | | | | | | | | | | | | | | | | | | | | | |
Advertising | | | | | | | | | | | | | | | | | | | | | | | | | |
I&I Sales Group, LLC (d/b/a Avision Sales Group)⁽⁷⁾ | | First Lien Secured Delayed Draw Loan | | 1.00% | | SOFR | | 6.75% | | 11.80% | | 02/10/23 | | 12/15/26 | | 1,760 | | $ | 1,709 | | $ | 1,709 | | 0.52 | % |
| | | | | | | | | | | | | | | | | | | 1,709 | | | 1,709 | | 0.52 | |
Air Freight & Logistics | | | | | | | | | | | | | | | | | | | | | | | | | |
Gulf Winds International Acquisition LLC (d/b/a Gulf Winds International, Inc.) | | First Lien Secured Term Loan | | 1.00% | | SOFR | | 7.00% | | 11.84% | | 12/16/22 | | 12/18/28 | | 4,841 | | | 4,703 | | | 4,704 | | 1.43 | |
Gulf Winds International Acquisition LLC (d/b/a Gulf Winds International, Inc.)⁽⁷⁾ | | First Lien Secured Revolving Loan | | 1.00% | | SOFR | | 7.00% | | 11.84% | | 12/16/22 | | 12/18/28 | | — | | | — | | | — | | — | |
Motivational Marketing, LLC (d/b/a Motivational Fulfillment) | | First Lien Secured Term Loan | | 1.00% | | LIBOR | | 6.25% | | 11.03% | | 07/12/21 | | 07/12/26 | | 11,102 | | | 10,957 | | | 10,764 | | 3.26 | |
Motivational Marketing, LLC (d/b/a Motivational Fulfillment)⁽⁷⁾ | | First Lien Secured Revolving Loan | | 1.00% | | LIBOR | | 6.25% | | 11.09% | | 07/12/21 | | 07/12/26 | | 315 | | | 311 | | | 290 | | 0.09 | |
| | | | | | | | | | | | | | | | | | | 15,971 | | | 15,758 | | 4.78 | |
Alternative Carriers | | | | | | | | | | | | | | | | | | | | | | | | | |
Patagonia Holdco LLC (d/b/a Lumen LATAM) | | First Lien Secured Term Loan | | 0.50% | | SOFR | | 5.75% | | 10.47% | | 08/05/22 | | 08/01/29 | | 14,552 | | | 12,167 | | | 12,118 | | 3.67 | |
| | | | | | | | | | | | | | | | | | | 12,167 | | | 12,118 | | 3.67 | |
Application Software | | | | | | | | | | | | | | | | | | | | | | | | | |
Atlas Purchaser, Inc. (d/b/a Aspect Software, Inc.) | | First Lien Secured Term Loan | | 0.75% | | LIBOR | | 5.25% | | 10.39% | | 08/29/22 | | 05/08/28 | | 3,090 | | | 2,627 | | | 2,455 | | 0.74 | |
Atlas Purchaser, Inc. (d/b/a Aspect Software, Inc.) | | Second Lien Secured Term Loan | | 0.75% | | LIBOR | | 9.00% | | 14.20% | | 05/03/21 | | 05/07/29 | | 15,000 | | | 14,656 | | | 11,253 | | 3.41 | |
MBS Highway, LLC | | First Lien Secured Term Loan | | 1.00% | | SOFR | | 7.50% | | 11.92% | | 10/13/22 | | 10/13/27 | | 9,453 | | | 9,238 | | | 9,233 | | 2.80 | |
Naviga Inc. (f/k/a Newscycle Solutions, Inc.) | | First Lien Secured Term Loan | | 1.00% | | SOFR | | 7.00% | | 12.00% | | 06/14/19 | | 12/29/23 | | 3,172 | | | 3,170 | | | 3,074 | | 0.93 | |
Naviga Inc. (f/k/a Newscycle Solutions, Inc.)⁽⁷⁾ | | First Lien Secured Revolving Loan | | 1.00% | | SOFR | | 7.00% | | 11.95% | | 06/14/19 | | 12/29/23 | | 267 | | | 267 | | | 258 | | 0.08 | |
UserZoom Technologies, Inc. (d/b/a UserZoom, Inc.) | | First Lien Secured Term Loan | | 1.00% | | SOFR | | 7.50% | | 12.13% | | 01/12/23 | | 04/05/29 | | 9,819 | | | 9,535 | | | 9,535 | | 2.88 | |
| | | | | | | | | | | | | | | | | | | 39,493 | | | 35,808 | | 10.84 | |
Asset Management & Custody Banks | | | | | | | | | | | | | | | | | | | | | | | | | |
JZ Capital Partners Ltd.⁽⁴⁾⁽⁵⁾⁽²²⁾ | | First Lien Secured Term Loan | | 1.00% | | LIBOR | | 7.00% | | 11.82% | | 01/26/22 | | 01/26/27 | | 10,286 | | | 10,128 | | | 10,185 | | 3.09 | |
JZ Capital Partners Ltd.⁽⁴⁾⁽⁵⁾⁽⁷⁾⁽²²⁾ | | First Lien Secured Delayed Draw Loan | | 1.00% | | LIBOR | | 7.00% | | 11.82% | | 01/26/22 | | 01/26/27 | | — | | | — | | | 32 | | 0.01 | |
| | | | | | | | | | | | | | | | | | | 10,128 | | | 10,217 | | 3.10 | |
Automotive Retail | | | | | | | | | | | | | | | | | | | | | | | | | |
Team Car Care Holdings, LLC (Heartland Auto)⁽¹²⁾ | | First Lien Secured Term Loan | | 1.00% | | Base Rate | | 7.48% | | 12.35% | | 02/16/18 | | 06/28/24 | | 14,133 | | | 14,090 | | | 14,133 | | 4.28 | |
| | | | | | | | | | | | | | | | | | | 14,090 | | | 14,133 | | 4.28 | |
Broadcasting | | | | | | | | | | | | | | | | | | | | | | | | | |
Coastal Television Broadcasting Group LLC | | First Lien Secured Term Loan | | 1.00% | | SOFR | | 6.50% | | 11.33% | | 12/30/21 | | 12/30/26 | | 7,727 | | | 7,611 | | | 7,485 | | 2.27 | |
Coastal Television Broadcasting Group LLC(7) | | First Lien Secured Revolving Loan | | 1.00% | | SOFR | | 6.50% | | 11.33% | | 12/30/21 | | 12/30/26 | | — | | | — | | | (5) | | — | |
| | | | | | | | | | | | | | | | | | | 7,611 | | | 7,480 | | 2.27 | |
Broadline Retail | | | | | | | | | | | | | | | | | | | | | | | | | |
BBQ Buyer, LLC (d/b/a BBQ Guys) | | First Lien Secured Term Loan | | 1.50% | | LIBOR | | 10.00% | | 14.84% (12.84% Cash + 2.00% PIK) | | 08/28/20 | | 08/28/25 | | 12,741 | | | 12,588 | | | 12,553 | | 3.80 | |
BBQ Buyer, LLC (d/b/a BBQ Guys) | | First Lien Secured Delayed Draw Loan | | 1.50% | | LIBOR | | 10.00% | | 14.84% (12.84% Cash + 2.00% PIK) | | 12/02/21 | | 08/28/25 | | 2,597 | | | 2,565 | | | 2,559 | | 0.78 | |
Luxury Brand Holdings, Inc. (d/b/a Ross-Simons, Inc.) | | First Lien Secured Term Loan | | 1.00% | | LIBOR | | 6.50% | | 11.33% | | 12/04/20 | | 06/04/26 | | 5,280 | | | 5,219 | | | 5,246 | | 1.59 | |
Potpourri Group, Inc. | | First Lien Secured Term Loan | | 1.50% | | LIBOR | | 8.25% | | 12.97% | | 07/03/19 | | 07/03/24 | | 14,090 | | | 14,011 | | | 14,090 | | 4.27 | |
| | | | | | | | | | | | | | | | | | | 34,383 | | | 34,448 | | 10.44 | |
Building Products | | | | | | | | | | | | | | | | | | | | | | | | | |
PFB Holdco, Inc. (d/b/a PFB Corporation)⁽¹³⁾ | | First Lien Secured Term Loan | | 1.00% | | CDOR | | 6.00% | | 10.92% | | 12/17/21 | | 12/17/26 | | 8,912 | | | 6,868 | | | 6,489 | | 1.96 | |
PFB Holdco, Inc. (d/b/a PFB Corporation)⁽⁷⁾⁽¹³⁾ | | First Lien Secured Revolving Loan | | 1.00% | | CDOR | | 6.00% | | 10.92% | | 12/17/21 | | 12/17/26 | | — | | | — | | | — | | — | |
PFB Holdco, Inc. (d/b/a PFB Corporation) | | First Lien Secured Term Loan | | 1.00% | | LIBOR | | 6.00% | | 10.70% | | 12/17/21 | | 12/17/26 | | 2,171 | | | 2,138 | | | 2,146 | | 0.65 | |
PFB Holdco, Inc. (d/b/a PFB Corporation)⁽⁷⁾ | | First Lien Secured Revolving Loan | | 1.00% | | LIBOR | | 6.00% | | 10.70% | | 12/17/21 | | 12/17/26 | | — | | | — | | | 1 | | — | |
Trimlite Buyer LLC (d/b/a Trimlite LLC)⁽⁵⁾⁽¹³⁾⁽²³⁾ | | First Lien Secured Term Loan | | 1.00% | | CDOR | | 6.00% | | 11.02% | | 07/27/21 | | 07/27/26 | | 20,584 | | | 16,177 | | | 15,000 | | 4.55 | |
| | | | | | | | | | | | | | | | | | | 25,183 | | | 23,636 | | 7.16 | |
WhiteHorse Finance, Inc.
Consolidated Schedule of Investments (Unaudited)
March 31, 2023
(in thousands)
Issuer |
| Investment Type(1) |
| Floor |
| Reference Rate(2) |
| Spread |
| Interest |
| Acquisition |
| Maturity |
| Principal/ |
| Amortized |
| Fair |
| Fair Value |
| ||
|---|---|---|---|---|---|---|---|---|---|---|---|---|---|---|---|---|---|---|---|---|---|---|---|---|---|
Cable & Satellite | | | | | | | | | | | | | | | | | | | | | | | | | |
Bulk Midco, LLC | | First Lien Secured Term Loan | | 1.00% | | LIBOR | | 7.50% | | 12.34% (11.34% Cash + 1.00% PIK) | | 10/28/22 | | 06/10/24 | | 19,202 | | $ | 19,119 | | $ | 18,621 | | 5.64 | % |
Bulk Midco, LLC | | First Lien Secured Revolving Loan | | 1.00% | | LIBOR | | 7.50% | | 12.34% (11.34% Cash + 1.00% PIK) | | 10/28/22 | | 06/10/24 | | 2,000 | | | 1,970 | | | 1,940 | | 0.59 | |
| | | | | | | | | | | | | | | | | | | 21,089 | | | 20,561 | | 6.23 | |
Commodity Chemicals | | | | | | | | | | | | | | | | | | | | | | | | | |
FGI Acquisition Corp. (d/b/a Flexitallic Group SAS) | | First Lien Secured Term Loan | | 1.00% | | SOFR | | 6.50% | | 11.55% | | 10/28/19 | | 10/29/26 | | 16,319 | | | 15,800 | | | 15,875 | | 4.81 | |
US Methanol Midco LLC (d/b/a US Methanol LLC)⁽²⁴⁾ | | First Lien Secured Term Loan | | 1.00% | | SOFR | | 7.75% | | 12.61% PIK | | 12/20/22 | | 12/20/27 | | 4,813 | | | 4,703 | | | 4,698 | | 1.42 | |
US Methanol Midco LLC (d/b/a US Methanol LLC)⁽⁴⁾⁽⁷⁾⁽²⁴⁾ | | First Lien Secured Delayed Draw Loan | | 1.00% | | SOFR | | 7.75% | | 12.61% PIK | | 12/20/22 | | 12/20/27 | | — | | | — | | | (113) | | (0.03) | |
| | | | | | | | | | | | | | | | | | | 20,503 | | | 20,460 | | 6.20 | |
Construction Materials | | | | | | | | | | | | | | | | | | | | | | | | | |
Claridge Products and Equipment, LLC | | First Lien Secured Term Loan | | 1.00% | | LIBOR | | 6.50% | | 11.66% | | 12/30/20 | | 12/29/25 | | 7,079 | | | 7,001 | | | 6,794 | | 2.06 | |
Claridge Products and Equipment, LLC(7)(12) | | First Lien Secured Revolving Loan | | 1.00% | | Base Rate | | 5.88% | | 12.83% | | 12/30/20 | | 12/29/25 | | 912 | | | 905 | | | 873 | | 0.26 | |
| | | | | | | | | | | | | | | | | | | 7,906 | | | 7,667 | | 2.32 | |
Data Processing & Outsourced Services | | | | | | | | | | | | | | | | | | | | | | | | | |
Future Payment Technologies, L.P. | | First Lien Secured Term Loan | | 1.00% | | LIBOR | | 8.25% | | 12.91% | | 12/23/16 | | 06/07/24 | | 22,599 | | | 22,478 | | | 22,487 | | 6.81 | |
| | | | | | | | | | | | | | | | | | | 22,478 | | | 22,487 | | 6.81 | |
Distributors | | | | | | | | | | | | | | | | | | | | | | | | | |
Foodservices Brand Group, LLC (d/b/a Crown Brands Group) | | First Lien Secured Term Loan | | 1.00% | | SOFR | | 8.00% | | 12.80% | | 11/22/22 | | 12/09/25 | | 357 | | | 357 | | | 324 | | 0.10 | |
Foodservices Brand Group, LLC (d/b/a Crown Brands Group)⁽¹⁹⁾ | | Second Lien Secured Term Loan | | 1.50% | | SOFR | | 6.50% | | 11.41% | | 11/22/22 | | 01/08/26 | | 5,171 | | | 5,113 | | | 3,670 | | 1.11 | |
| | | | | | | | | | | | | | | | | | | 5,470 | | | 3,994 | | 1.21 | |
Diversified Chemicals | | | | | | | | | | | | | | | | | | | | | | | | | |
Manchester Acquisition Sub LLC (d/b/a Draslovka Holding AS) | | First Lien Secured Term Loan | | 0.75% | | SOFR | | 5.75% | | 10.81% | | 11/16/21 | | 12/01/26 | | 7,900 | | | 7,580 | | | 6,948 | | 2.11 | |
Pressurized Holdings, LLC (f/k/a Starco)⁽⁶⁾⁽²⁷⁾ | | First Lien Secured Term Loan | | 1.00% | | SOFR | | 7.75% | | 12.49% PIK | | 03/16/23 | | 03/16/27 | | 2,694 | | | 2,694 | | | 2,401 | | 0.73 | |
Sklar Holdings, Inc. (d/b/a Starco) | | First Lien Secured Term Loan | | 1.00% | | Prime | | 8.75% | | 16.75% PIK | | 11/13/19 | | 05/13/23 | | 4,654 | | | 4,615 | | | 4,146 | | 1.26 | |
| | | | | | | | | | | | | | | | | | | 14,889 | | | 13,495 | | 4.10 | |
Diversified Support Services | | | | | | | | | | | | | | | | | | | | | | | | | |
NNA Services, LLC | | First Lien Secured Term Loan | | 1.00% | | LIBOR | | 6.75% | | 11.91% | | 08/27/21 | | 08/27/26 | | 9,635 | | | 9,553 | | | 9,256 | | 2.80 | |
| | | | | | | | | | | | | | | | | | | 9,553 | | | 9,256 | | 2.80 | |
Drug Retail | | | | | | | | | | | | | | | | | | | | | | | | | |
Maxor Acquisition, Inc. (d/b/a Maxor National Pharmacy Services, LLC) | | First Lien Secured Term Loan | | 1.00% | | SOFR | | 6.75% | | 11.91% | | 03/01/23 | | 03/01/29 | | 5,515 | | | 5,352 | | | 5,352 | | 1.62 | |
Maxor Acquisition, Inc. (d/b/a Maxor National Pharmacy Services, LLC)(7) | | First Lien Secured Revolving Loan | | 1.00% | | SOFR | | 6.75% | | 11.77% | | 03/01/23 | | 03/01/29 | | 291 | | | 282 | | | 282 | | 0.09 | |
| | | | | | | | | | | | | | | | | | | 5,634 | | | 5,634 | | 1.71 | |
Education Services | | | | | | | | | | | | | | | | | | | | | | | | | |
EducationDynamics, LLC | | First Lien Secured Term Loan | | 1.00% | | LIBOR | | 7.00% | | 11.84% (11.34% Cash + 0.50% PIK) | | 09/15/21 | | 09/15/26 | | 12,986 | | | 12,808 | | | 12,591 | | 3.81 | |
EducationDynamics, LLC(4)(7) | | First Lien Secured Delayed Draw Loan | | 1.00% | | LIBOR | | 7.00% | | 11.84% (11.34% Cash + 0.50% PIK) | | 09/15/21 | | 09/15/26 | | — | | | — | | | (28) | | (0.01) | |
EducationDynamics, LLC(7) | | First Lien Secured Revolving Loan | | 1.00% | | LIBOR | | 7.00% | | 11.84% (11.34% Cash + 0.50% PIK) | | 09/15/21 | | 09/15/26 | | — | | | — | | | (20) | | (0.01) | |
EducationDynamics, LLC(4) | | Subordinated Unsecured Term Loan | | N/A | | N/A | | 4.00% | | 4.00% | | 09/15/21 | | 03/15/27 | | 167 | | | 167 | | | 167 | | 0.05 | |
| | | | | | | | | | | | | | | | | | | 12,975 | | | 12,710 | | 3.84 | |
Electric Utilities | | | | | | | | | | | | | | | | | | | | | | | | | |
CleanChoice Energy, Inc. | | First Lien Secured Term Loan | | 1.00% | | LIBOR | | 7.58% | | 12.40% | | 10/12/21 | | 10/12/26 | | 15,955 | | | 15,651 | | | 15,716 | | 4.76 | |
| | | | | | | | | | | | | | | | | | | 15,651 | | | 15,716 | | 4.76 | |
WhiteHorse Finance, Inc.
Consolidated Schedule of Investments (Unaudited)
March 31, 2023
(in thousands)
Issuer |
| Investment Type(1) |
| Floor |
| Reference Rate(2) |
| Spread |
| Interest |
| Acquisition |
| Maturity |
| Principal/ |
| Amortized |
| Fair |
| Fair Value |
| ||
|---|---|---|---|---|---|---|---|---|---|---|---|---|---|---|---|---|---|---|---|---|---|---|---|---|---|
Environmental & Facilities Services | | | | | | | | | | | | | | | | | | | | | | | | | |
Industrial Specialty Services USA LLC | | First Lien Secured Term Loan | | 1.00% | | SOFR | | 6.75% | | 11.80% | | 12/31/21 | | 12/31/26 | | 11,857 | | $ | 11,679 | | $ | 11,514 | | 3.49 | % |
| | | | | | | | | | | | | | | | | | | 11,679 | | | 11,514 | | 3.49 | |
Health Care Facilities | | | | | | | | | | | | | | | | | | | | | | | | | |
Bridgepoint Healthcare, LLC | | First Lien Secured Term Loan | | 1.00% | | LIBOR | | 7.75% | | 12.46% | | 10/05/21 | | 10/05/26 | | 10,284 | | | 10,139 | | | 10,022 | | 3.04 | |
Bridgepoint Healthcare, LLC(7) | | First Lien Secured Delayed Draw Loan | | 1.00% | | LIBOR | | 7.75% | | 12.46% | | 10/05/21 | | 10/05/26 | | — | | | — | | | (15) | | — | |
Bridgepoint Healthcare, LLC(7) | | First Lien Secured Revolving Loan | | 1.00% | | LIBOR | | 7.75% | | 12.46% | | 10/05/21 | | 10/05/26 | | — | | | — | | | (18) | | (0.01) | |
| | | | | | | | | | | | | | | | | | | 10,139 | | | 9,989 | | 3.03 | |
Health Care Services | | | | | | | | | | | | | | | | | | | | | | | | | |
Lab Logistics, LLC | | First Lien Secured Term Loan | | 1.00% | | SOFR | | 7.25% | | 12.12% | | 10/16/19 | | 09/25/23 | | 5,475 | | | 5,448 | | | 5,475 | | 1.66 | |
Lab Logistics, LLC | | First Lien Secured Delayed Draw Loan | | 1.00% | | SOFR | | 7.25% | | 12.11% | | 10/16/19 | | 09/25/23 | | 5,118 | | | 5,114 | | | 5,118 | | 1.55 | |
PG Dental New Jersey Parent, LLC | | First Lien Secured Term Loan | | 1.00% | | LIBOR | | 9.75% | | 14.43% (12.93% Cash + 1.50% PIK) | | 11/25/20 | | 11/25/25 | | 13,525 | | | 13,369 | | | 12,707 | | 3.85 | |
PG Dental New Jersey Parent, LLC(7) | | First Lien Secured Revolving Loan | | 1.00% | | LIBOR | | 9.75% | | 14.43% (12.93% Cash + 1.50% PIK) | | 11/25/20 | | 11/25/25 | | 352 | | | 348 | | | 313 | | 0.09 | |
| | | | | | | | | | | | | | | | | | | 24,279 | | | 23,613 | | 7.15 | |
Health Care Supplies | | | | | | | | | | | | | | | | | | | | | | | | | |
ABB/Con-cise Optical Group LLC (d/b/a ABB Optical Group, LLC) | | First Lien Secured Term Loan | | 0.75% | | LIBOR | | 7.50% | | 12.67% | | 02/23/22 | | 02/23/28 | | 21,518 | | | 21,079 | | | 20,223 | | 6.13 | |
ABB/Con-cise Optical Group LLC (d/b/a ABB Optical Group, LLC)⁽⁷⁾⁽¹²⁾ | | First Lien Secured Revolving Loan | | 0.75% | | Base Rate | | 6.19% | | 13.99% | | 02/23/22 | | 02/23/28 | | 2,151 | | | 2,107 | | | 2,017 | | 0.61 | |
| | | | | | | | | | | | | | | | | | | 23,186 | | | 22,240 | | 6.74 | |
Heavy Electrical Equipment | | | | | | | | | | | | | | | | | | | | | | | | | |
Power Service Group CR Acquisition Inc. (d/b/a Power Plant Services) | | First Lien Secured Term Loan | | 1.00% | | LIBOR | | 6.25% | | 11.41% | | 06/25/21 | | 06/25/26 | | 14,094 | | | 13,901 | | | 13,788 | | 4.18 | |
Power Service Group CR Acquisition Inc. (d/b/a Power Plant Services)⁽⁷⁾ | | First Lien Secured Delayed Draw Loan | | 1.00% | | LIBOR | | 6.25% | | 11.41% | | 07/11/22 | | 06/25/26 | | — | | | — | | | (28) | | (0.01) | |
Power Service Group CR Acquisition Inc. (d/b/a Power Plant Services)⁽⁷⁾ | | First Lien Secured Revolving Loan | | 1.00% | | LIBOR | | 6.25% | | 11.41% | | 06/25/21 | | 06/25/24 | | 627 | | | 622 | | | 579 | | 0.18 | |
| | | | | | | | | | | | | | | | | | | 14,523 | | | 14,339 | | 4.35 | |
Home Furnishings | | | | | | | | | | | | | | | | | | | | | | | | | |
Sleep OpCo LLC (d/b/a Brooklyn Bedding LLC) | | First Lien Secured Term Loan | | 1.00% | | LIBOR | | 6.50% | | 11.30% | | 10/12/21 | | 10/12/26 | | 20,774 | | | 20,478 | | | 20,247 | | 6.14 | |
Sleep OpCo LLC (d/b/a Brooklyn Bedding LLC)⁽⁷⁾ | | First Lien Secured Revolving Loan | | 1.00% | | SOFR | | 6.50% | | 11.43% | | 10/12/21 | | 10/12/26 | | 794 | | | 783 | | | 753 | | 0.23 | |
Hollander Intermediate LLC (d/b/a Hollander Sleep Products, LLC) | | First Lien Secured Term Loan | | 2.00% | | SOFR | | 8.75% | | 13.67% | | 09/19/22 | | 09/21/26 | | 4,830 | | | 4,793 | | | 4,340 | | 1.32 | |
| | | | | | | | | | | | | | | | | | | 26,054 | | | 25,340 | | 7.69 | |
Household Appliances | | | | | | | | | | | | | | | | | | | | | | | | | |
Token Buyer, Inc. (d/b/a Therm-O-Disc, Inc.) | | First Lien Secured Term Loan | | 0.50% | | SOFR | | 6.00% | | 10.91% | | 05/26/22 | | 05/31/29 | | 7,196 | | | 6,684 | | | 6,498 | | 1.97 | |
| | | | | | | | | | | | | | | | | | | 6,684 | | | 6,498 | | 1.97 | |
Household Products | | | | | | | | | | | | | | | | | | | | | | | | | |
The Kyjen Company, LLC (d/b/a Outward Hound) | | First Lien Secured Term Loan | | 1.00% | | SOFR | | 7.00% | | 12.64% (12.14% Cash + 0.50% PIK) | | 04/05/21 | | 04/05/26 | | 11,320 | | | 11,218 | | | 10,393 | | 3.15 | |
The Kyjen Company, LLC (d/b/a Outward Hound) | | First Lien Secured Revolving Loan | | 1.00% | | SOFR | | 7.00% | | 12.64% (12.14% Cash + 0.50% PIK) | | 04/05/21 | | 04/05/26 | | 798 | | | 791 | | | 722 | | 0.22 | |
| | | | | | | | | | | | | | | | | | | 12,009 | | | 11,115 | | 3.37 | |
Industrial Machinery & Supplies & Components | | | | | | | | | | | | | | | | | | | | | | | | | |
Project Castle, Inc. (d/b/a Material Handling Systems, Inc.)⁽¹²⁾ | | First Lien Secured Term Loan | | 0.50% | | Base Rate | | 4.56% | | 12.60% | | 06/09/22 | | 06/01/29 | | 8,334 | | | 7,547 | | | 7,119 | | 2.16 | |
| | | | | | | | | | | | | | | | | | | 7,547 | | | 7,119 | | 2.16 | |
Interactive Media & Services | | | | | | | | | | | | | | | | | | | | | | | | | |
MSI Information Services, Inc. | | First Lien Secured Term Loan | | 1.00% | | SOFR | | 7.75% | | 12.66% | | 04/25/22 | | 04/24/26 | | 7,652 | | | 7,535 | | | 7,492 | | 2.27 | |
MSI Information Services, Inc.(7) | | First Lien Secured Revolving Loan | | 1.00% | | Prime | | 6.75% | | 14.75% | | 04/25/22 | | 04/24/26 | | 300 | | | 295 | | | 290 | | 0.09 | |
| | | | | | | | | | | | | | | | | | | 7,830 | | | 7,782 | | 2.36 | |
WhiteHorse Finance, Inc.
Consolidated Schedule of Investments (Unaudited)
March 31, 2023
(in thousands)
Issuer |
| Investment Type(1) |
| Floor |
| Reference Rate(2) |
| Spread |
| Interest |
| Acquisition |
| Maturity |
| Principal/ |
| Amortized |
| Fair |
| Fair Value |
| ||
|---|---|---|---|---|---|---|---|---|---|---|---|---|---|---|---|---|---|---|---|---|---|---|---|---|---|
Investment Banking & Brokerage | | | | | | | | | | | | | | | | | | | | | | | | | |
JVMC Holdings Corp. (fka RJO Holdings Corp) | | First Lien Secured Term Loan | | 1.00% | | LIBOR | | 6.50% | | 11.34% | | 02/28/19 | | 02/28/24 | | 11,643 | | $ | 11,622 | | $ | 11,643 | | 3.53 | % |
| | | | | | | | | | | | | | | | | | | 11,622 | | | 11,643 | | 3.53 | |
IT Consulting & Other Services | | | | | | | | | | | | | | | | | | | | | | | | | |
ATSG, Inc. | | First Lien Secured Term Loan | | 1.00% | | LIBOR | | 6.50% | | 11.37% | | 11/12/21 | | 11/12/26 | | 3,821 | | | 3,766 | | | 3,739 | | 1.13 | |
| | | | | | | | | | | | | | | | | | | 3,766 | | | 3,739 | | 1.13 | |
Leisure Facilities | | | | | | | | | | | | | | | | | | | | | | | | | |
Honors Holdings, LLC (d/b/a Orange Theory)⁽¹⁵⁾⁽¹⁶⁾ | | First Lien Secured Term Loan | | 1.00% | | SOFR | | 6.97% | | 11.98% | | 09/06/19 | | 09/06/24 | | 9,440 | | | 9,351 | | | 9,297 | | 2.82 | |
Honors Holdings, LLC (d/b/a Orange Theory)⁽¹⁵⁾⁽¹⁶⁾ | | First Lien Secured Delayed Draw Loan | | 1.00% | | SOFR | | 6.92% | | 11.93% | | 09/06/19 | | 09/06/24 | | 4,649 | | | 4,623 | | | 4,579 | | 1.39 | |
Lift Brands, Inc. | | First Lien Secured Term Loan A | | 1.00% | | SOFR | | 7.50% | | 12.41% | | 06/29/20 | | 06/29/25 | | 5,560 | | | 5,521 | | | 5,532 | | 1.68 | |
Lift Brands, Inc. | | First Lien Secured Term Loan B | | N/A | | N/A | | 9.50% | | 9.50% PIK | | 06/29/20 | | 06/29/25 | | 1,351 | | | 1,338 | | | 1,287 | | 0.39 | |
Snap Fitness Holdings, Inc. (d/b/a Lift Brands, Inc.)⁽⁹⁾ | | First Lien Secured Term Loan C | | N/A | | N/A | | 9.50% | | 9.50% PIK | | 06/29/20 | | N/A | | 1,268 | | | 1,265 | | | 1,240 | | 0.38 | |
| | | | | | | | | | | | | | | | | | | 22,098 | | | 21,935 | | 6.66 | |
Leisure Products | | | | | | | | | | | | | | | | | | | | | | | | | |
Playmonster Group LLC(6)(20) | | Priority First Lien Secured Term Loan | | 1.00% | | LIBOR | | 6.75% | | 11.64% PIK | | 12/09/22 | | 06/08/26 | | 929 | | | 903 | | | 902 | | 0.27 | |
Playmonster Group LLC⁽⁶⁾⁽²⁰⁾⁽²⁵⁾ | | First Lien Secured Term Loan | | 1.00% | | LIBOR | | 9.00% | | 13.82% PIK | | 01/24/22 | | 06/08/26 | | 3,799 | | | 3,661 | | | 2,661 | | 0.81 | |
Leviathan Intermediate Holdco, LLC | | First Lien Secured Term Loan | | 1.50% | | SOFR | | 7.50% | | 12.54% | | 12/27/22 | | 12/27/27 | | 10,424 | | | 10,127 | | | 10,136 | | 3.07 | |
Leviathan Intermediate Holdco, LLC⁽⁷⁾ | | First Lien Secured Revolving Loan | | 1.50% | | SOFR | | 7.50% | | 12.54% | | 12/27/22 | | 12/27/27 | | 76 | | | 74 | | | 74 | | 0.02 | |
| | | | | | | | | | | | | | | | | | | 14,765 | | | 13,773 | | 4.17 | |
Life Sciences Tools & Services | | | | | | | | | | | | | | | | | | | | | | | | | |
LSCS Holdings, Inc. (d/b/a Eversana Life Science Services, LLC) | | Second Lien Secured Term Loan | | 0.50% | | LIBOR | | 8.00% | | 12.84% | | 11/23/21 | | 12/16/29 | | 5,000 | | | 4,937 | | | 4,850 | | 1.47 | |
| | | | | | | | | | | | | | | | | | | 4,937 | | | 4,850 | | 1.47 | |
Office Services & Supplies | | | | | | | | | | | | | | | | | | | | | | | | | |
American Crafts, LC⁽¹⁴⁾⁽²⁶⁾ | | Priority First Lien Secured Term Loan | | 1.00% | | SOFR | | 8.50% | | 13.36% PIK | | 12/22/22 | | 05/28/26 | | 4,581 | | | 4,581 | | | 4,581 | | 1.39 | |
American Crafts, LC⁽¹⁴⁾⁽²⁶⁾ | | First Lien Secured Term Loan | | 1.00% | | SOFR | | 8.50% | | 13.36% PIK | | 05/28/21 | | 05/28/26 | | 8,479 | | | 8,403 | | | 7,110 | | 2.15 | |
American Crafts, LC⁽¹⁴⁾⁽²⁶⁾ | | First Lien Secured Delayed Draw Loan | | 1.00% | | SOFR | | 8.50% | | 13.36% PIK | | 10/01/22 | | 05/28/26 | | 1,424 | | | 1,404 | | | 1,194 | | 0.36 | |
Empire Office, Inc. | | First Lien Secured Term Loan | | 1.50% | | LIBOR | | 6.75% | | 11.59% | | 04/12/19 | | 04/12/24 | | 11,594 | | | 11,532 | | | 11,487 | | 3.48 | |
Empire Office, Inc. | | First Lien Secured Delayed Draw Loan | | 1.50% | | LIBOR | | 6.75% | | 11.59% | | 08/17/21 | | 04/12/24 | | 4,741 | | | 4,698 | | | 4,697 | | 1.42 | |
| | | | | | | | | | | | | | | | | | | 30,618 | | | 29,069 | | 8.80 | |
Packaged Foods & Meats | | | | | | | | | | | | | | | | | | | | | | | | | |
Lenny & Larry's, LLC⁽¹⁵⁾⁽¹⁷⁾ | | First Lien Secured Term Loan | | 1.00% | | SOFR | | 7.76% | | 12.67% (11.54% Cash + 1.13% PIK) | | 05/15/18 | | 05/15/23 | | 11,418 | | | 11,413 | | | 11,142 | | 3.38 | |
| | | | | | | | | | | | | | | | | | | 11,413 | | | 11,142 | | 3.38 | |
Personal Care Products | | | | | | | | | | | | | | | | | | | | | | | | | |
Inspired Beauty Brands, Inc. | | First Lien Secured Term Loan | | 1.00% | | LIBOR | | 7.00% | | 11.86% | | 12/30/20 | | 12/30/25 | | 11,362 | | | 11,237 | | | 11,082 | | 3.36 | |
Inspired Beauty Brands, Inc.(7) | | First Lien Secured Revolving Loan | | 1.00% | | LIBOR | | 7.00% | | 11.81% | | 12/30/20 | | 12/30/25 | | 88 | | | 87 | | | 80 | | 0.02 | |
| | | | | | | | | | | | | | | | | | | 11,324 | | | 11,162 | | 3.38 | |
Real Estate Development | | | | | | | | | | | | | | | | | | | | | | | | | |
StoicLane MidCo, LLC (d/b/a StoicLane Inc.) | | First Lien Secured Term Loan | | 1.00% | | SOFR | | 7.50% | | 12.35% | | 11/04/22 | | 11/04/27 | | 4,641 | | | 4,535 | | | 4,551 | | 1.38 | |
StoicLane MidCo, LLC (d/b/a StoicLane Inc.)⁽⁷⁾ | | First Lien Secured Delayed Draw Loan | | 1.00% | | SOFR | | 7.50% | | 12.36% | | 11/04/22 | | 11/04/27 | | 5,587 | | | 5,491 | | | 5,463 | | 1.66 | |
| | | | | | | | | | | | | | | | | | | 10,026 | | | 10,014 | | 3.04 | |
Real Estate Operating Companies | | | | | | | | | | | | | | | | | | | | | | | | | |
Salon Republic Holdings, LLC (d/b/a Salon Republic, LLC) | | First Lien Secured Term Loan | | 1.00% | | SOFR | | 7.50% | | 12.41% | | 12/02/22 | | 12/02/27 | | 5,144 | | | 5,000 | | | 5,000 | | 1.52 | |
Salon Republic Holdings, LLC (d/b/a Salon Republic, LLC)⁽⁷⁾ | | First Lien Secured Delayed Draw Loan | | 1.00% | | SOFR | | 7.50% | | 12.37% | | 12/02/22 | | 12/02/27 | | 193 | | | 190 | | | 163 | | 0.05 | |
Salon Republic Holdings, LLC (d/b/a Salon Republic, LLC)⁽⁷⁾ | | First Lien Secured Revolving Loan | | 1.00% | | SOFR | | 7.50% | | 12.33% | | 12/02/22 | | 12/02/27 | | 387 | | | 377 | | | 377 | | 0.11 | |
| | | | | | | | | | | | | | | | | | | 5,567 | | | 5,540 | | 1.68 | |
Research & Consulting Services | | | | | | | | | | | | | | | | | | | | | | | | | |
Aeyon LLC⁽¹⁵⁾ | | First Lien Secured Term Loan | | 1.00% | | SOFR | | 8.88% | | 13.62% | | 02/10/22 | | 02/10/27 | | 8,888 | | | 8,750 | | | 8,661 | | 2.62 | |
ALM Media, LLC | | First Lien Secured Term Loan | | 1.00% | | LIBOR | | 6.00% | | 11.16% | | 11/25/19 | | 11/25/24 | | 13,191 | | | 13,103 | | | 13,113 | | 3.97 | |
| | | | | | | | | | | | | | | | | | | 21,853 | | | 21,774 | | 6.59 | |
WhiteHorse Finance, Inc.
Consolidated Schedule of Investments (Unaudited)
March 31, 2023
(in thousands)
Issuer |
| Investment Type(1) |
| Floor |
| Reference Rate(2) |
| Spread |
| Interest |
| Acquisition |
| Maturity |
| Principal/ |
| Amortized |
| Fair |
| Fair Value |
| ||
|---|---|---|---|---|---|---|---|---|---|---|---|---|---|---|---|---|---|---|---|---|---|---|---|---|---|
Specialized Consumer Services | | | | | | | | | | | | | | | | | | | | | | | | | |
Camp Facility Services Holdings, LLC (d/b/a Camp Construction Services, Inc.) | | First Lien Secured Term Loan | | 1.00% | | LIBOR | | 6.50% | | 11.34% | | 11/16/21 | | 11/16/27 | | 11,765 | | $ | 11,584 | | $ | 11,319 | | 3.43 | % |
Camp Facility Services Holdings, LLC (d/b/a Camp Construction Services, Inc.)⁽⁴⁾⁽⁷⁾ | | First Lien Secured Delayed Draw Loan | | 1.00% | | LIBOR | | 6.50% | | 11.34% | | 11/16/21 | | 11/16/27 | | — | | | — | | | (91) | | (0.03) | |
HC Salon Holdings, Inc. (d/b/a Hair Cuttery) | | First Lien Secured Term Loan | | 1.00% | | LIBOR | | 6.50% | | 11.66% | | 09/30/21 | | 09/30/26 | | 11,492 | | | 11,331 | | | 11,492 | | 3.48 | |
HC Salon Holdings, Inc. (d/b/a Hair Cuttery)⁽⁷⁾ | | First Lien Secured Revolving Loan | | 1.00% | | LIBOR | | 6.50% | | 11.66% | | 09/30/21 | | 09/30/26 | | — | | | — | | | 10 | | — | |
| | | | | | | | | | | | | | | | | | | 22,915 | | | 22,730 | | 6.88 | |
Specialized Finance | | | | | | | | | | | | | | | | | | | | | | | | | |
WHF STRS Ohio Senior Loan Fund LLC(4)(5)(7)(9)(14)(28) | | Subordinated Note | | N/A | | LIBOR | | 6.50% | | 11.17% | | 07/19/19 | | N/A | | 80,000 | | | 80,000 | | | 80,000 | | 24.24 | |
| | | | | | | | | | | | | | | | | | | 80,000 | | | 80,000 | | 24.24 | |
Systems Software | | | | | | | | | | | | | | | | | | | | | | | | | |
Arcstor Midco, LLC (d/b/a Arcserve (USA), LLC | | First Lien Secured Term Loan | | 1.00% | | SOFR | | 7.50% | | 12.41% (8.66% Cash + 3.75% PIK) | | 03/16/21 | | 03/16/27 | | 19,811 | | | 19,557 | | | 17,468 | | 5.29 | |
| | | | | | | | | | | | | | | | | | | 19,557 | | | 17,468 | | 5.29 | |
Technology Hardware, Storage & Peripherals | | | | | | | | | | | | | | | | | | | | | | | | | |
Telestream Holdings Corporation | | First Lien Secured Term Loan | | 1.00% | | SOFR | | 9.75% | | 14.66% | | 10/15/20 | | 10/15/25 | | 15,884 | | | 15,621 | | | 15,810 | | 4.79 | |
Telestream Holdings Corporation(7) | | First Lien Secured Revolving Loan | | 1.00% | | SOFR | | 9.75% | | 14.63% | | 10/15/20 | | 10/15/25 | | 932 | | | 917 | | | 932 | | 0.28 | |
| | | | | | | | | | | | | | | | | | | 16,538 | | | 16,742 | | 5.07 | |
| | | | | | | | | | | | | | | | | | | | | | | | | |
Total Debt Investments | | | | | | | | | | | | | | | | | | $ | 727,812 | | $ | 708,417 | | 214.66 | % |
| | | | | | | | | | | | | | | | | | | | | | | | | |
Equity Investments(21) | | | | | | | | | | | | | | | | | | | | | | | | | |
Advertising | | | | | | | | | | | | | | | | | | | | | | | | | |
Avision Holdings, LLC (d/b/a Avision Sales Group)⁽⁴⁾ | | Class A LLC Interests | | N/A | | N/A | | N/A | | N/A | | 12/15/21 | | N/A | | 208 | | $ | 258 | | $ | 144 | | 0.04 | % |
| | | | | | | | | | | | | | | | | | | 258 | | | 144 | | 0.04 | |
Air Freight & Logistics | | | | | | | | | | | | | | | | | | | | | | | | | |
Motivational CIV, LLC (d/b/a Motivational Fulfillment)⁽⁴⁾ | | Class B Units | | N/A | | N/A | | N/A | | N/A | | 07/12/21 | | N/A | | 1,250 | | | 1,250 | | | 451 | | 0.14 | |
| | | | | | | | | | | | | | | | | | | 1,250 | | | 451 | | 0.14 | |
Broadline Retail | | | | | | | | | | | | | | | | | | | | | | | | | |
BBQ Buyer, LLC (d/b/a BBQGuys)⁽⁴⁾ | | Shares | | N/A | | N/A | | N/A | | N/A | | 08/28/20 | | N/A | | 1,100 | | | 1,100 | | | 1,266 | | 0.38 | |
Ross-Simons Topco, LP (d/b/a Ross-Simons, Inc.)⁽⁴⁾ | | Preferred Units | | N/A | | N/A | | 8.00% | | 8.00% PIK | | 12/04/20 | | N/A | | 600 | | | 514 | | | 776 | | 0.24 | |
| | | | | | | | | | | | | | | | | | | 1,614 | | | 2,042 | | 0.62 | |
Building Products | | | | | | | | | | | | | | | | | | | | | | | | | |
PFB Holding Company, LLC (d/b/a PFB Corporation)⁽⁴⁾⁽¹³⁾ | | Class A Units | | N/A | | N/A | | N/A | | N/A | | 12/17/21 | | N/A | | 1 | | | 423 | | | 869 | | 0.26 | |
| | | | | | | | | | | | | | | | | | | 423 | | | 869 | | 0.26 | |
Diversified Chemicals | | | | | | | | | | | | | | | | | | | | | | | | | |
Pressurized Holdings, LLC (f/k/a Starco)⁽⁴⁾⁽⁶⁾⁽²⁷⁾ | | Common Units | | N/A | | N/A | | N/A | | N/A | | 03/16/23 | | N/A | | — | | | — | | | — | | — | |
Pressurized Holdings, LLC (f/k/a Starco)⁽⁴⁾⁽⁶⁾⁽⁸⁾⁽²⁷⁾ | | Preferred Units | | N/A | | N/A | | N/A | | 14.00% PIK | | 03/16/23 | | N/A | | — | | | 645 | | | — | | — | |
| | | | | | | | | | | | | | | | | | | 645 | | | — | | — | |
Diversified Financial Services | | | | | | | | | | | | | | | | | | | | | | | | | |
SFS Global Holding Company (d/b/a Sigue Corporation)⁽⁴⁾ | | Warrants | | N/A | | N/A | | N/A | | N/A | | 06/28/18 | | 12/28/25 | | — | | | — | | | — | | — | |
Sigue Corporation(4) | | Warrants | | N/A | | N/A | | N/A | | N/A | | 06/28/18 | | 12/28/25 | | 22 | | | 2,890 | | | 3,790 | | 1.15 | |
| | | | | | | | | | | | | | | | | | | 2,890 | | | 3,790 | | 1.15 | |
Diversified Support Services | | | | | | | | | | | | | | | | | | | | | | | | | |
Quest Events, LLC(4) | | Preferred Units | | N/A | | N/A | | N/A | | N/A | | 12/28/18 | | 12/08/25 | | 348 | | | 348 | | | 195 | | 0.06 | |
ImageOne Industries, LLC(4) | | Common A Units | | N/A | | N/A | | N/A | | N/A | | 09/20/19 | | N/A | | 229 | | | 4 | | | 50 | | 0.02 | |
| | | | | | | | | | | | | | | | | | | 352 | | | 245 | | 0.08 | |
Education Services | | | | | | | | | | | | | | | | | | | | | | | | | |
Eddy Acquisitions, LLC (d/b/a EducationDynamics, LLC)⁽⁴⁾ | | Preferred Units | | N/A | | N/A | | 12.00% | | 12.00% | | 09/15/21 | | N/A | | 167 | | | 167 | | | 83 | | 0.03 | |
| | | | | | | | | | | | | | | | | | | 167 | | | 83 | | 0.03 | |
WhiteHorse Finance, Inc.
Consolidated Schedule of Investments (Unaudited)
March 31, 2023
(in thousands)
Issuer |
| Investment Type(1) |
| Floor |
| Reference Rate(2) |
| Spread |
| Interest |
| Acquisition |
| Maturity |
| Principal/ |
| Amortized |
| Fair |
| Fair Value |
| ||
|---|---|---|---|---|---|---|---|---|---|---|---|---|---|---|---|---|---|---|---|---|---|---|---|---|---|
Environmental & Facilities Services | | | | | | | | | | | | | | | | | | | | | | | | | |
BPII-JL Group Holdings LP (d/b/a Juniper Landscaping Holdings LLC)⁽⁴⁾ | | Class A Units | | N/A | | N/A | | N/A | | N/A | | 12/29/21 | | N/A | | 83 | | $ | 825 | | $ | 641 | | 0.19 | % |
| | | | | | | | | | | | | | | | | | | 825 | | | 641 | | 0.19 | |
Industrial Machinery & Supplies & Components | | | | | | | | | | | | | | | | | | | | | | | | | |
BL Products Parent, LP (d/b/a Bishop Lifting Products, Inc.)⁽⁴⁾ | | Class A Units | | N/A | | N/A | | N/A | | N/A | | 02/01/22 | | N/A | | 667 | | | 667 | | | 500 | | 0.15 | |
| | | | | | | | | | | | | | | | | | | 667 | | | 500 | | 0.15 | |
Interactive Media & Services | | | | | | | | | | | | | | | | | | | | | | | | | |
What If Media Group, LLC(4) | | Common Units | | N/A | | N/A | | N/A | | N/A | | 07/02/21 | | N/A | | 851 | | | 851 | | | 1,719 | | 0.52 | |
| | | | | | | | | | | | | | | | | | | 851 | | | 1,719 | | 0.52 | |
Investment Banking & Brokerage | | | | | | | | | | | | | | | | | | | | | | | | | |
Arcole Holding Corporation⁽⁴⁾⁽⁵⁾⁽⁶⁾⁽¹⁸⁾⁽²³⁾ | | Shares | | N/A | | N/A | | N/A | | N/A | | 10/01/20 | | N/A | | — | | | 6,944 | | | 6,134 | | 1.86 | |
| | | | | | | | | | | | | | | | | | | 6,944 | | | 6,134 | | 1.86 | |
IT Consulting & Other Services | | | | | | | | | | | | | | | | | | | | | | | | | |
CX Holdco LLC (d/b/a Cennox Inc.)⁽⁴⁾ | | Common Units | | N/A | | N/A | | N/A | | N/A | | 05/04/21 | | N/A | | 1,068 | | | 1,116 | | | 1,531 | | 0.46 | |
Keras Holdings, LLC (d/b/a KSM Consulting, LLC)⁽⁴⁾ | | Shares | | N/A | | N/A | | N/A | | N/A | | 12/31/20 | | N/A | | 496 | | | 496 | | | 346 | | 0.10 | |
| | | | | | | | | | | | | | | | | | | 1,612 | | | 1,877 | | 0.56 | |
Leisure Facilities | | | | | | | | | | | | | | | | | | | | | | | | | |
Snap Fitness Holdings, Inc. (d/b/a Lift Brands, Inc.)⁽⁴⁾ | | Class A Common Stock | | N/A | | N/A | | N/A | | N/A | | 06/29/20 | | N/A | | 2 | | | 1,941 | | | 182 | | 0.06 | |
Snap Fitness Holdings, Inc. (d/b/a Lift Brands, Inc.)⁽⁴⁾ | | Warrants | | N/A | | N/A | | N/A | | N/A | | 06/29/20 | | 06/28/28 | | 1 | | | 793 | | | 74 | | 0.02 | |
| | | | | | | | | | | | | | | | | | | 2,734 | | | 256 | | 0.08 | |
Leisure Products | | | | | | | | | | | | | | | | | | | | | | | | | |
Playmonster Group Equity, Inc. (d/b/a Playmonster Group LLC)⁽⁴⁾⁽⁶⁾⁽⁸⁾⁽²⁰⁾ | | Preferred Stock | | N/A | | N/A | | 14.00% | | 14.00% PIK | | 01/24/22 | | N/A | | 36 | | | 3,600 | | | — | | — | |
Playmonster Group Equity, Inc. (d/b/a Playmonster Group LLC)⁽⁴⁾⁽⁶⁾⁽²⁰⁾ | | Common Stock | | N/A | | N/A | | N/A | | N/A | | 01/24/22 | | N/A | | 72 | | | 460 | | | — | | — | |
| | | | | | | | | | | | | | | | | | | 4,060 | | | — | | — | |
Office Services & Supplies | | | | | | | | | | | | | | | | | | | | | | | | | |
American Crafts Holdings, LLC (d/b/a American Crafts, LC)⁽⁴⁾⁽¹⁴⁾⁽²⁶⁾ | | Warrants | | N/A | | N/A | | N/A | | N/A | | 12/22/22 | | 12/22/32 | | — | | | — | | | — | | — | |
New American Crafts Holdings, LLC (d/b/a American Crafts, LC)⁽⁴⁾⁽¹⁴⁾⁽²⁶⁾ | | Class A Units | | N/A | | N/A | | N/A | | N/A | | 03/16/23 | | N/A | | 1 | | | — | | | — | | — | |
| | | | | | | | | | | | | | | | | | | — | | | — | | — | |
Paper & Plastic Packaging Products & Materials | | | | | | | | | | | | | | | | | | | | | | | | | |
Max Solutions Inc.(4) | | Common Stock | | N/A | | N/A | | N/A | | N/A | | 09/29/22 | | N/A | | 4 | | | 400 | | | 327 | | 0.10 | |
| | | | | | | | | | | | | | | | | | | 400 | | | 327 | | 0.10 | |
Real Estate Operating Companies | | | | | | | | | | | | | | | | | | | | | | | | | |
Salon Republic Investments LLC (d/b/a Salon Republic, LLC)⁽⁴⁾⁽⁸⁾ | | Preferred Stock | | N/A | | N/A | | N/A | | 8.00% PIK | | 12/02/22 | | N/A | | 200 | | | 200 | | | 200 | | 0.06 | |
Salon Republic Investments LLC (d/b/a Salon Republic, LLC)⁽⁴⁾ | | Common Stock | | N/A | | N/A | | N/A | | N/A | | 12/02/22 | | N/A | | 400 | | | 400 | | | 264 | | 0.08 | |
| | | | | | | | | | | | | | | | | | | 600 | | | 464 | | 0.14 | |
Specialized Consumer Services | | | | | | | | | | | | | | | | | | | | | | | | | |
Camp Facility Services Parent, LLC (d/b/a Camp Construction Services, Inc.)⁽⁴⁾⁽⁸⁾ | | Preferred Units | | N/A | | N/A | | 10.00% | | 10.00% PIK | | 11/16/21 | | N/A | | 15 | | | 840 | | | 951 | | 0.29 | |
| | | | | | | | | | | | | | | | | | | 840 | | | 951 | | 0.29 | |
Specialized Finance | | | | | | | | | | | | | | | | | | | | | | | | | |
WHF STRS Ohio Senior Loan Fund(4)(5)(7)(14)(28) | | LLC Interests | | N/A | | N/A | | N/A | | N/A | | 07/19/19 | | N/A | | 20,000 | | | 20,000 | | | 20,313 | | 6.16 | |
| | | | | | | | | | | | | | | | | | | 20,000 | | | 20,313 | | 6.16 | |
| | | | | | | | | | | | | | | | | | | | | | | | | |
Total Equity Investments | | | | | | | | | | | | | | | | | | $ | 47,132 | | $ | 40,806 | | 12.37 | % |
| | | | | | | | | | | | | | | | | | | | | | | | | |
Total Investments | | | | | | | | | | | | | | | | | | $ | 774,944 | | $ | 749,223 | | 227.03 | % |
WhiteHorse Finance, Inc.
Consolidated Schedule of Investments (Unaudited)
March 31, 2023
(in thousands)
Counterparty |
| Currency to be sold |
| Currency to be purchased |
| Settlement date |
| Unrealized |
| Unrealized | ||||||
Morgan Stanley | | C$ | 520 | CAD | | $ | 388 | USD | | 5/5/23 | | $ | 3 | | $ | — |
Morgan Stanley | | £ | 22 | GBP | | $ | 27 | USD | | 5/5/23 | | | — | | | — |
Total | | | | | | | | | | | | $ | 3 | | $ | — |
| (1) | Except as otherwise noted, all investments are non-controlled/non-affiliate investments as defined by the Investment Company Act of 1940, as amended (the “1940 Act”), provide collateral for the Company’s credit facility, and are domiciled in the United States. |
| (2) | The investments bear interest at a rate that may be determined by reference to the London Interbank Offered Rate (“LIBOR” or “L”), the Secured Overnight Financing Rate (“SOFR” or “SF”), the Canadian Dollar Offered Rate (“CDOR” or “C”), the Sterling Overnight Index Average (“SONIA” or “S”), or the U.S. Prime Rate (“Prime” or “P”) which may reset monthly, quarterly or semiannually. |
| (3) | The interest rate is the “all-in-rate” including the current index and spread, the fixed rate, and the payment-in-kind (“PIK”) interest rate, as the case may be. |
| (4) | The investment or a portion of the investment does not provide collateral for the Company’s credit facility. |
| (5) | Not a qualifying asset under Section 55(a) of the 1940 Act. Under the 1940 Act, the Company may not acquire any non-qualifying asset unless, at the time the acquisition is made, qualifying assets represent at least 70% of total assets. Qualifying assets represented 83.1% of total assets as of the date of the consolidated schedule of investments. |
| (6) | Investment is a non-controlled/affiliate investment as defined by the 1940 Act. |
| (7) | The investment has an unfunded commitment in addition to any amounts presented in the consolidated schedule of investments as of March 31, 2023. |
| (8) | Preferred equity investment is a non-income producing security. |
| (9) | Security is perpetual with no defined maturity date. |
| (10) | Except as otherwise noted, all of the Company’s portfolio company investments, which as of the date of the consolidated schedule of investments represented 227.03% of the Company’s net assets or 95.9% of the Company’s total assets, are subject to legal restrictions on sales. |
| (11) | The fair value of each investment was determined using significant unobservable inputs. |
| (12) | The investment was comprised of two contracts, which were indexed to different base rates, L or SF and P, respectively. The Floor, Spread Above Index and Interest Rate presented represent the weighted average of both contracts. |
| (13) | Principal amount is non-USD denominated and is based in Canadian dollars. |
| (14) | Investment is a controlled affiliate investment as defined by the 1940 Act. |
| (15) | Investment is structured as a unitranche loan in which the Company may receive additional interest on its “last out” tranche of the portfolio company’s senior term debt, which was previously syndicated into “first out” and “last out” tranches, whereby the “first out” tranche will have priority as to the “last out” tranche with respect to payments of principal, interest and any other amounts due thereunder. |
| (16) | In addition to the interest earned based on the stated interest rate of this security, the Company is entitled to receive an additional interest in the amount of 3.50% on its “last out” tranche of the portfolio company’s senior term debt, which was previously syndicated into “first out” and “last out” tranches, whereby the “first out” tranche will have priority as to the “last out” tranche with respect to payments of principal, interest and any other amounts due thereunder. |
| (17) | In addition to the interest earned based on the stated interest rate of this security, the Company is entitled to receive an additional interest in the amount of 3.00% on its “last out” tranche of the portfolio company’s senior term debt, which was previously syndicated into “first out” and “last out” tranches, whereby the “first out” tranche will have priority as to the “last out” tranche with respect to payments of principal, interest and any other amounts due thereunder. |
| (18) | On October 1, 2020, as part of a restructuring agreement between the Company and Arcole Acquisition Corp, the Company’s investments in first lien secured term loans to Arcole Acquisition Corp were converted into common shares of Arcole Holding Corp. |
| (19) | At the option of the issuer, interest can be paid in cash or cash and PIK. The issuer may elect to pay up to 1.50% PIK. |
| (20) | On January 24, 2022, as part of a restructuring agreement between the Company and PlayMonster LLC, the Company’s first lien secured term loan and delayed draw loan investments to PlayMonster LLC were converted into a new first lien secured term loan, preferred stock and common stock of Playmonster Group LLC. |
| (21) | Ownership of certain equity investments may occur through a holding company or partnership. |
| (22) | The issuer is domiciled in Guernsey. |
| (23) | The issuer is domiciled in Canada. |
| (24) | Investment is structured with a PIK period beginning with the first interest payment date through December 20, 2023, whereby accrued interest due on the loan is capitalized and added to the unpaid principal balance of the loan. |
| (25) | The investment is on non-accrual status. |
| (26) | In March 2023, as a result of a restructuring agreement between the Company and American Crafts, LC, the Company’s investments are controlled affiliate investments, as defined by the 1940 Act. |
| (27) | In March 2023, as part of a restructuring agreement between the Company and Sklar Holdings, Inc (d/b/a Starco), the Company’s first lien secured term loan investment was converted into a new first lien secured term loan, preferred stock and common stock of Pressurized Holdings, LLC (f/k/a Starco). |
| (28) | On January 14, 2019, the Company entered into an agreement with State Teachers Retirement System of Ohio, a public pension fund established under Ohio law (“STRS Ohio”), to create WHF STRS Ohio Senior Loan Fund, LLC (“STRS JV”), a joint venture, which invests primarily in senior secured first and second lien term loans. |
| |
Contacts | |
| |
Stuart Aronson | |
WhiteHorse Finance, Inc. | |
212-506-0500 | |
saronson@higwhitehorse.com | |
| |
or | |
| |
Joyson Thomas | |
WhiteHorse Finance, Inc. | |
305-379-2322 | |
jthomas@higwhitehorse.com | |
| |
or | |
| |
Robert Brinberg | |
| |
| |
| |
| |
Source: WhiteHorse Finance, Inc. | |
| Earnings Presentation Quarter Ended March 31, 2023 WhiteHorse Finance, Inc. NASDAQ: WHF (Common Stock) |
| 1 References in this presentation to “WHF”, “we”, “us”, “our” and “the Company” refer to WhiteHorse Finance, Inc. This presentation and the information and views included herein do not constitute investment advice, or a recommendation or an offer to enter into any transaction with the Company or any of its affiliates. Investors are advised to consider carefully the Company’s investment objectives, risks, charges and expenses before investing in the Company’s securities. Our annual reports on Form 10-K, quarterly reports on Form 10-Q and current reports on Form 8-K, which have been filed with the Securities and Exchange Commission (“SEC”), contain this and other information about the Company and should be read carefully before investing in the Company’s securities. The information in this presentation is not complete and may be changed. This presentation is not an offer to sell the Company’s securities and is not soliciting an offer to buy the Company’s securities in any jurisdiction where such offer or sale is not permitted. A shelf registration statement relating to the Company’s securities is on file with the SEC. A public offering of the Company’s securities may be made only by means of a prospectus and a related prospectus supplement, copies of which may be obtained by writing the Company at 1450 Brickell Avenue, 31st Floor, Miami, FL 33131, Attention: Investor Relations, or by calling (305) 381-6999; copies may also be obtained by visiting EDGAR on the SEC’s website at http://www.sec.gov. Forward Looking Statements Some of the statements in this presentation constitute forward-looking statements, which relate to future events or the Company’s future performance or financial condition. The forward-looking statements contained in this presentation involve risks and uncertainties, including statements as to: the Company’s future operating results; changes in political, economic or industry conditions, the interest rate environment or conditions affecting the financial and capital markets, which could result in changes to the value of the Company’s assets; the impact of the COVID-19 pandemic and its effects on the Company’s and its portfolio companies’ results of operations and financial condition; the Company’s business prospects and the prospects of its prospective portfolio companies; the impact of investments that the Company expects to make; the impact of increased competition; the Company’s contractual arrangements and relationships with third parties; the dependence of the Company’s future success on the general economy and its impact on the industries in which the Company invests; the ability of the Company’s prospective portfolio companies to achieve their objectives; the relative and absolute performance of the Company’s investment adviser; the Company’s expected financings and investments; the adequacy of the Company’s cash resources and working capital; the timing of cash flows, if any, from the operations of the Company’s prospective portfolio companies; and the impact of future acquisitions and divestitures. Such forward-looking statements may include statements preceded by, followed by or that otherwise include the words “may,” “might,” “will,” “intend,” “should,” “could,” “can,” “would,” “expect,” “believe,” “estimate,” “anticipate,” “predict,” “potential,” “plan” or similar words. The Company has based the forward-looking statements included in this presentation on information available to us on the date of this presentation, and the Company assumes no obligation to update any such forward-looking statements. Actual results could differ materially from those implied or expressed in the Company’s forward-looking statements for any reason, and future results could differ materially from historical performance. Although the Company undertakes no obligation to revise or update any forward-looking statements, whether as a result of new information, future events or otherwise, you are advised to consult any additional disclosures that are made directly to you or through reports that the Company in the future may file with the SEC, including annual reports on Form 10-K, quarterly reports on Form 10-Q and current reports on Form 8-K. For a further discussion of factors that could cause the Company’s future results to differ materially from any forward-looking statements, see the section entitled “Risk Factors” in the annual reports on Form 10-K and quarterly reports on Form 10-Q we file with the SEC. Important Information and Forward Looking Statements |
| 2 WhiteHorse Finance Snapshot Company: WhiteHorse Finance, Inc. (“WhiteHorse Finance” or the “Company”): Equity Ticker: NASDAQ: WHF Market Cap: $260.3MM(1) NAV / Share: $14.20 Portfolio Fair Value: $749.2MM Current Dividend Yield: 12.7%(1)(2); consistent quarterly dividends of $0.355 per share since 2012 IPO (1) Based on May 8, 2023 share price of $11.20. (2) Based on LTM dividend rate, excluding special dividends, relative to closing share price. External Manager: Affiliate of H.I.G. Capital, LLC (“H.I.G. Capital” or “H.I.G.”) |
| Overview of WhiteHorse Finance, Inc. 3 Portfolio at Fair Value ($MM) NAV + Cumulative Dividends per share Note: As of December 31st, of each respective year presented, unless otherwise noted. (1) Based on total capital commitments managed by H.I.G. Capital and affiliates. (2) Based on fair value. Does not include investments in STRS JV. Source: Company filings WhiteHorse Finance, Inc. is a publicly listed Business Development Company (“BDC”) that completed its IPO in December 2012 WhiteHorse Finance’s investment activities are managed by H.I.G. WhiteHorse Advisers, LLC, an affiliate of H.I.G. Capital, a leading global alternative asset manager with over $55Bn of capital under management(1) Principally focused on originating senior secured loans to performing lower middle market companies with individual enterprise values generally between $50MM and $350MM Diversified investment portfolio totaling $749.2MM as of March 31, 2023 Investments across 116 positions in 70 portfolio companies as of March 31, 2023 − Average Investment Size(2): $5.7MM (Average Debt Investment Size(2): $7.2MM) − Largest Portfolio Company Investment(2): $22.5MM Invested $2,487MM in 215 transactions since December 2012 IPO The Company and State Teachers Retirement System of Ohio (“STRS Ohio”), a public pension fund established under Ohio law, partnered to create WHF STRS Ohio Senior Loan Fund LLC (“STRS JV”), a joint venture formed to invest in directly originated, senior secured first and second lien term loans. $180.5 $272.4 $403.5 $415.3 $411.7 $440.7 $469.6 $589.7 $690.7 $819.2 $760.2 $749.2 2012 2013 2014 2015 2016 2017 2018 2019 2020 2021 2022 Q1 2023 $15.30 $15.16 $15.04 $13.33 $13.63 $13.98 $15.35 $15.23 $15.23 $15.10 $14.30 $14.20 $0.11 $1.53 $2.95 $4.37 $5.79 $7.21 $8.63 $10.25 $11.79 $13.35 $14.82 $15.24 $15.41 $16.69 $17.99 $17.70 $19.42 $21.19 $23.98 $25.48 $27.02 $28.45 $29.12 $29.44 2012 2013 2014 2015 2016 2017 2018 2019 2020 2021 2022 Q1 2023 Net asset value Cumulative dividends paid (including special dividends) |
| 4 Overview of WhiteHorse Finance, Inc. (continued) Note: As of March 31, 2023, unless otherwise noted. (1) Reflects life-to-date since IPO and may exclude follow-on transactions and investments in STRS JV made via asset transfers in-kind. (2) Across 114 investments. Does not include investments in STRS JV. (3) Reflects weighted average effective yield of income-producing debt investments. Weighted average effective yield for entire portfolio, including equities and investments in STRS JV, as of March 31, 2023, is 12.6%. Weighted average effective yield is computed by dividing (a) annualized interest income (including interest income resulting from the amortization of fees and discounts) by (b) the weighted average cost of investments. (4) Measured at origination based on borrower reporting and WHF’s target underwriting leverage. Does not include investments in STRS JV. (5) Based on fair value. Does not include the Company’s investments in STRS JV. Generate attractive risk-adjusted return in all market conditions by originating and investing in senior secured loans to performing lower middle market companies and leveraging the knowledge of H.I.G. Capital Differentiated proprietary deal flow from over 65 dedicated deal professionals sourcing through direct coverage of financial sponsors and intermediaries Rigorous credit process focused on fundamental analysis with emphasis on downside protection and cash flow visibility 10-person investment committee with more than 250 years of industry experience Investment strategy focused on first lien and second lien senior secured investments in lower middle market companies with a target hold size of $5MM to $25MM Summary Stats: Invested Capital since IPO: $2,487MM(1) Number of Investments Made: ~215(1) Average Investment Size: ~$5.7MM(2) All-in Yield: 13.2%(3) Net Debt / EBITDA of Current Portfolio Companies: ~4.0x(4) Secured Debt as a % of Total Debt: ~100%(5) Investment Strategy |
| 5 Summary of Quarterly Results Fiscal Quarter Highlights Total investments at fair value decreased to $749.2 million in Q1 2023 as compared with $760.2 million in Q4 2022. The Company made investments in three new portfolio companies for gross deployments of $18.8 million and made add-on investments totaling $15.3 million. The Company transferred seven investments to the STRS JV totaling $25.9 million. The Company received additional dispositions and principal repayments of $19.3 million. The weighted average effective yield on income-producing investments at the end of Q1 2023 was approximately 13.2% as compared with approximately 12.6% at the end of the prior quarter. Q1 Net Investment Income (“NII”) was $10.7 million, or $0.461 per share, which compares with Q4 NII of $11.1 million, or $0.476 per share. Q1 Core NII(1) was $10.7 million, or $0.461 per share, compared with the quarterly distribution of $0.355 per share. This compares with Q4 Core NII of $11.1 million, or $0.476 per share. Net realized and unrealized losses on investments and foreign currency transactions for Q1 2023 were $3.2 million primarily driven by unrealized losses from market related markdowns across the portfolio. NAV per share at the end of Q1 2023 was $14.20 per share compared with $14.30 per share from Q4 2022. Gross leverage levels decreased during the quarter to 1.30x from 1.34x at the end of Q4 2022. Cash on-hand at the end of Q1 2023 was $22.2 million resulting in net leverage of 1.23x as compared with 1.26x at the end of Q4 2022. As of March 31, 2023, STRS JV had total assets of $324.6 million. The Company’s return on its investment in STRS JV at the end of Q1 2023 was 16.1%(2). (1) Core net investment income is a non-GAAP financial measure. Refer to next slide for components and discussion of core net investment income. Additional information on core net investment income and a reconciliation of core net investment income to its most directly comparable GAAP financial measure, net investment income, can also be found by accessing the earnings releases posted to the Company’s website at http://www.whitehorsefinance.com. (2) Computed as the annual stated rate of the subordinated notes, based on the subordinated notes outstanding as of the period, and dividends received over the last twelve-month period, based on average capital invested. |
| 6 Quarterly Operating Highlights Note: Numbers may not foot due to rounding. (1) Total investment income includes investment income (e.g., interest and dividends) from investments in STRS JV. (2) Core net investment income is a non-GAAP financial measure. The Company believes that core net investment income provides useful information to investors and management because it reflects the Company's financial performance excluding (i) the net impact of costs associated with the refinancing of the Company's indebtedness, (ii) the accrual of the capital gains incentive fee attributable to realized and unrealized gains and losses, and (iii) certain excise or other income taxes (net of incentive fees). The presentation of this additional information is not meant to be considered in isolation or as a substitute for financial results prepared in accordance with GAAP. Additional information on core net investment income and a reconciliation of core net investment income to its most directly comparable GAAP financial measure, net investment income, can be found by accessing the earnings releases posted to the Company’s website at http://www.whitehorsefinance.com. Source: Company filings Unaudited Quarterly Financials Q4 2021 Q1 2022 Q2 2022 Q3 2022 Q4 2022 Q1 2023 (USD in MM, except per share data) Total Investment Income(1) $ 18.5 $ 20.0 $ 20.0 $ 21.6 $ 25.9 $ 26.2 Expenses Interest Expense 5.1 4.8 4.9 5.6 6.6 7.5 Base Management Fees 3.8 4.0 3.9 3.9 3.9 3.7 Performance-based Incentive Fees 0.8 1.4 1.8 1.0 2.8 2.7 Other Expenses 1.3 1.3 1.5 1.3 1.5 1.6 Total Expenses 11.0 11.5 12.1 11.8 14.8 15.5 Net Investment Income $ 7.5 $ 8.5 $ 7.9 $ 9.8 $ 11.1 $ 10.7 Net Realized and Unrealized Gain / (Loss) (4.3) (2.8) (0.5) (5.9) (12.3) (3.2) Net Increase in Net Assets from Operations $ 3.2 $ 5.7 $ 7.4 $ 3.9 $ (1.2) $ 7.5 Per Share Net Investment Income (NII) $ 0.33 $ 0.37 $ 0.34 $ 0.4 2 $ 0.48 $ 0.4 6 Core NII(2) $ 0.32 $ 0.34 $ 0.33 $ 0.37 $ 0.48 $ 0.4 6 Net Realized and Unrealized Gain / (Loss) $ (0.19) $ (0.12) $ (0.02) $ (0.25) $ (0.53) $ (0.14) Earnings $ 0.14 $ 0.2 5 $ 0.32 $ 0.17 $ (0.05) $ 0.32 Dividends Declared $ 0.35 5 $ 0.35 5 $ 0.35 5 $ 0.35 5 $ 0.35 5 $ 0.35 5 Special Dividends Declared $ 0.13 5 $ - $ - $ - $ 0.050 $ 0.070 Core NII Dividend Coverage 91% 97% 94% 105% 134% 130% |
| 7 Quarterly Balance Sheet Highlights Note: Numbers may not foot due to rounding (1) Includes Restricted Cash. (2) Calculated as Total Gross Debt Outstanding divided by Total Net Assets. (3) Net Leverage Ratio is defined as debt outstanding less cash, divided by total net assets. (4) Fundings, exits and repayments may include cash flows on revolver investments as well as non-cash transactions (e.g., PIK, equity issuances). Unaudited Quarterly Financials Q4 2021 Q1 2022 Q2 2022 Q3 2022 Q4 2022 Q1 2023 (USD in MM, except per share data) Assets Investments at Fair Value $ 819.2 $ 800.4 $ 766.5 $ 764.6 $ 760.2 $ 749.2 Cash and Equivalents(1) 22.5 21.3 18.6 19.3 26.3 22.2 Other Assets 9.3 17.1 14.5 12.8 10.0 9.6 Total Assets $ 851.0 $ 838.8 $ 799.6 $ 796.7 $ 796.5 $ 781.0 Liabilities Debt (net of issuance costs) 476.0 467.9 423.2 431.0 440.4 423.7 Other Liabilities 25.2 23.0 29.0 22.7 23.7 27.3 Total Liabilities $ 501.2 $ 490.9 $ 452.2 $ 453.7 $ 464.1 $ 451.0 Total Net Assets $ 349.8 $ 347.9 $ 347.4 $ 343.0 $ 332.4 $ 330.0 Total Liabilities and Net Assets $ 851.0 $ 838.8 $ 799.6 $ 796.7 $ 796.5 $ 781.0 Net Asset Value per Share $ 15.1 0 $ 14.9 9 $ 14.9 5 $ 14.7 6 $ 14.3 0 $ 14.2 0 Leverage Ratio(2) 1.38x 1.36x 1.23x 1.27x 1.34x 1.30x Net Leverage Ratio(3) 1.31 x 1.30x 1.18x 1.22x 1.26x 1.23x Gross Fundings (4) 215.4 103. 6 66.9 53.3 56.3 37.3 Exits and Repayments (4) (80.3) (121.0) (101.2) (49.6) (51.3) (48.2) Net Fundings/(Repayments) $ 135.1 $ (17.4) $ (34.3) $ 3. 7 $ 5. 0 $ (10.9) |
| Portfolio Highlights 8 Note: Not a guarantee of future performance or investment pace. (1) Does not include investments in STRS JV. (2) Calculated based on funded principal amounts of debt investments. (3) Weighted average effective yield is computed by dividing (a) annualized interest income (including interest income resulting from the amortization of fees and discounts) by (b) the weighted average cost of investments. (4) Weighted average effective yield for entire portfolio, including equities and investments in STRS JV. (5) Includes STRS JV Subordinated Note. Source: Company filings ($ in MM, except per share data) Portfolio Investment Q4 2021 Q1 2022 Q2 2022 Q3 2022 Q4 2022 Q1 2023 Total Fair Value of Investments $ 819.2 $ 800.4 $ 766.5 $ 764.6 $ 760.2 $ 749.2 Number of Portfolio Investments 127 111 105 107 115 116 Number of Portfolio Companies 76 68 68 68 72 70 Average Investment Size(1) $ 5.9 $ 6.4 $ 6.4 $ 6.3 $ 5.8 $ 5.7 Average Borrower Size(1) $ 9.9 $ 10.4 $ 9.9 $ 9.9 $ 9.3 $ 9.4 Average Debt Investment Size(1) $ 6.8 $ 7.7 $ 7.9 $ 7.7 $ 7.0 $ 7.2 Fair Value as a Percentage of Principal(1)(2) 96.5% 98.5% 97.6% 96.5% 95.6% 95.1% Total Portfolio Effective Yield(3) Q4 2021 Q1 2022 Q2 2022 Q3 2022 Q4 2022 Q1 2023 Weighted average effective yield on income-producing debt investments(1) 9.1% 9.2% 9.9% 11.4% 12.6% 13.2% Weighted average effective yield on total portfolio(4) 9.0% 9.3% 9.9% 11.0% 12.2% 12.6% Portfolio Composition - Floating vs. Fixed Investments (Debt Investments at Fair Value)(1) Q4 2021 Q1 2022 Q2 2022 Q3 2022 Q4 2022 Q1 2023 Percentage of fixed rate investments 0.4% 0.4% 0.4% 0.4% 0.4% 0.4% Percentage of floating rate investments 99.6% 99.6% 99.6% 99.6% 99.6% 99.6% Portfolio Composition - Sponsor vs. Non-Sponsor (Fair Value)(1) Q4 2021 Q1 2022 Q2 2022 Q3 2022 Q4 2022 Q1 2023 Sponsor 66.9% 60.5% 59.8% 60.7% 62.3% 65.4% Non-Sponsor 33.1% 39.5% 40.2% 39.3% 37.7% 34.6% Total Portfolio Composition by Instrument Type (Fair Value) Q4 2021 Q1 2022 Q2 2022 Q3 2022 Q4 2022 Q1 2023 First lien secured loans 85.1% 81.0% 80.3% 80.6% 81.3% 81.2% Second lien secured loans 2.9% 3.0% 2.9% 2.7% 2.7% 2.6% Subordinated debt 0.0% 0.0% 0.0% 0.0% 0.0% 0.0% STRS JV 9.2% 12.6% 13.3% 13.3% 13.2% 13.4% Equity 2.8% 3.4% 3.5% 3.4% 2.8% 2.8% Investments on Non-Accrual Status (Debt Investments) Q4 2021 Q1 2022 Q2 2022 Q3 2022 Q4 2022 Q1 2023 Fair Value of Investments on Non-accrual Status $ 10.0 $ - $ - $ - $ - $ 2.7 Cost of Investments on Non-accrual Status $ 24.5 $ - $ - $ - $ - $ 3.7 % of Investments on Non-accrual Status (Based on Fair Value of Debt Investments)(5) 1.3% 0.0% 0.0% 0.0% 0.0% 0.4% % of Investments on Non-accrual Status (Based on Cost of Debt Investments)(5) 3.1% 0.0% 0.0% 0.0% 0.0% 0.5% |
| Portfolio Trends Historical Portfolio Trends 9 % Floating and % Fixed (Based on Fair Value) % Instrument Type (Based on Fair Value) % Sponsored / Non-Sponsored (Based on Fair Value) % Non Accruals (Based on Fair Value of Debt Investments)(1) Note: As of end of each year/quarter presented, unless otherwise noted; percentages may not add up to 100% due to rounding. Not a guarantee of future performance or investment pace. (1) Based on fair value of debt investments, including STRS JV Subordinated Note. 99.8% 99.9% 100.0% 100.0% 99.8% 99.6% 99.6% 99.6% 0.2% 0.1% 0.2% 0.4% 0.4% 0.4% 0.0% 20.0% 40.0% 60.0% 80.0% 100.0% 2016 2017 2018 2019 2020 2021 2022 Q1 2023 Floating Fixed 60% 52% 77% 81% 85% 85% 81% 81% 33% 39% 21% 11% 4% 3% 3% 3% 7% 9% 3% 3% 3% 3% 3% 3% 6% 7% 9% 13% 13% 2016 2017 2018 2019 2020 2021 2022 Q1 2023 % First Lien Loans % Second Lien Loans % Equity STRS JV % Subordinated 32% 32% 44% 53% 58% 67% 62% 65% 68% 68% 56% 47% 42% 33% 38% 35% 0.0% 20.0% 40.0% 60.0% 80.0% 100.0% 2016 2017 2018 2019 2020 2021 2022 Q1 2023 Sponsor Non-Sponsor 3.9% 7.4% 3.3% 1.8% 2.5% 1.5% 1.3% 1.3% 0.0% 0.0% 0.0% 0.0% 0.4% 0.0% 2.0% 4.0% 6.0% 8.0% 10.0% Q1'20 Q2'20 Q3'20 Q4'20 Q1'21 Q2'21 Q3'21 Q4'21 Q1'22 Q2'22 Q3'22 Q4'22 Q1'23 % of Investments on Non-accrual |
| 13.4% 3.0% 3.0% 2.8% 2.7% 2.3% 2.2% 2.2% 2.2% 2.1% 64.1% STRS JV Future Payment Technologies, L.P. ABB/Con-cise Optical Group LLC Sleep OpCo LLC Bulk Midco, LLC Arcstor Midco, LLC Telestream Holdings Corporation BBQ Buyer, LLC Empire Office, Inc. FGI Acquisition Corp. Other 10 Note: As of March 31, 2023, unless otherwise noted; percentages may not add up to 100% due to rounding. (1) Does not include investments in STRS JV. Industry classifications based on GICS. Composition by Borrower (Based on Fair Value) Composition by Industry(1) (Based on Fair Value) Borrower and Industry Diversity 5.6% 5.5% 4.5% 3.9% 3.8% 3.6% 3.6% 3.5% 3.4% 3.4% 3.4% 3.2% 52.6% Broadline Retail Application Software Office Services & Supplies Home Furnishings Building Products Specialized Consumer Services Health Care Services Data Processing & Outsourced Services Health Care Supplies Leisure Facilities Research & Consulting Services Cable & Satellite Other STRS JV ~100% of WHF loans are senior secured |
| Effective Yield & Dividend Coverage Debt Portfolio Effective Yield and Borrower Leverage(1) From IPO to March 31, 2023 11 Core NII(2) to Dividend Coverage(3) Note: Amounts may not foot due to rounding. (1) Portfolio leverage is based on investment leverage at inception. (2) Core net investment income is a non-GAAP financial measure. The Company believes that core net investment income provides useful information to investors and management because it reflects the Company's financial performance excluding (i) the net impact of costs associated with the refinancing of the Company's indebtedness, (ii) the accrual of the capital gains incentive fee attributable to realized and unrealized gains and losses, and (iii) certain excise or other income taxes (net of incentive fees). The presentation of this additional information is not meant to be considered in isolation or as a substitute for financial results prepared in accordance with GAAP. The presentation of this additional information is not meant to be considered in isolation or as a substitute for financial results prepared in accordance with GAAP. Additional information on core net investment income and a reconciliation of core net investment income to its most directly comparable GAAP financial measure, net investment income, can be found by accessing the earnings releases posted to the Company’s website at http://www.whitehorsefinance.com (3) Does not include special dividends. Source: Company filings Covered by $0.01 Covered by $0.04 Covered by $0.03 Missed by $0.09 Missed by $0.02 Missed by $0.02 Covered by $0.02 Missed by $0.10 Covered by $0.02 Missed by $0.01 Covered by $0.01 Missed by $0.04 Covered by $0.01 Missed by $0.03 Covered by $0.12 2.8x 2.4x 4.1x 3.4x 3.4x 2.1x 4.5x 3.0x 3.8x 2.3x 3.1x 2.7x 3.0x 3.6x 2.9x 3.4x 3.2x 3.5x 3.4x 3.4x 3.2x 3.3x 3.3x 3.5x 3.6x 3.6x 3.6x 3.6x 3.7x 3.8x 3.7x 3.8x 4.0x 4.1x 4.1x 4.1x 4.0x 4.1x 4.1x 4.0x 4.0x 15.5% 14.9% 13.1% 11.8% 11.7% 11.1% 10.7% 11.3% 11.4% 11.7% 11.6% 11.8% 11.9% 11.9% 12.1% 11.8% 11.8% 11.9% 11.9% 11.9% 12.0% 12.0% 11.9% 11.9% 11.7% 11.3% 11.1% 10.4% 9.9% 9.6% 9.9% 9.9% 9.6% 9.5% 9.3% 9.1% 9.2% 9.9% 11.4% 12.6% 13.2% Borrower Leverage through WHF Security Effective Yield $0.36 $0.40 $0.39 $0.27 $0.26 $0.38 $0.35 $0.38 $0.34 $0.37 $0.32 $0.34 $0.33 $0.37 $0.48 $0.46 $0.36 $0.36 $0.36 $0.36 $0.36 $0.36 $0.36 $0.36 $0.36 $0.36 $0.36 $0.36 $0.36 $0.36 $0.36 $0.36 Q2'19 Q3'19 Q4'19 Q1'20 Q2'20 Q3'20 Q4'20 Q1'21 Q2'21 Q3'21 Q4'21 Q1'22 Q2'22 Q3'22 Q4'22 Q1'23 Core NII per share Dividends per share Covered by $0.10 |
| Yield & Interest Rate Economic Analysis 12 (1) Weighted average effective yield is computed by dividing (a) annualized interest income (including interest income resulting from the amortization of fees and discounts) by (b) the weighted average cost of investments. (2) Income yield is calculated as (a) the actual amount earned on earning investments, including interest and fee income but excluding amortization of capitalized fees and discounts. (3) Calculated as (a) effective yield less (b) weighted average cost of debt. (4) The weighted average cost of debt is calculated as (a) the actual amount of expenses incurred on debt obligations divided by (b) the daily average of total debt obligations. (5) The base reference rate represents the weighted average base rate for the quarter applied on the JPM Revolving Credit Facility borrowings. 11.3% 11.1% 10.4% 9.9% 9.6% 9.9% 9.9% 9.6% 9.5% 9.3% 9.1% 9.2% 9.9% 11.4% 12.6% 13.2% 11.0% 10.7% 10.0% 9.5% 9.1% 9.4% 9.4% 9.1% 9.0% 8.8% 8.6% 8.8% 9.4% 10.8% 12.1% 12.6% 5.7% 5.7% 5.5% 5.2% 5.4% 6.2% 6.1% 5.7% 5.7% 5.7% 5.7% 5.7% 5.9% 6.8% 7.1% 7.1% 5.6% 5.4% 4.9% 4.7% 4.2% 3.7% 3.8% 3.8% 3.8% 3.6% 3.4% 3.5% 4.0% 4.6% 5.5% 6.1% 2.6% 2.3% 2.3% 1.7% 1.0% 0.3% 0.2% 0.2% 0.2% 0.1% 0.2% 0.3% 0.9% 2.1% 3.7% 4.8% 0.0% 2.0% 4.0% 6.0% 8.0% 10.0% 12.0% 14.0% Q2'19 Q3'19 Q4'19 Q1'20 Q2'20 Q3'20 Q4'20 Q1'21 Q2'21 Q3'21 Q4'21 Q1'22 Q2'22 Q3'22 Q4'22 Q1'23 Effective Yield⁽¹⁾ Income Yield⁽²⁾ Net Investment Spread⁽³⁾ Weighted Average Cost of Debt⁽⁴⁾ Base reference rate⁽⁵⁾ |
| Investment Performance Ratings 13 Investment Performance Ratings (% of Portfolio at Fair Value) Rating 2012 2013 2014 2015 2016 2017 2018 2019 2020 2021 2022 Q1 2023 1 6.3% 2.3% 22.2% 15.4% 8.6% 12.3% 2 100.0% 92.4% 100.0% 90.3% 87.0% 83.9% 80.1% 83.3% 61.1% 74.7% 66.2% 60.9% 3 7.6% 7.9% 13.0% 16.1% 13.6% 13.1% 15.0% 8.9% 22.2% 25.0% 4 0.0% 0.0% 0.0% 0.6% 1.0% 3.0% 1.8% 5 1.8% 0.0% 1.3% 1.1% - - - 100.0% 100.0% 100.0% 100.0% 100.0% 100.0% 100.0% 100.0% 100.0% 100.0% 100.0% 100.0% Investment Perfomance Rating Definitions Rating Definition 1 The portfolio company's risk of loss has been reduced relative to initial expectations. 2 The portfolio company is meeting initial expectations with regard to performance and outlook. 3 The investment's risk of loss has increased relative to initial expectation. 4 Investment principal is at a material risk of not being fully repaid. 5 Investment is in payment default and has significant risk of not receiving full repayment. |
| Net Asset Value Trends 14 *As a supplement to GAAP financial measures, the Company has provided this non-GAAP measure. The Company believes that this non-GAAP financial measure is useful as it highlights the changes in NAV per share of common stock for each quarter excluding the impact of special dividends that were paid and shows the pro forma to the Company’s NAV per share after payment of regular distributions. Net Asset Value Per Share 15.43 15.55 15.56 14.81 14.78 15.00 15.30 15.16 15.04 13.33 13.63 13.98 15.35 15.23 15.23 15.10 14.30 14.20 $13.00 $13.50 $14.00 $14.50 $15.00 $15.50 $16.00 Net Asset Value if No Special Dividends Were Paid* Net Asset Value |
| NAV Per Share Bridge 15 Note: Numbers may not foot due to rounding. Core net investment income is a non-GAAP financial measure. The Company believes that core net investment income provides useful information to investors and management because it reflects the Company's financial performance excluding (i) the net impact of costs associated with the refinancing of the Company's indebtedness, (ii) the accrual of the capital gains incentive fee attributable to realized and unrealized gains and losses, and (iii) certain excise or other income taxes (net of incentive fees). The presentation of this additional information is not meant to be considered in isolation or as a substitute for financial results prepared in accordance with GAAP. Additional information on core net investment income and a reconciliation of core net investment income to its most directly comparable GAAP financial measure, net investment income, can be found by accessing the earnings releases posted to the Company’s website at http://www.whitehorsefinance.com. Source: Company filings |
| 12/31/2022 Quarterly Change 03/31/2023 Outstanding Debt: Outstanding Debt: $445.1 ($17.1) $428.0 Driven by net paydowns and sales of portfolio investments NAV: NAV: $332.4 ($2.4) $330.0 Driven by net realized and unrealized losses Leverage Migration 16 Note: Numbers may not foot due to rounding. ($ in MM) Leverage Ratio: 1.30x Leverage Ratio: 1.34x Sales & Principal Payments 48.2 $ Acquisition of Investments $37.3 Borrowings 20.0 Debt Paydown 37.5 Net Investment Income 10.7 Dividend Payment, net of distributions reinvested 8.3 Balance Sheet Cash 4.0 Other Balance Sheet Changes 0.2 Total $83.1 Total $83.1 Sources Uses |
| Note: As of end of each quarter presented, unless otherwise noted. Not a guarantee of future performance or investment pace. (1) As of March 31, 2023, WHF had $4.3MM of deferred debt issuance costs. (2) Gross leverage excluding cash. (3) Credit Facility bears interest at LIBOR plus 2.35% on outstanding USD denominated borrowings up to $285.0 and SOFR plus 2.50% on borrowings above $285.0. 3 Current Debt Outstanding (as of March 31, 2023) ($ in MM) Commitment Outstanding(1) Weighted Average Interest Rate Maturity Revolving Credit Facility(3) $335.0 (Accordion Feature up to $375) $238.0 L+2.350% payable quarterly 2025 6.000% 2023 Notes $30.0 $30.0 6.000% payable semi-annually; unsecured 2023 5.375% 2025 Notes $40.0 $40.0 5.375% payable semi-annually; unsecured 2025 5.375% 2026 Notes $10.0 $10.0 5.375% payable semi-annually; unsecured 2026 4.000% 2026 Notes $75.0 $75.0 4.000% payable semi-annually; unsecured 2026 5.625% 2027 Notes $10.0 $10.0 5.625% payable semi-annually; unsecured 2027 4.250% 2028 Notes $25.0 $25.0 4.250% payable semi-annually; unsecured 2028 Total Debt $525.0 $428.0 6.2% weighted average cost of debt Total Shareholders’ Equity/Net Assets $330.0 NA Funding Profile 17 Gross Debt to Equity(2) 1.0x-1.35x Target Leverage 0.79x 0.75x 0.97x 1.04x 0.86x 0.94x 1.25x 1.08x 1.14x 1.19x 1.38x 1.36x 1.23x 1.27x 1.34x 1.30x 0.00x 0.50x 1.00x Q2'19 Q3'19 Q4'19 Q1'20 Q2'20 Q3'20 Q4'20 Q1'21 Q2'21 Q3'21 Q4'21 Q1'22 Q2'22 Q3'22 Q4'22 Q1'23 Debt/ Equity |
| 18 Appendix |
| Origination Footprint (as of March 31, 2023) Regional Direct Origination Footprint Scope of H.I.G. WhiteHorse market coverage results in consistent investment activity levels regardless of market conditions Dedicated direct lending team of approximately 65 investment and origination professionals Regional footprint with ~25 dedicated direct lending originators in 12 North American offices Global platform of approximately 560 investment professionals across 18 offices in 9 countries and 3 continents Additional 25 generalist business development professionals dedicated to sourcing proprietary opportunities in the lower to middle market 19 |
| Note: As of end of each quarter presented, unless otherwise noted. Not a guarantee of future performance or investment pace. As of March 31, 2023 STRS JV had $1.7MM of deferred debt issuance costs. (1) Credit Facility bears interest at LIBOR plus 2.35% on outstanding USD denominated borrowings up to $175.0 and SOFR plus 2.71% on borrowings above $175.0. 3 ($ in MM) Commitment Outstanding(1) Weighted Average Interest Rate Maturity Revolving Credit Facility(1) $262.5 ($75 Accordion Feature) $168.8 L+2.35% payable quarterly 2025 Subordinated Note $140.0 $121.7 L+6.50% payable quarterly N/A Total Debt $402.5 $290.5 8.7% weighted average cost of debt Equity $35.0 $30.4 N/A N/A STRS JV Key Terms and Funding Profile 20 Key Terms WHF and STRS Ohio have committed to provide up to $175 million in subordinated notes and equity to STRS JV, with STRS Ohio providing $60 million and WHF providing $115 million. WHF and STRS Ohio share voting control 50%/50%. Equity ownership of 65.71% WHF and 34.29% STRS An affiliate of H.I.G. provides day-to-day administrative oversight Current Debt Outstanding (as of March 31, 2023) ($ in MM) |
| 21 Note: As of March 31, 2023, unless otherwise noted; percentages may not add up to 100% due to rounding. (1) Industry classifications based on GICS. Composition by Borrower (Based on Fair Value) Composition by Industry(1) (Based on Fair Value) 100% of STRS JV loans are senior secured STRS JV Borrower and Industry Diversity 6.1% 5.1% 4.8% 4.7% 4.7% 4.6% 4.6% 4.3% 4.3% 4.3% 52.5% Marlin DTC-LS Midco 2, LLC Meta Buyer LLC Source Code Holdings, LLC Geo Logic Systems Ltd. RCKC Acquisitions LLC Cennox, Inc. Drew Foam Companies Inc MEP-TS Midco, LLC LMG Holdings, Inc. Juniper Landscaping Holdings LLC Other 14.4% 8.7% 6.1% 5.5% 5.1% 4.8% 4.7% 4.8% 4.6% 4.3% 4.3% 3.9% 28.8% IT Consulting & Other Services Environmental & Facilities Services Broadline Retail Industrial Machinery & Supplies & Components Pharmaceuticals Construction & Engineering Technology Hardware, Storage & Peripherals Data Processing & Outsourced Services Building Products Application Software Electronic Equipment & Instruments Advertising Other |
| Origination Pipeline Funnel(1) 22 (1) Origination Pipeline figures reflect 2014 through March 31, 2023. Three tier sourcing platform, generating meaningful investable opportunities for WhiteHorse Finance Over 60 WhiteHorse deal professionals dedicated to sourcing and underwriting for WHF 20+ person business development team seeks opportunities from H.I.G.’s proprietary database of over 21,000 contacts (telephonic salesforce) With access to H.I.G. Capital’s extensive sourcing network, the Company is able to capitalize on attractive self-originated lower middle market transactions as compared to the broadly syndicated market Directly originated loans to lower middle market companies typically generate more attractive risk-adjusted returns relative to larger, broadly syndicated credits Typical Underwriting Process: 3-6 months Opportunities Reviewed Initial Due Diligence Term Sheets Delivered Transactions Closed Deals being sourced by over 500 Investment Professionals across H.I.G.’s platform Total % of Sourced 9,611 100.0% 2,202 22.9% 600 6.2% 222 2.3% |
| Board of Directors Investment Committee Corporate Officers Research Coverage Corporate Counsel John Bolduc Sami Mnaymneh Stuart Aronson Bryce Rowe Dechert LLP Chairman of the Board Founder and Co‐CEO of H.I.G. Capital Chief Executive Officer B. Riley FBR New York, NY Stuart Aronson Anthony Tamer Marco Collazos Erik Zwick Corporate Headquarters Director Founder and Co‐CEO of H.I.G. Capital Chief Compliance Officer Hovde Group 1450 Brickell Avenue 31st Floor Jay Carvell Stuart Aronson Joyson Thomas Melissa Wedel Miami, FL 33131 Director Chief Executive Officer and Director Chief Financial Officer J.P. Morgan Transfer Agent Kevin F. Burke Mark Bernier Mickey Schleien American Stock Transfer & Independent Director Managing Director of WhiteHorse Capital Ladenburg Thalmann & Co. Inc. Trust Company, LLC New York, NY Rick P. Frier John Bolduc Mitchel Penn Independent Director Chairman of the Board, Executive Managing Oppenheimer & Co. Investor Relations Contact Director of H.I.G. Capital 1450 Brickell Avenue Rick D. Puckett Robert Dodd 31st Floor Independent Director Javier Casillas Raymond James Attention: Investor Relations Managing Director of WhiteHorse Capital Miami, FL 33131 G. Stacy Smith (305) 381‐6999 Independent Director Pankaj Gupta Global Head of Originations and Managing Director of WhiteHorse Capital Independent Registered Public Accounting Firm David Indelicato Crowe LLP Managing Director of WhiteHorse Capital New York, NY Brian Schwartz Securities Listing Co‐President of H.I.G. Capital NASDAQ: WHF John Yeager Please visit our website at: Managing Director of WhiteHorse Capital www.whitehorsefinance.com 23 Corporate Data |