
UNITED STATES
SECURITIES AND EXCHANGE COMMISSION
Washington, D.C. 20549
FORM
CURRENT REPORT
Pursuant to Section 13 OR 15(d) of The Securities Exchange Act of 1934
Date of Report (Date of earliest event reported):
May 9, 2023 (
(Exact name of registrant as specified in its charter)
(State or other jurisdiction of incorporation)
| (Commission File Number) | (I.R.S. Employer Identification No.) |
| (Address of principal executive offices) | (Zip Code) |
Registrant’s telephone number, including
area code: (
Not Applicable
(Former name or former address, if changed since last report)
Check the appropriate box below if the Form 8-K filing is intended to simultaneously satisfy the filing obligation of the registrant under any of the following provisions:
| Written communications pursuant to Rule 425 under the Securities Act (17 CFR 230.425) |
| Soliciting material pursuant to Rule 14a-12 under the Exchange Act (17 CFR 240.14a-12) |
| Pre-commencement communications pursuant to Rule 14d-2(b) under the Exchange Act (17 CFR 240.14d-2(b)) |
| Pre-commencement communications pursuant to Rule 13e-4(c) under the Exchange Act (17 CFR 240.13e-4(c)) |
Securities registered pursuant to Section 12(b) of the Act:
| Title of each class | Trading Symbol(s) | Name of each exchange on which registered |
Indicate by check mark whether the registrant is an emerging growth company as defined in Rule 405 of the Securities Act of 1933 (§230.405 of this chapter) or Rule 12b-2 of the Securities Exchange Act of 1934 (§240.12b-2 of this chapter).
Emerging growth company
If an emerging growth company, indicate by check mark if the registrant has elected not to use the extended transition period for complying with any new or revised financial accounting standards provided pursuant to Section 13(a) of the Exchange Act. ¨
| Item 2.02. | Results of Operations and Financial Condition. |
On May 9, 2023, Veritiv Corporation (the “Company”) issued a press release containing certain financial results of the Company and its direct and indirect wholly-owned subsidiaries for the three months ended March 31, 2023. A copy of this press release is attached as Exhibit 99.1 to this Current Report on Form 8-K.
| Item 7.01. | Regulation FD Disclosure. |
The Company is furnishing herewith additional information in conjunction with the May 9, 2023 earnings release. This additional information includes general Company information and highlights of financial results of the Company and its direct and indirect wholly-owned subsidiaries for the three months ended March 31, 2023. The additional information, attached as Exhibit 99.2 to this Current Report on Form 8-K, is being furnished and will not be deemed “filed” for the purposes of Section 18 of the Securities Exchange Act of 1934, as amended, or otherwise subject to the liabilities of that Section.
The information in this Current Report on Form 8-K will not be incorporated by reference into any registration statement or other document filed by the Company under the Securities Act of 1933, as amended, unless specifically identified therein as being incorporated by reference.
| Item 9.01. | Financial Statements and Exhibits. |
(d) Exhibits.
The following exhibits are included with this report:
| Exhibit No. | Exhibit Description | |
| 99.1 | Press Release of Veritiv Corporation issued May 9, 2023. | |
| 99.2 | Additional Information of Veritiv Corporation issued May 9, 2023. | |
| 104 | Cover Page Interactive Data File (embedded within the Inline XBRL document). |
SIGNATURES
Pursuant to the requirements of the Securities Exchange Act of 1934, the registrant has duly caused this report to be signed on its behalf by the undersigned hereunto duly authorized.
| VERITIV CORPORATION | ||||
| Dated: | May 9, 2023 | /s/ Susan B. Salyer | ||
| Susan B. Salyer | ||||
| Senior Vice President, General Counsel & Corporate Secretary |
Exhibit 99.1

Veritiv Announces First Quarter 2023 Financial Results, Reaffirms 2023 Guidance
First Quarter Highlights
| • | Net Income of $68.7 million, a decrease of 12.5% from prior year |
| • | Diluted EPS of $5.00, a decrease of 2.3% from prior year |
| • | Adjusted EBITDA and Adjusted EBITDA margin1 of $103.8 million and 6.9%, respectively |
| • | Returned $8.5 million to shareholders through dividends |
| • | Named a 2023 World's Most Admired Company by Fortune Magazine |
ATLANTA (May 9, 2023) – Veritiv Corporation (NYSE: VRTV), a full-service provider of business-to-business products, services and solutions, today announced financial results for the first quarter ended March 31, 2023.
“The ongoing execution of our commercial strategy drove record first quarter Adjusted EBITDA margin, despite industry-wide destocking and softening demand,” said Sal Abbate, Chief Executive Officer. “The combination of working capital management and the benefits of our recession-resistant business model also drove strong free cash flow for the quarter.”
Abbate concluded, "We believe the benefits from our diversified and complementary portfolio of products, industry verticals and customers will continue to generate strong free cash flow and provide stability and investment optionality during this uncertain macroeconomic environment."
For the three months ended March 31, 2023, compared to the three months ended March 31, 2022:
| • | Net sales were $1.5 billion, a decrease of 18.7% from the prior year; organic sales decreased 7.8%. |
| • | Net income was $68.7 million, compared to $78.5 million in the prior year. Net restructuring charges were none, compared to $2.7 million in the prior year. |
| • | Basic and diluted earnings per share were $5.08 and $5.00, respectively, compared to $5.31 and $5.12, respectively, in the prior year. |
| • | Adjusted EBITDA was $103.8 million, a decrease of 13.1% from the prior year. |
| • | Adjusted EBITDA margin was 6.9%, an increase of 50 basis points from the prior year. |
For the three months ended March 31, 2023, net cash provided by operating activities was $70.9 million and free cash flow was $68.0 million.
“Disciplined management of our working capital and earnings stability resulted in strong free cash flow of $68 million for the first quarter,” said Eric Guerin, Chief Financial Officer. "Our record low leverage ratio of 0.3x, along with an active pipeline of inorganic opportunities, provides strategic optionality for the Company to act on our capital allocation priorities. Based on our results and current market trends, we are reaffirming our guidance for 2023 as our strategic initiatives provide confidence in achieving our financial goals for the year."
2023 Guidance
The Company reaffirms its full year 2023 guidance. Net income is expected to be in the range of $265 to $305 million. Diluted earnings per share is estimated to be in the range of $19.00 to $22.00, based on approximately 13.9 million fully diluted shares outstanding. Adjusted EBITDA is expected to be in the range of $430 to $490 million. Net cash provided by operating activities and free cash flow are expected to be approximately $305 million and $275 million, respectively. Capital investments are estimated to be approximately $45 million, consisting of approximately $30 million of traditional capital expenditures and approximately $15 million of cloud computing arrangements2, consistent with our investments in technology.
Quarterly Dividend
Veritiv Corporation's Board of Directors approved a dividend of $0.63 per share payable on June 5, 2023 to shareholders of record as of the close of business on May 18, 2023.
1Adjusted EBITDA margin, a non-GAAP metric, is defined as Adjusted EBITDA as a percentage of net sales.
2Capital expenditures are reported in cash flow from investing activities and cloud computing arrangements are reported in cash flow from operating activities.
-----
Veritiv Corporation will host a conference call and webcast today, May 9, 2023, at 9 a.m. (ET) to discuss its first quarter results. To participate, callers within the United States (U.S.) and Canada can dial (888) 330-2469, and international callers can use the following link for international access numbers, https://events.evolveirportal.com/custom/access/2324, both using conference ID number 3047006. Interested parties can also listen online at ir.veritivcorp.com. A replay of the call and webcast will be available online for a limited period of time at ir.veritivcorp.com shortly after the webcast is completed.
Important information regarding measures not presented in accordance with U.S. generally accepted accounting principles ("U.S. GAAP") and related reconciliations of non-GAAP financial measures to the most comparable U.S. GAAP measures can be found in the schedules to this press release, which should be thoroughly reviewed.
About Veritiv
Veritiv Corporation (NYSE: VRTV), headquartered in Atlanta and a Fortune 500® company, is a full-service provider of packaging, JanSan and hygiene products, services and solutions. Additionally, Veritiv provides print and publishing products. Serving customers in a wide range of industries both in North America and globally, Veritiv has distribution centers throughout the U.S. and Mexico, and team members around the world helping shape the success of its customers. For more information about Veritiv and its business segments visit www.veritivcorp.com.
Safe Harbor Provision
Certain statements contained in this press release regarding Veritiv Corporation’s (the "Company") future operating results, performance, strategy, business plans, prospects and guidance, statements related to customer demand, supply and demand imbalances, the expected competitive landscape, the expected impact of COVID-19 and any other statements not constituting historical fact are "forward-looking statements" subject to the safe harbor created by the Private Securities Litigation Reform Act of 1995. Where possible, the words "believe," "expect," "anticipate," "continue," "intend," "will," "may," "should," "could," "would," "plan," "estimate," "predict," "potential," "goal," "outlook," or the negative of such terms, or other comparable expressions, have been used to identify such forward-looking statements. All forward-looking statements reflect only the Company’s current beliefs and assumptions with respect to future results and other matters, and are based on information currently available to the Company. Accordingly, the statements are subject to significant risks, uncertainties and contingencies, which could cause the Company’s actual operating results, performance, strategy, business plans, prospects or guidance to differ materially from those expressed in, or implied by, these statements.
Factors that could cause actual results to differ materially from current expectations include the risks and other factors described under "Risk Factors" and elsewhere in our Annual Report on Form 10-K and in the Company's other publicly available reports filed with the Securities and Exchange Commission ("SEC"). Such risks and other factors, which in some instances are beyond the Company's control, include: the industry-wide decline in demand for paper and related products; increased competition from existing and non-traditional sources; procurement and other risks in obtaining packaging, facility products and paper from our suppliers for resale to our customers; changes in prices for raw materials; changes in trade policies and regulations; increases in the cost of fuel and third-party freight and the availability of third-party freight providers; the loss of multiple significant customers; adverse developments in general business and economic conditions that could impair our ability to use net operating loss carryforwards and other deferred tax assets; our ability to adequately protect our material intellectual property and other proprietary rights, or to defend successfully against intellectual property infringement claims by third parties; our ability to attract, train and retain appropriately qualified employees; our pension and health care costs and participation in multi-employer pension, health and welfare plans; the effects of work stoppages, union negotiations and labor disputes; our ability to generate sufficient cash to service our debt; our ability to comply with the covenants contained in our debt agreements; costs to comply with laws, rules and regulations, including environmental, health and safety laws, and to satisfy any liability or obligation imposed under such laws; our ability to adequately address environmental, social and governance matters; changes in tax laws; adverse results from litigation, governmental investigations or audits, or tax-related proceedings or audits; regulatory changes and judicial rulings impacting our business; adverse impacts from the COVID-19 pandemic; the impact of adverse developments in general business and economic conditions as well as conditions in the global capital and credit markets on demand for our products and services, our business including our international operations, and our customers; foreign currency fluctuations; inclement weather, widespread outbreak of an illness, anti-terrorism measures and other disruptions to our supply chain, distribution system and operations; our dependence on a variety of information technology and telecommunications systems and the Internet; our reliance on third-party vendors for various services; cybersecurity risks; and other events of which we are presently unaware or that we currently deem immaterial that may result in unexpected adverse operating results.
The Company is not responsible for updating the information contained in this press release beyond the published date, or for changes made to this document by wire services or Internet service providers. This press release is being furnished to the SEC through a Form 8-K. The Company’s Quarterly Report on Form 10-Q for the three months ended March 31, 2023 to be filed with the SEC may contain updates to the information included in this release.
Financial Statements
VERITIV CORPORATION
CONDENSED CONSOLIDATED STATEMENTS OF OPERATIONS
(in millions, except per share data, unaudited)
Three Months Ended March 31, | ||||||||
| 2023 | 2022 | |||||||
| Net sales | $ | 1,510.2 | $ | 1,858.1 | ||||
| Cost of products sold (exclusive of depreciation and amortization shown separately below) | 1,144.1 | 1,455.4 | ||||||
| Distribution expenses | 89.7 | 112.2 | ||||||
| Selling and administrative expenses | 171.4 | 187.9 | ||||||
| Depreciation and amortization | 10.1 | 12.7 | ||||||
| Restructuring charges, net | — | 2.7 | ||||||
| Operating income | 94.9 | 87.2 | ||||||
| Interest expense, net | 4.7 | 3.5 | ||||||
| Other (income) expense, net | 1.0 | (0.6 | ) | |||||
| Income before income taxes | 89.2 | 84.3 | ||||||
| Income tax expense | 20.5 | 5.8 | ||||||
| Net income | $ | 68.7 | $ | 78.5 | ||||
| Earnings per share: | ||||||||
| Basic | $ | 5.08 | $ | 5.31 | ||||
| Diluted | $ | 5.00 | $ | 5.12 | ||||
| Weighted-average shares outstanding: | ||||||||
| Basic | 13.53 | 14.77 | ||||||
| Diluted | 13.74 | 15.32 | ||||||
VERITIV CORPORATION
CONDENSED CONSOLIDATED BALANCE SHEETS
(dollars in millions, except par value, unaudited)
| March 31, 2023 | December 31, 2022 | |||||||
| Assets | ||||||||
| Current assets: | ||||||||
| Cash and cash equivalents | $ | 33.0 | $ | 40.6 | ||||
| Accounts receivable, less allowances of $24.3 and $26.7, respectively | 789.8 | 889.6 | ||||||
| Inventories | 470.9 | 423.9 | ||||||
| Other current assets | 101.2 | 103.7 | ||||||
| Total current assets | 1,394.9 | 1,457.8 | ||||||
| Property and equipment (net of accumulated depreciation and amortization of $329.1 and $325.5, respectively) | 124.2 | 127.5 | ||||||
| Goodwill | 96.3 | 96.3 | ||||||
| Other intangibles, net | 34.5 | 35.6 | ||||||
| Deferred income tax assets | 29.4 | 29.0 | ||||||
| Other non-current assets | 347.6 | 343.4 | ||||||
| Total assets | $ | 2,026.9 | $ | 2,089.6 | ||||
| Liabilities and shareholders' equity | ||||||||
| Current liabilities: | ||||||||
| Accounts payable | $ | 444.6 | $ | 452.9 | ||||
| Accrued payroll and benefits | 44.1 | 106.2 | ||||||
| Other accrued liabilities | 144.2 | 154.1 | ||||||
| Current portion of debt | 13.6 | 13.4 | ||||||
| Total current liabilities | 646.5 | 726.6 | ||||||
| Long-term debt, net of current portion | 231.9 | 264.8 | ||||||
| Defined benefit pension obligations | 0.8 | 0.4 | ||||||
| Other non-current liabilities | 330.4 | 341.7 | ||||||
| Total liabilities | 1,209.6 | 1,333.5 | ||||||
| Commitments and contingencies | ||||||||
| Shareholders' equity: | ||||||||
| Preferred stock, $0.01 par value, 10.0 million shares authorized, none issued | — | — | ||||||
| Common stock, $0.01 par value, 100.0 million shares authorized; shares issued - 17.5 million and 17.5 million, respectively; shares outstanding - 13.5 million and 13.5 million, respectively | 0.2 | 0.2 | ||||||
| Additional paid-in capital | 611.3 | 613.1 | ||||||
| Accumulated earnings | 532.8 | 472.6 | ||||||
| Accumulated other comprehensive loss | (9.9 | ) | (12.7 | ) | ||||
| Treasury stock at cost - 4.0 million and 4.0 million shares, respectively | (317.1 | ) | (317.1 | ) | ||||
| Total shareholders' equity | 817.3 | 756.1 | ||||||
| Total liabilities and shareholders' equity | $ | 2,026.9 | $ | 2,089.6 | ||||
VERITIV CORPORATION
CONDENSED CONSOLIDATED STATEMENTS OF CASH FLOWS
(in millions, unaudited)
| Three Months Ended March 31, | ||||||||
| 2023 | 2022 | |||||||
| Operating activities | ||||||||
| Net income | $ | 68.7 | $ | 78.5 | ||||
| Depreciation and amortization | 10.1 | 12.7 | ||||||
| Amortization and write-off of deferred financing fees | 0.4 | 0.4 | ||||||
| Net (gains) losses on disposition of assets and sale of businesses | 0.0 | (2.3 | ) | |||||
| Provision for expected credit losses | (1.7 | ) | (0.6 | ) | ||||
| Deferred income tax provision | (0.2 | ) | (12.7 | ) | ||||
| Stock-based compensation | 1.8 | 2.8 | ||||||
| Other non-cash items, net | (0.2 | ) | 0.5 | |||||
| Changes in operating assets and liabilities | ||||||||
| Accounts receivable | 102.2 | (25.8 | ) | |||||
| Inventories | (45.7 | ) | (8.8 | ) | ||||
| Other current assets | 3.5 | (1.1 | ) | |||||
| Accounts payable | 19.1 | 4.5 | ||||||
| Accrued payroll and benefits | (69.3 | ) | (50.6 | ) | ||||
| Other accrued liabilities | (11.5 | ) | 1.0 | |||||
| Other | (6.3 | ) | (4.4 | ) | ||||
| Net cash provided by (used for) operating activities | 70.9 | (5.9 | ) | |||||
| Investing activities | ||||||||
| Property and equipment additions | (2.9 | ) | (9.4 | ) | ||||
| Proceeds from asset sales and sale of businesses, net of cash transferred | 0.2 | 0.2 | ||||||
| Proceeds from insurance related to property and equipment | — | 2.1 | ||||||
| Net cash provided by (used for) investing activities | (2.7 | ) | (7.1 | ) | ||||
| Financing activities | ||||||||
| Change in book overdrafts | (29.0 | ) | 20.3 | |||||
| Borrowings of long-term debt | 1,459.5 | 1,515.2 | ||||||
| Repayments of long-term debt | (1,488.8 | ) | (1,481.8 | ) | ||||
| Payments under right-of-use finance leases | (2.5 | ) | (3.4 | ) | ||||
| Payments under vendor-based financing arrangements | (3.4 | ) | (3.2 | ) | ||||
| Purchase of treasury stock | — | (10.4 | ) | |||||
| Impact of tax withholding on share-based compensation | (3.6 | ) | (29.5 | ) | ||||
| Dividends paid to shareholders | (8.5 | ) | — | |||||
| Other | (0.2 | ) | 0.2 | |||||
| Net cash provided by (used for) financing activities | (76.5 | ) | 7.4 | |||||
| Effect of exchange rate changes on cash | 0.7 | 0.0 | ||||||
| Net change in cash and cash equivalents, including cash classified within assets-held-for-sale | (7.6 | ) | (5.6 | ) | ||||
| Less: cash included in assets-held-for-sale, end of period | — | (9.9 | ) | |||||
| Net change in cash and cash equivalents | (7.6 | ) | (15.5 | ) | ||||
| Cash and cash equivalents at beginning of period | 40.6 | 49.3 | ||||||
| Cash and cash equivalents at end of period | $ | 33.0 | $ | 33.8 | ||||
| Supplemental cash flow information | ||||||||
| Cash paid for income taxes, net of refunds | $ | 21.6 | $ | 15.1 | ||||
| Cash paid for interest | 4.2 | 2.9 | ||||||
| Non-cash investing and financing activities | ||||||||
| Non-cash additions to property and equipment for right-of-use finance leases and vendor-based financing arrangements | $ | 2.7 | $ | 15.6 | ||||
| Non-cash additions to other non-current assets for right-of-use operating leases | 14.3 | 31.2 | ||||||
Non-GAAP Measures
We supplement our financial information prepared in accordance with U.S. GAAP with certain non-GAAP measures including organic sales (net sales on an average daily sales basis, excluding revenue from sold businesses and revenue from acquired businesses for a period of 12 months after we complete the acquisition), Adjusted EBITDA (earnings before interest, income taxes, depreciation and amortization, restructuring charges, net, integration and acquisition expenses and other similar charges including any severance costs, costs associated with warehouse and office openings or closings, consolidation, and relocation and other business optimization expenses, stock-based compensation expense, changes in the LIFO reserve, non-restructuring asset impairment charges, non-restructuring severance charges, non-restructuring pension charges (benefits), fair value adjustments related to contingent liabilities assumed in mergers and acquisitions and certain other adjustments), free cash flow and other non-GAAP measures such as the Net Leverage Ratio (calculated as net debt divided by trailing twelve months of Adjusted EBITDA) and Return on Invested Capital "ROIC" (calculated as Net Operating Profit After Tax divided by the sum of net working capital and property and equipment. Net Operating Profit After Tax is defined as Adjusted EBITDA less depreciation and amortization times 1 minus the standard tax rate1). We believe investors commonly use Adjusted EBITDA, free cash flow and these other non-GAAP measures as key financial metrics for valuing companies; we also present organic sales to help investors better compare period-over-period results. In addition, the credit agreement governing our Asset-Based Lending Facility (the "ABL Facility") permits us to exclude the foregoing and other charges in calculating "Consolidated EBITDA", as defined in the ABL Facility. Consolidated EBITDA and ROIC are also used as a basis for certain compensation programs sponsored by the Company.
Organic sales, Adjusted EBITDA, free cash flow and these other non-GAAP measures are not alternative measures of financial performance or liquidity under U.S. GAAP. Non-GAAP measures do not have definitions under U.S. GAAP and may be defined differently by, and not be comparable to, similarly titled measures used by other companies. As a result, we consider and evaluate non-GAAP measures in connection with a review of the most directly comparable measure calculated in accordance with U.S. GAAP. We caution investors not to place undue reliance on such non-GAAP measures and to consider them with the most directly comparable U.S. GAAP measures. Organic sales, Adjusted EBITDA, free cash flow and these other non-GAAP measures have limitations as analytical tools and should not be considered in isolation or as a substitute for analyzing our results as reported under U.S. GAAP. Please see the following tables for reconciliations of non-GAAP measures to the most comparable U.S. GAAP measures.
1 The Company uses a standard tax rate of 26%.
Table I
VERITIV CORPORATION
RECONCILIATION OF NON-GAAP MEASURES
NET INCOME TO ADJUSTED EBITDA; ADJUSTED EBITDA MARGIN
(in millions, unaudited)
Three Months Ended March 31, | ||||||||
| 2023 | 2022 | |||||||
| Net income | $ | 68.7 | $ | 78.5 | ||||
| Interest expense, net | 4.7 | 3.5 | ||||||
| Income tax expense | 20.5 | 5.8 | ||||||
| Depreciation and amortization | 10.1 | 12.7 | ||||||
| EBITDA | 104.0 | 100.5 | ||||||
| Restructuring charges, net | — | 2.7 | ||||||
| Facility closure charges, including (gain) loss from asset disposition | (0.1 | ) | (0.6 | ) | ||||
| Stock-based compensation | 1.8 | 2.8 | ||||||
| LIFO reserve (decrease) increase | (2.5 | ) | 11.0 | |||||
| Non-restructuring severance charges | 0.3 | 1.7 | ||||||
| Non-restructuring pension charges (benefits) | 0.2 | — | ||||||
| Other | 0.1 | 1.4 | ||||||
| Adjusted EBITDA | $ | 103.8 | $ | 119.5 | ||||
| Net sales | $ | 1,510.2 | $ | 1,858.1 | ||||
| Adjusted EBITDA as a % of net sales | 6.9 | % | 6.4 | % | ||||
Table I.a.
VERITIV CORPORATION
RECONCILIATION OF NON-GAAP MEASURES
ADJUSTED EBITDA GUIDANCE
(in millions, unaudited)
| Forecast for Year Ending December 31, 2023 | ||||||||
| Low | High | |||||||
| Net income | $ | 265 | $ | 305 | ||||
| Interest expense, net | 15 | 15 | ||||||
| Income tax expense | 95 | 110 | ||||||
| Depreciation and amortization | 40 | 40 | ||||||
| Other reconciling items | 15 | 20 | ||||||
| Adjusted EBITDA | $ | 430 | $ | 490 | ||||
Table II
VERITIV CORPORATION
RECONCILIATION OF NON-GAAP MEASURES
FREE CASH FLOW
(in millions, unaudited)
| Three Months Ended March 31, 2023 | ||||
| Net cash provided by (used for) operating activities | $ | 70.9 | ||
| Less: Capital expenditures | (2.9 | ) | ||
| Free cash flow | $ | 68.0 | ||
Table II.a
VERITIV CORPORATION
RECONCILIATION OF NON-GAAP MEASURES
FREE CASH FLOW GUIDANCE
(in millions, unaudited)
| Forecast for Year Ending December 31, 2023 | ||||
| Net cash provided by (used for) operating activities | approximately $305 | |||
| Less: Capital expenditures | approximately ($30) | |||
| Free cash flow | approximately $275 |
Table III
VERITIV CORPORATION
RECONCILIATION OF NON-GAAP MEASURES
NET DEBT TO ADJUSTED EBITDA
(in millions, unaudited)
| March 31, 2023 | ||||
| Amount drawn on ABL Facility | $ | 199.9 | ||
| Less: Cash and cash equivalents | (33.0 | ) | ||
| Net debt | $ | 166.9 | ||
| Last Twelve Months Adjusted EBITDA | $ | 502.2 | ||
| Net debt to Adjusted EBITDA | 0.3 | x | ||
| Last Twelve Months | ||||
| March 31, 2023 | ||||
| Net income | $ | 328.1 | ||
| Interest expense, net | 18.9 | |||
| Income tax expense | 108.7 | |||
| Depreciation and amortization | 43.0 | |||
| EBITDA | 498.7 | |||
| Restructuring charges, net | (0.7 | ) | ||
| Gain on sale of businesses | (29.7 | ) | ||
| Facility closure charges, including (gain) loss from asset disposition | 0.5 | |||
| Stock-based compensation | 8.5 | |||
| LIFO reserve (decrease) increase | 18.6 | |||
| Non-restructuring severance charges | 2.9 | |||
| Non-restructuring pension charges (benefits) | (1.9 | ) | ||
| Other | 5.3 | |||
| Adjusted EBITDA | $ | 502.2 | ||
Table IV
VERITIV CORPORATION
RECONCILIATION OF NON-GAAP MEASURES
REPORTED NET SALES TO ORGANIC SALES
(in millions, unaudited)
Three Months Ended March 31, | ||||||||
| 2023 | 2022 | |||||||
| Reported net sales | $ | 1,510.2 | $ | 1,858.1 | ||||
| Impact of change in selling days (1) | — | — | ||||||
| Net sales (on an average daily sales basis) | 1,510.2 | 1,858.1 | ||||||
| Business divestitures (2) | — | (220.6 | ) | |||||
| Organic sales | $ | 1,510.2 | $ | 1,637.5 | ||||
| Business Days | 63 | 63 | ||||||
(1) Adjustment for differences in the number of selling days, if any.
(2) Represents the net sales of each of the following divested businesses prior to its respective divestiture: Veritiv Canada, Inc. (May 2, 2022) and the logistics solutions business (September 1, 2022).
Veritiv Contacts:
| Investors: Scott Palfreeman, 844-845-2136 | Media: Kristie Madara, 770-391-8471 |

1 FIRST QUARTER 2023 FINANCIAL RESULTS May 9, 2023 Exhibit 99.2

2 SCOTT PALFREEMAN Director of Finance and Investor Relations SCOTT PALFREEMAN Vice President of Finance and Investor Relations
3 Safe Harbor Provision Certain statements contained in this presentation regarding Veritiv Corporation’s (the "Company") future operating results, p erf ormance, strategy, business plans, prospects and guidance, statements related to customer demand, supply and demand imbalances, the expected competitive landscape, the expect ed impact of COVID - 19 and any other statements not constituting historical fact are "forward - looking statements" subject to the safe harbor created by the Private Securities L itigation Reform Act of 1995. Where possible, the words "believe," "expect," "anticipate," "continue," "intend," "will," "may," "should," "could," "would," "plan," "estimate," "pred ict ," "potential," "goal," "outlook," or the negative of such terms, or other comparable expressions, have been used to identify such forward - looking statements. All forward - looking statements reflect only the Company’s current beliefs and assumptions with respect to future results and other matters, and are based on information currently available to the Company. Accordingly, th e s tatements are subject to significant risks, uncertainties and contingencies, which could cause the Company’s actual operating results, performance, strategy, business plans, prospects or guidance to differ materially from those expressed in, or implied by, these statements. Factors that could cause actual results to differ materially from current expectations include the risks and other factors de scr ibed under "Risk Factors" and elsewhere in our Annual Report on Form 10 - K and in the Company's other publicly available reports filed with the Securities and Exchange Commission ("SE C"). Such risks and other factors, which in some instances are beyond the Company's control, include: the industry - wide decline in demand for paper and related products; increas ed competition from existing and non - traditional sources; procurement and other risks in obtaining packaging, facility products and paper from our suppliers for resale to our cu stomers; changes in prices for raw materials; changes in trade policies and regulations; increases in the cost of fuel and third - party freight and the availability of third - party freigh t providers; the loss of multiple significant customers; adverse developments in general business and economic conditions that could impair our ability to use net operating loss carryforward s a nd other deferred tax assets; our ability to adequately protect our material intellectual property and other proprietary rights, or to defend successfully against intellectual prope rty infringement claims by third parties; our ability to attract, train and retain appropriately qualified employees; our pension and health care costs and participation in multi - employer pensio n, health and welfare plans; the effects of work stoppages, union negotiations and labor disputes; our ability to generate sufficient cash to service our debt; our ability to co mply with the covenants contained in our debt agreements; costs to comply with laws, rules and regulations, including environmental, health and safety laws, and to satisfy any liabili ty or obligation imposed under such laws; our ability to adequately address environmental, social and governance matters; changes in tax laws; adverse results from litigation, govern men tal investigations or audits, or tax - related proceedings or audits; regulatory changes and judicial rulings impacting our business; adverse impacts from the COVID - 19 pandemi c; the impact of adverse developments in general business and economic conditions as well as conditions in the global capital and credit markets on demand for our products an d s ervices, our business including our international operations, and our customers; foreign currency fluctuations; inclement weather, widespread outbreak of an illness, anti - terrori sm measures and other disruptions to our supply chain, distribution system and operations; our dependence on a variety of information technology and telecommunications systems and the Internet; our reliance on third - party vendors for various services; cybersecurity risks; and other events of which we are presently unaware or that we currently deem immateria l t hat may result in unexpected adverse operating results. The Company is not responsible for updating the information contained in this presentation beyond the published date. This pr ese ntation should be read together with the Company’s press release furnished to the SEC earlier today through a Form 8 - K. The Company’s Quarterly Report on Form 10 - Q for the three m onths ended March 31, 2023 to be filed with the SEC may contain updates to the information included in this release.

SAL ABBATE Chief Executive Officer
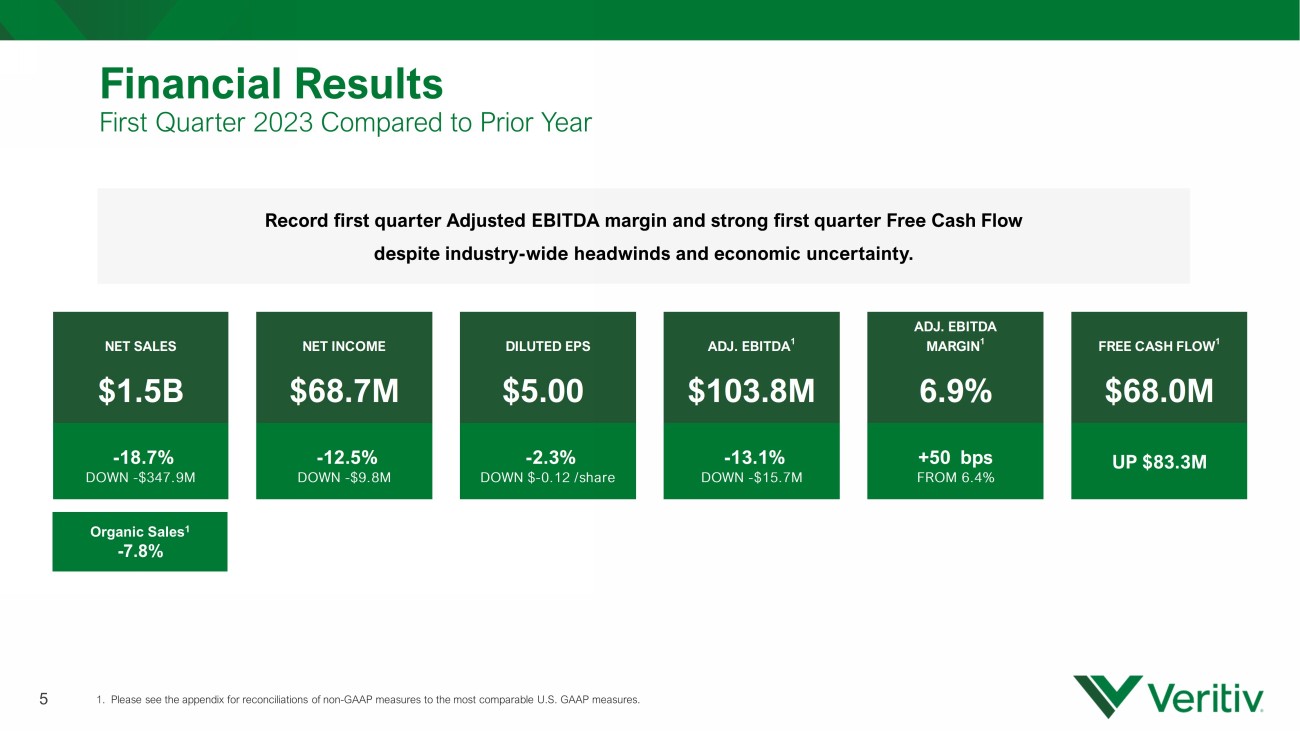
Financial Results First Quarter 2023 Compared to Prior Year 5 1. Please see the appendix for reconciliations of non - GAAP measures to the most comparable U.S. GAAP measures . Record first quarter Adjusted EBITDA margin and strong first quarter Free Cash Flow despite industry - wide headwinds and economic uncertainty. Organic Sales 1 - 7.8% NET SALES NET INCOME DILUTED EPS ADJ. EBITDA 1 ADJ. EBITDA MARGIN 1 FREE CASH FLOW 1 $1.5B $68.7M $5.00 $103.8M 6.9% $68.0M -18.7% -12.5% -2.3% -13.1% +50 bps DOWN -$347.9M DOWN -$9.8M DOWN $-0.12 /share DOWN -$15.7M FROM 6.4% UP $83.3M
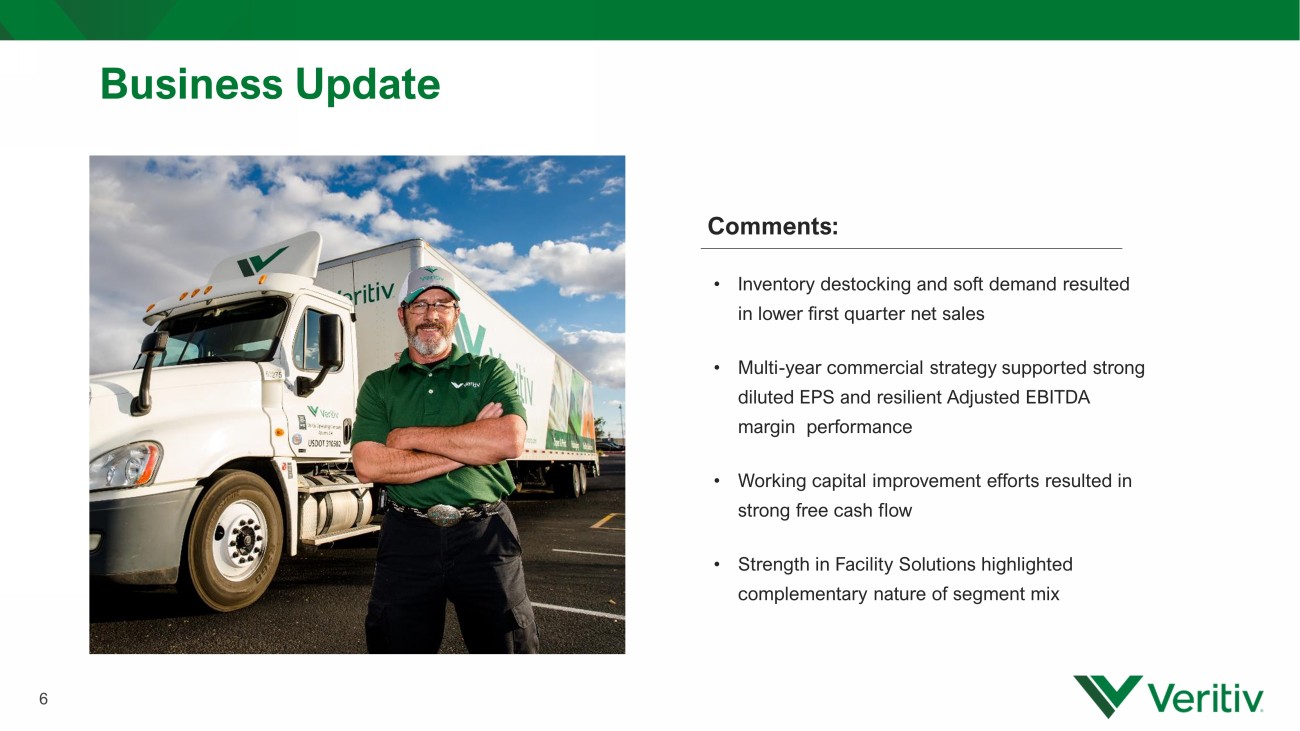
6 Business Update Comments : • Inventory destocking and soft demand resulted in lower first quarter net sales • Multi - year commercial strategy supported strong diluted EPS and resilient Adjusted EBITDA margin performance • Working capital improvement efforts resulted in strong free cash flow • Strength in Facility Solutions highlighted complementary nature of segment mix
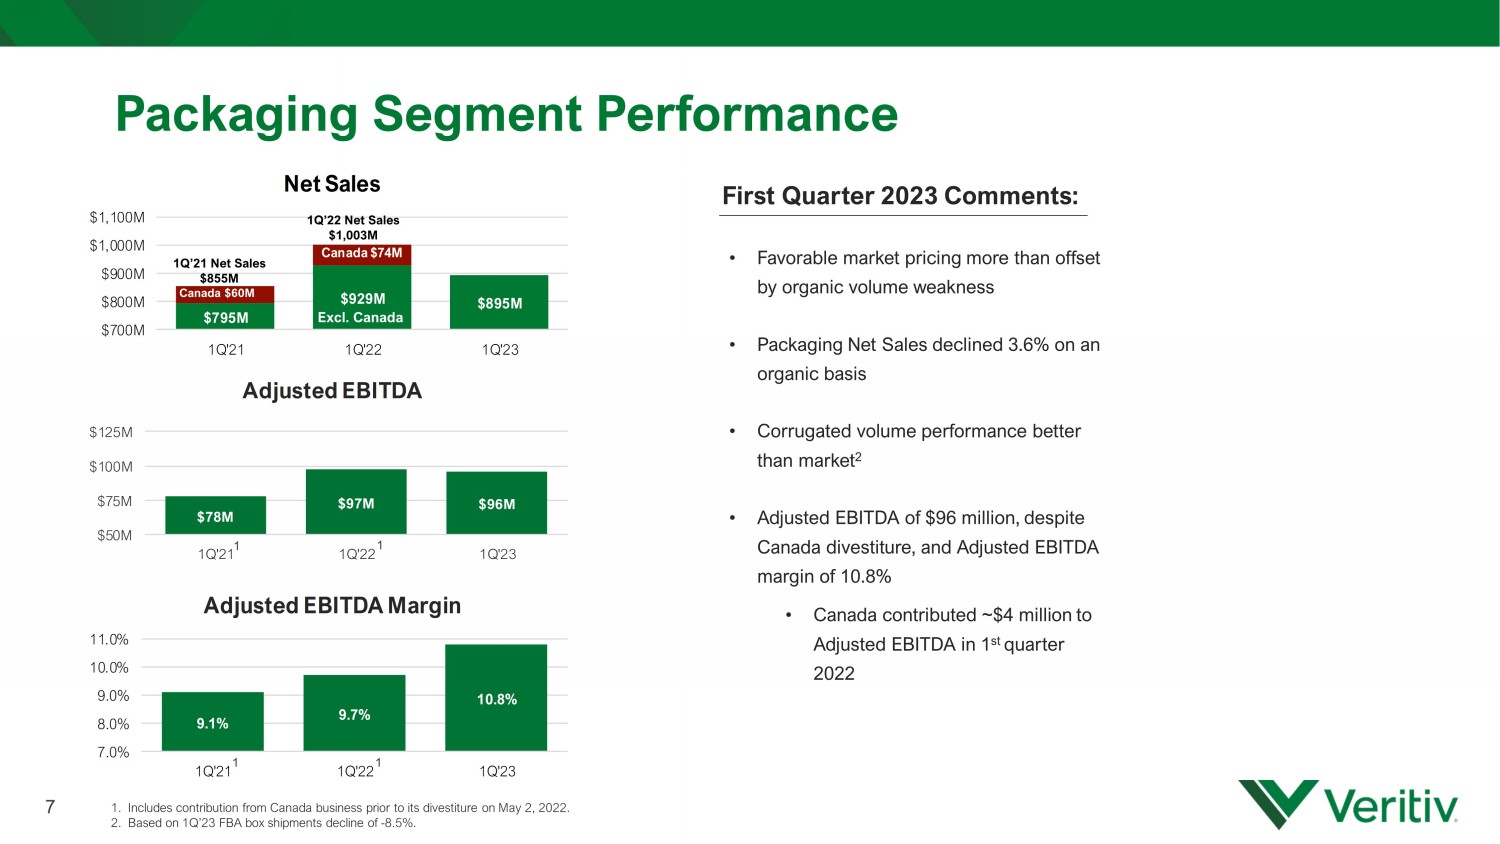
$795M $929M $895M Canada $74M $700M $800M $900M $1,000M $1,100M 1Q'21 1Q'22 1Q'23 Net Sales First Quarter 2023 Comments : • Favorable market pricing more than offset by organic volume weakness • Packaging Net Sales declined 3.6% on an organic basis • Corrugated volume performance better than market 2 • Adjusted EBITDA of $96 million, despite Canada divestiture, and Adjusted EBITDA margin of 10.8% • Canada contributed ~$4 million to Adjusted EBITDA in 1 st quarter 2022 Packaging Segment Performance 7 $78M $97M $96M $50M $75M $100M $125M 1Q'21 1Q'22 1Q'23 Adjusted EBITDA 9.1% 9.7% 10.8% 7.0% 8.0% 9.0% 10.0% 11.0% 1Q'21 1Q'22 1Q'23 Adjusted EBITDA Margin 1Q’22 Net Sales $1,003M Excl. Canada 1. Includes contribution from Canada business prior to its divestiture on May 2, 2022. 2. Based on 1Q’23 FBA box shipments decline of - 8.5%. 1Q’21 Net Sales $855M Canada $60M 1 1 1 1
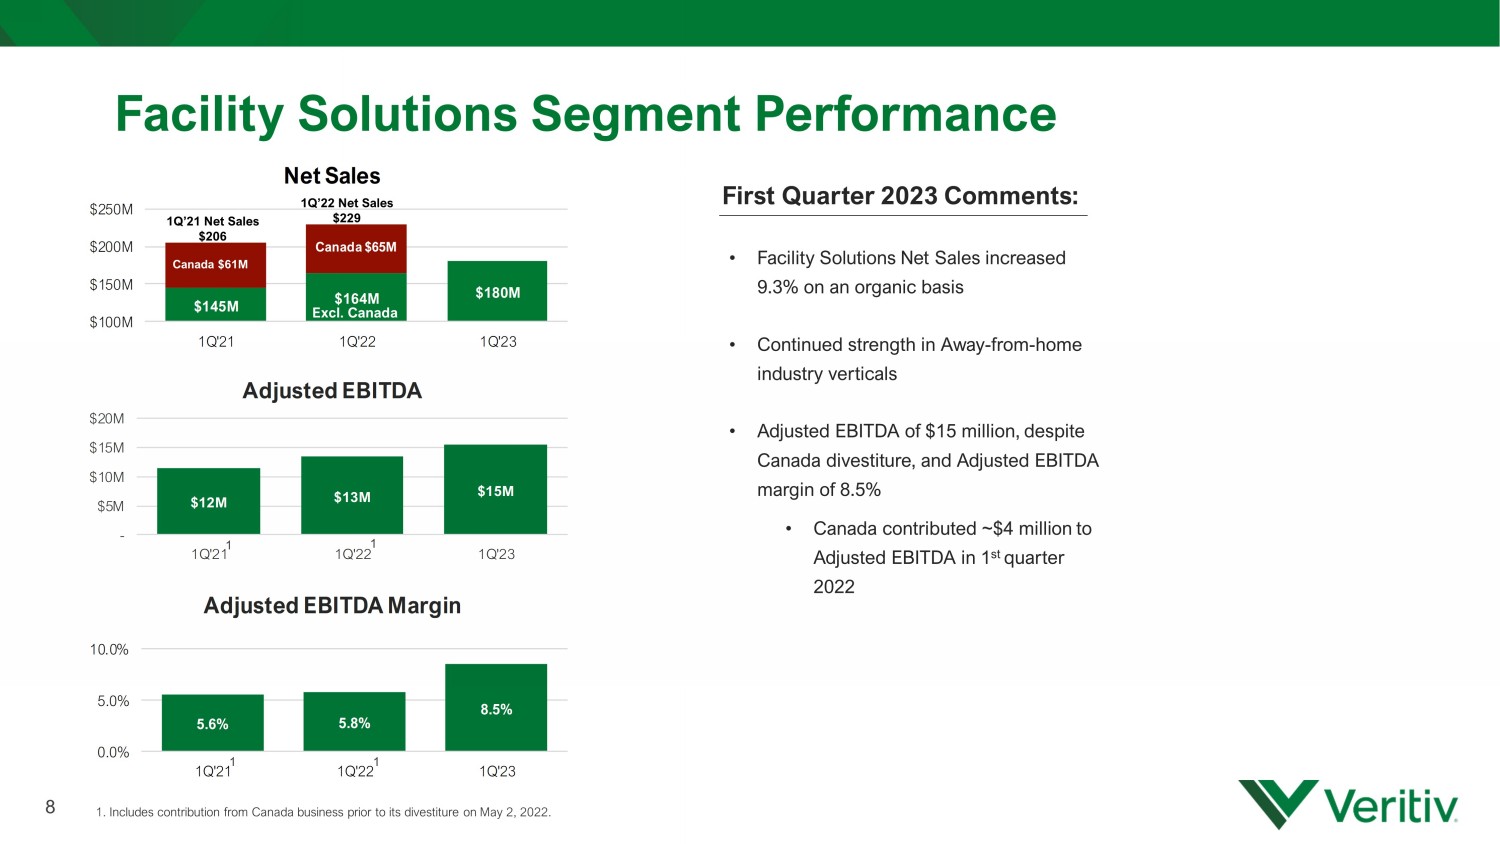
$145M $164M $180M Canada $65M $100M $150M $200M $250M 1Q'21 1Q'22 1Q'23 Net Sales First Quarter 2023 Comments : • Facility Solutions Net Sales increased 9.3% on an organic basis • Continued strength in Away - from - home industry verticals • Adjusted EBITDA of $15 million, despite Canada divestiture, and Adjusted EBITDA margin of 8.5% • Canada contributed ~$4 million to Adjusted EBITDA in 1 st quarter 2022 Facility Solutions Segment Performance 8 1Q’22 Net Sales $229 Excl. Canada $12M $13M $15M - $5M $10M $15M $20M 1Q'21 1Q'22 1Q'23 Adjusted EBITDA 5.6% 5.8% 8.5% 0.0% 5.0% 10.0% 1Q'21 1Q'22 1Q'23 Adjusted EBITDA Margin Canada $61M 1Q’21 Net Sales $206 1. Includes contribution from Canada business prior to its divestiture on May 2, 2022. 1 1 1 1
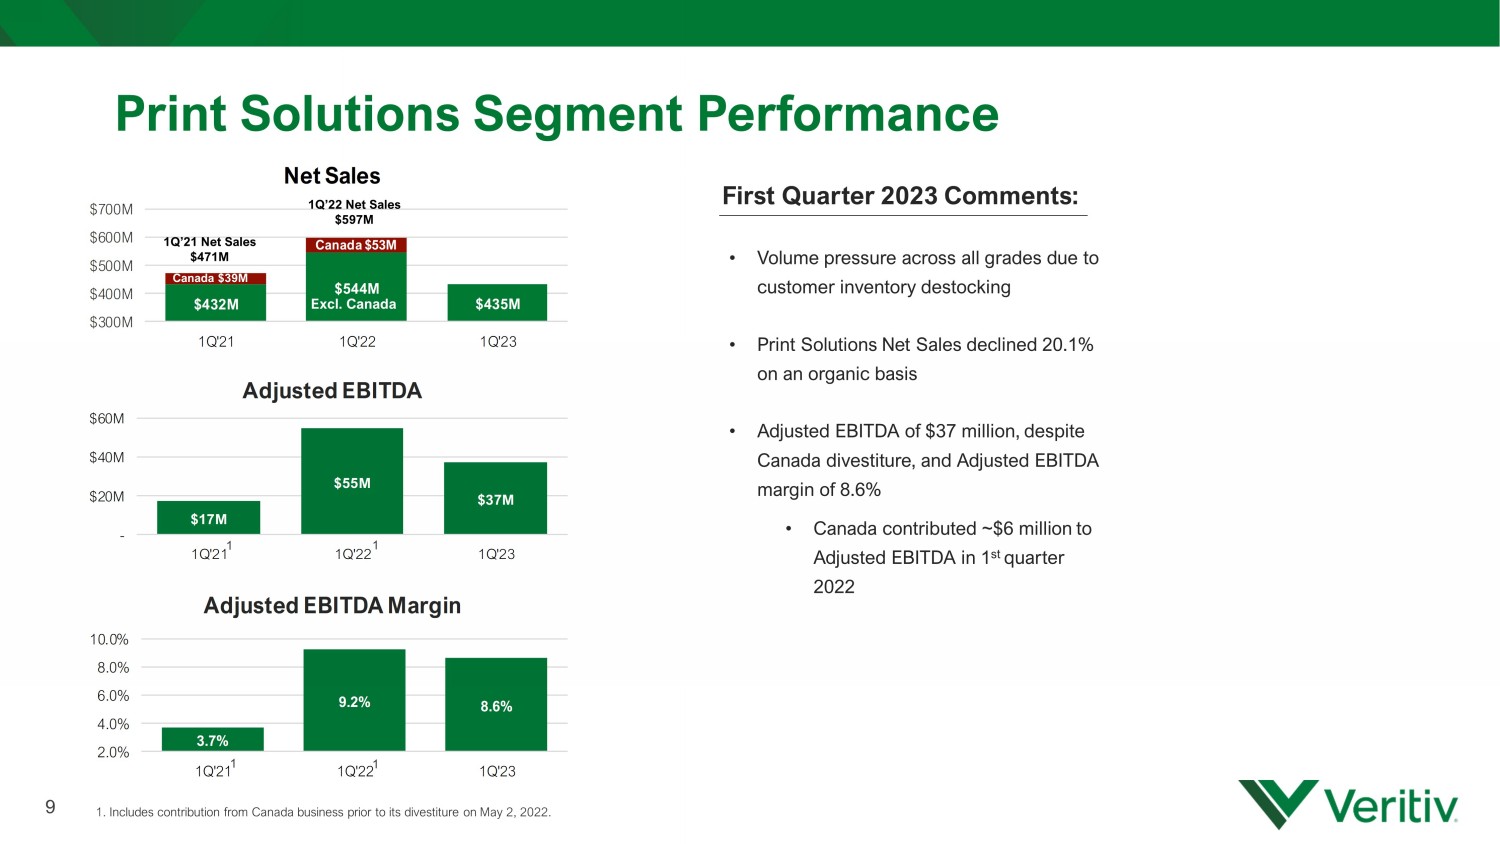
$432M $544M $435M Canada $53M $300M $400M $500M $600M $700M 1Q'21 1Q'22 1Q'23 Net Sales First Quarter 2023 Comments : • Volume pressure across all grades due to customer inventory destocking • Print Solutions Net Sales declined 20.1% on an organic basis • Adjusted EBITDA of $37 million, despite Canada divestiture, and Adjusted EBITDA margin of 8.6% • Canada contributed ~$6 million to Adjusted EBITDA in 1 st quarter 2022 Print Solutions Segment Performance 9 Excl. Canada $17M $55M $37M - $20M $40M $60M 1Q'21 1Q'22 1Q'23 Adjusted EBITDA 3.7% 9.2% 8.6% 2.0% 4.0% 6.0% 8.0% 10.0% 1Q'21 1Q'22 1Q'23 Adjusted EBITDA Margin 1Q’22 Net Sales $597M Canada $39M 1Q’21 Net Sales $471M 1. Includes contribution from Canada business prior to its divestiture on May 2, 2022. 1 1 1 1

ERIC GUERIN Chief Financial Officer
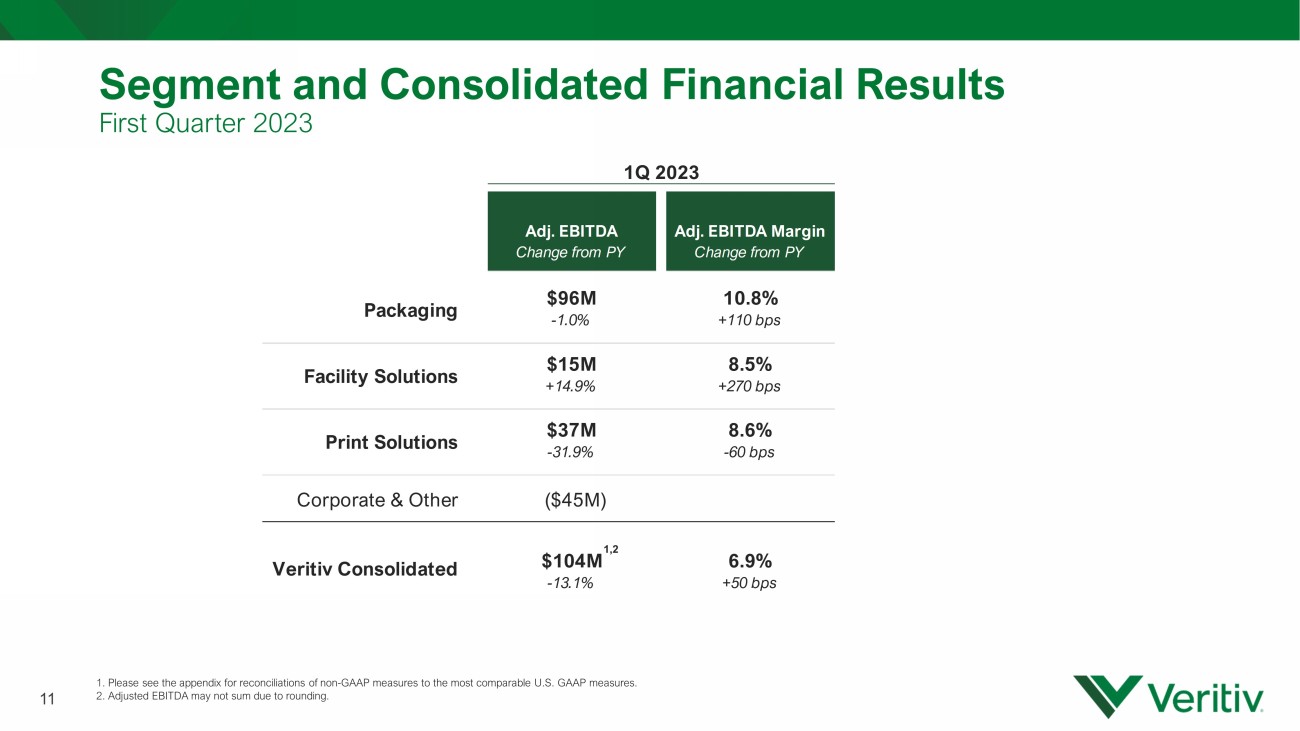
1Q 2023 Full Year 2022 Adj. EBITDA Adj. EBITDA Margin Change from PY Change from PY $96M 10.8% -1.0% +110 bps $15M 8.5% +14.9% +270 bps $37M 8.6% -31.9% -60 bps Corporate & Other ($45M) $104M 6.9% -13.1% +50 bps Veritiv Consolidated Packaging Facility Solutions Print Solutions Segment and Consolidated Financial Results First Quarter 2023 1. Please see the appendix for reconciliations of non - GAAP measures to the most comparable U.S. GAAP measures. 2. Adjusted EBITDA may not sum due to rounding. 11 1,2
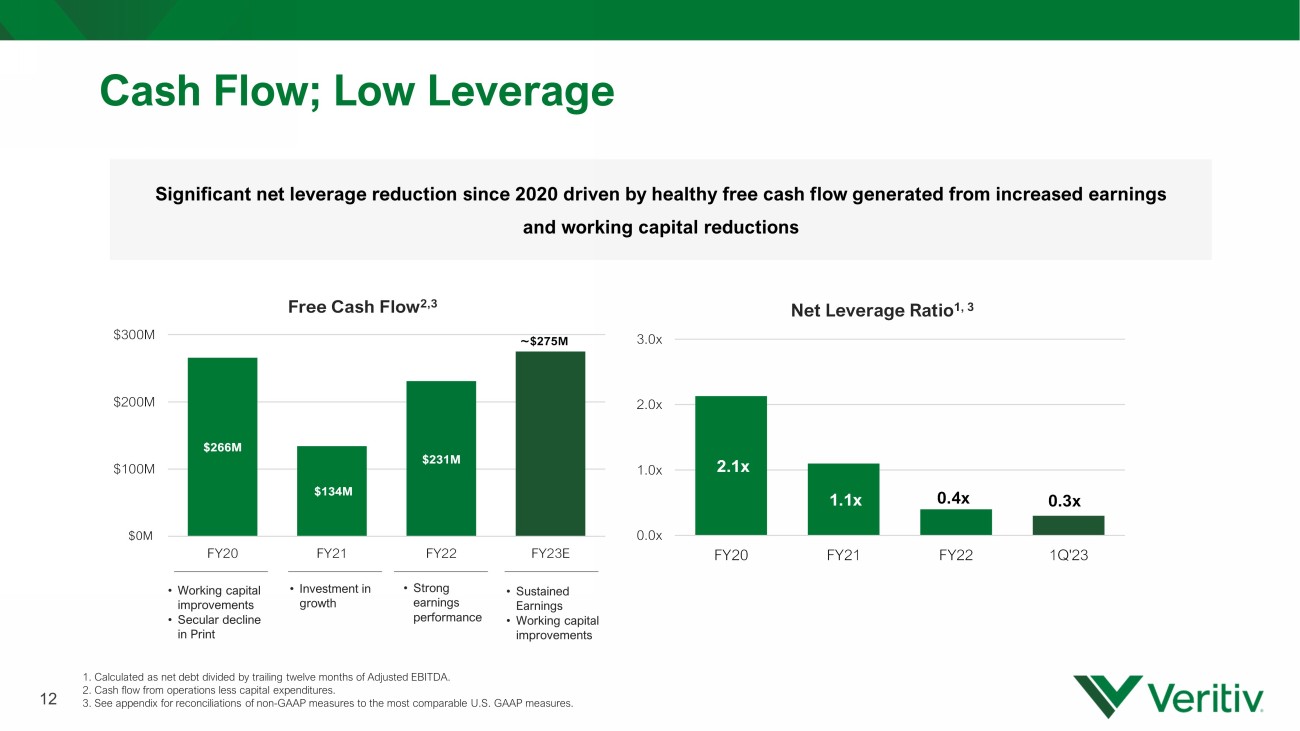
$266M $134M $231M $275M - $100M $200M $300M FY20 FY21 FY22 FY23E Free Cash Flow 2,3 Cash Flow; Low Leverage 1. Calculated as net debt divided by trailing twelve months of Adjusted EBITDA. 2. Cash flow from operations less capital expenditures. 3 . S ee appendix for reconciliations of non - GAAP measures to the most comparable U.S. GAAP measures . Significant net leverage reduction since 2020 driven by healthy free cash flow generated from increased earnings and working capital reductions 12 $0M • Working capital improvements • Secular decline in Print • Investment in growth • Sustained Earnings • Working capital improvements • Strong earnings performance ~ 2.1x 1.1x 0.4x 0.3x 0.0x 1.0x 2.0x 3.0x FY20 FY21 FY22 1Q'23 Net Leverage Ratio 1, 3
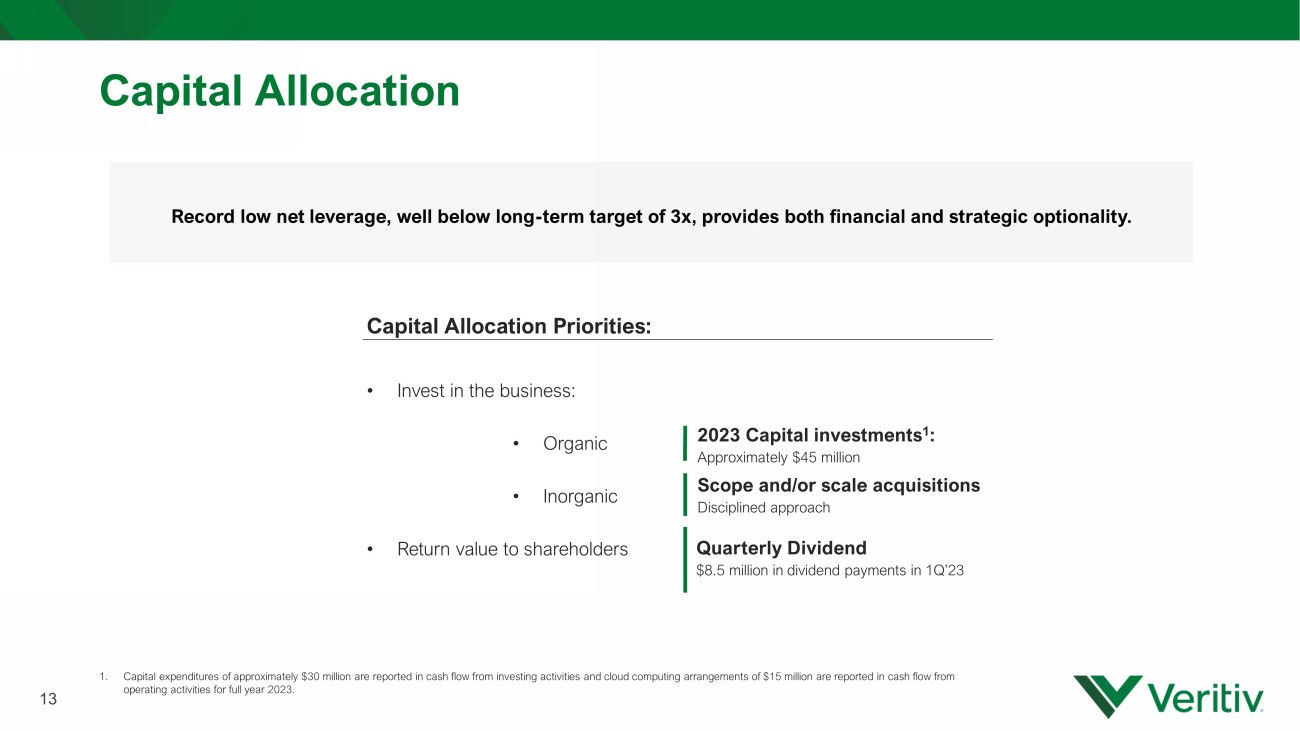
Capital Allocation Capital Allocation Priorities: • Invest in the business: • Organic • Inorganic • Return value to shareholders 2023 Capital investments 1 : Approximately $45 million Record low net leverage, well below long - term target of 3x, provides both financial and strategic optionality. Scope and/or scale acquisitions Disciplined approach 13 1. Capital expenditures of approximately $30 million are reported in cash flow from investing activities and cloud computing arr ang ements of $15 million are reported in cash flow from operating activities for full year 2023. Quarterly Dividend $8.5 million in dividend payments in 1Q’23
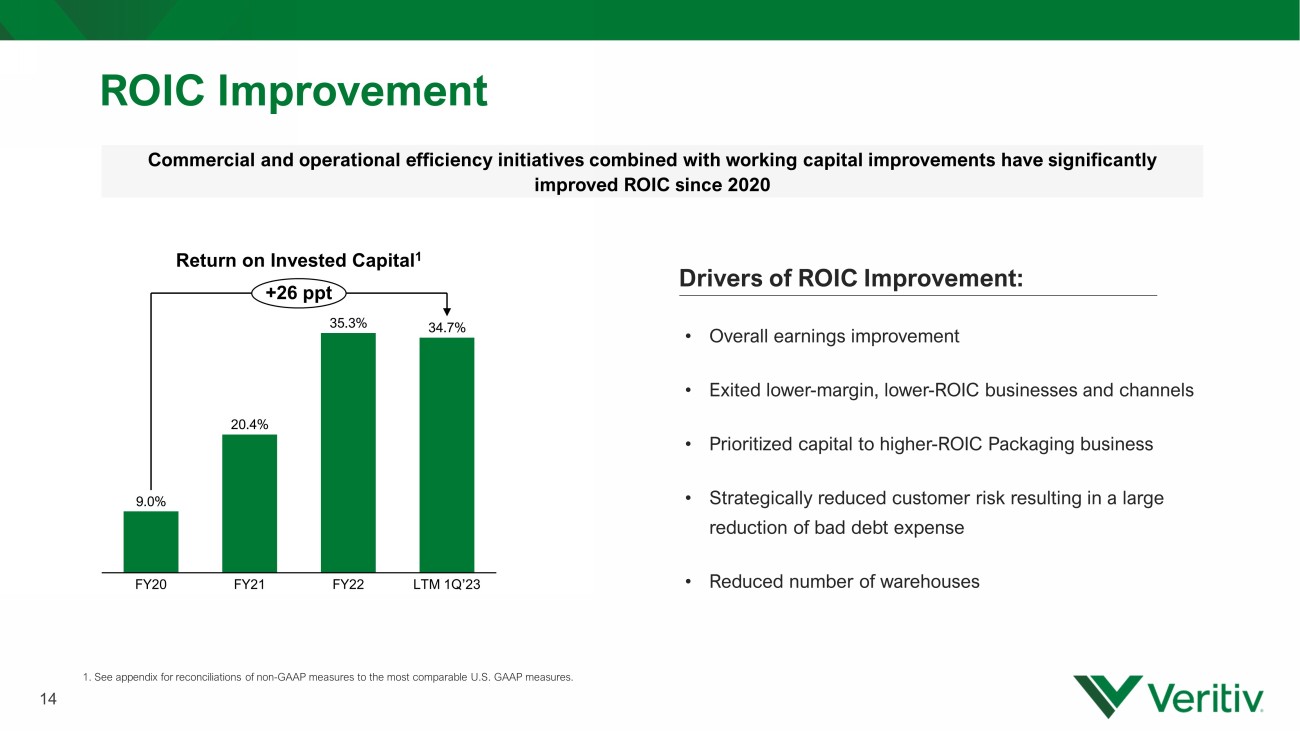
ROIC Improvement 1. See appendix for reconciliations of non - GAAP measures to the most comparable U.S. GAAP measures. Commercial and operational efficiency initiatives combined with working capital improvements have significantly improved ROIC since 2020 14 9.0% 20.4% 35.3% 34.7% FY22 FY20 FY21 LTM 1Q’23 +26 ppt Return on Invested Capital 1 Drivers of ROIC Improvement: • Overall earnings improvement • Exited lower - margin, lower - ROIC businesses and channels • Prioritized capital to higher - ROIC Packaging business • Strategically reduced customer risk resulting in a large reduction of bad debt expense • Reduced number of warehouses
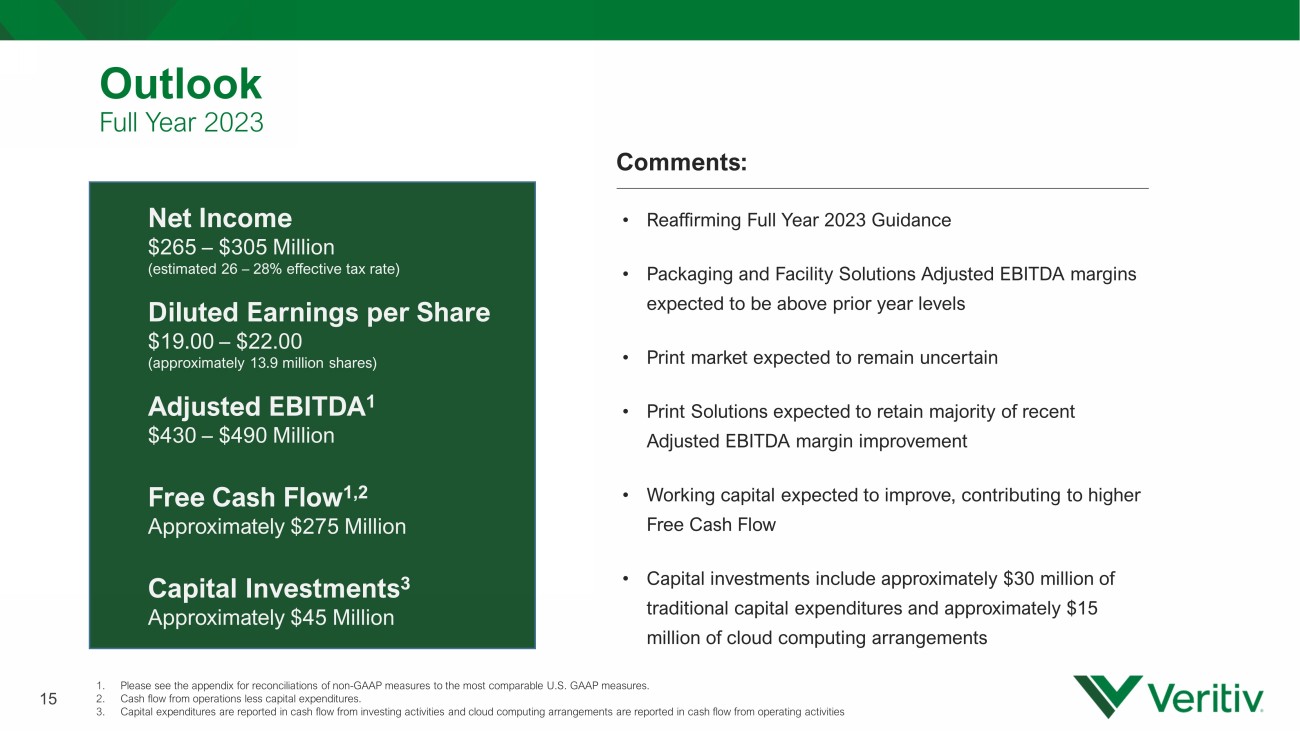
Outlook Full Year 2023 1. P lease see the appendix for reconciliations of non - GAAP measures to the most comparable U.S. GAAP measures. 2. Cash flow from operations less capital expenditures. 3. Capital expenditures are reported in cash flow from investing activities and cloud computing arrangements are reported in cas h f low from operating activities Net Income $265 – $305 Million (estimated 26 – 28% effective tax rate) Diluted Earnings per Share $19.00 – $22.00 (approximately 13.9 million shares) Adjusted EBITDA 1 $430 – $490 Million Free Cash Flow 1,2 Approximately $275 Million Capital Investments 3 Approximately $45 Million 15 Comments : • Reaffirming Full Year 2023 Guidance • Packaging and Facility Solutions Adjusted EBITDA margins expected to be above prior year levels • Print market expected to remain uncertain • Print Solutions expected to retain majority of recent Adjusted EBITDA margin improvement • Working capital expected to improve, contributing to higher Free Cash Flow • Capital investments include approximately $30 million of traditional capital expenditures and approximately $15 million of cloud computing arrangements

SAL ABBATE Chief Executive Officer
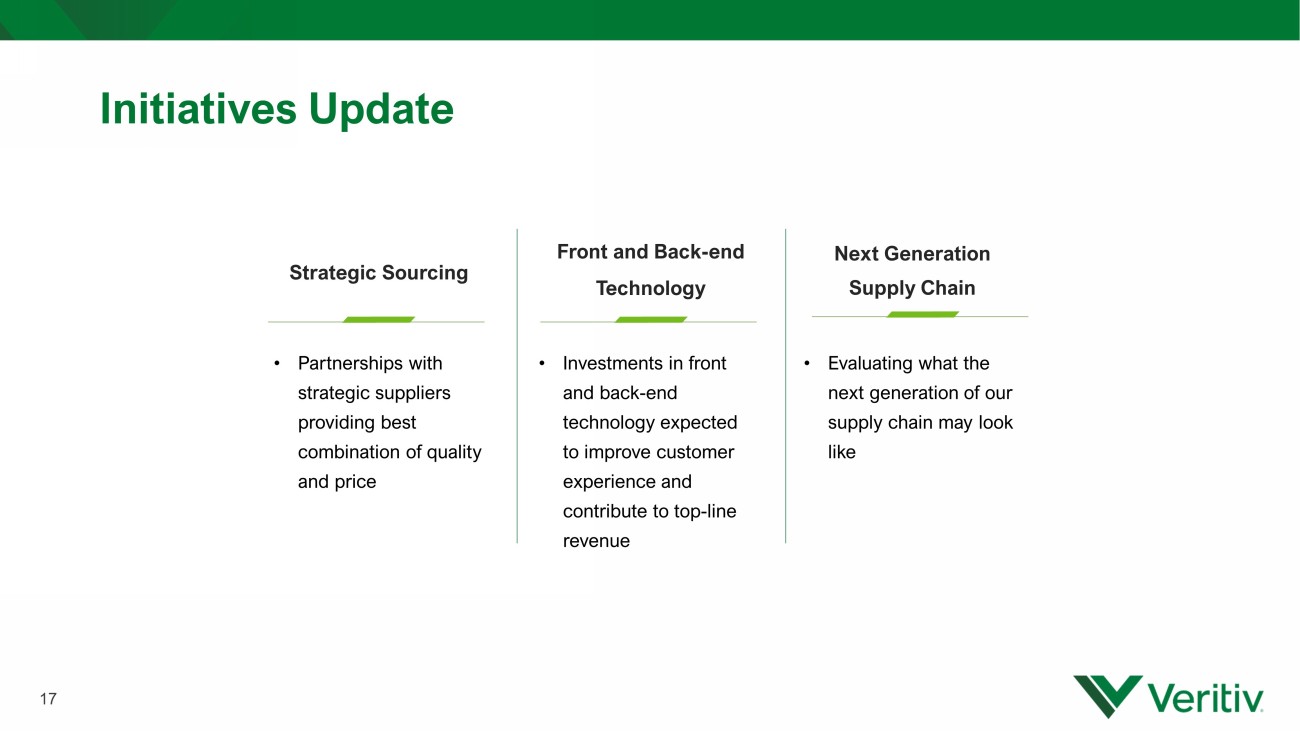
Initiatives Update Strategic Sourcing • Evaluating what the next generation of our supply chain may look like 17 Front and Back - end Technology • Investments in front and back - end technology expected to improve customer experience and contribute to top - line revenue Next Generation Supply Chain • Partnerships with strategic suppliers providing best combination of quality and price
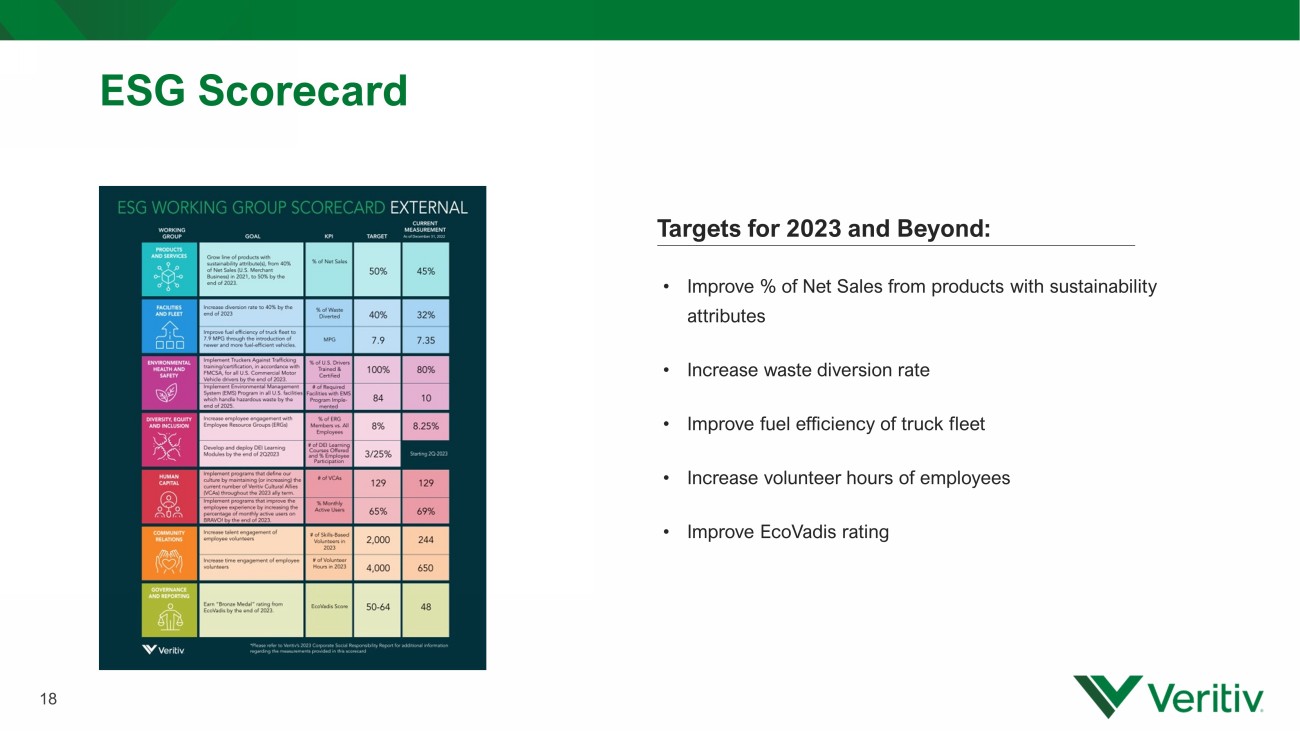
ESG Scorecard 18 Targets for 2023 and Beyond: • Improve % of Net Sales from products with sustainability attributes • Increase waste diversion rate • Improve fuel efficiency of truck fleet • Increase volunteer hours of employees • Improve EcoVadis rating

Questions 19
Appendix Reconciliation of Non - GAAP Financial Measures We supplement our financial information prepared in accordance with U.S. GAAP with certain non - GAAP measures including organic s ales (net sales on an average daily sales basis, excluding revenue from sold businesses and revenue from acquired businesses for a period of 12 mon ths after we complete the acquisition), Adjusted EBITDA (earnings before interest, income taxes, depreciation and amortization, restructuring charges, net , integration and acquisition expenses and other similar charges including any severance costs, costs associated with warehouse and office openings or clos ing s, consolidation, and relocation and other business optimization expenses, stock - based compensation expense, changes in the LIFO reserve, non - restruct uring asset impairment charges, non - restructuring severance charges, non - restructuring pension charges (benefits), fair value adjustments related to co ntingent liabilities assumed in mergers and acquisitions and certain other adjustments), free cash flow and other non - GAAP measures such as the Net Leverage Rat io (calculated as net debt divided by trailing twelve months of Adjusted EBITDA) and Return on Invested Capital “ROIC” (calculated as Net Operating Prof it After Tax divided by the sum of net working capital and property and equipment. Net Operating Profit After Tax is defined as Adjusted EBITDA less depreciatio n a nd amortization times 1 minus the standard tax rate 1 ). We believe investors commonly use Adjusted EBITDA, free cash flow and these other non - GAAP measures as key financial metrics for valuing companies; we also present organic sales to help investors better compare period - over - period results. In addition, the c redit agreement governing our Asset - Based Lending Facility (the "ABL Facility") permits us to exclude the foregoing and other charges in calculating "Consolid ated EBITDA", as defined in the ABL Facility. Consolidated EBITDA and ROIC are also used as a basis for certain compensation programs sponsored by the Compan y. Organic sales, Adjusted EBITDA, free cash flow, Return on Invested Capital and these other non - GAAP measures are not alternative measures of financial performance or liquidity under U.S. GAAP. Non - GAAP measures do not have definitions under U.S. GAAP and may be defined different ly by, and not be comparable to, similarly titled measures used by other companies. As a result, we consider and evaluate non - GAAP measures in con nection with a review of the most directly comparable measure calculated in accordance with U.S. GAAP. We caution investors not to place undue reliance on su ch non - GAAP measures and to consider them with the most directly comparable U.S. GAAP measures. Organic sales, Adjusted EBITDA, free cash flow, RO IC and these other non - GAAP measures have limitations as analytical tools and should not be considered in isolation or as a substitute for analyzing ou r results as reported under U.S. GAAP. Please see the following tables for reconciliations of non - GAAP measures to the most comparable U.S. GAAP measures. 1 The Company uses a standard tax rate of 26%. 20
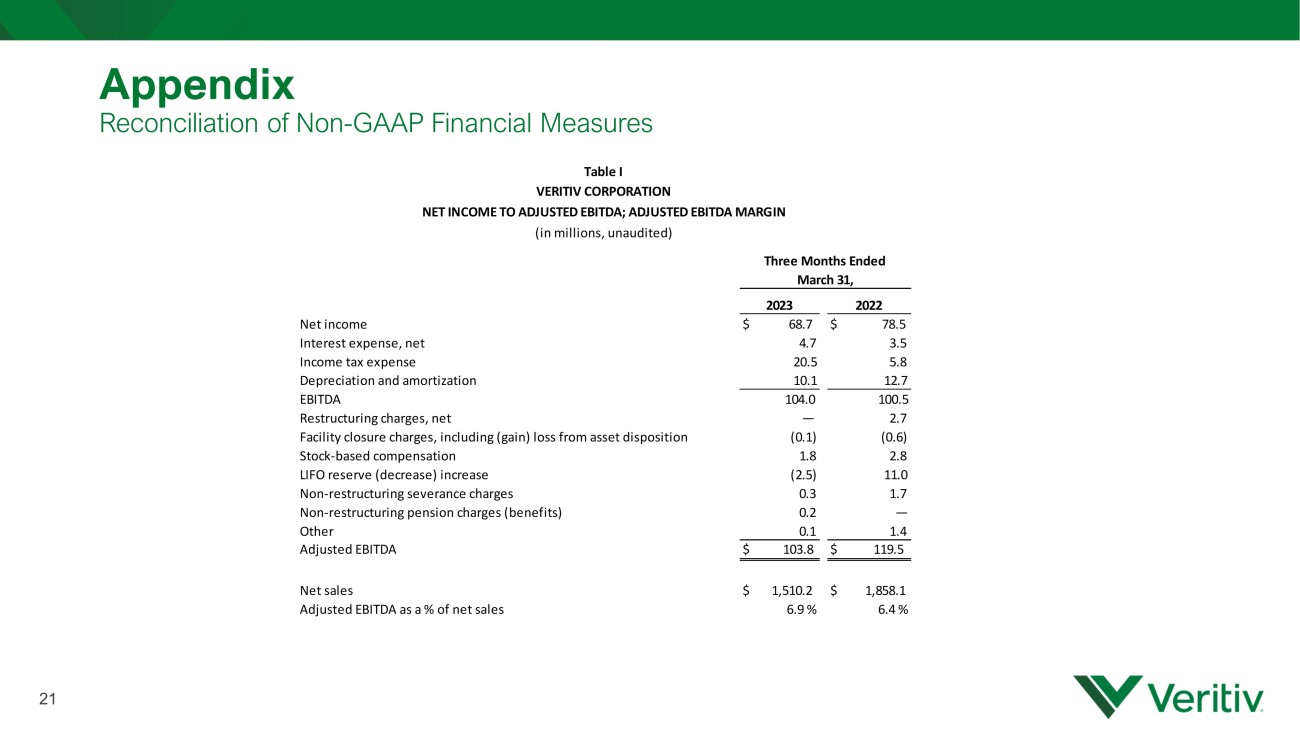
Appendix Reconciliation of Non - GAAP Financial Measures 21 2023 2022 Net income $ 68.7 $ 78.5 Interest expense, net 4.7 3.5 Income tax expense 20.5 5.8 Depreciation and amortization 10.1 12.7 EBITDA 104.0 100.5 Restructuring charges, net — 2.7 Facility closure charges, including (gain) loss from asset disposition (0.1) (0.6) Stock-based compensation 1.8 2.8 LIFO reserve (decrease) increase (2.5) 11.0 Non-restructuring severance charges 0.3 1.7 Non-restructuring pension charges (benefits) 0.2 — Other 0.1 1.4 Adjusted EBITDA $ 103.8 $ 119.5 Net sales $ 1,510.2 $ 1,858.1 Adjusted EBITDA as a % of net sales 6.9 % 6.4 % Three Months Ended March 31, Table I VERITIV CORPORATION NET INCOME TO ADJUSTED EBITDA; ADJUSTED EBITDA MARGIN (in millions, unaudited)
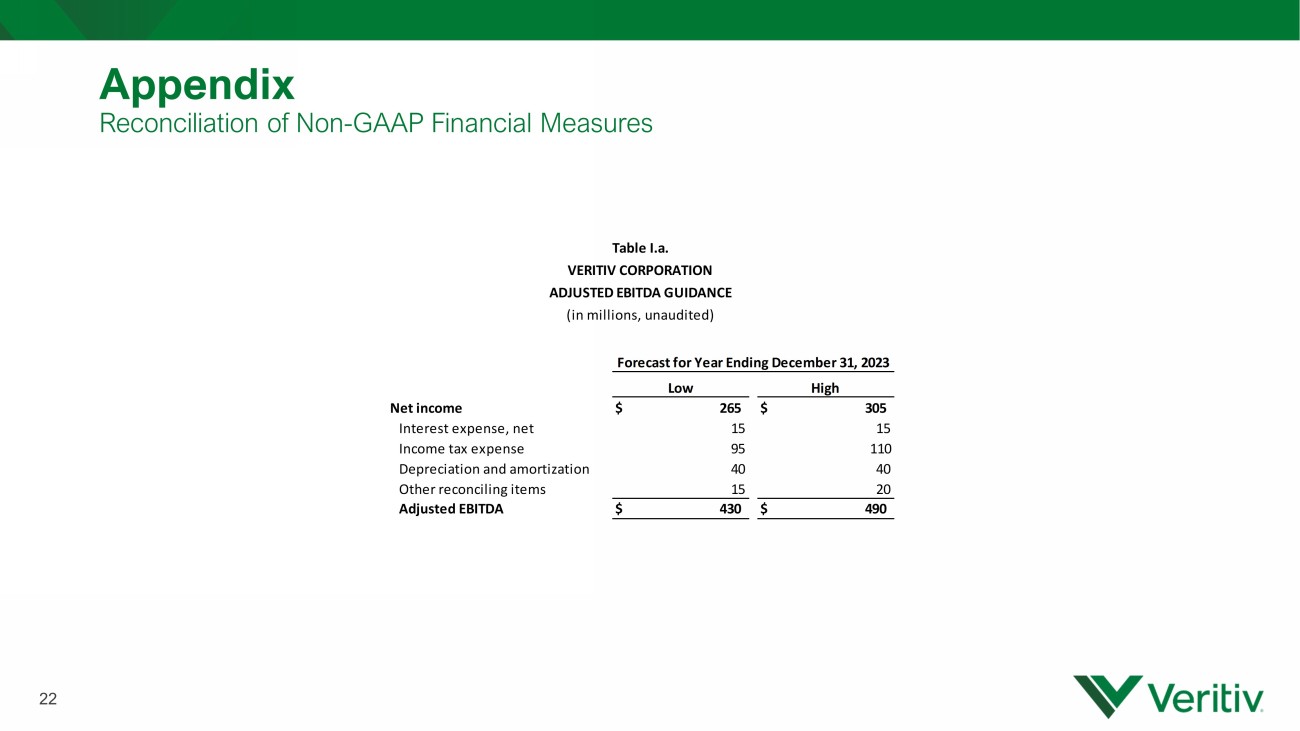
22 Appendix Reconciliation of Non - GAAP Financial Measures Low High Net income $ 265 $ 305 Interest expense, net 15 15 Income tax expense 95 110 Depreciation and amortization 40 40 Other reconciling items 15 20 Adjusted EBITDA $ 430 $ 490 Forecast for Year Ending December 31, 2023 Table I.a. VERITIV CORPORATION ADJUSTED EBITDA GUIDANCE (in millions, unaudited)
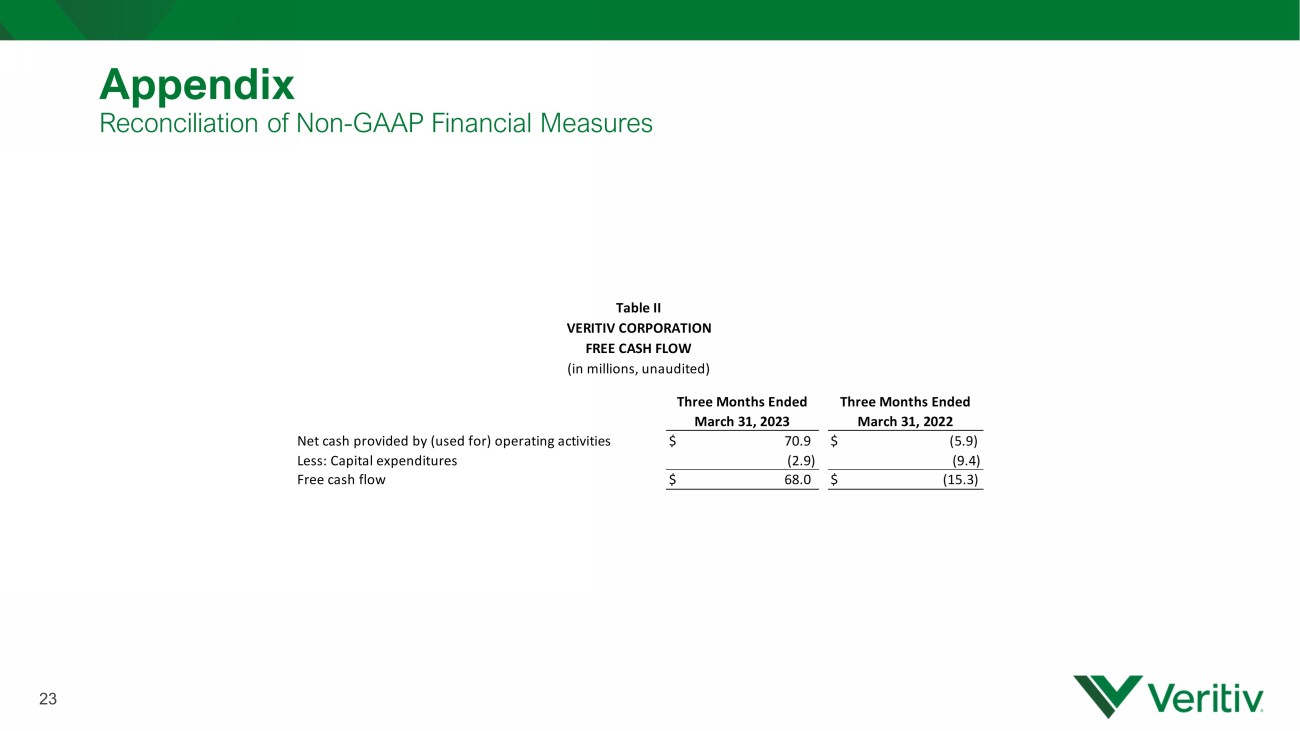
23 Appendix Reconciliation of Non - GAAP Financial Measures Three Months Ended March 31, 2023 Three Months Ended March 31, 2022 Net cash provided by (used for) operating activities $ 70.9 $ (5.9) Less: Capital expenditures (2.9) (9.4) Free cash flow $ 68.0 $ (15.3) Table II VERITIV CORPORATION FREE CASH FLOW (in millions, unaudited)
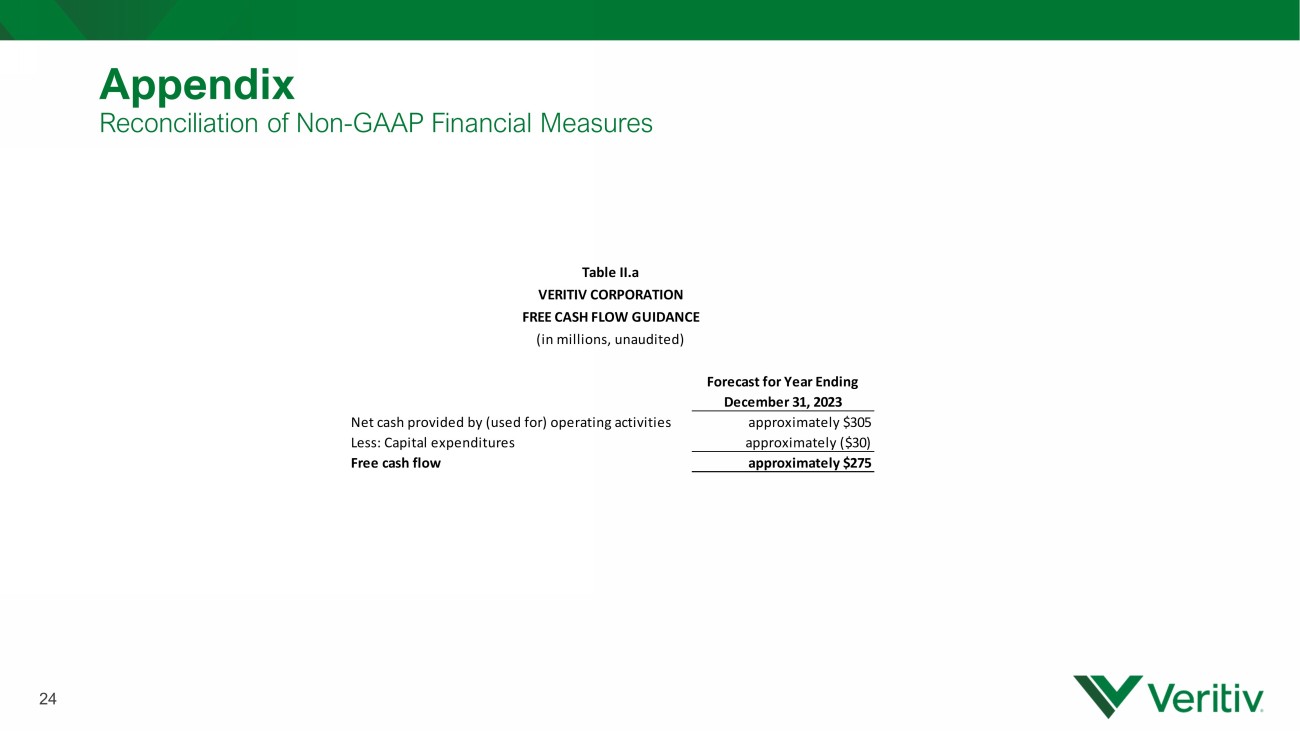
24 Appendix Reconciliation of Non - GAAP Financial Measures Forecast for Year Ending December 31, 2023 Net cash provided by (used for) operating activities approximately $305 Less: Capital expenditures approximately ($30) Free cash flow approximately $275 Table II.a VERITIV CORPORATION FREE CASH FLOW GUIDANCE (in millions, unaudited)
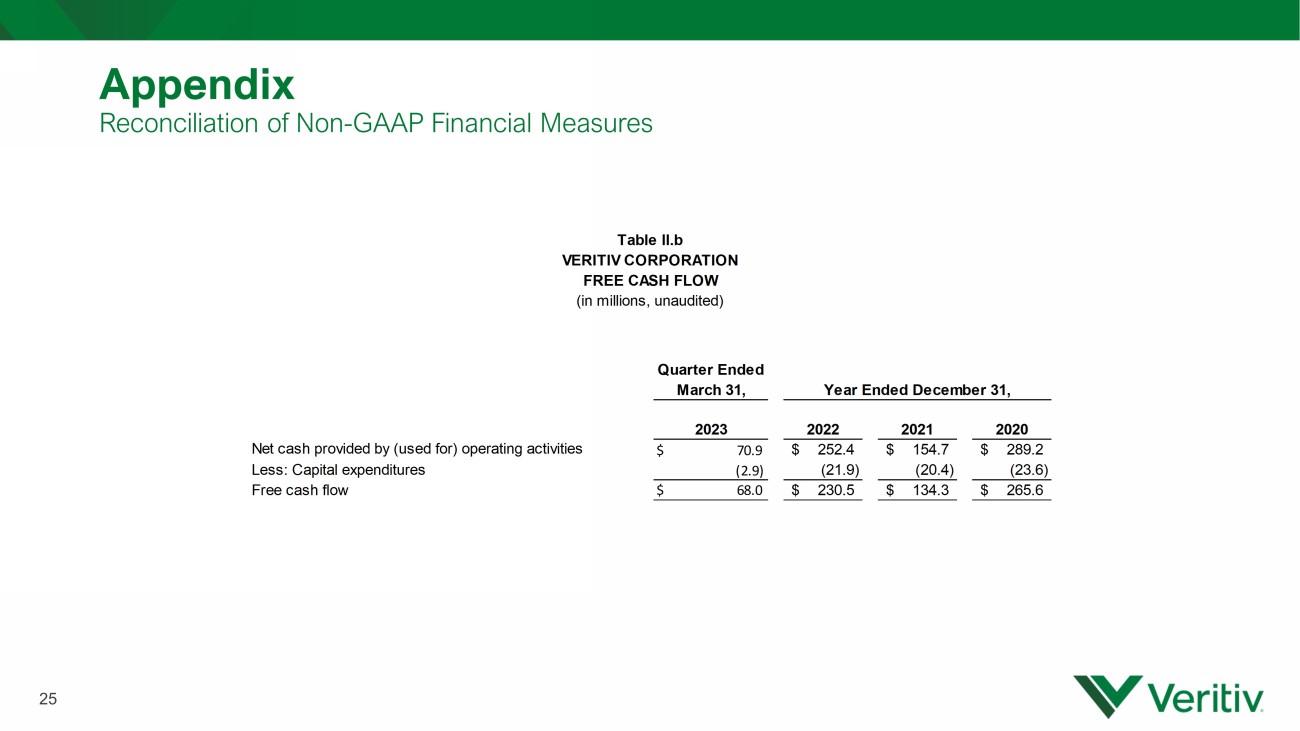
25 Appendix Reconciliation of Non - GAAP Financial Measures VERITIV CORPORATION FREE CASH FLOW (in millions, unaudited) Quarter Ended March 31, 2023 2022 2021 2020 Net cash provided by (used for) operating activities $ 70.9 252.4$ 154.7$ 289.2$ Less: Capital expenditures (2.9) (21.9) (20.4) (23.6) Free cash flow $ 68.0 230.5$ 134.3$ 265.6$ Table ll.b Year Ended December 31,
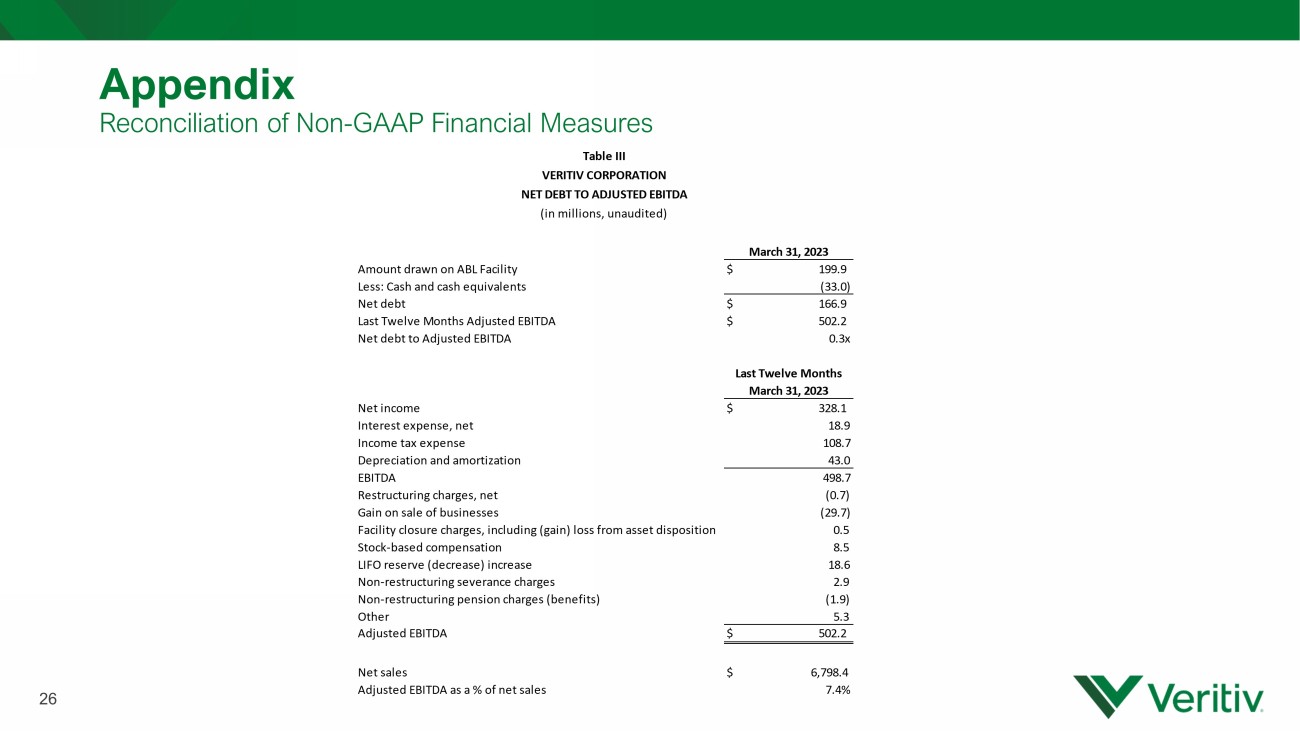
26 Appendix Reconciliation of Non - GAAP Financial Measures March 31, 2023 Amount drawn on ABL Facility $ 199.9 Less: Cash and cash equivalents (33.0) Net debt $ 166.9 Last Twelve Months Adjusted EBITDA $ 502.2 Net debt to Adjusted EBITDA 0.3x Last Twelve Months March 31, 2023 Net income $ 328.1 Interest expense, net 18.9 Income tax expense 108.7 Depreciation and amortization 43.0 EBITDA 498.7 Restructuring charges, net (0.7) Gain on sale of businesses (29.7) Facility closure charges, including (gain) loss from asset disposition 0.5 Stock-based compensation 8.5 LIFO reserve (decrease) increase 18.6 Non-restructuring severance charges 2.9 Non-restructuring pension charges (benefits) (1.9) Other 5.3 Adjusted EBITDA $ 502.2 Net sales $ 6,798.4 Adjusted EBITDA as a % of net sales 7.4% Table III VERITIV CORPORATION NET DEBT TO ADJUSTED EBITDA (in millions, unaudited)
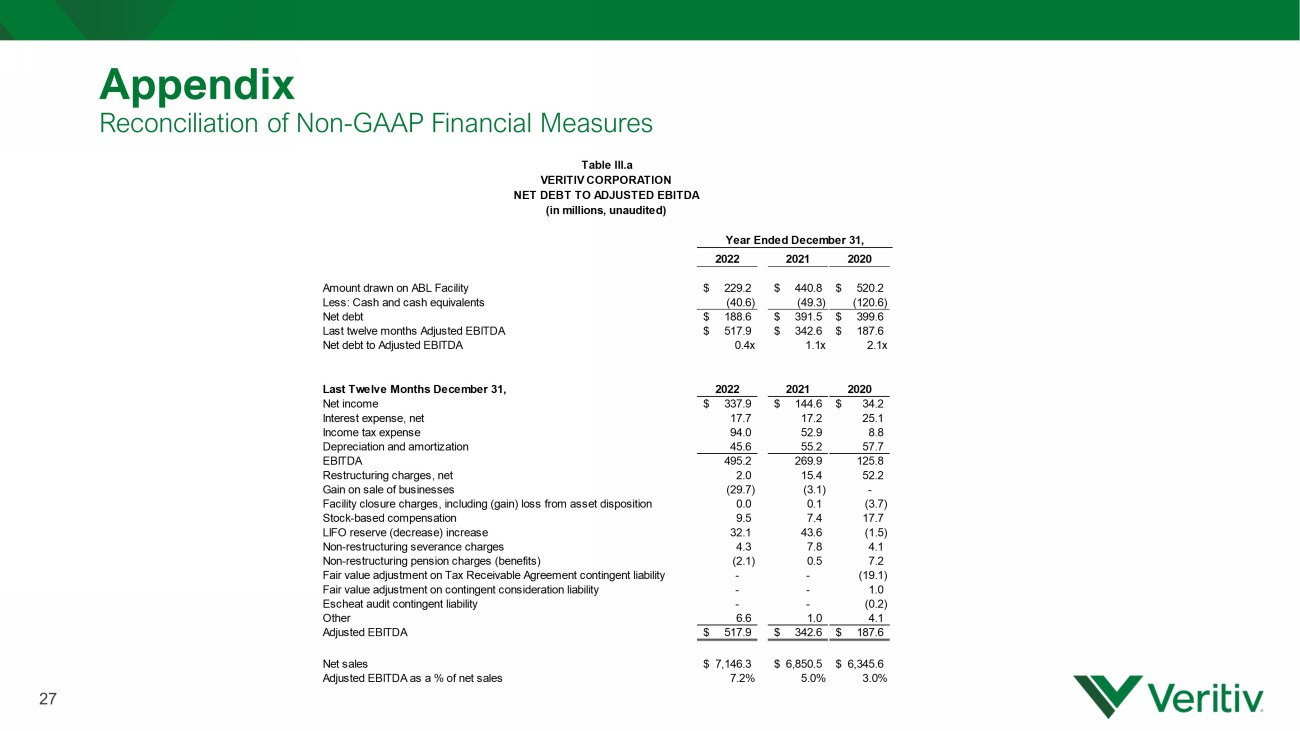
27 Appendix Reconciliation of Non - GAAP Financial Measures 2022 2021 2020 Amount drawn on ABL Facility 229.2$ 440.8$ 520.2$ Less: Cash and cash equivalents (40.6) (49.3) (120.6) Net debt 188.6$ 391.5$ 399.6$ Last twelve months Adjusted EBITDA 517.9$ 342.6$ 187.6$ Net debt to Adjusted EBITDA 0.4x 1.1x 2.1x Last Twelve Months December 31, 2022 2021 2020 Net income 337.9$ 144.6$ 34.2$ Interest expense, net 17.7 17.2 25.1 Income tax expense 94.0 52.9 8.8 Depreciation and amortization 45.6 55.2 57.7 EBITDA 495.2 269.9 125.8 Restructuring charges, net 2.0 15.4 52.2 Gain on sale of businesses (29.7) (3.1) - Facility closure charges, including (gain) loss from asset disposition 0.0 0.1 (3.7) Stock-based compensation 9.5 7.4 17.7 LIFO reserve (decrease) increase 32.1 43.6 (1.5) Non-restructuring severance charges 4.3 7.8 4.1 Non-restructuring pension charges (benefits) (2.1) 0.5 7.2 Fair value adjustment on Tax Receivable Agreement contingent liability - - (19.1) Fair value adjustment on contingent consideration liability - - 1.0 Escheat audit contingent liability - - (0.2) Other 6.6 1.0 4.1 Adjusted EBITDA 517.9$ 342.6$ 187.6$ Net sales 7,146.3$ 6,850.5$ 6,345.6$ Adjusted EBITDA as a % of net sales 7.2% 5.0% 3.0% Table lll.a VERITIV CORPORATION NET DEBT TO ADJUSTED EBITDA (in millions, unaudited) Year Ended December 31,
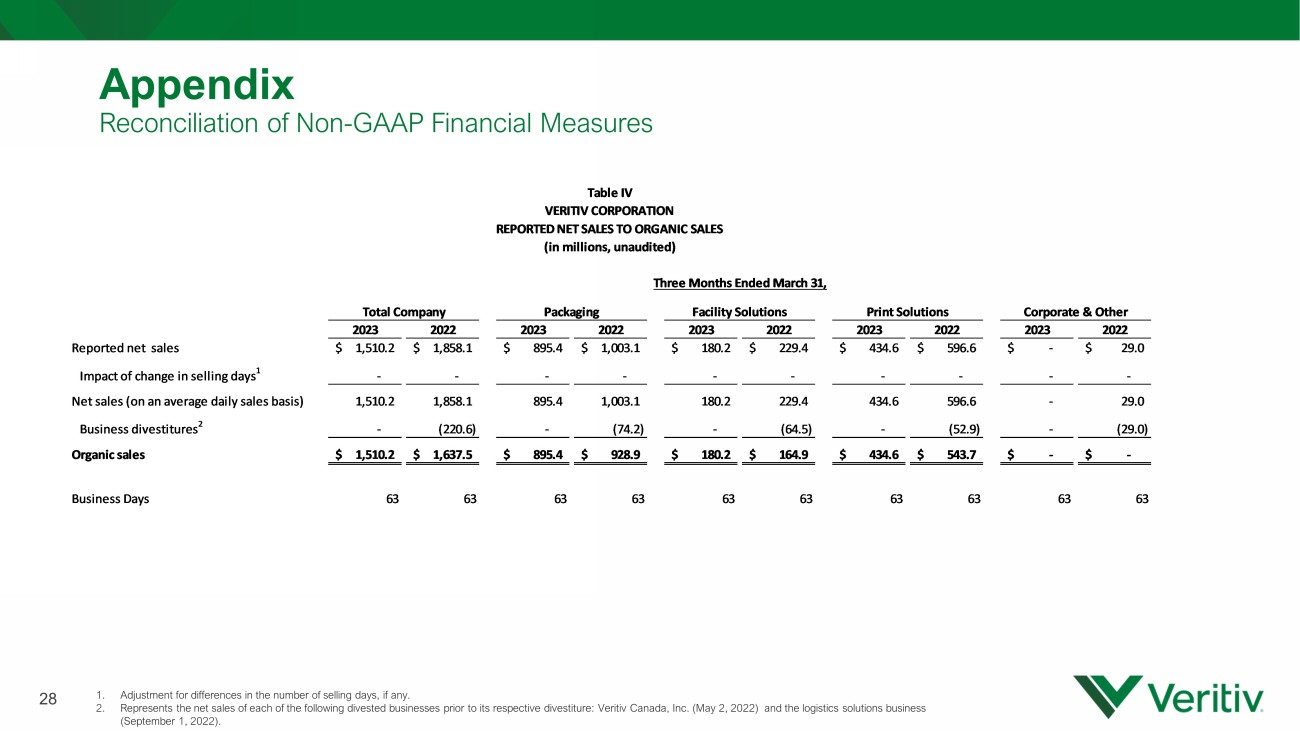
28 Appendix Reconciliation of Non - GAAP Financial Measures 1. Adjustment for differences in the number of selling days, if any. 2. Represents the net sales of each of the following divested businesses prior to its respective divestiture: Veritiv Canada, In c. (May 2, 2022) and the logistics solutions business (September 1, 2022). 2023 2022 2023 2022 2023 2022 2023 2022 2023 2022 Reported net sales 1,510.2$ 1,858.1$ 895.4$ 1,003.1$ 180.2$ 229.4$ 434.6$ 596.6$ -$ 29.0$ Impact of change in selling days 1 - - - - - - - - - - Net sales (on an average daily sales basis) 1,510.2 1,858.1 895.4 1,003.1 180.2 229.4 434.6 596.6 - 29.0 Business divestitures 2 - (220.6) - (74.2) - (64.5) - (52.9) - (29.0) Organic sales 1,510.2$ 1,637.5$ 895.4$ 928.9$ 180.2$ 164.9$ 434.6$ 543.7$ -$ -$ Business Days 63 63 63 63 63 63 63 63 63 63 Corporate & Other Three Months Ended March 31, Table IV VERITIV CORPORATION REPORTED NET SALES TO ORGANIC SALES (in millions, unaudited) Print Solutions Total Company Packaging Facility Solutions
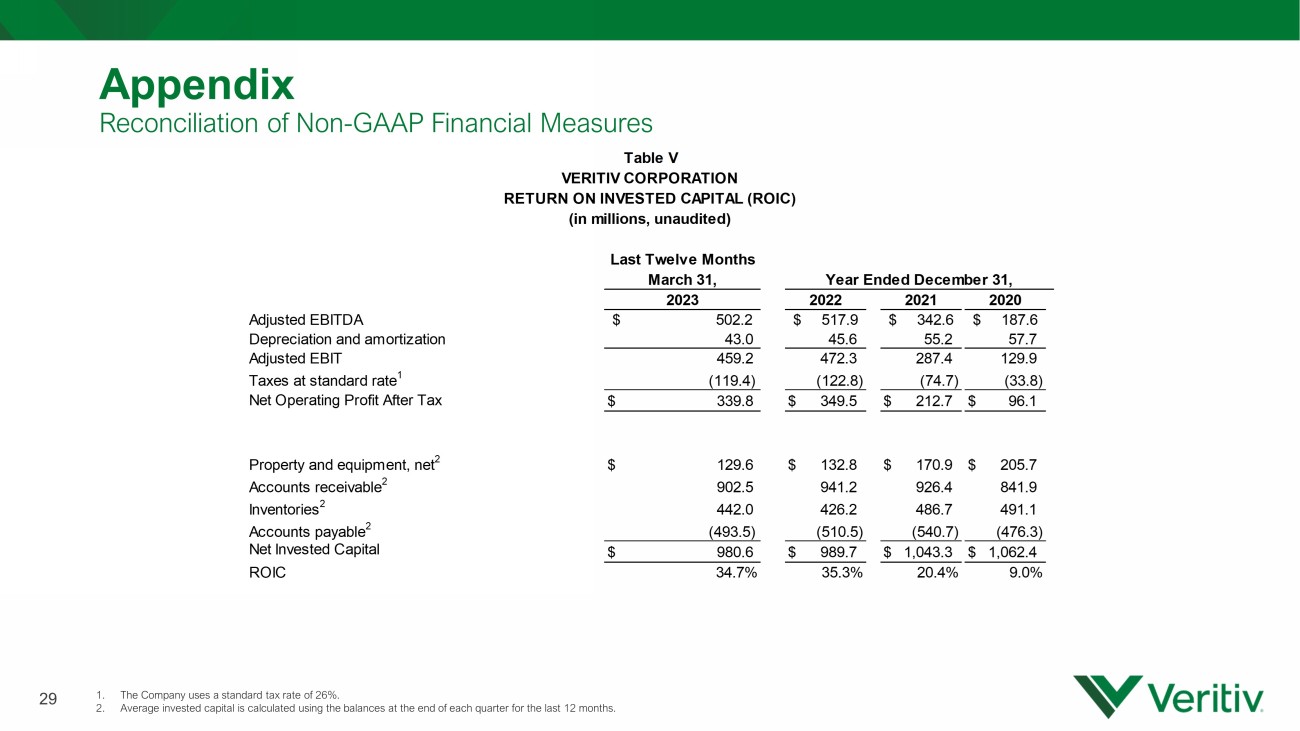
29 Appendix Reconciliation of Non - GAAP Financial Measures 1. The Company uses a standard tax rate of 26%. 2. Average invested capital is calculated using the balances at the end of each quarter for the last 12 months. Last Twelve Months March 31, 2023 2022 2021 2020 Adjusted EBITDA 502.2$ 517.9$ 342.6$ 187.6$ Depreciation and amortization 43.0 45.6 55.2 57.7 Adjusted EBIT 459.2 472.3 287.4 129.9 Taxes at standard rate 1 (119.4) (122.8) (74.7) (33.8) Net Operating Profit After Tax $ 339.8 $ 349.5 $ 212.7 $ 96.1 Property and equipment, net 2 $ 129.6 $ 132.8 $ 170.9 $ 205.7 Accounts receivable 2 902.5 941.2 926.4 841.9 Inventories 2 442.0 426.2 486.7 491.1 Accounts payable 2 (493.5) (510.5) (540.7) (476.3) Net Invested Capital $ 980.6 $ 989.7 $ 1,043.3 $ 1,062.4 ROIC 34.7% 35.3% 20.4% 9.0% Year Ended December 31, Table V VERITIV CORPORATION RETURN ON INVESTED CAPITAL (ROIC) (in millions, unaudited)

30 FIRST QUARTER 2023 FINANCIAL RESULTS May 9, 2023