 |
 |
|
3756 Central Avenue
|
NEWS RELEASE
|
|
Riverside, CA 92506
|
|
|
(951) 686-6060
|
PROVIDENT FINANCIAL HOLDINGS REPORTS
THIRD QUARTER FISCAL 2023 RESULTS
Net Income of $2.32 Million in the March 2023 Quarter
Net Interest Margin Expanded 39 Basis Points in Comparison
to the Same Quarter Last Year
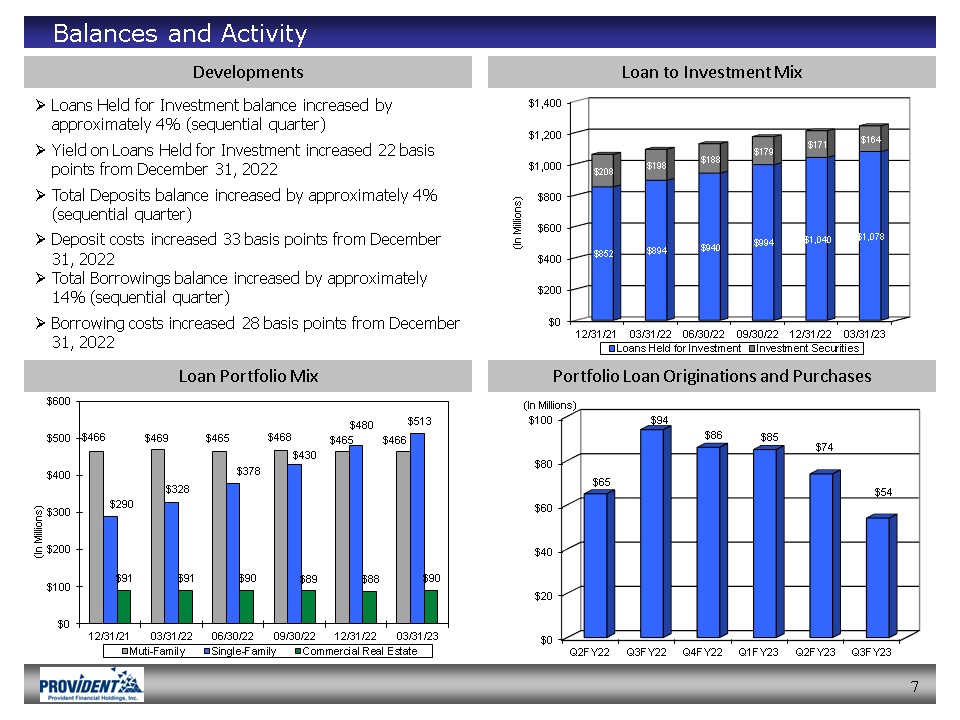
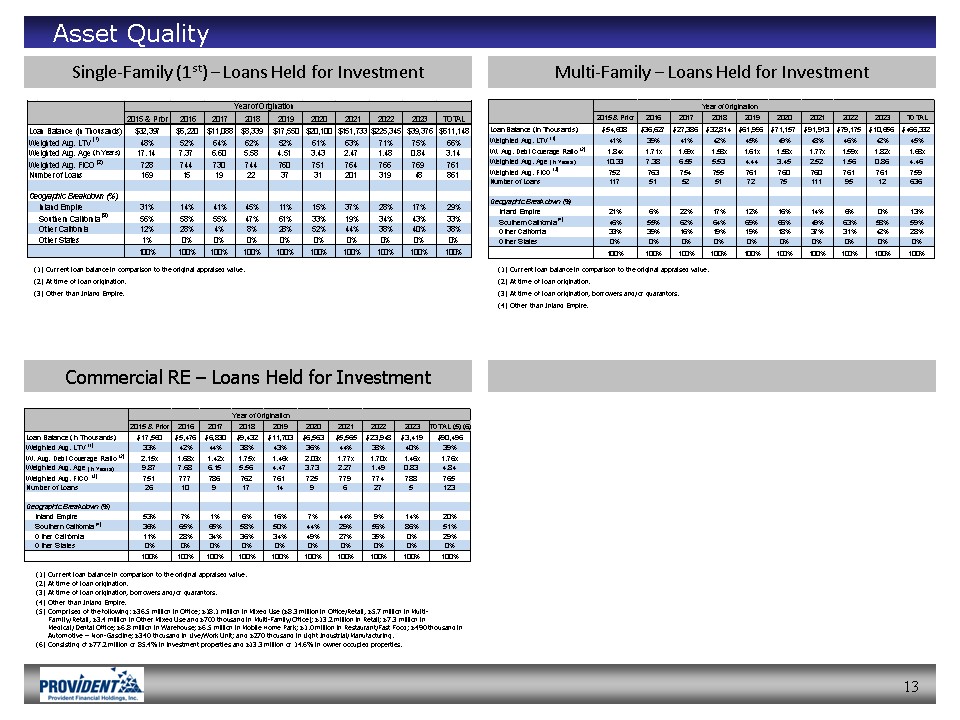
Loans Held for Investment Increased 15% from June 30, 2022 to $1.08 Billion
Total Deposits Increased 3% from June 30, 2022 to $983.0 Million
Strong Asset Quality with Non-Performing Assets to Total Assets Ratio of 0.07%
Non-Interest Expenses Remained Well-Controlled
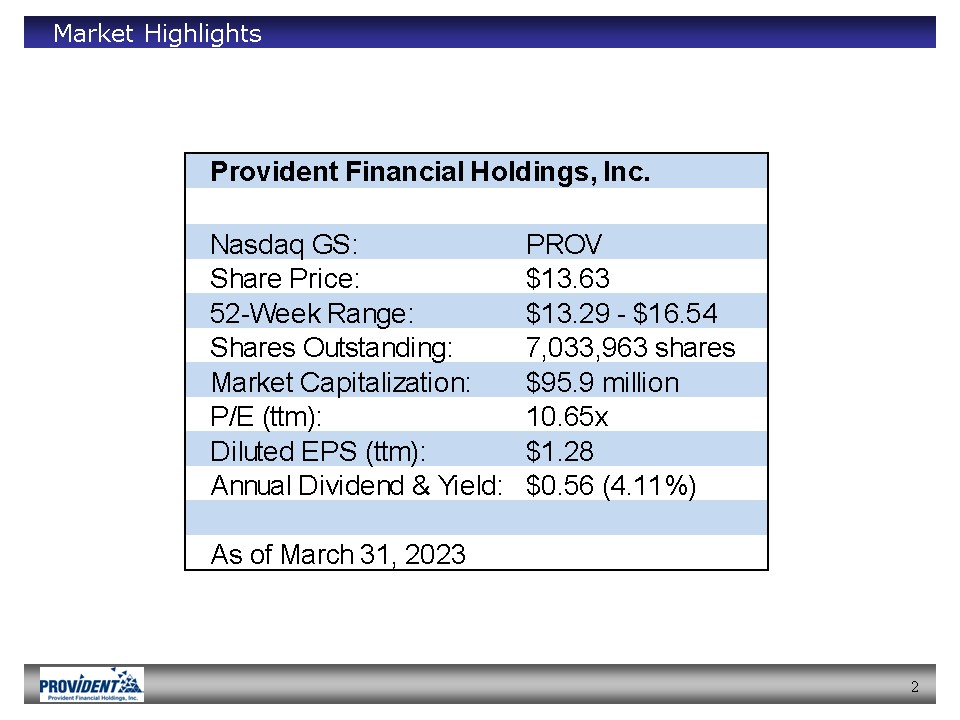
Riverside, Calif. – April 26, 2023 – Provident Financial Holdings, Inc. (“Company”), NASDAQ
GS: PROV, the holding company for Provident Savings Bank, F.S.B. (“Bank”), today announced third quarter earnings for the fiscal year ending June 30, 2023.
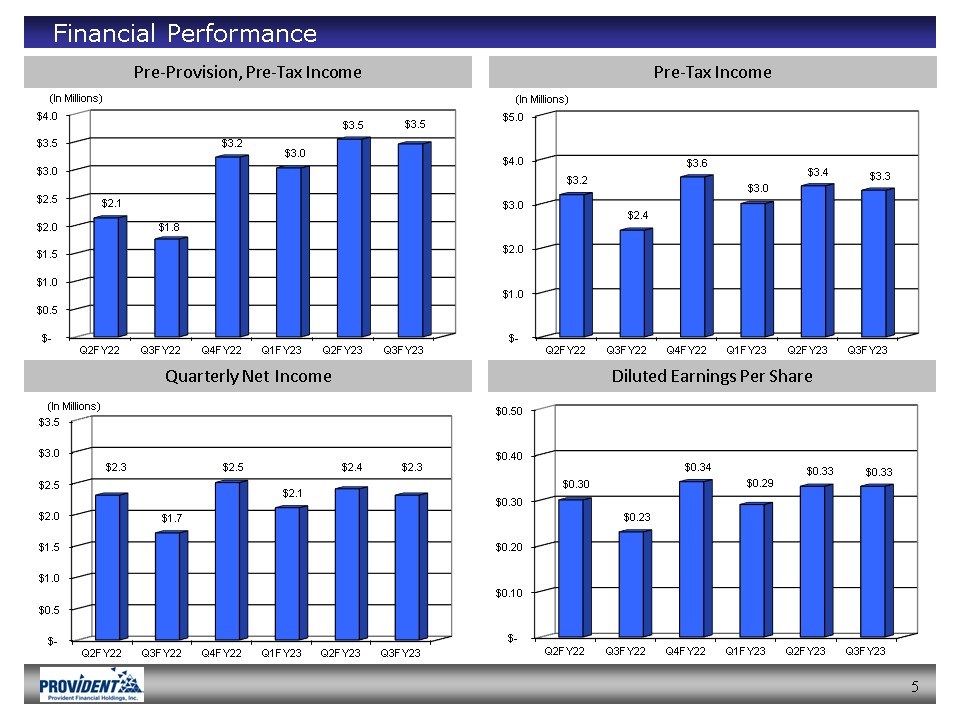
For the quarter ended March 31, 2023, the Company reported net income of $2.32 million, or
$0.33 per diluted share (on 7.15 million average diluted shares outstanding), up 37 percent from net income of $1.70 million, or $0.23 per diluted share (on 7.41 million average diluted shares outstanding), in the comparable period a year ago. The
increase in earnings was primarily attributable to a $1.86 million increase in net interest income, partly offset by an $814,000 change to the provision for loan losses to a $169,000 provision for loan losses this quarter in contrast to a $645,000
recovery from the allowance for loan losses in the same quarter last year and a $133,000 decrease in non-interest income.
“We are pleased with our recent financial results particularly when evaluated against the
backdrop of recent industry turmoil. Our community banking organization is well-capitalized, profitable, regulatorily compliant and built on a strong financial foundation. We primarily make loans on homes and apartment buildings and offer checking
accounts, savings accounts, and certificates of deposit to individuals, families and small businesses,” said Craig G. Blunden, Chairman and Chief Executive Officer of the Company. “Our community banking focus is conservative, easily understood and
has served and is expected to continue to serve our local customers and communities very well for many, many years,” concluded Blunden.
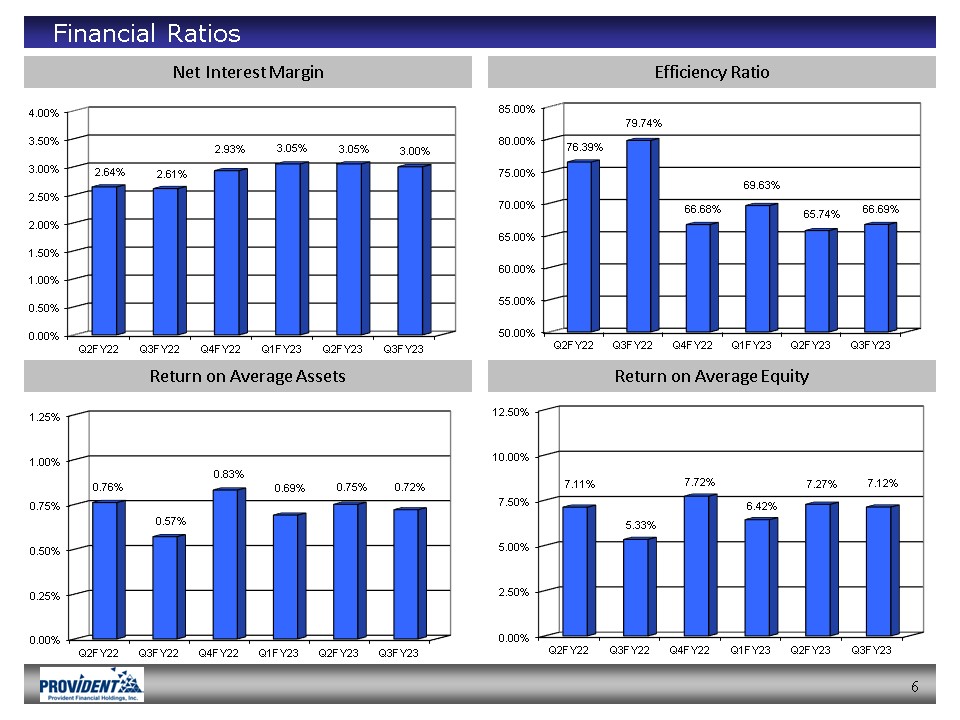
Return on average assets for the third quarter of fiscal 2023 was 0.72 percent, up from 0.57
percent for the same period of fiscal 2022; and return on average stockholders’ equity for the third
Page 1 of 15
|
|
quarter of fiscal 2023 was 7.12 percent, up from 5.33 percent for the comparable period of fiscal 2022.
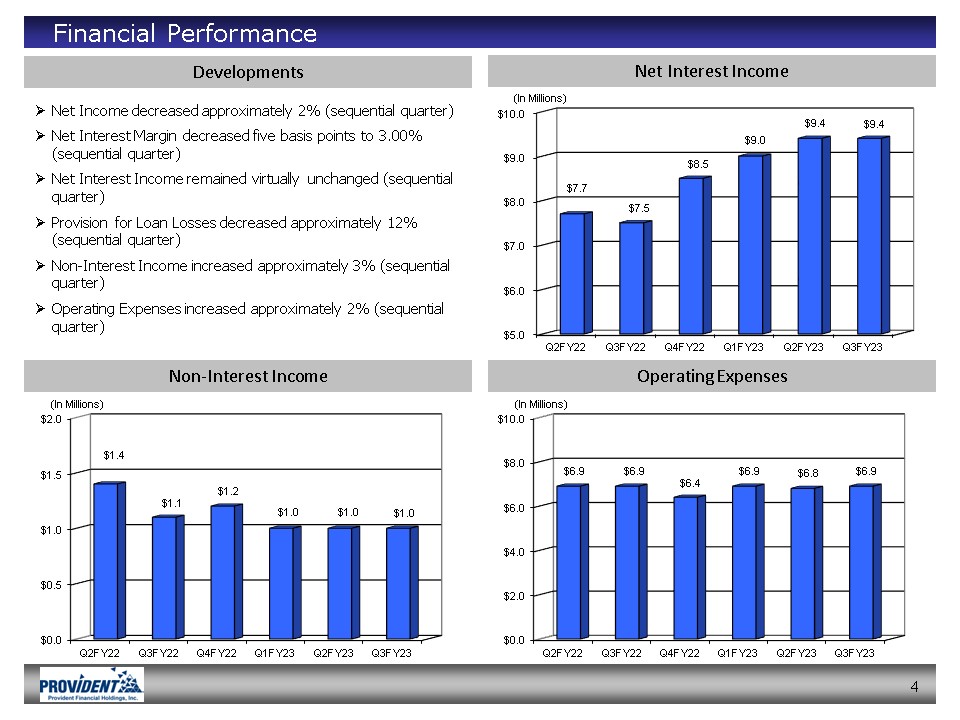
On a sequential quarter basis, the $2.32 million net income for the third quarter of fiscal
2023 reflects a two percent decrease from $2.37 million in the second quarter of fiscal 2023. The decrease was primarily attributable to a $126,000 increase in non-interest expenses, partly offset by a $16,000 increase in net interest income, a
$22,000 decrease in the provision for loan losses and a $25,000 increase in non-interest income. Diluted earnings per share for the third quarter of fiscal 2023 were $0.33 per share, unchanged from the second quarter of fiscal 2023. Return on average
assets was 0.72 percent for the third quarter of fiscal 2023, slightly lower than the 0.75 percent in the second quarter of fiscal 2023; and return on average stockholders’ equity for the third quarter of fiscal 2023 was 7.12 percent, slightly lower
than the 7.27 percent for the second quarter of fiscal 2023.
For the nine months ended March 31, 2023, net income increased $154,000, or two percent, to
$6.78 million from $6.63 million in the comparable period ended March 31, 2022. Diluted earnings per share for the nine months ended March 31, 2023 increased six percent to $0.94 per share (on 7.23 million average diluted shares outstanding) from
$0.89 per share (on 7.49 million average diluted shares outstanding) for the comparable nine-month period last year. The increase in earnings was primarily attributable to a $4.66 million increase in net interest income, partly offset by a $2.48
million change in the provision for loan losses to a $430,000 provision for loan losses in the nine months ended March 31, 2023 in contrast to a $2.05 million recovery from the allowance for loan losses in the comparable period last year, a $1.19
million increase in non-interest expense (primarily attributable to the $1.20 million employee retention tax credit recorded in the first quarter of fiscal 2022 and not replicated in the current fiscal year to date) and a $611,000 decrease in
non-interest income (mainly a decrease in loan prepayment fees).
In the third quarter of fiscal 2023, net interest income increased $1.86 million, or 25
percent, to $9.40 million from $7.54 million for the same quarter last year. The increase in net interest income was primarily due to a higher net interest margin due to a shift in the composition of interest-earning assets towards higher
yielding loans held for investment and an increase in the average yield on interest-earning assets reflecting recent increases in the targeted federal funds rate, partly offset by increases in the average cost of interest-bearing liabilities. The net
interest margin during the third quarter of fiscal 2023 increased 39 basis points to 3.00 percent from 2.61 percent in the same quarter last year. The average yield on interest-earning assets increased 97 basis points to 3.83 percent in the third
quarter of fiscal 2023 from 2.86 percent in the same quarter last year while the average cost of interest-bearing liabilities increased by 65 basis points to 0.93 percent in the third quarter of fiscal 2023 from 0.28 percent in the same quarter last
year. The average balance of interest-earning assets increased by nine percent to $1.25 billion in the third quarter of fiscal 2023 from $1.16 billion in the same quarter last year. This increase was attributable to the increase in the average
balance of loans receivable, partly offset by decreases in the average balance of investment securities and interest-earning deposits.
Page 2 of 15
|
|
Interest income on loans receivable increased by $3.45 million, or 45 percent, to $11.03
million in the third quarter of fiscal 2023 from $7.58 million in the same quarter of fiscal 2022. The increase was due to a higher average balance and, to a lesser extent, a higher average loan yield. The average balance of loans receivable
increased by $196.1 million, or 23 percent, to $1.05 billion in the third quarter of fiscal 2023 from $858.3 million in the same quarter last year. Total loans originated and purchased for investment in the third quarter of fiscal 2023 were $53.9
million, down 43 percent from $94.0 million in the same quarter last year. Loan principal payments received in the third quarter of fiscal 2023 were $17.5 million, down 67 percent from $53.6 million in the same quarter last year. The average yield on
loans receivable increased by 65 basis points to 4.18 percent in the third quarter of fiscal 2023 from 3.53 percent in the same quarter last year. Net deferred loan cost amortization in the third quarter of fiscal 2023 decreased 54 percent to
$228,000 from $496,000 in the same quarter last year, attributable primarily to fewer loan payoffs. Adjustable-rate loans of approximately $97.4 million were repriced upward in the third quarter of fiscal 2023 by approximately 137 basis points from a
weighted average rate of 4.77 percent to 6.14 percent.
Interest income from investment securities increased $33,000, or six percent, to $548,000 in
the third quarter of fiscal 2023 from $515,000 for the same quarter of fiscal 2022. This increase was attributable to a higher average yield, partly offset by a lower average balance. The average yield on investment securities increased 30 basis
points to 1.31 percent in the third quarter of fiscal 2023 from 1.01 percent for the same quarter last year. The increase in the average investment securities yield was primarily attributable to a lower premium amortization during the current quarter
in comparison to the same quarter last year ($181,000 vs. $328,000) attributable to a lower total principal repayment ($6.9 million vs. $12.3 million) and, to a lesser extent, the upward repricing of adjustable-rate mortgage-backed securities. The
average balance of investment securities decreased by $35.5 million, or 17 percent, to $167.7 million in the third quarter of fiscal 2023 from $203.2 million in the same quarter last year.
In the third quarter of fiscal 2023, the Federal Home Loan Bank – San Francisco (“FHLB”)
distributed a $146,000 cash dividend to the Bank on its FHLB stock, up 19 percent from $123,000 in the same quarter last year. The average balance of FHLB – San
Francisco stock in the third quarter of fiscal 2023 was $8.2 million, virtually unchanged from the same quarter of fiscal 2022 while the average yield increased by 106 basis points to 7.09 percent in the third quarter of fiscal 2023 from 6.03 percent
in the same quarter last year.
Interest income from interest-earning deposits, primarily cash deposited at the Federal
Reserve Bank of San Francisco, was $286,000 in the third quarter of fiscal 2023, up 633 percent from $39,000 in the same quarter of fiscal 2022. The increase was due to a higher average yield, partly offset by a lower average balance. The average
yield earned on interest-earning deposits in the third quarter of fiscal 2023 was 4.65 percent, up 447 basis points from 0.18 percent in the same quarter last year. The average balance of the Company’s interest-earning deposits decreased $61.4
million, or 71 percent, to $24.6 million in the third quarter of fiscal 2023 from $86.0 million in the same quarter last year primarily due to the utilization of excess funds for loan portfolio growth.
Page 3 of 15
|
|
Interest expense on deposits for the third quarter of fiscal 2023 was $879,000, a 221 percent
increase from $274,000 for the same period last year. The increase in interest expense on deposits was attributable to a higher weighted average cost. The average cost of deposits was 0.37 percent in the third quarter of fiscal 2023, up 25 basis
points from 0.12 percent in the same quarter last year. The average balance of deposits decreased slightly to $962.0 million in the third quarter of fiscal 2023 from $963.1 million in the same quarter last year.
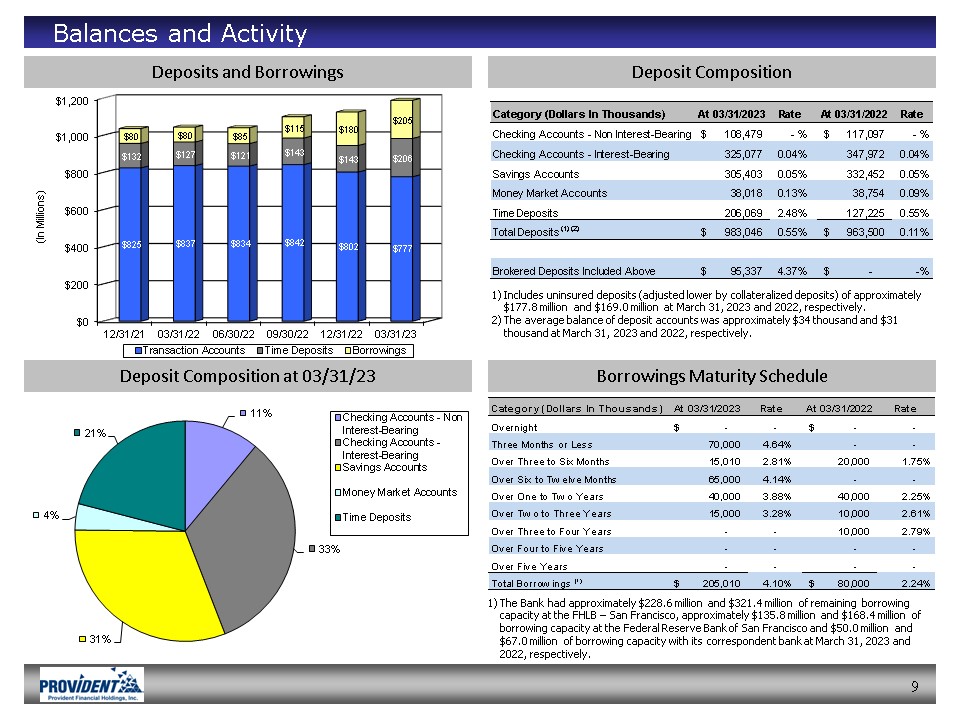
Transaction account balances or “core deposits” decreased $57.4 million, or seven percent, to
$777.0 million at March 31, 2023 from $834.4 million at June 30, 2022 while time deposits increased $85.0 million, or 70 percent, to $206.1 million at March 31, 2023 from $121.1 million at June 30, 2022. The increase in time deposits was due to a
$95.3 million increase in brokered certificates of deposit. As of March 31, 2023, brokered certificates of deposit totaled $95.3 million with a weighted average cost of 4.37 percent (including broker fees).
Interest expense on borrowings, consisting of FHLB – San Francisco advances, for the third
quarter of fiscal 2023 increased $1.28 million, or 287 percent, to $1.73 million from $446,000 for the same period last year. The increase in interest expense on borrowings was primarily the result of a higher average balance and, to a lesser extent, a higher average cost. The average balance of borrowings increased by $96.5 million, or 121 percent, to $176.5 million in the third quarter of fiscal 2023 from $80.0
million in the same quarter last year and the average cost of borrowings increased by 171 basis points to 3.97 percent in the third quarter of fiscal 2023 from 2.26 percent in the same quarter last year.
At March 31, 2023, the Bank has approximately $228.6 million of remaining borrowing capacity
at the FHLB – San Francisco. Additionally, the Bank has an unused secured borrowing facility of approximately $135.8 million with the Federal Reserve Bank of San Francisco and an unused unsecured federal funds borrowing
facility of $50.0 million with its correspondent bank.
The Bank continues to work with both the FHLB - San
Francisco and Federal Reserve Bank of San Francisco to ensure that borrowing capacity is continuously reviewed and updated in order to be accessed seamlessly should the need arise. This includes establishing accounts and pledging assets as needed in
order to maximize borrowing capacity and liquidity.
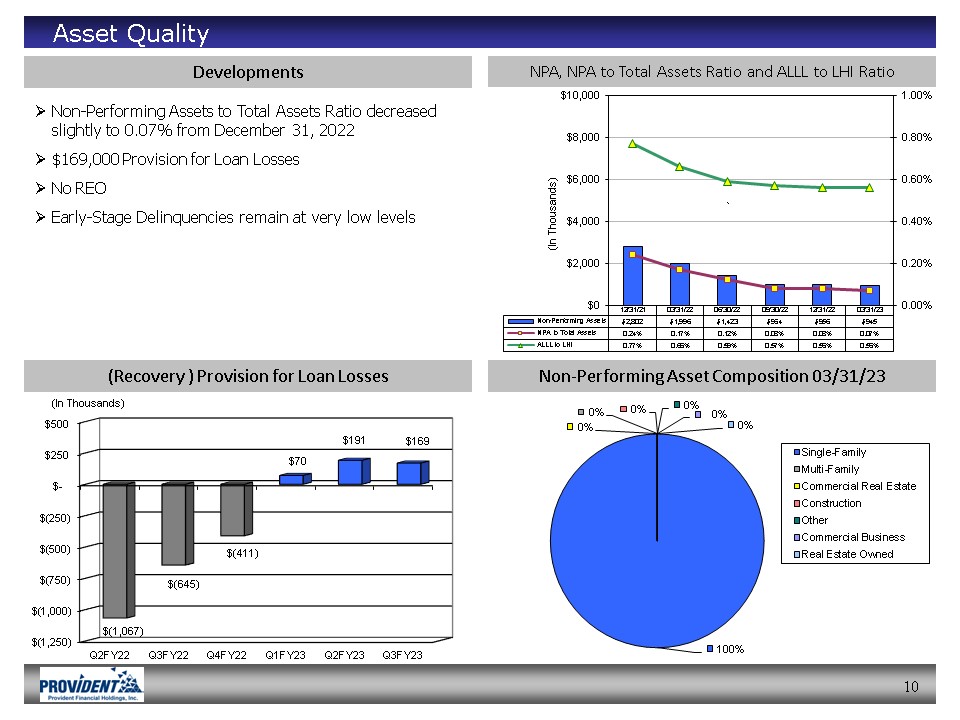
During the third quarter of fiscal 2023, the Company recorded a provision for loan losses of
$169,000, as compared to a $645,000 recovery from the allowance for loan losses recorded during the same period last year and the $191,000 provision for loan losses recorded in the second quarter of fiscal 2023 (sequential quarter). The provision for
loan losses primarily reflects an increase in loans held for investment in the third quarter of fiscal 2023 while the overall loan credit quality remains very strong.
Non-performing assets, comprised solely of non-performing loans with underlying collateral
located in California, decreased $478,000 or 34 percent to $945,000, or 0.07 percent of total assets, at March 31, 2023, compared to $1.4 million, or 0.12 percent of total assets, at June 30, 2022. The non-performing loans at March 31, 2023 are
comprised of five single-family loans,
Page 4 of 15
|
|
while the non-performing loans at June 30, 2022 were comprised of seven single-family loans.
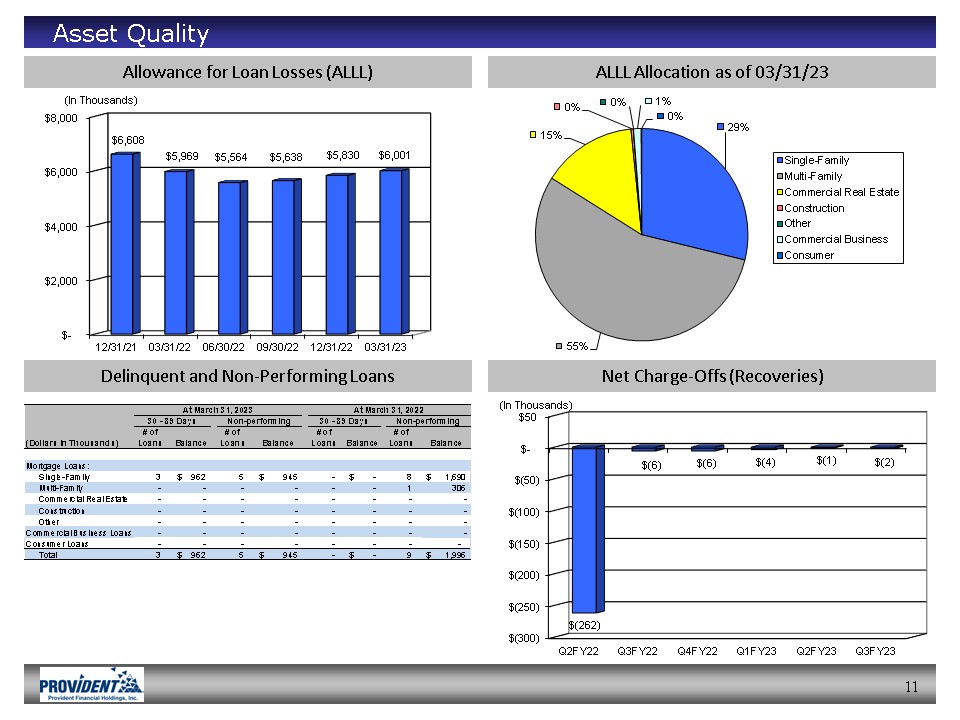
At both March 31, 2023 and June 30, 2022, there was no real estate owned. Net loan recoveries for the quarter ended March 31, 2023 were $2,000, as compared to $6,000 for the quarter ended March 31, 2022 and $1,000 for the quarter ended December 31,
2022 (sequential quarter).
Classified assets were $3.0 million at March 31, 2023 which consist of $1.5 million of
loans in the special mention category and $1.5 million of loans in the substandard category. Classified assets at June 30, 2022 were $1.6 million, consisting of $224,000 of loans in the special mention category and $1.4 million of loans in the
substandard category.
The allowance for loan losses was $6.0 million, or 0.56 percent of gross loans held for
investment, at March 31, 2023, up from the $5.6 million, or 0.59 percent of gross loans held for investment, at June 30, 2022. Management believes that, based on currently available information, the allowance for loan losses is sufficient to absorb
potential losses inherent in loans held for investment at March 31, 2023 under the incurred loss methodology.
Non-interest income decreased by $133,000, or 12 percent, to $981,000 in the third quarter of
fiscal 2023 from $1.11 million in the same period last year, primarily due to a decrease in loan servicing and other fees, attributable primarily to lower loan prepayment fees. On a sequential quarter basis, non-interest income increased $25,000 or
three percent.
Non-interest expenses increased slightly to $6.92 million in the third quarter of fiscal 2023
from $6.90 million for the same quarter last year. The increase in the non-interest expenses in the third quarter of fiscal 2023 was primarily due to higher salaries and employee benefits and deposit insurance premiums, partly offset by lower
equipment expenses, professional expenses and other operating expenses. On a sequential quarter basis, non-interest expenses increased by $126,000 or two percent to
$6.92 million in the third quarter of fiscal 2023 from $6.80 million in the second quarter of fiscal 2023, primarily due to an increase in premises and occupancy expenses, deposit insurance premiums expense and other operating expenses, partly offset
by a decrease in professional expenses (mainly a decrease in legal costs).
The Company’s efficiency ratio, defined as non-interest expense divided by the sum of net interest income and non-interest income, in the third quarter of fiscal 2023 was 66.69 percent, improving from 79.74 percent in the same quarter last year but slightly
higher than the 65.74 percent in the second quarter of fiscal 2023 (sequential quarter). The improvement in the efficiency ratio was primarily due to higher total revenues during the current quarter, compared to the comparable quarter last year.
The Company’s provision for income taxes was $966,000 for the third quarter of fiscal 2023, up
38 percent from $699,000 in the same quarter last year primarily due to an increase in income before income taxes. The effective tax rate in the third quarter of fiscal 2023 was 29.4 percent as compared to 29.2 percent in the same quarter last year.
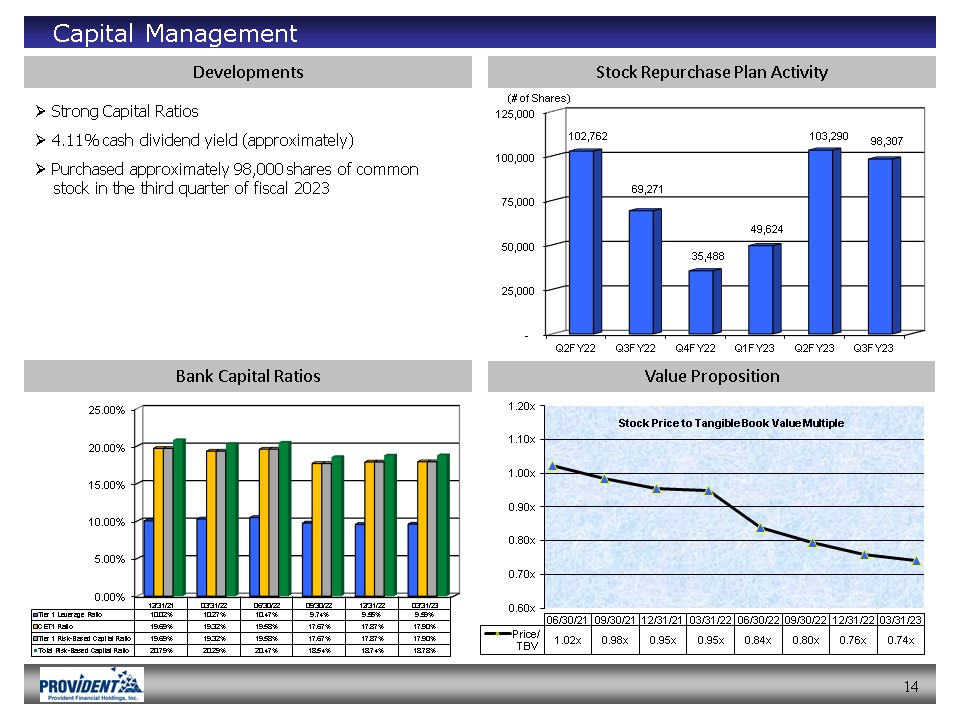
The Company repurchased 98,307 shares of its common stock with an average cost of $14.20 per
share during the quarter ended March 31, 2023 pursuant to its April 2022 stock
Page 5 of 15
|
|
repurchase plan. As of March 31, 2023, a total of 113,038 shares or 31 percent of the shares
authorized for repurchase under the plan remain available to purchase until the plan expires on April 28, 2023.
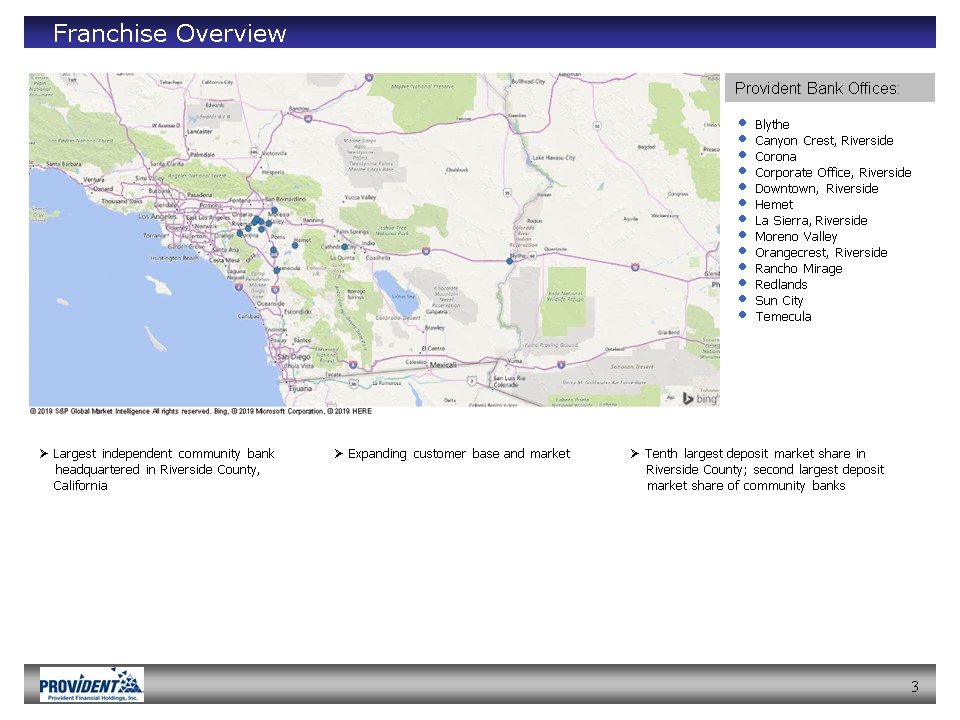
The Bank currently operates 13 retail/business banking offices in Riverside County and San
Bernardino County (Inland Empire).
The Company will host a conference call for institutional investors and bank analysts on
Thursday, April 27, 2023 at 9:00 a.m. (Pacific) to discuss its financial results. The conference call can be accessed by dialing 1-877-692-8955 and referencing access code number 3665390. An audio replay of the conference call will be available
through Thursday, May 4, 2023 by dialing 1-866-207-1041 and referencing access code number 9361268.
For more financial information about the Company please visit the website at
www.myprovident.com and click on the “Investor Relations” section.
Safe-Harbor Statement
This press release contains statements that the Company believes are “forward-looking statements” within the
meaning of the Private Securities Litigation Reform Act of 1995. These statements relate to the Company’s financial condition, liquidity, results of operations, plans, objectives, future performance or business. You should not place undue reliance on
these statements, as they are subject to risks and uncertainties. When considering these forward-looking statements, you should keep in mind these risks and uncertainties, as well as any cautionary statements the Company may make. Moreover, you
should treat these statements as speaking only as of the date they are made and based only on information then actually known to the Company. There are a number of important factors that could cause future results to differ materially from historical
performance and these forward-looking statements. Factors which could cause actual results to differ materially from the results anticipated or implied by our forward-looking statements include, but are not limited to potential adverse impacts to
economic conditions in our local market areas, other markets where the Company has lending relationships, or other aspects of the Company's business operations or financial markets, including, without limitation, as a result of employment levels,
labor shortages and the effects of inflation, a potential recession or slowed economic growth caused by increasing political instability from acts of war including Russia’s invasion of Ukraine, as well as increasing prices and supply chain
disruptions, and any governmental or societal responses to new COVID-19 variants; increased competitive pressures; changes in the interest rate environment; changes in general economic conditions, including the effects of inflation, and conditions
within the securities markets; legislative and regulatory changes, including changes in banking, securities and tax law, in regulatory policies and principles, or the interpretation of regulatory capital or other rules; and other factors described in
the Company’s latest Annual Report on Form 10-K and Quarterly Reports on Form 10-Q and other reports filed with and furnished to the Securities and Exchange Commission (“SEC”) - which are available on our website at www.myprovident.com and on the
SEC’s website at www.sec.gov. We do not undertake and specifically disclaim any obligation to revise any forward-looking statements to reflect the occurrence of anticipated or unanticipated events or circumstances after the date of such statements
whether as a result of new information, future events or otherwise. These risks could cause our actual results for fiscal 2023 and beyond to differ materially from those expressed in any forward-looking statements by, or on behalf of us and could
negatively affect our operating and stock price performance.
|
Contacts:
|
|
Craig G. Blunden
|
|
Donavon P. Ternes
|
|
Chairman and
|
President, Chief Operating Officer,
|
|||
|
Chief Executive Officer
|
and Chief Financial Officer
|
Page 6 of 15
|
|
PROVIDENT FINANCIAL HOLDINGS, INC.
Condensed Consolidated Statements of Financial Condition
(Unaudited –In Thousands, Except Share Information)
|
|
March 31,
|
|
December 31,
|
|
September 30,
|
|
June 30,
|
|
March 31,
|
||||||
|
2023
|
2022
|
2022
|
2022
|
2022
|
|||||||||||
|
Assets
|
|
|
|
|
|
|
|
|
|
|
|||||
|
Cash and cash equivalents
|
$
|
60,771
|
$
|
24,840
|
$
|
38,701
|
$
|
23,414
|
$
|
60,121
|
|||||
|
Investment securities – held to maturity, at cost
|
|
161,336
|
|
168,232
|
|
176,162
|
|
185,745
|
|
195,579
|
|||||
|
Investment securities - available for sale, at fair value
|
|
2,251
|
|
2,377
|
|
2,517
|
|
2,676
|
|
2,944
|
|||||
|
Loans held for investment, net of allowance for loan losses of
$6,001; $5,830; $5,638; $5,564 and $5,969, respectively;
includes $1,352; $1,345; $1,350; $1,396 and $1,470 of loans
held at fair value, respectively
|
|
1,077,704
|
|
1,040,337
|
|
993,942
|
|
939,992
|
|
893,563
|
|||||
|
Accrued interest receivable
|
|
3,610
|
|
3,343
|
|
3,054
|
|
2,966
|
|
2,850
|
|||||
|
FHLB – San Francisco stock
|
|
8,239
|
|
8,239
|
|
8,239
|
|
8,239
|
|
8,155
|
|||||
|
Premises and equipment, net
|
|
9,193
|
|
8,911
|
|
8,707
|
|
8,826
|
|
8,957
|
|||||
|
Prepaid expenses and other assets
|
|
12,176
|
|
14,763
|
|
14,593
|
|
15,180
|
|
15,665
|
|||||
|
Total assets
|
$
|
1,335,280
|
$
|
1,271,042
|
$
|
1,245,915
|
$
|
1,187,038
|
$
|
1,187,834
|
|||||
|
Liabilities and Stockholders’ Equity
|
|
|
|
|
|
|
|
|
|
|
|||||
|
Liabilities:
|
|
|
|
|
|
|
|
|
|
|
|||||
|
Non-interest-bearing deposits
|
$
|
108,479
|
$
|
108,891
|
$
|
123,314
|
$
|
125,089
|
$
|
117,097
|
|||||
|
Interest-bearing deposits
|
|
874,567
|
|
836,411
|
|
862,010
|
|
830,415
|
|
846,403
|
|||||
|
Total deposits
|
|
983,046
|
|
945,302
|
|
985,324
|
|
955,504
|
|
963,500
|
|||||
|
Borrowings
|
|
205,010
|
|
180,000
|
|
115,000
|
|
85,000
|
|
80,000
|
|||||
|
Accounts payable, accrued interest and other liabilities
|
|
17,818
|
|
16,499
|
|
16,402
|
|
17,884
|
|
16,717
|
|||||
|
Total liabilities
|
|
1,205,874
|
|
1,141,801
|
|
1,116,726
|
|
1,058,388
|
|
1,060,217
|
|||||
|
Stockholders’ equity:
|
|
|
|
|
|
|
|
|
|
|
|||||
|
Preferred stock, $.01 par value (2,000,000 shares authorized;
none issued and outstanding)
|
|
—
|
|
—
|
|
—
|
|
—
|
|
—
|
|||||
|
Common stock, $.01 par value; (40,000,000 shares authorized;
18,229,615; 18,229,615; 18,229,615; 18,229,615 and
18,229,615 shares issued respectively; 7,033,963; 7,132,270;
7,235,560; 7,285,184 and 7,320,672 shares outstanding,
respectively)
|
|
183
|
|
183
|
|
183
|
|
183
|
|
183
|
|||||
|
Additional paid-in capital
|
|
98,962
|
|
98,732
|
|
98,559
|
|
98,826
|
|
98,617
|
|||||
|
Retained earnings
|
|
206,449
|
|
205,117
|
|
203,750
|
|
202,680
|
|
201,237
|
|||||
|
Treasury stock at cost (11,195,652; 11,097,345; 10,994,055;
10,944,431 and 10,908,943 shares, respectively)
|
|
(176,163)
|
|
(174,758)
|
|
(173,286)
|
|
(173,041)
|
|
(172,459)
|
|||||
|
Accumulated other comprehensive (loss) income, net of tax
|
|
(25)
|
|
(33)
|
|
(17)
|
|
2
|
|
39
|
|||||
|
Total stockholders’ equity
|
|
129,406
|
|
129,241
|
|
129,189
|
|
128,650
|
|
127,617
|
|||||
|
Total liabilities and stockholders’ equity
|
$
|
1,335,280
|
$
|
1,271,042
|
$
|
1,245,915
|
$
|
1,187,038
|
$
|
1,187,834
|
|||||
Page 7 of 15
|
|
PROVIDENT FINANCIAL HOLDINGS, INC.
Condensed Consolidated Statements of Operations
(Unaudited - In Thousands, Except Earnings Per Share)
|
Quarter Ended
|
Nine Months Ended
|
|||||||||||
|
|
March 31,
|
|
March 31,
|
|||||||||
|
|
2023
|
|
2022
|
|
2023
|
|
2022
|
|||||
|
Interest income:
|
|
|
|
|
|
|
||||||
|
Loans receivable, net
|
$
|
11,028
|
$
|
7,581
|
$
|
30,365
|
$
|
23,676
|
||||
|
Investment securities
|
|
548
|
|
515
|
|
1,632
|
|
1,366
|
||||
|
FHLB – San Francisco stock
|
|
146
|
|
123
|
|
414
|
|
368
|
||||
|
Interest-earning deposits
|
|
286
|
|
39
|
|
666
|
|
105
|
||||
|
Total interest income
|
|
12,008
|
|
8,258
|
|
33,077
|
|
25,515
|
||||
|
Interest expense:
|
|
|
|
|
|
|
|
|
||||
|
Checking and money market deposits
|
|
56
|
|
54
|
|
177
|
|
169
|
||||
|
Savings deposits
|
|
42
|
|
42
|
|
130
|
|
128
|
||||
|
Time deposits
|
|
781
|
|
178
|
|
1,364
|
|
592
|
||||
|
Borrowings
|
|
1,728
|
|
446
|
|
3,655
|
|
1,537
|
||||
|
Total interest expense
|
|
2,607
|
|
720
|
|
5,326
|
|
2,426
|
||||
|
Net interest income
|
|
9,401
|
|
7,538
|
|
27,751
|
|
23,089
|
||||
|
Provision (recovery) for loan losses
|
|
169
|
|
(645)
|
|
430
|
|
(2,051)
|
||||
|
Net interest income, after provision (recovery) for loan losses
|
|
9,232
|
|
8,183
|
|
27,321
|
|
25,140
|
||||
|
Non-interest income:
|
|
|
|
|
|
|
|
|
||||
|
Loan servicing and other fees
|
|
104
|
|
237
|
|
327
|
|
867
|
||||
|
Deposit account fees
|
|
328
|
|
329
|
|
998
|
|
966
|
||||
|
Card and processing fees
|
|
361
|
|
378
|
|
1,109
|
|
1,182
|
||||
|
Other
|
|
188
|
|
170
|
|
506
|
|
536
|
||||
|
Total non-interest income
|
|
981
|
|
1,114
|
|
2,940
|
|
3,551
|
||||
|
Non-interest expense:
|
|
|
|
|
|
|
|
|
||||
|
Salaries and employee benefits
|
|
4,359
|
|
4,203
|
|
12,882
|
|
11,778
|
||||
|
Premises and occupancy
|
|
843
|
|
836
|
|
2,500
|
|
2,499
|
||||
|
Equipment
|
|
279
|
|
330
|
|
848
|
|
932
|
||||
|
Professional expenses
|
|
260
|
|
299
|
|
1,162
|
|
1,108
|
||||
|
Sales and marketing expenses
|
|
182
|
|
186
|
|
504
|
|
477
|
||||
|
Deposit insurance premiums and regulatory assessments
|
|
191
|
|
136
|
|
465
|
|
409
|
||||
|
Other
|
|
810
|
|
909
|
|
2,302
|
|
2,263
|
||||
|
Total non-interest expense
|
|
6,924
|
|
6,899
|
|
20,663
|
|
19,466
|
||||
|
Income before income taxes
|
|
3,289
|
|
2,398
|
|
9,598
|
|
9,225
|
||||
|
Provision for income taxes
|
|
966
|
|
699
|
|
2,814
|
|
2,595
|
||||
|
Net income
|
$
|
2,323
|
$
|
1,699
|
$
|
6,784
|
$
|
6,630
|
||||
|
Basic earnings per share
|
$
|
0.33
|
$
|
0.23
|
$
|
0.94
|
$
|
0.89
|
||||
|
Diluted earnings per share
|
$
|
0.33
|
$
|
0.23
|
$
|
0.94
|
$
|
0.89
|
||||
|
Cash dividends per share
|
$
|
0.14
|
$
|
0.14
|
$
|
0.42
|
$
|
0.42
|
||||
Page 8 of 15
|
|
PROVIDENT FINANCIAL HOLDINGS, INC.
Condensed Consolidated Statements of Operations – Sequential Quarters
(Unaudited – In Thousands, Except Share Information)
|
Quarter Ended
|
|||||||||||||||
|
March 31,
|
December 31,
|
September 30,
|
June 30,
|
March 31,
|
|||||||||||
|
|
2023
|
|
2022
|
|
2022
|
|
2022
|
|
2022
|
||||||
|
Interest income:
|
|
|
|
|
|
|
|
|
|
|
|||||
|
Loans receivable, net
|
$
|
11,028
|
$
|
10,237
|
$
|
9,100
|
$
|
8,485
|
$
|
7,581
|
|||||
|
Investment securities
|
|
548
|
|
548
|
|
536
|
|
540
|
|
515
|
|||||
|
FHLB – San Francisco stock
|
|
146
|
|
145
|
|
123
|
|
121
|
|
123
|
|||||
|
Interest-earning deposits
|
|
286
|
|
241
|
|
139
|
|
69
|
|
39
|
|||||
|
Total interest income
|
|
12,008
|
|
11,171
|
|
9,898
|
|
9,215
|
|
8,258
|
|||||
|
Interest expense:
|
|
|
|
|
|
|
|
|
|
|
|||||
|
Checking and money market deposits
|
|
56
|
|
61
|
|
60
|
|
51
|
|
54
|
|||||
|
Savings deposits
|
|
42
|
|
44
|
|
44
|
|
44
|
|
42
|
|||||
|
Time deposits
|
|
781
|
|
370
|
|
213
|
|
160
|
|
178
|
|||||
|
Borrowings
|
|
1,728
|
|
1,311
|
|
616
|
|
454
|
|
446
|
|||||
|
Total interest expense
|
|
2,607
|
|
1,786
|
|
933
|
|
709
|
|
720
|
|||||
|
Net interest income
|
|
9,401
|
|
9,385
|
|
8,965
|
|
8,506
|
|
7,538
|
|||||
|
Provision (recovery) for loan losses
|
|
169
|
|
191
|
|
70
|
|
(411)
|
|
(645)
|
|||||
|
Net interest income, after provision
(recovery) for loan losses
|
|
9,232
|
|
9,194
|
|
8,895
|
|
8,917
|
|
8,183
|
|||||
|
Non-interest income:
|
|
|
|
|
|
|
|
|
|
|
|||||
|
Loan servicing and other fees
|
|
104
|
|
115
|
|
108
|
|
189
|
|
237
|
|||||
|
Deposit account fees
|
|
328
|
|
327
|
|
343
|
|
336
|
|
329
|
|||||
|
Card and processing fees
|
|
361
|
|
367
|
|
381
|
|
457
|
|
378
|
|||||
|
Other
|
|
188
|
|
147
|
|
171
|
|
183
|
|
170
|
|||||
|
Total non-interest income
|
|
981
|
|
956
|
|
1,003
|
|
1,165
|
|
1,114
|
|||||
|
Non-interest expense:
|
|
|
|
|
|
|
|
|
|
|
|||||
|
Salaries and employee benefits
|
|
4,359
|
|
4,384
|
|
4,139
|
|
4,055
|
|
4,203
|
|||||
|
Premises and occupancy
|
|
843
|
|
796
|
|
861
|
|
690
|
|
836
|
|||||
|
Equipment
|
|
279
|
|
258
|
|
311
|
|
350
|
|
330
|
|||||
|
Professional expenses
|
|
260
|
|
310
|
|
592
|
|
311
|
|
299
|
|||||
|
Sales and marketing expenses
|
|
182
|
|
175
|
|
147
|
|
165
|
|
186
|
|||||
|
Deposit insurance premiums and regulatory assessments
|
|
191
|
|
139
|
|
135
|
|
134
|
|
136
|
|||||
|
Other
|
|
810
|
|
736
|
|
756
|
|
744
|
|
909
|
|||||
|
Total non-interest expense
|
|
6,924
|
|
6,798
|
|
6,941
|
|
6,449
|
|
6,899
|
|||||
|
Income before income taxes
|
|
3,289
|
|
3,352
|
|
2,957
|
|
3,633
|
|
2,398
|
|||||
|
Provision for income taxes
|
|
966
|
|
981
|
|
867
|
|
1,170
|
|
699
|
|||||
|
Net income
|
$
|
2,323
|
$
|
2,371
|
$
|
2,090
|
$
|
2,463
|
$
|
1,699
|
|||||
|
Basic earnings per share
|
$
|
0.33
|
$
|
0.33
|
$
|
0.29
|
$
|
0.34
|
$
|
0.23
|
|||||
|
Diluted earnings per share
|
$
|
0.33
|
$
|
0.33
|
$
|
0.29
|
$
|
0.34
|
$
|
0.23
|
|||||
|
Cash dividends per share
|
$
|
0.14
|
$
|
0.14
|
$
|
0.14
|
$
|
0.14
|
$
|
0.14
|
|||||
Page 9 of 15
|
|
PROVIDENT FINANCIAL HOLDINGS, INC.
Financial Highlights
(Unaudited - Dollars in Thousands, Except Share
Information)
|
As of and For the
|
|||||||||||||
|
Quarter Ended
|
Nine Months Ended
|
|
|||||||||||
|
March 31,
|
March 31,
|
|
|||||||||||
|
|
2023
|
|
2022
|
|
2023
|
|
2022
|
|
|||||
|
SELECTED FINANCIAL RATIOS:
|
|
|
|
|
|
|
|
|
|||||
|
Return on average assets
|
|
0.72
|
%
|
0.57
|
%
|
0.72
|
%
|
0.74
|
%
|
||||
|
Return on average stockholders' equity
|
|
7.12
|
%
|
5.33
|
%
|
6.94
|
%
|
6.94
|
%
|
||||
|
Stockholders’ equity to total assets
|
|
9.69
|
%
|
10.74
|
%
|
9.69
|
%
|
10.74
|
%
|
||||
|
Net interest spread
|
|
2.90
|
%
|
2.58
|
%
|
2.97
|
%
|
2.62
|
%
|
||||
|
Net interest margin
|
|
3.00
|
%
|
2.61
|
%
|
3.03
|
%
|
2.65
|
%
|
||||
|
Efficiency ratio
|
|
66.69
|
%
|
79.74
|
%
|
67.33
|
%
|
73.07
|
%
|
||||
|
Average interest-earning assets to average interest-bearing liabilities
|
|
110.23
|
%
|
110.79
|
%
|
110.30
|
%
|
110.73
|
%
|
||||
|
SELECTED FINANCIAL DATA:
|
|
|
|
|
|
|
|
|
|||||
|
Basic earnings per share
|
$
|
0.33
|
$
|
0.23
|
$
|
0.94
|
$
|
0.89
|
|||||
|
Diluted earnings per share
|
$
|
0.33
|
$
|
0.23
|
$
|
0.94
|
$
|
0.89
|
|||||
|
Book value per share
|
$
|
18.40
|
$
|
17.43
|
$
|
18.40
|
$
|
17.43
|
|||||
|
Shares used for basic EPS computation
|
|
7,080,817
|
|
7,357,989
|
|
7,180,337
|
|
7,441,632
|
|||||
|
Shares used for diluted EPS computation
|
|
7,145,583
|
|
7,412,516
|
|
7,231,562
|
|
7,490,822
|
|||||
|
Total shares issued and outstanding
|
|
7,033,963
|
|
7,320,672
|
|
7,033,963
|
|
7,320,672
|
|||||
|
LOANS ORIGINATED AND PURCHASED FOR INVESTMENT:
|
|
|
|
|
|
|
|
|
|||||
|
Mortgage Loans:
|
|
|
|
|
|
|
|
|
|||||
|
Single-family
|
$
|
39,543
|
$
|
54,978
|
$
|
153,671
|
$
|
135,118
|
|||||
|
Multi-family
|
|
10,660
|
|
31,487
|
|
43,519
|
|
71,725
|
|||||
|
Commercial real estate
|
|
3,422
|
|
7,011
|
|
13,772
|
|
11,216
|
|||||
|
Construction
|
|
260
|
|
544
|
|
1,648
|
|
2,228
|
|||||
|
Commercial business loans
|
|
—
|
|
—
|
|
190
|
|
—
|
|||||
|
Total loans originated and purchased for investment
|
$
|
53,885
|
$
|
94,020
|
$
|
212,800
|
$
|
220,287
|
|||||
Page 10 of 15
|
|
PROVIDENT FINANCIAL HOLDINGS, INC.
Financial Highlights
(Unaudited - Dollars in Thousands, Except Share
Information)
|
As of and For the
|
||||||||||||||||
|
Quarter
|
Quarter
|
Quarter
|
Quarter
|
Quarter
|
|
|||||||||||
|
Ended
|
Ended
|
Ended
|
Ended
|
Ended
|
|
|||||||||||
|
|
03/31/23
|
|
12/31/22
|
|
09/30/22
|
|
06/30/22
|
|
03/31/22
|
|
||||||
|
SELECTED FINANCIAL RATIOS:
|
|
|
|
|
|
|
|
|
|
|
||||||
|
Return on average assets
|
|
0.72
|
%
|
0.75
|
%
|
0.69
|
%
|
0.83
|
%
|
0.57
|
%
|
|||||
|
Return on average stockholders'
equity
|
|
7.12
|
%
|
7.27
|
%
|
6.42
|
%
|
7.72
|
%
|
5.33
|
%
|
|||||
|
Stockholders’ equity to total assets
|
|
9.69
|
%
|
10.17
|
%
|
10.37
|
%
|
10.84
|
%
|
10.74
|
%
|
|||||
|
Net interest spread
|
|
2.90
|
%
|
3.00
|
%
|
3.01
|
%
|
2.91
|
%
|
2.58
|
%
|
|||||
|
Net interest margin
|
|
3.00
|
%
|
3.05
|
%
|
3.05
|
%
|
2.93
|
%
|
2.61
|
%
|
|||||
|
Efficiency ratio
|
|
66.69
|
%
|
65.74
|
%
|
69.63
|
%
|
66.68
|
%
|
79.74
|
%
|
|||||
|
Average interest-earning assets to
average interest-bearing liabilities
|
|
110.23
|
%
|
110.14
|
%
|
110.56
|
%
|
110.51
|
%
|
110.79
|
%
|
|||||
|
SELECTED FINANCIAL DATA:
|
|
|
|
|
|
|
|
|
|
|
||||||
|
Basic earnings per share
|
$
|
0.33
|
$
|
0.33
|
$
|
0.29
|
$
|
0.34
|
$
|
0.23
|
||||||
|
Diluted earnings per share
|
$
|
0.33
|
$
|
0.33
|
$
|
0.29
|
$
|
0.34
|
$
|
0.23
|
||||||
|
Book value per share
|
$
|
18.40
|
$
|
18.12
|
$
|
17.85
|
$
|
17.66
|
$
|
17.43
|
||||||
|
Average shares used for basic EPS
|
|
7,080,817
|
|
7,184,652
|
|
7,273,377
|
|
7,291,046
|
|
7,357,989
|
||||||
|
Average shares used for diluted
EPS |
|
7,145,583
|
|
7,236,451
|
|
7,310,490
|
|
7,323,138
|
|
7,412,516
|
||||||
|
Total shares issued and outstanding
|
|
7,033,963
|
|
7,132,270
|
|
7,235,560
|
|
7,285,184
|
|
7,320,672
|
||||||
|
LOANS ORIGINATED AND
PURCHASED FOR
INVESTMENT:
|
|
|
|
|
|
|
|
|
|
|
||||||
|
Mortgage loans:
|
|
|
|
|
|
|
|
|
|
|
||||||
|
Single-family
|
$
|
39,543
|
$
|
57,079
|
$
|
57,049
|
$
|
62,908
|
$
|
54,978
|
||||||
|
Multi-family
|
|
10,660
|
|
8,663
|
|
24,196
|
|
16,013
|
|
31,487
|
||||||
|
Commercial real estate
|
|
3,422
|
|
7,025
|
|
3,325
|
|
6,971
|
|
7,011
|
||||||
|
Construction
|
|
260
|
|
1,388
|
|
—
|
|
—
|
|
544
|
||||||
|
Commercial business loans
|
|
—
|
|
190
|
|
—
|
|
—
|
|
—
|
||||||
|
Total loans originated and
purchased for investment
|
$
|
53,885
|
$
|
74,345
|
$
|
84,570
|
$
|
85,892
|
$
|
94,020
|
||||||
Page 11 of 15
|
|
PROVIDENT FINANCIAL HOLDINGS, INC.
Financial Highlights
(Unaudited - Dollars in Thousands)
|
|
As of
|
|
As of
|
|
As of
|
|
As of
|
|
As of
|
|
||||||
|
03/31/23
|
12/31/22
|
09/30/22
|
06/30/22
|
03/31/22
|
|
|||||||||||
|
ASSET QUALITY RATIOS AND DELINQUENT
LOANS:
|
|
|
|
|
|
|
|
|
|
|
||||||
|
Recourse reserve for loans sold
|
$
|
160
|
$
|
160
|
$
|
160
|
$
|
160
|
$
|
160
|
||||||
|
Allowance for loan losses
|
$
|
6,001
|
$
|
5,830
|
$
|
5,638
|
$
|
5,564
|
$
|
5,969
|
||||||
|
Non-performing loans to loans held for investment,
net
|
|
0.09
|
%
|
|
0.09
|
%
|
|
0.10
|
%
|
|
0.15
|
%
|
|
0.22
|
%
|
|
|
Non-performing assets to total assets
|
|
0.07
|
%
|
|
0.08
|
%
|
|
0.08
|
%
|
|
0.12
|
%
|
|
0.17
|
%
|
|
|
Allowance for loan losses to gross loans held for
investment
|
|
0.56
|
%
|
|
0.56
|
%
|
|
0.57
|
%
|
|
0.59
|
%
|
|
0.66
|
%
|
|
|
Net loan charge-offs (recoveries) to average loans
receivable (annualized)
|
|
—
|
%
|
|
—
|
%
|
|
—
|
%
|
|
—
|
%
|
|
—
|
%
|
|
|
Non-performing loans
|
$
|
945
|
$
|
956
|
$
|
964
|
$
|
1,423
|
$
|
1,996
|
||||||
|
Loans 30 to 89 days delinquent
|
$
|
963
|
$
|
4
|
$
|
1
|
$
|
3
|
$
|
2
|
||||||
|
|
Quarter
|
|
Quarter
|
|
Quarter
|
|
Quarter
|
|
Quarter
|
||||||
|
Ended
|
Ended
|
Ended
|
Ended
|
Ended
|
|||||||||||
|
03/31/23
|
12/31/22
|
09/30/22
|
06/30/22
|
03/31/22
|
|||||||||||
|
Recourse provision (recovery) for loans
sold
|
$
|
—
|
$
|
—
|
$
|
—
|
$
|
—
|
$
|
—
|
|||||
|
Provision (recovery) for loan losses
|
$
|
169
|
$
|
191
|
$
|
70
|
$
|
(411)
|
$
|
(645)
|
|||||
|
Net loan charge-offs (recoveries)
|
$
|
(2)
|
$
|
(1)
|
$
|
(4)
|
$
|
(6)
|
$
|
(6)
|
|||||
|
|
As of
|
|
As of
|
|
As of
|
|
As of
|
|
As of
|
|
|
|
03/31/2023
|
12/31/2022
|
09/30/2022
|
06/30/2022
|
03/31/2022
|
|
||||||
|
REGULATORY CAPITAL RATIOS (BANK):
|
|
|
|
|
|
|
|
|
|
|
|
|
Tier 1 leverage ratio
|
|
9.59
|
%
|
9.55
|
%
|
9.74
|
%
|
10.47
|
%
|
10.27
|
%
|
|
Common equity tier 1 capital ratio
|
|
17.90
|
%
|
17.87
|
%
|
17.67
|
%
|
19.58
|
%
|
19.32
|
%
|
|
Tier 1 risk-based capital ratio
|
|
17.90
|
%
|
17.87
|
%
|
17.67
|
%
|
19.58
|
%
|
19.32
|
%
|
|
Total risk-based capital ratio
|
|
18.78
|
%
|
18.74
|
%
|
18.54
|
%
|
20.47
|
%
|
20.29
|
%
|
|
As of March 31,
|
|
||||||||||
|
|
2023
|
|
2022
|
|
|||||||
|
|
Balance
|
|
Rate(1)
|
|
Balance
|
|
Rate(1)
|
|
|||
|
INVESTMENT SECURITIES:
|
|
|
|
|
|
|
|
||||
|
Held to maturity (at cost):
|
|
|
|
|
|
|
|
||||
|
Certificates of deposit
|
$
|
—
|
|
—
|
%
|
$
|
600
|
|
0.28
|
%
|
|
|
U.S. SBA securities
|
|
656
|
|
4.85
|
|
950
|
|
0.60
|
|||
|
U.S. government sponsored enterprise MBS
|
156,785
|
1.43
|
191,074
|
1.33
|
|||||||
|
U.S. government sponsored enterprise CMO
|
|
3,895
|
|
2.20
|
|
2,955
|
|
2.02
|
|||
|
Total investment securities held to maturity
|
$
|
161,336
|
|
1.46
|
%
|
$
|
195,579
|
|
1.33
|
%
|
|
|
Available for sale (at fair value):
|
|
|
|
|
|
|
|
|
|||
|
U.S. government agency MBS
|
$
|
1,440
|
|
2.72
|
%
|
$
|
1,832
|
|
1.79
|
%
|
|
|
U.S. government sponsored enterprise MBS
|
|
713
|
|
4.04
|
|
977
|
|
2.30
|
|||
|
Private issue CMO
|
|
98
|
|
3.45
|
|
135
|
|
2.54
|
|||
|
Total investment securities available for sale
|
$
|
2,251
|
|
3.17
|
%
|
$
|
2,944
|
|
1.99
|
%
|
|
|
Total investment securities
|
$
|
163,587
|
|
1.49
|
%
|
$
|
198,523
|
|
1.34
|
%
|
|
|
(1)
|
The interest rate described in the rate column is the weighted-average interest rate or yield of all instruments, which are
included in the balance of the respective line item.
|
Page 12 of 15
|
|
PROVIDENT FINANCIAL HOLDINGS, INC.
Financial Highlights
(Unaudited - Dollars in Thousands)
|
As of March 31,
|
|
||||||||||
|
|
2023
|
|
2022
|
|
|||||||
|
|
Balance
|
|
Rate(1)
|
|
Balance
|
|
Rate(1)
|
|
|||
|
LOANS HELD FOR INVESTMENT:
|
|
|
|
|
|
|
|
||||
|
|
|
|
|
|
|
||||||
|
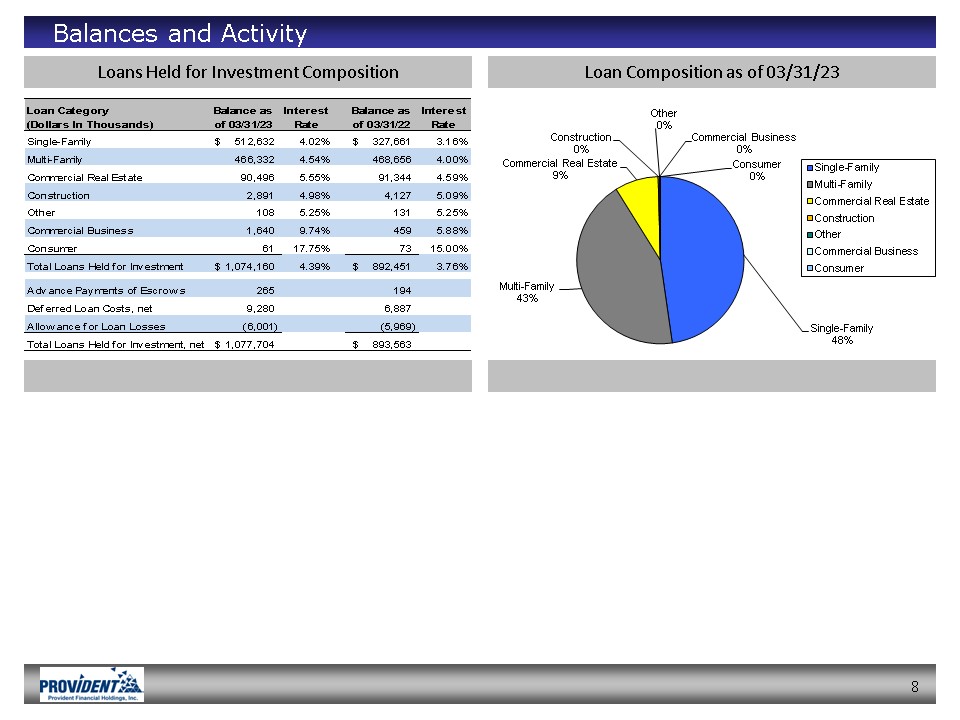
Single-family (1 to 4 units)
|
$
|
512,632
|
|
4.02
|
%
|
$
|
327,661
|
|
3.16
|
%
|
|
|
Multi-family (5 or more units)
|
|
466,332
|
|
4.54
|
|
468,656
|
|
4.00
|
|||
|
Commercial real estate
|
|
90,496
|
|
5.55
|
|
91,344
|
|
4.59
|
|||
|
Construction
|
|
2,891
|
|
4.98
|
|
4,127
|
|
5.09
|
|||
|
Other mortgage
|
|
108
|
|
5.25
|
|
131
|
|
5.25
|
|||
|
Commercial business
|
|
1,640
|
|
9.74
|
|
459
|
|
5.88
|
|||
|
Consumer
|
|
61
|
|
17.75
|
|
73
|
|
15.00
|
|||
|
Total loans held for investment
|
|
1,074,160
|
|
4.39
|
%
|
|
892,451
|
|
3.76
|
%
|
|
|
Advance payments of escrows
|
|
265
|
|
|
194
|
|
|
||||
|
Deferred loan costs, net
|
|
9,280
|
|
|
6,887
|
|
|
||||
|
Allowance for loan losses
|
|
(6,001)
|
|
|
(5,969)
|
|
|
||||
|
Total loans held for investment, net
|
$
|
1,077,704
|
$
|
893,563
|
|
|
|||||
|
Purchased loans serviced by others included above
|
$
|
10,651
|
4.25
|
%
|
$
|
11,653
|
|
3.51
|
%
|
||
(1) The interest rate described in the rate column is the weighted-average
interest rate or yield of all instruments, which are included in the balance of the respective line item.
|
As of March 31,
|
|
||||||||||
|
|
2023
|
|
2022
|
|
|||||||
|
|
Balance
|
|
Rate(1)
|
|
Balance
|
|
Rate(1)
|
|
|||
|
DEPOSITS:
|
|
|
|
|
|
|
|
||||
|
Checking accounts – non interest-bearing
|
$
|
108,479
|
|
—
|
%
|
$
|
117,097
|
|
—
|
%
|
|
|
Checking accounts – interest-bearing
|
|
325,077
|
|
0.04
|
|
347,972
|
|
0.04
|
|||
|
Savings accounts
|
|
305,403
|
|
0.05
|
|
332,452
|
|
0.05
|
|||
|
Money market accounts
|
|
38,018
|
|
0.13
|
|
38,754
|
|
0.09
|
|||
|
Time deposits
|
|
206,069
|
|
2.48
|
|
127,225
|
|
0.55
|
|||
|
Total deposits(2)(3)
|
$
|
983,046
|
|
0.55
|
%
|
$
|
963,500
|
|
0.11
|
%
|
|
|
BORROWINGS:
|
|
|
|
|
|
|
|
|
|||
|
Overnight
|
$
|
—
|
|
—
|
%
|
$
|
—
|
|
—
|
%
|
|
|
Three months or less
|
|
70,000
|
|
4.64
|
|
—
|
|
—
|
|||
|
Over three to six months
|
|
15,010
|
|
2.81
|
|
20,000
|
|
1.75
|
|||
|
Over six months to one year
|
|
65,000
|
|
4.14
|
|
—
|
|
—
|
|||
|
Over one year to two years
|
|
40,000
|
|
3.88
|
|
40,000
|
|
2.25
|
|||
|
Over two years to three years
|
|
15,000
|
|
3.28
|
|
10,000
|
|
2.61
|
|||
|
Over three years to four years
|
|
—
|
|
—
|
|
10,000
|
|
2.79
|
|||
|
Total borrowings(4)
|
$
|
205,010
|
|
4.10
|
%
|
$
|
80,000
|
|
2.24
|
%
|
|
|
(1)
|
The interest rate described in the rate column is the weighted-average interest rate or cost of all instruments, which are
included in the balance of the respective line item.
|
|
(2)
|
Includes uninsured deposits (adjusted lower by collateralized deposits) of approximately $177.8 million and $169.0 million
at March 31, 2023 and 2022, respectively.
|
|
(3)
|
The average balance of deposit accounts was approximately $34 thousand and $31 thousand at March 31, 2023 and 2022,
respectively.
|
|
(4)
|
The Bank had approximately $228.6 million and $321.4 million of remaining borrowing capacity at the FHLB – San Francisco,
approximately $135.8 million and $168.4 million of borrowing capacity at the Federal Reserve Bank of San Francisco and $50.0 million and $67.0 million of borrowing capacity with its correspondent bank at March 31, 2023 and 2022,
respectively.
|
Page 13 of 15
|
|
PROVIDENT FINANCIAL HOLDINGS, INC.
Financial Highlights
(Unaudited - Dollars in Thousands)
|
Quarter Ended
|
Quarter Ended
|
|
||||||||||
|
March 31, 2023
|
March 31, 2022
|
|
||||||||||
|
|
Balance
|
|
Rate(1)
|
|
Balance
|
|
Rate(1)
|
|
||||
|
SELECTED AVERAGE BALANCE SHEETS:
|
|
|
|
|
|
|
|
|
||||
|
|
|
|
|
|
|
|
|
|||||
|
Loans receivable, net
|
$
|
1,054,431
|
|
4.18
|
%
|
$
|
858,300
|
|
3.53
|
%
|
||
|
Investment securities
|
|
167,679
|
|
1.31
|
|
203,171
|
|
1.01
|
||||
|
FHLB – San Francisco stock
|
|
8,239
|
|
7.09
|
|
8,155
|
|
6.03
|
||||
|
Interest-earning deposits
|
|
24,615
|
|
4.65
|
|
86,007
|
|
0.18
|
||||
|
Total interest-earning assets
|
$
|
1,254,964
|
|
3.83
|
%
|
$
|
1,155,633
|
|
2.86
|
%
|
||
|
Total assets
|
$
|
1,287,380
|
$
|
1,187,979
|
|
|
||||||
|
Deposits
|
$
|
962,043
|
|
0.37
|
%
|
$
|
963,112
|
|
0.12
|
%
|
||
|
Borrowings
|
|
176,501
|
|
3.97
|
|
80,000
|
|
2.26
|
||||
|
Total interest-bearing liabilities
|
$
|
1,138,544
|
|
0.93
|
%
|
$
|
1,043,112
|
|
0.28
|
%
|
||
|
Total stockholders’ equity
|
$
|
130,545
|
$
|
127,519
|
|
|
||||||
|
(1)
|
The interest rate described in the rate column is the weighted-average interest rate or yield/cost of all instruments, which
are included in the balance of the respective line item.
|
|
Nine Months Ended
|
Nine Months Ended
|
|
||||||||||
|
|
March 31, 2023
|
|
March 31, 2022
|
|
||||||||
|
|
Balance
|
|
Rate(1)
|
|
Balance
|
|
Rate(1)
|
|
||||
|
SELECTED AVERAGE BALANCE SHEETS:
|
|
|
|
|
|
|
|
|||||
|
|
|
|
|
|
|
|
||||||
|
Loans receivable, net
|
$
|
1,011,916
|
|
4.00
|
%
|
$
|
855,080
|
|
3.69
|
%
|
||
|
Investment securities
|
|
175,802
|
|
1.24
|
|
210,978
|
|
0.86
|
||||
|
FHLB – San Francisco stock
|
|
8,239
|
|
6.70
|
|
8,155
|
|
6.02
|
||||
|
Interest-earning deposits
|
|
24,153
|
|
3.62
|
|
86,402
|
|
0.16
|
||||
|
Total interest-earning assets
|
$
|
1,220,110
|
|
3.61
|
%
|
$
|
1,160,615
|
|
2.93
|
%
|
||
|
Total assets
|
$
|
1,253,662
|
$
|
1,193,219
|
|
|
||||||
|
Deposits
|
$
|
962,241
|
|
0.23
|
%
|
$
|
959,153
|
|
0.12
|
%
|
||
|
Borrowings
|
|
143,887
|
|
3.38
|
|
88,986
|
|
2.30
|
||||
|
Total interest-bearing liabilities
|
$
|
1,106,128
|
|
0.64
|
%
|
$
|
1,048,139
|
|
0.31
|
%
|
||
|
Total stockholders’ equity
|
$
|
130,387
|
$
|
127,358
|
|
|
||||||
(1) The interest rate described in the rate column is the weighted-average
interest rate or yield/cost of all instruments, which are included in the balance of the respective line item.
Page 14 of 15
|
|
PROVIDENT FINANCIAL HOLDINGS, INC.
Financial Highlights
(Unaudited - Dollars in Thousands)
ASSET QUALITY:
|
|
As of
|
|
As of
|
|
As of
|
|
As of
|
|
As of
|
||||||
|
03/31/23
|
12/31/22
|
09/30/22
|
06/30/22
|
03/31/22
|
|||||||||||
|
Loans on non-accrual status (excluding restructured loans):
|
|
|
|
|
|
|
|
|
|
|
|||||
|
Mortgage loans:
|
|||||||||||||||
|
Single-family
|
$
|
235
|
$
|
242
|
$
|
243
|
$
|
701
|
$
|
716
|
|||||
|
Multi-family
|
|
—
|
|
—
|
|
—
|
|
—
|
|
306
|
|||||
|
Total
|
|
235
|
|
242
|
|
243
|
|
701
|
|
1,022
|
|||||
|
Accruing loans past due 90 days or more:
|
|
—
|
|
—
|
|
—
|
|
—
|
|
—
|
|||||
|
Total
|
|
—
|
|
—
|
|
—
|
|
—
|
|
—
|
|||||
|
Restructured loans on non-accrual status:
|
|
|
|
|
|
|
|
|
|
|
|||||
|
Mortgage loans:
|
|
|
|
|
|
|
|
|
|
|
|||||
|
Single-family
|
|
710
|
|
714
|
|
721
|
|
722
|
|
974
|
|||||
|
Total
|
|
710
|
|
714
|
|
721
|
|
722
|
|
974
|
|||||
|
Total non-performing loans (1)
|
|
945
|
|
956
|
|
964
|
|
1,423
|
|
1,996
|
|||||
|
Real estate owned, net
|
|
—
|
|
—
|
|
—
|
|
—
|
|
—
|
|||||
|
Total non-performing assets
|
$
|
945
|
$
|
956
|
$
|
964
|
$
|
1,423
|
$
|
1,996
|
|||||
|
(1)
|
The non-performing loans balances are net of individually evaluated or collectively evaluated allowances, specifically
attached to the individual loans.
|
Page 15 of 15