
UNITED STATES
SECURITIES AND EXCHANGE COMMISSION
Washington, D.C. 20549
FORM
CURRENT REPORT
Pursuant to Section 13 or 15(d) of the Securities Exchange Act of 1934
Date of Report (Date of earliest event
reported)
(Exact name of registrant as specified in its charter)
| (State of | (Commission File Number) | (IRS Employer | ||
| Incorporation) | Identification No.) |
(Address of principal executive offices and zip code)
(
(Registrant’s telephone number, including area code)
N/A
(Former name or former address, if changed since last report)
Securities registered pursuant to Section 12(b) of the Act:
| (Title of Each Class) | (Trading Symbol) | (Name of Exchange on Which Registered) |
Check the appropriate box below if the Form 8-K filing is intended to simultaneously satisfy the filing obligation of the registrant under any of the following provisions (see General Instruction A.2. below):
| Written communications pursuant to Rule 425 under the Securities Act (17 CFR 230-425) |
| Soliciting material pursuant to Rule 14a-12 under the Exchange Act (17 CFR 240.14a-12) |
| Pre-commencement communications pursuant to Rule 14d-2(b) under the Exchange Act (17 CFR 240.14d-2(b)) |
| Pre-commencement communications pursuant to Rule 13e-4(c) under the Exchange Act (17 CFR 240.13e-4(c)) |
Indicate by check mark whether the registrant is an emerging growth company as defined in Rule 405 of the Securities Act of 1933 (§230.405 of this chapter) or Rule 12b-2 of the Securities Exchange Act of 1934 (§240.12b-2 of this chapter).
Emerging growth
company
If an emerging growth company, indicate by check mark if the registrant has elected not to use the extended transition period for complying with any new or revised financial accounting standards provided pursuant to Section 13(a) of the Exchange Act. ¨
Item 2.02 Results of Operations and Financial Condition.*
On April 25, 2023, PacWest Bancorp (the “Company”) announced its results of operations and financial condition for the three months ended March 31, 2023. The press release announcing the financial results for the three months ended March 31, 2023 is furnished as Exhibit 99.1 and incorporated herein by reference. A presentation regarding the Company’s financial results for the three months ended March 31, 2023 is furnished as Exhibit 99.2 and incorporated herein by reference.
Item 9.01 Financial Statements and Exhibits.*
(d) Exhibits.
| Exhibit Number |
Description | |
| 99.1 | Press release dated April 25, 2023 announcing PacWest’s results of operations and financial condition for the three months ended March 31, 2023. | |
| 99.2 | Earnings Release Presentation | |
| 104 | Cover page interactive data file (embedded within the Inline XBRL document) |
*The information furnished under Item 2.02 and Item 9.01 of this Current Report on Form 8-K, including the exhibit, shall not be deemed “filed” for purposes of Section 18 of the Securities Exchange Act of 1934, as amended, or otherwise subject to the liabilities under that Section, nor shall it be deemed incorporated by reference in any registration statement or other filings of PacWest Bancorp under the Securities Act of 1933, as amended, except as shall be set forth by specific reference in such filing.
SIGNATURE
Pursuant to the requirements of the Securities Exchange Act of 1934, the registrant has duly caused this report to be signed on its behalf by the undersigned hereunto duly authorized.
| PacWest Bancorp | ||
| By: | /s/ Kevin L. Thompson | |
| Name: | Kevin L. Thompson | |
| Title: | Executive Vice President Chief Financial Officer | |
| Date: April 25, 2023 | ||
Exhibit 99.1
| April 25, 2023 | |
PACWEST BANCORP ANNOUNCES RESULTS FOR THE FIRST QUARTER 2023
FOR IMMEDIATE RELEASE
first Quarter 2023 Highlights
| • | Net loss available to common stockholders of $1.21 billion, or a loss of $10.22 per diluted share |
| • | Adjusted earnings of $89.4 million, or $0.66 per diluted share, which excludes non-cash goodwill impairment, and severance and contract termination expense (non-GAAP measure) |
| • | Goodwill impairment of $1.38 billion recorded due to decline in our stock price as a result of recent market volatility. Goodwill impairment is a non-cash charge and has no impact on our regulatory capital ratios, cash flows, or liquidity position |
| • | Severance and contract termination expense of $8.5 million accrued related to our efficiency initiative |
| • | First quarter results were marked by enhanced liquidity following market volatility |
| • | Total deposits increased $1.1 billion to $28.2 billion at March 31, 2023 compared to Company’s most recent update of $27.1 billion as of March 20, 2023. Deposit balances further increased approximately $700 million as of April 24, 2023 |
| • | Total insured deposits, including accounts eligible for pass-through insurance, represented approximately 73% of total deposits as of April 24, 2023 up from 48% at December 31, 2022 |
| • | Immediately-available liquidity (on-balance sheet liquidity and unused borrowing capacity) of $12.4 billion, which exceeded uninsured deposits of $8.1 billion, with a coverage ratio of 153% at March 31, 2023 |
| • | All risk-based capital ratios increased from December 31, 2022, with CET1 increasing from 8.70% to 9.22% |
| • | Credit metrics remain steady with nonperforming assets ratio declining 3 basis points to 35 basis points |
| • | Unrealized losses on the Company’s investment portfolio improved, declining from $791 million at December 31, 2022 to $736 million at March 31, 2023 |
ADJUSTED eARNINGS
Financial results for the first quarter of 2023 were impacted by goodwill impairment of $1.38 billion and reorganization costs of $8.5 million. Excluding these amounts, adjusted earnings were $89.4 million, or $0.66 per diluted share, for the first quarter of 2023. A reconciliation of adjusted earnings to net (loss) earnings according to accounting principles generally accepted in the United States (“GAAP”) is provided in the financial tables at the end of this press release.
| Three Months Ended | ||||||||||||
| March 31, | December 31, | March 31, | ||||||||||
| 2023 | 2022 | 2022 | ||||||||||
| (Dollars in thousands, except per share amounts) | ||||||||||||
| Earnings Summary: | ||||||||||||
| Net (loss) earnings | $ | (1,195,424 | ) | $ | 49,509 | $ | 120,128 | |||||
| Diluted earnings per common share | $ | (10.22 | ) | $ | 0.33 | $ | 1.01 | |||||
| Return on average assets | (11.34 | )% | 0.48 | % | 1.22 | % | ||||||
| Return on average tangible common equity (1) | 14.45 | % | 12.71 | % | 20.77 | % | ||||||
| Adjusted Earnings Summary (1): | ||||||||||||
| Adjusted earnings | $ | 89,436 | $ | 75,066 | $ | 120,128 | ||||||
| Adjusted diluted earnings per common share | $ | 0.66 | $ | 0.54 | $ | 1.01 | ||||||
| Adjusted return on average assets | 0.85 | % | 0.72 | % | 1.22 | % | ||||||
| Adjusted return on average tangible common equity | 15.62 | % | 13.56 | % | 20.77 | % | ||||||
(1) Non-GAAP measure.
| Page 1 |
CEO COMMENTARY
Paul Taylor, President and CEO, commented, “Our strong banking franchise and our loyal, diversified customer base have driven us through one of the most challenging recent periods in the banking industry. Our deposits have stabilized with total insured deposits increasing from 48% of total deposits at year-end to 71% of total deposits at March 31, 2023. Importantly, deposits stabilized in the latter part of March and rebounded nicely in April, increasing approximately $700 million subsequent to quarter-end. Moreover, in light of the recent events, management took immediate steps to maximize liquidity, including the exploration of strategic asset sales, which has led to the transfer of our $2.7 billion Lender Finance loan portfolio to held for sale.”
Mr. Taylor continued, “The industry dynamics in the quarter caused a significant decline in regional bank stocks, including ours. As a result, we recorded a goodwill impairment charge. It is important to note that goodwill impairment is a non-cash charge and has no impact on our regulatory capital ratios, cash flows, or liquidity position. We also are continuing the work we started last year to improve the overall efficiency of the Bank, which resulted in severance and contract termination expense of $8.5 million and the consolidation of two branches into nearby branches in the first quarter of 2023. I am proud to say that in the face of this crisis, our business of serving our customers and communities was unrelenting, allowing us to post $89.4 million in adjusted earnings for the quarter. In addition, credit quality remains strong as evidenced by nonperforming assets of 35 basis points and net charge-offs of 13 basis points for the quarter and 5 basis points for the trailing twelve months.”
Mr. Taylor concluded, “As we look forward, we continue to execute on our overall strategy, which includes managing the balance sheet around a stable and diversified funding mix, emphasizing our core business, preserving profitability with a strong asset base and reduced costs, and maintaining our capital and liquidity positions while prudently managing risks. We expect that our total assets will be closer to $35 billion within the next few months, after we complete certain asset sales and bring down liquidity to more normal levels. These actions will improve our liquidity position and are expected to increase our CET1 capital ratio to above 10%. We are also expediting our operational efficiency strategy to reduce facilities and vendors, optimize business processes, and execute on other cost savings across the business to improve our profitability. We will continue to prioritize our customer relationships, which have been the bedrock of our success for more than twenty years.”
| Page 2 |
FINANCIAL HIGHLIGHTS
| At or For the | At or For the | |||||||||||||||||||||||
| Three Months Ended | Three Months Ended | |||||||||||||||||||||||
| March 31, | December 31, | Increase | March 31, | Increase | ||||||||||||||||||||
| Financial Highlights | 2023 | 2022 | (Decrease) | 2023 | 2022 | (Decrease) | ||||||||||||||||||
| (Dollars in thousands, except per share amounts) | ||||||||||||||||||||||||
| Net (loss) earnings available to common stockholders | $ | (1,205,371 | ) | $ | 39,562 | $ | (1,244,933 | ) | $ | (1,205,371 | ) | $ | 120,128 | $ | (1,325,499 | ) | ||||||||
| Diluted (loss) earnings per common share | $ | (10.22 | ) | $ | 0.33 | $ | (10.55 | ) | $ | (10.22 | ) | $ | 1.01 | $ | (11.23 | ) | ||||||||
| Pre-provision, pre-good will impairment, pre-tax net revenue ("PPNR") (1) | $ | 119,396 | $ | 106,151 | $ | 13,245 | $ | 119,396 | $ | 162,109 | $ | (42,713 | ) | |||||||||||
| Return on average assets | (11.34 | )% | 0.48 | % | (11.82 | ) | (11.34 | )% | 1.22 | % | (12.56 | ) | ||||||||||||
| PPNR return on average assets (1) | 1.13 | % | 1.02 | % | 0.11 | 1.13 | % | 1.65 | % | (0.52 | ) | |||||||||||||
| Return on average tangible common equity (1) | 14.45 | % | 12.71 | % | 1.74 | 14.45 | % | 20.77 | % | (6.32 | ) | |||||||||||||
| Yield on average loans and leases (tax equivalent) | 6.14 | % | 5.73 | % | 0.41 | 6.14 | % | 4.66 | % | 1.48 | ||||||||||||||
| Cost of average total deposits | 1.98 | % | 1.37 | % | 0.61 | 1.98 | % | 0.07 | % | 1.91 | ||||||||||||||
| Net interest margin ("NIM")(tax equivalent) | 2.89 | % | 3.41 | % | (0.52 | ) | 2.89 | % | 3.43 | % | (0.54 | ) | ||||||||||||
| Efficiency ratio | 58.2 | % | 53.3 | % | 4.9 | 58.2 | % | 50.1 | % | 8.1 | ||||||||||||||
| Total assets | $ | 44,302,981 | $ | 41,228,936 | $ | 3,074,045 | $ | 44,302,981 | $ | 39,249,639 | $ | 5,053,342 | ||||||||||||
| Loans and leases held for investment, net of deferred fees | $ | 25,672,381 | $ | 28,609,129 | $ | (2,936,748 | ) | $ | 25,672,381 | $ | 24,352,072 | $ | 1,320,309 | |||||||||||
| Non interest-bearing demand deposits | $ | 7,030,759 | $ | 11,212,357 | $ | (4,181,598 | ) | $ | 7,030,759 | $ | 14,057,051 | $ | (7,026,292 | ) | ||||||||||
| Retail non-maturity deposits | $ | 19,230,293 | $ | 26,561,129 | $ | (7,330,836 | ) | $ | 19,230,293 | $ | 31,676,404 | $ | (12,446,111 | ) | ||||||||||
| Total deposits | $ | 28,187,561 | $ | 33,936,334 | $ | (5,748,773 | ) | $ | 28,187,561 | $ | 33,224,895 | $ | (5,037,334 | ) | ||||||||||
| As percentage of total deposits: | ||||||||||||||||||||||||
| Non interest-bearing demand deposits | 25 | % | 33 | % | (8 | ) | 25 | % | 42 | % | (17 | ) | ||||||||||||
| Retail non-maturity deposits | 68 | % | 78 | % | (10 | ) | 68 | % | 95 | % | (27 | ) | ||||||||||||
| Equity to assets ratio | 6.26 | % | 9.58 | % | (3.32 | ) | 6.26 | % | 9.30 | % | (3.04 | ) | ||||||||||||
| Common equity tier 1 capital ratio | 9.22 | % | 8.70 | % | 0.52 | 9.22 | % | 8.64 | % | 0.58 | ||||||||||||||
| Tier 1 capital ratio | 11.16 | % | 10.61 | % | 0.55 | 11.16 | % | 9.07 | % | 2.09 | ||||||||||||||
| Total capital ratio | 14.22 | % | 13.61 | % | 0.61 | 14.22 | % | 12.27 | % | 1.95 | ||||||||||||||
| Tangible common equity ratio (1) | 5.07 | % | 5.13 | % | (0.06 | ) | 5.07 | % | 5.83 | % | (0.76 | ) | ||||||||||||
| Tangible book value per common share (1) | $ | 18.66 | $ | 17.00 | $ | 1.66 | $ | 18.66 | $ | 18.42 | $ | 0.24 | ||||||||||||
(1) Non-GAAP measure.
| Page 3 |
INCOME STATEMENT HIGHLIGHTS
NET INTEREST INCOME
Net interest income decreased by $43.7 million to $279.3 million for the first quarter of 2023 compared to $322.9 million for the fourth quarter of 2022 due mainly to higher interest expense on deposits and borrowings, offset partially by higher interest income on loans and leases and deposits in financial institutions. Interest income on loans and leases increased by $25.7 million in the first quarter of 2023 due to a 41 basis points increase in the tax equivalent yield on loans and leases and a $390.3 million increase in the average balance of loans and leases compared to the fourth quarter of 2022. Interest income on deposits in financial institutions increased by $25.1 million in the first quarter of 2023 due mainly to a $1.8 billion increase in the average balance of deposits in financial institutions and a 98 basis points increase in the yield on deposits in financial institutions. The tax equivalent yield on loans and leases was 6.14% in the first quarter of 2023 compared to 5.73% for the fourth quarter of 2022. The increase in the tax equivalent yield on loans and leases was due primarily to higher coupon interest attributable to increased rates on production and on existing variable rate loans. Interest expense on deposits increased by $38.3 million in the first quarter of 2023 due mainly to increased market rates and an increased use of brokered deposits that contributed to a 61 basis points increase in the cost of total deposits, offset partially by the decrease in the average balance of deposits. Interest expense on borrowings increased by $49.2 million due to a $3.6 billion increase in the average balance and a 57 basis points increase in the cost of borrowings attributable mainly to the impact of increased market rates on our variable rate borrowings and higher market rates on new borrowings.
The tax equivalent NIM was 2.89% for the first quarter of 2023 compared to 3.41% for the fourth quarter of 2022. The decrease in the NIM was due mainly to a shift in our funding mix in the second half of March 2023 as we responded to the banking crisis to enhance liquidity and protect franchise value. Average borrowings as a percentage of average interest-bearing liabilities was 19% for the first quarter of 2023 compared to 7% for the fourth quarter of 2022. The additional borrowings are largely short term in nature, which will allow us to normalize our funding mix over time as economic conditions stabilize. The tax-equivalent NIM was further impacted by a higher cost of total deposits and borrowings, offset partially by higher yields on loans and leases and deposits in financial institutions.
The cost of total deposits was 1.98% for the first quarter of 2023 compared to 1.37% for the fourth quarter of 2022 due mainly to higher market interest rates and a change in the mix of average deposits, resulting from a decrease in lower cost retail non-maturity deposits and an increase in higher cost retail and brokered time deposits.
PROVISION FOR CREDIT LOSSES
The following table presents details of the provision for credit losses for the periods indicated:
| Three Months Ended | ||||||||||||
| March 31, | December 31, | Increase | ||||||||||
| Provision for Credit Losses | 2023 | 2022 | (Decrease) | |||||||||
| (In thousands) | ||||||||||||
| Addition to allowance for loan and lease losses | $ | 18,500 | $ | 14,000 | $ | 4,500 | ||||||
| Reduction in reserve for unfunded loan commitments | (15,500 | ) | (4,000 | ) | (11,500 | ) | ||||||
| Total loan-related provision | 3,000 | 10,000 | (7,000 | ) | ||||||||
| Addition to allowance for held-to-maturity securities | - | - | - | |||||||||
| Total provision for credit losses | $ | 3,000 | $ | 10,000 | $ | (7,000 | ) | |||||
| Page 4 |
The provision for credit losses was $3.0 million for the first quarter of 2023 compared to $10.0 million for the fourth quarter of 2022. The provision for the fourth quarter of 2022 reflected the impact of net loan growth. During the first quarter of 2023, while loans and leases held for investment and unfunded loan commitments declined, a $3 million provision was recognized due to an increase in qualitative reserves for loans secured by commercial real estate and higher net charge-offs.
Noninterest Income
The following table presents details of noninterest income for the periods indicated:
| Three Months Ended | ||||||||||||
| March 31, | December 31, | Increase | ||||||||||
| Noninterest Income | 2023 | 2022 | (Decrease) | |||||||||
| (In thousands) | ||||||||||||
| Service charges on deposit accounts | $ | 3,573 | $ | 3,178 | $ | 395 | ||||||
| Other commissions and fees | 10,344 | 11,208 | (864 | ) | ||||||||
| Leased equipment income | 13,857 | 12,322 | 1,535 | |||||||||
| Gain on sale of loans and leases | 2,962 | 388 | 2,574 | |||||||||
| Gain (loss) on sale of securities | - | (49,302 | ) | 49,302 | ||||||||
| Dividends and gains on equity investments | 1,098 | 661 | 437 | |||||||||
| Warrant loss | (333 | ) | (46 | ) | (287 | ) | ||||||
| Other income | 4,890 | 2,635 | 2,255 | |||||||||
| Total noninterest income (loss) | $ | 36,391 | $ | (18,956 | ) | $ | 55,347 | |||||
Noninterest income increased by $55.3 million to income of $36.4 million for the first quarter of 2023 compared to a loss of $19.0 million for the fourth quarter of 2022 due primarily to a decrease of $49.3 million in loss on sale of securities, and increases of $2.6 million in gain on sale of loans and leases, $2.3 million in other income, and $1.5 million in leased equipment income. The decrease in loss on sale of securities resulted from the sales of $1.0 billion of securities for a net loss of $49.3 million in the fourth quarter of 2022 compared to no sales in the first quarter of 2023. The increase in gain on sale of loans and leases resulted from the sale of $287.3 million of loans for a net gain of $3.0 million in the first quarter of 2023 compared to the sale of $11.0 million of loans for a net gain of $0.4 million in the fourth quarter of 2022. The increase in other income was due primarily to a $2.0 million gain from the change in fair value of the credit-linked notes in the first quarter of 2023. The increase in leased equipment income was due mainly to higher rental income compared to the linked quarter.
| Page 5 |
Noninterest Expense
The following table presents details of noninterest expense for the periods indicated:
| Three Months Ended | ||||||||||||
| March 31, | December 31, | Increase | ||||||||||
| Noninterest Expense | 2023 | 2022 | (Decrease) | |||||||||
| (In thousands) | ||||||||||||
| Compensation | $ | 88,476 | $ | 106,124 | $ | (17,648 | ) | |||||
| Occupancy | 15,067 | 14,922 | 145 | |||||||||
| Data processing | 10,938 | 9,722 | 1,216 | |||||||||
| Other professional services | 6,073 | 6,924 | (851 | ) | ||||||||
| Insurance and assessments | 11,717 | 7,205 | 4,512 | |||||||||
| Intangible asset amortization | 2,411 | 2,629 | (218 | ) | ||||||||
| Leased equipment depreciation | 9,375 | 8,627 | 748 | |||||||||
| Foreclosed assets expense (income), net | 363 | (108 | ) | 471 | ||||||||
| Customer related expense | 24,005 | 18,197 | 5,808 | |||||||||
| Loan expense | 6,524 | 6,150 | 374 | |||||||||
| Other | 12,804 | 11,737 | 1,067 | |||||||||
| Total operating expense | 187,753 | 192,129 | (4,376 | ) | ||||||||
| Acquisition, integration and reorganization costs | 8,514 | 5,703 | 2,811 | |||||||||
| Goodwill impairment | 1,376,736 | 29,000 | 1,347,736 | |||||||||
| Total noninterest expense | $ | 1,573,003 | $ | 226,832 | $ | 1,346,171 | ||||||
The Company recorded a goodwill impairment charge of $1.38 billion in the first quarter of 2023. It is a standard accounting requirement for companies to periodically assess and determine the carrying value of goodwill as an asset. The severe effects of recent industry events on the market valuation of the Company warranted goodwill impairment testing and, following a comprehensive analysis, it was determined that the total amount of goodwill was impaired. The goodwill impairment charge does not have an impact on the Company’s regulatory capital ratios, cash flows, or liquidity position.
Noninterest expense increased by $1.35 billion to $1.57 billion for the first quarter of 2023 compared to $226.8 million for the fourth quarter 2022 due primarily to the $1.38 billion goodwill impairment charge. Excluding the goodwill impairment and acquisition, integration and reorganization costs, operating expense decreased by $4.4 million to $187.8 million. The $4.4 million decrease was due mainly to a decrease of $17.6 million in compensation expense, offset partially by increases of $5.8 million in customer related expense and $4.5 million in insurance and assessments expense. The decrease in compensation expense was due primarily to lower bonus expense and lower stock-based compensation expense. The increase in customer related expense was due mostly to higher third-party payments for deposit customers on account analysis. The increase in insurance and assessments was due mainly to higher FDIC assessment expense attributable to the 2 basis point assessment rate increase effective January 1, 2023, and a higher assessment base as a result of the $1.6 billion increase in average assets in the first quarter of 2023.
Income Taxes
The effective income tax rate was 5.2% for the first quarter of 2023 compared to 26.3% for the fourth quarter of 2022. Excluding goodwill impairment, the effective income tax rate for the first quarter of 2023 was 28.4%. The increase from the fourth quarter of 2022 was due primarily to higher disallowed interest expense in the first quarter of 2023. Excluding goodwill impairment, the effective tax rate for the full year 2023 is currently estimated to be in the range of 28% to 30%.
| Page 6 |
BALANCE SHEET HIGHLIGHTS
Deposits and Client Investment Funds
The following table presents the composition of our deposit portfolio as of the dates indicated:
| March 31, 2023 | December 31, 2022 | March 31, 2022 | ||||||||||||||||||||||
| % of | % of | % of | ||||||||||||||||||||||
| Deposit Composition | Balance | Total | Balance | Total | Balance | Total | ||||||||||||||||||
| (Dollars in thousands) | ||||||||||||||||||||||||
| Noninterest-bearing demand | $ | 7,030,759 | 25 | % | $ | 11,212,357 | 33 | % | $ | 14,057,051 | 42 | % | ||||||||||||
| Interest checking | 5,307,413 | 19 | % | 6,990,377 | 20 | % | 6,673,696 | 20 | % | |||||||||||||||
| Money market | 6,220,203 | 22 | % | 7,780,758 | 23 | % | 10,301,996 | 31 | % | |||||||||||||||
| Savings | 671,918 | 2 | % | 577,637 | 2 | % | 643,661 | 2 | % | |||||||||||||||
| Total retail non-maturity deposits | 19,230,293 | 68 | % | 26,561,129 | 78 | % | 31,676,404 | 95 | % | |||||||||||||||
| Wholesale non-maturity deposits | 2,028,676 | 7 | % | 2,637,362 | 8 | % | 322,732 | 1 | % | |||||||||||||||
| Total non-maturity deposits | 21,258,969 | 75 | % | 29,198,491 | 86 | % | 31,999,136 | 96 | % | |||||||||||||||
| Retail time deposits | 2,502,914 | 9 | % | 2,434,414 | 7 | % | 1,030,124 | 3 | % | |||||||||||||||
| Brokered time deposits | 4,425,678 | 16 | % | 2,303,429 | 7 | % | 195,635 | 1 | % | |||||||||||||||
| Total time deposits (1) | 6,928,592 | 25 | % | 4,737,843 | 14 | % | 1,225,759 | 4 | % | |||||||||||||||
| Total deposits | $ | 28,187,561 | 100 | % | $ | 33,936,334 | 100 | % | $ | 33,224,895 | 100 | % | ||||||||||||
| (1) | Includes time deposits over $250,000 of $1.1 billion, $1.5 billion, and $347.4 million at March 31, 2023, December 31, 2022, and March 31, 2022, respectively. |
Total deposits decreased by $5.7 billion or 16.9% in the first quarter of 2023 due primarily to a $7.3 billion or 27.6% decrease in retail non-maturity deposits and a $608.7 million decrease in wholesale non-maturity deposits, offset partially by a $2.2 billion increase in time deposits. At March 31, 2023, retail non-maturity deposits totaled $19.2 billion or 68% of total deposits, including $7.0 billion of noninterest-bearing demand deposits or 25% of total deposits.
The following table presents the composition of our deposit portfolio by division as of the dates indicated:
| March 31, 2023 | December 31, 2022 | |||||||||||||||||||
| % of | % of | Increase | ||||||||||||||||||
| Balance | Total | Balance | Total | (Decrease) | ||||||||||||||||
| (Dollars in thousands) | ||||||||||||||||||||
| Community Banking | $ | 14,917,027 | 53 | % | $ | 17,466,726 | 52 | % | $ | (2,549,699 | ) | |||||||||
| Venture Banking | 6,584,554 | 23 | % | 11,296,574 | 33 | % | (4,712,020 | ) | ||||||||||||
| Wholesale Deposits | 6,685,980 | 24 | % | 5,173,034 | 15 | % | 1,512,946 | |||||||||||||
| Total deposits | $ | 28,187,561 | 100 | % | $ | 33,936,334 | 100 | % | $ | (5,748,773 | ) | |||||||||
As of March 31, 2023, FDIC-insured deposits represented approximately 71% of total deposits, including accounts eligible for pass-through insurance, and FDIC-insured venture-specific deposits accounted for approximately 83% of total venture-specific deposits, including accounts eligible for pass-through insurance. The Bank’s spot deposit rates increased from 1.71% at December 31, 2022 to 2.32% at March 31, 2023.
In addition to deposit products, we also offer alternative, non-depository cash investment options for select clients. These alternative options include investments managed by Pacific Western Asset Management Inc. (“PWAM”), our registered investment advisor subsidiary, and third-party sweep products. Total off-balance sheet client investment funds decreased from $1.4 billion as of December 31, 2022 to $1.2 billion as of March 31, 2023, of which $0.8 billion was managed by PWAM.
Page 7
BORROWINGS
The following table presents the composition of our borrowings as of the dates indicated:
| March 31, 2023 | December 31, 2022 | |||||||||||||||||||
| Weighted | Weighted | |||||||||||||||||||
| Avarage | Avarage | Increase | ||||||||||||||||||
| Borrowing Type | Balance | Rate | Balance | Rate | (Decrease) | |||||||||||||||
| (Dollars in thousands) | ||||||||||||||||||||
| FHLB secured advances | $ | 5,450,000 | 5.07 | % | $ | 1,270,000 | 4.62 | % | $ | 4,180,000 | ||||||||||
| Bank Term Funding Program | 4,910,000 | 4.38 | % | - | - | 4,910,000 | ||||||||||||||
| Repurchase agreement (1) | 1,393,337 | 8.50 | % | - | - | 1,393,337 | ||||||||||||||
| Credit-linked notes | 128,375 | 15.24 | % | 132,030 | 14.56 | % | (3,655 | ) | ||||||||||||
| AFX borrowings | - | - | 250,000 | 4.68 | % | (250,000 | ) | |||||||||||||
| FHLB unsecured overnight advance | - | - | 112,000 | 4.37 | % | (112,000 | ) | |||||||||||||
| Total borrowings | $ | 11,881,712 | 5.30 | % | $ | 1,764,030 | 5.36 | % | $ | 10,117,682 | ||||||||||
| (1) | Balance is net of unamortized issuance costs of $17.9 million and $0.4 million of accrued exit fees. Rate calculation does not include the effects of issuance costs and exit fees. |
The $10.1 billion increase in borrowings in the first quarter of 2023 is the result of the Company’s proactive effort to bolster its on-balance sheet liquidity in response to the elevated net deposit outflows caused by the banking crisis. The increase is comprised of borrowings under the new Bank Term Funding Program of $4.9 billion, an increase in FHLB secured advances of $4.2 billion, and borrowing under a new repurchase agreement facility of $1.4 billion. Available borrowing capacity was approximately $5.8 billion at March 31, 2023.
Page 8
Loans and Leases
The following table presents roll forwards of loans and leases held for investment, net of deferred fees, for the periods indicated:
| Three Months Ended | ||||||||
| Roll Forward of Loans and Leases Held | March 31, | December 31, | ||||||
| for Investment, Net of Deferred Fees | 2023 | 2022 | ||||||
| (Dollars in thousands) | ||||||||
| Balance, beginning of period | $ | 28,609,129 | $ | 27,660,041 | ||||
| Additions: | ||||||||
| Production | 468,671 | 1,287,248 | ||||||
| Disbursements | 1,622,898 | 1,919,979 | ||||||
| Total production and disbursements | 2,091,569 | 3,207,227 | ||||||
| Reductions: | ||||||||
| Payoffs | (1,021,652 | ) | (1,136,016 | ) | ||||
| Paydowns | (965,537 | ) | (1,050,727 | ) | ||||
| Total payoffs and paydowns | (1,987,189 | ) | (2,186,743 | ) | ||||
| Sales | (231,798 | ) | (2,611 | ) | ||||
| Transfers to foreclosed assets | (2,568 | ) | (4,714 | ) | ||||
| Charge-offs | (10,397 | ) | (3,352 | ) | ||||
| Transfers to loans held for sale | (2,796,365 | ) | (60,719 | ) | ||||
| Total reductions | (5,028,317 | ) | (2,258,139 | ) | ||||
| Net (decrease) increase | (2,936,748 | ) | 949,088 | |||||
| Balance, end of period | $ | 25,672,381 | $ | 28,609,129 | ||||
| Weighted average rate on production (1) | 8.44 | % | 7.55 | % | ||||
| (1) | The weighted average rate on production presents contractual rates on a tax equivalent basis and excludes amortized fees. Amortized fees added approximately 17 basis points to loan yields in 2023. |
Loans and leases held for investment, net of deferred fees, decreased by $2.9 billion, or 10.3% in the first quarter of 2023 to $25.7 billion at March 31, 2023. The overall decrease in the loans and leases balance for the first quarter of 2023 was due primarily to a $2.7 billion transfer to loans held for sale of Lender Finance loans included in the asset-based commercial loan portfolio.
The weighted average rate on the $469 million of production for the first quarter of 2023 increased to 8.44% from 7.55% for the fourth quarter of 2022 due primarily to the loan mix (lower percentage of multi-family production and a higher percentage of Civic production) and the increase in market interest rates.
Page 9
The following table presents the composition of loans and leases held for investment by loan portfolio segment and class, net of deferred fees, as of the dates indicated:
| March 31, 2023 | December 31, 2022 | March 31, 2022 | ||||||||||||||||||||||
| % of | % of | % of | ||||||||||||||||||||||
| Loan and Lease Portfolio | Balance | Total | Balance | Total | Balance | Total | ||||||||||||||||||
| (Dollars in thousands) | ||||||||||||||||||||||||
| Real estate mortgage: | ||||||||||||||||||||||||
| Commercial | $ | 3,808,751 | 15 | % | $ | 3,846,831 | 13 | % | $ | 3,669,741 | 15 | % | ||||||||||||
| Multi-family | 5,523,320 | 21 | % | 5,607,865 | 20 | % | 4,080,257 | 17 | % | |||||||||||||||
| Other residential | 6,075,540 | 24 | % | 6,275,628 | 22 | % | 4,759,066 | 20 | % | |||||||||||||||
| Total real estate mortgage | 15,407,611 | 60 | % | 15,730,324 | 55 | % | 12,509,064 | 52 | % | |||||||||||||||
| Real estate construction and land: | ||||||||||||||||||||||||
| Commercial | 910,327 | 4 | % | 898,592 | 3 | % | 802,022 | 3 | % | |||||||||||||||
| Residential | 3,698,113 | 14 | % | 3,253,580 | 11 | % | 2,421,694 | 10 | % | |||||||||||||||
| Total real estate construction and land | 4,608,440 | 18 | % | 4,152,172 | 14 | % | 3,223,716 | 13 | % | |||||||||||||||
| Total real estate | 20,016,051 | 78 | % | 19,882,496 | 69 | % | 15,732,780 | 65 | % | |||||||||||||||
| Commercial: | ||||||||||||||||||||||||
| Asset-based | 2,068,327 | 8 | % | 5,140,209 | 18 | % | 4,739,220 | 19 | % | |||||||||||||||
| Venture capital | 2,058,237 | 8 | % | 2,033,302 | 7 | % | 2,077,339 | 9 | % | |||||||||||||||
| Other commercial | 1,102,543 | 4 | % | 1,108,451 | 4 | % | 1,298,136 | 5 | % | |||||||||||||||
| Total commercial | 5,229,107 | 20 | % | 8,281,962 | 29 | % | 8,114,695 | 33 | % | |||||||||||||||
| Consumer | 427,223 | 2 | % | 444,671 | 2 | % | 504,597 | 2 | % | |||||||||||||||
| Total loans and leases held for investment, net of deferred fees | $ | 25,672,381 | 100 | % | $ | 28,609,129 | 100 | % | $ | 24,352,072 | 100 | % | ||||||||||||
| Total unfunded loan commitments | $ | 9,776,789 | $ | 11,110,264 | $ | 9,899,345 | ||||||||||||||||||
Allowance for Credit Losses ON LOANS AND LEASES
The following tables present roll forwards of the allowance for credit losses on loans and leases for the periods indicated:
| Three Months Ended March 31, 2023 | ||||||||||||
| Allowance for Credit | Allowance for | Reserve for | Total | |||||||||
| Losses on Loans and | Loan and | Unfunded Loan | Allowance for | |||||||||
| Leases Rollforward | Lease Losses | Commitments | Credit Losses | |||||||||
| (In thousands) | ||||||||||||
| Beginning balance | $ | 200,732 | $ | 91,071 | $ | 291,803 | ||||||
| Charge-offs | (10,397 | ) | - | (10,397 | ) | |||||||
| Recoveries | 1,220 | - | 1,220 | |||||||||
| Net charge-offs | (9,177 | ) | - | (9,177 | ) | |||||||
| Provision | 18,500 | (15,500 | ) | 3,000 | ||||||||
| Ending balance | $ | 210,055 | $ | 75,571 | $ | 285,626 | ||||||
Page 10
| Three Months Ended December 31, 2022 | ||||||||||||
| Allowance for Credit | Allowance for | Reserve for | Total | |||||||||
| Losses on Loans and | Loan and | Unfunded Loan | Allowance for | |||||||||
| Leases Rollforward | Lease Losses | Commitments | Credit Losses | |||||||||
| (In thousands) | ||||||||||||
| Beginning balance | $ | 189,327 | $ | 95,071 | $ | 284,398 | ||||||
| Charge-offs | (3,352 | ) | - | (3,352 | ) | |||||||
| Recoveries | 757 | - | 757 | |||||||||
| Net charge-offs | (2,595 | ) | - | (2,595 | ) | |||||||
| Provision | 14,000 | (4,000 | ) | 10,000 | ||||||||
| Ending balance | $ | 200,732 | $ | 91,071 | $ | 291,803 | ||||||
The following table presents allowance for credit losses information on loans and leases as of and for the dates and periods indicated:
| Allowance for Credit Losses | March 31, | December 31, | Increase | |||||||||
| on Loans and Leases | 2023 | 2022 | (Decrease) | |||||||||
| (Dollars in thousands) | ||||||||||||
| Allowance for loan and lease losses | $ | 210,055 | $ | 200,732 | $ | 9,323 | ||||||
| Reserve for unfunded loan commitments | 75,571 | 91,071 | (15,500 | ) | ||||||||
| Allowance for credit losses | $ | 285,626 | $ | 291,803 | $ | (6,177 | ) | |||||
| Provision for credit losses (for the quarter) | $ | 3,000 | $ | 10,000 | $ | (7,000 | ) | |||||
| Net charge-offs (for the quarter) | $ | 9,177 | $ | 2,595 | $ | 6,582 | ||||||
| Net charge-offs to average loans and leases (for the quarter) | 0.13 | % | 0.04 | % | ||||||||
| Allowance for loan and lease losses to loans and leases held for investment | 0.82 | % | 0.70 | % | ||||||||
| Allowance for credit losses to loans and leases held for investment | 1.11 | % | 1.02 | % | ||||||||
The allowance for credit losses decreased by $6.2 million in the first quarter of 2023 to $285.6 million at March 31, 2023. This decrease was attributable mainly to the decrease in loans and leases held for investment and unfunded loan commitments and $9.2 million in net charge-offs, offset partially by an increase in qualitative reserves for loans secured by commercial real estate.
Net charge-offs over the trailing twelve months were $12.8 million, which resulted in net charge-offs to average loans and leases over the trailing twelve months of 0.5%.
Page 11
CREDIT QUALITY
The following table presents loan and lease credit quality metrics as of the dates indicated:
| March 31, | December 31, | Increase | ||||||||||
| Credit Quality Metrics | 2023 | 2022 | (Decrease) | |||||||||
| (Dollars in thousands) | ||||||||||||
| Nonperforming Assets: | ||||||||||||
| Nonaccrual loans and leases held for investment (1) | $ | 87,124 | $ | 103,778 | $ | (16,654 | ) | |||||
| Accruing loans contractually past due 90 days or more | - | - | - | |||||||||
| Foreclosed assets, net | 2,135 | 5,022 | (2,887 | ) | ||||||||
| Total nonperforming assets ("NPAs") | $ | 89,259 | $ | 108,800 | $ | (19,541 | ) | |||||
| Nonaccrual loans and leases held for investment to loans and leases held for investment | 0.34 | % | 0.36 | % | ||||||||
| Nonperforming assets to loans and leases held for investment and foreclosed assets | 0.35 | % | 0.38 | % | ||||||||
| Allowance for credit losses to nonaccrual loans and leases held for investment | 327.8 | % | 281.2 | % | ||||||||
| Loan and Lease Credit Risk Ratings: | ||||||||||||
| Pass | $ | 24,959,805 | $ | 27,924,599 | $ | (2,964,794 | ) | |||||
| Special mention | 580,153 | 566,259 | 13,894 | |||||||||
| Classified | 132,423 | 118,271 | 14,152 | |||||||||
| Total loans and leases held for investment, net of deferred fees | $ | 25,672,381 | $ | 28,609,129 | $ | (2,936,748 | ) | |||||
| Special mention loans and leases held for investment to loans and leases held for investment | 2.26 | % | 1.98 | % | ||||||||
| Classified loans and leases held for investment to loans and leases held for investment | 0.52 | % | 0.41 | % | ||||||||
| (1) | Nonaccrual loans include SBA guaranteed amounts of $11.8 million at March 31, 2023 and $14.3 million at December 31, 2022. |
Nonaccrual loans and leases decreased by $16.7 million to $87.1 million in the first quarter of 2023 due primarily to a decrease in nonaccrual commercial real estate loans and, to a lesser extent, Civic loans.
Page 12
The following table presents nonaccrual loans and leases and accruing loans and leases past due between 30 and 89 days by loan portfolio segment and class as of the dates indicated:
| March 31, 2023 | December 31, 2022 | Increase (Decrease) | ||||||||||||||||||||||
| Accruing | Accruing | Accruing | ||||||||||||||||||||||
| and 30-89 | and 30-89 | and 30-89 | ||||||||||||||||||||||
| Days Past | Days Past | Days Past | ||||||||||||||||||||||
| Nonaccrual | Due | Nonaccrual | Due | Nonaccrual | Due | |||||||||||||||||||
| (In thousands) | ||||||||||||||||||||||||
| Real estate mortgage: | ||||||||||||||||||||||||
| Commercial | $ | 32,996 | $ | 1,650 | $ | 42,509 | $ | 1,047 | $ | (9,513 | ) | $ | 603 | |||||||||||
| Multi-family | - | - | - | - | - | - | ||||||||||||||||||
| Other residential | 50,060 | 125,458 | 55,893 | 95,654 | (5,833 | ) | 29,804 | |||||||||||||||||
| Total real estate mortgage | 83,056 | 127,108 | 98,402 | 96,701 | (15,346 | ) | 30,407 | |||||||||||||||||
| Real estate construction and land: | ||||||||||||||||||||||||
| Commercial | - | - | - | - | - | - | ||||||||||||||||||
| Residential | - | - | - | - | - | - | ||||||||||||||||||
| Total real estate construction and land | - | - | - | - | - | - | ||||||||||||||||||
| Commercial: | ||||||||||||||||||||||||
| Asset-based | 420 | - | 865 | - | (445 | ) | - | |||||||||||||||||
| Venture capital | - | - | - | - | - | - | ||||||||||||||||||
| Other commercial | 3,123 | 618 | 4,345 | 385 | (1,222 | ) | 233 | |||||||||||||||||
| Total commercial | 3,543 | 618 | 5,210 | 385 | (1,667 | ) | 233 | |||||||||||||||||
| Consumer | 525 | 1,593 | 166 | 1,935 | 359 | (342 | ) | |||||||||||||||||
| Total held for investment | $ | 87,124 | $ | 129,319 | $ | 103,778 | $ | 99,021 | $ | (16,654 | ) | $ | 30,298 | |||||||||||
Loans and leases accruing and 30-89 days past due generally fluctuate from period to period. The $30.3 million increase to $129.3 million in the first quarter of 2023 was due mainly to an increase in Civic delinquent loans of $22.7 million.
CAPITAL
The following table presents capital ratios as of the dates indicated:
| March 31, | December 31, | March 31, | ||||||||||
| 2023 | 2022 | 2022 | ||||||||||
| PacWest Bancorp Consolidated: | ||||||||||||
| Common equity tier 1 capital ratio (1) | 9.22 | % | 8.70 | % | 8.64 | % | ||||||
| Tier 1 capital ratio (1) | 11.16 | % | 10.61 | % | 9.07 | % | ||||||
| Total capital ratio (1) | 14.22 | % | 13.61 | % | 12.27 | % | ||||||
| Tier 1 leverage capital ratio (1) | 8.33 | % | 8.61 | % | 7.11 | % | ||||||
| Risk-weighted assets (1) (in thousands) | $ | 32,488,956 | $ | 33,030,960 | $ | 30,297,312 | ||||||
| Tangible common equity ratio (2) | 5.07 | % | 5.13 | % | 5.83 | % | ||||||
| Tangible common equity ratio excluding the impact of AOCI for securities (2) | 6.73 | % | 7.12 | % | 6.82 | % | ||||||
| (1) | Capital information for March 31, 2023 is preliminary. |
| (2) | Non-GAAP measure. |
Page 13
CONFERENCE CALL
PacWest Bancorp (“PacWest”) will host a conference call at 8:00 AM PT/ 11:00 AM ET on Wednesday, April 26, 2023, to discuss the Company’s performance for the first quarter of 2023.
Participants may access the conference call/webcast at:
Participant Dial-in: (888) 256-1007
Participant Webcast Link: https://event.webcasts.com/starthere.jsp?ei=1606712&tp_key=2960dca832
Confirmation Code: 9773012
The call will be recorded and made available for replay on April 26, 2023, after 12:00 PM PT. The recording may be accessed through the link above or at https://www.pacwestbancorp.com/news-market-data/presentations/default.aspx.
ABOUT PACWEST BANCORP
PacWest is a bank holding company headquartered in Los Angeles, California, with an executive office in Denver, Colorado, with one wholly-owned banking subsidiary, Pacific Western Bank (the “Bank”). Pacific Western Bank is a relationship-based community bank focused on providing business banking and treasury management services to small, middle-market, and venture-backed businesses. The Bank offers a broad range of loan and lease and deposit products and services through full-service branches throughout California and in Durham, North Carolina and Denver, Colorado, and loan production offices around the country. For more information about PacWest Bancorp or Pacific Western Bank, visit www.pacwest.com.
Page 14
FORWARD-LOOKING STATEMENTS
This communication contains certain forward-looking information about PacWest that is intended to be covered by the safe harbor for “forward-looking statements” provided by the Private Securities Litigation Reform Act of 1995. Statements that are not historical or current facts, including statements about future financial and operational results, expectations, or intentions are forward-looking statements. Such statements often use words such as “anticipates,” “targets,” “expects,” “estimates,” “intends,” “plans,” “believes,” “continue” and other similar expressions or future or conditional verbs such as “will,” “may,” “might,” “should,” “would” and “could.” Such statements are based on information available at the time of the communication and are based on current beliefs and expectations of PacWest’s management and are subject to significant risks, uncertainties and contingencies, many of which are beyond our control, which may cause actual results, performance, or achievements to differ materially from those expressed in them. Continued deterioration in general business, economic, and political conditions, geopolitical tensions, uncertainty in U.S. fiscal monetary policy, including the interest rate policies of the Federal Reserve Board, and volatility and disruptions in credit and capital markets could lead to a tightening of credit and an increase of credit losses, adversely affect PacWest’s revenues and the values of our assets and liabilities, increase stock price volatility, and adversely impact our ability to raise capital. In addition, PacWest and its results could be adversely affected by changes in interest rates, continued high inflation, and unemployment rates, our ability to attract and retain deposits and other sources of funding and liquidity particularly in a rising or high interest rate environment, the impact of bank failures or other adverse developments at other banks on general investor sentiment regarding the stability and liquidity of banks, the safety of deposits, and depositor behavior, the quality and composition of our deposits, deterioration in the credit quality of our loan portfolio or in the value of the collateral securing those loans, especially the risks associated with concentrations in real estate related loans, deterioration in the value of our investment securities as a result of rising interest rates or otherwise, our ability to successfully execute on our planned asset sales, strategic plan, and digital and innovation initiatives, the effectiveness of our risk management framework and quantitative models, and legal and regulatory developments. Actual results may differ materially from those set forth or implied in the forward-looking statements due to a variety of factors, including the risk factors described in documents filed by PacWest with the U.S. Securities and Exchange Commission.
All forward-looking statements in this communication are based on information available at the time the statement is made. We are under no obligation (and expressly disclaim any such obligation) to update or alter our forward-looking statements, whether as a result of new information, future events or otherwise, except as required by law.
Page 15
PACWEST BANCORP AND SUBSIDIARIES
CONDENSED CONSOLIDATED BALANCE SHEET
| March 31, | December 31, | March 31, | ||||||||||
| 2023 | 2022 | 2022 | ||||||||||
| (Dollars in thousands, except per share amounts) | ||||||||||||
| ASSETS: | ||||||||||||
| Cash and due from banks | $ | 218,830 | $ | 212,273 | $ | 205,446 | ||||||
| Interest-earning deposits in financial institutions | 6,461,306 | 2,027,949 | 1,865,235 | |||||||||
| Total cash and cash equivalents | 6,680,136 | 2,240,222 | 2,070,681 | |||||||||
| Securities available-for-sale, at estimated fair value | 4,848,607 | 4,843,487 | 9,975,109 | |||||||||
| Securities held-to-maturity, at amortized cost, net of allowance for credit losses | 2,273,650 | 2,269,135 | - | |||||||||
| Federal Home Loan Bank stock, at cost | 147,150 | 34,290 | 17,250 | |||||||||
| Total investment securities | 7,269,407 | 7,146,912 | 9,992,359 | |||||||||
| Loans held for sale | 2,796,208 | 65,076 | - | |||||||||
| Gross loans and leases held for investment | 25,770,912 | 28,726,016 | 24,439,749 | |||||||||
| Deferred fees, net | (98,531 | ) | (116,887 | ) | (87,677 | ) | ||||||
| Total loans and leases held for investment, net of deferred fees | 25,672,381 | 28,609,129 | 24,352,072 | |||||||||
| Allowance for loan and lease losses | (210,055 | ) | (200,732 | ) | (197,398 | ) | ||||||
| Total loans and leases held for investment, net | 25,462,326 | 28,408,397 | 24,154,674 | |||||||||
| Equipment leased to others under operating leases | 399,972 | 404,245 | 325,305 | |||||||||
| Premises and equipment, net | 60,358 | 54,315 | 51,011 | |||||||||
| Foreclosed assets, net | 2,135 | 5,022 | 304 | |||||||||
| Goodwill | - | 1,376,736 | 1,405,736 | |||||||||
| Core deposit and customer relationship intangibles, net | 28,970 | 31,381 | 41,308 | |||||||||
| Other assets | 1,603,469 | 1,496,630 | 1,208,261 | |||||||||
| Total assets | $ | 44,302,981 | $ | 41,228,936 | $ | 39,249,639 | ||||||
| LIABILITIES: | ||||||||||||
| Noninterest-bearing deposits | $ | 7,030,759 | $ | 11,212,357 | $ | 14,057,051 | ||||||
| Interest-bearing deposits | 21,156,802 | 22,723,977 | 19,167,844 | |||||||||
| Total deposits | 28,187,561 | 33,936,334 | 33,224,895 | |||||||||
| Borrowings | 11,881,712 | 1,764,030 | 991,000 | |||||||||
| Subordinated debt | 868,815 | 867,087 | 863,880 | |||||||||
| Accrued interest payable and other liabilities | 593,416 | 710,954 | 519,269 | |||||||||
| Total liabilities | 41,531,504 | 37,278,405 | 35,599,044 | |||||||||
| STOCKHOLDERS' EQUITY (1) | 2,771,477 | 3,950,531 | 3,650,595 | |||||||||
| Total liabilities and stockholders’ equity | $ | 44,302,981 | $ | 41,228,936 | $ | 39,249,639 | ||||||
| Book value per common share | $ | 18.90 | $ | 28.71 | $ | 30.52 | ||||||
| Tangible book value per common share (2) | $ | 18.66 | $ | 17.00 | $ | 18.42 | ||||||
| Common shares outstanding | 120,244,214 | 120,222,057 | 119,601,766 | |||||||||
| (1) Includes net unrealized loss on: | ||||||||||||
| Securities available-for-sale, net | $ | (537,307 | ) | $ | (586,450 | ) | $ | (376,475 | ) | |||
| Securities held to maturity | (198,753 | ) | (204,453 | ) | - | |||||||
| Total | $ | (736,060 | ) | $ | (790,903 | ) | $ | (376,475 | ) | |||
| (2) Non-GAAP measure. | ||||||||||||
Page 16
PACWEST BANCORP AND SUBSIDIARIES
CONDENSED CONSOLIDATED STATEMENT OF EARNINGS (LOSS)
| Three Months Ended | ||||||||||||
| March 31, | December 31, | March 31, | ||||||||||
| 2023 | 2022 | 2022 | ||||||||||
| (In thousands, except per share amounts) | ||||||||||||
| Interest income: | ||||||||||||
| Loans and leases | $ | 430,685 | $ | 404,985 | $ | 267,759 | ||||||
| Investment securities | 44,237 | 50,292 | 53,422 | |||||||||
| Deposits in financial institutions | 42,866 | 17,746 | 1,723 | |||||||||
| Total interest income | 517,788 | 473,023 | 322,904 | |||||||||
| Interest expense: | ||||||||||||
| Deposits | 155,892 | 117,591 | 6,208 | |||||||||
| Borrowings | 69,122 | 19,962 | 161 | |||||||||
| Subordinated debt | 13,502 | 12,531 | 7,818 | |||||||||
| Total interest expense | 238,516 | 150,084 | 14,187 | |||||||||
| Net interest income | 279,272 | 322,939 | 308,717 | |||||||||
| Provision for credit losses | 3,000 | 10,000 | - | |||||||||
| Net interest income after provision for credit losses | 276,272 | 312,939 | 308,717 | |||||||||
| Noninterest income: | ||||||||||||
| Service charges on deposit accounts | 3,573 | 3,178 | 3,571 | |||||||||
| Other commissions and fees | 10,344 | 11,208 | 11,580 | |||||||||
| Leased equipment income | 13,857 | 12,322 | 13,094 | |||||||||
| Gain on sale of loans and leases | 2,962 | 388 | 60 | |||||||||
| Gain (loss) on sale of securities | - | (49,302 | ) | 104 | ||||||||
| Dividends and gains (losses) on equity investments | 1,098 | 661 | (11,375 | ) | ||||||||
| Warrant (loss) income | (333 | ) | (46 | ) | 629 | |||||||
| Other income | 4,890 | 2,635 | 3,155 | |||||||||
| Total noninterest income (loss) | 36,391 | (18,956 | ) | 20,818 | ||||||||
| Noninterest expense: | ||||||||||||
| Compensation | 88,476 | 106,124 | 92,240 | |||||||||
| Occupancy | 15,067 | 14,922 | 15,200 | |||||||||
| Data processing | 10,938 | 9,722 | 9,629 | |||||||||
| Other professional services | 6,073 | 6,924 | 5,954 | |||||||||
| Insurance and assessments | 11,717 | 7,205 | 5,490 | |||||||||
| Intangible asset amortization | 2,411 | 2,629 | 3,649 | |||||||||
| Leased equipment depreciation | 9,375 | 8,627 | 9,189 | |||||||||
| Foreclosed assets expense (income), net | 363 | (108 | ) | (3,353 | ) | |||||||
| Acquisition, integration and reorganization costs | 8,514 | 5,703 | - | |||||||||
| Customer related expense | 24,005 | 18,197 | 12,655 | |||||||||
| Loan expense | 6,524 | 6,150 | 5,157 | |||||||||
| Goodwill impairment | 1,376,736 | 29,000 | - | |||||||||
| Other expense | 12,804 | 11,737 | 11,616 | |||||||||
| Total noninterest expense | 1,573,003 | 226,832 | 167,426 | |||||||||
| (Loss) earnings before income taxes | (1,260,340 | ) | 67,151 | 162,109 | ||||||||
| Income tax (benefit) expense | (64,916 | ) | 17,642 | 41,981 | ||||||||
| Net (loss) earnings | (1,195,424 | ) | 49,509 | 120,128 | ||||||||
| Preferred stock dividends | 9,947 | 9,947 | - | |||||||||
| Net (loss) earnings available to common stockholders | $ | (1,205,371 | ) | $ | 39,562 | $ | 120,128 | |||||
| Basic and diluted (loss) earnings per | ||||||||||||
| common share | $ | (10.22 | ) | $ | 0.33 | $ | 1.01 | |||||
| Dividends declared and paid per common share | $ | 0.25 | $ | 0.25 | $ | 0.25 | ||||||
Page 17
PACWEST BANCORP AND SUBSIDIARIES
AVERAGE BALANCE SHEET AND YIELD ANALYSIS
| Three Months Ended | ||||||||||||||||||||||||||||||||||||
| March 31, 2023 | December 31, 2022 | March 31, 2022 | ||||||||||||||||||||||||||||||||||
| Interest | Average | Interest | Average | Interest | Average | |||||||||||||||||||||||||||||||
| Average | Income/ | Yield/ | Average | Income/ | Yield/ | Average | Income/ | Yield/ | ||||||||||||||||||||||||||||
| Balance | Expense | Cost | Balance | Expense | Cost | Balance | Expense | Cost | ||||||||||||||||||||||||||||
| (Dollars in thousands) | ||||||||||||||||||||||||||||||||||||
| Assets: | ||||||||||||||||||||||||||||||||||||
| Loans and | ||||||||||||||||||||||||||||||||||||
| leases (1)(2)(3) | $ | 28,583,265 | $ | 433,029 | 6.14 | % | $ | 28,192,953 | $ | 407,135 | 5.73 | % | $ | 23,433,019 | $ | 269,521 | 4.66 | % | ||||||||||||||||||
| Investment securities (3) | 7,191,362 | 44,246 | 2.50 | % | 7,824,915 | 50,697 | 2.57 | % | 10,397,709 | 55,594 | 2.17 | % | ||||||||||||||||||||||||
| Deposits in financial institutions | 3,682,228 | 42,866 | 4.72 | % | 1,881,950 | 17,746 | 3.74 | % | 3,083,159 | 1,723 | 0.23 | % | ||||||||||||||||||||||||
| Total interest-earning assets (1) | 39,456,855 | 520,141 | 5.35 | % | 37,899,818 | 475,578 | 4.98 | % | 36,913,887 | 326,838 | 3.59 | % | ||||||||||||||||||||||||
| Other assets | 3,311,859 | 3,252,145 | 2,969,417 | |||||||||||||||||||||||||||||||||
| Total assets | $ | 42,768,714 | $ | 41,151,963 | $ | 39,883,304 | ||||||||||||||||||||||||||||||
| Liabilities and Stockholders' Equity: | ||||||||||||||||||||||||||||||||||||
| Interest checking | $ | 7,089,102 | 55,957 | 3.20 | % | $ | 7,146,333 | 41,427 | 2.30 | % | $ | 7,094,623 | 1,776 | 0.10 | % | |||||||||||||||||||||
| Money market | 8,932,059 | 56,224 | 2.55 | % | 10,088,641 | 51,687 | 2.03 | % | 10,852,454 | 3,461 | 0.13 | % | ||||||||||||||||||||||||
| Savings | 597,287 | 599 | 0.41 | % | 616,298 | 66 | 0.04 | % | 642,709 | 39 | 0.02 | % | ||||||||||||||||||||||||
| Time | 5,123,955 | 43,112 | 3.41 | % | 3,909,130 | 24,411 | 2.48 | % | 1,278,609 | 932 | 0.30 | % | ||||||||||||||||||||||||
| Total interest-bearing deposits | 21,742,403 | 155,892 | 2.91 | % | 21,760,402 | 117,591 | 2.14 | % | 19,868,395 | 6,208 | 0.13 | % | ||||||||||||||||||||||||
| Borrowings | 5,289,429 | 69,122 | 5.30 | % | 1,675,738 | 19,962 | 4.73 | % | 298,444 | 161 | 0.22 | % | ||||||||||||||||||||||||
| Subordinated debt | 867,637 | 13,502 | 6.31 | % | 864,581 | 12,531 | 5.75 | % | 863,572 | 7,818 | 3.67 | % | ||||||||||||||||||||||||
| Total interest-bearing liabilities | 27,899,469 | 238,516 | 3.47 | % | 24,300,721 | 150,084 | 2.45 | % | 21,030,411 | 14,187 | 0.27 | % | ||||||||||||||||||||||||
| Noninterest-bearing demand deposits | 10,233,434 | 12,325,902 | 14,463,667 | |||||||||||||||||||||||||||||||||
| Other liabilities | 637,124 | 626,540 | 541,745 | |||||||||||||||||||||||||||||||||
| Total liabilities | 38,770,027 | 37,253,163 | 36,035,823 | |||||||||||||||||||||||||||||||||
| Stockholders' equity | 3,998,687 | 3,898,800 | 3,847,481 | |||||||||||||||||||||||||||||||||
| Total liabilities and stockholders' equity | $ | 42,768,714 | $ | 41,151,963 | $ | 39,883,304 | ||||||||||||||||||||||||||||||
| Net interest income (1) | $ | 281,625 | $ | 325,494 | $ | 312,651 | ||||||||||||||||||||||||||||||
| Net interest spread (1) | 1.88 | % | 2.53 | % | 3.32 | % | ||||||||||||||||||||||||||||||
| Net interest margin (1) | 2.89 | % | 3.41 | % | 3.43 | % | ||||||||||||||||||||||||||||||
| Total deposits (4) | $ | 31,975,837 | $ | 155,892 | 1.98 | % | $ | 34,086,304 | $ | 117,591 | 1.37 | % | $ | 34,332,062 | $ | 6,208 | 0.07 | % | ||||||||||||||||||
| (1) | Tax equivalent. |
| (2) | Includes net loan premium amortization of $2.8 million, $2.5 million, and $5.7 million for the three months ended March 31, 2023, December 31, 2022, and March 31, 2022, respectively. |
| (3) | Includes tax-equivalent adjustments of $2.3 million, $2.2 million,
and $1.8 million for the three months ended March 31, 2023, December 31, 2022, and March 31, 2022 related to tax-exempt
income on loans. Includes tax-equivalent adjustments of $9,000, $0.4 million, and $2.2 million for the three months ended March 31, 2023, December 31, 2022, and March 31, 2022 related to tax-exempt income on investment securities. |
The federal statutory tax rate utilized was 21%.
| (4) | Total deposits is the sum of total interest-bearing deposits and noninterest-bearing demand deposits. The cost of total deposits is calculated as annualized interest expense on total deposits divided by average total deposits. |
Page 18
PACWEST BANCORP AND SUBSIDIARIES
FIVE QUARTER BALANCE SHEET
| March 31, | December 31, | September 30, | June 30, | March 31, | ||||||||||||||||
| 2023 | 2022 | 2022 | 2022 | 2022 | ||||||||||||||||
| (Dollars in thousands, except per share amounts) | ||||||||||||||||||||
| ASSETS: | ||||||||||||||||||||
| Cash and due from banks | $ | 218,830 | $ | 212,273 | $ | 216,436 | $ | 197,027 | $ | 205,446 | ||||||||||
| Interest-earning deposits in financial institutions | 6,461,306 | 2,027,949 | 2,244,272 | 2,192,877 | 1,865,235 | |||||||||||||||
| Total cash and cash equivalents | 6,680,136 | 2,240,222 | 2,460,708 | 2,389,904 | 2,070,681 | |||||||||||||||
| Securities available-for-sale | 4,848,607 | 4,843,487 | 5,891,328 | 6,780,648 | 9,975,109 | |||||||||||||||
| Securities held-to-maturity | 2,273,650 | 2,269,135 | 2,264,601 | 2,260,367 | - | |||||||||||||||
| Federal Home Loan Bank stock | 147,150 | 34,290 | 36,990 | 33,210 | 17,250 | |||||||||||||||
| Total investment securities | 7,269,407 | 7,146,912 | 8,192,919 | 9,074,225 | 9,992,359 | |||||||||||||||
| Loans held for sale | 2,796,208 | 65,076 | 15,534 | - | - | |||||||||||||||
| Gross loans and leases held for investment | 25,770,912 | 28,726,016 | 27,775,962 | 26,608,541 | 24,439,749 | |||||||||||||||
| Deferred fees, net | (98,531 | ) | (116,887 | ) | (115,921 | ) | (107,404 | ) | (87,677 | ) | ||||||||||
| Total loans and leases held for investment, net of deferred fees | 25,672,381 | 28,609,129 | 27,660,041 | 26,501,137 | 24,352,072 | |||||||||||||||
| Allowance for loan and lease losses | (210,055 | ) | (200,732 | ) | (189,327 | ) | (188,705 | ) | (197,398 | ) | ||||||||||
| Total loans and leases held for investment, net | 25,462,326 | 28,408,397 | 27,470,714 | 26,312,432 | 24,154,674 | |||||||||||||||
| Equipment leased to others under operating leases | 399,972 | 404,245 | 338,691 | 324,233 | 325,305 | |||||||||||||||
| Premises and equipment, net | 60,358 | 54,315 | 50,781 | 51,083 | 51,011 | |||||||||||||||
| Foreclosed assets, net | 2,135 | 5,022 | 2,967 | - | 304 | |||||||||||||||
| Goodwill | - | 1,376,736 | 1,405,736 | 1,405,736 | 1,405,736 | |||||||||||||||
| Core deposit and customer relationship intangibles, net | 28,970 | 31,381 | 34,010 | 37,659 | 41,308 | |||||||||||||||
| Other assets | 1,603,469 | 1,496,630 | 1,432,532 | 1,355,451 | 1,208,261 | |||||||||||||||
| Total assets | $ | 44,302,981 | $ | 41,228,936 | $ | 41,404,592 | $ | 40,950,723 | $ | 39,249,639 | ||||||||||
| LIABILITIES: | ||||||||||||||||||||
| Noninterest-bearing deposits | $ | 7,030,759 | $ | 11,212,357 | $ | 12,775,756 | $ | 13,338,029 | $ | 14,057,051 | ||||||||||
| Interest-bearing deposits | 21,156,802 | 22,723,977 | 21,420,116 | 20,630,123 | 19,167,844 | |||||||||||||||
| Total deposits | 28,187,561 | 33,936,334 | 34,195,872 | 33,968,152 | 33,224,895 | |||||||||||||||
| Borrowings | 11,881,712 | 1,764,030 | 1,864,815 | 1,592,000 | 991,000 | |||||||||||||||
| Subordinated debt | 868,815 | 867,087 | 863,379 | 863,756 | 863,880 | |||||||||||||||
| Accrued interest payable and other liabilities | 593,416 | 710,954 | 604,581 | 548,412 | 519,269 | |||||||||||||||
| Total liabilities | 41,531,504 | 37,278,405 | 37,528,647 | 36,972,320 | 35,599,044 | |||||||||||||||
| STOCKHOLDERS' EQUITY (1) | 2,771,477 | 3,950,531 | 3,875,945 | 3,978,403 | 3,650,595 | |||||||||||||||
| Total liabilities and stockholders’ equity | $ | 44,302,981 | $ | 41,228,936 | $ | 41,404,592 | $ | 40,950,723 | $ | 39,249,639 | ||||||||||
| Book value per common share | $ | 18.90 | $ | 28.71 | $ | 28.07 | $ | 28.93 | $ | 30.52 | ||||||||||
| Tangible book value per common share (2) | $ | 18.66 | $ | 17.00 | $ | 16.11 | $ | 16.93 | $ | 18.42 | ||||||||||
| Common shares outstanding | 120,244,214 | 120,222,057 | 120,314,023 | 120,288,024 | 119,601,766 | |||||||||||||||
| (1) Includes net unrealized loss on: | ||||||||||||||||||||
| Securities available-for-sale, net | $ | (537,307 | ) | $ | (586,450 | ) | $ | (637,346 | ) | $ | (428,242 | ) | $ | (376,475 | ) | |||||
| Securities held to maturity | (198,753 | ) | (204,453 | ) | (210,868 | ) | (216,508 | ) | - | |||||||||||
| Total | $ | (736,060 | ) | $ | (790,903 | ) | $ | (848,214 | ) | $ | (644,750 | ) | $ | (376,475 | ) | |||||
| (2) Non-GAAP measure. | ||||||||||||||||||||
Page 19
PACWEST BANCORP AND SUBSIDIARIES
FIVE QUARTER STATEMENT OF EARNINGS (LOSS)
| Three Months Ended | ||||||||||||||||||||
| March 31, | December 31, | September 30, | June 30, | March 31, | ||||||||||||||||
| 2023 | 2022 | 2022 | 2022 | 2022 | ||||||||||||||||
| (In thousands, except per share amounts) | ||||||||||||||||||||
| Interest income: | ||||||||||||||||||||
| Loans and leases | $ | 430,685 | $ | 404,985 | $ | 346,550 | $ | 293,286 | $ | 267,759 | ||||||||||
| Investment securities | 44,237 | 50,292 | 53,135 | 52,902 | 53,422 | |||||||||||||||
| Deposits in financial institutions | 42,866 | 17,746 | 10,359 | 4,330 | 1,723 | |||||||||||||||
| Total interest income | 517,788 | 473,023 | 410,044 | 350,518 | 322,904 | |||||||||||||||
| Interest expense: | ||||||||||||||||||||
| Deposits | 155,892 | 117,591 | 61,288 | 15,362 | 6,208 | |||||||||||||||
| Borrowings | 69,122 | 19,962 | 3,081 | 2,441 | 161 | |||||||||||||||
| Subordinated debt | 13,502 | 12,531 | 10,494 | 8,790 | 7,818 | |||||||||||||||
| Total interest expense | 238,516 | 150,084 | 74,863 | 26,593 | 14,187 | |||||||||||||||
| Net interest income | 279,272 | 322,939 | 335,181 | 323,925 | 308,717 | |||||||||||||||
| Provision for credit losses | 3,000 | 10,000 | 3,000 | 11,500 | - | |||||||||||||||
| Net interest income after provision for credit losses | 276,272 | 312,939 | 332,181 | 312,425 | 308,717 | |||||||||||||||
| Noninterest income: | ||||||||||||||||||||
| Service charges on deposit accounts | 3,573 | 3,178 | 3,608 | 3,634 | 3,571 | |||||||||||||||
| Other commissions and fees | 10,344 | 11,208 | 10,034 | 10,813 | 11,580 | |||||||||||||||
| Leased equipment income | 13,857 | 12,322 | 12,835 | 12,335 | 13,094 | |||||||||||||||
| Gain on sale of loans and leases | 2,962 | 388 | 58 | 12 | 60 | |||||||||||||||
| Gain (loss) on sale of securities | - | (49,302 | ) | 86 | (1,209 | ) | 104 | |||||||||||||
| Dividends and gains (losses) on equity investments | 1,098 | 661 | 3,228 | 4,097 | (11,375 | ) | ||||||||||||||
| Warrant (loss) income | (333 | ) | (46 | ) | 292 | 1,615 | 629 | |||||||||||||
| Other income | 4,890 | 2,635 | 8,478 | 3,049 | 3,155 | |||||||||||||||
| Total noninterest income (loss) | 36,391 | (18,956 | ) | 38,619 | 34,346 | 20,818 | ||||||||||||||
| Noninterest expense: | ||||||||||||||||||||
| Compensation | 88,476 | 106,124 | 105,933 | 102,542 | 92,240 | |||||||||||||||
| Occupancy | 15,067 | 14,922 | 15,574 | 15,268 | 15,200 | |||||||||||||||
| Data processing | 10,938 | 9,722 | 9,568 | 9,258 | 9,629 | |||||||||||||||
| Other professional services | 6,073 | 6,924 | 10,674 | 6,726 | 5,954 | |||||||||||||||
| Insurance and assessments | 11,717 | 7,205 | 7,159 | 5,632 | 5,490 | |||||||||||||||
| Intangible asset amortization | 2,411 | 2,629 | 3,649 | 3,649 | 3,649 | |||||||||||||||
| Leased equipment depreciation | 9,375 | 8,627 | 8,908 | 8,934 | 9,189 | |||||||||||||||
| Foreclosed assets expense (income), net | 363 | (108 | ) | (248 | ) | (28 | ) | (3,353 | ) | |||||||||||
| Acquisition, integration and reorganization costs | 8,514 | 5,703 | - | - | - | |||||||||||||||
| Customer related expense | 24,005 | 18,197 | 12,673 | 11,748 | 12,655 | |||||||||||||||
| Loan expense | 6,524 | 6,150 | 6,228 | 7,037 | 5,157 | |||||||||||||||
| Goodwill impairment | 1,376,736 | 29,000 | - | - | - | |||||||||||||||
| Other expense | 12,804 | 11,737 | 15,500 | 12,879 | 11,616 | |||||||||||||||
| Total noninterest expense | 1,573,003 | 226,832 | 195,618 | 183,645 | 167,426 | |||||||||||||||
| (Loss) earnings before income taxes | (1,260,340 | ) | 67,151 | 175,182 | 163,126 | 162,109 | ||||||||||||||
| Income tax (benefit) expense | (64,916 | ) | 17,642 | 43,566 | 40,766 | 41,981 | ||||||||||||||
| Net (loss) earnings | (1,195,424 | ) | 49,509 | 131,616 | 122,360 | 120,128 | ||||||||||||||
| Preferred stock dividends | 9,947 | 9,947 | 9,392 | - | - | |||||||||||||||
| Net (loss) earnings available to common stockholders | $ | (1,205,371 | ) | $ | 39,562 | $ | 122,224 | $ | 122,360 | $ | 120,128 | |||||||||
| Basic and diluted (loss) earnings per common share | $ | (10.22 | ) | $ | 0.33 | $ | 1.02 | $ | 1.02 | $ | 1.01 | |||||||||
| Dividends declared and paid per common share | $ | 0.25 | $ | 0.25 | $ | 0.25 | $ | 0.25 | $ | 0.25 | ||||||||||
Page 20
PACWEST BANCORP AND SUBSIDIARIES
FIVE QUARTER SELECTED FINANCIAL DATA
| At or For the Three Months Ended | ||||||||||||||||||||
| March 31, | December 31, | September 30, | June 30, | March 31, | ||||||||||||||||
| 2023 | 2022 | 2022 | 2022 | 2022 | ||||||||||||||||
| (Dollars in thousands) | ||||||||||||||||||||
| Performance Ratios: | ||||||||||||||||||||
| Return on average assets (1) | (11.34 | )% | 0.48 | % | 1.28 | % | 1.23 | % | 1.22 | % | ||||||||||
| Pre-provision, pre-goodwill impairment, pre-tax net revenue ("PPNR") return on average assets (1)(2) | 1.13 | % | 1.02 | % | 1.73 | % | 1.75 | % | 1.65 | % | ||||||||||
| Return on average equity (1) | (121.24 | )% | 5.04 | % | 13.02 | % | 13.44 | % | 12.66 | % | ||||||||||
| Return on average tangible common equity (1)(2) | 14.45 | % | 12.71 | % | 23.93 | % | 24.24 | % | 20.77 | % | ||||||||||
| Efficiency ratio | 58.2 | % | 53.3 | % | 51.0 | % | 49.5 | % | 50.1 | % | ||||||||||
| Noninterest expense as a percentage of average assets (1) | 14.92 | % | 2.19 | % | 1.90 | % | 1.84 | % | 1.70 | % | ||||||||||
| Average Yields/Costs (1): | ||||||||||||||||||||
| Yield on: | ||||||||||||||||||||
| Average loans and leases (3) | 6.14 | % | 5.73 | % | 5.12 | % | 4.65 | % | 4.66 | % | ||||||||||
| Average investment securities (3) | 2.50 | % | 2.57 | % | 2.45 | % | 2.32 | % | 2.17 | % | ||||||||||
| Average interest-earning assets (3) | 5.35 | % | 4.98 | % | 4.36 | % | 3.85 | % | 3.59 | % | ||||||||||
| Cost of: | ||||||||||||||||||||
| Average interest-bearing deposits | 2.91 | % | 2.14 | % | 1.15 | % | 0.31 | % | 0.13 | % | ||||||||||
| Average total deposits | 1.98 | % | 1.37 | % | 0.70 | % | 0.18 | % | 0.07 | % | ||||||||||
| Average interest-bearing liabilities | 3.47 | % | 2.45 | % | 1.32 | % | 0.49 | % | 0.27 | % | ||||||||||
| Net interest spread (3) | 1.88 | % | 2.53 | % | 3.04 | % | 3.36 | % | 3.32 | % | ||||||||||
| Net interest margin (3) | 2.89 | % | 3.41 | % | 3.57 | % | 3.56 | % | 3.43 | % | ||||||||||
| Average Balances: | ||||||||||||||||||||
| Assets: | ||||||||||||||||||||
| Loans and leases, net of deferred fees | $ | 28,583,265 | $ | 28,192,953 | $ | 27,038,873 | $ | 25,499,773 | $ | 23,433,019 | ||||||||||
| Investment securities | 7,191,362 | 7,824,915 | 8,803,349 | 9,488,653 | 10,397,709 | |||||||||||||||
| Deposits in financial institutions | 3,682,228 | 1,881,950 | 1,809,809 | 1,984,751 | 3,083,159 | |||||||||||||||
| Interest-earning assets | 39,456,855 | 37,899,818 | 37,652,031 | 36,973,177 | 36,913,887 | |||||||||||||||
| Total assets | 42,768,714 | 41,151,963 | 40,841,272 | 40,031,891 | 39,883,304 | |||||||||||||||
| Liabilities: | ||||||||||||||||||||
| Noninterest-bearing deposits | 10,233,434 | 12,325,902 | 13,653,177 | 13,987,398 | 14,463,667 | |||||||||||||||
| Interest-bearing deposits | 21,742,403 | 21,760,402 | 21,214,265 | 19,661,618 | 19,868,395 | |||||||||||||||
| Total deposits | 31,975,837 | 34,086,304 | 34,867,442 | 33,649,016 | 34,332,062 | |||||||||||||||
| Borrowings | 5,289,429 | 1,675,738 | 505,482 | 1,356,616 | 298,444 | |||||||||||||||
| Subordinated debt | 867,637 | 864,581 | 863,719 | 863,653 | 863,572 | |||||||||||||||
| Interest-bearing liabilities | 27,899,469 | 24,300,721 | 22,583,466 | 21,881,887 | 21,030,411 | |||||||||||||||
| Stockholders' equity | 3,998,687 | 3,898,800 | 4,011,179 | 3,652,368 | 3,847,481 | |||||||||||||||
| (1) | Annualized. |
| (2) | Non-GAAP measure. |
| (3) | Tax equivalent. |
Page 21
PACWEST BANCORP AND SUBSIDIARIES
FIVE QUARTER SELECTED FINANCIAL DATA
| At or For the Three Months Ended | ||||||||||||||||||||
| March 31, | December 31, | September 30, | June 30, | March 31, | ||||||||||||||||
| 2023 | 2022 | 2022 | 2022 | 2022 | ||||||||||||||||
| (Dollars in thousands, except per share amounts) | ||||||||||||||||||||
| Credit Quality Metrics for Loans and Leases Held for Investment: | ||||||||||||||||||||
| Nonaccrual loans and leases | $ | 87,124 | $ | 103,778 | $ | 89,742 | $ | 78,527 | $ | 66,538 | ||||||||||
| Nonperforming assets | 89,259 | 108,800 | 92,709 | 78,527 | 66,842 | |||||||||||||||
| Special mention loans and leases | 580,153 | 566,259 | 463,994 | 480,261 | 377,315 | |||||||||||||||
| Classified loans and leases | 132,423 | 118,271 | 96,685 | 104,264 | 82,068 | |||||||||||||||
| Allowance for loan and lease losses | 210,055 | 200,732 | 189,327 | 188,705 | 197,398 | |||||||||||||||
| Allowance for credit losses | 285,626 | 291,803 | 284,398 | 283,776 | 272,469 | |||||||||||||||
| For the quarter: | ||||||||||||||||||||
| Provision for credit losses | 3,000 | 10,000 | 3,000 | 10,000 | - | |||||||||||||||
| Net charge-offs (recoveries) | 9,177 | 2,595 | 2,378 | (1,307 | ) | 1,166 | ||||||||||||||
| Nonaccrual loans and leases to loans and leases | 0.34 | % | 0.36 | % | 0.32 | % | 0.30 | % | 0.27 | % | ||||||||||
| Nonperforming assets to loans and leases and foreclosed assets | 0.35 | % | 0.38 | % | 0.34 | % | 0.30 | % | 0.27 | % | ||||||||||
| Special mention loans and leases to loans and leases | 2.26 | % | 1.98 | % | 1.68 | % | 1.81 | % | 1.55 | % | ||||||||||
| Classified loans and leases to loans and leases | 0.52 | % | 0.41 | % | 0.35 | % | 0.39 | % | 0.34 | % | ||||||||||
| Allowance for loan and lease losses to loans and leases | 0.82 | % | 0.70 | % | 0.68 | % | 0.71 | % | 0.81 | % | ||||||||||
| Allowance for credit losses to loans and leases | 1.11 | % | 1.02 | % | 1.03 | % | 1.07 | % | 1.12 | % | ||||||||||
| Allowance for credit losses to nonaccrual loans and leases | 327.84 | % | 281.18 | % | 316.91 | % | 361.37 | % | 409.49 | % | ||||||||||
| Net charge-offs (recoveries) to average loans and leases | 0.13 | % | 0.04 | % | 0.03 | % | (0.02 | )% | 0.02 | % | ||||||||||
| Trailing 12 months net charge-offs (recoveries) to average loans and leases | 0.05 | % | 0.02 | % | 0.01 | % | 0.00 | % | (0.02 | )% | ||||||||||
| PacWest Bancorp Consolidated: | ||||||||||||||||||||
| Common equity tier 1 capital ratio (1) | 9.22 | % | 8.70 | % | 8.56 | % | 8.24 | % | 8.64 | % | ||||||||||
| Tier 1 capital ratio (1) | 11.16 | % | 10.61 | % | 10.46 | % | 10.15 | % | 9.07 | % | ||||||||||
| Total capital ratio (1) | 14.22 | % | 13.61 | % | 13.43 | % | 13.12 | % | 12.27 | % | ||||||||||
| Tier 1 leverage capital ratio (1) | 8.33 | % | 8.61 | % | 8.63 | % | 8.52 | % | 7.11 | % | ||||||||||
| Risk-weighted assets (1) | $ | 32,488,956 | $ | 33,030,960 | $ | 33,042,173 | $ | 33,009,455 | $ | 30,297,312 | ||||||||||
| Equity to assets ratio | 6.26 | % | 9.58 | % | 9.36 | % | 9.72 | % | 9.30 | % | ||||||||||
| Tangible common equity ratio (2) | 5.07 | % | 5.13 | % | 4.85 | % | 5.15 | % | 5.83 | % | ||||||||||
| Book value per common share | $ | 18.90 | $ | 28.71 | $ | 28.07 | $ | 28.93 | $ | 30.52 | ||||||||||
| Tangible book value per common share (2) | $ | 18.66 | $ | 17.00 | $ | 16.11 | $ | 16.93 | $ | 18.42 | ||||||||||
| Pacific Western Bank: | ||||||||||||||||||||
| Common equity tier 1 capital ratio (1) | 10.89 | % | 10.32 | % | 10.17 | % | 9.78 | % | 9.32 | % | ||||||||||
| Tier 1 capital ratio (1) | 10.89 | % | 10.32 | % | 10.17 | % | 9.78 | % | 9.32 | % | ||||||||||
| Total capital ratio (1) | 12.94 | % | 12.34 | % | 12.16 | % | 11.77 | % | 11.45 | % | ||||||||||
| Tier 1 leverage capital ratio (1) | 8.14 | % | 8.39 | % | 8.39 | % | 8.21 | % | 7.31 | % | ||||||||||
| (1) | Capital information for March 31, 2023 is preliminary. |
| (2) | Non-GAAP measure. |
Page 22
GAAP TO NON-GAAP RECONCILIATIONS
This press release contains certain non-GAAP financial disclosures for: (1) Pre-provision, pre-goodwill impairment, pre-tax net revenue (“PPNR”), (2) PPNR return on average assets (3) return on average tangible common equity, (4) tangible common equity ratio, and (5) tangible book value per common share. The Company uses these non-GAAP financial measures to provide meaningful supplemental information regarding the Company’s operational performance and to enhance investors’ overall understanding of such financial performance. In particular, the use of PPNR, return on average tangible common equity, tangible common equity ratio, and tangible book value per common share is prevalent among banking regulators, investors, and analysts. Accordingly, we disclose the non-GAAP measures in addition to the related GAAP measures of: (1) net earnings, (2) return on average assets, (3) return on average equity, (4) equity to assets ratio, and (5) book value per common share.
The Company recorded significant non-operating charges in the three months ended March 31, 2023 and December 31, 2022. Thus, to supplement information regarding the Company’s operational performance and to enhance investors’ overall understanding of such performance, this press release includes non-GAAP financial measures for (1) adjusted return on average tangible common equity, (2) adjusted earnings, (3) adjusted earnings per share, and (4) adjusted return on average assets. These measures help the reader to compare the recent periods with the historical periods more readily. These non-GAAP financial measures should not be considered a substitute for financial measures presented in accordance with GAAP and may be different from the non-GAAP financial measures used by other companies.
The tables below present the reconciliations of these GAAP financial measures to the related non-GAAP financial measures:
| Three Months Ended | ||||||||||||
| PPNR and PPNR Return | March 31, | December 31, | March 31, | |||||||||
| on Average Assets | 2023 | 2022 | 2022 | |||||||||
| (Dollars in thousands) | ||||||||||||
| Net (loss) earnings | $ | (1,195,424 | ) | $ | 49,509 | $ | 120,128 | |||||
| Net interest income | $ | 279,272 | $ | 322,939 | $ | 308,717 | ||||||
| Add: Noninterest income (loss) | 36,391 | (18,956 | ) | 20,818 | ||||||||
| Less: Noninterest expense | (1,573,003 | ) | (226,832 | ) | (167,426 | ) | ||||||
| Add: Goodwill impairment | 1,376,736 | 29,000 | - | |||||||||
| Pre-provision, pre-goodwill impairment, pre-tax net revenue ("PPNR") | $ | 119,396 | $ | 106,151 | $ | 162,109 | ||||||
| Average assets | $ | 42,768,714 | $ | 41,151,963 | $ | 39,883,304 | ||||||
| Return on average assets (1) | (11.34 | )% | 0.48 | % | 1.22 | % | ||||||
| PPNR return on average assets (2) | 1.13 | % | 1.02 | % | 1.65 | % | ||||||
| (1) | Annualized net earnings divided by average assets. |
| (2) | Annualized PPNR divided by average assets. |
Page 23
| Three Months Ended | ||||||||||||
| Return on Average | March 31, | December 31, | March 31, | |||||||||
| Tangible Common Equity | 2023 | 2022 | 2022 | |||||||||
| (Dollars in thousands) | ||||||||||||
| Net (loss) earnings | $ | (1,195,424 | ) | $ | 49,509 | $ | 120,128 | |||||
| (Loss) earnings before income taxes | $ | (1,260,340 | ) | $ | 67,151 | $ | 162,109 | |||||
| Add: Goodwill impairment | 1,376,736 | 29,000 | - | |||||||||
| Add: Intangible asset amortization | 2,411 | 2,629 | 3,649 | |||||||||
| Adjusted earnings before income taxes | 118,807 | 98,780 | 165,758 | |||||||||
| Adjusted income tax expense (1) | 33,741 | 25,979 | 42,931 | |||||||||
| Adjusted net earnings | 85,066 | 72,801 | 122,827 | |||||||||
| Less: Preferred stock dividends | 9,947 | 9,947 | - | |||||||||
| Adjusted net earnings available to common stockholders | $ | 75,119 | $ | 62,854 | $ | 122,827 | ||||||
| Average stockholders' equity | $ | 3,998,687 | $ | 3,898,800 | $ | 3,847,481 | ||||||
| Less: Average intangible assets | 1,391,857 | 1,438,173 | 1,449,056 | |||||||||
| Less: Average preferred stock | 498,516 | 498,516 | - | |||||||||
| Average tangible common equity | $ | 2,108,314 | $ | 1,962,111 | $ | 2,398,425 | ||||||
| Return on average equity (2) | (121.24 | )% | 5.04 | % | 12.66 | % | ||||||
| Return on average tangible common equity (3) | 14.45 | % | 12.71 | % | 20.77 | % | ||||||
| (1) | Adjusted effective tax rate of 28.4% used for three months ended March 31, 2023; effective tax rates of 26.3% and 25.9% used for three months ended December 31, 2022 and March 31, 2022. |
| (2) | Annualized net (loss) earnings divided by average stockholders' equity. |
| (3) | Annualized adjusted net earnings available to common stockholders divided by average tangible common equity. |
Page 24
| Three Months Ended | ||||||||||||
| Adjusted Return on Average | March 31, | December 31, | March 31, | |||||||||
| Tangible Common Equity | 2023 | 2022 | 2022 | |||||||||
| (Dollars in thousands) | ||||||||||||
| (Loss) earnings before income taxes | $ | (1,260,340 | ) | $ | 67,151 | $ | 162,109 | |||||
| Add: Goodwill impairment | 1,376,736 | 29,000 | - | |||||||||
| Add: Intangible asset amortization | 2,411 | 2,629 | 3,649 | |||||||||
| Add: Acquisition, integration, and reorganization costs | 8,514 | 5,703 | - | |||||||||
| Adjusted earnings before income taxes | 127,321 | 104,483 | 165,758 | |||||||||
| Adjusted income tax expense (1) | 36,159 | 27,479 | 42,931 | |||||||||
| Adjusted net earnings | 91,162 | 77,004 | 122,827 | |||||||||
| Less: Preferred stock dividends | 9,947 | 9,947 | - | |||||||||
| Adjusted net earnings available to common stockholders | $ | 81,215 | $ | 67,057 | $ | 122,827 | ||||||
| Average stockholders' equity | $ | 3,998,687 | $ | 3,898,800 | $ | 3,847,481 | ||||||
| Less: Average intangible assets | 1,391,857 | 1,438,173 | 1,449,056 | |||||||||
| Less: Average preferred stock | 498,516 | 498,516 | - | |||||||||
| Average tangible common equity | $ | 2,108,314 | $ | 1,962,111 | $ | 2,398,425 | ||||||
| Adjusted return on average tangible common equity (2) | 15.62 | % | 13.56 | % | 20.77 | % | ||||||
| (1) | Adjusted effective tax rate of 28.4% used for three months ended March 31, 2023; effective tax rates of 26.3% and 25.9% used for three months ended December 31, 2022 and March 31, 2022. |
| (2) | Annualized adjusted net earnings available to common stockholders divided by average tangible common equity. |
Page 25
| Tangible Common Equity Ratio/ | ||||||||||||||||||||
| Tangible Book Value Per | March 31, | December 31, | September 30, | June 30, | March 31, | |||||||||||||||
| Common Share | 2023 | 2022 | 2022 | 2022 | 2022 | |||||||||||||||
| (Dollars in thousands, except per share amounts) | ||||||||||||||||||||
| Stockholders' equity | $ | 2,771,477 | $ | 3,950,531 | $ | 3,875,945 | $ | 3,978,403 | $ | 3,650,595 | ||||||||||
| Less: Preferred stock | 498,516 | 498,516 | 498,516 | 498,516 | - | |||||||||||||||
| Total common equity | 2,272,961 | 3,452,015 | 3,377,429 | 3,479,887 | 3,650,595 | |||||||||||||||
| Less: Intangible assets | 28,970 | 1,408,117 | 1,439,746 | 1,443,395 | 1,447,044 | |||||||||||||||
| Tangible common equity | 2,243,991 | 2,043,898 | 1,937,683 | 2,036,492 | 2,203,551 | |||||||||||||||
| Add: Accumulated other comprehensive loss | 736,060 | 790,903 | 848,214 | 644,750 | 376,475 | |||||||||||||||
| Adjusted tangible common equity | $ | 2,980,051 | $ | 2,834,801 | $ | 2,785,897 | $ | 2,681,242 | $ | 2,580,026 | ||||||||||
| Total assets | $ | 44,302,981 | $ | 41,228,936 | $ | 41,404,592 | $ | 40,950,723 | $ | 39,249,639 | ||||||||||
| Less: Intangible assets | 28,970 | 1,408,117 | 1,439,746 | 1,443,395 | 1,447,044 | |||||||||||||||
| Tangible assets | $ | 44,274,011 | $ | 39,820,819 | $ | 39,964,846 | $ | 39,507,328 | $ | 37,802,595 | ||||||||||
| Equity to assets ratio | 6.26 | % | 9.58 | % | 9.36 | % | 9.72 | % | 9.30 | % | ||||||||||
| Tangible common equity ratio (1) | 5.07 | % | 5.13 | % | 4.85 | % | 5.15 | % | 5.83 | % | ||||||||||
| Tangible common equity ratio, excluding AOCI (2) | 6.73 | % | 7.12 | % | 6.97 | % | 6.79 | % | 6.82 | % | ||||||||||
| Book value per common share (3) | $ | 18.90 | $ | 28.71 | $ | 28.07 | $ | 28.93 | $ | 30.52 | ||||||||||
| Tangible book value per common share (4) | $ | 18.66 | $ | 17.00 | $ | 16.11 | $ | 16.93 | $ | 18.42 | ||||||||||
| Tangible book value per common share, excluding AOCI (5) | $ | 24.78 | $ | 23.58 | $ | 23.16 | $ | 22.29 | $ | 21.57 | ||||||||||
| Common shares outstanding | 120,244,214 | 120,222,057 | 120,314,023 | 120,288,024 | 119,601,766 | |||||||||||||||
| (1) | Tangible common equity divided by tangible assets. |
| (2) | Adjusted tangible common equity divided by tangible assets. |
| (3) | Total common equity divided by common shares outstanding. |
| (4) | Tangible common equity divided by common shares outstanding. |
| (5) | Adjusted tangible common equity divided by common shares outstanding. |
Page 26
| Three Months Ended | ||||||||||||
| Adjusted Earnings, Earnings Per | March 31, | December 31, | March 31, | |||||||||
| Share, and Return on Average Assets | 2023 | 2022 | 2022 | |||||||||
| (In thousands, except per share amounts) | ||||||||||||
| (Loss) earnings before income taxes | $ | (1,260,340 | ) | $ | 67,151 | $ | 162,109 | |||||
| Add: Goodwill impairment | 1,376,736 | 29,000 | - | |||||||||
| Add: Acquisition, integration, and reorganization costs | 8,514 | 5,703 | - | |||||||||
| Adjusted earnings before income taxes | 124,910 | 101,854 | 162,109 | |||||||||
| Adjusted income tax expense (1) | 35,474 | 26,788 | 41,981 | |||||||||
| Adjusted earnings | 89,436 | 75,066 | 120,128 | |||||||||
| Less: Preferred stock dividends | (9,947 | ) | (9,947 | ) | - | |||||||
| Adjusted earnings available to common stockholders | 79,489 | 65,119 | 120,128 | |||||||||
| Less: Earnings allocated to unvested restricted stock | (1,210 | ) | (1,183 | ) | (2,037 | ) | ||||||
| Adjusted earnings allocated to common shares | $ | 78,279 | $ | 63,936 | $ | 118,091 | ||||||
| Weighted average shares outstanding | 117,930 | 117,811 | 117,349 | |||||||||
| Adjusted diluted earnings per common share (2) | $ | 0.66 | $ | 0.54 | $ | 1.01 | ||||||
| Average assets | $ | 42,768,714 | $ | 41,151,963 | $ | 39,883,304 | ||||||
| Adjusted return on average assets (3) | 0.85 | % | 0.72 | % | 1.22 | % | ||||||
| (1) | Adjusted effective tax rate of 28.4% used for three months ended March 31, 2023; effective tax rates of 26.3% and 25.9% used for three months ended December 31, 2022 and March 31, 2022. |
| (2) | Adjusted earnings allocated to common shares divided by weighted average shares outstanding. |
| (3) | Annualized adjusted earnings divided by average assets. |
CONTACTS
Kevin L. Thompson Executive Vice President, Chief Financial Officer 303.802.8934 |
William J. Black Executive Vice President, Strategy and Corporate Development 919.597.7466 |
Page 27
Exhibit 99.2

Investor Presentation April 25, 2023
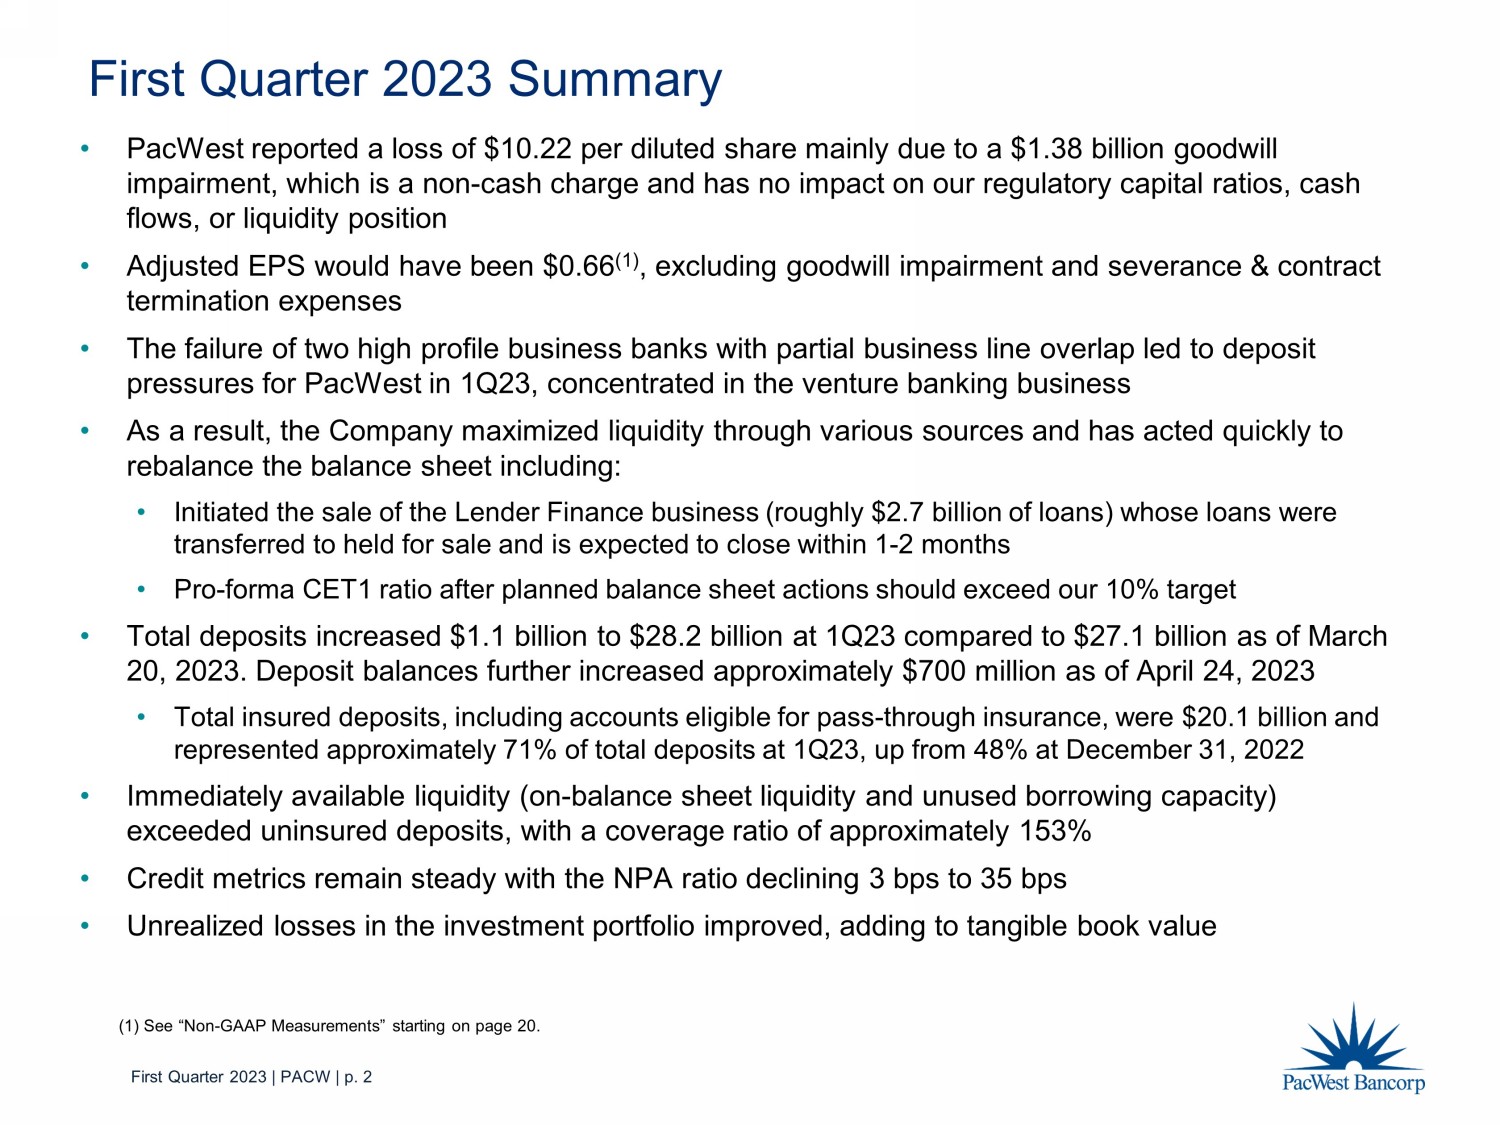
First Quarter 2023 | PACW | p. 2 • PacWest reported a loss of $10.22 per diluted share mainly due to a $1.38 billion goodwill impairment, which is a non - cash charge and has no impact on our regulatory capital ratios, cash flows, or liquidity position • Adjusted EPS would have been $ 0.66 (1) , excluding goodwill impairment and severance & contract termination expenses • The failure of two high profile business banks with partial business line overlap led to deposit pressures for PacWest in 1Q23, concentrated in the venture banking business • As a result, the Company maximized liquidity through various sources and has acted quickly to rebalance the balance sheet including: • Initiated the sale of the Lender Finance business (roughly $ 2.7 billion of loans) whose loans were transferred to held for sale and is expected to close within 1 - 2 months • Pro - forma CET1 ratio after planned balance sheet actions should exceed our 10% target • Total deposits increased $1.1 billion to $28.2 billion at 1Q23 compared to $27.1 billion as of March 20, 2023. Deposit balances further increased approximately $600 million as of April 21, 2023 • Total insured deposits, including accounts eligible for pass - through insurance, were $20.1 billion and represented approximately 71% of total deposits at 1Q23, up from 48% at December 31, 2022 • Immediately available liquidity (on - balance sheet liquidity and unused borrowing capacity) exceeded uninsured deposits, with a coverage ratio of approximately 153% • Credit metrics remain steady with the NPA ratio declining 3 bps to 35 bps • Unrealized losses in the investment portfolio improved, adding to tangible book value First Quarter 2023 Summary (1) See “Non - GAAP Measurements” starting on page 20.
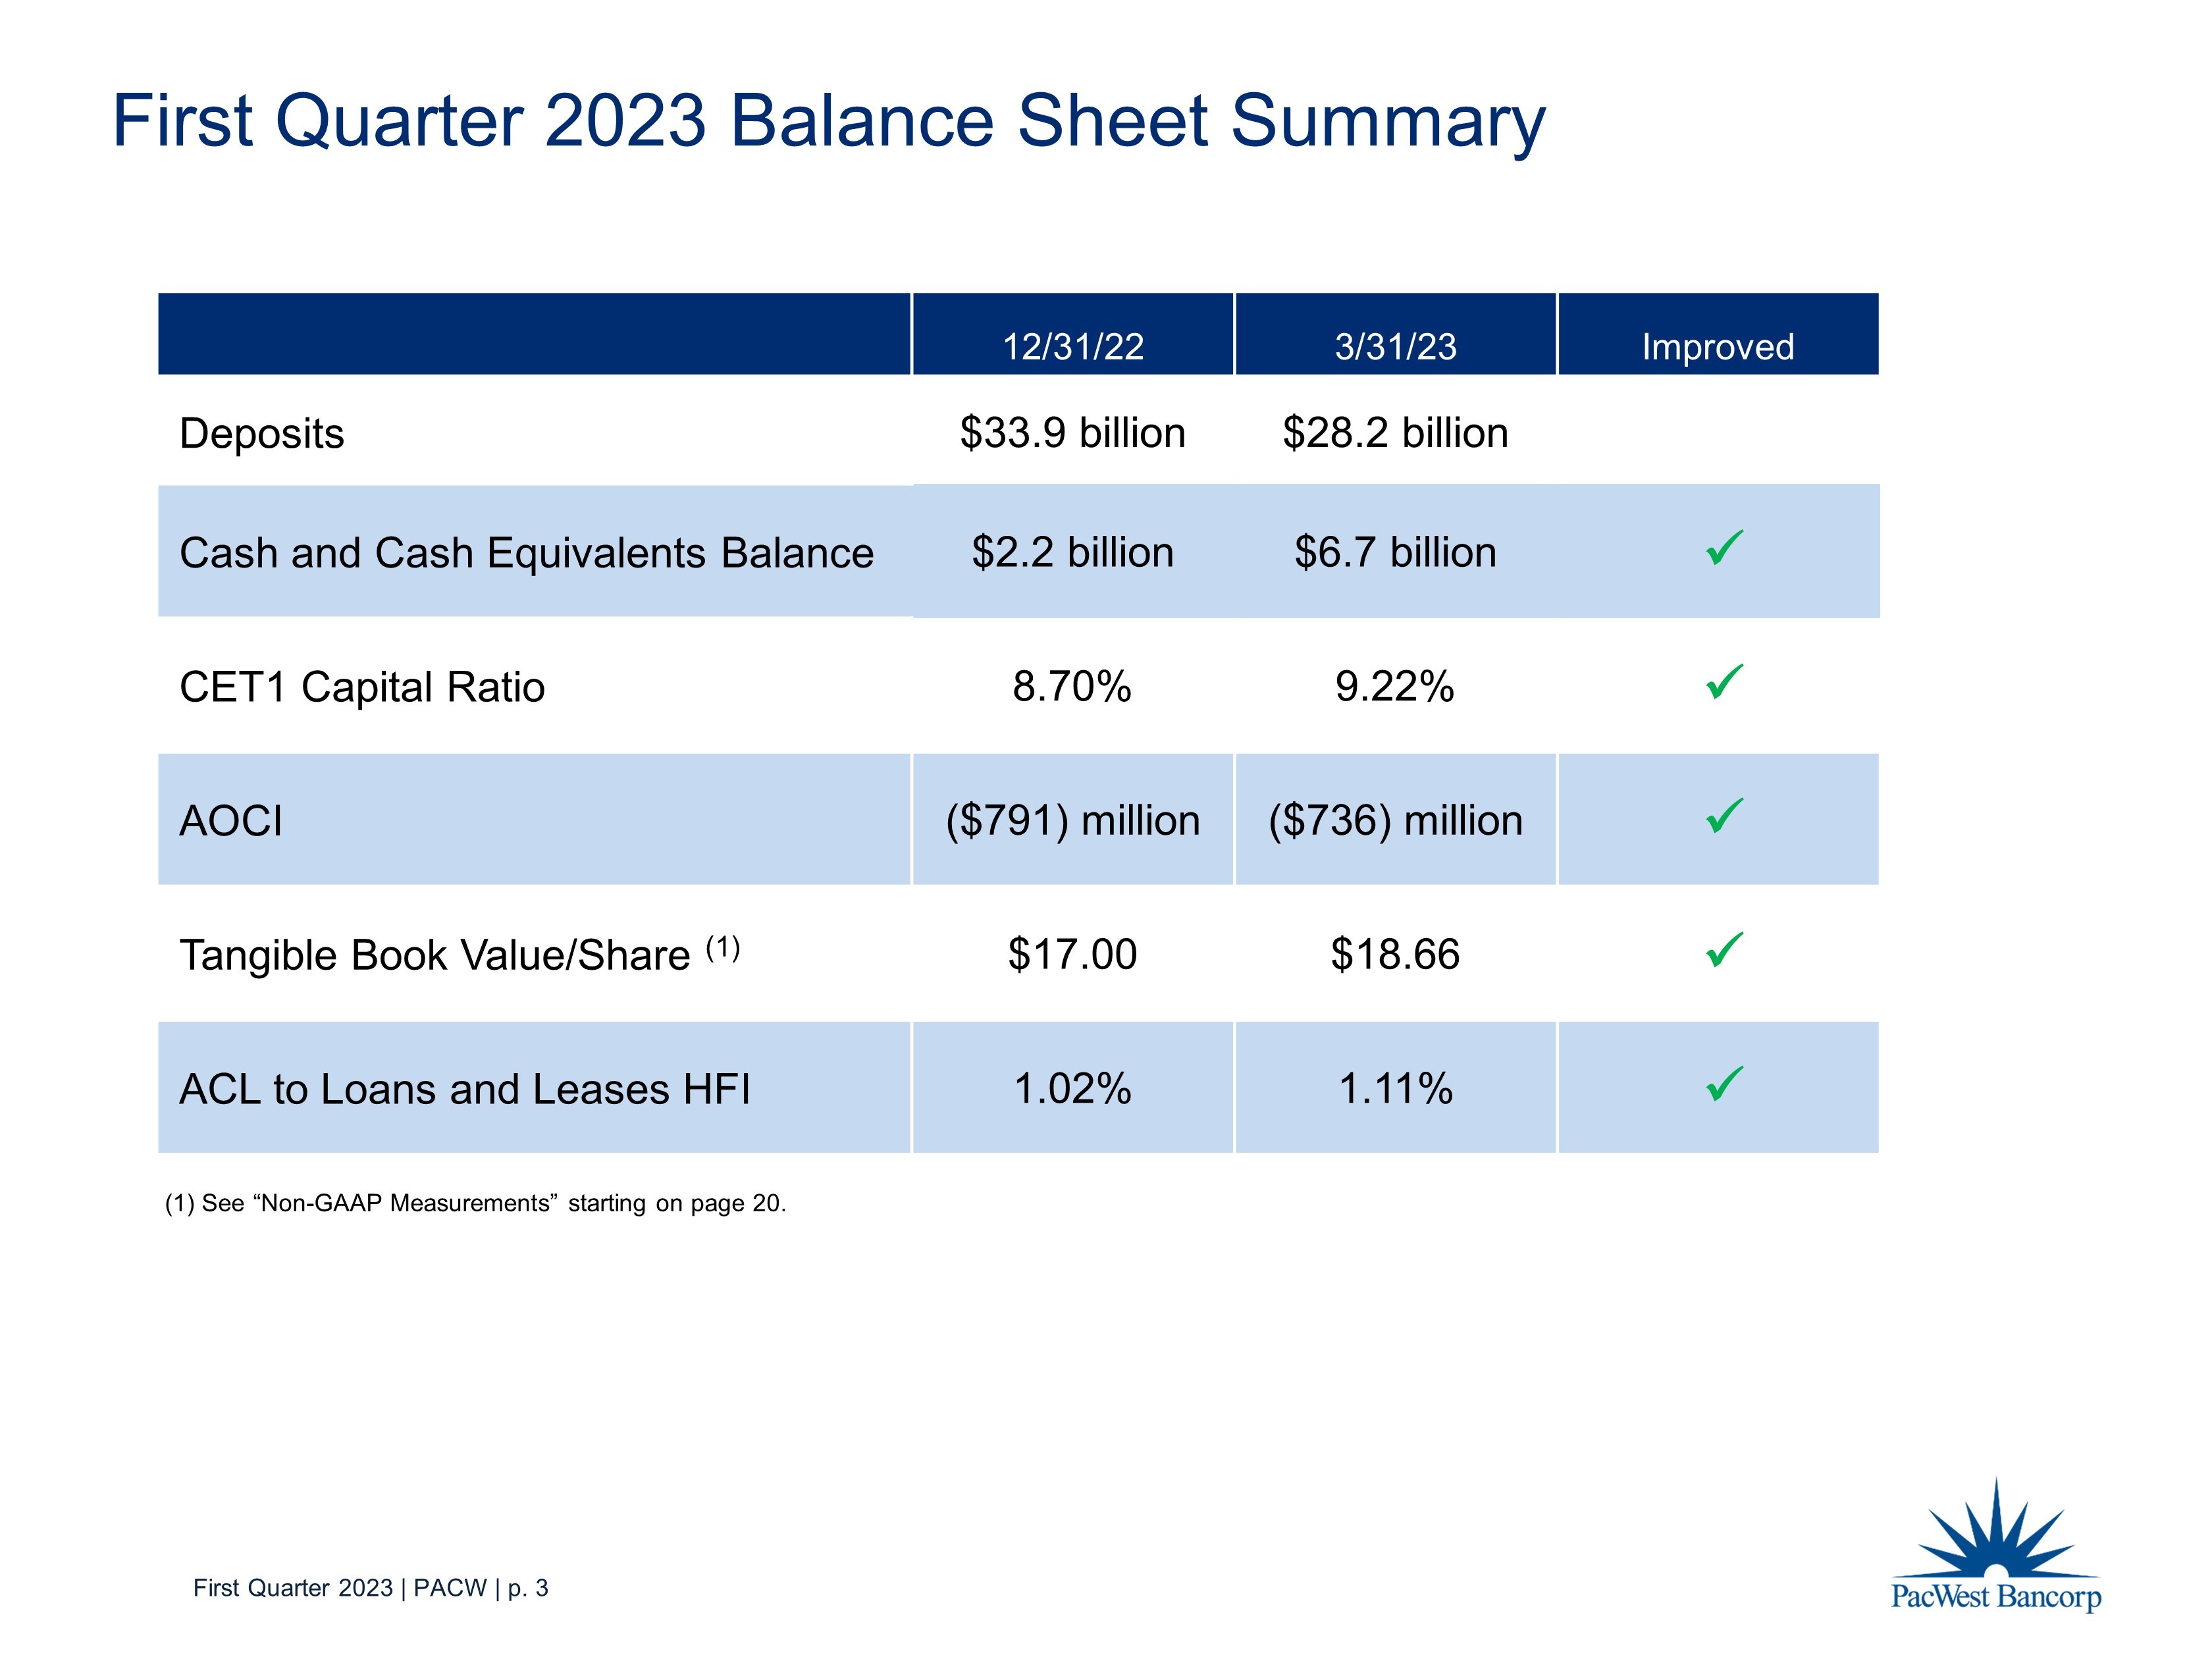
First Quarter 2023 | PACW | p. 3 First Quarter 2023 Balance Sheet Summary 12/31/22 3/31/23 Improved Deposits $33.9 billion $28.2 billion Cash and Cash Equivalents Balance $2.2 billion $6.7 billion x CET1 Capital Ratio 8.70% 9.22% x AOCI ($791) million ($736) million x Tangible Book Value/Share (1) $17.00 $18.66 x ACL to Loans and Leases HFI 1.02% 1.11% x (1) See “Non - GAAP Measurements” starting on page 20.
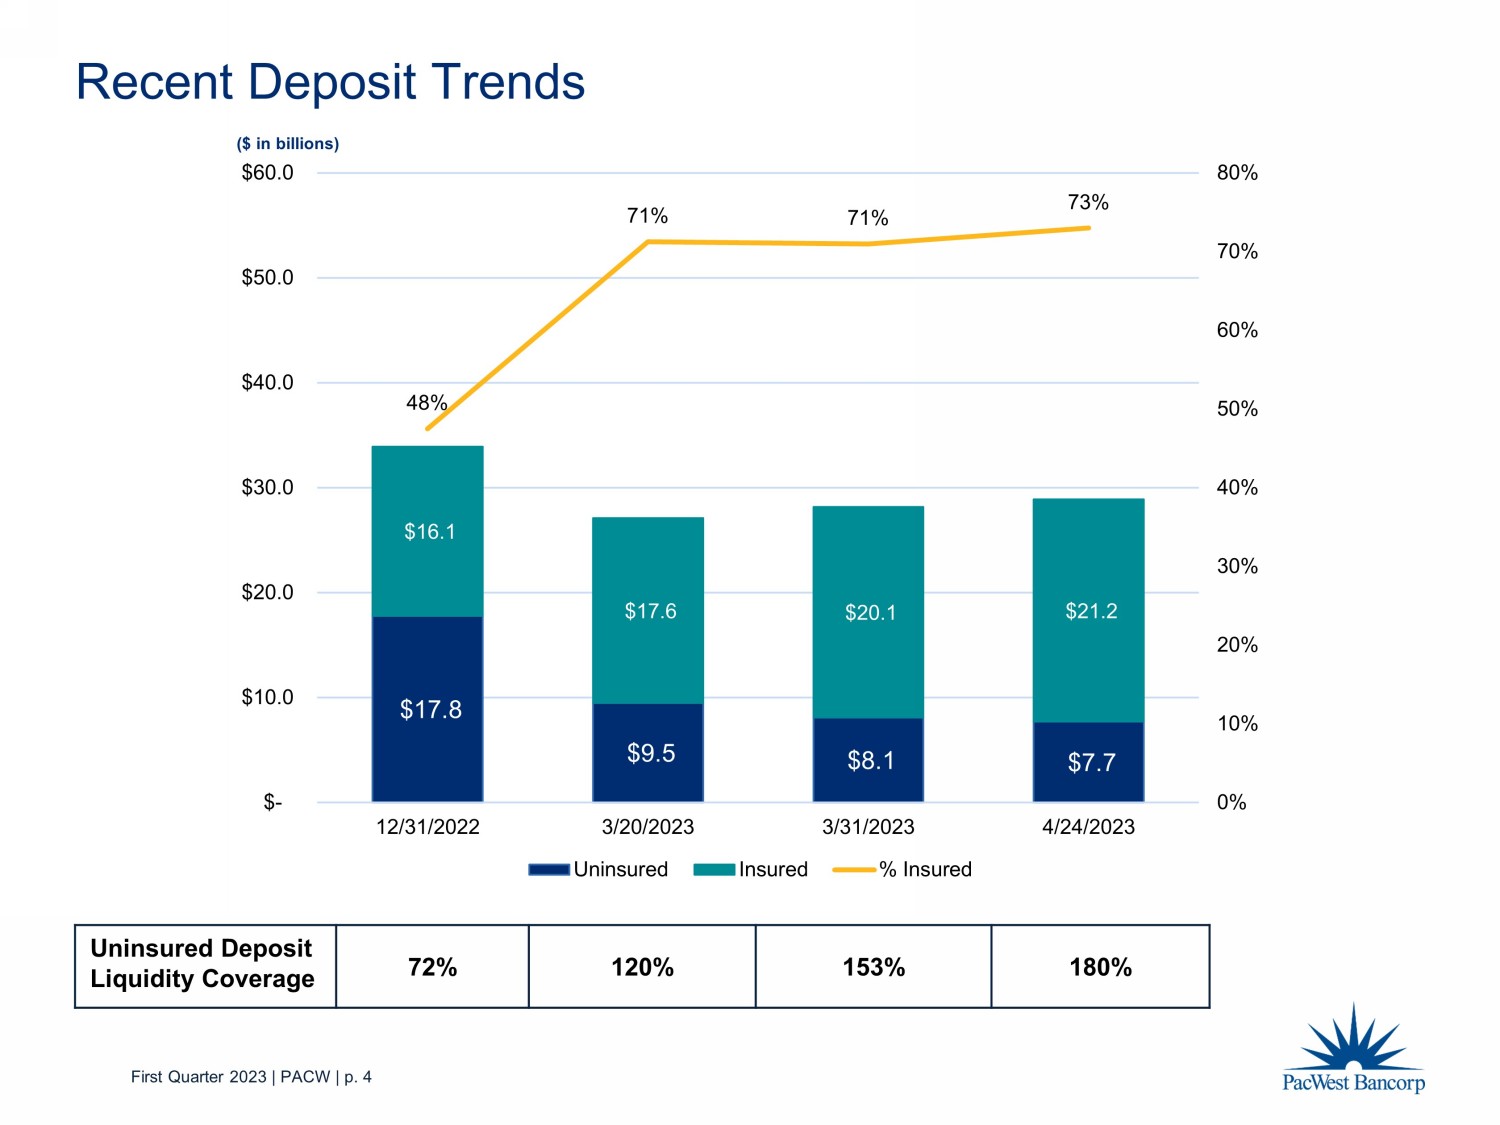
First Quarter 2023 | PACW | p. 4 Recent Deposit Trends $17.8 $9.5 $8.1 $7.7 $16.1 $17.6 $20.1 $21.1 48% 71% 71% 73% 0% 10% 20% 30% 40% 50% 60% 70% 80% $- $10.0 $20.0 $30.0 $40.0 $50.0 $60.0 12/31/2022 3/20/2023 3/31/2023 4/18/2023 Uninsured Insured % Insured Uninsured Deposit Liquidity Coverage 72% 120% 153% 182% ($ in billions)
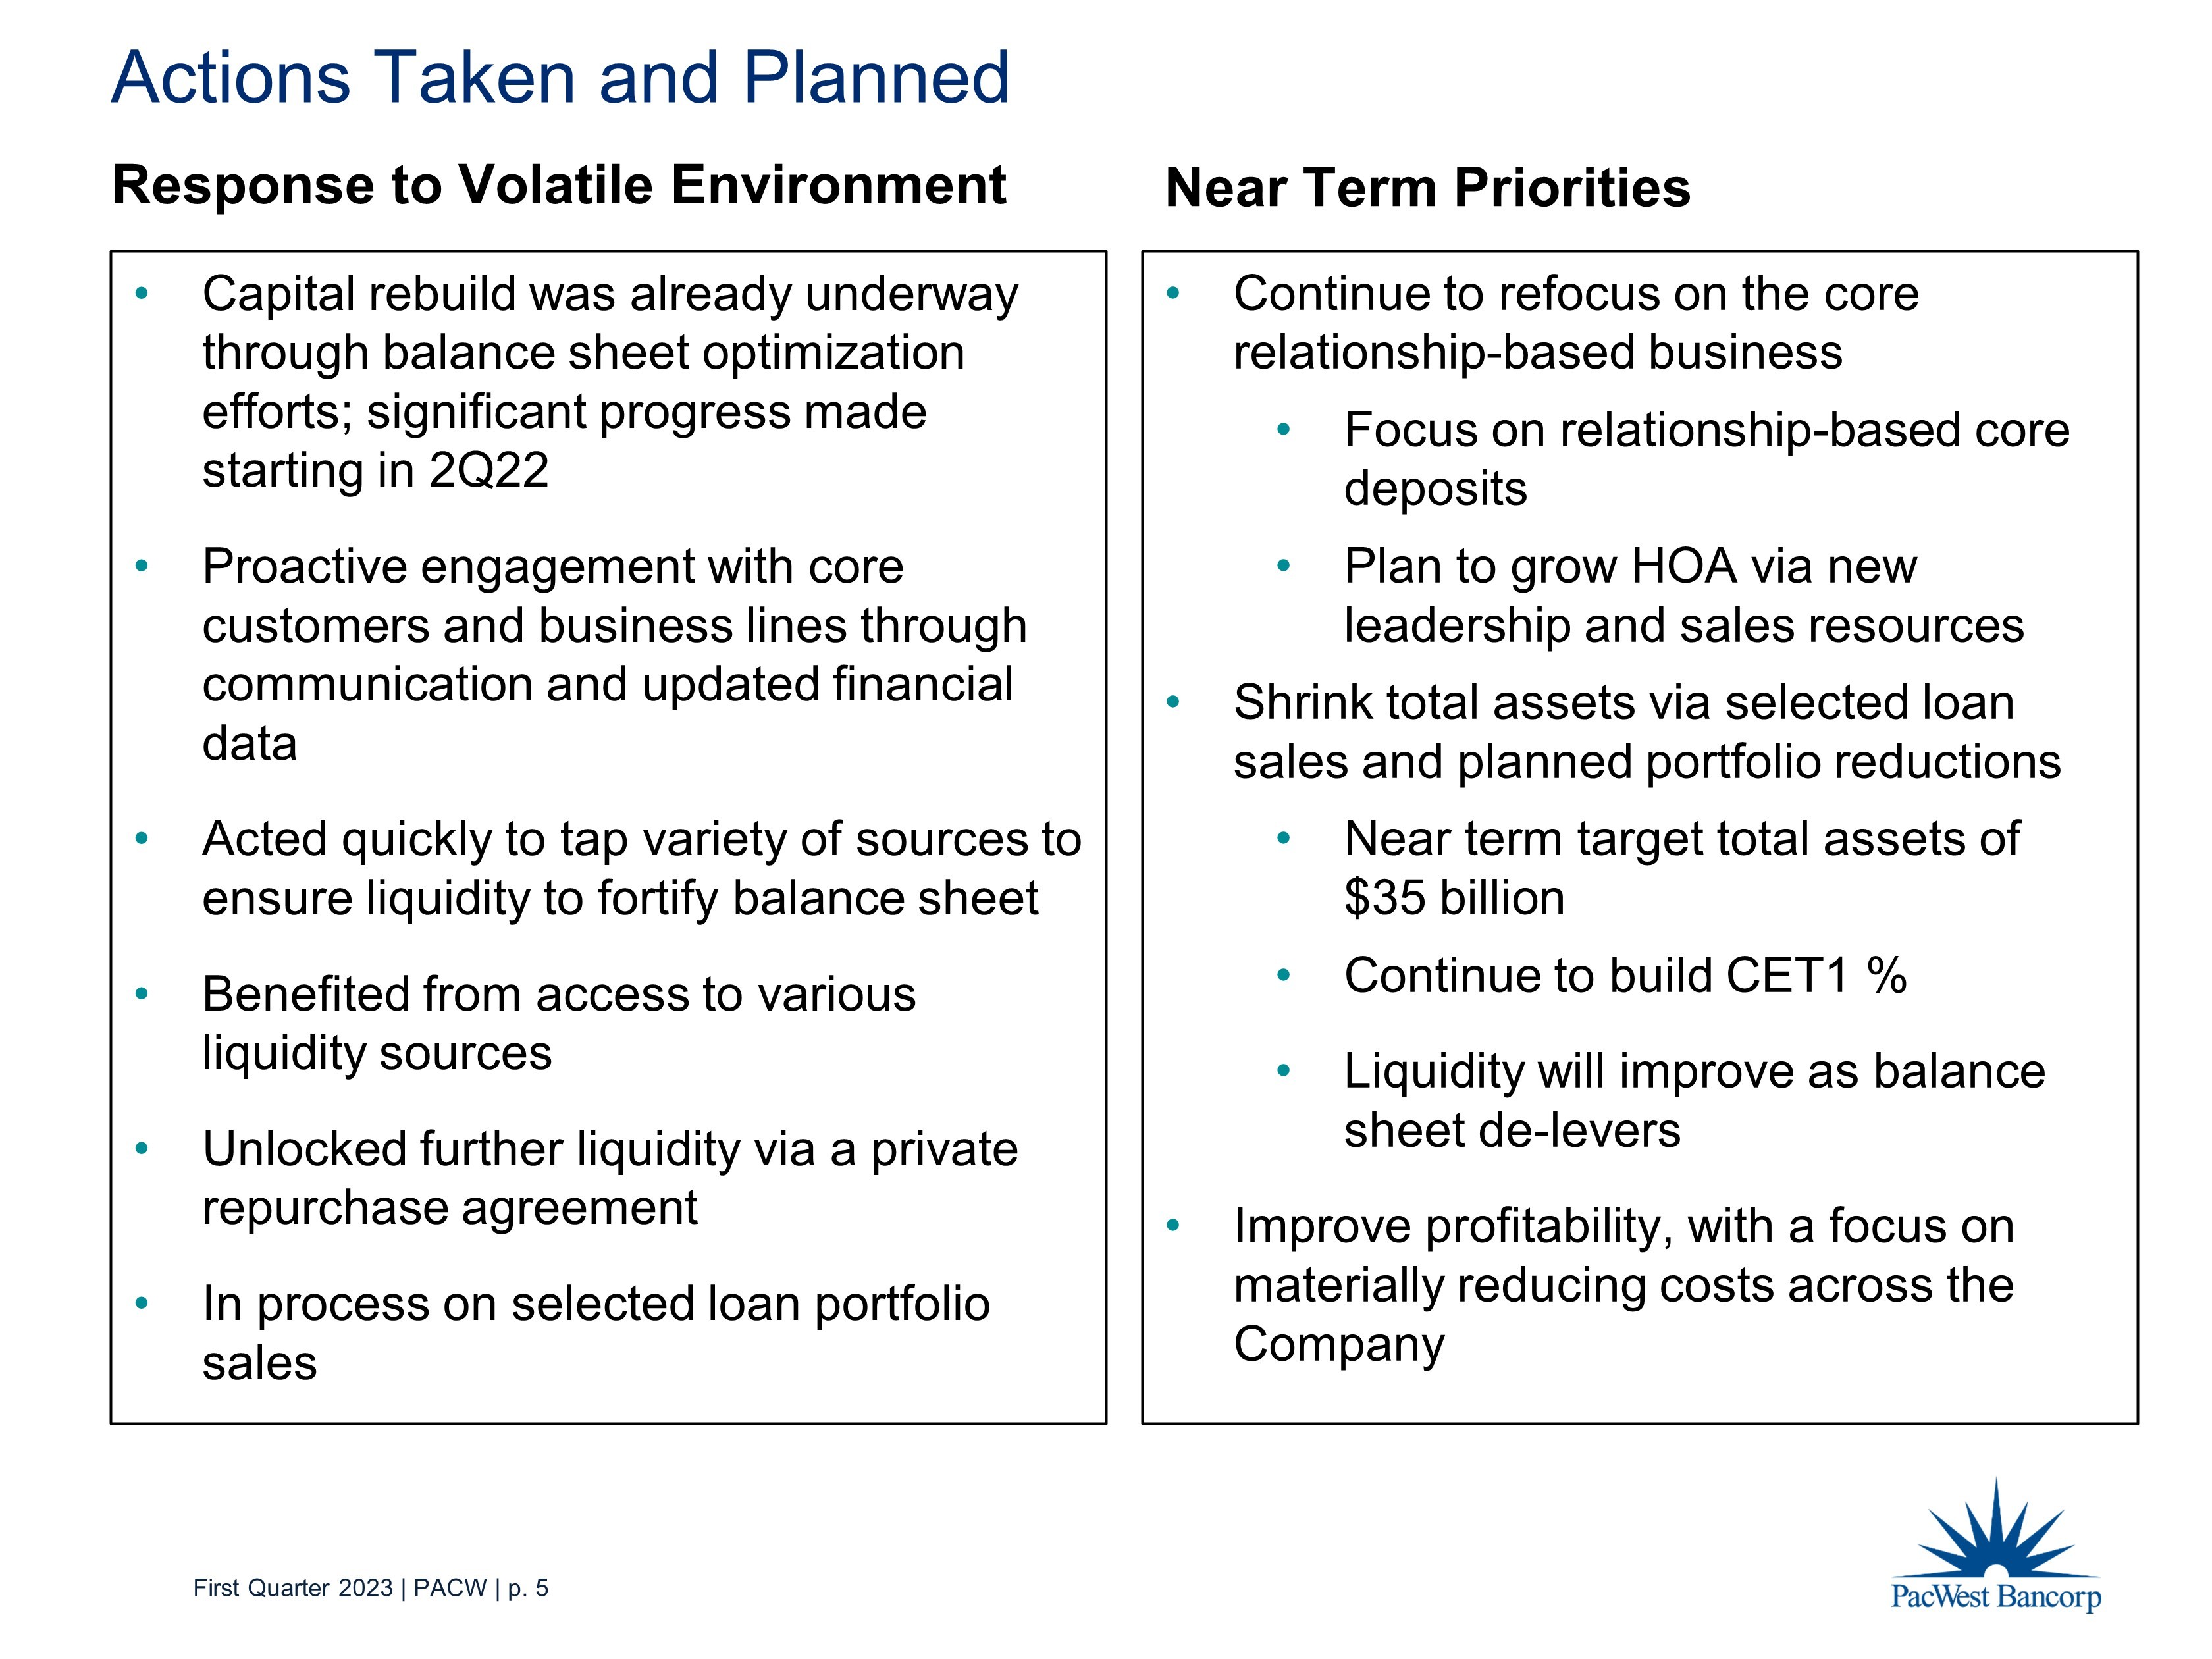
First Quarter 2023 | PACW | p. 5 Actions Taken and Planned • Capital rebuild was already underway through balance sheet optimization efforts; significant progress made starting in 2Q22 • Proactive engagement with core customers and business lines through communication and updated financial data • Acted quickly to tap variety of sources to ensure liquidity to fortify balance sheet • Benefited from access to various liquidity sources • Unlocked further liquidity via a private repurchase agreement • In process on selected loan portfolio sales • Continue to refocus on the core relationship - based business • Focus on relationship - based core deposits • Plan to grow HOA via new leadership and sales resources • Shrink total assets via selected loan sales and planned portfolio reductions • Near term target total assets of $35 billion • Continue to build CET1 % • Liquidity will improve as balance sheet de - levers • Improve profitability , with a focus on materially reducing costs across the Company Response to Volatile Environment Near Term Priorities
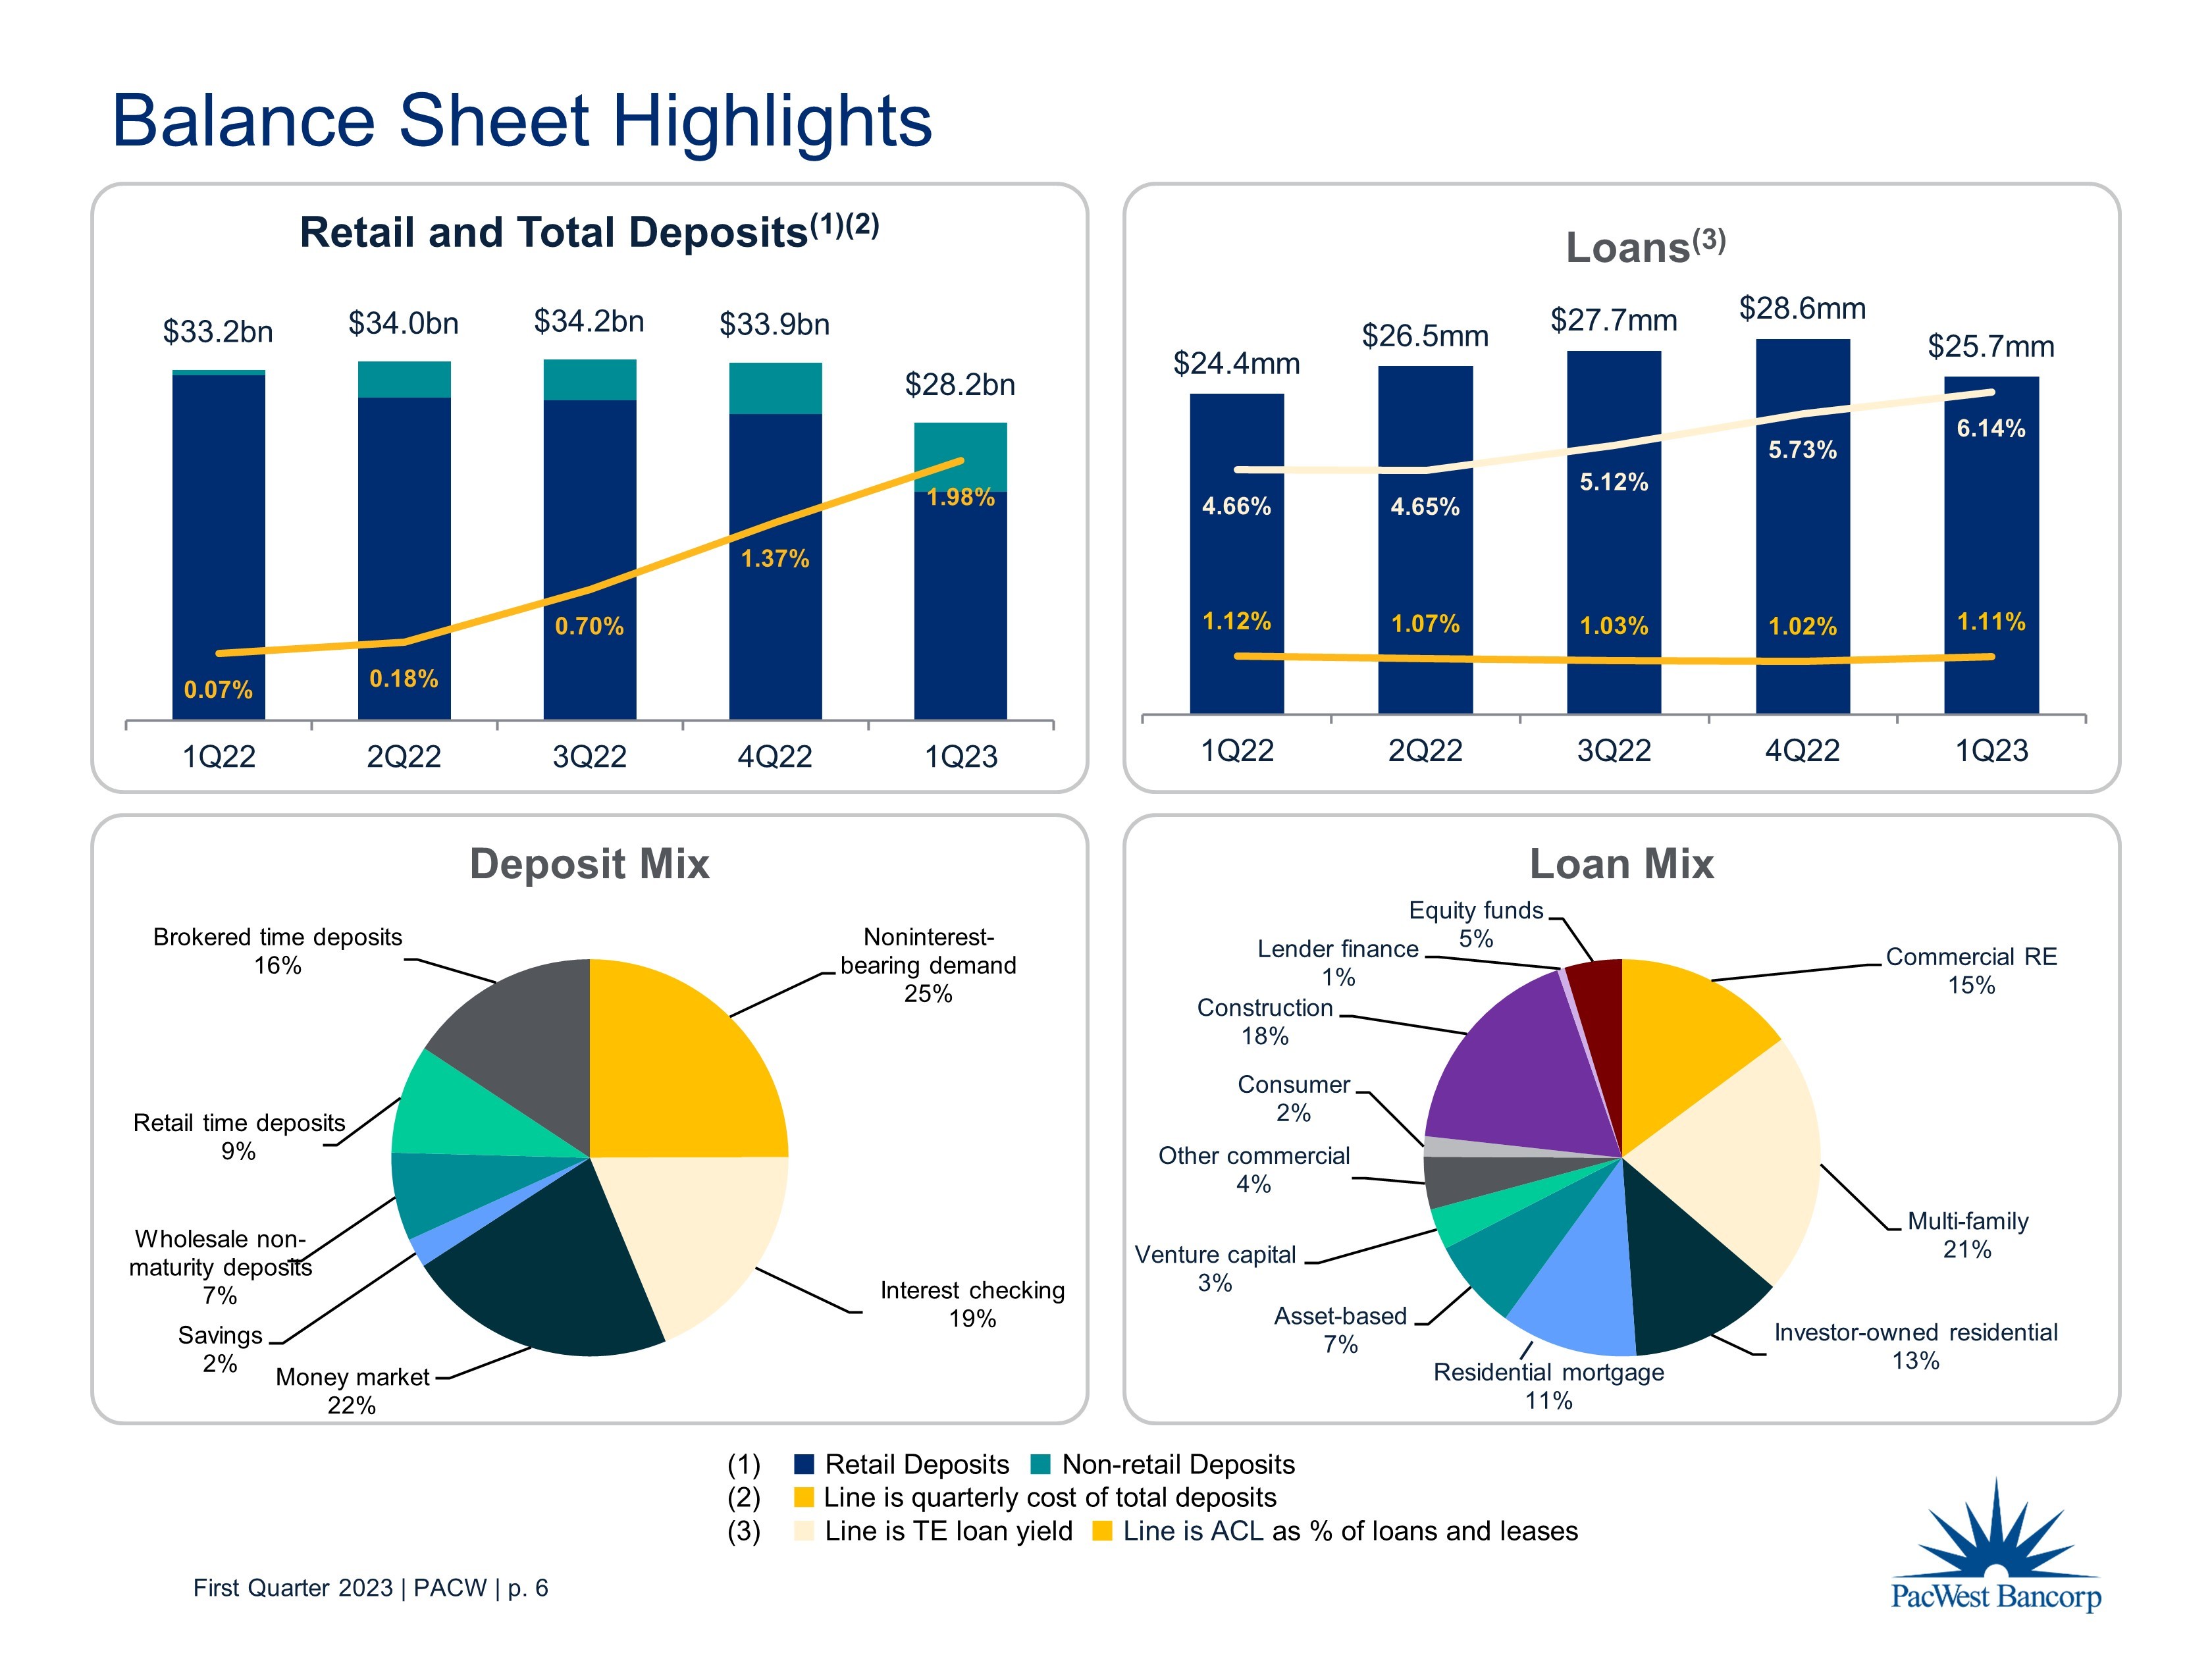
First Quarter 2023 | PACW | p. 6 $33.2bn $34.0bn $34.2bn $33.9bn $28.2bn 0.07% 0.18% 0.70% 1.37% 1.98% 1Q22 2Q22 3Q22 4Q22 1Q23 Retail and Total Deposits (1)(2) $24.4mm $26.5mm $27.7mm $28.6mm $25.7mm 1.12% 1.07% 1.03% 1.02% 1.11% 4.66% 4.65% 5.12% 5.73% 6.14% 1Q22 2Q22 3Q22 4Q22 1Q23 Loans (3) Balance Sheet Highlights (1) ■ Retail Deposits ■ Non - retail Deposits (2) ■ Line is quarterly cost of total deposits (3) ■ Line is TE loan yield ■ Line is ACL as % of loans and leases Commercial RE 15% Multi - family 21% Investor - owned residential 13% Residential mortgage 11% Asset - based 7% Venture capital 3% Other commercial 4% Consumer 2% Construction 18% Lender finance 1% Equity funds 5% Loan Mix Noninterest - bearing demand 25% Interest checking 19% Money market 22% Savings 2% Wholesale non - maturity deposits 7% Retail time deposits 9% Brokered time deposits 16% Deposit Mix
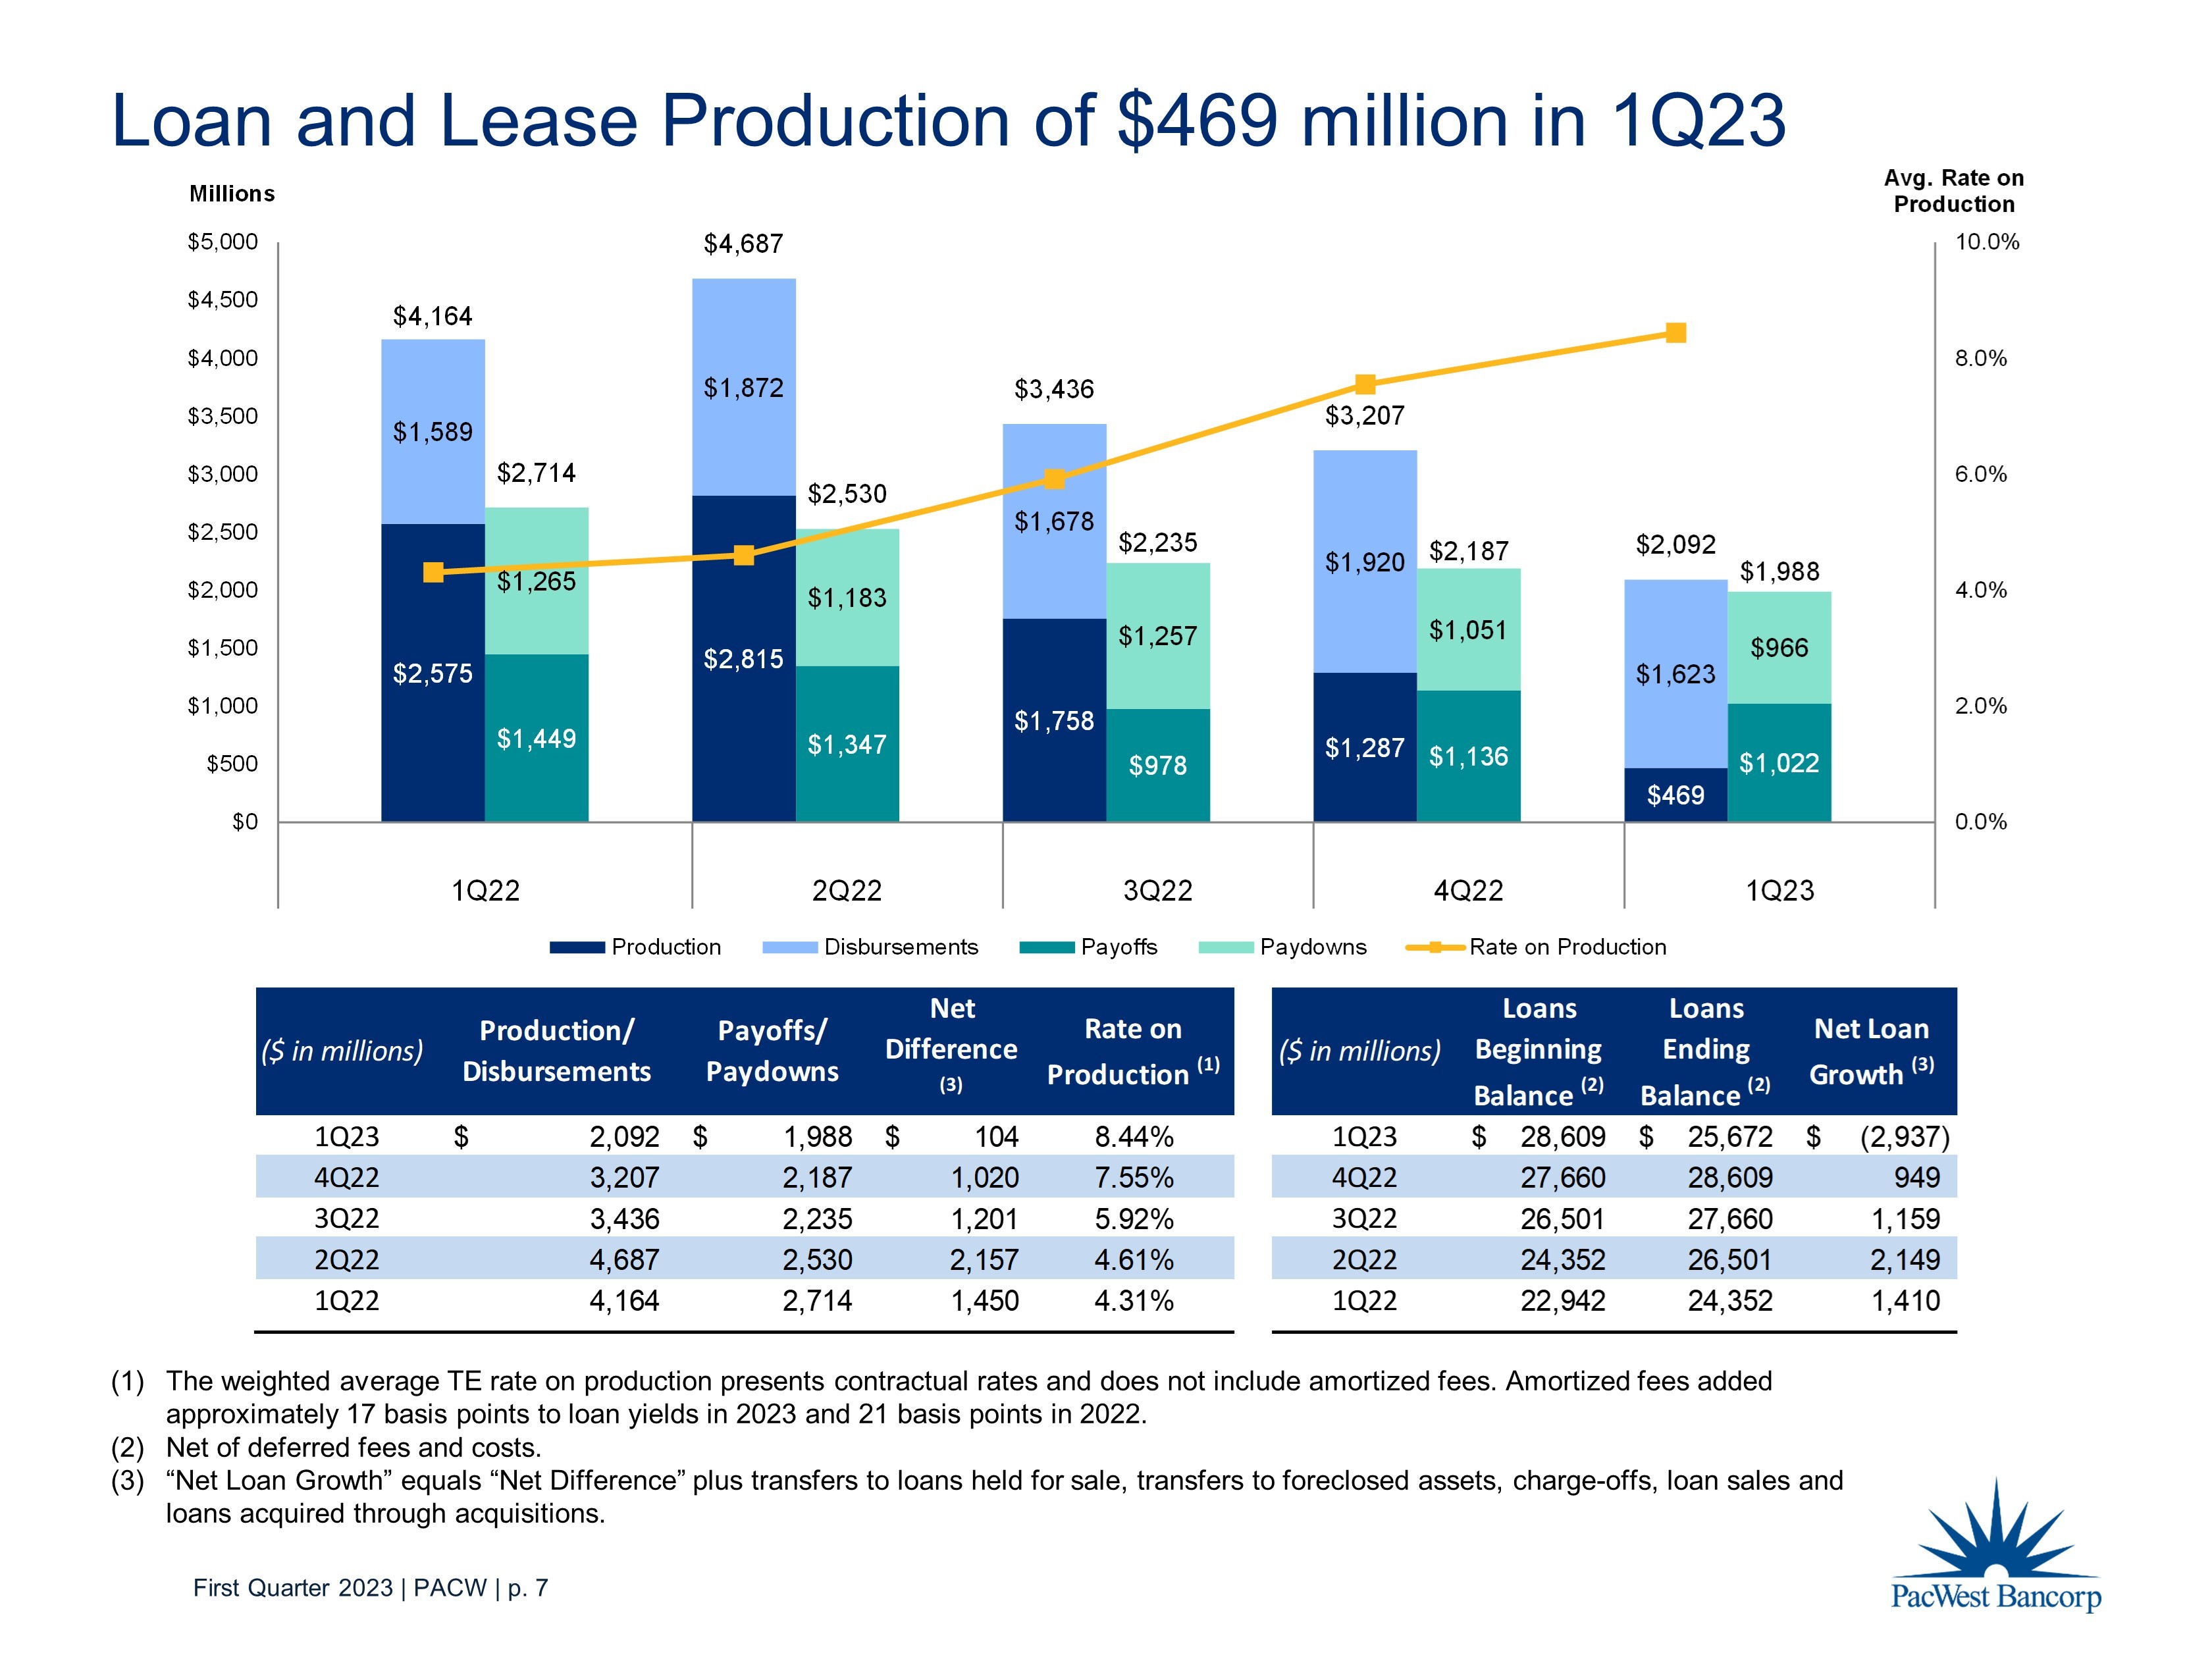
First Quarter 2023 | PACW | p. 7 ($ in millions) Production/ Disbursements Payoffs/ Paydowns Net Difference (3) Rate on Production (1) ($ in millions) Loans Beginning Balance (2) Loans Ending Balance (2) Net Loan Growth (3) 1Q23 2,092$ 1,988$ 104$ 8.44% 1Q23 28,609$ 25,672$ (2,937)$ 4Q22 3,207 2,187 1,020 7.55% 4Q22 27,660 28,609 949 3Q22 3,436 2,235 1,201 5.92% 3Q22 26,501 27,660 1,159 2Q22 4,687 2,530 2,157 4.61% 2Q22 24,352 26,501 2,149 1Q22 4,164 2,714 1,450 4.31% 1Q22 22,942 24,352 1,410 $2,575 $2,815 $1,758 $1,287 $469 $1,589 $1,872 $1,678 $1,920 $1,623 $1,449 $1,347 $978 $1,136 $1,022 $1,265 $1,183 $1,257 $1,051 $966 $4,164 $4,687 $3,436 $3,207 $2,092 $2,714 $2,530 $2,235 $2,187 $1,988 0.0% 2.0% 4.0% 6.0% 8.0% 10.0% $0 $500 $1,000 $1,500 $2,000 $2,500 $3,000 $3,500 $4,000 $4,500 $5,000 1Q22 2Q22 3Q22 4Q22 1Q23 Avg. Rate on Production Millions Production Disbursements Payoffs Paydowns Rate on Production Loan and Lease P roduction of $469 million in 1Q23 (1) The weighted average TE rate on production presents contractual rates and does not include amortized fees. Amortized fees add ed approximately 17 basis points to loan yields in 2023 and 21 basis points in 2022. (2) Net of deferred fees and costs. (3) “Net Loan Growth” equals “Net Difference” plus transfers to loans held for sale, transfers to foreclosed assets, charge - offs, loan sales and loans acquired through acquisitions.
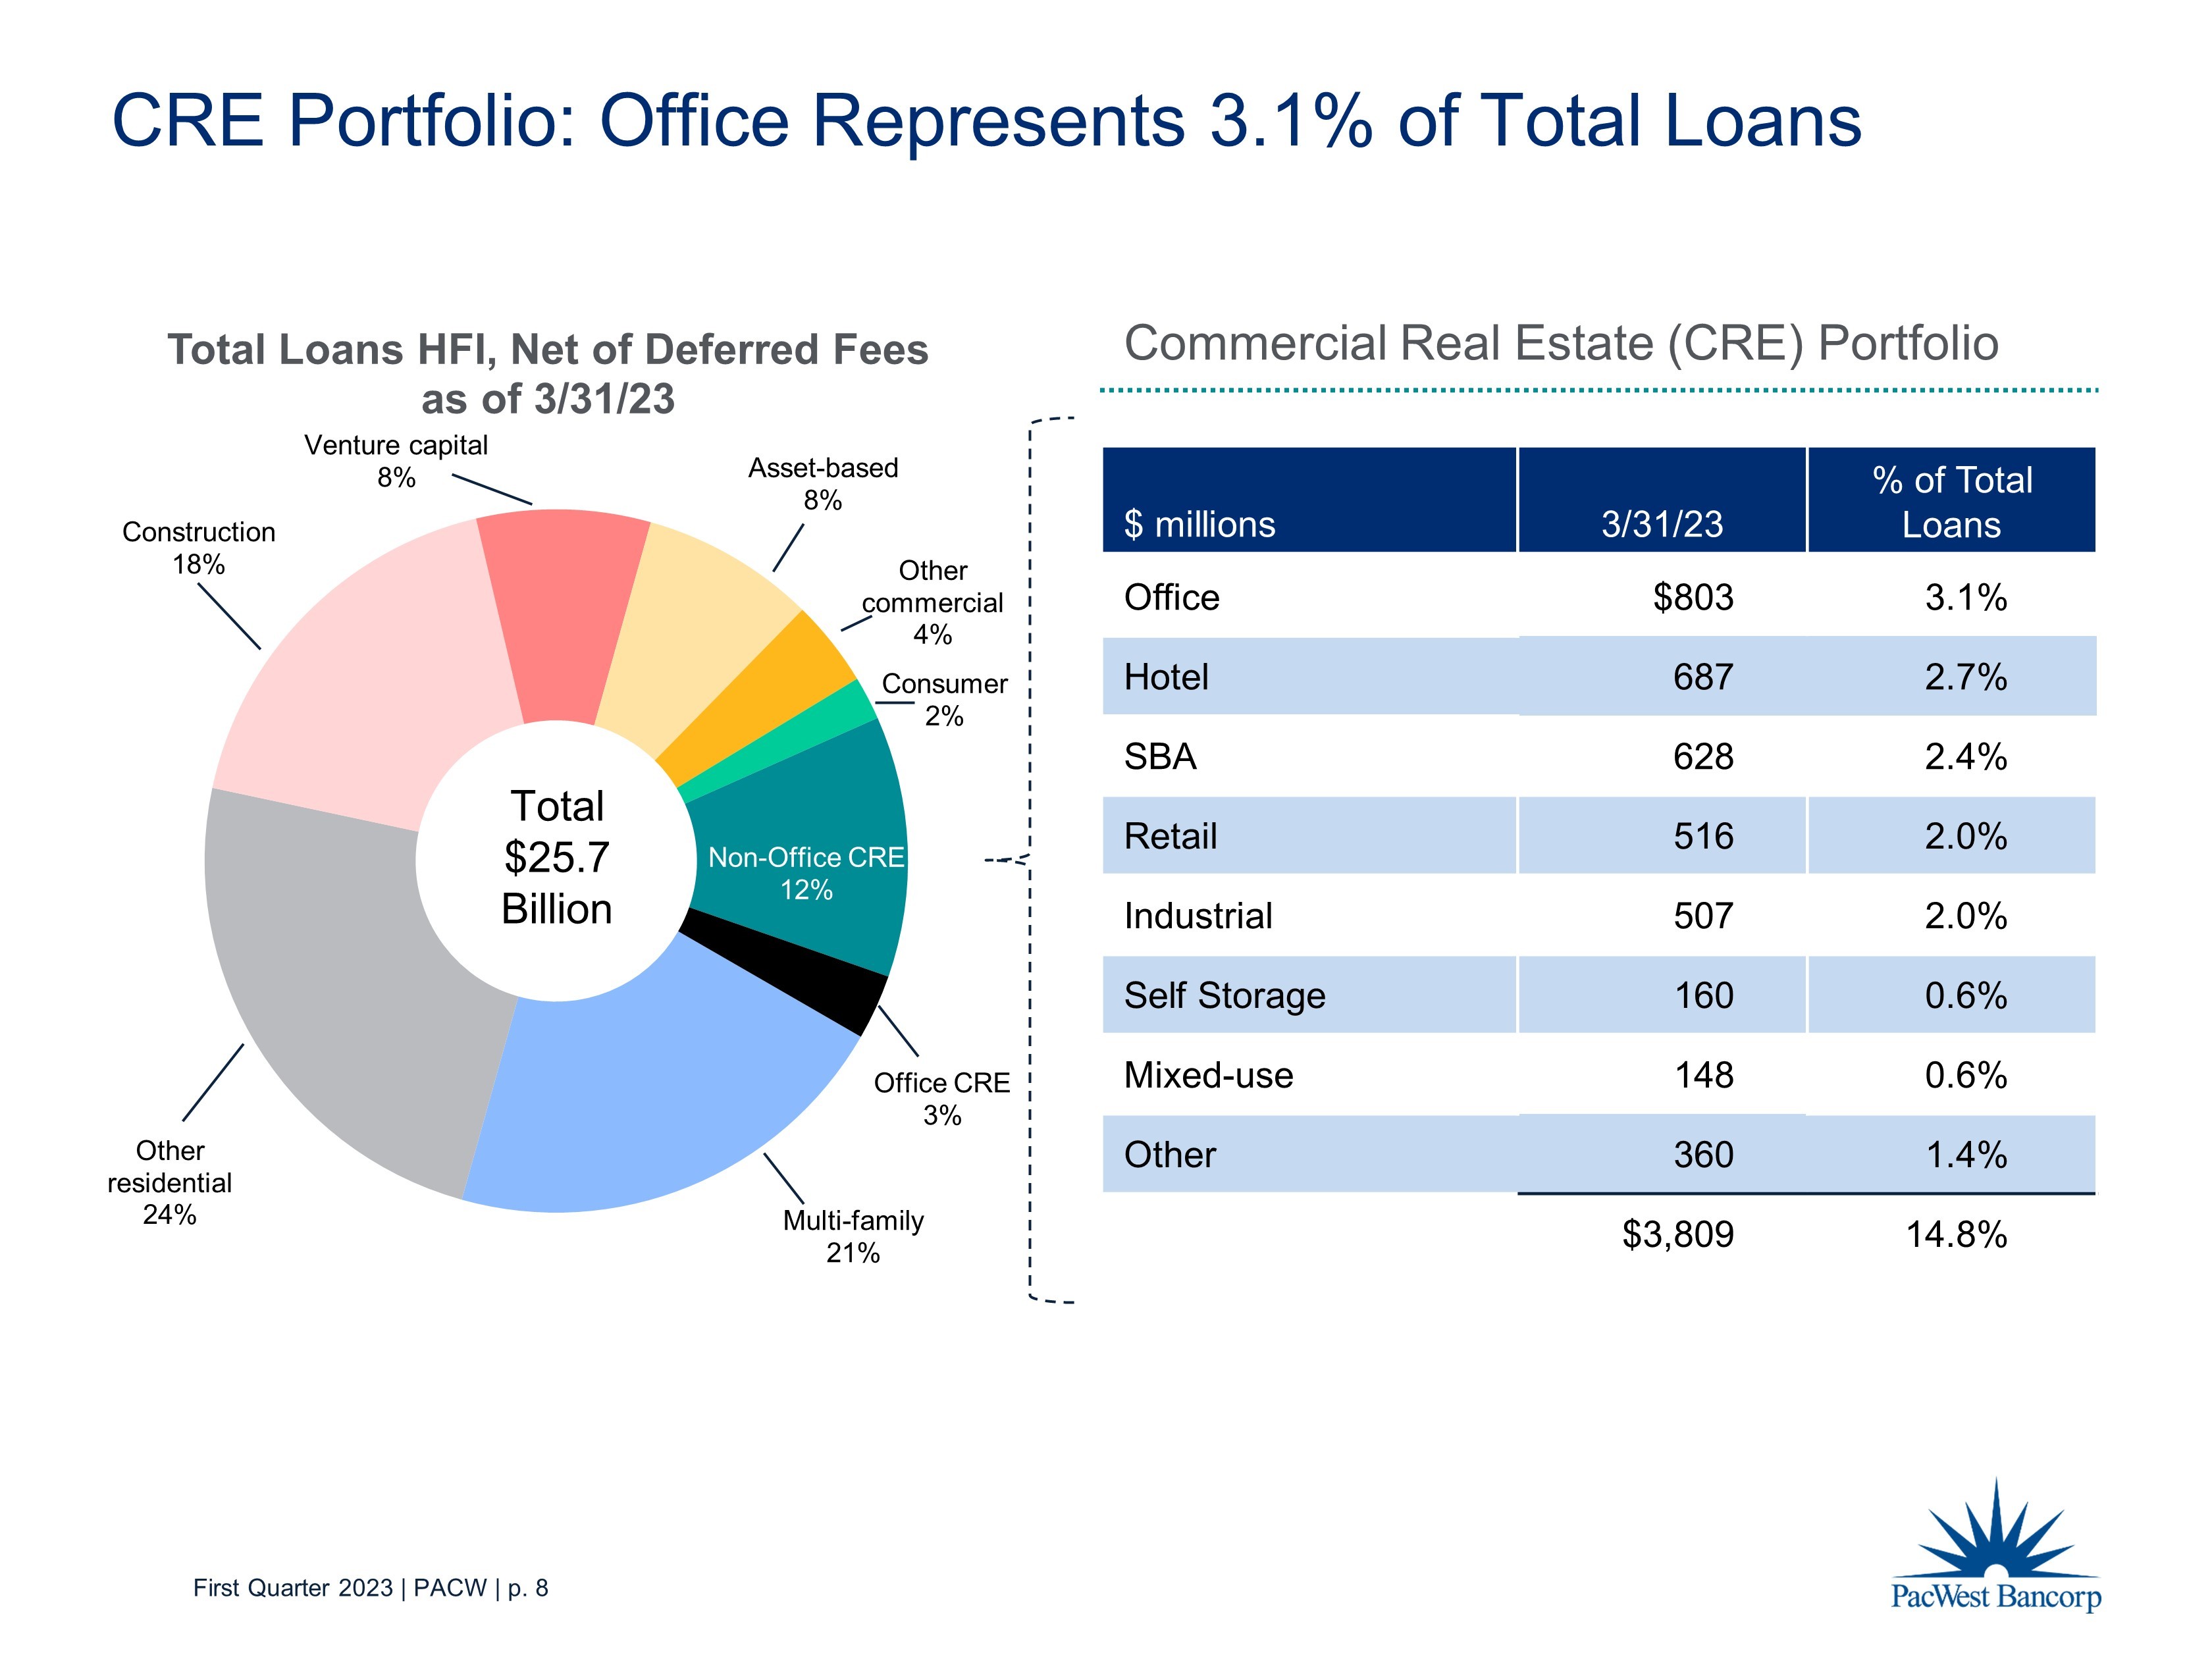
First Quarter 2023 | PACW | p. 8 CRE Portfolio: Office Represents 3.1% of Total Loans Multi - family 21% Other residential 24% Construction 18% Venture capital 8% Asset - based 8% Other commercial 4% Consumer 2% Non - Office CRE 12% Office CRE 3% Total Loans HFI, Net of Deferred Fees as of 3/31/23 Total $25.7 Billion $ millions 3/31/23 % of Total Loans Office $803 3.1% Hotel 687 2.7% SBA 628 2.4% Retail 516 2.0% Industrial 507 2.0% Self Storage 160 0.6% Mixed - use 148 0.6% Other 360 1.4% $3,809 14.8% Commercial Real Estate (CRE) Portfolio
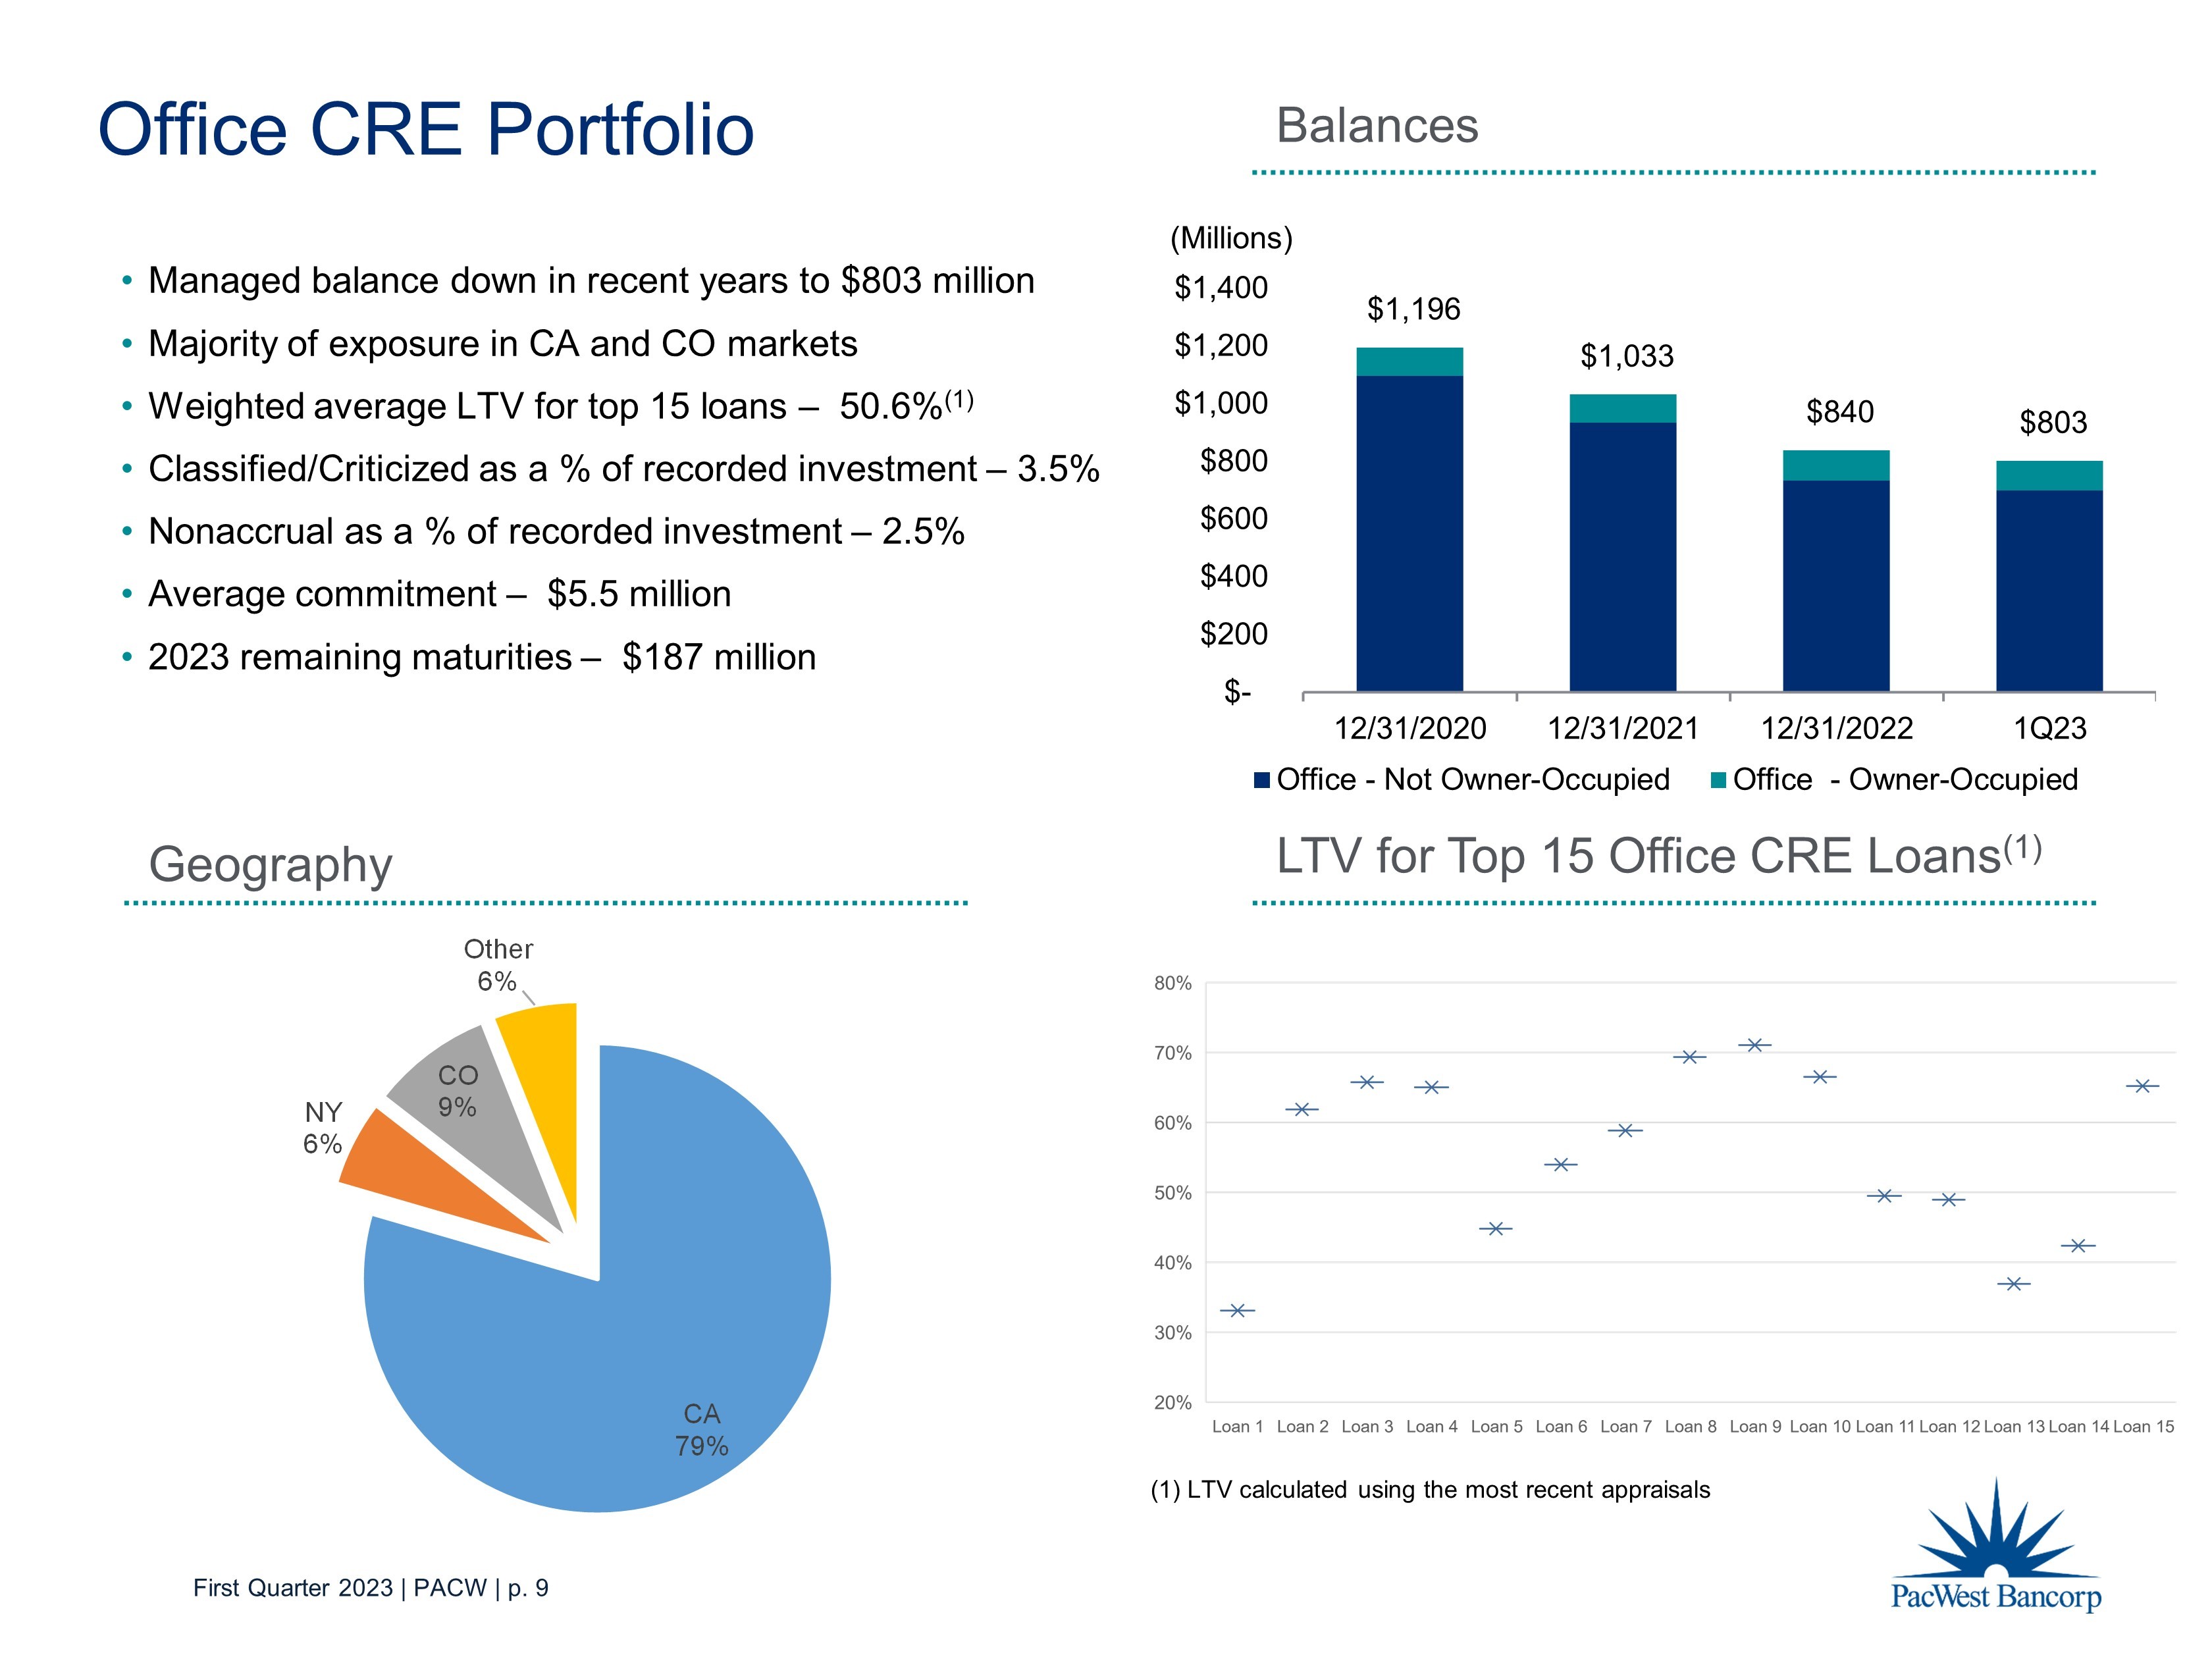
First Quarter 2023 | PACW | p. 9 $1,196 $1,033 $840 $803 $- $200 $400 $600 $800 $1,000 $1,200 $1,400 12/31/2020 12/31/2021 12/31/2022 1Q23 (Millions) Office - Not Owner-Occupied Office - Owner-Occupied Office CRE Portfolio Balances LTV for Top 15 Office CRE Loans (1) Geography • Managed balance down in recent years to $803 million • Majority of exposure in CA and CO markets • Weighted average LTV for top 15 loans – 50.6% (1) • Classified/Criticized as a % of recorded investment – 3.5% • Nonaccrual as a % of recorded investment – 2.5% • Average commitment – $5.5 million • 2023 remaining maturities – $ 187 million CA 79% NY 6% CO 9% Other 6% (1) LTV calculated using the most recent appraisals
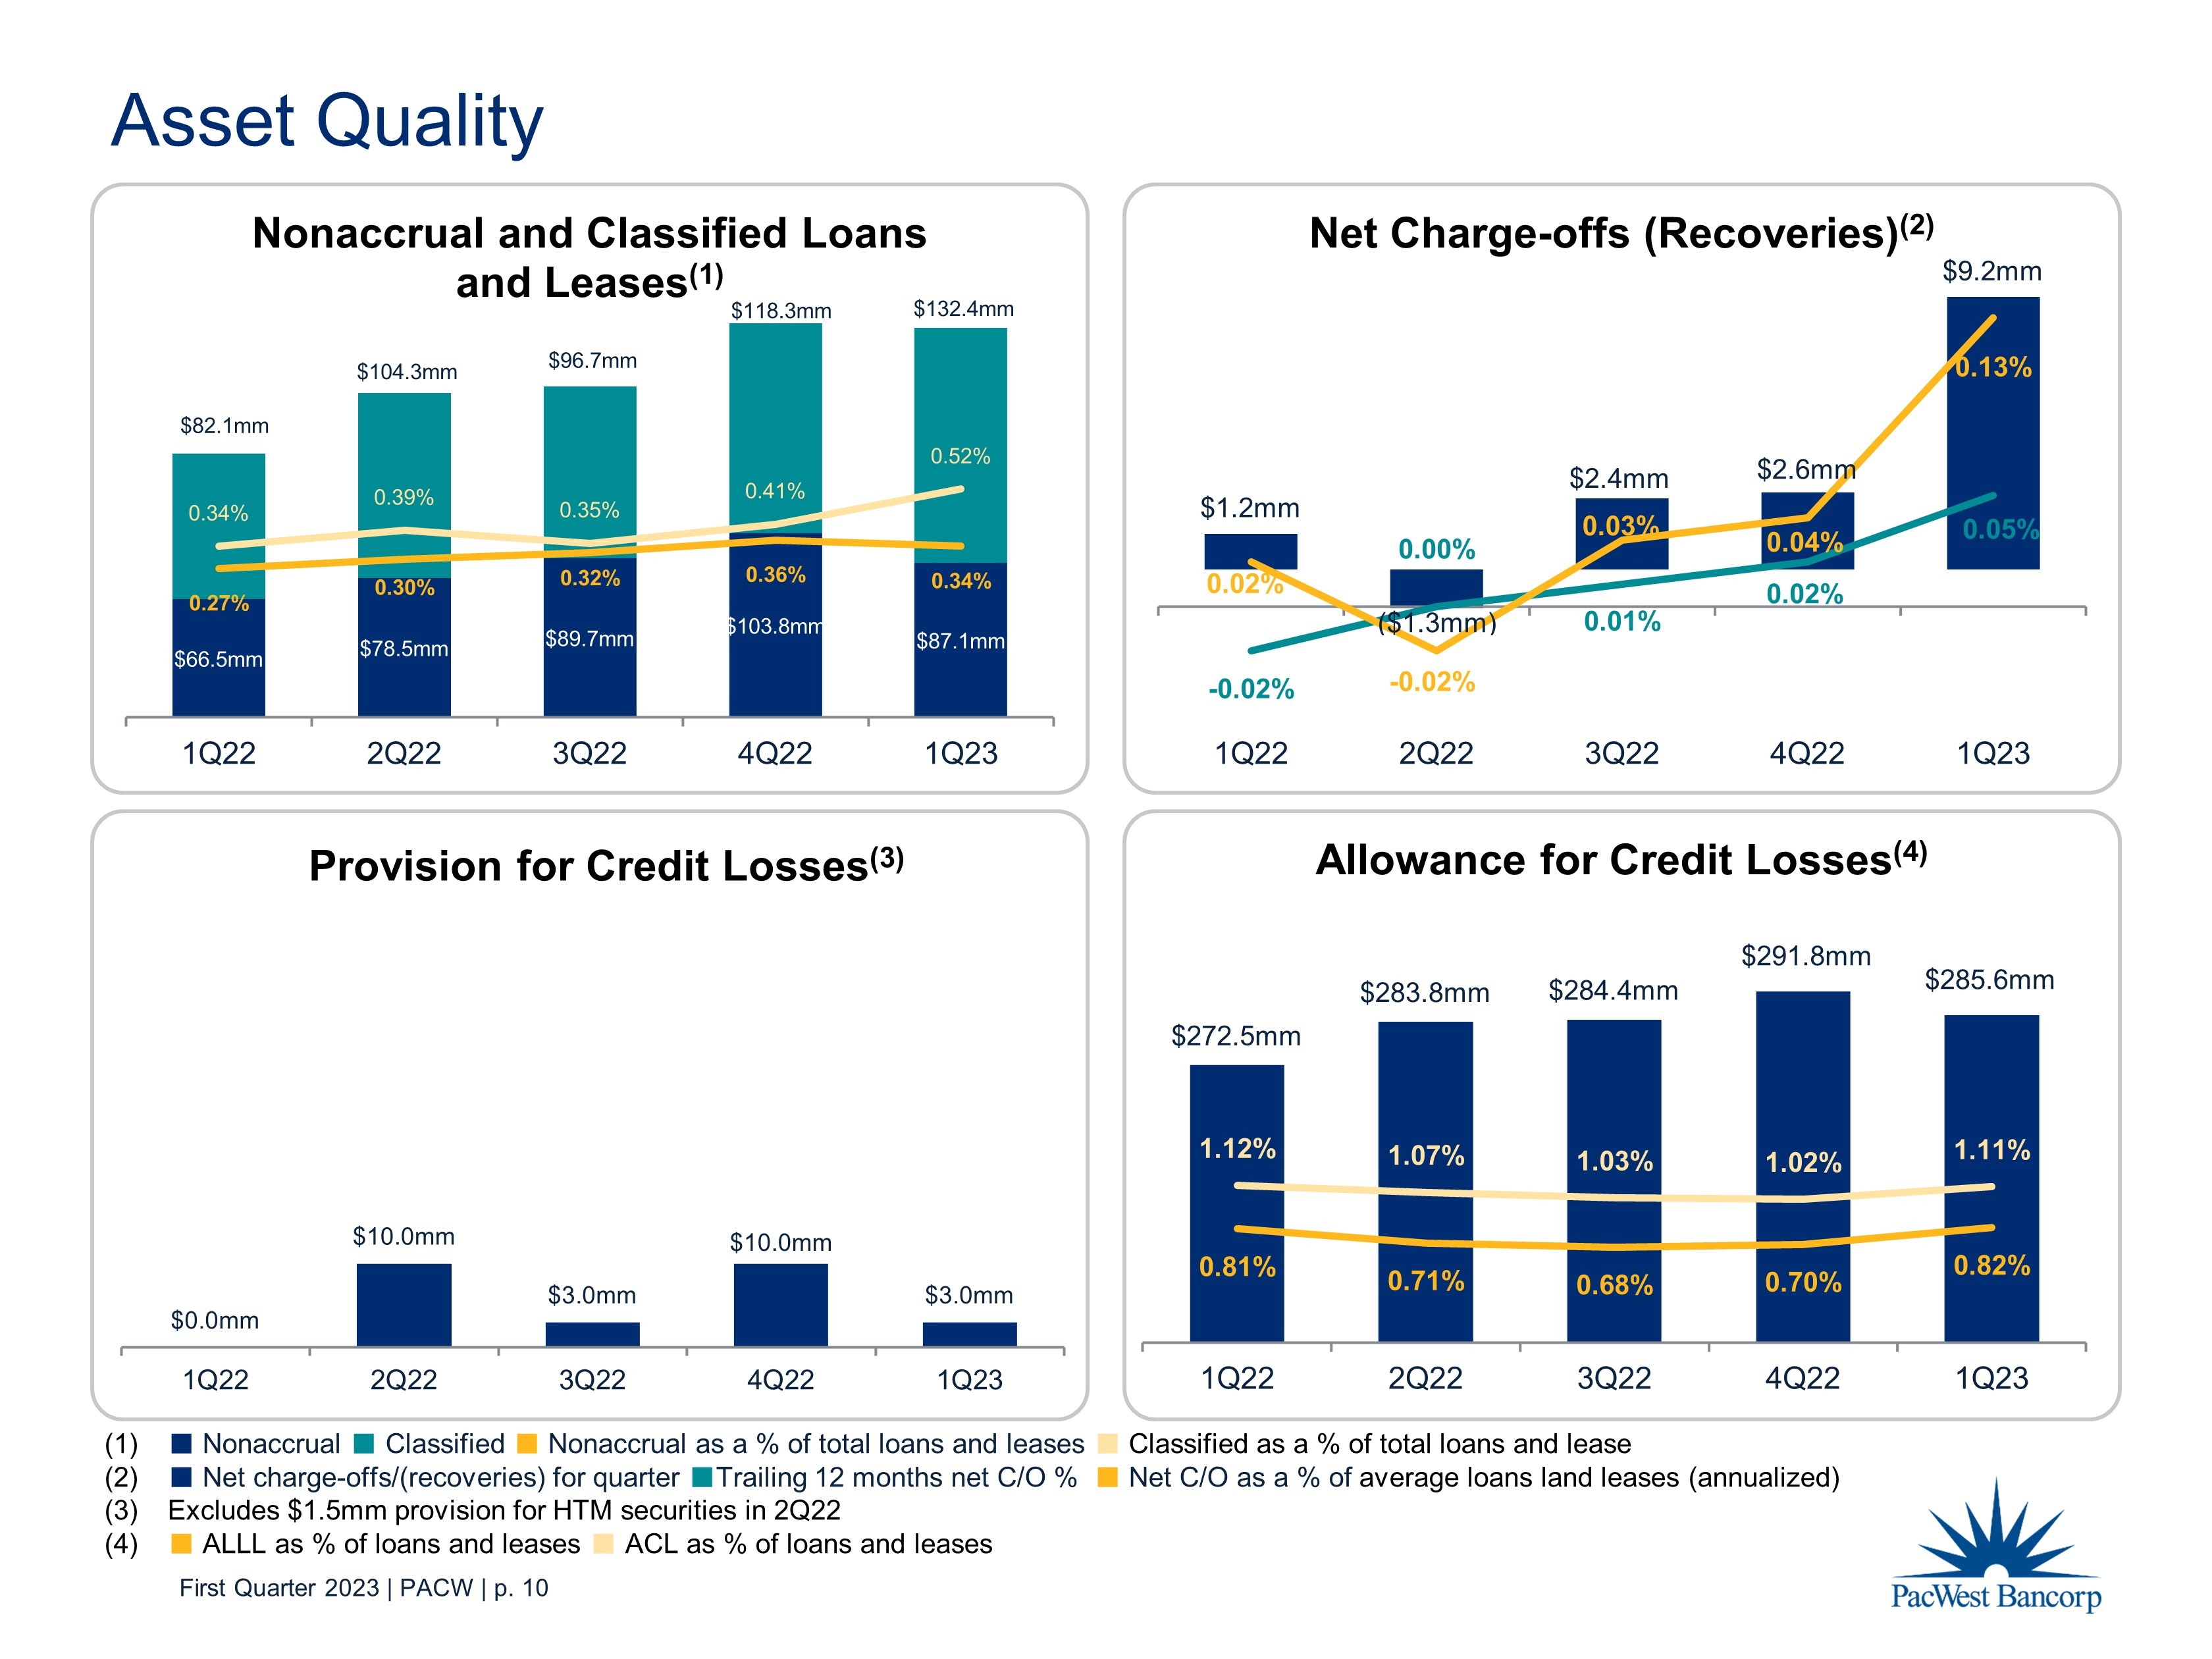
First Quarter 2023 | PACW | p. 10 $0.0mm $10.0mm $3.0mm $10.0mm $3.0mm 1Q22 2Q22 3Q22 4Q22 1Q23 Provision for Credit Losses (3) $1.2mm ($1.3mm) $2.4mm $2.6mm $9.2mm - 0.02% 0.00% 0.01% 0.02% 0.05% 0.02% - 0.02% 0.03% 0.04% 0.13% 1Q22 2Q22 3Q22 4Q22 1Q23 Net Charge - offs (Recoveries ) (2) Asset Quality $66.5mm $78.5mm $89.7mm $103.8mm $87.1mm $82.1mm $104.3mm $96.7mm $118.3mm $132.4mm 0.27% 0.30% 0.32% 0.36% 0.34% 0.34% 0.39% 0.35% 0.41% 0.52% 1Q22 2Q22 3Q22 4Q22 1Q23 Nonaccrual and Classified Loans and Leases (1) (1) ■ Nonaccrual ■ Classified ■ Nonaccrual as a % of total loans and leases ■ Classified as a % of total loans and lease (2) ■ Net charge - offs/(recoveries) for quarter ■ Trailing 12 months net C/O % ■ Net C/O as a % of average loans land leases (annualized) (3) Excludes $1.5mm provision for HTM securities in 2Q22 (4) ■ ALLL as % of loans and leases ■ ACL as % of loans and leases $272.5mm $283.8mm $284.4mm $291.8mm $285.6mm 1.12% 1.07% 1.03% 1.02% 1.11% 0.81% 0.71% 0.68% 0.70% 0.82% 1Q22 2Q22 3Q22 4Q22 1Q23 Allowance for Credit Losses (4)
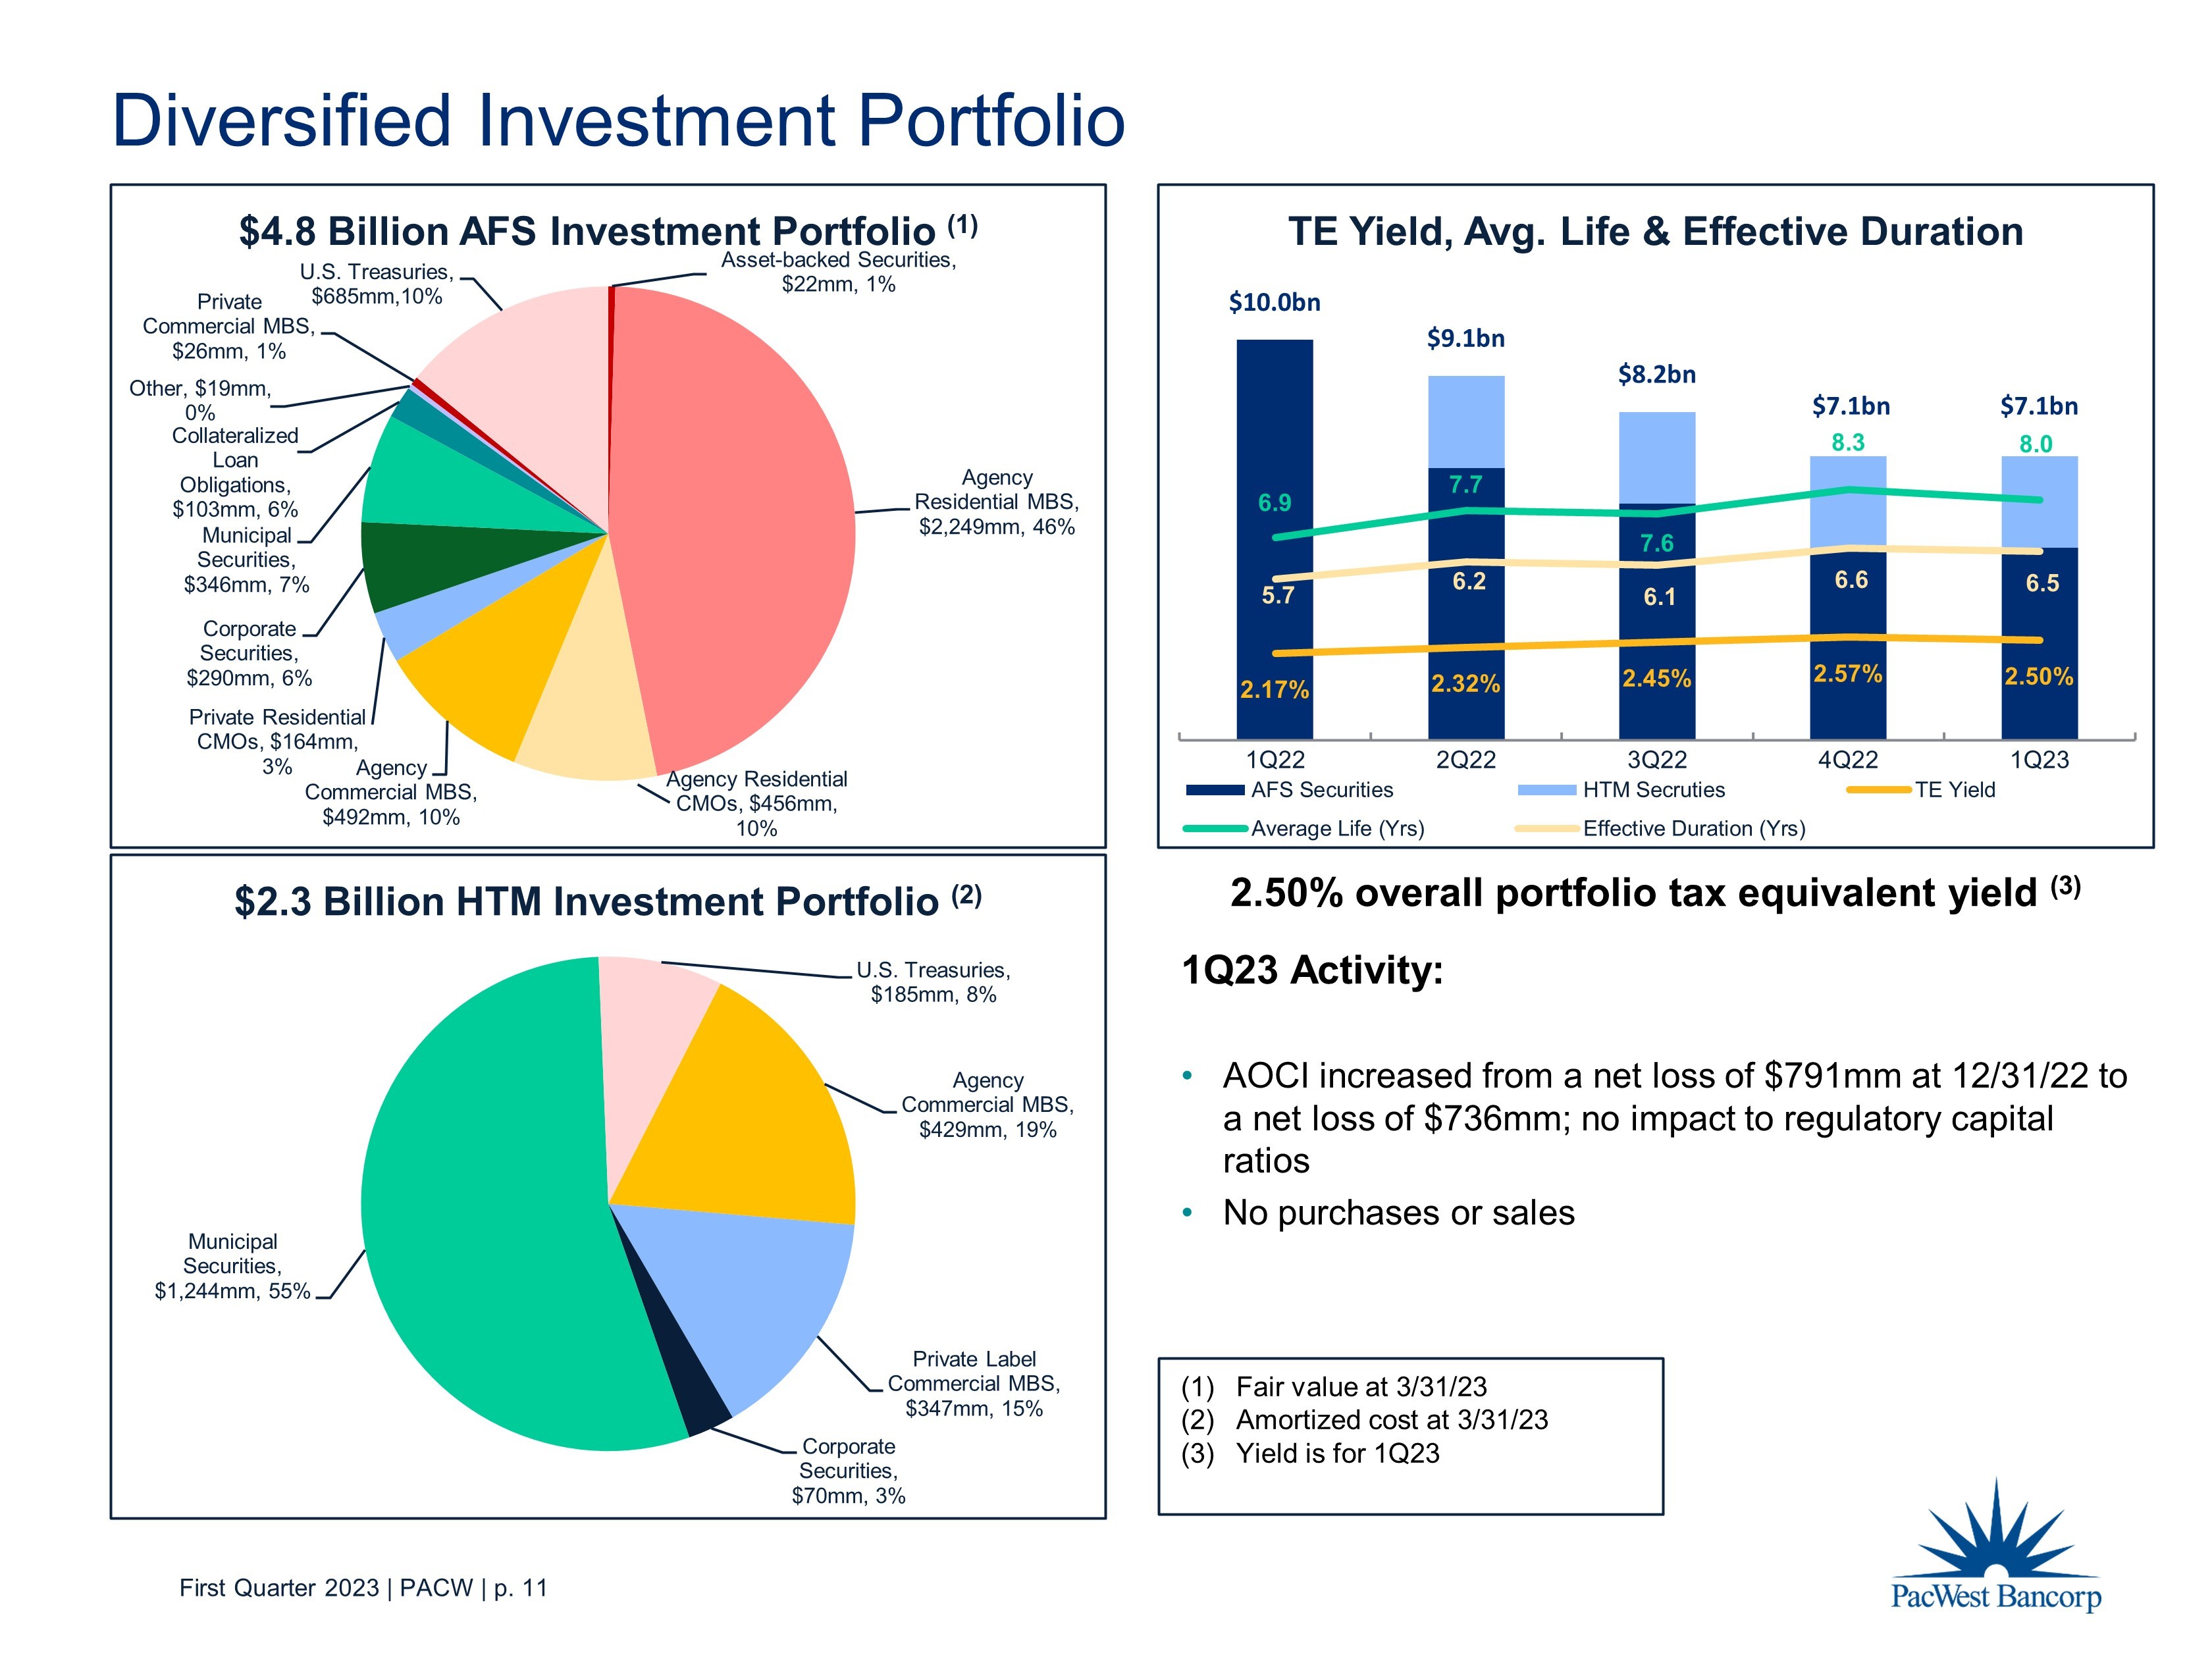
First Quarter 2023 | PACW | p. 11 $10.0bn $9.1bn $8.2bn $7.1bn $7.1bn 2.17% 2.32% 2.45% 2.57% 2.50% 6.9 7.7 7.6 8.3 8.0 5.7 6.2 6.1 6.6 6.5 1Q22 2Q22 3Q22 4Q22 1Q23 TE Yield, Avg. Life & Effective Duration AFS Securities HTM Secruties TE Yield Average Life (Yrs) Effective Duration (Yrs) Diversified Investment Portfolio (1) Fair value at 3/31/23 (2) Amortized cost at 3/31/23 (3) Yield is for 1Q23 Asset - backed Securities , $22mm , 1% Agency Residential MBS , $2,249mm , 46% Agency Residential CMOs , $456mm , 10% Agency Commercial MBS , $492mm , 10% Private Residential CMOs , $164mm , 3% Corporate Securities , $290mm , 6% Municipal Securities , $346mm , 7% Collateralized Loan Obligations , $103mm , 6% Other, $19mm , 0% Private Commercial MBS , $26mm , 1% U.S. Treasuries , $685mm ,10% $4.8 Billion AFS Investment Portfolio (1) 2.50% overall portfolio tax equivalent yield (3) 1Q23 Activity: • AOCI increased from a net loss of $791mm at 12/31/22 to a net loss of $736mm; no impact to regulatory capital ratios • No purchases or sales Agency Commercial MBS , $429mm , 19% Private Label Commercial MBS , $347mm , 15% Corporate Securities , $70mm , 3% Municipal Securities , $1,244mm , 55% U.S. Treasuries , $185mm , 8% $2.3 Billion HTM Investment Portfolio (2)
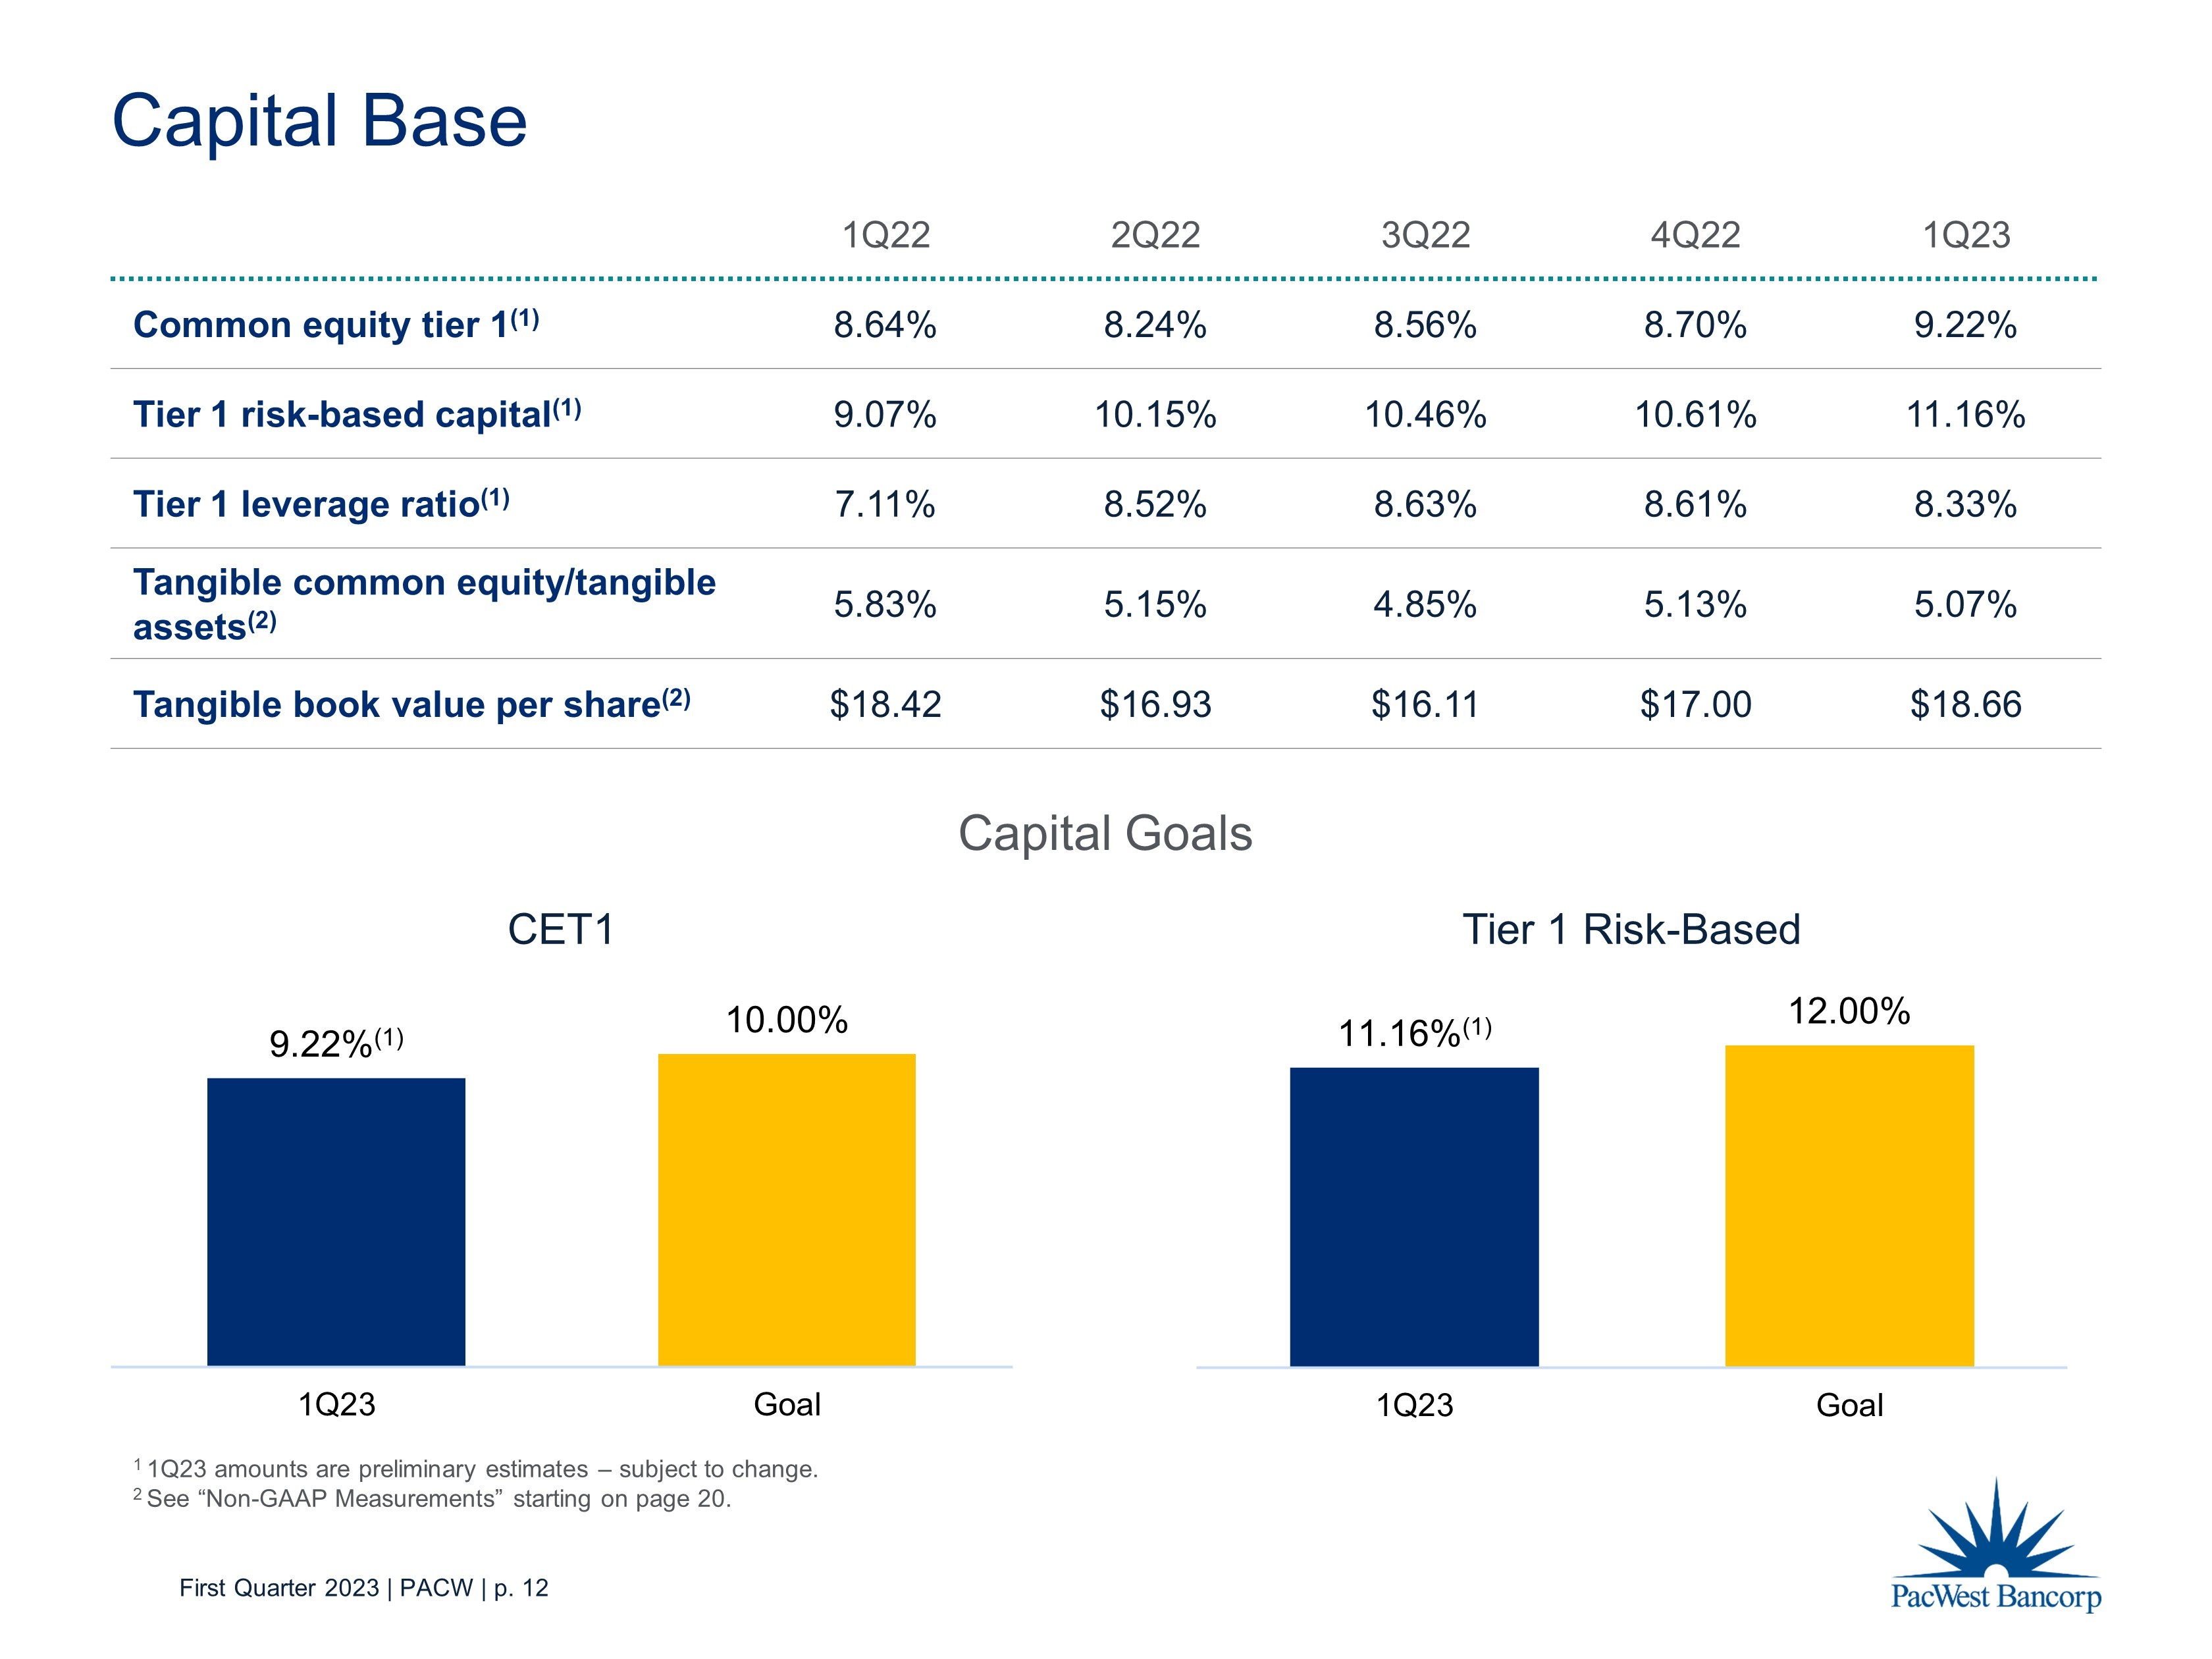
First Quarter 2023 | PACW | p. 12 Capital Base 1Q22 2Q22 3Q22 4Q22 1Q23 Common equity tier 1 (1) 8.64% 8.24% 8.56% 8.70% 9.22% Tier 1 risk - based capital (1) 9.07% 10.15% 10.46% 10.61% 11.16% Tier 1 leverage ratio (1) 7.11% 8.52% 8.63% 8.61% 8.33% Tangible common equity/tangible assets (2) 5.83% 5.15% 4.85% 5.13% 5.07% Tangible book value per share (2) $18.42 $16.93 $16.11 $17.00 $18.66 Capital Goals 9.22% (1) 10.00% 1Q23 Goal CET1 11.16% (1) 12.00% 1Q23 Goal Tier 1 Risk - Based 1 1Q23 amounts are preliminary estimates – subject to change. 2 See “Non - GAAP Measurements” starting on page 20.
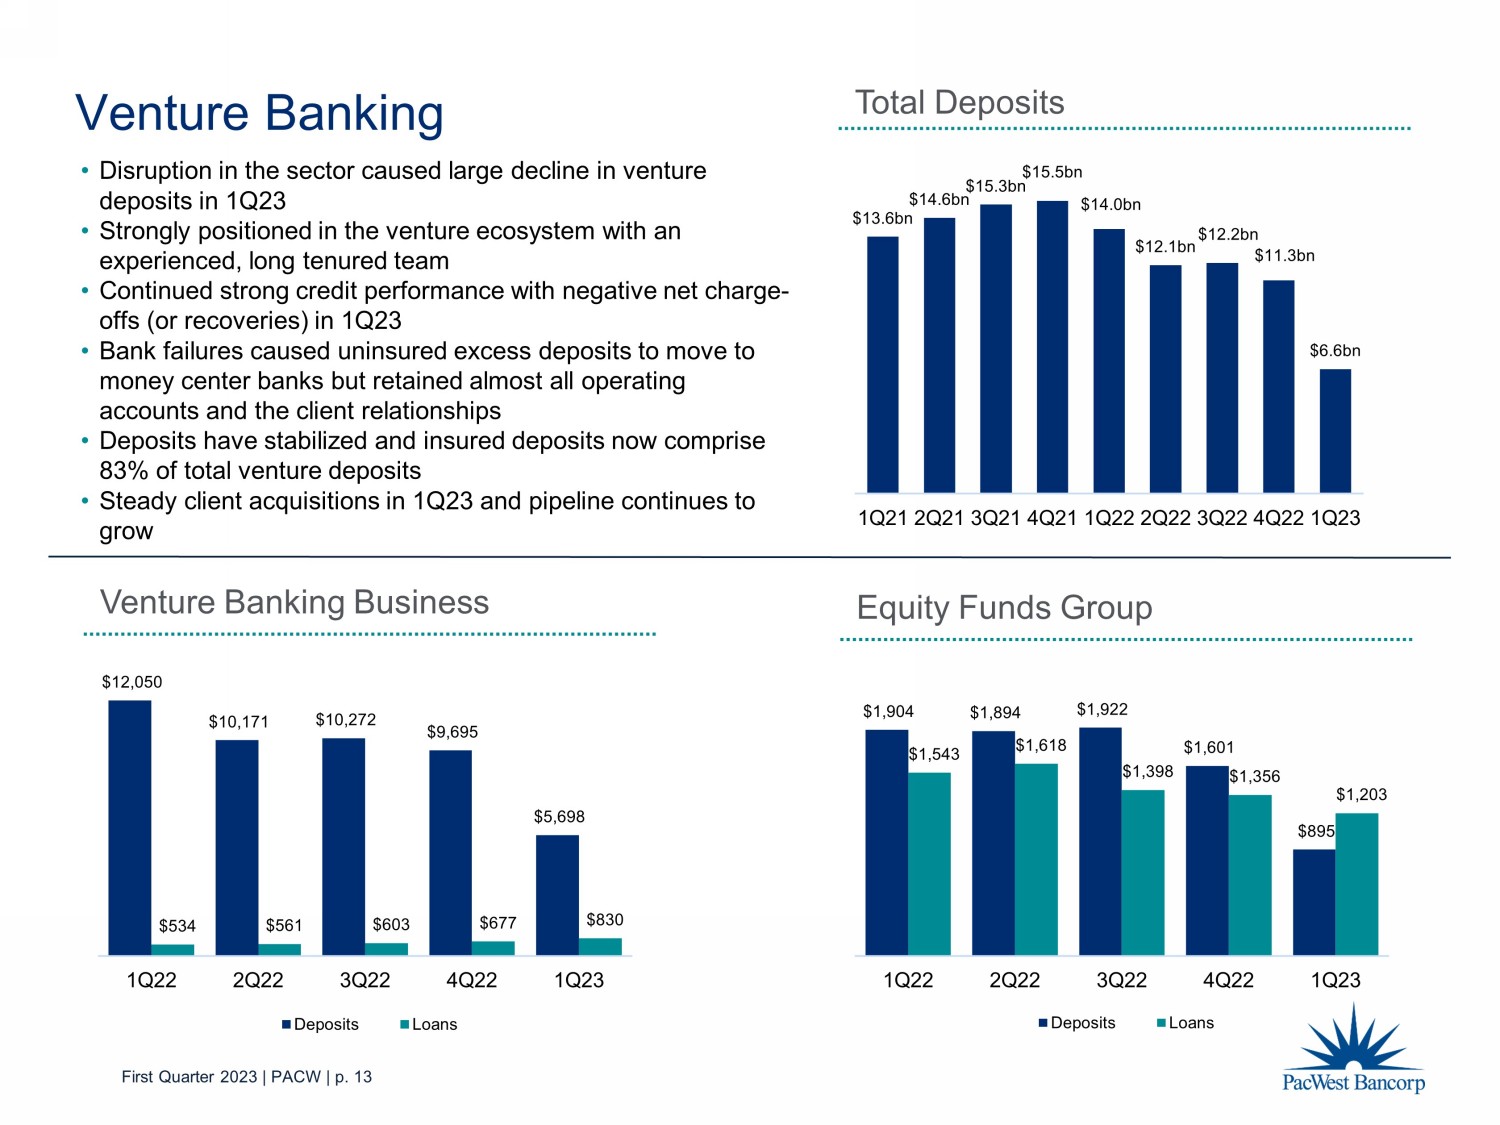
First Quarter 2023 | PACW | p. 13 $12,050 $10,171 $10,272 $9,695 $5,698 $534 $561 $603 $677 $830 1Q22 2Q22 3Q22 4Q22 1Q23 Deposits Loans Venture Banking Business Venture Banking $1,904 $1,894 $1,922 $1,601 $895 $1,543 $1,618 $1,398 $1,356 $1,203 1Q22 2Q22 3Q22 4Q22 1Q23 Deposits Loans Equity Funds Group Total Deposits $13.6bn $14.6bn $15.3bn $15.5bn $14.0bn $12.1bn $12.2bn $11.3bn $6.6bn 1Q21 2Q21 3Q21 4Q21 1Q22 2Q22 3Q22 4Q22 1Q23 • Disruption in the sector caused large decline in venture deposits in 1Q23 • Strongly positioned in the venture ecosystem with an experienced, long tenured team • Continued strong credit performance with negative net charge - offs (or recoveries) in 1Q23 • Bank failures caused uninsured excess deposits to move to money center banks but retained almost all operating accounts and the client relationships • Deposits have stabilized and insured deposits now comprise 83% of total venture deposits • Steady client acquisitions in 1Q23 and pipeline continues to grow
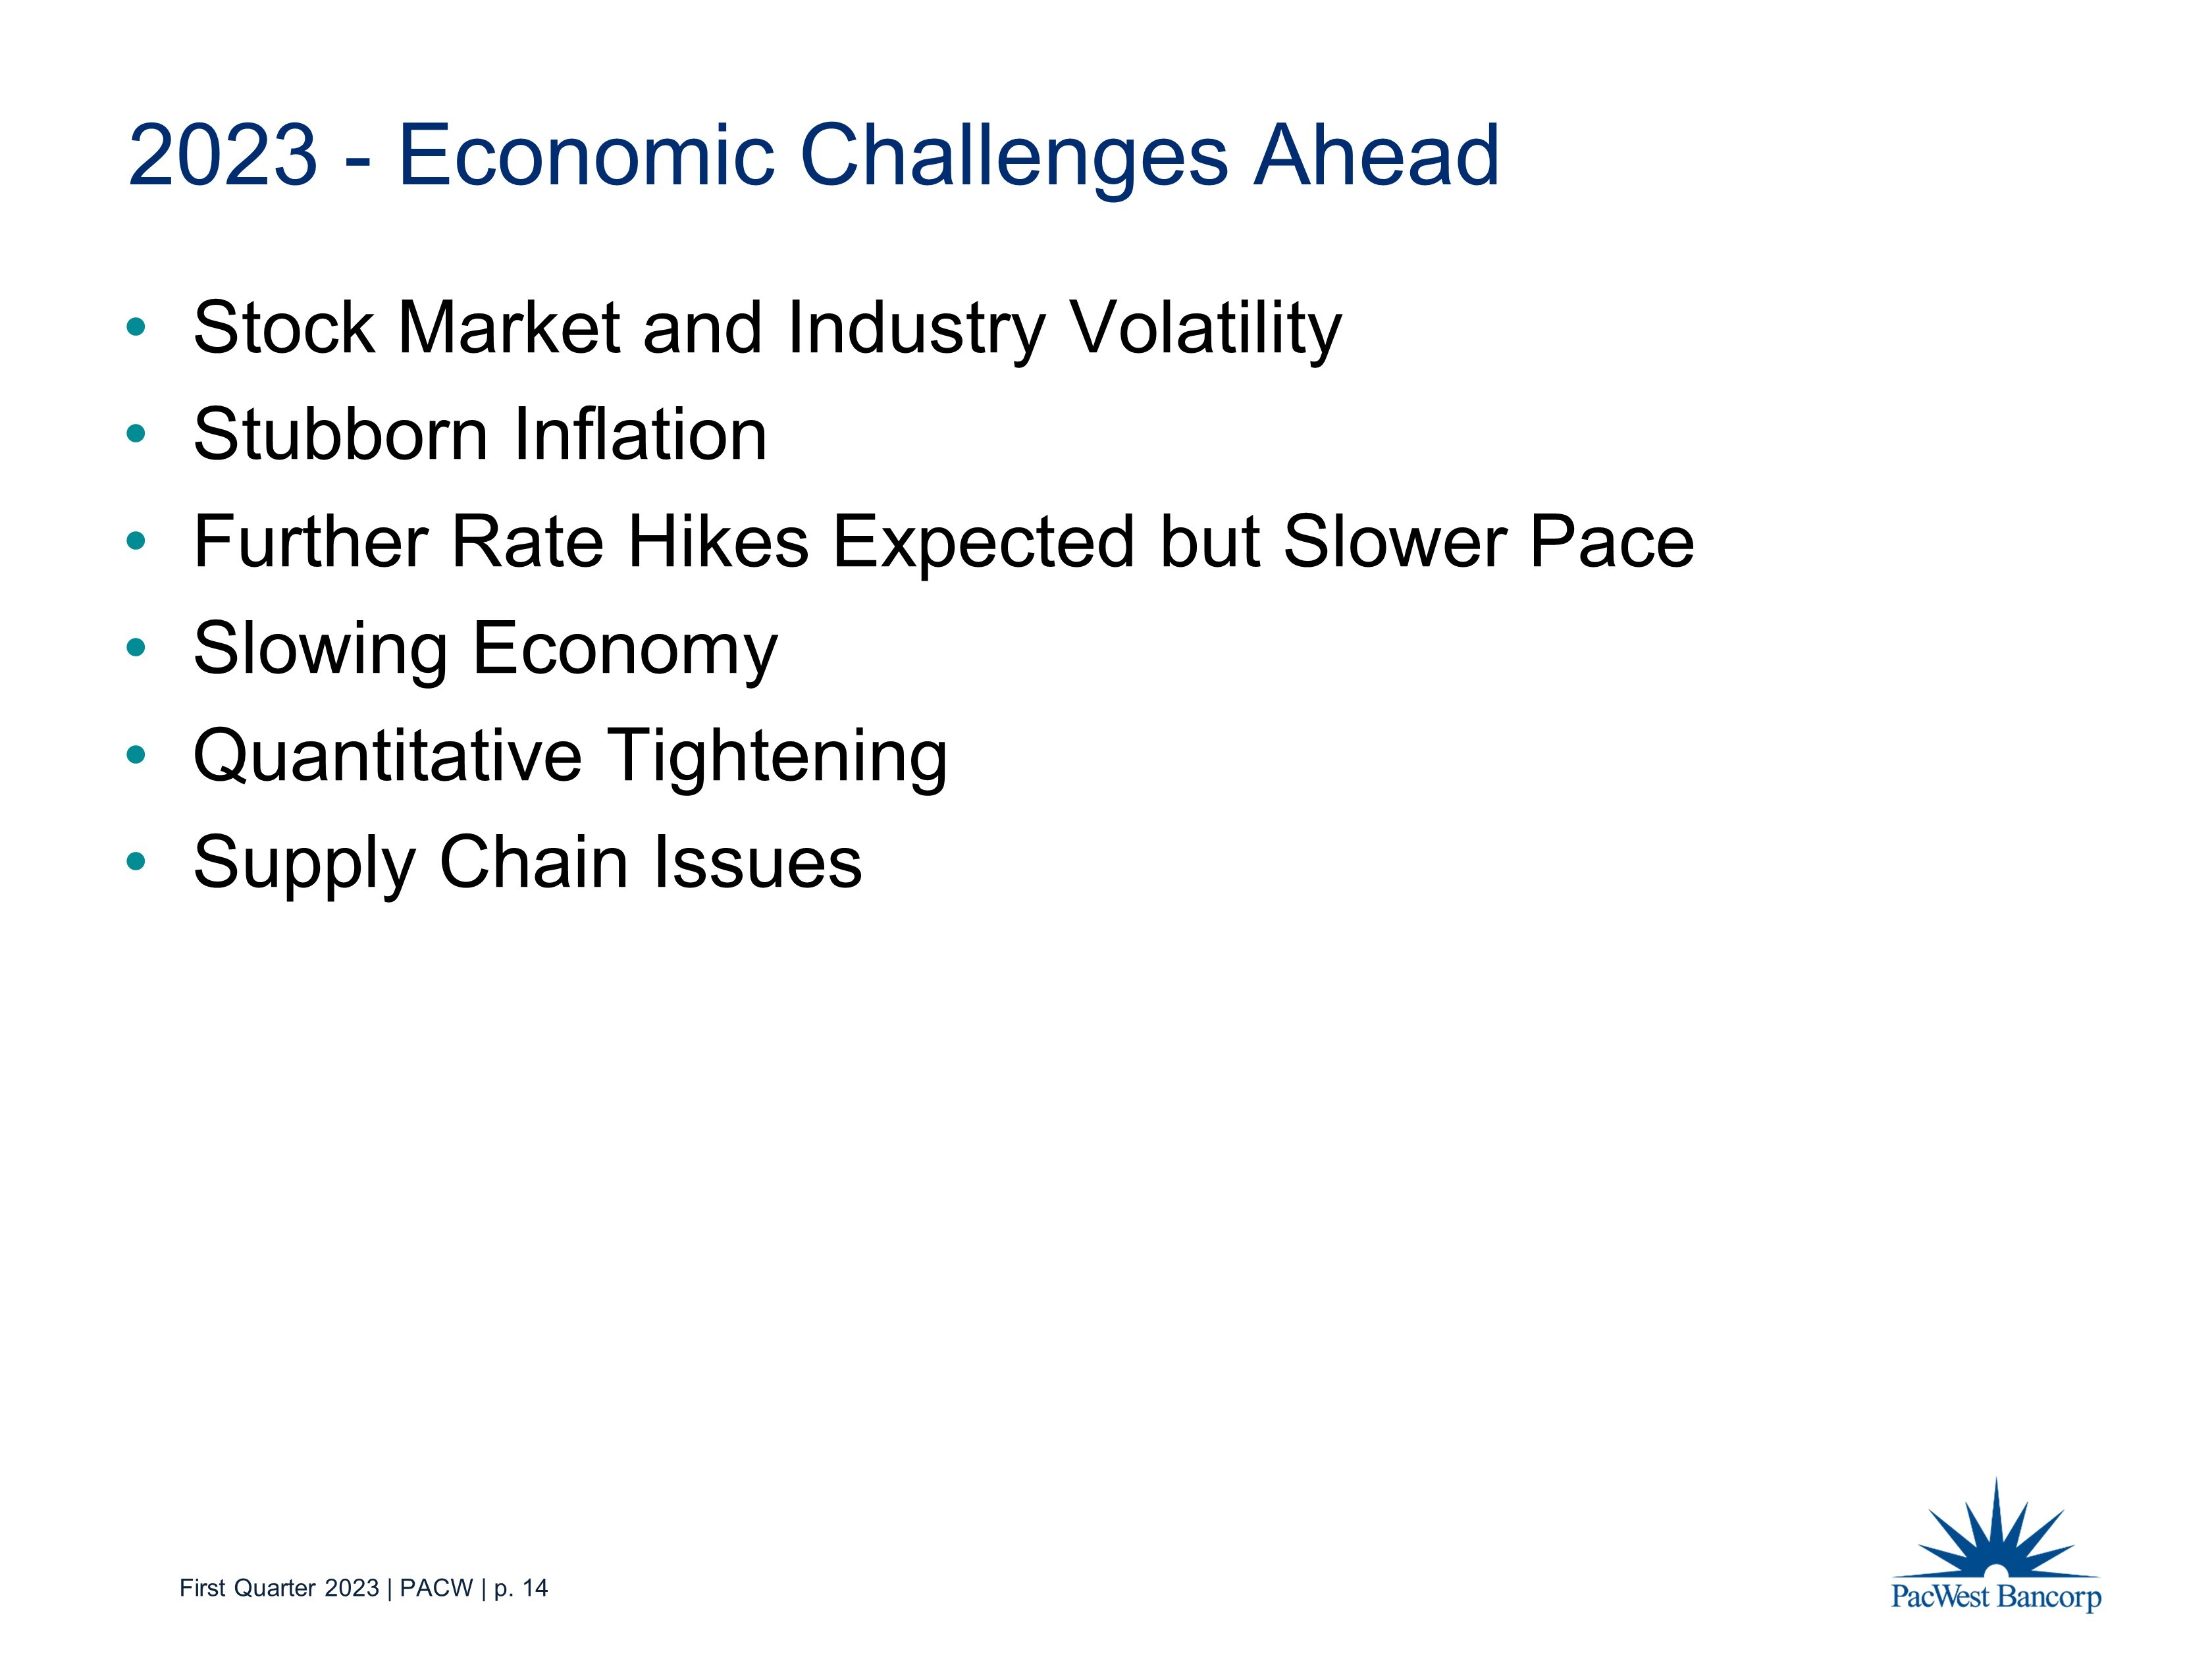
First Quarter 2023 | PACW | p. 14 2023 - Economic Challenges Ahead • Stock Market and Industry Volatility • Stubborn Inflation • Further Rate Hikes Expected but Slower Pace • Slowing Economy • Quantitative Tightening • Supply Chain Issues

First Quarter 2023 | PACW | p. 15 Appendix
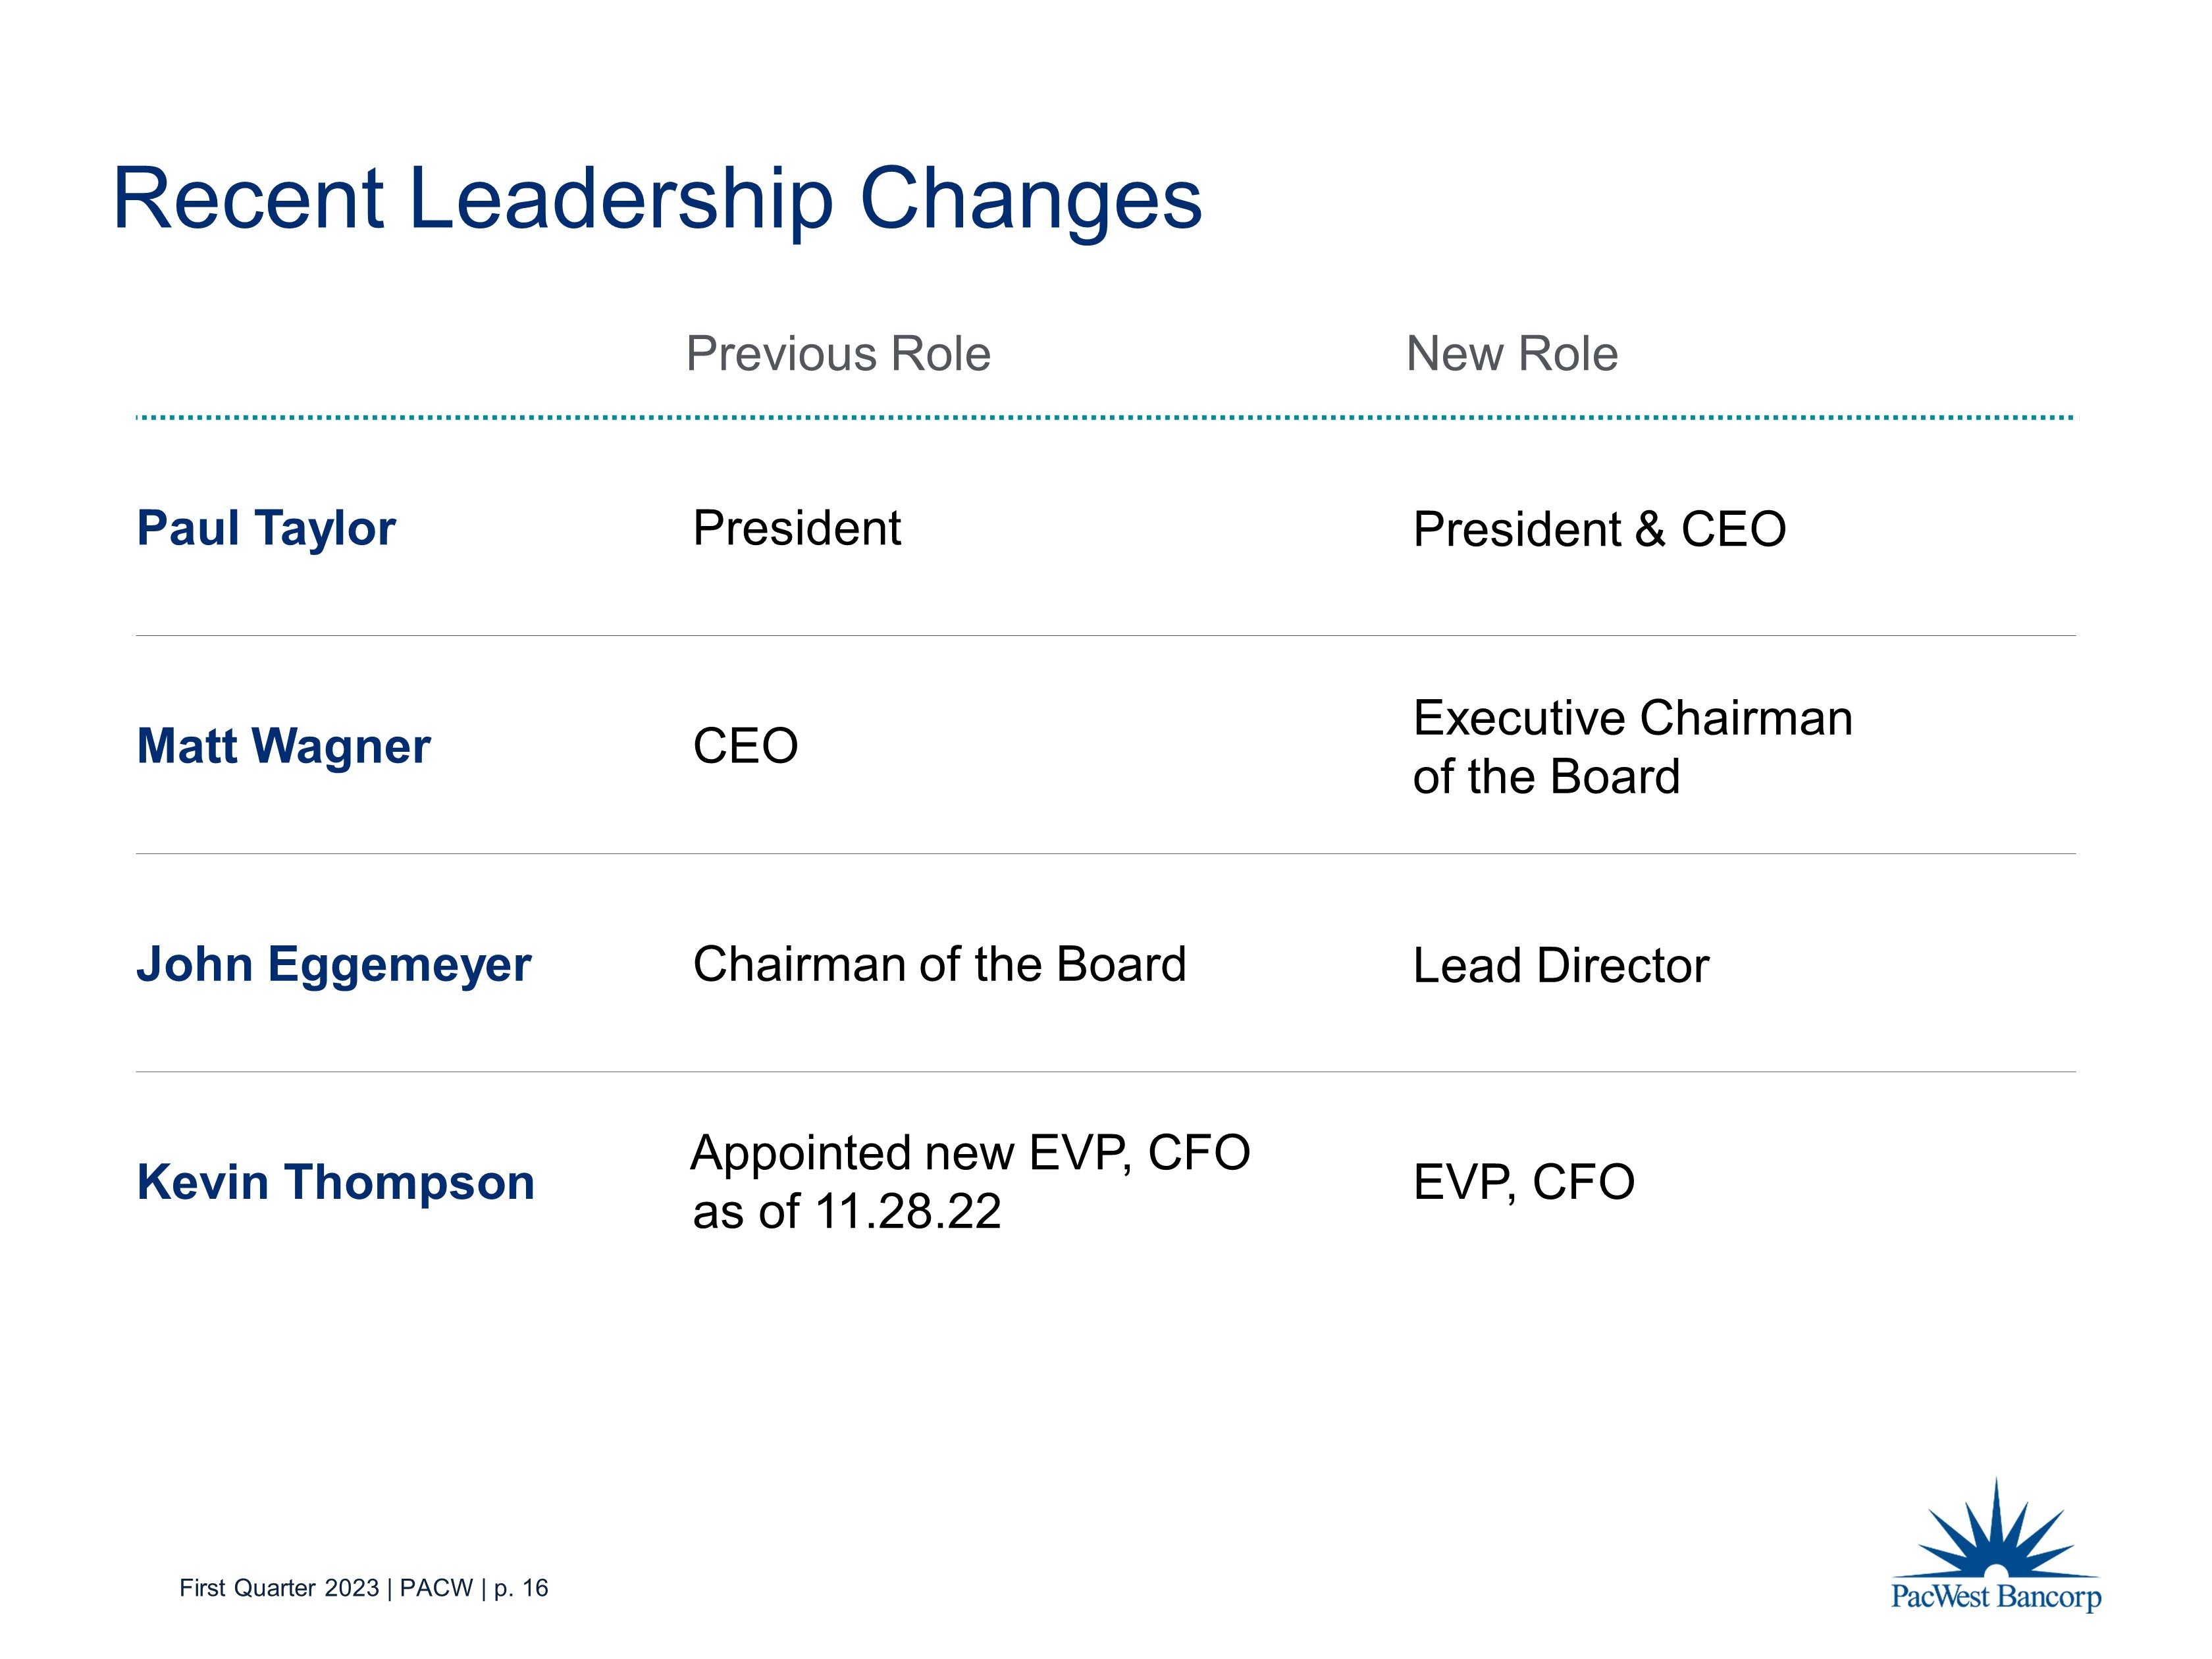
First Quarter 2023 | PACW | p. 16 Recent Leadership Changes Previous Role New Role Paul Taylor President President & CEO Matt Wagner CEO Executive Chairman of the Board John Eggemeyer Chairman of the Board Lead Director Kevin Thompson Appointed new EVP, CFO as of 11.28.22 EVP, CFO
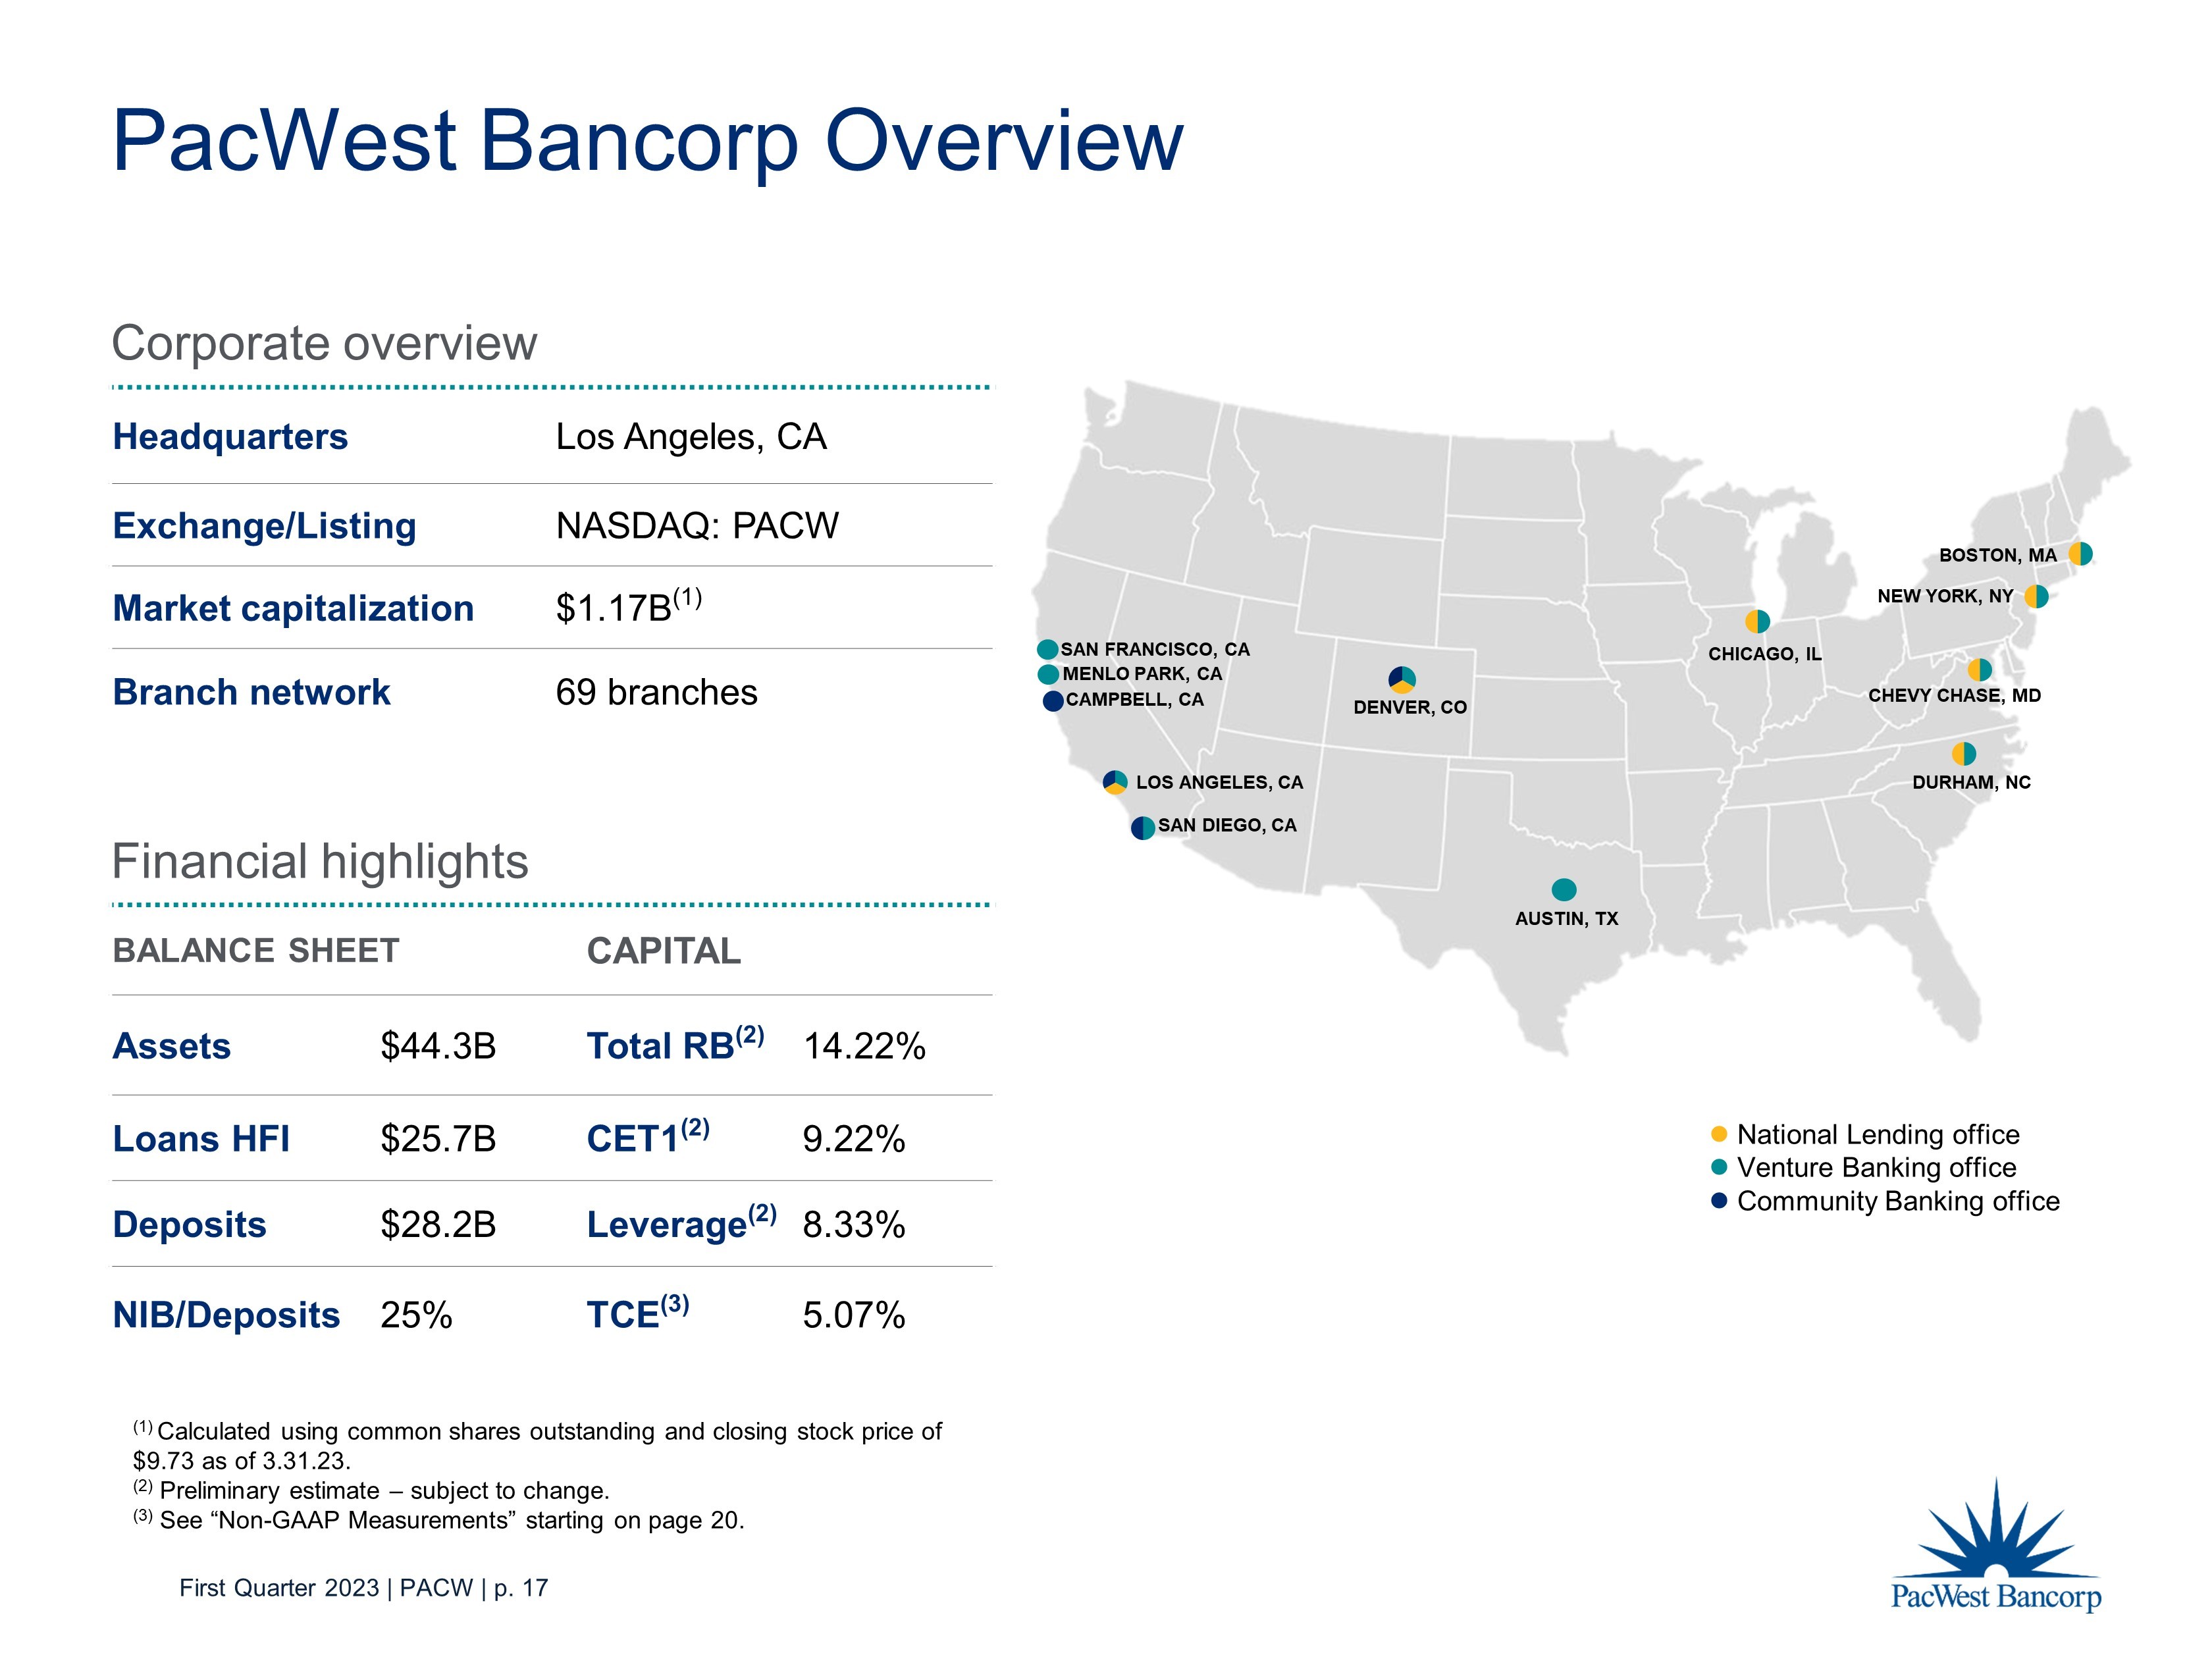
First Quarter 2023 | PACW | p. 17 PacWest Bancorp Overview Corporate overview Headquarters Los Angeles, CA Exchange/Listing NASDAQ: PACW Market capitalization $1.17B (1) Branch network 69 branches Financial highlights BALANCE SHEET CAPITAL Assets $ 44.3B Total RB (2) 14.22% Loans HFI $ 25.7B CET1 (2) 9.22% Deposits $28.2B Leverage (2) 8.33% NIB/Deposits 25% TCE (3) 5.07% National Lending office Venture Banking office Community Banking office (1) Calculated using common shares outstanding and closing stock price of $9.73 as of 3.31.23. (2) Preliminary estimate – subject to change. (3) See “Non - GAAP Measurements” starting on page 20. LOS ANGELES, CA DURHAM, NC CHEVY CHASE, MD CHICAGO, IL DENVER, CO NEW YORK, NY BOSTON, MA AUSTIN, TX CAMPBELL, CA MENLO PARK, CA SAN FRANCISCO, CA SAN DIEGO, CA
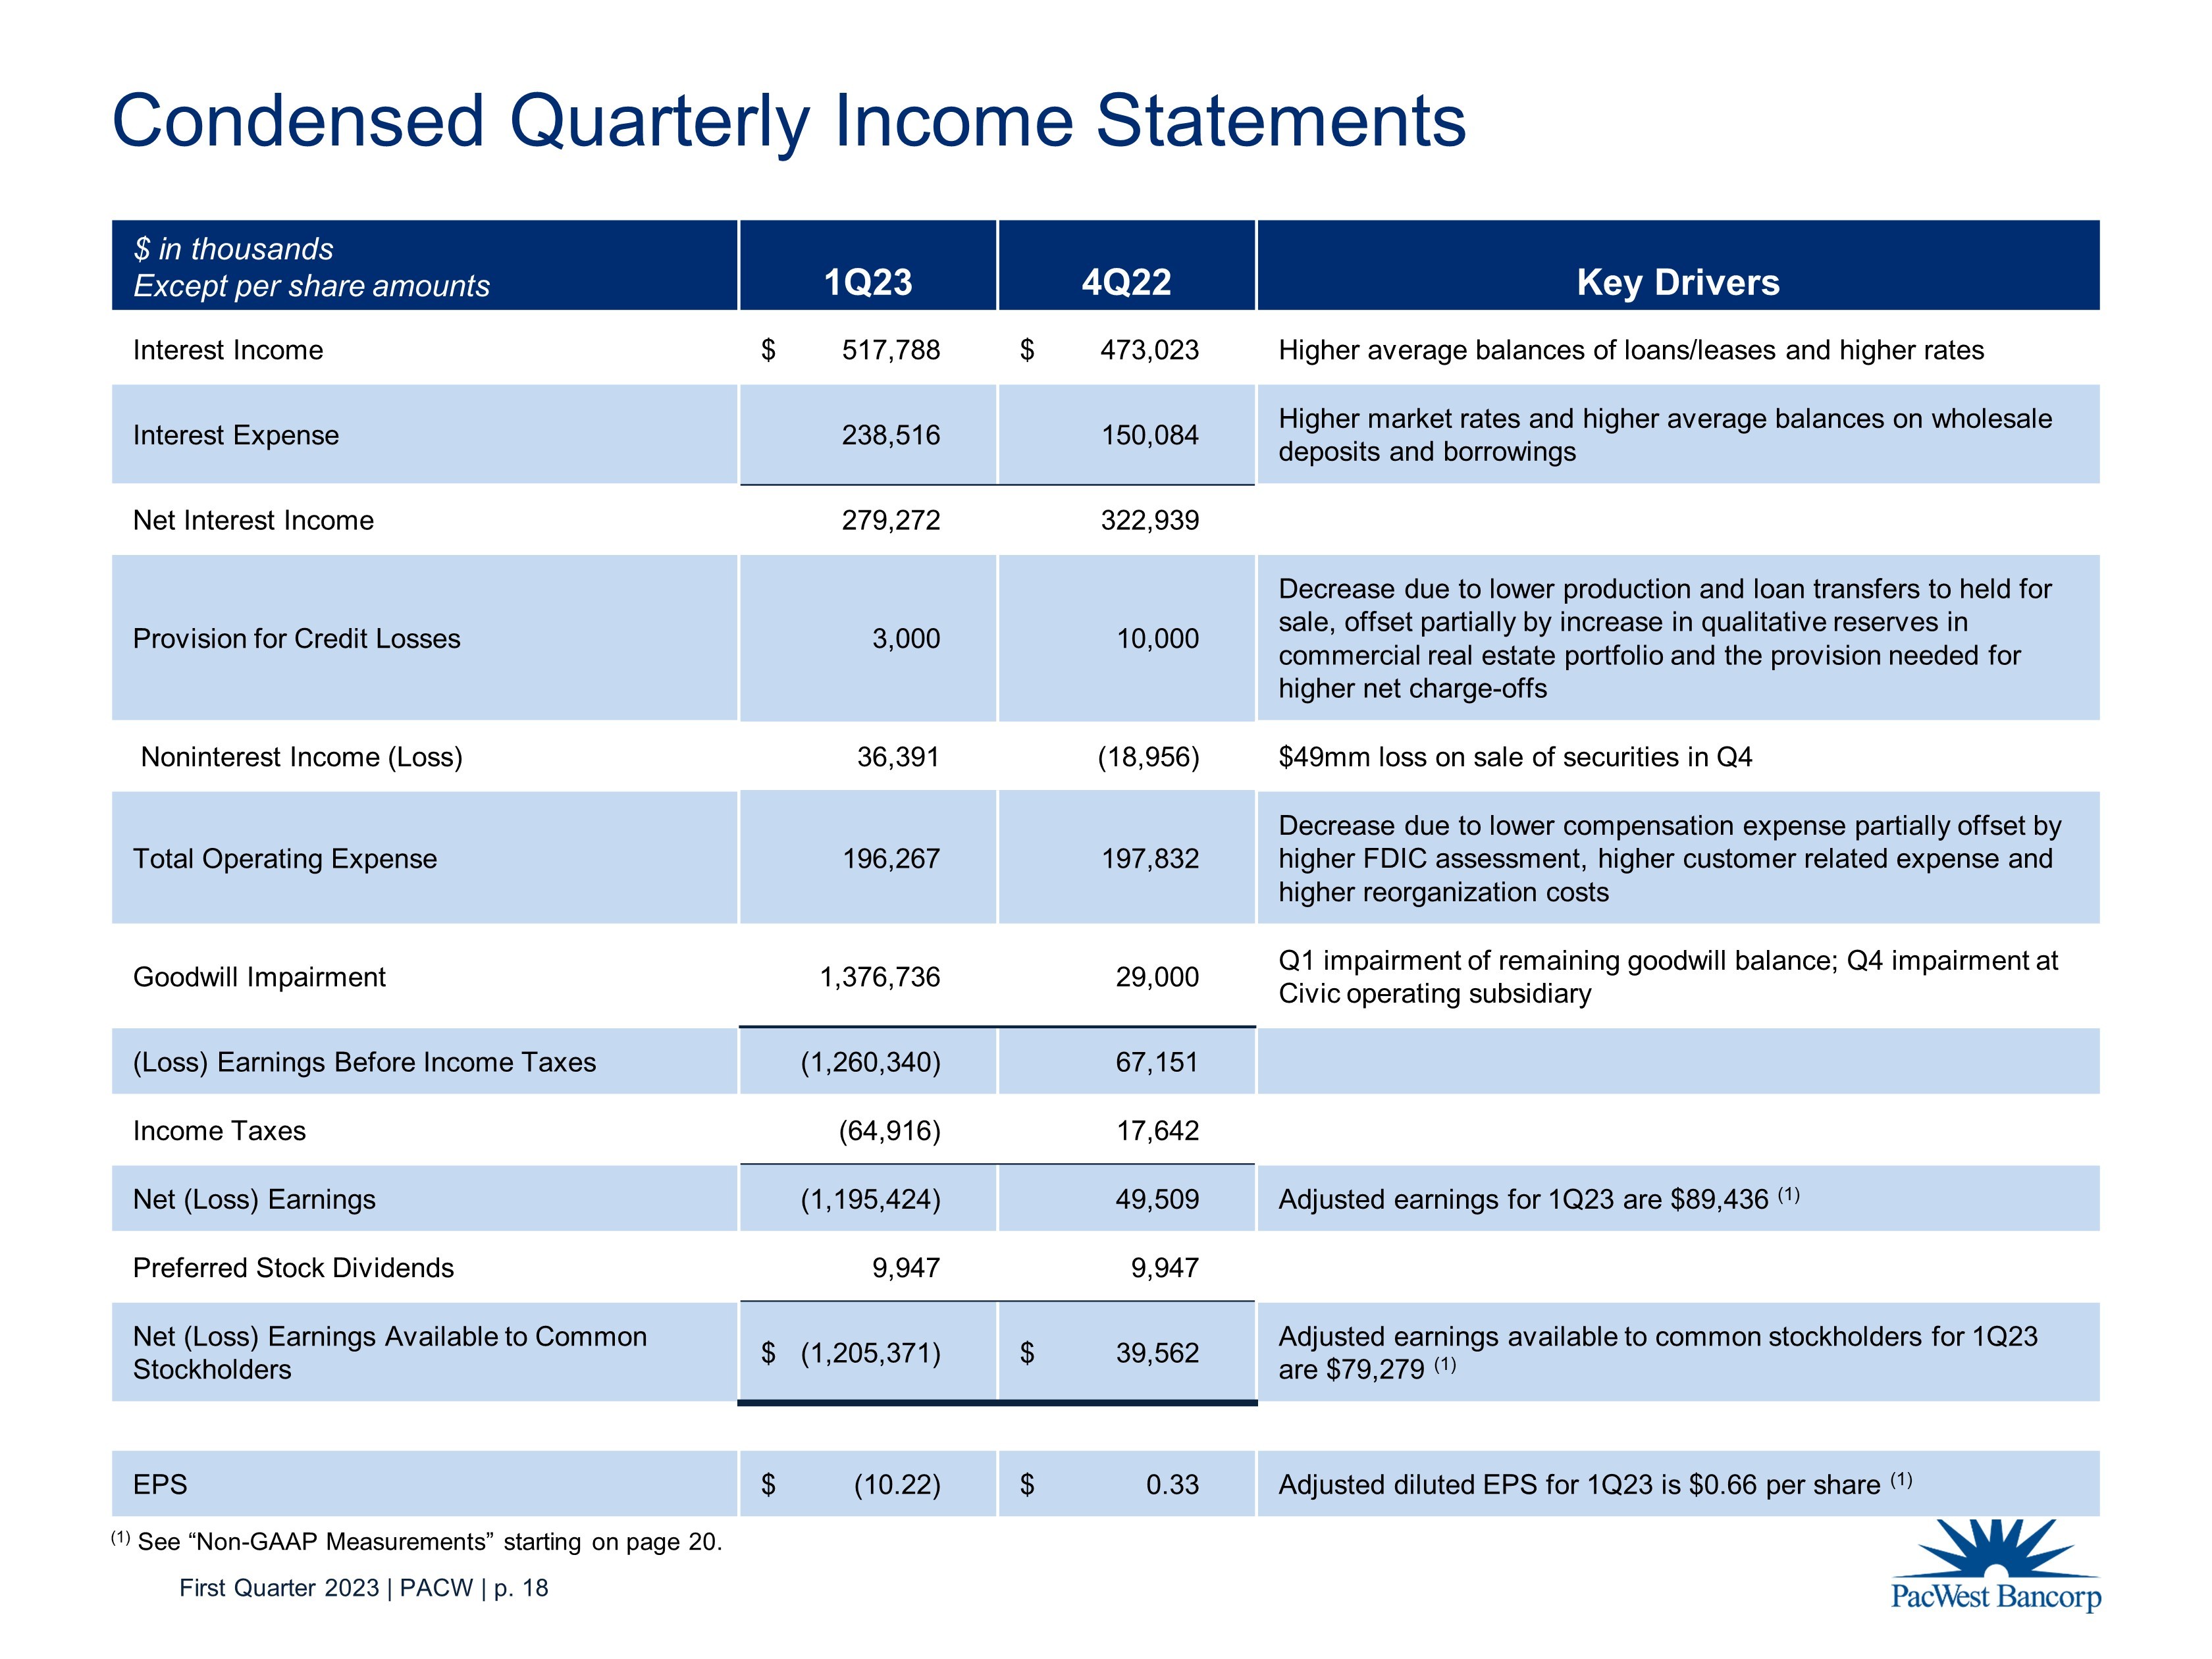
First Quarter 2023 | PACW | p. 18 Condensed Quarterly Income S tatements $ in thousands Except per share amounts 1Q23 4Q22 Key Drivers Interest Income $ 517,788 $ 473,023 Higher average balances of loans/leases and higher rates Interest Expense 238,516 150,084 Higher market rates and higher average balances on wholesale deposits and borrowings Net Interest Income 279,272 322,939 Provision for Credit Losses 3,000 10,000 Decrease due to lower production and loan transfers to held for sale, offset partially by increase in qualitative reserves in commercial real estate portfolio and the provision needed for higher net charge - offs Noninterest Income (Loss) 36,391 (18,956) $49mm loss on sale of securities in Q4 Total Operating Expense 196,267 197,832 Decrease due to lower compensation expense partially offset by higher FDIC assessment, higher customer related expense and higher reorganization costs Goodwill Impairment 1,376,736 29,000 Q1 impairment of remaining goodwill balance; Q4 impairment at Civic operating subsidiary (Loss) Earnings Before Income Taxes (1,260,340) 67,151 Income Taxes (64,916) 17,642 Net (Loss) Earnings (1,195,424) 49,509 Adjusted earnings for 1Q23 are $89,436 (1) Preferred Stock Dividends 9,947 9,947 Net (Loss) Earnings Available to Common Stockholders $ (1,205,371) $ 39,562 Adjusted earnings available to common stockholders for 1Q23 are $79,279 (1) EPS $ (10.22) $ 0.33 Adjusted diluted EPS for 1Q23 is $0.66 per share (1) (1) See “Non - GAAP Measurements” starting on page 20.
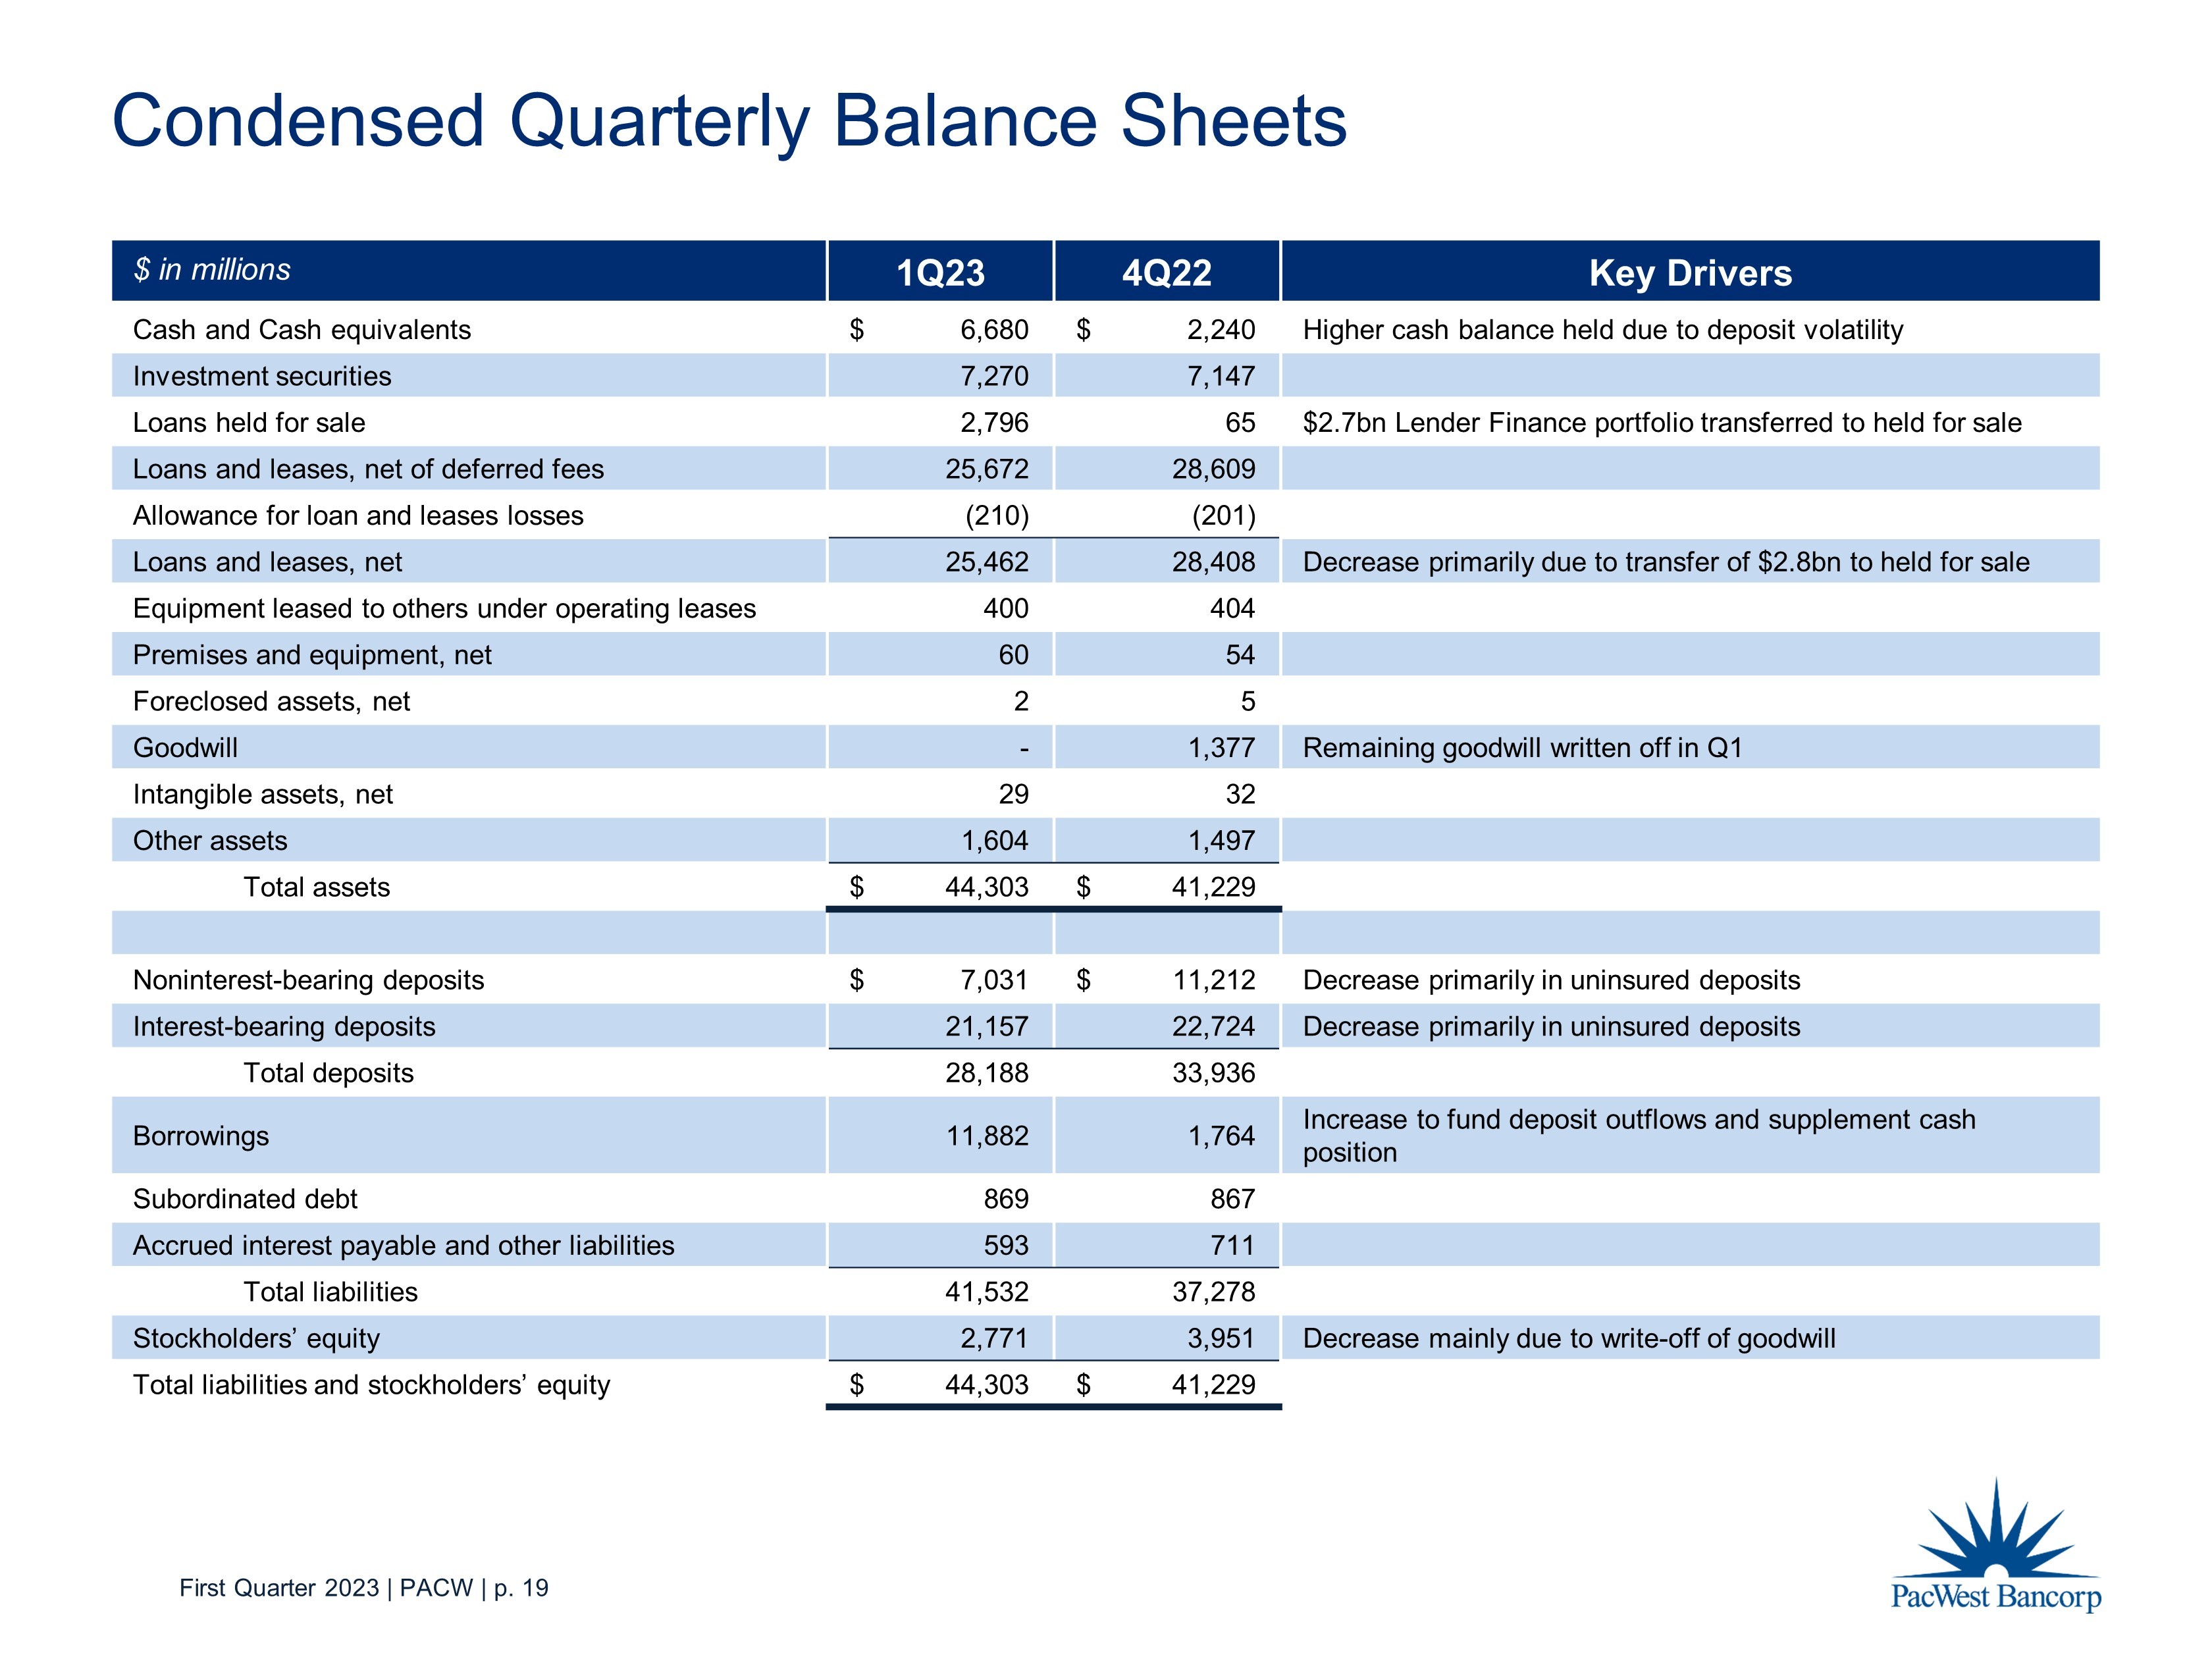
First Quarter 2023 | PACW | p. 19 Condensed Quarterly Balance Sheets $ in millions 1Q23 4Q22 Key Drivers Cash and Cash equivalents $ 6,680 $ 2,240 Higher cash balance held due to deposit volatility Investment securities 7,270 7,147 Loans held for sale 2,796 65 $2.7bn Lender Finance portfolio transferred to held for sale Loans and leases, net of deferred fees 25,672 28,609 Allowance for loan and lease s losses (210) (201) Loans and leases, net 25,462 28,408 Decrease primarily due to transfer of $2.8bn to held for sale Equipment leased to others under operating leases 400 404 Premises and equipment, net 60 54 Foreclosed assets, net 2 5 Goodwill - 1,377 Remaining goodwill written off in Q1 Intangible assets, net 29 32 Other assets 1,604 1,497 Total assets $ 44,303 $ 41,229 Noninterest - bearing deposits $ 7,031 $ 11,212 Decrease primarily in uninsured deposits Interest - bearing deposits 21,157 22,724 Decrease primarily in uninsured deposits Total deposits 28,188 33,936 Borrowings 11,882 1,764 Increase to fund deposit outflows and supplement cash position Subordinated debt 869 867 Accrued interest payable and other liabilities 593 711 Total liabilities 41,532 37,278 Stockholders’ equity 2,771 3,951 Decrease mainly due to write - off of goodwill Total liabilities and stockholders’ equity $ 44,303 $ 41,229
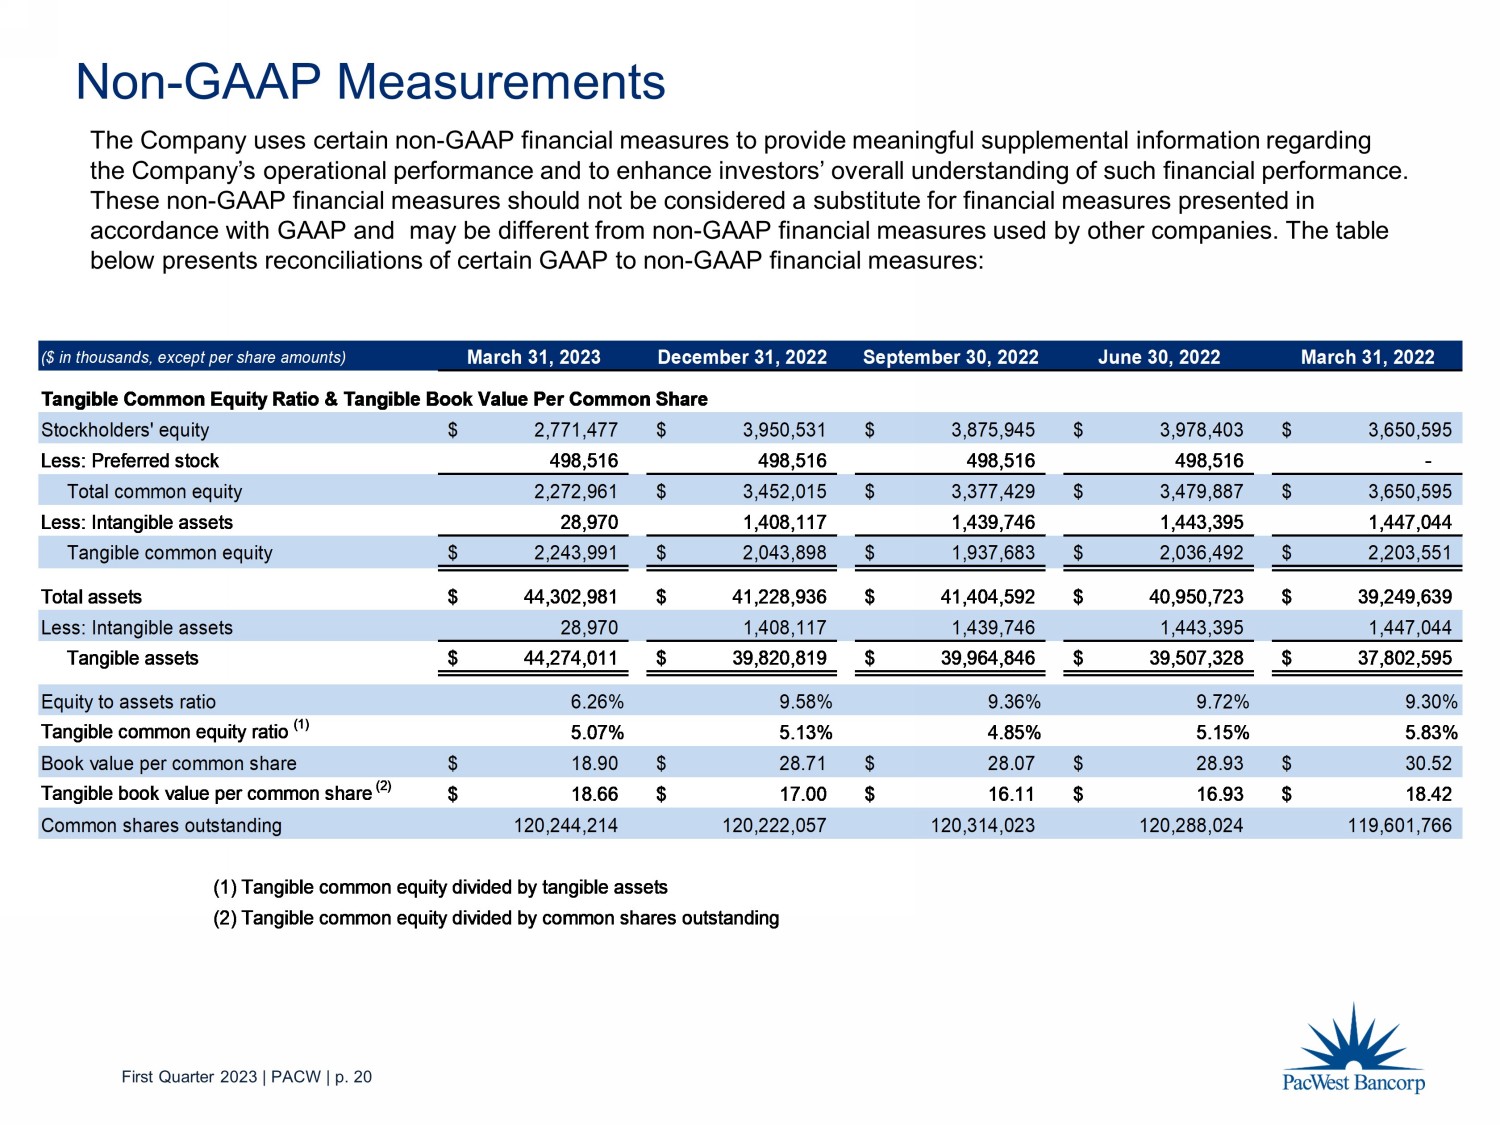
First Quarter 2023 | PACW | p. 20 Non - GAAP Measurements The Company uses certain non - GAAP financial measures to provide meaningful supplemental information regarding the Company’s operational performance and to enhance investors’ overall understanding of such financial performance. These non - GAAP financial measures should not be considered a substitute for financial measures presented in accordance with GAAP and may be different from non - GAAP financial measures used by other companies. The table below presents reconciliations of certain GAAP to non - GAAP financial measures: ($ in thousands, except per share amounts) March 31, 2023 December 31, 2022 September 30, 2022 June 30, 2022 March 31, 2022 Tangible Common Equity Ratio & Tangible Book Value Per Common Share Stockholders' equity 2,771,477$ 3,950,531$ 3,875,945$ 3,978,403$ 3,650,595$ Less: Preferred stock 498,516 498,516 498,516 498,516 - Total common equity 2,272,961 3,452,015$ 3,377,429$ 3,479,887$ 3,650,595$ Less: Intangible assets 28,970 1,408,117 1,439,746 1,443,395 1,447,044 Tangible common equity 2,243,991$ 2,043,898$ 1,937,683$ 2,036,492$ 2,203,551$ Total assets 44,302,981$ 41,228,936$ 41,404,592$ 40,950,723$ 39,249,639$ Less: Intangible assets 28,970 1,408,117 1,439,746 1,443,395 1,447,044 Tangible assets 44,274,011$ 39,820,819$ 39,964,846$ 39,507,328$ 37,802,595$ Equity to assets ratio 6.26% 9.58% 9.36% 9.72% 9.30% Tangible common equity ratio (1) 5.07% 5.13% 4.85% 5.15% 5.83% Book value per common share 18.90$ 28.71$ 28.07$ 28.93$ 30.52$ Tangible book value per common share (2) 18.66$ 17.00$ 16.11$ 16.93$ 18.42$ Common shares outstanding 120,244,214 120,222,057 120,314,023 120,288,024 119,601,766 (1) Tangible common equity divided by tangible assets (2) Tangible common equity divided by common shares outstanding
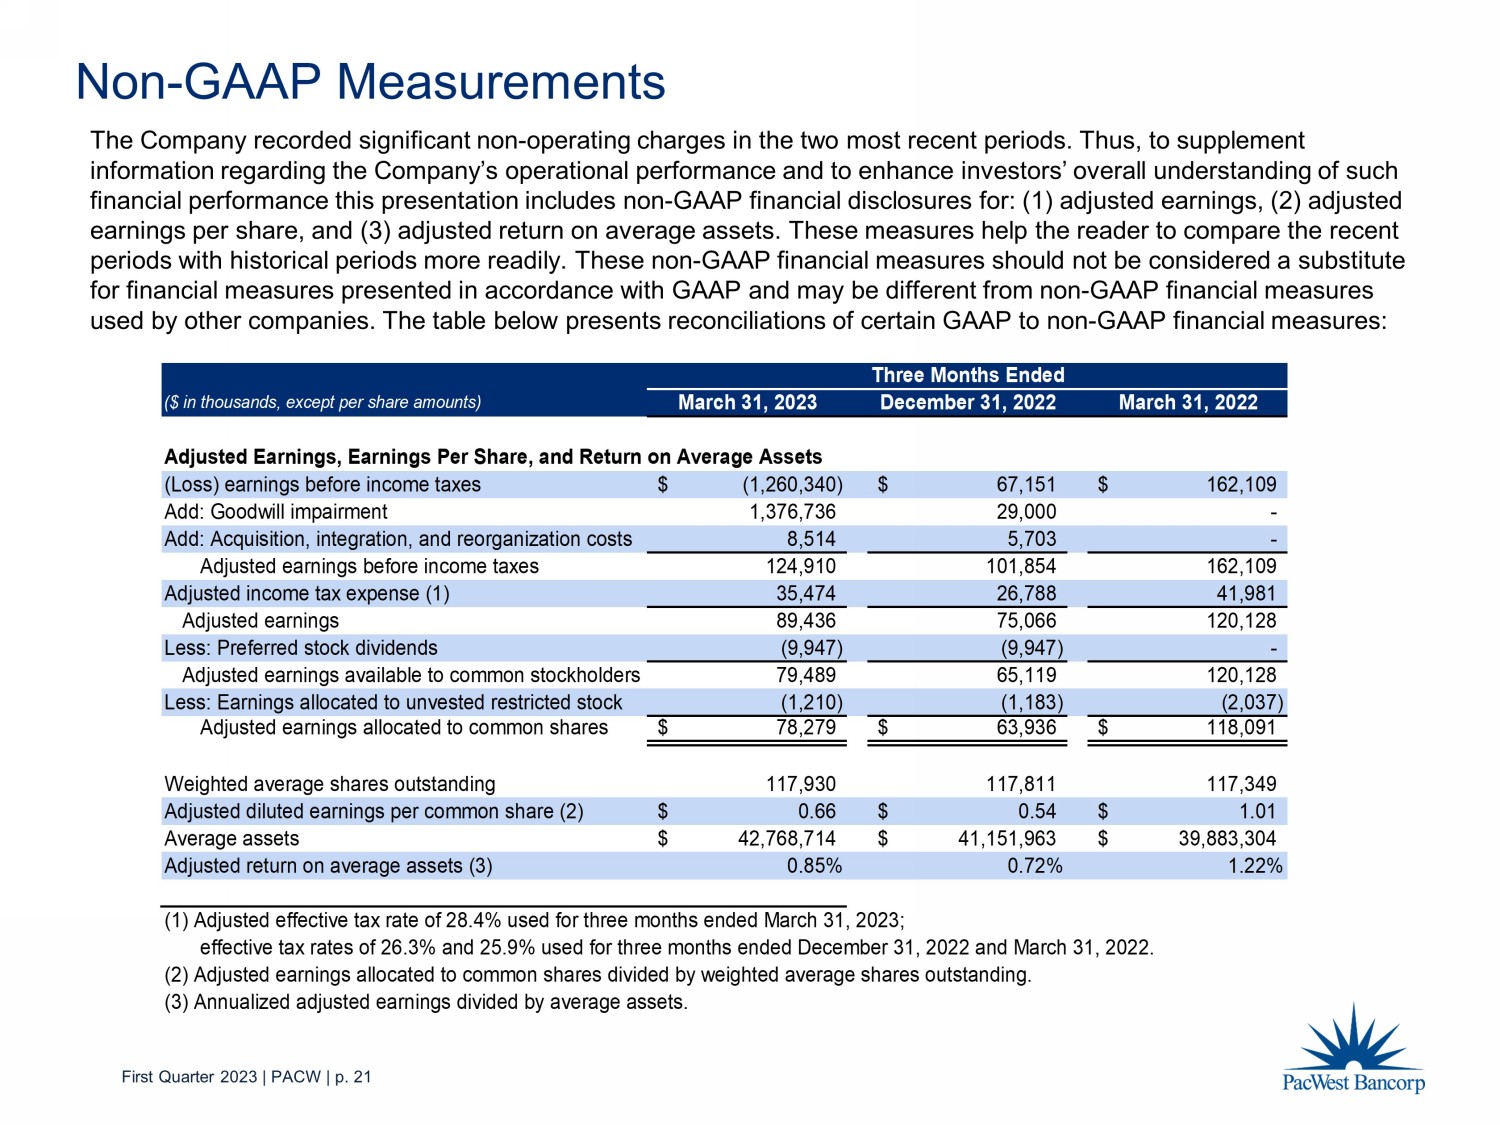
First Quarter 2023 | PACW | p. 21 ($ in thousands, except per share amounts) March 31, 2023 December 31, 2022 September 30, 2022 Adjusted Earnings, Earnings Per Share, and Return on Average Assets (Loss) earnings before income taxes (1,260,340)$ 67,151$ 162,109$ Add: Goodwill impairment 1,376,736 29,000 - Add: Acquisition, integration, and reorganization costs 8,514 5,703 - Adjusted earnings before income taxes 124,910 101,854 162,109 Adjusted income tax expense (1) 35,474 26,788 41,981 Adjusted earnings 89,436 75,066 120,128 Less: Preferred stock dividends (9,947) (9,947) - Adjusted earnings available to common stockholders 79,489 65,119 120,128 Less: Earnings allocated to unvested restricted stock (1,210) (1,183) (2,037) Adjusted earnings allocated to common shares 78,279$ 63,936$ 118,091$ Weighted average shares outstanding 117,930 117,811 117,349 Adjusted diluted earnings per common share (2) 0.66$ 0.54$ 1.01$ Average assets 42,768,714$ 41,151,963$ 39,883,304$ Adjusted return on average assets (3) 0.85% 0.72% 1.22% (1) Adjusted effective tax rate of 28.4% used for three months ended March 31, 2023; effective tax rates of 26.3% and 25.9% used for three months ended December 31, 2022 and March 31, 2022. (2) Adjusted earnings allocated to common shares divided by weighted average shares outstanding. (3) Annualized adjusted earnings divided by average assets. Three Months Ended Non - GAAP Measurements The Company recorded significant non - operating charges in the two most recent periods. Thus, to supplement information regarding the Company’s operational performance and to enhance investors’ overall understanding of such financial performance this presentation includes non - GAAP financial disclosures for: (1) adjusted earnings, (2) adjusted earnings per share, and (3) adjusted return on average assets. These measures help the reader to compare the recent periods with historical periods more readily. These non - GAAP financial measures should not be considered a substitute for financial measures presented in accordance with GAAP and may be different from non - GAAP financial measures used by other companies. The table below presents reconciliations of certain GAAP to non - GAAP financial measures:
First Quarter 2023 | PACW | p. 22 Forward - Looking Statements This communication contains certain forward - looking information about PacWest Bancorp (“PacWest”) that is intended to be covered by the safe harbor for “forward - looking statements” provided by the Private Securities Litigation Reform Act of 1995. Statements that are not historical or current facts, including statements about future financial and operational results, exp ect ations, or intentions are forward - looking statements. Such statements often use words such as “anticipates,” “targets,” “expects,” “estimates,” intends,” “plans,” “believes,” “continue” and other similar expressions or future or conditional verbs such as “ wil l,” “may,” “might,” “should,” “would” and “could.” Such statements are based on information available at the time of the communication and are based on current beliefs and expectations of the PacWest’s management and are subject to significant risks, uncertainties and contingencies, many of which are beyond our control, which may cause actual results, performance, or achievements to differ materially from those expressed in them. Continued deterioration in general business, economic, and political conditions, geopolitical tensions, uncertainty in U.S. fiscal monetary policy, including the interest rate policies of the Federal Reserve Board, and volatility and disruptions in credit and capital markets could lead to a tightening of credit and an increase of credit losses, adversely affect PacWest’s revenues and the values of our assets and liabilities, increase stock p ric e volatility, and adversely impact our ability to raise capital. In addition, PacWest and its results could be adversely affect ed by changes in interest rates, continued high inflation, and unemployment rates, our ability to attract and retain deposits and o the r sources of funding and liquidity particularly in a rising or high interest rate environment, the impact of bank failures or o the r adverse developments at other banks on general investor sentiment regarding the stability and liquidity of banks, the safety of deposits, and depositor behavior, the quality and composition of our deposits, deterioration in the credit quality of our loa n p ortfolio or in the value of the collateral securing those loans, especially the risks associated with concentrations in real estate re lat ed loans, deterioration in the value of our investment securities as a result of rising interest rates or otherwise, our ability to successfully execute on our planned asset sales, strategic plan, and digital and innovation initiatives, the effectiveness of ou r risk management framework and quantitative models, and legal and regulatory developments. Actual results may differ materially from those set forth or implied in the forward - looking statements due to a variety of factors, including the risk factors described i n documents filed by PacWest with the U.S. Securities and Exchange Commission. All forward - looking statements in this communication are based on information available at the time the statement is made. We are under no obligation (and expressly disclaim any such obligation) to update or alter our forward - looking statements, whether as a result of new information, future events or otherwise, except as required by law .