Form 20-F  Form 40-F
Form 40-F
Form 40-F
|
Media Release
Zurich, April 24, 2023
|
 |
|
Reported (CHF mn)
|
1Q23
|
4Q22
|
1Q22
|
Δ4Q22
|
Δ1Q22
|
|
Net revenues
|
18,467
|
3,060
|
4,412
|
-
|
319%
|
|
Provision for credit losses
|
83
|
41
|
(110)
|
-
|
-
|
|
Total operating expenses
|
5,620
|
4,334
|
4,950
|
30%
|
14%
|
|
Pre-tax income/(loss)
|
12,764
|
(1,315)
|
(428)
|
-
|
-
|
|
Income tax expense/(benefit)
|
345
|
82
|
(151)
|
321%
|
-
|
|
Net income/(loss) attributable to shareholders
|
12,432
|
(1,393)
|
(273)
|
-
|
-
|
|
Return on tangible equity
|
117.5%
|
(13.5)%
|
(2.6)%
|
-
|
-
|
|
Cost/income ratio
|
30.4%
|
142%
|
112%
|
-
|
-
|
|
Net New Assets (NNA)/Net Asset Outflows - CHF bn
|
(61.2)
|
(110.5)
|
7.9
|
-
|
-
|
|
Assets under Management (AuM) - CHF bn
|
1,253
|
1,294
|
1,555
|
(3)%
|
(19)%
|
|
|
|||||
|
Adjusted* (CHF mn)
|
1Q23
|
4Q22
|
1Q22
|
Δ4Q22
|
Δ1Q22
|
|
Net revenues
|
2,734
|
2,964
|
4,582
|
(8)%
|
(40)%
|
|
Provision for credit losses
|
83
|
41
|
45
|
-
|
-
|
|
Total operating expenses
|
3,966
|
3,938
|
4,237
|
1%
|
(6)%
|
|
Pre-tax income/(loss)
|
(1,316)
|
(1,015)
|
300
|
-
|
-
|
|
|
|||||
|
Capital ratios
|
1Q23
|
4Q22
|
1Q22
|
Δ4Q22
|
Δ1Q22
|
|
CET1 ratio
|
20.3%
|
14.1%
|
13.8%
|
-
|
-
|
|
CET1 ratio excl. AT1 write-down
|
14.3%
|
||||
|
Tier 1 leverage ratio
|
7.6%
|
7.7%
|
6.1%
|
-
|
-
|
|
CET1 leverage ratio
|
7.6%
|
5.4%
|
4.3%
|
-
|
-
|
|
Media Release
Zurich, April 24, 2023
|
|
|
◾
|
In WM, net asset outflows in 1Q23 represented 9% of AuM reported as of the end of 4Q22.
|
|
◾
|
In the SB, net asset outflows in 1Q23 represented 1% of AuM reported as of the end of 4Q22.
|
|
◾
|
In Asset Management (AM), net asset outflows in 1Q23 represented 3% of AuM reported as of the end of 4Q22.
|
|
◾
|
SPG: Achieved approximately USD 48 bn reduction in the asset equivalent exposures of SPG and related financing
|
|
Media Release
Zurich, April 24, 2023
|
|
|
◾
|
Non-Core Unit (NCU): Reduced Risk Weighted Assets (RWA) and leverage exposure by approximately USD 4 bn and approximately USD 14 bn1, respectively since 4Q22.
|
|
◾
|
Cost actions: Progress on cost transformation program with adjusted* operating expenses 6% lower YoY in 1Q23 due to lower general and administrative expenses and compensation and benefits. Achieved reduction in number of
employees of approximately 9% since 3Q222.
|
|
◾
|
CS First Boston: Credit Suisse Group AG, and M. Klein & Co LLC have mutually agreed to terminate the acquisition of The Klein Group, LLC (i.e., the investment banking business of M. Klein & Co. LLC) by Credit Suisse
considering Credit Suisse’s recently announced merger with UBS Group AG.
|
|
Wealth Management (WM)
|
|
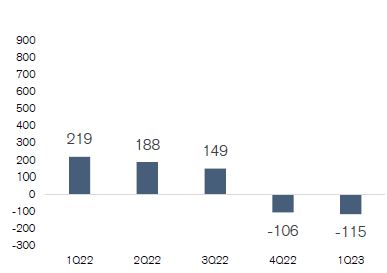 Restated adjusted* pre-tax income/loss QoQ in CHF million
|
1Q23
◾ WM’s
adjusted* net revenues were down 33% vs. 1Q22. Net interest income was down 37%, mainly reflecting lower loan margins on lower average loan volumes, higher costs related to interest rate management and higher funding
costs, partially offset by higher deposit margins despite significantly lower average deposit volumes. Recurring commissions and fees declined 17%, reflecting lower average AuM. Transaction- and performance-based revenues were down
43%, primarily due to reduced client activity, but were 9% higher QoQ.
◾ Adjusted* operating expenses in WM were down 8% vs. 1Q22. This
was due to lower general and administrative expenses, driven by lower professional services fees and allocated corporate function costs.
◾ WM had an adjusted* 1Q23 pre-tax loss of CHF 115 mn. The reported pre-tax loss of CHF 1.5 bn includes a
goodwill impairment charge of CHF 1.3 bn and restructuring expenses of CHF 46 mn.
◾ WM experienced net asset outflows of CHF 47.1 bn in 1Q23 driven by outflows across all regions.
|
|
Swiss Bank (SB)
|
|
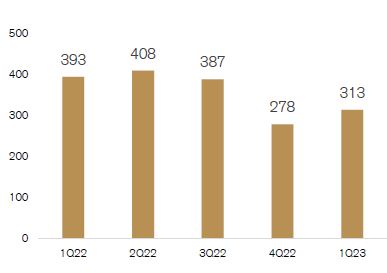 Restated adjusted* pre-tax income QoQ in CHF million
|
1Q23
◾ Adjusted* net revenues were down 8% vs. 1Q22. Net interest income was down 11% YoY. Higher deposit income was
offset by decreased income from loans, as well as by the absence of SNB threshold benefits following the increase of interest rates. Net interest income in 1Q23 was down 2% compared to 4Q22. Recurring commissions and fees declined 8%
YoY, which reflected lower average AuM. Transaction-based revenues were down 12% due to decreased client activity and lower revenues from the Swiss investment banking business.
◾ Adjusted* operating expenses were down 3% vs. 1Q22. This was driven by lower discretionary compensation
expenses as well as decreased Group-wide operating costs.
◾ The SB had an adjusted* pre-tax income of CHF 313 mn, down 20% vs. 1Q22. This reflects the lower net revenues
and higher non- specific provisions for credit losses, which were partially offset by lower operating expenses.
◾ The net asset outflows of CHF 6.9 bn in 1Q23 mainly reflected outflows in the private clients business.
|
|
Media Release
Zurich, April 24, 2023
|
|
|
Asset Management (AM)
|
|
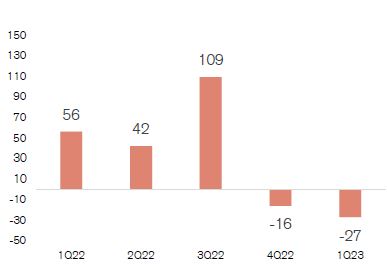
Restated adjusted* pre-tax income QoQ in CHF million
|
1Q23
◾ Adjusted* net revenues were down 45% vs. 1Q22 reflecting decreased investment and partnership income and lower
management fees, partially offset by higher performance and transaction revenues.
The decrease in investment and partnership income was mainly due to a currency translation adjustment and impairment on the planned partial disposal of
an investment.
◾ Adjusted* operating expenses were down 24% vs. 1Q22 primarily driven by lower expenses related to the Supply
Chain Finance Funds (SCFF) matter, reduced discretionary compensation expenses and declining commission expenses.
◾ The adjusted* pre-tax loss of CHF 27 mn compared to adjusted* pre- tax income of CHF 56 mn in 1Q22 and mainly
reflected reduced net revenues despite lower total operating expenses.
◾ AM experienced net asset outflows of CHF 11.6 bn. These were driven by outflows from traditional investments, in
particular fixed income and index solutions, and from alternative investments, primarily related to outflows in credit.
|
|
Investment Bank (IB)
|
|
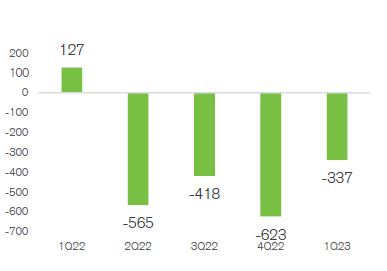 Restated adjusted* pre-tax income/loss QoQ in USD million
|
1Q23
◾ IB adjusted* net revenues of USD 1.1 bn increased 70% vs. 4Q22 but declined 37% vs. 1Q22. Performance was
impacted by less favorable markets conditions YoY exacerbated by previously disclosed issues affecting Credit Suisse, which led to lower client activity across businesses. These declines were partially offset by gains of USD 257 mn on
increased buyback activity principally in the structured notes portfolio across equities and fixed income at prices reflecting significantly wider own credit spreads. Equities Sales & Trading revenues of USD 457 mn declined 36% YoY
vs. a strong 1Q22, driven by lower revenues in Equity Derivatives and Cash Equities. Fixed Income revenues of USD 301 mn declined 5% as strong activity in Investment Grade trading and Rates was offset by reduced revenues in the Foreign
Exchange franchise. Capital Markets and Advisory revenue of USD 343 mn was down 51% vs. 1Q22 reflecting lower global fees across the industry and reduced market share.
◾ Adjusted* operating expenses of USD 1.4 bn were down 9% YoY due to reduced compensation and benefits and lower
revenue-related expenses.
◾ The IB had an adjusted* 1Q23 pre-tax loss of USD 337 mn. The IB reported a pre-tax loss of USD 487 mn, which
included restructuring expenses of USD 115 mn and goodwill impairment charge of USD 33 mn.
◾ Significantly reduced capital usage. The IB’s risk-weighted assets were down 1% and leverage exposure was down
7% vs.4Q22.
|
|
Media Release
Zurich, April 24, 2023
|
|
|
◾
|
Adjusted* net revenues were down USD 1.0 bn vs. 1Q22. This decrease was driven by a loss of revenues from businesses transferred from the IB, particularly from SPG. The CRU also saw losses
on the valuation of certain financing arrangements associated with the Apollo transaction.
|
|
◾
|
Adjusted* operating expenses of USD 686 mn were down 9% vs. 1Q22. The decrease in 1Q23 was driven by lower compensation and benefits and lower commission expenses. The decrease in
compensation and benefits reflected lower discretionary compensation expenses and lower salaries, primarily relating to the exit of prime services. The decrease in commission expenses was mainly driven by reduced trading activity,
most notably from the prime services business.
|
|
◾
|
The CRU had an adjusted* pre-tax loss of USD 1.1 bn. The reported pre-tax loss of USD 445 mn included primarily a USD 0.8bn gain on the sale of a significant part of the SPG to Apollo, partially
offset by a loss of revenues from businesses transferred from the IB, particularly from SPG.
|
|
Media Release
Zurich, April 24, 2023
|
|
|
Media Release
Zurich, April 24, 2023
|
|
|
Appendix
|
|
| Key metrics | |||||||||||
| in / end of | % change | ||||||||||
| 1Q23 | 4Q22 | 1Q22 | QoQ | YoY | |||||||
| Credit Suisse Group results (CHF million) | |||||||||||
| Net revenues | 18,467 | 3,060 | 4,412 | – | 319 | ||||||
| Provision for credit losses | 83 | 41 | (110) | 102 | – | ||||||
| Compensation and benefits | 2,398 | 2,062 | 2,458 | 16 | (2) | ||||||
| General and administrative expenses | 1,392 | 1,710 | 2,148 | (19) | (35) | ||||||
| Commission expenses | 207 | 210 | 298 | (1) | (31) | ||||||
| Goodwill impairment | 1,324 | – | 0 | – | – | ||||||
| Restructuring expenses | 299 | 352 | 46 | (15) | – | ||||||
| Total other operating expenses | 3,222 | 2,272 | 2,492 | 42 | 29 | ||||||
| Total operating expenses | 5,620 | 4,334 | 4,950 | 30 | 14 | ||||||
| Income/(loss) before taxes | 12,764 | (1,315) | (428) | – | – | ||||||
| Income tax expense/(benefit) | 345 | 82 | (151) | 321 | – | ||||||
| Net income/(loss) attributable to shareholders | 12,432 | (1,393) | (273) | – | – | ||||||
| Balance sheet statistics (CHF million) | |||||||||||
| Total assets | 540,291 | 531,358 | 739,554 | 2 | (27) | ||||||
| Risk-weighted assets | 243,431 | 250,540 | 273,043 | (3) | (11) | ||||||
| Leverage exposure | 653,047 | 650,551 | 878,023 | 0 | (26) | ||||||
| Assets under management and net new assets (CHF billion) | |||||||||||
| Assets under management | 1,252.6 | 1,293.6 | 1,554.9 | (3.2) | (19.4) | ||||||
| Net new assets/(net asset outflows) | (61.2) | (110.5) | 7.9 | (44.6) | – | ||||||
| Basel III regulatory capital and leverage statistics (%) | |||||||||||
| CET1 ratio | 20.3 | 14.1 | 13.8 | – | – | ||||||
| CET1 leverage ratio | 7.6 | 5.4 | 4.3 | – | – | ||||||
| Tier 1 leverage ratio | 7.6 | 7.7 | 6.1 | – | – | ||||||
|
Appendix
|
|
| Reconciliation of adjustment items | |||||||
| Group | |||||||
| in | 1Q23 | 4Q22 | 1Q22 | ||||
| Results (CHF million) | |||||||
| Net revenues | 18,467 | 3,060 | 4,412 | ||||
| Real estate (gains)/losses | (1) | (191) | (164) | ||||
| (Gains)/losses on business sales | (726) | 0 | 3 | ||||
| (Gain)/loss on InvestLab/Allfunds Group | 0 | 75 | 353 | ||||
| (Gain)/loss on equity investment in SIX Group AG | 0 | 20 | (5) | ||||
| Archegos | 0 | 0 | (17) | ||||
| Additional tier 1 securities write-down | (15,007) | 0 | 0 | ||||
| Adjusted net revenues | 2,733 | 2,964 | 4,582 | ||||
| Provision for credit losses | 83 | 41 | (110) | ||||
| Archegos | 0 | 0 | 155 | ||||
| Adjusted provision for credit losses | 83 | 41 | 45 | ||||
| Total operating expenses | 5,620 | 4,334 | 4,950 | ||||
| Goodwill impairment | (1,324) | 0 | 0 | ||||
| Restructuring expenses | (299) | (352) | (46) | ||||
| Major litigation provisions | (22) | (34) | (653) | ||||
| Expenses related to real estate disposals | (3) | 0 | (3) | ||||
| Expenses related to equity investment in Allfunds Group | 0 | (2) | 0 | ||||
| Archegos | (6) | (8) | (11) | ||||
| Adjusted total operating expenses | 3,966 | 3,938 | 4,237 | ||||
| Income/(loss) before taxes | 12,764 | (1,315) | (428) | ||||
| Adjusted income/(loss) before taxes | (1,316) | (1,015) | 300 | ||||
| Adjusted return on regulatory capital (%) | (12.9) | (9.1) | 2.4 | ||||
| Adjusted return on tangible equity (%) | (16.5) | (9.6) | 4.3 | ||||
|
Appendix
|
|
| Wealth Management | |||||||||||
| in / end of | % change | ||||||||||
| 1Q23 | 4Q22 | 1Q22 | QoQ | YoY | |||||||
| Results (CHF million) | |||||||||||
| Net revenues | 893 | 1,094 | 1,342 | (18) | (33) | ||||||
| Provision for credit losses | 21 | (5) | 26 | – | (19) | ||||||
| Total operating expenses | 2,333 | 1,164 | 1,318 | 100 | 77 | ||||||
| Loss before taxes | (1,461) | (65) | (2) | – | – | ||||||
| Metrics | |||||||||||
| Cost/income ratio (%) | 261.3 | 106.4 | 98.2 | – | – | ||||||
| Assets under management (CHF billion) | 502.5 | 540.5 | 707.0 | (7.0) | (28.9) | ||||||
| Net new assets/(net asset outflows) (CHF billion) | (47.1) | (92.7) | 4.8 | – | – | ||||||
| Gross margin (annualized) (bp) | 66 | 75 | 74 | – | – | ||||||
| Net margin (annualized) (bp) | (108) | (5) | – | – | – | ||||||
| Reconciliation of adjustment items | |||||||
| Wealth Management | |||||||
| in | 1Q23 | 4Q22 | 1Q22 | ||||
| Results (CHF million) | |||||||
| Net revenues | 893 | 1,094 | 1,342 | ||||
| Real estate (gains)/losses | 0 | (122) | (20) | ||||
| (Gains)/losses on business sales | 0 | 0 | 3 | ||||
| (Gain)/loss on equity investment in SIX Group AG | 0 | 10 | (2) | ||||
| Adjusted net revenues | 893 | 982 | 1,323 | ||||
| Provision for credit losses | 21 | (5) | 26 | ||||
| Total operating expenses | 2,333 | 1,164 | 1,318 | ||||
| Goodwill impairment | (1,294) | – | – | ||||
| Restructuring expenses | (46) | (65) | (10) | ||||
| Major litigation provisions | (6) | (6) | (230) | ||||
| Adjusted total operating expenses | 987 | 1,093 | 1,078 | ||||
| Loss before taxes | (1,461) | (65) | (2) | ||||
| Adjusted income/(loss) before taxes | (115) | (106) | 219 | ||||
| Adjusted return on regulatory capital (%) | (5.7) | (4.8) | 9.3 | ||||
|
Appendix
|
|
| Swiss Bank | |||||||||||
| in / end of | % change | ||||||||||
| 1Q23 | 4Q22 | 1Q22 | QoQ | YoY | |||||||
| Results (CHF million) | |||||||||||
| Net revenues | 973 | 1,016 | 1,144 | (4) | (15) | ||||||
| Provision for credit losses | 40 | 28 | 23 | 43 | 74 | ||||||
| Total operating expenses | 646 | 682 | 642 | (5) | 1 | ||||||
| Income before taxes | 287 | 306 | 479 | (6) | (40) | ||||||
| Metrics | |||||||||||
| Cost/income ratio (%) | 66.4 | 67.1 | 56.1 | – | – | ||||||
| Assets under management (CHF billion) | 526.6 | 525.8 | 582.5 | 0.2 | (9.6) | ||||||
| Net new assets/(net asset outflows) (CHF billion) | (6.9) | (8.3) | 6.0 | – | – | ||||||
| Gross margin (annualized) (bp) | 73 | 77 | 78 | – | – | ||||||
| Net margin (annualized) (bp) | 21 | 23 | 33 | – | – | ||||||
| Reconciliation of adjustment items | |||||||
| Swiss Bank | |||||||
| in | 1Q23 | 4Q22 | 1Q22 | ||||
| Results (CHF million) | |||||||
| Net revenues | 973 | 1,016 | 1,144 | ||||
| Real estate (gains)/losses | (1) | (51) | (84) | ||||
| (Gain)/loss on equity investment in SIX Group AG | 0 | 10 | (3) | ||||
| Adjusted net revenues | 972 | 975 | 1,057 | ||||
| Provision for credit losses | 40 | 28 | 23 | ||||
| Total operating expenses | 646 | 682 | 642 | ||||
| Restructuring expenses | (27) | (13) | (1) | ||||
| Adjusted total operating expenses | 619 | 669 | 641 | ||||
| Income before taxes | 287 | 306 | 479 | ||||
| Adjusted income before taxes | 313 | 278 | 393 | ||||
| Adjusted return on regulatory capital (%) | 9.9 | 8.6 | 11.8 | ||||
|
Appendix
|
|
| Asset Management | |||||||||||
| in / end of | % change | ||||||||||
| 1Q23 | 4Q22 | 1Q22 | QoQ | YoY | |||||||
| Results (CHF million) | |||||||||||
| Net revenues | 187 | 261 | 339 | (28) | (45) | ||||||
| Provision for credit losses | 0 | 1 | 0 | (100) | – | ||||||
| Total operating expenses | 218 | 288 | 282 | (24) | (23) | ||||||
| Income/(loss) before taxes | (31) | (28) | 57 | 11 | – | ||||||
| Metrics | |||||||||||
| Cost/income ratio (%) | 116.6 | 110.3 | 83.2 | – | – | ||||||
| Reconciliation of adjustment items | |||||||
| Asset Management | |||||||
| in | 1Q23 | 4Q22 | 1Q22 | ||||
| Results (CHF million) | |||||||
| Net revenues | 187 | 261 | 339 | ||||
| Real estate (gains)/losses | 0 | 0 | (1) | ||||
| Adjusted net revenues | 187 | 261 | 338 | ||||
| Provision for credit losses | 0 | 1 | 0 | ||||
| Total operating expenses | 218 | 288 | 282 | ||||
| Restructuring expenses | (4) | (12) | – | ||||
| Adjusted total operating expenses | 214 | 276 | 282 | ||||
| Income/(loss) before taxes | (31) | (28) | 57 | ||||
| Adjusted income/(loss) before taxes | (27) | (16) | 56 | ||||
| Adjusted return on regulatory capital (%) | (13.8) | (7.4) | 27.0 | ||||
|
Appendix
|
|
| Investment Bank | |||||||||||
| in / end of | % change | ||||||||||
| 1Q23 | 4Q22 | 1Q22 | QoQ | YoY | |||||||
| Results (CHF million) | |||||||||||
| Net revenues | 1,017 | 621 | 1,609 | 64 | (37) | ||||||
| Provision for credit losses | 18 | 2 | (3) | – | – | ||||||
| Total operating expenses | 1,447 | 1,394 | 1,450 | 4 | 0 | ||||||
| Income/(loss) before taxes | (448) | (775) | 162 | (42) | – | ||||||
| Metrics | |||||||||||
| Cost/income ratio (%) | 142.3 | 224.5 | 90.1 | – | – | ||||||
| Results (USD million) | |||||||||||
| Net revenues | 1,102 | 647 | 1,740 | 70 | (37) | ||||||
| Provision for credit losses | 19 | 3 | (4) | – | – | ||||||
| Total operating expenses | 1,570 | 1,453 | 1,569 | 8 | 0 | ||||||
| Income/(loss) before taxes | (487) | (809) | 175 | (40) | – | ||||||
| Net revenue detail | |||||||
| in / end of | 1Q23 | 4Q22 | 1Q22 | ||||
| Net revenue detail (USD million) | |||||||
| Fixed income sales and trading | 301 | 208 | 317 | ||||
| Equity sales and trading | 457 | 74 | 711 | ||||
| Capital markets | 260 | 176 | 475 | ||||
| Advisory and other fees | 83 | 190 | 225 | ||||
| Other revenues | 1 | (1) | 12 | ||||
| Net revenues | 1,102 | 647 | 1,740 | ||||
|
Appendix
|
|
| Reconciliation of adjustment items | |||||||
| Investment Bank | |||||||
| in | 1Q23 | 4Q22 | 1Q22 | ||||
| Results (CHF million) | |||||||
| Net revenues | 1,017 | 621 | 1,609 | ||||
| Real estate (gains)/losses | 0 | 0 | (50) | ||||
| Adjusted net revenues | 1,017 | 621 | 1,559 | ||||
| Provision for credit losses | 18 | 2 | (3) | ||||
| Total operating expenses | 1,447 | 1,394 | 1,450 | ||||
| Goodwill impairment | (30) | 0 | 0 | ||||
| Restructuring expenses | (106) | (165) | (4) | ||||
| Major litigation provisions | 0 | (12) | 0 | ||||
| Expenses related to real estate disposals | (2) | 0 | (2) | ||||
| Adjusted total operating expenses | 1,309 | 1,217 | 1,444 | ||||
| Income/(loss) before taxes | (448) | (775) | 162 | ||||
| Adjusted income/(loss) before taxes | (310) | (598) | 118 | ||||
| Adjusted return on regulatory capital (%) | (17.5) | (29.0) | 5.0 | ||||
| Reconciliation of adjustment items | |||||||||||||||
| Investment Bank | |||||||||||||||
| in | 1Q23 | 4Q22 | 1Q22 | ||||||||||||
| Results (USD million) | |||||||||||||||
| Net revenues | 1,102 | 647 | 1,740 | ||||||||||||
| Real estate (gains)/losses | 0 | 0 | (54) | ||||||||||||
| Adjusted net revenues | 1,102 | 647 | 1,686 | ||||||||||||
| Provision for credit losses | 19 | 3 | (4) | ||||||||||||
| Total operating expenses | 1,570 | 1,453 | 1,569 | ||||||||||||
| Goodwill impairment | (33) | 0 | 0 | ||||||||||||
| Restructuring expenses | (115) | (175) | (4) | ||||||||||||
| Major litigation provisions | 0 | (12) | 0 | ||||||||||||
| Expenses related to real estate disposals | (2) | 1 | (2) | ||||||||||||
| Adjusted total operating expenses | 1,420 | 1,267 | 1,563 | ||||||||||||
| Income/(loss) before taxes | (487) | (809) | 175 | ||||||||||||
| Adjusted income/(loss) before taxes | (337) | (623) | 127 | ||||||||||||
| Adjusted return on regulatory capital (%) | (17.5) | (29.0) | 5.0 | ||||||||||||
|
Appendix
|
|
| Capital Release Unit | |||||||||||
| in / end of | % change | ||||||||||
| 1Q23 | 4Q22 | 1Q22 | QoQ | YoY | |||||||
| Results (CHF million) | |||||||||||
| Net revenues | 345 | (141) | 191 | – | 81 | ||||||
| Provision for credit losses | 4 | 15 | (155) | (73) | – | ||||||
| Total operating expenses | 740 | 710 | 740 | 4 | 0 | ||||||
| Loss before taxes | (399) | (866) | (394) | (54) | 1 | ||||||
| Results (USD million) | |||||||||||
| Net revenues | 361 | (148) | 207 | – | 74 | ||||||
| Provision for credit losses | 5 | 15 | (168) | (67) | – | ||||||
| Total operating expenses | 801 | 736 | 801 | 9 | 0 | ||||||
| Income/(loss) before taxes | (445) | (899) | (426) | (51) | 4 | ||||||
| Reconciliation of adjustment items | |||||||
| Capital Release Unit | |||||||
| in | 1Q23 | 4Q22 | 1Q22 | ||||
| Adjusted results (CHF million) | |||||||
| Net revenues | 345 | (141) | 191 | ||||
| Real estate (gains)/losses | 0 | 0 | (9) | ||||
| (Gains)/losses on business sales | (726) | 0 | 0 | ||||
| (Gain)/loss on InvestLab/Allfunds Group | 0 | 75 | 353 | ||||
| Archegos | 0 | 0 | (17) | ||||
| Adjusted net revenues | (381) | (66) | 518 | ||||
| Provision for credit losses | 4 | 15 | (155) | ||||
| Archegos | 0 | 0 | 155 | ||||
| Adjusted provision for credit losses | 4 | 15 | 0 | ||||
| Total operating expenses | 740 | 710 | 740 | ||||
| Restructuring expenses | (99) | (44) | (33) | ||||
| Major litigation provisions | 0 | (28) | 0 | ||||
| Expenses related to real estate disposals | (1) | 0 | (1) | ||||
| Expenses related to equity investment in Allfunds Group | 0 | (2) | 0 | ||||
| Archegos | (6) | (8) | (11) | ||||
| Adjusted total operating expenses | 634 | 628 | 695 | ||||
| Loss before taxes | (399) | (866) | (394) | ||||
| Adjusted loss before taxes | (1,019) | (709) | (177) | ||||
|
Appendix
|
|
| Reconciliation of adjustment items | |||||||||||||||
| Capital Release Unit | |||||||||||||||
| in | 1Q23 | 4Q22 | 1Q22 | ||||||||||||
| Adjusted results (USD million) | |||||||||||||||
| Net revenues | 361 | (148) | 207 | ||||||||||||
| Real estate (gains)/losses | 0 | 0 | (9) | ||||||||||||
| (Gains)/losses on business sales | (777) | 0 | 0 | ||||||||||||
| (Gain)/loss on InvestLab/Allfunds Group | 0 | 74 | 381 | ||||||||||||
| Archegos | 0 | 0 | (19) | ||||||||||||
| Adjusted net revenues | (416) | (74) | 560 | ||||||||||||
| Provision for credit losses | 5 | 15 | (168) | ||||||||||||
| Archegos | 0 | 0 | 167 | ||||||||||||
| Adjusted provision for credit losses | 5 | 15 | (1) | ||||||||||||
| Total operating expenses | 801 | 736 | 801 | ||||||||||||
| Restructuring expenses | (108) | (47) | (35) | ||||||||||||
| Major litigation provisions | 0 | (31) | 0 | ||||||||||||
| Expenses related to real estate disposals | 0 | (1) | (1) | ||||||||||||
| Expenses related to equity investment in Allfunds Group | 0 | (2) | 0 | ||||||||||||
| Archegos | (7) | (8) | (12) | ||||||||||||
| Adjusted total operating expenses | 686 | 647 | 753 | ||||||||||||
| Loss before taxes | (445) | (899) | (426) | ||||||||||||
| Adjusted loss before taxes | (1,107) | (736) | (192) | ||||||||||||
|
Appendix
|
|