Exhibit 99.1

TRX Gold Corporation
Interim Condensed Consolidated
Financial Statements
(Unaudited)
For the three and six months ended
TRX Gold Corporation
Interim Condensed Consolidated Statements of Financial Position
(Unaudited)
(Expressed in Thousands of US Dollars)
| Note | February 28, 2023 |
August 31, 2022 (Note 2) |
||||||||||
| Assets | ||||||||||||
| Current assets | ||||||||||||
| Cash | $ | $ | ||||||||||
| Amounts receivable | 5 | |||||||||||
| Prepayments and other assets | 6 | |||||||||||
| Inventories | 7 | |||||||||||
| Total current assets | ||||||||||||
| Other long-term assets | 5 | |||||||||||
| Mineral property, plant and equipment | 8 | |||||||||||
| Total assets | $ | $ | ||||||||||
| Liabilities | ||||||||||||
| Current liabilities | ||||||||||||
| Amounts payable and accrued liabilities | 15 | $ | $ | |||||||||
| Withholding tax payable | ||||||||||||
| Income tax payable | ||||||||||||
| Current portion of deferred revenue | 9 | |||||||||||
| Current portion of lease liabilities | ||||||||||||
| Derivative warrant liabilities | 10 | |||||||||||
| Total current liabilities | ||||||||||||
| Lease liabilities | ||||||||||||
| Deferred revenue | 9 | |||||||||||
| Deferred income tax liability | ||||||||||||
| Provision for reclamation | ||||||||||||
| Total liabilities | ||||||||||||
| Equity | ||||||||||||
| Share capital | ||||||||||||
| Share-based payments reserve | 12 | |||||||||||
| Warrants reserve | 13 | |||||||||||
| Accumulated deficit | ( | ) | ( | ) | ||||||||
| Equity attributable to shareholders | ||||||||||||
| Non-controlling interest | 14 | |||||||||||
| Total equity | ||||||||||||
| Total equity and liabilities | $ | $ | ||||||||||
The accompanying notes are an integral part of these interim condensed consolidated financial statements.
| 2 |
TRX Gold Corporation
Interim Condensed Consolidated Statements of Income and Comprehensive Income
(Unaudited)
(Expressed in Thousands of US Dollars, except per share amounts)
Three months ended February 28, | Six months ended February 28, | |||||||||||||||||||
| Note | 2023 | 2022 (Note 2) |
2023 | 2022 (Note 2) |
||||||||||||||||
| Revenue | 14, 19 | $ | $ | $ | $ | |||||||||||||||
| Cost of sales | ||||||||||||||||||||
| Production costs | ( | ) | ( | ) | ( | ) | ( | ) | ||||||||||||
| Royalty | ( | ) | ( | ) | ( | ) | ( | ) | ||||||||||||
| Depreciation | ( | ) | ( | ) | ( | ) | ( | ) | ||||||||||||
| Total cost of sales | ( | ) | ( | ) | ( | ) | ( | ) | ||||||||||||
| Gross profit | ||||||||||||||||||||
| General and administrative expenses | 16 | ( | ) | ( | ) | ( | ) | ( | ) | |||||||||||
| (Loss) gain on derivative warrant liabilities | 10 | ( | ) | ( | ) | |||||||||||||||
| Foreign exchange gains (losses) | ( | ) | ( | ) | ||||||||||||||||
| Interest and other expenses | ( | ) | ( | ) | ( | ) | ( | ) | ||||||||||||
| Income (loss) before tax | ( | ) | ( | ) | ||||||||||||||||
| Income tax expense | 17 | ( | ) | ( | ) | ( | ) | ( | ) | |||||||||||
| Net (loss) income and comprehensive (loss) income | $ | ( | ) | $ | ( | ) | $ | $ | ( | ) | ||||||||||
| Net (loss) income and comprehensive (loss) income attributable to: | ||||||||||||||||||||
| Shareholders | $ | ( | ) | $ | ( | ) | $ | $ | ( | ) | ||||||||||
| Non-controlling interest | ||||||||||||||||||||
| Net (loss) income and comprehensive (loss) income | $ | ( | ) | $ | ( | ) | $ | $ | ( | ) | ||||||||||
| (Loss) earnings per share attributable to shareholders | ||||||||||||||||||||
| Basic and diluted (loss) earnings per share | 11 | $ | ( | ) | $ | ( | ) | $ | $ | ( | ) | |||||||||
The accompanying notes are an integral part of these interim condensed consolidated financial statements.
| 3 |
TRX Gold Corporation
Interim Condensed Consolidated Statements of Changes in Equity
(Unaudited)
(Expressed in Thousands of US Dollars, except share amounts)
| Share Capital | Reserves | |||||||||||||||||||||||||||||||
| Number of Shares | Amount | Share-based payments | Warrants | Accumulated deficit | Owner's equity | Non-controlling interests | Total equity | |||||||||||||||||||||||||
| Balance at August 31, 2021 | $ | $ | $ | $ | ( | ) | $ | $ | ( | ) | $ | |||||||||||||||||||||
| Shares issued for settlement of debts | ||||||||||||||||||||||||||||||||
| Shares issued for financing | ||||||||||||||||||||||||||||||||
| Shares issued for cash, net of share issuance costs | ||||||||||||||||||||||||||||||||
| Stock options exercised | ||||||||||||||||||||||||||||||||
| Warrants issued | - | |||||||||||||||||||||||||||||||
| Share-based compensation expense (Note 12) | - | |||||||||||||||||||||||||||||||
| Net loss for the period | - | ( | ) | ( | ) | ( | ) | |||||||||||||||||||||||||
| Balance at February 28, 2022 | $ | $ | $ | $ | ( | ) | $ | $ | ( | ) | ||||||||||||||||||||||
| Shares issued for cash, net of share issuance costs | - | ( | ) | ( | ) | ( | ) | |||||||||||||||||||||||||
| Stock options exercised | - | ( | ) | |||||||||||||||||||||||||||||
| Shares issued for share-based payments | ( | ) | ||||||||||||||||||||||||||||||
| Witholding tax impact on restricted share units | - | ( | ) | ( | ) | ( | ) | |||||||||||||||||||||||||
| Share-based compensation expense (Note 12) | - | |||||||||||||||||||||||||||||||
| Net income for the period | - | ( | ) | ( | ) | |||||||||||||||||||||||||||
| Balance at August 31, 2022 | $ | $ | $ | $ | ( | ) | $ | $ | $ | |||||||||||||||||||||||
| Shares issued for share-based payments | ( | ) | ||||||||||||||||||||||||||||||
| Share-based compensation expense (Note 12) | - | |||||||||||||||||||||||||||||||
| Witholding tax impact on restricted share units ("RSUs") | - | |||||||||||||||||||||||||||||||
| Net income for the period | - | |||||||||||||||||||||||||||||||
| Balance at February 28, 2023 | $ | $ | $ | $ | ( | ) | $ | $ | $ | |||||||||||||||||||||||
The accompanying notes are an integral part of these interim condensed consolidated financial statements.
| 4 |
TRX Gold Corporation
Interim Condensed Consolidated Statements of Cash Flows
(Unaudited)
(Expressed in Thousands of US Dollars)
| Six months ended February 28, | ||||||||||||
| Note | 2023 | 2022 | ||||||||||
| Operating | ||||||||||||
| Net income (loss) | $ | $ | ( | ) | ||||||||
| Adjustments for items not involving cash: | ||||||||||||
| Non-cash items | 21 | |||||||||||
| Cost of shares and warrants issuance | ||||||||||||
| Changes in non-cash working capital: | ||||||||||||
| Decrease (increase) in amounts receivable | ( | ) | ||||||||||
| Increase in inventories | ( | ) | ( | ) | ||||||||
| Increase in prepaid and other assets | ( | ) | ( | ) | ||||||||
| Increase in amounts payable and accrued liabilities | ||||||||||||
| Increase in income tax payable | ||||||||||||
| Cash provided by (used in) operating activities | $ | $ | ( | ) | ||||||||
| Investing | ||||||||||||
| Exploration and evaluation assets and expenditures | $ | $ | ( | ) | ||||||||
| Proceeds from gold sales | ||||||||||||
| Purchase of mineral property, plant and equipment | ( | ) | ( | ) | ||||||||
| Increase in other long-term assets | ( | ) | ||||||||||
| Cash used in investing activities | $ | ( | ) | $ | ( | ) | ||||||
| Financing | ||||||||||||
| Proceeds from issuance of shares and warrants | $ | $ | ||||||||||
| Issue costs | ( | ) | ||||||||||
| Withholding taxes on settlement of restricted share units | ( | ) | ||||||||||
| Lease payments | ( | ) | ||||||||||
| Cash (used in) provided by financing activities | $ | ( | ) | $ | ||||||||
| Net increase (decrease) in cash | $ | $ | ( | ) | ||||||||
| Cash at beginning of the period | ||||||||||||
| Cash at end of the period | $ | $ | ||||||||||
The accompanying notes are an integral part of these interim condensed consolidated financial statements.
| 5 |
TRX Gold Corporation
Notes to the Interim Condensed Consolidated Financial Statements
For the three and six months ended February 28, 2023 and 2022
(Unaudited)
(Expressed in Thousands of US dollars, except for share and per share amounts)
| 1. | Nature of operations |
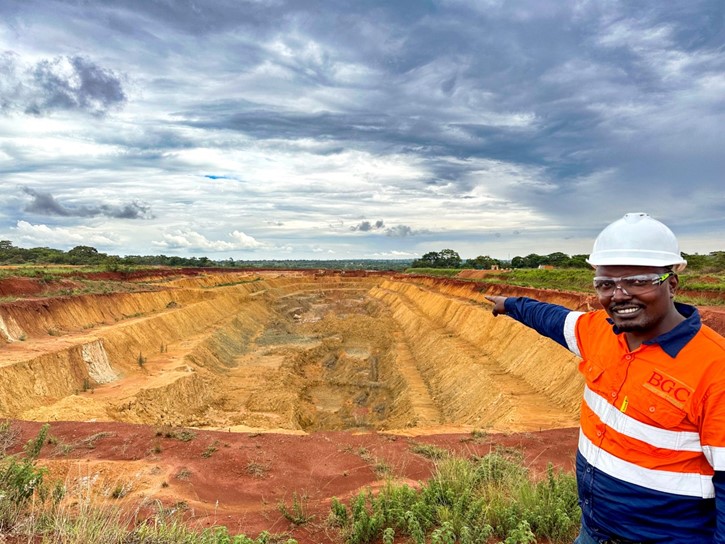
TRX Gold Corporation (“TRX Gold” or the “Company”) was incorporated in the Province of Alberta on July 5, 1990 under the Business Corporations Act (Alberta). The Company’s principal business activity is the exploration, development and production of mineral property interests in the United Republic of Tanzania (“Tanzania”). On November 1, 2022, the Company declared commercial production on the 1,000+ tonne per day (“tpd”) process plant at its Buckreef Gold Project (“Buckreef”) in Tanzania.
The Company’s registered office is 400 3rd Avenue SW, Suite 3700, Calgary, Alberta, T2P 4H2, Canada and the Company’s principal place of business is 277 Lakeshore Road E, Suite 403, Oakville, Ontario, L6J 6J3, Canada.
The Company’s common shares are listed on the Toronto Stock Exchange in Canada (TSX: TNX) and NYSE American in the United States of America (NYSE American: TRX).
The Company is primarily focused on development and mining operations, exploring, and evaluating its mineral properties. The business of exploring and mining for minerals involves a high degree of risk. The underlying value of the mineral properties is dependent upon the existence and economic recovery of mineral resources and reserves, the ability to raise long-term financing to complete the development of the properties, government policies and regulations, and upon future profitable production or, alternatively, upon the Company’s ability to dispose of its interest on an advantageous basis; all of which are uncertain.
| 2. | Basis of preparation |
| a) | Statement of compliance |
The Company’s interim condensed consolidated financial statements have been prepared in accordance with International Accounting Standards (“IAS”) 34, Interim Financial Reporting, as issued by the International Accounting Standards Board. The interim condensed consolidated financial statements do not include all disclosures required by International Financial Reporting Standards (“IFRS”) for annual financial statements and should be read in conjunction with the Company consolidated financial statements for the year ended August 31, 2022.
These interim condensed consolidated financial statements were approved by the Board of Directors of the Company on April 13, 2023.
| b) | Comparative figures |
Certain comparative amounts have been restated to conform to current period’s presentation.
The accompanying notes are an integral part of these interim condensed consolidated financial statements.
| 6 |
TRX Gold Corporation
Notes to the Interim Condensed Consolidated Financial Statements
For the three and six months ended February 28, 2023 and 2022
(Unaudited)
(Expressed in Thousands of US dollars, except for share and per share amounts)
The reclassification in presentation resulted in the following impact on the Consolidated Statements of Income (Loss) and Comprehensive Income (Loss) for the three and six months ended February 28, 2022:
Three months ended February 28, 2022:
|
Reported at February 28, 2022 |
| Reclassification | Restated at February 28, 2022 |
||||||||
| General and administrative expenses | $ | ( | ) | $ | $ | ( | ) | |||||
| Financial instrument related cost and other | ( | ) | ||||||||||
| Accretion on asset retirement obligation | ( | ) | ||||||||||
| Loss on derivative warrant liabilities | ( | ) | ( | ) | ||||||||
| Foreign exchange losses | ( | ) | ( | ) | ||||||||
| Interest and other expenses | ( | ) | ( | ) | ( | ) | ||||||
| Income tax expense | ( | ) | ( | ) | ||||||||
| Net loss and comprehensive loss | $ | ( | ) | $ | $ | ( | ) |
Six months ended February 28, 2022:
|
Reported at February 28, 2022 |
| Reclassification |
|
Restated at February 28, 2022 |
| ||||||
| General and administrative expenses | $ | ( | ) | $ | $ | ( | ) | |||||
| Financial instrument related costs and other | ( | ) | ||||||||||
| Accretion on asset retirement obligation | ( | ) | ||||||||||
| Gain on derivative warrant liabilities | ||||||||||||
| Foreign exchange losses | ( | ) | ( | ) | ||||||||
| Interest and other expenses | ( | ) | ( | ) | ( | ) | ||||||
| Income tax expense | ( | ) | ( | ) | ||||||||
| Net loss and comprehensive loss | $ | ( | ) | $ | $ | ( | ) |
The accompanying notes are an integral part of these interim condensed consolidated financial statements.
| 7 |
TRX Gold Corporation
Notes to the Interim Condensed Consolidated Financial Statements
For the three and six months ended February 28, 2023 and 2022
(Unaudited)
(Expressed in Thousands of US dollars, except for share and per share amounts)
The reclassification in presentation resulted in the following impact on the Consolidated Statements Financial Position as at August 31, 2022:
|
Reported at August 31, 2022 |
| Reclassification |
|
Restated at August 31, 2022 |
| ||||||
| Amounts receivable | $ | $ | $ | |||||||||
| Other receivables | ( | ) |
| c) | Basis of presentation and measurement |
These interim condensed consolidated financial statements have been prepared on a going concern basis under the historical cost basis, except for certain financial assets and liabilities which are measured at fair value, as disclosed in Note 18. All amounts in these interim condensed consolidated financial statements are presented in U.S. dollars with all amounts rounded to the nearest thousand, except for share and per share data, or as otherwise noted. Reference herein of $ or USD is to US dollars and C$ or CAD is to Canadian dollars.
| 3. | Significant accounting policies |
The accounting policies applied in these interim condensed consolidated financial statements are consistent with those applied in the preparation of the Company’s annual consolidated financial statements for the year ended August 31, 2022.
| 4. | Significant accounting judgments, estimates and assumptions |
The preparation of consolidated financial statements in conformity with IFRS requires management to make estimates and assumptions that affect the carrying amount of assets and liabilities and the reported amount of revenues and expenses. The following discusses the most significant accounting policy judgments and accounting estimates that the Company has made in the preparation of these interim condensed consolidated financial statements.
| a) | Production Start Date |
Management assesses the stage of each mine development project to determine when a mine moves into the production stage. The criteria used to assess the start date of a mine are determined based on the unique nature of each mine development project. The Company considers various relevant criteria to assess when the mine is substantially complete, ready for its intended use and moves into the production phase. Some of the criteria include, but are not limited to, the following:
| · | A significant level of capital expenditures compared to construction cost estimates are complete, |
| · | Ability to produce gold in saleable form within specifications has been achieved, |
| · | Reasonable period for testing has been completed, and |
| · | Reasonable level of ongoing production based on mill throughput, recovery rates and mill availability. |
The accompanying notes are an integral part of these interim condensed consolidated financial statements.
| 8 |
TRX Gold Corporation
Notes to the Interim Condensed Consolidated Financial Statements
For the three and six months ended February 28, 2023 and 2022
(Unaudited)
(Expressed in Thousands of US dollars, except for share and per share amounts)
On November 1, 2022, the Company declared commercial production for the 1,000+ tpd processing plant at Buckreef after successful construction, commissioning and ramp-up of processing to a steady state throughput of 1,000+ tpd. The processing plant was running consistently at or above nameplate capacity since October 2022 with gold recoveries exceeding 90%. All major construction activities were completed and Buckreef demonstrated its ability to sustain ongoing production levels.
| b) | Units-of-Production |
Management estimates recoverable proven and probable mineral reserves in determining the depreciation and amortization of certain mineral property, plant and equipment that is expected to be used for the duration of the mine life. This results in a depreciation charge proportional to the recovery of the anticipated ounces of gold. The life of the asset is assessed annually and considers its physical life limitations and present assessment of economically recoverable reserves of the mine property at which the asset is located. The calculations require the use of estimates and assumptions, including the amount of recoverable proven and probable mineral reserves. The Company’s units of production calculations are based on recovered ounces of gold poured.
| c) | Stripping costs in the Production Phase of a Surface Mine |
Significant judgement is required to distinguish between development stripping and production stripping and to distinguish between the production stripping that relates to the extraction of inventory and that which relates to the creation of a stripping activity asset.
The Company identifies the separate components of the ore bodies for its mining operations. An identifiable component is a specific volume of the ore body that is made more accessible by the stripping activity. Significant judgement is required to identify and define these components, and also to determine the expected volumes of waste to be stripped and ore to be mined in each of these components. The assessment is based on the information available in the mine plan. The mine plans and, therefore, the identification of components, may change for a number of reasons as new information becomes available. These include, but are not limited to, the geographic location and geological characteristics of the ore body, and/or financial considerations.
Judgement is also required to identify a suitable production measure to be used to allocate production stripping costs between inventory and any stripping activity asset. Management estimates the cost of deferred stripping activities as the excess waste material moved above the average strip ratio to provide access to further quantities of ore that is expected to be mined in future periods.
The accompanying notes are an integral part of these interim condensed consolidated financial statements.
| 9 |
TRX Gold Corporation
Notes to the Interim Condensed Consolidated Financial Statements
For the three and six months ended February 28, 2023 and 2022
(Unaudited)
(Expressed in Thousands of US dollars, except for share and per share amounts)
Furthermore, judgements and estimates are also used to apply the units-of-production method in determining the depreciable lives of stripping activity assets.
| 5. | Amounts receivable |
| February 28, 2023 | August 31, 2022 | |||||||
| Sales tax receivable(1) | $ | $ | ||||||
| Prepaid gold purchase receivable (Note 9) | ||||||||
| Other | ||||||||
| Less: Long-term portion | ( | ) | ( | ) | ||||
| Total amounts receivable | $ | $ |
| (1) |
As at February 28, 2023, $0.2 million (August 31, 2022 - $nil) of VAT has been written-off. The Company held no collateral for any receivables.
| 6. | Prepayments and other assets |
| February 28, 2023 | August 31, 2022 | |||||||
| Prepaid expenses | $ | $ | ||||||
| Commitment fees(1) | ||||||||
| Total prepayments and other assets | $ | $ |
| (1) |
The accompanying notes are an integral part of these interim condensed consolidated financial statements.
| 10 |
TRX Gold Corporation
Notes to the Interim Condensed Consolidated Financial Statements
For the three and six months ended February 28, 2023 and 2022
(Unaudited)
(Expressed in Thousands of US dollars, except for share and per share amounts)
| 7. | Inventories |
| February 28, 2023 | August 31, 2022 | |||||||
| Ore stockpile | $ | $ | ||||||
| Gold in circuit | ||||||||
| Gold doré | ||||||||
| Total precious metals inventories | ||||||||
| Supplies | ||||||||
| Total inventories | $ | $ |
| 8. | Mineral property, plant and equipment |
| Construction in progress | Mineral properties | Processing plant and related infrastructure | Machinery and equipment | Other | Total | |||||||||||||||||||
| Cost | ||||||||||||||||||||||||
| As at August 31, 2022 | $ | $ | $ | $ | $ | $ | ||||||||||||||||||
| Additions | ||||||||||||||||||||||||
| Transfers(1) | ( | ) | ||||||||||||||||||||||
| As at February 28, 2023 | $ | $ | $ | $ | $ | $ | ||||||||||||||||||
| Accumulated depreciation | ||||||||||||||||||||||||
| As at August 31, 2022 | $ | $ | $ | $ | $ | $ | ||||||||||||||||||
| Depreciation | ||||||||||||||||||||||||
| As at February 28, 2023 | $ | $ | $ | $ | $ | $ | ||||||||||||||||||
| Net book value | ||||||||||||||||||||||||
| As at August 31, 2022 | $ | $ | $ | $ | $ | $ | ||||||||||||||||||
| As at February 28, 2023 | $ | $ | $ | $ | $ | $ |
| (1) |
| 9. | Deferred revenue |
On August 11, 2022, the Company entered into a
$
The accompanying notes are an integral part of these interim condensed consolidated financial statements.
| 11 |
TRX Gold Corporation
Notes to the Interim Condensed Consolidated Financial Statements
For the three and six months ended February 28, 2023 and 2022
(Unaudited)
(Expressed in Thousands of US dollars, except for share and per share amounts)
The Agreement has been accounted for as a contract in accordance with IFRS 15, Revenue from Contracts with Customers. As the total amount paid up-front by OCIM for the future deliveries of gold differs from the stand-alone selling price of the gold, the Company concluded the Agreement contains a significant financing component (“SFC”). Gold deliveries due in connection with the up-front payment are recorded in revenue based on the gold spot price originally established at the time of each advance, being the estimated stand-alone selling price of gold deliveries as determined at inception (after separating the SFC). The outstanding deferred revenue liability will accrue interest reflecting the cost of financing.
| Amount | ||||
| As at August 31, 2022 | $ | |||
| Accretion of deferred revenue | ||||
| Transaction costs expensed | ||||
| Revenue recognized | ( | ) | ||
| As at February 28, 2023 | $ |
| 10. | Derivative warrant liabilities |
| Amount | ||||
| As at August 31, 2022 | $ | |||
| Change in fair value | ( | ) | ||
| As at February 28, 2023 | $ |
Derivative warrant liabilities of $
Fair values of derivative warrant liabilities were calculated using the Black-Scholes option pricing model with the following assumptions:
| February 28, 2023 | August 31, 2022 | |||||||
| Share price | $ | $ | ||||||
| Risk-free interest rate | ||||||||
| Dividend yield | ||||||||
| Expected volatility | ||||||||
| Remaining term (in years) |
The fair value is classified as level 3 as expected volatilities is determined using adjusted historical volatilities and were therefore not an observable input.
The accompanying notes are an integral part of these interim condensed consolidated financial statements.
| 12 |
TRX Gold Corporation
Notes to the Interim Condensed Consolidated Financial Statements
For the three and six months ended February 28, 2023 and 2022
(Unaudited)
(Expressed in Thousands of US dollars, except for share and per share amounts)
Sensitivity analysis
If expected volatility, the significant unobservable input, had been higher or lower by 10% and all other variables were held constant, net income and net assets for the three and six months ended February 28, 2023 would increase or decrease by:
| February 28, 2023 | ||||||||
| 10% change in expected volatilities | Increase | Decrease | ||||||
| (Loss) income | $ | ( | ) | $ | ||||
| 11. | (Loss) earnings per share |
| Three months ended February 28, | Six months ended February 28, | |||||||||||||||
| 2023 | 2022 | 2023 | 2022 | |||||||||||||
| Net (loss) income attributable to shareholders | $ | ( | ) | $ | ( | ) | $ | $ | ( | ) | ||||||
| Weighted average number of common shares for purposes of basic EPS | ||||||||||||||||
| Effect of dilutive stock options, warrants, RSUs and share awards | ||||||||||||||||
| Weighted average number of common shares for purposes of diluted EPS | ||||||||||||||||
The determination of weighted average number of common shares for the six months ended purpose of diluted EPS excluded million stock options and million warrants that were anti-dilutive for the period (2022: million share options and million share warrants).
| 12. | Share-based payments reserve |
Share-based compensation expense for the three and six months ended February 28, 2023 totalled $ million and $ million, respectively (2022: $ million and $ million, respectively).
As at February 28, 2023, the Company had (August 31, 2022 - ) share awards available for issuance under the Omnibus Equity Incentive Plan.
The accompanying notes are an integral part of these interim condensed consolidated financial statements.
| 13 |
TRX Gold Corporation
Notes to the Interim Condensed Consolidated Financial Statements
For the three and six months ended February 28, 2023 and 2022
(Unaudited)
(Expressed in Thousands of US dollars, except for share and per share amounts)
| a) | Stock options |
Canadian Dollars denominated stock options
| Number of stock options | Weighted average exercise price per share | |||||||
| Balance – February 28, 2023 and August 31, 2022 | CAD $ | |||||||
Options to purchase common shares carry exercise prices and terms to maturity as follows:
| Remaining | |||||||||||||
| Number of options | Expiry | contractual | |||||||||||
| Exercise price | Outstanding | Exercisable | Date | life (years) | |||||||||
| C$ | |||||||||||||
| C$ | |||||||||||||
| C$ | |||||||||||||
| C$(1) | (1) | ||||||||||||
| (1) |
US Dollars denominated stock options
| Number of stock options | Weighted average exercise price per share | |||||||
| Balance – February 28, 2023 and August 31, 2022 | $ | |||||||
Options to purchase common shares carry exercise prices and terms to maturity as follows:
| Remaining | ||||||||||||||
| Exercise price | Number of options | Expiry | contractual | |||||||||||
| Outstanding $ | Outstanding | Exercisable | Date | life (years) | ||||||||||
| USD $ | ||||||||||||||
For the three and six months ended February 28, 2023, share-based payment expenses related to stock options totalled $ million and $ million, respectively (2022 – $nil and $nil, respectively).
The accompanying notes are an integral part of these interim condensed consolidated financial statements.
| 14 |
TRX Gold Corporation
Notes to the Interim Condensed Consolidated Financial Statements
For the three and six months ended February 28, 2023 and 2022
(Unaudited)
(Expressed in Thousands of US dollars, except for share and per share amounts)
| b) | Restricted Share Units: |
The following table sets out activity with respect to outstanding RSUs:
| Number of RSUs | ||||
| Balance – August 31, 2022 | ||||
| Granted | ||||
| Vested | ( | ) | ||
| Forfeited | ( | ) | ||
| Balance – February 28, 2023 |
For the three and six months ended February 28, 2023, share-based payment expenses related to RSUs totalled $ million and $ million, respectively (2022 - $nil and $nil, respectively).
| 13. | Warrants reserve |
| Number of warrants | Weighted average exercise price per share | |||||||
| Balance – February 28, 2023 and August 31, 2022 | ||||||||
As at February 28, 2023, the following warrants were outstanding:
Number of Warrants | Exercise price |
Expiry date | ||||||||
| Convertible debenture warrants - July 27, 2020 | $ | |||||||||
| Private placement financing warrants - December 23, 2020 | $ | |||||||||
| Private placement financing warrants - February 11, 2021 | $ | |||||||||
| Private placement financing broker warrants - February 11, 2021 | $ | |||||||||
| Private placement financing warrants – January 26, 2022 | $ | |||||||||
| Private placement financing placement agent warrants – January 26, 2022 | $ | |||||||||
| Balance – February 28, 2023 | ||||||||||
The outstanding warrants have a weighted average exercise price of $ and weighted average remaining contractual life of 3.0 years.
The accompanying notes are an integral part of these interim condensed consolidated financial statements.
| 15 |
TRX Gold Corporation
Notes to the Interim Condensed Consolidated Financial Statements
For the three and six months ended February 28, 2023 and 2022
(Unaudited)
(Expressed in Thousands of US dollars, except for share and per share amounts)
| 14. | Non-controlling interest |
Summarized financial information for Buckreef is disclosed below:
| Three months ended February 28, | Six months ended February 28, | |||||||||||||||
| Income Statement | 2023 | 2022 | 2023 | 2022 | ||||||||||||
| Revenue | $ | $ | $ | $ | ||||||||||||
| Comprehensive income for the period | ||||||||||||||||
| Statement of Financial Position | February 28, 2023 | August 31, 2022 | ||||||
| Current assets | $ | $ | ||||||
| Non-current assets | ||||||||
| Current liabilities | ( | ) | ( | ) | ||||
| Non-current liabilities | ( | ) | ( | ) | ||||
| Advances from parent, net | ( | ) | ( | ) |
| 15. | Related party transactions |
Related parties include the Board of Directors and officers, extended relatives and enterprises that are controlled by these individuals as well as certain consultants performing similar functions.
Remuneration of Directors and key management personnel of the Company was as follows:
| Three months ended February 28, | Six months ended February 28, | |||||||||||||||
| Directors and key management personnel | 2023 | 2022 | 2023 | 2022 | ||||||||||||
| Remuneration (1) | $ | $ | $ | $ | ||||||||||||
| Share-based compensation expense | ||||||||||||||||
| Total directors and key management personnel | $ | $ | $ | $ | ||||||||||||
| (1) |
As at February 28, 2023, included in amounts payable
is $
The accompanying notes are an integral part of these interim condensed consolidated financial statements.
| 16 |
TRX Gold Corporation
Notes to the Interim Condensed Consolidated Financial Statements
For the three and six months ended February 28, 2023 and 2022
(Unaudited)
(Expressed in Thousands of US dollars, except for share and per share amounts)
During the three and six months ended February 28, 2023, $ million and $ million for stock options granted to key management personnel was expensed, respectively (2022 - $nil and $nil, respectively) and $nil and $ million for RSUs granted to directors was expensed, respectively (2022 - $nil and $nil, respectively).
During the year ended August 31, 2021, the Company granted common shares upon hiring key management personnel in the aggregate of:
| a) | 1.56 million common shares having a fair market value of $1.1 million on the respective start dates of the key Management (December 1, 2020 to May 18, 2021). |
| b) | Common shares on the first, second and third anniversary dates of the greater of up to 2.02 million, 3.55 million and 2.82 million common shares; or common shares having a fair market value of to $1.4 million, $2.5 million and $2.0 million provided that 80% of such issuance shall be guaranteed and 20% shall be subject to certain financial milestones to be determined by the Board of Directors respectively. |
The common shares had a value of $ million at grant date that is amortized over the service period.
During the three and six months ended February 28, 2023, $ million and $ million related to share-based compensation granted to key management personnel was expensed, respectively (2022 - $ million and $ million, respectively).
| 16. | General and administrative expenses |
| Three months ended February 28, | Six months ended February 28, | |||||||||||||||
| 2023 | 2022 | 2023 | 2022 | |||||||||||||
| Directors’ fees (Note 15) | $ | $ | $ | $ | ||||||||||||
| Insurance | ||||||||||||||||
| Office and general | ||||||||||||||||
| Shareholder information | ||||||||||||||||
| Professional fees | ||||||||||||||||
| Salaries and benefits(1) (Note 15) | ||||||||||||||||
| Consulting | ||||||||||||||||
| Severance | ||||||||||||||||
| Share-based compensation expense(1) (Note 15) | ||||||||||||||||
| Travel and accommodation | ||||||||||||||||
| Depreciation(1) | ( | ) | ||||||||||||||
| Other | ||||||||||||||||
| Total general and administrative expenses | $ | $ | $ | $ | ||||||||||||
| (1) |
The accompanying notes are an integral part of these interim condensed consolidated financial statements.
| 17 |
TRX Gold Corporation
Notes to the Interim Condensed Consolidated Financial Statements
For the three and six months ended February 28, 2023 and 2022
(Unaudited)
(Expressed in Thousands of US dollars, except for share and per share amounts)
| 17. | Income tax |
Income tax expense is recognized based on management’s estimate of the weighted average annual income tax rate expected for the full financial year. The maximum amount of tax losses that a business can utilize in Tanzania is 70% of its taxable profit for the current year. The remaining 30% of taxable profit is subject to a statutory tax rate of 30%. As a result, Buckreef’s current income tax is calculated at an effective tax rate of 9% until Buckreef’s tax loss carryforwards are fully utilized. Tax losses in Tanzania can only be utilized by the entity to which the tax losses relate to.
The carrying value of Buckreef’s Mineral Property, Plant and Equipment is higher than their tax written down values due to historical mining incentives in Tanzania and accelerated depreciation for tax purposes. The taxable temporary difference between the carrying value of Mineral Property, Plant and Equipment and its tax basis in excess of available tax loss carryforwards resulted in a deferred tax liability.
For the three months ended February 28,
2023, the Company recorded income tax expense of $
| 18. | Financial instruments |
Fair value of financial instruments
Cash and derivative warrant liabilities are classified as measured at fair value through profit and loss. Amounts receivable and amounts payable are classified as measured at amortized cost. The carrying value of the Company’s cash, amounts receivable, amounts payable approximate their fair value due to the relatively short-term nature of these instruments.
Fair value estimates are made at a specific point in time based on relevant market information and information about financial instruments. These estimates are subject to and involve uncertainties and matters of significant judgment, and therefore cannot be determined with precision. Changes in assumptions could significantly affect the estimates.
The Company classifies its financial instruments carried at fair value according to a three-level hierarchy that reflects the significance of the inputs used in making the fair value measurements. The three levels of fair value hierarchy, giving the highest priority to Level 1 inputs and the lowest priority to Level 3 inputs, are as follows:
| · | Level 1 – Unadjusted quoted prices in active markets for identical assets or liabilities; |
| · | Level 2 – Inputs other than quoted prices that are observable for assets and liabilities, either directly or indirectly; and |
| · | Level 3 – Inputs for assets or liabilities that are not based on observable market data. |
As at February 28, 2023 and August 31, 2022, cash was classified as Level 1 and derivative warrant liabilities (Note 10) were classified as Level 3 under the fair value hierarchy.
The accompanying notes are an integral part of these interim condensed consolidated financial statements.
| 18 |
TRX Gold Corporation
Notes to the Interim Condensed Consolidated Financial Statements
For the three and six months ended February 28, 2023 and 2022
(Unaudited)
(Expressed in Thousands of US dollars, except for share and per share amounts)
| 19. | Segmented information |
Operating segments
The Company’s Chief Operating Decision Maker, its Chief Executive Officer, reviews the operating results, assesses the performance and makes capital allocation decisions of the Company viewed as a single operating segment engaged in mineral exploration and development in Tanzania. All amounts disclosed in the interim condensed consolidated financial statements represent this single reporting segment. The Company’s corporate division only earns interest revenue that is considered incidental to the activities of the Company and does not meet the definition of an operating segment as defined in IFRS 8, Operating Segments.
Geographic segments
The Company is in the business of mineral exploration and production in Tanzania. Information regarding the Company’s geographic locations are as follows:
| Three months ended February 28, | Six months ended February 28, | |||||||||||||||
| Revenue | 2023 | 2022 | 2023 | 2022 | ||||||||||||
| Tanzania | $ | $ | $ | $ | ||||||||||||
| Total revenue | $ | $ | $ | $ | ||||||||||||
| Non-current assets | February 28, 2023 | August 31, 2022 | ||||||
| Canada | $ | $ | ||||||
| Tanzania | ||||||||
| Total non-current assets | $ | $ |
| 20. | Commitments and contingencies |
Commitments:
In order to maintain its existing mining and exploration
licenses, the Company is required to pay annual license fees totalling $
Contingencies:
The Company is involved in litigation and disputes arising in the normal course of operations. Management is of the opinion that the outcome of any potential litigation will not have a material adverse impact on the Company’s financial position or results of operations. Accordingly, no provisions for the settlement of outstanding litigation and potential claims have been accrued as at February 28, 2023 and August 31, 2022.
The accompanying notes are an integral part of these interim condensed consolidated financial statements.
| 19 |
TRX Gold Corporation
Notes to the Interim Condensed Consolidated Financial Statements
For the three and six months ended February 28, 2023 and 2022
(Unaudited)
(Expressed in Thousands of US dollars, except for share and per share amounts)
| 21. | Non-cash items |
| Six months ended February 28, | ||||||||
| 2023 | 2022 | |||||||
| Depreciation | $ | $ | ||||||
| Gains on derivative warrant liabilities (Note 10) | ( | ) | ( | ) | ||||
| Share-based compensation expense (Note 12) | ||||||||
| Accretion of provision for reclamation | ||||||||
| Deferred income tax expense (Note 17) | ||||||||
| Accretion of lease liabilities | ||||||||
| Settlement of deferred revenue (Note 9) | ( | ) | ||||||
| Accretion of deferred revenue (Note 9) | ||||||||
| Foreign exchange gains | ( | ) | ||||||
| VAT written-off (Note 5) | ||||||||
| Other expenses | ||||||||
| Total non-cash items | $ | $ | ||||||
| 22. | Subsequent events |
In March 2023, the Company entered into a series of gold zero-cost collar contracts for 900 gold ounces per month for a total of 4,500 gold ounces to be settled from April 2023 to August 2023, at a maximum and minimum gold price of $2,030 and $1,825 per gold ounce, respectively.
20
Exhibit 99.2
TRX GOLD CORPORATION
MANAGEMENT’S DISCUSSION AND ANALYSIS
For the three and six month periods ended February 28, 2023
 | Management’s Discussion and Analysis February 28, 2023 |
The following Management’s Discussion and Analysis (“MD&A”) of the financial condition and results of operations for TRX Gold Corporation (“TRX Gold” or the “Company”) should be read in conjunction with the Company’s unaudited interim condensed consolidated financial statements for the three and six months ended February 28, 2023, as well as the Company’s audited consolidated financial statements included in the Company's Annual Report on Form 40-F and Annual Information Form for the year ended August 31, 2022. The financial statements and related notes of TRX Gold have been prepared in accordance with International Financial Reporting Standards (“IFRS”). Additional information, including our press releases, has been filed electronically on SEDAR and is available online under the Company’s profile at www.sedar.com and on our website at www.TRXGold.com.
This MD&A reports our activities through April 13, 2023 unless otherwise indicated. References to the 2nd quarter of 2023 or Q2 2023, and references to the 2nd quarter of 2022 or Q2 2022 mean the three months ended February 28, 2023 and 2022, respectively. Unless otherwise noted, all references to currency in this MD&A refer to US dollars. Unless clearly otherwise referenced to a specific table, numbers referenced refer to numbered Endnotes on page 35.
Mr. Andrew Mark Cheatle, P.Geo., MBA, ARSM, is the Company’s in-house Qualified Person under National Instrument 43-101 “Standards of Disclosure for Mineral Projects” (“NI 43-101”) and has reviewed and approved the scientific and technical information in this MD&A. Mr. Cheatle is the Chief Operating Officer, a Director of TRX Gold and a Director of the Company’s subsidiaries, including Buckreef Gold Company Limited (“Buckreef Gold”) and TRX Gold Tanzania Limited (“TRX Gold Tanzania”). Therefore, he is not considered to be independent under NI 43-101. Mr. Cheatle has over 30 years of relevant industry experience, a Master of Business Administration (MBA) from Capella University, USA (2005), and an Honours Degree in Geology from the Royal School of Mines, Imperial College, London, UK (1985). He is a registered professional geoscientist with Professional Geoscientists of Ontario, Canada (Reg. No. 0166).
Disclosure and Cautionary Statement Regarding Forward Looking Information
This MD&A contains certain forward-looking statements and forward-looking information, including without limitation statements about TRX Gold’s future business, operations and production capabilities. All statements, other than statements of historical fact, included herein are forward-looking statements and forward-looking information that involve various risks and uncertainties. There can be no assurance that such statements will prove to be accurate, and actual results and future events could differ materially from those anticipated in such statements. Although TRX Gold believes the expectations expressed in such forward-looking statements are based on reasonable assumptions, such statements are not guarantees of future performance. The actual achievements of TRX Gold or other future events or conditions may differ materially from those reflected in the forward-looking statements due to a variety of risks, uncertainties and other factors. These risks, uncertainties and factors include general business, legal, economic, competitive, political, regulatory and social uncertainties; actual results of exploration activities and economic evaluations; fluctuations in currency exchange rates; changes in costs; future prices of gold and other minerals; mining method, production profile and mine plan; delays in exploration, development and construction activities; changes in government legislation and regulation; the ability to obtain financing on acceptable terms and in a timely manner or at all; contests over title to properties; employee relations and shortages of skilled personnel and contractors; and the speculative nature of, and the risks involved in, the exploration, development and mining business.
1
| | Management’s Discussion and Analysis February 28, 2023 |
Certain information presented in this MD&A may constitute “forward-looking statements” and “forward looking information” within the meaning of the U.S. Private Securities Litigation Reform Act of 1995 and under securities legislation applicable in Canada, respectively. Such forward-looking statements and information are based on numerous assumptions, and involve known and unknown risks, uncertainties, and other factors, including risks inherent in mineral exploration and development, which may cause the actual results, performance, or achievements of the Company to be materially different from any projected future results, performance, or achievements expressed or implied by such forward-looking statements and information. Investors are referred to our description of the risk factors affecting the Company, as contained in our U.S. Securities and Exchange Commission (“SEC”) filings, including our Annual Report on Form 40-F and Report of Foreign Private Issuer on Form 6-K, and our Annual Information Form also posted on SEDAR, for more information concerning these risks, uncertainties, and other factors.
TRX Gold Corporation
TRX Gold is rapidly advancing the Buckreef Gold Project. Anchored by a Mineral Resource published in May 2020, the project currently hosts an NI 43-101 Measured and Indicated Mineral Resource (“M&I Resource”) of 35.88 million tonnes (“MT”) at 1.77 grams per tonne (“g/t”) gold containing 2,036,280 ounces (“oz”) of gold and an Inferred Mineral Resource of 17.8 MT at 1.11 g/t gold for 635,540 oz of gold. The leadership team is focused on creating both near-term and long-term shareholder value by increasing gold production to generate positive cash flow. The positive cash flow will be utilized for exploratory drilling with the goal of increasing the current mineral resource base and advancing the larger project development which represents 90% of current mineral resources. TRX Gold’s actions are led by the highest environmental, social and corporate governance (“ESG”) standards, evidenced by the relationships and programs that the Company has developed during its nearly two decades of presence in the Geita Region, Tanzania. Please refer to the Company’s Updated Mineral Resources Estimate for Buckreef Gold Project, dated May 15, 2020 and filed under the Company’s profile on SEDAR and with the SEC on June 23, 2020 (the “Technical Report”) for more information.
2
| | Management’s Discussion and Analysis February 28, 2023 |
Highlights – Second Quarter and Year to Date 2023
Q2 2023 was a significant quarter for the Company as it reflected the first full quarter operating the 1,000+ tonne per day (“tpd”) processing plant at Buckreef Gold at full design capacity following commercial production declaration in November 2022. During Q2 2023 the Company recorded its highest quarterly production output (5,636 ounces of gold) generating record quarterly revenue ($10.1 million). The Company generated strong gross profit ($4.9 million, 49% margin), Adjusted EBITDA ($3.9 million) and operating cash flow ($4.8 million) which enabled further investment in Buckreef Gold. During the quarter the Company used cash flow from operations to invest in infrastructure and development of Buckreef Gold, including advancing construction of a significantly expanded tailings storage facility (“TSF”) to accommodate higher production, road realignment around the Special Mining License which is expected to enable full life of mine access to the Main Zone, the addition of four new gensets to replace existing rental units, and a development drilling program which focused on infill and exploration drilling at Buckreef Main, Anfield and Eastern Porphyry. Subsequent to quarter-end, the Company used cash flow from operations to order an additional 1,000 tpd ball mill to advance the short-term objective of increasing Buckreef Gold’s current average annual throughput by 75-100% through the addition of this new mill. These positive results continue to demonstrate the immense opportunity at Buckreef Gold and reflect successful execution of the Company’s sustainable business plan where cash flow from operations funds value creating activities - including exploration and growth.
Key highlights for Q2 2023 and Year to Date February 28, 2023 include:
| · | The Company achieved zero lost time injuries (“LTI”) and achieved a significant safety milestone of approximately 1.5 million operating hours with no LTI. |
| · | In September 2022, Buckreef Gold announced successful commissioning of the expanded 1,000+ tpd processing plant. The plant reached nameplate capacity in October 2022 and commercial production was declared effective in November 2022. Q2 2023 was the first full quarter operating the 1,000+ tpd processing plant at full design capacity. |
| · | In Q2 2023, poured 5,636 ounces of gold, a new quarterly production record at Buckreef Gold and sold 5,504 ounces of gold, resulting in positive operating cash flow for the Company of $4.8 million. |
| · | In Q2 2023, recognized revenue of $10.1 million, cost of sales of $5.2 million, generating gross profit of $4.9 million, gross profit margin of 49% and Adjusted EBITDA1 of $3.9 million. |
| · | Year to date, poured and sold 11,030 and 11,258 ounces of gold, respectively, both half-year production records at Buckreef Gold, resulting in positive operating cash flow for the Company of $11.4 million. |
| · | Year to date, recognized revenue of $19.8 million, cost of sales of $9.6 million, generating gross profit of $10.2 million, gross profit margin of 52% and Adjusted EBITDA1 of $8.3 million. |
| · | During Q2 2023, the Company drilled 1,441 meters at Buckreef Gold including exploration, infill drilling and step-out drilling, and 165 meters of sterilization drilling. Year to date, the Company drilled 10,332 meters of exploration, infill and sterilization drilling, excluding 3,525 meters of grade control drilling. |
| · | During Q2 2023, the Company announced positive assay results from its 19-hole metallurgical variability sampling program on the Buckreef Gold Main Zone and positive assay results from the southwest Main Zone drilling. |
| · | Continue to expect gold production for fiscal 2023 (“F2023”) to be between 20,000 – 25,000 ounces at total average cash costs1 of $750 - $850 per ounce. |
3
| | Management’s Discussion and Analysis February 28, 2023 |
2023 Outlook
| · | F2023 production and cost guidance ranges are unchanged from when they were originally estimated and released in November 2022. |
| · | The Company continues to expect gold production from the 1,000+ tpd processing plant for F2023 to be between 20,000 - 25,000 ounces at total average cash costs1 of $750 - $850 per ounce. |
| · | Mining, crushing, processing and gold production are all expected to operate at full capacity during the second half (“H2”) of F2023 following initial ramp-up and commissioning of the 1,000+ tpd processing plant during Q1 2023. Higher production is expected in H2 as the processing plant achieved steady state operation at nameplate capacity of 1,000+ tpd at the end of October 2022. |
| · | Operating cash flow from the 1,000+ tpd processing plant will be reinvested in Buckreef Gold with a focus on value enhancing activities, including: (i) exploration and drilling with a focus on potential resource expansion at Buckreef Main (northeast (“NE”) and south), Buckreef West, Anfield, Eastern Porphyry extension; (ii) additional capital programs focused on further plant expansions and production growth; and (iii) enhanced corporate social responsibility/ESG programs. |
| · | The Company continues to advance a project aimed at increasing the average annual throughput by 75-100% through the addition of a new ball mill. In March 2023 the Company announced that a new 1,000 tpd ball mill has been ordered from CSI Energy Group (Tanzania) Limited in partnership with Solo Resources Pty Ltd in South Africa. Construction of the expanded milling circuit is expected to start in F2023 and potentially benefit production in late calendar 2023. Any incremental production as a result of this expansion has not been considered in the F2023 guidance above. |
| · | The Company continues to expect exploration spending in H2 F2023 to include diamond drill and reverse circulation drilling services provided by the State Mining Corporation of Tanzania (“STAMICO”) for a program which includes; brownfield exploration drilling at Buckreef Main Zone (NE and SW), Buckreef West, Eastern Porphyry, and greenfield exploration drilling at Anfield. Sterilization drilling has commenced at site expansion facilities, including TSF and waste rock facilities. |
| · | The larger development project, in which the ‘sulphide ore’ encompasses approximately 90% of the Buckreef Main Zone’s Measured and Indicated Mineral Resources, is a key mid-to-long term value driver. Unlocking this value is an important business objective for the Company. The larger development project will evaluate the options for a high return large scale project. It is the goal of the Company to exceed the metrics outlined in the 2018 Technical Report, including annual production, strip ratios and key financial metrics. The Company continues to work with our principal consultants on advancing the larger development project, including advanced metallurgical testing across the deposit and geotechnical studies for a deeper pit. The Company has started assessing a significantly larger sulphide ore processing facility. |
4
| | Management’s Discussion and Analysis February 28, 2023 |
Operational and Financial Details - Second Quarter and Year to Date 2023
Mining and Processing
| · | Buckreef Gold reported zero LTI at site during the three and six months ended February 28, 2023. For the three and six months ended February 28, 2023, including contractors, Buckreef Gold recorded a safety incident frequency rate of 0 (per million hours). The Company’s two main contractors, FEMA Builders Limited (“FEMA”) and STAMICO, also recorded a safety incident frequency rate of 0 (per million hours). In Q2 2023, the Company achieved a significant safety milestone of approximately 1.5 million operating hours with no LTI. |
| · | During Q2 2023, Buckreef Gold poured 5,636 ounces of gold and sold 5,504 ounces of gold. The 164% increase in gold production in Q2 2023 compared to the prior year period is mainly attributable to an increase in ore tonnes milled following commissioning of the expanded 1,000+ tpd processing plant in Q1 2023. For the six months ended February 28, 2023, the Company produced 11,030 ounces of gold and sold 11,258 ounces of gold, both half-year records for the Company. |
| · | The 1,000+ tpd processing plant operated at full capacity during Q2 2023 and achieved the following statistics: (i) average throughput of 1,025 tpd; (ii) plant availability of 95%; and (iii) an average recovery rate of 90%. Following successful ramp-up and commissioning of the expanded 1,000+ tpd processing plan in November 2022, for the six months ended February 28, 2023, the processing plant achieved the following statistics: (i) average throughput of 936 tpd; (ii) plant availability of 95%; and (iii) an average recovery rate of 91%. |
| · | Total ore mined in Q2 2023 was 139 thousand tonnes (“kt”) and total waste mined was 705 kt contributing to a strip ratio of 5.1 (waste:ore tonnes). During the first half (“H1”) of F2023, the Company expedited waste stripping to access a greater extent of ore, including higher grade blocks which is expected to benefit production in H2 F2023. The 442% increase in total tonnes mined compared to the prior year period is mainly related to a higher mining rate to feed the expanded 1,000+ tpd processing plant commissioned in Q1 2023. For the six months ended February 28, 2023, total ore mined was 207 kt and total waste mined was 1,143 kt contributing to a strip ratio of 5.5 (waste:ore tonnes). |
| · | As at February 28, 2023, the run-of-mine (“ROM”) pad stockpile contained 153,619 tonnes at an average grade of 1.0 g/t with an estimated 4,933 ounces of gold. A further stockpile of crushed mill feed of 7,668 tonnes at 2.40 g/t containing an estimated 592 ounces of gold has been accumulated between the crusher and mill. Since year-end August 31, 2022, the Company has drawn down the ROM pad stockpile (365 ounces) and crushed ore stockpile (625 ounces) to support mill feed during the wet season. These fluctuations in ROM pad inventory are anticipated throughout the course of the year and are designed to ensure steady state processing. During Q1 2023, the Company processed stockpiled and mined material to commission the expanded 1,000+ tpd processing plant (which included 7 new large CIL tanks) and consequently reported an increase of gold in circuit, reflecting a buildup of metal inventory in the CIL tanks during plant commissioning. The net result being a substantial increase of gold in circuit, which contained 1,638 ounces at February 28, 2023. The remaining stockpile balance continues to provide support for the Company to meet its production guidance in the upcoming quarters. |
| · | Development of tailings storage facilities (TSF 2, pond 1 and pond 2) have both continued to significantly advance. TSF 2, pond 1 (TSF 2.1) has now been completed, and TSF 2, pond 2 (TSF 2.2) is on track for completion of its first raise and use by June 2023. Together, these TSFs will provide an additional two years of (tailings) storage capacity. Concurrently, the Company has identified two sites for a long-term tailings storage solution. The two sites have been field examined and more detailed engineering design is expected to continue in Q3 and Q4 2023. |
5
| | Management’s Discussion and Analysis February 28, 2023 |
Exploration
| · | In Q2 2023, the Company drilled 13 holes representing 1,411 meters at Buckreef Gold including exploration drilling at Eastern Porphyry and sterilization drilling at Buckreef Gold’s ROM pad. For the six months ended February 28, 2023, the Company drilled 34 holes representing 6,077 meters including infill drilling at Buckreef Main, exploration drilling at Anfield and Eastern Porphyry, and sterilization drilling. Assay results from the latter two programs have been received and are being analyzed. |
| · | For the six months ended February 28, 2023, the Company has also drilled to the southwest (“SW”) of the Main Zone, beyond and under the historical South Pit (24 drill holes representing 4,255 meters). Assay results from both wide spaced drill programs are encouraging with wide zones of mineralization encountered in some holes that are comparable to present mining areas. Importantly, the deposit now remains open on strike to the SW, NE and at depth. Since drilling recommenced in 2021, an additional 500 meters of gold mineralization (along strike and representing approximately 30% increase in the strike length of known gold mineralization) have been identified. The identification of the additional 500 meters of strike length to the deposit provides future opportunity for the Company to potentially add additional mineral resources. |
| · | During the six months ended February 28, 2023, the Company received significant assay results for the metallurgical testing program, the results of which demonstrate: (i) continuity of mineralization down dip and along strike of the deposit; and (ii) excellent width and grade of mineralization. As part of the upcoming metallurgical variability study, using core from this program, the Company plans to assess the amenability of the sulphide material to be processed through the existing processing plant, using its relatively simple flowsheet. In turn, this may have positive implications for potential plant expansions. |
Larger Development Project
| · | Buckreef Gold has commenced the long-lead items for de-risking the larger development project, including: (i) geotechnical characterization to determine the ultimate pit slopes of the 2 kilometre long open pit. The field work completed in early Q3 2023 with consultants SGS Canada Inc (“SGSC”) and Terrane Geoscience Inc; and (ii) the variability metallurgical study for the first 5-7 years of potential production of the larger development project. To date a total of 19 metallurgical holes (2,367 meters) have been completed along the entire strike of the Buckreef Main deposit. These holes have now been shipped to SGS South Africa for metallurgical testing at the successful bidding laboratory. |
| · | The Company, in conjunction with Ausenco Engineering Canada Inc. (“Ausenco”), has identified potential locations for the larger processing plant, potential dry stack tailings facility, waste rock piles and other associated infrastructure. All locations are subject to successful ‘sterilization drilling’, which commenced in Q2 2023. |
| · | The exploration drilling program will also focus on infill and expansion drilling at Eastern Porphyry, Buckreef West, inferred mineral resources and strike extensions, both to the NE and SW of the Main Zone - which if successful, has the potential to increase tonnes to the indicated mineral resource category. |
Environmental, Social and Corporate Governance
| · | The Company is committed to working to high ESG standards and is implementing several community programs, while continuing to develop a broader framework and policies. There were no reportable environmental or community related incidents during the three and six months ended February 28, 2023. Buckreef Gold continued to develop its ESG program during the quarter, after successfully partnering with the Geita District and District Commissioners on school, water and health projects. |
| · | Buckreef Gold worked with Geita District Council and local wards to collaboratively identify programs that focus on short to long term educational needs, which in turn is aligned with Buckreef Gold’s local hiring practices and includes Science, Technology, Engineering and Mathematics and gender goals. |
6
| | Management’s Discussion and Analysis February 28, 2023 |
| · | A Memorandum of Understanding was signed in Q2 2022 between Buckreef Gold and the Geita District Council to provide support around education in the wards of Lwamgasa, Kaseme, Busanda and Bugulula, being the host wards for the mine site. A total of 420 million Tanzania Shillings (approximately $180,000) was budgeted by Buckreef Gold for F2023, commencing July 2022 – June 2023, to support priority areas in agreement with the Geita District Council. During Q2 2023, the Company continued construction activities on a new health center in the Busanda ward and has incurred approximately 100 million Tanzania Shillings (approximately $50,000) year to date. |
| · | Buckreef Gold’s operations: (i) are connected to the Tanzanian national electricity grid and utilize grid power which is significantly and increasingly sourced from hydroelectric facilities in Tanzania; (ii) recycle all water used in its operations; (iii) do not discharge water from its operations; (iv) employ a workforce that comprises 100% Tanzanian citizens (110 full-time employees, 249 contract miners and project contractors); (v) include development and building activities that are focused on maximizing local content; and (vi) exhibit a ‘100 mile diet’ by procuring all food locally. In addition, the Company’s sulphide development operations are expected to utilize dry stack tailings. |
| · | The Company supports local procurement in its activities by first sourcing within the immediate wards, then out to district, region and nation. Only those items or services not available in Tanzania are purchased externally, first prioritizing East Africa, Africa, then globally. |
| · | The Company will continue to develop a broader ESG program, including reporting aligned with definitions from the World Economic Forum, and identifying its contributions to the United Nations Sustainable Development Goals over the remainder of F2023. |
Financial
| · | Gold ounces poured during Q2 2023 were 5,636 ounces – a quarterly production record for Buckreef Gold and in line with previous production guidance of approximately 1,600 – 2,000 ounces of gold per month. Gold ounces sold were 5,504 at an average realized price1 of $1,845 per ounce excluding the revenue and gold ounces sold related to the prepaid gold purchase agreement with OCIM Metals & Mining SA (“OCIM”) (“average realized price (net)1”). |
| · | For the six months ended February 28, 2023, gold ounces poured and sold were 11,030 and 11,258 respectively, at an average realized price (net)1 of $1,762 per ounce. |
| · | Following record production during Q2 2023, the Company recognized revenue of $10.1 million, cost of sales of $5.2 million and cash costs1 of $888 per ounce. Cash cost1 per ounce were higher than Q1 2023 ($732 per ounce) and the prior year comparative period ($727 per ounce) predominantly due to higher mining costs in Q2 2023, in line with the mine sequence, where the Company incurred waste stripping to access a greater extent of ore, including higher grade blocks, which is expected to benefit production in H2 2023. Additionally, the impact of higher blasting activity to access higher grade blocks, combined with lower head grade, unfavorable inventory movements, and lower gold ounces sold contributed to an increase in cash cost in Q2 2023. The Company continues to expect full year total average cash costs1 of $750 - $850 per ounce. The Company generated gross profit of $4.9 million (49% gross profit margin), a quarterly net loss of $0.1 million, operating cash flow of $4.8 million and Adjusted EBITDA1 of $3.9 million. The increase in revenue, gross profit, operating cashflow and Adjusted EBITDA1 compared to the prior comparative period follows successful ramp-up and commissioning of the 1,000+ tpd processing plant in November 2022. |
| · | For the six months ended February 28, 2023, the Company recognized revenue of $19.8 million, cost of sales of $9.6 million and cash cost1 of $808 per ounce, in line with annual guidance of $750 - $850 per ounce, generating gross profit of $10.2 million (52% gross profit margin), net income of $5.1 million, operating cash flow of $11.4 million and Adjusted EBITDA1 of $8.3 million. |
| · | As at February 28, 2023, the Company had cash of $9.5 million and working capital of $5.5 million after adjusting for derivative liabilities which will only be settled by issuing equity of the Company. |
7
| | Management’s Discussion and Analysis February 28, 2023 |
| · | As the Company advances and the production profile expands, management continually evaluates its liquidity requirements and available sources of financing including but not limited to: (i) cash flow from operations; (ii) corporate debt; (iii) project specific debt; (iv) off-take financing; and (v) equity financing. The Company will be prudent in how it capitalizes the Company over the short, medium and long-term with shareholder value being an overarching consideration. |
| · | During Q4 2022, the Company announced that its operating subsidiary, Buckreef Gold, entered into a pre-paid gold purchase agreement with a contract price totaling US$5.0 million with OCIM. The total contract price can be made available to Buckreef Gold in tranches with a $2.5 million upfront tranche and further tranches to be drawn over the next 18 months at Buckreef Gold’s option. During Q1 2023, the Company drew down the first tranche of $2.5 million in exchange for delivering 434 ounces of gold per quarter, commencing February 2023, for a total of 1,735 ounces of gold over four quarters. The second tranche of $2.5 million was undrawn at February 28, 2023. |
8
| | Management’s Discussion and Analysis February 28, 2023 |
Operational Overview
The Buckreef Gold Project
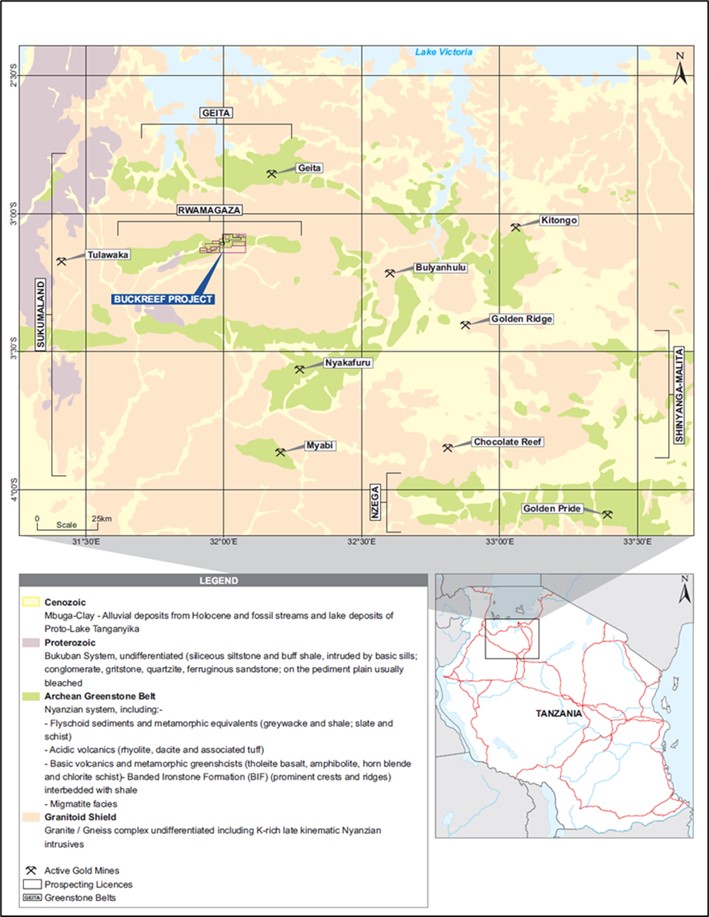
The Company is focused on the Buckreef Gold Project located in the Geita District of the Geita Region south of Lake Victoria, approximately 110 km southwest of the City of Mwanza, Tanzania (Figure 1). The Buckreef Gold Project area can be accessed by ferry across Smiths Sound, via a paved national road and, thereafter, via well maintained unpaved regional roads. The Buckreef Gold Project comprises five prospects, namely Buckreef, Eastern Porphyry and Anfield. The Buckreef Gold Project itself encompasses three main mineralized zones: Buckreef South, Buckreef Main and Buckreef North. The Buckreef Gold Project is fully licensed for mining and the extraction of gold.
The Buckreef Gold Project Mineral Resources as of May 15, 2020, are as follows:
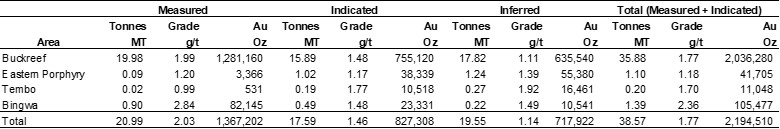
Note: Main Zone at 0.4 g/t cut-off, and Eastern Porphyry, Bingwa and Tembo at 0.5 g/t cut-off
Mineral Resources inclusive of Mineral Reserves
Mineral Resources that are not Mineral Reserves do not have demonstrated economic viability
All resources below 540 mRL are classified as inferred
Estimates over variable widths of 2 to 40 meters
Bulk Density ranges 2.0 g/cm3 to 2.8 g/cm3
55% attributable to the Company
Effective Date: May 15, 2020
The Buckreef Gold Project Mineral Reserves remained as of the May 15, 2020 Technical Report and are tabulated below.
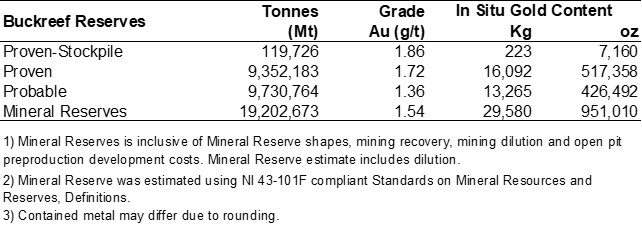
Mineral Resource and Reserve Statements
The Company did not conduct any new work that would warrant material changes in the previously reported Mineral Resource and Mineral Reserve statements during this reporting period.
9
| | Management’s Discussion and Analysis February 28, 2023 |
Figure 1: Location of Buckreef Gold Project Licences on Lake Victoria Greenstone Belt
10
| | Management’s Discussion and Analysis February 28, 2023 |
Processing Plant and Operations
In September 2022, Buckreef Gold announced that the 1,000+ tpd oxide mill circuit was commissioned and was ramping up production from its original 360 tpd capacity. First ore was introduced to the expanded processing plant in September 2022 and the team ramped up throughput reaching nameplate capacity of 1,000+ tpd at the end of October 2022. Commercial production of the 1,000+ tpd processing plant was declared in November 2022. Q2 2023 was the first full quarter of the 1,000+ tpd operating at capacity.
Select operating, financial and stockpile information from the expanded operation follows below:
Select Operating and Financial Data
| Unit | Three months ended February 28, 2023 | Three months ended February 28, 2022 | Six months ended February 28, 2023 | Six months ended February 28, 2022 | ||||||||||||||||
| Operating Data | ||||||||||||||||||||
| Ore Mined | k tonnes | 139 | 47 | 207 | 74 | |||||||||||||||
| Waste Mined | k tonnes | 705 | 109 | 1,143 | 194 | |||||||||||||||
| Total Mined | k tonnes | 845 | 156 | 1,351 | 268 | |||||||||||||||
| Strip Ratio | w:o | 5.1 | 2.3 | 5.5 | 2.6 | |||||||||||||||
| Mining Rate | tpd | 9,388 | 1,734 | 7,462 | 1,481 | |||||||||||||||
| Mining Cost (Variable) | US$/t | $ | 3.06 | $ | 3.07 | $ | 3.10 | $ | 2.97 | |||||||||||
| Plant Ore Milled | k tonnes | 92 | 26 | 169 | 34 | |||||||||||||||
| Head Grade | g/t | 2.07 | 2.88 | 2.52 | 2.85 | |||||||||||||||
| Plant Utilization | % | 95 | 92 | 95 | 87 | |||||||||||||||
| Plant Recovery Rate | % | 90 | 90 | 91 | 87 | |||||||||||||||
| Processing Cost (Fixed) | US$ ('000s) | $ | 238 | $ | 151 | $ | 425 | $ | 305 | |||||||||||
| Processing Cost (Variable) | US$/t | $ | 15.70 | $ | 15.59 | $ | 16.98 | $ | 16.07 | |||||||||||
| Plant Mill Throughput | tpd | 1,025 | 286 | 936 | 188 | |||||||||||||||
| Gold Ounces Poured | oz | 5,636 | 2,132 | 11,030 | 2,522 | |||||||||||||||
| Gold Ounces Sold | oz | 5,504 | 1,812 | 11,258 | 2,202 | |||||||||||||||
| Financial Data1 | ||||||||||||||||||||
| Revenue2 | $ | ('000s) | 10,098 | 3,334 | 19,816 | 3,334 | ||||||||||||||
| Gross Profit | $ | ('000s) | 4,919 | 1,891 | 10,229 | 1,891 | ||||||||||||||
| Net income (loss) | $ | ('000s) | (50 | ) | (1,002 | ) | 5,110 | (3,160 | ) | |||||||||||
| Adjusted EBITDA3 | $ | ('000s) | 3,888 | 293 | 8,300 | (1,054 | ) | |||||||||||||
| Operating Cash Flow | $ | ('000s) | 4,778 | 1,544 | 11,426 | (1,411 | ) | |||||||||||||
| Average Realized Price (gross)3 | $/oz | 1,835 | 1,840 | 1,760 | 1,840 | |||||||||||||||
| Average Realized Price (net)3,4 | $/oz | 1,845 | 1,840 | 1,762 | 1,840 | |||||||||||||||
| Cash Costs3 | $/oz | 888 | 727 | 808 | 727 |
| 1 | Note that the table above does not present comparative statistics for revenue, costs of good sold and related sales and cost metrics for the six month comparable period as Buckreef Gold early adopted the IAS 16 amendment as disclosed in the three and six months ended February 28, 2022 financial statements. Gold sales and related costs prior to that date were capitalized to exploration and evaluation assets and expenditures. |
| 2 | Revenue includes immaterial amounts from the sale of by-product silver and copper. |
| 3 | Refer to the "Non-IFRS Performance Measure" section. |
| 4 | Net of revenue and ounces of gold sold related to OCIM gold prepaid purchase agreement. |
11
| | Management’s Discussion and Analysis February 28, 2023 |
Operations Discussion
Gold Production and Sales
During Q2 2023, Buckreef Gold poured 5,636 ounces of gold, a new quarterly record for the Company, and sold 5,504 ounces of gold at an average realized price (net)1 of $1,845 per ounce. For the six months ended February 28, 2023, Buckreef Gold poured 11,030 ounces of gold and sold 11,258 ounces of gold at an average realized price (net)1 of $1,762 per ounce. Gold ounces produced and sold reflected an increase relative to the prior year comparative periods mainly due to an increase in plant throughput following commissioning of the expanded 1,000+ tpd processing plant in Q1 2023.
Mining
Total ore mined in Q2 2023 increased to 139 kt from 47 kt in the prior year period due to a higher mining rate for the successful commissioning of the expanded 1,000+ tpd processing plant during Q1 2023. In Q2 2023 total waste mined was 705 kt contributing to a strip ratio of 5.1 (waste:ore tonnes) and a total of 845 kt of material mined. During H1 2023 the Company expedited waste stripping to access a greater extent of ore, including higher grade blocks, which is expected to benefit production in H2 2023.
Mining costs per tonne (variable) primarily reflect contractor mining costs following the hiring of FEMA in Q1 2022 on a two-year contract to mine ore, waste, and to construct the TSF at Buckreef Gold. Mining costs per tonne (variable) of $3.06 in Q2 2023 were in line with the prior year comparative period ($3.07). On a year to date basis, mining costs per tonne (variable) of $3.10 were higher than the prior year comparative period ($2.97) primarily due to an increase in blasting costs as the Company scheduled additional blasting activity in Q2 2023 to access higher grade ore blocks. This was combined with an increase in blasting activities in Q1 2023 related to the ramp up of mining operations in preparation for 1,000+ tpd processing plant commissioning.
Processing
The 1,000+ tpd processing plant was commissioned in September 2022 and reached nameplate capacity at the end of October 2022. In Q2 2023, the expanded processing plant achieved the following statistics: (i) average throughput of 1,025 tpd; (ii) plant availability of 95%; and (iii) an average recovery rate of 90%. On a year to date basis, following commissioning of the 1,000+ tpd processing plant in November 2022, the processing plant achieved the following statistics: (i) average throughput of 936 tpd; (ii) plant availability of 95%; and (iii) an average recovery rate of 91%.
For the three months ended February 28, 2023, processing costs per tonne (variable) of $15.70 were in line with the prior year comparative period ($15.59). On a year to date basis, processing cost per tonne (variable) of $16.98 were higher than the prior year period ($16.07) mainly due to an increase in power utilization, fuel consumption, reagents and consumables associated with the first-fill of the expanded 1,000+ tpd processing facility which was commissioned during Q1 2023.
12
| | Management’s Discussion and Analysis February 28, 2023 |
Stockpile, Gold in Circuit (GIC) and Finished Goods Inventory
As at February 28, 2023, Buckreef Gold reported the following stockpile statistics: (i) the ROM pad stockpile contained 153,619 tonnes at an average grade of 1.0 g/t with an estimated 4,933 ounces of gold; and (ii) crushed mill feed of 7,668 tonnes at 2.40 g/t containing an estimated 592 ounces of gold. Since year-end August 31, 2022, the Company has drawn down the ROM pad stockpile (365 ounces) and crushed ore stockpile (625 ounces) to support mill feed during the wet season. These fluctuations in ROM pad inventory are anticipated throughout the course of the year and are designed to ensure steady state processing. During Q1 2023, the Company processed stockpiled and mined material to commission the expanded 1,000+ tpd processing plant (which included 7 new large CIL tanks) and consequently reported an increase of gold in circuit, reflecting a buildup of metal inventory in the CIL tanks during plant commissioning. The net result being a substantial increase of gold in circuit, which contained 1,638 ounces at February 28, 2023. The remaining stockpile and GIC balance at February 28, 2023 continue to provide support for the Company to meet its production guidance in the upcoming quarters.
A summary of the ROM pad and crushed ore stockpile statistics are contained in Table 1 below:
| Table: RoM Stockpile Summary (as at 28 February 2023) | ||||||||||||||||
| Summary RoM Stockpile | Volume (m3) | Tonnes | Grade (g/t Au) | Metal (oz) | ||||||||||||
| High Grade | 215 | 1,027 | 3.34 | 110 | ||||||||||||
| Medium Grade | 36,430 | 60,493 | 1.32 | 2,568 | ||||||||||||
| Low Grade | 54,063 | 92,100 | 0.76 | 2,256 | ||||||||||||
| Total (RoM) | 90,708 | 153,619 | 1.00 | 4,933 | ||||||||||||
| Crushed Ore (COS) | 1,350 | 7,668 | 2.40 | 592 | ||||||||||||
| Total | 92,058 | 161,287 | 1.07 | 5,525 | ||||||||||||
13
| | Management’s Discussion and Analysis February 28, 2023 |
Figure 2: Buckreef Gold Mine Oxide Mineral Reserve Starter Pit (Blasting Activity Q1 2023)
Figure 3: 1,000+ tpd Processing Plant at Buckreef Gold Mine, showing new CIL tanks and conveyor feed to the new ball mills (Q1 2023)
14
| | Management’s Discussion and Analysis February 28, 2023 |
Figure 4: Buckeef Gold Expanded 1,000+ tpd Processing Plant, showing installation of two new 360 tpd ball mills (Q1 2023)
15
| | Management’s Discussion and Analysis February 28, 2023 |
Figure 5: Buckreef Gold Tailings Storage Facility Expansion (Q2 2023)
Exploration & Mineral Resources
TRX Gold and Buckreef Gold continue to evaluate the full potential of the Buckreef Gold property and identify opportunities for the discovery of additional mineral resources and their conversion to mineral reserves. Successful exploration will also provide greater production flexibility and growth. To achieve this goal the Company, in conjunction with Buckreef Gold, has:
| · | Re-evaluated the Buckreef Main Zone for strike extensions, off-shoot splays, and at depth potential. The deposit is open in all directions (See Figure 6). To date, the Company has tested the NE Extension and successfully identified gold mineralization over an additional 300 meters. The deposit remains open along strike to the NE and future infill drilling is warranted. The SW extension has also been tested with wide spaced drilling and the exploration program has returned encouraging results. The deposit now remains open along strike to the SW; |
| · | Collectively, between the NE extension and SW drilling the known strike extent of gold mineralization on the deposit structure has been expanded 500 meters, or by nearly 30% since exploration recommenced. The Company will now identify the areas offering the best opportunity to add gold ounces to the mineral resource inventory and commence an infill drilling program; and |
16
| | Management’s Discussion and Analysis February 28, 2023 |
| · | During Q1 2023, the Company commenced drilling at Anfield and the Eastern Porphyry zones. Both zones represent compelling exploration targets to the Company. In 2021 the Company discovered the Anfield Zone, a set of parallel structures 200 - 500 meters to the east of the Buckreef Main Zone and with evidence of an additional strike length of 3 km of shear zone targets (Figure 6). Furthermore, the Anfield trend aligns and is on strike with the Eastern Porphyry zone to the NE and a neighboring small scale mine to the SW. Assay results have been received and are currently being analyzed. |
Buckreef Gold Exploration – Second Quarter and Year to Date 2023
During Q2 2023, the Company drilled 1,441 meters at Buckreef Gold including exploration, infill drilling and step-out drilling, and 165 meters of sterilization drilling. Year to date the Company drilled 10,332 meters of exploration, infill and sterilization drilling have been completed, excluding 3,525 meters of grade control drilling.
Buckreef Gold Main Zone Drilling Results and Interpretation
The significant mineralized intercepts of the Buckreef Main Zone are as shown in the Figure 6. It is evident that the deposit remains open on trend to the NE and SW. As previously noted, the Company had initiated a drill program, specifically to explore potential mineralization extensions to the NE and SW and to upgrade shallow Inferred Mineral Resources.
During the six months ended February 28, 2023, the Company received more assay results from its exploration program which has provided another extension of known mineralization on the Buckreef Gold Main Zone to the south.
The results are positive and significant for the Company as they continue to demonstrate: (i) continuity of gold mineralization along strike to the southwest of the Main Zone deposit; and (ii) continued gold mineralization under the (historical) South Pit. The deposit, therefore, remains ‘open at depth and on strike,’ and in combination with the 300 meter extension of the NE (announced previously) represents approximately a 30% increase in the Main Zone deposit strike length to over 2.0 kms.
Highlights include:
| · | Hole BMDD250 intersected 34.80 m grading @ 1.26 g/t Au from 87.2 m, including 10.0 m grading @ 3.08 g/t from 89.9 m; and |
| · | Hole BMDD275 intersected 16.5 m grading @ 2.01 g/t Au from 53.7 m, including 7.0 m grading @ 3.28 g/t from 56.0 m. |
Notes: Sample Protocol QA/QC – see endnotes. Sampled widths are not true widths.
| · | Extension of Buckreef Main Zone South by a further 200 meters: Expansion of the gold deposit mineralization by 300 meters in the NE and 200 meters in the southwest (increases in the strike length of the Buckreef Main Zone deposit, or known gold mineralization, to over 2.0 kms) on the Buckreef Gold deposit which contains over 2.0 million ounces of gold in the Measured and Indicated Mineral Resources in the Buckreef Main Zone. The Company has drilled a total of 24 drill holes representing 4,255 meters in the southwest area, with full results provided in Table 2. The Buckreef Main Zone continues to be open further to the NE and extending to the Buckreef Special Mining License boundary and to the SW (see Figure 7). In the latter the trend is aligned to several historical artisanal scale miner pits; and |
| · | The Company continued exploration drilling at the Anfield Zone and extended the program to include the Eastern Porphyry Zone. This exploration program combined with the extension of the Buckreef Main Zone is expected to expand the scope and scale of the Buckreef Gold Project. Assay results have been recently received and are currently being analyzed. |
17
| | Management’s Discussion and Analysis February 28, 2023 |
Table 2: Buckreef Main Zone South Drill Hole Sample Results Summary
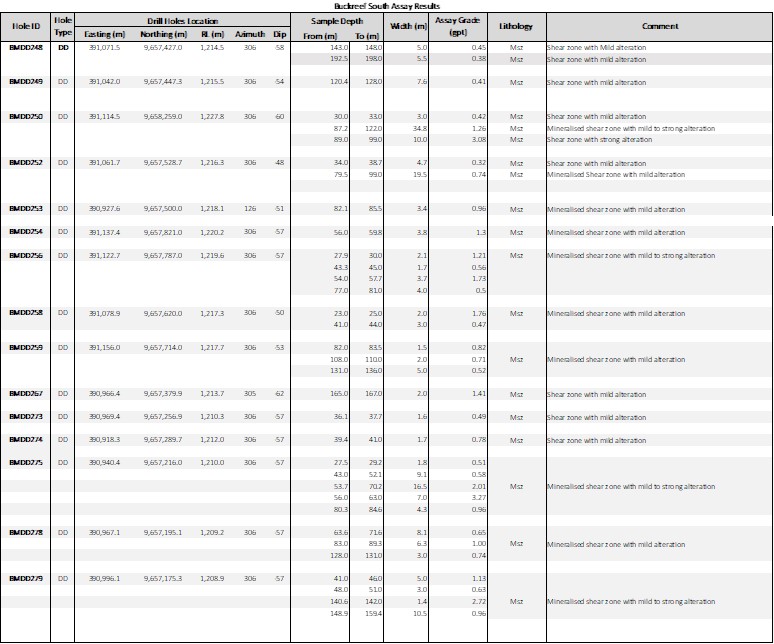
Notes: Sample Protocol QA/QC – see endnotes. Sampled widths are not true widths.
18
| | Management’s Discussion and Analysis February 28, 2023 |
Figure 6: NE Buckreef Main Zone Exploration Target Highlighted and in Relation to the Anfield Zone
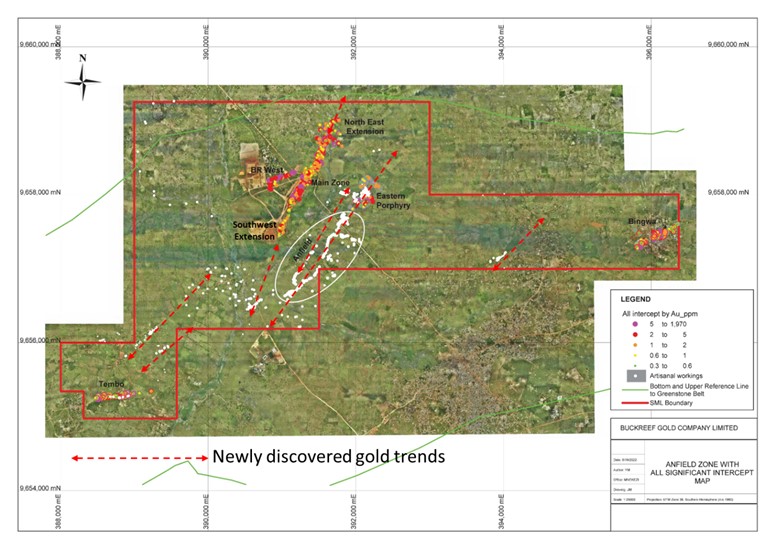
19
| | Management’s Discussion and Analysis February 28, 2023 |
Figure 7: Map Showing Mineralization Extension and Location of Drill Results at Buckreef Main Zone Southwest Extension
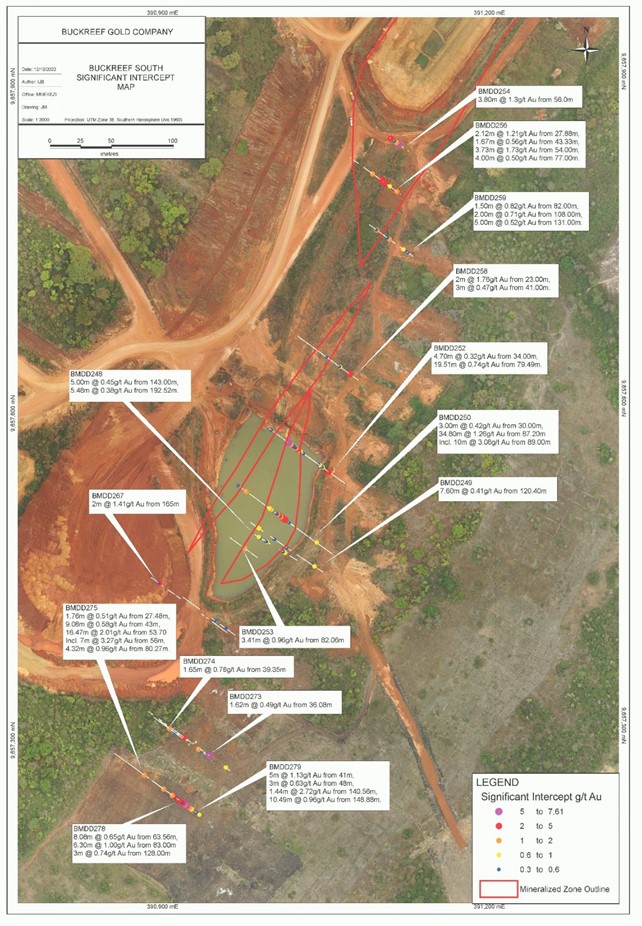
20
| | Management’s Discussion and Analysis February 28, 2023 |
Larger Development Project – Preliminary Metallurgical Results and Ongoing Test Work
The Company continues to work on its mid-to-long-term larger development project and has received assay results from its 19-hole metallurgical variability sampling program on the Buckreef Main Zone. The samples have now been dispatched to SGS South Africa for the metallurgical testwork
The results are positive and significant for the Company because they continue to demonstrate: (i) continuity of mineralization down dip and along strike of the deposit; and (ii) excellent width and grade of mineralization.
Highlights include:
| · | Hole BMMT015 intersected 28.0 m grading @ 10.68 g/t Au from 0 m; |
| · | Hole BMMT020 intersected 123.0 m grading @ 2.69 g/t Au from 3 m; |
| · | Hole BMMT009 intersected 121.0 m grading @ 2.96 g/t Au from 3 m; |
| · | Hole BMMT022 intersected 106.0 m grading @ 4.19 g/t Au from 85 m, 77 m grading @ 3.09 g/t from 241 m; and |
| · | Hole BMMT021 intersected 90.0 m grading @ 1.56 g/t Au from 139 m. |
Detailed results are shown in Table 3 and locations are shown in Figure 8.
Figure 8: Map Showing Location of Metallurgical Drill Holes and Their Result Highlights
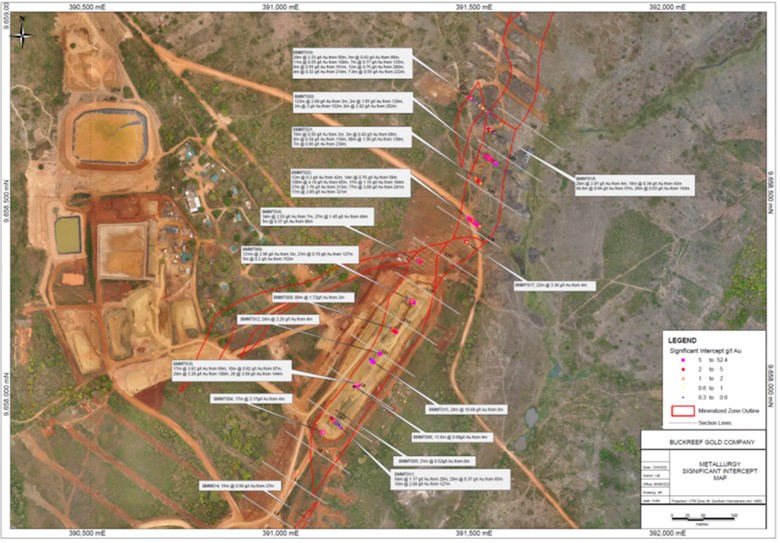
21
| | Management’s Discussion and Analysis February 28, 2023 |
Table 3: Metallurgy Drill Hole Sample Results Summary
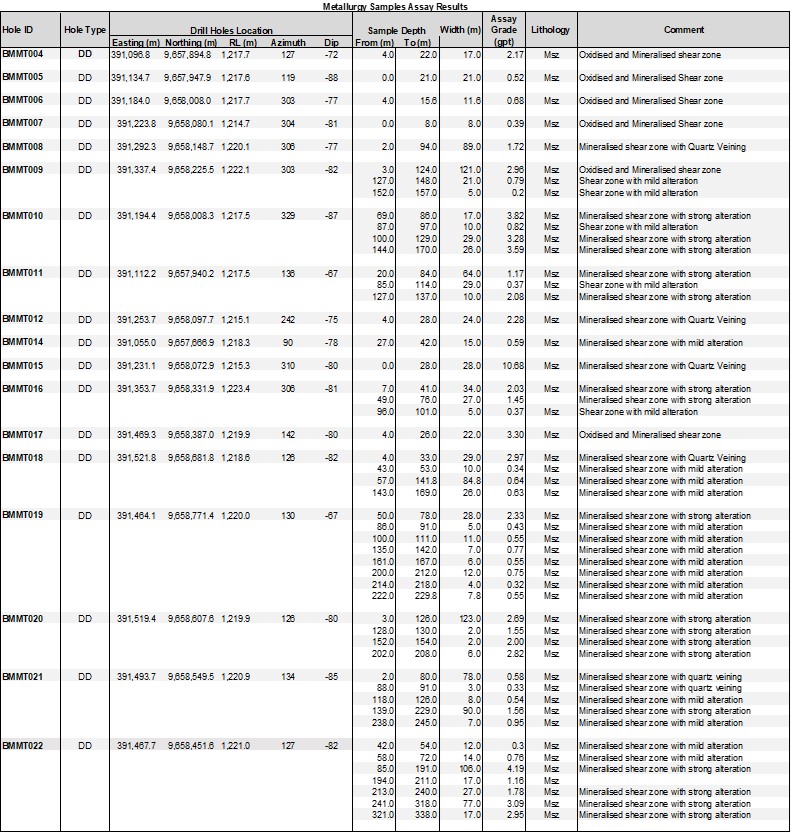
Notes: Sample Protocol QA/QC – see footnote below. Sampled widths are not true widths. Of 19 holes drilled, 18 are reported, with the remaining hole unreported due to an incomplete intersection of the Main Zone.
22
| | Management’s Discussion and Analysis February 28, 2023 |
As part of the metallurgical variability study, using core from the 19 hole drill program, the Company plans to assess the amenability of the sulphide material to be processed through the existing processing plant, using its relatively simple flowsheet. In turn, this may have positive implications for potential plant expansions. During Q2 2023, the Company. working with Ausenco, has successfully identified a metallurgical laboratory of good renown to complete this work to undertake which will encompass the first 5-7 years of production from the sulphide mine and processing operations at Buckreef Gold. This study will build on the prior work of SGSC on deeper parts of the mineral resource and data gathered during processing of the oxide, transitional mineral reserve. All samples have been prepared and are ready for shipment.
The samples will be analyzed for:
| · | Overall gold recoveries; |
| · | Process design to achieve those recoveries (grindability, retention times, straight CIL or flotation/regrind); |
| · | Any pregnant solution robbing or refractory mineralogy; |
| · | Acid Mine Drainage (if any) characteristics; and |
| · | Dry stack tailings characteristics. |
Geotechnical Analysis Field Work
SGSC – Terrane Geoscience have been awarded the geotechnical analysis work for the deeper pit design. Field work includes a drilling program that constitutes 5 holes for 1,571 meters. Associated detailed field work involving packer tests, downhole televiewer, co-axial rock strength testing and standard geotechnical logging of the footwall and hanging wall lithologies has been completed. Selected samples have been sent to a geomechanical laboratory in Canada for further analysis. The results of this work will be instrumental in determining pit slope angles for the ultimate pit.
23
| | Management’s Discussion and Analysis February 28, 2023 |
Financial Highlights – Second Quarter and Year to Date 2023
For the three months ended February 28, 2023, Buckreef Gold produced 5,636 ounces of gold – a quarterly record for the Company - and sold 5,504 ounces of gold.
Following record production, the Company recognized revenue of $10.1 million for the three months ended February 28, 2023.
Cost of sales, which includes production costs, royalties and depreciation, was $5.2 million generating a gross profit of $4.9 million or 49% during Q2 2023. After general and administrative expenses, revaluation of derivative warrant liabilities, foreign exchange, interest and other expenses, and income taxes, the Company recorded a net loss of $0.1 million for Q2 2023.
Q2 2023 ounces sold (5,504 ounces) generated positive operating cash flow of $4.8 million in Q2 2023. Positive operating cash flow is being used to fund value creating activities, including exploration and advancing the larger development project.
At February 28, 2023, the Company had a cash balance of $9.5 million and a working capital surplus of $5.5 million after adjusting for current liabilities which will only be settled by issuing equity.
For the six months ended February 28, 2023, Buckreef Gold produced and sold 11,030 and 11,258 ounces of gold, respectively. The Company recognized revenue of $19.8 million and cost of sales was $9.6 million generating a gross profit of $10.2 million or 52%. For the six months ended February 28, 2023, the Company recorded net income of $5.1 million and generated positive operating cash flow of $11.4 million which enabled further investment in the development and growth of Buckreef Gold.
Capital Expenditures
During the three months ended February 28, 2023, the Company incurred a total of $4.2 million in cash capital expenditures (including value added tax). Net additions increased as the Company continued to invest in infrastructure and development for the Buckreef Gold property during the quarter, including construction of a significantly expanded TSF, one-time expenditures related to final road realignment around the Special Mining License which is expected to enable full life of mine access to the Main Zone, four new gensets with cabling and synchronization panel to replace existing rental units, capitalized pre-stripping mine development activity with FEMA to access a greater extent of ore, including higher grade blocks, and the diamond drill program with STAMICO which focused on infill and exploration drilling at Buckreef Main, Anfield and Eastern Porphyry.
For the six months ended February 28, 2023, the Company incurred a total of $10.2 million in cash capital expenditures, mainly related to the list of items above combined with expenditures related to final commissioning of the 1,000+ tpd processing plant in November 2022.
24
| | Management’s Discussion and Analysis February 28, 2023 |
Selected Financial Information
The following information has been extracted from the Company’s unaudited interim condensed consolidated financial statements for the three and six months ended February 28, 2023 prepared in accordance with IFRS.
| $(000's) | As at and for the three months ended February 28, 2023 | As at and for the six months ended February 28, 2023 | As at and for the three months ended February 28, 2022 | As at and for the six months ended February 28, 2022 | ||||||||||||
| Net income (loss) and comprehensive income (loss) attributable to shareholders | (1,399 | ) | 2,113 | (1,958 | ) | (3,980 | ) | |||||||||
| Basic income (loss) per share | 0.00 | 0.01 | (0.01 | ) | (0.02 | ) | ||||||||||
| Diluted income (loss) per share | 0.00 | 0.01 | (0.01 | ) | (0.02 | ) | ||||||||||
| Total assets | 79,384 | 79,384 | 62,643 | 62,643 | ||||||||||||
| Total long term financial liabilities | 5,082 | 5,082 | 2,768 | 2,768 |
Financial Results
Three months ended February 28, 2023
| Three months ended | ||||||||
| February 28, | ||||||||
| 2023 | 2022 | |||||||
| Revenue | $ | 10,098 | $ | 3,334 | ||||
| Cost of sales | (5,179 | ) | (1,443 | ) | ||||
| Gross profit | 4,919 | 1,891 | ||||||
| General and administrative expense | (2,035 | ) | (2,152 | ) | ||||
| Loss on derivative warrant liabilities | (965 | ) | (145 | ) | ||||
| Foreign exchange | 65 | (104 | ) | |||||
| Interest and other expenses | (856 | ) | (341 | ) | ||||
| Income tax expense | (1,178 | ) | (151 | ) | ||||
| Net loss and comprehensive loss | $ | (50 | ) | $ | (1,002 | ) | ||
| Net income and comprehensive income attributable to non-controlling interests | 1,349 | 956 | ||||||
| Net loss and comprehensive loss attributable to shareholders | (1,399 | ) | (1,958 | ) | ||||
Revenue
For the three months ended February 28, 2023, the Company recognized revenue of $10.1 million (Q2 2022: $3.3 million). The 203% increase in revenue compared to the prior year comparative period is primarily related to higher gold production and ounces of gold sold following final commissioning of the 1,000+ tpd processing plant in November 2022. During the period, the Company sold 5,504 ounces of gold (Q2 2022: 1,812 ounces) at an average realized price (net)1 of $1,845 per ounce (Q2 2022: $1,840 per ounce).
Cost of sales
Cost of sales for the three months ended February 28, 2023 was $5.2 million (Q2 2022: $1.4 million) and is comprised of production costs, (including mining, processing and site general and administrative costs), royalties and depreciation. Assets are depreciated on a straight-line basis over their useful life or depleted on a units-of-production basis over the reserves to which they relate.
25
| | Management’s Discussion and Analysis February 28, 2023 |
In connection with the successful processing plant expansion which resulted in higher plant throughput and gold production, the Company changed the method of estimating the cost of its ore stockpiles effective September 1, 2022. The updated methodology estimates the cost of ore stockpiles based on estimated recoverable ounces of gold in ore stockpiles whereby the previous methodology was based on tonnes of ore in stockpiles. The net result is that higher costs are attached to higher grade ore and consequently, higher costs are charged to the statements of comprehensive income/(loss) during periods that higher grade ore is processed and sold (and vice versa). The Company believes this methodology better matches revenue and expenses and has been applied prospectively from September 1, 2022.
For the three months ended February 28, 2023, the Company recorded production costs of $4.1 million (Q2 2022: $1.1 million) and royalties of $0.8 million (Q2 2022: $0.3 million) based on a 7.3% statutory royalty rate in Tanzania. Cash cost1 which include production costs and royalties were $888 per ounce (Q2 2022: $727 per ounce). Cash cost1 per ounce were higher than the prior year comparative period predominantly due to higher mining costs in Q2 2023, in line with mine sequence, where the Company incurred waste stripping to access a greater extent of ore, including higher grade blocks, which is expected to benefit production in H2 2023. Additionally, the impact of higher blasting activity to access higher grade blocks, combined with lower head grade, unfavorable inventory movements, and lower ounces sold contributed to an increase in cash cost1 in Q2 2023. The Company continues to expect full year total average cash cost1 of $750 - $850 per ounce.
On November 1, 2022, the Company declared commercial production for the 1,000+ tpd processing plant at Buckreef after successful construction, commissioning and ramp-up of processing to a steady state throughput of 1,000+ tpd. Upon declaration of commercial production, capitalization of mine development costs ceases and depreciation of capitalized mine development costs commences. For the three months ended February 28, 2022, the Company recorded depreciation of $0.3 million (Q2 2022: $0.1 million).
General and administrative expense
During the three months ended February 28, 2023, the Company recorded general and administrative expense of $2.0 million compared to $2.2 million for the prior year period, mainly due to a decrease in severance related expenses following personnel changes made during Q2 2022.
Loss on derivative warrant liabilities
During the three months ended February 28, 2023, the Company had a loss on derivative warrant liabilities of $1.0 million compared to a loss of $0.1 million in the prior year period. The loss on revaluation of derivative warrant liabilities, which are valued using the Black Scholes option pricing model, was principally due to the quarterly increase in the Company’s share price (Q2 2023: $0.40, Q1 2023: $0.34).
Interest and other expense
During the three months ended February 28, 2023, the Company recorded interest and other expense of $0.9 million compared to $0.3 million in the prior year period. The increase is primarily related to tax adjustments related to a 2012 – 2020 tax assessment in Tanzania that was issued during Q2 2023.
Income tax expense
Income tax expense is recognized based on management’s estimate of the weighted average annual income tax rate expected for the full financial year. During the three months ended February 28, 2023, the Company recorded net income at Buckreef Gold and recognized income tax expense of $1.2 million (Q2 2022: $0.2 million), comprised of a current income tax expense of $0.2 million (Q2 2022: $0.2 million) and deferred income tax expense of $1.0 million (Q2 2022: $nil) based on current Tanzanian statutory tax rates.
26
| | Management’s Discussion and Analysis February 28, 2023 |
Net loss and comprehensive loss
The Company reported a net loss for the three month period ended February 28, 2023 of $0.1 million ($1.4 million net loss attributable to shareholders, basic and diluted loss per share of $0.00) compared to a net loss of $1.0 million in the prior year period ($2.0 million net loss attributable to shareholders, basic and diluted loss per share of $0.01).The decrease in the net loss compared to the prior year comparative period is primarily the result of an increase in gross profit of $3.0 million following an increase in revenue of $6.8 million and cost of sales of $3.7 million during Q2 2023. This, combined with a decrease in general and administrative expense ($0.1 million) due to lower severance expenses was partially offset by an increased loss on derivative warrant liabilities ($0.8 million) due to an increase in the Company’s share price and an increase in income tax expense of $1.0 million following recognition of net income at Buckreef Gold.
Six months ended February 28, 2023
| Six months ended | ||||||||
| February 28, | ||||||||
| 2023 | 2022 | |||||||
| Revenue | $ | 19,816 | $ | 3,334 | ||||
| Cost of sales | (9,587 | ) | (1,443 | ) | ||||
| Gross profit | 10,229 | 1,891 | ||||||
| General and administrative expense | (3,872 | ) | (4,497 | ) | ||||
| Gain on derivative warrant liabilities | 2,400 | 63 | ||||||
| Foreign exchange | 58 | (86 | ) | |||||
| Interest and other expense | (1,041 | ) | (380 | ) | ||||
| Income tax expense | (2,664 | ) | (151 | ) | ||||
| Net income (loss) and comprehensive income (loss) | $ | 5,110 | $ | (3,160 | ) | |||
| Net income (loss) and comprehensive income (loss) attributable to non-controlling interests | 2,997 | 820 | ||||||
| Net income (loss) and comprehensive income (loss) attributable to shareholders | 2,113 | (3,980 | ) | |||||
Revenue
For the six months ended February 28, 2023, the Company recognized revenue of $19.8 million (2022: $3.3 million). The financial statements for the comparable period only present revenue, cost of sales and gross profit for the three months ended February 28, 2022 as Buckreef Gold early adopted amendments to International Accounting Standards (“IAS”) 16, Property, Plant and Equipment, as disclosed in the three and six months ended February 28, 2022 financial statements. Gold sales and related costs prior to that date were capitalized to exploration and evaluation assets and expenditures. The increase in revenue compared to the prior year comparative period is primarily related to higher gold production and ounces of gold sold following final commissioning of the 1,000+ tpd processing plant in November 2022. During the period, the Company sold 11,258 ounces of gold (2022: 2,202 ounces) at an average realized price (net)1 of $1,762 per ounce (2022: $1,840 per ounce).
Cost of sales
Cost of sales for the six months ended February 28, 2023 was $9.6 million (2022: $1.4 million) and is comprised of production costs, (including mining, processing and site general and administrative costs), royalties and depreciation. The increase in cost of sales compared to the prior year comparative period is primarily related to commencement of the 1,000+ tpd processing plant which was commissioned in November 2022.
27
| | Management’s Discussion and Analysis February 28, 2023 |
For the six months ended February 28, 2023, the Company recorded production costs of $7.6 million (2022: $1.1 million) and royalties of $1.5 million (2022: $0.3 million) based on a 7.3% statutory royalty rate in Tanzania. Cash costs1 which include production costs and royalties were $808 per ounce (2022: $727 per ounce), in line with annual guidance of $750 - $850 per ounce.
Following commercial production declaration of the 1,000+ tpd plant in November 2022, the Company ceased capitalization of mine development costs and commenced depreciation of capitalized mine development costs. For the six months ended February 28, 2023, the Company recorded depreciation of $0.5 million (2022: $0.1 million).
As noted above, the prior year comparable period only presents cost of sales for the three months ended February 28, 2022 as Buckreef Gold early adopted amendments to IAS 16 as disclosed in the three and six months ended February 28, 2022 financial statements. Prior to that date, costs were capitalized to exploration and evaluation assets and expenditures.
General and administrative expense
During the six months ended February 28, 2023, the Company recorded general and administrative expense of $3.9 million compared to $4.5 million for the previous year comparable period, mainly due to a decrease in severance related expenses following personnel changes made during Q2 2022.
Gain on derivative warrant liabilities
During the six months ended February 28, 2023, the Company recorded a gain on derivative warrant liabilities of $2.4 million compared to a gain of $0.1 million in the prior year period. The gain on revaluation of derivative warrant liabilities, valued using the Black Scholes option pricing model, was principally due to a decrease in the Company’s share price (Q2 2023 - $0.40, Q4 2022 - $0.48).
Interest and other expense
During the six months ended February 28, 2023, the Company recorded interest and other expense of $1.0 million compared to $0.4 million in the prior year comparative period. The increase is primarily related to tax adjustments related to a 2012 – 2020 tax assessment in Tanzania that was issued during Q2 2023.
Income tax expense
Income tax expense is recognized based on management’s estimate of the weighted average annual income tax rate expected for the full financial year. During the six months ended February 28, 2023, the Company recorded net income at Buckreef Gold and recognized income tax expense of $2.7 million (2022: $0.2 million), comprised of a current income tax expense of $0.5 million (2022: $0.2 million) and deferred income tax expense of $2.2 million (2022: $nil) based on current Tanzanian statutory tax rates.
Net income (loss) and comprehensive income (loss)
The Company reported net income for the six month period ended February 28, 2023 of $5.1 million ($2.1 million net income attributable to shareholders, basic and diluted earnings per share of $0.01), compared to a net loss of $3.2 million in the prior year period ($4.0 million net loss attributable to shareholders, basic and diluted loss per share of $0.02). The increase in net income is primarily the result of an increase in gross profit of $8.3 million following an increase in revenue of $16.5 million and cost of sales of $8.1 million during the six months ended February 28, 2023. This, combined with an increased gain on derivative warrant liabilities ($2.3 million) due to a decrease in the Company’s share price and a decrease in general and administrative expense ($0.6 million) due to lower severance related expense was partially offset by an increase in interest and other expenses of $0.6 million and an increase in income tax expense of $2.5 million following recognition of net income at Buckreef Gold.
28
| | Management’s Discussion and Analysis February 28, 2023 |
Summary of Quarterly Results
| ($(000's), except per share amounts) | ||||||||||||||||||||||||||||||||
| US$ unless otherwise stated | 2023 Q2 | 2023 Q1 | 2022 Q4 | 2022 Q3 | 2022 Q2 | 2022 Q1 | 2021 Q4 | 2021 Q3 | ||||||||||||||||||||||||
| Net income (loss) and comprehensive income (loss) | (50 | ) | 5,160 | (2,350 | ) | 3,188 | (1,002 | ) | (2,158 | ) | (3,517 | ) | 33 | |||||||||||||||||||
| Net income (loss) and comprehensive (income) loss attributable to: | ||||||||||||||||||||||||||||||||
| Non-controlling interests | 1,349 | 1,648 | 1,857 | 1,217 | 956 | (136 | ) | (79 | ) | (483 | ) | |||||||||||||||||||||
| Common shareholders | (1,399 | ) | 3,512 | (4,207 | ) | 1,971 | (1,958 | ) | (2,022 | ) | (3,438 | ) | 516 | |||||||||||||||||||
| Net income (loss) and comprehensive income (loss) | (50 | ) | 5,160 | (2,350 | ) | 3,188 | (1,002 | ) | (2,158 | ) | (3,517 | ) | 33 | |||||||||||||||||||
During the three months ended February 28, 2023, the Company reported a net loss of $0.1 million ($1.4 million net loss attributable to shareholders), compared to net income of $5.2 million ($3.5 million net income attributable to shareholders) in the prior quarter (Q1 2023). The decrease in net income compared to the prior quarter is primarily due to a loss on derivative warrant liabilities ($1.0 million) in Q2 2023 due to an increase in the Company’s share price compared to a gain on derivative warrant liabilities in Q1 2023 ($3.5 million).
Liquidity and Capital Resources
At February 28, 2023 the Company had $9.5 million of cash (August 31, 2022 - $8.5 million) and working capital of $5.5 million after adjusting for current liabilities which will only be settled by issuing equity of the Company (August 31, 2022 - $5.5 million).
The increase in cash of $1.0 million over August 31, 2022 was primarily due to an increase in operating cash flow (H1 2023: $11.4 million), partially offset by an increase in capital investment in infrastructure and development for Buckreef Gold (H1 2023: $10.2 million). During Q2 2023, the Company poured 5,636 ounces of gold (Q2 2022: 2,132), a new record for Buckreef Gold, and sold 5,504 ounces of gold (Q2 2022: 1,812), which contributed to positive operating cash flow of $4.8 million during Q2 2023 (Q2 2022: $1.5 million). For the six months ended February 28, 2023, the Company produced and sold 11,030 and 11,258 ounces of gold, respectively (H1 2022: 2,522 and 2,202 ounces, respectively) generating operating cash flow of $11.5 million (H1 2022: negative $1.4 million). The increase in operating cash flow was partially offset by an increase in capital expenditures related to the final commissioning of the expanded 1,000+ tpd processing plant, capitalized pre-stripping mine development, expenditures related to final road realignment around the Special Mining License, construction of a significantly expanded TSF, development drilling related to the diamond drill program with STAMICO, and the purchase of four new gensets to replace rental units.
To help supplement the Company’s liquidity and to fund productivity enhancing purchases, during Q4 2022 the Company announced that its operating subsidiary, Buckreef Gold, entered into a pre-paid gold purchase agreement with a contract price totaling $5.0 million with OCIM. The total contract price was made available to Buckreef Gold in tranches with a $2.5 million upfront tranche and further tranches to be drawn over the next 18 months at Buckreef Gold’s option. Tranche 1 in this non-dilutive financing includes a 6-month grace period and a repayment period over the following 12 months as quarterly deliveries of a pre-determined quantity of gold. During Q1 2023, the Company drew down the first tranche of $2.5 million in exchange for delivering 434 ounces of gold per quarter, commencing February 2023, for a total of 1,735 ounces of gold over four quarters. The Company intends to use these proceeds on an opportunistic basis and provides the flexibility to make value accretive equipment purchases, and to expedite exploration and sulphide development programs at Buckreef Gold. The second tranche of $2.5 million was undrawn at February 28, 2023.
29
| | Management’s Discussion and Analysis February 28, 2023 |
In addition, to provide the Company with access to supplementary liquidity, during Q2 2022, TRX Gold entered into a purchase agreement with Lincoln Park Capital Fund, LLC (“Lincoln Park”). This agreement provides TRX Gold with the right to sell up to $10 million of its shares to Lincoln Park over a 36-month period at its sole discretion. TRX Gold will control the timing and amount of any sales to Lincoln Park and will use the proceeds as needed to develop the Buckreef Gold asset. To date, TRX Gold has made no sales of its common shares to Lincoln Park.
As of February 28, 2023, the Company has accumulated losses of $121.6 million since inception (August 31, 2022: $123.7 million).
Commitments
In order to maintain existing site mining and exploration licenses, the Company is required to pay annual license fees. As at February 28, 2023 these licenses remained in good standing and the Company is up to date on license payments.
Contingencies
The Company is involved in litigation and disputes arising in the normal course of operations. Management is of the opinion that the outcome of any potential litigation will not have a material adverse impact on the Company’s financial position or results of operations. Accordingly, no provisions for the settlement of outstanding litigation and potential claims have been accrued.
Off-Balance Sheet Arrangements
The Company has no off-balance sheet arrangements.
Transactions with Related Parties
The Company may enter into related party transactions that are in the normal course of business. Transactions with Related Parties disclosure can be found in Note 15 of the Unaudited Interim Condensed Consolidated Financial Statements for the three and six months ended February 28, 2023.
Omnibus Equity Incentive Plan
Effective June 26, 2019, the Company adopted the Omnibus Equity Incentive Plan dated June 26, 2019 (the “Omnibus Plan”), which Omnibus Plan was approved by the shareholders on August 16, 2019, subsequently updated and approved by the shareholders on February 25, 2022.
The purposes of the Omnibus Plan are: (a) to advance the interests of the Company by enhancing the ability of the Company and its subsidiaries to attract, motivate and retain employees, officers, directors, and consultants, which either of directors or officers may be consultants or employees; (b) to reward such persons for their sustained contributions; and (c) to encourage such persons to consider the long-term corporate performance of the Company.
The Omnibus Plan provides for the grant of options, restricted share units (“RSUs”), deferred share units (“DSUs”) and performance share units (“PSUs”) (collectively, the “Omnibus Plan Awards”), all of which are described in detail in the Form 40-F Annual Report for the year ended August 31, 2022, and the Information Circular dated January 21, 2022, filed on SEDAR on January 27, 2022.
The Omnibus Plan provides for the grant of other share-based awards to participants (“Other Share-Based Awards”), which awards would include the grant of common shares. All Other Share-Based Awards will be granted by an agreement evidencing the Other Share-Based Awards granted under the Omnibus Plan.
30
| | Management’s Discussion and Analysis February 28, 2023 |
Subject to adjustments as provided for under the Omnibus Plan, the maximum number of shares issuable pursuant to Omnibus Plan Awards outstanding at any time under the Omnibus Plan shall not exceed 10% of the aggregate number of common shares outstanding from time to time on a non-diluted basis; provided that the acquisition of common shares by the Company for cancellation shall not constitute non-compliance with the Omnibus Plan for any Omnibus Plan Awards outstanding prior to such purchase of common shares for cancellation.
For more particulars about the Omnibus Plan, we refer you to the copy of the Omnibus Plan previously filed as an exhibit with the SEC and on SEDAR. The Omnibus Plan replaces all previous equity compensation plans of the Company, including the Restricted Stock Unit Plan and Stock Option Plan.
Changes in Accounting Polices and Critical Accounting Estimates and Judgements
Significant accounting policies as well as any changes in accounting policies are discussed in Note 3 “Significant Accounting Policies” and Note 4 “Significant Accounting Judgments, Estimates and Assumptions” of the Company’s Unaudited Interim Condensed Consolidated Financial Statements for the three and six months ended February 28, 2023.
Non-IFRS Performance Measures
Average realized price per ounce of gold sold
Average realized price per ounce of gold sold is a non-IFRS measure and does not constitute a measure recognized by IFRS and does not have a standardized meaning defined by IFRS. Average realized price per ounce of gold sold is calculated by dividing revenue by ounces of gold sold. It may not be comparable to information in other gold producers’ reports and filings.
| Three Months Ended | Three Months Ended | Six Months Ended | Six Months Ended | |||||||||||||
| February 28, 2023 | February 28, 2022 | February 28, 2023 | February 28, 2022 | |||||||||||||
| Revenue per financial statements | $ | 10,098 | $ | 3,334 | $ | 19,816 | $ | 3,334 | ||||||||
| Revenue recognized from OCIM prepaid gold purchase agreement | (742 | ) | - | (742 | ) | - | ||||||||||
| Revenue from gold spot sales | 9,356 | 3,334 | 19,074 | 3,334 | ||||||||||||
| Ounces of gold sold1 | 5,504 | 1,812 | 11,258 | 1,812 | ||||||||||||
| Ounces of gold sold from OCIM prepaid gold purchase agreement | (434 | ) | - | (434 | ) | - | ||||||||||
| Ounces from gold spot sales1 | 5,070 | 1,812 | 10,824 | 1,812 | ||||||||||||
| Average realized price (gross) | $ | 1,835 | $ | 1,840 | $ | 1,760 | $ | 1,840 | ||||||||
| Average realized price net OCIM prepaid gold purchase agreement | $ | 1,845 | $ | 1,840 | $ | 1,762 | $ | 1,840 | ||||||||
1 Note that the ounces of gold sold for the Six Months Ended February 28, 2022 does not include 390 ounces as Buckreef Gold early adopted the IAS 16 amendment as disclosed in the three and six months ended February 28, 2022 financial statements. Gold sales and related costs prior to that date were capitalized to exploration and evaluation assets and expenditures.
Cash cost per ounce of gold sold
Cash cost per ounce of gold sold is a non-IFRS performance measure and does not constitute a measure recognized by IFRS and does not have a standardized meaning defined by IFRS. Cash cost per ounce may not be comparable to information in other gold producers’ reports and filings. Upon declaration of commercial production of the 1,000+ tpd processing plant in Q1 2023, capitalization of mine development costs ceased, and depreciation of capitalized mine development costs commenced. As the Company uses this measure to monitor the performance of our gold mining operations and its ability to generate positive cash flow, beginning in Q1 2023, total cash cost per ounce of gold sold starts with cost of sales related to gold production and removes depreciation. The following table provides a reconciliation of total cash costs per ounce of gold sold to cost of goods sold per the financial statements for the three and six months ended February 28, 2023.
31
| | Management’s Discussion and Analysis February 28, 2023 |
| Three Months Ended | Three Months Ended | Six Months Ended | Six Months Ended | |||||||||||||
| February 28, 2023 | February 28, 2022 | February 28, 2023 | February 28, 2022 | |||||||||||||
| Cost of sales per financial statements | $ | 5,179 | $ | 1,443 | $ | 9,587 | $ | 1,443 | ||||||||
| Less: Depreciation | $ | (294 | ) | $ | (125 | ) | $ | (487 | ) | $ | (125 | ) | ||||
| Total cash costs | $ | 4,885 | $ | 1,318 | $ | 9,100 | $ | 1,318 | ||||||||
| Ounces of gold sold1 | 5,504 | 1,812 | 11,258 | 1,812 | ||||||||||||
| Cash costs per ounce of gold sold | $ | 888 | $ | 727 | $ | 808 | $ | 727 |
1 Note that the ounces of gold sold for the Six Months Ended February 28, 2022 does not include 390 ounces as Buckreef Gold early adopted the IAS 16 amendment as disclosed in the three and six months ended February 28, 2022 financial statements. Gold sales and related costs prior to that date were capitalized to exploration and evaluation assets and expenditures.
Adjusted EBITDA
Adjusted EBITDA is a non-IFRS performance measure and does not constitute a measure recognized by IFRS and does not have a standardized meaning defined by IFRS. Adjusted EBITDA may not be comparable to information in other gold producers’ reports and filings. Adjusted EBITDA is presented as a supplemental measure of the Company’s performance and ability to service its obligations. Adjusted EBITDA is frequently used by securities analysts, investors and other interested parties in the evaluation of companies in the industry, many of which present Adjusted EBITDA when reporting their results. Issuers present Adjusted EBITDA because investors, analysts and rating agencies consider it useful in measuring the ability of those issuers to meet their obligations. Adjusted EBITDA represents net income (loss) before interest, income taxes, and depreciation and also eliminates the impact of a number of items that are not considered indicative of ongoing operating performance.
Certain items of expense are added, and certain items of income are deducted from net income that are not likely to recur or are not indicative of the Company’s underlying operating results for the reporting periods presented or for future operating performance and consist of:
| · | Unrealized gain/loss on derivative warrant liabilities; |
| · | Accretion related to the provision for reclamation; |
| · | Share-based compensation expense; and |
| · | Tax adjustments related to a prior period tax assessment (2012-2020). |
The following table provides a reconciliation of net income (loss) and comprehensive income (loss) to Adjusted EBITDA per the financial statements for the three and six months ended February 28, 2023.
| Three Months Ended | Three Months Ended | Six Months Ended | Six Months Ended | |||||||||||||
| February 28, 2023 | February 28, 2022 | February 28, 2023 | February 28, 2022 | |||||||||||||
| Net (loss) income and comprehensive (loss) income per financial statements | (50 | ) | (1,002 | ) | 5,110 | (3,160 | ) | |||||||||
| Add: | ||||||||||||||||
| Depreciation | 294 | 125 | 487 | 125 | ||||||||||||
| Interest and other expenses | 856 | 341 | 1,041 | 380 | ||||||||||||
| Income tax expense | 1,178 | 151 | 2,664 | 151 | ||||||||||||
| Change in fair value of derivative warrant liabilities | 965 | 145 | (2,400 | ) | (63 | ) | ||||||||||
| Share-based payment expense | 645 | 533 | 1,398 | 1,513 | ||||||||||||
| Adjusted EBITDA | 3,888 | 293 | 8,300 | (1,054 | ) | |||||||||||
The Company has included “average realized price per ounce of gold sold”, “cash cost per ounce of gold sold” and “Adjusted EBITDA” as non-IFRS performance measures throughout this MD&A as TRX Gold believes that these generally accepted industry performance measures provide a useful indication of the Company’s operational performance. The Company believes that certain investors use this information to evaluate the Company’s performance and ability to generate cash flow. Accordingly, they are intended to provide additional information and should not be considered in isolation or as a substitute for measures of performance prepared in accordance with IFRS.
32
| | Management’s Discussion and Analysis February 28, 2023 |
Disclosure of Outstanding Share Data
As at the date of this MD&A, there were 276,935,220 common shares outstanding, 41,970,074 share purchase warrants outstanding, 1,255,276 RSUs outstanding, nil PSUs/DSUs outstanding, and 12,711,000 stock options outstanding.
Risks Factors
The Company is subject to a number of extraneous risk factors over which it has no control. These factors are common to most mineral exploration and development companies and include, among others: project ownership, exploration and development risk, depressed equity markets and related financing risk, commodity price risk, fluctuating exchange rates, environmental risk, insurance risk, sovereign risk. For further details on the risk factors affecting the Company, please see the Company’s Form 40-F Annual Report for the year ended August 31, 2022 filed with the SEC on November 29, 2022 and on SEDAR as the Company’s Annual Information Form on November 29, 2022.
Internal Control Over Financial Reporting (“ICFR”)
Management of the Company is responsible for establishing and maintaining adequate internal controls over financial reporting (“ICFR”) for the Company as defined in Rule 13a-15(f) under the Securities and Exchange Act of 1934. The Company’s management, including the Company’s Chief Executive Officer (“CEO”) and Chief Financial Officer (“CFO”) have conducted an evaluation of the design and effectiveness of the Company’s ICFR as of August 31, 2022. In making this assessment, the Company’s management used the criteria established in Internal Control – Integrated Framework, issued by the Committee of Sponsoring Organizations of the Treadway Commission (“COSO 2013”). This evaluation included review of the documentation of controls, evaluation of the design and operating effectiveness of controls, and a conclusion on this evaluation. Based on this evaluation, Management concluded that ICFR was not effective for the year ended August 31, 2022 due to the following material weaknesses: (i) the Company had not implemented and tested all of the Company’s key controls, including information technology general controls, internal control over financial reporting and disclosure controls and procedures as per the criteria established in the COSO 2013 Framework and (ii) lack of timely review and approval of certain journal entries and reconciliations.
Remediation of Material Weaknesses
The control deficiencies described above were concluded on by management during the year ended August 31, 2022. The Company has prioritized the remediation of the material weaknesses and is working under the oversight of the Audit Committee to resolve the issue.
During the year ended August 31, 2022, the Company continued to strengthen its internal controls and are committed to ensuring that such controls are designed and operating effectively. The Company is implementing process and control improvements and management made the following changes during the year to improve the internal control framework, including the following:
| · | Engaged a third-party service provider to design and implement an enhanced internal control environment framework. During the year, the Company developed a set of key risk control matrices by business cycle and by entity, including key controls, business processes and policies to enhance the maturity level of the Company’s internal control environment. The Company also developed narratives and process maps for each key business cycle as conducted through walkthroughs with management, staff and its third-party IT services provider within all key business cycles. Management has been proactive in implementing the newly designed internal control framework and is remediating any identified control gaps. |
33
| | Management’s Discussion and Analysis February 28, 2023 |
| · | Built an experienced finance team at Buckreef Gold with several internal personnel changes, including a new site Finance Manager and site Finance Superintendent, to enhance review and approval of invoices, journal entries and reconciliations, improve segregation of duties and to optimize the Company’s financial reporting close process. |
| · | Hired a new Corporate Controller with extensive IFRS experience to further supplement review and approval of journal entries and reconciliations, and to improve the Company’s financial reporting close process and reporting of the Company’s financial results and disclosures. This also includes preparation of formal accounting memorandums to support our conclusions on technical accounting matters, and the development and use of checklists and research tools to assist in compliance with IFRS with regard to complex accounting issues. |
| · | The Company implemented a new enterprise resource planning system subsequent to August 31, 2022 to help automate certain reconciliations and manual processes and to increase the efficiency of the financial statement review process. It is also expected to eliminate risk of manual spreadsheet errors and formalize procedures around validation of completeness and accuracy of spreadsheets related to account reconciliations. The Company will continue to expand on the use of the software tool to help manage month-end and quarter-end activities. |
During the year ended August 31, 2022, the Company worked with a third-party service provider to design and document a new and improved system of internal controls and is currently in the process of implementing and testing the operating effectiveness of these newly designed key controls with the goal of remediating the material weakness identified above. However, as at August 31, 2022, the Company has been unable to complete this implementation by the required reporting date due to limited time and resources. Proposed changes to address the material weaknesses will take time to implement due to, amongst other things, a limited number of staff at the Company.
It is the Company’s intention to remediate the material weakness by engaging a third-party service provider to assist in the review, evaluation and testing of the Company’s controls and procedures in a timely manner over the course of F2023.
Additional Information
The Company is a Canadian public company listed on the Toronto Stock Exchange trading under the symbol “TNX” and also listed on the NYSE American trading under the symbol “TRX”. Additional information about the Company and its business activities is available on SEDAR at www.sedar.com; with the SEC at sec.gov; and the Company’s website at www.TRXgold.com.
Approval
The Board of Directors of TRX Gold Corporation has approved the disclosure contained in this Q2 2023 MD&A. A copy of this Q2 2023 MD&A will be provided to anyone who requests it. It is also available on the SEDAR website at www.sedar.com.
34
| | Management’s Discussion and Analysis February 28, 2023 |
Endnotes
1 Refer to “Non-IFRS Performance Measures” section.
2 Notes Regarding Sample Protocol QA/QC: The sample chain of custody is managed by the Buckreef Gold geology team on site. Reported results are from diamond drilled core samples. Intervals of core to be analyzed are split into half using a mechanized core cutter, with one half sent to the Laboratory for geochemical analysis and the remaining half kept in storage for future reference and uses. Diamond drilled core has been a HQ size and recoveries are consistently 100% across all drill holes intercept reported.
Sampling and analytical procedures are subject to a comprehensive quality assurance and quality control program. The QA/QC program involves insertion of duplicate samples, blanks and certified reference materials in the sample stream. Gold analyses are performed by standard fire assaying protocols using a 50-gram charge with atomic absorption (AAS) finish and a gravimetric finish performed for assays greater than 10 grams per tonne.
Sample Preparation and analysis are performed by independent SGS Laboratory in Mwanza, Tanzania. SGS Laboratory is ISO17025 accredited and employs a Laboratory Information Management System for sample tracking, quality control and reporting.
The results summarized in this MD&A are from Buckreef Main Zone NEE prospect. The prospect is an extension of the known Buckreef Main Zone. The intercepts confirm a continuity of over 200 m of known Buckreef main deposit to the North east. The intersections reported here are a down-hole length and may not represent true width, however the true width is estimated to be between 50% - 60% of the length.
35