Form 20-F  Form 40-F
Form 40-F
Form 40-F
No
| Location of disclosures | |||||
| FINMA disclosure requirements | Location | Page number | |||
| Overview of risk management, key prudential metrics and risk-weighted assets | |||||
| Key prudential metrics [Table KM1] / [Table KM2] | Qualitative disclosures: "Treasury, Risk, Balance sheet and Off-balance sheet" | 109 - 126 | |||
| Risk management approach [Table OVA] |
"Risk management oversight" "Risk appetite framework" "Risk coverage and management" |
133 - 135 135 - 138 138 - 154 |
|||
| Overview of risk-weighted assets [Table OV1] | Qualitative disclosures: "Risk-weighted assets" | 122 - 124 | |||
| Linkages between financial statements and regulatory exposures | |||||
| Valuation process [Table LIA] |
"Fair valuations" "Critical accounting estimates - Fair value" "Note 36 - Financial instruments" |
72 97 358 - 385 |
|||
| Composition of capital and TLAC | |||||
| Differences in basis of consolidation [Table CC2] |
List of significant subsidiaries and associated entities: "Note 41 - Significant subsidiaries and equity method investments" Changes in scope of consolidation: "Note 3 - Business developments, significant shareholders and subsequent events" |
400 - 402 276 - 277 |
|||
| Main features of regulatory capital instruments and TLAC-eligible instruments [Table CCA] | Refer to "Capital instruments" under credit-suisse.com/regulatorydisclosures 1 | ||||
| Macroprudential supervisor measures | |||||
| Disclosure of G-SIBs indicators [Table GSIB1] | Refer to "G-SIB Indicators" under credit-suisse.com/regulatorydisclosures 1 | ||||
| Credit risk | |||||
| General qualitative information [Table CRA] | "Credit risk" | 140 - 144 | |||
|
Additional disclosure related to credit quality of assets [Table CRB a), b), c) and d)] |
"Note 1 - Summary of significant accounting policies" "Note 20 - Financial instruments measured at amortized cost and credit losses" |
269 - 271 290 - 303 |
|||
|
Qualitative disclosure requirements related to credit risk mitigation techniques [Table CRC a)]: Netting |
"Derivative instruments" "Note 1 - Summary of significant accounting policies" "Note 28 - Offsetting of financial assets and financial liabilities" |
160 - 162 267 - 268 313 - 316 |
|||
| Counterparty credit risk | |||||
| Qualitative disclosure requirements [Table CCRA] |
Transaction rating, credit limits and provisioning: "Credit risk" Effect of a credit rating downgrade: "Credit ratings" |
140 - 144 113 - 114 |
|||
| Securitization | |||||
| Qualitative disclosure requirements [Table SECA] | "Note 35 - Transfers of financial assets and variable interest entities" | 348 - 357 | |||
| Market risk | |||||
| Qualitative disclosure requirements [Table MRA] |
"Market risk" "Note 1 - Summary of significant accounting policies" "Note 33 - Derivatives and hedging activities" |
144 - 148 267 - 268 338 - 344 |
|||
| Leverage metrics | |||||
| Qualitative disclosures [Table LR2] |
"Leverage metrics" "Swiss metrics" |
125 125 - 126 |
|||
| Liquidity coverage ratio | |||||
| Liquidity risk management [Table LIQA] | "Liquidity and funding management" | 106 - 114 | |||
| Liquidity Coverage Ratio [Table LIQ1] | Qualitative disclosures: "Liquidity metrics" | 109 - 110 | |||
| Liquidity: information on the NSFR [Table LIQ2] | Qualitative disclosures: "Liquidity metrics" | 110 | |||
| Remuneration | |||||
| Remuneration policy [Table REMA] | "Compensation" | 219 - 254 | |||
|
Remuneration awarded during the financial year [table REM1] / Special payments [table REM2] / Deferred remuneration [table REM3] |
Senior management: "Executive Board compensation" Other material risk takers: "Group compensation" |
233 - 235 246 - 248 236 - 241 249 - 251 |
|||
| Operational risk | |||||
| Qualitative disclosures [Table ORA] | "Non-financial risk regulatory capital measurement" | 150 | |||
| Corporate Governance | |||||
| Corporate Governance [Appendix 4] | "Corporate Governance" | 169 - 218 | |||
| Climate-related financial risks | |||||
| Climate-related financial risks [Appendix 5] | "Climate-related risks" | 152 - 153 | |||
|
1
The disclosure will be available by the end of April 2023.
|
|||||
| Swiss capital requirements and metrics | |||||
|
end of 4Q22 |
CHF million |
in % of RWA |
|||
| Swiss risk-weighted assets | |||||
| Swiss risk-weighted assets | 250,963 | – | |||
| Risk-based capital requirements (going-concern) based on Swiss capital ratios | |||||
| Total 1 | 36,722 | 14.63 | |||
| of which CET1: minimum | 11,293 | 4.5 | |||
| of which CET1: buffer | 11,996 | 4.78 | |||
| of which CET1: countercyclical buffers | 791 | 0.315 | |||
| of which additional tier 1: minimum | 8,784 | 3.5 | |||
| of which additional tier 1: buffer | 2,008 | 0.8 | |||
| Swiss eligible capital (going-concern) | |||||
| Swiss CET1 capital and additional tier 1 capital 2 | 50,026 | 19.9 | |||
| of which CET1 capital 3 | 35,290 | 14.1 | |||
| of which additional tier 1 high-trigger capital instruments | 10,495 | 4.2 | |||
| of which additional tier 1 low-trigger capital instruments 4 | 4,241 | 1.7 | |||
| Risk-based requirements for additional total loss-absorbing capacity (gone-concern) based on Swiss capital ratios | |||||
| Total according to size and market share 5 | 34,081 | 13.58 | |||
| Reductions due to rebates in accordance with article 133 of the CAO | (7,811) | (3.113) | |||
| Total, net | 26,270 | 10.468 | |||
| Eligible additional total loss-absorbing capacity (gone-concern) | |||||
| Total | 49,117 | 19.6 | |||
| of which bail-in instruments 6 | 49,117 | 19.6 | |||
|
1
The total requirement includes the FINMA Pillar 2 capital add-on of CHF 1,850 million relating to the supply chain finance funds matter. This Pillar 2 capital add-on equates to an additional Swiss CET1 capital ratio requirement of 74 basis points.
|
|||||
|
2
Excludes tier 1 capital that is used to fulfill gone-concern requirements.
|
|||||
|
3
Excludes CET1 capital that is used to fulfill gone-concern requirements.
|
|||||
|
4
If issued before July 1, 2016, such capital instruments qualify as additional tier 1 high-trigger capital instruments until their first call date according to the transitional Swiss "Too Big to Fail" rules.
|
|||||
|
5
Consists of a base requirement of 12.86%, or CHF 32,274 million, and a surcharge of 0.72%, or CHF 1,807 million.
|
|||||
|
6
Includes instruments issued, which are eligible as gone-concern capacity, where the Group used the proceeds of CHF 6,982 million to reduce an exposure that Credit Suisse AG has from providing net senior funding to the Group. As of the end of 4Q22, the Group had a net funding liability against Credit Suisse AG of CHF 227 million, resulting from existing net senior funding provided by Credit Suisse AG to the Group of CHF 2,516 million offset by CHF 2,289 million of funding provided by the Group to Credit Suisse AG.
|
|||||
| Swiss leverage requirements and metrics | |||||
|
end of 4Q22 |
CHF million |
in % of LRD |
|||
| Leverage exposure | |||||
| Leverage ratio denominator | 650,551 | – | |||
| Unweighted capital requirements (going-concern) based on Swiss leverage ratio | |||||
| Total 1 | 32,751 | 5.034 | |||
| of which CET1: minimum | 9,758 | 1.5 | |||
| of which CET1: buffer | 11,385 | 1.75 | |||
| of which additional tier 1: minimum | 9,758 | 1.5 | |||
| Swiss eligible capital (going-concern) | |||||
| Swiss CET1 capital and additional tier 1 capital 2 | 50,026 | 7.7 | |||
| of which CET1 capital 3 | 35,290 | 5.4 | |||
| of which additional tier 1 high-trigger capital instruments | 10,495 | 1.6 | |||
| of which additional tier 1 low-trigger capital instruments 4 | 4,241 | 0.7 | |||
| Unweighted requirements for additional total loss-absorbing capacity (gone-concern) based on the Swiss leverage ratio | |||||
| Total according to size and market share 5 | 30,901 | 4.75 | |||
| Reductions due to rebates in accordance with article 133 of the CAO | (6,506) | (1.0) | |||
| Total, net | 24,396 | 3.75 | |||
| Eligible additional total loss-absorbing capacity (gone-concern) | |||||
| Total | 49,117 | 7.6 | |||
| of which bail-in instruments 6 | 49,117 | 7.6 | |||
|
1
The total requirement includes the FINMA Pillar 2 capital add-on of CHF 1,850 million relating to the supply chain finance funds matter. This Pillar 2 capital add-on equates to an additional Swiss CET1 leverage ratio requirement of 28 basis points.
|
|||||
|
2
Excludes tier 1 capital that is used to fulfill gone-concern requirements.
|
|||||
|
3
Excludes CET1 capital that is used to fulfill gone-concern requirements.
|
|||||
|
4
If issued before July 1, 2016, such capital instruments qualify as additional tier 1 high-trigger capital instruments until their first call date according to the transitional Swiss "Too Big to Fail" rules.
|
|||||
|
5
Consists of a base requirement of 4.5%, or CHF 29,275 million, and a surcharge of 0.25%, or CHF 1,626 million.
|
|||||
|
6
Includes instruments issued, which are eligible as gone-concern capacity, where the Group used the proceeds of CHF 6,982 million to reduce an exposure that Credit Suisse AG has from providing net senior funding to the Group. As of the end of 4Q22, the Group had a net funding liability against Credit Suisse AG of CHF 227 million, resulting from existing net senior funding provided by Credit Suisse AG to the Group of CHF 2,516 million offset by CHF 2,289 million of funding provided by the Group to Credit Suisse AG.
|
|||||
| OV1 – Overview of Swiss risk-weighted assets and capital requirements | |||||||||
|
Risk-weighted assets |
Capital requirement |
1 | |||||||
| end of | 4Q22 | 3Q22 | 4Q21 | 4Q22 | |||||
| CHF million | |||||||||
| Credit risk (excluding counterparty credit risk) | 120,369 | 131,023 | 126,878 | 9,629 | |||||
| of which standardized approach (SA) | 26,974 | 30,870 | 25,591 | 2,158 | |||||
| of which supervisory slotting approach | 3,703 | 4,063 | 4,040 | 296 | |||||
| of which advanced internal ratings-based (A-IRB) approach | 89,692 | 96,090 | 97,247 | 7,175 | |||||
| Counterparty credit risk | 10,147 | 13,443 | 15,640 | 812 | |||||
| of which standardized approach for counterparty credit risk (SA-CCR) | 1,970 | 3,434 | 3,064 | 158 | |||||
| of which internal model method (IMM) | 7,518 | 9,203 | 11,536 | 601 | |||||
| of which other counterparty credit risk 2 | 659 | 806 | 1,040 | 53 | |||||
| Credit valuation adjustments (CVA) | 3,301 | 4,032 | 5,046 | 264 | |||||
| Equity positions in the banking book under the simple risk weight approach | 3,775 | 5,479 | 7,071 | 302 | |||||
| Equity investments in funds - look-through approach | 2,181 | 2,298 | 2,431 | 174 | |||||
| Equity investments in funds - mandate-based approach | 11 | 11 | 21 | 1 | |||||
| Equity investments in funds - fall-back approach | 671 | 662 | 505 | 54 | |||||
| Settlement risk | 422 | 387 | 465 | 34 | |||||
| Securitization exposures in the banking book | 13,282 | 13,731 | 13,396 | 1,063 | |||||
| of which securitization internal ratings-based approach (SEC-IRBA) | 7,431 | 7,864 | 7,736 | 595 | |||||
| of which securitization external ratings-based approach (SEC-ERBA), including internal assessment approach (IAA) | 922 | 916 | 1,429 | 74 | |||||
| of which securitization standardized approach (SEC-SA) | 4,929 | 4,951 | 4,231 | 394 | |||||
| Market risk | 15,025 | 16,725 | 16,355 | 1,202 | |||||
| of which standardized approach (SA) | 1,802 | 1,964 | 1,648 | 144 | |||||
| of which internal models approach (IMA) | 13,223 | 14,761 | 14,707 | 1,058 | |||||
| Operational risk (AMA) | 74,500 | 78,880 | 67,627 | 5,960 | |||||
| Amounts below the thresholds for deduction (subject to 250% risk weight) | 7,279 | 7,467 | 12,983 | 582 | |||||
| Total | 250,963 | 274,138 | 268,418 | 20,077 | |||||
|
1
Calculated as 8% of Swiss risk-weighted assets, based on total capital minimum requirements, excluding capital conservation buffer and G-SIB buffer requirements.
|
|||||||||
|
2
Includes RWA for contributions to the default fund of a central counterparty and loans hedged by centrally cleared CDS.
|
|||||||||
| LI1 - Differences between accounting and regulatory scopes of consolidation and mapping of financial statements with regulatory risk categories | |||||||||||||||
| Carrying values | Carrying values of items subject to: | ||||||||||||||
|
end of 4Q22 |
Published financial statements |
Regulatory scope of consolidation |
Credit risk frame- work |
Counter- party credit risk frame- work |
Securiti- zation frame- work |
Market risk frame- work |
Not subject to capital require- ments or subject to deduction from capital |
||||||||
| Assets (CHF million) | |||||||||||||||
| Cash and due from banks | 68,478 | 68,293 | 67,593 | 0 | 0 | 0 | 700 | ||||||||
| Interest-bearing deposits with banks | 455 | 1,006 | 981 | 25 | 0 | 0 | 0 | ||||||||
| Central bank funds sold, securities purchased under resale agreements and securities borrowing transactions | 58,798 | 58,798 | 0 | 58,448 | 350 | 44,042 | 0 | ||||||||
| Securities received as collateral, at fair value | 2,978 | 2,978 | 0 | 2,978 | 0 | 2,978 | 0 | ||||||||
| Trading assets, at fair value 1 | 65,461 | 64,681 | 8,657 | 32,980 | 2 | 781 | 62,160 | 0 | |||||||
| Investment securities | 1,718 | 1,718 | 1,718 | 0 | 0 | 0 | 0 | ||||||||
| Other investments | 5,518 | 5,768 | 3,485 | 0 | 213 | 16 | 2,054 | ||||||||
| Net loans | 264,165 | 264,543 | 229,295 | 375 | 34,234 | 1,251 | 0 | ||||||||
| Goodwill | 2,903 | 2,903 | 0 | 0 | 0 | 0 | 2,903 | ||||||||
| Other intangible assets | 458 | 458 | 0 | 0 | 0 | 0 | 458 | ||||||||
| Brokerage receivables | 13,818 | 13,818 | 1,220 | 2,452 | 0 | 0 | 10,153 | ||||||||
| Other assets | 46,608 | 44,466 | 22,277 | 8,413 | 6,633 | 2,719 | 4,556 | ||||||||
| Total assets | 531,358 | 529,430 | 335,226 | 105,671 | 42,211 | 113,166 | 20,824 | ||||||||
| Liabilities (CHF million) | |||||||||||||||
| Due to banks | 11,905 | 12,032 | 0 | 0 | 0 | 0 | 12,032 | ||||||||
| Customer deposits | 233,235 | 233,320 | 0 | 0 | 0 | 0 | 233,320 | ||||||||
| Central bank funds purchased, securities sold under repurchase agreements and securities lending transactions | 20,280 | 20,282 | 0 | 20,282 | 0 | 15,038 | 0 | ||||||||
| Obligation to return securities received as collateral, at fair value | 2,978 | 2,978 | 0 | 2,978 | 0 | 2,978 | 0 | ||||||||
| Trading liabilities, at fair value 1 | 18,338 | 18,372 | 0 | 9,198 | 0 | 28,181 | 746 | ||||||||
| Short-term borrowings | 12,414 | 12,444 | 0 | 0 | 0 | 7,783 | 4,661 | ||||||||
| Long-term debt | 157,235 | 155,113 | 1,371 | 0 | 0 | 39,157 | 114,585 | ||||||||
| Brokerage payables | 11,442 | 11,442 | 0 | 794 | 0 | 0 | 10,648 | ||||||||
| Other liabilities | 18,200 | 17,987 | 444 | 4,227 | 0 | 973 | 12,343 | ||||||||
| Total liabilities | 486,027 | 483,970 | 1,815 | 37,479 | 0 | 94,110 | 388,335 | ||||||||
|
There are items in the table which attract capital charges according to more than one risk category framework. As an example, derivatives assets/liabilities held in the regulatory trading book are shown in the column about market risk and in the column about counterparty credit risk.
|
|||||||||||||||
|
1
Trading assets/liabilities on the balance sheet reflect the balance after considering netting benefit of cash collateral hence reflect a lower balance than disclosed in the market risk column as cash collateral is not part of the market risk framework.
|
|||||||||||||||
|
2
Includes assets pledged as collateral since collateral posted is subject to counterparty credit risk.
|
|||||||||||||||
| LI1 - Differences between accounting and regulatory scopes of consolidation and mapping of financial statements with regulatory risk categories (continued) | |||||||||||||||
| Carrying values | Carrying values of items subject to: | ||||||||||||||
|
end of 4Q21 |
Published financial statements |
Regulatory scope of consolidation |
Credit risk frame- work |
Counter- party credit risk frame- work |
Securiti- zation frame- work |
Market risk frame- work |
Not subject to capital require- ments or subject to deduction from capital |
||||||||
| Assets (CHF million) | |||||||||||||||
| Cash and due from banks | 164,818 | 164,524 | 163,292 | 0 | 0 | 0 | 1,232 | ||||||||
| Interest-bearing deposits with banks | 1,323 | 1,590 | 1,498 | 92 | 0 | 0 | 0 | ||||||||
| Central bank funds sold, securities purchased under resale agreements and securities borrowing transactions | 103,906 | 103,900 | 0 | 103,900 | 0 | 81,295 | 0 | ||||||||
| Securities received as collateral, at fair value | 15,017 | 15,017 | 0 | 15,017 | 0 | 15,017 | 0 | ||||||||
| Trading assets, at fair value 1 | 111,141 | 110,246 | 9,327 | 47,737 | 2 | 944 | 110,544 | 0 | |||||||
| Investment securities | 1,005 | 1,005 | 1,002 | 0 | 3 | 0 | 0 | ||||||||
| Other investments | 5,826 | 5,770 | 3,705 | 0 | 289 | 0 | 1,776 | ||||||||
| Net loans | 291,686 | 292,126 | 259,842 | 201 | 30,842 | 1,473 | 0 | ||||||||
| Goodwill | 2,917 | 2,921 | 0 | 0 | 0 | 0 | 2,921 | ||||||||
| Other intangible assets | 276 | 276 | 0 | 0 | 0 | 0 | 276 | ||||||||
| Brokerage receivables | 16,687 | 16,687 | 2,071 | 12,941 | 0 | 0 | 1,675 | ||||||||
| Other assets | 41,231 | 40,701 | 19,801 | 8,161 | 938 | 3,984 | 8,107 | ||||||||
| Total assets | 755,833 | 754,763 | 460,538 | 188,049 | 33,016 | 212,313 | 15,987 | ||||||||
| Liabilities (CHF million) | |||||||||||||||
| Due to banks | 18,965 | 19,016 | 0 | 0 | 0 | 0 | 19,016 | ||||||||
| Customer deposits | 392,819 | 392,784 | 0 | 0 | 0 | 0 | 392,784 | ||||||||
| Central bank funds purchased, securities sold under repurchase agreements and securities lending transactions | 35,274 | 35,274 | 0 | 35,274 | 0 | 18,307 | 0 | ||||||||
| Obligation to return securities received as collateral, at fair value | 15,017 | 15,017 | 0 | 15,017 | 0 | 15,017 | 0 | ||||||||
| Trading liabilities, at fair value 1 | 27,535 | 27,563 | 42 | 10,865 | 0 | 44,144 | 439 | ||||||||
| Short-term borrowings | 19,393 | 19,473 | 0 | 0 | 0 | 11,816 | 7,657 | ||||||||
| Long-term debt | 166,896 | 165,670 | 1,487 | 0 | 0 | 41,801 | 122,382 | ||||||||
| Brokerage payables | 13,060 | 13,060 | 0 | 8,810 | 0 | 0 | 4,250 | ||||||||
| Other liabilities | 22,644 | 22,606 | 407 | 6,053 | 0 | 1,388 | 14,871 | ||||||||
| Total liabilities | 711,603 | 710,463 | 1,936 | 76,019 | 0 | 132,473 | 561,399 | ||||||||
|
There are items in the table which attract capital charges according to more than one risk category framework. As an example, derivatives assets/liabilities held in the regulatory trading book are shown in the column about market risk and in the column about counterparty credit risk.
|
|||||||||||||||
|
1
Trading assets/liabilities on the balance sheet reflect the balance after considering netting benefit of cash collateral hence reflect a lower balance than disclosed in the market risk column as cash collateral is not part of the market risk framework.
|
|||||||||||||||
|
2
Includes assets pledged as collateral since collateral posted is subject to counterparty credit risk.
|
|||||||||||||||
| LI2 - Main sources of differences between regulatory exposure amounts and carrying values in financial statements | |||||||||
| Items subject to: | |||||||||
|
end of |
Credit risk frame- work |
Counter- party credit risk frame- work |
1 |
Securiti- zation frame- work |
Market risk frame- work |
||||
| 4Q22 (CHF million) | |||||||||
| Asset carrying value amount under regulatory scope of consolidation | 335,226 | 105,671 | 42,211 | 113,166 | |||||
| Liabilities carrying value amount under regulatory scope of consolidation | 1,815 | 37,479 | 0 | 94,110 | |||||
| Total net amount under regulatory scope of consolidation | 333,411 | 68,192 | 42,211 | 19,056 | |||||
| Off-balance sheet amounts | 56,485 | 0 | 26,468 | 0 | |||||
| Differences due to consideration of valuation adjustments and provisions | 436 | 0 | 95 | 0 | |||||
| Derivatives: Differences due to application of internal models (IMM) and SA-CCR | 0 | 20,504 | 0 | 0 | |||||
| SFT: Differences due to the application of internal models (VaR) | 0 | (41,342) | 0 | 0 | |||||
| Other differences not classified above | 552 | 3,750 | (3,732) | 0 | |||||
| Exposure amounts considered for regulatory purposes | 390,884 | 51,104 | 65,042 | – | 2 | ||||
| 4Q21 (CHF million) | |||||||||
| Asset carrying value amount under regulatory scope of consolidation | 460,538 | 188,049 | 33,016 | 212,313 | |||||
| Liabilities carrying value amount under regulatory scope of consolidation | 1,936 | 76,019 | 0 | 132,473 | |||||
| Total net amount under regulatory scope of consolidation | 458,602 | 112,030 | 33,016 | 79,840 | |||||
| Off-balance sheet amounts | 65,075 | 0 | 33,158 | 0 | |||||
| Differences due to consideration of valuation adjustments and provisions | 507 | 0 | 64 | 0 | |||||
| Derivatives: Differences due to application of internal models (IMM) and SA-CCR | 0 | 30,489 | 0 | 0 | |||||
| SFT: Differences due to the application of internal models (VaR) | 0 | (76,949) | 0 | 0 | |||||
| Other differences not classified above | (6,042) | 3,649 | (3,247) | 0 | |||||
| Exposure amounts considered for regulatory purposes | 518,142 | 69,219 | 62,991 | – | 2 | ||||
|
The funded portion of the default funds for clearing houses are recorded as a brokerage receivable in accounting. For these positions there is no exposure amount considered for regulatory purposes.
|
|||||||||
|
1
Counterparty credit risk includes client cleared exposures, whereas such agency exposures are not reported in the financial statements. Additionally, the column counterparty credit risk and the column market risk take into account the impact of collateral pledges received in SFTs.
|
|||||||||
|
2
The concept of “exposure amounts considered for regulatory purposes” is not applicable for market risk as for example for the VaR model.
|
|||||||||
| CRB - Geographic concentration of gross credit exposures | |||||||||||
|
end of |
Switzerland |
Americas |
Asia Pacific |
EMEA |
Total |
||||||
| 4Q22 (CHF million) | |||||||||||
| Loans and debt securities | 154,413 | 69,679 | 27,477 | 83,065 | 334,634 | ||||||
| Off-balance sheet exposures 1 | 14,716 | 33,500 | 4,793 | 19,029 | 72,038 | ||||||
| Total | 169,129 | 103,179 | 32,270 | 102,094 | 406,672 | ||||||
| 4Q21 (CHF million) | |||||||||||
| Loans and debt securities | 222,872 | 69,927 | 39,977 | 122,844 | 455,620 | ||||||
| Off-balance sheet exposures 1 | 18,444 | 41,595 | 5,696 | 27,913 | 93,648 | ||||||
| Total | 241,316 | 111,522 | 45,673 | 150,757 | 549,268 | ||||||
|
The geographic distribution is based on the domicile of the counterparty, shown pre-substitution.
|
|||||||||||
|
1
Revocable loan commitments, which are excluded from the disclosed exposures, can attract risk-weighted assets.
|
|||||||||||
| CRB - Industry concentration of gross credit exposures | |||||||||||
|
end of |
Financial institutions |
1 |
Commercial |
Consumer |
Public authorities |
Total |
|||||
| 4Q22 (CHF million) | |||||||||||
| Loans and debt securities | 119,263 | 75,118 | 134,809 | 5,444 | 334,634 | ||||||
| Off-balance sheet exposures 2 | 22,689 | 47,294 | 591 | 1,464 | 72,038 | ||||||
| Total | 141,952 | 122,412 | 135,400 | 6,908 | 406,672 | ||||||
| 4Q21 (CHF million) | |||||||||||
| Loans and debt securities | 228,794 | 79,468 | 142,656 | 4,702 | 455,620 | ||||||
| Off-balance sheet exposures 2 | 32,794 | 57,391 | 1,701 | 1,762 | 93,648 | ||||||
| Total | 261,588 | 136,859 | 144,357 | 6,464 | 549,268 | ||||||
|
Exposures are shown pre-substitution.
|
|||||||||||
|
1
Includes exposures to central banks of CHF 62.9 billion and CHF 155.0 billion as of the end of 4Q22 and 4Q21, respectively.
|
|||||||||||
|
2
Revocable loan commitments, which are excluded from the disclosed exposures, can attract risk-weighted assets.
|
|||||||||||
| CRB - Remaining contractual maturity of gross credit exposures | |||||||||
|
end of |
Due in 1 year or less |
1 |
Due between 1 year and 5 years |
Due over 5 years |
Total |
||||
| 4Q22 (CHF million) | |||||||||
| Loans and debt securities | 187,869 | 92,543 | 54,222 | 334,634 | |||||
| Off-balance sheet exposures 2 | 26,882 | 41,277 | 3,879 | 72,038 | |||||
| Total | 214,751 | 133,820 | 58,101 | 406,672 | |||||
| 4Q21 (CHF million) 3 | |||||||||
| Loans and debt securities | 296,892 | 99,986 | 58,742 | 455,620 | |||||
| Off-balance sheet exposures 2 | 37,579 | 47,600 | 8,469 | 93,648 | |||||
| Total | 334,471 | 147,586 | 67,211 | 549,268 | |||||
|
1
Includes positions without agreed residual contractual maturity.
|
|||||||||
|
2
Revocable loan commitments, which are excluded from the disclosed exposures, can attract risk-weighted assets.
|
|||||||||
|
3
Prior period has been revised.
|
|||||||||
| CRB - Geographic concentration of allowances, impaired loans and write-offs | |||||||||||||||
|
end of |
Allowances individually evaluated |
Allowances collectively evaluated |
Total allowances |
Impaired loans with specific allowances |
Impaired loans without specific allowances |
Total impaired loans |
Gross write- offs |
||||||||
| 4Q22 (CHF million) | |||||||||||||||
| Switzerland | 481 | 320 | 801 | 1,504 | 349 | 1,853 | 118 | ||||||||
| EMEA | 23 | 37 | 60 | 267 | 98 | 365 | 19 | ||||||||
| Americas | 4,149 | 112 | 4,261 | 518 | 94 | 612 | 17 | ||||||||
| Asia Pacific | 238 | 48 | 286 | 594 | 4 | 598 | 30 | ||||||||
| Total | 4,891 | 517 | 5,408 | 2,883 | 545 | 3,428 | 184 | ||||||||
| 4Q21 (CHF million) | |||||||||||||||
| Switzerland | 472 | 319 | 791 | 1,090 | 300 | 1,390 | 252 | ||||||||
| EMEA | 31 | 52 | 83 | 339 | 129 | 468 | 22 | ||||||||
| Americas | 4,218 | 108 | 4,326 | 268 | 19 | 287 | 25 | ||||||||
| Asia Pacific | 216 | 32 | 248 | 624 | 0 | 624 | 0 | ||||||||
| Total | 4,937 | 511 | 5,448 | 2,321 | 448 | 2,769 | 299 | ||||||||
| CRB - Industry concentration of allowances, impaired loans and write-offs | |||||||||||||||
|
end of |
Allowances individually evaluated |
Allowances collectively evaluated |
Total allowances |
Impaired loans with specific allowances |
Impaired loans without specific allowances |
Total impaired loans |
Gross write- offs |
||||||||
| 4Q22 (CHF million) | |||||||||||||||
| Financial institutions | 4,104 | 34 | 4,138 | 345 | 42 | 387 | 0 | ||||||||
| Commercial | 511 | 396 | 907 | 1,779 | 362 | 2,141 | 117 | ||||||||
| Consumer | 273 | 86 | 359 | 748 | 141 | 889 | 67 | ||||||||
| Public authorities | 3 | 1 | 4 | 11 | 0 | 11 | 0 | ||||||||
| Total | 4,891 | 517 | 5,408 | 2,883 | 545 | 3,428 | 184 | ||||||||
| 4Q21 (CHF million) | |||||||||||||||
| Financial institutions | 4,187 | 65 | 4,252 | 42 | 44 | 86 | 0 | ||||||||
| Commercial | 473 | 360 | 833 | 1,396 | 193 | 1,589 | 242 | ||||||||
| Consumer | 273 | 84 | 357 | 873 | 202 | 1,075 | 57 | ||||||||
| Public authorities | 4 | 2 | 6 | 10 | 9 | 19 | 0 | ||||||||
| Total | 4,937 | 511 | 5,448 | 2,321 | 448 | 2,769 | 299 | ||||||||
| CR1 – Credit quality of assets | |||||||||||||||||
|
of which non-specific provisions for expected credit losses on SA exposures |
|||||||||||||||||
|
end of |
Defaulted exposures |
Non- defaulted exposures |
Gross exposures |
Allowances/ impairments |
Regulatory category – specific |
Regulatory category – general |
of which non- specific provisions for expected credit losses on IRB exposures |
Net exposures |
|||||||||
| 4Q22 (CHF million) | |||||||||||||||||
| Loans 1 | 8,006 | 313,811 | 321,817 | (5,242) | (26) | 0 | (434) | 316,575 | |||||||||
| Debt securities | 52 | 12,765 | 12,817 | 0 | 0 | 0 | 0 | 12,817 | |||||||||
| Off-balance sheet exposures 2 | 671 | 71,367 | 72,038 | (144) | (3) | 0 | (95) | 71,894 | |||||||||
| Total | 8,729 | 397,943 | 406,672 | (5,386) | (29) | 0 | (529) | 401,286 | |||||||||
| 2Q22 (CHF million) | |||||||||||||||||
| Loans 1 | 8,097 | 428,505 | 436,602 | (5,441) | (38) | 0 | (483) | 431,161 | |||||||||
| Debt securities | 20 | 11,027 | 11,047 | 0 | 0 | 0 | 0 | 11,047 | |||||||||
| Off-balance sheet exposures 2 | 628 | 86,913 | 87,541 | (178) | (8) | 0 | (118) | 87,363 | |||||||||
| Total | 8,745 | 526,445 | 535,190 | (5,619) | (46) | 0 | (601) | 529,571 | |||||||||
|
1
Loans include all on-balance sheet exposures that give rise to a credit risk charge and are not limited to exposures that are recognized as net loans under US GAAP. Loans exclude debt securities, derivatives, securities financing transactions and off-balance sheet exposures.
|
|||||||||||||||||
|
2
Revocable loan commitments, which are excluded from the disclosed exposures, can attract risk-weighted assets.
|
|||||||||||||||||
| CR2 – Changes in defaulted exposures | |||
| 2H22 | |||
| CHF million | |||
| Defaulted exposures at beginning of period | 8,745 | ||
| Exposures that have defaulted since the last reporting period | 1,222 | ||
| Returned to non-defaulted status | (226) | ||
| Amounts written-off | (100) | ||
| Other changes | (912) | ||
| Defaulted exposures at end of period | 8,729 | ||
| CRB - Aging analysis of accounting past-due exposures | |||||||||||||||
| Current | Past due | ||||||||||||||
|
end of |
|
Up to 30 days |
31–60 days |
61–90 days |
More than 90 days |
Total |
Total |
||||||||
| 4Q22 (CHF million) | |||||||||||||||
| Financial institutions | 21,302 | 258 | 1 | 1 | 159 | 419 | 21,721 | ||||||||
| Commercial | 83,257 | 339 | 115 | 25 | 867 | 1,346 | 84,603 | ||||||||
| Consumer | 149,887 | 413 | 136 | 73 | 762 | 1,384 | 151,271 | ||||||||
| Public authorities | 1,171 | 5 | 0 | 0 | 11 | 16 | 1,187 | ||||||||
| Gross loans held at amortized cost | 255,617 | 1,015 | 252 | 99 | 1,799 | 3,165 | 258,782 | ||||||||
| Gross loans held at fair value | 7,361 | ||||||||||||||
| Gross loans | 266,143 | ||||||||||||||
| 4Q21 (CHF million) | |||||||||||||||
| Financial institutions | 20,815 | 61 | 7 | 1 | 41 | 110 | 20,925 | ||||||||
| Commercial | 93,009 | 167 | 18 | 12 | 797 | 994 | 94,003 | ||||||||
| Consumer | 165,734 | 350 | 148 | 107 | 713 | 1,318 | 167,052 | ||||||||
| Public authorities | 1,253 | 16 | 0 | 0 | 19 | 35 | 1,288 | ||||||||
| Gross loans held at amortized cost | 280,811 | 594 | 173 | 120 | 1,570 | 2,457 | 283,268 | ||||||||
| Gross loans held at fair value | 10,243 | ||||||||||||||
| Gross loans | 293,511 | ||||||||||||||
| CR3 – CRM techniques | |||||||||||||
| Net exposures | Exposures secured by | ||||||||||||
|
end of |
Unsecured |
Partially or fully secured |
Total |
Collateral |
Financial guarantees |
Credit derivatives |
|||||||
| 4Q22 (CHF million) | |||||||||||||
| Loans 1 | 108,336 | 208,239 | 316,575 | 170,869 | 3,562 | 22 | |||||||
| Debt securities | 12,652 | 165 | 12,817 | 152 | 0 | 0 | |||||||
| Total | 120,988 | 208,404 | 329,392 | 171,021 | 3,562 | 22 | |||||||
| of which defaulted | 1,337 | 1,937 | 3,274 | 966 | 79 | 0 | |||||||
| 2Q22 (CHF million) | |||||||||||||
| Loans 1 | 203,558 | 227,603 | 431,161 | 184,912 | 5,446 | 15 | |||||||
| Debt securities | 9,545 | 1,502 | 11,047 | 1,460 | 0 | 0 | |||||||
| Total | 213,103 | 229,105 | 442,208 | 186,372 | 5,446 | 15 | |||||||
| of which defaulted | 1,402 | 1,794 | 3,196 | 1,068 | 74 | 0 | |||||||
|
1
Loans include all on-balance sheet exposures that give rise to a credit risk charge and are not limited to exposures that are recognized as net loans under US GAAP. Loans exclude debt securities, derivatives, securities financing transactions and off-balance sheet exposures.
|
|||||||||||||
| CR4 – Credit risk exposure and CRM effects | |||||||||||||||||
| Exposures pre-CCF and CRM | Exposures post-CCF and CRM | ||||||||||||||||
|
end of |
On-balance sheet |
Off-balance sheet |
Total |
On-balance sheet |
Off-balance sheet |
Total |
RWA |
RWA density |
|||||||||
| 4Q22 (CHF million) | |||||||||||||||||
| Sovereigns | 34,756 | 21 | 34,777 | 34,756 | 0 | 34,756 | 98 | 0% | |||||||||
| Institutions - Banks and securities dealer | 2,127 | 730 | 2,857 | 1,943 | 374 | 2,317 | 788 | 34% | |||||||||
| Institutions - Other institutions | 703 | 1,796 | 2,499 | 703 | 145 | 848 | 244 | 29% | |||||||||
| Corporates | 9,700 | 8,146 | 17,846 | 9,082 | 2,443 | 11,525 | 10,663 | 93% | |||||||||
| Retail | 2,827 | 1,768 | 4,595 | 2,541 | 284 | 2,825 | 2,438 | 86% | |||||||||
| Other exposures | 13,551 | 1,229 | 14,780 | 13,268 | 1,108 | 14,376 | 12,743 | 89% | |||||||||
| of which non-counterparty related assets | 6,931 | 0 | 6,931 | 6,931 | 0 | 6,931 | 6,931 | 100% | |||||||||
| Total | 63,664 | 13,690 | 77,354 | 62,293 | 4,354 | 66,647 | 26,974 | 40% | |||||||||
| 2Q22 (CHF million) | |||||||||||||||||
| Sovereigns | 119,874 | 20 | 119,894 | 119,874 | 0 | 119,874 | 101 | 0% | |||||||||
| Institutions - Banks and securities dealer | 2,780 | 768 | 3,548 | 2,578 | 388 | 2,966 | 986 | 33% | |||||||||
| Institutions - Other institutions | 814 | 2,122 | 2,936 | 814 | 298 | 1,112 | 369 | 33% | |||||||||
| Corporates | 12,260 | 8,783 | 21,043 | 11,444 | 2,822 | 14,266 | 12,179 | 85% | |||||||||
| Retail | 2,944 | 1,933 | 4,877 | 2,654 | 410 | 3,064 | 2,736 | 89% | |||||||||
| Other exposures | 15,442 | 1,443 | 16,885 | 15,172 | 1,257 | 16,429 | 14,465 | 88% | |||||||||
| of which non-counterparty related assets | 7,403 | 0 | 7,403 | 7,403 | 0 | 7,403 | 7,403 | 100% | |||||||||
| Total | 154,114 | 15,069 | 169,183 | 152,536 | 5,175 | 157,711 | 30,836 | 20% | |||||||||
| CR5 – Exposures by asset class and risk weight | |||||||||||||||||||
| Risk weight | |||||||||||||||||||
|
end of |
0% |
20% |
35% |
50% |
75% |
100% |
150% |
Others |
Exposures post-CCF and CRM |
||||||||||
| 4Q22 (CHF million) | |||||||||||||||||||
| Sovereigns | 34,611 | 49 | 0 | 39 | 0 | 32 | 25 | 0 | 34,756 | ||||||||||
| Institutions - Banks and securities dealer | 0 | 1,607 | 0 | 497 | 0 | 204 | 9 | 0 | 2,317 | ||||||||||
| Institutions - Other institutions | 363 | 0 | 0 | 483 | 0 | 0 | 2 | 0 | 848 | ||||||||||
| Corporates | 0 | 956 | 25 | 1,270 | 0 | 8,166 | 1,108 | 0 | 11,525 | ||||||||||
| Retail | 0 | 0 | 79 | 0 | 1,674 | 907 | 165 | 0 | 2,825 | ||||||||||
| Other exposures | 1,729 | 0 | 0 | 0 | 0 | 12,639 | 0 | 8 | 14,376 | ||||||||||
| of which non-counterparty related assets | 0 | 0 | 0 | 0 | 0 | 6,931 | 0 | 0 | 6,931 | ||||||||||
| Total | 36,703 | 2,612 | 104 | 2,289 | 1,674 | 21,948 | 1,309 | 8 | 66,647 | ||||||||||
| of which secured by real estate | 0 | 0 | 104 | 0 | 40 | 742 | 0 | 0 | 886 | ||||||||||
| of which past due | 0 | 0 | 0 | 0 | 0 | 182 | 640 | 0 | 822 | ||||||||||
| 2Q22 (CHF million) | |||||||||||||||||||
| Sovereigns | 119,737 | 53 | 0 | 32 | 0 | 10 | 42 | 0 | 119,874 | ||||||||||
| Institutions - Banks and securities dealer | 0 | 1,912 | 0 | 913 | 0 | 131 | 10 | 0 | 2,966 | ||||||||||
| Institutions - Other institutions | 374 | 4 | 0 | 732 | 0 | 0 | 2 | 0 | 1,112 | ||||||||||
| Corporates | 0 | 1,734 | 27 | 2,189 | 0 | 9,489 | 827 | 0 | 14,266 | ||||||||||
| Retail | 0 | 0 | 91 | 0 | 1,716 | 936 | 321 | 0 | 3,064 | ||||||||||
| Other exposures | 2,062 | 0 | 0 | 0 | 0 | 14,358 | 0 | 9 | 16,429 | ||||||||||
| of which non-counterparty related assets | 0 | 0 | 0 | 0 | 0 | 7,403 | 0 | 0 | 7,403 | ||||||||||
| Total | 122,173 | 3,703 | 118 | 3,866 | 1,716 | 24,924 | 1,202 | 9 | 157,711 | ||||||||||
| of which secured by real estate | 0 | 0 | 118 | 0 | 44 | 591 | 0 | 0 | 753 | ||||||||||
| of which past due | 0 | 0 | 0 | 0 | 0 | 254 | 465 | 0 | 719 | ||||||||||
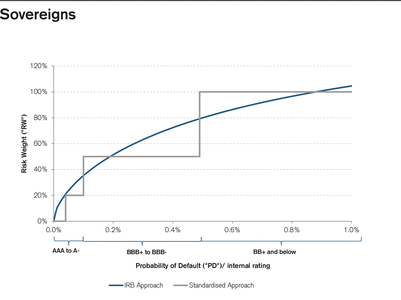
| Key differences between the standardized approach and the internal model approach | |||||||
| Standardized approach | Internal model approach | Key impact | |||||
|
EAD for derivatives |
SA-CCR is calculated as the replacement costs plus regulatory add-ons that take into account potential future market moves at predetermined fixed rates. |
Internal Models Method (IMM) allows Monte-Carlo simulation to estimate exposure. |
For large diversified derivatives portfolios, standardized EAD is higher than model EAD. |
||||
|
Differentiates add-ons by five exposure types and three maturity buckets only. |
Application of multiplier on IMM exposure estimate. |
|
|||||
|
Limited ability to net. |
Variability in holding period applied to collateralized transactions, reflecting liquidity risks. |
|
|||||
|
Risk weighting |
Reliance on ECAIs: where no rating is available a 100% risk weight is applied (i.e. for most small and medium-size enterprises and funds). |
Reliance on internal ratings where each counterparty/transaction receives a rating. |
Model approach produces lower RWA for high-quality short-term transactions. |
||||
|
Crude risk weight differentiation with 4 key weights: 20%, 50%, 100%, 150% (and 0% for AAA sovereigns; 35%, 75% or 100% for mortgages; 75% or 100% for retail). |
Granular risk sensitive risk weights differentiation via individual PDs and LGDs. |
Standardized approach produces lower RWA for non-investment grade and long-term transactions. |
|||||
|
No differentiation for transaction features. |
LGD captures transaction quality features incl. collateralization. |
Impact relevant across all asset classes. |
|||||
| Application of a 1.06 scaling factor. | |||||||
|
Risk mitigation |
Limited recognition of risk mitigation. |
Risk mitigation recognized via risk sensitive LGD or EAD. |
Standardized approach RWA higher than model approach RWA for most collaterals. |
||||
|
Restricted list of eligible collateral. |
Wider variety of collateral types eligible. |
Impact particularly relevant for lombard lending and SFTs. |
|||||
|
Conservative and crude regulatory haircuts. |
Repo VaR allows use of VaR models to estimate exposure and collateral for SFTs. Approach permits full diversification and netting across all collateral types. |
|
|||||
|
Maturity in risk weight |
No differentiation for maturity of transactions, except for interbank exposures in a coarse manner. |
No internal modelling of maturity. |
Model approach produces lower RWA for high-quality short-term transactions. |
||||
|
|
Regulatory RWA function considers maturity: the longer the maturity the higher the risk weight (see chart "Risk weight by maturity"). |
|
|||||
| Leverage exposure estimate | |||||||
| Internal model approach | |||||||
|
EAD |
Risk weight |
Leverage exposures |
1 | ||||
| Basel asset class (CHF billion, except where indicated) | |||||||
| Corporates | 124 | 50% | 199 | ||||
| Banks | 20 | 23% | 59 | ||||
| Sovereigns | 39 | 5% | 35 | ||||
| Retail | 174 | 16% | 171 | ||||
|
1
The leverage exposure estimates only consider those exposures which are comparable to the credit risk RWA calculation under internal model approach and hence excludes exposures such as trading book, securitization and non-credit exposures. Asset class leverage ratio based exposures are approximate and provided on a best efforts basis.
|
|||||||
| CRE - Main PD and LGD models used by Credit Suisse | |||||||||||||||
| PD | LGD | ||||||||||||||
|
Portfolio |
Asset class |
RWA (in CHF billion) as of 3Q22 |
Data history |
No. of models |
Model comment |
No. of models |
Model comment |
||||||||
| Statistical and hybrid models using e.g. industry and counterparty segmentation, collateral types and amounts, seniority and other transaction specific factors with granularity enhancements by public research and expert judgement | |||||||||||||||
| Corporates | Corporates, retail | 36 | >15 years | 2 | Statistical scorecards using e.g. balance sheet, P&L data and qualitative factors | 2 | |||||||||
| Banks and other financial institutions | Banks, corporates | 5 | >30 years | 5 | Statistical scorecard and constrained expert judgement using e.g. balance sheet, P&L data and qualitative factors | ||||||||||
| Funds |
Corporates |
5 |
>10 years |
4 |
Statistical scorecards using e.g. net asset value, volatility of returns and qualitative factors |
|
|||||||||
| Statistical model using e.g. counterparty segmentation, collateral types and amounts | |||||||||||||||
| Residential mortgages & other wealth- management financing | Retail, corporates | 15 | >15 years | 2 | Statistical scorecard using e.g. LTV, affordability, assets and qualitative factors | 2 | |||||||||
| Income producing real estate | Specialized lending, retail | 12 | >15 years | 2 | Statistical scorecards using e.g. LTV, debt service coverage and qualitative factors | ||||||||||
|
Commodity traders |
Corporates, specialized lending |
2 |
>15 years |
1 |
Statistical scorecard using e.g. volume, liquidity and duration of financed commodity transactions |
|
|||||||||
| Sovereign |
Sovereign, corporates |
3 |
>15 years |
1 |
Statistical scorecards using e.g. GDP, financials and qualitative factors |
1 |
Statistical models using e.g. industry and counterparty segmentation, seniority and other transaction specific factors |
||||||||
|
Ship finance |
Specialized lending |
1 |
>15 years |
1 |
Statistical scorecard using e.g. freight rates, ship market values, operational expenses and group information |
1 |
Statistical model using e.g. LTV and counterparty attributes |
||||||||
|
Lombard, Securities Borrowing & Lending |
Retail, corporates |
9 |
>15 years |
1 |
Merton type model using e.g. LTV, collateral volatility and counterparty attributes |
1 |
Merton type model using e.g. LTV, collateral volatility and counterparty attributes |
||||||||
| CRE - Credit Suisse counterparty ratings | |||||||||||||
| Ratings | PD bands (%) | 1 | Definition | S&P | Fitch | Moody's | Details | ||||||
| AAA |
0.000 - 0.021 |
Substantially risk free |
AAA |
AAA |
Aaa |
Extremely low risk, very high long-term stability, still solvent under extreme conditions |
|||||||
|
AA+ AA AA- |
0.021 - 0.027 0.027 - 0.034 0.034 - 0.044 |
Minimal risk |
AA+ AA AA- |
AA+ AA AA- |
Aa1 Aa2 Aa3 |
Very low risk, long-term stability, repayment sources sufficient under lasting adverse conditions, extremely high medium-term stability |
|||||||
|
A+ A A- |
0.044 - 0.056 0.056 - 0.068 0.068 - 0.097 |
Modest risk |
A+ A A- |
A+ A A- |
A1 A2 A3 |
Low risk, short- and mid-term stability, small adverse developments can be absorbed long term, short- and mid-term solvency preserved in the event of serious difficulties |
|||||||
|
BBB+ BBB BBB- |
0.097 - 0.167 0.167 - 0.285 0.285 - 0.487 |
Average risk |
BBB+ BBB BBB- |
BBB+ BBB BBB- |
Baa1 Baa2 Baa3 |
Medium to low risk, high short-term stability, adequate substance for medium-term survival, very stable short term |
|||||||
|
BB+ BB BB- |
0.487 - 0.839 0.839 - 1.442 1.442 - 2.478 |
Acceptable risk |
BB+ BB BB- |
BB+ BB BB- |
Ba1 Ba2 Ba3 |
Medium risk, only short-term stability, only capable of absorbing minor adverse developments in the medium term, stable in the short term, no increased credit risks expected within the year |
|||||||
|
B+ B B- |
2.478 - 4.259 4.259 - 7.311 7.311 - 12.550 |
High risk |
B+ B B- |
B+ B B- |
B1 B2 B3 |
Increasing risk, limited capability to absorb further unexpected negative developments |
|||||||
|
CCC+ CCC CCC- CC |
12.550 - 21.543 21.543 - 100.00 21.543 - 100.00 21.543 - 100.00 |
Very high risk |
CCC+ CCC CCC- CC |
CCC+ CCC CCC- CC |
Caa1 Caa2 Caa3 Ca |
High risk, very limited capability to absorb further unexpected negative developments |
|||||||
|
C D1 D2 |
100 Risk of default has materialized |
Imminent or actual loss |
C D |
C D |
C |
Substantial credit risk has materialized, i.e. counterparty is distressed and/or non-performing. Adequate specific provisions must be made as further adverse developments will result directly in credit losses. |
|||||||
|
Transactions rated C are potential problem loans; those rated D1 are non-performing assets and those rated D2 are non-interest earning.
|
|||||||||||||
|
1
For Ratings AAA to CCC+, the PD bands are exclusive of the left-hand side and inclusive of the right-hand side PD band boundary. For Ratings CCC to CC, the PD bands are exclusive of the left-hand and exclusive of the right-hand side. For Rating C, the PD equals 100%.
|
|||||||||||||
| CRE - EAD covered by the various approaches | |||||
|
end of 4Q22 |
Standardized approach |
A-IRB approach |
1 | ||
| EAD (in %) | |||||
| Sovereigns | 51 | 49 | |||
| Institutions - Banks and securities dealer | 17 | 83 | |||
| Institutions - Other institutions | 62 | 38 | |||
| Corporates | 10 | 90 | |||
| Residential mortgages | 0 | 100 | |||
| Retail | 5 | 95 | |||
| Other exposures | 100 | 0 | |||
| Total | 17 | 83 | |||
|
1
Includes EAD related to the supervisory slotting approach.
|
|||||
| CR6 – Credit risk exposures by portfolio and PD range | |||||||||||||||||||||||||||
|
end of 4Q22 |
Original on-balance sheet gross exposure |
Off-balance sheet exposures pre CCF |
Total exposures |
Average CCF |
EAD post- CRM and post-CCF |
1 |
Average PD |
Number of obligors (thousands) |
Average LGD |
Average maturity (years) |
RWA |
2 |
RWA density |
Expected loss |
Provisions |
||||||||||||
| Sovereigns (CHF million, except where indicated) | |||||||||||||||||||||||||||
| 0.00% to <0.15% | 38,993 | 740 | 39,733 | 55% | 33,448 | 0.03% | < 0.1 | 4% | 1.1 | 539 | 2% | 1 | – | ||||||||||||||
| 0.15% to <0.25% | 26 | 0 | 26 | 0% | 0 | 0.22% | < 0.1 | 58% | 4.2 | 0 | 86% | 0 | – | ||||||||||||||
| 0.25% to <0.50% | 113 | 0 | 113 | 0% | 81 | 0.37% | < 0.1 | 72% | 2.0 | 80 | 100% | 0 | – | ||||||||||||||
| 0.50% to <0.75% | 31 | 0 | 31 | 0% | 9 | 0.64% | < 0.1 | 42% | 1.0 | 5 | 58% | 0 | – | ||||||||||||||
| 0.75% to <2.50% | 42 | 3 | 45 | 45% | 38 | 1.84% | < 0.1 | 40% | 3.1 | 44 | 114% | 0 | – | ||||||||||||||
| 2.50% to <10.00% | 61 | 24 | 85 | 20% | 66 | 4.29% | < 0.1 | 50% | 2.9 | 115 | 174% | 2 | – | ||||||||||||||
| 10.00% to <100.00% | 318 | 0 | 318 | 0% | 211 | 28.19% | < 0.1 | 54% | 0.2 | 632 | 299% | 32 | – | ||||||||||||||
| 100.00% (Default) | 295 | 0 | 295 | 0% | 113 | 100.00% | < 0.1 | 58% | 1.2 | 119 | 106% | 182 | – | ||||||||||||||
| Sub-total | 39,879 | 767 | 40,646 | 54% | 33,966 | 0.54% | 0.1 | 5% | 1.1 | 1,534 | 5% | 217 | 182 | ||||||||||||||
| Institutions - Banks and securities dealer | |||||||||||||||||||||||||||
| 0.00% to <0.15% | 7,692 | 1,186 | 8,878 | 59% | 9,758 | 0.06% | 1.5 | 52% | 0.6 | 1,462 | 15% | 3 | – | ||||||||||||||
| 0.15% to <0.25% | 250 | 265 | 515 | 47% | 316 | 0.22% | 0.1 | 51% | 0.7 | 139 | 44% | 0 | – | ||||||||||||||
| 0.25% to <0.50% | 424 | 193 | 617 | 45% | 395 | 0.37% | 0.1 | 51% | 1.1 | 256 | 65% | 1 | – | ||||||||||||||
| 0.50% to <0.75% | 33 | 102 | 135 | 48% | 84 | 0.64% | < 0.1 | 48% | 1.8 | 83 | 99% | 0 | – | ||||||||||||||
| 0.75% to <2.50% | 89 | 46 | 135 | 51% | 116 | 1.66% | 0.1 | 52% | 0.7 | 138 | 119% | 1 | – | ||||||||||||||
| 2.50% to <10.00% | 589 | 186 | 775 | 48% | 273 | 5.47% | 0.2 | 50% | 1.0 | 444 | 163% | 7 | – | ||||||||||||||
| 10.00% to <100.00% | 7 | 8 | 15 | 35% | 5 | 21.57% | < 0.1 | 53% | 0.4 | 14 | 285% | 1 | – | ||||||||||||||
| 100.00% (Default) | 7 | 0 | 7 | 0% | 7 | 100.00% | < 0.1 | 50% | 1.0 | 8 | 106% | 0 | – | ||||||||||||||
| Sub-total | 9,091 | 1,986 | 11,077 | 54% | 10,954 | 0.31% | 1.9 | 52% | 0.7 | 2,544 | 23% | 13 | 0 | ||||||||||||||
| Institutions - Other institutions | |||||||||||||||||||||||||||
| 0.00% to <0.15% | 165 | 1,883 | 2,048 | 2% | 318 | 0.04% | < 0.1 | 39% | 3.5 | 61 | 19% | 0 | – | ||||||||||||||
| 0.15% to <0.25% | 34 | 8 | 42 | 14% | 35 | 0.19% | < 0.1 | 40% | 3.0 | 23 | 66% | 0 | – | ||||||||||||||
| 0.25% to <0.50% | 12 | 0 | 12 | 0% | 12 | 0.37% | < 0.1 | 58% | 2.5 | 11 | 83% | 0 | – | ||||||||||||||
| 0.50% to <0.75% | 4 | 4 | 8 | 45% | 6 | 0.72% | < 0.1 | 44% | 1.5 | 4 | 72% | 0 | – | ||||||||||||||
| 0.75% to <2.50% | 0 | 0 | 0 | 0% | – | 0.00% | < 0.1 | 0% | 0.0 | 0 | 0% | 0 | – | ||||||||||||||
| 2.50% to <10.00% | 79 | 104 | 183 | 45% | 126 | 5.18% | < 0.1 | 6% | 4.2 | 33 | 26% | 1 | – | ||||||||||||||
| 10.00% to <100.00% | 0 | 49 | 49 | 45% | 22 | 19.31% | < 0.1 | 8% | 5.0 | 11 | 51% | 0 | – | ||||||||||||||
| Sub-total | 294 | 2,048 | 2,342 | 5% | 519 | 2.13% | 0.1 | 30% | 3.6 | 143 | 27% | 1 | 0 | ||||||||||||||
| Corporates - Specialized lending | |||||||||||||||||||||||||||
| 0.00% to <0.15% | 7,219 | 1,967 | 9,186 | 45% | 8,096 | 0.05% | 0.8 | 28% | 2.5 | 1,704 | 21% | 1 | – | ||||||||||||||
| 0.15% to <0.25% | 3,855 | 1,777 | 5,632 | 36% | 4,502 | 0.19% | 0.7 | 25% | 2.6 | 1,466 | 33% | 2 | – | ||||||||||||||
| 0.25% to <0.50% | 2,364 | 1,655 | 4,019 | 35% | 2,939 | 0.36% | 0.5 | 27% | 1.9 | 1,213 | 41% | 3 | – | ||||||||||||||
| 0.50% to <0.75% | 3,487 | 2,269 | 5,756 | 33% | 4,242 | 0.59% | 0.3 | 21% | 1.9 | 1,725 | 41% | 5 | – | ||||||||||||||
| 0.75% to <2.50% | 6,473 | 1,881 | 8,354 | 40% | 7,227 | 1.35% | 0.6 | 18% | 2.3 | 3,273 | 45% | 17 | – | ||||||||||||||
| 2.50% to <10.00% | 867 | 120 | 987 | 46% | 923 | 3.89% | 0.1 | 18% | 1.8 | 566 | 61% | 7 | – | ||||||||||||||
| 10.00% to <100.00% | 0 | 0 | 0 | 0% | – | 0.00% | < 0.1 | 0% | 0.0 | 0 | 0% | 0 | – | ||||||||||||||
| 100.00% (Default) | 73 | 1 | 74 | 61% | 40 | 100.00% | < 0.1 | 47% | 1.0 | 43 | 106% | 34 | – | ||||||||||||||
| Sub-total | 24,338 | 9,670 | 34,008 | 38% | 27,969 | 0.79% | 2.8 | 23% | 2.3 | 9,990 | 36% | 69 | 34 | ||||||||||||||
|
1
CRM is reflected by shifting the counterparty exposure from the underlying obligor to the protection provider.
|
|||||||||||||||||||||||||||
|
2
Reflects RWA post CCF.
|
|||||||||||||||||||||||||||
| CR6 – Credit risk exposures by portfolio and PD range (continued) | |||||||||||||||||||||||||||
|
end of 4Q22 |
Original on-balance sheet gross exposure |
Off-balance sheet exposures pre CCF |
Total exposures |
Average CCF |
EAD post- CRM and post-CCF |
1 |
Average PD |
Number of obligors (thousands) |
Average LGD |
Average maturity (years) |
RWA |
2 |
RWA density |
Expected loss |
Provisions |
||||||||||||
| Corporates without specialized lending (CHF million, except where indicated) | |||||||||||||||||||||||||||
| 0.00% to <0.15% | 13,873 | 38,961 | 52,834 | 34% | 27,581 | 0.07% | 2.8 | 42% | 2.1 | 6,161 | 22% | 8 | – | ||||||||||||||
| 0.15% to <0.25% | 6,992 | 11,754 | 18,746 | 39% | 11,063 | 0.21% | 1.3 | 47% | 2.0 | 5,198 | 47% | 11 | – | ||||||||||||||
| 0.25% to <0.50% | 4,562 | 8,137 | 12,699 | 36% | 7,166 | 0.37% | 1.5 | 42% | 2.1 | 3,818 | 53% | 11 | – | ||||||||||||||
| 0.50% to <0.75% | 2,557 | 5,428 | 7,985 | 33% | 4,086 | 0.63% | 0.8 | 36% | 2.2 | 2,450 | 60% | 9 | – | ||||||||||||||
| 0.75% to <2.50% | 8,014 | 7,987 | 16,001 | 41% | 10,794 | 1.55% | 1.7 | 40% | 2.4 | 10,359 | 96% | 69 | – | ||||||||||||||
| 2.50% to <10.00% | 7,079 | 8,274 | 15,353 | 49% | 9,888 | 5.97% | 1.7 | 35% | 3.1 | 13,018 | 132% | 199 | – | ||||||||||||||
| 10.00% to <100.00% | 805 | 318 | 1,123 | 50% | 875 | 17.59% | 0.1 | 24% | 3.1 | 1,189 | 136% | 38 | – | ||||||||||||||
| 100.00% (Default) | 6,083 | 754 | 6,837 | 48% | 1,782 | 100.00% | 0.3 | 61% | 1.9 | 1,843 | 103% | 4,691 | – | ||||||||||||||
| Sub-total | 49,965 | 81,613 | 131,578 | 37% | 73,235 | 3.81% | 10.1 | 41% | 2.3 | 44,036 | 60% | 5,036 | 4,691 | ||||||||||||||
| Residential mortgages | |||||||||||||||||||||||||||
| 0.00% to <0.15% | 31,276 | 1,396 | 32,672 | 39% | 31,821 | 0.09% | 44.2 | 14% | 2.9 | 2,264 | 7% | 4 | – | ||||||||||||||
| 0.15% to <0.25% | 33,307 | 1,596 | 34,903 | 43% | 34,000 | 0.18% | 37.7 | 15% | 3.0 | 4,396 | 13% | 9 | – | ||||||||||||||
| 0.25% to <0.50% | 35,075 | 1,579 | 36,654 | 42% | 35,745 | 0.31% | 48.2 | 14% | 3.0 | 6,913 | 19% | 16 | – | ||||||||||||||
| 0.50% to <0.75% | 4,439 | 440 | 4,879 | 44% | 4,630 | 0.59% | 5.2 | 17% | 2.7 | 1,467 | 32% | 4 | – | ||||||||||||||
| 0.75% to <2.50% | 5,143 | 636 | 5,779 | 44% | 5,421 | 1.35% | 5.0 | 16% | 2.7 | 2,475 | 46% | 12 | – | ||||||||||||||
| 2.50% to <10.00% | 936 | 46 | 982 | 61% | 964 | 4.42% | 0.6 | 16% | 2.2 | 679 | 70% | 6 | – | ||||||||||||||
| 10.00% to <100.00% | 66 | 0 | 66 | 70% | 66 | 18.19% | < 0.1 | 15% | 1.6 | 70 | 106% | 2 | – | ||||||||||||||
| 100.00% (Default) | 379 | 2 | 381 | 65% | 348 | 100.00% | 0.2 | 51% | 1.6 | 369 | 106% | 32 | – | ||||||||||||||
| Sub-total | 110,621 | 5,695 | 116,316 | 42% | 112,995 | 0.62% | 141.0 | 15% | 2.9 | 18,633 | 16% | 85 | 32 | ||||||||||||||
| Qualifying revolving retail | |||||||||||||||||||||||||||
| 0.75% to <2.50% | 461 | 0 | 461 | 0% | 461 | 1.30% | 563.3 | 50% | 1.0 | 155 | 34% | 3 | – | ||||||||||||||
| 100.00% (Default) | 0 | 0 | 0 | 0% | – | 100.00% | < 0.1 | 50% | 1.0 | 0 | 106% | 0 | – | ||||||||||||||
| Sub-total | 461 | 0 | 461 | 0% | 461 | 1.31% | 563.3 | 50% | 1.0 | 155 | 34% | 3 | 0 | ||||||||||||||
| Other retail | |||||||||||||||||||||||||||
| 0.00% to <0.15% | 36,615 | 121,701 | 158,316 | 6% | 44,007 | 0.04% | 47.8 | 63% | 1.4 | 3,429 | 8% | 11 | – | ||||||||||||||
| 0.15% to <0.25% | 2,511 | 6,863 | 9,374 | 9% | 3,130 | 0.19% | 3.9 | 45% | 1.4 | 580 | 19% | 3 | – | ||||||||||||||
| 0.25% to <0.50% | 1,779 | 2,656 | 4,435 | 13% | 2,129 | 0.36% | 3.4 | 42% | 1.5 | 564 | 27% | 3 | – | ||||||||||||||
| 0.50% to <0.75% | 390 | 602 | 992 | 23% | 530 | 0.64% | 1.3 | 35% | 1.9 | 166 | 31% | 1 | – | ||||||||||||||
| 0.75% to <2.50% | 4,598 | 1,731 | 6,329 | 29% | 5,095 | 1.64% | 95.3 | 34% | 2.5 | 2,200 | 43% | 29 | – | ||||||||||||||
| 2.50% to <10.00% | 2,815 | 323 | 3,138 | 25% | 2,895 | 5.12% | 86.2 | 40% | 3.6 | 1,794 | 62% | 59 | – | ||||||||||||||
| 10.00% to <100.00% | 52 | 26 | 78 | 7% | 53 | 17.24% | 0.3 | 26% | 1.4 | 30 | 55% | 2 | – | ||||||||||||||
| 100.00% (Default) | 311 | 14 | 325 | 20% | 238 | 100.00% | 4.9 | 78% | 1.9 | 252 | 106% | 314 | – | ||||||||||||||
| Sub-total | 49,071 | 133,916 | 182,987 | 7% | 58,077 | 0.88% | 243.2 | 57% | 1.6 | 9,015 | 16% | 422 | 314 | ||||||||||||||
| Sub-total (all portfolios) | |||||||||||||||||||||||||||
| 0.00% to <0.15% | 135,832 | 167,835 | 303,667 | 14% | 155,030 | 0.05% | 97.2 | 34% | 1.8 | 15,620 | 10% | 28 | – | ||||||||||||||
| 0.15% to <0.25% | 46,975 | 22,262 | 69,237 | 30% | 53,046 | 0.19% | 43.6 | 24% | 2.6 | 11,802 | 22% | 25 | – | ||||||||||||||
| 0.25% to <0.50% | 44,330 | 14,221 | 58,551 | 32% | 48,466 | 0.32% | 53.6 | 21% | 2.7 | 12,855 | 27% | 34 | – | ||||||||||||||
| 0.50% to <0.75% | 10,941 | 8,845 | 19,786 | 33% | 13,587 | 0.60% | 7.7 | 25% | 2.3 | 5,900 | 43% | 19 | – | ||||||||||||||
| 0.75% to <2.50% | 24,820 | 12,284 | 37,104 | 39% | 29,152 | 1.47% | 665.9 | 29% | 2.4 | 18,644 | 64% | 131 | – | ||||||||||||||
| 2.50% to <10.00% | 12,427 | 9,077 | 21,504 | 48% | 15,134 | 5.56% | 88.8 | 34% | 3.0 | 16,649 | 110% | 281 | – | ||||||||||||||
| 10.00% to <100.00% | 1,248 | 401 | 1,649 | 46% | 1,233 | 19.47% | 0.4 | 29% | 2.5 | 1,946 | 158% | 75 | – | ||||||||||||||
| 100.00% (Default) | 7,147 | 770 | 7,917 | 47% | 2,528 | 100.00% | 5.5 | 61% | 1.8 | 2,634 | 104% | 5,253 | – | ||||||||||||||
| Sub-total (all portfolios) | 283,720 | 235,695 | 519,415 | 20% | 318,176 | 1.40% | 962.6 | 30% | 2.2 | 86,050 | 27% | 5,846 | 5,254 | ||||||||||||||
| Alternative treatment | |||||||||||||||||||||||||||
| Exposures from free deliveries applying standardized risk weights or 100% under the alternative treatment | – | – | – | – | 3 | – | – | – | – | 3 | – | – | – | ||||||||||||||
| IRB - maturity and export finance buffer | – | – | – | – | – | – | – | – | – | 3,639 | – | – | – | ||||||||||||||
| Total (all portfolios and alternative treatment) | 283,720 | 235,695 | 519,415 | 20% | 318,179 | 1.40% | 962.6 | 30% | 2.2 | 89,692 | 27% | 5,846 | 5,254 | ||||||||||||||
|
1
CRM is reflected by shifting the counterparty exposure from the underlying obligor to the protection provider.
|
|||||||||||||||||||||||||||
|
2
Reflects RWA post CCF.
|
|||||||||||||||||||||||||||
| CR6 – Credit risk exposures by portfolio and PD range (continued) | |||||||||||||||||||||||||||
|
end of 2Q22 |
Original on-balance sheet gross exposure |
Off-balance sheet exposures pre CCF |
Total exposures |
Average CCF |
EAD post- CRM and post-CCF |
1 |
Average PD |
Number of obligors (thousands) |
Average LGD |
Average maturity (years) |
RWA |
2 |
RWA density |
Expected loss |
Provisions |
||||||||||||
| Sovereigns (CHF million, except where indicated) | |||||||||||||||||||||||||||
| 0.00% to <0.15% | 37,926 | 315 | 38,241 | 53% | 32,579 | 0.03% | < 0.1 | 6% | 1.1 | 518 | 2% | 1 | – | ||||||||||||||
| 0.15% to <0.25% | 27 | 0 | 27 | 0% | 0 | 0.22% | < 0.1 | 58% | 2.5 | 0 | 64% | 0 | – | ||||||||||||||
| 0.25% to <0.50% | 116 | 0 | 116 | 0% | 83 | 0.37% | < 0.1 | 56% | 2.2 | 64 | 77% | 0 | – | ||||||||||||||
| 0.50% to <0.75% | 49 | 0 | 49 | 0% | 13 | 0.64% | < 0.1 | 58% | 1.4 | 12 | 88% | 0 | – | ||||||||||||||
| 0.75% to <2.50% | 47 | 3 | 50 | 45% | 48 | 1.85% | < 0.1 | 24% | 3.5 | 34 | 71% | 0 | – | ||||||||||||||
| 2.50% to <10.00% | 245 | 59 | 304 | 20% | 204 | 5.73% | < 0.1 | 49% | 2.0 | 349 | 171% | 6 | – | ||||||||||||||
| 10.00% to <100.00% | 499 | 0 | 499 | 0% | 344 | 28.23% | < 0.1 | 54% | 1.1 | 1,037 | 301% | 53 | – | ||||||||||||||
| 100.00% (Default) | 357 | 0 | 357 | 0% | 129 | 100.00% | < 0.1 | 56% | 1.9 | 136 | 106% | 178 | – | ||||||||||||||
| Sub-total | 39,266 | 377 | 39,643 | 48% | 33,400 | 0.74% | 0.1 | 7% | 1.1 | 2,150 | 6% | 238 | 178 | ||||||||||||||
| Institutions - Banks and securities dealer | |||||||||||||||||||||||||||
| 0.00% to <0.15% | 8,399 | 1,695 | 10,094 | 61% | 11,196 | 0.06% | 1.6 | 51% | 0.7 | 1,682 | 15% | 3 | – | ||||||||||||||
| 0.15% to <0.25% | 237 | 278 | 515 | 47% | 225 | 0.22% | 0.1 | 49% | 0.6 | 86 | 38% | 0 | – | ||||||||||||||
| 0.25% to <0.50% | 521 | 207 | 728 | 49% | 472 | 0.37% | 0.1 | 51% | 0.7 | 282 | 60% | 1 | – | ||||||||||||||
| 0.50% to <0.75% | 56 | 132 | 188 | 52% | 104 | 0.64% | < 0.1 | 45% | 2.6 | 91 | 87% | 0 | – | ||||||||||||||
| 0.75% to <2.50% | 235 | 129 | 364 | 42% | 224 | 1.62% | 0.1 | 51% | 0.5 | 233 | 104% | 2 | – | ||||||||||||||
| 2.50% to <10.00% | 653 | 173 | 826 | 43% | 353 | 5.31% | 0.2 | 50% | 0.8 | 576 | 163% | 10 | – | ||||||||||||||
| 10.00% to <100.00% | 52 | 24 | 76 | 50% | 58 | 28.04% | < 0.1 | 53% | 0.7 | 188 | 321% | 9 | – | ||||||||||||||
| 100.00% (Default) | 8 | 0 | 8 | 0% | 8 | 100.00% | < 0.1 | 50% | 1.6 | 8 | 106% | 0 | – | ||||||||||||||
| Sub-total | 10,161 | 2,638 | 12,799 | 56% | 12,640 | 0.44% | 2.0 | 51% | 0.7 | 3,146 | 25% | 25 | 0 | ||||||||||||||
| Institutions - Other institutions | |||||||||||||||||||||||||||
| 0.00% to <0.15% | 1,059 | 1,845 | 2,904 | 2% | 1,183 | 0.04% | < 0.1 | 41% | 3.4 | 261 | 22% | 0 | – | ||||||||||||||
| 0.15% to <0.25% | 68 | 9 | 77 | 33% | 71 | 0.16% | < 0.1 | 49% | 1.2 | 29 | 42% | 0 | – | ||||||||||||||
| 0.25% to <0.50% | 13 | 0 | 13 | 45% | 13 | 0.37% | < 0.1 | 58% | 2.5 | 11 | 83% | 0 | – | ||||||||||||||
| 0.50% to <0.75% | 5 | 2 | 7 | 45% | 5 | 0.72% | < 0.1 | 44% | 1.9 | 4 | 77% | 0 | – | ||||||||||||||
| 0.75% to <2.50% | 1 | 0 | 1 | 0% | 1 | 1.05% | < 0.1 | 17% | 2.0 | 1 | 52% | 0 | – | ||||||||||||||
| 2.50% to <10.00% | 165 | 276 | 441 | 45% | 290 | 5.40% | < 0.1 | 7% | 4.7 | 88 | 30% | 1 | – | ||||||||||||||
| Sub-total | 1,311 | 2,132 | 3,443 | 7% | 1,563 | 1.05% | 0.1 | 35% | 3.5 | 394 | 25% | 1 | 0 | ||||||||||||||
| Corporates - Specialized lending | |||||||||||||||||||||||||||
| 0.00% to <0.15% | 8,039 | 2,540 | 10,579 | 44% | 9,155 | 0.06% | 0.8 | 28% | 2.4 | 1,972 | 22% | 1 | – | ||||||||||||||
| 0.15% to <0.25% | 4,463 | 2,407 | 6,870 | 38% | 5,367 | 0.19% | 0.7 | 28% | 2.4 | 1,998 | 37% | 3 | – | ||||||||||||||
| 0.25% to <0.50% | 2,785 | 1,457 | 4,242 | 33% | 3,267 | 0.37% | 0.4 | 29% | 1.8 | 1,425 | 44% | 4 | – | ||||||||||||||
| 0.50% to <0.75% | 3,341 | 2,591 | 5,932 | 31% | 4,156 | 0.59% | 0.3 | 22% | 1.9 | 1,698 | 41% | 5 | – | ||||||||||||||
| 0.75% to <2.50% | 7,116 | 2,173 | 9,289 | 39% | 7,965 | 1.42% | 0.6 | 19% | 2.3 | 3,937 | 49% | 21 | – | ||||||||||||||
| 2.50% to <10.00% | 1,321 | 28 | 1,349 | 15% | 1,325 | 3.88% | 0.1 | 16% | 2.4 | 691 | 52% | 9 | – | ||||||||||||||
| 10.00% to <100.00% | 45 | 0 | 45 | 45% | 45 | 14.86% | < 0.1 | 19% | 1.3 | 41 | 93% | 1 | – | ||||||||||||||
| 100.00% (Default) | 89 | 2 | 91 | 56% | 55 | 100.00% | < 0.1 | 43% | 1.3 | 58 | 106% | 34 | – | ||||||||||||||
| Sub-total | 27,199 | 11,198 | 38,397 | 37% | 31,335 | 0.89% | 3.0 | 24% | 2.2 | 11,820 | 38% | 78 | 34 | ||||||||||||||
|
1
CRM is reflected by shifting the counterparty exposure from the underlying obligor to the protection provider.
|
|||||||||||||||||||||||||||
|
2
Reflects RWA post CCF.
|
|||||||||||||||||||||||||||
| CR6 – Credit risk exposures by portfolio and PD range (continued) | |||||||||||||||||||||||||||
|
end of 2Q22 |
Original on-balance sheet gross exposure |
Off-balance sheet exposures pre CCF |
Total exposures |
Average CCF |
EAD post- CRM and post-CCF |
1 |
Average PD |
Number of obligors (thousands) |
Average LGD |
Average maturity (years) |
RWA |
2 |
RWA density |
Expected loss |
Provisions |
||||||||||||
| Corporates without specialized lending (CHF million, except where indicated) | |||||||||||||||||||||||||||
| 0.00% to <0.15% | 15,948 | 49,374 | 65,322 | 34% | 33,330 | 0.07% | 2.9 | 40% | 2.3 | 7,050 | 21% | 9 | – | ||||||||||||||
| 0.15% to <0.25% | 5,915 | 10,585 | 16,500 | 37% | 9,515 | 0.21% | 1.4 | 45% | 1.9 | 4,342 | 46% | 9 | – | ||||||||||||||
| 0.25% to <0.50% | 5,632 | 8,412 | 14,044 | 36% | 8,374 | 0.37% | 1.5 | 41% | 2.0 | 4,431 | 53% | 13 | – | ||||||||||||||
| 0.50% to <0.75% | 3,762 | 4,849 | 8,611 | 42% | 5,343 | 0.62% | 0.8 | 41% | 2.2 | 3,667 | 69% | 13 | – | ||||||||||||||
| 0.75% to <2.50% | 8,616 | 7,689 | 16,305 | 40% | 10,945 | 1.44% | 1.7 | 37% | 2.3 | 9,440 | 86% | 60 | – | ||||||||||||||
| 2.50% to <10.00% | 8,001 | 14,320 | 22,321 | 44% | 12,923 | 6.06% | 2.0 | 35% | 2.6 | 16,970 | 131% | 275 | – | ||||||||||||||
| 10.00% to <100.00% | 984 | 491 | 1,475 | 35% | 1,070 | 19.08% | 0.1 | 26% | 2.8 | 1,542 | 144% | 54 | – | ||||||||||||||
| 100.00% (Default) | 6,082 | 683 | 6,765 | 37% | 1,732 | 100.00% | 0.2 | 64% | 1.6 | 1,784 | 103% | 4,688 | – | ||||||||||||||
| Sub-total | 54,940 | 96,403 | 151,343 | 37% | 83,232 | 3.58% | 10.6 | 40% | 2.2 | 49,226 | 59% | 5,121 | 4,688 | ||||||||||||||
| Residential mortgages | |||||||||||||||||||||||||||
| 0.00% to <0.15% | 30,701 | 1,646 | 32,347 | 41% | 31,369 | 0.09% | 43.8 | 14% | 3.0 | 2,236 | 7% | 4 | – | ||||||||||||||
| 0.15% to <0.25% | 33,251 | 1,624 | 34,875 | 43% | 33,949 | 0.18% | 38.1 | 15% | 3.0 | 4,391 | 13% | 9 | – | ||||||||||||||
| 0.25% to <0.50% | 36,132 | 1,962 | 38,094 | 43% | 36,986 | 0.30% | 50.3 | 14% | 3.1 | 7,042 | 19% | 16 | – | ||||||||||||||
| 0.50% to <0.75% | 4,793 | 439 | 5,232 | 47% | 4,998 | 0.58% | 5.7 | 17% | 2.8 | 1,596 | 32% | 5 | – | ||||||||||||||
| 0.75% to <2.50% | 5,615 | 640 | 6,255 | 42% | 5,885 | 1.30% | 5.5 | 17% | 2.8 | 2,702 | 46% | 12 | – | ||||||||||||||
| 2.50% to <10.00% | 1,356 | 51 | 1,407 | 57% | 1,385 | 4.40% | 0.7 | 15% | 2.2 | 962 | 69% | 9 | – | ||||||||||||||
| 10.00% to <100.00% | 27 | 0 | 27 | 70% | 27 | 15.23% | < 0.1 | 16% | 2.4 | 44 | 166% | 1 | – | ||||||||||||||
| 100.00% (Default) | 462 | 3 | 465 | 73% | 430 | 100.00% | 0.2 | 55% | 1.6 | 456 | 106% | 34 | – | ||||||||||||||
| Sub-total | 112,337 | 6,365 | 118,702 | 43% | 115,029 | 0.70% | 144.2 | 15% | 3.0 | 19,429 | 17% | 90 | 34 | ||||||||||||||
| Qualifying revolving retail | |||||||||||||||||||||||||||
| 0.75% to <2.50% | 490 | 0 | 490 | 0% | 490 | 1.30% | 572.5 | 50% | 1.0 | 164 | 33% | 3 | – | ||||||||||||||
| 100.00% (Default) | 0 | 0 | 0 | 0% | 0 | 100.00% | < 0.1 | 50% | 1.0 | 0 | 106% | 0 | – | ||||||||||||||
| Sub-total | 490 | 0 | 490 | 0% | 490 | 1.30% | 572.6 | 50% | 1.0 | 164 | 33% | 3 | 0 | ||||||||||||||
| Other retail | |||||||||||||||||||||||||||
| 0.00% to <0.15% | 44,395 | 139,515 | 183,910 | 6% | 52,772 | 0.04% | 49.8 | 63% | 1.4 | 4,138 | 8% | 13 | – | ||||||||||||||
| 0.15% to <0.25% | 3,198 | 7,171 | 10,369 | 9% | 3,845 | 0.19% | 4.1 | 46% | 1.4 | 738 | 19% | 4 | – | ||||||||||||||
| 0.25% to <0.50% | 1,983 | 2,573 | 4,556 | 10% | 2,249 | 0.36% | 3.5 | 41% | 1.6 | 589 | 26% | 3 | – | ||||||||||||||
| 0.50% to <0.75% | 675 | 766 | 1,441 | 17% | 806 | 0.62% | 1.4 | 39% | 1.7 | 292 | 36% | 2 | – | ||||||||||||||
| 0.75% to <2.50% | 4,531 | 1,432 | 5,963 | 22% | 4,852 | 1.59% | 92.6 | 34% | 2.3 | 2,090 | 43% | 27 | – | ||||||||||||||
| 2.50% to <10.00% | 2,653 | 721 | 3,374 | 41% | 2,950 | 5.19% | 83.1 | 39% | 3.6 | 1,789 | 61% | 59 | – | ||||||||||||||
| 10.00% to <100.00% | 25 | 35 | 60 | 5% | 27 | 15.47% | 0.2 | 53% | 2.0 | 30 | 109% | 2 | – | ||||||||||||||
| 100.00% (Default) | 306 | 19 | 325 | 19% | 238 | 100.00% | 4.8 | 79% | 1.8 | 252 | 106% | 280 | – | ||||||||||||||
| Sub-total | 57,766 | 152,232 | 209,998 | 7% | 67,739 | 0.76% | 239.4 | 58% | 1.6 | 9,918 | 15% | 390 | 280 | ||||||||||||||
| Sub-total (all portfolios) | |||||||||||||||||||||||||||
| 0.00% to <0.15% | 146,467 | 196,931 | 343,398 | 14% | 171,585 | 0.05% | 98.9 | 36% | 1.8 | 17,857 | 10% | 31 | – | ||||||||||||||
| 0.15% to <0.25% | 47,158 | 22,074 | 69,232 | 29% | 52,971 | 0.19% | 44.3 | 24% | 2.6 | 11,586 | 22% | 25 | – | ||||||||||||||
| 0.25% to <0.50% | 47,183 | 14,612 | 61,795 | 32% | 51,444 | 0.32% | 55.8 | 21% | 2.8 | 13,842 | 27% | 37 | – | ||||||||||||||
| 0.50% to <0.75% | 12,679 | 8,778 | 21,457 | 37% | 15,426 | 0.60% | 8.2 | 28% | 2.3 | 7,360 | 48% | 26 | – | ||||||||||||||
| 0.75% to <2.50% | 26,650 | 12,066 | 38,716 | 38% | 30,410 | 1.43% | 673.0 | 28% | 2.4 | 18,599 | 61% | 125 | – | ||||||||||||||
| 2.50% to <10.00% | 14,396 | 15,628 | 30,024 | 44% | 19,430 | 5.63% | 86.0 | 33% | 2.7 | 21,427 | 110% | 368 | – | ||||||||||||||
| 10.00% to <100.00% | 1,632 | 550 | 2,182 | 33% | 1,571 | 21.17% | 0.4 | 33% | 2.3 | 2,882 | 183% | 120 | – | ||||||||||||||
| 100.00% (Default) | 7,304 | 706 | 8,010 | 37% | 2,591 | 100.00% | 5.3 | 63% | 1.6 | 2,695 | 104% | 5,215 | – | ||||||||||||||
| Sub-total (all portfolios) | 303,469 | 271,345 | 574,814 | 20% | 345,428 | 1.42% | 971.9 | 31% | 2.2 | 96,248 | 28% | 5,947 | 5,215 | ||||||||||||||
| Alternative treatment | |||||||||||||||||||||||||||
| Exposures from free deliveries applying standardized risk weights or 100% under the alternative treatment | – | – | – | – | 21 | – | – | – | – | 22 | – | – | – | ||||||||||||||
| IRB - maturity and export finance buffer | – | – | – | – | – | – | – | – | – | 762 | – | – | – | ||||||||||||||
| Total (all portfolios and alternative treatment) | 303,469 | 271,345 | 574,814 | 20% | 345,449 | 1.42% | 971.9 | 31% | 2.2 | 97,032 | 28% | 5,947 | 5,215 | ||||||||||||||
|
1
CRM is reflected by shifting the counterparty exposure from the underlying obligor to the protection provider.
|
|||||||||||||||||||||||||||
|
2
Reflects RWA post CCF.
|
|||||||||||||||||||||||||||
| CR7 – Effect on risk-weighted assets of credit derivatives used as CRM techniques | |||||||||
| 4Q22 | 2Q22 | ||||||||
|
end of |
Pre-credit derivatives RWA |
Actual RWA |
Pre-credit derivatives RWA |
Actual RWA |
|||||
| CHF million | |||||||||
| Sovereigns - A-IRB | 1,534 | 1,534 | 2,150 | 2,150 | |||||
| Institutions - Banks and securities dealers - A-IRB | 2,606 | 2,544 | 3,210 | 3,146 | |||||
| Institutions - Other institutions - A-IRB | 143 | 143 | 394 | 394 | |||||
| Corporates - Specialized lending - A-IRB | 13,693 | 13,693 | 16,143 | 16,143 | |||||
| Corporates without specialized lending - A-IRB | 44,052 | 44,039 | 49,262 | 49,248 | |||||
| Residential mortgages | 18,633 | 18,633 | 19,429 | 19,429 | |||||
| Qualifying revolving retail | 155 | 155 | 164 | 164 | |||||
| Other retail | 9,015 | 9,015 | 9,918 | 9,918 | |||||
| Maturity and export finance buffer - IRB | 3,639 | 3,639 | 762 | 762 | |||||
| Total | 93,470 | 93,395 | 101,432 | 101,354 | |||||
|
Includes RWA related to the A-IRB approach and supervisory slotting approach.
|
|||||||||
| CR8 – Risk-weighted assets flow statements of credit risk exposures under IRB | |||
| 4Q22 | |||
| CHF million | |||
| Risk-weighted assets at beginning of period | 100,153 | ||
| Asset size | (6,035) | ||
| Asset quality | (661) | ||
| Model and parameter updates | 1,719 | ||
| Foreign exchange impact | (1,781) | ||
| Risk-weighted assets at end of period | 93,395 | ||
|
Includes RWA related to the A-IRB approach and supervisory slotting approach.
|
|||
| Definition of risk-weighted assets movement components related to credit risk and CCR | |||
| Description | Definition | ||
| Asset size |
Represents changes on the portfolio size arising in the ordinary course of business (including new businesses). Asset size also includes movements arising from the application of the comprehensive approach with regard to the treatment of financial collateral |
||
| Asset quality/credit quality of counterparties | Represents changes in average risk weighting across credit risk classes | ||
| Model and parameter updates |
Represents movements arising from internally driven or externally mandated updates to models and recalibrations of model parameters specific only to Credit Suisse |
||
| Methodology and policy changes |
Represents movements arising from externally mandated regulatory methodology and policy changes to accounting and exposure classification and treatment policies not specific only to Credit Suisse |
||
| Acquisitions and disposals | Represents changes in book sizes due to acquisitions and disposals of entities | ||
| Foreign exchange impact | Represents changes in exchange rates of the transaction currencies compared to the Swiss franc | ||
| Other | Represents changes that cannot be attributed to any other category | ||
| CR9 - Backtesting of PD per portfolio | |||||||||||||||||||||
|
Number of obligors (thousands) |
|||||||||||||||||||||
|
Master scale from CRM S&P |
Master scale from CRM Fitch |
Master scale from CRM Moody |
Weighted average PD |
Arithmetic average PD by obligors |
1 |
End of previous year |
End of the year |
Defaulted obligors in the year |
2 |
of which: new defaulted obligors in the year |
2 |
Average historical annual default rate |
2 | ||||||||
| Sovereigns | |||||||||||||||||||||
| 0.00% to <0.15% | AAA to BBB+ | AAA to BBB+ | Aaa to Baa1 | 0.02% | 0.04% | <0.1 | <0.1 | 0 | 0 | 0.03% | |||||||||||
| 0.15% to <0.25% | BBB | BBB | Baa2 | 0.22% | 0.23% | <0.1 | <0.1 | 0 | 0 | 0.00% | |||||||||||
| 0.25% to <0.50% | BBB- | BBB- | Baa3 | 0.37% | 0.37% | <0.1 | <0.1 | 0 | 0 | 0.00% | |||||||||||
| 0.50% to <0.75% | BB+ | BB+ | Ba1 | 0.64% | 0.64% | <0.1 | <0.1 | 0 | 0 | 0.00% | |||||||||||
| 0.75% to <2.50% | BB to BB- | BB to BB- | Ba2 to Ba3 | 1.18% | 1.33% | <0.1 | <0.1 | 0 | 0 | 0.00% | |||||||||||
| 2.50% to <10.00% | B+ to B- | B+ to B- | B1 to B3 | 6.45% | 6.15% | <0.1 | <0.1 | 0 | 0 | 1.09% | |||||||||||
| 10.00% to <100.00% | CCC+ to CC | CCC+ to CC | Caa1 to Ca | 28.23% | 28.23% | <0.1 | <0.1 | 1 | 0 | 13.89% | |||||||||||
| Institutions - Banks and securities dealer | |||||||||||||||||||||
| 0.00% to <0.15% | AAA to BBB+ | AAA to BBB+ | Aaa to Baa1 | 0.06% | 0.07% | 1.6 | 1.6 | 0 | 0 | 0.03% | |||||||||||
| 0.15% to <0.25% | BBB | BBB | Baa2 | 0.22% | 0.22% | 0.1 | 0.1 | 0 | 0 | 0.14% | |||||||||||
| 0.25% to <0.50% | BBB- | BBB- | Baa3 | 0.37% | 0.37% | 0.1 | 0.1 | 0 | 0 | 0.26% | |||||||||||
| 0.50% to <0.75% | BB+ | BB+ | Ba1 | 0.61% | 0.64% | <0.1 | <0.1 | 0 | 0 | 0.17% | |||||||||||
| 0.75% to <2.50% | BB to BB- | BB to BB- | Ba2 to Ba3 | 1.31% | 1.41% | 0.1 | 0.1 | 0 | 0 | 0.15% | |||||||||||
| 2.50% to <10.00% | B+ to B- | B+ to B- | B1 to B3 | 5.16% | 4.95% | 0.2 | 0.2 | 0 | 0 | 0.56% | |||||||||||
| 10.00% to <100.00% | CCC+ to CC | CCC+ to CC | Caa1 to Ca | 17.18% | 19.39% | <0.1 | <0.1 | 0 | 0 | 2.23% | |||||||||||
| Institutions - Other institutions | |||||||||||||||||||||
| 0.00% to <0.15% | AAA to BBB+ | AAA to BBB+ | Aaa to Baa1 | 0.04% | 0.06% | <0.1 | <0.1 | 0 | 0 | 0.00% | |||||||||||
| 0.15% to <0.25% | BBB | BBB | Baa2 | 0.20% | 0.18% | <0.1 | <0.1 | 0 | 0 | 0.00% | |||||||||||
| 0.25% to <0.50% | BBB- | BBB- | Baa3 | 0.37% | 0.32% | <0.1 | <0.1 | 0 | 0 | 0.00% | |||||||||||
| 0.50% to <0.75% | BB+ | BB+ | Ba1 | 0.00% | 0.00% | 0 | – | 0 | 0 | 0.07% | |||||||||||
| 0.75% to <2.50% | BB to BB- | BB to BB- | Ba2 to Ba3 | 0.00% | 0.00% | 0 | <0.1 | 0 | 0 | 0.00% | |||||||||||
| 2.50% to <10.00% | B+ to B- | B+ to B- | B1 to B3 | 4.77% | 4.13% | <0.1 | <0.1 | – | – | – | |||||||||||
| Corporates - Specialized lending | |||||||||||||||||||||
| 0.00% to <0.15% | AAA to BBB+ | AAA to BBB+ | Aaa to Baa1 | 0.06% | 0.07% | 0.8 | 0.8 | 0 | 0 | 0.01% | |||||||||||
| 0.15% to <0.25% | BBB | BBB | Baa2 | 0.20% | 0.20% | 0.7 | 0.7 | 1 | 0 | 0.03% | |||||||||||
| 0.25% to <0.50% | BBB- | BBB- | Baa3 | 0.37% | 0.37% | 0.5 | 0.4 | 0 | 0 | 0.03% | |||||||||||
| 0.50% to <0.75% | BB+ | BB+ | Ba1 | 0.58% | 0.60% | 0.3 | 0.3 | 1 | 0 | 0.21% | |||||||||||
| 0.75% to <2.50% | BB to BB- | BB to BB- | Ba2 to Ba3 | 1.50% | 1.38% | 0.7 | 0.6 | 4 | 0 | 0.42% | |||||||||||
| 2.50% to <10.00% | B+ to B- | B+ to B- | B1 to B3 | 4.43% | 4.19% | 0.2 | 0.1 | 4 | 0 | 4.42% | |||||||||||
| 10.00% to <100.00% | CCC+ to CC | CCC+ to CC | Caa1 to Ca | 12.45% | 12.45% | <0.1 | <0.1 | 0 | 0 | 19.10% | |||||||||||
|
1
The number of obligors used in the calculation is based on the transactional-based approach.
|
|||||||||||||||||||||
|
2
Reflects risk data where prudential portfolios are not captured. Accordingly for these columns approximations are required. Further, fast defaults are in tendency understated since capturing of fast defaults is not available for all clients in risk data. Underlying default rates are determined on client level, i.e. a client can have more than one transaction/credit.
|
|||||||||||||||||||||
| CR9 - Backtesting of PD per portfolio (continued) | |||||||||||||||||||||
|
Number of obligors (thousands) |
|||||||||||||||||||||
|
Master scale from CRM S&P |
Master scale from CRM Fitch |
Master scale from CRM Moody |
Weighted average PD |
Arithmetic average PD by obligors |
1 |
End of previous year |
End of the year |
Defaulted obligors in the year |
2 |
of which: new defaulted obligors in the year |
2 |
Average historical annual default rate |
2 | ||||||||
| Corporates without specialized lending | |||||||||||||||||||||
| 0.00% to <0.15% | AAA to BBB+ | AAA to BBB+ | Aaa to Baa1 | 0.07% | 0.07% | 2.6 | 2.7 | 0 | 0 | 0.03% | |||||||||||
| 0.15% to <0.25% | BBB | BBB | Baa2 | 0.21% | 0.20% | 1.3 | 1.2 | 1 | 0 | 0.10% | |||||||||||
| 0.25% to <0.50% | BBB- | BBB- | Baa3 | 0.37% | 0.37% | 1.6 | 1.5 | 2 | 0 | 0.11% | |||||||||||
| 0.50% to <0.75% | BB+ | BB+ | Ba1 | 0.62% | 0.65% | 0.9 | 0.7 | 1 | 0 | 0.25% | |||||||||||
| 0.75% to <2.50% | BB to BB- | BB to BB- | Ba2 to Ba3 | 1.50% | 1.44% | 2.1 | 1.8 | 9 | 0 | 0.79% | |||||||||||
| 2.50% to <10.00% | B+ to B- | B+ to B- | B1 to B3 | 5.70% | 5.43% | 1.8 | 1.6 | 25 | 1 | 2.05% | |||||||||||
| 10.00% to <100.00% | CCC+ to CC | CCC+ to CC | Caa1 to Ca | 19.34% | 18.78% | 0.1 | 0.1 | 9 | 0 | 13.71% | |||||||||||
| Residential mortgages | |||||||||||||||||||||
| 0.00% to <0.15% | AAA to BBB+ | AAA to BBB+ | Aaa to Baa1 | 0.09% | 0.09% | 44.0 | 43.7 | 8 | 0 | 0.02% | |||||||||||
| 0.15% to <0.25% | BBB | BBB | Baa2 | 0.18% | 0.17% | 38.4 | 38.1 | 12 | 0 | 0.04% | |||||||||||
| 0.25% to <0.50% | BBB- | BBB- | Baa3 | 0.30% | 0.30% | 52.5 | 51.1 | 33 | 0 | 0.08% | |||||||||||
| 0.50% to <0.75% | BB+ | BB+ | Ba1 | 0.59% | 0.60% | 6.4 | 6.0 | 6 | 0 | 0.15% | |||||||||||
| 0.75% to <2.50% | BB to BB- | BB to BB- | Ba2 to Ba3 | 1.23% | 1.27% | 6.5 | 6.0 | 35 | 0 | 0.31% | |||||||||||
| 2.50% to <10.00% | B+ to B- | B+ to B- | B1 to B3 | 4.17% | 4.27% | 0.7 | 0.7 | 14 | 0 | 3.89% | |||||||||||
| 10.00% to <100.00% | CCC+ to CC | CCC+ to CC | Caa1 to Ca | 17.12% | 16.30% | <0.1 | <0.1 | 2 | 0 | 18.72% | |||||||||||
| Qualifying revolving retail | |||||||||||||||||||||
| 0.75% to <2.50% | BB to BB- | BB to BB- | Ba2 to Ba3 | 1.30% | 1.30% | 767.2 | 745.9 | 4,075 | 0 | 0.98% | |||||||||||
| 10.00% to <100.00% | CCC+ to CC | CCC+ to CC | Caa1 to Ca | 0.00% | 0.00% | 0.0 | – | – | – | – | |||||||||||
| Other retail | |||||||||||||||||||||
| 0.00% to <0.15% | AAA to BBB+ | AAA to BBB+ | Aaa to Baa1 | 0.04% | 0.04% | 50.8 | 50.5 | 9 | 0 | 0.04% | |||||||||||
| 0.15% to <0.25% | BBB | BBB | Baa2 | 0.19% | 0.19% | 3.9 | 3.9 | 0 | 0 | 0.02% | |||||||||||
| 0.25% to <0.50% | BBB- | BBB- | Baa3 | 0.36% | 0.35% | 3.5 | 3.5 | 0 | 0 | 0.05% | |||||||||||
| 0.50% to <0.75% | BB+ | BB+ | Ba1 | 0.62% | 0.67% | 1.4 | 1.3 | 7 | 0 | 0.12% | |||||||||||
| 0.75% to <2.50% | BB to BB- | BB to BB- | Ba2 to Ba3 | 1.51% | 1.79% | 81.5 | 96.0 | 922 | 131 | 1.13% | |||||||||||
| 2.50% to <10.00% | B+ to B- | B+ to B- | B1 to B3 | 5.19% | 5.48% | 80.7 | 81.8 | 2,636 | 202 | 3.73% | |||||||||||
| 10.00% to <100.00% | CCC+ to CC | CCC+ to CC | Caa1 to Ca | 15.79% | 16.97% | 0.3 | 0.2 | – | 0 | 0.12% | |||||||||||
|
1
The number of obligors used in the calculation is based on the transactional-based approach.
|
|||||||||||||||||||||
|
2
Reflects risk data where prudential portfolios are not captured. Accordingly for these columns approximations are required. Further, fast defaults are in tendency understated since capturing of fast defaults is not available for all clients in risk data. Underlying default rates are determined on client level, i.e. a client can have more than one transaction/credit.
|
|||||||||||||||||||||
| CR10 – Specialized lending | |||||||||||||||
|
end of |
|
On- balance sheet amount |
Off- balance sheet amount |
Risk weight |
Exposure amount |
1 |
RWA |
Expected losses |
|||||||
| 4Q22 (CHF million, except where indicated) | |||||||||||||||
| Other than high-volatility commercial real estate | |||||||||||||||
| Regulatory categories and remaining maturity | |||||||||||||||
| Strong | Less than 2.5 years | 488 | 247 | 50% | 646 | 342 | 0 | ||||||||
| Equal to or more than 2.5 years | 698 | 423 | 70% | 904 | 671 | 4 | |||||||||
| Good | Less than 2.5 years | 1,346 | 333 | 70% | 1,529 | 1,134 | 6 | ||||||||
| Equal to or more than 2.5 years | 532 | 220 | 90% | 641 | 612 | 5 | |||||||||
| Satisfactory | 751 | 48 | 115% | 2 | 747 | 911 | 21 | ||||||||
| Weak | 6 | 11 | 250% | 12 | 33 | 1 | |||||||||
| Total | 3,821 | 1,282 | – | 4,479 | 3,703 | 37 | |||||||||
| High-volatility commercial real estate | |||||||||||||||
| Regulatory categories and remaining maturity | |||||||||||||||
| Default | 0 | 2 | – | 1 | 0 | 1 | |||||||||
| Total | 0 | 2 | – | 1 | 0 | 1 | |||||||||
| 2Q22 (CHF million, except where indicated) | |||||||||||||||
| Other than high-volatility commercial real estate | |||||||||||||||
| Regulatory categories and remaining maturity | |||||||||||||||
| Strong | Less than 2.5 years | 735 | 276 | 50% | 921 | 488 | 0 | ||||||||
| Equal to or more than 2.5 years | 522 | 696 | 70% | 865 | 642 | 4 | |||||||||
| Good | Less than 2.5 years | 1,378 | 612 | 70% | 1,715 | 1,273 | 7 | ||||||||
| Equal to or more than 2.5 years | 787 | 351 | 90% | 968 | 923 | 8 | |||||||||
| Satisfactory | 946 | 42 | 115% | 2 | 640 | 780 | 18 | ||||||||
| Weak | 11 | 12 | 250% | 18 | 47 | 1 | |||||||||
| Default | 15 | 0 | – | 15 | 0 | 7 | |||||||||
| Total | 4,394 | 1,989 | – | 5,142 | 4,153 | 45 | |||||||||
| High-volatility commercial real estate | |||||||||||||||
| Regulatory categories and remaining maturity | |||||||||||||||
| Satisfactory | 32 | 0 | 140% | 32 | 48 | 1 | |||||||||
| Weak | 46 | 0 | 250% | 46 | 121 | 3 | |||||||||
| Default | 0 | 2 | – | 1 | 0 | 1 | |||||||||
| Total | 78 | 2 | – | 79 | 169 | 5 | |||||||||
|
1
Exposure amounts in connection with IPRE.
|
|||||||||||||||
|
2
For a portion of the exposure, a risk weight of 120% is applied.
|
|||||||||||||||
| CR10 – Equity positions in the banking book under the simple risk-weight approach | |||||||||||
|
end of |
On-balance sheet amount |
Off-balance sheet amount |
Risk weight |
Exposure amount |
RWA |
||||||
| 4Q22 (CHF million) | |||||||||||
| Exchange-traded equity exposures | 23 | 0 | 300% | 23 | 72 | ||||||
| Other equity exposures | 873 | 0 | 400% | 873 | 3,703 | ||||||
| Total | 896 | 0 | – | 896 | 3,775 | ||||||
| 2Q22 (CHF million) | |||||||||||
| Exchange-traded equity exposures | 437 | 0 | 300% | 437 | 1,390 | ||||||
| Other equity exposures | 962 | 0 | 400% | 962 | 4,079 | ||||||
| Total | 1,399 | 0 | – | 1,399 | 5,469 | ||||||
|
Equity investments in funds exposures of CHF 682.3 million and CHF 713.5 million as of the end of 4Q22 and 2Q22, respectively, are not included in the above table.
|
|||||||||||
| CCR1 – Analysis of counterparty credit risk exposure by approach | |||||||||||||
|
end of |
Re-placement cost |
PFE |
EEPE |
Alpha used for computing regulatory EAD |
EAD post-CRM |
RWA |
|||||||
| 4Q22 (CHF million, except where indicated) | |||||||||||||
| SA-CCR (for derivatives) | 1,638 | 1,888 | – | 1.4 | 4,937 | 1,827 | |||||||
| IMM (for derivatives) | – | – | 10,151 | 1.6 | 1 | 16,228 | 4,493 | ||||||
| VaR for SFTs | – | – | – | – | 17,661 | 2,963 | |||||||
| Total | – | – | – | – | 38,826 | 9,283 | |||||||
| 2Q22 (CHF million, except where indicated) | |||||||||||||
| SA-CCR (for derivatives) | 3,053 | 3,540 | – | 1.4 | 9,230 | 3,496 | |||||||
| IMM (for derivatives) | – | – | 13,879 | 1.6 | 1 | 22,189 | 5,982 | ||||||
| Comprehensive Approach for CRM (for SFTs) | – | – | – | – | 1 | 1 | |||||||
| VaR for SFTs | – | – | – | – | 20,882 | 3,799 | |||||||
| Total | – | – | – | – | 52,302 | 13,278 | |||||||
|
1
Alpha factor is set equal to 1.0 in case of wrong way risk.
|
|||||||||||||
| CCR2 – CVA capital charge | |||||||||
| 4Q22 | 2Q22 | ||||||||
|
end of |
EAD post-CRM |
RWA |
EAD post-CRM |
RWA |
|||||
| CHF million | |||||||||
| Total portfolios subject to the advanced CVA capital charge | 19,182 | 3,301 | 27,967 | 4,191 | |||||
| of which VaR component (including the 3 x multiplier) | – | 641 | – | 780 | |||||
| of which stressed VaR component (including the 3 x multiplier) | – | 2,660 | – | 3,411 | |||||
| Total subject to the CVA capital charge | 19,182 | 3,301 | 27,967 | 4,191 | |||||
|
EAD post-CRM is disclosed as of the end of the period (end of day), whereas the RWA is an average as of the last 12 weeks.
|
|||||||||
| CCR3 – CCR exposures by regulatory portfolio and risk weight - standardized approach | |||||||||||||||
| Risk weight | |||||||||||||||
|
end of |
0% |
20% |
50% |
75% |
100% |
150% |
Exposures post-CCF and CRM |
||||||||
| 4Q22 (CHF million) | |||||||||||||||
| Sovereigns | 305 | 0 | 0 | 0 | 0 | 0 | 305 | ||||||||
| Institutions - Banks and securities dealer | 0 | 218 | 127 | 0 | 62 | 2 | 409 | ||||||||
| Institutions - Other institutions | 628 | 0 | 81 | 0 | 0 | 0 | 709 | ||||||||
| Corporates | 0 | 81 | 7 | 0 | 1,107 | 37 | 1,232 | ||||||||
| Retail | 0 | 0 | 0 | 21 | 61 | 0 | 82 | ||||||||
| Other exposures | 0 | 0 | 0 | 0 | 347 | 0 | 347 | ||||||||
| Total | 933 | 299 | 215 | 21 | 1,577 | 39 | 3,084 | ||||||||
| 2Q22 (CHF million) | |||||||||||||||
| Sovereigns | 4 | 0 | 0 | 0 | 0 | 0 | 4 | ||||||||
| Institutions - Banks and securities dealer | 0 | 116 | 299 | 0 | 57 | 0 | 472 | ||||||||
| Institutions - Other institutions | 542 | 0 | 119 | 0 | 0 | 0 | 661 | ||||||||
| Corporates | 0 | 122 | 2 | 0 | 1,530 | 22 | 1,676 | ||||||||
| Retail | 0 | 0 | 0 | 48 | 348 | 0 | 396 | ||||||||
| Other exposures | 0 | 0 | 0 | 0 | 478 | 0 | 478 | ||||||||
| Total | 546 | 238 | 420 | 48 | 2,413 | 22 | 3,687 | ||||||||
| CCR4 – CCR exposures by portfolio and PD scale - IRB models | |||||||||||||||
|
end of 4Q22 |
EAD post- CRM |
Average PD |
Number of obligors (thousands) |
Average LGD |
Average maturity (years) |
RWA |
RWA density |
||||||||
| Sovereigns (CHF million, except where indicated) | |||||||||||||||
| 0.00% to <0.15% | 4,978 | 0.03% | < 0.1 | 46% | 0.5 | 289 | 6% | ||||||||
| 0.15% to <0.25% | 0 | 0.22% | < 0.1 | 58% | 1.0 | 0 | 44% | ||||||||
| 0.25% to <0.50% | 69 | 0.37% | < 0.1 | 41% | 1.0 | 29 | 42% | ||||||||
| Sub-total | 5,047 | 0.03% | < 0.1 | 46% | 0.5 | 318 | 6% | ||||||||
| Institutions - Banks and securities dealer | |||||||||||||||
| 0.00% to <0.15% | 8,448 | 0.06% | 0.4 | 58% | 0.6 | 1,477 | 17% | ||||||||
| 0.15% to <0.25% | 494 | 0.22% | 0.1 | 59% | 0.7 | 247 | 50% | ||||||||
| 0.25% to <0.50% | 61 | 0.37% | < 0.1 | 56% | 0.6 | 36 | 60% | ||||||||
| 0.50% to <0.75% | 121 | 0.64% | < 0.1 | 60% | 0.1 | 83 | 69% | ||||||||
| 0.75% to <2.50% | 192 | 1.84% | 0.1 | 54% | 0.2 | 232 | 121% | ||||||||
| 2.50% to <10.00% | 36 | 5.35% | < 0.1 | 53% | 0.8 | 61 | 171% | ||||||||
| 10.00% to <100.00% | 0 | 26.29% | < 0.1 | 53% | 1.0 | 0 | 289% | ||||||||
| 100.00% (Default) | 0 | 0.00% | < 0.1 | 0% | 0.0 | 0 | 0% | ||||||||
| Sub-total | 9,352 | 0.13% | 0.7 | 58% | 0.6 | 2,136 | 23% | ||||||||
| Institutions - Other institutions | |||||||||||||||
| 0.00% to <0.15% | 62 | 0.04% | < 0.1 | 18% | 1.0 | 3 | 4% | ||||||||
| 0.15% to <0.25% | 0 | 0.24% | < 0.1 | 0% | 1.0 | 0 | 0% | ||||||||
| 0.50% to <0.75% | 0 | 0.72% | < 0.1 | 44% | 1.0 | 0 | 65% | ||||||||
| Sub-total | 62 | 0.04% | < 0.1 | 18% | 1.0 | 3 | 4% | ||||||||
| Corporates - Specialized lending | |||||||||||||||
| 0.25% to <0.50% | 0 | 0.37% | < 0.1 | 50% | 1.0 | 0 | 52% | ||||||||
| 0.75% to <2.50% | – | 0.90% | < 0.1 | 50% | 1.0 | 0 | 81% | ||||||||
| 2.50% to <10.00% | 0 | 3.34% | < 0.1 | 50% | 1.0 | 0 | 131% | ||||||||
| Sub-total | 0 | 0.81% | < 0.1 | 50% | 1.0 | 0 | 76% | ||||||||
| CCR4 – CCR exposures by portfolio and PD scale - IRB models (continued) | |||||||||||||||
|
end of 4Q22 |
EAD post- CRM |
Average PD |
Number obligors (thousands) |
Average LGD |
Average maturity (years) |
RWA |
RWA density |
||||||||
| Corporates without specialized lending (CHF million, except where indicated) | |||||||||||||||
| 0.00% to <0.15% | 14,758 | 0.05% | 3.9 | 48% | 0.4 | 1,689 | 11% | ||||||||
| 0.15% to <0.25% | 2,087 | 0.22% | 0.4 | 45% | 1.0 | 725 | 35% | ||||||||
| 0.25% to <0.50% | 613 | 0.36% | 0.3 | 48% | 1.0 | 343 | 56% | ||||||||
| 0.50% to <0.75% | 211 | 0.63% | 0.2 | 48% | 0.9 | 145 | 69% | ||||||||
| 0.75% to <2.50% | 600 | 1.63% | 0.5 | 69% | 0.6 | 935 | 156% | ||||||||
| 2.50% to <10.00% | 283 | 5.69% | 0.3 | 63% | 0.9 | 893 | 316% | ||||||||
| 10.00% to <100.00% | 2 | 28.23% | < 0.1 | 90% | 1.0 | 14 | 892% | ||||||||
| 100.00% (Default) | 4 | 100.00% | < 0.1 | 46% | 1.0 | 4 | 106% | ||||||||
| Sub-total | 18,558 | 0.25% | 5.5 | 48% | 0.5 | 4,748 | 26% | ||||||||
| Other retail | |||||||||||||||
| 0.00% to <0.15% | 2,437 | 0.04% | 4.8 | 62% | 1.0 | 186 | 8% | ||||||||
| 0.15% to <0.25% | 162 | 0.19% | 0.4 | 47% | 1.0 | 32 | 20% | ||||||||
| 0.25% to <0.50% | 49 | 0.36% | 0.2 | 48% | 1.0 | 15 | 30% | ||||||||
| 0.50% to <0.75% | 4 | 0.63% | < 0.1 | 32% | 1.0 | 1 | 28% | ||||||||
| 0.75% to <2.50% | 68 | 1.36% | 0.1 | 32% | 1.0 | 24 | 35% | ||||||||
| 2.50% to <10.00% | 4 | 4.04% | < 0.1 | 23% | 1.0 | 1 | 35% | ||||||||
| 10.00% to <100.00% | 1 | 16.66% | < 0.1 | 28% | 1.0 | 0 | 56% | ||||||||
| 100.00% (Default) | 0 | 100.00% | < 0.1 | 53% | 1.0 | 0 | 100% | ||||||||
| Sub-total | 2,725 | 0.10% | 5.5 | 60% | 1.0 | 259 | 10% | ||||||||
| Total (all portfolios) | |||||||||||||||
| 0.00% to <0.15% | 30,683 | 0.05% | 9.2 | 51% | 0.5 | 3,644 | 12% | ||||||||
| 0.15% to <0.25% | 2,743 | 0.22% | 0.9 | 47% | 0.9 | 1,003 | 37% | ||||||||
| 0.25% to <0.50% | 793 | 0.37% | 0.5 | 48% | 1.0 | 424 | 53% | ||||||||
| 0.50% to <0.75% | 336 | 0.63% | 0.2 | 52% | 0.6 | 229 | 68% | ||||||||
| 0.75% to <2.50% | 859 | 1.66% | 0.6 | 63% | 0.5 | 1,191 | 139% | ||||||||
| 2.50% to <10.00% | 322 | 5.63% | 0.3 | 61% | 0.9 | 955 | 297% | ||||||||
| 10.00% to <100.00% | 2 | 24.87% | < 0.1 | 71% | 1.0 | 15 | 624% | ||||||||
| 100.00% (Default) | 4 | 100.00% | < 0.1 | 46% | 1.0 | 4 | 106% | ||||||||
| Total (all portfolios) | 35,742 | 0.18% | 11.8 | 51% | 0.6 | 7,465 | 21% | ||||||||
| CCR4 – CCR exposures by portfolio and PD scale - IRB models | |||||||||||||||
|
end of 2Q22 |
EAD post- CRM |
Average PD |
Number of obligors (thousands) |
Average LGD |
Average maturity (years) |
RWA |
RWA density |
||||||||
| Sovereigns (CHF million, except where indicated) | |||||||||||||||
| 0.00% to <0.15% | 6,150 | 0.03% | < 0.1 | 49% | 0.4 | 373 | 6% | ||||||||
| 0.15% to <0.25% | 0 | 0.22% | < 0.1 | 58% | 1.0 | 0 | 44% | ||||||||
| 0.25% to <0.50% | 84 | 0.37% | < 0.1 | 41% | 1.0 | 36 | 42% | ||||||||
| 0.75% to <2.50% | 0 | 1.10% | < 0.1 | 53% | 1.0 | 0 | 95% | ||||||||
| Sub-total | 6,234 | 0.03% | < 0.1 | 49% | 0.4 | 409 | 7% | ||||||||
| Institutions - Banks and securities dealer | |||||||||||||||
| 0.00% to <0.15% | 10,666 | 0.06% | 0.5 | 58% | 0.7 | 1,989 | 19% | ||||||||
| 0.15% to <0.25% | 444 | 0.22% | < 0.1 | 57% | 0.7 | 202 | 46% | ||||||||
| 0.25% to <0.50% | 176 | 0.37% | < 0.1 | 59% | 0.8 | 129 | 73% | ||||||||
| 0.50% to <0.75% | 61 | 0.64% | < 0.1 | 50% | 0.4 | 38 | 63% | ||||||||
| 0.75% to <2.50% | 172 | 1.83% | < 0.1 | 54% | 0.2 | 213 | 124% | ||||||||
| 2.50% to <10.00% | 40 | 5.73% | < 0.1 | 55% | 0.9 | 74 | 183% | ||||||||
| 10.00% to <100.00% | 1 | 27.63% | < 0.1 | 53% | 1.0 | 4 | 295% | ||||||||
| Sub-total | 11,560 | 0.12% | 0.8 | 58% | 0.7 | 2,649 | 23% | ||||||||
| Institutions - Other institutions | |||||||||||||||
| 0.00% to <0.15% | 65 | 0.04% | < 0.1 | 16% | 1.0 | 3 | 4% | ||||||||
| 0.15% to <0.25% | 0 | 0.24% | < 0.1 | 0% | 1.0 | 0 | 0% | ||||||||
| 0.50% to <0.75% | 0 | 0.72% | < 0.1 | 44% | 1.0 | 0 | 65% | ||||||||
| Sub-total | 65 | 0.04% | < 0.1 | 16% | 1.0 | 3 | 4% | ||||||||
| Corporates - Specialized lending | |||||||||||||||
| 0.25% to <0.50% | 0 | 0.37% | < 0.1 | 50% | 1.0 | 0 | 52% | ||||||||
| 0.50% to <0.75% | 0 | 0.58% | < 0.1 | 50% | 1.0 | 0 | 66% | ||||||||
| 0.75% to <2.50% | 0 | 1.72% | < 0.1 | 50% | 1.0 | 0 | 99% | ||||||||
| 2.50% to <10.00% | 0 | 3.37% | < 0.1 | 50% | 1.0 | 1 | 135% | ||||||||
| Sub-total | 0 | 2.49% | < 0.1 | 50% | 1.0 | 1 | 112% | ||||||||
| CCR4 – CCR exposures by portfolio and PD scale - IRB models (continued) | |||||||||||||||
|
end of 2Q22 |
EAD post- CRM |
Average PD |
Number of obligors (thousands) |
Average LGD |
Average maturity (years) |
RWA |
RWA density |
||||||||
| Corporates without specialized lending (CHF million, except where indicated) | |||||||||||||||
| 0.00% to <0.15% | 21,452 | 0.05% | 5.7 | 47% | 0.5 | 2,533 | 12% | ||||||||
| 0.15% to <0.25% | 2,360 | 0.22% | 0.5 | 50% | 0.7 | 888 | 38% | ||||||||
| 0.25% to <0.50% | 926 | 0.37% | 0.6 | 51% | 1.0 | 552 | 60% | ||||||||
| 0.50% to <0.75% | 243 | 0.63% | 0.2 | 55% | 0.8 | 195 | 80% | ||||||||
| 0.75% to <2.50% | 944 | 1.57% | 0.6 | 70% | 0.6 | 1,501 | 159% | ||||||||
| 2.50% to <10.00% | 459 | 5.72% | 0.4 | 63% | 0.8 | 1,369 | 298% | ||||||||
| 10.00% to <100.00% | 1 | 16.44% | < 0.1 | 32% | 1.0 | 1 | 159% | ||||||||
| 100.00% (Default) | 6 | 100.00% | < 0.1 | 62% | 1.0 | 7 | 106% | ||||||||
| Sub-total | 26,391 | 0.26% | 7.9 | 49% | 0.6 | 7,046 | 27% | ||||||||
| Other retail | |||||||||||||||
| 0.00% to <0.15% | 3,851 | 0.04% | 5.8 | 63% | 1.0 | 281 | 7% | ||||||||
| 0.15% to <0.25% | 279 | 0.20% | 0.5 | 53% | 1.0 | 63 | 23% | ||||||||
| 0.25% to <0.50% | 125 | 0.36% | 0.2 | 42% | 1.0 | 34 | 27% | ||||||||
| 0.50% to <0.75% | 48 | 0.58% | < 0.1 | 62% | 1.0 | 25 | 52% | ||||||||
| 0.75% to <2.50% | 39 | 1.26% | < 0.1 | 30% | 1.0 | 14 | 36% | ||||||||
| 2.50% to <10.00% | 6 | 5.53% | < 0.1 | 48% | 1.0 | 4 | 75% | ||||||||
| 10.00% to <100.00% | 0 | 19.08% | < 0.1 | 63% | 1.0 | 1 | 145% | ||||||||
| 100.00% (Default) | 0 | 100.00% | < 0.1 | 53% | 1.0 | 0 | 106% | ||||||||
| Sub-total | 4,348 | 0.08% | 6.6 | 62% | 1.0 | 422 | 10% | ||||||||
| Total (all portfolios) | |||||||||||||||
| 0.00% to <0.15% | 42,184 | 0.05% | 12.0 | 51% | 0.6 | 5,179 | 12% | ||||||||
| 0.15% to <0.25% | 3,083 | 0.21% | 1.0 | 51% | 0.7 | 1,153 | 37% | ||||||||
| 0.25% to <0.50% | 1,311 | 0.37% | 0.9 | 51% | 0.9 | 751 | 57% | ||||||||
| 0.50% to <0.75% | 353 | 0.62% | 0.3 | 55% | 0.8 | 259 | 73% | ||||||||
| 0.75% to <2.50% | 1,155 | 1.59% | 0.8 | 67% | 0.6 | 1,728 | 150% | ||||||||
| 2.50% to <10.00% | 505 | 5.72% | 0.5 | 62% | 0.8 | 1,447 | 286% | ||||||||
| 10.00% to <100.00% | 2 | 22.66% | < 0.1 | 48% | 1.0 | 5 | 227% | ||||||||
| 100.00% (Default) | 6 | 100.00% | < 0.1 | 62% | 1.0 | 7 | 106% | ||||||||
| Total (all portfolios) | 48,599 | 0.18% | 15.4 | 52% | 0.6 | 10,529 | 22% | ||||||||
| CCR5 – Composition of collateral for CCR exposure | |||||||||||||||||
| Collateral used in derivative transactions | Collateral used in SFTs | ||||||||||||||||
|
Fair value of collateral received |
Fair value of posted collateral |
Fair value of collateral received |
Fair value of posted collateral |
||||||||||||||
|
end of |
Segregated |
Un- segregated |
Total |
Segregated |
Un- segregated |
Total |
|
|
|||||||||
| 4Q22 (CHF million) | |||||||||||||||||
| Cash - domestic currency | 0 | 3,086 | 3,086 | 0 | 1,902 | 1,902 | 12 | 3,956 | |||||||||
| Cash - other currencies | 0 | 17,485 | 17,485 | 141 | 22,226 | 22,367 | 33,821 | 68,443 | |||||||||
| Domestic sovereign debt | 0 | 129 | 129 | 0 | 0 | 0 | 1,797 | 54 | |||||||||
| Other sovereign debt | 3,034 | 6,424 | 9,458 | 9,812 | 3,120 | 12,932 | 78,636 | 40,541 | |||||||||
| Government agency debt | 10 | 19 | 29 | 0 | 7 | 7 | 700 | 2,160 | |||||||||
| Corporate bonds | 432 | 9,142 | 9,574 | 8 | 311 | 319 | 21,118 | 12,553 | |||||||||
| Equity securities | 349 | 12,074 | 12,423 | 1,072 | 628 | 1,700 | 6,522 | 1 | 12,006 | 1 | |||||||
| Other collateral | 0 | 4,538 | 4,538 | 0 | 2 | 2 | 22,233 | 13,559 | |||||||||
| Total | 3,825 | 52,897 | 56,722 | 11,033 | 28,196 | 39,229 | 164,839 | 153,272 | |||||||||
| 2Q22 (CHF million) 2 | |||||||||||||||||
| Cash - domestic currency | 0 | 6,364 | 6,364 | 0 | 1,764 | 1,764 | 62 | 6,729 | |||||||||
| Cash - other currencies | 104 | 34,649 | 34,753 | 551 | 34,838 | 35,389 | 41,929 | 113,413 | |||||||||
| Domestic sovereign debt | 0 | 93 | 93 | 0 | 0 | 0 | 1,444 | 85 | |||||||||
| Other sovereign debt | 4,332 | 8,112 | 12,444 | 12,384 | 3,267 | 15,651 | 127,057 | 51,777 | |||||||||
| Government agency debt | 8 | 24 | 32 | 0 | 15 | 15 | 1,366 | 2,723 | |||||||||
| Corporate bonds | 114 | 9,815 | 9,929 | 0 | 418 | 418 | 32,303 | 19,328 | |||||||||
| Equity securities | 128 | 14,796 | 14,924 | 2,255 | 689 | 2,944 | 15,999 | 1 | 21,384 | 1 | |||||||
| Other collateral | 3 | 4,635 | 4,638 | 0 | 18 | 18 | 32,297 | 11,103 | |||||||||
| Total | 4,689 | 78,488 | 83,177 | 15,190 | 41,009 | 56,199 | 252,457 | 226,542 | |||||||||
|
1
The equity prime brokerage business consists of clients acquiring long and short positions in the market in a Credit Suisse account along with the appropriate margins. In the case of a counterparty default, Credit Suisse gains control over the long positions and are free to sell them to cover the exposure and the long positions are thus considered as "collateral received". On the other hand, the short positions are considered as "trades" and are not reported in the disclosure as "posted collateral".
|
|||||||||||||||||
|
2
Reflects an update of the dataset, primarily related to the derivative collateral balances for both segregated and unsegregated balances. Prior period has been revised.
|
|||||||||||||||||
| CCR6 – Credit derivatives exposures | |||||||||
| 4Q22 | 2Q22 | ||||||||
|
end of |
Protection bought |
Protection sold |
Protection bought |
Protection sold |
|||||
| Notionals (CHF billion) | |||||||||
| Single-name CDS | 84.9 | 76.0 | 89.6 | 80.6 | |||||
| Index CDS | 90.2 | 83.2 | 113.2 | 100.2 | |||||
| Total return swaps | 4.5 | 1.4 | 7.2 | 4.9 | |||||
| Other credit derivatives | 9.0 | 2.9 | 22.4 | 17.4 | |||||
| of which credit default swaptions | 7.3 | 1.2 | 20.0 | 11.5 | |||||
| of which other credit instruments | 1.7 | 1.7 | 2.4 | 5.9 | |||||
| Total notionals | 188.6 | 163.5 | 232.4 | 203.1 | |||||
| Fair values (CHF billion) | |||||||||
| Positive fair value (asset) | 2.5 | 0.7 | 2.7 | 0.7 | |||||
| Negative fair value (liability) | 2.0 | 1.4 | 1.9 | 2.4 | |||||
|
Includes the client leg of cleared credit derivatives.
|
|||||||||
| CCR7 – Risk-weighted assets flow statements of CCR exposures under IMM | |||
| 4Q22 | |||
| CHF million | |||
| Risk-weighted assets at beginning of period | 9,203 | ||
| Asset size | (1,415) | ||
| Credit quality of counterparties | 66 | ||
| Model and parameter updates | 4 | ||
| Foreign exchange impact | (340) | ||
| Risk-weighted assets at end of period | 7,518 | ||
| CCR8 – Exposures to central counterparties | |||||||||
| 4Q22 | 2Q22 | ||||||||
|
end of |
EAD (post-CRM) |
RWA |
EAD (post-CRM) |
RWA |
|||||
| CHF million | |||||||||
| QCCPs | |||||||||
| Exposures for trades at QCCPs | 12,278 | 267 | 15,787 | 334 | |||||
| of which OTC derivatives | 7,306 | 168 | 8,627 | 191 | |||||
| of which exchange-traded derivatives | 3,917 | 78 | 5,956 | 119 | |||||
| of which SFTs | 1,055 | 21 | 1,204 | 24 | |||||
| Segregated initial margin | 4,549 | – | 5,532 | – | |||||
| Pre-funded default fund contributions | 2,422 | 593 | 3,024 | 856 | |||||
| Total exposures to QCCPs | – | 860 | – | 1,190 | |||||
| Non-QCCPs | |||||||||
| Pre-funded default fund contributions | 0 | 4 | 0 | 0 | |||||
| Total exposures to non-QCCPs | – | 4 | – | 0 | |||||
| SEC1 – Securitization exposures in the banking book | |||||||||||||||||||
| Bank acts as originator | Bank acts as sponsor | Bank acts as investor | |||||||||||||||||
| end of | Traditional | Synthetic | Total | Traditional | Synthetic | Total | Traditional | Synthetic | Total | ||||||||||
| 4Q22 (CHF million) | |||||||||||||||||||
| Residential mortgages | 10 | 440 | 450 | 564 | 0 | 564 | 2,000 | 0 | 2,000 | ||||||||||
| Credit cards | 0 | 0 | 0 | 696 | 0 | 696 | 407 | 0 | 407 | ||||||||||
| Other retail exposures | 396 | 66 | 462 | 3,294 | 0 | 3,294 | 3,027 | 0 | 3,027 | ||||||||||
| Re-securitization | 0 | 0 | 0 | 0 | 0 | 0 | 141 | 0 | 141 | ||||||||||
| Total retail | 406 | 506 | 912 | 4,554 | 0 | 4,554 | 5,575 | 0 | 5,575 | ||||||||||
| Loans to corporates | 0 | 29,889 | 29,889 | 956 | 0 | 956 | 3,436 | 0 | 3,436 | ||||||||||
| Commercial mortgages | 2 | 10,258 | 10,260 | 226 | 0 | 226 | 792 | 0 | 792 | ||||||||||
| Lease and receivables | 0 | 0 | 0 | 1,123 | 0 | 1,123 | 4,470 | 0 | 4,470 | ||||||||||
| Other wholesale | 699 | 110 | 809 | 1,114 | 0 | 1,114 | 926 | 0 | 926 | ||||||||||
| Total wholesale | 701 | 40,257 | 40,958 | 3,419 | 0 | 3,419 | 9,624 | 0 | 9,624 | ||||||||||
| Total | 1,107 | 40,763 | 41,870 | 7,973 | 0 | 7,973 | 15,199 | 0 | 15,199 | ||||||||||
| 2Q22 (CHF million) | |||||||||||||||||||
| Residential mortgages | 108 | 457 | 565 | 0 | 0 | 0 | 2,570 | 0 | 2,570 | ||||||||||
| Credit cards | 0 | 0 | 0 | 628 | 0 | 628 | 616 | 0 | 616 | ||||||||||
| Other retail exposures | 335 | 43 | 378 | 3,044 | 0 | 3,044 | 2,692 | 0 | 2,692 | ||||||||||
| Re-securitization | 0 | 0 | 0 | 0 | 0 | 0 | 48 | 0 | 48 | ||||||||||
| Total retail | 443 | 500 | 943 | 3,672 | 0 | 3,672 | 5,926 | 0 | 5,926 | ||||||||||
| Loans to corporates | 0 | 29,860 | 29,860 | 1,022 | 0 | 1,022 | 3,138 | 0 | 3,138 | ||||||||||
| Commercial mortgages | 11 | 10,484 | 10,495 | 0 | 0 | 0 | 888 | 0 | 888 | ||||||||||
| Lease and receivables | 0 | 0 | 0 | 2,102 | 0 | 2,102 | 2,209 | 0 | 2,209 | ||||||||||
| Other wholesale | 745 | 125 | 870 | 870 | 0 | 870 | 1,224 | 0 | 1,224 | ||||||||||
| Total wholesale | 756 | 40,469 | 41,225 | 3,994 | 0 | 3,994 | 7,459 | 0 | 7,459 | ||||||||||
| Total | 1,199 | 40,969 | 42,168 | 7,666 | 0 | 7,666 | 13,385 | 0 | 13,385 | ||||||||||
| SEC2 – Securitization exposures in the trading book | |||||||||||||||||||
| Bank acts as originator | Bank acts as sponsor | Bank acts as investor | |||||||||||||||||
| end of | Traditional | Synthetic | Total | Traditional | Synthetic | Total | Traditional | Synthetic | Total | ||||||||||
| 4Q22 (CHF million) | |||||||||||||||||||
| Residential mortgages | 9 | 0 | 9 | 0 | 0 | 0 | 842 | 0 | 842 | ||||||||||
| Other retail exposures | 0 | 0 | 0 | 0 | 0 | 0 | 312 | 0 | 312 | ||||||||||
| Re-securitization | 0 | 12 | 12 | 0 | 0 | 0 | 189 | 48 | 237 | ||||||||||
| Total retail | 9 | 12 | 21 | 0 | 0 | 0 | 1,343 | 48 | 1,391 | ||||||||||
| Loans to corporates | 0 | 0 | 0 | 0 | 0 | 0 | 317 | 0 | 317 | ||||||||||
| Commercial mortgages | 96 | 0 | 96 | 0 | 0 | 0 | 426 | 0 | 426 | ||||||||||
| Re-securitization | 0 | 0 | 0 | 0 | 0 | 0 | 0 | 18 | 18 | ||||||||||
| Total wholesale | 96 | 0 | 96 | 0 | 0 | 0 | 743 | 18 | 761 | ||||||||||
| Total | 105 | 12 | 117 | 0 | 0 | 0 | 2,086 | 66 | 2,152 | ||||||||||
| 2Q22 (CHF million) | |||||||||||||||||||
| Residential mortgages | 53 | 0 | 53 | 0 | 0 | 0 | 1,135 | 0 | 1,135 | ||||||||||
| Other retail exposures | 0 | 0 | 0 | 0 | 0 | 0 | 256 | 0 | 256 | ||||||||||
| Re-securitization | 0 | 10 | 10 | 0 | 0 | 0 | 200 | 57 | 257 | ||||||||||
| Total retail | 53 | 10 | 63 | 0 | 0 | 0 | 1,591 | 57 | 1,648 | ||||||||||
| Loans to corporates | 0 | 0 | 0 | 0 | 0 | 0 | 387 | 0 | 387 | ||||||||||
| Commercial mortgages | 100 | 0 | 100 | 0 | 0 | 0 | 693 | 0 | 693 | ||||||||||
| Re-securitization | 0 | 0 | 0 | 0 | 0 | 0 | 0 | 16 | 16 | ||||||||||
| Total wholesale | 100 | 0 | 100 | 0 | 0 | 0 | 1,080 | 16 | 1,096 | ||||||||||
| Total | 153 | 10 | 163 | 0 | 0 | 0 | 2,671 | 73 | 2,744 | ||||||||||
| SEC3 – Securitization exposures in the banking book and associated regulatory capital requirements - Credit Suisse acting as originator or as sponsor | |||||||||||||||||||||||||||||||||||
| Exposure value (by RW band) | Exposure value (by regulatory approach) | RWA (by regulatory approach) | Capital charge after cap | ||||||||||||||||||||||||||||||||
|
end of |
<=20% RW |
>20% to 50% RW |
>50% to 100% RW |
>100% to <1250% RW |
1250% RW |
SEC-IRBA |
SEC-ERBA |
SEC-SA |
1250% RW |
SEC-IRBA |
SEC-ERBA |
SEC-SA |
1250% RW |
SEC-IRBA |
SEC-ERBA |
SEC-SA |
1250% RW |
||||||||||||||||||
| 4Q22 (CHF million) | |||||||||||||||||||||||||||||||||||
| Total exposures | 45,617 | 3,593 | 345 | 274 | 14 | 39,985 | 513 | 9,331 | 14 | 7,157 | 847 | 3,040 | 174 | 575 | 43 | 176 | 14 | ||||||||||||||||||
| Traditional securitization | 6,448 | 2,057 | 345 | 219 | 11 | 742 | 513 | 7,814 | 11 | 310 | 847 | 2,560 | 138 | 25 | 43 | 138 | 11 | ||||||||||||||||||
| of which securitization | 6,448 | 2,057 | 345 | 219 | 11 | 742 | 513 | 7,814 | 11 | 310 | 847 | 2,559 | 138 | 25 | 43 | 138 | 11 | ||||||||||||||||||
| of which retail underlying | 4,167 | 653 | 35 | 94 | 11 | 0 | 251 | 4,698 | 11 | 0 | 421 | 1,522 | 138 | 0 | 9 | 78 | 11 | ||||||||||||||||||
| of which wholesale | 2,281 | 1,404 | 310 | 125 | 0 | 742 | 262 | 3,116 | 0 | 310 | 426 | 1,037 | 0 | 25 | 34 | 60 | 0 | ||||||||||||||||||
| of which re-securitization | 0 | 0 | 0 | 0 | 0 | 0 | 0 | 0 | 0 | 0 | 0 | 1 | 0 | 0 | 0 | 0 | 0 | ||||||||||||||||||
| of which senior | 0 | 0 | 0 | 0 | 0 | 0 | 0 | 0 | 0 | 0 | 0 | 1 | 0 | 0 | 0 | 0 | 0 | ||||||||||||||||||
| Synthetic securitization | 39,169 | 1,536 | 0 | 55 | 3 | 39,243 | 0 | 1,517 | 3 | 6,847 | 0 | 480 | 36 | 550 | 0 | 38 | 3 | ||||||||||||||||||
| of which securitization | 39,169 | 1,536 | 0 | 55 | 3 | 39,243 | 0 | 1,517 | 3 | 6,847 | 0 | 480 | 36 | 550 | 0 | 38 | 3 | ||||||||||||||||||
| of which retail underlying | 505 | 0 | 0 | 0 | 1 | 505 | 0 | 0 | 1 | 86 | 0 | 0 | 10 | 7 | 0 | 0 | 1 | ||||||||||||||||||
| of which wholesale | 38,664 | 1,536 | 0 | 55 | 2 | 38,738 | 0 | 1,517 | 2 | 6,761 | 0 | 480 | 26 | 543 | 0 | 38 | 2 | ||||||||||||||||||
| 2Q22 (CHF million) | |||||||||||||||||||||||||||||||||||
| Total exposures | 44,682 | 4,116 | 770 | 253 | 13 | 40,717 | 589 | 8,515 | 13 | 7,382 | 1,002 | 2,050 | 155 | 592 | 52 | 159 | 13 | ||||||||||||||||||
| Traditional securitization | 5,800 | 2,089 | 770 | 198 | 8 | 745 | 589 | 7,523 | 8 | 306 | 1,002 | 1,749 | 101 | 24 | 52 | 135 | 8 | ||||||||||||||||||
| of which securitization | 5,800 | 2,089 | 770 | 198 | 8 | 745 | 589 | 7,523 | 8 | 306 | 1,002 | 1,749 | 101 | 24 | 52 | 135 | 8 | ||||||||||||||||||
| of which retail underlying | 3,525 | 362 | 158 | 62 | 8 | 0 | 323 | 3,784 | 8 | 0 | 545 | 667 | 101 | 0 | 15 | 53 | 8 | ||||||||||||||||||
| of which wholesale | 2,275 | 1,727 | 612 | 136 | 0 | 745 | 266 | 3,739 | 0 | 306 | 457 | 1,082 | 0 | 24 | 37 | 82 | 0 | ||||||||||||||||||
| Synthetic securitization | 38,882 | 2,027 | 0 | 55 | 5 | 39,972 | 0 | 992 | 5 | 7,076 | 0 | 301 | 54 | 568 | 0 | 24 | 5 | ||||||||||||||||||
| of which securitization | 38,882 | 2,027 | 0 | 55 | 5 | 39,972 | 0 | 992 | 5 | 7,076 | 0 | 301 | 54 | 568 | 0 | 24 | 5 | ||||||||||||||||||
| of which retail underlying | 499 | 0 | 0 | 0 | 1 | 499 | 0 | 0 | 1 | 84 | 0 | 0 | 10 | 7 | 0 | 0 | 1 | ||||||||||||||||||
| of which wholesale | 38,383 | 2,027 | 0 | 55 | 4 | 39,473 | 0 | 992 | 4 | 6,992 | 0 | 301 | 44 | 561 | 0 | 24 | 4 | ||||||||||||||||||
| SEC4 – Securitization exposures in the banking book and associated regulatory capital requirements - Credit Suisse acting as investor | |||||||||||||||||||||||||||||||||||
| Exposure value (by RW band) | Exposure value (by regulatory approach) | RWA (by regulatory approach) | Capital charge after cap | ||||||||||||||||||||||||||||||||
|
end of |
<=20% RW |
>20% to 50% RW |
>50% to 100% RW |
>100% to <1250% RW |
1250% RW |
SEC-IRBA |
SEC-ERBA |
SEC-SA |
1250% RW |
SEC-IRBA |
SEC-ERBA |
SEC-SA |
1250% RW |
SEC-IRBA |
SEC-ERBA |
SEC-SA |
1250% RW |
||||||||||||||||||
| 4Q22 (CHF million) | |||||||||||||||||||||||||||||||||||
| Total exposures | 13,404 | 1,122 | 496 | 161 | 16 | 1,427 | 566 | 13,190 | 16 | 214 | 215 | 3,175 | 194 | 17 | 17 | 205 | 16 | ||||||||||||||||||
| Traditional securitization | 13,404 | 1,122 | 496 | 161 | 16 | 1,427 | 566 | 13,190 | 16 | 214 | 215 | 3,175 | 194 | 17 | 17 | 205 | 16 | ||||||||||||||||||
| of which securitization | 13,404 | 1,122 | 496 | 22 | 14 | 1,427 | 566 | 13,051 | 14 | 214 | 215 | 3,021 | 174 | 17 | 17 | 193 | 14 | ||||||||||||||||||
| of which retail underlying | 4,668 | 742 | 5 | 16 | 3 | 0 | 199 | 5,232 | 3 | 0 | 73 | 1,223 | 37 | 0 | 6 | 75 | 3 | ||||||||||||||||||
| of which wholesale | 8,736 | 380 | 491 | 6 | 11 | 1,427 | 367 | 7,819 | 11 | 214 | 142 | 1,798 | 137 | 17 | 11 | 118 | 11 | ||||||||||||||||||
| of which re-securitization | 0 | 0 | 0 | 139 | 2 | 0 | 0 | 139 | 2 | 0 | 0 | 154 | 20 | 0 | 0 | 12 | 2 | ||||||||||||||||||
| of which senior | 0 | 0 | 0 | 139 | 2 | 0 | 0 | 139 | 2 | 0 | 0 | 154 | 20 | 0 | 0 | 12 | 2 | ||||||||||||||||||
| 2Q22 (CHF million) | |||||||||||||||||||||||||||||||||||
| Total exposures | 10,230 | 2,707 | 205 | 229 | 14 | 2,374 | 567 | 10,430 | 14 | 356 | 222 | 2,377 | 169 | 28 | 17 | 183 | 14 | ||||||||||||||||||
| Traditional securitization | 10,230 | 2,707 | 205 | 229 | 14 | 2,374 | 567 | 10,430 | 14 | 356 | 222 | 2,377 | 169 | 28 | 17 | 183 | 14 | ||||||||||||||||||
| of which securitization | 10,230 | 2,707 | 205 | 183 | 12 | 2,374 | 567 | 10,384 | 12 | 356 | 222 | 2,325 | 146 | 28 | 17 | 179 | 12 | ||||||||||||||||||
| of which retail underlying | 3,691 | 2,124 | 22 | 41 | 0 | 0 | 204 | 5,674 | 0 | 0 | 79 | 1,263 | 0 | 0 | 6 | 100 | 0 | ||||||||||||||||||
| of which wholesale | 6,539 | 583 | 183 | 142 | 12 | 2,374 | 363 | 4,710 | 12 | 356 | 143 | 1,062 | 146 | 28 | 11 | 79 | 12 | ||||||||||||||||||
| of which re-securitization | 0 | 0 | 0 | 46 | 2 | 0 | 0 | 46 | 2 | 0 | 0 | 52 | 23 | 0 | 0 | 4 | 2 | ||||||||||||||||||
| of which senior | 0 | 0 | 0 | 46 | 2 | 0 | 0 | 46 | 2 | 0 | 0 | 52 | 23 | 0 | 0 | 4 | 2 | ||||||||||||||||||
| MR1 – Market risk under standardized approach | |||||
| end of | 4Q22 | 2Q22 | |||
| Risk-weighted assets (CHF million) | |||||
| Securitization | 1,802 | 1,612 | |||
| Total risk-weighted assets | 1,802 | 1,612 | |||
| MRB - Internal model approach - overview | |||||||
| Regulatory VaR | Stressed VaR | IRC | |||||
| Method applied |
Historical simulation |
Historical simulation |
Portfolio loss simulation |
||||
| Data set | 2 years | 1 Year | – | ||||
| Holding period | 10 days (overlapping) | 10 days (overlapping) | One-year liquidity horizon | ||||
| Confidence level | 99% equivalent | 99% equivalent | 99.9% | ||||
| Population |
Regulatory trading book (where applicable, foreign exchange and commodity risks in the regulatory banking book are added) |
Regulatory trading book (where applicable, foreign exchange and commodity risks in the regulatory banking book are added) |
Regulatory trading book subject to issuer default and migration risk (excl. securitizations and correlation trades) |
||||
| MRB - IMA - Risk-weighted assets | |||||
| end of 4Q22 | CHF billion | in % | |||
| Risk-weighted assets | |||||
| Regulatory VaR | 3.8 | 29 | |||
| Stressed VaR | 4.5 | 34 | |||
| RNIV | 3.3 | 25 | |||
| IRC | 1.6 | 12 | |||
| Total risk-weighted assets | 13.2 | 100 | |||
| MR2 – Risk-weighted assets flow statements of market risk exposures under an IMA | |||||||||||
|
4Q22 |
Regulatory VaR |
Stressed VaR |
IRC |
Other |
1 |
Total |
|||||
| CHF million | |||||||||||
| Risk-weighted assets at beginning of period | 4,344 | 4,379 | 2,223 | 3,815 | 14,761 | ||||||
| Regulatory adjustment | (587) | (496) | (185) | (483) | (1,751) | ||||||
| Risk-weighted assets at beginning of period (end of day) | 3,757 | 3,883 | 2,038 | 3,332 | 13,010 | ||||||
| Movement in risk levels | (353) | 1,615 | (840) | 263 | 685 | ||||||
| Model and parameter updates | (230) | (21) | 0 | 0 | (251) | ||||||
| Foreign exchange impact | (228) | (239) | (109) | (190) | (766) | ||||||
| Risk-weighted assets at end of period (end of day) | 2,946 | 5,238 | 1,089 | 3,405 | 12,678 | ||||||
| Regulatory adjustment | 900 | (780) | 491 | (66) | 545 | ||||||
| Risk-weighted assets at end of period | 3,846 | 4,458 | 1,580 | 3,339 | 13,223 | ||||||
|
1
Risks not in VaR.
|
|||||||||||
| Definitions of risk-weighted assets movement components related to market risk | |||
| Description | Definition | ||
| RWA as of the end of the previous/current reporting periods | Represents RWA at quarter-end | ||
| Regulatory adjustment | Indicates the difference between RWA and RWA (end of day) at beginning and end of period | ||
| RWA as of the previous/current quarters end (end of day) |
For a given component (e.g., VaR) it refers to the RWA that would be computed if the snapshot quarter end amount of the component determines the quarter end RWA, as opposed to a 60-day average for regulatory |
||
| Movement in risk levels | Represents movements due to position changes | ||
| Model and parameter updates |
Represents movements arising from internally driven or externally mandated updates to models and recalibrations of model parameters specific only to Credit Suisse |
||
| Methodology and policy changes |
Represents movements arising from externally mandated regulatory methodology and policy changes to accounting and exposure classification and treatment policies not specific only to Credit Suisse |
||
| Acquisitions and disposals | Represents changes in book sizes due to acquisitions and disposals of entities | ||
| Foreign exchange impact | Represents changes in exchange rates of the transaction currencies compared to the Swiss franc | ||
| Other | Represents changes that cannot be attributed to any other category | ||
| MR3 – Regulatory VaR, stressed VaR and Incremental Risk Charge | |||||
| in / end of | 2H22 | 1H22 | |||
| CHF million | |||||
| Regulatory VaR (10 day 99%) | |||||
| Maximum value | 143 | 139 | |||
| Average value | 109 | 107 | |||
| Minimum value | 73 | 82 | |||
| Period-end value | 79 | 98 | |||
| Stressed VaR (10 day 99%) | |||||
| Maximum value | 152 | 178 | |||
| Average value | 109 | 122 | |||
| Minimum value | 79 | 101 | |||
| Period-end value | 140 | 114 | |||
| IRC (99.9%) | |||||
| Maximum value | 279 | 188 | |||
| Average value | 155 | 154 | |||
| Minimum value | 82 | 116 | |||
| Period-end value | 87 | 145 | |||
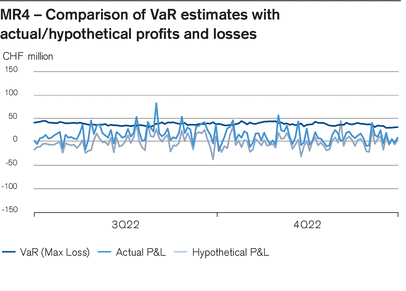
| IRRBBA1 - Quantitative information on the exposure's structure and repricing period | |||||||||||||||||
|
Volume |
1 |
Average repricing period (years) |
2 |
Maximum repricing period for exposures with modelled (not determined) repricing date (years) |
|||||||||||||
|
end of 4Q22 |
Total |
of which CHF |
of which USD |
of which EUR |
Total |
of which CHF |
Total |
of which CHF |
|||||||||
| CHF million, except where indicated | |||||||||||||||||
| Definite repricing date 3 | |||||||||||||||||
| Due from banks | 84,468 | 4,444 | 59,356 | 5,951 | 0.0 | 0.0 | – | – | |||||||||
| Due from customers | 139,335 | 24,198 | 75,398 | 23,854 | 0.8 | 0.9 | – | – | |||||||||
| Money market mortgages | 43,602 | 40,279 | 256 | 188 | 0.0 | 0.0 | – | – | |||||||||
| Fixed-rate mortgages | 98,596 | 95,128 | 866 | 230 | 4.6 | 4.7 | – | – | |||||||||
| Financial investments | 4,739 | 325 | 1,054 | 985 | 2.4 | 0.4 | – | – | |||||||||
| Other receivables | 10 | 0 | 10 | 0 | 0.1 | – | – | – | |||||||||
| Receivables from interest rate derivatives 4 | 1,316,832 | 362,662 | 685,636 | 167,624 | 1.2 | 0.6 | – | – | |||||||||
| Due to banks | (50,657) | (4,774) | (37,108) | (3,126) | 0.1 | 0.1 | – | – | |||||||||
| Customer deposits | (73,966) | (15,963) | (35,087) | (9,422) | 0.1 | 0.2 | – | – | |||||||||
| Cash bonds | (79) | (79) | 0 | 0 | 1.5 | 1.5 | – | – | |||||||||
| Bonds issues and central mortgage institution loans | (119,249) | (18,176) | (65,875) | (27,908) | 4.3 | 7.4 | – | – | |||||||||
| Other payables | (43,973) | (1,967) | (27,397) | (10,099) | 0.1 | 0.1 | – | – | |||||||||
| Payables to interest rate derivatives 4 | (1,313,202) | (422,540) | (655,303) | (137,843) | 0.9 | 0.8 | – | – | |||||||||
| Indefinite repricing date | |||||||||||||||||
| Variable mortgages | 1,107 | 1,107 | 0 | 0 | 0.0 | 0.0 | – | – | |||||||||
| Other receivables on demand | 2,178 | 539 | 1,043 | 515 | 0.0 | 0.0 | – | – | |||||||||
| Payables on demand from personal accounts and current accounts | (111,583) | (65,183) | (25,578) | (15,957) | 1.6 | 2.2 | – | – | |||||||||
| Payables arising from client deposits, terminable but not transferable (savings) | (27,374) | (27,374) | 0 | 0 | 2.5 | 2.5 | – | – | |||||||||
| Total | – | – | – | – | – | – | 10.0 | 10.0 | |||||||||
|
1
Volume figures may differ from the respective accounting values under US GAAP, due to the impact of effective interest rate calculations and the treatment of loan loss provisions.
|
|||||||||||||||||
|
2
The non-maturing deposits' average repricing period has been calculated based on the internal term-replication strategy.
|
|||||||||||||||||
|
3
Additional tier 1 capital is excluded.
|
|||||||||||||||||
|
4
Receivables and payables from interest rate derivatives are shown as gross figures, including intercompany transactions.
|
|||||||||||||||||
| IRRBB1 - Quantitative information on the regulatory ∆EVE and regulatory ∆NII | |||||||||
| ΔEVE | 1 | ΔNII | 2 | ||||||
| end of | 4Q22 | 4Q21 | 4Q22 | 4Q21 | |||||
| Interest rate shock scenarios (CHF million) 3 | |||||||||
| Parallel up | (1,782) | (1,599) | (1,752) | (3,214) | |||||
| Parallel down | 1,923 | 2,015 | 1,835 | 5,354 | |||||
| Steepener shock | 76 | (311) | – | – | |||||
| Flattener shock | (462) | 47 | – | – | |||||
| Rise in short-term interest rates | (1,161) | (672) | – | – | |||||
| Fall in short-term interest rates | 1,177 | 877 | – | – | |||||
| Maximum | (1,782) | (1,599) | (1,752) | (3,214) | |||||
|
1
Reflects changes in the net present value.
|
|||||||||
|
2
Reflects changes in the earnings value.
|
|||||||||
|
3
All scenarios are in line with FINMA circular 2019/2.
|
|||||||||
| IRRBB1 - Tier 1 capital | |||||
| end of | 4Q22 | 4Q21 | |||
| Tier 1 capital (CHF million) | |||||
| Swiss CET1 capital and additional tier 1 capital 1 | 50,026 | 54,372 | |||
|
1
Excludes tier 1 capital, which is used to fulfill gone concern requirements.
|
|||||
| CC1 - Composition of regulatory capital | ||||||
| end of 4Q22 | Amounts | Reference | 1 | |||
| Swiss CET1 capital (CHF million) | ||||||
| 1 | Directly issued qualifying common share (and equivalent for non-joint stock companies) capital plus related stock surplus | 38,775 | 1 | |||
| 2 | Retained earnings | 23,632 | 2 | |||
| 3 | Accumulated other comprehensive income (and other reserves) 2 | (17,278) | 3 | |||
| 6 | CET1 capital before regulatory adjustments | 45,129 | ||||
| 7 | Prudent valuation adjustments | (271) | ||||
| 8 | Goodwill, net of tax | (2,871) | 4 | |||
| 9 | Other intangible assets (excluding mortgage servicing rights), net of tax | (53) | 5 | |||
| 10 | Deferred tax assets that rely on future profitability (excluding temporary differences), net of tax | (141) | 6 | |||
| 11 | Cash flow hedge reserve | 1,189 | ||||
| 12 | Shortfall of provisions to expected losses | (120) | ||||
| 14 | Gains/(losses) due to changes in own credit on fair-valued liabilities | (4,056) | ||||
| 15 | Defined benefit pension plan assets | (3,289) | 7 | |||
| 16 | Investments in own shares | (409) | ||||
| 26b | National specific regulatory adjustments | 182 | ||||
| 28 | Total regulatory adjustments to CET1 capital | (9,839) | ||||
| 29 | CET1 capital | 35,290 | ||||
| 30 | Directly issued qualifying additional tier 1 instruments plus related stock surplus 3 | 14,776 | ||||
| 32 | of which classified as liabilities under applicable accounting standards | 14,776 | 8 | |||
| 36 | Additional tier 1 capital before regulatory adjustments | 14,776 | ||||
| 37 | Investments in own additional tier 1 instruments | (40) | ||||
| 43 | Total regulatory adjustments to additional tier 1 capital | (40) | ||||
| 44 | Additional tier 1 capital | 14,736 | ||||
| Swiss tier 1 capital (CHF million) | ||||||
| 45 | Tier 1 capital | 50,026 | ||||
| Swiss eligible capital (CHF million) | ||||||
| 59 | Total eligible capital | 50,026 | ||||
|
1
Refer to the balance sheet under regulatory scope of consolidation in the table "CC2 - Reconciliation of regulatory capital to balance sheet". Only material items are referenced to the balance sheet.
|
||||||
|
2
Includes treasury shares.
|
||||||
|
3
Consists of high-trigger and low-trigger capital instruments. Of this amount, CHF 10.5 billion consists of capital instruments with a capital ratio write-down trigger of 7% and CHF 4.2 billion consists of capital instruments with a capital ratio write-down trigger of 5.125%.
|
||||||
| CC1 - Composition of regulatory capital (continued) | ||||||
| end of 4Q22 | Amounts | Reference | 1 | |||
| Swiss risk-weighted assets (CHF million) | ||||||
| 60 | Risk-weighted assets | 250,963 | ||||
| Swiss risk-based capital ratios as a percentage of risk-weighted assets (%) | ||||||
| 61 | CET1 capital ratio | 14.1 | ||||
| 62 | Tier 1 capital ratio | 19.9 | ||||
| 63 | Total capital ratio | 19.9 | ||||
| BIS CET1 buffer requirements (%) 2 | ||||||
| 64 | Total BIS CET buffer requirement | 3.580 | ||||
| 65 | of which capital conservation buffer | 2.5 | ||||
| 66 | of which extended countercyclical buffer | 0.080 | ||||
| 67 | of which progressive buffer for G-SIB and/or D-SIB | 1.0 | ||||
| 68 | CET1 capital ratio available after meeting the bank's minimum capital requirements 3 | 9.6 | ||||
| Amounts below the thresholds for deduction (before risk weighting) (CHF million) | ||||||
| 72 | Non-significant investments in the capital and other TLAC liabilities of other financial entities | 1,612 | ||||
| 73 | Significant investments in the common stock of financial entities | 2,151 | ||||
| 74 | Mortgage servicing rights, net of tax | 368 | ||||
| 75 | Deferred tax assets arising from temporary differences, net of tax | 392 | ||||
| Applicable caps on the inclusion of provisions in tier 2 (CHF million) | ||||||
| 77 | Cap on inclusion of provisions in tier 2 under standardized approach | 297 | ||||
| 79 | Cap for inclusion of provisions in tier 2 under internal ratings-based approach | 606 | ||||
|
1
Refer to the balance sheet under regulatory scope of consolidation in the table "CC2 - Reconciliation of regulatory capital to balance sheet". Only material items are referenced to the balance sheet.
|
||||||
|
2
CET1 buffer requirements are based on BIS requirements as a percentage of Swiss risk-weighted assets.
|
||||||
|
3
Reflects the CET1 ratio that is available for meeting buffer requirements. Calculated as the CET1 ratio less the BIS CET1 ratio minimum requirement of 4.5% and after considering, where applicable, CET1 capital that was used to meet tier 1 and/or total capital ratio requirements under Pillar 1.
|
||||||
| PV1 – Prudent valuation adjustments | |||||||||||||||||
|
end of |
Equity |
Interest rates |
FX |
Credit |
Commodities |
Total |
of which in the trading book |
of which in the banking book |
|||||||||
| 4Q22 (CHF million) | |||||||||||||||||
| Closeout uncertainty | 53 | 116 | 7 | 85 | 0 | 261 | 202 | 59 | |||||||||
| of which concentration | 53 | 116 | 7 | 85 | 0 | 261 | 202 | 59 | |||||||||
| Model risk | 0 | 0 | 0 | 10 | 0 | 10 | 10 | 0 | |||||||||
| Total adjustments | 53 | 116 | 7 | 95 | 0 | 271 | 212 | 59 | |||||||||
| 4Q21 (CHF million) | |||||||||||||||||
| Closeout uncertainty | 84 | 0 | 0 | 0 | 0 | 84 | 30 | 54 | |||||||||
| of which concentration | 84 | 0 | 0 | 0 | 0 | 84 | 30 | 54 | |||||||||
| Total adjustments | 84 | 0 | 0 | 0 | 0 | 84 | 30 | 54 | |||||||||
| CC2 - Reconciliation of regulatory capital to balance sheet | |||||||
|
end of 4Q22 |
Financial statements |
Regulatory scope of consolidation |
Reference to composition of capital |
||||
| Assets (CHF million) | |||||||
| Cash and due from banks | 68,478 | 68,293 | |||||
| Interest-bearing deposits with banks | 455 | 1,006 | |||||
| Central bank funds sold, securities purchased under resale agreements and securities borrowing transactions | 58,798 | 58,798 | |||||
| Securities received as collateral, at fair value | 2,978 | 2,978 | |||||
| Trading assets, at fair value | 65,461 | 64,681 | |||||
| Investment securities | 1,718 | 1,718 | |||||
| Other investments | 5,518 | 5,768 | |||||
| Net loans | 264,165 | 264,543 | |||||
| Goodwill | 2,903 | 2,903 | 4 | ||||
| Other intangible assets | 458 | 458 | |||||
| of which other intangible assets (excluding mortgage servicing rights) | 55 | 55 | 5 | ||||
| Brokerage receivables | 13,818 | 13,818 | |||||
| Other assets | 46,608 | 44,466 | |||||
| of which deferred tax assets related to net operating losses | 141 | 141 | 6 | ||||
| of which deferred tax assets from temporary differences | 164 | (519) | |||||
| of which defined benefit pension plan assets | 4,117 | 4,117 | 7 | ||||
| Total assets | 531,358 | 529,430 | |||||
| Liabilities and equity (CHF million) | |||||||
| Due to banks | 11,905 | 12,032 | |||||
| Customer deposits | 233,235 | 233,320 | |||||
| Central bank funds purchased, securities sold under repurchase agreements and securities lending transactions | 20,280 | 20,282 | |||||
| Obligation to return securities received as collateral, at fair value | 2,978 | 2,978 | |||||
| Trading liabilities, at fair value | 18,338 | 18,372 | |||||
| Short-term borrowings | 12,414 | 12,444 | |||||
| Long-term debt | 157,235 | 155,113 | |||||
| Brokerage payables | 11,442 | 11,442 | |||||
| Other liabilities | 18,200 | 17,987 | |||||
| Total liabilities | 486,027 | 483,970 | |||||
| of which additional tier 1 instruments, fully eligible | 12,114 | 14,736 | 8 | ||||
| Common shares | 160 | 160 | 1 | ||||
| Additional paid-in capital | 38,615 | 38,615 | 1 | ||||
| Retained earnings | 23,632 | 23,586 | 2 | ||||
| Treasury shares, at cost | (428) | (428) | 3 | ||||
| Accumulated other comprehensive income/(loss) | (16,850) | (16,805) | 3 | ||||
| Total shareholders' equity 1 | 45,129 | 45,128 | |||||
| Noncontrolling interests 2 | 202 | 332 | |||||
| Total equity | 45,331 | 45,460 | |||||
| Total liabilities and equity | 531,358 | 529,430 | |||||
|
1
Eligible as CET1 capital, prior to regulatory adjustments.
|
|||||||
|
2
The difference between the accounting and regulatory scope of consolidation primarily represents private equity and other fund type vehicles, which FINMA does not require to consolidate for capital adequacy reporting.
|
|||||||
| TLAC1 - TLAC composition for G-SIBs | |||
| end of | 4Q22 | ||
| TLAC (CHF million) | |||
| CET1 capital | 35,290 | ||
| Additional tier 1 instruments eligible under TLAC framework | 14,736 | ||
| TLAC arising from regulatory capital | 50,026 | ||
| External TLAC instruments issued directly by Credit Suisse Group AG and subordinated to excluded liabilities | 52,256 | ||
| TLAC arising from non-regulatory capital instruments before adjustments | 52,256 | ||
| TLAC before deductions | 102,282 | ||
| Deduction of investment in own other TLAC liabilities | 383 | ||
| Other adjustments to TLAC | 2,756 | ||
| TLAC | 99,143 | ||
| Risk-weighted assets and leverage exposure (CHF million) | |||
| Swiss risk-weighted assets | 250,963 | ||
| Leverage exposure | 650,551 | ||
| TLAC ratios and buffers (%) | |||
| TLAC ratio | 39.5 | ||
| TLAC leverage ratio | 15.2 | ||
| CET1 capital ratio available after meeting the resolution group’s minimum capital and TLAC requirements | 9.6 | ||
| Institution-specific buffer requirement (capital conservation buffer plus countercyclical buffer requirements plus higher loss absorbency requirement, expressed as a percentage of risk-weighted assets) | 3.580 | ||
| of which capital conservation buffer requirement | 2.5 | ||
| of which bank specific countercyclical buffer requirement | 0.080 | ||
| of which higher loss absorbency requirement | 1.0 | ||
| TLAC3 - Resolution entity - Creditor ranking at legal entity level | |||||||||
| Creditor ranking | |||||||||
|
end of 4Q22 |
Shareholders' equity |
1 |
Subordinated debt instruments Additional tier 1 |
Bail-in debt instruments and pari passu liabilities |
2 |
Total |
|||
| CHF million | |||||||||
| Total capital and liabilities net of credit risk mitigation | 22,661 | 16,243 | 58,262 | 97,166 | |||||
| Excluded liabilities | – | – | 69 | 69 | |||||
| Total capital and liabilities less excluded liabilities | 22,661 | 16,243 | 58,193 | 97,097 | |||||
| of which potentially eligible as TLAC 3 | 22,661 | 16,016 | 54,679 | 93,356 | |||||
| of which residual maturity between 1 to 2 years | – | – | 3,010 | 3,010 | |||||
| of which residual maturity between 2 to 5 years | – | – | 21,394 | 21,394 | |||||
| of which residual maturity between 5 to 10 years | – | – | 19,453 | 19,453 | |||||
| of which residual maturity greater than 10 years, excluding perpetual securities | – | – | 10,822 | 10,822 | |||||
| of which perpetual securities | 22,661 | 16,016 | – | 38,677 | |||||
|
Presented for Credit Suisse Group AG at the legal entity level and therefore instruments issued by subsidiaries and special purpose entities are excluded. Amounts are prepared in accordance with the provisions of the Swiss Law on Accounting and Financial Reporting (32nd title of the Swiss Code of Obligations).
|
|||||||||
|
1
Includes nominal share capital of CHF 160 million.
|
|||||||||
|
2
Amount does not include CHF 2,684 million of intercompany liabilities, which are pari passu to the external bail-in debt instruments and are not considered to be excluded liabilities.
|
|||||||||
|
3
Notes with a maturity of less than one year, notes called but not yet redeemed and accrued but not yet paid interest on TLAC instruments are not eligible as TLAC, but can be bailed in by FINMA.
|
|||||||||
| KM1 - Key metrics | |||||||||||
| end of | 4Q22 | 3Q22 | 2Q22 | 1Q22 | 4Q21 | ||||||
| Capital (CHF million) | |||||||||||
| Swiss CET1 capital | 35,290 | 34,423 | 37,049 | 37,713 | 38,529 | ||||||
| Fully loaded CECL accounting model Swiss CET1 capital 1 | 35,290 | 34,423 | 37,049 | 37,713 | 38,529 | ||||||
| Swiss tier 1 capital | 50,026 | 50,110 | 52,736 | 53,204 | 54,372 | ||||||
| Fully loaded CECL accounting model Swiss tier 1 capital 1 | 50,026 | 50,110 | 52,736 | 53,204 | 54,372 | ||||||
| Swiss total eligible capital | 50,026 | 50,110 | 53,217 | 53,676 | 55,073 | ||||||
| Fully loaded CECL accounting model Swiss total eligible capital 1 | 50,026 | 50,110 | 53,217 | 53,676 | 55,073 | ||||||
| Minimum capital requirement (8% of Swiss risk-weighted assets) 2 | 20,077 | 21,931 | 22,000 | 21,889 | 21,473 | ||||||
| Risk-weighted assets (CHF million) | |||||||||||
| Swiss risk-weighted assets | 250,963 | 274,138 | 274,997 | 273,609 | 268,418 | ||||||
| Risk-based capital ratios as a percentage of risk-weighted assets (%) | |||||||||||
| Swiss CET1 capital ratio | 14.1 | 12.6 | 13.5 | 13.8 | 14.4 | ||||||
| Fully loaded CECL accounting model Swiss CET1 capital ratio 1 | 14.1 | 12.6 | 13.5 | 13.8 | 14.4 | ||||||
| Swiss tier 1 capital ratio | 19.9 | 18.3 | 19.2 | 19.4 | 20.3 | ||||||
| Fully loaded CECL accounting model Swiss tier 1 capital ratio 1 | 19.9 | 18.3 | 19.2 | 19.4 | 20.3 | ||||||
| Swiss total capital ratio | 19.9 | 18.3 | 19.4 | 19.6 | 20.5 | ||||||
| Fully loaded CECL accounting model Swiss total capital ratio 1 | 19.9 | 18.3 | 19.4 | 19.6 | 20.5 | ||||||
| BIS CET1 buffer requirements (%) 3 | |||||||||||
| Capital conservation buffer | 2.5 | 2.5 | 2.5 | 2.5 | 2.5 | ||||||
| Extended countercyclical buffer | 0.080 | 0.026 | 0.025 | 0.023 | 0.028 | ||||||
| Progressive buffer for G-SIB and/or D-SIB | 1.0 | 1.0 | 1.0 | 1.0 | 1.0 | ||||||
| Total BIS CET1 buffer requirement | 3.580 | 3.526 | 3.525 | 3.523 | 3.528 | ||||||
| Additional Swiss sectoral countercyclical buffer | 0.235 | 0.227 | – | – | – | ||||||
| CET1 capital ratio available after meeting the bank's minimum capital requirements 4 | 9.6 | 8.1 | 9.0 | 9.3 | 9.9 | ||||||
| Basel III leverage ratio (CHF million) | |||||||||||
| Leverage exposure | 650,551 | 836,881 | 862,737 | 878,023 | 889,137 | ||||||
| Basel III leverage ratio (%) | 7.7 | 6.0 | 6.1 | 6.1 | 6.1 | ||||||
| Fully loaded CECL accounting model Basel III leverage ratio (%) 1 | 7.7 | 6.0 | 6.1 | 6.1 | 6.1 | ||||||
| Liquidity coverage ratio (CHF million) 5 | |||||||||||
| High-quality liquid assets | 119,954 | 226,839 | 234,931 | 225,572 | 227,193 | ||||||
| Net cash outflows | 83,202 | 118,144 | 123,312 | 114,869 | 112,156 | ||||||
| Liquidity coverage ratio (%) | 144 | 192 | 191 | 196 | 203 | ||||||
| Net stable funding ratio (CHF million) | |||||||||||
| Available stable funding | 343,158 | 425,622 | 428,764 | 430,894 | 436,856 | ||||||
| Required stable funding | 292,524 | 314,062 | 325,767 | 335,546 | 342,870 | ||||||
| Net stable funding ratio (%) | 117 | 136 | 132 | 128 | 127 | ||||||
|
1
The fully loaded US GAAP CECL accounting model excludes the transitional relief of recognizing CECL allowances and provisions in CET1 capital in accordance with FINMA Circular 2013/1 “Eligible capital – banks”.
|
|||||||||||
|
2
Calculated as 8% of Swiss risk-weighted assets, based on total capital minimum requirements, excluding the BIS CET1 buffer requirements.
|
|||||||||||
|
3
CET1 buffer requirements are based on BIS requirements as a percentage of Swiss risk-weighted assets and do not include the additional Swiss sectoral countercyclical capital buffer for mortgage loans that are directly or indirectly secured by residential real estate in Switzerland.
|
|||||||||||
|
4
Reflects the CET1 ratio that is available for meeting buffer requirements. Calculated as the CET1 ratio less the BIS CET1 ratio minimum requirement of 4.5% and after considering, where applicable, CET1 capital that was used to meet tier 1 and/or total capital ratio requirements under Pillar 1.
|
|||||||||||
|
5
Calculated using a three-month average, which is calculated on a daily basis.
|
|||||||||||
| KM2 - Key metrics - TLAC requirements (at resolution group level) | |||||||||||
| end of | 4Q22 | 3Q22 | 2Q22 | 1Q22 | 4Q21 | ||||||
| CHF million | |||||||||||
| TLAC | 99,143 | 97,398 | 96,896 | 101,177 | 101,269 | ||||||
| Fully loaded CECL accounting model TLAC 1 | 99,143 | 97,398 | 96,896 | 101,177 | 101,269 | ||||||
| Swiss risk-weighted assets | 250,963 | 274,138 | 274,997 | 273,609 | 268,418 | ||||||
| TLAC ratio (%) | 39.5 | 35.5 | 35.2 | 37.0 | 37.7 | ||||||
| Fully loaded CECL accounting model TLAC ratio (%) 1 | 39.5 | 35.5 | 35.2 | 37.0 | 37.7 | ||||||
| Leverage exposure | 650,551 | 836,881 | 862,737 | 878,023 | 889,137 | ||||||
| TLAC leverage ratio (%) | 15.2 | 11.6 | 11.2 | 11.5 | 11.4 | ||||||
| Fully loaded CECL accounting model TLAC leverage ratio (%) 1 | 15.2 | 11.6 | 11.2 | 11.5 | 11.4 | ||||||
| Does the subordination exemption in the antepenultimate paragraph of Section 11 of the FSB TLAC Term Sheet apply? | No | No | No | No | No | ||||||
| Does the subordination exemption in the penultimate paragraph of Section 11 of the FSB TLAC Term Sheet apply? | No | No | No | No | No | ||||||
| If the capped subordination exemption applies, the amount of funding issued that ranks pari passu with Excluded Liabilities and that is recognized as external TLAC, divided by funding issued that ranks pari passu with Excluded Liabilities and that would be recognized as external TLAC if no cap was applied (%) | N/A - refer to our response above | N/A - refer to our response above | N/A - refer to our response above | N/A - refer to our response above | N/A - refer to our response above | ||||||
|
1
The fully loaded US GAAP CECL accounting model excludes the transitional relief of recognizing CECL allowances and provisions in CET1 capital in accordance with FINMA Circular 2013/1 “Eligible capital – banks”.
|
|||||||||||
| CCyB1 - Geographical distribution of risk-weighted assets used in the CCyB | |||||||||
|
end of |
CCyB rate (%) |
RWA used in the computation of the CCyB |
Bank- specific CCyB rate (%) |
CCyB amount |
|||||
| 4Q22 (CHF million) | |||||||||
| Hong Kong | 1.00 | 1,381 | – | – | |||||
| Sweden | 1.00 | 452 | – | – | |||||
| UK | 1.00 | 7,065 | – | – | |||||
| Luxembourg | 0.50 | 3,935 | – | – | |||||
| Subtotal | – | 12,833 | – | – | |||||
| Other countries | 0.00 | 123,227 | – | – | |||||
| Total 1 | – | 136,060 | 0.080 | 200 | |||||
|
1
Reflects the total of RWA for private sector credit exposures across all jurisdictions to which the Group is exposed, including jurisdictions with no CCyB rate or with a CCyB rate set at zero, and value of the Group specific CCyB rate and resulting CCyB amount.
|
|||||||||
| LR1 - Summary comparison of accounting assets vs leverage ratio exposure | |||
| end of | 4Q22 | ||
| Reconciliation of consolidated assets to leverage exposure (CHF million) | |||
| Total consolidated assets as per published financial statements | 531,358 | ||
| Adjustment for investments in banking, financial, insurance or commercial entities that are consolidated for accounting purposes but outside the scope of regulatory consolidation 1 | (8,518) | ||
| Adjustments for derivatives financial instruments | 43,642 | ||
| Adjustments for SFTs (i.e. repos and similar secured lending) | 2,402 | ||
| Adjustments for off-balance sheet items (i.e. conversion to credit equivalent amounts of off-balance sheet exposures) | 78,811 | ||
| Other adjustments | 2,856 | ||
| Leverage exposure | 650,551 | ||
|
1
Includes adjustments for investments in banking, financial, insurance or commercial entities that are consolidated for accounting purposes but outside the scope of regulatory consolidation and tier 1 capital deductions related to balance sheet assets.
|
|||
| LR2 - Leverage ratio common disclosure template | |||||
| end of | 4Q22 | 3Q22 | |||
| Reconciliation of consolidated assets to leverage exposure (CHF million) | |||||
| On-balance sheet items (excluding derivatives and SFTs, but including collateral) | 458,961 | 567,982 | |||
| Asset amounts deducted from Basel III tier 1 capital | (6,163) | (5,952) | |||
| Total on-balance sheet exposures | 452,798 | 562,030 | |||
| Reconciliation of consolidated assets to leverage exposure (CHF million) | |||||
| Replacement cost associated with all derivatives transactions (i.e. net of eligible cash variation margin) | 12,967 | 21,102 | |||
| Add-on amounts for PFE associated with all derivatives transactions | 37,181 | 44,118 | |||
| Gross-up for derivatives collateral provided where deducted from the balance sheet assets pursuant to the operative accounting framework | 13,560 | 17,392 | |||
| Deductions of receivables assets for cash variation margin provided in derivatives transactions | (12,562) | (16,090) | |||
| Exempted CCP leg of client-cleared trade exposures | (382) | (581) | |||
| Adjusted effective notional amount of all written credit derivatives | 161,382 | 189,372 | |||
| Adjusted effective notional offsets and add-on deductions for written credit derivatives | (157,403) | (184,128) | |||
| Derivative Exposures | 54,743 | 71,185 | |||
| Securities financing transaction exposures (CHF million) | |||||
| Gross SFT assets (with no recognition of netting), after adjusting for sale accounting transactions | 69,568 | 118,058 | |||
| Netted amounts of cash payables and cash receivables of gross SFT assets | (10,749) | (10,136) | |||
| Counterparty credit risk exposure for SFT assets | 5,380 | 4,742 | |||
| Securities financing transaction exposures | 64,199 | 112,664 | |||
| Other off-balance sheet exposures (CHF million) | |||||
| Off-balance sheet exposure at gross notional amount | 260,448 | 287,310 | |||
| Adjustments for conversion to credit equivalent amounts | (181,637) | (196,308) | |||
| Other off-balance sheet exposures | 78,811 | 91,002 | |||
| Swiss tier 1 capital (CHF million) | |||||
| Swiss tier 1 capital | 50,026 | 50,110 | |||
| Leverage exposure (CHF million) | |||||
| Leverage exposure | 650,551 | 836,881 | |||
| Leverage ratio (%) | |||||
| Basel III leverage ratio | 7.7 | 6.0 | |||
| LIQ1 - Liquidity coverage ratio | |||||
|
end of 4Q22 |
Unweighted value |
1 |
Weighted value |
2 | |
| High-quality liquid assets (CHF million) | |||||
| High-quality liquid assets 3 | – | 119,954 | |||
| Cash outflows (CHF million) | |||||
| Retail deposits and deposits from small business customers | 118,506 | 13,444 | |||
| of which less stable deposits | 118,506 | 13,444 | |||
| Unsecured wholesale funding | 153,546 | 58,000 | |||
| of which operational deposits (all counterparties) and deposits in networks of cooperative banks | 31,348 | 7,837 | |||
| of which non-operational deposits (all counterparties) | 77,042 | 39,405 | |||
| of which unsecured debt | 10,156 | 10,156 | |||
| Secured wholesale funding | 50,915 | 9,692 | |||
| Additional requirements | 153,272 | 33,328 | |||
| of which outflows related to derivative exposures and other collateral requirements | 53,394 | 12,550 | |||
| of which outflows related to loss of funding on debt products | 1,069 | 1,069 | |||
| of which credit and liquidity facilities | 98,809 | 19,709 | |||
| Other contractual funding obligations | 43,945 | 43,945 | |||
| Other contingent funding obligations | 194,227 | 2,303 | |||
| Total cash outflows | – | 160,712 | |||
| Cash inflows (CHF million) | |||||
| Secured lending | 32,744 | 12,104 | |||
| Inflows from fully performing exposures | 48,350 | 22,101 | |||
| Other cash inflows | 43,305 | 43,305 | |||
| Total cash inflows | 124,399 | 77,510 | |||
| Liquidity cover ratio (CHF million) | |||||
| High-quality liquid assets | – | 119,954 | |||
| Net cash outflows | – | 83,202 | |||
| Liquidity coverage ratio (%) | – | 144 | |||
|
Calculated based on an average of 65 data points in 4Q22.
|
|||||
|
1
Calculated as outstanding balances maturing or callable within 30 days.
|
|||||
|
2
Calculated after the application of haircuts for high-quality liquid assets or inflow and outflow rates.
|
|||||
|
3
Consists of cash and eligible securities as prescribed by FINMA and reflects a post-cancellation view.
|
|||||
| LIQ2 – Liquidity: information on the NSFR | |||||||||||
| Values not weighted, according to residual maturities | |||||||||||
|
end of 4Q22 |
No maturity |
< 6 months |
≥ 6 months up to 1 year |
≥ 1 year |
Weighted values |
||||||
| Information on the available stable funding (CHF million) | |||||||||||
| Equity instruments | 52,433 | 0 | 0 | 12,010 | 64,443 | ||||||
| of which regulatory capital 1 | 52,433 | 0 | 0 | 12,010 | 64,443 | ||||||
| of which other equity instruments | 0 | 0 | 0 | 0 | 0 | ||||||
| Demand deposits and/or term deposits of private customers and small business customers | 84,136 | 17,873 | 8,911 | 7 | 100,136 | ||||||
| of which "stable" deposits | 6,000 | 0 | 0 | 0 | 5,700 | ||||||
| of which "less stable" deposits | 78,136 | 17,873 | 8,911 | 7 | 94,436 | ||||||
| Funding deposited by non-financial institutions (without small business customers) (wholesale customers) | 57,889 | 38,749 | 2,598 | 1,317 | 48,446 | ||||||
| of which operational deposits | 23,190 | 0 | 0 | 0 | 11,595 | ||||||
| of which non-operational deposits | 34,699 | 38,749 | 2,598 | 1,317 | 36,851 | ||||||
| Liabilities with matching interdependent assets | 0 | 0 | 0 | 0 | 0 | ||||||
| Other exposures | 61,094 | 64,904 | 23,170 | 113,380 | 130,133 | ||||||
| of which exposures arising from derivative transactions | – | 11,277 | 0 | 0 | – | ||||||
| of which other exposures and equity instruments | 61,094 | 53,627 | 23,170 | 113,380 | 130,133 | ||||||
| Total available stable funding | – | – | – | – | 343,158 | ||||||
| Information on the required stable funding (CHF million) | |||||||||||
| Total of HQLA NSFR | – | – | – | – | 3,279 | ||||||
| Operational deposits held at other financial institutions | 6,700 | – | – | – | 3,350 | ||||||
| Performing loans and securities | 31,020 | 112,025 | 43,454 | 179,249 | 221,436 | ||||||
| of which performing loans to companies in the financial sector, secured with category 1 and 2a HQLA | 11,891 | 20,647 | 0 | 0 | 3,390 | ||||||
| of which performing loans to companies in the financial sector, secured with non-category 1 or 2a HQLA or unsecured | 3,578 | 23,895 | 13,591 | 23,285 | 34,252 | ||||||
| of which performing loans to companies outside the financial sector, to retail and small business customers, to countries, central banks and sub-national public sector entities | 5,956 | 53,676 | 15,724 | 69,835 | 94,493 | ||||||
| of which risk-weighted up to 35% under the SA-BIS | 7 | 0 | 0 | 7,560 | 5,396 | ||||||
| of which performing loans for residential properties | 0 | 13,460 | 13,629 | 77,579 | 73,388 | ||||||
| of which risk-weighted up to 35% under the SA-BIS | 0 | 4,526 | 4,677 | 70,204 | 58,176 | ||||||
| of which non-defaulted securities that do not qualify as HQLA, including exchange-traded shares | 9,595 | 347 | 510 | 8,550 | 15,913 | ||||||
| Assets with matching interdependent liabilities | 0 | 0 | 0 | 0 | 0 | ||||||
| Other assets | 73,923 | 539 | 45 | 86,266 | 58,243 | ||||||
| of which physically traded commodities, including gold | 1,298 | – | – | – | 1,103 | ||||||
| of which assets posted as initial margin for derivative contracts and contributions to default funds of central counterparties | – | 0 | 0 | 13,870 | 11,789 | ||||||
| of which NSFR assets in the form of derivatives | – | 0 | 0 | 10,518 | 0 | ||||||
| of which NSFR derivative liabilities before deduction of variation margin posted | – | 0 | 0 | 22,912 | 5,800 | ||||||
| of which all remaining assets | 72,625 | 539 | 45 | 38,966 | 39,551 | ||||||
| Off-balance sheet items | – | 0 | 0 | 307,122 | 6,216 | ||||||
| Total required stable funding | – | – | – | – | 292,524 | ||||||
| Net stable funding ratio (%) | – | – | – | – | 117 | ||||||
|
1
Prior to regulatory deductions.
|
|||||||||||
| LIQ2 – Liquidity: information on the NSFR (continued) | |||||||||||
| Values not weighted, according to residual maturities | |||||||||||
|
end of 3Q22 |
No maturity |
< 6 months |
≥ 6 months up to 1 year |
≥ 1 year |
Weighted values |
||||||
| Information on the available stable funding (CHF million) | |||||||||||
| Equity instruments | 49,156 | 0 | 0 | 14,853 | 64,009 | ||||||
| of which regulatory capital 1 | 49,156 | 0 | 0 | 14,853 | 64,009 | ||||||
| of which other equity instruments | 0 | 0 | 0 | 0 | 0 | ||||||
| Demand deposits and/or term deposits of private customers and small business customers | 117,280 | 28,914 | 9,457 | 7 | 140,393 | ||||||
| of which "stable" deposits | 6,000 | 0 | 0 | 0 | 5,700 | ||||||
| of which "less stable" deposits | 111,280 | 28,914 | 9,457 | 7 | 134,693 | ||||||
| Funding deposited by non-financial institutions (without small business customers) (wholesale customers) | 83,322 | 86,877 | 6,068 | 1,384 | 85,446 | ||||||
| of which operational deposits | 28,498 | 0 | 0 | 0 | 14,249 | ||||||
| of which non-operational deposits | 54,824 | 86,877 | 6,068 | 1,384 | 71,197 | ||||||
| Liabilities with matching interdependent assets | 0 | 0 | 0 | 0 | 0 | ||||||
| Other exposures | 76,432 | 83,790 | 31,716 | 113,356 | 135,774 | ||||||
| of which exposures arising from derivative transactions | – | 18,497 | 0 | 0 | – | ||||||
| of which other exposures and equity instruments | 76,432 | 65,293 | 31,716 | 113,356 | 135,774 | ||||||
| Total available stable funding | – | – | – | – | 425,622 | ||||||
| Information on the required stable funding (CHF million) | |||||||||||
| Total of HQLA NSFR | – | – | – | – | 4,276 | ||||||
| Operational deposits held at other financial institutions | 9,009 | – | – | – | 4,504 | ||||||
| Performing loans and securities | 43,401 | 167,089 | 40,435 | 179,779 | 234,800 | ||||||
| of which performing loans to companies in the financial sector, secured with category 1 and 2a HQLA | 13,962 | 51,321 | 0 | 0 | 6,651 | ||||||
| of which performing loans to companies in the financial sector, secured with non-category 1 or 2a HQLA or unsecured | 7,581 | 35,565 | 11,469 | 18,838 | 31,211 | ||||||
| of which performing loans to companies outside the financial sector, to retail and small business customers, to countries, central banks and sub-national public sector entities | 6,500 | 65,151 | 16,035 | 70,445 | 100,003 | ||||||
| of which risk-weighted up to 35% under the SA-BIS | 11 | 0 | 0 | 7,837 | 5,610 | ||||||
| of which performing loans for residential properties | 0 | 13,917 | 12,342 | 79,405 | 73,540 | ||||||
| of which risk-weighted up to 35% under the SA-BIS | 0 | 5,248 | 4,429 | 72,122 | 59,059 | ||||||
| of which non-defaulted securities that do not qualify as HQLA, including exchange-traded shares | 15,358 | 1,135 | 589 | 11,091 | 23,395 | ||||||
| Assets with matching interdependent liabilities | 0 | 0 | 0 | 0 | 0 | ||||||
| Other assets | 151,037 | 876 | 35 | 106,569 | 63,779 | ||||||
| of which physically traded commodities, including gold | 1,459 | – | – | – | 1,240 | ||||||
| of which assets posted as initial margin for derivative contracts and contributions to default funds of central counterparties | – | 0 | 0 | 15,823 | 13,449 | ||||||
| of which NSFR assets in the form of derivatives | – | 0 | 0 | 17,762 | 0 | ||||||
| of which NSFR derivative liabilities before deduction of variation margin posted | – | 0 | 0 | 32,468 | 7,663 | ||||||
| of which all remaining assets | 149,578 | 876 | 35 | 40,516 | 41,427 | ||||||
| Off-balance sheet items | – | 0 | 0 | 329,788 | 6,703 | ||||||
| Total required stable funding | – | – | – | – | 314,062 | ||||||
| Net stable funding ratio (%) | – | – | – | – | 136 | ||||||
|
1
Prior to regulatory deductions.
|
|||||||||||
| A | ||
| ABS | Asset-backed securities | |
| ACVA | Advanced credit valuation adjustment approach | |
| A-IRB | Advanced-internal ratings-based | |
| AMA | Advanced measurement approach | |
| Art. | Article | |
| B | ||
| BCBS | Basel Committee on Banking Supervision | |
| BIS | Bank for International Settlements | |
| C | ||
| CALMC | Capital Allocation and Liability Management Committee | |
| CAO | Capital Adequacy Ordinance | |
| CCF | Credit conversion factor | |
| CCP | Central counterparties | |
| CCR | Counterparty credit risk | |
| CCyB | Countercyclical buffer | |
| CDS | Credit default swap | |
| CECL | Current expected credit loss | |
| CET1 | Common equity tier 1 | |
| CFO | Chief Financial Officer | |
| CMBS | Commercial mortgage-backed securities | |
| CRO | Chief Risk and Compliance Officer | |
| CRM | Credit risk mitigation | |
| CVA | Credit valuation adjustment | |
| D | ||
| D-SIB | Domestic systemically important bank | |
| E | ||
| EAD | Exposure at default | |
| ECAI | External credit assessment institutions | |
| EEPE | Effective expected positive exposure | |
| EMIR | European Market Infrastructure Regulation | |
| EVE | Economic value of equity | |
| F | ||
| FINMA | Swiss Financial Market Supervisory Authority FINMA | |
| F-IRB | Foundation-internal ratings-based | |
| FSB | Financial Stability Board | |
| G | ||
| GDP | Gross Domestic Product | |
| G-SIB | Global systemically important bank | |
| H | ||
| HQLA | High-quality liquid assets | |
| I | ||
| IAA | Internal assessment approach | |
| IMA | Internal model approach | |
| IMM | Internal model method | |
| IPRE | Income producing real estate | |
| IRB | Internal ratings-based | |
| IRRBB | Interest rate risk in the banking book | |
| IRC | Incremental Risk Charge | |
| L | |||
| LCR | Liquidity coverage ratio | ||
| LGD | Loss given default | ||
| LRD | Leverage ratio denominator | ||
| LTV | Loan-to-value | ||
| M | |||
| MACC | Model Approval and Controls Committee | ||
| N | |||
| NII | Net interest income | ||
| N/A | Not applicable | ||
| NSFR | Net stable funding ratio | ||
| O | |||
| OTC | Over-the-counter | ||
| P | |||
| P&L | Profits and losses | ||
| PD | Probability of default | ||
| PFE | Potential future exposure | ||
| Q | |||
| QCCP | Qualifying central counterparty | ||
| R | |||
| RMBS | Residential mortgage-backed securities | ||
| RNIV | Risks not in value-at-risk | ||
| RPSC | Risk Processes & Standards Committee | ||
| RW | Risk weight | ||
| RWA | Risk-weighted assets | ||
| S | |||
| SA | Standardized approach | ||
| SA-CCR | Standardized approach - counterparty credit risk | ||
| SEC-ERBA | Securitization external ratings-based approach | ||
| SEC-IRBA | Securitization internal ratings-based approach | ||
| SEC-SA | Securitization standardized approach | ||
| SFT | Securities financing transactions | ||
| SMM | Standardized measurement method | ||
| SPE | Special purpose entity | ||
| T | |||
| TLAC | Total loss-absorbing capacity | ||
| U | |||
| US GAAP | US generally accepted accounting principles | ||
| V | |||
| VaR | Value-at-risk | ||
| ∆ | |||
| ∆EVE | Delta economic value of equity | ||
| ∆NII | Delta net interest income | ||