August 5, 2022
PRESS RELEASE
Century Casinos, Inc. Announces Second Quarter 2022 Results
Colorado Springs, Colorado – August 5, 2022 – Century Casinos, Inc. (Nasdaq Capital Market®: CNTY) today announced its financial results for the three and six months ended June 30, 2022.
Second Quarter 2022 Highlights*
|
·
| |
Net operating revenue was $111.1 million, an increase of 21% from the three months ended June 30, 2021. |
|
·
| |
Earnings from operations were $20.8 million, an increase of 15% from the three months ended June 30, 2021. |
|
·
| |
Net earnings attributable to Century Casinos, Inc. shareholders were $8.9 million, an increase of 29% from the three months ended June 30, 2021. |
|
·
| |
Adjusted EBITDA** was $29.8 million, an increase of 18% from the three months ended June 30, 2021. |
|
·
| |
Basic earnings per share attributable to Century Casinos, Inc. shareholders were $0.30. |
|
·
| |
Diluted earnings per share attributable to Century Casinos, Inc. shareholders were $0.28. |
|
·
| |
Book value per share*** at June 30, 2022 was $5.00. |
COVID-19 Update
Since the inception of the COVID-19 pandemic in March 2020, the Company’s casinos have varied their operations based on the governmental health and safety requirements in the jurisdictions in which they are located. The COVID-19 pandemic impacted the Company’s results of operations in the first half of 2021 because of closures at the Company’s Canada and Poland properties during this period. Currently the Company’s operations have no health and safety requirements for entry and few other COVID-19 related restrictions. The duration and ultimate impact of the COVID-19 pandemic otherwise remains uncertain.
NUGGET CASINO RESORT ACQUISITION AND FINANCING
On April 1, 2022, the Company purchased 50% of the membership interest in Smooth Bourbon, LLC (“PropCo”) for approximately $95.0 million (the “PropCo Acquisition”). Pursuant to a definitive agreement and subject to approval from the Nevada Gaming Commission, the Company will purchase 100% of the membership interests in Nugget Sparks, LLC (“OpCo”) for $100.0 million (subject to certain adjustments) (the “OpCo Acquisition” and together with the PropCo Acquisition, the “Acquisition”). The OpCo Acquisition is expected to occur within one year of the PropCo Acquisition. OpCo owns and operates the Nugget Casino Resort in Sparks, Nevada, and PropCo owns the real property on which the casino is located and leases the real property to OpCo for an annual rent of $15.0 million.
* Amounts presented are rounded. As such, rounding differences could occur in period over period changes and percentages reported.
** Adjusted EBITDA and Adjusted EBITDA margin are Non-US GAAP financial measures. See discussion and reconciliation of Non-US GAAP financial measures in Supplemental Information below.
*** The Company defines book value per share as total Century Casinos, Inc. shareholders’ equity divided by outstanding common shares.
On April 1, 2022, the Company also entered into a Credit Agreement with Goldman Sachs Bank USA (the “Goldman Credit Agreement”). The Goldman Credit Agreement provides for a $350.0 million term loan (the “Term Loan”) and a $30.0 million revolving credit facility (the “Revolving Facility”). The Company drew $350.0 million under the Term Loan and used the proceeds as well as $29.3 million of cash on hand to fund the PropCo Acquisition, to repay approximately $166.2 million outstanding under the Company’s credit agreement with Macquarie (“Macquarie Credit Agreement”), to fund a $100.0 million escrow fund that will be used to purchase OpCo, and for related fees and expenses. The Goldman Credit Agreement replaces the Macquarie Credit Agreement. The Company did not draw on the Revolving Facility on the closing date of the PropCo acquisition.
RESULTS
The consolidated results for the three and six months ended June 30, 2022 and 2021 are as follows:
|
|
|
|
|
|
|
|
|
|
|
|
|
|
|
|
|
|
|
|
For the three months
|
|
|
For the six months
|
|
|
|
Amounts in thousands, except per share data
|
ended June 30,
|
|
|
ended June 30,
|
|
|
|
Consolidated Results:
|
|
|
2022
|
|
|
2021
|
|
% Change
|
|
|
2022
|
|
|
2021
|
|
% Change
|
|
Net Operating Revenue
|
|
$
|
111,122
|
|
$
|
92,185
|
|
21%
|
|
$
|
214,224
|
|
$
|
164,599
|
|
30%
|
|
Earnings from Operations
|
|
|
20,802
|
|
|
18,112
|
|
15%
|
|
|
33,846
|
|
|
26,361
|
|
28%
|
|
Net Earnings Attributable to Century Casinos, Inc. Shareholders
|
|
$
|
8,856
|
|
$
|
6,855
|
|
29%
|
|
$
|
9,074
|
|
$
|
5,436
|
|
67%
|
|
|
|
|
|
|
|
|
|
|
|
|
|
|
|
|
|
|
|
Adjusted EBITDA**
|
|
$
|
29,778
|
|
$
|
25,238
|
|
18%
|
|
$
|
53,601
|
|
$
|
39,983
|
|
34%
|
|
|
|
|
|
|
|
|
|
|
|
|
|
|
|
|
|
|
|
Earnings Per Share Attributable to Century Casinos, Inc. Shareholders:
|
|
Basic
|
|
$
|
0.30
|
|
$
|
0.23
|
|
30%
|
|
$
|
0.30
|
|
$
|
0.18
|
|
67%
|
|
Diluted
|
|
$
|
0.28
|
|
$
|
0.22
|
|
27%
|
|
$
|
0.29
|
|
$
|
0.18
|
|
61%
|
|
|
|
|
|
|
|
|
|
|
|
|
|
|
|
|
|
|
“We achieved the highest net operating revenue and Adjusted EBITDA during a second quarter in the history of the Company. We are pleased with the strong contribution from our operations in Canada which have continued to improve after Alberta removed COVID-19 restrictions,” Erwin Haitzmann and Peter Hoetzinger, Co-Chief Executive Officers of Century Casinos remarked. “As we announced in April, we have completed the first portion of our acquisition of the Nugget Casino Resort. We are excited to enter the growing Reno/Sparks Nevada market with this transaction,” Messrs. Haitzmann and Hoetzinger concluded.
* Amounts presented are rounded. As such, rounding differences could occur in period over period changes and percentages reported.
** Adjusted EBITDA and Adjusted EBITDA margin are Non-US GAAP financial measures. See discussion and reconciliation of Non-US GAAP financial measures in Supplemental Information below.
2/11
Reportable Segment Results*
The table below shows the Company’s reporting units and operating segments that are included in each of the Company’s reportable segments as of June 30, 2022:
|
|
|
|
|
Reportable Segment
|
Operating Segment
|
Reporting Unit
|
|
United States
|
Colorado
|
Century Casino & Hotel - Central City
|
|
|
|
Century Casino & Hotel - Cripple Creek
|
|
|
West Virginia
|
Mountaineer Casino, Racetrack & Resort
|
|
|
Missouri
|
Century Casino Cape Girardeau
|
|
|
|
Century Casino Caruthersville
|
|
Canada
|
Edmonton
|
Century Casino & Hotel - Edmonton
|
|
|
|
Century Casino St. Albert
|
|
|
|
Century Mile Racetrack and Casino
|
|
|
Calgary
|
Century Downs Racetrack and Casino
|
|
|
|
Century Sports (1)
|
|
|
|
Century Bets! Inc. (1)
|
|
Poland
|
Poland
|
Casinos Poland
|
|
Corporate and Other
|
Corporate and Other
|
Cruise Ships & Other
|
|
|
|
Corporate Other (2)
|
|
(1)
| |
The Company operated Century Sports through February 10, 2022. The Company operated Century Bets! Inc. through August 2021 when operations were transferred to Century Mile Racetrack and Casino. |
|
(2)
| |
The Company’s equity interest in Smooth Bourbon is included in the Corporate Other reporting unit. |
The Company’s net operating revenue increased by $18.9 million, or 21%, and by $49.6 million, or 30%, for the three and six months ended June 30, 2022, compared to the three and six months ended June 30, 2021. Following is a summary of the changes in net operating revenue by reportable segment for the three and six months ended June 30, 2022, compared to the three and six months ended June 30, 2021:
|
|
|
|
|
|
|
|
|
|
|
|
|
|
|
|
|
|
|
|
|
|
|
|
|
|
|
Net Operating Revenue
|
|
|
|
For the three months
|
|
|
|
|
|
|
For the six months
|
|
|
|
|
|
|
Amounts in
|
|
ended June 30,
|
|
|
$
|
|
%
|
|
ended June 30,
|
|
|
$
|
|
%
|
|
thousands
|
|
2022
|
|
2021
|
|
|
Change
|
|
Change
|
|
2022
|
|
2021
|
|
|
Change
|
|
Change
|
|
United States
|
|
$
|
70,313
|
|
$
|
76,700
|
|
$
|
(6,387)
|
|
(8%)
|
|
$
|
135,556
|
|
$
|
141,072
|
|
$
|
(5,516)
|
|
(4%)
|
|
Canada
|
|
|
19,037
|
|
|
6,658
|
|
|
12,379
|
|
186%
|
|
|
35,039
|
|
|
8,666
|
|
|
26,373
|
|
304%
|
|
Poland
|
|
|
21,707
|
|
|
8,689
|
|
|
13,018
|
|
150%
|
|
|
43,531
|
|
|
14,599
|
|
|
28,932
|
|
198%
|
|
Corporate and Other
|
|
|
65
|
|
|
138
|
|
|
(73)
|
|
(53%)
|
|
|
98
|
|
|
262
|
|
|
(164)
|
|
(63%)
|
|
Consolidated
|
|
$
|
111,122
|
|
$
|
92,185
|
|
$
|
18,937
|
|
21%
|
|
$
|
214,224
|
|
$
|
164,599
|
|
$
|
49,625
|
|
30%
|
|
|
|
|
|
|
|
|
|
|
|
|
|
|
|
|
|
|
|
|
|
|
|
|
* Amounts presented are rounded. As such, rounding differences could occur in period over period changes and percentages reported.
** Adjusted EBITDA and Adjusted EBITDA margin are Non-US GAAP financial measures. See discussion and reconciliation of Non-US GAAP financial measures in Supplemental Information below.
3/11
The Company’s earnings from operations increased by $2.7 million, or 15%, and by $7.5 million, or 28%, for the three and six months ended June 30, 2022, compared to the three and six months ended June 30, 2021. Following is a summary of the changes in earnings (loss) from operations by reportable segment for the three and six months ended June 30, 2022, compared to the three and six months ended June 30, 2021:
|
|
|
|
|
|
|
|
|
|
|
|
|
|
|
|
|
|
|
|
|
|
|
|
|
|
|
Earnings (Loss) from Operations
|
|
|
|
For the three months
|
|
|
|
|
|
|
For the six months
|
|
|
|
|
|
|
Amounts in
|
|
ended June 30,
|
|
|
$
|
|
%
|
|
ended June 30,
|
|
|
$
|
|
%
|
|
thousands
|
|
2022
|
|
2021
|
|
|
Change
|
|
Change
|
|
2022
|
|
2021
|
|
|
Change
|
|
Change
|
|
United States
|
|
$
|
17,624
|
|
$
|
23,529
|
|
$
|
(5,905)
|
|
(25%)
|
|
$
|
33,147
|
|
$
|
41,058
|
|
$
|
(7,911)
|
|
(19%)
|
|
Canada
|
|
|
4,334
|
|
|
(612)
|
|
|
4,946
|
|
808%
|
|
|
4,933
|
|
|
(4,436)
|
|
|
9,369
|
|
211%
|
|
Poland
|
|
|
2,047
|
|
|
(1,810)
|
|
|
3,857
|
|
213%
|
|
|
4,008
|
|
|
(5,170)
|
|
|
9,178
|
|
178%
|
|
Corporate and Other
|
|
|
(3,203)
|
|
|
(2,995)
|
|
|
(208)
|
|
(7%)
|
|
|
(8,242)
|
|
|
(5,091)
|
|
|
(3,151)
|
|
(62%)
|
|
Consolidated
|
|
$
|
20,802
|
|
$
|
18,112
|
|
$
|
2,690
|
|
15%
|
|
$
|
33,846
|
|
$
|
26,361
|
|
$
|
7,485
|
|
28%
|
|
|
|
|
|
|
|
|
|
|
|
|
|
|
|
|
|
|
|
|
|
|
|
|
Net earnings attributable to Century Casinos, Inc. shareholders increased by $2.0 million, or 29%, and by $3.6 million, or 67%, for the three and six months ended June 30, 2022, compared to the three and six months ended June 30, 2021. Following is a summary of the changes in net earnings (loss) attributable to Century Casinos, Inc. shareholders by reportable segment for the three and six months ended June 30, 2022, compared to the three and six months ended June 30, 2021:
|
|
|
|
|
|
|
|
|
|
|
|
|
|
|
|
|
|
|
|
|
|
|
|
|
|
|
Net Earnings (Loss) Attributable to Century Casinos, Inc. Shareholders
|
|
|
|
For the three months
|
|
|
|
|
|
|
For the six months
|
|
|
|
|
|
|
Amounts in
|
|
ended June 30,
|
|
|
$
|
|
%
|
|
ended June 30,
|
|
|
$
|
|
%
|
|
thousands
|
|
2022
|
|
2021
|
|
|
Change
|
|
Change
|
|
2022
|
|
2021
|
|
|
Change
|
|
Change
|
|
United States
|
|
$
|
10,521
|
|
$
|
16,502
|
|
$
|
(5,981)
|
|
(36%)
|
|
$
|
19,038
|
|
$
|
27,096
|
|
$
|
(8,058)
|
|
(30%)
|
|
Canada
|
|
|
2,875
|
|
|
(1,525)
|
|
|
4,400
|
|
289%
|
|
|
2,170
|
|
|
(5,040)
|
|
|
7,210
|
|
143%
|
|
Poland
|
|
|
1,322
|
|
|
(1,038)
|
|
|
2,360
|
|
227%
|
|
|
2,255
|
|
|
(2,873)
|
|
|
5,128
|
|
179%
|
|
Corporate and Other
|
|
|
(5,862)
|
|
|
(7,084)
|
|
|
1,222
|
|
17%
|
|
|
(14,389)
|
|
|
(13,747)
|
|
|
(642)
|
|
(5%)
|
|
Consolidated
|
|
$
|
8,856
|
|
$
|
6,855
|
|
$
|
2,001
|
|
29%
|
|
$
|
9,074
|
|
$
|
5,436
|
|
$
|
3,638
|
|
67%
|
|
|
|
|
|
|
|
|
|
|
|
|
|
|
|
|
|
|
|
|
|
|
|
|
Items deducted from or added to earnings from operations to arrive at net earnings attributable to Century Casinos, Inc. shareholders include interest income, interest expense, gains (losses) on foreign currency transactions and other, income tax (benefit) expense and non-controlling interests. Items that impacted net earnings attributable to Century Casinos, Inc. shareholders for the three and six months ended June 30, 2022 included a write-off of $7.3 million in deferred financing costs to interest expense related to the prepayment of the Macquarie Credit Agreement and the release of a $10.2 million US valuation allowance, resulting in an income tax benefit.
* Amounts presented are rounded. As such, rounding differences could occur in period over period changes and percentages reported.
** Adjusted EBITDA and Adjusted EBITDA margin are Non-US GAAP financial measures. See discussion and reconciliation of Non-US GAAP financial measures in Supplemental Information below.
4/11
Adjusted EBITDA** increased by $4.5 million, or 18%, and by $13.6 million, or 34%, for the three and six months ended June 30, 2022 compared to the three and six months ended June 30, 2021. Following is a summary of the changes in Adjusted EBITDA** by reportable segment for the three and six months ended June 30, 2022 compared to the three and six months ended June 30, 2021:
|
|
|
|
|
|
|
|
|
|
|
|
|
|
|
|
|
|
|
|
|
|
|
|
|
|
|
Adjusted EBITDA**
|
|
|
|
For the three months
|
|
|
|
|
|
|
For the six months
|
|
|
|
|
|
|
Amounts in
|
|
ended June 30,
|
|
|
$
|
|
%
|
|
ended June 30,
|
|
|
$
|
|
%
|
|
thousands
|
|
2022
|
|
2021
|
|
|
Change
|
|
Change
|
|
2022
|
|
2021
|
|
|
Change
|
|
Change
|
|
United States
|
|
$
|
22,382
|
|
$
|
28,247
|
|
$
|
(5,865)
|
|
(21%)
|
|
$
|
42,692
|
|
$
|
50,376
|
|
$
|
(7,684)
|
|
(15%)
|
|
Canada
|
|
|
5,568
|
|
|
639
|
|
|
4,929
|
|
771%
|
|
|
9,562
|
|
|
(1,850)
|
|
|
11,412
|
|
617%
|
|
Poland
|
|
|
2,724
|
|
|
(1,042)
|
|
|
3,766
|
|
361%
|
|
|
5,368
|
|
|
(3,608)
|
|
|
8,976
|
|
249%
|
|
Corporate and Other
|
|
|
(896)
|
|
|
(2,606)
|
|
|
1,710
|
|
66%
|
|
|
(4,021)
|
|
|
(4,935)
|
|
|
914
|
|
19%
|
|
Consolidated
|
|
$
|
29,778
|
|
$
|
25,238
|
|
$
|
4,540
|
|
18%
|
|
$
|
53,601
|
|
$
|
39,983
|
|
$
|
13,618
|
|
34%
|
|
|
|
|
|
|
|
|
|
|
|
|
|
|
|
|
|
|
|
|
|
|
|
|
Balance Sheet and Liquidity
As of June 30, 2022, the Company had $96.2 million in cash and cash equivalents compared to $107.8 million in cash and cash equivalents at December 31, 2021. Cash and cash equivalents as of June 30, 2022 do not include restricted cash, which includes $100.0 million in escrow to fund the OpCo Acquisition. As of June 30, 2022, the Company had $369.9 million in outstanding debt compared to $189.2 million in outstanding debt at December 31, 2021. The outstanding debt as of June 30, 2022 included $349.1 million related to the Term Loan under the Goldman Credit Agreement (including $100.0 million borrowed and in escrow to fund the OpCo Acquisition), $0.1 million of bank debt related to Casinos Poland, $5.5 million of bank debt related to Century Resorts Management GmbH (“CRM”), and $15.1 million related to a long-term land lease for Century Downs Racetrack and Casino (“CDR”). The Company also has a $283.0 million long-term financing obligation under its triple net master lease (“Master Lease”) of its West Virginia and Missouri properties.
Conference Call Information
Today the Company will post a copy of its quarterly report on Form 10-Q filed with the SEC for the quarter ended June 30, 2022 on its website at www.cnty.com/investor/financials/sec-filings/. The Company will also post a presentation of the second quarter results on its website at www.cnty.com/investor/presentations/.
The Company will host its second quarter 2022 earnings conference call today, Friday, August 5, at 10:00 am EDT / 8:00 am MDT. U.S. domestic participants should dial 800-920-5564. For all international participants, please use 415-226-5355 to dial-in. Participants may listen to the call live at cc.callinfo.com/r/1ocsahbwizouj&eom or obtain a recording of the call on the Company’s website until August 31, 2022 at www.cnty.com/investor/financials/sec-filings/.
* Amounts presented are rounded. As such, rounding differences could occur in period over period changes and percentages reported.
** Adjusted EBITDA and Adjusted EBITDA margin are Non-US GAAP financial measures. See discussion and reconciliation of Non-US GAAP financial measures in Supplemental Information below.
5/11
CENTURY CASINOS, INC. AND SUBSIDIARIES –
UNAUDITED FINANCIAL INFORMATION – US GAAP BASIS
|
|
|
Condensed Consolidated Statements of Earnings
|
|
|
|
|
|
|
|
|
|
|
|
|
|
|
|
|
For the three months
|
For the six months
|
|
|
ended June 30,
|
ended June 30,
|
|
Amounts in thousands, except for per share information
|
|
2022
|
|
2021
|
|
2022
|
|
2021
|
|
Operating revenue:
|
|
|
|
|
|
|
|
|
|
|
|
|
|
Net operating revenue
|
|
$
|
111,122
|
|
$
|
92,185
|
|
$
|
214,224
|
|
$
|
164,599
|
|
Operating costs and expenses:
|
|
|
|
|
|
|
|
|
|
|
|
|
|
Total operating costs and expenses
|
|
|
91,383
|
|
|
74,073
|
|
|
181,441
|
|
|
138,238
|
|
Earnings from equity investment
|
|
|
1,063
|
|
|
—
|
|
|
1,063
|
|
|
—
|
|
Earnings from operations
|
|
|
20,802
|
|
|
18,112
|
|
|
33,846
|
|
|
26,361
|
|
Non-operating (expense) income, net
|
|
|
(21,372)
|
|
|
(10,720)
|
|
|
(30,272)
|
|
|
(20,773)
|
|
(Loss) earnings before income taxes
|
|
|
(570)
|
|
|
7,392
|
|
|
3,574
|
|
|
5,588
|
|
Income tax provision
|
|
|
10,421
|
|
|
(1,120)
|
|
|
8,986
|
|
|
(1,219)
|
|
Net earnings
|
|
|
9,851
|
|
|
6,272
|
|
|
12,560
|
|
|
4,369
|
|
Net (earnings) loss attributable to non-controlling interests
|
|
|
(995)
|
|
|
583
|
|
|
(3,486)
|
|
|
1,067
|
|
Net earnings attributable to Century Casinos, Inc. shareholders
|
|
$
|
8,856
|
|
$
|
6,855
|
|
$
|
9,074
|
|
$
|
5,436
|
|
|
|
|
|
|
|
|
|
|
|
|
|
|
|
Earnings per share attributable to Century Casinos, Inc. shareholders:
|
|
Basic
|
|
$
|
0.30
|
|
$
|
0.23
|
|
$
|
0.30
|
|
$
|
0.18
|
|
Diluted
|
|
$
|
0.28
|
|
$
|
0.22
|
|
$
|
0.29
|
|
$
|
0.18
|
|
|
|
|
|
|
|
|
|
|
|
|
|
|
|
Weighted average common shares
|
|
|
|
|
|
|
|
|
|
|
|
|
|
Basic
|
|
|
29,843
|
|
|
29,579
|
|
|
29,752
|
|
|
29,578
|
|
Diluted
|
|
|
31,506
|
|
|
30,935
|
|
|
31,489
|
|
|
30,708
|
|
|
|
|
|
|
|
|
|
|
|
|
|
|
|
|
|
|
|
|
|
|
|
Condensed Consolidated Balance Sheets
|
|
|
|
|
|
|
|
|
|
June 30,
|
|
December 31,
|
|
Amounts in thousands
|
|
2022
|
|
2021
|
|
Assets
|
|
|
|
|
|
|
|
Current assets
|
|
$
|
216,582
|
|
$
|
140,680
|
|
Property and equipment, net
|
|
|
467,185
|
|
|
472,302
|
|
Other assets
|
|
|
192,055
|
|
|
90,376
|
|
Total assets
|
|
$
|
875,822
|
|
$
|
703,358
|
|
|
|
|
|
|
|
|
|
Liabilities and Equity
|
|
|
|
|
|
|
|
Current liabilities
|
|
$
|
56,023
|
|
$
|
60,433
|
|
Non-current liabilities
|
|
|
661,068
|
|
|
492,568
|
|
Century Casinos, Inc. shareholders' equity
|
|
|
149,201
|
|
|
141,624
|
|
Non-controlling interests
|
|
|
9,530
|
|
|
8,733
|
|
Total liabilities and equity
|
|
$
|
875,822
|
|
$
|
703,358
|
CENTURY CASINOS, INC. AND SUBSIDIARIES
UNAUDITED SUPPLEMENTAL INFORMATION
Reconciliation of Adjusted EBITDA* to Net Earnings (Loss) Attributable to Century Casinos, Inc. Shareholders by Reportable Segment.
|
|
|
|
|
|
|
|
|
|
|
|
|
|
|
|
|
|
|
For the three months ended June 30, 2022
|
|
Amounts in thousands
|
|
|
United States
|
|
|
Canada
|
|
|
Poland
|
|
|
Corporate and Other
|
|
|
Total
|
|
Net earnings (loss) attributable to Century Casinos, Inc. shareholders
|
|
$
|
10,521
|
|
$
|
2,875
|
|
$
|
1,322
|
|
$
|
(5,862)
|
|
$
|
8,856
|
|
Interest expense (income), net (1)
|
|
|
7,103
|
|
|
585
|
|
|
(54)
|
|
|
14,162
|
|
|
21,796
|
|
Income taxes (benefit)
|
|
|
—
|
|
|
574
|
|
|
515
|
|
|
(11,510)
|
|
|
(10,421)
|
|
Depreciation and amortization
|
|
|
4,758
|
|
|
1,226
|
|
|
676
|
|
|
119
|
|
|
6,779
|
|
Net earnings attributable to non-controlling interests
|
|
|
—
|
|
|
334
|
|
|
661
|
|
|
—
|
|
|
995
|
|
Non-cash stock-based compensation
|
|
|
—
|
|
|
—
|
|
|
—
|
|
|
1,012
|
|
|
1,012
|
|
(Gain) loss on foreign currency transactions, cost recovery income and other
|
|
|
—
|
|
|
(34)
|
|
|
(397)
|
|
|
7
|
|
|
(424)
|
|
Loss (gain) on disposition of fixed assets
|
|
|
—
|
|
|
8
|
|
|
1
|
|
|
(121)
|
|
|
(112)
|
|
Acquisition costs
|
|
|
—
|
|
|
—
|
|
|
—
|
|
|
1,297
|
|
|
1,297
|
|
Adjusted EBITDA
|
|
$
|
22,382
|
|
$
|
5,568
|
|
$
|
2,724
|
|
$
|
(896)
|
|
$
|
29,778
|
|
|
|
|
|
|
|
|
|
|
|
|
|
|
|
|
|
|
(1)
| |
Expense of $7.1 million related to the Master Lease is included in interest expense (income), net in the United States segment. Expense of $0.6 million related to the CDR land lease is included in interest expense (income), net in the Canada segment. Cash payments related to the Master Lease and CDR land lease were $6.4 million and $0.7 million, respectively, for the period presented. Expense of $7.3 million related to the write-off of deferred financing costs in connection with the prepayment of the Macquarie Term Loan is included in interest expense (income), net in the Corporate and Other segment. |
|
|
|
|
|
|
|
|
|
|
|
|
|
|
|
|
|
|
|
For the three months ended June 30, 2021
|
|
Amounts in thousands
|
|
|
United States
|
|
|
Canada
|
|
|
Poland
|
|
|
Corporate and Other
|
|
|
Total
|
|
Net earnings (loss) attributable to Century Casinos, Inc. shareholders
|
|
$
|
16,502
|
|
$
|
(1,525)
|
|
$
|
(1,038)
|
|
$
|
(7,084)
|
|
$
|
6,855
|
|
Interest expense (income), net (1)
|
|
|
7,027
|
|
|
396
|
|
|
11
|
|
|
3,253
|
|
|
10,687
|
|
Income taxes (benefit)
|
|
|
—
|
|
|
572
|
|
|
(283)
|
|
|
831
|
|
|
1,120
|
|
Depreciation and amortization
|
|
|
4,509
|
|
|
1,251
|
|
|
768
|
|
|
105
|
|
|
6,633
|
|
Net loss attributable to non-controlling interests
|
|
|
—
|
|
|
(65)
|
|
|
(518)
|
|
|
—
|
|
|
(583)
|
|
Non-cash stock-based compensation
|
|
|
—
|
|
|
—
|
|
|
—
|
|
|
323
|
|
|
323
|
|
Loss on foreign currency transactions and cost recovery income
|
|
|
—
|
|
|
10
|
|
|
18
|
|
|
5
|
|
|
33
|
|
Loss (gain) on disposition of fixed assets
|
|
|
209
|
|
|
—
|
|
|
—
|
|
|
(39)
|
|
|
170
|
|
Adjusted EBITDA
|
|
$
|
28,247
|
|
$
|
639
|
|
$
|
(1,042)
|
|
$
|
(2,606)
|
|
$
|
25,238
|
|
|
|
|
|
|
|
|
|
|
|
|
|
|
|
|
|
|
(1)
| |
Expense of $7.0 million related to the Master Lease is included in interest expense (income), net in the United States segment. Expense of $0.4 million related to the CDR land lease is included in interest expense (income), net in the Canada segment. Cash payments related to the Master Lease and CDR land lease were $6.3 million and $0.6 million, respectively, for the period presented. |
CENTURY CASINOS, INC. AND SUBSIDIARIES
UNAUDITED SUPPLEMENTAL INFORMATION
Reconciliation of Adjusted EBITDA* to Net Earnings (Loss) Attributable to Century Casinos, Inc. Shareholders by Reportable Segment.
|
|
|
|
|
|
|
|
|
|
|
|
|
|
|
|
|
|
|
For the six months ended June 30, 2022
|
|
Amounts in thousands
|
|
|
United States
|
|
|
Canada
|
|
|
Poland
|
|
|
Corporate and Other
|
|
|
Total
|
|
Net earnings (loss) attributable to Century Casinos, Inc. shareholders
|
|
$
|
19,038
|
|
$
|
2,170
|
|
$
|
2,255
|
|
$
|
(14,389)
|
|
$
|
9,074
|
|
Interest expense (income), net (1)
|
|
|
14,109
|
|
|
1,152
|
|
|
(67)
|
|
|
17,395
|
|
|
32,589
|
|
Income taxes (benefit)
|
|
|
—
|
|
|
1,197
|
|
|
1,072
|
|
|
(11,255)
|
|
|
(8,986)
|
|
Depreciation and amortization
|
|
|
9,526
|
|
|
2,452
|
|
|
1,356
|
|
|
240
|
|
|
13,574
|
|
Net earnings attributable to non-controlling interests
|
|
|
—
|
|
|
2,359
|
|
|
1,127
|
|
|
—
|
|
|
3,486
|
|
Non-cash stock-based compensation
|
|
|
—
|
|
|
—
|
|
|
—
|
|
|
1,685
|
|
|
1,685
|
|
Loss (gain) on foreign currency transactions, cost recovery income and other (2)
|
|
|
—
|
|
|
209
|
|
|
(379)
|
|
|
(5)
|
|
|
(175)
|
|
Loss (gain) on disposition of fixed assets
|
|
|
19
|
|
|
23
|
|
|
4
|
|
|
(121)
|
|
|
(75)
|
|
Acquisition costs
|
|
|
—
|
|
|
—
|
|
|
—
|
|
|
2,429
|
|
|
2,429
|
|
Adjusted EBITDA
|
|
$
|
42,692
|
|
$
|
9,562
|
|
$
|
5,368
|
|
$
|
(4,021)
|
|
$
|
53,601
|
|
|
|
|
|
|
|
|
|
|
|
|
|
|
|
|
|
|
(1)
| |
Expense of $14.1 million related to the Master Lease is included in interest expense (income), net in the United States segment. Expense of $1.1 million related to the CDR land lease is included in interest expense (income), net in the Canada segment. Cash payments related to the Master Lease and CDR land lease were $10.6 million and $1.0 million, respectively, for the period presented. Expense of $7.3 million related to the write-off of deferred financing costs in connection with the prepayment of the Macquarie Term Loan is included in interest expense (income), net in the Corporate and Other segment. |
|
(2)
| |
Loss of $2.2 million related to the sale of land and building in Calgary is included in the Canada segment. |
CENTURY CASINOS, INC. AND SUBSIDIARIES
UNAUDITED SUPPLEMENTAL INFORMATION
Reconciliation of Adjusted EBITDA* to Net Earnings (Loss) Attributable to Century Casinos, Inc. Shareholders by Reportable Segment.
|
|
|
|
|
|
|
|
|
|
|
|
|
|
|
|
|
|
|
For the six months ended June 30, 2021
|
|
Amounts in thousands
|
|
|
United States
|
|
|
Canada
|
|
|
Poland
|
|
|
Corporate and Other
|
|
|
Total
|
|
Net earnings (loss) attributable to Century Casinos, Inc. shareholders
|
|
$
|
27,096
|
|
$
|
(5,040)
|
|
$
|
(2,873)
|
|
$
|
(13,747)
|
|
$
|
5,436
|
|
Interest expense (income), net (1)
|
|
|
13,962
|
|
|
703
|
|
|
15
|
|
|
6,530
|
|
|
21,210
|
|
Income taxes (benefit)
|
|
|
—
|
|
|
163
|
|
|
(889)
|
|
|
1,945
|
|
|
1,219
|
|
Depreciation and amortization
|
|
|
9,036
|
|
|
2,473
|
|
|
1,562
|
|
|
205
|
|
|
13,276
|
|
Net earnings (loss) attributable to non-controlling interests
|
|
|
—
|
|
|
367
|
|
|
(1,434)
|
|
|
—
|
|
|
(1,067)
|
|
Non-cash stock-based compensation
|
|
|
—
|
|
|
—
|
|
|
—
|
|
|
582
|
|
|
582
|
|
(Gain) loss on foreign currency transactions, cost recovery income and other
|
|
|
—
|
|
|
(548)
|
|
|
11
|
|
|
(411)
|
|
|
(948)
|
|
Loss (gain) on disposition of fixed assets
|
|
|
282
|
|
|
32
|
|
|
—
|
|
|
(39)
|
|
|
275
|
|
Adjusted EBITDA
|
|
$
|
50,376
|
|
$
|
(1,850)
|
|
$
|
(3,608)
|
|
$
|
(4,935)
|
|
$
|
39,983
|
|
|
|
|
|
|
|
|
|
|
|
|
|
|
|
|
|
|
(1)
| |
Expense of $14.0 million related to the Master Lease is included in interest expense (income), net in the United States segment. Expense of $0.7 million related to the CDR land lease is included in interest expense (income), net in the Canada segment. Cash payments related to the Master Lease and CDR land lease were $10.5 million and $0.9 million, respectively, for the period presented. |
Adjusted EBITDA Margins**
|
|
|
|
|
|
|
|
For the three months
|
For the six months
|
|
|
ended June 30,
|
ended June 30,
|
|
|
2022
|
2021
|
2022
|
2021
|
|
United States
|
32%
|
37%
|
32%
|
36%
|
|
Canada
|
29%
|
10%
|
27%
|
(21%)
|
|
Poland
|
13%
|
(12%)
|
12%
|
(25%)
|
|
Corporate and Other
|
(1378%)
|
(1888%)
|
(4103%)
|
(1884%)
|
|
Consolidated
|
27%
|
27%
|
25%
|
24%
|
|
|
|
|
|
|
CENTURY CASINOS, INC. AND SUBSIDIARIES
UNAUDITED SUPPLEMENTAL INFORMATION
* The Company defines Adjusted EBITDA as net earnings (loss) attributable to Century Casinos, Inc. shareholders before interest expense (income), net, income taxes (benefit), depreciation and amortization, non-controlling interests net earnings (loss) and transactions, pre-opening expenses, acquisition costs, non-cash stock-based compensation charges, asset impairment costs, loss (gain) on disposition of fixed assets, discontinued operations, (gain) loss on foreign currency transactions, cost recovery income and other, gain on business combination and certain other one-time transactions. Expense related to the Master Lease and CDR land lease is included in the interest expense (income), net line item. Intercompany transactions consisting primarily of management and royalty fees and interest, along with their related tax effects, are excluded from the presentation of net earnings (loss) attributable to Century Casinos, Inc. shareholders and Adjusted EBITDA reported for each segment. Non-cash stock-based compensation expense is presented under Corporate and Other as the expense is not allocated to reportable segments when reviewed by the Company’s chief operating decision makers. Not all of the aforementioned items occur in each reporting period, but have been included in the definition based on historical activity. These adjustments have no effect on the consolidated results as reported under US GAAP. Adjusted EBITDA is not considered a measure of performance recognized under US GAAP. Management believes that Adjusted EBITDA is a valuable measure of the relative performance of the Company and its properties. The gaming industry commonly uses Adjusted EBITDA as a method of arriving at the economic value of a casino operation. Management uses Adjusted EBITDA to compare the relative operating performance of separate operating units by eliminating the above-mentioned items associated with the varying levels of capital expenditures for infrastructure required to generate revenue and the often high cost of acquiring existing operations. Adjusted EBITDA is used by the Company’s lending institution to gauge operating performance. The Company’s computation of Adjusted EBITDA may be different from, and therefore may not be comparable to, similar measures used by other companies within the gaming industry. Please see the reconciliation of Adjusted EBITDA to net earnings (loss) attributable to Century Casinos, Inc. shareholders above.
** The Company defines Adjusted EBITDA margin as Adjusted EBITDA divided by net operating revenue. Adjusted EBITDA margin is a non-US GAAP measure. Management uses this margin as one of several measures to evaluate the efficiency of the Company’s casino operations.
About Century Casinos, Inc.:
Century Casinos, Inc. is a casino entertainment company. The Company owns and operates Century Casino & Hotels in Cripple Creek and Central City, Colorado, and in Edmonton, Alberta, Canada; the Century Casino in Cape Girardeau and Caruthersville, Missouri, and in St. Albert, Alberta, Canada; Mountaineer Casino, Racetrack & Resort in New Cumberland, West Virginia; and the Century Mile Racetrack and Casino in Edmonton, Alberta, Canada. Through its Austrian subsidiary, CRM, the Company holds a 66.6% ownership interest in Casinos Poland Ltd., the owner and operator of eight casinos throughout Poland; and a 75% ownership interest in Century Downs Racetrack and Casino in Calgary, Alberta, Canada. Through its United States subsidiary, Century Nevada Acquisition, Inc., the Company owns a 50% membership interest in PropCo, which owns the land and building of OpCo in Sparks, Nevada. The Company has an agreement to purchase 100% of the membership interests in OpCo. The Company also has an agreement to operate one ship-based casino. The Company continues to pursue other projects in various stages of development.
Century Casinos’ common stock trades on The Nasdaq Capital Market® under the symbol CNTY. For more information about Century Casinos, visit our website at www.cnty.com.
CENTURY CASINOS, INC. AND SUBSIDIARIES
UNAUDITED SUPPLEMENTAL INFORMATION
This release may contain “forward-looking statements” within the meaning of Section 27A of the Securities Act of 1933, as amended, Section 21E of the Securities Exchange Act of 1934, as amended, and the Private Securities Litigation Reform Act of 1995. These statements are based on the beliefs and assumptions of the management of Century Casinos based on information currently available to management. Such forward-looking statements include, but are not limited to, statements regarding future results of operations, including statements about operating margins and Adjusted EBITDA, the impact of the coronavirus (COVID-19) pandemic, estimates of the financial impact of COVID-19, the adequacy of cash flows from operations and available cash to meet our future liquidity needs, particularly if we cannot operate our casinos due to COVID-19 or their operations are restricted, operating efficiencies, synergies and operational performance, the prospects for and timing and costs of new projects, projects in development and other opportunities, our Goldman Credit Agreement and obligations under our Master Lease and our ability to repay our debt and other obligations, investments in joint ventures, outcomes of legal proceedings, changes in our tax provisions or exposure to additional income tax liabilities, certain plans, expectations, goals, projections, and statements about the benefits of the Acquisition, as well as our plans, objectives, expectations, intentions, and other statements relating to cash flow, operating results and debt repayment; the possibility that the OpCo Acquisition does not close when expected or at all because regulatory or other conditions to closing are not satisfied on a timely basis or at all; potential adverse reactions or changes to business or employee relationships, including those resulting from the completion of the Acquisition; the possibility that the anticipated benefits of the Acquisition are not realized when expected or at all and plans for our casinos and our Company. Such forward-looking statements are subject to risks, uncertainties and other factors that could cause actual results to differ materially from future results expressed or implied by such forward-looking statements. Important factors that could cause actual results to differ materially from the forward-looking statements include, among others, the risks described in the section entitled “Risk Factors” under Item 1A in our Annual Report on Form 10-K for the year ended December 31, 2021, and in subsequent periodic and current SEC filings we may make. Century Casinos disclaims any obligation to revise or update any forward-looking statement that may be made from time to time by it or on its behalf.
Exhibit 99.2
CENTURY CASINOS FINANCIAL RESULTS Q2 2022 0
Forward-Looking Statements, Business Environment & Risk Factors CENTURY CASINOS This presentation may contain “forward-looking statements” within the meaning of Section 27A of the Securities Act of 1933, as amended, Section 21E of the Securities Exchange Act of 1934, as amended (the “Exchange Act”), and the Private Securities Litigation Reform Act of 1995. In addition, Century Casinos, Inc. (together with its subsidiaries, the “Company”, “we”, “us”, “our”) may make other written and oral communications from time to time that contain such statements. Forward-looking statements include statements as to industry trends and future expectations of the Company and other matters that do not relate strictly to historical facts and are based on certain assumptions by management at the time such statements are made. Forward-looking statements in this presentation include statements regarding the hotel and casino projects in Missouri, future results of operations, including statements about operating margins, the impact of the coronavirus (COVID-19) pandemic, estimates of the financial impact of COVID-19, the adequacy of cash flows from operations and available cash to meet our future liquidity needs, particularly if we cannot operate our casinos due to COVID-19 or their operations are restricted, operating efficiencies, synergies and operational performance, the prospects for and timing and costs of new projects, projects in development and other opportunities, the Goldman Credit Agreement (as defined herein) and obligations under our Master Lease (as defined herein) and the ability to repay debt and other obligations, investments in joint ventures, outcomes of legal proceedings, changes in our tax provisions or exposure to additional income tax liabilities, certain plans, expectations, goals, projections, and statements about the benefits of the Acquisition (as defined herein), the possibility that the OpCo Acquisition (as defined herein) does not close when expected or at all because regulatory or other conditions to closing are not satisfied on a timely basis or at all; potential adverse reactions or changes to business or employee relationships, including those resulting from the completion of the Acquisition; the possibility that the anticipated benefits of the Acquisition are not realized when expected or at all and plans for our casinos and our Company. These statements are often identified by the use of words such as “may,” “will,” “expect,” “believe,” “anticipate,” “intend,” “could,” “estimate,” or “continue,” and similar expressions or variations. These statements are based on the beliefs and assumptions of the management of the Company based on information currently available to management. Such forward-looking statements are subject to risks, uncertainties and other factors that could cause actual results to differ materially from future results expressed or implied by such forward-looking statements. Important factors that could cause actual results to differ materially from the forward-looking statements include, among others, the risks described in the section entitled “Risk Factors” under Item 1A in our Annual Report on Form 10-K for the year ended December 31, 2021 (the “2021 Annual Report”) and our subsequent periodic and current reports filed with the SEC. We caution the reader to carefully consider such factors. Furthermore, such forward-looking statements speak only as of the date on which such statements are made. We undertake no obligation to update any forward-looking statements to reflect events or circumstances after the date of such statements. 1
Notes on Presentation CENTURY CASINOS In this presentation the term “USD” refers to US dollars, the term “CAD” refers to Canadian dollars and the term “PLN” refers to Polish zloty. Adjusted EBITDA, Adjusted EBITDA margin and Net Debt are non-GAAP financial measures. See Appendix for the definition and reconciliation of Adjusted EBITDA, Adjusted EBITDA margin and Net Debt. Amounts presented are rounded. As such, rounding differences could occur in period-over-period changes and percentages reported throughout this presentation. The names of the Company’s subsidiaries and certain operating segments are abbreviated on certain of the following slides. See Appendix for a list of the subsidiaries and their abbreviations. 2
New Developments CENTURY CASINOS COVID-19 UPDATE Since the inception of the COVID-19 pandemic in March 2020, the Company’s casinos have varied their operations based on the governmental health and safety requirements in the jurisdictions in which they are located. The COVID-19 pandemic impacted the Company’s results of operations in the first half of 2021 because of closures at the Company’s Canada and Poland properties during this period. Currently the Company’s operations have no health and safety requirements for entry and few other COVID-19 related restrictions. The duration and ultimate impact of the COVID-19 pandemic otherwise remains uncertain. NUGGET CASINO RESORT ACQUISITION AND FINANCING On April 1, 2022, the Company purchased 50% of the membership interest in Smooth Bourbon, LLC (“PropCo”) for approximately $95.0 million (the “PropCo Acquisition”). Pursuant to a definitive agreement and subject to approval from the Nevada Gaming Commission, the Company will purchase 100% of the membership interests in Nugget Sparks, LLC (“OpCo”) for $100.0 million (subject to certain adjustments) (the “OpCo Acquisition” and together with the PropCo Acquisition, the “Acquisition”). The OpCo Acquisition is expected to occur within one year of the PropCo Acquisition. OpCo owns and operates the Nugget Casino Resort in Sparks, Nevada and PropCo owns the real property on which the casino is located and leases the real property to OpCo for an annual rent of $15.0 million. On April 1, 2022, the Company also entered into a Credit Agreement with Goldman Sachs Bank USA (the “Goldman Credit Agreement”). The Goldman Credit Agreement provides for a $350.0 million term loan (the “Term Loan”) and a $30.0 million revolving credit facility (the “Revolving Facility”). The Company drew $350.0 million under the Term Loan and used the proceeds as well as approximately $29.3 million of cash on hand to fund the PropCo acquisition, to repay approximately $166.2 million outstanding under the Company’s credit agreement with Macquarie (“Macquarie Credit Agreement”), to fund a $100.0 million escrow fund that will be used to purchase OpCo, and for related fees and expenses. The Goldman Credit Agreement replaces the Macquarie Credit Agreement. The Company did not draw on the Revolving Facility on the closing date of the PropCo acquisition. 3

FINANCIAL RESULTS CENTURY CASINOS 4

Net Operating Revenue Q2 2022 by Reportable Segment and Operating Segment (1) (in USD) CENTURY CASINOS Canada 17% United States 63% Poland 20% Edmonton 12% Calgary 5% Colorado 10% West Virginia 27% Missouri 26% Poland 20% 1. Excludes the Corporate and Other Reportable Segment. 5
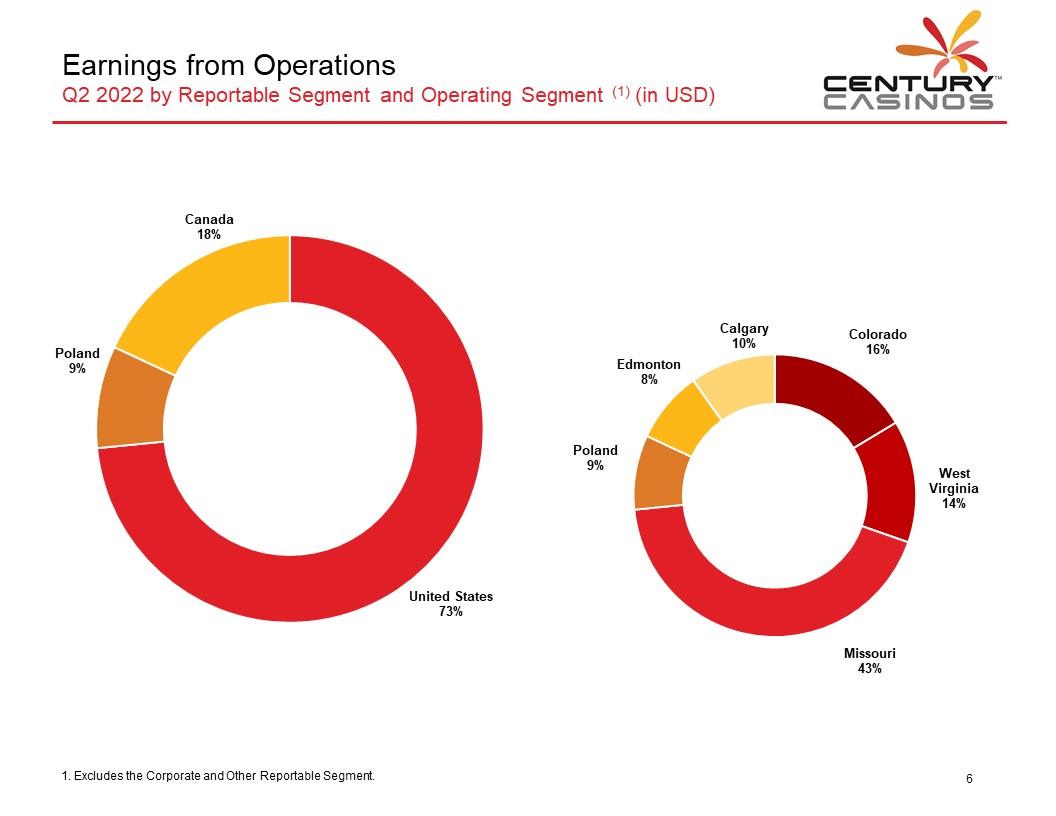
Earnings from Operations Q2 2022 by Reportable Segment and Operating Segment (1) (in USD) CENTURY CASINOS Canada 18% United States 73% Poland 9% Calgary 10% Edmonton 8% Poland 9% Colorado 16% West Virginia 14% Missouri 43% 1. Excludes the Corporate and Other Reportable Segment. 6
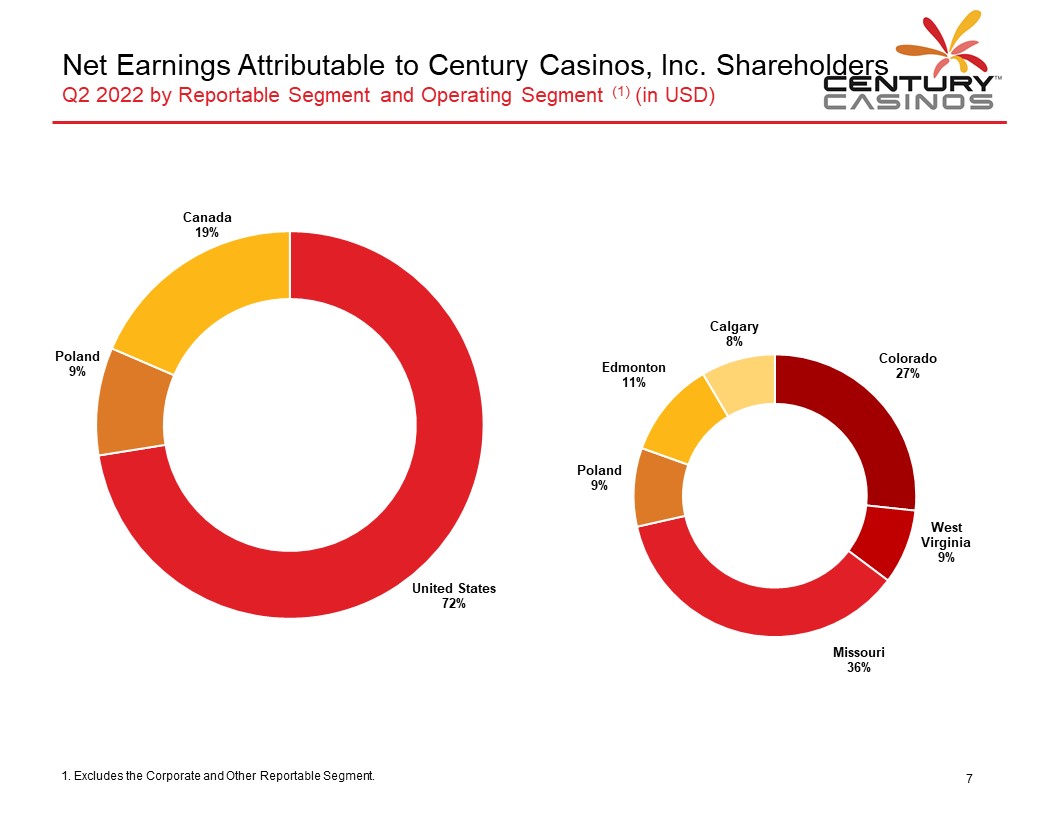
Net Earnings Attributable to Century Casinos, Inc. Shareholders Q2 2022 by Reportable Segment and Operating Segment (1) (in USD) CENTURY CASINOS Canada 19% United States 72% Poland 9% Calgary 8% Colorado 27% West Virginia 9% Missouri 36% Edmonton 11% Poland 9% 1. Excludes the Corporate and Other Reportable Segment. 7
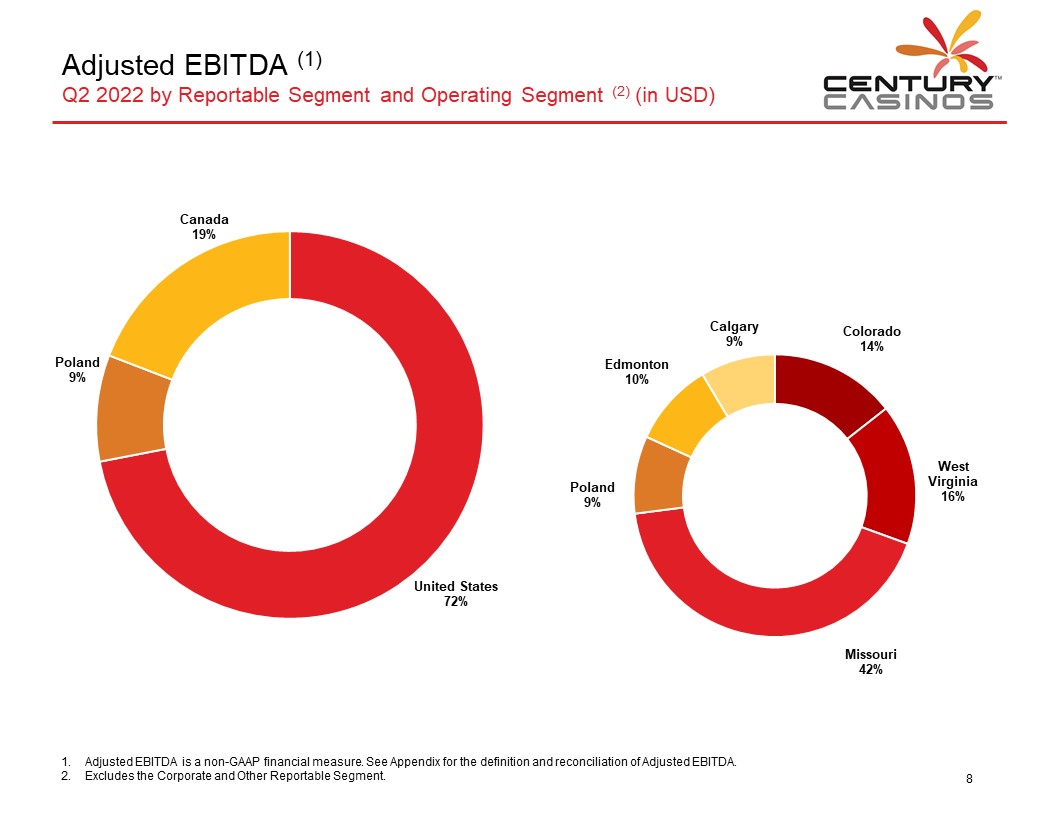
Adjusted EBITDA (1) Q2 2022 by Reportable Segment and Operating Segment (2) (in USD) CENTURY CASINOS Canada 19% United States 72% Poland 9% Calgary 9% Colorado 14% West Virginia 16% Missouri 42% Poland 9% Edmonton 10% Adjusted EBITDA is a non-GAAP financial measure. See Appendix for the definition and reconciliation of Adjusted EBITDA. Excludes the Corporate and Other Reportable Segment. 8
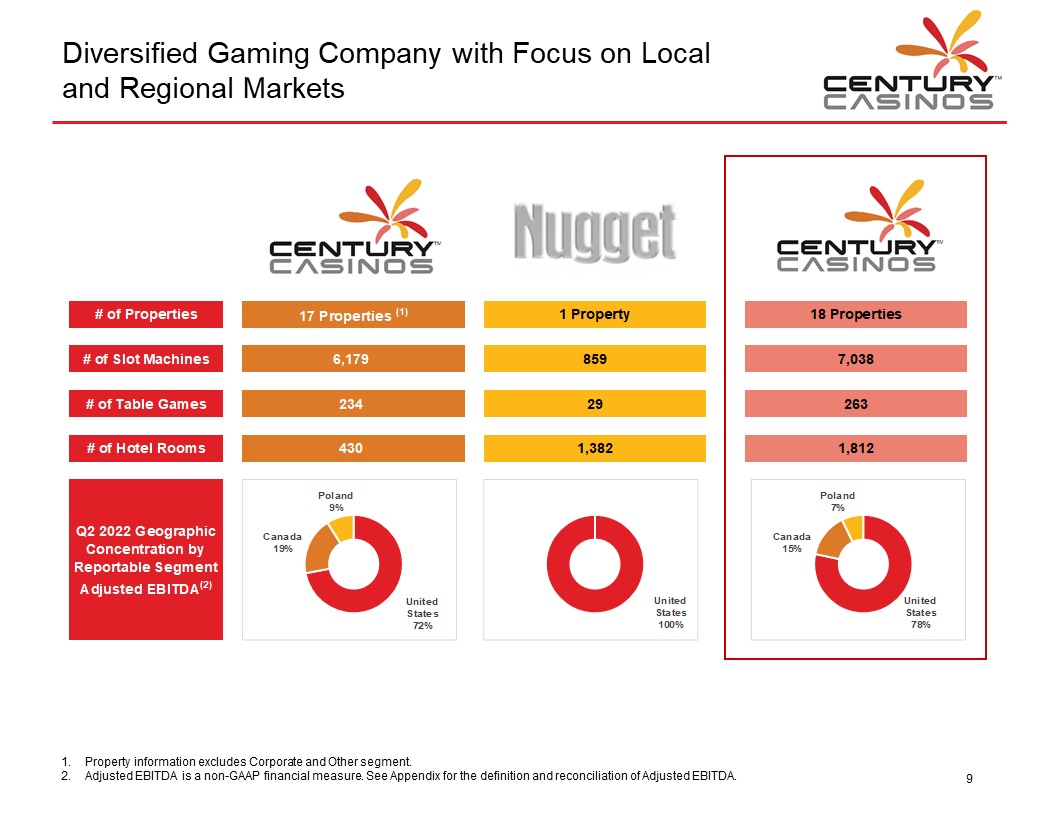
Diversified Gaming Company with Focus on Local and Regional Markets CENTURY CASINOS # of Properties # of Slot Machines # of Table Games # of Hotel Rooms Q2 2022 Geographic Concentration by Reportable Segment Adjusted EBITDA(2) CENTURY CASINOS 17 Properties (1) 6,179 234 430 Poland 9% Canada 19% United States 72% Nugget 1 Property 859 29 1,382 United States 100% CENTURY CASINOS 18 Properties 7,038 263 1,812 Poland 7% United States 78% Canada 15% 1. Property information excludes Corporate and Other segment. 2. Adjusted EBITDA is a non-GAAP financial measure. See Appendix for the definition and reconciliation of Adjusted EBITDA. 9
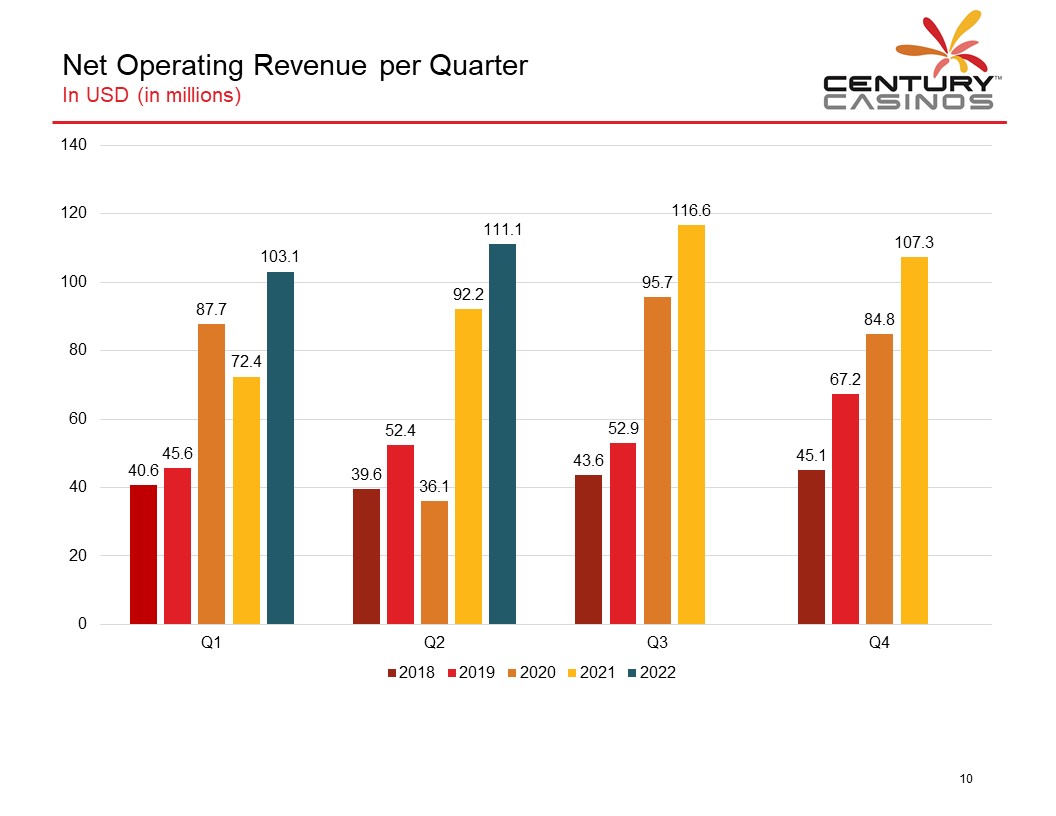
Net Operating Revenue per Quarter In USD (in millions) CENTURY CASINOS 140 120 100 80 60 40 20 0 Q1 40.6 45.6 87.7 72.4 103.1 Q2 39.6 52.4 36.1 92.2 111.1 Q3 43.6 52.9 95.7 116.6 Q4 45.1 67.2 84.8 107.3 2018 2019 2020 2021 2022 10
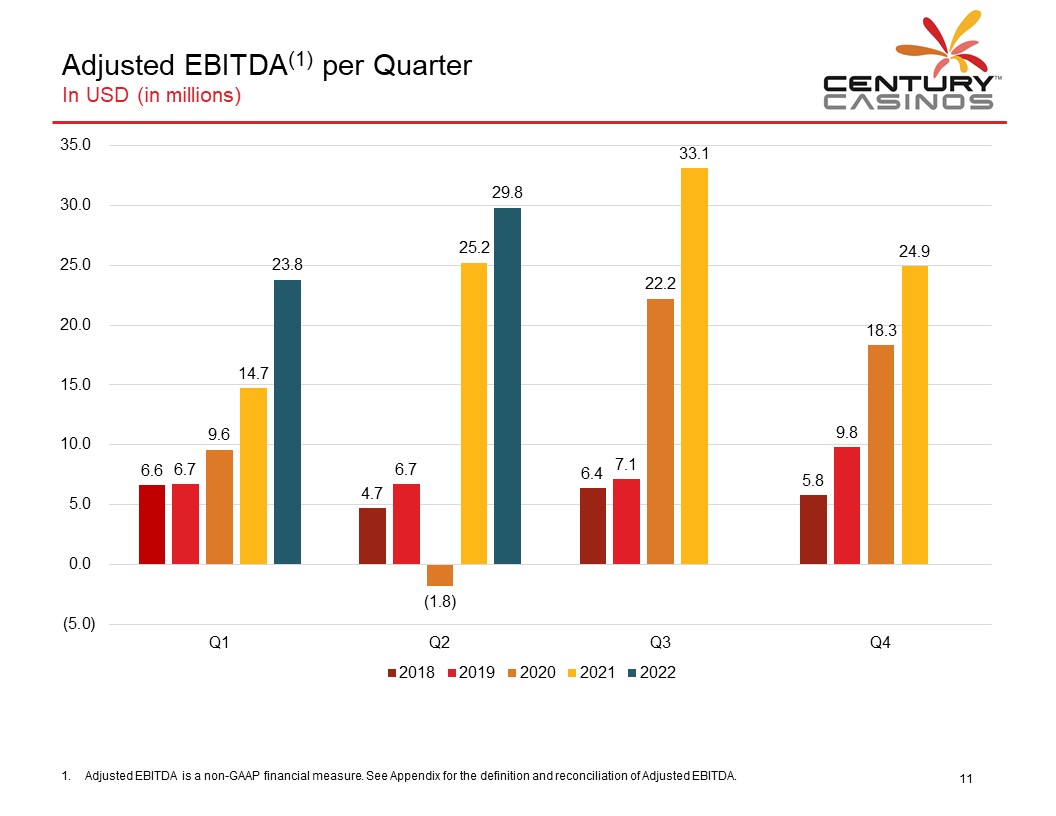
Adjusted EBITDA(1) per Quarter In USD (in millions) CENTURY CASINOS 35.0 30.0 25.0 20.0 15.0 10.0 5.0 0 (5.0) Q1 6.6 6.7 9.6 14.7 23.8 Q2 4.7 6.7 (1.8) 25.2 29.8 Q3 6.4 7.1 22.2 33.1 Q4 5.8 9.8 18.3 24.9 2018 2019 2020 2021 2022 1. Adjusted EBITDA is a non-GAAP financial measure. See Appendix for the definition and reconciliation of Adjusted EBITDA. 11
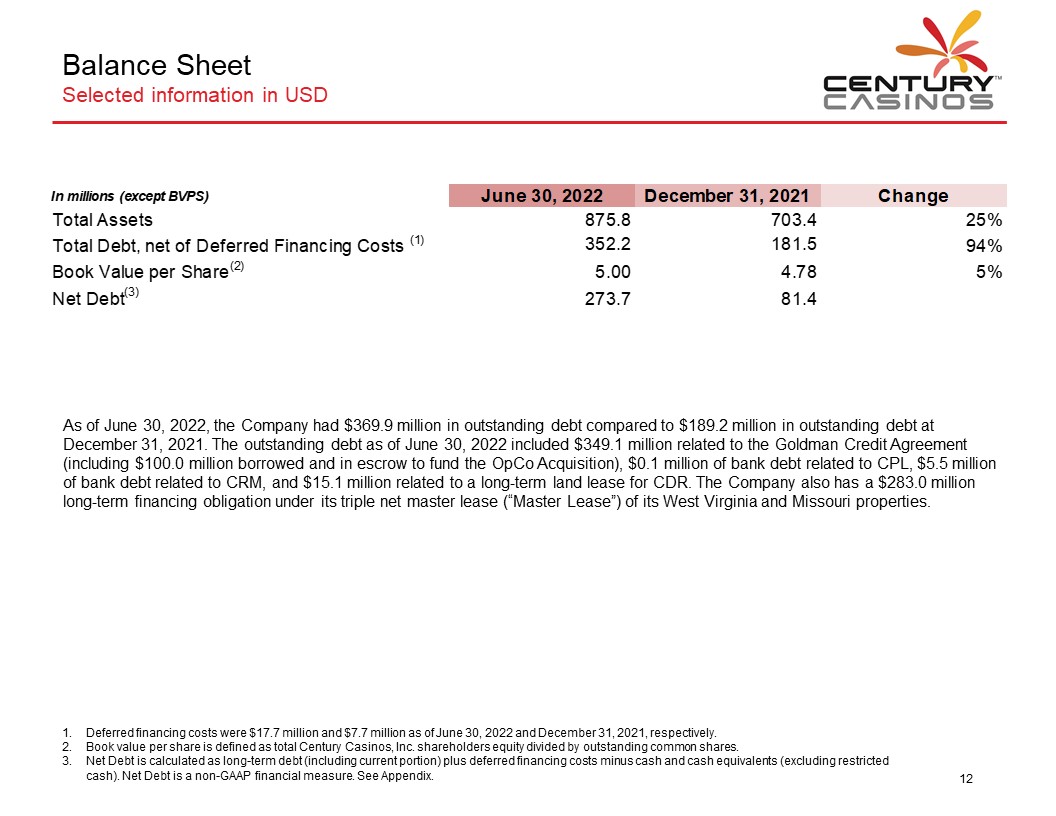
Balance Sheet Selected information in USD CENTURY CASINOS in millons (except BVPS) June 30,2022 December 31,2021 Change Total Assets 875.8 703.4 25% Total Debt, net of Deferred Financing Costs (1) 352.2 181.5 94% Book Value per Share (2) 5.00 4.78 5% Net Debt (3) 273.7 81.4 As of June 30, 2022, the Company had $369.9 million in outstanding debt compared to $189.2 million in outstanding debt at December 31, 2021. The outstanding debt as of June 30, 2022 included $349.1 million related to the Goldman Credit Agreement (including $100.0 million borrowed and in escrow to fund the OpCo Acquisition), $0.1 million of bank debt related to CPL, $5.5 million of bank debt related to CRM, and $15.1 million related to a long-term land lease for CDR. The Company also has a $283.0 million long-term financing obligation under its triple net master lease (“Master Lease”) of its West Virginia and Missouri properties. 1. Deferred financing costs were $17.7 million and $7.7 million as of June 30, 2022 and December 31, 2021, respectively. 2. Book value per share is defined as total Century Casinos, Inc. shareholders equity divided by outstanding common shares. 3. Net Debt is calculated as long-term debt (including current portion) plus deferred financing costs minus cash and cash equivalents (excluding restricted cash). Net Debt is a non-GAAP financial measure. See Appendix. 12
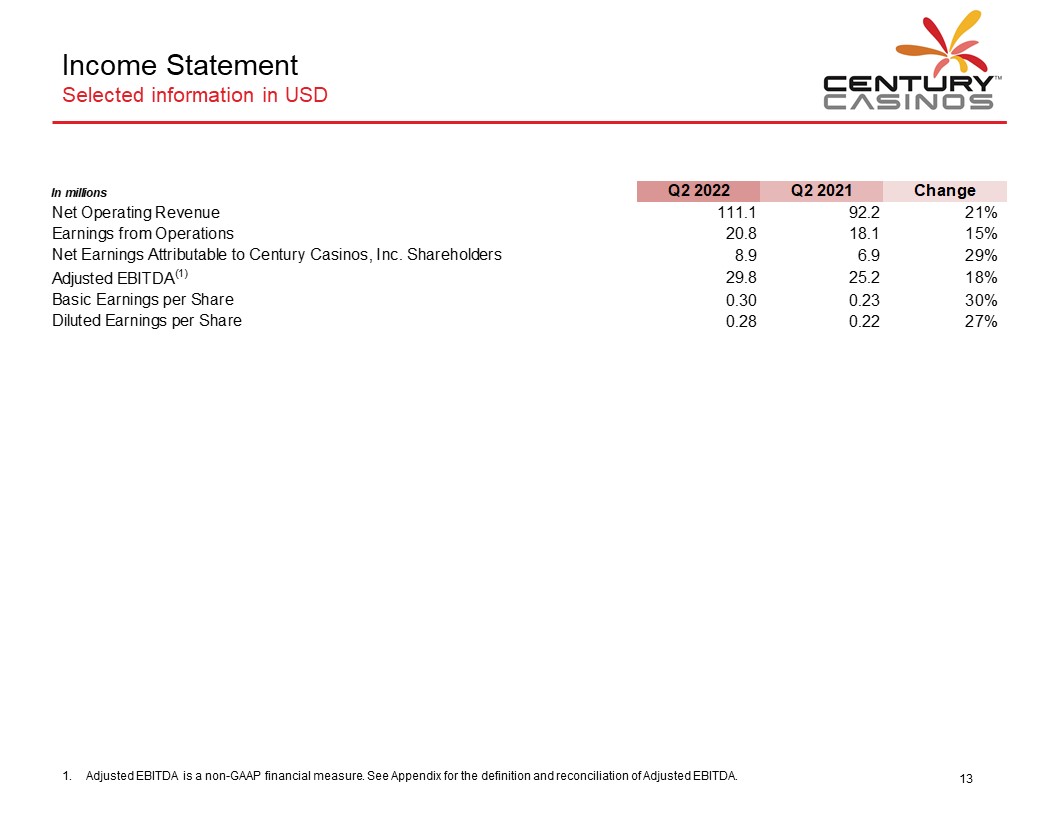
Income Statement Selected information in USD CENTURY CASINOS In millions Q2 2022 Q2 2021 Change Net Operating Revenue 111.1 92.2 21% Earnings from Operations 20.8 18.1 15% Net Earnings Attributable to Century Casinos, Inc. Shareholders 8.9 6.9 29% Adjusted EBITDA(1) 29.8 25.2 18% Basic Earnings per Share 0.30 023 30% Diluted Earnings per Share 0.28 022 27% 1. Adjusted EBITDA is a non-GAAP financial measure. See Appendix for the definition and reconciliation of Adjusted EBITDA. 13
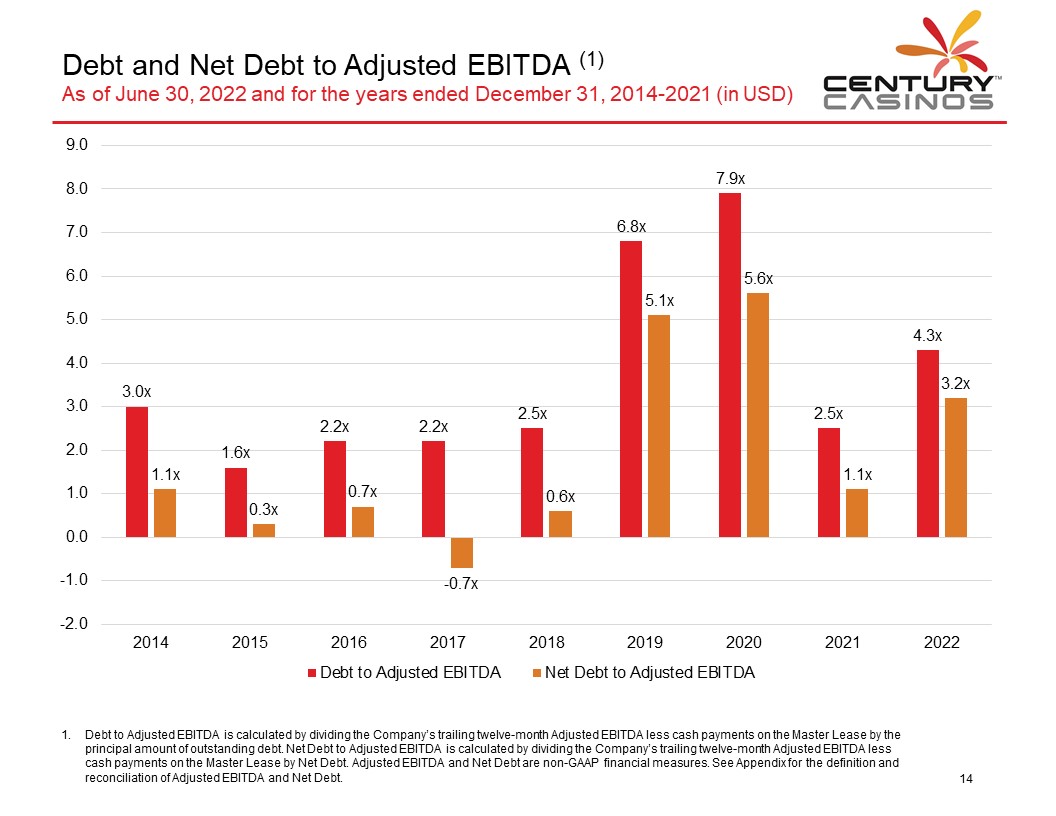
Debt and Net Debt to Adjusted EBITDA (1) As of June 30, 2022 and for the years ended December 31, 2014-2021 (in USD) CENTURY CASINOS 9.0 8.0 7.0 6.0 5.0 4.0 3.0 2.0 1.0 0.0 -1.0 -2.0 2014 3.0x 1.1x 2015 1.6x 0.3x 2016 2.2x 0.7x 2017 2.2x -0.7x 2018 2.5x 0.6x 2019 6.8x 5.1x 2020 7.9x 5.6x 2021 2.5x 1.1x 2022 4.3x 3.2x 1. Debt to Adjusted EBITDA is calculated by dividing the Company’s trailing twelve-month Adjusted EBITDA less cash payments on the Master Lease by the principal amount of outstanding debt. Net Debt to Adjusted EBITDA is calculated by dividing the Company’s trailing twelve-month Adjusted EBITDA less cash payments on the Master Lease by Net Debt. Adjusted EBITDA and Net Debt are non-GAAP financial measures. See Appendix for the definition and reconciliation of Adjusted EBITDA and Net Debt. 14
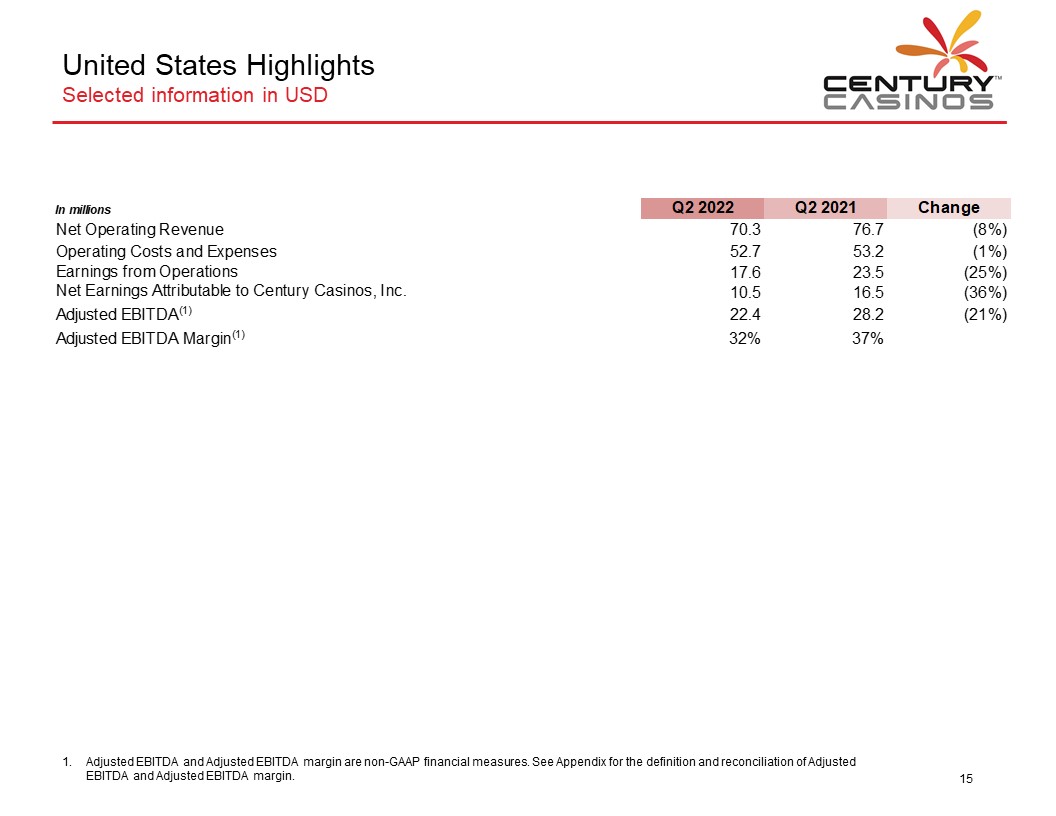
United States Highlights Selected information in USD CENTURY CASINOS In millions Q2 2022 Q2 2021 Change Net Operating Revenue 70.3 76.7 (8%) Operating Costs and Expenses 52.7 53.2 (1%) Earnings from Operations 17.6 23.5 (25%) Net Earnings Attributable to Century Casinos, Inc. 10.5 16.5 (36%) Adjusted EBITDA(1) 22.4 28.2 (21%) Adjusted EBITDA Margin(1) 32% 37% 1. Adjusted EBITDA and Adjusted EBITDA margin are non-GAAP financial measures. See Appendix for the definition and reconciliation of Adjusted EBITDA and Adjusted EBITDA margin. 15
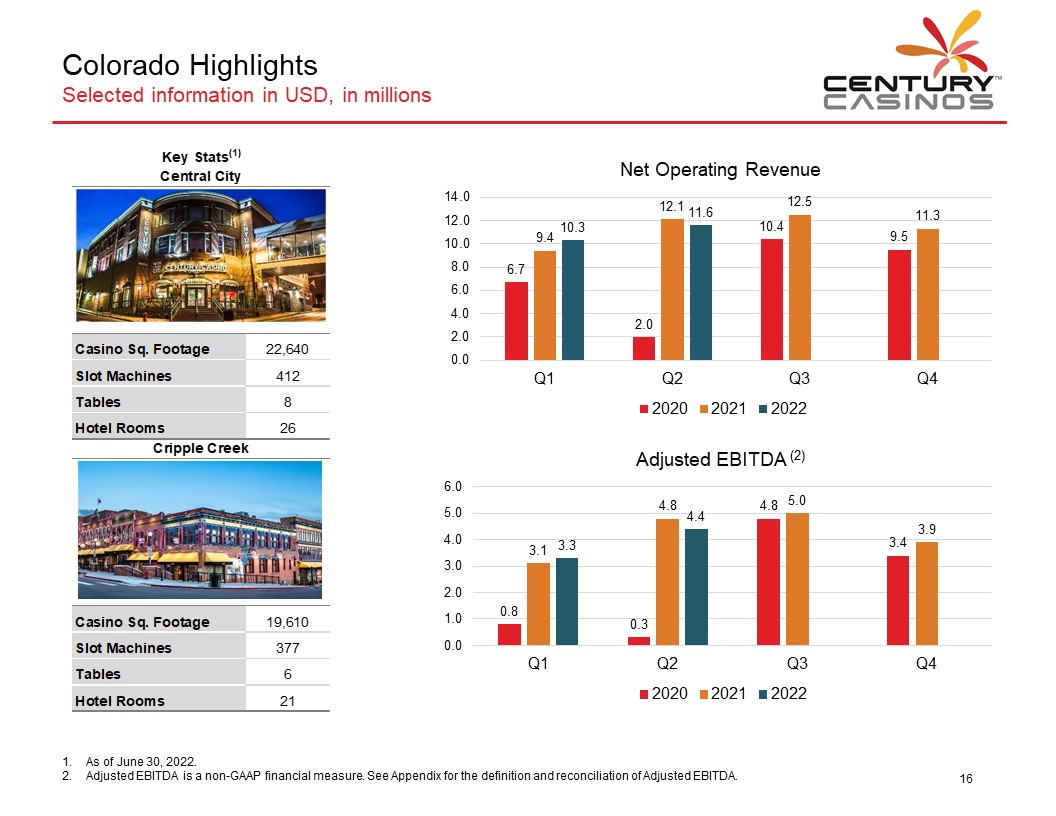
Colorado Highlights Selected information in USD, in millions CENTURY CASINOS Key Stats (1) Central City Casino Sq. Footage 22,640 Slot Machines 412 Tables 8 Hotel Rooms 26 Net Operating Revenue 14.0 12.0 10.0 8.0 6.0 4.0 2.0 0.0 Q1 6.7 9.4 10.3 Q2 2.0 12.1 11.6 Q3 10.4 12.5 Q4 9.5 11.3 2020 2021 2022 Cripple Creek Casino Sq. Footage 19,610 Slot Machines 377 Tables 6 Hotel Rooms 21 Adjusted EBITDA (2) 6.0 5.0 4.0 3.0 2.0 1.0 0.0 Q1 0.8 3.1 3.3 Q2 0.3 4.8 4.4 Q3 4.8 5.0 Q4 3.4 3.9 2020 2021 2022 1. As of June 30, 2022. 2. Adjusted EBITDA is a non-GAAP financial measure. See Appendix for the definition and reconciliation of Adjusted EBITDA. 16
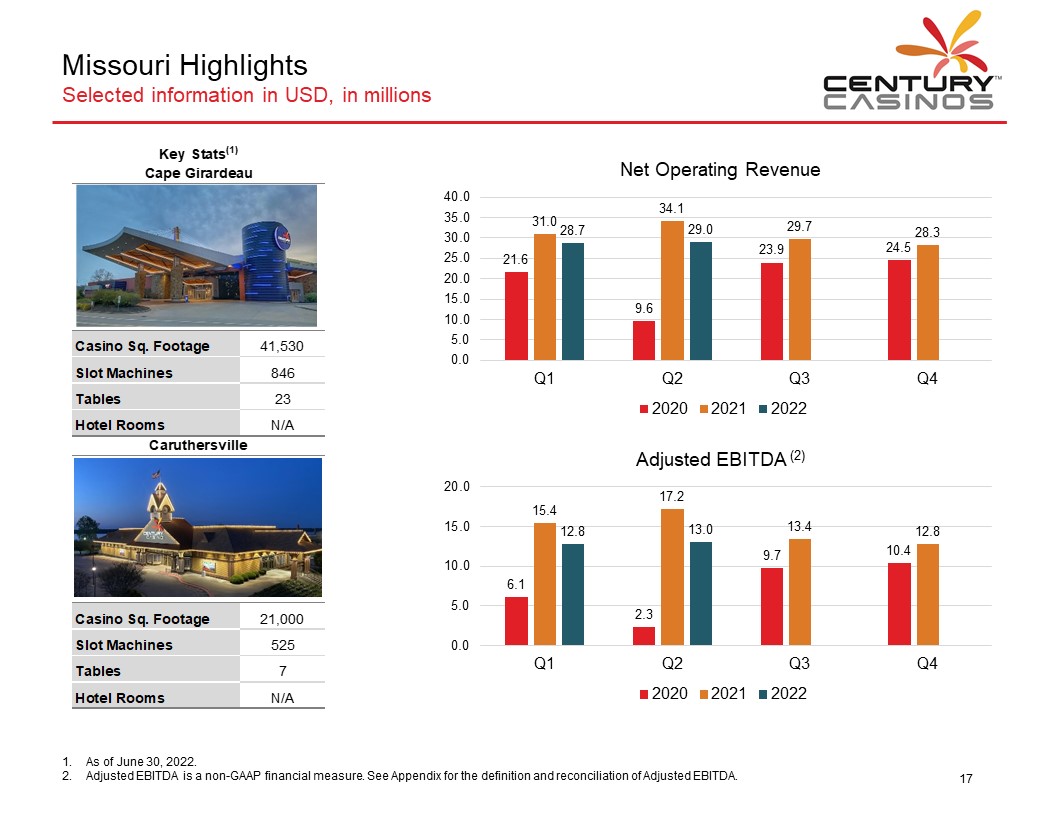
Missouri Highlights Selected information in USD, in millions CENTURY CASINOS Key Stats (1) Cape Girardeau Casino Sq. Footage 41,530 Slot Machines 846 Tables 23 Hotel Rooms N/A Net Operating Revenue 40.0 35.0 30.0 25.0 20.0 15.0 10.0 5.0 0.0 Q1 21.6 31.0 28.7 Q2 9.6 34.1 29.0 Q3 23.9 29.7 Q4 24.5 28.3 2020 2021 2022 Caruthersville Casino Sq. Footage 21,000 Slot Machines 525 Tables 7 Hotel Rooms N/A Adjusted EBITDA (2) 20.0 15.0 10.0 5.0 0.0 Q1 6.1 15.4 12.8 Q2 2.3 17.2 13.0 Q3 9.7 13.4 Q4 10.4 12.8 2020 2021 2022 1. As of June 30, 2022. 2. Adjusted EBITDA is a non-GAAP financial measure. See Appendix for the definition and reconciliation of Adjusted EBITDA. 17
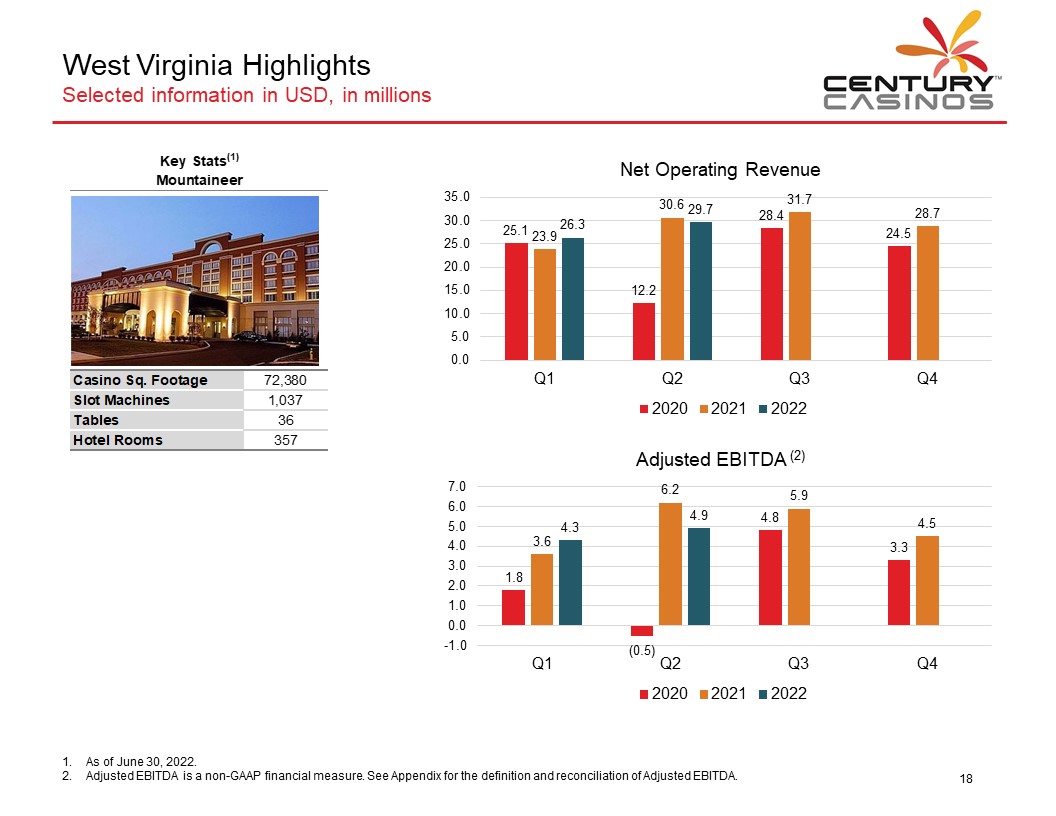
West Virginia Highlights Selected information in USD, in millions CENTURY CASINOS Key Stats(1) Mountaineer Casino Sq. Footage 72,380 Slot Machines 1,037 Tables 36 Hotel Rooms 357 Net Operating Revenue 35.0 30.0 25.0 20.0 15.0 10.0 5.0 0.0 Q1 25.1 23.9 26.3 Q2 12.2 30.6 29.7 Q3 28.4 31.7 Q4 24.5 28.7 2020 2021 2022 Adjusted EBITDA (2) 7.0 6.0 5.0 4.0 3.0 2.0 1.0 0.0 -1.0 Q1 1.8 3.6 4.3 Q2 (0.5) 6.2 4.9 Q3 4.8 5.9 Q4 3.3 4.5 2020 2021 2022 1. As of June 30, 2022. 2. Adjusted EBITDA is a non-GAAP financial measure. See Appendix for the definition and reconciliation of Adjusted EBITDA. 18
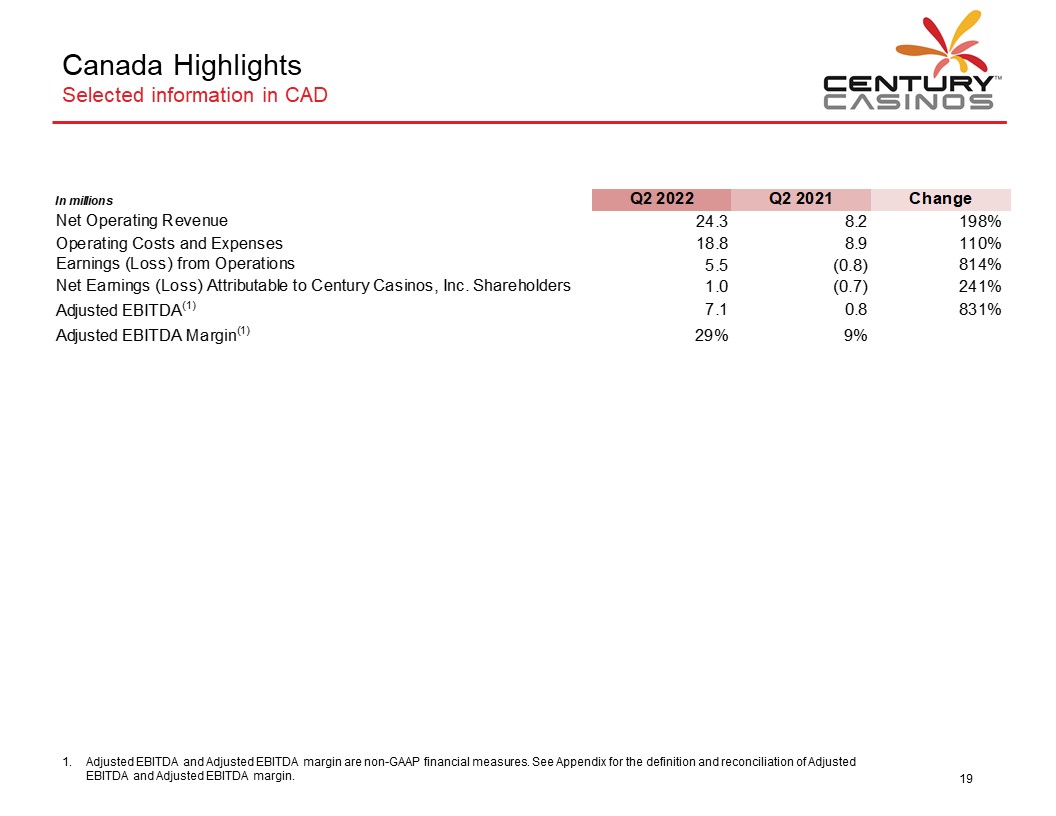
Canada Highlights Selected information in CAD CENTURY CASINOS In millions Q2 2022 Q2 2021 Change Net Operating Revenue 24.3 8.2 198% Operating Costs and Expenses 18.8 8.9 110% Earnings (Loss) from Operations 5.5 (0.8) 814% Net Earnings (Loss) Attributable to Century Casinos. Inc. Shareholders 1.0 (0.7) 241% Adjusted EBITDA(1) 7.1 0.8 831% Adjusted EBITDA Margin(1) 29% 9% 1. Adjusted EBITDA and Adjusted EBITDA margin are non-GAAP financial measures. See Appendix for the definition and reconciliation of Adjusted EBITDA and Adjusted EBITDA margin. 19
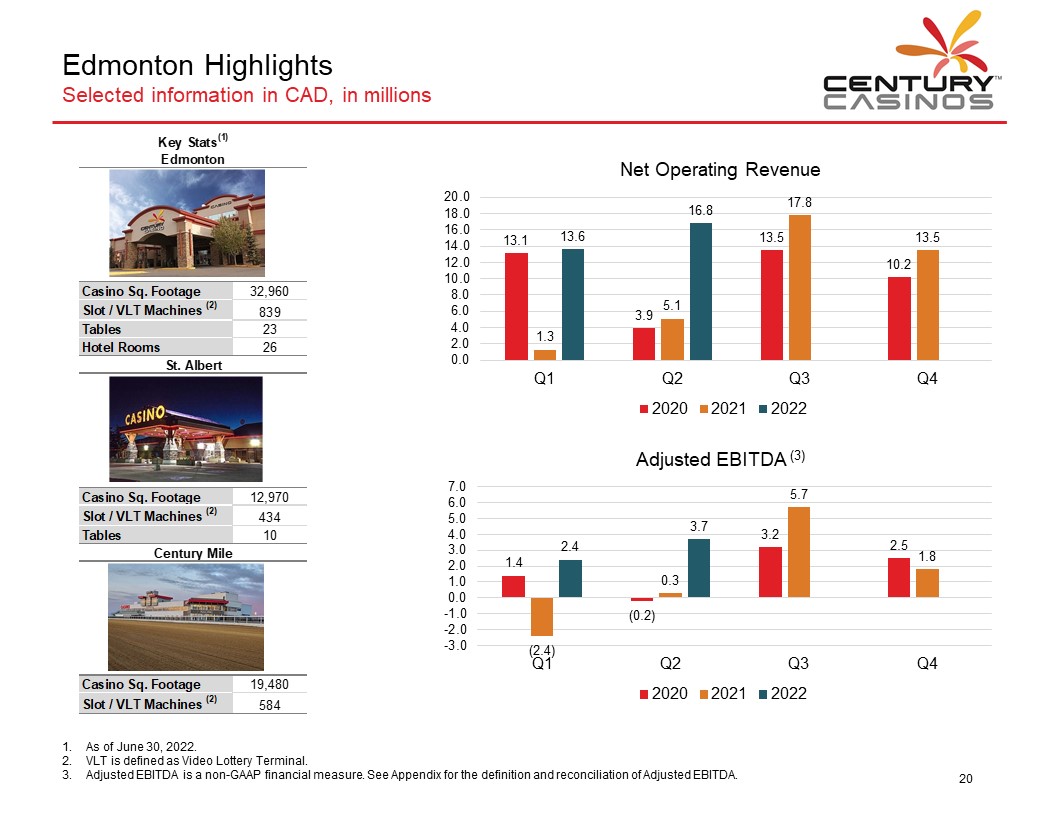
Edmonton Highlights Selected information in CAD, in millions CENTURY CASINOS Key Stats(1) Edmonton Casino Sq. Footage 32,960 Slot / VLT Machines (2) 839 Tables 23 Hotel Rooms 26 St Albert Casino Sq. Footage 12,970 Slot/VLT Machines (2) 434 Tables 10 Century Mile Casino Sq. Footage 19,480 Slot/VLT Machines (2) 584 Net Operating Revenue 20.0 18.0 16.0 14.0 12.0 10.0 8.0 6.0 4.0 2.0 0.0 Q1 13.1 1.3 13.6 Q2 3.9 5.1 16.8 Q3 13.5 17.8 Q4 1.2 13.5 2020 2021 2022 Adjusted EBITDA (3) 7.0 6.0 5.0 4.0 3.0 2.0 1.0 0.0 -1.0 -2.0 -3.0 Q1 1.4 (2.4) 2.4 Q2 (0.2) 0.3 3.7 Q3 3.2 5.7 Q4 2.5 1.8 2020 2021 2022 1. As of June 30, 2022. 2. VLT is defined as Video Lottery Terminal. 3. Adjusted EBITDA is a non-GAAP financial measure. See Appendix for the definition and reconciliation of Adjusted EBITDA. 20
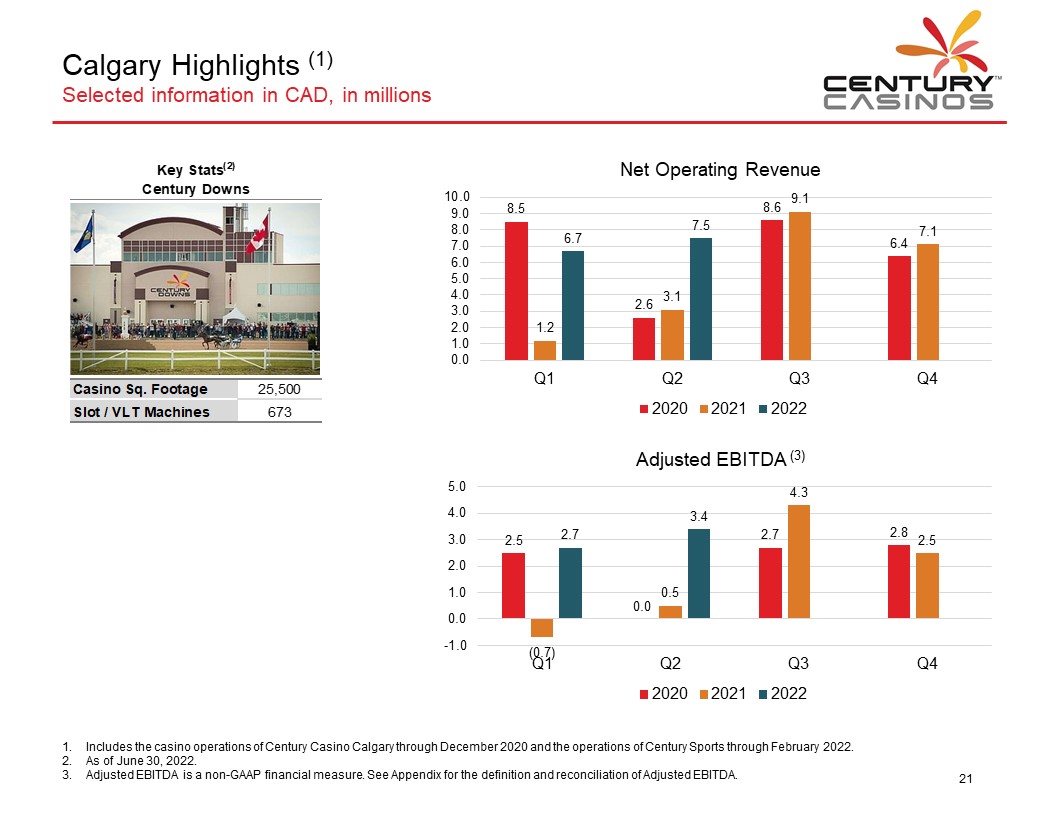
Calgary Highlights (1) Selected information in CAD, in millions CENTURY CASINOS Key Stats(2) Century Downs Casino Sq. Footage 25,500 Slot/VLT Machines 673 Net Operating Revenue 10.0 9.0 8.0 7.0 6.0 5.0 4.0 3.0 2.0 1.0 0.0 Q1 8.5 1.2 6.7 Q2 2.6 3.1 7.5 Q3 8.6 9.1 Q4 6.4 7.1 2020 2021 2022 Adjusted EBITDA (3) 5.0 4.0 3.0 2.0 1.0 0.0 -1.0 Q1 2.5 (0.7) 2.7 Q2 0.0 0.5 3.4 Q3 2.7 4.3 Q4 2.8 2.5 2020 2021 2022 1. Includes the casino operations of Century Casino Calgary through December 2020 and the operations of Century Sports through February 2022. 2. As of June 30, 2022. 3. Adjusted EBITDA is a non-GAAP financial measure. See Appendix for the definition and reconciliation of Adjusted EBITDA. 21
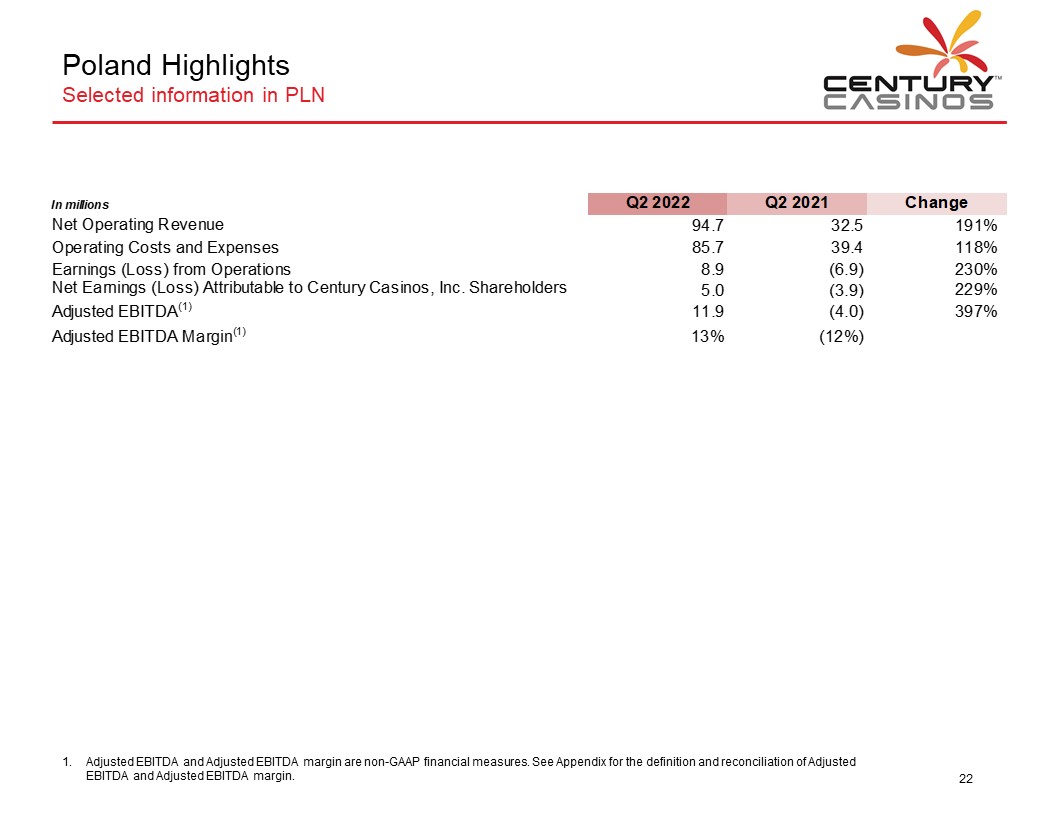
Poland Highlights Selected information in PLN CENTURY CASINOS In millions Q2 2022 Q2 2021 Change Net Operating Revenue 94.7 32.5 191% Operating Costs and Expenses 85.7 39.4 118% Earnings (Loss) from Operations 8.9 (6.9) 230% Net Earnings (Loss) Attributable to Century Casinos Inc. Shareholders 5.0 (3.9) 229% Adjusted EBITDA(1) 11.9 (4.0) 397% Adjusted EBITDA Margin(1) 13% (12%) 1. Adjusted EBITDA and Adjusted EBITDA margin are non-GAAP financial measures. See Appendix for the definition and reconciliation of Adjusted EBITDA and Adjusted EBITDA margin. 22
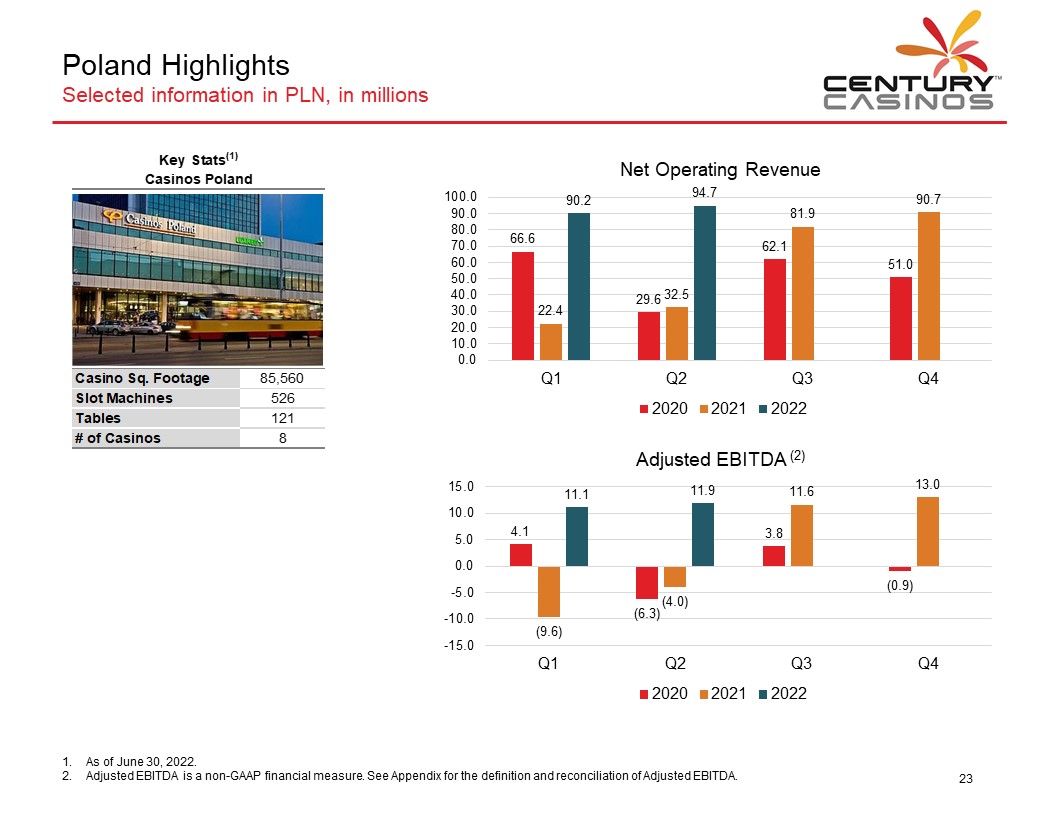
Poland Highlights Selected information in PLN, in millions CENTURY CASINOS Key Stats(1) Casinos Poland Casino Sq. Footage 85,560 Slot Machines 526 Tables 121 # of Casinos 8 Net Operating Revenue 100.0 90.0 80.0 70.0 60.0 50.0 40.0 30.0 20.0 10.0 0.0 Q1 66.6 22.4 90.2 Q2 29.6 32.5 94.7 Q3 62.1 81.9 Q4 51.0 90.7 2020 2021 2022 Adjusted EBITDA (2) 15.0 10.0 5.0 0.0 -5.0 -10.0 -15.0 Q1 4.1 (9.6) 11.1 Q2 (6.3) (4.0) 11.9 Q3 3.8 11.6 Q4 (0.9) 13.0 2020 2021 2022 1. As of June 30, 2022. 2. Adjusted EBITDA is a non-GAAP financial measure. See Appendix for the definition and reconciliation of Adjusted EBITDA. 23
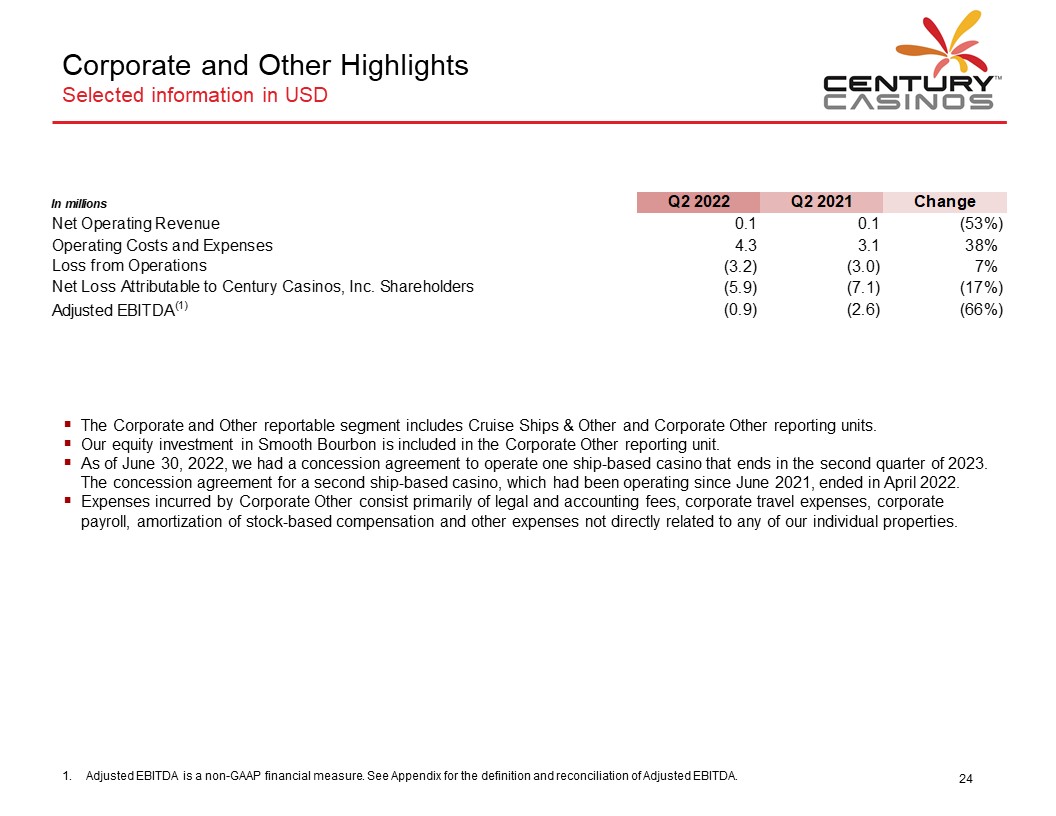
Corporate and Other Highlights Selected information in USD CENTURY CASINOS In millions Q2 2022 Q2 2021 Change Net Operating Revenue 0.1 0.1 (53%) Operating Costs and Expenses 4.3 3.1 38% Loss from Operations (3.2) (3.0) 7% Net Loss Attributable to Century Casinos. Inc. Shareholders (5.9) (7.1) (17%) Adjusted EBITDA(1) (0.9) (2.6) (66%) The Corporate and Other reportable segment includes Cruise Ships & Other and Corporate Other reporting units. Our equity investment in Smooth Bourbon is included in the Corporate Other reporting unit. As of June 30, 2022, we had a concession agreement to operate one ship-based casino that ends in the second quarter of 2023. The concession agreement for a second ship-based casino, which had been operating since June 2021, ended in April 2022. Expenses incurred by Corporate Other consist primarily of legal and accounting fees, corporate travel expenses, corporate payroll, amortization of stock-based compensation and other expenses not directly related to any of our individual properties. 1. Adjusted EBITDA is a non-GAAP financial measure. See Appendix for the definition and reconciliation of Adjusted EBITDA. 24
PROJECTS CENTURY CASINOS 25
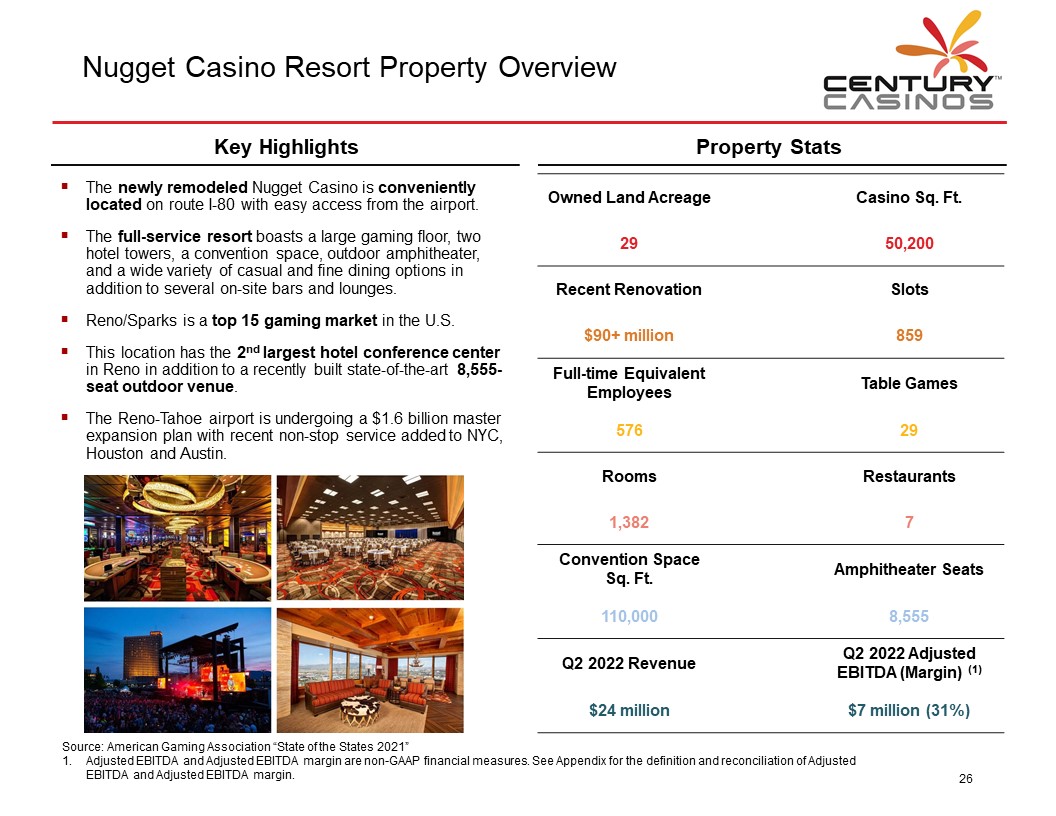
Nugget Casino Resort Property Overview CENTURY CASINOS Key Highlights The newly remodeled Nugget Casino is conveniently located on route I-80 with easy access from the airport. The full-service resort boasts a large gaming floor, two hotel towers, a convention space, outdoor amphitheater, and a wide variety of casual and fine dining options in addition to several on-site bars and lounges. Reno/Sparks is a top 15 gaming market in the U.S. This location has the 2nd largest hotel conference center in Reno in addition to a recently built state-of-the-art 8,555-seat outdoor venue. The Reno-Tahoe airport is undergoing a $1.6 billion master expansion plan with recent non-stop service added to NYC, Houston and Austin. Property Stats Owned Land Acreage 29 Casino Sq. Ft. 50,200 Recent Renovation $90+ million Slots 859 Full-time Equivalent Employees 576 Table Games 29 Rooms 1,382 Restaurants 7 Convention Space Sq. Ft. 110,000 Amphitheater Seats 8,555 Q2 2022 Revenue $24 million Q2 2022 Adjusted EBITDA (Margin)(1) $7 million (31%) Source: American Gaming Association “State of the States 2021” 1. Adjusted EBITDA and Adjusted EBITDA margin are non-GAAP financial measures. See Appendix for the definition and reconciliation of Adjusted EBITDA and Adjusted EBITDA margin. 26
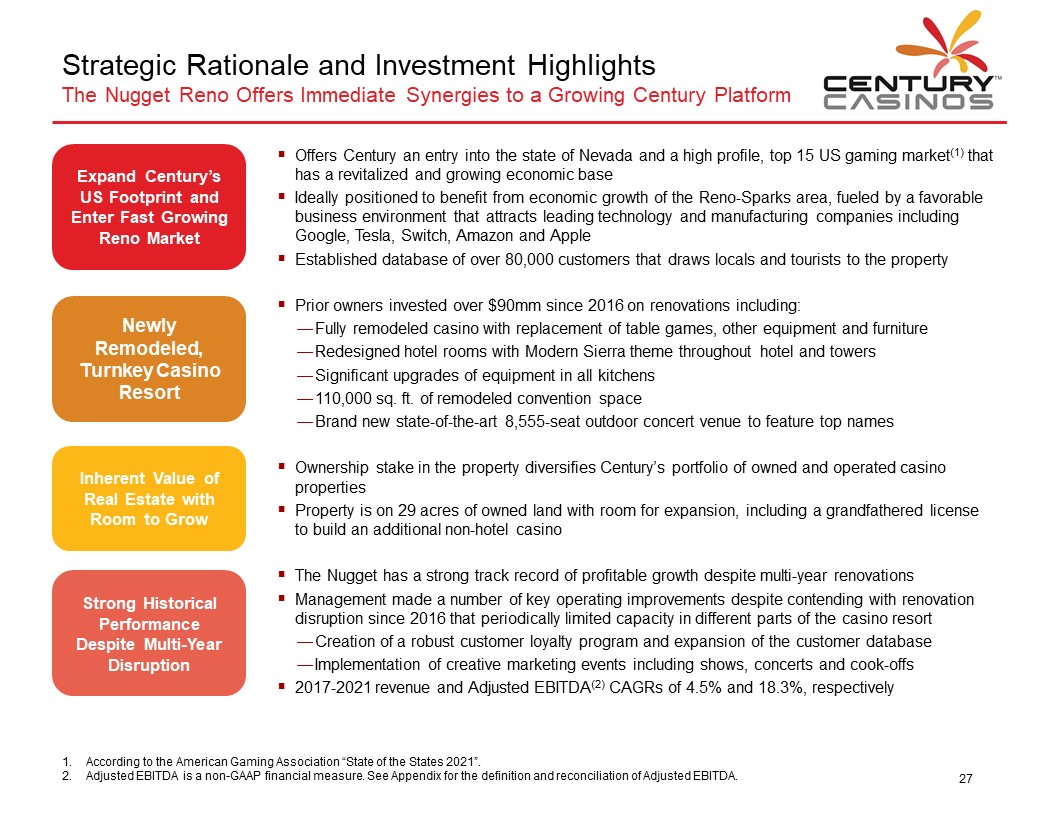
Strategic Rationale and Investment Highlights The Nugget Reno Offers Immediate Synergies to a Growing Century Platform CENTURY CASINOS Expand Century’s US Footprint and Enter Fast Growing Reno Market Offers Century an entry into the state of Nevada and a high profile, top 15 US gaming market(1) that has a revitalized and growing economic base Ideally positioned to benefit from economic growth of the Reno-Sparks area, fueled by a favorable business environment that attracts leading technology and manufacturing companies including Google, Tesla, Switch, Amazon and Apple Established database of over 80,000 customers that draws locals and tourists to the property Newly Remodeled, Turnkey Casino Resort Prior owners invested over $90mm since 2016 on renovations including: Fully remodeled casino with replacement of table games, other equipment and furniture Redesigned hotel rooms with Modern Sierra theme throughout hotel and towers Significant upgrades of equipment in all kitchens 110,000 sq. ft. of remodeled convention space Brand new state-of-the-art 8,555-seat outdoor concert venue to feature top names Inherent Value of Real Estate with Room to Grow Ownership stake in the property diversifies Century’s portfolio of owned and operated casino properties Property is on 29 acres of owned land with room for expansion, including a grandfathered license to build an additional non-hotel casino Strong Historical Performance Despite Multi-Year Disruption The Nugget has a strong track record of profitable growth despite multi-year renovations Management made a number of key operating improvements despite contending with renovation disruption since 2016 that periodically limited capacity in different parts of the casino resort Creation of a robust customer loyalty program and expansion of the customer database Implementation of creative marketing events including shows, concerts and cook-offs 2017-2021 revenue and Adjusted EBITDA(2) CAGRs of 4.5% and 18.3%, respectively 1. According to the American Gaming Association “State of the States 2021”. 2. Adjusted EBITDA is a non-GAAP financial measure. See Appendix for the definition and reconciliation of Adjusted EBITDA. 27
Century is Well-Positioned for the Next Stage of Growth CENTURY CASINOS Century’s operating expertise has provided opportunities to make small yet meaningful changes that have long-term impact. Recently Completed or In-Process Organic Growth Projects Truing Up mobile app to enhance customer experience, build loyalty, streamline process and reinforce operation efficiency. Partnerships with established iGaming and sports betting operators. Contracts include a minimum guaranteed amount and a revenue share above a set level. Introduction of player loyalty app and web portal across all U.S. properties. In West Virginia, multi-year slot floor upgrade to include adding electronic table games, investing in 200 new slot machines, modernization of the casino floor as well as updating hotel amenities, exterior and food venues. Already completed renovations include improvements to Mountaineer’s slot floor, notably a new VIP area, upgrades to center bar and updating floor layout, upgrades to the sports betting area and relocation of casino smoking section. Key Partnerships and Vendors 28
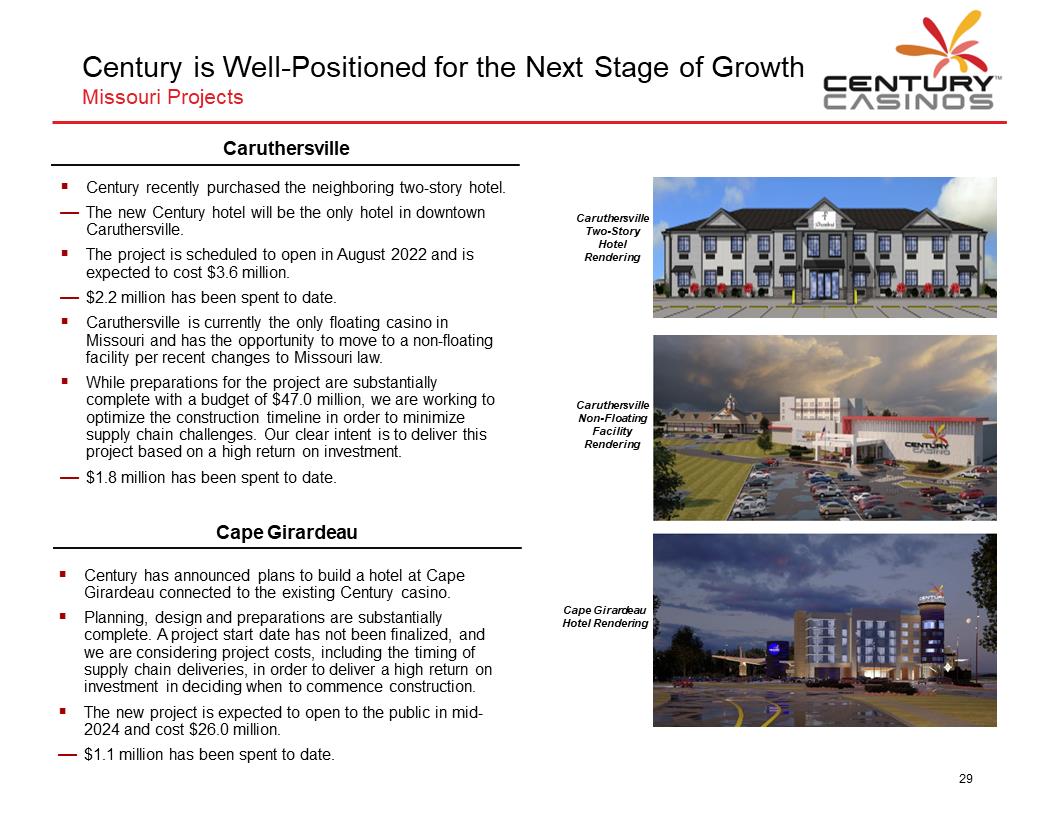
Century is Well-Positioned for the Next Stage of Growth Missouri Projects CENTURY CASINOS Caruthersville Century recently purchased the neighboring two-story hotel. The new Century hotel will be the only hotel in downtown Caruthersville. The project is scheduled to open in August 2022 and is expected to cost $3.6 million. $2.2 million has been spent to date. Caruthersville is currently the only floating casino in Missouri and has the opportunity to move to a non-floating facility per recent changes to Missouri law. While preparations for the project are substantially complete with a budget of $47.0 million, we are working to optimize the construction timeline in order to minimize supply chain challenges. Our clear intent is to deliver this project based on a high return on investment. $1.8 million has been spent to date. Caruthersville Two-Story Hotel Rendering Caruthersville Non-Floating Facility Rendering Cape Girardeau Century has announced plans to build a hotel at Cape Girardeau connected to the existing Century casino. Planning, design and preparations are substantially complete. A project start date has not been finalized, and we are considering project costs, including the timing of supply chain deliveries, in order to deliver a high return on investment in deciding when to commence construction. The new project is expected to open to the public in mid-2024 and cost $26.0 million. $1.1 million has been spent to date. Cape Girardeau Hotel Rendering 29

APPENDIX CENTURY CASINOS 30
Appendix Abbreviations of Century Casinos, Inc. Subsidiaries and Certain Reporting Units CENTURY CASINOS Abbreviation Century Casino & Hotel – Central City CTL or Central City Century Casino & Hotel – Cripple Creek CRC or Cripple Creek Mountaineer Casino, Racetrack & Resort MTR or Mountaineer Century Casino Cape Girardeau CCG or Cape Girardeau Century Casino Caruthersville CCV or Caruthersville Century Casino & Hotel – Edmonton CRA or Edmonton Century Casino St. Albert CSA or St. Albert Century Downs Racetrack and Casino CDR or Century Downs Century Mile Racetrack and Casino CMR or Century Mile Casinos Poland CPL Century Resorts Management GmbH CRM Cruise Ships & Other Ships & Other Corporate Other N/A 31
Appendix Non-GAAP Financial Measures CENTURY CASINOS The Company supplements its consolidated financial statements prepared in accordance with U.S. generally accepted accounting principles (“GAAP”) by using the following non-GAAP financial measures, which management believes are useful in properly understanding the Company’s short-term and long-term financial trends. Management uses these non-GAAP financial measures to forecast and evaluate the operational performance of the Company as well as to compare results of current periods to prior periods on a consolidated basis. Adjusted EBITDA Adjusted EBITDA margin Net Debt Adjusted EBITDA less Cash Rent on Master Lease Management believes presenting the non-GAAP financial measures used in this presentation provides investors greater transparency to the information used by management for financial and operational decision-making and allows investors to see the Company’s results “through the eyes” of management. Management also believes providing this information better enables our investors to understand the Company’s operating performance and evaluate the methodology used by management to evaluate and measure such performance. The adjustments made to GAAP financial measures result from facts and circumstances that vary in frequency and impact on the Company’s results of operations. The following is an explanation of each of the adjustments that management excludes in calculating its non-GAAP financial measures. 32
Appendix Non-GAAP Financial Measures CENTURY CASINOS The Company defines Adjusted EBITDA as net earnings (loss) attributable to Century Casinos, Inc. shareholders before interest expense (income), net, income taxes (benefit), depreciation and amortization, non-controlling interests net earnings (loss) and transactions, pre-opening expenses, acquisition costs, non-cash stock-based compensation charges, asset impairment costs, loss (gain) on disposition of fixed assets, discontinued operations, (gain) loss on foreign currency transactions, cost recovery income and other, gain on business combination and certain other one-time transactions. Expense related to the Master Lease for the Company’s acquired casinos in Missouri and West Virginia and CDR land lease is included in the interest expense (income), net line item. Intercompany transactions consisting primarily of management and royalty fees and interest, along with their related tax effects, are excluded from the presentation of net earnings (loss) attributable to Century Casinos, Inc. shareholders and Adjusted EBITDA reported for each segment. Non-cash stock-based compensation expense is presented under Corporate and Other as the expense is not allocated to reportable segments when reviewed by the Company’s chief operating decision makers. Not all of the aforementioned items occur in each reporting period, but have been included in the definition based on historical activity. These adjustments have no effect on the consolidated results as reported under GAAP. Adjusted EBITDA is not considered a measure of performance recognized under GAAP. Management believes that Adjusted EBITDA is a valuable measure of the relative performance of the Company and its properties. The gaming industry commonly uses Adjusted EBITDA as a method of arriving at the economic value of a casino operation. Management uses Adjusted EBITDA to compare the relative operating performance of separate operating units by eliminating the above-mentioned items associated with the varying levels of capital expenditures for infrastructure required to generate revenue and the often high cost of acquiring existing operations. Adjusted EBITDA is used by the Company’s lending institution to gauge operating performance. The Company’s computation of Adjusted EBITDA may be different from, and therefore may not be comparable to, similar measures used by other companies within the gaming industry. Please see the reconciliation of Adjusted EBITDA to net earnings (loss) attributable to Century Casinos, Inc. shareholders below. The Company defines Adjusted EBITDA margin as Adjusted EBITDA divided by net operating revenue. Management uses this margin as one of several measures to evaluate the efficiency of the Company’s casino operations. 33
Appendix Non-GAAP Financial Measures CENTURY CASINOS The Company defines Net Debt as total long-term debt (including current portion) plus deferred financing costs minus cash and cash equivalents. Net Debt is not considered a liquidity measure recognized under GAAP. Management believes that Net Debt is a valuable measure of our overall financial situation. Net Debt provides investors with an indication of our ability to pay off all of our long-term debt if it became due simultaneously. Adjusted EBITDA less Cash Rent on Master Lease is calculated by deducting the cash payments related to the Company’s Master Lease from Adjusted EBITDA to calculate the debt and Net Debt to Adjusted EBITDA ratios. The Company does not recognize rent expense related to these leased assets; instead, a portion of the periodic payment under the Master Lease is recognized as interest expense with the remainder of the payment reducing the failed sale-leaseback financing obligation using the effective interest method. Management believes that deducting cash payments related to its Master Lease from Adjusted EBITDA provides investors with an indication of the length of time it would take the Company to repay its long-term debt. 34
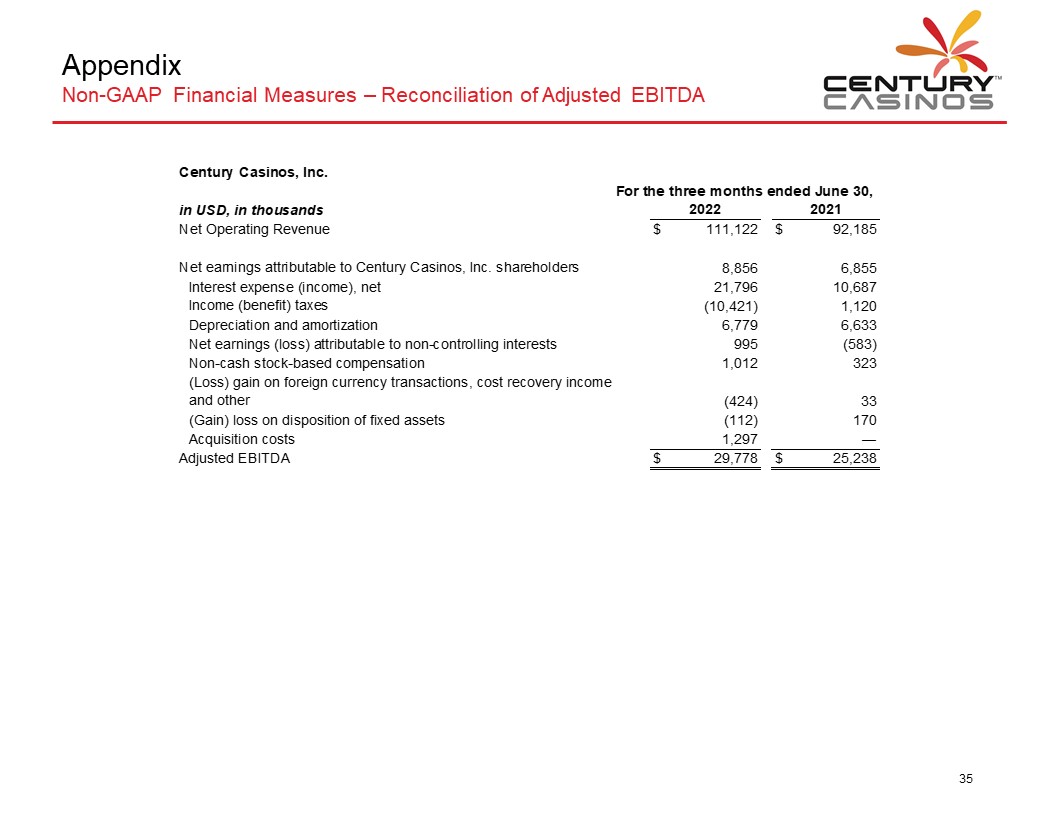
Appendix Non-GAAP Financial Measures – Reconciliation of Adjusted EBITDA CENTURY CASINOS Century Casinos, Inc. For the three months ended June 30, in USD, in thousands 2022 2021 Net Operating Revenue $ 111,122 $ 92,185 Net earnings attributable to Century Casinos, Inc. shareholders 8,856 6,855 Interest expense (income), net 21,796 10,687 Income (benefit) taxes (10,421) 1,120 Depreciation and amortization 6,779 6,633 Net earnings (loss) attributable to non-controlling interests 995 (583) Non-cash stock-based compensation 1,012 323 (Loss) gain on foreign currency transactions, cost recovery income and other (424) 33 (Gain) loss on disposition of fixed assets (112) 170 Acquisition costs 1,297 — Adjusted EBITDA $ 29,778 $ 25,238 35
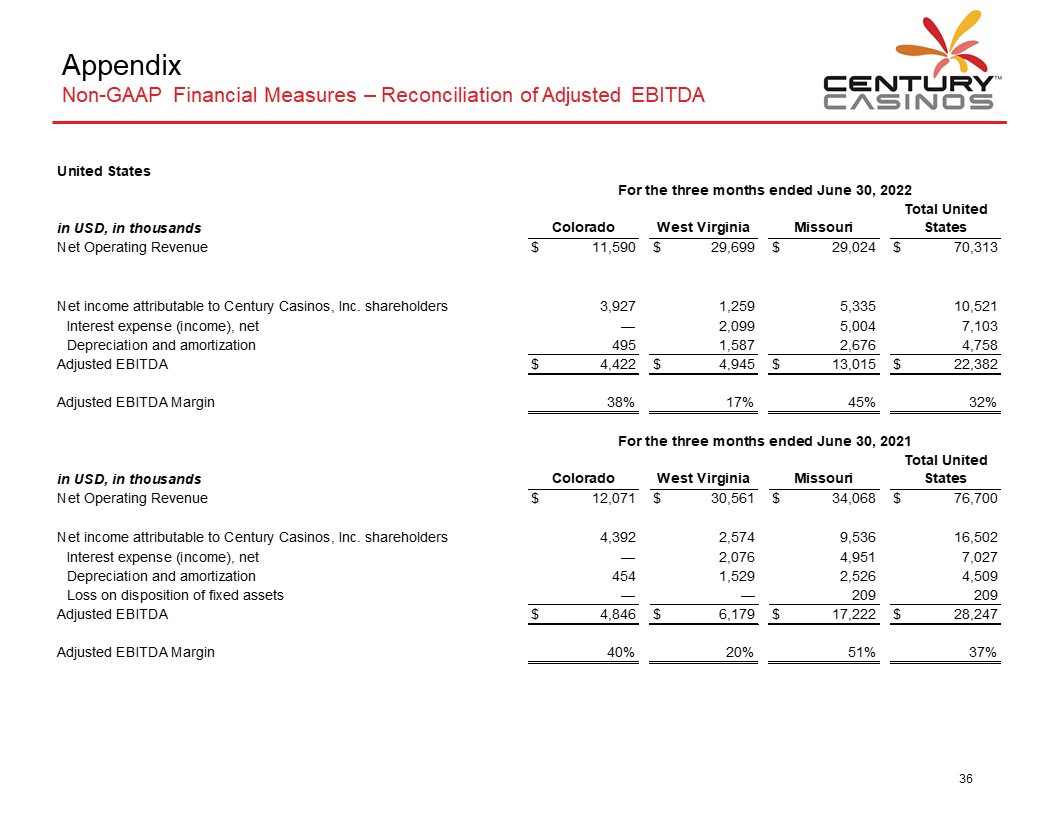
Appendix Non-GAAP Financial Measures – Reconciliation of Adjusted EBITDA CENTURY CASINOS United States in USD, in thousands For the three months ended June 30, 2022 Colorado West Virginia Missouri Total United States Net Operating Revenue $ 11,590 $ 29,699 $ 29,024 $ 70,313 Net income attributable to Century Casinos, Inc. shareholders 3,927 1,259 5,335 10,521 Interest expense (income), net — 2,099 5,004 7,103 Depreciation and amortization 495 1,587 2,676 4,758 Adjusted EBITDA $ 4,422 $ 4,945 $ 13,015 $ 22,382 Adjusted EBITDA Margin 38% 17% 45% 32% in USD, in thousands For the three months ended June 30, 2021 Colorado West Virginia Missouri Total United States Net Operating Revenue $ 12,071 $ 30,561 $ 34,068 $ 76,700 Net income attributable to Century Casinos, Inc. shareholders 4,392 2,574 9,536 16,502 Interest expense (income), net — 2,076 4,951 7,027 Depreciation and amortization 454 1,529 2,526 4,509 Loss on disposition of fixed assets — — 209 209 Adjusted EBITDA $ 4,846 $ 6,179 $ 17,222 $ 28,247 Adjusted EBITDA Margin 40% 20% 51% 37% 36
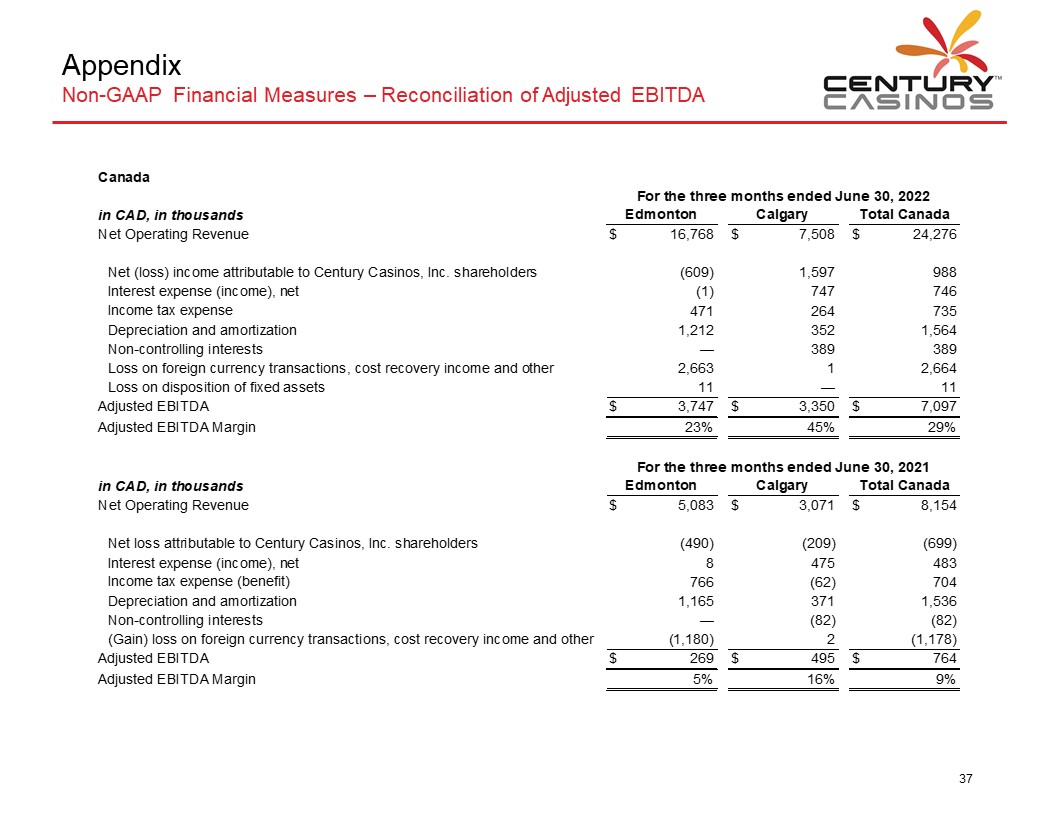
Appendix Non-GAAP Financial Measures – Reconciliation of Adjusted EBITDA CENTURY CASINOS Canada For the three months ended June 30, 2022 in CAD, in thousands Edmonton Calgary Total Canada Net Operating Revenue $ 16,768 $ 7,508 $ 24,276 Net (loss) income attributable to Century Casinos, Inc. shareholders (609) 1,597 988 Interest expense (income), net (1) 747 746 Income tax expense 471 264 735 Depreciation and amortization 1,212 352 1,564 Non-controlling interests — 389 389 Loss on foreign currency transactions, cost recovery income and other 2,663 1 2,664 Loss on disposition of fixed assets 11 — 11 Adjusted EBITDA $ 3,747 $ 3,350 $ 7,097 Adjusted EBITDA Margin 23% 45% 29% For the three months ended June 30, 2021 in CAD, in thousands Edmonton Calgary Total Canada Net Operating Revenue $ 5,083 $ 3,071 $ 8,154 Net loss attributable to Century Casinos, Inc. shareholders (490) (209) (699) Interest expense (income), net 8 475 483 Income tax expense (benefit) 766 (62) 704 Depreciation and amortization 1,165 371 1,536 Non-controlling interests — (82) (82) (Gain) loss on foreign currency transactions, cost recovery income and other (1,180) 2 (1,178) Adjusted EBITDA $ 269 $ 495 $ 764 Adjusted EBITDA Margin 5% 16% 9% 37
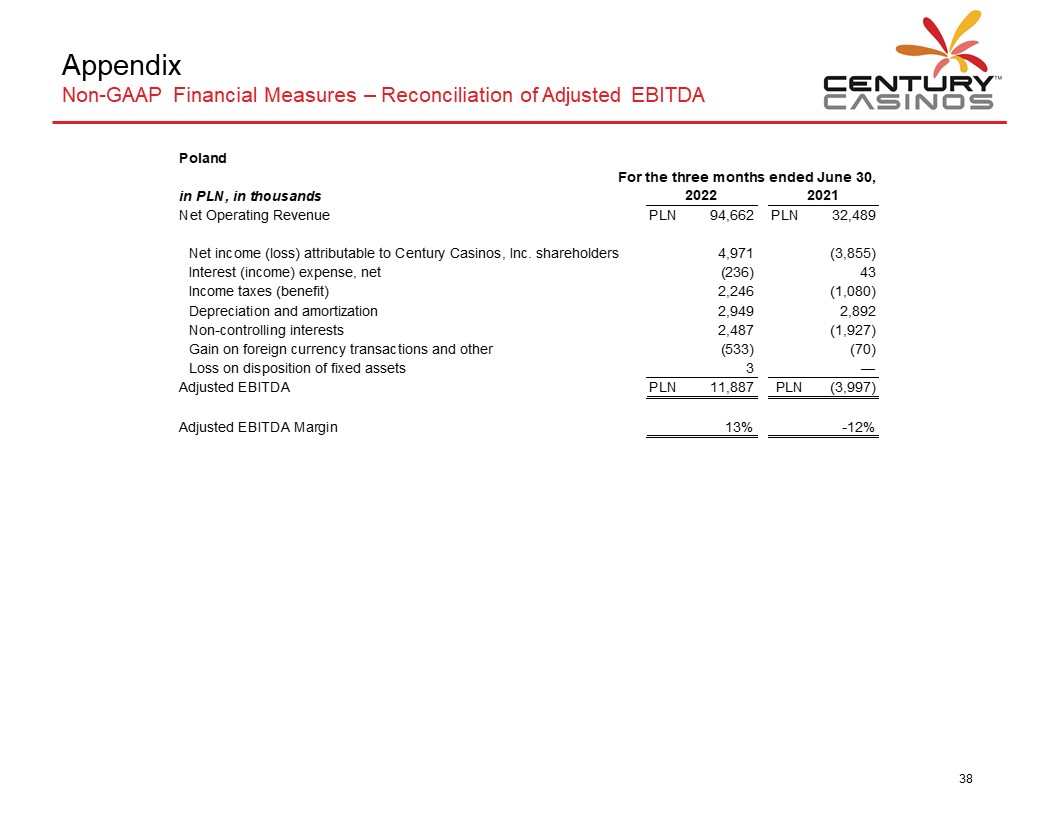
Appendix Non-GAAP Financial Measures – Reconciliation of Adjusted EBITDA CENTURY CASINOS Poland For the three months ended June 30, in PLN, in thousands 2022 2021 Net Operating Revenue PLN 94,662 PLN 32,489 Net income (loss) attributable to Century Casinos, Inc. shareholders 4,971 (3,855) Interest (income) expense, net (236) 43 Income taxes (benefit) 2,246 (1,080) Depreciation and amortization 2,949 2,892 Non-controlling interests 2,487 (1,927) Gain on foreign currency transactions and other (533) (70) Loss on disposition of fixed assets 3 — Adjusted EBITDA PLN 11,887 PLN (3,997) Adjusted EBITDA Margin 13% -12% 38
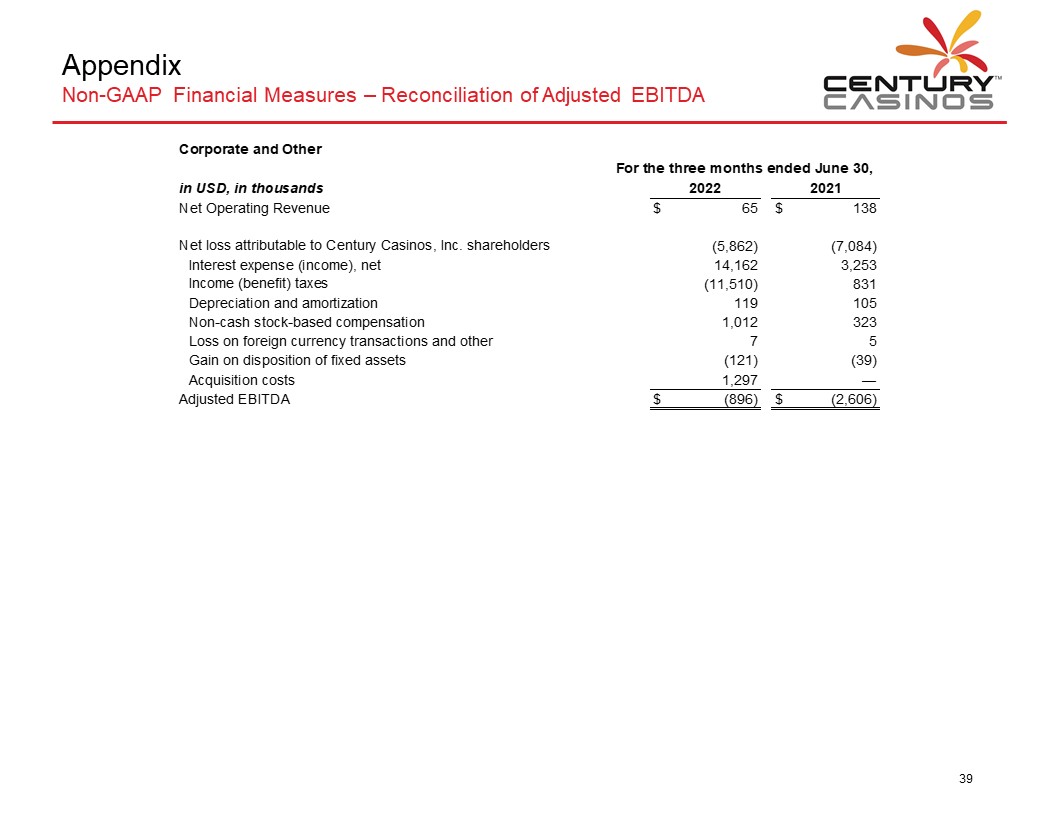
Appendix Non-GAAP Financial Measures – Reconciliation of Adjusted EBITDA CENTURY CASINOS Corporate and Other in USD, in thousands For the three months ended June 30, 2022 2021 Net Operating Revenue $ 65 $ 138 Net loss attributable to Century Casinos, Inc. shareholders (5,862) (7,084) Interest expense (income), net 14,162 3,253 Income (benefit) taxes (11,510) 831 Depreciation and amortization 119 105 Non-cash stock-based compensation 1,012 323 Loss on foreign currency transactions and other 7 5 Gain on disposition of fixed assets (121) (39) Acquisition costs 1,297 — Adjusted EBITDA $ (896) $ (2,606) 39
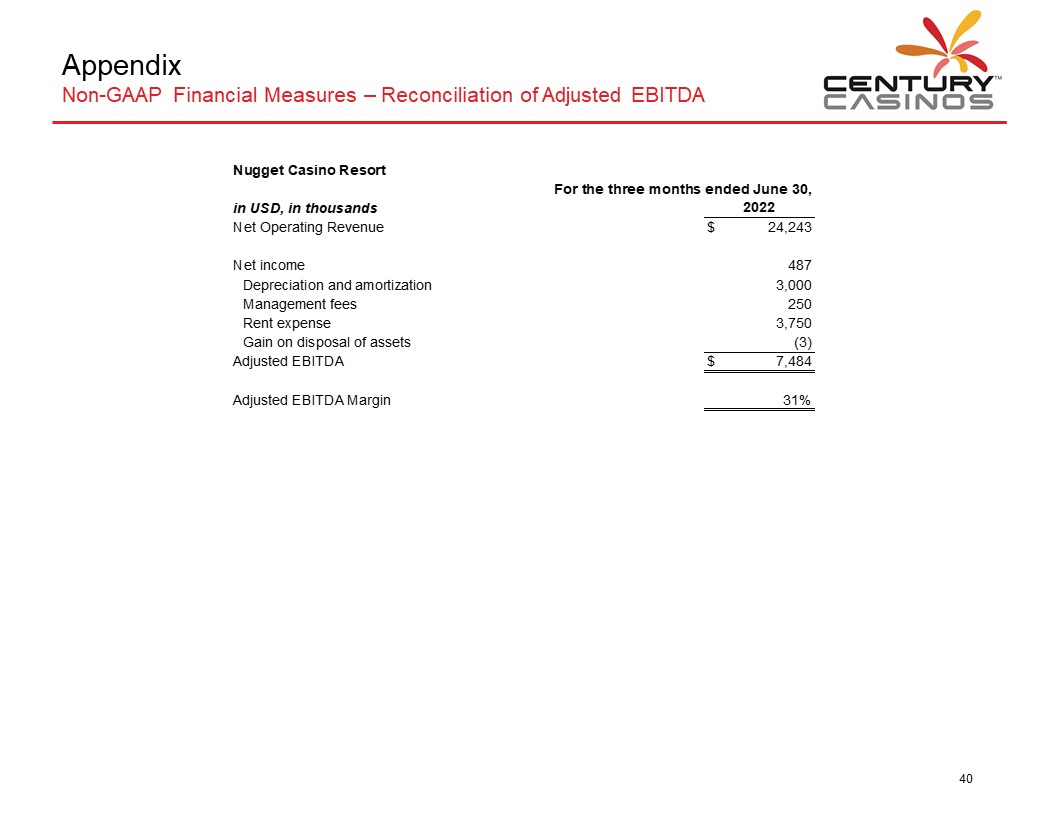
Appendix Non-GAAP Financial Measures – Reconciliation of Adjusted EBITDA CENTURY CASINOS Nugget Casino Resort in USD, in thousands For the three months ended June 30, 2022 Net Operating Revenue $ 24,243 Net income 487 Depreciation and amortization 3,000 Management fees 250 Rent expense 3,750 Gain on disposal of assets (3) Adjusted EBITDA $ 7,484 Adjusted EBITDA Margin 31% 40
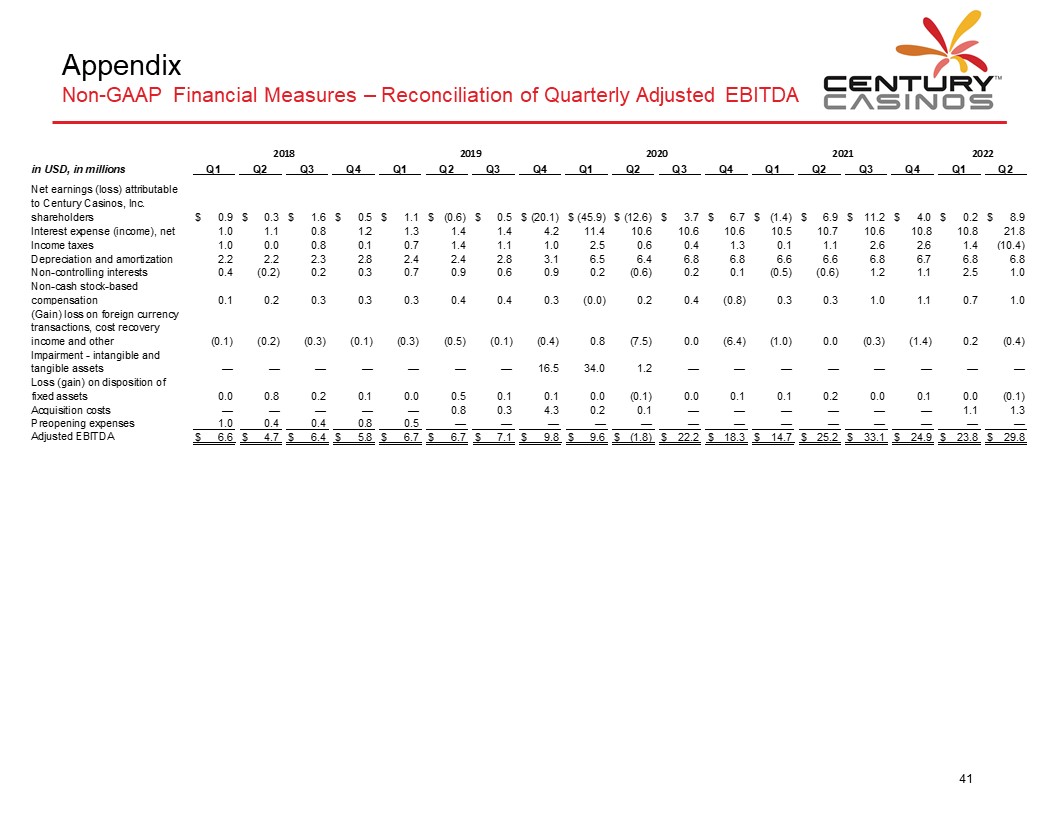
Appendix Non-GAAP Financial Measures – Reconciliation of Quarterly Adjusted EBITDA CENTURY CASINOS 2018 2019 2020 2021 2022 in USD, in millions Q1 Q2 Q3 Q4 Q1 Q2 Q3 Q4 Q1 Q2 Q3 Q4 Q1 Q2 Q3 Q4 Q1 Q2 Net earnings (loss) attributable to Century Casinos. Inc. shareholders $ 0.9 $ 0.3 $ 1.6 $ 0.5 $ 1.1 $ (0.6) $ 0.5 $ (20.1) $ (45.9) $ (12.6) $ 3.7 $ 6.7 $ (1.4) $ 6.9 $ 11.2 $ 4.0 $ 0.2 $ 8.9 Interest expense (income), net 1.0 1.1 0.8 1.2 1.3 1.4 1.4 4.2 11.4 10.6 10.6 10.6 10.5 10.7 10.6 10.8 10.8 21.8 Income taxes 1.0 0.0 0.8 0.1 0.7 1.4 1.1 1.0 2.5 0.6 0.4 1.3 0.1 1.1 2.6 2.6 1.4 (10.4) Deprecation and amortization 2.2 2.2 2.3 2.8 2.4 2.4 2.8 3.1 6.5 6.4 6.8 6.8 6.6 6.6 6.8 6.7 6.8 6.8 Non-controlling interests 0.4 (02) 0.2 0.3 0.7 0.9 0.6 0.9 0.2 (0.6) 0.2 0.1 (0.5) (0.6) 1.2 1.1 2.5 1.0 Non-cash stock-based compensation 0.1 0.2 0.3 0.3 0.3 0.4 0.4 0.3 (0.0) 0.2 0.4 (0.8) 0.3 0.3 1.0 1.1 0.7 1.0 (Gain) loss on foreign currency transactions, cost recovery income and other (0.1) (0.2) (0.3) (0.1) (0.3) (0.5) (0.1) (0.4) 0.8 (7.5) 0.0 (6.4) (1.0) 0.0 (0.3) (1.4) 0.2 (0.4) Impairment - intangible and tangible assets — — — — — — — 16.5 34.0 1.2 — — — — — — — — Loss (gain) on disposition of fixed assets 0.0 0.8 0.2 0.1 0.0 0.5 0.1 0.1 0.0 (0.1) 0.0 0.1 0.1 0.2 0.0 0.1 0.0 (0.1) Acquisition costs — — — — — 0.8 0.3 4.3 0.2 0.1 — — — — — — 1.1 1.3 Preopening expenses 1.0 0.4 0.4 0.8 0.5 — — — — — — — — — — — — — Adjusted EBITDA $ 6.6 $ 4.7 $ 6.4 $ 5.8 $6.7 $ 6.7 $ 7.1 $ 9.8 $ 9.6 $ (1.8) $ 22.2 $ 18.3 $ 14.7 $ 25.2 $ 33.1 $ 24.9 $ 23.8 $ 29.8 41
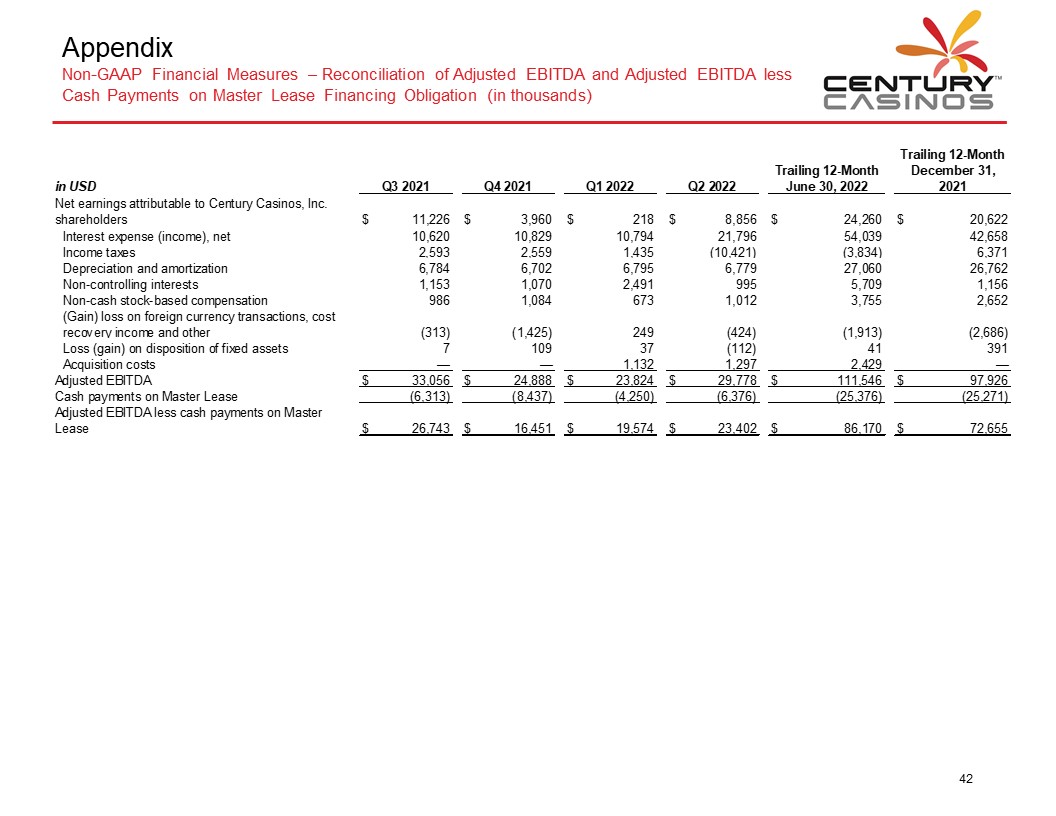
Appendix Non-GAAP Financial Measures – Reconciliation of Adjusted EBITDA and Adjusted EBITDA less Cash Payments on Master Lease Financing Obligation (in thousands) CENTURY CASINOS in USD Q3 2021 Q4 2021 Q1 2022 02 2022 Trailing 12-Month June 30,2022 Trailing 12-Month December 31, 2021 Net earnings attributable to Century Casinos. Inc. shareholders $ 11,226 $ 3,960 $ 218 $ 8,856 $ 24,260 $ 20,622 Interest expense (income), net 10,620 10,829 10,794 21,796 54,039 42,658 Income taxes 2,593 2,559 1,435 (10,421) (3,834) 6,371 Depreciation and amortization 6,784 6,702 6,795 6,779 27,060 26,762 Non-controlling interests 1,153 1,070 2,491 995 5,709 1,156 Non-cash stock-based compensation 986 1,084 673 1,012 3,755 2,652 (Gain) loss on foreign currency transactions, cost recovery income and other (313) (1,425) 249 (424) (1,913) (2,686) Loss (gain) on disposition of fixed assets 7 109 37 (112) 41 391 Acquisition costs — — 1,132 1,297 2,429 — Adjusted EBITDA $ 33,056 $ 24,888 $ 23,824 $ 29,778 $ 111,546 $ 97,926 Cash payments on Master Lease (6,313) (8,437) (4,250) (6,376) (25,376) (25,271) Adjusted EBITDA less cash payments on Master Lease $ 26,743 $ 16,451 $ 19,574 $ 23,402 $ 86,170 $ 72,655 42
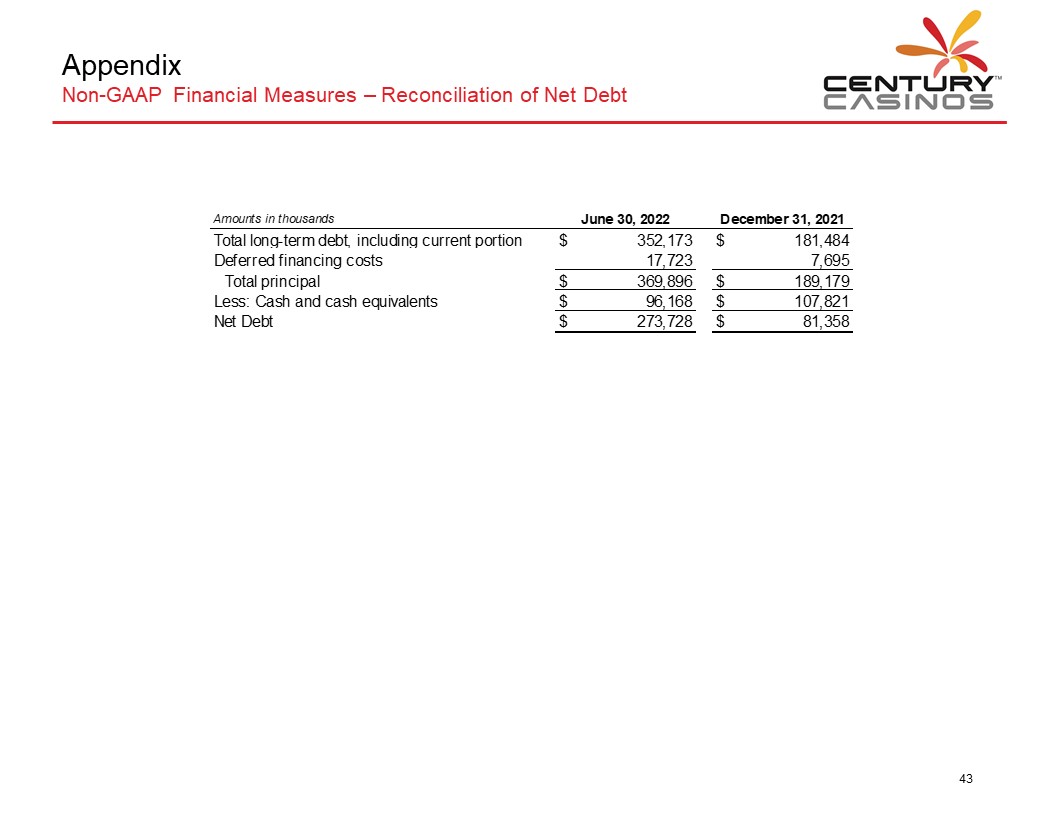
Appendix Non-GAAP Financial Measures – Reconciliation of Net Debt CENTURY CASINOS Amounts in thousands June 30, 2022 December 31, 2021 Total long-term debt, including current portion $ 352,173 $ 181.484 Deferred financing costs 17,723 7,695 Total principal $ 369,896 $ 189,179 Less: Cash and cash equivalents $ 96,168 $ 107,821 Net Debt $ 273,728 $ 81,358 43