UNITED STATES
SECURITIES AND EXCHANGE COMMISSION
Washington, D.C. 20549
FORM
CURRENT REPORT
Pursuant to Section 13 or 15(d) of the
Securities Exchange Act of 1934
Date of Report (Date of earliest event reported):
(Exact name of registrant as specified in its charter)
|
| |||
(State or Other Jurisdiction | (Commission | (IRS Employer |
(Address of Principal Executive Offices, Including Zip Code)
(
(Registrant’s Telephone Number, Including Area Code)
Check the appropriate box below if the Form 8-K filing is intended to simultaneously satisfy the filing obligation of the registrant under any of the following provisions:
Written communications pursuant to Rule 425 under the Securities Act (17 CFR 230.425) | ||
Soliciting material pursuant to Rule 14a-12 under the Exchange Act (17 CFR 240.14a-12) | ||
Pre-commencement communications pursuant to Rule 14d-2(b) under the Exchange Act (17 CFR 240.14d-2(b)) | ||
Pre-commencement communications pursuant to Rule 13e-4(c) under the Exchange Act (17 CFR 240.13e-4(c)) |
Securities registered pursuant to Section 12(b) of the Act:
Title of each class | Trading Symbol(s) | Name of each exchange on which registered |
Indicate by check mark whether the registrant is an emerging growth company as defined in Rule 405 of the Securities Act of 1933 (§230.405 of this chapter) or Rule 12b-2 of the Securities Exchange Act of 1934 (§240.12b-2 of this chapter).
Emerging growth company
If an emerging growth company, indicate by check mark if the registrant has elected not to use the extended transition period for complying with any new or revised financial accounting standards provided pursuant to Section 13(a) of the Exchange Act. ☐
Item 2.02 Results of Operations and Financial Condition.
On August 3, 2022, STORE Capital Corporation (the “Company”) issued a press release announcing its financial results for the second fiscal quarter ended June 30, 2022. A copy of the press release is furnished hereto as Exhibit 99.1 and incorporated herein by reference.
Additionally, on August 3, 2022, the Company made available on its website a report of supplemental operating and financial information for the quarter ended June 30, 2022 (the “Supplemental Information”) as well as issued its 2022 second quarter investor presentation containing operating and financial data of the Company (the “Investor Presentation”), which are furnished as Exhibit 99.2 and Exhibit 99.3 hereto, respectively, and incorporated herein by reference.
The information set forth in this Item 2.02, including the information contained in the attached Exhibits 99.1, 99.2 and 99.3, is deemed to be “furnished” and shall not be deemed to be “filed” for purposes of Section 18 of the Securities Exchange Act of 1934, as amended, and is not incorporated by reference into any filing of the Company, whether made before or after the date hereof, regardless of any general incorporation language in such filing.
Item 7.01 Regulation FD Disclosure.
On August 3, 2022, the Company made available on its website the Supplemental Information and the Investor Presentation. The Supplemental Information and the Investor Presentation are furnished as Exhibit 99.2 and Exhibit 99.3, respectively, and incorporated herein by reference.
The information set forth in this Item 7.01, including the information contained in the attached Exhibits 99.2 and 99.3, is deemed to be “furnished” and shall not be deemed to be “filed” for purposes of Section 18 of the Securities Exchange Act of 1934, as amended, and is not incorporated by reference into any filing of the Company, whether made before or after the date hereof, regardless of any general incorporation language in such filing.
Item 9.01 Financial Statements and Exhibits.
(d) Exhibits.
Exhibit |
| Description |
99.1 | ||
99.2 | Supplemental Operating and Financial Information for the quarter ended June 30, 2022. | |
99.3 | ||
104 | Cover Page Interactive Data File (embedded within the Inline XBRL document). |
The press release, supplemental information and investor presentation furnished as Exhibits 99.1, 99.2 and 99.3 hereto include non-GAAP financial measures as defined in Regulation G, along with the most directly comparable financial measures calculated and presented in accordance with accounting principles generally accepted in the United States
(“GAAP”), information reconciling the non-GAAP financial measures to the GAAP financial measures, and a discussion of the reasons why the Company believes that presentation of the non-GAAP financial measures provides useful information to investors regarding the Company’s financial condition and results of operations. The non-GAAP financial measures presented therein should be considered in addition to, and not in lieu of or alternatives to, GAAP financial measures.
SIGNATURES
Pursuant to the requirements of the Securities Exchange Act of 1934, the Registrant has duly caused this report to be signed on its behalf by the undersigned hereunto duly authorized.
STORE Capital Corporation | ||
| ||
Dated: August 3, 2022 | ||
By: | /s/ Chad A. Freed | |
| Chad A. Freed | |
| Executive Vice President – General Counsel, Chief Compliance Officer and Secretary | |
Exhibit 99.1

STORE Capital Announces Second Quarter 2022 Operating Results
Raises 2022 AFFO Per Share Guidance
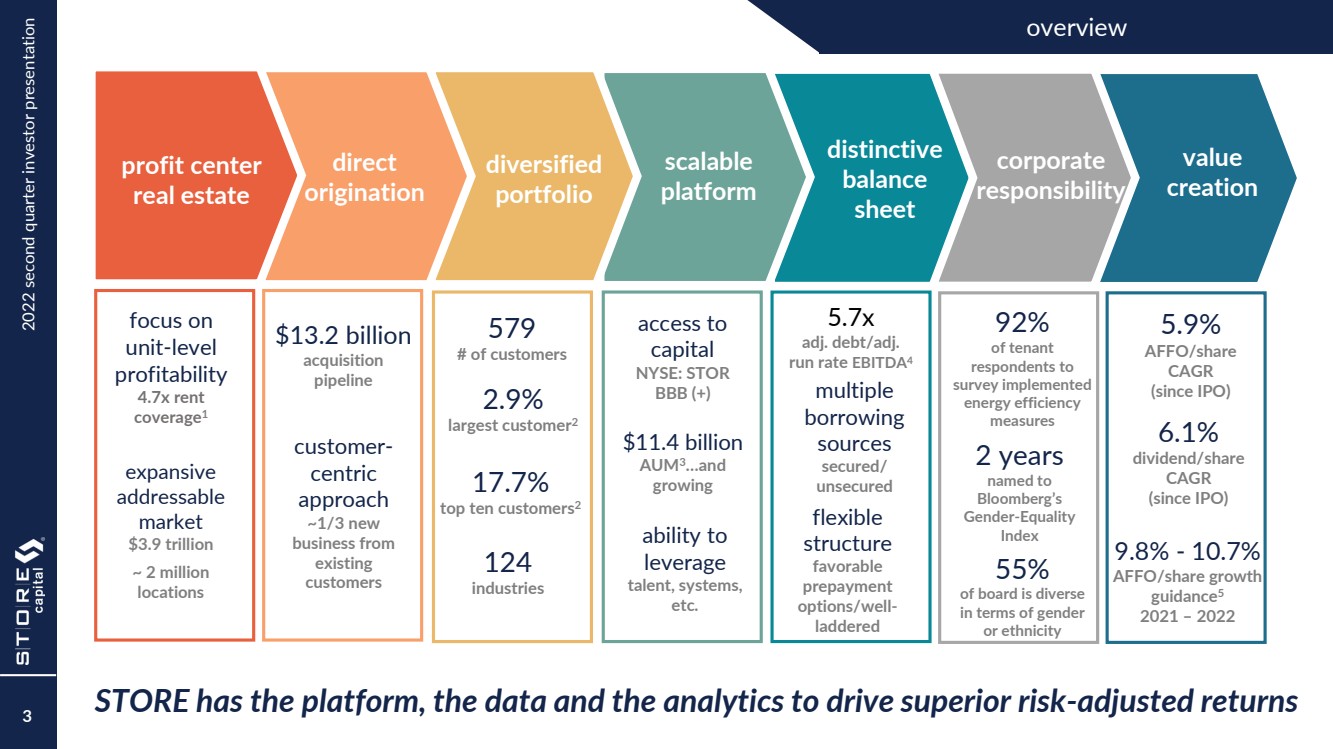
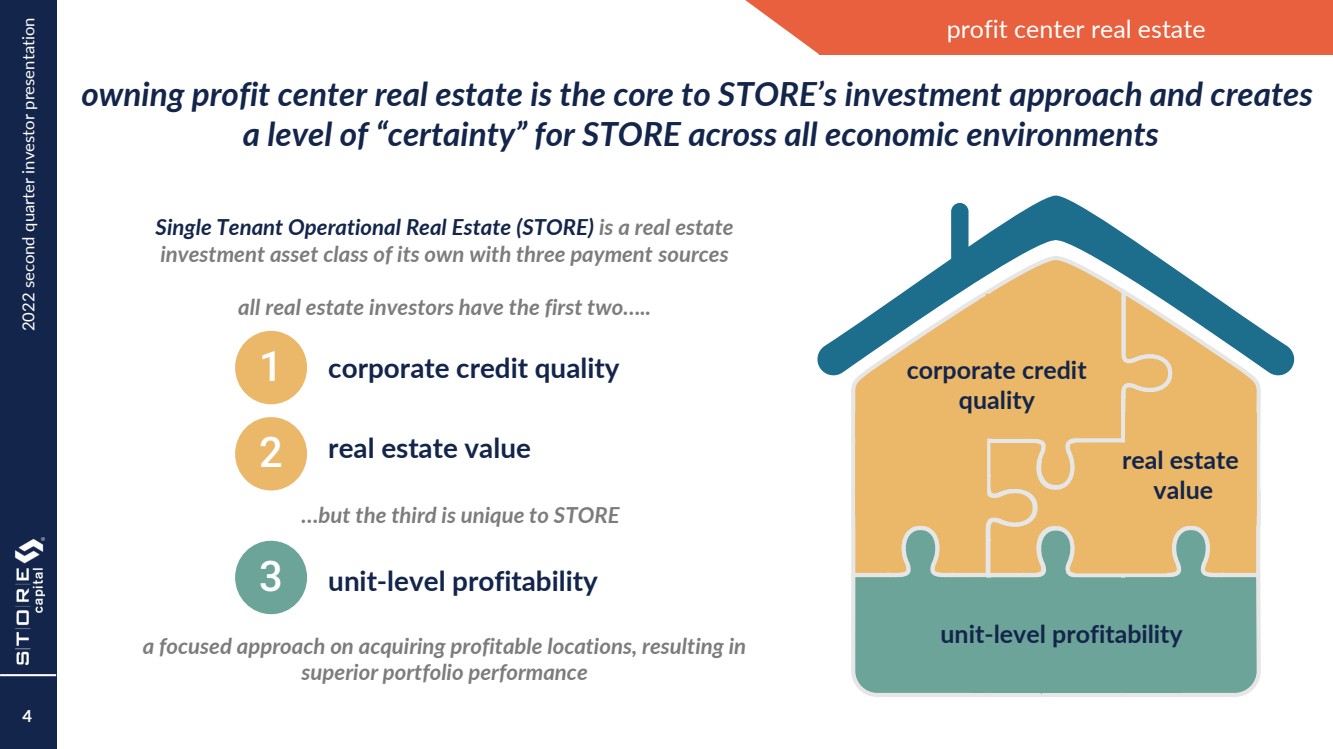
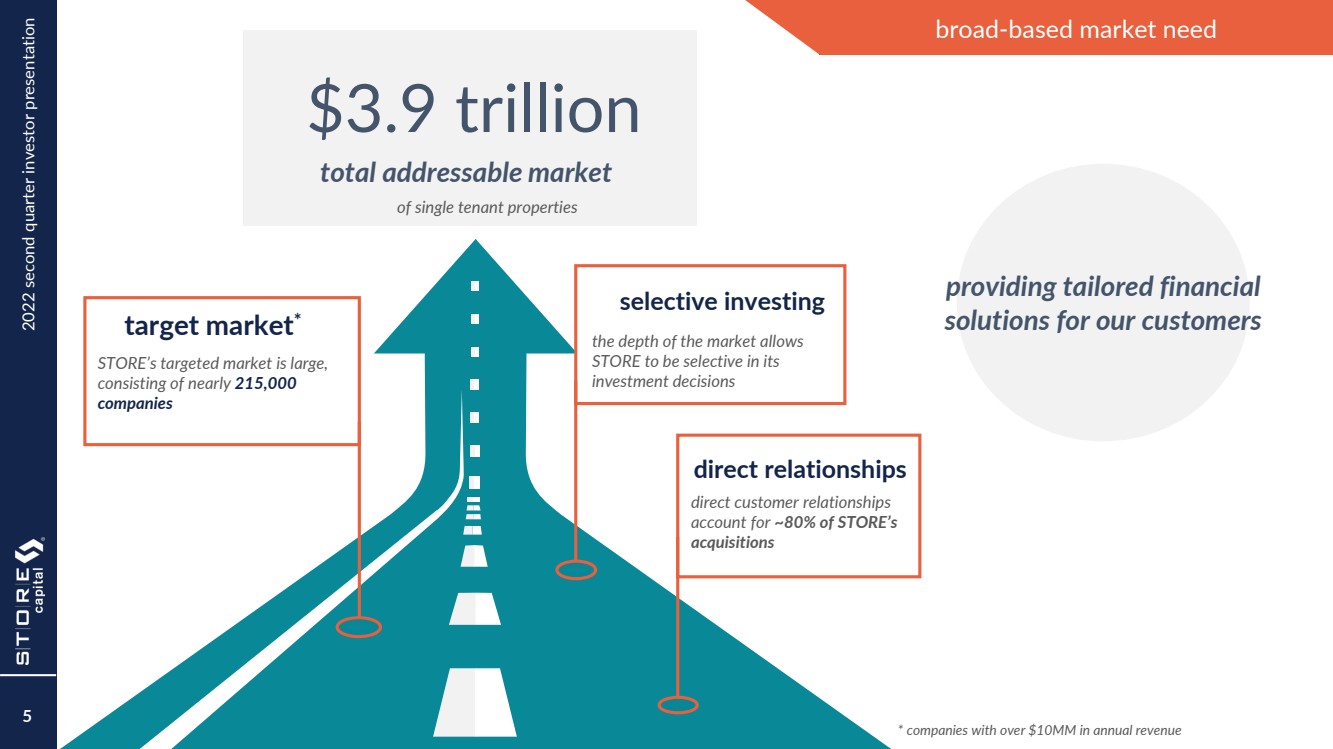
SCOTTSDALE, Ariz., August 3, 2022 – STORE Capital Corporation (NYSE: STOR, “STORE Capital” or the “Company”), an internally managed net-lease real estate investment trust (REIT) that invests in Single Tenant Operational Real Estate, today announced operating results for the second quarter ended June 30, 2022.
For the quarter ended June 30, 2022:
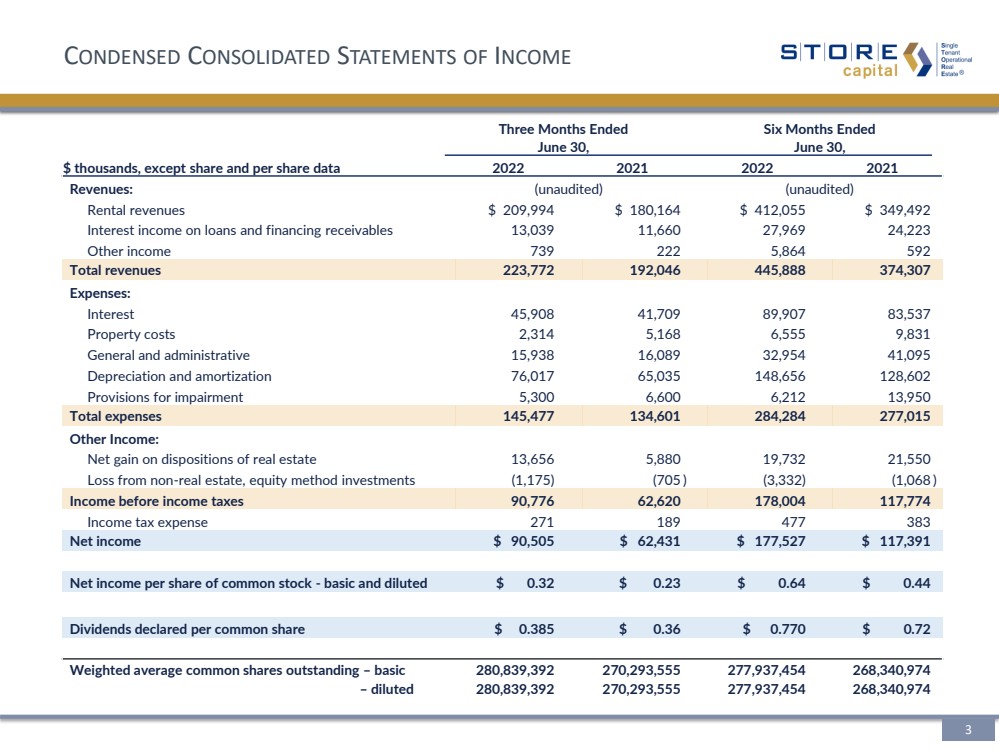
| ◾ | Total revenues of $223.8 million |
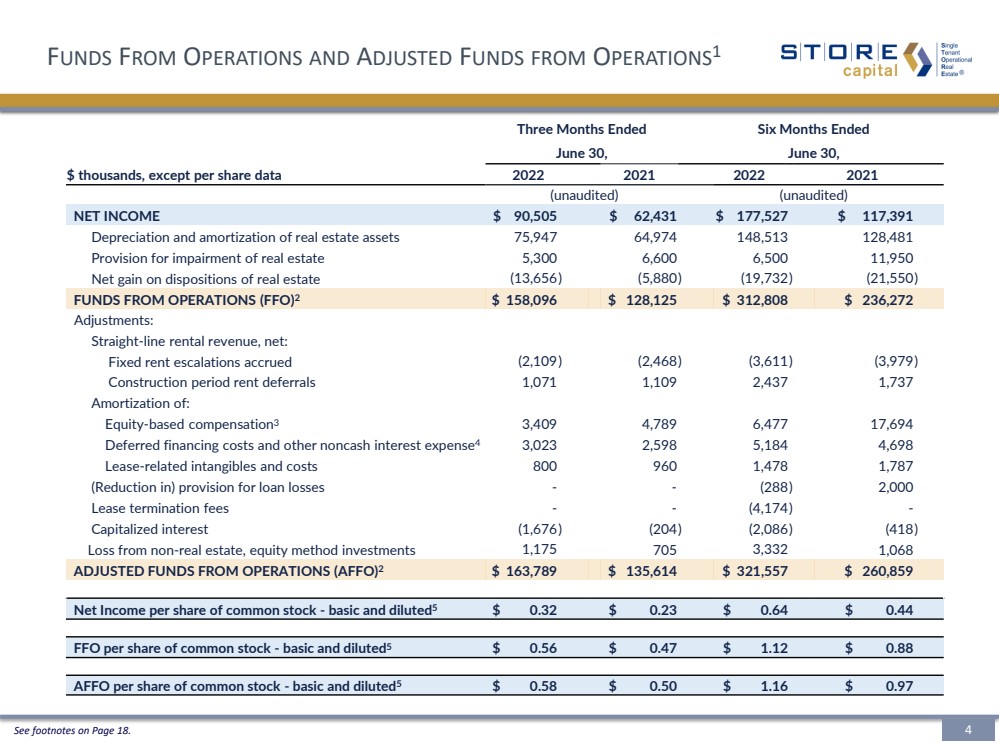
| ◾ | Net income of $90.5 million, or $0.32 per basic and diluted share, including an aggregate net gain of $13.7 million on dispositions of real estate |
| ◾ | AFFO of $163.8 million, or $0.58 per basic and diluted share |
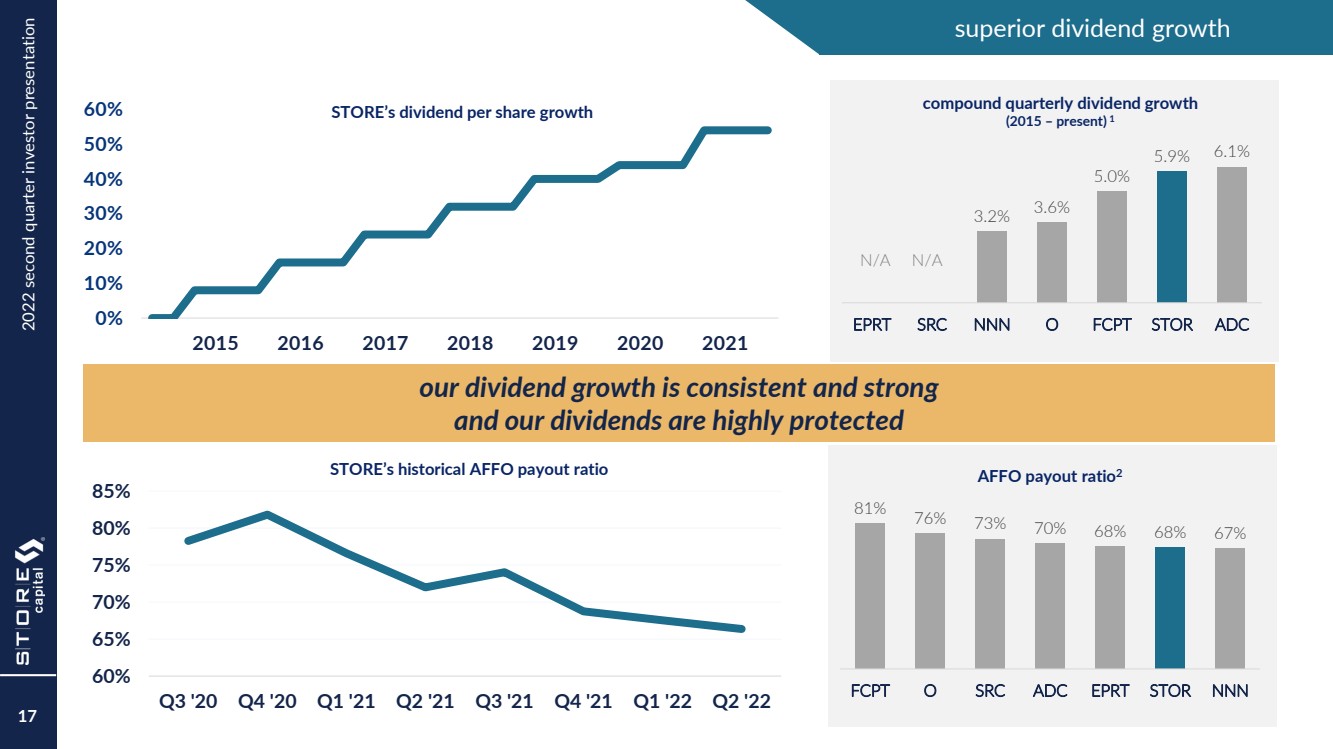
| ◾ | Declared a regular quarterly cash dividend per common share of $0.385 |
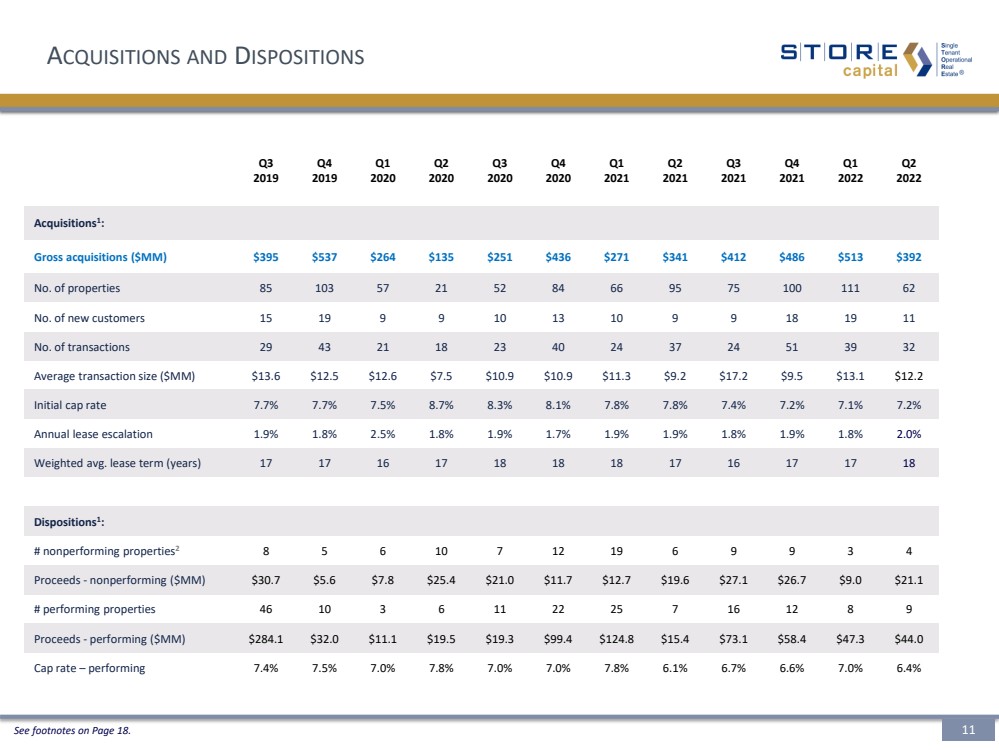
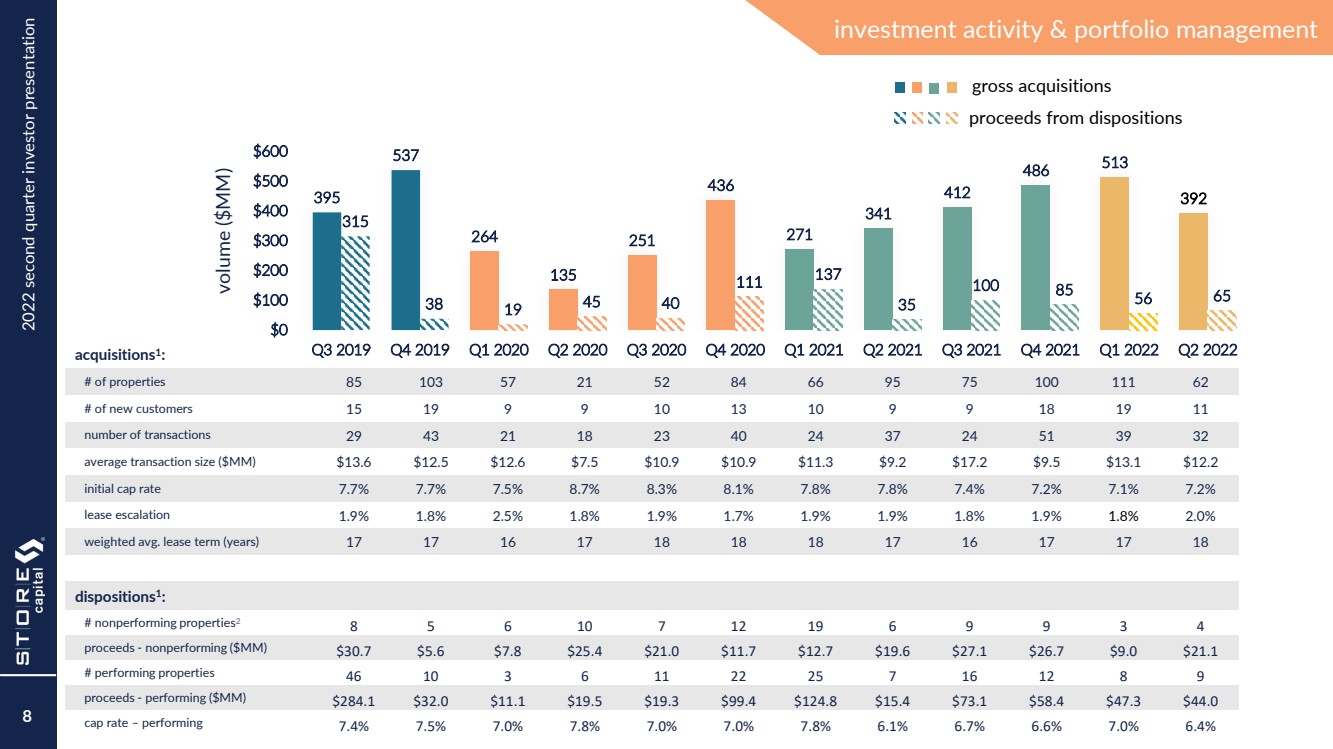
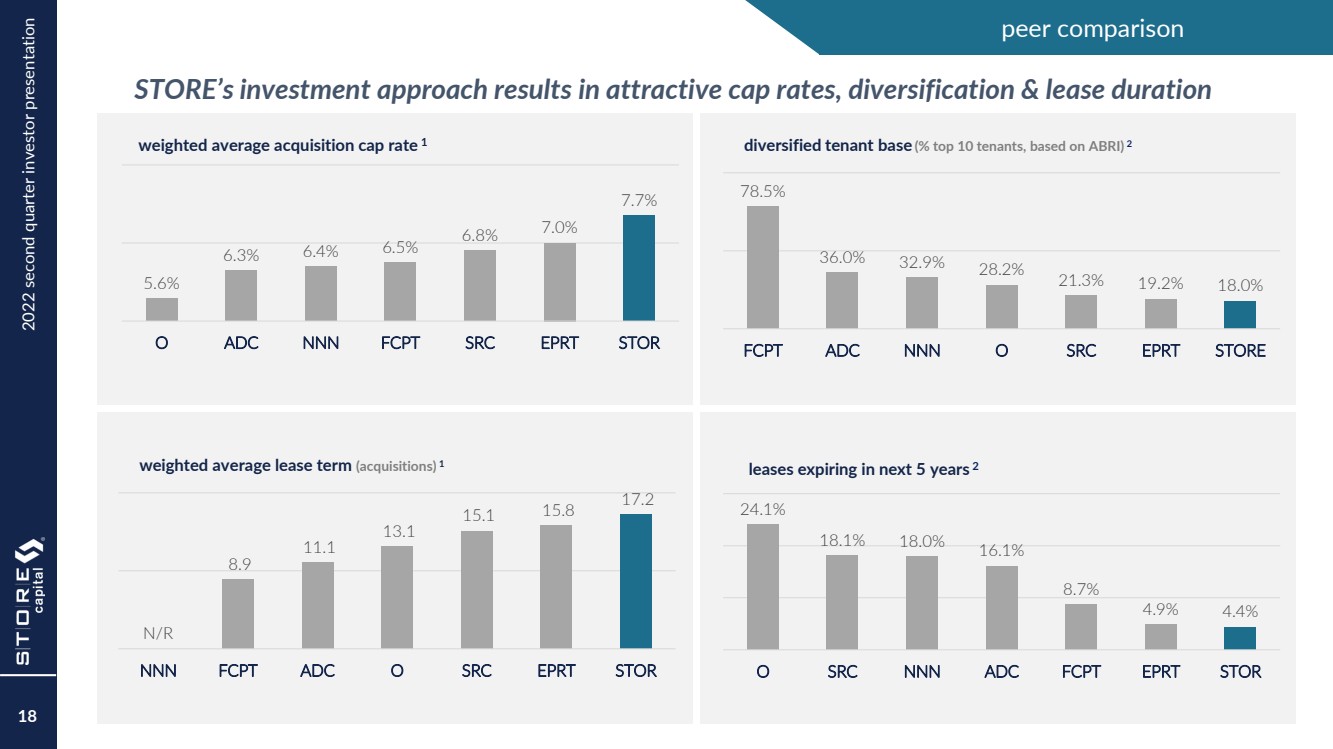
| ◾ | Invested $391.9 million in 62 properties at a weighted average initial cap rate of 7.2% |
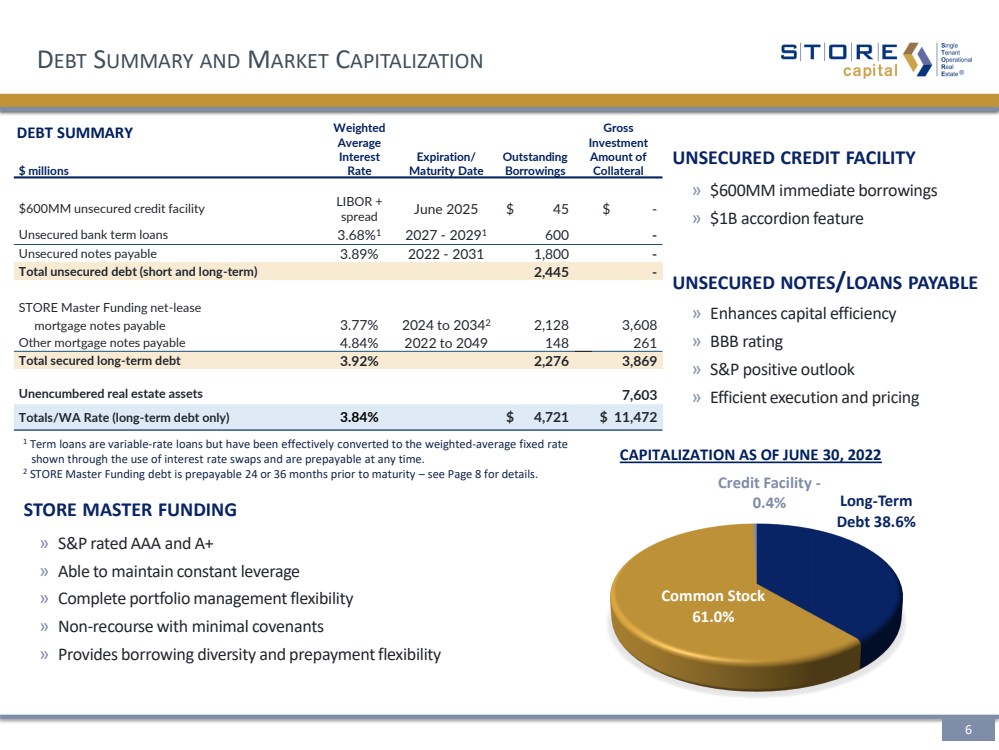
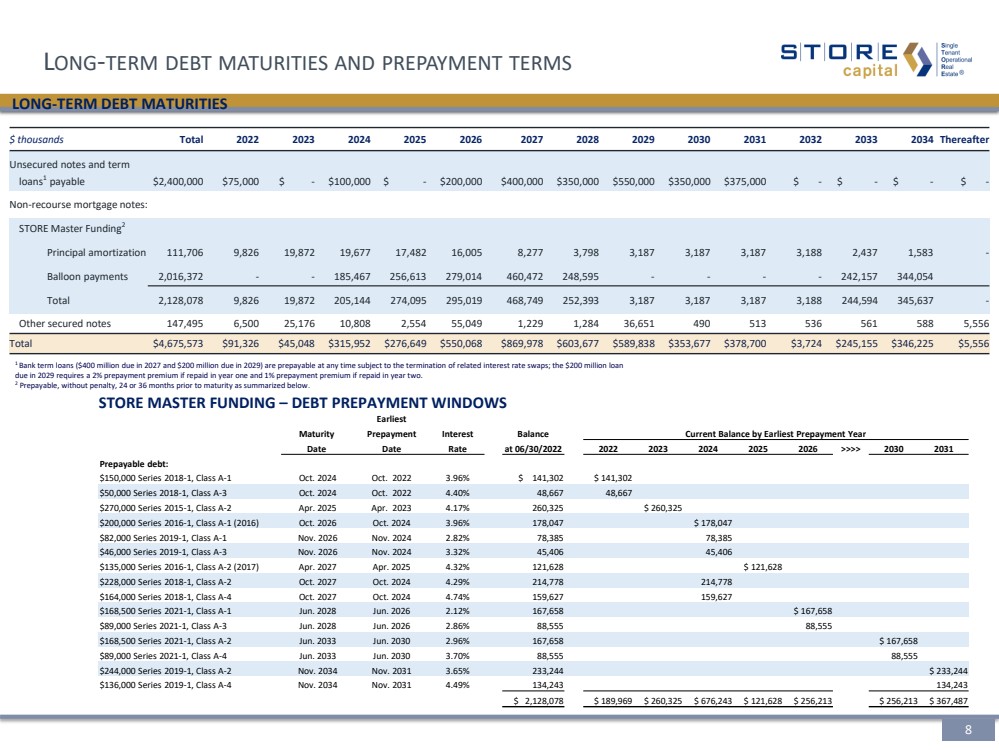
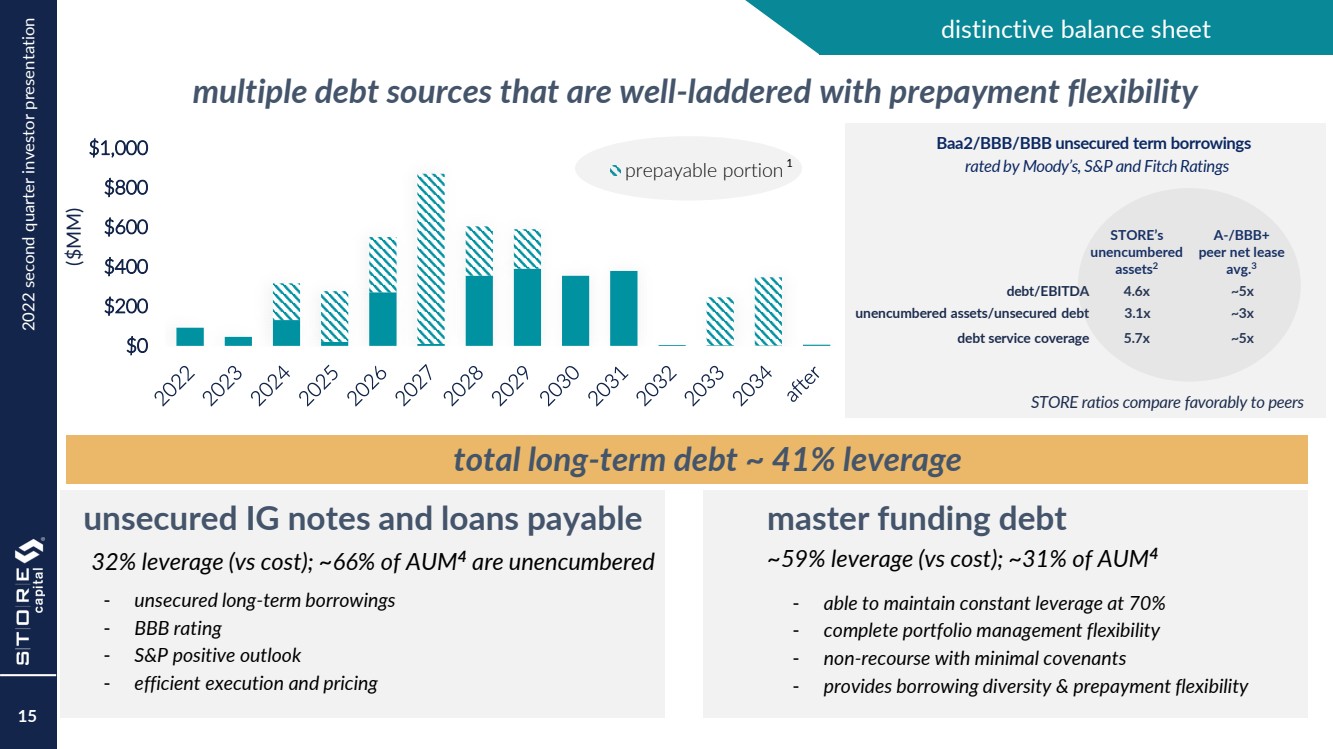
| ◾ | Closed on an aggregate $600 million of five-year ($400 million) and seven-year ($200 million) unsecured bank term debt at a weighted average interest rate of 3.68% |
| ◾ | Raised $83.4 million in net proceeds from the sale of approximately 3.1 million common shares under the Company’s at-the-market equity program |
For the six months ended June 30, 2022:
| ◾ | Total revenues of $445.9 million |
| ◾ | Net income of $177.5 million, or $0.64 per basic and diluted share, including an aggregate net gain of $19.7 million on dispositions of real estate |
| ◾ | AFFO of $321.6 million, or $1.16 per basic and diluted share |
| ◾ | Declared regular cash dividends per common share aggregating $0.770 |
| ◾ | Invested $904.4 million in 173 properties at a weighted average initial cap rate of 7.1% |
| ◾ | Raised $249.6 million in net proceeds from the sale of approximately 8.6 million common shares under the Company’s at-the-market equity program |
“Our momentum continued into the second quarter as we acquired $392 million in profit center real estate, while at the same time driving higher cap rates and lease escalations. We delivered strong revenue growth of 17% and a robust AFFO per share of $0.58. Our results were powered by our strong first half acquisition pace and the excellent performance of our portfolio,” said Mary Fedewa, STORE Capital’s President and Chief Executive Officer. “We address a very large market with our unique acquisition model and our financing flexibility allows us to optimize our cost of capital and maintain attractive spreads. As a result, we believe we can continue to deliver attractive risk-adjusted returns to our stakeholders in 2022 and beyond. Based on our
STORE Capital Corporation
Page 2 of 10
results in the first half of 2022 and our outlook for the remainder of the year, we are raising our 2022 AFFO per share guidance from a range of $2.20 to $2.23 to a range of $2.25 to $2.27.”
Financial Results
Total Revenues
Total revenues were $223.8 million for the second quarter of 2022, an increase of 16.5% from $192.0 million for the second quarter of 2021.
Total revenues for the first half of 2022 were $445.9 million, an increase of 19.1% from $374.3 million for the first half of 2021. The increase was driven primarily by the growth in the size of STORE Capital’s real estate investment portfolio, which grew from $10.0 billion in gross investment amount representing 2,738 property locations and 529 customers at June 30, 2021 to $11.4 billion in gross investment amount representing 3,012 property locations and 579 customers at June 30, 2022.
Net income was $90.5 million, or $0.32 per basic and diluted share, for the second quarter of 2022, as compared to $62.4 million, or $0.23 per basic and diluted share, for the second quarter of 2021. Net income for the second quarter of 2022 included an aggregate net gain on dispositions of real estate of $13.7 million, as compared to an aggregate net gain on dispositions of real estate of $5.9 million for the same period in 2021.
Net income includes such items as gain or loss on dispositions of real estate and provisions for impairment, which can vary from quarter to quarter and impact net income and period-to-period comparisons.
Net income for the six months ended June 30, 2022 was $177.5 million, or $0.64 per basic and diluted share, as compared to $117.4 million, or $0.44 per basic and diluted share, for the six months ended June 30, 2021. Net income for the first half of 2022 included an aggregate net gain on dispositions of real estate of $19.7 million, as compared to an aggregate net gain on dispositions of real estate of $21.5 million for the same period in 2021. Net income for the first half of 2021 reflects the impact of $10.1 million of noncash stock-based compensation expense related to the modification of certain performance-based awards granted in prior years.
Adjusted Funds from Operations (AFFO)
AFFO increased to $163.8 million, or $0.58 per basic and diluted share, for the second quarter of 2022, as compared to AFFO of $135.6 million, or $0.50 per basic and diluted share, for the second quarter of 2021. AFFO for the six months ended June 30, 2022 was $321.6 million, or $1.16 per basic and diluted share, an increase from $260.9 million, or $0.97 per basic and diluted share, for the six months ended June 30, 2021.
AFFO for the three- and six-month periods in 2022 rose primarily as a result of net additional rental revenues and interest income generated by growth in the Company’s real estate investment portfolio.
Dividend Information
As previously announced, STORE Capital declared a regular quarterly cash dividend per common share of $0.385 for the second quarter ended June 30, 2022. This dividend, totaling $108.8 million, was paid on July 15, 2022 to stockholders of record on June 30, 2022.
STORE Capital Corporation
Page 3 of 10
Real Estate Portfolio Highlights
The Company originated $391.9 million of gross investments representing 62 property locations during the second quarter of 2022. These origination and other activities resulted in the creation of 11 new customer relationships. The investments had a weighted average initial cap rate of 7.2%. Total investment activity for the first half of 2022 was $904.4 million representing 173 property locations with a weighted average initial cap rate of 7.1%. The Company defines “initial cap rate” for property acquisitions as the initial annual cash rent divided by the purchase price of the property. STORE’s leases customarily have lease escalations, most of which are tied to the consumer price index and subject to a cap. For acquisitions made during the three and six months ended June 30, 2022, the weighted average stated lease escalation cap was 2.0% and 1.9%, respectively.
Disposition Activity
During the six months ended June 30, 2022, the Company sold 24 properties and recognized an aggregate net gain on the disposition of real estate of $19.7 million; 13 of these 24 properties were sold in the second quarter for an aggregate net gain of $13.7 million. For the six months ended June 30, 2022, net proceeds from the disposition of real estate aggregated $117.2 million as compared to an aggregate original investment amount of $113.4 million. The Company also collected $4.2 million in lease termination fees in connection with property sales during the six months ended June 30, 2022.
Portfolio
At June 30, 2022, STORE Capital’s real estate portfolio totaled $11.4 billion. Approximately 94% of the portfolio represents commercial real estate properties subject to long-term leases, 6% represents mortgage loans and financing receivables on commercial real estate properties and a nominal amount represents loans receivable secured by the tenants’ other assets. As of June 30, 2022, the portfolio’s annualized base rent and interest (based on rates in effect on June 30, 2022 for all lease and loan contracts) totaled $908 million. The weighted average non-cancelable remaining term of the leases at June 30, 2022 was approximately 13.2 years, excluding renewal options, with leases representing approximately 4.4% of the portfolio scheduled to expire in the next five years (prior to 2027).
STORE Capital Corporation
Page 4 of 10
The Company’s portfolio of real estate investments is highly diversified across customers, brand names or business concepts, industries and geography. The following table presents a summary of the portfolio.
Portfolio At A Glance - As of June 30, 2022 |
|
| |
Customers |
| 579 | |
Investment property locations |
| 3,012 | |
States |
| 49 | |
Industries in which customers operate |
| 124 | |
Investment portfolio subject to Master Leases(1) |
| 94 | % |
Average investment amount/replacement cost (new)(2) |
| 80 | % |
Weighted average annual lease escalation(3) |
| 1.8 | % |
Weighted average remaining lease contract term |
| ~13.2 years | |
Occupancy(4) |
| 99.5 | % |
Locations subject to unit-level financial reporting |
| 99 | % |
Weighted average 4‑Wall coverage ratio(5) |
| 4.7x | |
Weighted average unit fixed charge coverage ratio (5) |
| 3.6x | |
| (1) | Percentage, based on base rent and interest, of investment portfolio in multiple properties with a single customer subject to master leases. Approximately 87% of the investment portfolio involves multiple properties with a single customer, whether or not subject to a master lease. |
| (2) | Represents the ratio of purchase price to replacement cost (new) at acquisition. |
| (3) | Represents the weighted average annual escalation rate of the entire portfolio as if all escalations occurred annually. For escalations based on a formula including CPI, assumes the stated fixed percentage in the contract or assumes 1.5% if no fixed percentage is in the contract. For contracts with no escalations remaining in the current lease term, assumes the escalation in the extension term. Calculation excludes contracts representing less than 0.1% of base rent and interest where there are no further escalations remaining in the current lease term and there are no extension options. |
| (4) | The Company defines occupancy as a property being subject to a lease or loan contract. As of June 30, 2022, 16 of the Company’s properties were vacant and not subject to a contract. |
| (5) | The 4-Wall coverage ratio refers to a unit’s FCCR before taking into account standardized corporate overhead expense. STORE Capital also calculates a unit’s FCCR generally as the ratio of (i) the unit’s EBITDAR, less a standardized corporate overhead expense based on estimated industry standards, to (ii) the unit’s total fixed charges, which are its lease expense, interest expense and scheduled principal payments on indebtedness (if applicable). The median 4-Wall coverage and unit FCCR ratios were 3.1x and 2.5x, respectively. |
The Company established a $900 million “at the market” equity distribution program, or ATM Program, in November 2020 and terminated its previous program. During the second quarter of 2022, the Company sold an aggregate of approximately 3.1 million common shares at a weighted average share price of $27.52 and raised approximately $83.4 million in net proceeds after the payment of sales agents’ commissions and offering expenses. For the six months ended June 30, 2022, the Company sold an aggregate of approximately 8.6 million common shares at a weighted average share price of $29.38 and raised approximately $249.6 million in net proceeds after the payment of sales agents’ commissions and offering expenses.
In April 2022, the Company entered into a term loan agreement under which the Company borrowed an aggregate $600 million of floating-rate, unsecured term loans through several banks who also participate in the Company’s revolving credit facility. The new term loans consist of a $400 million 5-year loan and a $200 million 7-year loan. In connection with the new floating-rate term loans, the Company also entered into interest rate swap agreements that effectively convert the floating rates to a weighted average fixed rate of 3.68%. The Company used proceeds from the transaction to pay down outstanding balances on its unsecured revolving credit facility and to prepay, without penalty, $134.5 million of STORE Master Funding Series 2014-1, Class A-2 notes, which were scheduled to mature in 2024 and bore an interest rate of 5.0%.
STORE Capital Corporation
Page 5 of 10
The Company is raising its 2022 AFFO per share guidance from a range of $2.20 to $2.23 to a range of $2.25 to $2.27 and is maintaining its expected 2022 annual real estate acquisition volume, net of projected property sales, of $1.3 billion to $1.5 billion. This AFFO per share guidance equates to anticipated net income, excluding gains or losses on sales of property, of $1.11 to $1.12 per share, plus $1.07 to $1.08 per share of expected real estate depreciation and amortization, plus approximately $0.07 per share related to noncash items. AFFO per share is sensitive to the timing and amount of real estate acquisitions, property dispositions and capital markets activities during the year, as well as to the spread achieved between the lease rates on new acquisitions and the interest rates on borrowings used to finance those acquisitions. The AFFO per share guidance is based on a weighted average initial cap rate on new acquisitions in the range of 7.0% to 7.2%.
Conference Call and Webcast
A conference call and audio webcast with analysts and investors will be held tomorrow, August 4, 2022, at 12:00 p.m. Eastern Time / 9:00 a.m. Scottsdale, Arizona Time, to discuss second quarter ended June 30, 2022 operating results and answer questions.
| ● | Live conference call: 855-656-0920 (domestic) or 412-542-4168 (international) |
| ● | Conference call replay available through August 18, 2022: 877-344-7529 (domestic) or 412-317-0088 (international) using access code 3145919 |
| ● | Live and archived webcast: https://ir.storecapital.com/news-results/webcasts/default.aspx |
Supplemental Materials
The Company’s Supplemental Operating and Financial Information for the second quarter ended June 30, 2022 is available on the Investor Relations section of the STORE Capital website (www.storecapital.com) at News & Results - Quarterly Results | STORE Capital Corporation.
STORE Capital Corporation is an internally managed net-lease real estate investment trust, or REIT, that is a leader in the acquisition, investment and management of Single Tenant Operational Real Estate, which is its target market and the inspiration for its name. STORE Capital is one of the largest and fastest growing net-lease REITs and owns a large, well-diversified portfolio that consists of investments in more than 3,000 property locations across the United States, substantially all of which are profit centers. Additional information about STORE Capital can be found on its website at www.storecapital.com.
Forward-Looking Statements
Certain statements contained in this press release that are not historical facts contain forward-looking statements within the meaning of Section 27A of the Securities Act of 1933, as amended, and within the meaning of Section 21E of the Securities Exchange Act of 1934, as amended, that are subject to the “safe harbor” created by those sections. Forward-looking statements can be identified by the use of words such as “estimate,” “anticipate,” “expect,” “believe,” “intend,” “may,” “will,” “should,” “seek,” “approximate” or “plan,” or the negative of these words and phrases or similar words or phrases. Forward-looking statements,
STORE Capital Corporation
Page 6 of 10
by their nature, involve estimates, projections, goals, forecasts and assumptions and are subject to risks and uncertainties that could cause actual results or outcomes to differ materially from those expressed in the forward-looking statements. For more information on risk factors for STORE Capital’s business, please refer to the periodic reports the Company files with the Securities and Exchange Commission from time to time. Many of the risks identified in the periodic reports have been and will continue to be heightened as a result of the ongoing and numerous adverse effects arising from the COVID-19 pandemic. These forward-looking statements herein speak only as of the date of this press release and should not be relied upon as predictions of future events. STORE Capital expressly disclaims any obligation or undertaking to update or revise any forward-looking statements contained herein, to reflect any change in STORE Capital’s expectations with regard thereto, or any other change in events, conditions or circumstances on which any such statement is based, except as required by law.
Non-GAAP Financial Measures
FFO and AFFO
STORE Capital’s reported results are presented in accordance with U.S. generally accepted accounting principles, or GAAP. The Company also discloses Funds from Operations, or FFO, and Adjusted Funds from Operations, or AFFO, both of which are non-GAAP measures. Management believes these two non-GAAP financial measures are useful to investors because they are widely accepted industry measures used by analysts and investors to compare the operating performance of REITs. FFO and AFFO do not represent cash generated from operating activities and are not necessarily indicative of cash available to fund cash requirements; accordingly, they should not be considered alternatives to net income as a performance measure or to cash flows from operations as reported on a statement of cash flows as a liquidity measure and should be considered in addition to, and not in lieu of, GAAP financial measures.
The Company computes FFO in accordance with the definition adopted by the Board of Governors of the National Association of Real Estate Investment Trusts, or NAREIT. NAREIT defines FFO as GAAP net income, excluding gains (or losses) from extraordinary items and sales of depreciable property, real estate impairment losses, and depreciation and amortization expense from real estate assets, including the pro rata share of such adjustments of unconsolidated subsidiaries.
To derive AFFO, the Company modifies the NAREIT computation of FFO to include other adjustments to GAAP net income related to certain revenues and expenses that have no impact on the Company’s long-term operating performance, such as straight-line rents, amortization of deferred financing costs and stock-based compensation. In addition, in deriving AFFO, the Company excludes certain other costs not related to its ongoing operations, such as the amortization of lease-related intangibles and executive severance and transition costs.
FFO is used by management, investors and analysts to facilitate meaningful comparisons of operating performance between periods and among the Company’s peers primarily because it excludes the effect of real estate depreciation and amortization and net gains (or losses) on sales, which are based on historical costs and implicitly assume that the value of real estate diminishes predictably over time, rather than fluctuating based on existing market conditions. Management believes that AFFO provides more useful information to investors and analysts because it modifies FFO to exclude certain additional revenues and expenses such as, as applicable, straight-line rents, including construction period rent deferrals, and the amortization of deferred financing costs, stock-based compensation, lease-related intangibles and executive severance and transition costs as such items have no impact on long-term operating performance. As a result, the Company believes AFFO to be a more meaningful measurement of ongoing performance that allows for greater performance
STORE Capital Corporation
Page 7 of 10
comparability. Therefore, the Company discloses both FFO and AFFO and reconciles them to the most appropriate GAAP performance metric, which is net income. STORE Capital’s FFO and AFFO may not be comparable to similarly titled measures employed by other companies.
Contacts:
Financial Profiles, Inc.
STORECapital@finprofiles.com
Investors or Media:
Moira Conlon, 310-622-8220
Megan McGrath, 310-622-8248
STORE Capital Corporation
Page 8 of 10
STORE Capital Corporation
Condensed Consolidated Statements of Income
(In thousands, except share and per share data)
| | Three months ended | | Six months ended | ||||||||
| | June 30, | | June 30, | ||||||||
|
| 2022 |
| 2021 |
| 2022 |
| 2021 | ||||
| | (unaudited) | | (unaudited) | ||||||||
Revenues: | | | | | | | | | | | | |
Rental revenues | | $ | 209,994 | | $ | 180,164 | | $ | 412,055 | | $ | 349,492 |
Interest income on loans and financing receivables | |
| 13,039 | |
| 11,660 | |
| 27,969 | |
| 24,223 |
Other income | |
| 739 | |
| 222 | |
| 5,864 | |
| 592 |
Total revenues | |
| 223,772 | |
| 192,046 | |
| 445,888 | |
| 374,307 |
| | | | | | | | | | | | |
Expenses: | |
|
| |
|
| |
|
| |
|
|
Interest | |
| 45,908 | |
| 41,709 | |
| 89,907 | |
| 83,537 |
Property costs | |
| 2,314 | |
| 5,168 | |
| 6,555 | |
| 9,831 |
General and administrative | |
| 15,938 | |
| 16,089 | |
| 32,954 | |
| 41,095 |
Depreciation and amortization | |
| 76,017 | |
| 65,035 | |
| 148,656 | |
| 128,602 |
Provisions for impairment | |
| 5,300 | |
| 6,600 | |
| 6,212 | |
| 13,950 |
Total expenses | |
| 145,477 | |
| 134,601 | |
| 284,284 | |
| 277,015 |
Other income: | | | | | | | | | | | | |
Net gain on dispositions of real estate | |
| 13,656 | |
| 5,880 | |
| 19,732 | |
| 21,550 |
Loss from non-real estate, equity method investments | | | (1,175) | | | (705) | | | (3,332) | | | (1,068) |
Income before income taxes | |
| 90,776 | |
| 62,620 | |
| 178,004 | |
| 117,774 |
Income tax expense | |
| 271 | |
| 189 | |
| 477 | |
| 383 |
Net income | | $ | 90,505 | | $ | 62,431 | | $ | 177,527 | | $ | 117,391 |
| | | | | | | | | | | | |
Net income per share of common stock - | | $ | 0.32 | | $ | 0.23 | | $ | 0.64 | | $ | 0.44 |
| | | | | | | | | | | | |
| | | | | | | | | | | | |
Weighted average common shares outstanding: | | | | | | | | | | | | |
Basic | |
| 280,839,392 | |
| 270,293,555 | |
| 277,937,454 | |
| 268,340,974 |
Diluted | |
| 280,839,392 | |
| 270,293,555 | |
| 277,937,454 | |
| 268,340,974 |
| | | | | | | | | | | | |
Dividends declared per common share | | $ | 0.385 | | $ | 0.36 | | $ | 0.770 | | $ | 0.72 |
STORE Capital Corporation
Page 9 of 10
STORE Capital Corporation
Condensed Consolidated Balance Sheets
(In thousands, except share and per share data)
|
| June 30, 2022 |
| December 31, 2021 | ||
| | (unaudited) | | (audited) | ||
Assets |
| |
|
| |
|
Investments: |
| |
|
| |
|
Real estate investments: |
| |
|
| |
|
Land and improvements | | $ | 3,300,120 | | $ | 3,133,402 |
Buildings and improvements | |
| 7,341,664 | |
| 6,802,918 |
Intangible lease assets | |
| 62,132 | |
| 54,971 |
Total real estate investments | |
| 10,703,916 | |
| 9,991,291 |
Less accumulated depreciation and amortization | |
| (1,289,861) | |
| (1,159,292) |
| |
| 9,414,055 | |
| 8,831,999 |
Real estate investments held for sale, net | | | 23,179 | | | 25,154 |
Operating ground lease assets | |
| 32,601 | |
| 33,318 |
Loans and financing receivables, net | |
| 710,186 | |
| 697,269 |
Net investments | |
| 10,180,021 | |
| 9,587,740 |
Cash and cash equivalents | |
| 30,855 | |
| 64,269 |
Other assets, net | |
| 115,616 | |
| 121,073 |
Total assets | | $ | 10,326,492 | | $ | 9,773,082 |
| | | | | | |
Liabilities and stockholders’ equity | |
|
| |
|
|
Liabilities: | |
|
| |
|
|
Credit facility | | $ | 45,000 | | $ | 130,000 |
Unsecured notes and term loans payable, net | |
| 2,381,200 | |
| 1,782,813 |
Non-recourse debt obligations of consolidated special purpose entities, net | |
| 2,252,667 | |
| 2,425,708 |
Dividends payable | |
| 108,835 | |
| 105,415 |
Operating lease liabilities | |
| 37,035 | |
| 37,637 |
Accrued expenses, deferred revenue and other liabilities | |
| 140,433 | |
| 147,380 |
Total liabilities | |
| 4,965,170 | |
| 4,628,953 |
| | | | | | |
Stockholders’ equity: | |
|
| |
|
|
Common stock, $0.01 par value per share, 375,000,000 shares authorized, 282,688,860 and 273,806,225 shares issued and outstanding, respectively | |
| 2,827 | |
| 2,738 |
Capital in excess of par value | |
| 5,997,378 | |
| 5,745,692 |
Distributions in excess of retained earnings | |
| (642,945) | |
| (602,137) |
Accumulated other comprehensive income (loss) | |
| 4,062 | |
| (2,164) |
Total stockholders’ equity | |
| 5,361,322 | |
| 5,144,129 |
Total liabilities and stockholders’ equity | | $ | 10,326,492 | | $ | 9,773,082 |
STORE Capital Corporation
Page 10 of 10
STORE Capital Corporation
Reconciliations of Non-GAAP Financial Measures
(In thousands, except per share data)
Funds from Operations and Adjusted Funds from Operations
| | Three months ended | | Six months ended | ||||||||
| | June 30, | | June 30, | ||||||||
|
| 2022 |
| 2021 |
| 2022 |
| 2021 | ||||
| | (unaudited) | | (unaudited) | ||||||||
| | | | | | | | | | | | |
Net income | | $ | 90,505 | | $ | 62,431 | | $ | 177,527 | | $ | 117,391 |
Depreciation and amortization of real estate assets | |
| 75,947 | |
| 64,974 | |
| 148,513 | |
| 128,481 |
Provision for impairment of real estate | |
| 5,300 | |
| 6,600 | |
| 6,500 | |
| 11,950 |
Net gain on dispositions of real estate | |
| (13,656) | |
| (5,880) | |
| (19,732) | |
| (21,550) |
Funds from Operations (1) | |
| 158,096 | |
| 128,125 | |
| 312,808 | |
| 236,272 |
| | | | | | | | | | | | |
Adjustments: | |
|
| |
|
| |
|
| |
|
|
Straight-line rental revenue: | |
|
| |
|
| |
|
| |
|
|
Fixed rent escalations accrued | |
| (2,109) | |
| (2,468) | |
| (3,611) | |
| (3,979) |
Construction period rent deferrals | |
| 1,071 | |
| 1,109 | |
| 2,437 | |
| 1,737 |
Amortization of: | |
|
| |
|
| |
|
| |
|
|
Equity-based compensation (2) | |
| 3,409 | |
| 4,789 | |
| 6,477 | |
| 17,694 |
Deferred financing costs and other (3) | |
| 3,023 | |
| 2,598 | |
| 5,184 | |
| 4,698 |
Lease-related intangibles and costs | |
| 800 | |
| 960 | |
| 1,478 | |
| 1,787 |
(Reduction in) provision for loan losses | |
| — | |
| — | |
| (288) | |
| 2,000 |
Lease termination fees | | | — | | | — | | | (4,174) | | | — |
Capitalized interest | |
| (1,676) | |
| (204) | |
| (2,086) | |
| (418) |
Loss from non-real estate, equity method investments | | | 1,175 | | | 705 | | | 3,332 | | | 1,068 |
Adjusted Funds from Operations (1) | | $ | 163,789 | | $ | 135,614 | | $ | 321,557 | | $ | 260,859 |
| | | | | | | | | | | | |
Dividends declared to common stockholders | | $ | 108,835 | | $ | 97,808 | | $ | 216,479 | | $ | 195,011 |
| | | | | | | | | | | | |
Net income per share of common stock: (4) | |
|
| |
|
| |
| | |
|
|
Basic and Diluted | | $ | 0.32 | | $ | 0.23 | | $ | 0.64 | | $ | 0.44 |
FFO per share of common stock: (4) | |
| | |
|
| |
| | |
| |
Basic and Diluted | | $ | 0.56 | | $ | 0.47 | | $ | 1.12 | | $ | 0.88 |
AFFO per share of common stock: (4) | |
| | |
|
| |
| | |
|
|
Basic and Diluted | | $ | 0.58 | | $ | 0.50 | | $ | 1.16 | | $ | 0.97 |
| (1) | FFO and AFFO for the three months ended June 30, 2022 and 2021, include approximately $0.3 million and $2.9 million, respectively, and, for the six months ended June 30, 2022 and 2021, include approximately $1.0 million and $4.9 million, respectively, of net revenue that is subject to the short-term deferral arrangements entered into in response to the COVID-19 pandemic; the Company accounts for these deferral arrangements as rental revenue and a corresponding increase in receivables. FFO and AFFO for the three months ended June 30, 2022 and 2021, exclude approximately $3.8 million and $5.4 million, respectively, and, for the six months ended June 30, 2022 and 2021, exclude approximately $7.2 million and $11.3 million, respectively, collected under these short-term deferral arrangements. |
| (2) | For the six months ended June 30, 2021, stock-based compensation expense included $10.1 million related to the modification of certain performance-based awards granted in 2018 and 2019. |
| (3) | For both the three and six months ended June 30, 2022 and 2021, includes $0.8 million and $0.5 million, respectively, of accelerated amortization of deferred financing costs related to the prepayment of debt. |
| (4) | Under the two-class method, earnings attributable to unvested restricted stock are deducted from earnings in the computation of per share amounts where applicable. |
| SINGLE | TENANT | OPERATIONAL | REAL | ESTATE NYSE: STOR ir.storecapital.com 2Q22 Supplemental Operating and Financial Information August 3, 2022 |
| This Supplemental Information should be read together with the Company’s second quarter 2022 earnings press release (include d a s Exhibit 99.1 of the Company’s Current Report on Form 8 - K, filed on August 3, 2022) as certain disclosures, definitions and reconciliations in such release have not been included in th is Supplemental Information. 1 T ABLE OF C ONTENTS STORE is Single Tenant Operational Real Estate 2 About STORE Capital 2 Financial Condensed Consolidated Statements of Income 3 Funds from Operations and Adjusted Funds from Operations 4 Condensed Consolidated Balance Sheets 5 Debt Summary and Market Capitalization 6 Adjusted Debt to Adjusted EBITDA re 7 Long - Term Debt Maturities and Prepayment Terms 8 Debt Covenants 9 Portfolio Portfolio At A Glance 10 Acquisitions and Dispositions 11 Diversification Across Customers and Geographies 12 Diversification Across Industry Groups 13 Occupancy 15 Rent Escalations and Lease Expirations 16 Guidance 17 Footnotes 18 Supplemental Reporting Measures 19 Forward - Looking Statements 21 |
| STORE IS S INGLE T ENANT O PERATIONAL R EAL E STATE What We Do We were formed to fill the needs of thousands of middle market and larger companies for efficient long - term capital for their pr ofit - center real estate. In addressing this large market, we have maintained a significant investment pipeline of targeted investment opportunities since th e day we opened our doors. These opportunities allow us to be selective, choosing strong tenants and investments that offer attractive risk - adjusted return s. Common Stock Our common stock is traded on the New York Stock Exchange under the symbol “STOR” Corporate Headquarters 8377 East Hartford Drive, Suite 100 Scottsdale, Arizona 85255 480.256.1100 About STORE Capital STORE Capital Corporation is an internally managed net - lease real estate investment trust, or REIT, that is a leader in the acquisition, investment and management of S ingle T enant O perational R eal E state. We are one of the largest and fastest growing net - lease REITs and own a large, well - diversified portfolio that consists of investments in 3,012 property locations aggregating $11.4 billion in gross investment dollars at June 30, 2022. Our customers operate across a wide variety of vital industries within the service, retail and manufacturing sectors of the U.S. economy, with restaurants, early childhood education centers, metal fabrication, automotive repair and maintenance, and health clubs representing the top industries in our portfolio. We estimate the market for STORE Properties to be among the nation’s largest real estate sectors, exceeding $3.9 trillion in market value and including more than 2.0 million properties. For more information about STORE Capital, please visit our website at www.storecapital.com . STORE Senior Leadership Team Mary Fedewa, President, Chief Executive Officer and Director Sherry Rexroad, Executive Vice President, Chief Financial Officer and Treasurer Craig Barnett, Executive Vice President – Underwriting and Portfolio Management Chad Freed, General Counsel, Executive Vice President and Secretary Tyler Maertz, Executive Vice President – Acquisitions Lori Markson, Executive Vice President – Portfolio Operations Alex McElyea, Executive Vice President – Data, Analytics and Business Strategy 2 |
| C ONDENSED C ONSOLIDATED S TATEMENTS OF I NCOME Three Months Ended Six Months Ended June 30, June 30, $ thousands, except share and per share data 2022 2021 2022 2021 Revenues: (unaudited) (unaudited) Rental revenues $ 209,994 $ 180,164 $ 412,055 $ 349,492 Interest income on loans and financing receivables 13,039 11,660 27,969 24,223 Other income 739 222 5,864 592 Total revenues 223,772 192,046 445,888 374,307 Expenses: Interest 45,908 41,709 89,907 83,537 Property costs 2,314 5,168 6,555 9,831 General and administrative 15,938 16,089 32,954 41,095 Depreciation and amortization 76,017 65,035 148,656 128,602 Provisions for impairment 5,300 6,600 6,212 13,950 Total expenses 145,477 134,601 284,284 277,015 Other Income: Net gain on dispositions of real estate 13,656 5,880 19,732 21,550 Loss from non - real estate, equity method investments (1,175) (705 ) (3,332) (1,068 ) Income before income taxes 90,776 62,620 178,004 117,774 Income tax expense 271 189 477 383 Net income $ 90,505 $ 62,431 $ 177,527 $ 117,391 Net income per share of common stock - basic and diluted $ 0.32 $ 0.23 $ 0.64 $ 0.44 Dividends declared per common share $ 0.385 $ 0.36 $ 0.770 $ 0.72 Weighted average common shares outstanding – basic 280,839,392 270,293,555 277,937,454 268,340,974 – diluted 280,839,392 270,293,555 277,937,454 268,340,974 3 |
| F UNDS F ROM O PERATIONS AND A DJUSTED F UNDS FROM O PERATIONS 1 See footnotes on Page 18. . Three Months Ended Six Months Ended June 30, June 30, $ thousands, except per share data 2022 2021 2022 2021 (unaudited) (unaudited) NET INCOME $ 90,505 $ 62,431 $ 177,527 $ 117,391 Depreciation and amortization of real estate assets 75,947 64,974 148,513 128,481 Provision for impairment of real estate 5,300 6,600 6,500 11,950 Net gain on dispositions of real estate (13,656 ) (5,880 ) (19,732 ) (21,550 ) FUNDS FROM OPERATIONS (FFO) 2 $ 158,096 $ 128,125 $ 312,808 $ 236,272 Adjustments: Straight - line rental revenue, net: Fixed rent escalations accrued (2,109 ) (2,468 ) (3,611 ) (3,979 ) Construction period rent deferrals 1,071 1,109 2,437 1,737 Amortization of: Equity - based compensation 3 3,409 4,789 6,477 17,694 Deferred financing costs and other noncash interest expense 4 3,023 2,598 5,184 4,698 Lease - related intangibles and costs 800 960 1,478 1,787 (Reduction in) provision for loan losses - - (288 ) 2,000 Lease termination fees - - (4,174 ) - Capitalized interest (1,676 ) (204 ) (2,086 ) (418 ) Loss from non - real estate, equity method investments 1,175 705 3,332 1,068 ADJUSTED FUNDS FROM OPERATIONS (AFFO) 2 $ 163,789 $ 135,614 $ 321,557 $ 260,859 Net Income per share of common stock - basic and diluted 5 $ 0.32 $ 0.23 $ 0.64 $ 0.44 FFO per share of common stock - basic and diluted 5 $ 0.56 $ 0.47 $ 1.12 $ 0.88 AFFO per share of common stock - basic and diluted 5 $ 0.58 $ 0.50 $ 1.16 $ 0.97 4 |
| C ONDENSED C ONSOLIDATED B ALANCE S HEETS $ thousands, except share and per share data June 30, 2022 December 31, 2021 Assets (unaudited) (audited) Investments: Real estate investments: Land and improvements $ 3,300,120 $ 3,133,402 Buildings and improvements 7,341,664 6,802,918 Intangible lease assets 62,132 54,971 Total real estate investments 10,703,916 9,991,291 Less accumulated depreciation and amortization (1,289,861 ) (1,159,292 ) 9,414,055 8,831,999 Real estate investments held for sale, net 23,179 25,154 Operating ground lease assets 32,601 33,318 Loans and financing receivables, net 710,186 697,269 Net investments 10,180,021 9,587,740 Cash and cash equivalents 30,855 64,269 Other assets, net 115,616 121,073 Total assets $ 10,326,492 $ 9,773,082 Liabilities and stockholders' equity Liabilities: Credit facility $ 45,000 $ 130,000 Unsecured notes and term loans payable, net 2,381,200 1,782,813 Non - recourse debt obligations of consolidated special purpose entities, net 2,252,667 2,425,708 Dividends payable 108,835 105,415 Operating lease liabilities 37,035 37,637 Accrued expenses, deferred revenue and other liabilities 140,433 147,380 Total liabilities 4,965,170 4,628,953 Stockholders' equity: Common stock, $0.01 par value per share, 375,000,000 shares authorized, 282,688,860 and 273,806,225 shares issued and outstanding, respectively 2,827 2,738 Capital in excess of par value 5,997,378 5,745,692 Distributions in excess of retained earnings (642,945 ) (602,137 ) Accumulated other comprehensive income (loss) 4,062 (2,164 ) Total stockholders' equity 5,361,322 5,144,129 Total liabilities and stockholders' equity $ 10,326,492 $ 9,773,082 5 |
| D EBT S UMMARY AND M ARKET C APITALIZATION DEBT SUMMARY DEBT MATURITIES STORE MASTER FUNDING » S&P rated AAA and A+ » Able to maintain constant leverage » Complete portfolio management flexibility » Non - recourse with minimal covenants » Provides borrowing diversity and prepayment flexibility » Enhances capital efficiency » BBB rating » S&P positive outlook » Efficient execution and pricing UNSECURED NOTES / LOANS PAYABLE $ millions Weighted Average Interest Rate Expiration/ Maturity Date Outstanding Borrowings Gross Investment Amount of Collateral $600 MM unsecured credit facility LIBOR + spread June 2025 $ 45 $ - Unsecured bank term loans 3.68% 1 2027 - 2029 1 600 - Unsecured notes payable 3.89% 2022 - 2031 1,800 - Total unsecured debt (short and long - term) 2,445 - STORE Master Funding net - lease mortgage notes payable 3.77% 2024 to 2034 2 2,128 3,608 Other mortgage notes payable 4.84% 2022 to 2049 148 261 Total secured long - term debt 3.92% 2,276 3,869 Unencumbered real estate assets 7,603 Totals/WA Rate (long - term debt only) 3.84% $ 4,721 $ 11,472 Long - Term Debt 38.6% Common Stock 61.0% Credit Facility - 0.4% CAPITALIZATION AS OF JUNE 30, 2022 UNSECURED CREDIT FACILITY » $600MM immediate borrowings » $1B accordion feature 1 Term loans are variable - rate loans but have been effectively converted to the weighted - average fixed rate shown through the use of interest rate swaps and are prepayable at any time. 2 STORE Master Funding debt is prepayable 24 or 36 months prior to maturity – see Page 8 for details. 6 |
| A DJUSTED D EBT TO A DJUSTED EBITDA RE . $ millions (unaudited) As of June 30, 2022 Credit facility $ 45.0 Unsecured notes payable, net 2,381.2 Non - recourse debt obligations of consolidated special purpose entities, net 2,252.7 TOTAL DEBT $ 4,678.9 Adjustments: Unamortized net debt discount 4.9 Unamortized deferred financing costs 36.8 Cash and cash equivalents (30.9 ) Restricted cash deposits held for the benefit of lenders (1.4 ) ADJUSTED DEBT $ 4,688.3 Debt to Adjusted Debt 1 $ millions (unaudited) Three Months Ended June 30, 2022 NET INCOME $ 90.5 Adjustments: Interest 45.9 Income tax expense 0.3 Depreciation and amortization 76.0 EBITDA 212.7 Adjustments: Provision for impairment of real estate 5.3 Net gain on dispositions of real estate (13.7 ) EBITDA re 204.3 Adjustments: Provision for loan losses - Lease termination fees - Loss from non - real estate, equity method investments 1.2 ADJUSTED EBITDA re $ 205.5 Estimated adjustment to Adjusted EBITDA re as if all real estate acquisitions and dispositions for the quarter ended June 30, 2022 had occurred as of April 1, 2022 1.9 ADJUSTED EBITDA re – CURRENT ESTIMATED RUN RATE $ 207.4 ANNUALIZED ADJUSTED EBITDA re $ 822.1 ANNUALIZED ADJUSTED EBITDA re – CURRENT ESTIMATED RUN RATE $ 829.7 ADJUSTED DEBT / ANNUALIZED ADJUSTED EBITDA re 5.7x ADJUSTED DEBT/ ANNUALIZED ADJUSTED EBITDA re – CURRENT ESTIMATED RUN RATE 5.7x Net Income to Adjusted EBITDA re 1 7 See footnotes on Page 18. . |
| $ thousands Total 2022 2023 2024 2025 2026 2027 2028 2029 2030 2031 2032 2033 2034 Thereafter Unsecured notes and term loans 1 payable $2,400,000 $75,000 $ - $100,000 $ - $200,000 $400,000 $350,000 $550,000 $350,000 $375,000 $ - $ - $ - $ - Non - recourse mortgage notes: STORE Master Funding 2 Principal amortization 111,706 9,826 19,872 19,677 17,482 16,005 8,277 3,798 3,187 3,187 3,187 3,188 2,437 1,583 - Balloon payments 2,016,372 - - 185,467 256,613 279,014 460,472 248,595 - - - - 242,157 344,054 Total 2,128,078 9,826 19,872 205,144 274,095 295,019 468,749 252,393 3,187 3,187 3,187 3,188 244,594 345,637 - Other secured notes 147,495 6,500 25,176 10,808 2,554 55,049 1,229 1,284 36,651 490 513 536 561 588 5,556 Total $4,675,573 $91,326 $45,048 $315,952 $276,649 $550,068 $869,978 $603,677 $589,838 $353,677 $378,700 $3,724 $245,155 $346,225 $5,556 Earliest Maturity Prepayment Interest Balance Current Balance by Earliest Prepayment Year Date Date Rate at 06/30/2022 2022 2023 2024 2025 2026 >>>> 2030 2031 Prepayable debt: $150,000 Series 2018 - 1, Class A - 1 Oct. 2024 Oct. 2022 3.96% $ 141,302 $ 141,302 $50,000 Series 2018 - 1, Class A - 3 Oct. 2024 Oct. 2022 4.40% 48,667 48,667 $270,000 Series 2015 - 1, Class A - 2 Apr. 2025 Apr. 2023 4.17% 260,325 $ 260,325 $200,000 Series 2016 - 1, Class A - 1 (2016) Oct. 2026 Oct. 2024 3.96% 178,047 $ 178,047 $82,000 Series 2019 - 1, Class A - 1 Nov. 2026 Nov. 2024 2.82% 78,385 78,385 $46,000 Series 2019 - 1, Class A - 3 Nov. 2026 Nov. 2024 3.32% 45,406 45,406 $135,000 Series 2016 - 1, Class A - 2 (2017) Apr. 2027 Apr. 2025 4.32% 121,628 $ 121,628 $228,000 Series 2018 - 1, Class A - 2 Oct. 2027 Oct. 2024 4.29% 214,778 214,778 $164,000 Series 2018 - 1, Class A - 4 Oct. 2027 Oct. 2024 4.74% 159,627 159,627 $168,500 Series 2021 - 1, Class A - 1 Jun. 2028 Jun. 2026 2.12% 167,658 $ 167,658 $89,000 Series 2021 - 1, Class A - 3 Jun. 2028 Jun. 2026 2.86% 88,555 88,555 $168,500 Series 2021 - 1, Class A - 2 Jun. 2033 Jun. 2030 2.96% 167,658 $ 167,658 $89,000 Series 2021 - 1, Class A - 4 Jun. 2033 Jun. 2030 3.70% 88,555 88,555 $244,000 Series 2019 - 1, Class A - 2 Nov. 2034 Nov. 2031 3.65% 233,244 $ 233,244 $136,000 Series 2019 - 1, Class A - 4 Nov. 2034 Nov. 2031 4.49% 134,243 134,243 $ 2,128,078 $ 189,969 $ 260,325 $ 676,243 $ 121,628 $ 256,213 $ 256,213 $ 367,487 L ONG - TERM DEBT MATURITIES AND PREPAYMENT TERMS STORE MASTER FUNDING – DEBT PREPAYMENT WINDOWS LONG - TERM DEBT MATURITIES 1 Bank term loans ($400 million due in 2027 and $200 million due in 2029) are prepayable at any time subject to the termination of related interest rate swaps; the $200 million loan due in 2029 requires a 2% prepayment premium if repaid in year one and 1% prepayment premium if repaid in year two. 2 Prepayable, without penalty, 24 or 36 months prior to maturity as summarized below . . 8 |
| Presented below is a summary of the key financial covenants as they relate to STORE’s unsecured debt, which consists of: • Unsecured Revolving Credit Facility (Credit Facility) • Bank Term Loans • Note Purchase Agreements (NPAs) • Senior Unsecured Notes (Public Notes) Such covenants are defined and calculated in accordance with the terms of the Credit Facility, the Bank Term Loans, the NPAs and the governing documents of the Public Notes. The Bank Term Loans and NPAs contain financial covenants that are similar to those of the Credit Facility; therefore, the summary of key financial covenants is combined below, presenting the most restrictive covenant, if different. Credit Facility/Bank Term Loans/NPAs – Key Covenants Required June 30, 2022 Maximum leverage ratio < 60% 41% Maximum unsecured leverage ratio < 60% 33% Maximum secured indebtedness ratio < 45% 20% Minimum fixed charge coverage ratio > 1.5x 4.0x Minimum unencumbered interest ratio > 2.0x 5.7x Public Notes – Key Covenants Required June 30, 2022 Limitation on incurrence of total debt < 60% 42% Limitation on incurrence of secured debt < 40% 19% Debt service coverage ratio > 1.5x 4.7x Maintenance of total unencumbered assets > 150% 311% 9 C OVENANTS – C REDIT F ACILITY AND U NSECURED N OTES P AYABLE |
| P ORTFOLIO AT A G LANCE JUNE 30, 2022 2021 PORTFOLIO DIVERSITY Customers 579 529 Investment property locations 3,012 2,738 Top customer 1 2.9% 3.0% Top ten customers 1 17.7% 18.4% States 49 49 Industries in which our customers operate 124 118 ORIGINATION Investment portfolio subject to Master Leases 2 94% 94% Average investment amount / replacement cost (new) 3 80% 80% Weighted average annual lease escalation 4 1.8% 1.9% Weighted average remaining lease contract term ~13.2 years ~14 years PORTFOLIO MANAGEMENT Occupancy 5 99.5% 99.6% Locations subject to unit - level financial reporting 6 99% 99% Weighted average 4 - wall FCCR 7 4.7x 4.1x Weighted average unit FCCR 7 3.6x 3.1x $ 11.4 Billion Assets Under Management ~$908 Million Annualized base rent and interest 8 10 See footnotes on Page 18. . ~80% Percentage of portfolio from direct origination |
| Q3 2019 Q4 2019 Q1 2020 Q2 2020 Q3 2020 Q4 2020 Q1 2021 Q2 2021 Q3 2021 Q4 2021 Q1 2022 Q2 2022 Acquisitions 1 : Gross acquisitions ($MM) $395 $537 $264 $135 $251 $436 $271 $341 $412 $486 $513 $392 No. of properties 85 103 57 21 52 84 66 95 75 100 111 62 No. of new customers 15 19 9 9 10 13 10 9 9 18 19 11 No. of transactions 29 43 21 18 23 40 24 37 24 51 39 32 Average transaction size ($MM) $13.6 $12.5 $12.6 $7.5 $10.9 $10.9 $11.3 $9.2 $17.2 $9.5 $13.1 $12.2 Initial cap rate 7.7% 7.7% 7.5% 8.7% 8.3% 8.1% 7.8% 7.8% 7.4% 7.2% 7.1% 7.2% Annual lease escalation 1.9% 1.8% 2.5% 1.8% 1.9% 1.7% 1.9% 1.9% 1.8% 1.9% 1.8% 2.0% Weighted avg. lease term (years) 17 17 16 17 18 18 18 17 16 17 17 18 Dispositions 1 : # nonperforming properties 2 8 5 6 10 7 12 19 6 9 9 3 4 Proceeds - nonperforming ($MM) $30.7 $5.6 $7.8 $25.4 $21.0 $11.7 $12.7 $19.6 $27.1 $26.7 $9.0 $21.1 # performing properties 46 10 3 6 11 22 25 7 16 12 8 9 Proceeds - performing ($MM) $284.1 $32.0 $11.1 $19.5 $19.3 $99.4 $124.8 $15.4 $73.1 $58.4 $47.3 $44.0 Cap rate – performing 7.4% 7.5% 7.0% 7.8% 7.0% 7.0% 7.8% 6.1% 6.7% 6.6% 7.0% 6.4% A CQUISITIONS AND D ISPOSITIONS 11 See footnotes on Page 18. . |
| D IVERSIFICATION A CROSS C USTOMERS AND G EOGRAPHIES T OP T EN S TATES State % Base Rent and Interest 1 # of Properties Texas 11.1% 353 Illinois 6.1 185 Georgia 5.5 170 California 5.5 84 Florida 5.0 161 Wisconsin 5.0 89 Ohio 4.7 148 Arizona 4.3 92 Tennessee 3.7 127 Michigan 3.6 116 Top Ten States 54.5 1,525 All other (39 states) 45.5 1,487 Total 100.0% 3,012 T OP T EN C USTOMERS Customer % Base Rent and Interest 1 # of Properties Spring Education Group Inc. 2.9% 28 LBM Acquisition, LLC 2.8 156 Fleet Farm Group LLC 2.1 9 Cadence Education, Inc. 2.0 76 Dufresne Spencer Group Holdings, LLC 1.6 30 CWGS Group, LLC 1.4 20 Zips Holdings, LLC 1.3 46 Great Outdoors Group, LLC 1.3 8 American Multi - Cinema, Inc. 1.2 14 At Home Stores LLC 1.1 11 Top Ten Customers 17.7 398 All other (569 customers) 82.3 2,614 Total 100.0% 3,012 ❖ STORE Capital has a diverse customer base. At June 30, 2022, the Company’s property locations were operated by 579 customers ; these customers operate their businesses across approximately 910 business concepts and the largest single concept represents 2.1% of base rent and interest. 12 See footnotes on Page 18. . ❖ STORE Capital’s portfolio is also highly diversified by geography, as the Company’s property locations can be found in every state except Hawaii. |
| D IVERSIFICATION A CROSS I NDUSTRY G ROUPS ~80% OF P ORTFOLIO IS IN C USTOMER - F ACING I NDUSTRIES Located near target customers Not readily available online Broad array of everyday services SERVICE Service 64% Manufacturing 21% Service - oriented retail 15% Customer Industry Group % Base Rent and Interest 1 # of Properties Building Sq. Ft. (thousands) Restaurants – full service 6.9% 356 2,520 Restaurants – limited service 4.8 403 1,278 Early childhood education 6.0 279 2,927 Automotive repair and maintenance 5.8 253 1,461 Health clubs 5.1 94 3,286 Pet care 3.3 185 1,758 Medical and dental 3.3 168 1,533 Lumber and construction materials wholesalers 3.2 167 6,877 Behavioral health 3.2 89 1,713 Movie theaters 3.1 35 1,807 Family entertainment 3.1 40 1,575 Elementary and secondary schools 2.8 15 816 Equipment sales and leasing 1.9 61 1,473 Logistics 1.7 34 4,227 Wholesale automobile auction 1.0 8 428 All other service (26 industry groups) 8.6 236 14,446 Total service 63.8% 2,423 48,125 The business concepts of our customers are diversified across 124 different industries in the service, retail and manufacturing sectors of the U.S. economy. We group these industries into 80 different industry groups as shown in the following tables. 13 See footnotes on Page 18. . |
| D IVERSIFICATION A CROSS I NDUSTRY G ROUPS ( CONTINUED ) Customer Industry Group % Base Rent and Interest 1 # of Properties Building Sq. Ft. (thousands) Farm and ranch supply 3.2% 41 4,137 Furniture 3.2 65 3,650 Recreational vehicle dealers 2.0 31 1,247 Home furnishings 1.9 28 2,475 Used car dealers 1.5 28 274 Hunting and fishing 1.2 8 631 New car dealers 1.0 14 505 All other retail (11 industry groups) 1.4 45 1,905 Total service - oriented retail 15.4% 260 14,824 Customer Industry Group % Base Rent and Interest 1 # of Properties Building Sq. Ft. (thousands) Metal fabrication 5.8% 114 14,720 Food processing 3.4 33 4,532 Automotive parts and accessories 1.9 27 4,901 Plastic and rubber products 1.6 18 3,260 Furniture manufacturing 1.2 12 2,980 Aerospace product and parts 1.0 25 1,806 All other manufacturing (15 industry groups) 5.9 100 10,682 Total manufacturing 20.8% 329 42,881 Total Portfolio 100.0% 3,012 105,830 S ERVICE - ORIENTED RETAIL Located in retail corridors Internet resistant High experiential and service component MANUFACTURING Primarily located in industrial parks Strategically near customers/suppliers Broad array of industries Making everyday necessities 14 See footnotes on Page 18. . |
| 99.5% 99.6% 99.7% 99.6% 99.5% 99.4% 99.5% 99.5% 99.5% 80% 84% 88% 92% 96% 100% Q2 2020 Q3 2020 Q4 2020 Q1 2021 Q2 2021 Q3 2021 Q4 2021 Q1 2022 Q2 2022 Percentage of Properties Occupied O CCUPANCY 1 15 See footnotes on Page 18. . |
| R ENT E SCALATIONS AND C ONTRACT E XPIRATIONS FREQUENT RENT ESCALATIONS PROVIDE A MEASURE OF INFLATION PROTECT ION AND A STRONG POTENTIAL SOURCE OF INTERNAL GROWTH Lease Escalation Frequency % Base Rent and Interest 1 Weighted Average Annual Escalation Rate 2 Annually 77% 1.9% Every 5 years 17 1.8% Other escalation frequencies 5 1.4% Flat 1 NA Total / Weighted Average 100% 1.8% Contractual Fixed Increases 13% Flat 1% Contractual CPI - Based Increases 86% 78.4% 17.2% 4.4% Thereafter 2027 - 2031 2022 - 2026 Year of Lease or Loan Maturity % Base Rent and Interest 1 # of Properties 3 Remainder of 2022 0.3% 18 2023 1.1 21 2024 0.6 22 2025 0.9 23 2026 1.5 55 2027 1.6 55 2028 2.8 67 2029 4.6 153 2030 3.3 139 2031 4.9 209 Thereafter 78.4 2,234 Total 100.0% 2,996 CONTRACT EXPIRATIONS 1 - BY YEAR OF LEASE EXPIRATION OR LOAN MATURITY 16 See footnotes on Page 18. . |
| 2022 G UIDANCE 2022 Guidance Net income per share (excluding gains or losses on sales of property) $1.11 - $1.12 Depreciation and amortization of real estate assets per share $1.07 - $1.08 FFO per share $2.18 - $2.20 Straight - line rent and other amortization adjustments per share $0.07 AFFO per share 1 $2.25 - $2.27 Estimated run - rate funded debt / adjusted EBITDA 2 5.5x – 6.0x Real estate acquisition volume, net of projected property sales ~$1.3 billion - $1.5 billion Weighted average cap rate on new acquisitions 7.0% - 7.2% 1 AFFO per share is sensitive to the timing and amount of real estate acquisitions and capital markets activities during the year, as well as to the spread achieved between the lease rates on new acquisitions and the interest rates on borrowings used to finance those acquisitions. See page 19 for further discussion regarding use of FFO and AFFO. 2 See page 20 for the definition of Adjusted EBITDA. 17 |
| F OOTNOTES Page 4 1 See page 19 for discussion regarding use of Funds From Operations and Adjusted Funds from Operations. 2 FFO and AFFO for the three months ended June 30, 2022 and 2021, include approximately $0.3 million and $2.9 million, respectively, and, for the six months ended June 30, 2022 and 2021, include approximately $1.0 million and $ 4.9 million, respectively, of net revenue that is subject to the short - term deferral arrangements entered into in response to the COVID - 19 pandemic; the Company accounts for these deferral arrangements as rental revenue and a corresponding increase in receivables. FFO and AFFO for the three months ended June 30, 2022 and 2021, exclude approximately $3.8 million and $5.4 million, respectively, and, for the six months ended June 30, 2022 and 2021, exclude approximately $7.2 million and $11.3 million, respectively, collected under these short - term deferral arrangements. 3 For the six months ended June 30, 2021, stock - based compensation expense included $10.1 million related to the modification of certain performance - based awards granted in 2018 and 2019. 4 For the three and six months ended June 30, 2022 and 2021, includes $0.8 million and $0.5 million, respectively, of accelerated amortization of deferred financing costs related to the prepayment of debt. 5 Under the two - class method, earnings attributable to unvested restricted stock are deducted from earnings in the computation of per share amounts applicable. Page 7 1 See page 20 for discussion regarding use of EBITDA, EBITDAre , Adjusted EBITDAre and Adjusted Debt. Page 10 1 Denotes the percentage the Company’s largest customer or its top ten largest customers represent of the Company’s total base rent and interest as of June 30, 2022. See Page 12 for listing of top ten customers. 2 The percentage of investment portfolio subject to master leases represents the percentage (based on base rent and interest) of the investment portfolio in multiple properties with a single customer subject to master leases. Approximately 87% of the investment portfolio involves multiple properties with a single customer, whether or not subject to a master lease. 3 The average investment amount/replacement cost (new) represents the ratio of purchase price to replacement cost (new) at acquisition. 4 Weighted average annual lease escalation represents the weighted average annual escalation rate of the entire portfolio as if all escalations occurred annually. For escalations based on a formula including CPI, assumes the stated fixed percentage in the contract or assumes 1.5% if no fixed percentage is in the contract. For contracts with no escalations remaining in the current lease term, assumes the escalation in the extension term. Calculation excludes contracts representing less than 0.1% of base rent and interest where there are no further escalations remaining in the current lease term and there are no extension options. 5 STORE defines occupancy as a property being subject to a lease or loan contract. As of June 30, 2022, 16 of the Company’s properties were vacant and not subject to a contract. 6 Of the 99% of properties that are required to provide unit - level reporting, 93% have provided current obligated statements as of July 25, 2022. 7 Represents the weighted - average 4 - Wall and unit fixed charge coverage ratio of the portfolio as of June 30, 2022. The 4 - Wall coverage ratio refers to a unit’s FCCR before taking into account standardized corporate overhead expense. STORE also calculates a unit fixed charge coverage ratio generally as the ratio of (i) the unit’s EBITDAR, less a standardized corporate overhead expense based on estimated industry standards, to (ii) the unit’s total fixed charges, which are its lease expense, interest expense and scheduled principal payments on indebtedness (if applicable). The median 4 - Wall coverage ratio and unit FCCR were 3.1x and 2.5x, respectively, as of June 30, 2022 and 3.0x and 2.4x, respectively, as of June 30, 2021. 8 Represents the annualized base rent and interest (based on rates in effect as of June 30, 2022 for all lease and loan contracts) on the investment portfolio as of June 30, 2022. Page 11 1 Acquisitions represent both acquisitions of real estate and investment in loans and financing receivables. Dispositions represent the net proceeds received from the sale of real estate and lease termination fees received in conjunction with those sales. 2 Includes the number of properties sold that were vacant or not performing at the time of sale. Pages 12, 13 and 14 1 Data as of June 30, 2022, by percentage of base rent and interest (based on rates in effect on June 30, 2022, for all leases, loans and financing receivables in place as of that date). Page 15 1 STORE defines occupancy as a property being subject to a lease or loan contract. As of June 30, 2022, 16 of the Company’s properties were vacant and not subject to a contract. Page 16 1 Data as of June 30, 2022, by percentage of base rent and interest (based on rates in effect on June 30, 2022, for all leases, loans and financing receivables in place as of that date). 2 Represents the weighted average annual escalation rate of the entire portfolio as if all escalations occurred annually. For escalations based on a formula including CPI, assumes the stated fixed percentage in the contract or assumes 1.5% if no fixed percentage is in the contract. For contracts with no escalations remaining in the current lease term, assumes the escalation in the extension term. 3 Excludes 16 properties that were vacant and not subject to a lease as of June 30, 2022. 18 |
| S UPPLEMENTAL R EPORTING M EASURES Funds from Operations, or FFO, and Adjusted Funds from Operations, or AFFO Our reported results are presented in accordance with U.S. generally accepted accounting principles, or GAAP. We also disclose Funds from Operations, or FFO, and Adjusted Funds from Operations, or AFFO, both of which are non - GAAP measures. We believe these two non - GAAP financial measures are useful to investors because they are widely accepted industry measures used by analysts and investors to compare the operating performance of REITs. FFO and AFFO do not represent cash generated from operating activities and are not necessarily indicative of cash available to fund cash requirements; accordingly, they should not be considered alternatives to net income as a performance measure or to cash flows from operations as reported on a statement of cash flows as a liquidity measure and should be considered in addition to, and not in lieu of, GAAP financial measures. We compute FFO in accordance with the definition adopted by the Board of Governors of the National Association of Real Estate Investment Trusts, or NAREIT. NAREIT defines FFO as GAAP net income, excluding gains (or losses) from extraordinary items and sales of depreciable property, real estate impairment losses, and depreciation and amortization expense from real estate assets, including the pro rata share of such adjustments of unconsolidated subsidiaries. To derive AFFO, we modify the NAREIT computation of FFO to include other adjustments to GAAP net income related to certain revenues and expenses that have no impact on our long - term operating performance, such as straight - line rents, amortization of deferred financing costs and stock - based compensation. In addition, in deriving AFFO, we exclude certain other costs not related to our ongoing operations, such as the amortization of lease - related intangibles and executive severance and transition costs. FFO is used by management, investors and analysts to facilitate meaningful comparisons of operating performance between periods and among our peers primarily because it excludes the effect of real estate depreciation and amortization and net gains (or losses) on sales, which are based on historical costs and implicitly assume that the value of real estate diminishes predictably over time, rather than fluctuating based on existing market conditions. Management believes that AFFO provides more useful information to investors and analysts because it modifies FFO to exclude certain additional revenues and expenses such as, as applicable, straight - line rents, including construction period rent deferrals, and the amortization of deferred financing costs, stock - based compensation, lease - related intangibles, and executive severance and transition costs as such items have no impact on long - term operating performance. As a result, we believe AFFO to be a more meaningful measurement of ongoing performance that allows for greater performance comparability. Therefore, we disclose both FFO and AFFO and reconcile them to the most appropriate GAAP performance metric, which is net income. STORE Capital’s FFO and AFFO may not be comparable to similarly titled measures employed by other companies. 19 |
| S UPPLEMENTAL R EPORTING M EASURES We believe that presenting supplemental reporting measures, or non - GAAP measures, such as EBITDA, EBITDA re and Adjusted EBITDA re , is useful to investors and analysts because it provides important supplemental information concerning our operating performance exclusive of certain non - cash and other costs. These non - GAAP measures have limitations as they do not include all items of income and expense that affect operations. Accordingly, they should not be considered alternatives to net income as a performance measure and should be considered in addition to, and not in lieu of, GAAP financial measures. Our presentation of such non - GAAP measures may not be comparable to similarly titled measures employed by other companies. EBITDA, EBITDA re and Adjusted EBITDA re EBITDA represents earnings (GAAP net income) plus interest expense, income tax expense, depreciation and amortization. We compute EBITDAre in accordance with the definition adopted by NAREIT. NAREIT defines EBITDA re as EBITDA (as defined above) excluding gains (or losses) from the sales of depreciable property and real estate impairment losses. To derive Adjusted EBITDAre we modify the NAREIT definition of EBITDA re to exclude other items included in GAAP net income, such as provisions for loan losses and executive severance, as such items are not related to our ongoing performance. Note: The adjustments to derive Adjusted EBITDAre may not exist in every quarter, therefore EBITDAre and Adjusted EBITDAre may be equal. Annualized Adjusted EBITDA re and Adjusted Debt Annualized Adjusted EBITDAre is calculated by multiplying Adjusted EBITDA re for the most recently completed fiscal quarter by four. Annualized Adjusted EBITDAre – Current Estimated Run Rate is based on an estimated Adjusted EBITDA re calculated as if all leases and loans in place as of the last date of the most recently completed fiscal quarter had been in place as of the beginning of such quarter; then annualizing that estimated Adjusted EBITDA re for the quarter by multiplying it by four. You should not unduly rely on this metric as it is based on several assumptions and estimates that may prove to be inaccurate. Our actual reported Adjusted EBITDA re for future periods may be significantly less than that implied by our reported Annualized Adjusted EBITDA re – Current Estimated Run Rate for a variety of reasons. Adjusted Debt represents our outstanding debt obligations excluding unamortized deferred financing costs and net debt premium, further reduced for cash and cash equivalents and restricted cash deposits held for the benefit of lenders. We believe excluding unamortized deferred financing costs and net debt premium, cash and cash equivalents and restricted cash deposits held for the benefit of lenders provides an estimate of the net contractual amount of borrowed capital to be repaid, which we believe is a beneficial disclosure to investors and analysts. Adjusted Debt to Annualized Adjusted EBITDA re Adjusted Debt to Annualized Adjusted EBITDAre , or leverage, is a supplemental non - GAAP financial measure we use to evaluate the level of borrowed capital being used to increase the potential return of our real estate investments. We calculate leverage by dividing Adjusted Debt by Annualized Adjusted EBITDA re . Because our portfolio growth level is significant to the overall size of the Company, we believe that presenting this leverage metric on a run rate basis is more meaningful than presenting the metric for the historical quarterly period, and we refer to this metric as Adjusted Debt to Annualized Adjusted EBITDA re — Current Estimated Run Rate. Leverage should be considered as a supplemental measure of the level of risk to which stockholder value may be exposed. Our computation of leverage may differ from the methodology employed by other companies and, therefore, may not be comparable to other measures. Note: NAREIT issued a white paper in 2017 recommending that companies that report EBITDA also report EBITDA re . 20 |
| Forward - Looking Statements Certain statements contained in this document that are not historical facts contain forward - looking statements within the meaning of Section 27A of the Securities Act of 1933, as amended, and within the meaning of Section 21E of the Securities Exchange Act of 1934, as amended, that are subject to the “safe harbor” created by those sections. Forward - looking statements can be identified by the use of words such as "estimate," "anticipate," "expect," "believe," "intend," "may," "will," "should," "seek," "approximate" or "plan," or the negative of these words and phrases or similar words or phrases. Forward - looking statements, by their nature, involve estimates, projections, goals, forecasts and assumptions and are subject to risks and uncertainties that could cause actual results or outcomes to differ materially from those expressed in the forward - looking statements. For more information on risk factors for our business, please refer to the periodic reports we file with the Securities and Exchange Commission from time to time. These forward - looking statements herein speak only as of the date of this document and should not be relied upon as predictions of future events. STORE Capital expressly disclaims any obligation or undertaking to update or revise any forward - looking statements contained herein, to reflect any change in STORE Capital’s expectations with regard thereto, or any other change in events, conditions or circumstances on which any such statement is based, except as required by law. F ORWARD - L OOKING S TATEMENTS Investor and Media Contacts: Financial Profiles, Inc. Moira Conlon, (310) 622 - 8220 Megan McGrath, (310) 622 - 8248 STORECapital@finprofiles.com 21 |
| 202 2 second quarter investor presentation a leader in real estate capital solutions |
| 2022 second quarter investor presentation 2 disclaimer This presentation contains forward - looking statements within the meaning of Section 27A of the Securities Act of 1933, as amended, or the Securities Act, and Section 21E of the Securities Exchange Act of 1934, as amended, or the Exchange Act. Such forward - looking statements include, without limitation, statements concerning our business and growth strategies, investment, financing and leasing activities and trends in our business, including trends in the market for long - term, triple - net leases of freestanding, single - tenant properties. Words such as “expects,” “anticipates,” “intends,” “plans,” “likely,” “will,” “believes,” “seeks,” “estimates,” and variations of such words and similar expressions are intended to identify such forward - looking statements. Such statements involve known and unknown risks, uncertainties and other factors which may cause our actual results, performance or achievements to be materially different from the results of operations or plans expressed or implied by such forward - looking statements. Although we believe that the assumptions underlying the forward - looking statements contained herein are reasonable, any of the assumptions could be inaccurate, and therefore such statements included in this presentation may not prove to be accurate. In light of the significant uncertainties inherent in the forward - looking statements included herein, the inclusion of such information should not be regarded as a representation by us or any other person that the results or conditions described in such statements or our objectives and plans will be achieved. Furthermore, actual results may differ materially from those described in the forward - looking statements and may be affected by a variety of risks and factors including, without limitation, the risks described in our Annual Reports on Form 10 - K, quarterly reports on form 10 - Q, and current reports on form 8 - K. Forward - looking statements set forth herein speak only as of the date hereof, and we expressly disclaim any obligation or undertaking to update or revise any forward - looking statement contained herein, to reflect any change in our expectations with regard thereto, or any other change in events, conditions or circumstances on which any such statement is based, except to the extent otherwise required by law. THIS PRESENTATION CONTAINS HISTORICAL PERFORMANCE INFORMATION REGARDING STORE CAPITAL AS WELL AS OTHER COMPANIES PREVIOUSLY MANAGED BY MEMBERS OF OUR SENIOR MANAGEMENT TEAM. SUCH PAST PERFORMANCE IS NOT A GUARANTEE OF FUTURE RESULTS. This presentation contains references to our copyrights, trademarks and service marks and to those belonging to other entities. Solely for convenience, copyrights, trademarks, trade names and service marks referred to in this presentation may appear without the “© “ or “ TM” OR “sm” Symbols, but such references are not intended to indicate, in any way, that we will not assert, to the fullest extent under applicable law, our rights or the rights of the applicable licensor to these copyrights, trademarks, trade names and service marks. We do not intend our use or display of other companies’ trade names, copyrights, trademarks or service marks to imply a relationship with, or endorsement or sponsorship of us by, any other companies. Definitions and footnotes for data provided herein are provided in the appendix section of this presentation. Unless otherwise indicated, data provided herein is as of June 30, 2022. |
| 2022 second quarter investor presentation 3 overview STORE has the platform, the data and the analytics to drive superior risk - adjusted returns profit center real estate direct origination diversified portfolio scalable platform distinctive balance sheet corporate responsibility focus on unit - level profitability 4.7x rent c overage 1 5.9% AFFO/share CAGR (since IPO) expansive addressable market $3.9 trillion ~ 2 million locations 9.8% - 10.7% AFFO/share growth guidance 5 2021 – 2022 $13.2 billion acquisition pipeline customer - centric approach ~1/3 new business from existing customers 124 industries multiple borrowing sources secured/ unsecured flexible structure favorable prepayment options/well - laddered ability to leverage talent, systems, etc. access to capital NYSE: STOR BBB (+) $11.4 billion AUM 3 … and growing 6.1% dividend/share CAGR (since IPO) 2.9% largest customer 2 579 # of customers 5.7x adj. debt/adj. run rate EBITDA 4 17.7% top ten customers 2 value creation 92% of tenant respondents to survey implemented energy efficiency measures 2 years named to Bloomberg’s Gender - Equality Index 55% of board is diverse in terms of gender or ethnicity |
| 2022 second quarter investor presentation owning profit center real estate is the core to STORE’s investment approach and creates a level of “certainty” for STORE across all economic environments Single Tenant Operational Real Estate (STORE) is a real estate investment asset class of its own with three payment sources all real estate investors have the first two….. 1 corporate credit quality 2 real estate value …but the third is unique to STORE 3 unit - level profitability a focused approach on acquiring profitable locations, resulting in superior portfolio performance profit center real estate 4 unit - level profitability real estate value corporate credit quality |
| 2022 second quarter investor presentation 5 broad - based market need total addressable market $3.9 trillion of single tenant properties providing tailored financial solutions for our customers the depth of the market allows STORE to be selective in its investment decisions selective investing target market * STORE’s targeted market is large, consisting of nearly 215,000 companies direct relationships direct customer relationships account for ~80% of STORE’s acquisitions * companies with over $10MM in annual revenue |
| 2022 second quarter investor presentation STORE customer profile 43,000 locations STORE’s customers consist of regional and national companies with a strong track record of growth 1.8MM ~40% ~$1.2B ~1/3 ~50% new business from existing customers number of locations operated by customers 3 number of workers employed by customers 2 2021 customer revenue growth 1 weighted average customer revenues customers with revenues over $200 million customer profile 6 |
| 2022 second quarter investor presentation direct origination model STORE’s pipeline is robust and diverse storage , 4% auto maintenance , 5% entertainment , 5% specialty med , 11% restaurants , 7% education , 5% health clubs , 2% all other service , 19% manufacturing , 22% RV/auto dealers , 6% all other service - oriented retail , 14% service - oriented retail service manufacturing $13.2 billion STORE’s direct origination model creates a strong and active investment pipeline STORE’s emphasis is on service, manufacturing and service - oriented retail industries which are essential and vital 7 |
| 2022 second quarter investor presentation investment activity & portfolio management REAL ESTATE VALUE acquisitions 1 : # of properties 85 103 57 21 52 84 66 95 75 100 111 62 # of new customers 15 19 9 9 10 13 10 9 9 18 19 11 number of transactions 29 43 21 18 23 40 24 37 24 51 39 32 average transaction size ($MM) $13.6 $12.5 $12.6 $7.5 $10.9 $10.9 $11.3 $9.2 $17.2 $9.5 $13.1 $12.2 initial cap rate 7.7% 7.7% 7.5% 8.7% 8.3% 8.1% 7.8% 7.8% 7.4% 7.2% 7.1% 7.2% lease escalation 1.9% 1.8% 2.5% 1.8% 1.9% 1.7% 1.9% 1.9% 1.8% 1.9% 1.8% 2.0% weighted avg. lease term (years) 17 17 16 17 18 18 18 17 16 17 17 18 dispositions 1 : # nonperforming properties 2 8 5 6 10 7 12 19 6 9 9 3 4 proceeds - nonperforming ($MM) $30.7 $5.6 $7.8 $25.4 $21.0 $11.7 $12.7 $19.6 $27.1 $26.7 $9.0 $21.1 # performing properties 46 10 3 6 11 22 25 7 16 12 8 9 proceeds - performing ($MM) $284.1 $32.0 $11.1 $19.5 $19.3 $99.4 $124.8 $15.4 $73.1 $58.4 $47.3 $44.0 cap rate – performing 7.4% 7.5% 7.0% 7.8% 7.0% 7.0% 7.8% 6.1% 6.7% 6.6% 7.0% 6.4% 395 537 264 135 251 436 271 341 412 486 513 392 315 38 19 45 40 111 137 35 100 85 56 65 $0 $100 $200 $300 $400 $500 $600 Q3 2019 Q4 2019 Q1 2020 Q2 2020 Q3 2020 Q4 2020 Q1 2021 Q2 2021 Q3 2021 Q4 2021 Q1 2022 Q2 2022 volume ($MM) 8 gross acquisitions proceeds from dispositions |
| 2022 second quarter investor presentation stable and attractive spreads we continue to operate with a wide spread between our acquisition cap rates and our cost of debt -1.0% 1.0% 3.0% 5.0% 7.0% 9.0% 11.0% 13.0% 15.0% WA annual lease rate (acquisitions) cost of new debt ten year treasury 2011 2022 1994 2007 1 1 9 STORE predecessor companies STORE capital ~350 bps |
| 2022 second quarter investor presentation 10 As of June 30, 2022 2021 2020 customers 579 529 503 investment property locations 3,012 2,738 2,554 investment portfolio subject to master leases 2 94% 94% 93% average investment amount / replacement cost (new) 3 80% 80% 81% weighted average annual lease escalation 4 1.8% 1.9% 1.9% occupancy 5 99.5% 99.6% 99.5% locations subject to unit - level financial reporting 6 99% 99% 98% weighted average 4 - wall FCCR 7 4.7x 4.1x 3.9x weighted average unit FCCR 7 3.6x 3.1x 3.0x diversification AUM 1 $11.4 billion WA lease term 13.2 years # of states 49 direct origination ~80% portfolio management origination portfolio at a glance |
| 2022 second quarter investor presentation % base rent and interest 1 # of properties 1 2.9% 28 2 2.8% 156 3 2.1% 9 4 2.0% 76 5 1.6% 30 6 1.4% 20 7 1.3% 46 8 1.3% 8 9 1.2% 14 10 1.1% 11 total top 10 customers 17.7% 398 % base rent and interest 1 # of properties 1 restaurants – full service 6.9% 356 2 early childhood education 6.0% 279 3 metal fabrication 5.8% 114 4 automotive repair & maintenance 5.8% 253 5 health clubs 5.1% 94 6 restaurants – limited service 4.8% 403 7 food processing 3.4% 33 8 pet care 3.3% 185 9 medical and dental 3.3% 168 10 lumber and construction material wholesalers 3.2% 167 total top 10 industries 47.6% 2,052 diversified profile top customers 11 top industries |
| 2022 second quarter investor presentation diversification by industry service manufacturing 12 building % base rent and interest 1 # of sq. ft. as of June 30, customer industry groups properties (in thousands) 2022 2021 2020 restaurants - full service 356 2,520 6.9% 7.4% 8.5% restaurants - limited service 403 1,278 4.8% 4.6% 5.1% early childhood education 279 2,927 6.0% 6.0% 6.1% automotive repair and maintenance 253 1,461 5.8% 5.2% 4.8% health clubs 94 3,286 5.1% 5.1% 5.3% pet care 185 1,758 3.3% 3.6% 3.5% medical and dental 168 1,533 3.3% 2.9% 2.9% lumber & construction materials wholesalers 167 6,877 3.2% 3.4% 2.8% behavioral health 89 1,713 3.2% 3.2% 2.9% movie theaters 35 1,807 3.1% 3.6% 4.0% family entertainment 40 1,575 3.1% 3.1% 3.6% elementary and secondary schools 15 816 2.8% 2.8% 1.4% equipment sales and leasing 61 1,473 1.9% 1.9% 1.9% logistics 34 4,227 1.7% 1.2% 1.2% wholesale automobile auction 8 428 1.0% 1.2% 1.3% all other service (26 industry groups) 236 14,446 8.6% 9.2% 9.1% total service 2,423 48,125 63.8% 64.4% 64.4% building % base rent and interest 1 # of sq. ft. as of June 30, customer industry groups properties (in thousands) 2022 2021 2020 metal fabrication 114 14,720 5.8% 5.0% 4.6% food processing 33 4,532 3.4% 2.6% 2.1% automotive parts and accessories 27 4,901 1.9% 1.4% 1.0% plastic and rubber products 18 3,260 1.6% 1.8% 1.6% furniture manufacturing 12 2,980 1.2% 1.3% 1.3% aerospace product and parts 25 1,806 1.0% 1.1% 0.8% all other manufacturing (15 industry groups) 100 10,682 5.9% 5.6% 5.9% total manufacturing 329 42,881 20.8% 18.8% 17.3% total portfolio service - oriented retail building % base rent and interest 1 # of sq. ft. as of June 30, customer industry groups properties (in thousands) 2022 2021 2020 farm and ranch supply 41 4,137 3.2% 3.1% 4.5% furniture 65 3,650 3.2% 4.2% 4.7% recreational vehicle dealers 31 1,247 2.0% 2.1% 1.9% home furnishings 28 2,475 1.9% 1.2% 1.1% used car dealers 28 274 1.5% 1.7% 1.7% hunting and fishing 8 631 1.2% 1.7% 1.8% new car dealers 14 505 1.0% 1.1% 0.7% all other retail (11 industry groups) 45 1,905 1.4% 1.7% 1.9% total service - oriented retail 260 14,824 15.4% 16.8% 18.3% 21% 15% 64% 3,012 properties > 100 MM square feet |
| 2022 second quarter investor presentation diversification by geography STORE’s portfolio is geographically diverse across the United States 13 0.0% - 2.5% 2.5% - 5.0% 5.0% - 7.5% 7.5% - 13.0% % of base rent and interest |
| 2022 second quarter investor presentation 75% 9% 8% 8% REAL ESTATE VALUE CORPORATE CREDIT QUALITY 0% 5% 10% 15% 20% NR C/D B3 B2 B1 Ba3 Ba2 Ba1 Baa3 Baa2 Baa1 A3 A2 A1 Aa3 Aa2 Aa1 Aaa % of rent & interest Moody’s RiskCalc (EDF) STORE score 3 99% locations subject to unit - level financial reporting 2 median STORE score median EDF strong unit - level FCCRs creating a superior portfolio profitability at the property level improves the credit profile of our portfolio 14 4.7x weighted average 4 - wall FCCR 1 1.51x > 2.00x > 2.01x 1.01x > 1.50x < 1.00x |
| 2022 second quarter investor presentation 15 $0 $200 $400 $600 $800 $1,000 Thousands prepayable portion - able to maintain constant leverage at 70% - complete portfolio management flexibility - non - recourse with minimal covenants - provides borrowing diversity & prepayment flexibility multiple debt sources that are well - laddered with prepayment flexibility distinctive balance sheet master funding debt STORE’s unencumbered assets 2 A - /BBB+ peer net lease avg. 3 debt/EBITDA 4.6x ~5x u n e n c u m b ere d a ss e t s / un s ec u re d d e bt 3.1x ~3x debt service coverage 5.7x ~5x Baa2/BBB/BBB unsecured term borrowings rated by Moody’s, S&P and Fitch Ratings ~59% leverage (vs cost); ~31% of AUM 4 STORE ratios compare favorably to peers total long - term debt ~ 41% leverage unsecured IG notes and loans payable - unsecured long - term borrowings - BBB rating - S&P positive outlook - efficient execution and pricing 32% leverage (vs cost); ~66% of AUM 4 are unencumbered ($MM) 1 |
| 2022 second quarter investor presentation growth by design >2.5% lease escalations on a leveraged basis, our “built - in” contractual lease escalations lead to AFFO per share growth of over 2.5 % dividend protection reinvesting cash flows from operations through the management of our dividend payout ratio allows for growth of about 3% ~3% internal growth target our model was built to provide consistent and reliable internal growth of over 5% >5% consistent, dependable internal growth $0.00 $0.50 $1.00 $1.50 $2.00 $2.50 5.9% 8.1% per share growth compound annual growth rate 1 6.1% internal growth enables STORE to generate attractive and consistent shareholder returns 16 AFFO dividends net income |
| 2022 second quarter investor presentation PEER COMPARISON superior dividend growth our dividend growth is consistent and strong and our dividends are highly protected 81% 76% 73% 70% 68% 68% 67% FCPT O SRC ADC EPRT STOR NNN AFFO payout ratio 2 3.2% 3.6% 5.0% 5.9% 6.1% EPRT SRC NNN O FCPT STOR ADC compound quarterly dividend growth (2015 – present) 1 N/A N/A STORE’s Dividend Per Share Growth 1 0% 10% 20% 30% 40% 50% 60% 2015 2016 2017 2018 2019 2020 2021 STORE’s dividend per share growth 60% 65% 70% 75% 80% 85% Q3 '20 Q4 '20 Q1 '21 Q2 '21 Q3 '21 Q4 '21 Q1 '22 Q2 '22 STORE’s historical AFFO payout ratio 17 |
| 2022 second quarter investor presentation PEER COMPARISON STORE’s investment approach results in attractive cap rates, diversification & lease duration 5.6% 6.3% 6.4% 6.5% 6.8% 7.0% 7.7% O ADC NNN FCPT SRC EPRT STOR weighted average acquisition cap rate 1 24.1% 18.1% 18.0% 16.1% 8.7% 4.9% 4.4% O SRC NNN ADC FCPT EPRT STOR leases expiring in next 5 years 2 peer comparison diversified tenant base (% top 10 tenants, based on ABRI) 2 78.5% 36.0% 32.9% 28.2% 21.3% 19.2% 18.0% FCPT ADC NNN O SRC EPRT STORE 18 weighted average lease term (acquisitions) 1 N/R 8.9 11.1 13.1 15.1 15.8 17.2 NNN FCPT ADC O SRC EPRT STOR |
| 2022 second quarter investor presentation corporate responsibility our definition of success: making a positive difference for all our stakeholders STORE seeks to deliver stable, predictable, and investment - grade stockholder performance stockholders STORE real estate capital solutions enable improved customer wealth creation and increased workforce and leadership opportunities customers STORE promotes employee opportunity, education, engagement and diversity employees STORE provides opportunities to professional, supplier and service vendors to prosper through fair business practices and dependable engagements b usiness partners STORE contributes to communities across the country through our multiple investments and associated career opportunities communities STORE works to promote and improve environmental conscientiousness through our attention to and promotion of environmental stewardship environment Environmental, Social, Governance (ESG) ratings reported by Institutional Shareholder Services (ISS) provide insight for investors on how companies perform in key areas of sustainability Governance 3* Social 3* 5* Environmental *’1‘ represents the highest quality and lowest risk. 19 |
| 2022 second quarter investor presentation corporate responsibility STORE maintains its strong commitment to sustainability, community, social responsibility and governance Environmental Projects and Initiatives In order to help customers reduce their carbon footprint and operating expense, STORE has partnered with specialists in: Published third annual Corporate Responsibility Report in 2022 To view the report, visit: https://www.storecapital.com/wp - content/uploads/STORE_2022_CorporateResponsibilityReport.pdf Enhanced Corporate Governance Tawn Kelley, a seasoned executive in the real estate finance industry, is our first female Chairman of the Board. We are one of only three public companies with a female Chairman, CEO and CFO. Also, she and our other independent directors comprise 89% of the Board; 55% of our board is diverse in terms of gender or ethnicity. LPGA Sponsorship In May, we announced our sponsorship of a team of professional golfers on the LPGA Tour. The STORE team includes Stacy Lewis, Lauren Stephenson, Fatima Fernandez Cano, Brooke Matthews and Sarah Schmelzel . The LPGA Tour has a long history of successfully raising charitable dollars for initiatives that expand opportunities for women and girls and creating a positive impact on the communities hosting their tournaments. • energy management • energy optimization • renewable energy • energy audit and benchmarking • financing for sustainability projects Volta charging station at a STORE - owned property 2022 Bloomberg GEI Member For the second consecutive year STORE has been named to Bloomberg’s Gender - Equality Index (GEI) In 2021, STORE Capital received an ESG Risk Rating of 16.3 from Sustainalytics and was assessed to be at LOW risk of experiencing material financial impacts from ESG factors. 20 ESG RISK RATING 16.3 LOW RISK CERTIFIED 2022 - 2023 94% of employees at STORE say it is a great place to work compared to 59% of employees at a typical U.S. - based company STORE Capital is a proud sponsor of five LPGA Tour Professionals |
| supplemental information and footnotes |
| 2022 second quarter investor presentation supplemental reporting measures Funds from Operations, or FFO, and Adjusted Funds from Operations, or AFFO Our reported results are presented in accordance with U.S. generally accepted accounting principles, or GAAP. We also disclose Funds from Operations, or FFO, and Adjusted Funds from Operations, or AFFO, both of which are non - GAAP measures. We believe these two non - GAAP financial measures are useful to investors because they are widely accepted industry measures used by analysts and investors to compare the operating performance of REITs. FFO and AFFO do not represent cash generated from operating activities and are not necessarily indicative of cash available to fund cash requirements; accordingly, they should not be considered alternatives to net income as a performance measure or to cash flows from operations as reported on a statement of cash flows as a liquidity measure and should be considered in addition to, and not in lieu of, GAAP financial measures. We compute FFO in accordance with the definition adopted by the Board of Governors of the National Association of Real Estate Investment Trusts, or NAREIT. NAREIT defines FFO as GAAP net income, excluding gains (or losses) from extraordinary items and sales of depreciable property, real estate impairment losses, and depreciation and amortization expense from real estate assets, including the pro rata share of such adjustments of unconsolidated subsidiaries. To derive AFFO, we modify the NAREIT computation of FFO to include other adjustments to GAAP net income related to certain revenues and expenses that have no impact on our long - term operating performance, such as straight - line rents, amortization of deferred financing costs and stock - based compensation. In addition, in deriving AFFO, we exclude certain other costs not related to our ongoing operations, such as the amortization of lease - related intangibles and executive severance and transition costs. FFO is used by management, investors and analysts to facilitate meaningful comparisons of operating performance between periods and among our peers primarily because it excludes the effect of real estate depreciation and amortization and net gains (or losses) on sales, which are based on historical costs and implicitly assume that the value of real estate diminishes predictably over time, rather than fluctuating based on existing market conditions. Management believes that AFFO provides more useful information to investors and analysts because it modifies FFO to exclude certain additional revenues and expenses such as, as applicable, straight - line rents, including construction period rent deferrals, and the amortization of deferred financing costs, stock - based compensation, lease - related intangibles, and executive severance and transition costs as such items have no impact on long - term operating performance. As a result, we believe AFFO to be a more meaningful measurement of ongoing performance that allows for greater performance comparability. Therefore, we disclose both FFO and AFFO and reconcile them to the most appropriate GAAP performance metric, which is net income. STORE Capital’s FFO and AFFO may not be comparable to similarly titled measures employed by other companies. 22 |
| 2022 second quarter investor presentation supplemental reporting measures We believe that presenting supplemental reporting measures, or non - GAAP measures, such as EBITDA, EBITDA re and Adjusted EBITDA re , is useful to investors and analysts because it provides important supplemental information concerning our operating performance exclusive of certain non - cash and other costs. These non - GAAP measures have limitations as they do not include all items of income and expense that affect operations. Accordingly, they should not be considered alternatives to net income as a performance measure and should be considered in addition to, and not in lieu of, GAAP financial measures. Our presentation of such non - GAAP measures may not be comparable to similarly titled measures employed by other companies. EBITDA, EBITDA re and Adjusted EBITDA re EBITDA represents earnings (GAAP net income) plus interest expense, income tax expense, depreciation and amortization. We compute EBITDAre in accordance with the definition adopted by NAREIT. NAREIT defines EBITDA re as EBITDA (as defined above) excluding gains (or losses) from the sales of depreciable property and real estate impairment losses. To derive Adjusted EBITDAre we modify the NAREIT definition of EBITDA re to exclude other items included in GAAP net income, such as provisions for loan losses and executive severance, as such items are not related to our ongoing performance. Note: The adjustments to derive Adjusted EBITDAre may not exist in every quarter, therefore EBITDAre and Adjusted EBITDAre may be equal. Annualized Adjusted EBITDA re and Adjusted Debt Annualized Adjusted EBITDAre is calculated by multiplying Adjusted EBITDA re for the most recently completed fiscal quarter by four. Annualized Adjusted EBITDAre – Current Estimated Run Rate is based on an estimated Adjusted EBITDA re calculated as if all leases and loans in place as of the last date of the most recently completed fiscal quarter had been in place as of the beginning of such quarter; then annualizing that estimated Adjusted EBITDA re for the quarter by multiplying it by four. You should not unduly rely on this metric as it is based on several assumptions and estimates that may prove to be inaccurate. Our actual reported Adjusted EBITDA re for future periods may be significantly less than that implied by our reported Annualized Adjusted EBITDA re – Current Estimated Run Rate for a variety of reasons. Adjusted Debt represents our outstanding debt obligations excluding unamortized deferred financing costs and net debt premium, further reduced for cash and cash equivalents and restricted cash deposits held for the benefit of lenders. We believe excluding unamortized deferred financing costs and net debt premium, cash and cash equivalents and restricted cash deposits held for the benefit of lenders provides an estimate of the net contractual amount of borrowed capital to be repaid, which we believe is a beneficial disclosure to investors and analysts. Adjusted Debt to Annualized Adjusted EBITDA re Adjusted Debt to Annualized Adjusted EBITDAre , or leverage, is a supplemental non - GAAP financial measure we use to evaluate the level of borrowed capital being used to increase the potential return of our real estate investments. We calculate leverage by dividing Adjusted Debt by Annualized Adjusted EBITDA re . Because our portfolio growth level is significant to the overall size of the Company, we believe that presenting this leverage metric on a run rate basis is more meaningful than presenting the metric for the historical quarterly period, and we refer to this metric as Adjusted Debt to Annualized Adjusted EBITDA re — Current Estimated Run Rate. Leverage should be considered as a supplemental measure of the level of risk to which stockholder value may be exposed. Our computation of leverage may differ from the methodology employed by other companies and, therefore, may not be comparable to other measures. Note: NAREIT issued a white paper in 2017 recommending that companies that report EBITDA also report EBITDA re . 23 |
| 2022 second quarter investor presentation footnotes 24 Page 3: 1 Represents the weighted - average 4 - Wall coverage ratio of the portfolio as of June 30, 2022. The 4 - Wall coverage ratio refers to a unit’s FCCR before taking into account standardized corporate overhead expense. STORE also calculates a unit fixed charge coverage ratio generally as the ratio of (i) the unit’s EBITDAR, less a standardized corporate overhead expense based on estimated industry standards, to (ii) the unit’s total fixed charges, which are its lease expense, interest expense and scheduled principal payments on indebtedness (if applicable). The weighted average unit FCCR was 3.6x as of June 30, 2022. The median 4 - Wall coverage ratio and unit FCCR were 3.1x and 2.5x, respectively, as of June 30, 2022. 2 Denotes the percentage our largest customer or our top ten largest customers represent of our total base rent and interest as of June 30, 2022. See Page 11 for listing of top ten customers. 3 Assets Under Management (AUM) represents our total investment in real estate assets (gross of accumulated depreciation and amortization) as of June 30, 2022. 4 Refer to page 23 for definitions of non - GAAP financial measures and page 7 of the Company’s Earnings Supplement filed as Exhibit 99.2 to the Company’s Form 8 - K filed with the SEC on August 3, 2022 for a reconciliation to net income. 5 Represents the estimated growth rate in AFFO per diluted share based on the low - and high - points of our 2022 guidance as compared to AFFO per diluted share of $2.05 for the year ended December 31, 2021. See page 22 for discussion regarding use of Adjusted Funds from Operations. Page 6: 1 Represents the weighted average percentage change (by base rent and interest) in reported corporate revenues for the trailing 12 - month (or nine - month if 12 - month was not available) period as reported to STORE Capital for the fiscal periods ended at or near December 31, 2021 as compared to the same periods ended December 31, 2020. Excludes customers representing 5% of base rent and interest because applicable comparable data was not available. 2 Estimated based on total revenue per employee for all companies in the middle market (based on data reported by the National Center for the Middle Market for 2021) extrapolated to the aggregate total revenue of STORE’s customers. 3 Represents the number of locations operated by STORE’s customers as reported to STORE Capital as of December 31, 2021. Page 8: 1 Acquisitions represent both acquisitions of real estate and investment in loans and financing receivables. Dispositions represent the net proceeds received from the sale of real estate and lease termination fees received in conjunction with those sales. 2 Includes the number of properties sold that were vacant or not performing at the time of sale. Page 9: 1 Source: U.S. Treasury and Company Data. With respect to the STORE Predecessor Companies (FFCA and Spirit Finance) data, publicly available Company filings with the SEC. Page 10: 1 Assets Under Management (AUM) represents the Company’s total investment in real estate assets (gross of accumulated depreciation and amortization) as of June 30, 2022. 2 The percentage of investment portfolio subject to master leases represents the percentage (based on base rent and interest) of the investment portfolio in multiple properties with a single customer subject to master leases. Approximately 87% of the investment portfolio involves multiple properties with a single customer, whether or not subject to a master lease. 3 The average investment amount/replacement cost (new) represents the ratio of purchase price to replacement cost (new) at acquisition. 4 Weighted average annual lease escalation represents the weighted average annual escalation rate of the entire portfolio as if all escalations occurred annually. For escalations based on a formula including CPI, assumes the stated fixed percentage in the contract or assumes 1.5% if no fixed percentage is in the contract. For contracts with no escalations remaining in the current lease term, assumes the escalation in the extension term. Calculation excludes contracts representing less than 0.1% of base rent and interest where there are no further escalations remaining in the current lease term and there are no extension options. 5 STORE defines occupancy as a property being subject to a lease or loan contract. As of June 30, 2022, sixteen of our properties were vacant and not subject to a contract. 6 Of the 99% of our properties that are required to provide unit - level reporting, 93% have provided current obligated statements as of July 25, 2022. Page 10 – continued: 7 Represents the weighted - average 4 - Wall and unit fixed charge coverage ratio of the portfolio as of June 30, 2022, 2021 and 2020. The 4 - Wall coverage ratio refers to a unit’s FCCR before taking into account standardized corporate overhead expense. STORE also calculates a unit fixed charge coverage ratio generally as the ratio of (i) the unit’s EBITDAR, less a standardized corporate overhead expense based on estimated industry standards, to (ii) the unit’s total fixed charges, which are its lease expense, interest expense and scheduled principal payments on indebtedness (if applicable). The median 4 - Wall coverage ratio and unit FCCR were 3.1x and 2.5x, respectively, as of June 30, 2022, 3.0x and 2.4x, respectively, as of June 30, 2021 and 2.5x and 2.1x, respectively, as of June 30, 2020. Page 11: 1 Data as of June 30, 2022, by percentage of base rent and interest (based on rates in effect on June 30, 2022, for all leases, loans and financing receivables in place as of that date). Page 12: 1 Data as of June 30, 2022, 2021 and 2020, by percentage of base rent and interest (based on rates in effect on those dates, for all leases, loans and financing receivables in place as of those dates). Page 14: 1 Represents the weighted - average 4 - Wall coverage ratio of the portfolio as of June 30, 2022. The 4 - Wall coverage ratio refers to a unit’s FCCR before taking into account standardized corporate overhead expense. STORE also calculates a unit fixed charge coverage ratio generally as the ratio of (i) the unit’s EBITDAR, less a standardized corporate overhead expense based on estimated industry standards, to (ii) the unit’s total fixed charges, which are its lease expense, interest expense and scheduled principal payments on indebtedness (if applicable). The weighted average unit FCCR was 3.6x as of June 30, 2022. The median 4 - Wall coverage ratio and unit FCCR were 3.1x and 2.5x, respectively , as of June 30, 2022. 2 Of the 99% of our properties that are required to provide unit - level reporting, 93% have provided current obligated statements as of July 25, 2022. . |
| 2022 second quarter investor presentation footnotes 25 Page 14 - continued: 3 We measure the credit quality of our portfolio on a contract - by - contract basis using the STORE Score, which is a proprietary risk measure reflective of both the credit risk of our tenants and the profitability of the operations at our properties. The STORE Score is a quantitative measurement of contract risk computed by multiplying tenant default probabilities (using Moody’s RiskCalc ) and estimated store closure probabilities (using a simple algorithm we developed that has closure probabilities ranging from 100% to 10%, depending on unit - level profitability). Qualitative features can also impact investment risk, such as low property investment amounts, favorable tenant debt capital stacks, the presence of third - party guarantors, or other factors. Such qualitative factors are not included in the STORE Score and may serve to mitigate investment risk even further. Page 15: 1 Indicates the prepayable portion of STORE Master Funding net - lease mortgage note maturities, which are prepayable 24 or 36 months prior to maturity, and bank term loans of $400 million maturing in 2027 and $200 million maturing in 2029; the bank term loans are prepayable at any time subject to the termination of any related interest rate swap(s). 2 Ratios as of June 30, 2022; Unencumbered EBITDA based on NOI from Unencumbered Assets less an allocation of G&A expenses based on assets. 3 Based on average of ratios of Realty Income and National Retail Properties as of March 31, 2022. 4 Assets Under Management (AUM) represents our total investment in real estate assets (gross of accumulated depreciation and amortization) as of June 30, 2022. Page 16: 1 Represents rolling 12 - month values for AFFO, Dividends and Net Income per share beginning with the 12 - month period ended June 30, 2016. Refer to page 22 for definitions of non - GAAP financial measures and page 4 of the Company’s Earnings Supplement filed as Exhibit 99.2 to the Company’s Form 8 - K filed with the SEC on August 3, 2022 for a reconciliation to net income. Page 17: 1 Source: Historical dividend data from Nasdaq.com. Compound growth rates for the period beginning in Q1 2015 through Q1 2022. 2 Represents actual AFFO payout ratios obtained from publicly available financial information for the quarter ended March 31, 2022. . Page 18: 1 Source: Weighted average acquisition cap rates and lease durations for acquisitions from publicly available financial information for the eight quarters ended March 31, 2022. 2 Source: Tenant information and lease expiration data by annualized rent from publicly available financial information as of March 31, 2022. |
| Investor and Media Contacts Financial Profiles, Inc. Moira Conlon, 310.622.8220 Megan McGrath, 310.622.8248 STORECapital@finprofiles.com Corporate Headquarters 8377 East Hartford Drive, Suite 100 Scottsdale, Arizona 85255 480.256.1100 www.STOREcapital.com |