hig-202206300000874766--12-312022Q2false00008747662022-01-012022-06-300000874766us-gaap:CommonStockMember2022-01-012022-06-300000874766us-gaap:DeferrableNotesMember2022-01-012022-06-300000874766us-gaap:NoncumulativePreferredStockMember2022-01-012022-06-3000008747662022-07-27xbrli:shares00008747662022-04-012022-06-30iso4217:USD00008747662021-04-012021-06-3000008747662021-01-012021-06-30iso4217:USDxbrli:shares00008747662022-06-3000008747662021-12-310000874766us-gaap:CommercialLoanMember2022-06-300000874766us-gaap:CommercialLoanMember2021-12-310000874766us-gaap:PreferredStockMember2022-06-300000874766us-gaap:PreferredStockMember2021-06-300000874766us-gaap:CommonStockMember2022-06-300000874766us-gaap:CommonStockMember2021-06-300000874766us-gaap:AdditionalPaidInCapitalMember2022-03-310000874766us-gaap:AdditionalPaidInCapitalMember2021-03-310000874766us-gaap:AdditionalPaidInCapitalMember2021-12-310000874766us-gaap:AdditionalPaidInCapitalMember2020-12-310000874766us-gaap:AdditionalPaidInCapitalMember2022-04-012022-06-300000874766us-gaap:AdditionalPaidInCapitalMember2021-04-012021-06-300000874766us-gaap:AdditionalPaidInCapitalMember2022-01-012022-06-300000874766us-gaap:AdditionalPaidInCapitalMember2021-01-012021-06-300000874766us-gaap:AdditionalPaidInCapitalMember2022-06-300000874766us-gaap:AdditionalPaidInCapitalMember2021-06-300000874766us-gaap:RetainedEarningsMember2022-03-310000874766us-gaap:RetainedEarningsMember2021-03-310000874766us-gaap:RetainedEarningsMember2021-12-310000874766us-gaap:RetainedEarningsMember2020-12-310000874766us-gaap:RetainedEarningsMember2022-04-012022-06-300000874766us-gaap:RetainedEarningsMember2021-04-012021-06-300000874766us-gaap:RetainedEarningsMember2022-01-012022-06-300000874766us-gaap:RetainedEarningsMember2021-01-012021-06-300000874766us-gaap:RetainedEarningsMember2022-06-300000874766us-gaap:RetainedEarningsMember2021-06-300000874766us-gaap:TreasuryStockMember2022-03-310000874766us-gaap:TreasuryStockMember2021-03-310000874766us-gaap:TreasuryStockMember2021-12-310000874766us-gaap:TreasuryStockMember2020-12-310000874766us-gaap:TreasuryStockMember2022-04-012022-06-300000874766us-gaap:TreasuryStockMember2021-04-012021-06-300000874766us-gaap:TreasuryStockMember2022-01-012022-06-300000874766us-gaap:TreasuryStockMember2021-01-012021-06-300000874766us-gaap:TreasuryStockMemberus-gaap:StockCompensationPlanMember2022-04-012022-06-300000874766us-gaap:TreasuryStockMemberus-gaap:StockCompensationPlanMember2021-04-012021-06-300000874766us-gaap:TreasuryStockMemberus-gaap:StockCompensationPlanMember2022-01-012022-06-300000874766us-gaap:TreasuryStockMemberus-gaap:StockCompensationPlanMember2021-01-012021-06-300000874766us-gaap:TreasuryStockMember2022-06-300000874766us-gaap:TreasuryStockMember2021-06-300000874766us-gaap:AccumulatedOtherComprehensiveIncomeMember2022-03-310000874766us-gaap:AccumulatedOtherComprehensiveIncomeMember2021-03-310000874766us-gaap:AccumulatedOtherComprehensiveIncomeMember2021-12-310000874766us-gaap:AccumulatedOtherComprehensiveIncomeMember2020-12-310000874766us-gaap:AccumulatedOtherComprehensiveIncomeMember2022-04-012022-06-300000874766us-gaap:AccumulatedOtherComprehensiveIncomeMember2021-04-012021-06-300000874766us-gaap:AccumulatedOtherComprehensiveIncomeMember2022-01-012022-06-300000874766us-gaap:AccumulatedOtherComprehensiveIncomeMember2021-01-012021-06-300000874766us-gaap:AccumulatedOtherComprehensiveIncomeMember2022-06-300000874766us-gaap:AccumulatedOtherComprehensiveIncomeMember2021-06-3000008747662021-06-300000874766us-gaap:CommonStockMember2022-03-310000874766us-gaap:CommonStockMember2021-03-310000874766us-gaap:CommonStockMember2021-12-310000874766us-gaap:CommonStockMember2020-12-310000874766us-gaap:CommonStockMember2022-04-012022-06-300000874766us-gaap:CommonStockMember2021-04-012021-06-300000874766us-gaap:CommonStockMember2022-01-012022-06-300000874766us-gaap:CommonStockMember2021-01-012021-06-3000008747662020-12-31xbrli:pure0000874766hig:PCCommercialLinesMemberus-gaap:OperatingSegmentsMember2022-04-012022-06-300000874766hig:PCCommercialLinesMemberus-gaap:OperatingSegmentsMember2021-04-012021-06-300000874766hig:PCCommercialLinesMemberus-gaap:OperatingSegmentsMember2022-01-012022-06-300000874766hig:PCCommercialLinesMemberus-gaap:OperatingSegmentsMember2021-01-012021-06-300000874766hig:PCPersonalLinesMemberus-gaap:OperatingSegmentsMember2022-04-012022-06-300000874766hig:PCPersonalLinesMemberus-gaap:OperatingSegmentsMember2021-04-012021-06-300000874766hig:PCPersonalLinesMemberus-gaap:OperatingSegmentsMember2022-01-012022-06-300000874766hig:PCPersonalLinesMemberus-gaap:OperatingSegmentsMember2021-01-012021-06-300000874766us-gaap:OperatingSegmentsMemberhig:PropertyCasualtyOtherOperationsMember2022-04-012022-06-300000874766us-gaap:OperatingSegmentsMemberhig:PropertyCasualtyOtherOperationsMember2021-04-012021-06-300000874766us-gaap:OperatingSegmentsMemberhig:PropertyCasualtyOtherOperationsMember2022-01-012022-06-300000874766us-gaap:OperatingSegmentsMemberhig:PropertyCasualtyOtherOperationsMember2021-01-012021-06-300000874766hig:GroupBenefitsMemberus-gaap:OperatingSegmentsMember2022-04-012022-06-300000874766hig:GroupBenefitsMemberus-gaap:OperatingSegmentsMember2021-04-012021-06-300000874766hig:GroupBenefitsMemberus-gaap:OperatingSegmentsMember2022-01-012022-06-300000874766hig:GroupBenefitsMemberus-gaap:OperatingSegmentsMember2021-01-012021-06-300000874766us-gaap:OperatingSegmentsMemberhig:HartfordFundsMember2022-04-012022-06-300000874766us-gaap:OperatingSegmentsMemberhig:HartfordFundsMember2021-04-012021-06-300000874766us-gaap:OperatingSegmentsMemberhig:HartfordFundsMember2022-01-012022-06-300000874766us-gaap:OperatingSegmentsMemberhig:HartfordFundsMember2021-01-012021-06-300000874766us-gaap:CorporateNonSegmentMember2022-04-012022-06-300000874766us-gaap:CorporateNonSegmentMember2021-04-012021-06-300000874766us-gaap:CorporateNonSegmentMember2022-01-012022-06-300000874766us-gaap:CorporateNonSegmentMember2021-01-012021-06-300000874766hig:PCCommercialLinesMemberus-gaap:OperatingSegmentsMemberus-gaap:AccidentAndHealthInsuranceSegmentMember2022-04-012022-06-300000874766hig:PCCommercialLinesMemberus-gaap:OperatingSegmentsMemberus-gaap:AccidentAndHealthInsuranceSegmentMember2021-04-012021-06-300000874766hig:PCCommercialLinesMemberus-gaap:OperatingSegmentsMemberus-gaap:AccidentAndHealthInsuranceSegmentMember2022-01-012022-06-300000874766hig:PCCommercialLinesMemberus-gaap:OperatingSegmentsMemberus-gaap:AccidentAndHealthInsuranceSegmentMember2021-01-012021-06-300000874766us-gaap:GeneralLiabilityMemberhig:PCCommercialLinesMemberus-gaap:OperatingSegmentsMember2022-04-012022-06-300000874766us-gaap:GeneralLiabilityMemberhig:PCCommercialLinesMemberus-gaap:OperatingSegmentsMember2021-04-012021-06-300000874766us-gaap:GeneralLiabilityMemberhig:PCCommercialLinesMemberus-gaap:OperatingSegmentsMember2022-01-012022-06-300000874766us-gaap:GeneralLiabilityMemberhig:PCCommercialLinesMemberus-gaap:OperatingSegmentsMember2021-01-012021-06-300000874766hig:MarineMemberhig:PCCommercialLinesMemberus-gaap:OperatingSegmentsMember2022-04-012022-06-300000874766hig:MarineMemberhig:PCCommercialLinesMemberus-gaap:OperatingSegmentsMember2021-04-012021-06-300000874766hig:MarineMemberhig:PCCommercialLinesMemberus-gaap:OperatingSegmentsMember2022-01-012022-06-300000874766hig:MarineMemberhig:PCCommercialLinesMemberus-gaap:OperatingSegmentsMember2021-01-012021-06-300000874766hig:PCCommercialLinesMemberhig:PackageBusinessMemberus-gaap:OperatingSegmentsMember2022-04-012022-06-300000874766hig:PCCommercialLinesMemberhig:PackageBusinessMemberus-gaap:OperatingSegmentsMember2021-04-012021-06-300000874766hig:PCCommercialLinesMemberhig:PackageBusinessMemberus-gaap:OperatingSegmentsMember2022-01-012022-06-300000874766hig:PCCommercialLinesMemberhig:PackageBusinessMemberus-gaap:OperatingSegmentsMember2021-01-012021-06-300000874766us-gaap:PropertyInsuranceProductLineMemberhig:PCCommercialLinesMemberus-gaap:OperatingSegmentsMember2022-04-012022-06-300000874766us-gaap:PropertyInsuranceProductLineMemberhig:PCCommercialLinesMemberus-gaap:OperatingSegmentsMember2021-04-012021-06-300000874766us-gaap:PropertyInsuranceProductLineMemberhig:PCCommercialLinesMemberus-gaap:OperatingSegmentsMember2022-01-012022-06-300000874766us-gaap:PropertyInsuranceProductLineMemberhig:PCCommercialLinesMemberus-gaap:OperatingSegmentsMember2021-01-012021-06-300000874766hig:PCCommercialLinesMemberus-gaap:OperatingSegmentsMemberhig:ProfessionalLiabilityMember2022-04-012022-06-300000874766hig:PCCommercialLinesMemberus-gaap:OperatingSegmentsMemberhig:ProfessionalLiabilityMember2021-04-012021-06-300000874766hig:PCCommercialLinesMemberus-gaap:OperatingSegmentsMemberhig:ProfessionalLiabilityMember2022-01-012022-06-300000874766hig:PCCommercialLinesMemberus-gaap:OperatingSegmentsMemberhig:ProfessionalLiabilityMember2021-01-012021-06-300000874766us-gaap:SuretySegmentMemberhig:PCCommercialLinesMemberus-gaap:OperatingSegmentsMember2022-04-012022-06-300000874766us-gaap:SuretySegmentMemberhig:PCCommercialLinesMemberus-gaap:OperatingSegmentsMember2021-04-012021-06-300000874766us-gaap:SuretySegmentMemberhig:PCCommercialLinesMemberus-gaap:OperatingSegmentsMember2022-01-012022-06-300000874766us-gaap:SuretySegmentMemberhig:PCCommercialLinesMemberus-gaap:OperatingSegmentsMember2021-01-012021-06-300000874766hig:AssumedReinsuranceMemberhig:PCCommercialLinesMemberus-gaap:OperatingSegmentsMember2022-04-012022-06-300000874766hig:AssumedReinsuranceMemberhig:PCCommercialLinesMemberus-gaap:OperatingSegmentsMember2021-04-012021-06-300000874766hig:AssumedReinsuranceMemberhig:PCCommercialLinesMemberus-gaap:OperatingSegmentsMember2022-01-012022-06-300000874766hig:AssumedReinsuranceMemberhig:PCCommercialLinesMemberus-gaap:OperatingSegmentsMember2021-01-012021-06-300000874766hig:PCCommercialLinesMemberus-gaap:OperatingSegmentsMemberus-gaap:AutomobilesMember2022-04-012022-06-300000874766hig:PCCommercialLinesMemberus-gaap:OperatingSegmentsMemberus-gaap:AutomobilesMember2021-04-012021-06-300000874766hig:PCCommercialLinesMemberus-gaap:OperatingSegmentsMemberus-gaap:AutomobilesMember2022-01-012022-06-300000874766hig:PCCommercialLinesMemberus-gaap:OperatingSegmentsMemberus-gaap:AutomobilesMember2021-01-012021-06-300000874766hig:PCPersonalLinesMemberus-gaap:OperatingSegmentsMemberus-gaap:AutomobilesMember2022-04-012022-06-300000874766hig:PCPersonalLinesMemberus-gaap:OperatingSegmentsMemberus-gaap:AutomobilesMember2021-04-012021-06-300000874766hig:PCPersonalLinesMemberus-gaap:OperatingSegmentsMemberus-gaap:AutomobilesMember2022-01-012022-06-300000874766hig:PCPersonalLinesMemberus-gaap:OperatingSegmentsMemberus-gaap:AutomobilesMember2021-01-012021-06-300000874766us-gaap:PropertyInsuranceProductLineMemberhig:PCPersonalLinesMemberus-gaap:OperatingSegmentsMember2022-04-012022-06-300000874766us-gaap:PropertyInsuranceProductLineMemberhig:PCPersonalLinesMemberus-gaap:OperatingSegmentsMember2021-04-012021-06-300000874766us-gaap:PropertyInsuranceProductLineMemberhig:PCPersonalLinesMemberus-gaap:OperatingSegmentsMember2022-01-012022-06-300000874766us-gaap:PropertyInsuranceProductLineMemberhig:PCPersonalLinesMemberus-gaap:OperatingSegmentsMember2021-01-012021-06-300000874766hig:GroupBenefitsMemberus-gaap:DisabilityInsurancePolicyMemberus-gaap:OperatingSegmentsMember2022-04-012022-06-300000874766hig:GroupBenefitsMemberus-gaap:DisabilityInsurancePolicyMemberus-gaap:OperatingSegmentsMember2021-04-012021-06-300000874766hig:GroupBenefitsMemberus-gaap:DisabilityInsurancePolicyMemberus-gaap:OperatingSegmentsMember2022-01-012022-06-300000874766hig:GroupBenefitsMemberus-gaap:DisabilityInsurancePolicyMemberus-gaap:OperatingSegmentsMember2021-01-012021-06-300000874766hig:GroupBenefitsMemberus-gaap:LifeInsuranceSegmentMemberus-gaap:OperatingSegmentsMember2022-04-012022-06-300000874766hig:GroupBenefitsMemberus-gaap:LifeInsuranceSegmentMemberus-gaap:OperatingSegmentsMember2021-04-012021-06-300000874766hig:GroupBenefitsMemberus-gaap:LifeInsuranceSegmentMemberus-gaap:OperatingSegmentsMember2022-01-012022-06-300000874766hig:GroupBenefitsMemberus-gaap:LifeInsuranceSegmentMemberus-gaap:OperatingSegmentsMember2021-01-012021-06-300000874766hig:GroupBenefitsMemberus-gaap:OtherInsuranceProductLineMemberus-gaap:OperatingSegmentsMember2022-04-012022-06-300000874766hig:GroupBenefitsMemberus-gaap:OtherInsuranceProductLineMemberus-gaap:OperatingSegmentsMember2021-04-012021-06-300000874766hig:GroupBenefitsMemberus-gaap:OtherInsuranceProductLineMemberus-gaap:OperatingSegmentsMember2022-01-012022-06-300000874766hig:GroupBenefitsMemberus-gaap:OtherInsuranceProductLineMemberus-gaap:OperatingSegmentsMember2021-01-012021-06-300000874766hig:ThirdpartyretailcustomersMemberus-gaap:OperatingSegmentsMemberhig:HartfordFundsMember2022-04-012022-06-300000874766hig:ThirdpartyretailcustomersMemberus-gaap:OperatingSegmentsMemberhig:HartfordFundsMember2021-04-012021-06-300000874766hig:ThirdpartyretailcustomersMemberus-gaap:OperatingSegmentsMemberhig:HartfordFundsMember2022-01-012022-06-300000874766hig:ThirdpartyretailcustomersMemberus-gaap:OperatingSegmentsMemberhig:HartfordFundsMember2021-01-012021-06-300000874766hig:TalcottResolutionMemberus-gaap:OperatingSegmentsMemberhig:HartfordFundsMember2022-04-012022-06-300000874766hig:TalcottResolutionMemberus-gaap:OperatingSegmentsMemberhig:HartfordFundsMember2021-04-012021-06-300000874766hig:TalcottResolutionMemberus-gaap:OperatingSegmentsMemberhig:HartfordFundsMember2022-01-012022-06-300000874766hig:TalcottResolutionMemberus-gaap:OperatingSegmentsMemberhig:HartfordFundsMember2021-01-012021-06-300000874766hig:PCPersonalLinesMemberhig:AARPMembersMember2022-04-012022-06-300000874766hig:PCPersonalLinesMemberhig:AARPMembersMember2021-04-012021-06-300000874766hig:PCPersonalLinesMemberhig:AARPMembersMember2022-01-012022-06-300000874766hig:PCPersonalLinesMemberhig:AARPMembersMember2021-01-012021-06-300000874766hig:PCCommercialLinesMemberus-gaap:OperatingSegmentsMemberhig:InstallmentbillingfeesMember2022-04-012022-06-300000874766hig:PCCommercialLinesMemberus-gaap:OperatingSegmentsMemberhig:InstallmentbillingfeesMember2021-04-012021-06-300000874766hig:PCCommercialLinesMemberus-gaap:OperatingSegmentsMemberhig:InstallmentbillingfeesMember2022-01-012022-06-300000874766hig:PCCommercialLinesMemberus-gaap:OperatingSegmentsMemberhig:InstallmentbillingfeesMember2021-01-012021-06-300000874766hig:PCPersonalLinesMemberus-gaap:OperatingSegmentsMemberhig:InstallmentbillingfeesMember2022-04-012022-06-300000874766hig:PCPersonalLinesMemberus-gaap:OperatingSegmentsMemberhig:InstallmentbillingfeesMember2021-04-012021-06-300000874766hig:PCPersonalLinesMemberus-gaap:OperatingSegmentsMemberhig:InstallmentbillingfeesMember2022-01-012022-06-300000874766hig:PCPersonalLinesMemberus-gaap:OperatingSegmentsMemberhig:InstallmentbillingfeesMember2021-01-012021-06-300000874766hig:InsuranceservicingfeesMemberhig:PCPersonalLinesMemberus-gaap:OperatingSegmentsMember2022-04-012022-06-300000874766hig:InsuranceservicingfeesMemberhig:PCPersonalLinesMemberus-gaap:OperatingSegmentsMember2021-04-012021-06-300000874766hig:InsuranceservicingfeesMemberhig:PCPersonalLinesMemberus-gaap:OperatingSegmentsMember2022-01-012022-06-300000874766hig:InsuranceservicingfeesMemberhig:PCPersonalLinesMemberus-gaap:OperatingSegmentsMember2021-01-012021-06-300000874766hig:GroupBenefitsMemberhig:AdministrativeservicesfeesMemberus-gaap:OperatingSegmentsMember2022-04-012022-06-300000874766hig:GroupBenefitsMemberhig:AdministrativeservicesfeesMemberus-gaap:OperatingSegmentsMember2021-04-012021-06-300000874766hig:GroupBenefitsMemberhig:AdministrativeservicesfeesMemberus-gaap:OperatingSegmentsMember2022-01-012022-06-300000874766hig:GroupBenefitsMemberhig:AdministrativeservicesfeesMemberus-gaap:OperatingSegmentsMember2021-01-012021-06-300000874766us-gaap:OperatingSegmentsMemberhig:HartfordFundsMemberhig:AdvisordistributionandothermanagementfeesMember2022-04-012022-06-300000874766us-gaap:OperatingSegmentsMemberhig:HartfordFundsMemberhig:AdvisordistributionandothermanagementfeesMember2021-04-012021-06-300000874766us-gaap:OperatingSegmentsMemberhig:HartfordFundsMemberhig:AdvisordistributionandothermanagementfeesMember2022-01-012022-06-300000874766us-gaap:OperatingSegmentsMemberhig:HartfordFundsMemberhig:AdvisordistributionandothermanagementfeesMember2021-01-012021-06-300000874766us-gaap:CorporateNonSegmentMemberhig:InvestmentmanagementandotherfeesMember2022-04-012022-06-300000874766us-gaap:CorporateNonSegmentMemberhig:InvestmentmanagementandotherfeesMember2021-04-012021-06-300000874766us-gaap:CorporateNonSegmentMemberhig:InvestmentmanagementandotherfeesMember2022-01-012022-06-300000874766us-gaap:CorporateNonSegmentMemberhig:InvestmentmanagementandotherfeesMember2021-01-012021-06-300000874766us-gaap:CorporateNonSegmentMemberhig:OtherMember2022-04-012022-06-300000874766us-gaap:CorporateNonSegmentMemberhig:OtherMember2021-04-012021-06-300000874766us-gaap:CorporateNonSegmentMemberhig:OtherMember2022-01-012022-06-300000874766us-gaap:CorporateNonSegmentMemberhig:OtherMember2021-01-012021-06-300000874766us-gaap:AssetBackedSecuritiesMember2022-06-300000874766us-gaap:AssetBackedSecuritiesMemberus-gaap:FairValueInputsLevel1Member2022-06-300000874766us-gaap:AssetBackedSecuritiesMemberus-gaap:FairValueInputsLevel2Member2022-06-300000874766us-gaap:AssetBackedSecuritiesMemberus-gaap:FairValueInputsLevel3Member2022-06-300000874766us-gaap:CollateralizedLoanObligationsMember2022-06-300000874766us-gaap:CollateralizedLoanObligationsMemberus-gaap:FairValueInputsLevel1Member2022-06-300000874766us-gaap:CollateralizedLoanObligationsMemberus-gaap:FairValueInputsLevel2Member2022-06-300000874766us-gaap:CollateralizedLoanObligationsMemberus-gaap:FairValueInputsLevel3Member2022-06-300000874766us-gaap:CommercialMortgageBackedSecuritiesMember2022-06-300000874766us-gaap:CommercialMortgageBackedSecuritiesMemberus-gaap:FairValueInputsLevel1Member2022-06-300000874766us-gaap:CommercialMortgageBackedSecuritiesMemberus-gaap:FairValueInputsLevel2Member2022-06-300000874766us-gaap:CommercialMortgageBackedSecuritiesMemberus-gaap:FairValueInputsLevel3Member2022-06-300000874766us-gaap:CorporateDebtSecuritiesMember2022-06-300000874766us-gaap:CorporateDebtSecuritiesMemberus-gaap:FairValueInputsLevel1Member2022-06-300000874766us-gaap:CorporateDebtSecuritiesMemberus-gaap:FairValueInputsLevel2Member2022-06-300000874766us-gaap:CorporateDebtSecuritiesMemberus-gaap:FairValueInputsLevel3Member2022-06-300000874766us-gaap:ForeignGovernmentDebtSecuritiesMember2022-06-300000874766us-gaap:ForeignGovernmentDebtSecuritiesMemberus-gaap:FairValueInputsLevel1Member2022-06-300000874766us-gaap:ForeignGovernmentDebtSecuritiesMemberus-gaap:FairValueInputsLevel2Member2022-06-300000874766us-gaap:ForeignGovernmentDebtSecuritiesMemberus-gaap:FairValueInputsLevel3Member2022-06-300000874766us-gaap:MunicipalBondsMember2022-06-300000874766us-gaap:MunicipalBondsMemberus-gaap:FairValueInputsLevel1Member2022-06-300000874766us-gaap:MunicipalBondsMemberus-gaap:FairValueInputsLevel2Member2022-06-300000874766us-gaap:MunicipalBondsMemberus-gaap:FairValueInputsLevel3Member2022-06-300000874766us-gaap:ResidentialMortgageBackedSecuritiesMember2022-06-300000874766us-gaap:ResidentialMortgageBackedSecuritiesMemberus-gaap:FairValueInputsLevel1Member2022-06-300000874766us-gaap:ResidentialMortgageBackedSecuritiesMemberus-gaap:FairValueInputsLevel2Member2022-06-300000874766us-gaap:ResidentialMortgageBackedSecuritiesMemberus-gaap:FairValueInputsLevel3Member2022-06-300000874766us-gaap:USTreasurySecuritiesMember2022-06-300000874766us-gaap:USTreasurySecuritiesMemberus-gaap:FairValueInputsLevel1Member2022-06-300000874766us-gaap:USTreasurySecuritiesMemberus-gaap:FairValueInputsLevel2Member2022-06-300000874766us-gaap:USTreasurySecuritiesMemberus-gaap:FairValueInputsLevel3Member2022-06-300000874766us-gaap:FairValueInputsLevel1Member2022-06-300000874766us-gaap:FairValueInputsLevel2Member2022-06-300000874766us-gaap:FairValueInputsLevel3Member2022-06-300000874766us-gaap:CreditRiskContractMember2022-06-300000874766us-gaap:CreditRiskContractMemberus-gaap:FairValueInputsLevel1Member2022-06-300000874766us-gaap:CreditRiskContractMemberus-gaap:FairValueInputsLevel2Member2022-06-300000874766us-gaap:CreditRiskContractMemberus-gaap:FairValueInputsLevel3Member2022-06-300000874766us-gaap:ForeignExchangeContractMember2022-06-300000874766us-gaap:ForeignExchangeContractMemberus-gaap:FairValueInputsLevel1Member2022-06-300000874766us-gaap:ForeignExchangeContractMemberus-gaap:FairValueInputsLevel2Member2022-06-300000874766us-gaap:ForeignExchangeContractMemberus-gaap:FairValueInputsLevel3Member2022-06-300000874766us-gaap:InterestRateContractMember2022-06-300000874766us-gaap:InterestRateContractMemberus-gaap:FairValueInputsLevel1Member2022-06-300000874766us-gaap:InterestRateContractMemberus-gaap:FairValueInputsLevel2Member2022-06-300000874766us-gaap:InterestRateContractMemberus-gaap:FairValueInputsLevel3Member2022-06-300000874766us-gaap:AssetBackedSecuritiesMember2021-12-310000874766us-gaap:AssetBackedSecuritiesMemberus-gaap:FairValueInputsLevel1Member2021-12-310000874766us-gaap:AssetBackedSecuritiesMemberus-gaap:FairValueInputsLevel2Member2021-12-310000874766us-gaap:AssetBackedSecuritiesMemberus-gaap:FairValueInputsLevel3Member2021-12-310000874766us-gaap:CollateralizedLoanObligationsMember2021-12-310000874766us-gaap:CollateralizedLoanObligationsMemberus-gaap:FairValueInputsLevel1Member2021-12-310000874766us-gaap:CollateralizedLoanObligationsMemberus-gaap:FairValueInputsLevel2Member2021-12-310000874766us-gaap:CollateralizedLoanObligationsMemberus-gaap:FairValueInputsLevel3Member2021-12-310000874766us-gaap:CommercialMortgageBackedSecuritiesMember2021-12-310000874766us-gaap:CommercialMortgageBackedSecuritiesMemberus-gaap:FairValueInputsLevel1Member2021-12-310000874766us-gaap:CommercialMortgageBackedSecuritiesMemberus-gaap:FairValueInputsLevel2Member2021-12-310000874766us-gaap:CommercialMortgageBackedSecuritiesMemberus-gaap:FairValueInputsLevel3Member2021-12-310000874766us-gaap:CorporateDebtSecuritiesMember2021-12-310000874766us-gaap:CorporateDebtSecuritiesMemberus-gaap:FairValueInputsLevel1Member2021-12-310000874766us-gaap:CorporateDebtSecuritiesMemberus-gaap:FairValueInputsLevel2Member2021-12-310000874766us-gaap:CorporateDebtSecuritiesMemberus-gaap:FairValueInputsLevel3Member2021-12-310000874766us-gaap:ForeignGovernmentDebtSecuritiesMember2021-12-310000874766us-gaap:ForeignGovernmentDebtSecuritiesMemberus-gaap:FairValueInputsLevel1Member2021-12-310000874766us-gaap:ForeignGovernmentDebtSecuritiesMemberus-gaap:FairValueInputsLevel2Member2021-12-310000874766us-gaap:ForeignGovernmentDebtSecuritiesMemberus-gaap:FairValueInputsLevel3Member2021-12-310000874766us-gaap:MunicipalBondsMember2021-12-310000874766us-gaap:MunicipalBondsMemberus-gaap:FairValueInputsLevel1Member2021-12-310000874766us-gaap:MunicipalBondsMemberus-gaap:FairValueInputsLevel2Member2021-12-310000874766us-gaap:MunicipalBondsMemberus-gaap:FairValueInputsLevel3Member2021-12-310000874766us-gaap:ResidentialMortgageBackedSecuritiesMember2021-12-310000874766us-gaap:ResidentialMortgageBackedSecuritiesMemberus-gaap:FairValueInputsLevel1Member2021-12-310000874766us-gaap:ResidentialMortgageBackedSecuritiesMemberus-gaap:FairValueInputsLevel2Member2021-12-310000874766us-gaap:ResidentialMortgageBackedSecuritiesMemberus-gaap:FairValueInputsLevel3Member2021-12-310000874766us-gaap:USTreasurySecuritiesMember2021-12-310000874766us-gaap:USTreasurySecuritiesMemberus-gaap:FairValueInputsLevel1Member2021-12-310000874766us-gaap:USTreasurySecuritiesMemberus-gaap:FairValueInputsLevel2Member2021-12-310000874766us-gaap:USTreasurySecuritiesMemberus-gaap:FairValueInputsLevel3Member2021-12-310000874766us-gaap:FairValueInputsLevel1Member2021-12-310000874766us-gaap:FairValueInputsLevel2Member2021-12-310000874766us-gaap:FairValueInputsLevel3Member2021-12-310000874766us-gaap:CreditRiskContractMember2021-12-310000874766us-gaap:CreditRiskContractMemberus-gaap:FairValueInputsLevel1Member2021-12-310000874766us-gaap:CreditRiskContractMemberus-gaap:FairValueInputsLevel2Member2021-12-310000874766us-gaap:CreditRiskContractMemberus-gaap:FairValueInputsLevel3Member2021-12-310000874766us-gaap:ForeignExchangeContractMember2021-12-310000874766us-gaap:ForeignExchangeContractMemberus-gaap:FairValueInputsLevel1Member2021-12-310000874766us-gaap:ForeignExchangeContractMemberus-gaap:FairValueInputsLevel2Member2021-12-310000874766us-gaap:ForeignExchangeContractMemberus-gaap:FairValueInputsLevel3Member2021-12-310000874766us-gaap:InterestRateContractMember2021-12-310000874766us-gaap:InterestRateContractMemberus-gaap:FairValueInputsLevel1Member2021-12-310000874766us-gaap:InterestRateContractMemberus-gaap:FairValueInputsLevel2Member2021-12-310000874766us-gaap:InterestRateContractMemberus-gaap:FairValueInputsLevel3Member2021-12-310000874766us-gaap:FairValueMeasuredAtNetAssetValuePerShareMember2022-06-300000874766us-gaap:FairValueMeasuredAtNetAssetValuePerShareMember2021-12-310000874766us-gaap:CollateralizedLoanObligationsMemberus-gaap:FairValueInputsLevel3Memberus-gaap:FairValueMeasurementsRecurringMember2022-06-300000874766srt:MinimumMemberus-gaap:CollateralizedLoanObligationsMemberus-gaap:MeasurementInputCreditSpreadMemberus-gaap:FairValueMeasurementsRecurringMemberus-gaap:FairValueInputsLevel3Member2022-06-300000874766us-gaap:CollateralizedLoanObligationsMemberus-gaap:MeasurementInputCreditSpreadMemberus-gaap:FairValueMeasurementsRecurringMemberus-gaap:FairValueInputsLevel3Membersrt:MaximumMember2022-06-300000874766us-gaap:CollateralizedLoanObligationsMemberus-gaap:MeasurementInputCreditSpreadMembersrt:WeightedAverageMemberus-gaap:FairValueMeasurementsRecurringMemberus-gaap:FairValueInputsLevel3Member2022-06-300000874766us-gaap:CommercialMortgageBackedSecuritiesMemberus-gaap:FairValueInputsLevel3Memberus-gaap:FairValueMeasurementsRecurringMember2022-06-300000874766srt:MinimumMemberus-gaap:MeasurementInputCreditSpreadMemberus-gaap:CommercialMortgageBackedSecuritiesMemberus-gaap:FairValueMeasurementsRecurringMemberus-gaap:FairValueInputsLevel3Member2022-06-300000874766us-gaap:MeasurementInputCreditSpreadMemberus-gaap:CommercialMortgageBackedSecuritiesMemberus-gaap:FairValueMeasurementsRecurringMemberus-gaap:FairValueInputsLevel3Membersrt:MaximumMember2022-06-300000874766us-gaap:MeasurementInputCreditSpreadMembersrt:WeightedAverageMemberus-gaap:CommercialMortgageBackedSecuritiesMemberus-gaap:FairValueMeasurementsRecurringMemberus-gaap:FairValueInputsLevel3Member2022-06-300000874766us-gaap:CorporateDebtSecuritiesMemberus-gaap:FairValueInputsLevel3Memberus-gaap:FairValueMeasurementsRecurringMember2022-06-300000874766srt:MinimumMemberus-gaap:MeasurementInputCreditSpreadMemberus-gaap:CorporateDebtSecuritiesMemberus-gaap:FairValueMeasurementsRecurringMemberus-gaap:FairValueInputsLevel3Member2022-06-300000874766us-gaap:MeasurementInputCreditSpreadMemberus-gaap:CorporateDebtSecuritiesMemberus-gaap:FairValueMeasurementsRecurringMemberus-gaap:FairValueInputsLevel3Membersrt:MaximumMember2022-06-300000874766us-gaap:MeasurementInputCreditSpreadMembersrt:WeightedAverageMemberus-gaap:CorporateDebtSecuritiesMemberus-gaap:FairValueMeasurementsRecurringMemberus-gaap:FairValueInputsLevel3Member2022-06-300000874766us-gaap:ResidentialMortgageBackedSecuritiesMemberus-gaap:FairValueInputsLevel3Memberus-gaap:FairValueMeasurementsRecurringMember2022-06-300000874766srt:MinimumMemberus-gaap:ResidentialMortgageBackedSecuritiesMemberus-gaap:MeasurementInputCreditSpreadMemberus-gaap:FairValueMeasurementsRecurringMemberus-gaap:FairValueInputsLevel3Member2022-06-300000874766us-gaap:ResidentialMortgageBackedSecuritiesMemberus-gaap:MeasurementInputCreditSpreadMemberus-gaap:FairValueMeasurementsRecurringMemberus-gaap:FairValueInputsLevel3Membersrt:MaximumMember2022-06-300000874766us-gaap:ResidentialMortgageBackedSecuritiesMemberus-gaap:MeasurementInputCreditSpreadMembersrt:WeightedAverageMemberus-gaap:FairValueMeasurementsRecurringMemberus-gaap:FairValueInputsLevel3Member2022-06-300000874766srt:MinimumMemberus-gaap:ResidentialMortgageBackedSecuritiesMemberus-gaap:MeasurementInputConstantPrepaymentRateMemberus-gaap:FairValueMeasurementsRecurringMemberus-gaap:FairValueInputsLevel3Member2022-06-300000874766us-gaap:ResidentialMortgageBackedSecuritiesMemberus-gaap:MeasurementInputConstantPrepaymentRateMemberus-gaap:FairValueMeasurementsRecurringMemberus-gaap:FairValueInputsLevel3Membersrt:MaximumMember2022-06-300000874766us-gaap:ResidentialMortgageBackedSecuritiesMembersrt:WeightedAverageMemberus-gaap:MeasurementInputConstantPrepaymentRateMemberus-gaap:FairValueMeasurementsRecurringMemberus-gaap:FairValueInputsLevel3Member2022-06-300000874766srt:MinimumMemberus-gaap:ResidentialMortgageBackedSecuritiesMemberus-gaap:MeasurementInputDefaultRateMemberus-gaap:FairValueMeasurementsRecurringMemberus-gaap:FairValueInputsLevel3Member2022-06-300000874766us-gaap:ResidentialMortgageBackedSecuritiesMemberus-gaap:MeasurementInputDefaultRateMemberus-gaap:FairValueMeasurementsRecurringMemberus-gaap:FairValueInputsLevel3Membersrt:MaximumMember2022-06-300000874766us-gaap:ResidentialMortgageBackedSecuritiesMembersrt:WeightedAverageMemberus-gaap:MeasurementInputDefaultRateMemberus-gaap:FairValueMeasurementsRecurringMemberus-gaap:FairValueInputsLevel3Member2022-06-300000874766srt:MinimumMemberus-gaap:ResidentialMortgageBackedSecuritiesMemberus-gaap:MeasurementInputLossSeverityMemberus-gaap:FairValueMeasurementsRecurringMemberus-gaap:FairValueInputsLevel3Member2022-06-300000874766us-gaap:ResidentialMortgageBackedSecuritiesMemberus-gaap:MeasurementInputLossSeverityMemberus-gaap:FairValueMeasurementsRecurringMemberus-gaap:FairValueInputsLevel3Membersrt:MaximumMember2022-06-300000874766us-gaap:ResidentialMortgageBackedSecuritiesMembersrt:WeightedAverageMemberus-gaap:MeasurementInputLossSeverityMemberus-gaap:FairValueMeasurementsRecurringMemberus-gaap:FairValueInputsLevel3Member2022-06-300000874766us-gaap:CollateralizedLoanObligationsMemberus-gaap:FairValueInputsLevel3Memberus-gaap:FairValueMeasurementsRecurringMember2021-12-310000874766srt:MinimumMemberus-gaap:CollateralizedLoanObligationsMemberus-gaap:MeasurementInputCreditSpreadMemberus-gaap:FairValueMeasurementsRecurringMemberus-gaap:FairValueInputsLevel3Member2021-12-310000874766us-gaap:CollateralizedLoanObligationsMemberus-gaap:MeasurementInputCreditSpreadMemberus-gaap:FairValueMeasurementsRecurringMemberus-gaap:FairValueInputsLevel3Membersrt:MaximumMember2021-12-310000874766us-gaap:CollateralizedLoanObligationsMemberus-gaap:MeasurementInputCreditSpreadMembersrt:WeightedAverageMemberus-gaap:FairValueMeasurementsRecurringMemberus-gaap:FairValueInputsLevel3Member2021-12-310000874766us-gaap:CommercialMortgageBackedSecuritiesMemberus-gaap:FairValueInputsLevel3Memberus-gaap:FairValueMeasurementsRecurringMember2021-12-310000874766srt:MinimumMemberus-gaap:MeasurementInputCreditSpreadMemberus-gaap:CommercialMortgageBackedSecuritiesMemberus-gaap:FairValueMeasurementsRecurringMemberus-gaap:FairValueInputsLevel3Member2021-12-310000874766us-gaap:MeasurementInputCreditSpreadMemberus-gaap:CommercialMortgageBackedSecuritiesMemberus-gaap:FairValueMeasurementsRecurringMemberus-gaap:FairValueInputsLevel3Membersrt:MaximumMember2021-12-310000874766us-gaap:MeasurementInputCreditSpreadMembersrt:WeightedAverageMemberus-gaap:CommercialMortgageBackedSecuritiesMemberus-gaap:FairValueMeasurementsRecurringMemberus-gaap:FairValueInputsLevel3Member2021-12-310000874766us-gaap:CorporateDebtSecuritiesMemberus-gaap:FairValueInputsLevel3Memberus-gaap:FairValueMeasurementsRecurringMember2021-12-310000874766srt:MinimumMemberus-gaap:MeasurementInputCreditSpreadMemberus-gaap:CorporateDebtSecuritiesMemberus-gaap:FairValueMeasurementsRecurringMemberus-gaap:FairValueInputsLevel3Member2021-12-310000874766us-gaap:MeasurementInputCreditSpreadMemberus-gaap:CorporateDebtSecuritiesMemberus-gaap:FairValueMeasurementsRecurringMemberus-gaap:FairValueInputsLevel3Membersrt:MaximumMember2021-12-310000874766us-gaap:MeasurementInputCreditSpreadMembersrt:WeightedAverageMemberus-gaap:CorporateDebtSecuritiesMemberus-gaap:FairValueMeasurementsRecurringMemberus-gaap:FairValueInputsLevel3Member2021-12-310000874766us-gaap:ResidentialMortgageBackedSecuritiesMemberus-gaap:FairValueInputsLevel3Memberus-gaap:FairValueMeasurementsRecurringMember2021-12-310000874766srt:MinimumMemberus-gaap:ResidentialMortgageBackedSecuritiesMemberus-gaap:MeasurementInputCreditSpreadMemberus-gaap:FairValueMeasurementsRecurringMemberus-gaap:FairValueInputsLevel3Member2021-12-310000874766us-gaap:ResidentialMortgageBackedSecuritiesMemberus-gaap:MeasurementInputCreditSpreadMemberus-gaap:FairValueMeasurementsRecurringMemberus-gaap:FairValueInputsLevel3Membersrt:MaximumMember2021-12-310000874766us-gaap:ResidentialMortgageBackedSecuritiesMemberus-gaap:MeasurementInputCreditSpreadMembersrt:WeightedAverageMemberus-gaap:FairValueMeasurementsRecurringMemberus-gaap:FairValueInputsLevel3Member2021-12-310000874766srt:MinimumMemberus-gaap:ResidentialMortgageBackedSecuritiesMemberus-gaap:MeasurementInputConstantPrepaymentRateMemberus-gaap:FairValueMeasurementsRecurringMemberus-gaap:FairValueInputsLevel3Member2021-12-310000874766us-gaap:ResidentialMortgageBackedSecuritiesMemberus-gaap:MeasurementInputConstantPrepaymentRateMemberus-gaap:FairValueMeasurementsRecurringMemberus-gaap:FairValueInputsLevel3Membersrt:MaximumMember2021-12-310000874766us-gaap:ResidentialMortgageBackedSecuritiesMembersrt:WeightedAverageMemberus-gaap:MeasurementInputConstantPrepaymentRateMemberus-gaap:FairValueMeasurementsRecurringMemberus-gaap:FairValueInputsLevel3Member2021-12-310000874766srt:MinimumMemberus-gaap:ResidentialMortgageBackedSecuritiesMemberus-gaap:MeasurementInputDefaultRateMemberus-gaap:FairValueMeasurementsRecurringMemberus-gaap:FairValueInputsLevel3Member2021-12-310000874766us-gaap:ResidentialMortgageBackedSecuritiesMemberus-gaap:MeasurementInputDefaultRateMemberus-gaap:FairValueMeasurementsRecurringMemberus-gaap:FairValueInputsLevel3Membersrt:MaximumMember2021-12-310000874766us-gaap:ResidentialMortgageBackedSecuritiesMembersrt:WeightedAverageMemberus-gaap:MeasurementInputDefaultRateMemberus-gaap:FairValueMeasurementsRecurringMemberus-gaap:FairValueInputsLevel3Member2021-12-310000874766srt:MinimumMemberus-gaap:ResidentialMortgageBackedSecuritiesMemberus-gaap:MeasurementInputLossSeverityMemberus-gaap:FairValueMeasurementsRecurringMemberus-gaap:FairValueInputsLevel3Member2021-12-310000874766us-gaap:ResidentialMortgageBackedSecuritiesMemberus-gaap:MeasurementInputLossSeverityMemberus-gaap:FairValueMeasurementsRecurringMemberus-gaap:FairValueInputsLevel3Membersrt:MaximumMember2021-12-310000874766us-gaap:ResidentialMortgageBackedSecuritiesMembersrt:WeightedAverageMemberus-gaap:MeasurementInputLossSeverityMemberus-gaap:FairValueMeasurementsRecurringMemberus-gaap:FairValueInputsLevel3Member2021-12-310000874766us-gaap:AvailableforsaleSecuritiesMemberus-gaap:AssetBackedSecuritiesMemberus-gaap:FixedMaturitiesMemberus-gaap:FairValueMeasurementsRecurringMemberus-gaap:FairValueInputsLevel3Member2022-03-310000874766us-gaap:AvailableforsaleSecuritiesMemberus-gaap:AssetBackedSecuritiesMemberus-gaap:FixedMaturitiesMemberus-gaap:FairValueMeasurementsRecurringMemberus-gaap:FairValueInputsLevel3Member2022-04-012022-06-300000874766us-gaap:AvailableforsaleSecuritiesMemberus-gaap:AssetBackedSecuritiesMemberus-gaap:FixedMaturitiesMemberus-gaap:FairValueMeasurementsRecurringMemberus-gaap:FairValueInputsLevel3Member2022-06-300000874766us-gaap:AvailableforsaleSecuritiesMemberus-gaap:CollateralizedLoanObligationsMemberus-gaap:FixedMaturitiesMemberus-gaap:FairValueMeasurementsRecurringMemberus-gaap:FairValueInputsLevel3Member2022-03-310000874766us-gaap:AvailableforsaleSecuritiesMemberus-gaap:CollateralizedLoanObligationsMemberus-gaap:FixedMaturitiesMemberus-gaap:FairValueMeasurementsRecurringMemberus-gaap:FairValueInputsLevel3Member2022-04-012022-06-300000874766us-gaap:AvailableforsaleSecuritiesMemberus-gaap:CollateralizedLoanObligationsMemberus-gaap:FixedMaturitiesMemberus-gaap:FairValueMeasurementsRecurringMemberus-gaap:FairValueInputsLevel3Member2022-06-300000874766us-gaap:AvailableforsaleSecuritiesMemberus-gaap:FixedMaturitiesMemberus-gaap:CommercialMortgageBackedSecuritiesMemberus-gaap:FairValueMeasurementsRecurringMemberus-gaap:FairValueInputsLevel3Member2022-03-310000874766us-gaap:AvailableforsaleSecuritiesMemberus-gaap:FixedMaturitiesMemberus-gaap:CommercialMortgageBackedSecuritiesMemberus-gaap:FairValueMeasurementsRecurringMemberus-gaap:FairValueInputsLevel3Member2022-04-012022-06-300000874766us-gaap:AvailableforsaleSecuritiesMemberus-gaap:FixedMaturitiesMemberus-gaap:CommercialMortgageBackedSecuritiesMemberus-gaap:FairValueMeasurementsRecurringMemberus-gaap:FairValueInputsLevel3Member2022-06-300000874766us-gaap:AvailableforsaleSecuritiesMemberus-gaap:CorporateDebtSecuritiesMemberus-gaap:FixedMaturitiesMemberus-gaap:FairValueMeasurementsRecurringMemberus-gaap:FairValueInputsLevel3Member2022-03-310000874766us-gaap:AvailableforsaleSecuritiesMemberus-gaap:CorporateDebtSecuritiesMemberus-gaap:FixedMaturitiesMemberus-gaap:FairValueMeasurementsRecurringMemberus-gaap:FairValueInputsLevel3Member2022-04-012022-06-300000874766us-gaap:AvailableforsaleSecuritiesMemberus-gaap:CorporateDebtSecuritiesMemberus-gaap:FixedMaturitiesMemberus-gaap:FairValueMeasurementsRecurringMemberus-gaap:FairValueInputsLevel3Member2022-06-300000874766us-gaap:AvailableforsaleSecuritiesMemberus-gaap:ForeignGovernmentDebtSecuritiesMemberus-gaap:FixedMaturitiesMemberus-gaap:FairValueMeasurementsRecurringMemberus-gaap:FairValueInputsLevel3Member2022-03-310000874766us-gaap:AvailableforsaleSecuritiesMemberus-gaap:ForeignGovernmentDebtSecuritiesMemberus-gaap:FixedMaturitiesMemberus-gaap:FairValueMeasurementsRecurringMemberus-gaap:FairValueInputsLevel3Member2022-04-012022-06-300000874766us-gaap:AvailableforsaleSecuritiesMemberus-gaap:ForeignGovernmentDebtSecuritiesMemberus-gaap:FixedMaturitiesMemberus-gaap:FairValueMeasurementsRecurringMemberus-gaap:FairValueInputsLevel3Member2022-06-300000874766us-gaap:AvailableforsaleSecuritiesMemberus-gaap:ResidentialMortgageBackedSecuritiesMemberus-gaap:FixedMaturitiesMemberus-gaap:FairValueMeasurementsRecurringMemberus-gaap:FairValueInputsLevel3Member2022-03-310000874766us-gaap:AvailableforsaleSecuritiesMemberus-gaap:ResidentialMortgageBackedSecuritiesMemberus-gaap:FixedMaturitiesMemberus-gaap:FairValueMeasurementsRecurringMemberus-gaap:FairValueInputsLevel3Member2022-04-012022-06-300000874766us-gaap:AvailableforsaleSecuritiesMemberus-gaap:ResidentialMortgageBackedSecuritiesMemberus-gaap:FixedMaturitiesMemberus-gaap:FairValueMeasurementsRecurringMemberus-gaap:FairValueInputsLevel3Member2022-06-300000874766us-gaap:AvailableforsaleSecuritiesMemberus-gaap:FixedMaturitiesMemberus-gaap:FairValueInputsLevel3Memberus-gaap:FairValueMeasurementsRecurringMember2022-03-310000874766us-gaap:AvailableforsaleSecuritiesMemberus-gaap:FixedMaturitiesMemberus-gaap:FairValueInputsLevel3Memberus-gaap:FairValueMeasurementsRecurringMember2022-04-012022-06-300000874766us-gaap:AvailableforsaleSecuritiesMemberus-gaap:FixedMaturitiesMemberus-gaap:FairValueInputsLevel3Memberus-gaap:FairValueMeasurementsRecurringMember2022-06-300000874766us-gaap:CollateralizedLoanObligationsMemberus-gaap:FixedMaturitiesMemberus-gaap:FairValueOptionOtherEligibleItemsMemberus-gaap:FairValueMeasurementsRecurringMemberus-gaap:FairValueInputsLevel3Member2022-03-310000874766us-gaap:CollateralizedLoanObligationsMemberus-gaap:FixedMaturitiesMemberus-gaap:FairValueOptionOtherEligibleItemsMemberus-gaap:FairValueMeasurementsRecurringMemberus-gaap:FairValueInputsLevel3Member2022-04-012022-06-300000874766us-gaap:CollateralizedLoanObligationsMemberus-gaap:FixedMaturitiesMemberus-gaap:FairValueOptionOtherEligibleItemsMemberus-gaap:FairValueMeasurementsRecurringMemberus-gaap:FairValueInputsLevel3Member2022-06-300000874766us-gaap:FairValueInputsLevel3Memberus-gaap:FairValueMeasurementsRecurringMemberus-gaap:EquitySecuritiesMember2022-03-310000874766us-gaap:FairValueInputsLevel3Memberus-gaap:FairValueMeasurementsRecurringMemberus-gaap:EquitySecuritiesMember2022-04-012022-06-300000874766us-gaap:FairValueInputsLevel3Memberus-gaap:FairValueMeasurementsRecurringMemberus-gaap:EquitySecuritiesMember2022-06-300000874766us-gaap:ShortTermInvestmentsMemberus-gaap:FairValueInputsLevel3Memberus-gaap:FairValueMeasurementsRecurringMember2022-03-310000874766us-gaap:ShortTermInvestmentsMemberus-gaap:FairValueInputsLevel3Memberus-gaap:FairValueMeasurementsRecurringMember2022-04-012022-06-300000874766us-gaap:ShortTermInvestmentsMemberus-gaap:FairValueInputsLevel3Memberus-gaap:FairValueMeasurementsRecurringMember2022-06-300000874766us-gaap:FairValueInputsLevel3Memberus-gaap:FairValueMeasurementsRecurringMember2022-03-310000874766us-gaap:FairValueInputsLevel3Memberus-gaap:FairValueMeasurementsRecurringMember2022-04-012022-06-300000874766us-gaap:FairValueInputsLevel3Memberus-gaap:FairValueMeasurementsRecurringMember2022-06-300000874766us-gaap:AvailableforsaleSecuritiesMemberus-gaap:AssetBackedSecuritiesMemberus-gaap:FixedMaturitiesMemberus-gaap:FairValueMeasurementsRecurringMemberus-gaap:FairValueInputsLevel3Member2021-12-310000874766us-gaap:AvailableforsaleSecuritiesMemberus-gaap:AssetBackedSecuritiesMemberus-gaap:FixedMaturitiesMemberus-gaap:FairValueMeasurementsRecurringMemberus-gaap:FairValueInputsLevel3Member2022-01-012022-06-300000874766us-gaap:AvailableforsaleSecuritiesMemberus-gaap:CollateralizedLoanObligationsMemberus-gaap:FixedMaturitiesMemberus-gaap:FairValueMeasurementsRecurringMemberus-gaap:FairValueInputsLevel3Member2021-12-310000874766us-gaap:AvailableforsaleSecuritiesMemberus-gaap:CollateralizedLoanObligationsMemberus-gaap:FixedMaturitiesMemberus-gaap:FairValueMeasurementsRecurringMemberus-gaap:FairValueInputsLevel3Member2022-01-012022-06-300000874766us-gaap:AvailableforsaleSecuritiesMemberus-gaap:FixedMaturitiesMemberus-gaap:CommercialMortgageBackedSecuritiesMemberus-gaap:FairValueMeasurementsRecurringMemberus-gaap:FairValueInputsLevel3Member2021-12-310000874766us-gaap:AvailableforsaleSecuritiesMemberus-gaap:FixedMaturitiesMemberus-gaap:CommercialMortgageBackedSecuritiesMemberus-gaap:FairValueMeasurementsRecurringMemberus-gaap:FairValueInputsLevel3Member2022-01-012022-06-300000874766us-gaap:AvailableforsaleSecuritiesMemberus-gaap:CorporateDebtSecuritiesMemberus-gaap:FixedMaturitiesMemberus-gaap:FairValueMeasurementsRecurringMemberus-gaap:FairValueInputsLevel3Member2021-12-310000874766us-gaap:AvailableforsaleSecuritiesMemberus-gaap:CorporateDebtSecuritiesMemberus-gaap:FixedMaturitiesMemberus-gaap:FairValueMeasurementsRecurringMemberus-gaap:FairValueInputsLevel3Member2022-01-012022-06-300000874766us-gaap:AvailableforsaleSecuritiesMemberus-gaap:ForeignGovernmentDebtSecuritiesMemberus-gaap:FixedMaturitiesMemberus-gaap:FairValueMeasurementsRecurringMemberus-gaap:FairValueInputsLevel3Member2021-12-310000874766us-gaap:AvailableforsaleSecuritiesMemberus-gaap:ForeignGovernmentDebtSecuritiesMemberus-gaap:FixedMaturitiesMemberus-gaap:FairValueMeasurementsRecurringMemberus-gaap:FairValueInputsLevel3Member2022-01-012022-06-300000874766us-gaap:AvailableforsaleSecuritiesMemberus-gaap:ResidentialMortgageBackedSecuritiesMemberus-gaap:FixedMaturitiesMemberus-gaap:FairValueMeasurementsRecurringMemberus-gaap:FairValueInputsLevel3Member2021-12-310000874766us-gaap:AvailableforsaleSecuritiesMemberus-gaap:ResidentialMortgageBackedSecuritiesMemberus-gaap:FixedMaturitiesMemberus-gaap:FairValueMeasurementsRecurringMemberus-gaap:FairValueInputsLevel3Member2022-01-012022-06-300000874766us-gaap:AvailableforsaleSecuritiesMemberus-gaap:FixedMaturitiesMemberus-gaap:FairValueInputsLevel3Memberus-gaap:FairValueMeasurementsRecurringMember2021-12-310000874766us-gaap:AvailableforsaleSecuritiesMemberus-gaap:FixedMaturitiesMemberus-gaap:FairValueInputsLevel3Memberus-gaap:FairValueMeasurementsRecurringMember2022-01-012022-06-300000874766us-gaap:CollateralizedLoanObligationsMemberus-gaap:FixedMaturitiesMemberus-gaap:FairValueOptionOtherEligibleItemsMemberus-gaap:FairValueMeasurementsRecurringMemberus-gaap:FairValueInputsLevel3Member2021-12-310000874766us-gaap:CollateralizedLoanObligationsMemberus-gaap:FixedMaturitiesMemberus-gaap:FairValueOptionOtherEligibleItemsMemberus-gaap:FairValueMeasurementsRecurringMemberus-gaap:FairValueInputsLevel3Member2022-01-012022-06-300000874766us-gaap:FairValueInputsLevel3Memberus-gaap:FairValueMeasurementsRecurringMemberus-gaap:EquitySecuritiesMember2021-12-310000874766us-gaap:FairValueInputsLevel3Memberus-gaap:FairValueMeasurementsRecurringMemberus-gaap:EquitySecuritiesMember2022-01-012022-06-300000874766us-gaap:ShortTermInvestmentsMemberus-gaap:FairValueInputsLevel3Memberus-gaap:FairValueMeasurementsRecurringMember2021-12-310000874766us-gaap:ShortTermInvestmentsMemberus-gaap:FairValueInputsLevel3Memberus-gaap:FairValueMeasurementsRecurringMember2022-01-012022-06-300000874766us-gaap:FairValueInputsLevel3Memberus-gaap:FairValueMeasurementsRecurringMember2021-12-310000874766us-gaap:FairValueInputsLevel3Memberus-gaap:FairValueMeasurementsRecurringMember2022-01-012022-06-300000874766us-gaap:AvailableforsaleSecuritiesMemberus-gaap:AssetBackedSecuritiesMemberus-gaap:FixedMaturitiesMemberus-gaap:FairValueMeasurementsRecurringMemberus-gaap:FairValueInputsLevel3Member2021-03-310000874766us-gaap:AvailableforsaleSecuritiesMemberus-gaap:AssetBackedSecuritiesMemberus-gaap:FixedMaturitiesMemberus-gaap:FairValueMeasurementsRecurringMemberus-gaap:FairValueInputsLevel3Member2021-04-012021-06-300000874766us-gaap:AvailableforsaleSecuritiesMemberus-gaap:AssetBackedSecuritiesMemberus-gaap:FixedMaturitiesMemberus-gaap:FairValueMeasurementsRecurringMemberus-gaap:FairValueInputsLevel3Member2021-06-300000874766us-gaap:AvailableforsaleSecuritiesMemberus-gaap:CollateralizedLoanObligationsMemberus-gaap:FixedMaturitiesMemberus-gaap:FairValueMeasurementsRecurringMemberus-gaap:FairValueInputsLevel3Member2021-03-310000874766us-gaap:AvailableforsaleSecuritiesMemberus-gaap:CollateralizedLoanObligationsMemberus-gaap:FixedMaturitiesMemberus-gaap:FairValueMeasurementsRecurringMemberus-gaap:FairValueInputsLevel3Member2021-04-012021-06-300000874766us-gaap:AvailableforsaleSecuritiesMemberus-gaap:CollateralizedLoanObligationsMemberus-gaap:FixedMaturitiesMemberus-gaap:FairValueMeasurementsRecurringMemberus-gaap:FairValueInputsLevel3Member2021-06-300000874766us-gaap:AvailableforsaleSecuritiesMemberus-gaap:FixedMaturitiesMemberus-gaap:CommercialMortgageBackedSecuritiesMemberus-gaap:FairValueMeasurementsRecurringMemberus-gaap:FairValueInputsLevel3Member2021-03-310000874766us-gaap:AvailableforsaleSecuritiesMemberus-gaap:FixedMaturitiesMemberus-gaap:CommercialMortgageBackedSecuritiesMemberus-gaap:FairValueMeasurementsRecurringMemberus-gaap:FairValueInputsLevel3Member2021-04-012021-06-300000874766us-gaap:AvailableforsaleSecuritiesMemberus-gaap:FixedMaturitiesMemberus-gaap:CommercialMortgageBackedSecuritiesMemberus-gaap:FairValueMeasurementsRecurringMemberus-gaap:FairValueInputsLevel3Member2021-06-300000874766us-gaap:AvailableforsaleSecuritiesMemberus-gaap:CorporateDebtSecuritiesMemberus-gaap:FixedMaturitiesMemberus-gaap:FairValueMeasurementsRecurringMemberus-gaap:FairValueInputsLevel3Member2021-03-310000874766us-gaap:AvailableforsaleSecuritiesMemberus-gaap:CorporateDebtSecuritiesMemberus-gaap:FixedMaturitiesMemberus-gaap:FairValueMeasurementsRecurringMemberus-gaap:FairValueInputsLevel3Member2021-04-012021-06-300000874766us-gaap:AvailableforsaleSecuritiesMemberus-gaap:CorporateDebtSecuritiesMemberus-gaap:FixedMaturitiesMemberus-gaap:FairValueMeasurementsRecurringMemberus-gaap:FairValueInputsLevel3Member2021-06-300000874766us-gaap:AvailableforsaleSecuritiesMemberus-gaap:ResidentialMortgageBackedSecuritiesMemberus-gaap:FixedMaturitiesMemberus-gaap:FairValueMeasurementsRecurringMemberus-gaap:FairValueInputsLevel3Member2021-03-310000874766us-gaap:AvailableforsaleSecuritiesMemberus-gaap:ResidentialMortgageBackedSecuritiesMemberus-gaap:FixedMaturitiesMemberus-gaap:FairValueMeasurementsRecurringMemberus-gaap:FairValueInputsLevel3Member2021-04-012021-06-300000874766us-gaap:AvailableforsaleSecuritiesMemberus-gaap:ResidentialMortgageBackedSecuritiesMemberus-gaap:FixedMaturitiesMemberus-gaap:FairValueMeasurementsRecurringMemberus-gaap:FairValueInputsLevel3Member2021-06-300000874766us-gaap:AvailableforsaleSecuritiesMemberus-gaap:FixedMaturitiesMemberus-gaap:FairValueInputsLevel3Memberus-gaap:FairValueMeasurementsRecurringMember2021-03-310000874766us-gaap:AvailableforsaleSecuritiesMemberus-gaap:FixedMaturitiesMemberus-gaap:FairValueInputsLevel3Memberus-gaap:FairValueMeasurementsRecurringMember2021-04-012021-06-300000874766us-gaap:AvailableforsaleSecuritiesMemberus-gaap:FixedMaturitiesMemberus-gaap:FairValueInputsLevel3Memberus-gaap:FairValueMeasurementsRecurringMember2021-06-300000874766us-gaap:FairValueInputsLevel3Memberus-gaap:FairValueMeasurementsRecurringMemberus-gaap:EquitySecuritiesMember2021-03-310000874766us-gaap:FairValueInputsLevel3Memberus-gaap:FairValueMeasurementsRecurringMemberus-gaap:EquitySecuritiesMember2021-04-012021-06-300000874766us-gaap:FairValueInputsLevel3Memberus-gaap:FairValueMeasurementsRecurringMemberus-gaap:EquitySecuritiesMember2021-06-300000874766us-gaap:ShortTermInvestmentsMemberus-gaap:FairValueInputsLevel3Memberus-gaap:FairValueMeasurementsRecurringMember2021-03-310000874766us-gaap:ShortTermInvestmentsMemberus-gaap:FairValueInputsLevel3Memberus-gaap:FairValueMeasurementsRecurringMember2021-04-012021-06-300000874766us-gaap:ShortTermInvestmentsMemberus-gaap:FairValueInputsLevel3Memberus-gaap:FairValueMeasurementsRecurringMember2021-06-300000874766us-gaap:FairValueInputsLevel3Memberus-gaap:FairValueMeasurementsRecurringMember2021-03-310000874766us-gaap:FairValueInputsLevel3Memberus-gaap:FairValueMeasurementsRecurringMember2021-04-012021-06-300000874766us-gaap:FairValueInputsLevel3Memberus-gaap:FairValueMeasurementsRecurringMember2021-06-300000874766us-gaap:AvailableforsaleSecuritiesMemberus-gaap:AssetBackedSecuritiesMemberus-gaap:FixedMaturitiesMemberus-gaap:FairValueMeasurementsRecurringMemberus-gaap:FairValueInputsLevel3Member2020-12-310000874766us-gaap:AvailableforsaleSecuritiesMemberus-gaap:AssetBackedSecuritiesMemberus-gaap:FixedMaturitiesMemberus-gaap:FairValueMeasurementsRecurringMemberus-gaap:FairValueInputsLevel3Member2021-01-012021-06-300000874766us-gaap:AvailableforsaleSecuritiesMemberus-gaap:CollateralizedLoanObligationsMemberus-gaap:FixedMaturitiesMemberus-gaap:FairValueMeasurementsRecurringMemberus-gaap:FairValueInputsLevel3Member2020-12-310000874766us-gaap:AvailableforsaleSecuritiesMemberus-gaap:CollateralizedLoanObligationsMemberus-gaap:FixedMaturitiesMemberus-gaap:FairValueMeasurementsRecurringMemberus-gaap:FairValueInputsLevel3Member2021-01-012021-06-300000874766us-gaap:AvailableforsaleSecuritiesMemberus-gaap:FixedMaturitiesMemberus-gaap:CommercialMortgageBackedSecuritiesMemberus-gaap:FairValueMeasurementsRecurringMemberus-gaap:FairValueInputsLevel3Member2020-12-310000874766us-gaap:AvailableforsaleSecuritiesMemberus-gaap:FixedMaturitiesMemberus-gaap:CommercialMortgageBackedSecuritiesMemberus-gaap:FairValueMeasurementsRecurringMemberus-gaap:FairValueInputsLevel3Member2021-01-012021-06-300000874766us-gaap:AvailableforsaleSecuritiesMemberus-gaap:CorporateDebtSecuritiesMemberus-gaap:FixedMaturitiesMemberus-gaap:FairValueMeasurementsRecurringMemberus-gaap:FairValueInputsLevel3Member2020-12-310000874766us-gaap:AvailableforsaleSecuritiesMemberus-gaap:CorporateDebtSecuritiesMemberus-gaap:FixedMaturitiesMemberus-gaap:FairValueMeasurementsRecurringMemberus-gaap:FairValueInputsLevel3Member2021-01-012021-06-300000874766us-gaap:AvailableforsaleSecuritiesMemberus-gaap:ForeignGovernmentDebtSecuritiesMemberus-gaap:FixedMaturitiesMemberus-gaap:FairValueMeasurementsRecurringMemberus-gaap:FairValueInputsLevel3Member2020-12-310000874766us-gaap:AvailableforsaleSecuritiesMemberus-gaap:ForeignGovernmentDebtSecuritiesMemberus-gaap:FixedMaturitiesMemberus-gaap:FairValueMeasurementsRecurringMemberus-gaap:FairValueInputsLevel3Member2021-01-012021-06-300000874766us-gaap:AvailableforsaleSecuritiesMemberus-gaap:ForeignGovernmentDebtSecuritiesMemberus-gaap:FixedMaturitiesMemberus-gaap:FairValueMeasurementsRecurringMemberus-gaap:FairValueInputsLevel3Member2021-06-300000874766us-gaap:AvailableforsaleSecuritiesMemberus-gaap:ResidentialMortgageBackedSecuritiesMemberus-gaap:FixedMaturitiesMemberus-gaap:FairValueMeasurementsRecurringMemberus-gaap:FairValueInputsLevel3Member2020-12-310000874766us-gaap:AvailableforsaleSecuritiesMemberus-gaap:ResidentialMortgageBackedSecuritiesMemberus-gaap:FixedMaturitiesMemberus-gaap:FairValueMeasurementsRecurringMemberus-gaap:FairValueInputsLevel3Member2021-01-012021-06-300000874766us-gaap:AvailableforsaleSecuritiesMemberus-gaap:FixedMaturitiesMemberus-gaap:FairValueInputsLevel3Memberus-gaap:FairValueMeasurementsRecurringMember2020-12-310000874766us-gaap:AvailableforsaleSecuritiesMemberus-gaap:FixedMaturitiesMemberus-gaap:FairValueInputsLevel3Memberus-gaap:FairValueMeasurementsRecurringMember2021-01-012021-06-300000874766us-gaap:FairValueInputsLevel3Memberus-gaap:FairValueMeasurementsRecurringMemberus-gaap:EquitySecuritiesMember2020-12-310000874766us-gaap:FairValueInputsLevel3Memberus-gaap:FairValueMeasurementsRecurringMemberus-gaap:EquitySecuritiesMember2021-01-012021-06-300000874766us-gaap:ShortTermInvestmentsMemberus-gaap:FairValueInputsLevel3Memberus-gaap:FairValueMeasurementsRecurringMember2020-12-310000874766us-gaap:ShortTermInvestmentsMemberus-gaap:FairValueInputsLevel3Memberus-gaap:FairValueMeasurementsRecurringMember2021-01-012021-06-300000874766us-gaap:FairValueInputsLevel3Memberus-gaap:FairValueMeasurementsRecurringMember2020-12-310000874766us-gaap:FairValueInputsLevel3Memberus-gaap:FairValueMeasurementsRecurringMember2021-01-012021-06-300000874766us-gaap:AvailableforsaleSecuritiesMemberus-gaap:CollateralizedLoanObligationsMemberus-gaap:FixedMaturitiesMemberus-gaap:FairValueMeasurementsRecurringMemberus-gaap:FairValueInputsLevel3Memberus-gaap:OtherComprehensiveIncomeMember2022-04-012022-06-300000874766us-gaap:AvailableforsaleSecuritiesMemberus-gaap:CollateralizedLoanObligationsMemberus-gaap:FixedMaturitiesMemberus-gaap:FairValueMeasurementsRecurringMemberus-gaap:FairValueInputsLevel3Memberus-gaap:OtherComprehensiveIncomeMember2021-04-012021-06-300000874766us-gaap:AvailableforsaleSecuritiesMemberus-gaap:CollateralizedLoanObligationsMemberus-gaap:FixedMaturitiesMemberus-gaap:FairValueMeasurementsRecurringMemberus-gaap:FairValueInputsLevel3Memberus-gaap:OtherComprehensiveIncomeMember2022-01-012022-06-300000874766us-gaap:AvailableforsaleSecuritiesMemberus-gaap:CollateralizedLoanObligationsMemberus-gaap:FixedMaturitiesMemberus-gaap:FairValueMeasurementsRecurringMemberus-gaap:FairValueInputsLevel3Memberus-gaap:OtherComprehensiveIncomeMember2021-01-012021-06-300000874766us-gaap:AvailableforsaleSecuritiesMemberus-gaap:FixedMaturitiesMemberus-gaap:CommercialMortgageBackedSecuritiesMemberus-gaap:FairValueMeasurementsRecurringMemberus-gaap:FairValueInputsLevel3Memberus-gaap:OtherComprehensiveIncomeMember2022-04-012022-06-300000874766us-gaap:AvailableforsaleSecuritiesMemberus-gaap:FixedMaturitiesMemberus-gaap:CommercialMortgageBackedSecuritiesMemberus-gaap:FairValueMeasurementsRecurringMemberus-gaap:FairValueInputsLevel3Memberus-gaap:OtherComprehensiveIncomeMember2021-04-012021-06-300000874766us-gaap:AvailableforsaleSecuritiesMemberus-gaap:FixedMaturitiesMemberus-gaap:CommercialMortgageBackedSecuritiesMemberus-gaap:FairValueMeasurementsRecurringMemberus-gaap:FairValueInputsLevel3Memberus-gaap:OtherComprehensiveIncomeMember2022-01-012022-06-300000874766us-gaap:AvailableforsaleSecuritiesMemberus-gaap:FixedMaturitiesMemberus-gaap:CommercialMortgageBackedSecuritiesMemberus-gaap:FairValueMeasurementsRecurringMemberus-gaap:FairValueInputsLevel3Memberus-gaap:OtherComprehensiveIncomeMember2021-01-012021-06-300000874766us-gaap:AvailableforsaleSecuritiesMemberus-gaap:CorporateDebtSecuritiesMemberus-gaap:FixedMaturitiesMemberus-gaap:FairValueMeasurementsRecurringMemberus-gaap:FairValueInputsLevel3Memberus-gaap:OtherComprehensiveIncomeMember2022-04-012022-06-300000874766us-gaap:AvailableforsaleSecuritiesMemberus-gaap:CorporateDebtSecuritiesMemberus-gaap:FixedMaturitiesMemberus-gaap:FairValueMeasurementsRecurringMemberus-gaap:FairValueInputsLevel3Memberus-gaap:OtherComprehensiveIncomeMember2021-04-012021-06-300000874766us-gaap:AvailableforsaleSecuritiesMemberus-gaap:CorporateDebtSecuritiesMemberus-gaap:FixedMaturitiesMemberus-gaap:FairValueMeasurementsRecurringMemberus-gaap:FairValueInputsLevel3Memberus-gaap:OtherComprehensiveIncomeMember2022-01-012022-06-300000874766us-gaap:AvailableforsaleSecuritiesMemberus-gaap:CorporateDebtSecuritiesMemberus-gaap:FixedMaturitiesMemberus-gaap:FairValueMeasurementsRecurringMemberus-gaap:FairValueInputsLevel3Memberus-gaap:OtherComprehensiveIncomeMember2021-01-012021-06-300000874766us-gaap:AvailableforsaleSecuritiesMemberus-gaap:ForeignGovernmentDebtMemberus-gaap:FixedMaturitiesMemberus-gaap:FairValueMeasurementsRecurringMemberus-gaap:FairValueInputsLevel3Member2022-04-012022-06-300000874766us-gaap:AvailableforsaleSecuritiesMemberus-gaap:ForeignGovernmentDebtMemberus-gaap:FixedMaturitiesMemberus-gaap:FairValueMeasurementsRecurringMemberus-gaap:FairValueInputsLevel3Member2021-04-012021-06-300000874766us-gaap:AvailableforsaleSecuritiesMemberus-gaap:ForeignGovernmentDebtMemberus-gaap:FixedMaturitiesMemberus-gaap:FairValueMeasurementsRecurringMemberus-gaap:FairValueInputsLevel3Memberus-gaap:OtherComprehensiveIncomeMember2022-04-012022-06-300000874766us-gaap:AvailableforsaleSecuritiesMemberus-gaap:ForeignGovernmentDebtMemberus-gaap:FixedMaturitiesMemberus-gaap:FairValueMeasurementsRecurringMemberus-gaap:FairValueInputsLevel3Memberus-gaap:OtherComprehensiveIncomeMember2021-04-012021-06-300000874766us-gaap:AvailableforsaleSecuritiesMemberus-gaap:ForeignGovernmentDebtMemberus-gaap:FixedMaturitiesMemberus-gaap:FairValueMeasurementsRecurringMemberus-gaap:FairValueInputsLevel3Member2022-01-012022-06-300000874766us-gaap:AvailableforsaleSecuritiesMemberus-gaap:ForeignGovernmentDebtMemberus-gaap:FixedMaturitiesMemberus-gaap:FairValueMeasurementsRecurringMemberus-gaap:FairValueInputsLevel3Member2021-01-012021-06-300000874766us-gaap:AvailableforsaleSecuritiesMemberus-gaap:ForeignGovernmentDebtMemberus-gaap:FixedMaturitiesMemberus-gaap:FairValueMeasurementsRecurringMemberus-gaap:FairValueInputsLevel3Memberus-gaap:OtherComprehensiveIncomeMember2022-01-012022-06-300000874766us-gaap:AvailableforsaleSecuritiesMemberus-gaap:ForeignGovernmentDebtMemberus-gaap:FixedMaturitiesMemberus-gaap:FairValueMeasurementsRecurringMemberus-gaap:FairValueInputsLevel3Memberus-gaap:OtherComprehensiveIncomeMember2021-01-012021-06-300000874766us-gaap:AvailableforsaleSecuritiesMemberus-gaap:ResidentialMortgageBackedSecuritiesMemberus-gaap:FixedMaturitiesMemberus-gaap:FairValueMeasurementsRecurringMemberus-gaap:FairValueInputsLevel3Memberus-gaap:OtherComprehensiveIncomeMember2022-04-012022-06-300000874766us-gaap:AvailableforsaleSecuritiesMemberus-gaap:ResidentialMortgageBackedSecuritiesMemberus-gaap:FixedMaturitiesMemberus-gaap:FairValueMeasurementsRecurringMemberus-gaap:FairValueInputsLevel3Memberus-gaap:OtherComprehensiveIncomeMember2021-04-012021-06-300000874766us-gaap:AvailableforsaleSecuritiesMemberus-gaap:ResidentialMortgageBackedSecuritiesMemberus-gaap:FixedMaturitiesMemberus-gaap:FairValueMeasurementsRecurringMemberus-gaap:FairValueInputsLevel3Memberus-gaap:OtherComprehensiveIncomeMember2022-01-012022-06-300000874766us-gaap:AvailableforsaleSecuritiesMemberus-gaap:ResidentialMortgageBackedSecuritiesMemberus-gaap:FixedMaturitiesMemberus-gaap:FairValueMeasurementsRecurringMemberus-gaap:FairValueInputsLevel3Memberus-gaap:OtherComprehensiveIncomeMember2021-01-012021-06-300000874766us-gaap:AvailableforsaleSecuritiesMemberus-gaap:FixedMaturitiesMemberus-gaap:FairValueMeasurementsRecurringMemberus-gaap:FairValueInputsLevel3Memberus-gaap:OtherComprehensiveIncomeMember2022-04-012022-06-300000874766us-gaap:AvailableforsaleSecuritiesMemberus-gaap:FixedMaturitiesMemberus-gaap:FairValueMeasurementsRecurringMemberus-gaap:FairValueInputsLevel3Memberus-gaap:OtherComprehensiveIncomeMember2021-04-012021-06-300000874766us-gaap:AvailableforsaleSecuritiesMemberus-gaap:FixedMaturitiesMemberus-gaap:FairValueMeasurementsRecurringMemberus-gaap:FairValueInputsLevel3Memberus-gaap:OtherComprehensiveIncomeMember2022-01-012022-06-300000874766us-gaap:AvailableforsaleSecuritiesMemberus-gaap:FixedMaturitiesMemberus-gaap:FairValueMeasurementsRecurringMemberus-gaap:FairValueInputsLevel3Memberus-gaap:OtherComprehensiveIncomeMember2021-01-012021-06-300000874766us-gaap:CollateralizedLoanObligationsMemberus-gaap:FixedMaturitiesMemberus-gaap:FairValueOptionOtherEligibleItemsMemberus-gaap:FairValueMeasurementsRecurringMemberus-gaap:FairValueInputsLevel3Member2021-04-012021-06-300000874766us-gaap:CollateralizedLoanObligationsMemberus-gaap:FixedMaturitiesMemberus-gaap:FairValueOptionOtherEligibleItemsMemberus-gaap:FairValueMeasurementsRecurringMemberus-gaap:FairValueInputsLevel3Memberus-gaap:OtherComprehensiveIncomeMember2022-04-012022-06-300000874766us-gaap:CollateralizedLoanObligationsMemberus-gaap:FixedMaturitiesMemberus-gaap:FairValueOptionOtherEligibleItemsMemberus-gaap:FairValueMeasurementsRecurringMemberus-gaap:FairValueInputsLevel3Memberus-gaap:OtherComprehensiveIncomeMember2021-04-012021-06-300000874766us-gaap:CollateralizedLoanObligationsMemberus-gaap:FixedMaturitiesMemberus-gaap:FairValueOptionOtherEligibleItemsMemberus-gaap:FairValueMeasurementsRecurringMemberus-gaap:FairValueInputsLevel3Member2021-01-012021-06-300000874766us-gaap:CollateralizedLoanObligationsMemberus-gaap:FixedMaturitiesMemberus-gaap:FairValueOptionOtherEligibleItemsMemberus-gaap:FairValueMeasurementsRecurringMemberus-gaap:FairValueInputsLevel3Memberus-gaap:OtherComprehensiveIncomeMember2022-01-012022-06-300000874766us-gaap:CollateralizedLoanObligationsMemberus-gaap:FixedMaturitiesMemberus-gaap:FairValueOptionOtherEligibleItemsMemberus-gaap:FairValueMeasurementsRecurringMemberus-gaap:FairValueInputsLevel3Memberus-gaap:OtherComprehensiveIncomeMember2021-01-012021-06-300000874766us-gaap:EquitySecuritiesMemberus-gaap:FairValueInputsLevel3Memberus-gaap:FairValueMeasurementsRecurringMember2022-04-012022-06-300000874766us-gaap:EquitySecuritiesMemberus-gaap:FairValueInputsLevel3Memberus-gaap:FairValueMeasurementsRecurringMember2021-04-012021-06-300000874766us-gaap:EquitySecuritiesMemberus-gaap:FairValueInputsLevel3Memberus-gaap:FairValueMeasurementsRecurringMemberus-gaap:OtherComprehensiveIncomeMember2022-04-012022-06-300000874766us-gaap:EquitySecuritiesMemberus-gaap:FairValueInputsLevel3Memberus-gaap:FairValueMeasurementsRecurringMemberus-gaap:OtherComprehensiveIncomeMember2021-04-012021-06-300000874766us-gaap:EquitySecuritiesMemberus-gaap:FairValueInputsLevel3Memberus-gaap:FairValueMeasurementsRecurringMember2022-01-012022-06-300000874766us-gaap:EquitySecuritiesMemberus-gaap:FairValueInputsLevel3Memberus-gaap:FairValueMeasurementsRecurringMember2021-01-012021-06-300000874766us-gaap:EquitySecuritiesMemberus-gaap:FairValueInputsLevel3Memberus-gaap:FairValueMeasurementsRecurringMemberus-gaap:OtherComprehensiveIncomeMember2022-01-012022-06-300000874766us-gaap:EquitySecuritiesMemberus-gaap:FairValueInputsLevel3Memberus-gaap:FairValueMeasurementsRecurringMemberus-gaap:OtherComprehensiveIncomeMember2021-01-012021-06-300000874766us-gaap:FairValueInputsLevel3Memberus-gaap:FairValueMeasurementsRecurringMemberus-gaap:OtherComprehensiveIncomeMember2022-04-012022-06-300000874766us-gaap:FairValueInputsLevel3Memberus-gaap:FairValueMeasurementsRecurringMemberus-gaap:OtherComprehensiveIncomeMember2021-04-012021-06-300000874766us-gaap:FairValueInputsLevel3Memberus-gaap:FairValueMeasurementsRecurringMemberus-gaap:OtherComprehensiveIncomeMember2022-01-012022-06-300000874766us-gaap:FairValueInputsLevel3Memberus-gaap:FairValueMeasurementsRecurringMemberus-gaap:OtherComprehensiveIncomeMember2021-01-012021-06-300000874766us-gaap:CarryingReportedAmountFairValueDisclosureMemberus-gaap:MortgagesMemberus-gaap:FairValueInputsLevel3Member2022-06-300000874766us-gaap:EstimateOfFairValueFairValueDisclosureMemberus-gaap:MortgagesMemberus-gaap:FairValueInputsLevel3Member2022-06-300000874766us-gaap:CarryingReportedAmountFairValueDisclosureMemberus-gaap:MortgagesMemberus-gaap:FairValueInputsLevel3Member2021-12-310000874766us-gaap:EstimateOfFairValueFairValueDisclosureMemberus-gaap:MortgagesMemberus-gaap:FairValueInputsLevel3Member2021-12-310000874766hig:OtherPolicyholderFundsAndBenefitsPayableMemberus-gaap:CarryingReportedAmountFairValueDisclosureMemberus-gaap:FairValueInputsLevel3Member2022-06-300000874766hig:OtherPolicyholderFundsAndBenefitsPayableMemberus-gaap:EstimateOfFairValueFairValueDisclosureMemberus-gaap:FairValueInputsLevel3Member2022-06-300000874766hig:OtherPolicyholderFundsAndBenefitsPayableMemberus-gaap:CarryingReportedAmountFairValueDisclosureMemberus-gaap:FairValueInputsLevel3Member2021-12-310000874766hig:OtherPolicyholderFundsAndBenefitsPayableMemberus-gaap:EstimateOfFairValueFairValueDisclosureMemberus-gaap:FairValueInputsLevel3Member2021-12-310000874766us-gaap:CarryingReportedAmountFairValueDisclosureMemberus-gaap:SeniorNotesMemberus-gaap:FairValueInputsLevel2Member2022-06-300000874766us-gaap:EstimateOfFairValueFairValueDisclosureMemberus-gaap:SeniorNotesMemberus-gaap:FairValueInputsLevel2Member2022-06-300000874766us-gaap:CarryingReportedAmountFairValueDisclosureMemberus-gaap:SeniorNotesMemberus-gaap:FairValueInputsLevel2Member2021-12-310000874766us-gaap:EstimateOfFairValueFairValueDisclosureMemberus-gaap:SeniorNotesMemberus-gaap:FairValueInputsLevel2Member2021-12-310000874766us-gaap:CarryingReportedAmountFairValueDisclosureMemberus-gaap:JuniorSubordinatedDebtMemberus-gaap:FairValueInputsLevel2Member2022-06-300000874766us-gaap:EstimateOfFairValueFairValueDisclosureMemberus-gaap:JuniorSubordinatedDebtMemberus-gaap:FairValueInputsLevel2Member2022-06-300000874766us-gaap:CarryingReportedAmountFairValueDisclosureMemberus-gaap:JuniorSubordinatedDebtMemberus-gaap:FairValueInputsLevel2Member2021-12-310000874766us-gaap:EstimateOfFairValueFairValueDisclosureMemberus-gaap:JuniorSubordinatedDebtMemberus-gaap:FairValueInputsLevel2Member2021-12-310000874766us-gaap:FixedMaturitiesMember2022-04-012022-06-300000874766us-gaap:FixedMaturitiesMember2021-04-012021-06-300000874766us-gaap:FixedMaturitiesMember2022-01-012022-06-300000874766us-gaap:FixedMaturitiesMember2021-01-012021-06-300000874766us-gaap:EquitySecuritiesMember2022-04-012022-06-300000874766us-gaap:EquitySecuritiesMember2021-04-012021-06-300000874766us-gaap:EquitySecuritiesMember2022-01-012022-06-300000874766us-gaap:EquitySecuritiesMember2021-01-012021-06-300000874766us-gaap:MortgagesMember2022-04-012022-06-300000874766us-gaap:MortgagesMember2021-04-012021-06-300000874766us-gaap:MortgagesMember2022-01-012022-06-300000874766us-gaap:MortgagesMember2021-01-012021-06-300000874766us-gaap:OtherInvestmentsMember2022-04-012022-06-300000874766us-gaap:OtherInvestmentsMember2021-04-012021-06-300000874766us-gaap:OtherInvestmentsMember2022-01-012022-06-300000874766us-gaap:OtherInvestmentsMember2021-01-012021-06-300000874766us-gaap:NondesignatedMember2022-04-012022-06-300000874766us-gaap:NondesignatedMember2022-01-012022-06-300000874766us-gaap:NondesignatedMember2021-04-012021-06-300000874766us-gaap:NondesignatedMember2021-01-012021-06-300000874766us-gaap:DebtSecuritiesMember2022-04-012022-06-300000874766us-gaap:DebtSecuritiesMember2022-01-012022-06-300000874766us-gaap:DebtSecuritiesMember2021-04-012021-06-300000874766us-gaap:DebtSecuritiesMember2021-01-012021-06-300000874766us-gaap:DebtSecuritiesMember2022-06-300000874766us-gaap:DebtSecuritiesMember2021-12-310000874766us-gaap:MortgagesMember2022-06-300000874766us-gaap:MortgagesMember2021-12-310000874766us-gaap:CorporateDebtSecuritiesMember2022-03-310000874766us-gaap:ForeignGovernmentDebtSecuritiesMember2022-03-310000874766us-gaap:CommercialMortgageBackedSecuritiesMember2022-03-3100008747662022-03-310000874766us-gaap:CorporateDebtSecuritiesMember2021-03-3100008747662021-03-310000874766us-gaap:CorporateDebtSecuritiesMember2022-04-012022-06-300000874766us-gaap:ForeignGovernmentDebtSecuritiesMember2022-04-012022-06-300000874766us-gaap:CommercialMortgageBackedSecuritiesMember2022-04-012022-06-300000874766us-gaap:CorporateDebtSecuritiesMember2021-04-012021-06-300000874766us-gaap:CorporateDebtSecuritiesMember2021-06-300000874766us-gaap:CorporateDebtSecuritiesMember2020-12-310000874766us-gaap:CorporateDebtSecuritiesMember2022-01-012022-06-300000874766us-gaap:ForeignGovernmentDebtSecuritiesMember2022-01-012022-06-300000874766us-gaap:CommercialMortgageBackedSecuritiesMember2022-01-012022-06-300000874766us-gaap:CorporateDebtSecuritiesMember2021-01-012021-06-300000874766us-gaap:AvailableforsaleSecuritiesMember2022-06-300000874766us-gaap:AvailableforsaleSecuritiesMember2021-12-310000874766us-gaap:CommercialLoanMember2022-03-310000874766us-gaap:CommercialLoanMember2021-03-310000874766us-gaap:CommercialLoanMember2020-12-310000874766us-gaap:CommercialLoanMember2022-04-012022-06-300000874766us-gaap:CommercialLoanMember2021-04-012021-06-300000874766us-gaap:CommercialLoanMember2022-01-012022-06-300000874766us-gaap:CommercialLoanMember2021-01-012021-06-300000874766us-gaap:CommercialLoanMember2021-06-300000874766hig:LTVBetween65to80PercentMemberus-gaap:CommercialLoanMemberhig:AmortizedCostMember2022-06-300000874766hig:LTVBetween65to80PercentMemberus-gaap:CommercialLoanMemberhig:OriginatedInCurrentFiscalYearMember2022-06-300000874766hig:LTVBetween65to80PercentMemberus-gaap:CommercialLoanMemberhig:OriginatedInFiscalYearBeforeLatestFiscalYearMember2022-06-300000874766hig:LTVBetween65to80PercentMemberus-gaap:CommercialLoanMemberhig:OriginatedTwoYearsBeforeLatestFiscalYearMember2022-06-300000874766hig:LTVBetween65to80PercentMemberus-gaap:CommercialLoanMemberhig:OriginatedThreeYearsBeforeLatestFiscalYearMember2022-06-300000874766hig:LTVBetween65to80PercentMemberus-gaap:CommercialLoanMemberhig:OriginatedFourYearsBeforeLatestFiscalYearMember2022-06-300000874766hig:OriginatedFiveOrMoreYearsBeforeLatestFiscalYearMemberhig:LTVBetween65to80PercentMemberus-gaap:CommercialLoanMember2022-06-300000874766hig:LTVBetween65to80PercentMemberus-gaap:CommercialLoanMember2022-06-300000874766us-gaap:CommercialLoanMemberhig:LTVLessthan65PercentMemberhig:AmortizedCostMember2022-06-300000874766us-gaap:CommercialLoanMemberhig:LTVLessthan65PercentMemberhig:OriginatedInCurrentFiscalYearMember2022-06-300000874766us-gaap:CommercialLoanMemberhig:LTVLessthan65PercentMemberhig:OriginatedInFiscalYearBeforeLatestFiscalYearMember2022-06-300000874766us-gaap:CommercialLoanMemberhig:LTVLessthan65PercentMemberhig:OriginatedTwoYearsBeforeLatestFiscalYearMember2022-06-300000874766us-gaap:CommercialLoanMemberhig:LTVLessthan65PercentMemberhig:OriginatedThreeYearsBeforeLatestFiscalYearMember2022-06-300000874766us-gaap:CommercialLoanMemberhig:LTVLessthan65PercentMemberhig:OriginatedFourYearsBeforeLatestFiscalYearMember2022-06-300000874766hig:OriginatedFiveOrMoreYearsBeforeLatestFiscalYearMemberus-gaap:CommercialLoanMemberhig:LTVLessthan65PercentMember2022-06-300000874766us-gaap:CommercialLoanMemberhig:LTVLessthan65PercentMember2022-06-300000874766us-gaap:CommercialLoanMemberhig:AmortizedCostMember2022-06-300000874766us-gaap:CommercialLoanMemberhig:OriginatedInCurrentFiscalYearMember2022-06-300000874766us-gaap:CommercialLoanMemberhig:OriginatedInFiscalYearBeforeLatestFiscalYearMember2022-06-300000874766us-gaap:CommercialLoanMemberhig:OriginatedTwoYearsBeforeLatestFiscalYearMember2022-06-300000874766us-gaap:CommercialLoanMemberhig:OriginatedThreeYearsBeforeLatestFiscalYearMember2022-06-300000874766us-gaap:CommercialLoanMemberhig:OriginatedFourYearsBeforeLatestFiscalYearMember2022-06-300000874766hig:OriginatedFiveOrMoreYearsBeforeLatestFiscalYearMemberus-gaap:CommercialLoanMember2022-06-300000874766hig:LTVBetween65to80PercentMemberus-gaap:CommercialLoanMemberhig:AmortizedCostMember2021-12-310000874766hig:LTVBetween65to80PercentMemberus-gaap:CommercialLoanMemberhig:OriginatedInCurrentFiscalYearMember2021-12-310000874766hig:LTVBetween65to80PercentMemberus-gaap:CommercialLoanMemberhig:OriginatedInFiscalYearBeforeLatestFiscalYearMember2021-12-310000874766hig:LTVBetween65to80PercentMemberus-gaap:CommercialLoanMemberhig:OriginatedTwoYearsBeforeLatestFiscalYearMember2021-12-310000874766hig:LTVBetween65to80PercentMemberus-gaap:CommercialLoanMemberhig:OriginatedThreeYearsBeforeLatestFiscalYearMember2021-12-310000874766hig:LTVBetween65to80PercentMemberus-gaap:CommercialLoanMemberhig:OriginatedFourYearsBeforeLatestFiscalYearMember2021-12-310000874766hig:OriginatedFiveOrMoreYearsBeforeLatestFiscalYearMemberhig:LTVBetween65to80PercentMemberus-gaap:CommercialLoanMember2021-12-310000874766hig:LTVBetween65to80PercentMemberus-gaap:CommercialLoanMember2021-12-310000874766us-gaap:CommercialLoanMemberhig:LTVLessthan65PercentMemberhig:AmortizedCostMember2021-12-310000874766us-gaap:CommercialLoanMemberhig:LTVLessthan65PercentMemberhig:OriginatedInCurrentFiscalYearMember2021-12-310000874766us-gaap:CommercialLoanMemberhig:LTVLessthan65PercentMemberhig:OriginatedInFiscalYearBeforeLatestFiscalYearMember2021-12-310000874766us-gaap:CommercialLoanMemberhig:LTVLessthan65PercentMemberhig:OriginatedTwoYearsBeforeLatestFiscalYearMember2021-12-310000874766us-gaap:CommercialLoanMemberhig:LTVLessthan65PercentMemberhig:OriginatedThreeYearsBeforeLatestFiscalYearMember2021-12-310000874766us-gaap:CommercialLoanMemberhig:LTVLessthan65PercentMemberhig:OriginatedFourYearsBeforeLatestFiscalYearMember2021-12-310000874766hig:OriginatedFiveOrMoreYearsBeforeLatestFiscalYearMemberus-gaap:CommercialLoanMemberhig:LTVLessthan65PercentMember2021-12-310000874766us-gaap:CommercialLoanMemberhig:LTVLessthan65PercentMember2021-12-310000874766us-gaap:CommercialLoanMemberhig:AmortizedCostMember2021-12-310000874766us-gaap:CommercialLoanMemberhig:OriginatedInCurrentFiscalYearMember2021-12-310000874766us-gaap:CommercialLoanMemberhig:OriginatedInFiscalYearBeforeLatestFiscalYearMember2021-12-310000874766us-gaap:CommercialLoanMemberhig:OriginatedTwoYearsBeforeLatestFiscalYearMember2021-12-310000874766us-gaap:CommercialLoanMemberhig:OriginatedThreeYearsBeforeLatestFiscalYearMember2021-12-310000874766us-gaap:CommercialLoanMemberhig:OriginatedFourYearsBeforeLatestFiscalYearMember2021-12-310000874766hig:OriginatedFiveOrMoreYearsBeforeLatestFiscalYearMemberus-gaap:CommercialLoanMember2021-12-310000874766us-gaap:CommercialLoanMemberhig:EastNorthCentralMember2022-06-300000874766us-gaap:CommercialLoanMemberhig:EastNorthCentralMemberus-gaap:MortgagesMember2022-06-300000874766us-gaap:CommercialLoanMemberhig:EastNorthCentralMember2021-12-310000874766us-gaap:CommercialLoanMemberhig:EastNorthCentralMemberus-gaap:MortgagesMember2021-12-310000874766us-gaap:CommercialLoanMemberhig:MiddleAtlanticMember2022-06-300000874766us-gaap:CommercialLoanMemberhig:MiddleAtlanticMemberus-gaap:MortgagesMember2022-06-300000874766us-gaap:CommercialLoanMemberhig:MiddleAtlanticMember2021-12-310000874766us-gaap:CommercialLoanMemberhig:MiddleAtlanticMemberus-gaap:MortgagesMember2021-12-310000874766us-gaap:CommercialLoanMemberhig:MountainMember2022-06-300000874766us-gaap:CommercialLoanMemberhig:MountainMemberus-gaap:MortgagesMember2022-06-300000874766us-gaap:CommercialLoanMemberhig:MountainMember2021-12-310000874766us-gaap:CommercialLoanMemberhig:MountainMemberus-gaap:MortgagesMember2021-12-310000874766us-gaap:CommercialLoanMemberhig:NewEnglandMember2022-06-300000874766us-gaap:CommercialLoanMemberhig:NewEnglandMemberus-gaap:MortgagesMember2022-06-300000874766us-gaap:CommercialLoanMemberhig:NewEnglandMember2021-12-310000874766us-gaap:CommercialLoanMemberhig:NewEnglandMemberus-gaap:MortgagesMember2021-12-310000874766hig:PacificMemberus-gaap:CommercialLoanMember2022-06-300000874766hig:PacificMemberus-gaap:CommercialLoanMemberus-gaap:MortgagesMember2022-06-300000874766hig:PacificMemberus-gaap:CommercialLoanMember2021-12-310000874766hig:PacificMemberus-gaap:CommercialLoanMemberus-gaap:MortgagesMember2021-12-310000874766us-gaap:CommercialLoanMemberhig:SouthAtlanticMember2022-06-300000874766us-gaap:CommercialLoanMemberhig:SouthAtlanticMemberus-gaap:MortgagesMember2022-06-300000874766us-gaap:CommercialLoanMemberhig:SouthAtlanticMember2021-12-310000874766us-gaap:CommercialLoanMemberhig:SouthAtlanticMemberus-gaap:MortgagesMember2021-12-310000874766us-gaap:CommercialLoanMemberhig:WestNorthCentralMember2022-06-300000874766us-gaap:CommercialLoanMemberhig:WestNorthCentralMemberus-gaap:MortgagesMember2022-06-300000874766us-gaap:CommercialLoanMemberhig:WestNorthCentralMember2021-12-310000874766us-gaap:CommercialLoanMemberhig:WestNorthCentralMemberus-gaap:MortgagesMember2021-12-310000874766us-gaap:CommercialLoanMemberhig:WestSouthCentralMember2022-06-300000874766us-gaap:CommercialLoanMemberus-gaap:MortgagesMemberhig:WestSouthCentralMember2022-06-300000874766us-gaap:CommercialLoanMemberhig:WestSouthCentralMember2021-12-310000874766us-gaap:CommercialLoanMemberus-gaap:MortgagesMemberhig:WestSouthCentralMember2021-12-310000874766us-gaap:CommercialLoanMemberhig:RegionOthersMember2022-06-300000874766us-gaap:CommercialLoanMemberhig:RegionOthersMemberus-gaap:MortgagesMember2022-06-300000874766us-gaap:CommercialLoanMemberhig:RegionOthersMember2021-12-310000874766us-gaap:CommercialLoanMemberhig:RegionOthersMemberus-gaap:MortgagesMember2021-12-310000874766us-gaap:CommercialLoanMemberus-gaap:MortgagesMember2022-06-300000874766us-gaap:CommercialLoanMemberus-gaap:MortgagesMember2021-12-310000874766us-gaap:CommercialLoanMembersrt:IndustrialPropertyMember2022-06-300000874766us-gaap:CommercialLoanMembersrt:IndustrialPropertyMember2021-12-310000874766us-gaap:CommercialLoanMembersrt:MultifamilyMember2022-06-300000874766us-gaap:CommercialLoanMembersrt:MultifamilyMember2021-12-310000874766us-gaap:CommercialLoanMembersrt:OfficeBuildingMember2022-06-300000874766us-gaap:CommercialLoanMembersrt:OfficeBuildingMember2021-12-310000874766us-gaap:CommercialLoanMembersrt:RetailSiteMember2022-06-300000874766us-gaap:CommercialLoanMembersrt:RetailSiteMember2021-12-310000874766us-gaap:CommercialLoanMemberus-gaap:ResidentialRealEstateMember2022-06-300000874766us-gaap:CommercialLoanMemberus-gaap:ResidentialRealEstateMember2021-12-310000874766us-gaap:CommercialLoanMembersrt:OtherPropertyMember2022-06-300000874766us-gaap:CommercialLoanMembersrt:OtherPropertyMember2021-12-310000874766us-gaap:CommercialLoanMemberus-gaap:FinancialAssetPastDueMemberus-gaap:MortgagesMember2021-12-310000874766us-gaap:CommercialLoanMemberus-gaap:FinancialAssetPastDueMemberus-gaap:MortgagesMember2022-06-300000874766us-gaap:InvestmentsMember2022-06-300000874766us-gaap:InvestmentsMember2021-12-310000874766us-gaap:VariableInterestEntityNotPrimaryBeneficiaryMember2022-06-300000874766us-gaap:VariableInterestEntityNotPrimaryBeneficiaryMember2021-12-310000874766hig:SyndicatePolicyholdersMemberus-gaap:DebtSecuritiesMember2022-06-300000874766hig:SyndicatePolicyholdersMemberus-gaap:DebtSecuritiesMember2021-12-310000874766us-gaap:ShortTermInvestmentsMemberhig:SyndicatePolicyholdersMember2022-06-300000874766us-gaap:ShortTermInvestmentsMemberhig:SyndicatePolicyholdersMember2021-12-310000874766hig:LloydsofLondonMemberus-gaap:DebtSecuritiesMember2022-06-300000874766hig:LloydsofLondonMemberus-gaap:DebtSecuritiesMember2021-12-310000874766us-gaap:InterestRateSwapMemberus-gaap:NondesignatedMember2022-06-300000874766us-gaap:InterestRateSwapMemberus-gaap:NondesignatedMember2021-12-310000874766us-gaap:NondesignatedMemberus-gaap:CommodityOptionMember2022-01-012022-03-310000874766us-gaap:NondesignatedMemberus-gaap:CommodityOptionMember2022-01-012022-06-300000874766us-gaap:InterestRateSwapMemberus-gaap:DesignatedAsHedgingInstrumentMember2022-06-300000874766us-gaap:InterestRateSwapMemberus-gaap:DesignatedAsHedgingInstrumentMember2021-12-310000874766us-gaap:DesignatedAsHedgingInstrumentMemberus-gaap:CurrencySwapMember2022-06-300000874766us-gaap:DesignatedAsHedgingInstrumentMemberus-gaap:CurrencySwapMember2021-12-310000874766us-gaap:CashFlowHedgingMember2022-06-300000874766us-gaap:CashFlowHedgingMember2021-12-310000874766hig:InterestRateSwapsandFuturesMemberus-gaap:NondesignatedMember2022-06-300000874766hig:InterestRateSwapsandFuturesMemberus-gaap:NondesignatedMember2021-12-310000874766hig:ForeignCurrencySwapsandForwardsMemberus-gaap:NondesignatedMember2022-06-300000874766hig:ForeignCurrencySwapsandForwardsMemberus-gaap:NondesignatedMember2021-12-310000874766us-gaap:NondesignatedMemberus-gaap:CreditDefaultSwapBuyingProtectionMember2022-06-300000874766us-gaap:NondesignatedMemberus-gaap:CreditDefaultSwapBuyingProtectionMember2021-12-310000874766hig:CreditDerivativesInOffsettingPositionsMemberus-gaap:NondesignatedMember2022-06-300000874766hig:CreditDerivativesInOffsettingPositionsMemberus-gaap:NondesignatedMember2021-12-310000874766us-gaap:NondesignatedMember2022-06-300000874766us-gaap:NondesignatedMember2021-12-310000874766us-gaap:AvailableforsaleSecuritiesMember2022-06-300000874766us-gaap:AvailableforsaleSecuritiesMember2021-12-310000874766us-gaap:OtherInvestmentsMember2022-06-300000874766us-gaap:OtherInvestmentsMember2021-12-310000874766us-gaap:OtherLiabilitiesMember2022-06-300000874766us-gaap:OtherLiabilitiesMember2021-12-310000874766us-gaap:DerivativeFinancialInstrumentsAssetsMember2022-06-300000874766us-gaap:DerivativeFinancialInstrumentsLiabilitiesMember2022-06-300000874766us-gaap:DerivativeFinancialInstrumentsAssetsMember2021-12-310000874766us-gaap:DerivativeFinancialInstrumentsLiabilitiesMember2021-12-310000874766us-gaap:InterestRateSwapMemberus-gaap:DesignatedAsHedgingInstrumentMemberus-gaap:CashFlowHedgingMember2022-04-012022-06-300000874766us-gaap:InterestRateSwapMemberus-gaap:DesignatedAsHedgingInstrumentMemberus-gaap:CashFlowHedgingMember2021-04-012021-06-300000874766us-gaap:InterestRateSwapMemberus-gaap:DesignatedAsHedgingInstrumentMemberus-gaap:CashFlowHedgingMember2022-01-012022-06-300000874766us-gaap:InterestRateSwapMemberus-gaap:DesignatedAsHedgingInstrumentMemberus-gaap:CashFlowHedgingMember2021-01-012021-06-300000874766us-gaap:DesignatedAsHedgingInstrumentMemberus-gaap:CurrencySwapMemberus-gaap:CashFlowHedgingMember2022-04-012022-06-300000874766us-gaap:DesignatedAsHedgingInstrumentMemberus-gaap:CurrencySwapMemberus-gaap:CashFlowHedgingMember2021-04-012021-06-300000874766us-gaap:DesignatedAsHedgingInstrumentMemberus-gaap:CurrencySwapMemberus-gaap:CashFlowHedgingMember2022-01-012022-06-300000874766us-gaap:DesignatedAsHedgingInstrumentMemberus-gaap:CurrencySwapMemberus-gaap:CashFlowHedgingMember2021-01-012021-06-300000874766us-gaap:DesignatedAsHedgingInstrumentMemberus-gaap:CashFlowHedgingMember2022-04-012022-06-300000874766us-gaap:DesignatedAsHedgingInstrumentMemberus-gaap:CashFlowHedgingMember2021-04-012021-06-300000874766us-gaap:DesignatedAsHedgingInstrumentMemberus-gaap:CashFlowHedgingMember2022-01-012022-06-300000874766us-gaap:DesignatedAsHedgingInstrumentMemberus-gaap:CashFlowHedgingMember2021-01-012021-06-300000874766us-gaap:InterestRateSwapMemberus-gaap:AccumulatedGainLossNetCashFlowHedgeParentMemberus-gaap:InvestmentIncomeMemberus-gaap:DesignatedAsHedgingInstrumentMemberus-gaap:CashFlowHedgingMemberus-gaap:ReclassificationOutOfAccumulatedOtherComprehensiveIncomeMember2022-04-012022-06-300000874766us-gaap:InterestRateSwapMemberus-gaap:AccumulatedGainLossNetCashFlowHedgeParentMemberus-gaap:InterestExpenseMemberus-gaap:DesignatedAsHedgingInstrumentMemberus-gaap:CashFlowHedgingMemberus-gaap:ReclassificationOutOfAccumulatedOtherComprehensiveIncomeMember2022-04-012022-06-300000874766us-gaap:InterestRateSwapMemberus-gaap:AccumulatedGainLossNetCashFlowHedgeParentMemberus-gaap:InvestmentIncomeMemberus-gaap:DesignatedAsHedgingInstrumentMemberus-gaap:CashFlowHedgingMemberus-gaap:ReclassificationOutOfAccumulatedOtherComprehensiveIncomeMember2021-04-012021-06-300000874766us-gaap:InterestRateSwapMemberus-gaap:AccumulatedGainLossNetCashFlowHedgeParentMemberus-gaap:InterestExpenseMemberus-gaap:DesignatedAsHedgingInstrumentMemberus-gaap:CashFlowHedgingMemberus-gaap:ReclassificationOutOfAccumulatedOtherComprehensiveIncomeMember2021-04-012021-06-300000874766us-gaap:InterestRateSwapMemberus-gaap:AccumulatedGainLossNetCashFlowHedgeParentMemberus-gaap:InvestmentIncomeMemberus-gaap:DesignatedAsHedgingInstrumentMemberus-gaap:CashFlowHedgingMemberus-gaap:ReclassificationOutOfAccumulatedOtherComprehensiveIncomeMember2022-01-012022-06-300000874766us-gaap:InterestRateSwapMemberus-gaap:AccumulatedGainLossNetCashFlowHedgeParentMemberus-gaap:InterestExpenseMemberus-gaap:DesignatedAsHedgingInstrumentMemberus-gaap:CashFlowHedgingMemberus-gaap:ReclassificationOutOfAccumulatedOtherComprehensiveIncomeMember2022-01-012022-06-300000874766us-gaap:InterestRateSwapMemberus-gaap:AccumulatedGainLossNetCashFlowHedgeParentMemberus-gaap:InvestmentIncomeMemberus-gaap:DesignatedAsHedgingInstrumentMemberus-gaap:CashFlowHedgingMemberus-gaap:ReclassificationOutOfAccumulatedOtherComprehensiveIncomeMember2021-01-012021-06-300000874766us-gaap:InterestRateSwapMemberus-gaap:AccumulatedGainLossNetCashFlowHedgeParentMemberus-gaap:InterestExpenseMemberus-gaap:DesignatedAsHedgingInstrumentMemberus-gaap:CashFlowHedgingMemberus-gaap:ReclassificationOutOfAccumulatedOtherComprehensiveIncomeMember2021-01-012021-06-300000874766us-gaap:AccumulatedGainLossNetCashFlowHedgeParentMemberus-gaap:InvestmentIncomeMemberus-gaap:DesignatedAsHedgingInstrumentMemberus-gaap:CurrencySwapMemberus-gaap:CashFlowHedgingMemberus-gaap:ReclassificationOutOfAccumulatedOtherComprehensiveIncomeMember2022-04-012022-06-300000874766us-gaap:AccumulatedGainLossNetCashFlowHedgeParentMemberus-gaap:InterestExpenseMemberus-gaap:DesignatedAsHedgingInstrumentMemberus-gaap:CurrencySwapMemberus-gaap:CashFlowHedgingMemberus-gaap:ReclassificationOutOfAccumulatedOtherComprehensiveIncomeMember2022-04-012022-06-300000874766us-gaap:AccumulatedGainLossNetCashFlowHedgeParentMemberus-gaap:InvestmentIncomeMemberus-gaap:DesignatedAsHedgingInstrumentMemberus-gaap:CurrencySwapMemberus-gaap:CashFlowHedgingMemberus-gaap:ReclassificationOutOfAccumulatedOtherComprehensiveIncomeMember2021-04-012021-06-300000874766us-gaap:AccumulatedGainLossNetCashFlowHedgeParentMemberus-gaap:InterestExpenseMemberus-gaap:DesignatedAsHedgingInstrumentMemberus-gaap:CurrencySwapMemberus-gaap:CashFlowHedgingMemberus-gaap:ReclassificationOutOfAccumulatedOtherComprehensiveIncomeMember2021-04-012021-06-300000874766us-gaap:AccumulatedGainLossNetCashFlowHedgeParentMemberus-gaap:InvestmentIncomeMemberus-gaap:DesignatedAsHedgingInstrumentMemberus-gaap:CurrencySwapMemberus-gaap:CashFlowHedgingMemberus-gaap:ReclassificationOutOfAccumulatedOtherComprehensiveIncomeMember2022-01-012022-06-300000874766us-gaap:AccumulatedGainLossNetCashFlowHedgeParentMemberus-gaap:InterestExpenseMemberus-gaap:DesignatedAsHedgingInstrumentMemberus-gaap:CurrencySwapMemberus-gaap:CashFlowHedgingMemberus-gaap:ReclassificationOutOfAccumulatedOtherComprehensiveIncomeMember2022-01-012022-06-300000874766us-gaap:AccumulatedGainLossNetCashFlowHedgeParentMemberus-gaap:InvestmentIncomeMemberus-gaap:DesignatedAsHedgingInstrumentMemberus-gaap:CurrencySwapMemberus-gaap:CashFlowHedgingMemberus-gaap:ReclassificationOutOfAccumulatedOtherComprehensiveIncomeMember2021-01-012021-06-300000874766us-gaap:AccumulatedGainLossNetCashFlowHedgeParentMemberus-gaap:InterestExpenseMemberus-gaap:DesignatedAsHedgingInstrumentMemberus-gaap:CurrencySwapMemberus-gaap:CashFlowHedgingMemberus-gaap:ReclassificationOutOfAccumulatedOtherComprehensiveIncomeMember2021-01-012021-06-300000874766us-gaap:InvestmentIncomeMemberus-gaap:DesignatedAsHedgingInstrumentMemberus-gaap:CashFlowHedgingMemberus-gaap:ReclassificationOutOfAccumulatedOtherComprehensiveIncomeMember2022-04-012022-06-300000874766us-gaap:InterestExpenseMemberus-gaap:DesignatedAsHedgingInstrumentMemberus-gaap:CashFlowHedgingMemberus-gaap:ReclassificationOutOfAccumulatedOtherComprehensiveIncomeMember2022-04-012022-06-300000874766us-gaap:InvestmentIncomeMemberus-gaap:DesignatedAsHedgingInstrumentMemberus-gaap:CashFlowHedgingMemberus-gaap:ReclassificationOutOfAccumulatedOtherComprehensiveIncomeMember2021-04-012021-06-300000874766us-gaap:InterestExpenseMemberus-gaap:DesignatedAsHedgingInstrumentMemberus-gaap:CashFlowHedgingMemberus-gaap:ReclassificationOutOfAccumulatedOtherComprehensiveIncomeMember2021-04-012021-06-300000874766us-gaap:InvestmentIncomeMemberus-gaap:DesignatedAsHedgingInstrumentMemberus-gaap:CashFlowHedgingMemberus-gaap:ReclassificationOutOfAccumulatedOtherComprehensiveIncomeMember2022-01-012022-06-300000874766us-gaap:InterestExpenseMemberus-gaap:DesignatedAsHedgingInstrumentMemberus-gaap:CashFlowHedgingMemberus-gaap:ReclassificationOutOfAccumulatedOtherComprehensiveIncomeMember2022-01-012022-06-300000874766us-gaap:InvestmentIncomeMemberus-gaap:DesignatedAsHedgingInstrumentMemberus-gaap:CashFlowHedgingMemberus-gaap:ReclassificationOutOfAccumulatedOtherComprehensiveIncomeMember2021-01-012021-06-300000874766us-gaap:InterestExpenseMemberus-gaap:DesignatedAsHedgingInstrumentMemberus-gaap:CashFlowHedgingMemberus-gaap:ReclassificationOutOfAccumulatedOtherComprehensiveIncomeMember2021-01-012021-06-300000874766us-gaap:ReclassificationOutOfAccumulatedOtherComprehensiveIncomeMember2021-04-012021-06-300000874766us-gaap:ReclassificationOutOfAccumulatedOtherComprehensiveIncomeMember2022-01-012022-06-300000874766us-gaap:ReclassificationOutOfAccumulatedOtherComprehensiveIncomeMember2021-01-012021-06-300000874766us-gaap:ReclassificationOutOfAccumulatedOtherComprehensiveIncomeMember2022-04-012022-06-300000874766us-gaap:ForeignExchangeForwardMemberus-gaap:NondesignatedMember2022-04-012022-06-300000874766us-gaap:ForeignExchangeForwardMemberus-gaap:NondesignatedMember2021-04-012021-06-300000874766us-gaap:ForeignExchangeForwardMemberus-gaap:NondesignatedMember2022-01-012022-06-300000874766us-gaap:ForeignExchangeForwardMemberus-gaap:NondesignatedMember2021-01-012021-06-300000874766us-gaap:NondesignatedMemberhig:InterestRateSwapsSwaptionsandFuturesMember2022-04-012022-06-300000874766us-gaap:NondesignatedMemberhig:InterestRateSwapsSwaptionsandFuturesMember2021-04-012021-06-300000874766us-gaap:NondesignatedMemberhig:InterestRateSwapsSwaptionsandFuturesMember2022-01-012022-06-300000874766us-gaap:NondesignatedMemberhig:InterestRateSwapsSwaptionsandFuturesMember2021-01-012021-06-300000874766us-gaap:CreditRiskContractMemberus-gaap:NondesignatedMemberus-gaap:CreditDefaultSwapBuyingProtectionMember2022-04-012022-06-300000874766us-gaap:CreditRiskContractMemberus-gaap:NondesignatedMemberus-gaap:CreditDefaultSwapBuyingProtectionMember2021-04-012021-06-300000874766us-gaap:CreditRiskContractMemberus-gaap:NondesignatedMemberus-gaap:CreditDefaultSwapBuyingProtectionMember2022-01-012022-06-300000874766us-gaap:CreditRiskContractMemberus-gaap:NondesignatedMemberus-gaap:CreditDefaultSwapBuyingProtectionMember2021-01-012021-06-300000874766us-gaap:CreditRiskContractMemberus-gaap:NondesignatedMemberus-gaap:CreditDefaultSwapSellingProtectionMember2022-04-012022-06-300000874766us-gaap:CreditRiskContractMemberus-gaap:NondesignatedMemberus-gaap:CreditDefaultSwapSellingProtectionMember2021-04-012021-06-300000874766us-gaap:CreditRiskContractMemberus-gaap:NondesignatedMemberus-gaap:CreditDefaultSwapSellingProtectionMember2022-01-012022-06-300000874766us-gaap:CreditRiskContractMemberus-gaap:NondesignatedMemberus-gaap:CreditDefaultSwapSellingProtectionMember2021-01-012021-06-300000874766us-gaap:NondesignatedMemberus-gaap:CommodityOptionMember2022-04-012022-06-300000874766us-gaap:NondesignatedMemberus-gaap:CommodityOptionMember2021-04-012021-06-300000874766us-gaap:NondesignatedMemberus-gaap:CommodityOptionMember2021-01-012021-06-300000874766hig:BasketCreditDefaultSwapsMemberus-gaap:CreditRiskContractMembersrt:StandardPoorsAAARatingMemberus-gaap:ExternalCreditRatingInvestmentGradeMember2022-06-300000874766hig:BasketCreditDefaultSwapsMemberus-gaap:CreditRiskContractMembersrt:StandardPoorsAAARatingMemberus-gaap:ExternalCreditRatingInvestmentGradeMember2022-01-012022-06-300000874766hig:BasketCreditDefaultSwapsMemberus-gaap:ExternalCreditRatingNonInvestmentGradeMemberus-gaap:CreditRiskContractMembersrt:StandardPoorsBMinusRatingMember2022-06-300000874766hig:BasketCreditDefaultSwapsMemberus-gaap:ExternalCreditRatingNonInvestmentGradeMemberus-gaap:CreditRiskContractMembersrt:StandardPoorsBMinusRatingMember2022-01-012022-06-300000874766hig:BasketCreditDefaultSwapsMemberus-gaap:CreditRiskContractMembersrt:StandardPoorsAAARatingMemberus-gaap:ExternalCreditRatingInvestmentGradeMember2021-12-310000874766hig:BasketCreditDefaultSwapsMemberus-gaap:CreditRiskContractMembersrt:StandardPoorsAAARatingMemberus-gaap:ExternalCreditRatingInvestmentGradeMember2021-01-012021-12-310000874766hig:BasketCreditDefaultSwapsMemberus-gaap:ExternalCreditRatingNonInvestmentGradeMemberus-gaap:CreditRiskContractMembersrt:StandardPoorsCCCRatingMember2021-12-310000874766hig:BasketCreditDefaultSwapsMemberus-gaap:ExternalCreditRatingNonInvestmentGradeMemberus-gaap:CreditRiskContractMembersrt:StandardPoorsCCCRatingMember2021-01-012021-12-310000874766us-gaap:AssetPledgedAsCollateralMember2022-06-300000874766us-gaap:AssetPledgedAsCollateralMember2021-12-310000874766us-gaap:CollateralPledgedMember2022-06-300000874766us-gaap:CollateralPledgedMember2021-12-310000874766us-gaap:AssetPledgedAsCollateralMemberus-gaap:OverTheCounterMember2022-06-300000874766us-gaap:AssetPledgedAsCollateralMemberus-gaap:OverTheCounterMember2021-12-310000874766hig:PremiumsReceivableDueinOneYearorLessExcludingReceivablesforLosswithinaDeductibleandRetrospectivelyRatedPolicyPremiumsMember2022-06-300000874766hig:PremiumsReceivableDueinOneYearorLessExcludingReceivablesforLosswithinaDeductibleandRetrospectivelyRatedPolicyPremiumsMember2021-12-310000874766srt:StandardPoorsAARatingMemberhig:PremiumsReceivableLossWithinaDeductibleandRetrospectivelyRatedPolicyPremiumsMember2022-06-300000874766srt:StandardPoorsAARatingMemberhig:PremiumsReceivableLossWithinaDeductibleandRetrospectivelyRatedPolicyPremiumsMember2021-12-310000874766hig:PremiumsReceivableLossWithinaDeductibleandRetrospectivelyRatedPolicyPremiumsMembersrt:StandardPoorsARatingMember2022-06-300000874766hig:PremiumsReceivableLossWithinaDeductibleandRetrospectivelyRatedPolicyPremiumsMembersrt:StandardPoorsARatingMember2021-12-310000874766hig:PremiumsReceivableLossWithinaDeductibleandRetrospectivelyRatedPolicyPremiumsMembersrt:StandardPoorsBBBRatingMember2022-06-300000874766hig:PremiumsReceivableLossWithinaDeductibleandRetrospectivelyRatedPolicyPremiumsMembersrt:StandardPoorsBBBRatingMember2021-12-310000874766hig:PremiumsReceivableLossWithinaDeductibleandRetrospectivelyRatedPolicyPremiumsMembersrt:StandardPoorsBBRatingMember2022-06-300000874766hig:PremiumsReceivableLossWithinaDeductibleandRetrospectivelyRatedPolicyPremiumsMembersrt:StandardPoorsBBRatingMember2021-12-310000874766hig:PremiumsReceivableLossWithinaDeductibleandRetrospectivelyRatedPolicyPremiumsMemberhig:StandardPoorsBelowBBRatingMember2022-06-300000874766hig:PremiumsReceivableLossWithinaDeductibleandRetrospectivelyRatedPolicyPremiumsMemberhig:StandardPoorsBelowBBRatingMember2021-12-310000874766hig:PremiumsReceivableLossWithinaDeductibleandRetrospectivelyRatedPolicyPremiumsMember2022-06-300000874766hig:PremiumsReceivableLossWithinaDeductibleandRetrospectivelyRatedPolicyPremiumsMember2021-12-310000874766hig:PremiumsReceivableDueinOneYearorLessExcludingReceivablesforLosswithinaDeductibleandRetrospectivelyRatedPolicyPremiumsMember2022-03-310000874766hig:PremiumsReceivableLossWithinaDeductibleandRetrospectivelyRatedPolicyPremiumsMember2022-03-310000874766hig:PremiumsReceivableDueinOneYearorLessExcludingReceivablesforLosswithinaDeductibleandRetrospectivelyRatedPolicyPremiumsMember2021-03-310000874766hig:PremiumsReceivableLossWithinaDeductibleandRetrospectivelyRatedPolicyPremiumsMember2021-03-310000874766hig:PremiumsReceivableDueinOneYearorLessExcludingReceivablesforLosswithinaDeductibleandRetrospectivelyRatedPolicyPremiumsMember2022-04-012022-06-300000874766hig:PremiumsReceivableLossWithinaDeductibleandRetrospectivelyRatedPolicyPremiumsMember2022-04-012022-06-300000874766hig:PremiumsReceivableDueinOneYearorLessExcludingReceivablesforLosswithinaDeductibleandRetrospectivelyRatedPolicyPremiumsMember2021-04-012021-06-300000874766hig:PremiumsReceivableLossWithinaDeductibleandRetrospectivelyRatedPolicyPremiumsMember2021-04-012021-06-300000874766hig:PremiumsReceivableDueinOneYearorLessExcludingReceivablesforLosswithinaDeductibleandRetrospectivelyRatedPolicyPremiumsMember2021-06-300000874766hig:PremiumsReceivableLossWithinaDeductibleandRetrospectivelyRatedPolicyPremiumsMember2021-06-300000874766hig:PremiumsReceivableDueinOneYearorLessExcludingReceivablesforLosswithinaDeductibleandRetrospectivelyRatedPolicyPremiumsMember2020-12-310000874766hig:PremiumsReceivableLossWithinaDeductibleandRetrospectivelyRatedPolicyPremiumsMember2020-12-310000874766hig:PremiumsReceivableDueinOneYearorLessExcludingReceivablesforLosswithinaDeductibleandRetrospectivelyRatedPolicyPremiumsMember2022-01-012022-06-300000874766hig:PremiumsReceivableLossWithinaDeductibleandRetrospectivelyRatedPolicyPremiumsMember2022-01-012022-06-300000874766hig:PremiumsReceivableDueinOneYearorLessExcludingReceivablesforLosswithinaDeductibleandRetrospectivelyRatedPolicyPremiumsMember2021-01-012021-06-300000874766hig:PremiumsReceivableLossWithinaDeductibleandRetrospectivelyRatedPolicyPremiumsMember2021-01-012021-06-300000874766us-gaap:PropertyLiabilityAndCasualtyInsuranceSegmentMembersrt:AMBestAPlusPlusRatingMemberus-gaap:OperatingSegmentsMember2022-06-300000874766srt:AMBestAPlusPlusRatingMemberus-gaap:OperatingSegmentsMemberus-gaap:GroupPoliciesMember2022-06-300000874766us-gaap:CorporateNonSegmentMembersrt:AMBestAPlusPlusRatingMember2022-06-300000874766srt:AMBestAPlusPlusRatingMember2022-06-300000874766us-gaap:PropertyLiabilityAndCasualtyInsuranceSegmentMembersrt:AMBestAPlusPlusRatingMemberus-gaap:OperatingSegmentsMember2021-12-310000874766srt:AMBestAPlusPlusRatingMemberus-gaap:OperatingSegmentsMemberus-gaap:GroupPoliciesMember2021-12-310000874766us-gaap:CorporateNonSegmentMembersrt:AMBestAPlusPlusRatingMember2021-12-310000874766srt:AMBestAPlusPlusRatingMember2021-12-310000874766us-gaap:PropertyLiabilityAndCasualtyInsuranceSegmentMembersrt:AMBestAPlusRatingMemberus-gaap:OperatingSegmentsMember2022-06-300000874766srt:AMBestAPlusRatingMemberus-gaap:OperatingSegmentsMemberus-gaap:GroupPoliciesMember2022-06-300000874766us-gaap:CorporateNonSegmentMembersrt:AMBestAPlusRatingMember2022-06-300000874766srt:AMBestAPlusRatingMember2022-06-300000874766us-gaap:PropertyLiabilityAndCasualtyInsuranceSegmentMembersrt:AMBestAPlusRatingMemberus-gaap:OperatingSegmentsMember2021-12-310000874766srt:AMBestAPlusRatingMemberus-gaap:OperatingSegmentsMemberus-gaap:GroupPoliciesMember2021-12-310000874766us-gaap:CorporateNonSegmentMembersrt:AMBestAPlusRatingMember2021-12-310000874766srt:AMBestAPlusRatingMember2021-12-310000874766us-gaap:PropertyLiabilityAndCasualtyInsuranceSegmentMembersrt:AMBestARatingMemberus-gaap:OperatingSegmentsMember2022-06-300000874766srt:AMBestARatingMemberus-gaap:OperatingSegmentsMemberus-gaap:GroupPoliciesMember2022-06-300000874766us-gaap:CorporateNonSegmentMembersrt:AMBestARatingMember2022-06-300000874766srt:AMBestARatingMember2022-06-300000874766us-gaap:PropertyLiabilityAndCasualtyInsuranceSegmentMembersrt:AMBestARatingMemberus-gaap:OperatingSegmentsMember2021-12-310000874766srt:AMBestARatingMemberus-gaap:OperatingSegmentsMemberus-gaap:GroupPoliciesMember2021-12-310000874766us-gaap:CorporateNonSegmentMembersrt:AMBestARatingMember2021-12-310000874766srt:AMBestARatingMember2021-12-310000874766us-gaap:PropertyLiabilityAndCasualtyInsuranceSegmentMembersrt:AMBestAMinusRatingMemberus-gaap:OperatingSegmentsMember2022-06-300000874766srt:AMBestAMinusRatingMemberus-gaap:OperatingSegmentsMemberus-gaap:GroupPoliciesMember2022-06-300000874766us-gaap:CorporateNonSegmentMembersrt:AMBestAMinusRatingMember2022-06-300000874766srt:AMBestAMinusRatingMember2022-06-300000874766us-gaap:PropertyLiabilityAndCasualtyInsuranceSegmentMembersrt:AMBestAMinusRatingMemberus-gaap:OperatingSegmentsMember2021-12-310000874766srt:AMBestAMinusRatingMemberus-gaap:OperatingSegmentsMemberus-gaap:GroupPoliciesMember2021-12-310000874766us-gaap:CorporateNonSegmentMembersrt:AMBestAMinusRatingMember2021-12-310000874766srt:AMBestAMinusRatingMember2021-12-310000874766srt:AMBestBPlusPlusRatingMemberus-gaap:PropertyLiabilityAndCasualtyInsuranceSegmentMemberus-gaap:OperatingSegmentsMember2022-06-300000874766srt:AMBestBPlusPlusRatingMemberus-gaap:OperatingSegmentsMemberus-gaap:GroupPoliciesMember2022-06-300000874766srt:AMBestBPlusPlusRatingMemberus-gaap:CorporateNonSegmentMember2022-06-300000874766srt:AMBestBPlusPlusRatingMember2022-06-300000874766srt:AMBestBPlusPlusRatingMemberus-gaap:PropertyLiabilityAndCasualtyInsuranceSegmentMemberus-gaap:OperatingSegmentsMember2021-12-310000874766srt:AMBestBPlusPlusRatingMemberus-gaap:OperatingSegmentsMemberus-gaap:GroupPoliciesMember2021-12-310000874766srt:AMBestBPlusPlusRatingMemberus-gaap:CorporateNonSegmentMember2021-12-310000874766srt:AMBestBPlusPlusRatingMember2021-12-310000874766hig:AMBestBelowBPlusPlusRatingMemberus-gaap:PropertyLiabilityAndCasualtyInsuranceSegmentMemberus-gaap:OperatingSegmentsMember2022-06-300000874766hig:AMBestBelowBPlusPlusRatingMemberus-gaap:OperatingSegmentsMemberus-gaap:GroupPoliciesMember2022-06-300000874766hig:AMBestBelowBPlusPlusRatingMemberus-gaap:CorporateNonSegmentMember2022-06-300000874766hig:AMBestBelowBPlusPlusRatingMember2022-06-300000874766hig:AMBestBelowBPlusPlusRatingMemberus-gaap:PropertyLiabilityAndCasualtyInsuranceSegmentMemberus-gaap:OperatingSegmentsMember2021-12-310000874766hig:AMBestBelowBPlusPlusRatingMemberus-gaap:OperatingSegmentsMemberus-gaap:GroupPoliciesMember2021-12-310000874766hig:AMBestBelowBPlusPlusRatingMemberus-gaap:CorporateNonSegmentMember2021-12-310000874766hig:AMBestBelowBPlusPlusRatingMember2021-12-310000874766hig:AMBestRatedMemberus-gaap:PropertyLiabilityAndCasualtyInsuranceSegmentMemberus-gaap:OperatingSegmentsMember2022-06-300000874766hig:AMBestRatedMemberus-gaap:OperatingSegmentsMemberus-gaap:GroupPoliciesMember2022-06-300000874766us-gaap:CorporateNonSegmentMemberhig:AMBestRatedMember2022-06-300000874766hig:AMBestRatedMember2022-06-300000874766hig:AMBestRatedMemberus-gaap:PropertyLiabilityAndCasualtyInsuranceSegmentMemberus-gaap:OperatingSegmentsMember2021-12-310000874766hig:AMBestRatedMemberus-gaap:OperatingSegmentsMemberus-gaap:GroupPoliciesMember2021-12-310000874766us-gaap:CorporateNonSegmentMemberhig:AMBestRatedMember2021-12-310000874766hig:AMBestRatedMember2021-12-310000874766hig:MandatoryandVoluntaryRiskPoolsMemberus-gaap:PropertyLiabilityAndCasualtyInsuranceSegmentMemberus-gaap:OperatingSegmentsMember2022-06-300000874766hig:MandatoryandVoluntaryRiskPoolsMemberus-gaap:OperatingSegmentsMemberus-gaap:GroupPoliciesMember2022-06-300000874766hig:MandatoryandVoluntaryRiskPoolsMemberus-gaap:CorporateNonSegmentMember2022-06-300000874766hig:MandatoryandVoluntaryRiskPoolsMember2022-06-300000874766hig:MandatoryandVoluntaryRiskPoolsMemberus-gaap:PropertyLiabilityAndCasualtyInsuranceSegmentMemberus-gaap:OperatingSegmentsMember2021-12-310000874766hig:MandatoryandVoluntaryRiskPoolsMemberus-gaap:OperatingSegmentsMemberus-gaap:GroupPoliciesMember2021-12-310000874766hig:MandatoryandVoluntaryRiskPoolsMemberus-gaap:CorporateNonSegmentMember2021-12-310000874766hig:MandatoryandVoluntaryRiskPoolsMember2021-12-310000874766hig:CaptivesMemberus-gaap:PropertyLiabilityAndCasualtyInsuranceSegmentMemberus-gaap:OperatingSegmentsMember2022-06-300000874766hig:CaptivesMemberus-gaap:OperatingSegmentsMemberus-gaap:GroupPoliciesMember2022-06-300000874766hig:CaptivesMemberus-gaap:CorporateNonSegmentMember2022-06-300000874766hig:CaptivesMember2022-06-300000874766hig:CaptivesMemberus-gaap:PropertyLiabilityAndCasualtyInsuranceSegmentMemberus-gaap:OperatingSegmentsMember2021-12-310000874766hig:CaptivesMemberus-gaap:OperatingSegmentsMemberus-gaap:GroupPoliciesMember2021-12-310000874766hig:CaptivesMemberus-gaap:CorporateNonSegmentMember2021-12-310000874766hig:CaptivesMember2021-12-310000874766us-gaap:PropertyLiabilityAndCasualtyInsuranceSegmentMemberus-gaap:OperatingSegmentsMemberhig:OthernotratedcompaniesMember2022-06-300000874766us-gaap:OperatingSegmentsMemberhig:OthernotratedcompaniesMemberus-gaap:GroupPoliciesMember2022-06-300000874766us-gaap:CorporateNonSegmentMemberhig:OthernotratedcompaniesMember2022-06-300000874766hig:OthernotratedcompaniesMember2022-06-300000874766us-gaap:PropertyLiabilityAndCasualtyInsuranceSegmentMemberus-gaap:OperatingSegmentsMemberhig:OthernotratedcompaniesMember2021-12-310000874766us-gaap:OperatingSegmentsMemberhig:OthernotratedcompaniesMemberus-gaap:GroupPoliciesMember2021-12-310000874766us-gaap:CorporateNonSegmentMemberhig:OthernotratedcompaniesMember2021-12-310000874766hig:OthernotratedcompaniesMember2021-12-310000874766us-gaap:PropertyLiabilityAndCasualtyInsuranceSegmentMemberus-gaap:OperatingSegmentsMember2022-06-300000874766us-gaap:OperatingSegmentsMemberus-gaap:GroupPoliciesMember2022-06-300000874766us-gaap:CorporateNonSegmentMember2022-06-300000874766us-gaap:PropertyLiabilityAndCasualtyInsuranceSegmentMemberus-gaap:OperatingSegmentsMember2021-12-310000874766us-gaap:OperatingSegmentsMemberus-gaap:GroupPoliciesMember2021-12-310000874766us-gaap:CorporateNonSegmentMember2021-12-310000874766us-gaap:PropertyLiabilityAndCasualtyInsuranceSegmentMemberus-gaap:OperatingSegmentsMember2022-03-310000874766us-gaap:OperatingSegmentsMemberus-gaap:GroupPoliciesMember2022-03-310000874766us-gaap:CorporateNonSegmentMember2022-03-310000874766us-gaap:PropertyLiabilityAndCasualtyInsuranceSegmentMemberus-gaap:OperatingSegmentsMember2021-03-310000874766us-gaap:OperatingSegmentsMemberus-gaap:GroupPoliciesMember2021-03-310000874766us-gaap:CorporateNonSegmentMember2021-03-310000874766Disputes [Member]us-gaap:PropertyLiabilityAndCasualtyInsuranceSegmentMemberus-gaap:OperatingSegmentsMember2022-03-310000874766Disputes [Member]us-gaap:OperatingSegmentsMemberus-gaap:GroupPoliciesMember2022-03-310000874766Disputes [Member]us-gaap:CorporateNonSegmentMember2022-03-310000874766Disputes [Member]2022-03-310000874766Disputes [Member]us-gaap:PropertyLiabilityAndCasualtyInsuranceSegmentMemberus-gaap:OperatingSegmentsMember2021-03-310000874766Disputes [Member]us-gaap:OperatingSegmentsMemberus-gaap:GroupPoliciesMember2021-03-310000874766Disputes [Member]us-gaap:CorporateNonSegmentMember2021-03-310000874766Disputes [Member]2021-03-310000874766Before Uncollectible Reinsurance [Member]us-gaap:PropertyLiabilityAndCasualtyInsuranceSegmentMemberus-gaap:OperatingSegmentsMember2022-03-310000874766Before Uncollectible Reinsurance [Member]us-gaap:OperatingSegmentsMemberus-gaap:GroupPoliciesMember2022-03-310000874766us-gaap:CorporateNonSegmentMemberBefore Uncollectible Reinsurance [Member]2022-03-310000874766Before Uncollectible Reinsurance [Member]2022-03-310000874766Before Uncollectible Reinsurance [Member]us-gaap:PropertyLiabilityAndCasualtyInsuranceSegmentMemberus-gaap:OperatingSegmentsMember2021-03-310000874766Before Uncollectible Reinsurance [Member]us-gaap:OperatingSegmentsMemberus-gaap:GroupPoliciesMember2021-03-310000874766us-gaap:CorporateNonSegmentMemberBefore Uncollectible Reinsurance [Member]2021-03-310000874766Before Uncollectible Reinsurance [Member]2021-03-310000874766us-gaap:PropertyLiabilityAndCasualtyInsuranceSegmentMemberus-gaap:OperatingSegmentsMember2022-04-012022-06-300000874766us-gaap:OperatingSegmentsMemberus-gaap:GroupPoliciesMember2022-04-012022-06-300000874766us-gaap:PropertyLiabilityAndCasualtyInsuranceSegmentMemberus-gaap:OperatingSegmentsMember2021-04-012021-06-300000874766us-gaap:OperatingSegmentsMemberus-gaap:GroupPoliciesMember2021-04-012021-06-300000874766Before Uncollectible Reinsurance [Member]us-gaap:PropertyLiabilityAndCasualtyInsuranceSegmentMemberus-gaap:OperatingSegmentsMember2022-06-300000874766Before Uncollectible Reinsurance [Member]us-gaap:OperatingSegmentsMemberus-gaap:GroupPoliciesMember2022-06-300000874766us-gaap:CorporateNonSegmentMemberBefore Uncollectible Reinsurance [Member]2022-06-300000874766Before Uncollectible Reinsurance [Member]2022-06-300000874766Before Uncollectible Reinsurance [Member]us-gaap:PropertyLiabilityAndCasualtyInsuranceSegmentMemberus-gaap:OperatingSegmentsMember2021-06-300000874766Before Uncollectible Reinsurance [Member]us-gaap:OperatingSegmentsMemberus-gaap:GroupPoliciesMember2021-06-300000874766us-gaap:CorporateNonSegmentMemberBefore Uncollectible Reinsurance [Member]2021-06-300000874766Before Uncollectible Reinsurance [Member]2021-06-300000874766Disputes [Member]us-gaap:PropertyLiabilityAndCasualtyInsuranceSegmentMemberus-gaap:OperatingSegmentsMember2022-06-300000874766Disputes [Member]us-gaap:OperatingSegmentsMemberus-gaap:GroupPoliciesMember2022-06-300000874766Disputes [Member]us-gaap:CorporateNonSegmentMember2022-06-300000874766Disputes [Member]2022-06-300000874766Disputes [Member]us-gaap:PropertyLiabilityAndCasualtyInsuranceSegmentMemberus-gaap:OperatingSegmentsMember2021-06-300000874766Disputes [Member]us-gaap:OperatingSegmentsMemberus-gaap:GroupPoliciesMember2021-06-300000874766Disputes [Member]us-gaap:CorporateNonSegmentMember2021-06-300000874766Disputes [Member]2021-06-300000874766us-gaap:PropertyLiabilityAndCasualtyInsuranceSegmentMemberus-gaap:OperatingSegmentsMember2021-06-300000874766us-gaap:OperatingSegmentsMemberus-gaap:GroupPoliciesMember2021-06-300000874766us-gaap:CorporateNonSegmentMember2021-06-300000874766us-gaap:PropertyLiabilityAndCasualtyInsuranceSegmentMemberus-gaap:OperatingSegmentsMember2020-12-310000874766us-gaap:OperatingSegmentsMemberus-gaap:GroupPoliciesMember2020-12-310000874766us-gaap:CorporateNonSegmentMember2020-12-310000874766Disputes [Member]us-gaap:PropertyLiabilityAndCasualtyInsuranceSegmentMemberus-gaap:OperatingSegmentsMember2021-12-310000874766Disputes [Member]us-gaap:OperatingSegmentsMemberus-gaap:GroupPoliciesMember2021-12-310000874766Disputes [Member]us-gaap:CorporateNonSegmentMember2021-12-310000874766Disputes [Member]2021-12-310000874766Disputes [Member]us-gaap:PropertyLiabilityAndCasualtyInsuranceSegmentMemberus-gaap:OperatingSegmentsMember2020-12-310000874766Disputes [Member]us-gaap:OperatingSegmentsMemberus-gaap:GroupPoliciesMember2020-12-310000874766Disputes [Member]us-gaap:CorporateNonSegmentMember2020-12-310000874766Disputes [Member]2020-12-310000874766Before Uncollectible Reinsurance [Member]us-gaap:PropertyLiabilityAndCasualtyInsuranceSegmentMemberus-gaap:OperatingSegmentsMember2021-12-310000874766Before Uncollectible Reinsurance [Member]us-gaap:OperatingSegmentsMemberus-gaap:GroupPoliciesMember2021-12-310000874766us-gaap:CorporateNonSegmentMemberBefore Uncollectible Reinsurance [Member]2021-12-310000874766Before Uncollectible Reinsurance [Member]2021-12-310000874766Before Uncollectible Reinsurance [Member]us-gaap:PropertyLiabilityAndCasualtyInsuranceSegmentMemberus-gaap:OperatingSegmentsMember2020-12-310000874766Before Uncollectible Reinsurance [Member]us-gaap:OperatingSegmentsMemberus-gaap:GroupPoliciesMember2020-12-310000874766us-gaap:CorporateNonSegmentMemberBefore Uncollectible Reinsurance [Member]2020-12-310000874766Before Uncollectible Reinsurance [Member]2020-12-310000874766us-gaap:PropertyLiabilityAndCasualtyInsuranceSegmentMemberus-gaap:OperatingSegmentsMember2022-01-012022-06-300000874766us-gaap:OperatingSegmentsMemberus-gaap:GroupPoliciesMember2022-01-012022-06-300000874766us-gaap:PropertyLiabilityAndCasualtyInsuranceSegmentMemberus-gaap:OperatingSegmentsMember2021-01-012021-06-300000874766us-gaap:OperatingSegmentsMemberus-gaap:GroupPoliciesMember2021-01-012021-06-300000874766us-gaap:PropertyLiabilityAndCasualtyInsuranceSegmentMember2022-01-012022-06-300000874766us-gaap:PropertyLiabilityAndCasualtyInsuranceSegmentMember2021-12-310000874766us-gaap:PropertyLiabilityAndCasualtyInsuranceSegmentMember2020-12-310000874766us-gaap:PropertyLiabilityAndCasualtyInsuranceSegmentMember2021-01-012021-06-300000874766Adverse Development Cover Navigators Groupus-gaap:PropertyLiabilityAndCasualtyInsuranceSegmentMember2022-01-012022-06-300000874766Adverse Development Cover Navigators Groupus-gaap:PropertyLiabilityAndCasualtyInsuranceSegmentMember2021-01-012021-06-300000874766us-gaap:PropertyLiabilityAndCasualtyInsuranceSegmentMember2022-06-300000874766us-gaap:PropertyLiabilityAndCasualtyInsuranceSegmentMember2021-06-300000874766us-gaap:MaterialReconcilingItemsMemberus-gaap:AccidentAndHealthInsuranceSegmentMember2022-01-012022-06-300000874766us-gaap:MaterialReconcilingItemsMemberus-gaap:AccidentAndHealthInsuranceSegmentMember2021-01-012021-06-300000874766us-gaap:MaterialReconcilingItemsMemberhig:ChangeInWorkersCompensationDiscountIncludingAccretionMember2022-01-012022-06-300000874766us-gaap:MaterialReconcilingItemsMemberhig:ChangeInWorkersCompensationDiscountIncludingAccretionMember2021-01-012021-06-300000874766us-gaap:MaterialReconcilingItemsMemberus-gaap:GeneralLiabilityMember2022-01-012022-06-300000874766us-gaap:MaterialReconcilingItemsMemberus-gaap:GeneralLiabilityMember2021-01-012021-06-300000874766us-gaap:MaterialReconcilingItemsMemberhig:MarineMember2022-01-012022-06-300000874766us-gaap:MaterialReconcilingItemsMemberhig:MarineMember2021-01-012021-06-300000874766us-gaap:MaterialReconcilingItemsMemberhig:PackageBusinessMember2022-01-012022-06-300000874766us-gaap:MaterialReconcilingItemsMemberhig:PackageBusinessMember2021-01-012021-06-300000874766us-gaap:PropertyInsuranceProductLineMemberus-gaap:MaterialReconcilingItemsMemberhig:PCCommercialLinesMember2022-01-012022-06-300000874766us-gaap:PropertyInsuranceProductLineMemberus-gaap:MaterialReconcilingItemsMemberhig:PCCommercialLinesMember2021-01-012021-06-300000874766us-gaap:ProfessionalLiabilityInsuranceMemberus-gaap:MaterialReconcilingItemsMember2022-01-012022-06-300000874766us-gaap:ProfessionalLiabilityInsuranceMemberus-gaap:MaterialReconcilingItemsMember2021-01-012021-06-300000874766us-gaap:MaterialReconcilingItemsMemberus-gaap:SuretySegmentMember2022-01-012022-06-300000874766us-gaap:MaterialReconcilingItemsMemberus-gaap:SuretySegmentMember2021-01-012021-06-300000874766us-gaap:MaterialReconcilingItemsMemberhig:AssumedReinsuranceMember2022-01-012022-06-300000874766us-gaap:MaterialReconcilingItemsMemberhig:AssumedReinsuranceMember2021-01-012021-06-300000874766us-gaap:MaterialReconcilingItemsMemberhig:PCCommercialLinesMemberus-gaap:AutomobilesMember2022-01-012022-06-300000874766us-gaap:MaterialReconcilingItemsMemberhig:PCCommercialLinesMemberus-gaap:AutomobilesMember2021-01-012021-06-300000874766us-gaap:MaterialReconcilingItemsMemberhig:PCPersonalLinesMemberus-gaap:AutomobilesMember2022-01-012022-06-300000874766us-gaap:MaterialReconcilingItemsMemberhig:PCPersonalLinesMemberus-gaap:AutomobilesMember2021-01-012021-06-300000874766us-gaap:PropertyInsuranceProductLineMemberus-gaap:MaterialReconcilingItemsMemberhig:PCPersonalLinesMember2022-01-012022-06-300000874766us-gaap:PropertyInsuranceProductLineMemberus-gaap:MaterialReconcilingItemsMemberhig:PCPersonalLinesMember2021-01-012021-06-300000874766us-gaap:CatastropheMemberus-gaap:MaterialReconcilingItemsMember2022-01-012022-06-300000874766us-gaap:CatastropheMemberus-gaap:MaterialReconcilingItemsMember2021-01-012021-06-300000874766hig:UncollectibleReinsuranceMemberus-gaap:MaterialReconcilingItemsMember2022-01-012022-06-300000874766hig:UncollectibleReinsuranceMemberus-gaap:MaterialReconcilingItemsMember2021-01-012021-06-300000874766us-gaap:MaterialReconcilingItemsMemberus-gaap:OtherInsuranceProductLineMember2022-01-012022-06-300000874766us-gaap:MaterialReconcilingItemsMemberus-gaap:OtherInsuranceProductLineMember2021-01-012021-06-300000874766hig:AbuseClaimsMemberus-gaap:GeneralLiabilityMember2022-06-300000874766Asbestos and Environmental2016-01-012016-12-310000874766Asbestos and Environmentalsrt:MaximumMember2022-01-012022-06-300000874766Asbestos and Environmental [Member]2016-01-012016-12-310000874766Asbestos and Environmentalhig:AsbestosandEnvironmentalMember2017-01-012022-06-300000874766hig:RemainingMemberAsbestos and Environmentalhig:AsbestosandEnvironmentalMember2022-01-012022-06-300000874766Asbestos and Environmental [Member]hig:AsbestosandEnvironmentalMember2022-06-300000874766Adverse Development Cover Navigators Group2019-05-232019-05-230000874766Adverse Development Cover Navigators Groupsrt:MaximumMember2022-01-012022-06-300000874766hig:RetentionLayerAboveReservefortheCoveredLiabilitiesasoftheInceptionDateMemberAdverse Development Cover Navigators Group2022-01-012022-06-300000874766Adverse Development Cover Navigators Grouphig:RetentionLayerforReservefortheCoveredLiabilitiesasoftheInceptionDateMember2022-01-012022-06-300000874766Adverse Development Cover Navigators Group2022-06-300000874766us-gaap:GroupPoliciesMember2022-01-012022-06-300000874766us-gaap:GroupPoliciesMember2021-12-310000874766us-gaap:GroupPoliciesMember2020-12-310000874766us-gaap:GroupPoliciesMember2021-01-012021-06-300000874766us-gaap:GroupPoliciesMember2022-06-300000874766us-gaap:GroupPoliciesMember2021-06-300000874766us-gaap:OtherOperatingIncomeExpenseMemberus-gaap:GroupPoliciesMember2022-01-012022-06-300000874766us-gaap:OtherOperatingIncomeExpenseMemberus-gaap:GroupPoliciesMember2021-01-012021-06-300000874766us-gaap:DisabilityInsurancePolicyMemberus-gaap:GroupPoliciesMember2022-01-012022-06-300000874766hig:GrouplifetermdisabilityandaccidentMemberus-gaap:GroupPoliciesMember2022-01-012022-06-300000874766hig:SupplementalHealthMemberus-gaap:GroupPoliciesMember2022-01-012022-06-300000874766us-gaap:DisabilityInsurancePolicyMemberus-gaap:GroupPoliciesMember2021-01-012021-06-300000874766hig:GrouplifetermdisabilityandaccidentMemberus-gaap:GroupPoliciesMember2021-01-012021-06-300000874766hig:SupplementalHealthMemberus-gaap:GroupPoliciesMember2021-01-012021-06-300000874766us-gaap:AnnuitizationBenefitMember2021-12-310000874766us-gaap:AnnuitizationBenefitMember2020-12-310000874766us-gaap:AnnuitizationBenefitMember2022-01-012022-06-300000874766us-gaap:AnnuitizationBenefitMember2021-01-012021-06-300000874766us-gaap:AnnuitizationBenefitMember2022-06-300000874766us-gaap:AnnuitizationBenefitMember2021-06-300000874766hig:JuniorSubordinatedNotesSevenPointEightSevenFivePercentDueTwoThousandFortyTwoMember2022-04-150000874766hig:JuniorSubordinatedNotesSevenPointEightSevenFivePercentDueTwoThousandFortyTwoMember2022-06-300000874766hig:JuniorSubordinatedNotesSevenPointEightSevenFivePercentDueTwoThousandFortyTwoMember2022-04-152022-04-150000874766us-gaap:ForeignCountryMember2022-06-300000874766hig:AsbestosandEnvironmentalMember2022-06-300000874766Asbestos and Environmental [Member]srt:MaximumMember2022-01-012022-06-300000874766Asbestos and Environmental [Member]hig:AsbestosandEnvironmentalMember2017-01-012022-06-300000874766hig:RemainingMemberAsbestos and Environmental [Member]hig:AsbestosandEnvironmentalMember2022-01-012022-06-300000874766hig:A11202112312022Member2021-10-010000874766us-gaap:SubsequentEventMember2022-07-012022-07-270000874766hig:A81202212312024Member2022-07-010000874766us-gaap:AccumulatedNetUnrealizedInvestmentGainLossMember2022-03-310000874766us-gaap:AociGainLossDebtSecuritiesAvailableForSaleWithAllowanceForCreditLossParentMember2022-03-310000874766us-gaap:AccumulatedGainLossNetCashFlowHedgeParentMember2022-03-310000874766us-gaap:AccumulatedTranslationAdjustmentMember2022-03-310000874766us-gaap:AccumulatedDefinedBenefitPlansAdjustmentMember2022-03-310000874766us-gaap:AccumulatedNetUnrealizedInvestmentGainLossMember2022-04-012022-06-300000874766us-gaap:AociGainLossDebtSecuritiesAvailableForSaleWithAllowanceForCreditLossParentMember2022-04-012022-06-300000874766us-gaap:AccumulatedGainLossNetCashFlowHedgeParentMember2022-04-012022-06-300000874766us-gaap:AccumulatedTranslationAdjustmentMember2022-04-012022-06-300000874766us-gaap:AccumulatedDefinedBenefitPlansAdjustmentMember2022-04-012022-06-300000874766us-gaap:AccumulatedNetUnrealizedInvestmentGainLossMember2022-06-300000874766us-gaap:AociGainLossDebtSecuritiesAvailableForSaleWithAllowanceForCreditLossParentMember2022-06-300000874766us-gaap:AccumulatedGainLossNetCashFlowHedgeParentMember2022-06-300000874766us-gaap:AccumulatedTranslationAdjustmentMember2022-06-300000874766us-gaap:AccumulatedDefinedBenefitPlansAdjustmentMember2022-06-300000874766us-gaap:AccumulatedNetUnrealizedInvestmentGainLossMember2021-12-310000874766us-gaap:AociGainLossDebtSecuritiesAvailableForSaleWithAllowanceForCreditLossParentMember2021-12-310000874766us-gaap:AccumulatedGainLossNetCashFlowHedgeParentMember2021-12-310000874766us-gaap:AccumulatedTranslationAdjustmentMember2021-12-310000874766us-gaap:AccumulatedDefinedBenefitPlansAdjustmentMember2021-12-310000874766us-gaap:AccumulatedNetUnrealizedInvestmentGainLossMember2022-01-012022-06-300000874766us-gaap:AociGainLossDebtSecuritiesAvailableForSaleWithAllowanceForCreditLossParentMember2022-01-012022-06-300000874766us-gaap:AccumulatedGainLossNetCashFlowHedgeParentMember2022-01-012022-06-300000874766us-gaap:AccumulatedTranslationAdjustmentMember2022-01-012022-06-300000874766us-gaap:AccumulatedDefinedBenefitPlansAdjustmentMember2022-01-012022-06-300000874766us-gaap:AccumulatedNetUnrealizedInvestmentGainLossMemberus-gaap:ReclassificationOutOfAccumulatedOtherComprehensiveIncomeMember2022-04-012022-06-300000874766us-gaap:AccumulatedNetUnrealizedInvestmentGainLossMemberus-gaap:ReclassificationOutOfAccumulatedOtherComprehensiveIncomeMember2022-01-012022-06-300000874766us-gaap:InterestRateSwapMemberus-gaap:AccumulatedGainLossNetCashFlowHedgeParentMemberus-gaap:ReclassificationOutOfAccumulatedOtherComprehensiveIncomeMember2022-04-012022-06-300000874766us-gaap:InterestRateSwapMemberus-gaap:AccumulatedGainLossNetCashFlowHedgeParentMemberus-gaap:ReclassificationOutOfAccumulatedOtherComprehensiveIncomeMember2022-01-012022-06-300000874766us-gaap:AccumulatedGainLossNetCashFlowHedgeParentMemberus-gaap:CurrencySwapMemberus-gaap:ReclassificationOutOfAccumulatedOtherComprehensiveIncomeMember2022-04-012022-06-300000874766us-gaap:AccumulatedGainLossNetCashFlowHedgeParentMemberus-gaap:CurrencySwapMemberus-gaap:ReclassificationOutOfAccumulatedOtherComprehensiveIncomeMember2022-01-012022-06-300000874766us-gaap:AccumulatedGainLossNetCashFlowHedgeParentMemberus-gaap:ReclassificationOutOfAccumulatedOtherComprehensiveIncomeMember2022-04-012022-06-300000874766us-gaap:AccumulatedGainLossNetCashFlowHedgeParentMemberus-gaap:ReclassificationOutOfAccumulatedOtherComprehensiveIncomeMember2022-01-012022-06-300000874766us-gaap:AccumulatedDefinedBenefitPlansAdjustmentNetPriorServiceCostCreditMemberus-gaap:ReclassificationOutOfAccumulatedOtherComprehensiveIncomeMember2022-04-012022-06-300000874766us-gaap:AccumulatedDefinedBenefitPlansAdjustmentNetPriorServiceCostCreditMemberus-gaap:ReclassificationOutOfAccumulatedOtherComprehensiveIncomeMember2022-01-012022-06-300000874766us-gaap:AccumulatedDefinedBenefitPlansAdjustmentNetUnamortizedGainLossMemberus-gaap:ReclassificationOutOfAccumulatedOtherComprehensiveIncomeMember2022-04-012022-06-300000874766us-gaap:AccumulatedDefinedBenefitPlansAdjustmentNetUnamortizedGainLossMemberus-gaap:ReclassificationOutOfAccumulatedOtherComprehensiveIncomeMember2022-01-012022-06-300000874766us-gaap:AccumulatedDefinedBenefitPlansAdjustmentMemberus-gaap:ReclassificationOutOfAccumulatedOtherComprehensiveIncomeMember2022-04-012022-06-300000874766us-gaap:AccumulatedDefinedBenefitPlansAdjustmentMemberus-gaap:ReclassificationOutOfAccumulatedOtherComprehensiveIncomeMember2022-01-012022-06-300000874766us-gaap:AccumulatedNetUnrealizedInvestmentGainLossMember2021-03-310000874766us-gaap:AociGainLossDebtSecuritiesAvailableForSaleWithAllowanceForCreditLossParentMember2021-03-310000874766us-gaap:AccumulatedGainLossNetCashFlowHedgeParentMember2021-03-310000874766us-gaap:AccumulatedTranslationAdjustmentMember2021-03-310000874766us-gaap:AccumulatedDefinedBenefitPlansAdjustmentMember2021-03-310000874766us-gaap:AccumulatedNetUnrealizedInvestmentGainLossMember2021-04-012021-06-300000874766us-gaap:AociGainLossDebtSecuritiesAvailableForSaleWithAllowanceForCreditLossParentMember2021-04-012021-06-300000874766us-gaap:AccumulatedGainLossNetCashFlowHedgeParentMember2021-04-012021-06-300000874766us-gaap:AccumulatedTranslationAdjustmentMember2021-04-012021-06-300000874766us-gaap:AccumulatedDefinedBenefitPlansAdjustmentMember2021-04-012021-06-300000874766us-gaap:AccumulatedNetUnrealizedInvestmentGainLossMember2021-06-300000874766us-gaap:AociGainLossDebtSecuritiesAvailableForSaleWithAllowanceForCreditLossParentMember2021-06-300000874766us-gaap:AccumulatedGainLossNetCashFlowHedgeParentMember2021-06-300000874766us-gaap:AccumulatedTranslationAdjustmentMember2021-06-300000874766us-gaap:AccumulatedDefinedBenefitPlansAdjustmentMember2021-06-300000874766us-gaap:AccumulatedNetUnrealizedInvestmentGainLossMember2020-12-310000874766us-gaap:AociGainLossDebtSecuritiesAvailableForSaleWithAllowanceForCreditLossParentMember2020-12-310000874766us-gaap:AccumulatedGainLossNetCashFlowHedgeParentMember2020-12-310000874766us-gaap:AccumulatedTranslationAdjustmentMember2020-12-310000874766us-gaap:AccumulatedDefinedBenefitPlansAdjustmentMember2020-12-310000874766us-gaap:AccumulatedNetUnrealizedInvestmentGainLossMember2021-01-012021-06-300000874766us-gaap:AociGainLossDebtSecuritiesAvailableForSaleWithAllowanceForCreditLossParentMember2021-01-012021-06-300000874766us-gaap:AccumulatedGainLossNetCashFlowHedgeParentMember2021-01-012021-06-300000874766us-gaap:AccumulatedTranslationAdjustmentMember2021-01-012021-06-300000874766us-gaap:AccumulatedDefinedBenefitPlansAdjustmentMember2021-01-012021-06-300000874766us-gaap:AccumulatedNetUnrealizedInvestmentGainLossMemberus-gaap:ReclassificationOutOfAccumulatedOtherComprehensiveIncomeMember2021-04-012021-06-300000874766us-gaap:AccumulatedNetUnrealizedInvestmentGainLossMemberus-gaap:ReclassificationOutOfAccumulatedOtherComprehensiveIncomeMember2021-01-012021-06-300000874766us-gaap:InterestRateSwapMemberus-gaap:AccumulatedGainLossNetCashFlowHedgeParentMemberus-gaap:ReclassificationOutOfAccumulatedOtherComprehensiveIncomeMember2021-04-012021-06-300000874766us-gaap:InterestRateSwapMemberus-gaap:AccumulatedGainLossNetCashFlowHedgeParentMemberus-gaap:ReclassificationOutOfAccumulatedOtherComprehensiveIncomeMember2021-01-012021-06-300000874766us-gaap:AccumulatedGainLossNetCashFlowHedgeParentMemberus-gaap:CurrencySwapMemberus-gaap:ReclassificationOutOfAccumulatedOtherComprehensiveIncomeMember2021-04-012021-06-300000874766us-gaap:AccumulatedGainLossNetCashFlowHedgeParentMemberus-gaap:CurrencySwapMemberus-gaap:ReclassificationOutOfAccumulatedOtherComprehensiveIncomeMember2021-01-012021-06-300000874766us-gaap:AccumulatedGainLossNetCashFlowHedgeParentMemberus-gaap:ReclassificationOutOfAccumulatedOtherComprehensiveIncomeMember2021-04-012021-06-300000874766us-gaap:AccumulatedGainLossNetCashFlowHedgeParentMemberus-gaap:ReclassificationOutOfAccumulatedOtherComprehensiveIncomeMember2021-01-012021-06-300000874766us-gaap:AccumulatedDefinedBenefitPlansAdjustmentNetPriorServiceCostCreditMemberus-gaap:ReclassificationOutOfAccumulatedOtherComprehensiveIncomeMember2021-04-012021-06-300000874766us-gaap:AccumulatedDefinedBenefitPlansAdjustmentNetPriorServiceCostCreditMemberus-gaap:ReclassificationOutOfAccumulatedOtherComprehensiveIncomeMember2021-01-012021-06-300000874766us-gaap:AccumulatedDefinedBenefitPlansAdjustmentNetUnamortizedGainLossMemberus-gaap:ReclassificationOutOfAccumulatedOtherComprehensiveIncomeMember2021-04-012021-06-300000874766us-gaap:AccumulatedDefinedBenefitPlansAdjustmentNetUnamortizedGainLossMemberus-gaap:ReclassificationOutOfAccumulatedOtherComprehensiveIncomeMember2021-01-012021-06-300000874766us-gaap:AccumulatedDefinedBenefitPlansAdjustmentMemberus-gaap:ReclassificationOutOfAccumulatedOtherComprehensiveIncomeMember2021-04-012021-06-300000874766us-gaap:AccumulatedDefinedBenefitPlansAdjustmentMemberus-gaap:ReclassificationOutOfAccumulatedOtherComprehensiveIncomeMember2021-01-012021-06-300000874766us-gaap:PensionPlansDefinedBenefitMember2022-04-012022-06-300000874766us-gaap:PensionPlansDefinedBenefitMember2021-04-012021-06-300000874766us-gaap:PensionPlansDefinedBenefitMember2022-01-012022-06-300000874766us-gaap:PensionPlansDefinedBenefitMember2021-01-012021-06-300000874766us-gaap:OtherPostretirementBenefitPlansDefinedBenefitMember2022-04-012022-06-300000874766us-gaap:OtherPostretirementBenefitPlansDefinedBenefitMember2021-04-012021-06-300000874766us-gaap:OtherPostretirementBenefitPlansDefinedBenefitMember2022-01-012022-06-300000874766us-gaap:OtherPostretirementBenefitPlansDefinedBenefitMember2021-01-012021-06-300000874766us-gaap:OtherOperatingIncomeExpenseMemberhig:HartfordNextMember2022-06-300000874766us-gaap:OtherOperatingIncomeExpenseMemberus-gaap:EmployeeSeveranceMemberhig:HartfordNextMember2022-04-012022-06-300000874766us-gaap:OtherOperatingIncomeExpenseMemberus-gaap:EmployeeSeveranceMemberhig:HartfordNextMember2021-04-012021-06-300000874766us-gaap:OtherOperatingIncomeExpenseMemberus-gaap:EmployeeSeveranceMemberhig:HartfordNextMember2022-01-012022-06-300000874766us-gaap:OtherOperatingIncomeExpenseMemberus-gaap:EmployeeSeveranceMemberhig:HartfordNextMember2021-01-012021-06-300000874766us-gaap:OtherOperatingIncomeExpenseMemberus-gaap:EmployeeSeveranceMemberhig:HartfordNextMember2020-07-012022-06-300000874766us-gaap:OtherOperatingIncomeExpenseMemberus-gaap:EmployeeSeveranceMemberhig:HartfordNextMember2022-06-300000874766us-gaap:OtherOperatingIncomeExpenseMemberhig:HartfordNextMemberhig:InformationTechnologyMember2022-04-012022-06-300000874766us-gaap:OtherOperatingIncomeExpenseMemberhig:HartfordNextMemberhig:InformationTechnologyMember2021-04-012021-06-300000874766us-gaap:OtherOperatingIncomeExpenseMemberhig:HartfordNextMemberhig:InformationTechnologyMember2022-01-012022-06-300000874766us-gaap:OtherOperatingIncomeExpenseMemberhig:HartfordNextMemberhig:InformationTechnologyMember2021-01-012021-06-300000874766us-gaap:OtherOperatingIncomeExpenseMemberhig:HartfordNextMemberhig:InformationTechnologyMember2020-07-012022-06-300000874766us-gaap:OtherOperatingIncomeExpenseMemberhig:HartfordNextMemberhig:InformationTechnologyMember2022-06-300000874766us-gaap:OtherOperatingIncomeExpenseMemberhig:HartfordNextMemberhig:ProfessionalFeesAndOtherExpensesMember2022-04-012022-06-300000874766us-gaap:OtherOperatingIncomeExpenseMemberhig:HartfordNextMemberhig:ProfessionalFeesAndOtherExpensesMember2021-04-012021-06-300000874766us-gaap:OtherOperatingIncomeExpenseMemberhig:HartfordNextMemberhig:ProfessionalFeesAndOtherExpensesMember2022-01-012022-06-300000874766us-gaap:OtherOperatingIncomeExpenseMemberhig:HartfordNextMemberhig:ProfessionalFeesAndOtherExpensesMember2021-01-012021-06-300000874766us-gaap:OtherOperatingIncomeExpenseMemberhig:HartfordNextMemberhig:ProfessionalFeesAndOtherExpensesMember2020-07-012022-06-300000874766us-gaap:OtherOperatingIncomeExpenseMemberhig:HartfordNextMemberhig:ProfessionalFeesAndOtherExpensesMember2022-06-300000874766us-gaap:OtherOperatingIncomeExpenseMemberhig:HartfordNextMember2022-04-012022-06-300000874766us-gaap:OtherOperatingIncomeExpenseMemberhig:HartfordNextMember2021-04-012021-06-300000874766us-gaap:OtherOperatingIncomeExpenseMemberhig:HartfordNextMember2022-01-012022-06-300000874766us-gaap:OtherOperatingIncomeExpenseMemberhig:HartfordNextMember2021-01-012021-06-300000874766us-gaap:OtherOperatingIncomeExpenseMemberhig:HartfordNextMember2020-07-012022-06-300000874766us-gaap:EmployeeSeveranceMemberhig:HartfordNextMemberus-gaap:OtherLiabilitiesMember2021-12-310000874766hig:HartfordNextMemberus-gaap:OtherLiabilitiesMemberhig:InformationTechnologyMember2021-12-310000874766hig:HartfordNextMemberhig:ProfessionalFeesAndOtherExpensesMemberus-gaap:OtherLiabilitiesMember2021-12-310000874766hig:HartfordNextMemberus-gaap:OtherLiabilitiesMember2021-12-310000874766us-gaap:EmployeeSeveranceMemberhig:HartfordNextMember2022-01-012022-06-300000874766hig:HartfordNextMemberhig:InformationTechnologyMember2022-01-012022-06-300000874766hig:HartfordNextMemberhig:ProfessionalFeesAndOtherExpensesMember2022-01-012022-06-300000874766hig:HartfordNextMember2022-01-012022-06-300000874766us-gaap:EmployeeSeveranceMemberhig:HartfordNextMemberus-gaap:OtherLiabilitiesMember2022-06-300000874766hig:HartfordNextMemberus-gaap:OtherLiabilitiesMemberhig:InformationTechnologyMember2022-06-300000874766hig:HartfordNextMemberhig:ProfessionalFeesAndOtherExpensesMemberus-gaap:OtherLiabilitiesMember2022-06-300000874766hig:HartfordNextMemberus-gaap:OtherLiabilitiesMember2022-06-300000874766us-gaap:EmployeeSeveranceMemberhig:HartfordNextMemberus-gaap:OtherLiabilitiesMember2020-12-310000874766hig:HartfordNextMemberus-gaap:OtherLiabilitiesMemberhig:InformationTechnologyMember2020-12-310000874766hig:HartfordNextMemberhig:ProfessionalFeesAndOtherExpensesMemberus-gaap:OtherLiabilitiesMember2020-12-310000874766hig:HartfordNextMemberus-gaap:OtherLiabilitiesMember2020-12-310000874766us-gaap:EmployeeSeveranceMemberhig:HartfordNextMember2021-01-012021-06-300000874766hig:HartfordNextMemberhig:InformationTechnologyMember2021-01-012021-06-300000874766hig:HartfordNextMemberhig:ProfessionalFeesAndOtherExpensesMember2021-01-012021-06-300000874766hig:HartfordNextMember2021-01-012021-06-300000874766us-gaap:EmployeeSeveranceMemberhig:HartfordNextMemberus-gaap:OtherLiabilitiesMember2021-06-300000874766hig:HartfordNextMemberus-gaap:OtherLiabilitiesMemberhig:InformationTechnologyMember2021-06-300000874766hig:HartfordNextMemberhig:ProfessionalFeesAndOtherExpensesMemberus-gaap:OtherLiabilitiesMember2021-06-300000874766hig:HartfordNextMemberus-gaap:OtherLiabilitiesMember2021-06-30
UNITED STATES
SECURITIES AND EXCHANGE COMMISSION
Washington, D.C. 20549
____________________________________
FORM 10-Q
____________________________________
(Mark One)
| | | | | |
☒ | QUARTERLY REPORT PURSUANT TO SECTION 13 OR 15(d) OF THE SECURITIES EXCHANGE ACT OF 1934 |
For the quarterly period ended June 30, 2022
or
| | | | | |
☐ | TRANSITION REPORT PURSUANT TO SECTION 13 OR 15(d) OF THE SECURITIES EXCHANGE ACT OF 1934 |
For the transition period from ____________ to ______________
Commission file number 001-13958
____________________________________
THE HARTFORD FINANCIAL SERVICES GROUP, INC.
(Exact name of registrant as specified in its charter)
| | | | | | | | |
Delaware | | 13-3317783 |
| (State or other jurisdiction of incorporation or organization) | | (I.R.S. Employer Identification No.) |
One Hartford Plaza, Hartford, Connecticut 06155
(Address of principal executive offices) (Zip Code)
(860) 547-5000
(Registrant’s telephone number, including area code)
Securities registered pursuant to Section 12(b) of the Act:
| | | | | | | | |
| Title of each class | Trading Symbol(s) | Name of each exchange on which registered |
| Common Stock, par value $0.01 per share | HIG | The New York Stock Exchange |
| 6.10% Notes due October 1, 2041 | HIG 41 | The New York Stock Exchange |
| | |
| Depositary Shares, Each Representing a 1/1,000th Interest in a Share of 6.000% Non-Cumulative Preferred Stock, Series G, par value $0.01 per share | HIG PR G | The New York Stock Exchange |
| | | | | | | | | | | | | | |
| Indicate by check mark: | | | | |
| | | | |
• whether the registrant (1) has filed all reports required to be filed by Section 13 or 15(d) of the Securities Exchange Act of 1934 during the preceding 12 months (or for such shorter period that the registrant was required to file such reports), and (2) has been subject to such filing requirements for the past 90 days. | Yes | ☒ | No | ☐ |
| | | | |
• whether the registrant has submitted electronically every Interactive Data File required to be submitted pursuant to Rule 405 of Regulation S-T during the preceding 12 months (or for such shorter period that the registrant was required to submit such files). | Yes | ☒ | No | ☐ |
| | | | |
• whether the registrant is a large accelerated filer, an accelerated filer, a non-accelerated filer, a smaller reporting company, or an emerging growth company. See definitions of “large accelerated filer,” “accelerated filer,” “smaller reporting company” and "emerging growth company" in Rule 12b-2 of the Exchange Act. | | | | |
| | | | | | | | | | | | | | | | | | | | | | | | | | | | | |
| Large accelerated filer | ☒ | Accelerated filer | ☐ | Non-accelerated filer | ☐ | Smaller reporting company | ☐ | Emerging growth company | ☐ |
If an emerging growth company, indicate by check mark if the registrant has elected not to use the extended transition period for complying with any new or revised financial accounting standards provided pursuant to Section 13(a) of the Exchange Act.
| | | | | | | | | | | | | | |
| • whether the registrant is a shell company (as defined in Rule 12b-2 of the Exchange Act). | Yes | ☐ | No | ☒ |
As of July 27, 2022, there were outstanding 323,142,378 shares of Common Stock, $0.01 par value per share, of the registrant.
THE HARTFORD FINANCIAL SERVICES GROUP, INC.
QUARTERLY REPORT ON FORM 10-Q
FOR THE QUARTERLY PERIOD ENDED JUNE 30, 2022
TABLE OF CONTENTS
| | | | | | | | |
| Item | Description | Page |
| | |
| 1. | | |
| | |
| | |
| | |
| | |
| | |
| | |
| | |
| | |
| | |
| | |
| | |
| | |
| | |
| | |
| | |
| | |
| | |
| | |
| | |
| | |
| | |
| | |
| | |
| | |
| 2. | | |
| 3. | QUANTITATIVE AND QUALITATIVE DISCLOSURES ABOUT MARKET RISK | [a] |
| 4. | | |
| | |
| 1. | | |
| 1A. | | |
| 2. | | |
| 6. | | |
| | |
| | |
[a]The information required by this item is set forth in the Enterprise Risk Management section of Item 2, Management's Discussion and Analysis of Financial Condition and Results of Operations and is incorporated herein by reference.
Forward-looking Statements
Certain of the statements contained herein are forward-looking statements made pursuant to the safe harbor provisions of the Private Securities Litigation Reform Act of 1995. Forward-looking statements can be identified by words such as “anticipates,” “intends,” “plans,” “seeks,” “believes,” “estimates,” “expects,” “projects,” and similar references to future periods.
Forward-looking statements are based on management's current expectations and assumptions regarding future economic, competitive, legislative and other developments and their potential effect upon The Hartford Financial Services Group, Inc. and its subsidiaries (collectively, the "Company" or "The Hartford"). Because forward-looking statements relate to the future, they are subject to inherent uncertainties, risks and changes in circumstances that are difficult to predict. Actual results could differ materially from expectations depending on the evolution of various factors, including the risks and uncertainties identified below, as well as factors described in such forward-looking statements, the Risk Factors of The Hartford's 2021 Form 10-K Annual Report, and our other filings with the Securities and Exchange Commission.
•Risks relating to the continued COVID-19 pandemic, including impacts to the Company's insurance and product-related, regulatory/legal, recessionary and other global economic, capital and liquidity and operational risks
•Risks Relating to Economic, Political and Global Market Conditions:
◦challenges related to the Company’s current operating environment, including global political, economic and market conditions, and the effect of financial market disruptions, economic downturns, changes in trade regulation including tariffs and other barriers or other potentially adverse macroeconomic developments on the demand for our products and returns in our investment portfolios;
◦market risks associated with our business, including changes in credit spreads, equity prices, interest rates, inflation rate, foreign currency exchange rates and market volatility;
◦the impact on our investment portfolio if our investment portfolio is concentrated in any particular segment of the economy;
◦the impacts of changing climate and weather patterns on our businesses, operations and investment portfolio including on claims, demand and pricing of our products, the availability and cost of reinsurance, our modeling data used to evaluate and manage risks of catastrophes and severe weather events, the value of our investment portfolios and credit risk with reinsurers and other counterparties;
◦the risks associated with the discontinuance of the London Inter-Bank Offered Rate ("LIBOR") on the securities we hold or may have issued, other financial instruments and any other assets and liabilities whose value is tied to LIBOR;
•Insurance Industry and Product-Related Risks:
◦the possibility of unfavorable loss development, including with respect to long-tailed exposures;
◦the significant uncertainties that limit our ability to estimate the ultimate reserves necessary for asbestos and environmental claims;
◦the possibility of another pandemic, civil unrest, earthquake, or other natural or man-made disaster that may adversely affect our businesses;
◦weather and other natural physical events, including the intensity and frequency of thunderstorms, tornadoes, hail, wildfires, flooding, winter storms, hurricanes and tropical storms, as well as climate change and its potential impact on weather patterns;
◦the possible occurrence of terrorist attacks and the Company’s inability to contain its exposure as a result of, among other factors, the inability to exclude coverage for terrorist attacks from workers' compensation policies and limitations on reinsurance coverage from the federal government under applicable laws;
◦the Company’s ability to effectively price its property and casualty policies, including its ability to obtain regulatory consents to pricing actions or to non-renewal or withdrawal of certain product lines;
◦actions by competitors that may be larger or have greater financial resources than we do;
◦technological changes, including usage-based methods of determining premiums, advancements in automotive safety features, the development of autonomous vehicles, and platforms that facilitate ride sharing;
◦the Company's ability to market, distribute and provide insurance products and investment advisory services through current and future distribution channels and advisory firms;
◦the uncertain effects of emerging claim and coverage issues;
◦political instability, politically motivated violence or civil unrest, which may increase the frequency and severity of insured losses;
•Financial Strength, Credit and Counterparty Risks:
◦risks to our business, financial position, prospects and results associated with negative rating actions or downgrades in the Company’s financial strength and credit ratings or negative rating actions or downgrades relating to our investments;
◦capital requirements which are subject to many factors, including many that are outside the Company’s control, such as National Association of Insurance Commissioners ("NAIC") risk based capital formulas, rating agency capital models, Funds at Lloyd's and Solvency Capital Requirement, which can in turn affect our credit and financial strength ratings, cost of capital, regulatory compliance and other aspects of our business and results;
◦losses due to nonperformance or defaults by others, including credit risk with counterparties associated with investments, derivatives, premiums receivable, reinsurance recoverables and indemnifications provided by third parties in connection with previous dispositions;
◦the potential for losses due to our reinsurers' unwillingness or inability to meet their obligations under reinsurance contracts and the availability, pricing and adequacy of reinsurance to protect the Company against losses;
◦state and international regulatory limitations on the ability of the Company and certain of its subsidiaries to declare and pay dividends;
•Risks Relating to Estimates, Assumptions and Valuations:
◦risks associated with the use of analytical models in making decisions in key areas such as underwriting, pricing, capital management, reserving, investments, reinsurance and catastrophe risk management;
◦the potential for differing interpretations of the methodologies, estimations and assumptions that underlie the Company’s fair value estimates for its investments and the evaluation of intent-to-sell impairments and allowance for credit losses on available-for-sale securities and mortgage loans;
◦the potential for impairments of our goodwill;
•Strategic and Operational Risks:
◦the Company’s ability to maintain the availability of its systems and safeguard the security of its data in the event of a disaster, cyber or other information security incident or other unanticipated event;
◦the potential for difficulties arising from outsourcing and similar third-party relationships;
◦the risks, challenges and uncertainties associated with capital management plans, expense reduction initiatives and other actions;
◦risks associated with acquisitions and divestitures, including the challenges of integrating acquired companies or businesses, which may result in our inability to achieve the anticipated benefits and synergies and may result in unintended consequences;
◦difficulty in attracting and retaining talented and qualified personnel, including key employees, such as executives, managers and employees with strong technological, analytical and other specialized skills;
◦the Company’s ability to protect its intellectual property and defend against claims of infringement;
•Regulatory and Legal Risks:
◦the cost and other potential effects of increased federal, state and international regulatory and legislative developments, including those that could adversely impact the demand for the Company’s products, operating costs and required capital levels;
◦unfavorable judicial or legislative developments;
◦the impact of changes in federal, state or foreign tax laws;
◦regulatory requirements that could delay, deter or prevent a takeover attempt that stockholders might consider in their best interests; and
◦the impact of potential changes in accounting principles and related financial reporting requirements.
Any forward-looking statement made by the Company in this document speaks only as of the date of the filing of this Form 10-Q. Factors or events that could cause the Company’s actual results to differ may emerge from time to time, and it is not possible for the Company to predict all of them. The Company undertakes no obligation to publicly update any forward-looking statement, whether as a result of new information, future developments or otherwise.
|Part I - Item 1. Financial Statements
FINANCIAL STATEMENTS
REPORT OF INDEPENDENT REGISTERED PUBLIC ACCOUNTING FIRM
To the Board of Directors and Stockholders of
The Hartford Financial Services Group, Inc.
Hartford, Connecticut
Results of Review of Interim Financial Information
We have reviewed the accompanying condensed consolidated balance sheet of The Hartford Financial Services Group, Inc. and subsidiaries (the "Company") as of June 30, 2022, the related condensed consolidated statements of operations, comprehensive income (loss), and changes in stockholders' equity, for the three-month and six-month periods ended June 30, 2022 and 2021, and of cash flows for the six-month periods ended June 30, 2022 and 2021, and the related notes (collectively referred to as the "interim financial information"). Based on our reviews, we are not aware of any material modifications that should be made to the accompanying interim financial information for it to be in conformity with accounting principles generally accepted in the United States of America.
We have previously audited, in accordance with the standards of the Public Company Accounting Oversight Board (United States) (PCAOB), the consolidated balance sheet of the Company as of December 31, 2021, and the related consolidated statements of operations, comprehensive income (loss), changes in stockholders' equity, and cash flows for the year then ended (not presented herein); and in our report dated February 18, 2022, we expressed an unqualified opinion on those consolidated financial statements. In our opinion, the information set forth in the accompanying condensed consolidated balance sheet as of December 31, 2021, is fairly stated, in all material respects, in relation to the consolidated balance sheet from which it has been derived.
Basis for Review Results
This interim financial information is the responsibility of the Company's management. We are a public accounting firm registered with the PCAOB and are required to be independent with respect to the Company in accordance with the U.S. federal securities laws and the applicable rules and regulations of the Securities and Exchange Commission and the PCAOB.
We conducted our reviews in accordance with standards of the PCAOB. A review of interim financial information consists principally of applying analytical procedures and making inquiries of persons responsible for financial and accounting matters. It is substantially less in scope than an audit conducted in accordance with the standards of the PCAOB, the objective of which is the expression of an opinion regarding the financial statements taken as a whole. Accordingly, we do not express such an opinion.
/s/ DELOITTE & TOUCHE LLP
Hartford, Connecticut
July 28, 2022
THE HARTFORD FINANCIAL SERVICES GROUP, INC.
Condensed Consolidated Statements of Operations
| | | | | | | | | | | | | | | | | |
| Three Months Ended June 30, | | Six Months Ended June 30, |
| (in millions, except for per share data) | 2022 | 2021 | | 2022 | 2021 |
| (Unaudited) |
| Revenues | | | | | |
| Earned premiums | $ | 4,810 | | $ | 4,460 | | | $ | 9,461 | | $ | 8,803 | |
| Fee income | 341 | | 375 | | | 703 | | 730 | |
| Net investment income | 541 | | 581 | | | 1,050 | | 1,090 | |
| Net realized (losses) gains | (338) | | 147 | | | (483) | | 227 | |
| Other revenues | 19 | | 26 | | | 35 | | 38 | |
| Total revenues | 5,373 | | 5,589 | | | 10,766 | | 10,888 | |
| Benefits, losses and expenses | | | | | |
| Benefits, losses and loss adjustment expenses | 3,076 | | 2,786 | | | 6,194 | | 6,136 | |
Amortization of deferred policy acquisition costs ("DAC") | 453 | | 417 | | | 893 | | 833 | |
| Insurance operating costs and other expenses | 1,222 | | 1,202 | | | 2,429 | | 2,346 | |
| | | | | |
| | | | | |
| | | | | |
| Interest expense | 51 | | 57 | | | 113 | | 114 | |
| Amortization of other intangible assets | 17 | | 17 | | | 35 | | 35 | |
| Restructuring and other costs | 2 | | — | | | 7 | | 11 | |
| Total benefits, losses and expenses | 4,821 | | 4,479 | | | 9,671 | | 9,475 | |
| Income before income taxes | 552 | | 1,110 | | | 1,095 | | 1,413 | |
| Income tax expense | 110 | | 205 | | | 208 | | 259 | |
| | | | | |
| | | | | |
| Net income | 442 | | 905 | | | 887 | | 1,154 | |
| Preferred stock dividends | 5 | | 5 | | | 10 | | 10 | |
| Net income available to common stockholders | $ | 437 | | $ | 900 | | | $ | 877 | | $ | 1,144 | |
| | | | | |
| | | | | |
| | | | | |
| | | | | |
| Net income available to common stockholders per common share | | | | | |
| Basic | $ | 1.33 | | $ | 2.54 | | | $ | 2.66 | | $ | 3.21 | |
| Diluted | $ | 1.32 | | $ | 2.51 | | | $ | 2.62 | | $ | 3.17 | |
See Notes to Condensed Consolidated Financial Statements.
THE HARTFORD FINANCIAL SERVICES GROUP, INC.
Condensed Consolidated Statements of Comprehensive Income (Loss)
| | | | | | | | | | | | | | | | | |
| | Three Months Ended June 30, | | Six Months Ended June 30, |
| (in millions) | 2022 | 2021 | | 2022 | 2021 |
| | (Unaudited) |
| Net income | $ | 442 | | $ | 905 | | | $ | 887 | | $ | 1,154 | |
Other comprehensive income (loss) ("OCI"): | | | | | |
| Change in net unrealized gain (loss) on fixed maturities | (1,592) | | 295 | | | (3,474) | | (630) | |
| | | | | |
| | | | | |
| Change in net gain on cash flow hedging instruments | 25 | | (5) | | | 24 | | — | |
| Change in foreign currency translation adjustments | (8) | | 2 | | | (8) | | 3 | |
| Changes in pension and other postretirement plan adjustments | 12 | | 14 | | | 24 | | 27 | |
| Other comprehensive income (loss), net of tax | (1,563) | | 306 | | | (3,434) | | (600) | |
| Comprehensive income (loss) | $ | (1,121) | | $ | 1,211 | | | $ | (2,547) | | $ | 554 | |
See Notes to Condensed Consolidated Financial Statements.
THE HARTFORD FINANCIAL SERVICES GROUP, INC.
Condensed Consolidated Balance Sheets
| | | | | | | | |
| (in millions, except for share and per share data) | June 30,
2022 | December 31, 2021 |
| | (Unaudited) | |
| Assets | |
| Investments: | | |
Fixed maturities, available-for-sale ("AFS"), at fair value (amortized cost of $40,258 and $40,788, and allowance for credit losses ("ACL") of $13 and $1) | $ | 37,887 | | $ | 42,847 | |
Fixed maturities, at fair value using the fair value option ("FVO") | 342 | | 160 | |
| Equity securities, at fair value | 1,728 | | 2,094 | |
Mortgage loans (net of ACL of $36 and $29) | 5,852 | | 5,383 | |
| Limited partnerships and other alternative investments | 3,856 | | 3,353 | |
| Other investments | 203 | | 215 | |
| Short-term investments | 2,524 | | 3,697 | |
| Total investments | 52,392 | | 57,749 | |
| Cash | 258 | | 205 | |
| Restricted cash | 90 | | 132 | |
Premiums receivable and agents' balances (net of ACL of $107 and $105) | 4,996 | | 4,445 | |
Reinsurance recoverables (net of allowance for uncollectible reinsurance of $105 and $99) | 6,726 | | 6,523 | |
| Deferred policy acquisition costs | 975 | | 881 | |
| Deferred income taxes, net | 1,191 | | 270 | |
| Goodwill | 1,911 | | 1,911 | |
| Property and equipment, net | 970 | | 1,027 | |
| Other intangible assets, net | 813 | | 858 | |
| Other assets | 2,080 | | 2,577 | |
| | |
| Total assets | $ | 72,402 | | $ | 76,578 | |
| Liabilities | | |
| Unpaid losses and loss adjustment expenses | $ | 40,032 | | $ | 39,659 | |
| Reserve for future policy benefits | 576 | | 596 | |
| Other policyholder funds and benefits payable | 664 | | 687 | |
| Unearned premiums | 7,838 | | 7,194 | |
| | |
| Long-term debt | 4,355 | | 4,944 | |
| Other liabilities | 4,711 | | 5,655 | |
| | |
| Total liabilities | 58,176 | | 58,735 | |
| Commitments and Contingencies (Note 13) | | |
| Stockholders’ Equity | | |
Preferred stock, $0.01 par value — 50,000,000 shares authorized, 13,800 shares issued at June 30, 2022 and December 31, 2021, aggregate liquidation preference of $345 | 334 | | 334 | |
Common stock, $0.01 par value —1,500,000,000 shares authorized, 366,960,228 shares issued at June 30, 2022 and December 31, 2021 | 4 | | 4 | |
| Additional paid-in capital | 3,264 | | 3,309 | |
| Retained earnings | 16,388 | | 15,764 | |
Treasury stock, at cost 42,215,668 and 32,034,244 shares | (2,502) | | (1,740) | |
Accumulated other comprehensive income (loss) ("AOCI") , net of tax | (3,262) | | 172 | |
| Total stockholders’ equity | 14,226 | | 17,843 | |
| Total liabilities and stockholders’ equity | $ | 72,402 | | $ | 76,578 | |
See Notes to Condensed Consolidated Financial Statements.
THE HARTFORD FINANCIAL SERVICES GROUP, INC.
Condensed Consolidated Statements of Changes in Stockholders' Equity
| | | | | | | | | | | | | | | | | |
| | Three Months Ended June 30, | | Six Months Ended June 30, |
| (in millions, except for share and per share data) | 2022 | 2021 | | 2022 | 2021 |
| | (Unaudited) |
| Preferred Stock | $ | 334 | | $ | 334 | | | $ | 334 | | $ | 334 | |
| Common Stock | 4 | | 4 | | | 4 | | 4 | |
| Additional Paid-in Capital | | | | | |
| Additional Paid-in Capital, beginning of period | 3,249 | | 4,310 | | | 3,309 | | 4,322 | |
| Issuance of shares under incentive and stock compensation plans and other | (7) | | (2) | | | (122) | | (71) | |
| Stock-based compensation plans expense | 22 | | 22 | | | 77 | | 79 | |
| | | | | |
| Additional Paid-in Capital, end of period | 3,264 | | 4,330 | | | 3,264 | | 4,330 | |
| Retained Earnings | | | | | |
| Retained Earnings, beginning of period | 16,077 | | 14,036 | | | 15,764 | | 13,918 | |
| | | | | |
| | | | | |
| Net income | 442 | | 905 | | | 887 | | 1,154 | |
| Dividends declared on preferred stock | (5) | | (5) | | | (10) | | (10) | |
| Dividends declared on common stock | (126) | | (123) | | | (253) | | (249) | |
| Retained Earnings, end of period | 16,388 | | 14,813 | | | 16,388 | | 14,813 | |
| Treasury Stock, at cost | | | | | |
| Treasury Stock, at cost, beginning of period | (2,068) | | (1,246) | | | (1,740) | | (1,192) | |
| Treasury stock acquired | (450) | | (568) | | | (850) | | (691) | |
| | | | | |
| Issuance of shares under incentive and stock compensation plans from treasury stock and other | 18 | | 8 | | | 142 | | 102 | |
| Net shares acquired related to employee incentive and stock compensation plans | (2) | | (1) | | | (54) | | (26) | |
| | | | | |
| Treasury Stock, at cost, end of period | (2,502) | | (1,807) | | | (2,502) | | (1,807) | |
| Accumulated Other Comprehensive Income (Loss), net of tax | | | | | |
| Accumulated Other Comprehensive Income, net of tax, beginning of period | (1,699) | | 264 | | | 172 | | 1,170 | |
| | | | | |
| | | | | |
| Total other comprehensive income (loss) | (1,563) | | 306 | | | (3,434) | | (600) | |
| Accumulated Other Comprehensive Income (Loss), net of tax, end of period | (3,262) | | 570 | | | (3,262) | | 570 | |
| Total Stockholders’ Equity | $ | 14,226 | | $ | 18,244 | | | $ | 14,226 | | $ | 18,244 | |
| | | | | |
| Preferred Shares Outstanding | 13,800 | | 13,800 | | | 13,800 | | 13,800 | |
| | | | | |
| | | | | |
| | | | | |
| Common Shares Outstanding (in thousands) | | | | | |
| Common Shares Outstanding, beginning of period | 330,709 | | 357,517 | | | 334,926 | | 358,489 | |
| Treasury stock acquired | (6,355) | | (8,650) | | | (12,037) | | (11,036) | |
| Issuance of shares under incentive and stock compensation plans and other | 411 | | 143 | | | 2,621 | | 2,057 | |
| Return of shares under incentive and stock compensation plans to treasury stock | (20) | | (12) | | | (765) | | (512) | |
| | | | | |
| Common Shares Outstanding, at end of period | 324,745 | | 348,998 | | | 324,745 | | 348,998 | |
| Cash dividends declared per common share | $ | 0.385 | | $ | 0.350 | | | $ | 0.770 | | $ | 0.700 | |
| Cash dividends declared per preferred share | $ | 375.00 | | $ | 375.00 | | | $ | 750.00 | | $ | 750.00 | |
See Notes to Condensed Consolidated Financial Statements.
THE HARTFORD FINANCIAL SERVICES GROUP, INC.
Condensed Consolidated Statements of Cash Flows
| | | | | | | | |
| | Six Months Ended June 30, |
| (in millions) | 2022 | 2021 |
| Operating Activities | (Unaudited) |
| Net income | $ | 887 | | $ | 1,154 | |
| Adjustments to reconcile net income to net cash provided by operating activities: | | |
| Net realized losses (gains) | 483 | | (227) | |
| Amortization of deferred policy acquisition costs | 893 | | 833 | |
| Additions to deferred policy acquisition costs | (978) | | (885) | |
| Depreciation and amortization | 332 | | 347 | |
| Loss on extinguishment of debt | 9 | | — | |
| | |
| | |
| Other operating activities, net | — | | (88) | |
| Change in assets and liabilities: | | |
| Increase in reinsurance recoverables | (205) | | (220) | |
| Net change in accrued and deferred income taxes | (127) | | (24) | |
| Increase in insurance liabilities | 1,008 | | 1,330 | |
| | |
| | |
| Net change in other assets and other liabilities | (899) | | (623) | |
| Net cash provided by operating activities | 1,403 | | 1,597 | |
| Investing Activities | | |
| Proceeds from the sale/maturity/prepayment of: | | |
| Fixed maturities, available-for-sale | 10,047 | | 11,370 | |
| Fixed maturities, fair value option | 1 | | — | |
| Equity securities, at fair value | 350 | | 317 | |
| Mortgage loans | 700 | | 858 | |
| Partnerships | 140 | | 340 | |
| Payments for the purchase of: | | |
| Fixed maturities, available-for-sale | (9,644) | | (10,716) | |
| Fixed maturities, fair value option | (216) | | — | |
| Equity securities, at fair value | (472) | | (922) | |
| Mortgage loans | (1,176) | | (1,229) | |
| Partnerships | (541) | | (441) | |
| Net proceeds from (payments for) derivatives | 52 | | (5) | |
| Net additions of property and equipment | (77) | | (47) | |
| Net proceeds from (payments for) short-term investments | 1,207 | | (102) | |
| Other investing activities, net | 16 | | (2) | |
| | |
| | |
| Net cash provided by (used for) investing activities | 387 | | (579) | |
| Financing Activities | | |
| Deposits and other additions to investment and universal life-type contracts | 46 | | 42 | |
| Withdrawals and other deductions from investment and universal life-type contracts | (68) | | (37) | |
| | |
| | |
| | |
| | |
| Repayment of debt | (600) | | — | |
| | |
| Net issuance (return) of shares under incentive and stock compensation plans | (34) | | 5 | |
| Treasury stock acquired | (850) | | (691) | |
| Dividends paid on preferred stock | (10) | | (10) | |
| Dividends paid on common stock | (257) | | (242) | |
| Net cash used for financing activities | (1,773) | | (933) | |
| Foreign exchange rate effect on cash | (6) | | 1 | |
| Net increase in cash and restricted cash, including cash classified within assets held for sale | 11 | | 86 | |
| Less: Net increase in cash classified within assets held for sale | — | | 17 | |
| Net increase in cash and restricted cash | 11 | | 69 | |
| Cash and restricted cash – beginning of period | 337 | | 239 | |
| Cash and restricted cash– end of period | $ | 348 | | $ | 308 | |
| Supplemental Disclosure of Cash Flow Information | | |
| Income tax paid | $ | 279 | | $ | 233 | |
| Interest paid | $ | 116 | | $ | 107 | |
| | |
| | |
See Notes to Condensed Consolidated Financial Statements.
| | | | | | | | | |
| | Note 1 - Basis of Presentation and Significant Accounting Policies |
THE HARTFORD FINANCIAL SERVICES GROUP, INC.
NOTES TO CONDENSED CONSOLIDATED FINANCIAL STATEMENTS
(Dollar amounts in millions, except for per share data, unless otherwise stated)
(Unaudited)
1. BASIS OF PRESENTATION AND SIGNIFICANT ACCOUNTING POLICIES
BASIS OF PRESENTATION
The Hartford Financial Services Group, Inc. is a holding company for insurance and financial services subsidiaries that provide property and casualty insurance, group life and disability products and mutual funds and exchange-traded funds ("ETF") to individual and business customers in the United States as well as in the United Kingdom and other international locations (collectively, “The Hartford”, the “Company”, “we” or “our”).
On December 29, 2021, the Company completed the sale of Navigators Holdings (Europe) N.V., a Belgium holding company, and its subsidiaries, Bracht, Deckers & Mackelbert N.V. and Assurances Contintales Contintale Verzekeringen N.V., collectively referred to as "Continental Europe Operations."
The Condensed Consolidated Financial Statements have been prepared in accordance with accounting principles generally accepted in the United States of America (“U.S. GAAP”) for interim financial information, which differ materially from the accounting practices prescribed by various insurance regulatory authorities. These Condensed Consolidated Financial Statements and Notes should be read in conjunction with the Consolidated Financial Statements and Notes thereto included in the Company's 2021 Form 10-K Annual Report. The results of operations for interim periods are not necessarily indicative of the results that may be expected for the full year.
The accompanying Condensed Consolidated Financial Statements and Notes are unaudited. These financial statements reflect all adjustments (generally consisting only of normal accruals) which are, in the opinion of management, necessary for the fair statement of the financial position, results of operations and cash flows for the interim periods. The Company's significant accounting policies are summarized in Note 1 - Basis of Presentation and Significant Accounting
Policies of Notes to Consolidated Financial Statements included in the Company's 2021 Form 10-K Annual Report.
CONSOLIDATION
The Condensed Consolidated Financial Statements include the accounts of The Hartford Financial Services Group, Inc., and entities in which the Company directly or indirectly has a controlling financial interest. Entities in which the Company has significant influence over the operating and financing decisions but does not control are reported using the equity method. Intercompany transactions and balances between The Hartford and its subsidiaries and affiliates have been eliminated.
USE OF ESTIMATES
The preparation of financial statements in conformity with U.S. GAAP requires management to make estimates and assumptions that affect the reported amounts of assets and liabilities and the disclosure of contingent assets and liabilities at the date of the financial statements and the reported amounts of revenues and expenses during the reporting period. Actual results could differ from those estimates.
The most significant estimates include those used in determining property and casualty and group long-term disability insurance product reserves, net of reinsurance; evaluation of goodwill for impairment; valuation of investments and derivative instruments; and contingencies relating to corporate litigation and regulatory matters.
RECLASSIFICATIONS
Certain reclassifications have been made to prior year financial information to conform to the current year presentation.
| | | | | | | | | |
| | Note 2 - Earnings Per Common Share |
THE HARTFORD FINANCIAL SERVICES GROUP, INC.
NOTES TO CONDENSED CONSOLIDATED FINANCIAL STATEMENTS
2. EARNINGS PER COMMON SHARE
| | | | | | | | | | | | | | | | | |
| Computation of Basic and Diluted Earnings per Common Share |
| Three Months Ended June 30, | | Six Months Ended June 30, |
| (In millions, except for per share data) | 2022 | 2021 | | 2022 | 2021 |
| Earnings | | | | | |
| | | | | |
| Net income | $ | 442 | | $ | 905 | | | $ | 887 | | $ | 1,154 | |
| Less: Preferred stock dividends | 5 | | 5 | | | 10 | | 10 | |
| | | | | |
| | | | | |
| | | | | |
| | | | | |
| Net income available to common stockholders | $ | 437 | | $ | 900 | | | $ | 877 | | $ | 1,144 | |
| Shares | | | | | |
| Weighted average common shares outstanding, basic | 327.4 | | 353.7 | | | 329.9 | | 356.0 | |
| | | | | |
| Dilutive effect of stock-based awards under compensation plans | 4.4 | | 4.8 | | | 4.7 | | 4.4 | |
| Weighted average common shares outstanding and dilutive potential common shares | 331.8 | | 358.5 | | | 334.6 | | 360.4 | |
| Net income available to common stockholders per common share | | | | | |
| | | | | |
| | | | | |
| | | | | |
| Basic | $ | 1.33 | | $ | 2.54 | | | $ | 2.66 | | $ | 3.21 | |
| | | | | |
| | | | | |
| | | | | |
| | | | | |
| | | | | |
| | | | | |
| Diluted | $ | 1.32 | | $ | 2.51 | | | $ | 2.62 | | $ | 3.17 | |
| | | | | |
| | | | | |
| | | | | |
3. SEGMENT INFORMATION
The Company currently conducts business principally in five reporting segments including Commercial Lines, Personal Lines, Property & Casualty ("P&C") Other Operations, Group Benefits and Hartford Funds, as well as a Corporate Category.
Net Income (Loss)
| | | | | | | | | | | | | | | | | |
| Three Months Ended June 30, | | Six Months Ended June 30, |
| 2022 | 2021 | | 2022 | 2021 |
| Commercial Lines | $ | 389 | | $ | 569 | | | $ | 772 | | $ | 698 | |
| Personal Lines | 6 | | 118 | | | 83 | | 253 | |
| Property & Casualty Other Operations | (20) | | 17 | | | (12) | | 4 | |
| Group Benefits | 104 | | 170 | | | 98 | | 179 | |
| Hartford Funds | 34 | | 52 | | | 76 | | 99 | |
| Corporate | (71) | | (21) | | | (130) | | (79) | |
| Net income | 442 | | 905 | | | 887 | | 1,154 | |
| Preferred stock dividends | 5 | | 5 | | | 10 | | 10 | |
| Net income available to common stockholders | $ | 437 | | $ | 900 | | | $ | 877 | | $ | 1,144 | |
| | | | | | | | | |
| | Note 3 - Segment Information |
THE HARTFORD FINANCIAL SERVICES GROUP, INC.
NOTES TO CONDENSED CONSOLIDATED FINANCIAL STATEMENTS
Revenues
| | | | | | | | | | | | | | | | | |
| Three Months Ended June 30, | | Six Months Ended June 30, |
| 2022 | 2021 | | 2022 | 2021 |
| Earned premiums and fee income: | | | | | |
Commercial Lines | | | | | |
| Workers’ compensation | $ | 869 | | $ | 768 | | | $ | 1,704 | | $ | 1,506 | |
| Liability | 453 | | 402 | | | 877 | | 777 | |
| Marine | 54 | | 57 | | | 115 | | 115 | |
| Package business | 449 | | 409 | | | 884 | | 802 | |
| Property | 212 | | 205 | | | 402 | | 405 | |
| Professional liability | 182 | | 158 | | | 360 | | 313 | |
| Bond | 77 | | 71 | | | 149 | | 140 | |
| Assumed reinsurance | 118 | | 84 | | | 218 | | 152 | |
| Automobile | 211 | | 198 | | | 411 | | 386 | |
| Total Commercial Lines | 2,625 | | 2,352 | | | 5,120 | | 4,596 | |
Personal Lines | | | | | |
| Automobile | 502 | | 515 | | | 1,001 | | 1,027 | |
| Homeowners | 231 | | 231 | | | 460 | | 461 | |
| Total Personal Lines [1] | 733 | | 746 | | | 1,461 | | 1,488 | |
Group Benefits | | | | | |
| Group disability | 828 | | 744 | | | 1,634 | | 1,483 | |
| Group life | 599 | | 604 | | | 1,196 | | 1,206 | |
| Other | 90 | | 79 | | | 177 | | 156 | |
| Total Group Benefits | 1,517 | | 1,427 | | | 3,007 | | 2,845 | |
Hartford Funds | | | | | |
| Mutual fund and ETF | 243 | | 272 | | | 508 | | 531 | |
| Talcott Resolution life and annuity separate accounts [2] | 20 | | 24 | | | 42 | | 47 | |
| Total Hartford Funds | 263 | | 296 | | | 550 | | 578 | |
Corporate | 13 | | 14 | | | 26 | | 26 | |
| Total earned premiums and fee income | 5,151 | | 4,835 | | | 10,164 | | 9,533 | |
| Net investment income | 541 | | 581 | | | 1,050 | | 1,090 | |
| Net realized gains (losses) | (338) | | 147 | | | (483) | | 227 | |
| Other revenues | 19 | | 26 | | | 35 | | 38 | |
Total revenues | $ | 5,373 | | $ | 5,589 | | | $ | 10,766 | | $ | 10,888 | |
[1]For the three months ended June 30, 2022 and 2021, AARP members accounted for earned premiums of $675 and $682, respectively. For the six months ended June 30, 2022 and 2021, AARP members accounted for earned premiums of $1.34 billion and $1.36 billion, respectively.
[2]Represents revenues earned for investment advisory services on the life and annuity separate account assets under management ("AUM") sold in May 2018 that is still managed by the Company's Hartford Funds segment.
| | | | | | | | | |
| | Note 3 - Segment Information |
THE HARTFORD FINANCIAL SERVICES GROUP, INC.
NOTES TO CONDENSED CONSOLIDATED FINANCIAL STATEMENTS
Revenue from Non-Insurance Contracts with Customers
| | | | | | | | | | | | | | | | | | | | |
| | Three Months Ended June 30, | | Six Months Ended June 30, |
| Revenue Line Item | 2022 | 2021 | | 2022 | 2021 |
| Commercial Lines | | | | | | |
| Installment billing fees | Fee income | $ | 10 | | $ | 8 | | | $ | 19 | | $ | 17 | |
| Personal Lines | | | | | | |
| Installment billing fees | Fee income | 7 | | 8 | | | 15 | | 16 | |
| Insurance servicing revenues | Other revenues | 19 | | 21 | | | 36 | | 40 | |
| Group Benefits | | | | | | |
| Administrative services | Fee income | 48 | | 49 | | | 93 | | 93 | |
| Hartford Funds | | | | | | |
| | | | | | |
| | | | | | |
| Advisor, distribution and other management fees | Fee income | 263 | | 296 | | | 550 | | 578 | |
| Corporate | | | | | | |
| Investment management and other fees | Fee income | 13 | | 14 | | | 26 | | 26 | |
| Other | Other revenues | 1 | | — | | | 1 | | — | |
| Total non-insurance revenues with customers | | $ | 361 | | $ | 396 | | | $ | 740 | | $ | 770 | |
4. FAIR VALUE MEASUREMENTS
The Company carries certain financial assets and liabilities at estimated fair value. Fair value is defined as the price that would be received to sell an asset or paid to transfer a liability in the principal or most advantageous market in an orderly transaction between market participants. Our fair value framework includes a hierarchy that gives the highest priority to the use of quoted prices in active markets, followed by the use of market observable inputs, followed by the use of unobservable inputs. The fair value hierarchy levels are as follows:
Level 1 Fair values based primarily on unadjusted quoted prices for identical assets or liabilities, in active markets that the Company has the ability to access at the measurement date.
Level 2 Fair values primarily based on observable inputs, other than quoted prices included in Level 1, or based on prices for similar assets and liabilities.
Level 3 Fair values derived when one or more of the significant inputs are unobservable (including assumptions about risk). With little or no observable market, the determination of fair values uses considerable judgment and represents the Company’s best estimate of an amount that could be realized in a market exchange for the asset or liability. Also included are securities that are traded within illiquid markets and/or priced by independent brokers.
The Company will classify the financial asset or liability by level based upon the lowest level input that is significant to the determination of the fair value. In most cases, both observable inputs (e.g., changes in interest rates) and unobservable inputs (e.g., changes in risk assumptions) are used to determine fair values that the Company has classified within Level 3.
| | | | | | | | | |
| | Note 4 - Fair Value Measurements |
THE HARTFORD FINANCIAL SERVICES GROUP, INC.
NOTES TO CONDENSED CONSOLIDATED FINANCIAL STATEMENTS
| | | | | | | | | | | | | | |
| Assets and (Liabilities) Carried at Fair Value by Hierarchy Level as of June 30, 2022 |
| Total | Quoted Prices in
Active Markets
for Identical
Assets
(Level 1) | Significant
Observable
Inputs
(Level 2) | Significant
Unobservable
Inputs
(Level 3) |
| Assets accounted for at fair value on a recurring basis | | | | |
| Fixed maturities, AFS | | | | |
Asset backed securities ("ABS") | $ | 1,342 | | $ | — | | $ | 1,342 | | $ | — | |
Collateralized loan obligations ("CLO") | 2,890 | | — | | 2,726 | | 164 | |
Commercial mortgage-backed securities ("CMBS") | 3,398 | | — | | 3,174 | | 224 | |
| Corporate | 16,151 | | — | | 14,542 | | 1,609 | |
| Foreign government/government agencies | 661 | | — | | 656 | | 5 | |
| Municipal | 7,067 | | — | | 7,067 | | — | |
Residential mortgage-backed securities ("RMBS") | 3,929 | | — | | 3,799 | | 130 | |
| U.S. Treasuries | 2,449 | | — | | 2,449 | | — | |
| Total fixed maturities | 37,887 | | — | | 35,755 | | 2,132 | |
| Fixed maturities, FVO | 342 | | — | | 149 | | 193 | |
| Equity securities, at fair value | 1,728 | | 1,203 | | 465 | | 60 | |
| Derivative assets | | | | |
| Credit derivatives | 3 | | — | | 3 | | — | |
| | | | |
| Foreign exchange derivatives | 29 | | — | | 29 | | — | |
| | | | |
| | | | |
| Total derivative assets [1] | 32 | | — | | 32 | | — | |
| Short-term investments | 2,524 | | 754 | | 1,710 | | 60 | |
| Total assets accounted for at fair value on a recurring basis | $ | 42,513 | | $ | 1,957 | | $ | 38,111 | | $ | 2,445 | |
| Liabilities accounted for at fair value on a recurring basis | | | | |
| Derivative liabilities | | | | |
| Credit derivatives | $ | (3) | | $ | — | | $ | (3) | | $ | — | |
| | | | |
| Foreign exchange derivatives | 25 | | — | | 25 | | — | |
| Interest rate derivatives | (20) | | — | | (20) | | — | |
| | | | |
| Total derivative liabilities [2] | 2 | | — | | 2 | | — | |
| | | | |
| Total liabilities accounted for at fair value on a recurring basis | $ | 2 | | $ | — | | $ | 2 | | $ | — | |
| | | | | | | | | |
| | Note 4 - Fair Value Measurements |
THE HARTFORD FINANCIAL SERVICES GROUP, INC.
NOTES TO CONDENSED CONSOLIDATED FINANCIAL STATEMENTS
| | | | | | | | | | | | | | |
| Assets and (Liabilities) Carried at Fair Value by Hierarchy Level as of December 31, 2021 |
| Total | Quoted Prices in Active Markets for Identical Assets (Level 1) | Significant Observable Inputs (Level 2) | Significant Unobservable Inputs (Level 3) |
| Assets accounted for at fair value on a recurring basis | | | | |
| Fixed maturities, AFS | | | | |
| ABS | $ | 1,135 | | $ | — | | $ | 1,135 | | $ | — | |
| CLO | 3,025 | | — | | 2,768 | | 257 | |
| CMBS | 4,119 | | — | | 3,923 | | 196 | |
| Corporate | 18,707 | | — | | 17,089 | | 1,618 | |
| Foreign government/government agencies | 910 | | — | | 905 | | 5 | |
| Municipal | 8,257 | | — | | 8,257 | | — | |
| RMBS | 3,643 | | — | | 3,315 | | 328 | |
| U.S. Treasuries | 3,051 | | 882 | | 2,169 | | — | |
| Total fixed maturities | 42,847 | | 882 | | 39,561 | | 2,404 | |
| Fixed maturities, FVO | 160 | | — | | — | | 160 | |
| Equity securities, at fair value | 2,094 | | 1,453 | | 577 | | 64 | |
| Derivative assets | | | | |
| Credit derivatives | 2 | | — | | 2 | | — | |
| | | | |
| Foreign exchange derivatives | 6 | | — | | 5 | | 1 | |
| Interest rate derivatives | (1) | | — | | (1) | | — | |
| Total derivative assets [1] | 7 | | — | | 6 | | 1 | |
| Short-term investments | 3,697 | | 1,627 | | 1,990 | | 80 | |
| Total assets accounted for at fair value on a recurring basis | $ | 48,805 | | $ | 3,962 | | $ | 42,134 | | $ | 2,709 | |
| Liabilities accounted for at fair value on a recurring basis | | | | |
| Derivative liabilities | | | | |
| Credit derivatives | $ | (4) | | $ | — | | $ | (4) | | $ | — | |
| | | | |
| Foreign exchange derivatives | — | | — | | 1 | | (1) | |
| Interest rate derivatives | (45) | | — | | (45) | | — | |
| Total derivative liabilities [2] | (49) | | — | | (48) | | (1) | |
| | | | |
| Total liabilities accounted for at fair value on a recurring basis | $ | (49) | | $ | — | | $ | (48) | | $ | (1) | |
[1]Includes derivative instruments in a net positive fair value position after consideration of the accrued interest and impact of collateral posting requirements which may be imposed by agreements and applicable law. See footnote 2 to this table for derivative liabilities.
[2]Includes derivative instruments in a net negative fair value position (derivative liability) after consideration of the accrued interest and impact of collateral posting requirements which may be imposed by agreements and applicable law.
The Company has overseas deposits included in other investments of $57 and $65 as of June 30, 2022 and December 31, 2021, respectively, which are measured at fair value using the net asset value as a practical expedient.
FIXED MATURITIES, EQUITY SECURITIES, SHORT-TERM INVESTMENTS, AND DERIVATIVES
Valuation Techniques
The Company generally determines fair values using valuation techniques that use prices, rates, and other relevant information evident from market transactions involving identical or similar instruments. Valuation techniques also include, where appropriate, estimates of future cash flows that are converted into a single discounted amount using current market expectations. The Company uses a "waterfall" approach
comprised of the following pricing sources and techniques, which are listed in priority order:
•Quoted prices, unadjusted, for identical assets or liabilities in active markets, which are classified as Level 1.
•Prices from third-party pricing services, which primarily utilize a combination of techniques. These services utilize recently reported trades of identical, similar, or benchmark securities making adjustments for market observable inputs available through the reporting date. If there are no recently reported trades, they may use a discounted cash flow technique to develop a price using expected cash flows based upon the anticipated future performance of the underlying collateral discounted at an estimated market rate. Both techniques develop prices that consider the time value of future cash flows and provide a margin for risk, including liquidity and credit risk. Most prices provided by third-party pricing services are classified as Level 2 because the inputs used in pricing the securities are observable. However, some securities that are less liquid or trade less actively are classified as Level 3. Additionally,
| | | | | | | | | |
| | Note 4 - Fair Value Measurements |
THE HARTFORD FINANCIAL SERVICES GROUP, INC.
NOTES TO CONDENSED CONSOLIDATED FINANCIAL STATEMENTS
certain long-dated securities, such as municipal securities and bank loans, include benchmark interest rate or credit spread assumptions that are not observable in the marketplace and are thus classified as Level 3.
•Internal matrix pricing is a valuation process internally developed for private placement securities for which the Company is unable to obtain a price from a third-party pricing service. Internal pricing matrices determine credit spreads that, when combined with risk-free rates, are applied to contractual cash flows to develop a price. The Company develops credit spreads using market based data for public securities adjusted for credit spread differentials between public and private securities, which are obtained from a survey of multiple private placement brokers. The market-based reference credit spread considers the issuer’s sector, financial strength, and term to maturity, using an independent public security index, while the credit spread differential considers the non-public nature of the security. Securities priced using internal matrix pricing are classified as Level 2 because the significant inputs are observable or can be corroborated with observable data.
•Independent broker quotes, which are typically non-binding, use inputs that can be difficult to corroborate with observable market-based data. Brokers may use present value techniques using assumptions specific to the security types, or they may use recent transactions of similar securities. Due to the lack of transparency in the process that brokers use to develop prices, valuations that are based on independent broker quotes are classified as Level 3.
The fair value of derivative instruments is determined primarily using a discounted cash flow model or option model technique and incorporates counterparty credit risk. In some cases, quoted market prices for exchange-traded and over-the-counter ("OTC") cleared derivatives may be used and in other cases independent broker quotes may be used. The pricing valuation models primarily use inputs that are observable in the market or can be corroborated by observable market data. The valuation of certain derivatives may include significant inputs that are unobservable, such as volatility levels, and reflect the Company’s view of what other market participants would use when pricing such instruments.
Valuation Controls
The process for determining the fair value of investments is monitored by the Valuation Committee, which is a cross-functional group of senior management within the Company. The purpose of the Valuation Committee is to provide oversight of the pricing policy, procedures, and controls, including approval of valuation methodologies and pricing sources. The Valuation Committee reviews market data trends, pricing statistics and trading statistics to ensure that prices are reasonable and consistent with our fair value framework. Controls and procedures used to assess third-party pricing services are reviewed by the Valuation Committee, including the results of annual due-diligence reviews. Controls include, but are not limited to, reviewing daily and monthly price changes, stale prices, and missing prices and comparing new trade prices to third-party pricing services, weekly price changes to published bond index prices, and daily OTC derivative market valuations to counterparty valuations. The Company has a dedicated pricing group that works with trading and investment professionals to challenge prices received by a third-party pricing source if the Company believes that the valuation received does not accurately reflect the fair value. New valuation models and changes to current models require approval by the Valuation Committee. In addition, the Company’s enterprise-wide Operational Risk Management function provides an independent review of the suitability and reliability of model inputs, as well as an analysis of significant changes to current models.
Valuation Inputs
Quoted prices for identical assets in active markets are considered Level 1 and consist of on-the-run U.S. Treasuries, money market funds, exchange-traded equity securities, open-ended mutual funds, certain short-term investments, and exchange traded derivative instruments.
| | | | | | | | | |
| | Note 4 - Fair Value Measurements |
THE HARTFORD FINANCIAL SERVICES GROUP, INC.
NOTES TO CONDENSED CONSOLIDATED FINANCIAL STATEMENTS
| | | | | | | | | | | |
| Valuation Inputs Used in Levels 2 and 3 Measurements for Securities and Derivatives |
Level 2 Primary Observable Inputs | Level 3 Primary Unobservable Inputs |
| Fixed Maturity Investments |
| Structured securities (includes ABS, CLO, CMBS and RMBS) |
| • Benchmark yields and spreads
• Monthly payment information
• Collateral performance, which varies by vintage year and includes delinquency rates, loss severity rates and refinancing assumptions
• Credit default swap indices
Other inputs for ABS, CLO, and RMBS:
• Estimate of future principal prepayments, derived from the characteristics of the underlying structure
• Prepayment speeds previously experienced at the interest rate levels projected for the collateral | | • Independent broker quotes • Credit spreads beyond observable curve • Interest rates beyond observable curve
Other inputs for less liquid securities or those that trade less actively, including subprime RMBS: • Estimated cash flows • Credit spreads, which include illiquidity premium • Constant prepayment rates • Constant default rates • Loss severity |
| Corporates |
| • Benchmark yields and spreads • Reported trades, bids, offers of the same or similar securities • Issuer spreads and credit default swap curves
Other inputs for investment grade privately placed securities that utilize internal matrix pricing: • Credit spreads for public securities of similar quality, maturity, and sector, adjusted for non-public nature | | • Independent broker quotes
• Credit spreads beyond observable curve
• Interest rates beyond observable curve
Other inputs for below investment grade privately placed securities and private bank loans:
• Credit spreads for public securities of similar quality, maturity, and sector, adjusted for non-public nature |
| U.S. Treasuries, Municipals, and Foreign government/government agencies |
| • Benchmark yields and spreads
• Issuer credit default swap curves
• Political events in emerging market economies
• Municipal Securities Rulemaking Board reported trades and material event notices
• Issuer financial statements | | • Credit spreads beyond observable curve • Interest rates beyond observable curve |
| Equity Securities |
| • Quoted prices in markets that are not active | | • For privately traded equity securities, internal discounted cash flow models utilizing earnings multiples or other cash flow assumptions that are not observable |
| Short-term Investments |
| • Benchmark yields and spreads • Reported trades, bids, offers • Issuer spreads and credit default swap curves • Material event notices and new issue money market rates | | • Independent broker quotes |
| Derivatives |
| Credit derivatives |
| • Swap yield curve • Credit default swap curves | | • Not applicable |
| Foreign exchange derivatives |
| • Swap yield curve • Currency spot and forward rates • Cross currency basis curves | | • Independent broker quotes |
| Interest rate derivatives |
| • Swap yield curve | | • Not applicable |
| | | |
| | | | | | | | | |
| | Note 4 - Fair Value Measurements |
THE HARTFORD FINANCIAL SERVICES GROUP, INC.
NOTES TO CONDENSED CONSOLIDATED FINANCIAL STATEMENTS
| | | | | | | | | | | | | | | | | | | | | | | | | |
| Significant Unobservable Inputs for Level 3 - Securities | | |
| Assets accounted for at fair value on a recurring basis | Fair
Value | Predominant
Valuation
Technique | Significant Unobservable Input | Minimum | Maximum | Weighted Average [1] | Impact of
Increase in
Input on Fair Value [2] | | |
| As of June 30, 2022 | | |
| CLO [3] | $ | 137 | | Discounted cash flows | Spread | 337 bps | 337 bps | 337 bps | Decrease | | |
| CMBS [3] | $ | 221 | | Discounted cash flows | Spread (encompasses prepayment, default risk and loss severity) | 255 bps | 1,055 bps | 478 bps | Decrease | | |
| Corporate [4] | $ | 1,555 | | Discounted cash flows | Spread | 32 bps | 2,072 bps | 374 bps | Decrease | | |
| RMBS [3] | $ | 97 | | Discounted cash flows | Spread [6] | 102 bps | 434 bps | 181 bps | Decrease | | |
| | | Constant prepayment rate [6] | 2% | 15% | 9% | Decrease [5] | | |
| | | Constant default rate [6] | 1% | 6% | 3% | Decrease | | |
| | | Loss severity [6] | 10% | 100% | 42% | Decrease | | |
| As of December 31, 2021 | | |
| CLO [3] | $ | 211 | | Discounted cash flows | Spread | 234 bps | 258 bps | 257 bps | Decrease | | |
| CMBS [3] | $ | 192 | | Discounted cash flows | Spread (encompasses prepayment, default risk and loss severity) | 203 bps | 468 bps | 266 bps | Decrease | | |
| Corporate [4] | $ | 1,532 | | Discounted cash flows | Spread | 96 bps | 1,227 bps | 298 bps | Decrease | | |
| RMBS [3] | $ | 266 | | Discounted cash flows | Spread [6] | 48 bps | 229 bps | 89 bps | Decrease | | |
| | | Constant prepayment rate [6] | 2% | 16% | 7% | Decrease [5] | | |
| | | Constant default rate [6] | 1% | 6% | 3% | Decrease | | |
| | | Loss severity [6] | —% | 100% | 63% | Decrease | | |
| | | | | | | | | |
[1]The weighted average is determined based on the fair value of the securities.
[2]Conversely, the impact of a decrease in input would have the opposite impact to the fair value as that presented in the table.
[3]Excludes securities for which the Company bases fair value on broker quotations.
[4]Excludes securities for which the Company bases fair value on broker quotations; however, included are broker priced lower-rated private placement securities for which the Company receives spread and yield information to corroborate the fair value.
[5]Decrease for above market rate coupons and increase for below market rate coupons.
[6]Generally, a change in the assumption used for the constant default rate would have been accompanied by a directionally similar change in the assumption used for the loss severity and a directionally opposite change in the assumption used for constant prepayment rate and would have resulted in wider spreads.
As of June 30, 2022 and December 31, 2021, the fair values of the Company's level 3 derivatives were less than $1 for both periods.
The table above excludes certain securities for which fair values are predominately based on independent broker quotes. While the Company does not have access to the significant unobservable inputs that independent brokers may use in their pricing process, the Company believes brokers likely use inputs similar to those used by the Company and third-party pricing services to price similar instruments. As such, in their pricing models, brokers likely use estimated loss severity rates, prepayment rates, constant default rates and credit spreads. Therefore, similar to non-broker priced securities, increases in these inputs would generally cause fair values to decrease. As of June 30, 2022, no significant adjustments were made by the Company to broker prices received.
LEVEL 3 ASSETS AND LIABILITIES MEASURED AT FAIR VALUE ON A RECURRING BASIS USING SIGNIFICANT UNOBSERVABLE INPUTS
The Company uses derivative instruments to manage the risk associated with certain assets and liabilities. However, the derivative instrument may not be classified within the same fair value hierarchy level as the associated asset or liability.
| | | | | | | | | |
| | Note 4 - Fair Value Measurements |
THE HARTFORD FINANCIAL SERVICES GROUP, INC.
NOTES TO CONDENSED CONSOLIDATED FINANCIAL STATEMENTS
| | | | | | | | | | | | | | | | | | | | | | | | | | | | | | | | |
Fair Value Rollforwards for Financial Instruments Classified as Level 3 for the
Three Months Ended June 30, 2022 |
| Total realized/unrealized gains (losses) | | | | | | |
| | Fair value as of March 31, 2022 | Included in net income [1] | Included in OCI [2] | Purchases | Settlements | Sales | Transfers into Level 3 [3] | Transfers out of Level 3 [3] | Fair value as of June 30, 2022 |
| Assets | | | | | | | | | |
| Fixed maturities, AFS | | | | | | | | | |
| ABS | $ | 19 | | $ | — | | $ | — | | $ | — | | $ | — | | $ | — | | $ | — | | $ | (19) | | $ | — | |
| CLO | 214 | | — | | (1) | | 28 | | (23) | | — | | — | | (54) | | 164 | |
| CMBS | 236 | | — | | (10) | | — | | (2) | | — | | — | | — | | 224 | |
| Corporate | 1,515 | | 1 | | (99) | | 264 | | (62) | | (14) | | 21 | | (17) | | 1,609 | |
| Foreign Govt./Govt. Agencies | 4 | | (1) | | (1) | | — | | — | | — | | 3 | | — | | 5 | |
| | | | | | | | | | |
| RMBS | 301 | | — | | (4) | | — | | (30) | | — | | — | | (137) | | 130 | |
| Total fixed maturities, AFS | 2,289 | | — | | (115) | | 292 | | (117) | | (14) | | 24 | | (227) | | 2,132 | |
| Fixed maturities, FVO | 174 | | (13) | | — | | 35 | | (3) | | — | | — | | — | | 193 | |
| Equity securities, at fair value | 57 | | 2 | | — | | 2 | | (1) | | — | | — | | — | | 60 | |
| Short-term investments | 32 | | — | | — | | 32 | | (4) | | — | | — | | — | | 60 | |
| Total Assets | $ | 2,552 | | $ | (11) | | $ | (115) | | $ | 361 | | $ | (125) | | $ | (14) | | $ | 24 | | $ | (227) | | $ | 2,445 | |
| | | | | | | | |
| | | | | | | | | |
| | | | | | | | | |
| | | | | | | | | | |
| | | | | | | | | | |
| | | | | | | | | |
| | | | | | | | | |
| | | | | | | | | | | | | | | | | | | | | | | | | | | | | | | | |
Fair Value Rollforwards for Financial Instruments Classified as Level 3 for the
Six Months Ended June 30, 2022 |
| Total realized/unrealized gains (losses) | | | | | | |
| | Fair value as of January 1, 2022 | Included in net income [1] | Included in OCI [2] | Purchases | Settlements | Sales | Transfers into Level 3 [3] | Transfers out of Level 3 [3] | Fair value as of June 30, 2022 |
| Assets | | | | | | | | | |
| Fixed Maturities, AFS | | | | | | | | | |
| ABS | $ | — | | $ | — | | $ | — | | $ | 19 | | $ | — | | $ | — | | $ | — | | $ | (19) | | $ | — | |
| CLO | 257 | | — | | (2) | | 82 | | (40) | | — | | — | | (133) | | 164 | |
| CMBS | 196 | | — | | (15) | | 46 | | (3) | | — | | — | | — | | 224 | |
| Corporate | 1,618 | | (1) | | (158) | | 323 | | (132) | | (21) | | 21 | | (41) | | 1,609 | |
| Foreign Govt./Govt. Agencies | 5 | | (1) | | (1) | | — | | — | | (1) | | 3 | | — | | 5 | |
| | | | | | | | | | |
| RMBS | 328 | | — | | (10) | | 137 | | (64) | | — | | — | | (261) | | 130 | |
| Total Fixed Maturities, AFS | 2,404 | | (2) | | (186) | | 607 | | (239) | | (22) | | 24 | | (454) | | 2,132 | |
| Fixed maturities, FVO | 160 | | (11) | | — | | 55 | | (11) | | — | | — | | — | | 193 | |
| Equity Securities, at fair value | 64 | | 9 | | — | | 2 | | (15) | | — | | — | | — | | 60 | |
| Short-term investments | 80 | | — | | — | | 36 | | (6) | | — | | — | | (50) | | 60 | |
| Total Assets | $ | 2,708 | | $ | (4) | | $ | (186) | | $ | 700 | | $ | (271) | | $ | (22) | | $ | 24 | | $ | (504) | | $ | 2,445 | |
| | | | | | | | |
| | | | | | | | | |
| | | | | | | | | |
| | | | | | | | | | |
| | | | | | | | | | |
| | | | | | | | | |
| | | | | | | | | |
| | | | | | | | | |
| | Note 4 - Fair Value Measurements |
THE HARTFORD FINANCIAL SERVICES GROUP, INC.
NOTES TO CONDENSED CONSOLIDATED FINANCIAL STATEMENTS
| | | | | | | | | | | | | | | | | | | | | | | | | | | | | | | | |
| | | | | | | | | | |
Fair Value Rollforwards for Financial Instruments Classified as Level 3 for the
Three Months Ended June 30, 2021 |
| Total realized/unrealized gains (losses) | | | | | | |
| | Fair value as of March 31, 2021 | Included in net income [1] | Included in OCI [2] | Purchases | Settlements | Sales | Transfers into Level 3 [3] | Transfers out of Level 3 [3] | Fair value as of June 30, 2021 |
| Assets | | | | | | | | | |
| Fixed Maturities, AFS | | | | | | | | | |
| ABS | $ | 6 | | $ | — | | $ | — | | $ | 13 | | $ | — | | $ | — | | $ | — | | $ | (5) | | $ | 14 | |
| CLO | 426 | | — | | — | | 119 | | (30) | | — | | — | | (140) | | 375 | |
| CMBS | 61 | | — | | 2 | | 38 | | (1) | | — | | 5 | | (19) | | 86 | |
| Corporate | 944 | | 1 | | 2 | | 176 | | (69) | | (37) | | 124 | | — | | 1,141 | |
| | | | | | | | | | |
| | | | | | | | | | |
| RMBS | 481 | | — | | (1) | | 29 | | (57) | | (10) | | — | | (140) | | 302 | |
| Total Fixed Maturities, AFS | 1,918 | | 1 | | 3 | | 375 | | (157) | | (47) | | 129 | | (304) | | 1,918 | |
| Equity Securities, at fair value | 70 | | 2 | | — | | 3 | | (1) | | — | | — | | — | | 74 | |
| Short-term investments | 16 | | — | | — | | 2 | | — | | — | | — | | — | | 18 | |
| Total Assets | $ | 2,004 | | $ | 3 | | $ | 3 | | $ | 380 | | $ | (158) | | $ | (47) | | $ | 129 | | $ | (304) | | $ | 2,010 | |
| | | | | | | | | |
| | | | | | | | | |
| | | | | | | | | |
| | | | | | | | | | |
| | | | | | | | | |
| | | | | | | | | |
| | | | | | | | | | | | | | | | | | | | | | | | | | | | | | | | |
Fair Value Rollforwards for Financial Instruments Classified as Level 3 for the
Six Months Ended June 30, 2021 |
| Total realized/unrealized gains (losses) | | | | | | |
| | Fair value as of January 1, 2021 | Included in net income [1] | Included in OCI [2] | Purchases | Settlements | Sales | Transfers into Level 3 [3] | Transfers out of Level 3 [3] | Fair value as of June 30, 2021 |
| Assets | | | | | | | | | |
| Fixed Maturities, AFS | | | | | | | | | |
| ABS | $ | — | | $ | — | | $ | — | | $ | 19 | | $ | — | | $ | — | | $ | — | | $ | (5) | | $ | 14 | |
| CLO | 360 | | — | | — | | 259 | | (45) | | — | | — | | (199) | | 375 | |
| CMBS | 77 | | — | | 2 | | 39 | | (3) | | — | | 5 | | (34) | | 86 | |
| Corporate | 881 | | 6 | | (11) | | 249 | | (76) | | (44) | | 172 | | (36) | | 1,141 | |
| Foreign Govt./Govt. Agencies | 6 | | — | | — | | — | | — | | (6) | | — | | — | | — | |
| | | | | | | | | | |
| RMBS | 381 | | — | | (2) | | 180 | | (103) | | (14) | | — | | (140) | | 302 | |
| Total Fixed Maturities, AFS | 1,705 | | 6 | | (11) | | 746 | | (227) | | (64) | | 177 | | (414) | | 1,918 | |
| Equity Securities, at fair value | 70 | | 2 | | — | | 3 | | (1) | | — | | — | | — | | 74 | |
| Short-term investments | 30 | | — | | — | | 2 | | (14) | | — | | — | | — | | 18 | |
| Total Assets | $ | 1,805 | | $ | 8 | | $ | (11) | | $ | 751 | | $ | (242) | | $ | (64) | | $ | 177 | | $ | (414) | | $ | 2,010 | |
| | | | | | | | | |
| | | | | | | | | |
| | | | | | | | | |
| | | | | | | | | | |
| | | | | | | | | |
| | | | | | | | | |
| | | | | | | | | | |
| | | | | | | | | | |
| | | | | | | | | | |
| | | | | | | | | | |
| | | | | | | | | | |
| | | | | | | | | | |
| | | | | | | | | | |
| | | | | | | | | | |
[1]Amounts in these columns are generally reported in net realized gains (losses). All amounts are before income taxes.
[2]All amounts are before income taxes.
[3]Transfers in and/or (out) of Level 3 are primarily attributable to the availability of market observable information and the re-evaluation of the observability of pricing inputs.
| | | | | | | | | |
| | Note 4 - Fair Value Measurements |
THE HARTFORD FINANCIAL SERVICES GROUP, INC.
NOTES TO CONDENSED CONSOLIDATED FINANCIAL STATEMENTS
| | | | | | | | | | | | | | | | | | | | | | | | | | | | | | | | |
Changes in Unrealized Gains (Losses) for Financial Instruments Classified as
Level 3 Still Held at End of Period |
| | Three Months Ended June 30, | | Six Months Ended June 30, |
| | 2022 | 2021 | 2022 | 2021 | | 2022 | 2021 | 2022 | 2021 |
| | Changes in Unrealized Gain/(Loss) included in Net Income [1] [2] | Changes in Unrealized Gain/(Loss) included in OCI [3] | | Changes in Unrealized Gain/(Loss) included in Net Income [1] [2] | Changes in Unrealized Gain/(Loss) included in OCI [3] |
| Assets | | | | | | | | | |
| Fixed Maturities, AFS | | | | | | | | | |
| | | | | | | | | | |
| CLO | $ | — | | $ | — | | $ | (1) | | $ | — | | | $ | — | | $ | — | | $ | (2) | | $ | — | |
| CMBS | — | | — | | (10) | | 2 | | | — | | — | | (15) | | 2 | |
| Corporate | 1 | | — | | (99) | | 2 | | | (1) | | — | | (157) | | (8) | |
| Foreign Govt./Govt. Agencies | (1) | | — | | (1) | | — | | | (1) | | — | | (1) | | — | |
| | | | | | | | | | |
| RMBS | — | | — | | (4) | | (1) | | | — | | — | | (10) | | (2) | |
| Total Fixed Maturities, AFS | — | | — | | (115) | | 3 | | | (2) | | — | | (185) | | (8) | |
| Fixed maturities, FVO | (13) | | — | | — | | — | | | (11) | | — | | — | | — | |
| Equity Securities, at fair value | 1 | | 2 | | — | | — | | | 1 | | 2 | | — | | — | |
| | | | | | | | | |
| | | | | | | | | | |
| | | | | | | | | | |
| | | | | | | | | |
| | | | | | | | | |
| Total Assets | $ | (12) | | $ | 2 | | $ | (115) | | $ | 3 | | | $ | (12) | | $ | 2 | | $ | (185) | | $ | (8) | |
| | | | | | | | | |
| | | | | | | | | |
| | | | | | | | | |
| | | | | | | | | | |
| | | | | | | | | |
| | | | | | | | | |
[1]All amounts in these rows are reported in net gains (losses). All amounts are before income taxes.
[2]Amounts presented are for Level 3 only and therefore may not agree to other disclosures included herein.
[3]Changes in unrealized gain (loss) on fixed maturities, AFS are reported in changes in net unrealized gain on securities in the Condensed Consolidated Statements of Comprehensive Income.
Fair Value Option
The Company has elected the fair value option for certain investments in residual interests of securitizations and other securities that contain embedded credit derivatives with underlying credit risk related to residential real estate in order to reflect changes in fair value in earnings. These instruments are included within fixed maturities, FVO on the Condensed Consolidated Balance Sheets and changes in the fair value of these investments are reported in net realized gains and losses.
As of June 30, 2022 and December 31, 2021, the fair value of assets using the fair value option was $342 and $160, respectively.
For the three and six months ended June 30, 2022 realized losses related to the change in fair value of assets using the fair value option were $20 and $23, respectively. For the three and six months ended June 30, 2021 there were no realized gains (losses) related to the change in fair value of assets using the fair value option.
FINANCIAL INSTRUMENTS NOT CARRIED AT FAIR VALUE
| | | | | | | | | | | | | | | | | | | | | | | |
| Financial Assets and Liabilities Not Carried at Fair Value |
| June 30, 2022 | | December 31, 2021 |
| Fair Value Hierarchy Level | Carrying Amount [1] | Fair Value | | Fair Value Hierarchy Level | Carrying Amount [1] | Fair Value |
Assets | | | | | | | |
| Mortgage loans | Level 3 | $ | 5,852 | | $ | 5,506 | | | Level 3 | $ | 5,383 | | $ | 5,576 | |
Liabilities | | | | | | | |
| Other policyholder funds and benefits payable | Level 3 | $ | 664 | | $ | 665 | | | Level 3 | $ | 687 | | $ | 689 | |
| Senior notes [2] | Level 2 | $ | 3,856 | | $ | 3,630 | | | Level 2 | $ | 3,854 | | $ | 4,725 | |
| Junior subordinated debentures [2] | Level 2 | $ | 499 | | $ | 395 | | | Level 2 | $ | 1,090 | | $ | 1,086 | |
[1]As of June 30, 2022 and December 31, 2021, the carrying amount of mortgage loans is net of ACL of $36 and $29, respectively.
[2]Included in long-term debt in the Condensed Consolidated Balance Sheets, except for any current maturities, which are included in short-term debt when applicable.
THE HARTFORD FINANCIAL SERVICES GROUP, INC.
NOTES TO CONDENSED CONSOLIDATED FINANCIAL STATEMENTS
5. INVESTMENTS
| | | | | | | | | | | | | | | | | |
| Net Realized Gains (Losses) |
| | Three Months Ended June 30, | | Six Months Ended June 30, |
| (Before tax) | 2022 | 2021 | | 2022 | 2021 |
Gross gains on sales of fixed maturities | $ | 15 | | $ | 68 | | | $ | 38 | | $ | 99 | |
Gross losses on sales of fixed maturities | (80) | | (15) | | | (175) | | (46) | |
| Equity securities [1] | | | | | |
| Net realized gains (losses) on sales of equity securities | 5 | | 2 | | | 45 | | 8 | |
| Change in net unrealized gains (losses) of equity securities | (267) | | 86 | | | (414) | | 123 | |
| Net realized and unrealized gains (losses) on equity securities | (262) | | 88 | | | (369) | | 131 | |
| Net credit losses on fixed maturities, AFS | — | | — | | | (12) | | 4 | |
| Change in ACL on mortgage loans | (5) | | 10 | | | (7) | | 14 | |
| Intent-to-sell impairments | — | | — | | | (3) | | — | |
| Other, net [2] | (6) | | (4) | | | 45 | | 25 | |
| | | | | |
| | | | | |
| | | | | |
| Net realized gains (losses) | $ | (338) | | $ | 147 | | | $ | (483) | | $ | 227 | |
[1]The net unrealized gains (losses) on equity securities still held as of June 30, 2022, and included in net realized gains (losses) were $(259) and $(366) for the three and six months ended June 30, 2022, respectively. The net unrealized gains (losses) on equity securities still held as of June 30, 2021, and included in net realized gains (losses) were $80 and $118 for the three and six months ended June 30, 2021, respectively.
[2]For the three and six months ended June 30, 2022, includes gains (losses) from transactional foreign currency revaluation of $15 and $21, respectively, and gains (losses) on non-qualifying derivatives of $14 and $61, respectively. For the three and six months ended June 30, 2021 includes gains (losses) from transactional foreign currency revaluation of $0 and $(7), respectively, and non-qualifying derivatives of $(29) and $6, respectively.
Proceeds from the sales of fixed maturities, AFS totaled $2.6 billion and $8.1 billion for the three and six months ended June 30, 2022 , respectively and $4.0 billion and $8.2 billion for the three and six months ended ended June 30, 2021.
Accrued Interest Receivable on Fixed Maturities, AFS and Mortgage Loans
As of June 30, 2022 and December 31, 2021, the Company reported accrued interest receivable related to fixed maturities, AFS of $309 and $299, respectively, and accrued interest receivable related to mortgage loans of $18 and $16, respectively. These amounts are recorded in other assets on the Condensed Consolidated Balance Sheets and are not included in the carrying value of the fixed maturities or mortgage loans. The Company does not include the current accrued interest receivable balance when estimating the ACL. The Company has a policy to write-off accrued interest receivable balances that are more than 90 days past due. Write-offs of accrued interest receivable are recorded as a credit loss component of net realized gains and losses.
Interest income on fixed maturities and mortgage loans is accrued unless it is past due over 90 days or management deems the interest uncollectible.
Recognition and Presentation of Intent-to-Sell Impairments and ACL on Fixed Maturities, AFS
The Company will record an "intent-to-sell impairment" as a reduction to the amortized cost of fixed maturities, AFS in an unrealized loss position if the Company intends to sell or it is more likely than not that the Company will be required to sell the fixed maturity before a recovery in value. A corresponding
charge is recorded in net realized losses equal to the difference between the fair value on the impairment date and the amortized cost basis of the fixed maturity before recognizing the impairment.
For fixed maturities where a credit loss has been identified and no intent-to-sell impairment has been recorded, the Company will record an ACL for the portion of the unrealized loss related to the credit loss. Any remaining unrealized loss on a fixed maturity after recording an ACL is the non-credit amount and is recorded in OCI. The ACL is the excess of the amortized cost over the greater of the Company's best estimate of the present value of expected future cash flows or the security's fair value. Cash flows are discounted at the effective yield that is used to record interest income. The ACL cannot exceed the unrealized loss and, therefore, it may fluctuate with changes in the fair value of the fixed maturity if the fair value is greater than the Company's best estimate of the present value of expected future cash flows. The initial ACL and any subsequent changes are recorded in net realized gains and losses. The ACL is written off against the amortized cost in the period in which all or a portion of the related fixed maturity is determined to be uncollectible.
Developing the Company’s best estimate of expected future cash flows is a quantitative and qualitative process that incorporates information received from third-party sources along with certain internal assumptions regarding the future performance. The Company's considerations include, but are not limited to, (a) changes in the financial condition of the issuer and/or the underlying collateral, (b) whether the issuer is current on contractually obligated interest and principal payments, (c) credit ratings, (d) payment structure of the security and (e) the extent to which the fair value has been less than the amortized cost of the security.
THE HARTFORD FINANCIAL SERVICES GROUP, INC.
NOTES TO CONDENSED CONSOLIDATED FINANCIAL STATEMENTS
For non-structured securities, assumptions include, but are not limited to, economic and industry-specific trends and fundamentals, instrument-specific developments including changes in credit ratings, industry earnings multiples and the issuer’s ability to restructure, access capital markets, and execute asset sales.
For structured securities, assumptions include, but are not limited to, various performance indicators such as historical and
projected default and recovery rates, credit ratings, current and projected delinquency rates, loan-to-value ratios ("LTVs"), average cumulative collateral loss rates that vary by vintage year, prepayment speeds, and property value declines. These assumptions require the use of significant management judgment and include the probability of issuer default and estimates regarding timing and amount of expected recoveries which may include estimating the underlying collateral value.
| | | | | | | | | | | | | | | | | | | | | | | | | | | | | | | | | |
| ACL on Fixed Maturities, AFS by Type |
| Three Months Ended June 30, | | |
| 2022 | | 2021 | | | | |
| (Before tax) | Corporate | Foreign govt./govt. agencies | CMBS | Total | | Corporate | | Total | | | | | | | | | |
| Balance as of beginning of period | $ | 9 | | $ | 3 | | $ | 1 | | $ | 13 | | | $ | 19 | | | $ | 19 | | | | | | | | | | |
| | | | | | | | | | | | | | | | | |
| Reduction due to sales | — | | — | | — | | — | | | (15) | | | (15) | | | | | | | | | | |
| Net increases (decreases) on fixed maturities where an allowance was previously recorded | (1) | | 1 | | — | | — | | | — | | | — | | | | | | | | | | |
| | | | | | | | | | | | | | | | | |
| | | | | | | | | | | | | | | | | |
| Balance as of end of period | $ | 8 | | $ | 4 | | $ | 1 | | $ | 13 | | | $ | 4 | | | $ | 4 | | | | | | | | | | |
| | | | | | | | | | | | | | | | | | | | | | | | | | | | | | | |
| ACL on Fixed Maturities, AFS by Type |
| | | Six Months Ended June 30, |
| | | | | 2022 | | 2021 |
| (Before tax) | | | | | | | | Corporate | Foreign govt./govt. agencies | CMBS | Total | | Corporate | | Total |
| Balance as of beginning of period | | | | | | | | $ | 1 | | $ | — | | $ | — | | $ | 1 | | | $ | 23 | | | $ | 23 | |
| Credit losses on fixed maturities where an allowance was not previously recorded | | | | | | | | 8 | | 3 | | 1 | | 12 | | | 2 | | | 2 | |
| Reduction due to sales | | | | | | | | — | | — | | — | | — | | | (15) | | | (15) | |
| Net increases (decreases) on fixed maturities where an allowance was previously recorded | | | | | | | | (1) | | 1 | | — | | — | | | (6) | | | (6) | |
| | | | | | | | | | | | | | | |
| | | | | | | | | | | | | | | |
| Balance as of end of period | | | | | | | | $ | 8 | | $ | 4 | | $ | 1 | | $ | 13 | | | $ | 4 | | | $ | 4 | |
Fixed Maturities, AFS | | | | | | | | | | | | | | | | | | | | | | | | | | | | | | | | | | | | | |
| Fixed Maturities, AFS, by Type |
| June 30, 2022 | | December 31, 2021 |
|
Amortized
Cost | ACL | Gross
Unrealized
Gains | Gross
Unrealized
Losses | Fair
Value | | |
Amortized
Cost | ACL | Gross
Unrealized
Gains | Gross
Unrealized
Losses | Fair
Value | |
| ABS | $ | 1,382 | | $ | — | | $ | 1 | | $ | (41) | | $ | 1,342 | | | | $ | 1,125 | | $ | — | | $ | 13 | | $ | (3) | | $ | 1,135 | | |
| CLO | 2,999 | | — | | 2 | | (111) | | 2,890 | | | | 3,019 | | — | | 8 | | (2) | | 3,025 | | |
| CMBS | 3,587 | | (1) | | 26 | | (214) | | 3,398 | | | | 3,955 | | — | | 179 | | (15) | | 4,119 | | |
| Corporate | 17,431 | | (8) | | 47 | | (1,319) | | 16,151 | | | | 17,744 | | (1) | | 1,038 | | (74) | | 18,707 | | |
| Foreign govt./govt. agencies | 715 | | (4) | | 2 | | (52) | | 661 | | | | 883 | | — | | 33 | | (6) | | 910 | | |
| Municipal | 7,332 | | — | | 124 | | (389) | | 7,067 | | | | 7,473 | | — | | 787 | | (3) | | 8,257 | | |
| RMBS | 4,230 | | — | | 5 | | (306) | | 3,929 | | | | 3,610 | | — | | 60 | | (27) | | 3,643 | | |
| U.S. Treasuries | 2,582 | | — | | 7 | | (140) | | 2,449 | | | | 2,979 | | — | | 86 | | (14) | | 3,051 | | |
| Total fixed maturities, AFS | $ | 40,258 | | $ | (13) | | $ | 214 | | $ | (2,572) | | $ | 37,887 | | | | $ | 40,788 | | $ | (1) | | $ | 2,204 | | $ | (144) | | $ | 42,847 | | |
THE HARTFORD FINANCIAL SERVICES GROUP, INC.
NOTES TO CONDENSED CONSOLIDATED FINANCIAL STATEMENTS
| | | | | | | | | | | | | | | | | |
| Fixed Maturities, AFS, by Contractual Maturity Year |
| June 30, 2022 | | December 31, 2021 |
| Amortized Cost | Fair Value | | Amortized Cost | Fair Value |
| One year or less | $ | 1,626 | | $ | 1,623 | | | $ | 1,400 | | $ | 1,419 | |
| Over one year through five years | 8,326 | | 8,044 | | | 8,615 | | 8,894 | |
| Over five years through ten years | 7,626 | | 6,958 | | | 8,303 | | 8,633 | |
| Over ten years | 10,482 | | 9,703 | | | 10,761 | | 11,979 | |
| Subtotal | 28,060 | | 26,328 | | | 29,079 | | 30,925 | |
| Mortgage-backed and asset-backed securities | 12,198 | | 11,559 | | | 11,709 | | 11,922 | |
| Total fixed maturities, AFS | $ | 40,258 | | $ | 37,887 | | | $ | 40,788 | | $ | 42,847 | |
Estimated maturities may differ from contractual maturities due to call or prepayment provisions. Due to the potential for variability in payment speeds (i.e., prepayments or extensions), mortgage-backed and asset-backed securities are not categorized by contractual maturity.
Concentration of Credit Risk
The Company aims to maintain a diversified investment portfolio including issuer, sector and geographic stratification, where
applicable, and has established certain exposure limits, diversification standards and review procedures to mitigate credit risk. The Company had no investment exposure to any credit concentration risk of a single issuer greater than 10% of the Company's stockholders' equity as of June 30, 2022 or December 31, 2021 other than U.S. government securities and certain U.S. government agencies.
Unrealized Losses on Fixed Maturities, AFS
| | | | | | | | | | | | | | | | | | | | | | | | | | | | | |
| Unrealized Loss Aging for Fixed Maturities, AFS by Type and Length of Time as of June 30, 2022 |
| | Less Than 12 Months | | | 12 Months or More | | | Total |
| | Fair Value | Unrealized Losses | | | Fair Value | Unrealized Losses | | | Fair Value | Unrealized Losses |
| ABS | | $ | 1,117 | | $ | (40) | | | | $ | 26 | | $ | (1) | | | | $ | 1,143 | | $ | (41) | |
| CLO | | 2,351 | | (88) | | | | 527 | | (23) | | | | 2,878 | | (111) | |
| CMBS | | 3,026 | | (198) | | | | 95 | | (16) | | | | 3,121 | | (214) | |
| Corporate | | 13,163 | | (1,196) | | | | 650 | | (123) | | | | 13,813 | | (1,319) | |
| Foreign govt./govt. agencies | | 515 | | (42) | | | | 93 | | (10) | | | | 608 | | (52) | |
| Municipal | | 4,553 | | (385) | | | | 23 | | (4) | | | | 4,576 | | (389) | |
| RMBS | | 3,366 | | (267) | | | | 295 | | (39) | | | | 3,661 | | (306) | |
| U.S. Treasuries | | 2,299 | | (136) | | | | 38 | | (4) | | | | 2,337 | | (140) | |
| Total fixed maturities, AFS in an unrealized loss position | | $ | 30,390 | | $ | (2,352) | | | | $ | 1,747 | | $ | (220) | | | | $ | 32,137 | | $ | (2,572) | |
| | | | | | | | | | | | | | | | | | | | | | | | | | | | | |
| Unrealized Loss Aging for Fixed Maturities, AFS by Type and Length of Time as of December 31, 2021 |
| | | Less Than 12 Months | | | 12 Months or More | | | Total |
| | Fair Value | Unrealized Losses | | | Fair Value | Unrealized Losses | | | Fair Value | Unrealized Losses |
| ABS | | $ | 396 | | $ | (3) | | | | $ | — | | $ | — | | | | $ | 396 | | $ | (3) | |
| CLO | | 1,434 | | (2) | | | | 147 | | — | | | | 1,581 | | (2) | |
| CMBS | | 594 | | (7) | | | | 82 | | (8) | | | | 676 | | (15) | |
| Corporate | | 3,698 | | (65) | | | | 234 | | (9) | | | | 3,932 | | (74) | |
| Foreign govt./govt. agencies | | 340 | | (5) | | | | 16 | | (1) | | | | 356 | | (6) | |
| Municipal | | 301 | | (3) | | | | 12 | | — | | | | 313 | | (3) | |
| RMBS | | 1,869 | | (23) | | | | 94 | | (4) | | | | 1,963 | | (27) | |
| U.S. Treasuries | | 2,301 | | (13) | | | | 23 | | (1) | | | | 2,324 | | (14) | |
| Total fixed maturities, AFS in an unrealized loss position | | $ | 10,933 | | $ | (121) | | | | $ | 608 | | $ | (23) | | | | $ | 11,541 | | $ | (144) | |
As of June 30, 2022, fixed maturities, AFS in an unrealized loss position consisted of 4,747 instruments, and were primarily depressed due to higher interest rates and/or wider credit
spreads since the purchase date. As of June 30, 2022, 95% of these fixed maturities were depressed less than 20% of cost or amortized cost. The increase in unrealized losses during the six
THE HARTFORD FINANCIAL SERVICES GROUP, INC.
NOTES TO CONDENSED CONSOLIDATED FINANCIAL STATEMENTS
months ended June 30, 2022, was primarily attributable to higher interest rates and wider credit spreads.
Most of the fixed maturities depressed for twelve months or more relate to the corporate sector, RMBS, and CLO which were primarily depressed because current rates are higher and/or market spreads are wider than at the respective purchase dates. Additionally, certain corporate fixed maturities were also depressed because of their variable-rate coupons and long-dated maturities. The Company neither has an intention to sell nor does it expect to be required to sell the fixed maturities outlined in the preceding discussion. The decision to record credit losses on fixed maturities, AFS in the form of an ACL requires us to make qualitative and quantitative estimates of expected future cash flows.
MORTGAGE LOANS
ACL on Mortgage Loans
The Company reviews mortgage loans on a quarterly basis to estimate the ACL with changes in the ACL recorded in net realized gains and losses. Apart from an ACL recorded on individual mortgage loans where the borrower is experiencing financial difficulties, the Company records an ACL on the pool of mortgage loans based on lifetime expected credit losses. The Company utilizes a third-party forecasting model to estimate lifetime expected credit losses at a loan level under multiple economic scenarios. The scenarios use macroeconomic data provided by an internationally recognized economics firm that generates forecasts of varying economic factors such as GDP growth, unemployment and interest rates. The economic scenarios are projected over 10 years. The first two to four years of the 10-year period assume a specific modeled economic scenario (including moderate upside, moderate recession and severe recession scenarios) and then revert to historical long-term assumptions over the remaining period. Using these economic scenarios, the forecasting model projects property-specific operating income and capitalization rates used to estimate the value of a future operating income stream. The operating income and the property valuations derived from capitalization rates are compared to loan payment and principal amounts to create debt service coverage ratios ("DSCRs") and LTVs over the forecast period. The Company's process also considers qualitative factors. The model overlays historical data about mortgage loan performance based on DSCRs and LTVs and projects the probability of default, amount of loss given a default and resulting expected loss through maturity for each loan under each economic scenario. Economic scenarios are probability-weighted based on a statistical analysis of the forecasted economic factors and qualitative analysis. The Company records the change in the ACL on mortgage loans based on the weighted-average expected credit losses across the selected economic scenarios.
When a borrower is experiencing financial difficulty, including
when foreclosure is probable, the Company measures an ACL on individual mortgage loans. The ACL is established for any shortfall between the amortized cost of the loan and the fair value of the collateral less costs to sell. Estimates of collectibility from an individual borrower require the use of significant management judgment and include the probability and timing of borrower default and loss severity estimates. In addition, cash flow projections may change based upon new information about the borrower's ability to pay and/or the value of underlying collateral such as changes in projected property value estimates. As of June 30, 2022, the Company did not have any mortgage loans for which an ACL was established on an individual basis.
There were no mortgage loans held-for-sale as of June 30, 2022 or December 31, 2021. For the three and six months ended June 30, 2022 and 2021, respectively, the Company had no mortgage loans that have had extensions or restructurings other than what is allowable under the original terms of the contract.
| | | | | | | | | | | | | | | | | |
| ACL on Mortgage Loans |
| Three Months Ended June 30, | | Six Months Ended June 30, |
| 2022 | 2021 | | 2022 | 2021 |
| ACL as of beginning of period | $ | 31 | | $ | 34 | | | $ | 29 | | $ | 38 | |
| Current period provision (release) | 5 | | (10) | | | 7 | | (14) | |
| | | | | |
| | | | | |
| | | | | |
| ACL as of June 30, | $ | 36 | | $ | 24 | | | $ | 36 | | $ | 24 | |
The increase in the allowance for the 2022 period is primarily attributable to the potential impact of current economic conditions on real estate property valuations and net additions of new loans.
The weighted-average LTV ratio of the Company’s mortgage loan portfolio was 50% as of June 30, 2022, while the weighted-average LTV ratio at origination of these loans was 59%. LTV ratios compare the loan amount to the value of the underlying property collateralizing the loan with property values based on appraisals updated no less than annually. Factors considered in estimating property values include, among other things, actual and expected property cash flows, geographic market data and the ratio of the property's net operating income to its value. DSCR compares a property’s net operating income to the borrower’s principal and interest payments and are updated no less than annually through reviews of underlying properties.
THE HARTFORD FINANCIAL SERVICES GROUP, INC.
NOTES TO CONDENSED CONSOLIDATED FINANCIAL STATEMENTS
| | | | | | | | | | | | | | | | | | | | | | | | | | | | | | | | | | | | | | | | | | | | |
| Mortgage Loans LTV & DSCR by Origination Year as of June 30, 2022 |
| 2022 | 2021 | 2020 | 2019 | 2018 | 2017 & Prior | Total |
| Loan-to-value | Amortized Cost | Avg. DSCR | Amortized Cost | Avg. DSCR | Amortized Cost | Avg. DSCR | Amortized Cost | Avg. DSCR | Amortized Cost | Avg. DSCR | Amortized Cost | Avg. DSCR | Amortized Cost [1] | Avg. DSCR |
| 65% - 80% | $ | 16 | | 2.02x | $ | 16 | | 1.85x | $ | 22 | | 2.66x | $ | 70 | | 1.46x | $ | 108 | | 0.98x | $ | 135 | | 1.69x | $ | 367 | | 1.51x |
| Less than 65% | $ | 616 | | 2.51x | $ | 1,460 | | 2.75x | $ | 678 | | 2.81x | $ | 711 | | 2.82x | $ | 462 | | 2.21x | $ | 1,594 | | 2.38x | $ | 5,521 | | 2.59x |
Total mortgage loans | $ | 632 | | 2.49x | $ | 1,476 | | 2.75x | $ | 700 | | 2.80x | $ | 781 | | 2.70x | $ | 570 | | 1.98x | $ | 1,729 | | 2.32x | $ | 5,888 | | 2.52x |
[1]Amortized cost of mortgage loans excludes ACL of $36.
| | | | | | | | | | | | | | | | | | | | | | | | | | | | | | | | | | | | | | | | | | | | | | | | | | | | | | | | | | | | | | | | | |
| Mortgage Loans LTV & DSCR by Origination Year as of December 31, 2021 | | | | | | | |
| 2021 | 2020 | 2019 | 2018 | 2017 | 2016 & Prior | Total | | | | | | | |
| Loan-to-value | Amortized Cost | Avg. DSCR | Amortized Cost | Avg. DSCR | Amortized Cost | Avg. DSCR | Amortized Cost | Avg. DSCR | Amortized Cost | Avg. DSCR | Amortized Cost | Avg. DSCR | Amortized Cost [1] | Avg. DSCR | | | | | | | |
| 65% - 80% | $ | 7 | | 2.37x | $ | 50 | | 2.63x | $ | 91 | | 1.57x | $ | 100 | | 1.00x | $ | 45 | | 1.37x | $ | 97 | | 1.80x | $ | 390 | | 1.61x | | | | | | | |
| Less than 65% | 1,481 | | 2.70x | 645 | | 2.78x | 722 | | 2.78x | 472 | | 2.23x | 417 | | 1.91x | 1,285 | | 2.45x | 5,022 | | 2.55x | | | | | | | |
Total mortgage loans | $ | 1,488 | | 2.70x | $ | 695 | | 2.77x | $ | 813 | | 2.64x | $ | 572 | | 2.02x | $ | 462 | | 1.86x | $ | 1,382 | | 2.41x | $ | 5,412 | | 2.48x | | | | | | | |
[1]Amortized cost of mortgage loans excludes ACL of $29.
| | | | | | | | | | | | | | | | | |
| Mortgage Loans by Region |
| June 30, 2022 | | December 31, 2021 |
| Amortized Cost | Percent of Total | | Amortized Cost | Percent of Total |
| East North Central | $ | 313 | | 5.3 | % | | $ | 284 | | 5.2 | % |
| | | | | |
| Middle Atlantic | 292 | | 5.0 | % | | 303 | | 5.6 | % |
| Mountain | 708 | | 12.0 | % | | 450 | | 8.3 | % |
| New England | 419 | | 7.1 | % | | 393 | | 7.3 | % |
| Pacific | 1,267 | | 21.5 | % | | 1,245 | | 23.0 | % |
| South Atlantic | 1,621 | | 27.5 | % | | 1,556 | | 28.8 | % |
| West North Central | 98 | | 1.7 | % | | 85 | | 1.6 | % |
| West South Central | 415 | | 7.1 | % | | 424 | | 7.8 | % |
| Other [1] | 755 | | 12.8 | % | | 672 | | 12.4 | % |
| Total mortgage loans | 5,888 | | 100.0 | % | | 5,412 | | 100.0 | % |
| ACL | (36) | | | | (29) | | |
| Total mortgage loans, net of ACL | $ | 5,852 | | | | $ | 5,383 | | |
[1]Primarily represents loans collateralized by multiple properties in various regions.
| | | | | | | | | | | | | | | | | |
| Mortgage Loans by Property Type |
| June 30, 2022 | | December 31, 2021 |
| Amortized Cost | Percent of Total | | Amortized Cost | Percent of Total |
| Commercial | | | | | |
| | | | | |
| Industrial | $ | 2,083 | | 35.4 | % | | $ | 1,931 | | 35.7 | % |
| | | | | |
| Multifamily | 2,167 | | 36.8 | % | | 1,833 | | 33.9 | % |
| Office | 611 | | 10.4 | % | | 627 | | 11.6 | % |
| Retail [1] | 949 | | 16.1 | % | | 951 | | 17.6 | % |
| Single Family | 38 | | 0.6 | % | | 30 | | 0.5 | % |
| Other | 40 | | 0.7 | % | | 40 | | 0.7 | % |
| Total mortgage loans | 5,888 | | 100.0 | % | | 5,412 | | 100.0 | % |
| ACL | (36) | | | | (29) | | |
| Total mortgage loans, net of ACL | $ | 5,852 | | | | $ | 5,383 | | |
[1]Primarily comprised of grocery-anchored retail centers, with no exposure to regional shopping malls.
Past-Due Mortgage Loans
Mortgage loans are considered past due if a payment of principal or interest is not received according to the contractual terms of the loan agreement, which typically includes a grace period. As of June 30, 2022 and December 31, 2021, the Company held no mortgage loans considered past due.
Mortgage Servicing
The Company originates, sells and services commercial mortgage loans on behalf of third parties and recognizes servicing fee income over the period that services are performed. As of June 30, 2022, under this program, the Company serviced mortgage loans with a total outstanding
THE HARTFORD FINANCIAL SERVICES GROUP, INC.
NOTES TO CONDENSED CONSOLIDATED FINANCIAL STATEMENTS
principal of $9.1 billion, of which $4.3 billion was serviced on behalf of third parties and $4.8 billion was retained and reported in total investments on the Company's Condensed Consolidated Balance Sheets. As of December 31, 2021, the Company serviced mortgage loans with a total outstanding principal balance of $8.2 billion, of which $3.9 billion was serviced on behalf of third parties and $4.3 billion was retained and reported in total investments on the Company's Condensed Consolidated Balance Sheets. Servicing rights are carried at the lower of cost or fair value and were $0 as of June 30, 2022 and December 31, 2021, because servicing fees were market-level fees at origination and remain adequate to compensate the Company for servicing the loans.
VARIABLE INTEREST ENTITIES
The Company is engaged with various special purpose entities and other entities that are deemed to be VIEs primarily as an investor through normal investment activities or, at times, as an investment manager.
A VIE is an entity that either has investors that lack certain essential characteristics of a controlling financial interest, such as simple majority kick-out rights, or lacks sufficient funds to finance its own activities without financial support provided by other entities. The Company performs ongoing qualitative assessments of its VIEs to determine whether the Company has a controlling financial interest in the VIE and therefore is the primary beneficiary. The Company is deemed to have a controlling financial interest when it has both the ability to direct the activities that most significantly impact the economic performance of the VIE and the obligation to absorb losses or right to receive benefits from the VIE that could potentially be significant to the VIE. Based on the Company’s assessment, if it determines it is the primary beneficiary, the Company consolidates the VIE in the Company’s Condensed Consolidated Financial Statements.
Consolidated VIEs
As of June 30, 2022 and December 31, 2021, the Company did not hold any securities for which it is the primary beneficiary.
Non-Consolidated VIEs
The Company, through normal investment activities, makes passive investments in limited partnerships and other alternative investments. For these non-consolidated VIEs, the Company has determined it is not the primary beneficiary as it has no ability to direct activities that could significantly affect the economic performance of the investments. The Company’s maximum exposure to loss as of June 30, 2022 and December 31, 2021 was limited to the total carrying value of $2.3 billion and $1.9 billion, respectively, which are a portion of the investments in limited partnerships and other alternative investments in the Company's Condensed Consolidated Balance Sheets that are primarily recorded using the equity method of accounting. As of June 30, 2022 and December 31, 2021, the Company has outstanding commitments totaling $1.7 billion and $1.4 billion, respectively, whereby the Company is committed to fund these investments and may be called by the partnership during the commitment period to fund the purchase of new investments and partnership expenses. These investments are generally of a passive nature in that the Company does not take an active role in management. For further discussion of these investments, see Equity Method
Investments within Note 6 - Investments of Notes to Consolidated Financial Statements included in the Company’s 2021 Form 10-K Annual Report.
In addition, the Company makes passive investments in structured securities issued by VIEs for which the Company is not the manager. These investments are included in ABS, CLO, CMBS, and RMBS and are reported in fixed maturities, AFS, and fixed maturities, FVO, on the Company's Condensed Consolidated Balance Sheets. The Company has not provided financial or other support with respect to these investments other than its original investment. For these investments, the Company determined it is not the primary beneficiary due to the relative size of the Company’s investment in comparison to the principal amount of the structured securities issued by the VIEs, the Company’s inability to direct the activities that most significantly impact the economic performance of the VIEs, and, where applicable, the level of credit subordination which reduces the Company’s obligation to absorb losses or right to receive benefits. The Company’s maximum exposure to loss on these investments is limited to the amount of the Company’s investment.
REVERSE REPURCHASE AGREEMENTS, OTHER COLLATERAL TRANSACTIONS AND RESTRICTED INVESTMENTS
Reverse Repurchase Agreements
From time to time, the Company enters into reverse repurchase agreements where the Company purchases securities and simultaneously agrees to resell the same or substantially the same securities. The maturity of these transactions is generally within one year. The agreements require additional collateral to be transferred to the Company under specified conditions and the Company has the right to sell or re-pledge the securities received. The Company accounts for reverse repurchase agreements as collateralized financing. As of June 30, 2022 and December 31, 2021, the Company reported $60 and $30, respectively, within short-term investments on the Condensed Consolidated Balance Sheets representing a receivable for the amount of cash transferred to purchase the securities.
Other Collateral Transactions
As of June 30, 2022 and December 31, 2021, the Company pledged collateral of $7 and $9, respectively, of U.S. government securities or cash primarily related to certain bank loan participations committed through a limited partnership agreement.
For disclosure of collateral in support of derivative transactions, refer to the Derivative Collateral Arrangements section in Note 6 - Derivatives of Notes to Condensed Consolidated Financial Statements.
Other Restricted Investments
The Company is required by law to deposit securities with government agencies in certain states in which it conducts business. In addition, the Company is required to hold fixed maturities and short-term investments in trust for the benefit of syndicate policyholders, hold fixed maturities in a Lloyd's of
THE HARTFORD FINANCIAL SERVICES GROUP, INC.
NOTES TO CONDENSED CONSOLIDATED FINANCIAL STATEMENTS
London ("Lloyd's") trust account to provide a portion of the required capital, and maintain other investments primarily consisting of overseas deposits in various countries with Lloyd's to support underwriting activities in those countries. Lloyd's is an insurance market-place operating worldwide. Lloyd's does not underwrite risks. The Company accepts risks as the sole member of Lloyd's Syndicate 1221 ("Lloyd's Syndicate").
The following table presents the components of the Company’s exposure to other restricted investments. | | | | | | | | |
|
| June 30, 2022 | December 31, 2021 |
| Fair Value | Fair Value |
| Securities on deposit with government agencies | $ | 2,172 | | $ | 2,376 | |
| Fixed maturities in trust for benefit of syndicate policyholders | 673 | | 712 | |
| Short-term investments in trust for benefit of syndicate policyholders | 6 | | 7 | |
| Fixed maturities in Lloyd's trust account | 149 | | 160 | |
| Other investments | 57 | | 65 | |
| Total Other Restricted Investments | $ | 3,057 | | $ | 3,320 | |
6. DERIVATIVES
The Company utilizes a variety of OTC, OTC-cleared and exchange traded derivative instruments as a part of its overall risk management strategy as well as to enter into replication transactions or income generation covered call transactions. Derivative instruments are used to manage risk associated with interest rate, equity market, commodity market, credit spread, issuer default, price, and currency exchange rate or volatility. Replication transactions are used as an economical means to synthetically replicate the characteristics and performance of assets that are permissible investments under the Company’s investment policies.
STRATEGIES THAT QUALIFY FOR HEDGE ACCOUNTING
Some of the Company's derivatives satisfy hedge accounting requirements as outlined in Note 1 - Basis of Presentation and Significant Accounting Policies of Notes to Consolidated Financial Statements, included in The Hartford’s 2021 Form 10-K Annual Report. Typically, these hedging instruments include interest rate swaps and, to a lesser extent, foreign currency swaps where the terms or expected cash flows of the hedged item closely match the terms of the swap. The interest rate swaps are typically used to manage interest rate duration of certain fixed maturity securities or debt instruments issued.
Cash Flow Hedges
Interest rate swaps are predominantly used to manage portfolio duration and better match cash receipts from assets with cash disbursements required to fund liabilities. These derivatives primarily convert interest receipts on variable-rate fixed maturity securities to fixed rates. The Company has also entered into interest rate swaps to convert the variable interest payments on 3 month London Inter-Bank Offered Rate ("LIBOR") + 2.125% junior subordinated debt to fixed interest payments. For further
information, see the Junior Subordinated Debentures section within Note 14 - Debt of Notes to the Consolidated Financial Statements, included in The Hartford's 2021 Form 10-K Annual Report.
Foreign currency swaps are used to convert foreign currency denominated cash flows related to certain investment receipts to U.S. dollars in order to reduce cash flow fluctuations due to changes in currency rates.
The Company also previously entered into forward starting swap agreements to hedge the interest rate exposure related to the future purchase of fixed-rate securities, primarily to hedge interest rate risk inherent in the assumptions used to price certain group benefits liabilities.
NON-QUALIFYING STRATEGIES
Derivative relationships that do not qualify for hedge accounting (“non-qualifying strategies”) primarily include hedges of interest rate, foreign currency, equity, and commodity risk of certain fixed maturities and equities. In addition, hedging and replication strategies that utilize credit default swaps do not qualify for hedge accounting. The non-qualifying strategies include:
Credit Contracts
Credit default swaps are used to purchase credit protection on an individual entity or referenced index to economically hedge against default risk and credit-related changes in the value of fixed maturity securities. Credit default swaps are also used to assume credit risk related to an individual entity or referenced index as a part of replication transactions. These contracts require the Company to pay or receive a periodic fee in exchange for compensation from the counterparty or the Company should the referenced security issuers experience a credit event, as defined in the contract. The Company also enters into credit default swaps to terminate existing credit
THE HARTFORD FINANCIAL SERVICES GROUP, INC.
NOTES TO CONDENSED CONSOLIDATED FINANCIAL STATEMENTS
default swaps, thereby offsetting the changes in value of the original swap going forward.
Interest Rate Swaps, Swaptions and Futures
The Company uses interest rate swaps and futures to manage interest rate duration between assets and liabilities. In addition, the Company enters into interest rate swaps to terminate existing swaps, thereby offsetting the changes in value of the original swap going forward. As of June 30, 2022 and December 31, 2021, the notional amount of interest rate swaps in offsetting relationships was $6.6 billion and $7.2 billion, respectively.
Foreign Currency Swaps and Forwards
The Company enters into foreign currency swaps to convert the foreign currency exposures of certain foreign currency-denominated fixed maturity investments to U.S. dollars.
Equity Index Options
The Company has previously entered into equity index options to hedge the impact of a decline in the equity markets on the investment portfolio. The Company has also entered into covered call options on equity securities to generate additional return.
Commodity Options
During the first quarter of 2022, the Company paid $10 to purchase call option contracts on oil futures in order to partially
offset potential changes in value related to certain fixed maturity securities that could arise if oil prices increased substantially. The option contracts were either terminated or were closed by entering into offsetting positions during the first quarter of 2022, resulting in a realized gain of $14.
DERIVATIVE BALANCE SHEET CLASSIFICATION
For reporting purposes, the Company has elected to offset within assets or liabilities based upon the net of the fair value amounts, income accruals and related cash collateral receivables and payables of OTC derivative instruments executed in a legal entity and with the same counterparty under a master netting agreement, which provides the Company with the legal right of offset. The following fair value amounts do not include income accruals or related cash collateral receivables and payables, which are netted with derivative fair value amounts to determine balance sheet presentation. The Company’s derivative instruments are held for risk management purposes, unless otherwise noted in the following table. The notional amount of derivative contracts represents the basis upon which payments or receipts are calculated and is presented in the table to quantify the volume of the Company’s derivative activity. Notional amounts are not necessarily reflective of credit risk.
| | | | | | | | | | | | | | | | | | | | | | | | | | | | | | | | |
Derivative Balance Sheet Presentation |
| Net Derivatives | | Asset Derivatives | | Liability Derivatives |
| Notional Amount | Fair Value | | Fair Value | | Fair Value |
| Hedge Designation/ Derivative Type | Jun 30, 2022 | Dec. 31, 2021 | Jun 30, 2022 | Dec. 31, 2021 | | Jun 30, 2022 | Dec. 31, 2021 | | Jun 30, 2022 | Dec. 31, 2021 |
| Cash flow hedges | | | | | | | | | | |
| Interest rate swaps | $ | 2,155 | | $ | 2,340 | | $ | (1) | | $ | — | | | $ | 2 | | $ | — | | | $ | (3) | | $ | — | |
| Foreign currency swaps | 524 | | 437 | | 53 | | 6 | | | 53 | | 11 | | | — | | (5) | |
| Total cash flow hedges | 2,679 | | 2,777 | | 52 | | 6 | | | 55 | | 11 | | | (3) | | (5) | |
| Non-qualifying strategies | | | | | | | | | | |
| Interest rate contracts | | | | | | | | | | |
| Interest rate swaps and futures | 6,969 | | 7,567 | | (19) | | (46) | | | 10 | | 3 | | | (29) | | (49) | |
| Foreign exchange contracts | | | | | | | | | | |
| Foreign currency swaps and forwards | 641 | | 558 | | 1 | | — | | | 1 | | — | | | — | | — | |
| Credit contracts | | | | | | | | | | |
| Credit derivatives that purchase credit protection | 5 | | 112 | | — | | (2) | | | — | | — | | | — | | (2) | |
| | | | | | | | | | |
| Credit derivatives in offsetting positions | 209 | | 210 | | — | | — | | | 4 | | 3 | | | (4) | | (3) | |
| | | | | | | | | | |
| | | | | | | | | | |
| Total non-qualifying strategies | 7,824 | | 8,447 | | (18) | | (48) | | | 15 | | 6 | | | (33) | | (54) | |
| Total cash flow hedges and non-qualifying strategies | $ | 10,503 | | $ | 11,224 | | $ | 34 | | $ | (42) | | | $ | 70 | | $ | 17 | | | $ | (36) | | $ | (59) | |
| Balance Sheet Location | | | | | | | | | | |
| Fixed maturities, available-for-sale | $ | 515 | | $ | 413 | | $ | — | | $ | — | | | $ | — | | $ | — | | | $ | — | | $ | — | |
| Other investments | 1,184 | | 1,452 | | 32 | | 7 | | | 35 | | 10 | | | (3) | | (3) | |
| Other liabilities | 8,804 | | 9,359 | | 2 | | (49) | | | 35 | | 7 | | | (33) | | (56) | |
| Total derivatives | $ | 10,503 | | $ | 11,224 | | $ | 34 | | $ | (42) | | | $ | 70 | | $ | 17 | | | $ | (36) | | $ | (59) | |
THE HARTFORD FINANCIAL SERVICES GROUP, INC.
NOTES TO CONDENSED CONSOLIDATED FINANCIAL STATEMENTS
Offsetting of Derivative Assets/Liabilities
The following tables present the gross fair value amounts, the offsetting amounts, and net position of derivative instruments eligible for offset in the Company's Condensed Consolidated Balance Sheets. Offsetting amounts include fair value amounts, income accruals and related cash collateral receivables and
payables associated with derivative instruments that are traded under a common master netting agreement, as described in the preceding discussion. Also included in the tables are financial collateral receivables and payables, which are contractually permitted to be offset upon an event of default, although are disallowed for offsetting under U.S. GAAP.
| | | | | | | | | | | | | | | | | | | | |
Offsetting Derivative Assets and Liabilities |
| (i) | (ii) | (iii) = (i) - (ii) | (iv) | (v) = (iii) - (iv) |
| | | Net Amounts Presented in the Statement of Financial Position | Collateral Disallowed for Offset in the Statement of Financial Position | |
| Gross Amounts of Recognized Assets (Liabilities) | Gross Amounts Offset in the Statement of Financial Position | Derivative Assets [1] (Liabilities) [2] | Accrued Interest and Cash Collateral (Received) [3] Pledged [2] | Financial Collateral (Received) Pledged [4] | Net Amount |
| As of June 30, 2022 | | | | | | |
| Other investments | $ | 70 | | $ | 52 | | $ | 32 | | $ | (14) | | $ | 17 | | $ | 1 | |
| Other liabilities | $ | (36) | | $ | (15) | | $ | 2 | | $ | (23) | | $ | (20) | | $ | (1) | |
| As of December 31, 2021 | | | | | | |
| Other investments | $ | 17 | | $ | 13 | | $ | 7 | | $ | (3) | | $ | 4 | | $ | — | |
| Other liabilities | $ | (59) | | $ | (10) | | $ | (49) | | $ | — | | $ | (47) | | $ | (2) | |
[1]Included in other investments in the Company's Condensed Consolidated Balance Sheets.
[2]Included in other liabilities in the Company's Condensed Consolidated Balance Sheets and is limited to the net derivative payable associated with each counterparty.
[3]Included in other investments in the Company's Condensed Consolidated Balance Sheets and is limited to the net derivative receivable associated with each counterparty.
[4]Excludes collateral associated with exchange-traded derivative instruments.
CASH FLOW HEDGES
For derivative instruments that are designated and qualify as cash flow hedges, the gain or loss on the derivative is reported as a component of OCI and reclassified into earnings in the
same period or periods during which the hedged transaction affects earnings. All components of each derivative’s gain or loss were included in the assessment of hedge effectiveness.
| | | | | | | | | | | | | | | | | | | |
| Gain (Loss) Recognized in OCI |
| | Three Months Ended June 30, | | Six Months Ended June 30, |
| | | 2022 | 2021 | | 2022 | 2021 |
| Interest rate swaps | | | $ | (3) | | $ | (4) | | | $ | (5) | | $ | 6 | |
| Foreign currency swaps | | | 41 | | 7 | | | 50 | | 11 | |
| Total | | | $ | 38 | | $ | 3 | | | $ | 45 | | $ | 17 | |
| | | | | | | | | | | | | | | | | | | | | | | | | | | | | | | | |
| Gain (Loss) Reclassified from AOCI into Income |
| |
| | | Three months ended June 30, | | Six Months Ended June 30, |
| | | 2022 | 2021 | 2022 | | 2021 |
| | | Net Investment Income | Interest Expense | Net Investment Income | Interest Expense | | Net Investment Income | Interest Expense | | Net Investment Income | Interest Expense |
| Interest rate swaps | | $ | 5 | | $ | (1) | | $ | 10 | | $ | (3) | | | $ | 14 | | $ | (4) | | | $ | 20 | | $ | (5) | |
| Foreign currency swaps | | 2 | | — | | 1 | | — | | | 4 | | — | | | 2 | | — | |
| Total | | $ | 7 | | $ | (1) | | $ | 11 | | $ | (3) | | | $ | 18 | | $ | (4) | | | $ | 22 | | $ | (5) | |
| | | | | | | | | | | | |
| Total amounts presented on the Condensed Consolidated Statement of Operations | | $ | 541 | | $ | 51 | | $ | 581 | | $ | 57 | | | $ | 1,050 | | $ | 113 | | | $ | 1,090 | | $ | 114 | |
THE HARTFORD FINANCIAL SERVICES GROUP, INC.
NOTES TO CONDENSED CONSOLIDATED FINANCIAL STATEMENTS
As of June 30, 2022, the before tax deferred net losses on derivative instruments recorded in AOCI that are expected to be reclassified to earnings during the next twelve months are $2. This expectation is based on the anticipated interest payments on hedged investments in fixed maturity securities and long-term debt that will occur over the next twelve months. At that time, the Company will recognize the deferred net gains (losses) as an adjustment to net investment income or interest expense, as applicable, over the term of the hedged instrument cash flows.
During the three and six months ended June 30, 2022 and 2021, the Company had no net reclassifications from AOCI to
earnings resulting from the discontinuance of cash-flow hedges due to forecasted transactions that were no longer probable of occurring.
NON-QUALIFYING STRATEGIES
For non-qualifying strategies, including embedded derivatives that are required to be bifurcated from their host contracts and accounted for as derivatives, the gain or loss on the derivative is recognized currently in earnings within net realized gains (losses).
| | | | | | | | | | | | | | | | | | |
| Non-Qualifying Strategies Recognized within Net Realized Gains (Losses) | |
| Three Months Ended June 30, | | Six Months Ended June 30, | |
| 2022 | 2021 | | 2022 | 2021 | |
| Foreign exchange contracts | | | | | | |
| Foreign currency forwards | $ | 4 | | $ | — | | | $ | 5 | | $ | — | | |
| | | | | | |
| | | | | | |
| | | | | | |
| Interest rate contracts | | | | | | |
| Interest rate swaps, swaptions, and futures | 5 | | (32) | | | 37 | | — | | |
| Credit contracts | | | | | | |
| Credit derivatives that purchase credit protection | 5 | | — | | | 5 | | — | | |
| Credit derivatives that assume credit risk | — | | 3 | | | — | | 6 | | |
| | | | | | |
| | | | | | |
| Commodity contracts | | | | | | |
| Commodity options | — | | — | | | 14 | | — | | |
| Total [1] | $ | 14 | | $ | (29) | | | $ | 61 | | $ | 6 | | |
| | | | | | |
| | | | | | |
| | | | | | |
[1]Excludes investments that contain an embedded credit derivative for which the Company has elected the fair value option. For further discussion, see the Fair Value Option section in Note 4 - Fair Value Measurements of Notes to Condensed Consolidated Financial Statements.
Credit Risk Assumed through Credit Derivatives
The Company primarily enters into credit default swaps that assume credit risk of a referenced market index in order to synthetically replicate investment transactions that are permissible under the Company's investment policies. The Company will receive periodic payments based on an agreed upon rate and notional amount and will only make a payment if there is a credit event. A credit event payment will typically be
equal to the notional value of the swap contract less the value of the referenced security issuer’s debt obligation after the occurrence of the credit event. A credit event is generally defined as a default on contractually obligated interest or principal payments or bankruptcy of the referenced entity. The credit default swaps in which the Company assumes credit risk reference baskets of standard diversified portfolios of CMBS issuers.
THE HARTFORD FINANCIAL SERVICES GROUP, INC.
NOTES TO CONDENSED CONSOLIDATED FINANCIAL STATEMENTS
| | | | | | | | | | | | | | | | | | | | | | | |
Credit Risk Assumed Derivatives by Type |
| | | | Underlying Referenced Credit Obligation(s) [1] | | |
| Notional Amount [2] | Fair Value | Weighted Average Years to Maturity | Type | Average Credit Rating | Offsetting Notional Amount [3] | Offsetting Fair Value [3] |
| As of June 30, 2022 |
| | | | | | | |
| | | | | | | |
| Basket credit default swaps [4] | | | | | | | |
| | | | | | | |
| | | | | | | |
| Investment grade risk exposure | $ | 100 | | $ | (1) | | 6 years | CMBS Credit | AAA | $ | 100 | | $ | 1 | |
| Below investment grade risk exposure | 4 | | (3) | | Less than 1 year | CMBS Credit | B- | 4 | | 3 | |
| Total [5] | $ | 104 | | $ | (4) | | | | | $ | 104 | | $ | 4 | |
| As of December 31, 2021 |
| | | | | | | |
| | | | | | | |
| Basket credit default swaps [4] | | | | | | | |
| | | | | | | |
| | | | | | | |
| Investment grade risk exposure | $ | 101 | | $ | — | | 6 years | CMBS Credit | AAA | $ | 101 | | $ | — | |
| Below investment grade risk exposure | 4 | | (2) | | Less than 1 year | CMBS Credit | CCC | 4 | | 2 | |
| Total [5] | $ | 105 | | $ | (2) | | | | | $ | 105 | | $ | 2 | |
[1]The average credit ratings are based on availability and are generally the midpoint of the available ratings among Moody’s, S&P and Fitch. If no rating is available from a rating agency, then an internally developed rating is used.
[2]Notional amount is equal to the maximum potential future loss amount. These derivatives are governed by agreements and applicable law, which include collateral posting requirements. There is no additional specific collateral related to these contracts or recourse provisions included in the contracts to offset losses.
[3]The Company has entered into offsetting credit default swaps to terminate certain existing credit default swaps, thereby offsetting the future changes in value of, or losses paid related to, the original swap.
[4]Comprised of swaps of standard market indices of diversified portfolios of CMBS issuers referenced through credit default swaps. These swaps are subsequently valued based upon the observable standard market index.
[5]Excludes investments that contain an embedded credit derivative for which the Company has elected the fair value option. For further discussion, see the Fair Value Option section in Note 4 - Fair Value Measurements of Notes to Consolidated Financial Statements.
.
DERIVATIVE COLLATERAL ARRANGEMENTS
The Company enters into various collateral arrangements in connection with its derivative instruments, which require both the pledging and accepting of collateral. As of June 30, 2022 and December 31, 2021, the Company has pledged cash collateral associated with derivative instruments of $0 and $2, respectively. In general, collateral receivable is recorded in other assets or other liabilities on the Company's Condensed Consolidated Balance Sheets as determined by the Company's election to offset on the balance sheet. As of June 30, 2022 and December 31, 2021, the Company pledged securities collateral associated with derivative instruments with a fair value of $16 and $48, respectively, which have been included in fixed maturities on the Company's Condensed Consolidated Balance Sheets. The counterparties generally have the right to sell or re-pledge these securities.
In addition, as of June 30, 2022 and December 31, 2021, the Company has pledged initial margin of cash related to OTC-cleared and exchange traded derivatives with a fair value of $16 and $12, respectively, which is recorded in other investments or other assets on the Company's Condensed Consolidated Balance Sheets. As of June 30, 2022 and December 31, 2021, the Company has pledged initial margin of securities related to OTC-cleared and exchange traded derivatives with a fair value of $21 and $82, respectively, which are included within fixed maturities on the Company's Condensed Consolidated Balance
Sheets.
As of June 30, 2022 and December 31, 2021, the Company accepted cash collateral associated with derivative instruments of $40 and $7, respectively, which was invested and recorded in the Company's Condensed Consolidated Balance Sheets in fixed maturities and short-term investments with corresponding amounts recorded in other investments or other liabilities as determined by the Company's election to offset on the balance sheet. The Company also accepted securities collateral as of June 30, 2022 and December 31, 2021, with a fair value of $17 and $5, respectively, which the Company has the right to repledge or sell. As of June 30, 2022 and December 31, 2021, the Company had no repledged securities. In addition, as of June 30, 2022 and December 31, 2021, non-cash collateral accepted was held in separate custodial accounts and was not included in the Company’s Condensed Consolidated Balance Sheets.
| | | | | | | | | |
| | Note 7 - Premiums Receivable and Agents' Balances |
THE HARTFORD FINANCIAL SERVICES GROUP, INC.
NOTES TO CONDENSED CONSOLIDATED FINANCIAL STATEMENTS
7. PREMIUMS RECEIVABLE AND AGENTS' BALANCES
| | | | | | | | |
| Premiums Receivable and Agents' Balances |
| |
| As of June 30, 2022 | As of December 31, 2021 |
| Premiums receivable, excluding receivables for losses within a deductible and retrospectively-rated policy premiums ("loss sensitive business") | $ | 4,703 | | $ | 4,130 | |
| Receivables for loss sensitive business, by credit quality: | | |
| | |
| AA | 126 | | 130 | |
| A | 38 | | 52 | |
| BBB | 121 | | 133 | |
| BB | 73 | | 64 | |
| Below BB | 42 | | 41 | |
| Total receivables for loss sensitive business | 400 | | 420 | |
| | |
Total Premiums Receivable and Agents' Balances, Gross | 5,103 | | 4,550 | |
| ACL | (107) | | (105) | |
Total Premiums Receivable and Agents' Balances, Net of ACL | $ | 4,996 | | $ | 4,445 | |
ACL on Premiums Receivable and Agents' Balances
Balances are considered past due when amounts that have been billed are not collected within contractually stipulated time periods. The Company had an immaterial amount of receivables with a due date of more than one year that are past-due.
Premiums receivable and agents' balances, excluding receivables for loss sensitive business, are primarily comprised of premiums due from policyholders, which are typically collectible within one year or less. For these balances, the ACL is estimated based on an aging of receivables and recent historical credit loss and collection experience, adjusted for current economic conditions and reasonable and supportable forecasts, when appropriate.
A portion of the Company's Commercial Lines business is written with large deductibles or under retrospectively-rated plans (referred to as "loss sensitive business"). Under some commercial insurance contracts with a large deductible, the
Company is obligated to pay the claimant the full amount of the claim and the Company is subsequently reimbursed by the policyholder for the deductible amount. As such, the Company is subject to credit risk until reimbursement is made. Retrospectively-rated policies are utilized primarily for workers' compensation coverage, whereby the ultimate premium is adjusted based on actual losses incurred. Although the premium adjustment feature of a retrospectively-rated policy substantially reduces insurance risk for the Company, it presents credit risk to the Company. The Company’s results of operations could be adversely affected if a significant portion of such policyholders failed to reimburse the Company for the deductible amount or the amount of additional premium owed under retrospectively-rated policies. The Company manages these credit risks through credit analysis, collateral requirements, and oversight.
The ACL for receivables for loss sensitive business is estimated as the amount of the receivable exposed to loss multiplied by estimated factors for probability of default and the amount of loss given a default. The probability of default is assigned based on each policyholder's credit rating, or a rating is estimated if no external rating is available. Credit ratings are reviewed and updated at least annually. The exposure amount is estimated net of collateral and other credit enhancement, considering the nature of the collateral, potential future changes in collateral values, and historical loss information for the type of collateral obtained. The probability of default factors are historical corporate defaults for receivables with similar durations estimated through multiple economic cycles. Credit ratings are forward-looking and consider a variety of economic outcomes. The loss given default factors are based on a study of historical recovery rates for general creditors through multiple economic cycles. The Company's evaluation of the required ACL for receivables for loss sensitive business considers the current economic environment as well as the probability-weighted macroeconomic scenarios similar to the approach used for estimating the ACL for mortgage loans. See Note 5 - Investments.
The increase in the ACL in the three and six months ended June 30, 2022 reflected the provision required on premiums written in the quarter and recoveries, offset by write-offs. During the three and six months ended ended June 30, 2021, the ACL on premiums receivable decreased as the provision required on premiums written in the quarter was more than offset by write-offs and a reduction in the provision reflecting lessening expected impacts of COVID-19 relative to prior assumptions in certain lines of business.
| | | | | | | | | |
| | Note 7 - Premiums Receivable and Agents' Balances |
THE HARTFORD FINANCIAL SERVICES GROUP, INC.
NOTES TO CONDENSED CONSOLIDATED FINANCIAL STATEMENTS
| | | | | | | | | | | | | | | | | | | | | | | | | | | |
| | | | | | | | | | | |
| Rollforward of ACL on Premiums Receivable and Agents' Balances for the Three Months Ended | | | | |
| June 30, 2022 | | June 30, 2021 | | |
| Premiums Receivable and Agents' Balances, Excluding Receivables for Loss Sensitive Business | Receivables for Loss Sensitive Business | Total | | Premiums Receivable and Agents' Balances, Excluding Receivables for Loss Sensitive Business | Receivables for Loss Sensitive Business | Total | | | | |
| Beginning ACL | $ | 84 | | $ | 22 | | $ | 106 | | | $ | 108 | | $ | 36 | | $ | 144 | | | | | |
| Current period provision (release) | 10 | | 1 | | 11 | | | 1 | | 1 | | 2 | | | | | |
| Current period write-offs | (13) | | — | | (13) | | | (15) | | — | | (15) | | | | | |
| Current period recoveries | 3 | | — | | 3 | | | 3 | | — | | 3 | | | | | |
| Ending ACL | $ | 84 | | $ | 23 | | $ | 107 | | | $ | 97 | | $ | 37 | | $ | 134 | | | | | |
| | | | | | | | | | | | | | | | | | | | | | | | | | | |
Rollforward of ACL on Premiums Receivable and Agents' Balances for the Six Months Ended | | | | |
| June 30, 2022 | | June 30, 2021 | | |
| Premiums Receivable and Agents' Balances, Excluding Receivables for Loss Sensitive Business | Receivables for Loss Sensitive Business | Total | | Premiums Receivable and Agents' Balances, Excluding Receivables for Loss Sensitive Business | Receivables for Loss Sensitive Business | Total | | | | |
Beginning ACL | $ | 83 | | $ | 22 | | $ | 105 | | | $ | 117 | | $ | 35 | | $ | 152 | | | | | |
| Current period provision (release) | 23 | | 1 | | 24 | | | 5 | | 2 | | 7 | | | | | |
| Current period write-offs | (28) | | — | | (28) | | | (30) | | — | | (30) | | | | | |
| Current period recoveries | 6 | | — | | 6 | | | 5 | | — | | 5 | | | | | |
Ending ACL | $ | 84 | | $ | 23 | | $ | 107 | | | $ | 97 | | $ | 37 | | $ | 134 | | | | | |
8. REINSURANCE
The Company cedes insurance risk to reinsurers to enable the Company to manage capital and risk exposure. Such arrangements do not relieve the Company of its primary liability to policyholders. Failure of reinsurers to honor their obligations could result in losses to the Company. The Company's procedures include carefully selecting its reinsurers, structuring agreements to provide collateral funds where necessary, and regularly monitoring the financial condition and ratings of its reinsurers.
REINSURANCE RECOVERABLES
Reinsurance recoverables include balances due from reinsurance companies and are presented net of an allowance for uncollectible reinsurance. Reinsurance recoverables include an estimate of the amount of gross losses and loss adjustment
expense reserves that may be ceded under the terms of the reinsurance agreements, including incurred but not reported ("IBNR") unpaid losses. The Company’s estimate of losses and loss adjustment expense reserves ceded to reinsurers is based on assumptions that are consistent with those used in establishing the gross reserves for amounts the Company owes to its claimants. The Company estimates its ceded reinsurance recoverables based on the terms of any applicable facultative and treaty reinsurance, including an estimate of how incurred but not reported losses will ultimately be ceded under reinsurance agreements. Accordingly, the Company’s estimate of reinsurance recoverables is subject to similar risks and uncertainties as the estimate of the gross reserve for unpaid losses and loss adjustment expenses.
THE HARTFORD FINANCIAL SERVICES GROUP, INC.
NOTES TO CONDENSED CONSOLIDATED FINANCIAL STATEMENTS
| | | | | | | | | | | | | | | | | | | | | | | | | | | | | |
| Reinsurance Recoverables by Credit Quality Indicator |
| As of June 30, 2022 | | As of December 31, 2021 |
| Property and Casualty | Group Benefits | Corporate | Total | | Property and Casualty | Group Benefits | Corporate | Total |
A.M. Best Financial Strength Rating | | | | | | | | | |
| A++ | $ | 1,873 | | $ | — | | $ | — | | $ | 1,873 | | | $ | 1,860 | | $ | — | | $ | — | | $ | 1,860 | |
| A+ | 2,126 | | 241 | | 275 | | 2,642 | | | 1,999 | | 237 | | 275 | | 2,511 | |
| A | 768 | | 1 | | — | | 769 | | | 713 | | — | | — | | 713 | |
| A- | 48 | | 10 | | — | | 58 | | | 37 | | 9 | | — | | 46 | |
| B++ | 633 | | — | | 3 | | 636 | | | 639 | | — | | 3 | | 642 | |
| Below B++ | 20 | | — | | — | | 20 | | | 20 | | — | | — | | 20 | |
Total Rated by A.M. Best | 5,468 | | 252 | | 278 | | 5,998 | | | 5,268 | | 246 | | 278 | | 5,792 | |
| Mandatory (Assigned) and Voluntary Risk Pools | 228 | | — | | — | | 228 | | | 239 | | — | | — | | 239 | |
| Captives | 343 | | — | | — | | 343 | | | 331 | | — | | — | | 331 | |
| Other not rated companies | 256 | | 6 | | — | | 262 | | | 255 | | 5 | | — | | 260 | |
Gross Reinsurance Recoverables | 6,295 | | 258 | | 278 | | 6,831 | | | 6,093 | | 251 | | 278 | | 6,622 | |
Allowance for uncollectible reinsurance | (102) | | (1) | | (2) | | (105) | | | (96) | | (1) | | (2) | | (99) | |
Net Reinsurance Recoverables | $ | 6,193 | | $ | 257 | | $ | 276 | | $ | 6,726 | | | $ | 5,997 | | $ | 250 | | $ | 276 | | $ | 6,523 | |
| | | | | | | | | |
| | | | | | | | | |
| | | | | | | | | |
Balances are considered past due when amounts that have been billed are not collected within contractually stipulated time periods, generally 30, 60 or 90 days. To manage reinsurer credit risk, a reinsurance security review committee evaluates the credit standing, financial performance, management and operational quality of each potential reinsurer. In placing reinsurance, the Company considers the nature of the risk reinsured, including the expected liability payout duration, and establishes limits tiered by reinsurer credit rating.
Where its contracts permit, the Company secures future claim obligations with various forms of collateral or other credit enhancement, including irrevocable letters of credit, secured trusts, funds held accounts and group wide offsets. As part of its reinsurance recoverable review, the Company analyzes recent developments in commutation activity between reinsurers and cedants, recent trends in arbitration and litigation outcomes in disputes between cedants and reinsurers and the overall credit quality of the Company’s reinsurers.
Due to the inherent uncertainties as to collection and the length of time before reinsurance recoverables become due, it is possible that future adjustments to the Company’s reinsurance recoverables, net of the allowance, could be required, which could have a material adverse effect on the Company’s consolidated results of operations or cash flows in a particular quarter or annual period.
The allowance for uncollectible reinsurance comprises an ACL and an allowance for disputed balances. The ACL is estimated as the amount of reinsurance recoverables exposed to loss multiplied by estimated factors for the probability of default and the amount of loss given a default. The probability of default is assigned based on each reinsurer's credit rating, or a rating is estimated if no external rating is available. Credit ratings are reviewed on a quarterly basis and any significant changes are reflected in an updated estimate. The probability of default
factors are historical insurer and reinsurer defaults for liabilities with similar durations to the reinsured liabilities as estimated through multiple economic cycles. Credit ratings are forward-looking and consider a variety of economic outcomes. The loss given default factors are based on a study of historical recovery rates for general creditors of corporations through multiple economic cycles or, in the case of purchased annuities funding structured settlements accounted for as reinsurance, historical recovery rates for annuity contract holders.
As shown in the table above, a portion of the total gross reinsurance recoverable balance relates to the Company’s participation in various mandatory (assigned) and voluntary risk pools. Reinsurance recoverables due from pools are backed by the financial position of all insurance companies participating in the pools and the credit backing the reinsurance recoverable is not limited to the financial strength of each pool. The mandatory pools generally are funded through policy assessments or surcharges and if any participant in the pool defaults, remaining liabilities are apportioned among the other members.
The Company's evaluation of the required ACL for reinsurance recoverables considers the current economic environment as well as macroeconomic scenarios similar to the approach used to estimate the ACL for mortgage loans. See Note 5 - Investments. Insurance companies, including reinsurers, are regulated and hold risk-based capital ("RBC") to mitigate the risk of loss due to economic factors and other risks. Non-U.S. reinsurers are either subject to a capital regime substantively equivalent to domestic insurers or we hold collateral to support collection of reinsurance recoverables. As a result, there is limited history of losses from insurer defaults. The decrease in the ACL for the six months ended June 30, 2021 was primarily due to higher than expected recovery from one reinsurer on which the Company had recognized an ACL.
THE HARTFORD FINANCIAL SERVICES GROUP, INC.
NOTES TO CONDENSED CONSOLIDATED FINANCIAL STATEMENTS
| | | | | | | | | | | | | | | | | | | | | | | | | | | | | | | | | | |
Allowance for Uncollectible Reinsurance for the Three Months Ended |
| June 30, 2022 | | June 30, 2021 | | |
| Property and Casualty | Group Benefits | Corporate | Total | | Property and Casualty | Group Benefits | Corporate | Total | | | | | |
Beginning allowance for uncollectible reinsurance | $ | 96 | | $ | 1 | | $ | 2 | | $ | 99 | | | $ | 95 | | $ | 1 | | $ | 2 | | $ | 98 | | | | | | |
| Beginning allowance for disputed amounts | 56 | | — | | — | | 56 | | | 56 | | — | | — | | 56 | | | | | | |
Beginning ACL | 40 | | 1 | | 2 | | 43 | | | 39 | | 1 | | 2 | | 42 | | | | | | |
| Current period provision (release) | 1 | | — | | — | | 1 | | | 1 | | — | | — | | 1 | | | | | | |
| | | | | | | | | | | | | | |
Ending ACL | 41 | | 1 | | 2 | | 44 | | | 40 | | 1 | | 2 | | 43 | | | | | | |
| Ending allowance for disputed amounts | 61 | | — | | — | | 61 | | | 56 | | — | | — | | 56 | | | | | | |
Ending allowance for uncollectible reinsurance | $ | 102 | | $ | 1 | | $ | 2 | | $ | 105 | | | $ | 96 | | $ | 1 | | $ | 2 | | $ | 99 | | | | | | |
| | | | | | | | | | | | | | | | | | | | | | | | | | | | | | | | | | | |
| | | | | | | | | | | | | | | |
| Allowance for Uncollectible Reinsurance for the Six Months Ended |
| | June 30, 2022 | | June 30, 2021 | | |
| | Property and Casualty | Group Benefits | Corporate | Total | | Property and Casualty | Group Benefits | Corporate | Total | | | | | |
| Beginning allowance for uncollectible reinsurance | $ | 96 | | $ | 1 | | $ | 2 | | $ | 99 | | | $ | 105 | | $ | 1 | | $ | 2 | | $ | 108 | | | | | | |
| Beginning allowance for disputed amounts | 54 | | — | | — | | 54 | | | 53 | | — | | — | | 53 | | | | | | |
| Beginning ACL | 42 | | 1 | | 2 | | 45 | | | 52 | | 1 | | 2 | | 55 | | | | | | |
| Current period provision (release) | (1) | | — | | — | | (1) | | | (12) | | — | | — | | (12) | | | | | | |
| | | | | | | | | | | | | | | |
| Ending ACL | 41 | | 1 | | 2 | | 44 | | | 40 | | 1 | | 2 | | 43 | | | | | | |
| Ending allowance for disputed amounts | 61 | | — | | — | | 61 | | | 56 | | — | | — | | 56 | | | | | | |
| Ending allowance for uncollectible reinsurance | $ | 102 | | $ | 1 | | $ | 2 | | $ | 105 | | | $ | 96 | | $ | 1 | | $ | 2 | | $ | 99 | | | | | | |
| | | | | | | | | |
| | Note 9 - Reserves for Unpaid Losses and Loss Adjustment Expenses |
THE HARTFORD FINANCIAL SERVICES GROUP, INC.
NOTES TO CONDENSED CONSOLIDATED FINANCIAL STATEMENTS
9. RESERVE FOR UNPAID LOSSES AND LOSS ADJUSTMENT EXPENSES
|PROPERTY & CASUALTY INSURANCE PRODUCT RESERVES, NET OF REINSURANCE
Rollforward of Liabilities for Unpaid Losses and Loss Adjustment Expenses
| | | | | | | | | |
| | For the six months ended June 30, |
| | 2022 | 2021 | |
Beginning liabilities for unpaid losses and loss adjustment expenses, gross | $ | 31,449 | | $ | 29,622 | | |
| Reinsurance and other recoverables | 6,081 | | 5,725 | | |
Beginning liabilities for unpaid losses and loss adjustment expenses, net | 25,368 | | 23,897 | | |
Provision for unpaid losses and loss adjustment expenses | | | |
| Current accident year | 3,998 | | 3,838 | | |
| Prior accident year development [1] | (94) | | 80 | | |
Total provision for unpaid losses and loss adjustment expenses | 3,904 | | 3,918 | | |
| Change in deferred gain on retroactive reinsurance included in other liabilities [1] | — | | (45) | | |
Payments | | | |
| Current accident year | (840) | | (864) | | |
| Prior accident years | (2,680) | | (2,222) | | |
Total payments | (3,520) | | (3,086) | | |
| Foreign currency adjustment | (29) | | (7) | | |
Ending liabilities for unpaid losses and loss adjustment expenses, net | 25,723 | | 24,677 | | |
| Reinsurance and other recoverables | 6,212 | | 5,905 | | |
Ending liabilities for unpaid losses and loss adjustment expenses, gross | $ | 31,935 | | $ | 30,582 | | |
[1]Prior accident year development does not include the benefit of a portion of losses ceded under the Navigators and Asbestos and Environmental ("A&E") Adverse Development Cover ("ADC") which, under retroactive reinsurance accounting, is deferred and is recognized over the period the ceded losses are recovered in cash from National Indemnity Company ("NICO"), a subsidiary of Berkshire Hathaway Inc. For additional information regarding the two adverse development cover reinsurance agreements, refer to Adverse Development Covers discussion below.
| | | | | | | | | |
| | Note 9 - Reserves for Unpaid Losses and Loss Adjustment Expenses |
THE HARTFORD FINANCIAL SERVICES GROUP, INC.
NOTES TO CONDENSED CONSOLIDATED FINANCIAL STATEMENTS
Unfavorable (Favorable) Prior Accident Year Development
| | | | | | | | | | |
| | For the six months ended June 30, |
| | | 2022 | 2021 |
| Workers’ compensation | | | $ | (85) | | $ | (83) | |
| Workers’ compensation discount accretion | | | 18 | | 18 | |
| General liability | | | 33 | | 307 | |
| Marine | | | (3) | | 1 | |
| Package business | | | (24) | | (46) | |
| Commercial property | | | (21) | | (20) | |
| Professional liability | | | (9) | | (7) | |
| Bond | | | (4) | | (14) | |
| Assumed reinsurance | | | 12 | | — | |
| Automobile liability - Commercial Lines | | | 12 | | — | |
| Automobile liability - Personal Lines | | | (5) | | (43) | |
| Homeowners | | | — | | 1 | |
| | | | |
| | | | |
| | | | |
| Catastrophes | | | (30) | | (98) | |
| Uncollectible reinsurance | | | 6 | | (10) | |
| Other reserve re-estimates, net | | | 6 | | 29 | |
| Prior accident year development before change in deferred gain | | | (94) | | 35 | |
| Change in deferred gain on retroactive reinsurance included in other liabilities [1] | | | — | | 45 | |
| Total prior accident year development | | | $ | (94) | | $ | 80 | |
[1]The change in deferred gain for the six months ended June 30, 2021 included $45 of adverse development on Navigators 2018 and prior accident year reserves, primarily driven by professional liability.
Re-estimates of prior accident year reserves for the six months ended June 30, 2022
Workers’ compensation reserves were decreased for the 2014 through 2018 accident years, predominately within small commercial, driven by lower than previously estimated claim severity.
General liability reserves were increased, driven by an increase in the estimated cost to settle large individual claims in middle and large commercial for the 2016 to 2019 accident years, an increase in excess casualty for the 2019 accident year, and increases in primary construction on older accident years, partially offset by a decrease in reserves for other mass torts.
Package business reserves decreased due to lower estimated loss adjustment expenses for accident years 2015 to 2018 and a reduction in property reserves for the 2020 and 2021 accident years.
Commercial property reserves were decreased primarily due to favorable development for the 2020 accident year in middle & large commercial related to COVID-19 claims and a reduction in property reserves for the 2021 accident year.
Professional liability reserves were decreased primarily due to favorable development on directors’ and officers’ claims for the 2018 to 2020 accident years and on
errors and omissions claims for the 2013 to 2017 accident years, partially offset by large losses related to 2018 and prior accident years for primary and excess directors’ and officers’ claims.
Assumed reinsurance reserves were increased primarily due to higher reserve estimates for syndicate property claims, including higher expected COVID-19 property losses in the 2020 accident year and increased reserves for international agriculture related to drought claims.
Automobile liability reserves were decreased in Personal Lines principally due to lower estimated severity on AARP Direct claims, primarily within accident years 2016 to 2020 and were increased in Commercial Lines principally due to a higher number of large claims in accident years 2017 to 2019.
Catastrophe reserves were decreased in both Commercial and Personal Lines with the largest reduction related to 2019 and 2020 wind and hail events.
Other reserve re-estimates, net, were increased primarily due to an increase in automobile physical damage severity and unfavorable development from participation in involuntary market pools.
Re-estimates of prior accident year reserves for the six months ended June 30, 2021
Workers’ compensation reserves were decreased primarily within small commercial and middle & large commercial accounts for the 2013 through 2017 accident years driven by lower than previously estimated claim severity.
General liability reserves were increased including an increase for sexual molestation and sexual abuse claims above the amount of reserves previously recorded for this exposure, primarily to reflect an increase in reserves for claims made against the Boy Scouts of America ("BSA") as discussed further below, partially offset by reserve decreases for other mass torts and extra contractual liability claims.
Package business reserves decreased largely due to lower estimated loss adjustment expenses for accident years 2014 to 2018 and a reduction in estimated reserves for extra contractual liability claims.
Commercial property reserves were decreased primarily due to favorable development for the 2020 accident year in both middle & large commercial and global specialty.
Professional liability reserves were decreased due to lower estimated severity in both large and middle market directors’ and officers’ (“D&O”) insurance for older accident years. More than offsetting this favorable reserve development were reserve increases on legacy Navigators public company directors’ and officers’ insurance for 2018 and prior accident years which is reflected within the change in deferred gain on retroactive reinsurance in the above table.
Bond reserves were reduced mostly due to favorable emergence on contract surety claims driven by higher than previously anticipated recoveries, largely for the 2016 to 2017 accident years.
Automobile liability reserves were decreased in Personal Lines principally due to lower estimated severity on
| | | | | | | | | |
| | Note 9 - Reserves for Unpaid Losses and Loss Adjustment Expenses |
THE HARTFORD FINANCIAL SERVICES GROUP, INC.
NOTES TO CONDENSED CONSOLIDATED FINANCIAL STATEMENTS
AARP Direct and Agency claims, primarily within accident years 2015 to 2020, and a reduction in estimated reserves for extra contractual liability claims.
Catastrophes reserves were decreased in both Commercial and Personal Lines primarily driven by a reduction in reserves for 2019 and 2020 wind and hail events, lower estimated losses from 2017 and 2018 hurricanes and a reduction in estimated losses from the 2017 and 2018 California wildfires, including an expected recovery of subrogation from a utility related to the 2018 Woolsey wildfire in California.
Uncollectible reinsurance reserves were decreased due to a higher than expected recovery from one reinsurer on which the Company had recognized an allowance for credit losses.
Other reserve re-estimates, net, were increased primarily due to an increase in reserves for sexual molestation and sexual abuse claims within P&C Other Operations, principally on assumed reinsurance.
Settlement Agreement with Boy Scouts of America
On September 14, 2021, the Company announced that it entered into a new agreement-in-principle with the BSA, related to sexual molestation and sexual abuse claims associated with liability policies issued by various Hartford writing companies in the 1970s and early 1980s, with the agreement in-principle including the BSA, its local councils and the representatives of a majority of the sexual abuse claimants. As part of the agreement-in-principle, The Hartford will pay $787, before tax, for claims associated with policies mostly issued in the 1970s. In exchange for The Hartford’s payment, the BSA and its local councils will fully release The Hartford from any obligation under policies The Hartford issued to the BSA and its local councils. In addition, the representatives for the claimants joining this agreement-in-principle will support a plan of reorganization which incorporates the settlement.
The agreement-in-principle was reached in connection with BSA’s Chapter 11 bankruptcy and a written settlement agreement (the "Settlement") was executed on February 14, 2022. The Settlement will become final upon the occurrence of certain conditions, including, but not limited to, confirmation of BSA’s plan of reorganization, receipt of executed releases from the local councils, and approval of the Settlement as part of the confirmation of BSA's plan of reorganization by the bankruptcy and district courts. While the confirmation hearing regarding BSA’s bankruptcy plan concluded in April, a final decision from the bankruptcy court on whether to approve BSA's plan of reorganization is not expected until later in third quarter 2022, with civil district court approval expected after that. Upon civil district court approval, the Company will pay the settlement amount of $787. However, no assurance can be given that all the conditions precedent to the Settlement will be satisfied or that final court approval, if obtained, will not be delayed for various procedural reasons.
If the conditions precedent to the Settlement are not satisfied or the requisite court approvals for BSA’s plan of reorganization are not obtained, it is possible that adverse outcomes, if any, could have a material adverse effect on the Company’s consolidated operating results.
Adverse Development Covers
The Company has an adverse development cover reinsurance agreement with NICO, a subsidiary of Berkshire Hathaway Inc., to reinsure loss development after 2016 on substantially all of the Company’s asbestos and environmental reserves (the “A&E ADC”). Under the A&E ADC, the Company paid a reinsurance premium of $650 for NICO to assume adverse net loss reserve development up to $1.5 billion above the Company’s existing net A&E reserves as of December 31, 2016 of approximately $1.7 billion including reserves for A&E exposure for accident years prior to 1986 that are reported in Property & Casualty Other Operations ("Run-off A&E") and reserves for A&E exposure for accident years 1986 and subsequent from policies underwritten prior to 2016 that are reported in ongoing Commercial Lines and Personal Lines. The $650 reinsurance premium was placed into a collateral trust account as security for NICO’s claim payment obligations to the Company. The Company has retained the risk of collection on amounts due from other third-party reinsurers and continues to be responsible for claims handling and other administrative services, subject to certain conditions. The A&E ADC covers substantially all the Company’s A&E reserve development up to the reinsurance limit.
Under retroactive reinsurance accounting, net adverse A&E reserve development after December 31, 2016 results in an offsetting reinsurance recoverable up to the $1.5 billion limit. Cumulative ceded losses up to the $650 reinsurance premium paid have been recognized as a dollar-for-dollar offset to direct losses incurred. Cumulative ceded losses exceeding the $650 reinsurance premium paid result in a deferred gain. As of June 30, 2022, the Company has incurred $1,015 in cumulative adverse development on asbestos and environmental reserves that have been ceded under the A&E ADC treaty with NICO with $485 of available limit remaining under the A&E ADC. As a result, the Company has recorded a $365 deferred gain within other liabilities, representing the difference between the reinsurance recoverable of $1,015 and ceded premium paid of $650. The deferred gain is recognized over the claim settlement period in the proportion of the amount of cumulative ceded losses collected from the reinsurer to the estimated ultimate reinsurance recoveries. Consequently, until periods when the deferred gain is recognized as a benefit to earnings, cumulative adverse development of asbestos and environmental claims will result in charges against earnings which may be significant.
Immediately after closing on the acquisition of Navigators Group, effective May 23, 2019, the Company purchased the Navigators ADC, an aggregate excess of loss reinsurance agreement covering adverse reserve development, from NICO, on behalf of Navigators Insurers. Under the Navigators ADC, the Navigators Insurers paid NICO a reinsurance premium of $91 in exchange for reinsurance coverage of $300 of adverse net loss reserve development that attaches $100 above the Navigators Insurers' existing net loss and allocated loss adjustment reserves as of December 31, 2018 subject to the treaty of $1.816 billion for accidents and losses prior to December 31, 2018.
As of June 30, 2022, the Company has recorded a reinsurance recoverable under the Navigators ADC of $300, as estimated cumulative loss development on the 2018 and prior accident year reserves has exhausted the treaty limit. While the
| | | | | | | | | |
| | Note 9 - Reserves for Unpaid Losses and Loss Adjustment Expenses |
THE HARTFORD FINANCIAL SERVICES GROUP, INC.
NOTES TO CONDENSED CONSOLIDATED FINANCIAL STATEMENTS
reinsurance recoverable is $300, the Company has recorded a $209 cumulative deferred gain within other liabilities since, under retroactive reinsurance accounting, ceded losses in excess of the $91 of ceded premium paid must be recognized
as a deferred gain. The deferred gain is recognized over the claim settlement period in the proportion of the amount of cumulative ceded losses collected from the reinsurer to the estimated ultimate reinsurance recoveries.
|GROUP LIFE, DISABILITY AND ACCIDENT PRODUCTS
Rollforward of Liabilities for Unpaid Losses and Loss Adjustment Expenses
| | | | | | | | |
| For the six months ended June 30, |
| 2022 | 2021 |
| Beginning liabilities for unpaid losses and loss adjustment expenses, gross | $ | 8,210 | | $ | 8,233 | |
| Reinsurance recoverables | 245 | | 237 | |
| Beginning liabilities for unpaid losses and loss adjustment expenses, net | 7,965 | | 7,996 | |
| | |
| Provision for unpaid losses and loss adjustment expenses | | |
| Current incurral year | 2,497 | | 2,464 | |
| Prior year's discount accretion | 107 | | 106 | |
| Prior incurral year development [1] | (242) | | (282) | |
| Total provision for unpaid losses and loss adjustment expenses [2] | 2,362 | | 2,288 | |
| Payments | | |
| Current incurral year | (984) | | (1,000) | |
| Prior incurral years | (1,500) | | (1,414) | |
| Total payments | (2,484) | | (2,414) | |
| Ending liabilities for unpaid losses and loss adjustment expenses, net | 7,843 | | 7,870 | |
| Reinsurance recoverables | 254 | | 250 | |
| Ending liabilities for unpaid losses and loss adjustment expenses, gross | $ | 8,097 | | $ | 8,120 | |
[1]Prior incurral year development represents the change in estimated ultimate incurred losses and loss adjustment expenses for prior incurral years on a discounted basis.
[2]Includes unallocated loss adjustment expenses ("ULAE") of $92 and $87 for the six months ended June 30, 2022 and 2021, respectively, that are recorded in insurance operating costs and other expenses in the Condensed Consolidated Statements of Operations.
Re-estimates of prior incurral years reserves for the six months ended June 30, 2022
Group disability- Prior period reserve estimates decreased by approximately $195 largely driven by group long-term disability claim incidence lower than prior assumptions together with strong recoveries on prior incurral year claims.
Group life and accident (including group life premium waiver)- Prior period reserve estimates decreased by approximately $40 largely driven by continued low incidence in group life premium waiver as well as a reduction in estimated excess mortality group term life losses incurred in fourth quarter 2021.
Supplement Accident & Health- Prior period reserve estimates decreased by approximately $10 driven by lower than previously expected claim incidence.
Re-estimates of prior incurral years reserves for the six months ended June 30, 2021
Group disability- Prior period reserve estimates decreased by approximately $240 largely driven by group long-term disability claim incidence lower than prior assumptions together with strong recoveries on prior incurral year claims. Also contributing was group short-term disability non-COVID-19 claim incidence lower than previously expected and a New York Paid Family Leave risk adjustment benefit.
Group life and accident (including group life premium waiver)- Prior period reserve estimates decreased by approximately $30 largely driven by lower-than-previously expected claim incidence in both group life premium waiver and group accidental death & dismemberment.
Supplemental Accident & Health- Prior period reserve estimates decreased by approximately $10 driven by lower-than-previously expected claim incidence during the pandemic.
| | | | | | | | | |
| | Note 10 - Reserve for Future Policy Benefits |
THE HARTFORD FINANCIAL SERVICES GROUP, INC.
NOTES TO CONDENSED CONSOLIDATED FINANCIAL STATEMENTS
10. RESERVE FOR FUTURE POLICY BENEFITS
| | | | | | | | |
| Changes in Reserves for Future Policy Benefits[1] |
| For the six months ended June 30, |
| 2022 | 2021 |
| Beginning liability balance | $ | 596 | | $ | 638 | |
| Incurred | 63 | | 33 | |
| Paid | (65) | | (54) | |
| Change in unrealized investment gains and losses | (18) | | (6) | |
| Ending liability balance | $ | 576 | | $ | 611 | |
| | |
| | |
| | |
| Ending reinsurance recoverable asset | $ | 33 | | $ | 24 | |
[1]Reserves for future policy benefits includes paid-up life insurance and whole-life policies resulting from conversion from group life policies included within the Group Benefits segment and reserves for run-off structured settlement and terminal funding agreement liabilities which are in the Corporate category.
11. DEBT
Junior Subordinated Debentures
On April 15, 2022, The Hartford redeemed at par $600 aggregate principal amount of its 7.875% junior subordinated debentures due 2042 and recognized, in insurance operating costs and other expenses, a loss on extinguishment of debt of $9, before tax, for unamortized debt issuance costs.
Shelf Registrations
On February 22, 2022, the Company filed with the Securities and Exchange Commission an automatic shelf registration statement (Registration No. 333-262879) for the potential offering and sale of debt and equity securities. The registration statement allows for the following types of securities to be offered: debt securities, junior subordinated debt securities, guarantees, preferred stock, common stock, depositary shares, warrants, stock purchase contracts, and stock purchase units. In that The Hartford is a well-known seasoned issuer, as defined in Rule 405 under the Securities Act of 1933, the registration statement went effective immediately upon filing and The Hartford may offer and sell an unlimited amount of securities under the registration statement during the three-year life of the registration statement.
THE HARTFORD FINANCIAL SERVICES GROUP, INC.
NOTES TO CONDENSED CONSOLIDATED FINANCIAL STATEMENTS
12. INCOME TAXES
INCOME TAX EXPENSE
| | | | | | | | | | | | | | | | | |
Income Tax Rate Reconciliation |
| Three Months Ended June 30, | | Six Months Ended June 30, |
| 2022 | 2021 | | 2022 | 2021 |
| Tax provision at U.S. federal statutory rate | $ | 116 | | $ | 233 | | | $ | 230 | | $ | 297 | |
| Tax-exempt interest | (8) | | (10) | | | (17) | | (21) | |
| | | | | |
| | | | | |
| | | | | |
| | | | | |
| | | | | |
| | | | | |
| | | | | |
| | | | | |
| | | | | |
| Other | 2 | | (18) | | | (5) | | (17) | |
| Provision for income taxes | $ | 110 | | $ | 205 | | | $ | 208 | | $ | 259 | |
UNCERTAIN TAX POSITIONS | | | | | | | | | | | | | | | | | | | |
Rollforward of Unrecognized Tax Benefits | | |
| | Three Months Ended June 30, | | Six Months Ended June 30, | | |
| | 2022 | 2021 | | 2022 | 2021 | | |
| Balance, beginning of period | $ | 17 | | $ | 15 | | | $ | 16 | | $ | 15 | | | |
| | | | | | | |
| | | | | | | |
| Gross increases - tax positions in current period | 1 | | — | | | 2 | | — | | | |
| Balance, end of period | $ | 18 | | $ | 15 | | | $ | 18 | | $ | 15 | | | |
The entire amount of unrecognized tax benefits, if recognized, would affect the effective tax rate in the period of the release.
OTHER TAX MATTERS
As of June 30, 2022, the Company has a deferred tax asset for foreign net operating losses of $36 partially offset by a valuation allowance of $15. While the foreign net operating losses ("NOLs") do not expire, this assessment reflects uncertainty in the Company's ability to generate sufficient taxable income in the near term in those specific jurisdictions.
Management has assessed the need for a valuation allowance against its deferred tax assets based on tax character and jurisdiction. In making the assessment, management considered future taxable temporary difference reversals, future taxable income exclusive of reversing temporary differences and carryovers, taxable income in open carry back years and other tax planning strategies which management views as prudent and feasible.
The federal income tax audits for the Company have been completed through 2013, and the Company is not currently under federal income tax examination for any open years. The statute of limitations is closed through the 2018 tax year with the exception of NOL carryforwards utilized in open tax years. Management believes that adequate provision has been made in the Company's Condensed Consolidated Financial Statements for any potential adjustments that may result from tax examinations and other tax-related matters for all open tax years.
13. COMMITMENTS AND CONTINGENCIES
Management evaluates each contingent matter separately. A loss is recorded if probable and reasonably estimable. Management establishes liabilities for these contingencies at its “best estimate,” or, if no one number within the range of possible losses is more probable than any other, the Company records an estimated liability at the low end of the range of losses.
LITIGATION
The Hartford is involved in claims litigation arising in the ordinary course of business, both as a liability insurer defending or providing indemnity for third-party claims brought against insureds and as an insurer defending coverage claims brought against it. The Hartford accounts for such activity through the establishment of unpaid loss and loss adjustment expense reserves. Subject to the uncertainties related to sexual molestation and sexual abuse claims discussed in Note 9 - Reserve for Unpaid Losses and Loss Adjustment Expenses of this Form 10-Q and in Note 12 - Reserve for Unpaid Losses and Loss Adjustment Expenses, of the Company's Annual Report on Form 10-K for the year ended December 31, 2021, and in the following discussion under the caption “COVID-19 Pandemic Business Income Insurance Litigation” and under the caption “Run-off Asbestos and Environmental Claims,” management expects that the ultimate liability, if any, with respect to such ordinary-course claims litigation, after consideration of provisions made for potential losses and costs of defense, will not be material to the consolidated financial condition, results of operations or cash flows of The Hartford.
The Hartford is also involved in other kinds of legal actions, some of which assert claims for substantial amounts. In addition to the matter described below, these actions include putative class actions seeking certification of a state or national class. Such putative class actions have alleged, for example, underpayment of claims or improper sales or underwriting practices in connection with various kinds of insurance policies, such as personal and commercial automobile, property, disability, life and inland marine. The Hartford also is involved in individual actions in which punitive damages are sought, such as claims alleging bad faith in the handling of insurance claims or other allegedly unfair or improper business practices. Like many other insurers, The Hartford also has been joined in actions by asbestos plaintiffs asserting, among other things, that insurers had a duty to protect the public from the dangers of asbestos and that insurers committed unfair trade practices by asserting defenses on behalf of their policyholders in the underlying asbestos cases. Management expects that the ultimate liability, if any, with respect to such lawsuits, after consideration of provisions made for estimated losses, will not be material to the consolidated financial condition of The Hartford. Nonetheless, given the large or indeterminate amounts sought in certain of these actions, and the inherent unpredictability of litigation, the outcome in certain matters could, from time to time, have a material adverse effect on the Company’s results of operations or cash flows in particular quarterly or annual periods.
| | | | | | | | | |
| | Note 13 - Commitments and Contingencies |
THE HARTFORD FINANCIAL SERVICES GROUP, INC.
NOTES TO CONDENSED CONSOLIDATED FINANCIAL STATEMENTS
COVID-19 Pandemic Business Income Insurance Litigation
Like many others in the property and casualty insurance industry, beginning in April 2020, various direct and indirect subsidiaries of the Company (collectively the "Hartford Writing Companies”), and in some instances the Company itself, have been served as defendants in lawsuits seeking insurance coverage under commercial insurance policies issued by the Hartford Writing Companies for alleged losses resulting from the shutdown or suspension of their businesses due to the spread of COVID-19. More than 300 such lawsuits have been filed, of which more than 60 purport to be filed on behalf of broad nationwide or statewide classes of policyholders. These lawsuits have been filed in state and federal courts in roughly 35 states. Although the allegations vary, the plaintiffs generally seek a declaration of insurance coverage, damages for breach of contract in unspecified amounts, interest, and attorneys' fees. Many of the lawsuits also allege that the insurance claims were denied in bad faith or otherwise in violation of state laws and seek extra-contractual or punitive damages. Some of the lawsuits also allege that the Hartford Writing Companies engaged in unfair business practices by collecting or retaining excess premium.
The Company and its subsidiaries deny the allegations and continue to vigorously defend these suits. The Hartford Writing Companies maintain that they have no coverage obligations with respect to these suits for business income allegedly lost by the plaintiffs due to the COVID-19 pandemic based on the clear terms of the applicable insurance policies. Although the policy terms vary depending, among other things, upon the size, nature, and location of the policyholder’s business, in general, the claims at issue in these lawsuits were denied because the claimant identified no direct physical damage or loss to property at the insured premises, and the governmental orders that led to the complete or partial shutdown of the business were not due to the existence of any direct physical loss or damage in the immediate vicinity of the insured premises and did not prohibit access to the insured premises, as required by the terms of the insurance policies. In addition, the vast majority of the policies at issue expressly exclude from coverage any loss caused directly or indirectly by the presence, growth, proliferation, spread or activity of a virus, subject to a narrow set of exceptions not applicable in connection with this pandemic, and contain a pollution and contamination exclusion that, among other things, expressly excludes from coverage any loss caused by material that threatens human health or welfare.
In addition to the inherent difficulty in predicting litigation outcomes, the COVID-19 pandemic business income coverage lawsuits present numerous uncertainties and contingencies that are not yet fully known, including how many policyholders will ultimately file claims, the number of lawsuits that will be filed, the extent to which any state or nationwide classes will be certified, and the size and scope of any such classes. The legal theories advocated by plaintiffs vary significantly by case as do the state laws that govern the policy interpretation. These lawsuits are at various stages of litigation; some are in the earliest stages of litigation, many complaints are in the process of being amended, some have been dismissed voluntarily and may be refiled, while others have been dismissed through rulings in favor of the Hartford Writing Companies. Discovery is underway in certain single plaintiff cases and class actions. More than 50 policyholders have appealed dismissals in favor of the Hartford
Writing Companies. To date, The Hartford Writing Companies have received eight appellate affirmances of trial court decisions in the Hartford Writing Companies' favor, including two decisions from the Second Circuit, and decisions from the Fifth, Sixth, Seventh, Eighth, and Eleventh Circuit Courts of Appeal, as well as one state appellate court. The remainder of the Hartford Writing Companies' appeals are at various stages of the process. In addition, business income calculations depend upon a wide range of factors that are particular to the circumstances of each individual policyholder and, here, almost none of the plaintiffs have submitted proofs of loss or otherwise quantified or factually supported any allegedly covered loss, and, in any event, the Company’s experience shows that demands for damages often bear little relation to a reasonable estimate of potential loss. Accordingly, management cannot now reasonably estimate the possible loss or range of loss, if any. Nonetheless, given the large number of claims and potential claims, the indeterminate amounts sought, and the inherent unpredictability of litigation, it is possible that adverse outcomes, if any, in the aggregate, could have a material adverse effect on the Company’s consolidated operating results or liquidity.
Run-off Asbestos and Environmental Claims
The Company continues to receive A&E claims. Asbestos claims relate primarily to bodily injuries asserted by people who came in contact with asbestos or products containing asbestos. Environmental claims relate primarily to pollution and related clean-up costs.
The vast majority of the Company's exposure to A&E relates to Run-off A&E, reported within the P&C Other Operations segment. In addition, since 1986, the Company has written asbestos and environmental exposures under general liability policies and pollution liability under homeowners policies, which are reported in the Commercial Lines and Personal Lines segments.
Prior to 1986, the Company wrote several different categories of insurance contracts that may cover A&E claims. First, the Company wrote primary policies providing the first layer of coverage in an insured’s liability program. Second, the Company wrote excess and umbrella policies providing higher layers of coverage for losses that exhaust the limits of underlying coverage. Third, the Company acted as a reinsurer assuming a portion of those risks assumed by other insurers writing primary, excess, umbrella and reinsurance coverages.
Significant uncertainty limits the ability of insurers and reinsurers to estimate the ultimate reserves necessary for unpaid gross losses and expenses related to environmental and asbestos claims. The degree of variability of gross reserve estimates for these exposures is significantly greater than for other more traditional exposures.
In the case of the reserves for asbestos exposures, factors contributing to the high degree of uncertainty include inadequate loss development patterns, plaintiffs’ expanding theories of liability, the risks inherent in major litigation, and inconsistent and emerging legal doctrines with respect to the underlying claims and with respect to the Company's coverage obligations. Furthermore, over time, insurers, including the Company, have experienced significant changes in the rate at which asbestos claims are brought, the claims experience of particular insureds, and the value of claims, making predictions of future exposure
| | | | | | | | | |
| | Note 13 - Commitments and Contingencies |
THE HARTFORD FINANCIAL SERVICES GROUP, INC.
NOTES TO CONDENSED CONSOLIDATED FINANCIAL STATEMENTS
from past experience uncertain. Plaintiffs and insureds also have sought to use bankruptcy proceedings, including “pre-packaged” bankruptcies, to accelerate and increase loss payments by insurers. In addition, some policyholders have asserted new classes of claims for coverages to which an aggregate limit of liability may not apply. Further uncertainties include insolvencies of other carriers, insolvencies of insureds and unanticipated developments pertaining to the Company’s ability to recover reinsurance for A&E claims. Management believes these issues are not likely to be resolved in the near future.
In the case of the reserves for environmental exposures, factors contributing to the high degree of uncertainty include expanding theories of liability and damages against insureds, emerging risks such as PFAS, the risks inherent in major litigation, inconsistent and emerging legal doctrines concerning the existence and scope of coverage for environmental claims, and the scope and level of complexity of the remediation required by regulators.
The reporting pattern for assumed reinsurance claims, including those related to A&E claims, is much longer than for direct claims. In many instances, it takes months or years to determine that the policyholder’s own obligations have been met and how the reinsurance in question may apply to such claims. The delay in reporting reinsurance claims and exposures adds to the uncertainty of estimating the related reserves.
It is also not possible to predict changes in the legal and legislative environment and their effect on the future development of A&E claims.
Given the factors described above, the Company believes the actuarial tools and other techniques it employs to estimate the ultimate cost of claims for more traditional kinds of insurance exposure are less precise in estimating reserves for A&E exposures. For this reason, the Company principally relies on exposure-based analysis to estimate the ultimate costs of these claims, both gross and net of reinsurance, and regularly evaluates new account information in assessing its potential A&E exposures. The Company supplements this exposure-based analysis with evaluations of the Company’s historical direct net loss and expense paid and reported experience, and net loss and expense paid and reported experience by calendar and/or report year, to assess any emerging trends, fluctuations or characteristics suggested by the aggregate paid and reported activity.
While the Company believes that its current A&E reserves are appropriate, significant uncertainties limit the ability of insurers and reinsurers to estimate the ultimate reserves necessary for unpaid losses and related expenses. The ultimate liabilities, thus, could exceed the currently recorded reserves, and any such additional liability, while not estimable now, could be material to The Hartford’s consolidated operating results and liquidity.
For its Run-off A&E, as of June 30, 2022, the Company reported $485 of net asbestos and environmental reserves. In addition, the Company has recorded a $365 deferred gain within other liabilities for losses economically ceded to NICO but for which the benefit is not recognized in earnings until later periods. While the Company believes that its current run-off A&E reserves are appropriate, significant uncertainties limit our ability to estimate the ultimate reserves necessary for unpaid losses
and related expenses. The ultimate liabilities, thus, could exceed the currently recorded reserves, and any such additional liability, while not reasonably estimable now, could be material to The Hartford's consolidated operating results and liquidity.
The Company’s A&E ADC reinsurance agreement with NICO reinsures substantially all A&E reserve development for 2016 and prior accident years, including Run-off A&E and A&E reserves included in Commercial Lines and Personal Lines. The A&E ADC has a coverage limit of $1.5 billion above the Company’s existing net A&E reserves as of December 31, 2016 of approximately $1.7 billion. As of June 30, 2022, the Company has incurred $1,015 in cumulative adverse development on A&E reserves that have been ceded under the A&E ADC treaty with NICO, leaving $485 of coverage available for future adverse net reserve development, if any. Cumulative adverse development of A&E claims for accident years 2016 and prior could ultimately exceed the $1.5 billion treaty limit in which case any adverse development in excess of the treaty limit would be absorbed as a charge to earnings by the Company. In these scenarios, the effect of these charges could be material to the Company’s consolidated operating results or liquidity. For more information on the A&E ADC, refer to Note 12, Reserve for Unpaid Losses and Loss Adjustment Expenses of Notes to Consolidated Financial Statements included in the Company's 2021 Form 10-K Annual Report.
DERIVATIVE COMMITMENTS
Certain of the Company’s derivative agreements contain provisions that are tied to the financial strength ratings, as set by nationally recognized statistical agencies, of the individual legal entity that entered into the derivative agreement. If the legal entity’s financial strength were to fall below certain ratings, the counterparties to the derivative agreements could, in certain instances, terminate the agreements and demand immediate settlement of all outstanding derivative positions traded under each impacted bilateral agreement.
The settlement amount is determined by netting the derivative positions transacted under each agreement. If the termination rights were to be exercised by the counterparties, it could impact the legal entity’s ability to conduct hedging activities by increasing the associated costs and decreasing the willingness of counterparties to transact with the legal entity. The aggregate fair value of all derivative instruments with credit-risk-related contingent features that are in a net liability position as of June 30, 2022 was $22 for which the legal entities have posted collateral of $16 in the normal course of business. Based on derivative contractual terms as of June 30, 2022, a downgrade of the current financial strength ratings by either Moody's or S&P would not require additional assets to be posted as collateral. This requirement could change as a result of changes in our hedging activities or to the extent changes in contractual terms are negotiated. The nature of the additional collateral that we would post, if required, would be primarily in the form of U.S. Treasury bills, U.S. Treasury notes and government agency securities.
THE HARTFORD FINANCIAL SERVICES GROUP, INC.
NOTES TO CONDENSED CONSOLIDATED FINANCIAL STATEMENTS
14. EQUITY
EQUITY REPURCHASE PROGRAM
During the six months ended June 30, 2022 and 2021, the Company repurchased $850.0 (12.0 million shares) and $691 (11.0 million shares), respectively, of common stock under the $3.0 billion share repurchase authorization that is effective January 1, 2021 until December 31, 2022 as authorized by the Board of Directors. As of June 30, 2022, The Hartford has $448 remaining for equity repurchases under this share repurchase program. During the period July 1, 2022 through July 27, 2022, the Company repurchased $107 (1.7 million shares) under the repurchase program.
In addition to the authorization covering the period from January 1, 2021 to December 31, 2022, in July, 2022, the Board of Directors approved a share repurchase authorization for up to $3.0 billion effective from August 1, 2022 to December 31, 2024.
The timing of any repurchases is dependent on several factors, including the market price of the Company's securities, the Company's capital position, consideration of the effect of any repurchases on the Company's financial strength or credit ratings, the Company's blackout periods, and other considerations.
15. CHANGES IN AND RECLASSIFICATIONS FROM ACCUMULATED OTHER COMPREHENSIVE INCOME (LOSS)
| | | | | | | | | | | | | | | | | | | | |
| Changes in AOCI, Net of Tax for the Three Months Ended June 30, 2022 |
| Changes in |
| Net Unrealized Gain (Loss) on Fixed Maturities | Unrealized Loss on Fixed Maturities with ACL | Net Gain on Cash Flow Hedging Instruments | Foreign Currency Translation Adjustments | Pension and Other Postretirement Plan Adjustments | AOCI,
net of tax |
| Beginning balance | $ | (266) | | $ | (2) | | $ | 5 | | $ | 41 | | $ | (1,477) | | (1,699) | |
| | | | | | |
| | | | | | |
| OCI before reclassifications | (2,080) | | — | | 38 | | (10) | | (1) | | (2,053) | |
| Amounts reclassified from AOCI | 65 | | — | | (6) | | — | | 16 | | 75 | |
| OCI, before tax | (2,015) | | — | | 32 | | (10) | | 15 | | (1,978) | |
| Income tax benefit (expense) | 423 | | — | | (7) | | 2 | | (3) | | 415 | |
| OCI, net of tax | (1,592) | | — | | 25 | | (8) | | 12 | | (1,563) | |
| Ending balance | $ | (1,858) | | $ | (2) | | $ | 30 | | $ | 33 | | $ | (1,465) | | $ | (3,262) | |
| | | | | | | | | | | | | | | | | | | | |
| | | | | | |
| Changes in AOCI, Net of Tax for the Six Months Ended June 30, 2022 |
| Changes in |
| Net Unrealized Gain (Loss) on Fixed Maturities | Unrealized Loss on Fixed Maturities with ACL | Net Gain on Cash Flow Hedging Instruments | Foreign Currency Translation Adjustments | Pension and Other Postretirement Plan Adjustments | AOCI,
net of tax |
| Beginning balance | $ | 1,616 | | $ | (2) | | $ | 6 | | $ | 41 | | $ | (1,489) | | 172 | |
| OCI before reclassifications | (4,549) | | — | | 45 | | (10) | | (1) | | (4,515) | |
| Amounts reclassified from AOCI | 152 | | — | | (14) | | — | | 31 | | 169 | |
| OCI, before tax | (4,397) | | — | | 31 | | (10) | | 30 | | (4,346) | |
| Income tax benefit (expense) | 923 | | — | | (7) | | 2 | | (6) | | 912 | |
| OCI, net of tax | (3,474) | | — | | 24 | | (8) | | 24 | | (3,434) | |
| Ending balance | $ | (1,858) | | $ | (2) | | $ | 30 | | $ | 33 | | $ | (1,465) | | $ | (3,262) | |
| | | | | | | | | |
| | Note 15 - Accumulated Other Comprehensive Income (Loss) |
THE HARTFORD FINANCIAL SERVICES GROUP, INC.
NOTES TO CONDENSED CONSOLIDATED FINANCIAL STATEMENTS
| | | | | | | | | | | |
| Reclassifications from AOCI |
| Three Months Ended June 30, 2022 | Six Months Ended June 30, 2022 | Affected Line Item in the Condensed Consolidated Statement of Operations |
| Net Unrealized Gain on Fixed Maturities | | | |
| Available-for-sale fixed maturities | $ | (65) | | $ | (152) | | Net realized gains (losses) |
| (65) | | (152) | | Total before tax |
| (14) | | (32) | | Income tax expense |
| $ | (51) | | $ | (120) | | Net income |
| | | |
| | | |
| | | |
| | | |
| | | |
| | | |
| Net Gains on Cash Flow Hedging Instruments | | | |
| | | |
| Interest rate swaps | $ | 5 | | $ | 14 | | Net investment income |
| Interest rate swaps | (1) | | (4) | | Interest expense |
| Foreign currency swaps | 2 | | 4 | | Net investment income |
| | | |
| 6 | | 14 | | Total before tax |
| 1 | | 3 | | Income tax expense |
| $ | 5 | | $ | 11 | | Net income |
| Pension and Other Postretirement Plan Adjustments | | | |
| Amortization of prior service credit | $ | 1 | | $ | 3 | | Insurance operating costs and other expenses |
| Amortization of actuarial loss | (17) | | (34) | | Insurance operating costs and other expenses |
| (16) | | (31) | | Total before tax |
| (3) | | (7) | | Income tax expense |
| $ | (13) | | $ | (24) | | Net income |
| Total amounts reclassified from AOCI | $ | (59) | | $ | (133) | | Net income |
| | | | | | | | | | | | | | | | | | | | | | | |
| Changes in AOCI, Net of Tax for the Three Months Ended June 30, 2021 | | | |
| Changes in | | | |
| Net Unrealized Gain on Fixed Maturities | Net Unrealized Loss on Fixed Maturities with ACL | Net Gain on Cash Flow Hedging Instruments | Foreign Currency Translation Adjustments | Pension and Other Postretirement Plan Adjustments | AOCI,
net of tax | | | |
| Beginning balance | $ | 1,909 | | $ | (2) | | $ | 17 | | $ | 44 | | $ | (1,704) | | $ | 264 | | | | |
| OCI before reclassifications | 426 | | — | | 2 | | 2 | | (1) | | 429 | | | | |
| Amounts reclassified from AOCI | (53) | | — | | (8) | | — | | 19 | | (42) | | | | |
| OCI, before tax | 373 | | — | | (6) | | 2 | | 18 | | 387 | | | | |
| Income tax benefit (expense) | (78) | | — | | 1 | | — | | (4) | | (81) | | | | |
| OCI, net of tax | 295 | | — | | (5) | | 2 | | 14 | | 306 | | | | |
| Ending balance | $ | 2,204 | | $ | (2) | | $ | 12 | | $ | 46 | | $ | (1,690) | | $ | 570 | | | | |
| | | | | | | | | |
| | | | | | | | | |
| | | | | | | | | |
| | | | | | | | | | | | | | | | | | | | |
| Changes in AOCI, Net of Tax for the Six Months Ended June 30, 2021 |
| Changes in |
| Net Unrealized Gain on Fixed Maturities | Net Unrealized Loss on Fixed Maturities with ACL | Net Gain on Cash Flow Hedging Instruments | Foreign Currency Translation Adjustments | Pension and Other Postretirement Plan Adjustments | AOCI, net of tax |
| Beginning balance | $ | 2,834 | | $ | (2) | | $ | 12 | | $ | 43 | | $ | (1,717) | | $ | 1,170 | |
| OCI before reclassifications | (740) | | — | | 17 | | 4 | | (2) | | (721) | |
| Amounts reclassified from AOCI | (57) | | — | | (17) | | — | | 36 | | (38) | |
| OCI, before tax | (797) | | — | | — | | 4 | | 34 | | (759) | |
| Income tax benefit (expense) | 167 | | — | | — | | (1) | | (7) | | 159 | |
| OCI, net of tax | (630) | | — | | — | | 3 | | 27 | | (600) | |
| Ending balance | $ | 2,204 | | $ | (2) | | $ | 12 | | $ | 46 | | $ | (1,690) | | $ | 570 | |
| | | | | | | | | |
| | Note 15 - Accumulated Other Comprehensive Income (Loss) |
THE HARTFORD FINANCIAL SERVICES GROUP, INC.
NOTES TO CONDENSED CONSOLIDATED FINANCIAL STATEMENTS
| | | | | | | | | | | |
| Reclassifications from AOCI |
| Three Months Ended June 30, 2021 | Six Months Ended June 30, 2021 | Affected Line Item in the Condensed Consolidated Statement of Operations |
| Net Unrealized Gain on Fixed Maturities | | | |
| Available-for-sale fixed maturities | $ | 53 | | $ | 57 | | Net realized gains (losses) |
| 53 | | 57 | | Total before tax |
| 11 | | 12 | | Income tax expense |
| | | |
| $ | 42 | | $ | 45 | | Net income |
| Net Gains on Cash Flow Hedging Instruments | | | |
| Interest rate swaps | $ | 10 | | $ | 20 | | Net investment income |
| Interest rate swaps | (3) | | (5) | | Interest expense |
| Foreign currency swaps | 1 | | 2 | | Net investment income |
| | | |
| | | |
| | | |
| 8 | | 17 | | Total before tax |
| 2 | | 4 | | Income tax expense |
| | | |
| $ | 6 | | $ | 13 | | Net income |
| Pension and Other Postretirement Plan Adjustments | | | |
| Amortization of prior service credit | $ | 1 | | $ | 3 | | Insurance operating costs and other expenses |
| Amortization of actuarial loss | (20) | | (39) | | Insurance operating costs and other expenses |
| (19) | | (36) | | Total before tax |
| (4) | | (8) | | Income tax expense |
| $ | (15) | | $ | (28) | | Net income |
| Total amounts reclassified from AOCI | $ | 33 | | $ | 30 | | Net income |
16. EMPLOYEE BENEFIT PLANS
The Company’s employee benefit plans are described in Note 19 - Employee Benefit Plans of Notes to Consolidated Financial Statements included in The Hartford’s 2021 Annual Report on Form 10-K. Net periodic cost (benefit) is recognized in insurance operating costs and other expenses in the condensed consolidated statement of operations.
The Company has not determined whether, and to what extent,
contributions may be made to the U.S. qualified defined benefit pension plan in 2022. The Company will monitor the funded status of the U.S. qualified defined benefit pension plan during 2022 to make this determination.
| | | | | | | | | | | | | | | | | | | | | | | | | | | | | |
| Net Periodic Cost (Benefit) |
| Pension Benefits | | Other Postretirement Benefits |
| Three Months Ended June 30, | Six Months Ended June 30, | | Three Months Ended June 30, | Six Months Ended June 30, |
| 2022 | 2021 | 2022 | 2021 | | 2022 | 2021 | 2022 | 2021 |
| Service cost | $ | 1 | | $ | 1 | | $ | 2 | | $ | 2 | | | $ | — | | $ | — | | $ | — | | $ | — | |
| Interest cost | 28 | | 23 | | 56 | | 47 | | | 1 | | 1 | | 2 | | 2 | |
| Expected return on plan assets | (50) | | (51) | | (101) | | (102) | | | (1) | | (1) | | (1) | | (2) | |
| Amortization of prior service credit | — | | — | | — | | — | | | (1) | | (1) | | (3) | | (3) | |
| Amortization of actuarial loss | 16 | | 18 | | 31 | | 35 | | | 1 | | 2 | | 3 | | 4 | |
| Net periodic cost (benefit) | $ | (5) | | $ | (9) | | $ | (12) | | $ | (18) | | | $ | — | | $ | 1 | | $ | 1 | | $ | 1 | |
| | | | | | | | | |
| | Note 17 - Restructuring and Other Costs |
THE HARTFORD FINANCIAL SERVICES GROUP, INC.
NOTES TO CONDENSED CONSOLIDATED FINANCIAL STATEMENTS
17. RESTRUCTURING AND OTHER COSTS
In recognition of the need to become more cost efficient and competitive along with enhancing the experience we provide to agents and customers, on July 30, 2020 the Company announced an operational transformation and cost reduction plan it refers to as Hartford Next. Hartford Next is intended to reduce annual insurance operating costs and other expenses through reduction of the Company's headcount, investment in information technology ("IT") to further enhance our capabilities, and other activities. The activities are expected to be substantially complete by the end of 2023.
Termination benefits related to workforce reductions and professional fees are included within restructuring and other costs in the Condensed Consolidated Statement of Operations
and unpaid restructuring costs are included in other liabilities in the June 30, 2022 and December 31, 2021 Condensed Consolidated Balance Sheets.
Subsequent to June 30, 2022, the Company expects to incur additional costs including amortization of right of use assets and other lease exit costs, other IT costs to retire applications and other expenses. Total restructuring and other costs are expected to be approximately $127, before tax, and will be recognized in Corporate for segment reporting. The estimated restructuring and other costs for future periods do not include all costs associated with the real estate consolidation plan as those plans are still being finalized.
| | | | | | | | | | | | | | | | | | | | | | | | | | | | | | |
| Restructuring and Other Costs, Before Tax | | |
| Incurred in the Three Months Ended June 30, | | Incurred in the Six Months Ended June 30, | | Cumulative Incurred Through June 30, 2022 | | | Total Amount Expected to be Incurred | | |
| 2022 | 2021 | | 2022 | 2021 | | | | | |
| Severance benefits | $ | (5) | | $ | (9) | | | $ | (7) | | $ | (9) | | | $ | 41 | | | | $ | 41 | | | |
| IT costs | 3 | | 2 | | | 5 | | 4 | | | 16 | | | | 26 | | | |
| Professional fees and other expenses | 4 | | 7 | | | 9 | | 16 | | | 55 | | | | 60 | | | |
| Total restructuring and other costs, before tax | $ | 2 | | $ | — | | | $ | 7 | | $ | 11 | | | $ | 112 | | | | $ | 127 | | | |
| | | | | | | | | | | | | | | | |
| Accrued Restructuring and Other Costs | |
| Six Months Ended June 30, 2022 | |
| Severance Benefits and Related Costs | IT Costs | Professional Fees and Other | | Total Restructuring and Other Costs Liability | |
| Balance, beginning of period | $ | 18 | | $ | — | | $ | — | | | $ | 18 | | |
| Incurred | (7) | | 5 | | 9 | | | 7 | | |
| Payments | (2) | | (5) | | (9) | | | (16) | | |
| Balance, end of period | $ | 9 | | $ | — | | $ | — | | | $ | 9 | | |
| | | | | | | | | | | | | | | | |
| Accrued Restructuring and Other Costs | |
| Six Months Ended June 30, 2021 | |
| Severance Benefits and Related Costs | IT Costs | Professional Fees and Other | | Total Restructuring and Other Costs Liability | |
| Balance, beginning of period | $ | 54 | | $ | — | | $ | — | | | $ | 54 | | |
| Incurred | (9) | | 4 | | 16 | | | 11 | | |
| Payments | (8) | | (4) | | (15) | | | (27) | | |
| Balance, end of period | $ | 37 | | $ | — | | $ | 1 | | | $ | 38 | | |
Part I - Item 2. Management's Discussion and Analysis of Financial Condition and Results of Operations
MANAGEMENT’S DISCUSSION AND ANALYSIS OF FINANCIAL CONDITION AND RESULTS OF OPERATIONS
(Dollar amounts in millions except for per share data, unless otherwise stated)
The Hartford provides projections and other forward-looking information in the following discussions, which contain many forward-looking statements, particularly relating to the Company’s future financial performance. These forward-looking statements are estimates based on information currently available to the Company, are made pursuant to the safe harbor provisions of the Private Securities Litigation Reform Act of 1995 and are subject to the cautionary statements set forth on pages 4 and 5 of this Form 10-Q. Actual results are likely to differ, and in the past have differed, materially from those forecast by the Company, depending on the outcome of various factors, including, but not limited to, those set forth in the following discussion; Part I, Item 1A, Risk Factors in The Hartford’s 2021 Form 10-K Annual Report; and our other filings with the Securities and Exchange Commission. The Hartford undertakes no obligation to publicly update any forward-looking statements, whether as a result of new information, future developments or otherwise.
On December 29, 2021, the Company completed the sale of Navigators Holdings (Europe) N.V., a Belgium holding company, and its subsidiaries, Bracht, Deckers & Mackelbert N.V. and Assurances Contintales Contintale Verzekeringen N.V., collectively referred to as "Continental Europe Operations."
Certain reclassifications have been made to historical financial information presented in Management's Discussion and Analysis of Financial Condition and Results of Operations ("MD&A") to conform to the current period presentation.
The Hartford defines increases or decreases greater than or equal to 200% as “NM” or not meaningful.
INDEX
Throughout the MD&A, we use certain terms and abbreviations, the more commonly used are summarized in the Acronyms section. KEY PERFORMANCE MEASURES AND RATIOS
The Company considers the measures and ratios in the following discussion to be key performance indicators for its businesses. Management believes that these ratios and measures are useful in understanding the underlying trends in The Hartford’s businesses. However, these key performance indicators should only be used in conjunction with, and not in lieu of, the results presented in the segment discussions that follow in this MD&A. These ratios and measures may not be comparable to other performance measures used by the Company’s competitors.
Part I - Item 2. Management's Discussion and Analysis of Financial Condition and Results of Operations
Definitions of Non-GAAP and Other Measures and Ratios
Assets Under Management ("AUM")- Include mutual fund and exchange-traded funds ("ETF") assets. AUM is a measure used by the Company's Hartford Funds segment because a significant portion of the segments’s revenues and expenses are based upon asset values. These revenues and expenses increase or decrease with a rise or fall in AUM whether caused by changes in the market or through net flows.
Book Value per Diluted Share excluding accumulated other comprehensive income ("AOCI")- This is a non-GAAP per share measure that is calculated by dividing (a) common stockholders' equity, excluding AOCI, after tax, by (b) common shares outstanding and dilutive potential common shares. The Company provides this measure to enable investors to analyze the amount of the Company's net worth that is primarily attributable to the Company's business operations. The Company believes that excluding AOCI from the numerator is useful to investors because it eliminates the effect of items that can fluctuate significantly from period to period, primarily based on changes in interest rates. Book value per diluted share is the most directly comparable U.S. GAAP measure.
Combined Ratio- The sum of the loss and loss adjustment expense ratio, the expense ratio and the policyholder dividend ratio. This ratio is a relative measurement that describes the related cost of losses and expenses for every $100 of earned premiums. A combined ratio below 100 demonstrates underwriting profit; a combined ratio above 100 demonstrates underwriting losses.
Core Earnings- The Hartford uses the non-GAAP measure core earnings as an important measure of the Company’s operating performance. The Hartford believes that core earnings provides investors with a valuable measure of the performance of the Company’s ongoing businesses because it reveals trends in our insurance and financial services businesses that may be obscured by including the net effect of certain items. Therefore, the following items are excluded from core earnings:
•Certain realized gains and losses - Some realized gains and losses are primarily driven by investment decisions and external economic developments, the nature and timing of which are unrelated to the insurance and underwriting aspects of our business. Accordingly, core earnings excludes the effect of all realized gains and losses that tend to be highly variable from period to period based on capital market conditions. The Hartford believes, however, that some realized gains and losses are integrally related to our insurance operations, so core earnings includes net realized gains and losses such as net periodic settlements on credit derivatives. These net realized gains and losses are directly related to an offsetting item included in the income statement such as net investment income.
•Restructuring and other costs - Costs incurred as part of a restructuring plan are not a recurring operating expense of the business.
•Loss on extinguishment of debt - Largely consisting of make-whole payments or tender premiums upon paying debt off before maturity, these losses are not a recurring operating expense of the business.
•Gains and losses on reinsurance transactions - Gains or losses on reinsurance, such as those entered into upon sale of a business or to reinsure loss reserves, are not a recurring operating expense of the business.
•Integration and other non-recurring M&A costs - These costs, including transaction costs incurred in connection with an acquired business, are incurred over a short period of time and do not represent an ongoing operating expense of the business.
•Change in loss reserves upon acquisition of a business - These changes in loss reserves are excluded from core earnings because such changes could obscure the ability to compare results in periods after the acquisition to results of periods prior to the acquisition.
•Deferred gain resulting from retroactive reinsurance and subsequent changes in the deferred gain - Retroactive reinsurance agreements economically transfer risk to the reinsurers and including the full benefit from retroactive reinsurance in core earnings provides greater insight into the economics of the business.
•Change in valuation allowance on deferred taxes related to non-core components of before tax income - These changes in valuation allowances are excluded from core earnings because they relate to non-core components of before tax income, such as tax attributes like capital loss carryforwards.
•Results of discontinued operations - These results are excluded from core earnings for businesses sold or held for sale because such results could obscure the ability to compare period over period results for our ongoing businesses.
In addition to the above components of net income available to common stockholders that are excluded from core earnings, preferred stock dividends declared, which are excluded from net income available to common stockholders, are included in the determination of core earnings. Preferred stock dividends are a cost of financing more akin to interest expense on debt and are expected to be a recurring expense as long as the preferred stock is outstanding.
Net income (loss) and net income (loss) available to common stockholders are the most directly comparable U.S. GAAP measures to core earnings. Core earnings should not be considered as a substitute for net income (loss) or net income (loss) available to common stockholders and does not reflect the overall profitability of the Company’s business. Therefore, The Hartford believes that it is useful for investors to evaluate net income (loss), net income (loss) available to common stockholders, and core earnings when reviewing the Company’s performance.
Part I - Item 2. Management's Discussion and Analysis of Financial Condition and Results of Operations
| | | | | | | | | | | | | | | | | |
| Reconciliation of Net Income to Core Earnings |
| | Three Months Ended June 30, | | Six Months Ended June 30, |
| | 2022 | 2021 | | 2022 | 2021 |
| Net income | $ | 442 | | $ | 905 | | | $ | 887 | | $ | 1,154 | |
| Preferred stock dividends | 5 | | 5 | | | 10 | | 10 | |
| Net income available to common stockholders | 437 | | 900 | | | 877 | | 1,144 | |
| Adjustments to reconcile net income available to common stockholders to core earnings: | | | | | |
| Net realized losses (gains) excluded from core earnings, before tax | 336 | | (148) | | | 482 | | (225) | |
| Restructuring and other costs, before tax | 2 | | — | | | 7 | | 11 | |
| Loss on extinguishment of debt, before tax | 9 | | — | | | 9 | | — | |
| | | | | |
| Integration and other non-recurring M&A costs, before tax | 6 | | 36 | | | 11 | | 45 | |
| | | | | |
| Change in deferred gain on retroactive reinsurance, before tax | — | | 39 | | | — | | 45 | |
| Income tax expense (benefit) [1] | (76) | | 9 | | | (111) | | 19 | |
| Core earnings | $ | 714 | | $ | 836 | | | $ | 1,275 | | $ | 1,039 | |
[1]Primarily represents the federal income tax expense (benefit) related to before tax items not included in core earnings and includes the effect of changes in net deferred taxes due to changes in enacted tax rates.
Core Earnings Margin- The Hartford uses the non-GAAP measure core earnings margin to evaluate, and believes it is an important measure of, the Group Benefits segment's operating performance. Core earnings margin is calculated by dividing core earnings by revenues, excluding buyouts and realized gains (losses). Net income margin, calculated by dividing net income by revenues, is the most directly comparable U.S. GAAP measure. The Company believes that core earnings margin provides investors with a valuable measure of the performance of Group Benefits because it reveals trends in the business that may be obscured by the effect of buyouts and realized gains (losses) as well as other items excluded in the calculation of core earnings. Core earnings margin should not be considered as a substitute for net income margin and does not reflect the overall profitability of Group Benefits. Therefore, the Company believes it is important for investors to evaluate both core earnings margin and net income margin when reviewing performance. A reconciliation of net income margin to core earnings margin is set forth in the Results of Operations section within MD&A - Group Benefits.
Current Accident Year Catastrophe Ratio- A component of the loss and loss adjustment expense ratio, represents the ratio of catastrophe losses incurred in the current accident year (net of reinsurance) to earned premiums. For U.S. events, a catastrophe is an event that causes $25 or more in industry insured property losses and affects a significant number of property and casualty policyholders and insurers, as defined by the Property Claim Services office of Verisk. For international events, the Company's approach is similar, informed, in part, by how Lloyd's of London defines major losses. Lloyd's of London is an insurance market-place operating worldwide ("Lloyd's"). Lloyd's does not underwrite risks. The Company accepts risks as the sole member of Lloyd's Syndicate 1221 ("Lloyd's Syndicate"). The current accident year catastrophe ratio includes the effect of catastrophe losses, but does not include the effect of reinstatement premiums.
Expense Ratio- For the underwriting segments of Commercial Lines and Personal Lines is the ratio of underwriting expenses less fee income, to earned premiums. Underwriting expenses include the amortization of deferred policy acquisition costs ("DAC") and insurance operating costs
and expenses, including certain centralized services costs and bad debt expense. DAC include commissions, taxes, licenses and fees and other incremental direct underwriting expenses and are amortized over the policy term.
The expense ratio for Group Benefits is expressed as the ratio of insurance operating costs and other expenses including amortization of intangibles and amortization of DAC, to premiums and other considerations, excluding buyout premiums.
The expense ratio for Commercial Lines, Personal Lines and Group Benefits does not include integration and other transaction costs associated with an acquired business.
Fee Income- Is largely driven from amounts earned as a result of contractually defined percentages of assets under management in our Hartford Funds business. These fees are generally earned on a daily basis. Therefore, the growth in assets under management either through net inflows or favorable market performance will have a favorable impact on fee income. Conversely, either net outflows or unfavorable market performance will reduce fee income.
Gross New Business Premium- Represents the amount of premiums charged, before ceded reinsurance, for policies issued to customers who were not insured with the Company in the previous policy term. Gross new business premium plus gross renewal written premium less ceded reinsurance equals total written premium.
Loss and Loss Adjustment Expense Ratio- A measure of the cost of claims incurred in the calendar year divided by earned premium and includes losses and loss adjustment expenses incurred for both the current and prior accident years. Among other factors, the loss and loss adjustment expense ratio needed for the Company to achieve its targeted return on equity ("ROE") fluctuates from year to year based on changes in the expected investment yield over the claim settlement period, the timing of expected claim settlements and the targeted returns set by management based on the competitive environment.
Part I - Item 2. Management's Discussion and Analysis of Financial Condition and Results of Operations
The loss and loss adjustment expense ratio is affected by claim frequency and claim severity, particularly for shorter-tail property lines of business, where the emergence of claim frequency and severity is credible and likely indicative of ultimate losses. Claim frequency represents the percentage change in the average number of reported claims per unit of exposure in the current accident year compared to that of the previous accident year. Claim severity represents the percentage change in the estimated average cost per claim in the current accident year compared to that of the previous accident year. As one of the factors used to determine pricing, the Company’s practice is to first make an overall assumption about claim frequency and severity for a given line of business and then, as part of the rate-making process, adjust the assumption as appropriate for the particular state, product or coverage.
Loss and Loss Adjustment Expense Ratio before Catastrophes and Prior Accident Year Development- A measure of the cost of non-catastrophe loss and loss adjustment expenses incurred in the current accident year divided by earned premiums. Management believes that the current accident year loss and loss adjustment expense ratio before catastrophes is a performance measure that is useful to investors as it removes the impact of volatile and unpredictable catastrophe losses and prior accident year development.
Loss Ratio, excluding Buyouts- Utilized for the Group Benefits segment and is expressed as a ratio of benefits, losses and loss adjustment expenses, excluding those related to buyout premiums, to premiums and other considerations, excluding buyout premiums. Since Group Benefits occasionally buys a block of claims for a stated premium amount, the Company excludes this buyout from the loss ratio used for evaluating the profitability of the business as buyouts may distort the loss ratio. Buyout premiums represent takeover of open claim liabilities and other non-recurring premium amounts.
Mutual Fund and Exchange-Traded Fund Assets- Are owned by the shareowners of those products and not by the Company and, therefore, are not reflected in the Company’s Condensed Consolidated Financial Statements except in instances where the Company seeds new investment products.
Mutual fund and ETF assets are a measure used by the Company primarily because a significant portion of the Company’s Hartford Funds segment revenues and expenses are based upon asset values. These revenues and expenses increase or decrease with a rise or fall in AUM whether caused by changes in the market or through net flows.
Net New Business Premium- Represents the amount of premiums charged, after ceded reinsurance, for policies issued to customers who were not insured with the Company in the previous policy term. Net new business premium plus renewal written premium equals total written premium.
Policy Count Retention- Represents the ratio of the number of renewal policies issued during the current year period divided by the number of policies issued in the previous calendar period before considering policies cancelled subsequent to renewal. Policy count retention is affected by a number of factors, including the percentage of renewal policy quotes accepted and decisions by the Company to non-renew policies because of specific policy underwriting concerns or
because of a decision to reduce premium writings in certain classes of business or states. Policy count retention is also affected by advertising and rate actions taken by competitors.
Policies in Force- Represents the number of policies with coverage in effect as of the end of the period. The number of policies in force is a growth measure used for Personal Lines and standard commercial lines (small commercial and middle market lines within middle & large commercial) within Commercial Lines and is affected by both new business growth and policy count retention.
Policyholder Dividend Ratio- The ratio of policyholder dividends to earned premium.
Prior Accident Year Loss and Loss Adjustment Expense Ratio- Represents the increase (decrease) in the estimated cost of settling catastrophe and non-catastrophe claims incurred in prior accident years as recorded in the current calendar year divided by earned premiums.
Reinstatement Premiums- Represents additional ceded premium paid for the reinstatement of the amount of reinsurance coverage that was reduced as a result of the Company ceding losses to reinsurers.
Renewal Earned Price Increase (Decrease)- Written premiums are earned over the policy term, which is six months for certain Personal Lines automobile business and twelve months for substantially all of the remainder of the Company’s Property and Casualty ("P&C") business. Since the Company earns premiums over the six to twelve month term of the policies, renewal earned price increases (decreases) lag renewal written price increases (decreases) by six to twelve months.
Renewal Written Price Increase (Decrease)- For Commercial Lines, represents the combined effect of rate changes and individual risk pricing decisions per unit of exposure on policies that renewed and, for small commercial and middle market business, includes amount of insurance. For Personal Lines, renewal written price increases represent the total change in premium per policy since the prior year on those policies that renewed and includes the combined effect of rate changes, amount of insurance and other changes in exposure. For Personal Lines, other changes in exposure include, but are not limited to, the effect of changes in number of drivers, vehicles and incidents, as well as changes in customer policy elections, such as deductibles and limits. The rate component represents the change in rate filed with and approved by state regulators during the period and the amount of insurance represents the change in the value of the rating base, such as model year/vehicle symbol for automobiles, building replacement costs for property and wage inflation for workers’ compensation. A number of factors affect renewal written price increases (decreases) including expected loss costs as projected by the Company’s pricing actuaries, rate filings approved by state regulators, risk selection decisions made by the Company’s underwriters and marketplace competition. Renewal written price changes reflect the property and casualty insurance market cycle. Prices tend to increase for a particular line of business when insurance carriers have incurred significant losses in that line of business in the recent past or the industry as a whole commits less of its capital to writing exposures in that line of business. Prices tend to decrease when
Part I - Item 2. Management's Discussion and Analysis of Financial Condition and Results of Operations
recent loss experience has been favorable or when competition among insurance carriers increases. Renewal written price statistics are subject to change from period to period, based on a number of factors, including changes in actuarial estimates and the effect of subsequent cancellations and non-renewals, and modifications made to better reflect ultimate pricing achieved.
Return on Assets (“ROA”), Core Earnings-The Company uses this non-GAAP financial measure to evaluate, and believes is an important measure of, the Hartford Funds segment’s operating performance. ROA, core earnings is calculated by dividing annualized core earnings by a daily average AUM. ROA is the most directly comparable U.S. GAAP measure. The Company believes that ROA, core earnings, provides investors with a valuable measure of the performance of the Hartford Funds segment because it reveals trends in our business that may be obscured by the effect of items excluded in the calculation of core earnings. ROA, core earnings, should not be considered as a substitute for ROA and does not reflect the overall profitability of our Hartford Funds business. Therefore, the Company believes it is important for investors to evaluate both ROA, and ROA, core earnings when reviewing the Hartford Funds segment performance. A reconciliation of ROA to ROA, core earnings is set forth in the Results of Operations section within MD&A - Hartford Funds.
Underlying Combined Ratio- This non-GAAP financial measure of underwriting results represents the combined ratio before catastrophes, prior accident year development and current accident year change in loss reserves upon acquisition of a business. Combined ratio is the most directly comparable GAAP measure. The underlying combined ratio represents the combined ratio for the current accident year, excluding the impact of current accident year catastrophes and current accident year change in loss reserves upon acquisition of a business. The Company believes this ratio is an important measure of the trend in profitability since it removes the impact of volatile and unpredictable catastrophe losses and prior accident year loss and loss adjustment expense reserve development. The changes to loss reserves upon acquisition of a business are excluded from underlying combined ratio because such changes could obscure the ability to compare results in periods after the acquisition to results of periods prior to the acquisition as such trends are valuable to our investors' ability to assess the Company's financial performance.
A reconciliation of combined ratio to underlying combined ratio is set forth in the Results of Operations section within MD&A - Commercial Lines and Personal Lines.
Underwriting Gain (Loss)- The Hartford's management evaluates profitability of the Commercial and Personal Lines segments primarily on the basis of underwriting gain or loss. Underwriting gain (loss) is a before tax non-GAAP measure that represents earned premiums less incurred losses, loss adjustment expenses and underwriting expenses. Net income (loss) is the most directly comparable GAAP measure. Underwriting gain (loss) is influenced significantly by earned premium growth and the adequacy of The Hartford's pricing. Underwriting profitability over time is also greatly influenced by The Hartford's underwriting discipline, as management strives to manage exposure to loss through favorable risk selection and diversification, effective management of claims, use of reinsurance and its ability to manage its expenses. The Hartford believes that the measure underwriting gain (loss) provides investors with a valuable measure of profitability, before tax, derived from underwriting activities, which are managed separately from the Company's investing activities.
Part I - Item 2. Management's Discussion and Analysis of Financial Condition and Results of Operations
| | | | | | | | | | | | | | | | | |
Reconciliation of Net Income to Underwriting Gain (Loss) |
| | Three Months Ended June 30, | | Six Months Ended June 30, |
| 2022 | 2021 | | 2022 | 2021 |
| Commercial Lines |
| Net income | $ | 389 | | $ | 569 | | | $ | 772 | | $ | 698 | |
| Adjustments to reconcile net income to underwriting gain (loss): | | | | | |
| Net servicing income | — | | (7) | | | (1) | | (9) | |
| Net investment income | (356) | | (382) | | | (689) | | (709) | |
| Net realized losses (gains) | 198 | | (47) | | | 289 | | (91) | |
| Other expense | 1 | | 6 | | | 8 | | 10 | |
| | | | | |
| Income tax expense | 101 | | 122 | | | 196 | | 146 | |
| Underwriting gain | $ | 333 | | $ | 261 | | | $ | 575 | | $ | 45 | |
| Personal Lines |
| Net income | $ | 6 | | $ | 118 | | | $ | 83 | | $ | 253 | |
| Adjustments to reconcile net income to underwriting gain: | | | | | |
| Net servicing income | (4) | | (5) | | | (8) | | (9) | |
| Net investment income | (35) | | (40) | | | (68) | | (75) | |
| Net realized losses (gains) | 18 | | (6) | | | 27 | | (13) | |
| Other income | 1 | | — | | | 1 | | — | |
| Income tax expense | 1 | | 29 | | | 21 | | 64 | |
| Underwriting gain (loss) | $ | (13) | | $ | 96 | | | $ | 56 | | $ | 220 | |
| P&C Other Operations |
| Net income (loss) | $ | (20) | | $ | 17 | | | $ | (12) | | $ | 4 | |
| Adjustments to reconcile net income to underwriting loss: | | | | | |
| Net investment income | (16) | | (20) | | | (32) | | (36) | |
| Net realized losses (gains) | 9 | | (3) | | | 13 | | (5) | |
| Income tax expense (benefit) | (5) | | 4 | | | (4) | | — | |
| Underwriting loss | $ | (32) | | $ | (2) | | | $ | (35) | | $ | (37) | |
Written and Earned Premiums- Written premium represents the amount of premiums charged for policies issued, net of reinsurance, during a fiscal period. Premiums are considered earned and are included in the financial results on a pro rata basis over the policy period. Management believes that written premium is a performance measure that is useful to investors as it reflects current trends in the Company’s sale of property and casualty insurance products. Written and earned premium are recorded net of ceded reinsurance premium.
Traditional life and disability insurance type products, such as those sold by Group Benefits, collect premiums from policyholders in exchange for financial protection for the policyholder from a specified insurable loss, such as death or disability. These premiums together with net investment income earned are used to pay the contractual obligations under these insurance contracts. Two major factors, new sales and persistency, impact premium growth. Sales can increase or decrease in a given year based on a number of factors, including but not limited to, customer demand for the Company’s product offerings, pricing competition, distribution channels and the Company’s reputation and ratings. Persistency refers to the percentage of premium remaining in-force from year-to-year.
Part I - Item 2. Management's Discussion and Analysis of Financial Condition and Results of Operations
THE HARTFORD’S OPERATIONS
The Hartford conducts business principally in five reporting segments including Commercial Lines, Personal Lines, Property & Casualty Other Operations, Group Benefits and Hartford Funds, as well as a Corporate category. The Company includes in the Corporate category reserves for run-off structured settlement and terminal funding agreement liabilities, restructuring costs, capital raising activities (including equity financing, debt financing and related interest expense), transaction expenses incurred in connection with an acquisition, certain M&A costs, purchase accounting adjustments related to goodwill and other expenses not allocated to the reporting segments. Corporate also includes investment management fees and expenses related to managing third party business, including management of a portion of the invested assets of Talcott Resolution Life, Inc. and its subsidiaries as well as certain affiliates. In addition, up until June 30, 2021, Corporate included a 9.7% ownership interest in Hopmeadow Holdings LP, the legal entity that acquired Talcott Resolution in May 2018 (Hopmeadow Holdings, LP, Talcott Resolution Life Inc., and its subsidiaries are collectively referred to as "Talcott Resolution"). The sale of Talcott Resolution to a new investor was completed on June 30, 2021. The Company received a total of $217 in connection with the sale of its 9.7% ownership interest, resulting in a realized gain of $46 before tax in 2021.
The Company derives its revenues principally from: (a) premiums earned for insurance coverage provided to insureds; (b) management fees on mutual fund and ETF assets; (c) net investment income; (d) fees earned for services provided to third parties; and (e) net realized gains and losses. Premiums charged for insurance coverage are earned principally on a pro rata basis over the terms of the related policies in-force.
The profitability of the Company's property and casualty insurance businesses over time is greatly influenced by the Company’s underwriting discipline, which seeks to manage exposure to loss through favorable risk selection and diversification, its management of claims, its use of reinsurance, the size of its in force block, actual mortality and morbidity experience, and its ability to manage its expense ratio which it accomplishes through economies of scale and its management of acquisition costs and other underwriting expenses. Pricing adequacy depends on a number of factors, including the ability to obtain regulatory approval for rate changes, proper evaluation of underwriting risks, the ability to project future loss cost frequency and severity based on historical loss experience adjusted for known trends, the Company’s response to rate actions taken by competitors, its expense levels and expectations about regulatory and legal developments. The Company seeks to price its insurance policies such that insurance premiums and future net investment income earned on premiums received will cover underwriting expenses and the ultimate cost of paying claims reported on the policies and provide for a profit margin. For many of its insurance products, the Company is required to obtain approval for its premium rates from state insurance departments and the Lloyd's Syndicate's ability to write business is subject to Lloyd's approval for its premium capacity each year. Most of Personal Lines written premium is associated with our exclusive licensing agreement
with AARP, which is effective through December 31, 2032. This agreement provides an important competitive advantage given the size of the 50 plus population and the strength of the AARP brand.
Similar to property and casualty, profitability of the group benefits business depends, in large part, on the ability to evaluate and price risks appropriately and make reliable estimates of mortality, morbidity, disability and longevity. To manage the pricing risk, Group Benefits generally offers term insurance policies, allowing for the adjustment of rates or policy terms in order to minimize the adverse effect of market trends, loss costs, declining interest rates and other factors. However, as policies are typically sold with rate guarantees of up to three years, pricing for the Company’s products could prove to be inadequate if loss and expense trends emerge adversely during the rate guarantee period or if investment returns are lower than expected at the time the products were sold. For some of its products, the Company is required to obtain approval for its premium rates from state insurance departments. New and renewal business for group benefits business, particularly for long-term disability ("LTD"), are priced using an assumption about expected investment yields over time. While the Company employs asset-liability duration matching strategies to mitigate risk and may use interest-rate sensitive derivatives to hedge its exposure in the Group Benefits investment portfolio, cash flow patterns related to the payment of benefits and claims are uncertain and actual investment yields could differ significantly from expected investment yields, affecting profitability of the business. In addition to appropriately evaluating and pricing risks, the profitability of the Group Benefits business depends on other factors, including the Company’s response to pricing decisions and other actions taken by competitors, its ability to offer voluntary products and self-service capabilities, the persistency of its sold business and its ability to manage its expenses which it seeks to achieve through economies of scale and operating efficiencies.
The financial results of the Company’s mutual fund and ETF businesses depend largely on the amount of assets under management and the level of fees charged based, in part, on asset share class and fund type. Changes in assets under management are driven by the two main factors of net flows and the market return of the funds, which are heavily influenced by the return realized in the equity and bond markets. Net flows are comprised of new sales less redemptions by mutual fund and ETF shareowners. Financial results are highly correlated to the growth in assets under management since these funds generally earn fee income on a daily basis.
The investment return, or yield, on invested assets is an important element of the Company’s earnings since insurance products are priced with the assumption that premiums received can be invested for a period of time before benefits, losses and loss adjustment expenses are paid. Due to the need to maintain sufficient liquidity to satisfy claim obligations, the majority of the Company’s invested assets have been held in available-for-sale ("AFS") securities, including, among other asset classes, corporate bonds, municipal bonds, government debt, short-term debt, mortgage-backed securities, asset-backed securities and collateralized loan obligations ("CLO"). The primary investment objective for the Company is to maximize economic value, consistent with acceptable risk parameters, including the management of credit risk and interest rate sensitivity of
Part I - Item 2. Management's Discussion and Analysis of Financial Condition and Results of Operations
invested assets, while generating sufficient net of tax income to meet policyholder and corporate obligations. Investment strategies are developed based on a variety of factors including business needs, regulatory requirements and tax considerations.
Impact of Ukraine conflict on our results of operations
From the Ukraine conflict, the Company incurred $27 of catastrophe losses, net of reinsurance, in the six months ended June 30, 2022, all in the first quarter, that included exposures under political violence and terrorism ("PV&T") policies, including aviation war, as well as under credit and political risk insurance ("CPRI") policies. Also in the first quarter of 2022, the Company recognized provisions for reinstatement premium of $11 as a result of estimated ceded incurred losses related to the conflict.
The Company’s direct investment exposure is limited to bonds issued by Russian entities with an amortized cost of $16 and a fair value of $7 as of June 30, 2022, with an allowance for credit losses ("ACL") of $9. The Company does not have any investments in Belarus or Ukraine.
For a discussion of the risks associated with a deterioration in global economic conditions and/or geopolitical conditions, including due to military action, please refer to the Risk Factors in our 2021 Form 10-K, including one entitled “Unfavorable economic, political and global market conditions may adversely impact our business and results of operations” and another entitled “We are vulnerable to losses from catastrophes, both natural and man-made”.
Operational Transformation and Cost Reduction Plan
In recognition of the need to become more cost efficient and competitive along with enhancing the experience we provide to
agents and customers, on July 30, 2020, the Company announced an operational transformation and cost reduction plan it refers to as Hartford Next. Through reduction of its headcount, Information Technology ("IT") investments to further enhance our capabilities, and other activities, relative to 2019, the Company expects to achieve a reduction in annual insurance operating costs and other expenses of approximately $540 by 2022 and $625 by 2023.
To achieve those expected savings, we expect to incur approximately $393 over the course of the program, with $253 expensed cumulatively through June 30, 2022, and expected expenses of $43 over the last six months of 2022, $40 in 2023, and $57 after 2023, with the expenses after 2023 consisting mostly of amortization of internal use software and capitalized real estate costs. Included in the estimated costs of $393, we expect to incur restructuring costs of approximately $127, including $41 of employee severance, $26 to retire certain IT applications, and $60 for consulting and lease termination expenses. Restructuring costs are reported as a charge to net income but not in core earnings.
The following table presents Hartford Next program costs incurred, including restructuring costs, and expense savings realized in the six months ended June 30, 2022 and expected annual costs and expense savings for the full year in 2022 and 2023:
| | | | | | | | | | | | | |
Hartford Next Costs and Expense Savings | |
| | Six Months Ended June 30, 2022 | Estimate for 2022 | Estimate for 2023 | |
| Employee severance | | $ | (7) | | $ | (7) | | $ | — | | |
| IT costs to retire applications | | 5 | | 10 | | 5 | | |
| Professional fees and other expenses | | 9 | | 14 | | — | | |
| Estimated restructuring costs | | 7 | | 17 | | 5 | | |
| | | | | |
| Non-capitalized IT costs | | 23 | | 45 | | 19 | | |
| Other costs | | 5 | | 12 | | 6 | | |
| Amortization of capitalized IT development costs [1] | | 1 | | 4 | | 9 | | |
| Amortization of capitalized real estate [2] | | — | | 1 | | 1 | | |
| Estimated costs within core earnings | | 29 | | 62 | | 35 | | |
| Total Hartford Next program costs | | $ | 36 | | $ | 79 | | $ | 40 | | |
| | | | | |
| Cumulative savings for the period relative to 2019 | | (267) | | (540) | | (625) | | |
| Net expense (savings) before tax: | | $ | (231) | | $ | (461) | | $ | (585) | | |
| | | | | |
| Net expense (savings) before tax: | | | | | |
| Accounted for within core earnings | | $ | (238) | | $ | (478) | | $ | (590) | | |
| Restructuring costs recognized outside of core earnings | | 7 | | 17 | | 5 | | |
| Net expense (savings) before tax | | $ | (231) | | $ | (461) | | $ | (585) | | |
[1]Does not include approximately $34 of IT asset amortization after 2023.
[2]Does not include approximately $18 of real estate amortization after 2023.
Part I - Item 2. Management's Discussion and Analysis of Financial Condition and Results of Operations
SECOND QUARTER FINANCIAL HIGHLIGHTS
| | | | | | | | | | | | | | |
| Net Income Available to Common Stockholders | | Net Income Available to Common Stockholders per Diluted Share | | Book Value per Diluted Share |
| | | | | | | | | | | | | | | | | | | | | | | | | | | | | | | | |
| Þ | Decreased $463 or 51% | | Þ | Decreased $1.19 or 47% | | Þ | Decreased $9.15 or 17.8% |
| - | A change to net realized losses | | - | Decrease in net income available to common stockholders | | - | Decrease in common stockholders' equity largely due to a decrease in AOCI, primarily driven by a change from net unrealized gains to net unrealized losses on available for sale securities as well as common stockholder dividends and share repurchases in excess of net income |
| - | Less favorable P&C prior accident year reserve development | | |
| | + | Share repurchases activity | | |
| - | Higher loss ratio in Personal Lines automobile and homeowners | | | | |
| | | | | | |
| - | Greater P&C underwriting expenses and Group Benefits insurance operating costs and other expenses | | | | | | |
| | | | | | + | Reduction in outstanding shares due to share repurchases |
| | | | | | |
| - | Lower net investment income | | | | | | | | |
| - | Higher disability loss ratio in Group Benefits | | | | | | | |
| + | In Commercial Lines, higher earned premiums and a lower current accident year loss ratio | | | | | | | | |
| + | In Group Benefits, lower excess mortality claims and the effect of higher premiums | | | | | | | |
| | | | | | | |
| | | | | | | | | | | | | | |
| Investment Yield, After Tax | | Property & Casualty Combined Ratio | | Group Benefits Net Income Margin |
| | | | | | | | | | | | | | | | | | | | | | | | | | | | | | | | |
| Þ | Decreased 40 bps | | Ý | Increased 2.9 points | | Þ | Decreased 4.1 points |
| - | Lower returns on limited partnerships and other alternative investments | | + | Lower favorable prior accident year reserve development | | - | A change to net realized losses |
| | | | - | A higher group disability loss ratio due to a lower New York Paid Family Leave risk adjustment benefit, with $10, before tax, recorded in the 2022 period versus $22, before tax, benefit recorded in the 2021 period |
| - | A decline in valuation of equity fund investments in the 2022 period due to the decline in equity market levels | | + | Higher personal automobile claim severity | | |
| | - | Lower current accident year loss ratio before catastrophes in Commercial Lines | | |
| | | |
| | | | - | Lower catastrophe losses | |
| | | | | | - | Higher insurance operating costs and other expenses |
| | | | | | | |
| | | | | | | | + | Lower excess mortality in group life |
| | | | |
| | + | Higher fully insured ongoing premiums |
| | | | | | | |
| | | | | | | |
| | | | | | | |
Part I - Item 2. Management's Discussion and Analysis of Financial Condition and Results of Operations
CONSOLIDATED RESULTS OF OPERATIONS
The Consolidated Results of Operations should be read in conjunction with the Company's Condensed Consolidated Financial Statements and the related Notes as well as with the segment operating results sections of MD&A.
Consolidated Results of Operations
| | | | | | | | | | | | | | | | | | | | | | | |
| Three Months Ended June 30, | | Six Months Ended June 30, |
| 2022 | 2021 | Change | | 2022 | 2021 | Change |
| Earned premiums | $ | 4,810 | | $ | 4,460 | | 8 | % | | $ | 9,461 | | $ | 8,803 | | 7 | % |
| Fee income | 341 | | 375 | | (9 | %) | | 703 | | 730 | | (4 | %) |
| Net investment income | 541 | | 581 | | (7 | %) | | 1,050 | | 1,090 | | (4 | %) |
| Net realized gains (losses) | (338) | | 147 | | NM | | (483) | | 227 | | NM |
| Other revenues | 19 | | 26 | | (27 | %) | | 35 | | 38 | | (8 | %) |
| Total revenues | 5,373 | | 5,589 | | (4 | %) | | 10,766 | | 10,888 | | (1 | %) |
| Benefits, losses and loss adjustment expenses | 3,076 | | 2,786 | | 10 | % | | 6,194 | | 6,136 | | 1 | % |
| Amortization of deferred policy acquisition costs | 453 | | 417 | | 9 | % | | 893 | | 833 | | 7 | % |
| Insurance operating costs and other expenses | 1,222 | | 1,202 | | 2 | % | | 2,429 | | 2,346 | | 4 | % |
| | | | | | | |
| | | | | | | |
| | | | | | | |
| Interest expense | 51 | | 57 | | (11 | %) | | 113 | | 114 | | (1 | %) |
| Amortization of other intangible assets | 17 | | 17 | | — | % | | 35 | | 35 | | — | % |
| Restructuring and other costs | 2 | | — | | NM | | 7 | | 11 | | (36 | %) |
| Total benefits, losses and expenses | 4,821 | | 4,479 | | 8 | % | | 9,671 | | 9,475 | | 2 | % |
| Income, before tax | 552 | | 1,110 | | (50 | %) | | 1,095 | | 1,413 | | (23 | %) |
| Income tax expense | 110 | | 205 | | (46 | %) | | 208 | | 259 | | (20 | %) |
| Net income | 442 | | 905 | | (51 | %) | | 887 | | 1,154 | | (23 | %) |
| Preferred stock dividends | 5 | | 5 | | — | % | | 10 | | 10 | | — | % |
| Net income available to common stockholders | $ | 437 | | $ | 900 | | (51 | %) | | $ | 877 | | $ | 1,144 | | (23 | %) |
Three months ended June 30, 2022 compared to the three months ended June 30, 2021
Net income available to common stockholders decreased by $463, primarily driven by:
•A $485, before tax, change to net realized losses in the 2022 period from net realized gains in the 2021 period, driven by a depreciation in value of equity securities during the second quarter of 2022 compared to appreciation in the 2021 period, as well as a net loss on sales of fixed maturity securities in the second quarter of 2022 compared to a net gain on sales in the 2021 period.
•A decrease in P&C underwriting results of $67, before tax, driven by less favorable prior accident year reserve development, higher Personal Lines automobile and homeowners’ loss costs and higher underwriting expenses, partially offset by the effect of Commercial Lines earned premium growth and a lower Commercial Lines current accident year loss and LAE ratio before catastrophes.
•A decline in net investment income driven by lower returns on limited partnerships and other alternative investments, and
•A decrease in earnings from Hartford Funds.
These decreases were partially offset by:
•In Group Benefits, lower excess mortality claims of $30, before tax, and the effect of higher earned premiums, partially offset by a higher disability loss ratio and an increase in insurance operating costs and other expenses; and
•Legal and consulting costs in the 2021 period associated with the unsolicited proposals from Chubb Limited to acquire the Company.
For a discussion of the Company's operating results by segment, see MD&A - Segment Operating Summaries.
Part I - Item 2. Management's Discussion and Analysis of Financial Condition and Results of Operations
REVENUE
Earned Premiums
Earned premiums increased by $350, or 8%, primarily due to:
•An increase in P&C reflecting a 12% increase in Commercial Lines and a 2% decrease in Personal Lines. Contributing to the increase in Commercial Lines was an increase in new business in small commercial, higher policy count retention in small commercial and middle market, the effect of higher renewal written price increases across all lines, and higher audit and endorsement premiums as a result of higher insured exposures. For Personal Lines, non-renewals outpaced new business despite an increase in new business and the effect of earned pricing increases; and
•An increase in Group Benefits earned premium of 7% due to an increase in group disability and supplemental health product premiums.
Fee income decreased, driven by lower daily average assets within Hartford Funds due to a decline in equity market levels and net outflows during 2022.
Other revenues decreased by $7, primarily driven by lower servicing revenues in P&C.
Net Investment Income
Net investment income decreased primarily due to:
•Lower income from limited partnerships and other alternative investments driven by lower returns on private equity funds, partially offset by higher real estate fund valuations and greater income from sales of underlying real estate properties in the 2022 period;
•A decline in valuation of equity fund investments in the 2022 period due to the decline in equity market levels;
•Partially offset by a higher level of invested assets.
Net realized gains (losses) changed to a net realized loss in the 2022 period from a net realized gain in the 2021 period, primarily driven by:
•Losses on equity securities in the 2022 period driven by depreciation in value compared to gains on equity securities in the 2021 period due to appreciation in value; and
•Net realized losses on sales of fixed maturity securities in 2022, driven by the increase in interest rates and wider credit spreads;
For further discussion of investment results, see MD&A - Investment Results, Net Realized Gains and MD&A - Investment Results, Net Investment Income.
Part I - Item 2. Management's Discussion and Analysis of Financial Condition and Results of Operations
BENEFITS, LOSSES AND EXPENSES
Losses and LAE Incurred for P&C
Benefits, losses and loss adjustment expenses increased $290 due to:
•An increase in Property & Casualty of $244, which was attributable to:
–An increase in P&C current accident year ("CAY") loss and loss adjustment expenses before catastrophes of $158, primarily due to the effect of higher earned premiums in Commercial Lines and higher personal automobile claim severity, and higher non-catastrophe property losses in middle market, partially offset by lower current accident year loss ratios in global specialty lines.
–An unfavorable change of $91 in P&C net prior accident year reserve development. Prior accident year reserve development in the 2022 period was a net favorable $58, before tax, primarily driven by reserve decreases in workers' compensation, catastrophes, and package business, partially offset by reserve increases in general liability and commercial automobile liability. Prior accident year reserve development in 2021 was a favorable $149, before tax, net of $39 before tax of adverse development for Navigators related to 2018 and prior accident years that has been economically ceded to NICO but recorded as a deferred gain. Favorable development in second quarter 2021 was primarily due to reserve decreases for catastrophes, workers' compensation, package business, personal automobile liability, and bond. For further discussion, see Note 9 - Reserve for Unpaid Losses and Loss Adjustment Expenses of Notes to Condensed Consolidated Financial Statements.
–Partially offsetting was a decrease in current accident year catastrophe losses of $5 before tax. Catastrophe losses in the 2022 period included losses from wind and hail events mostly concentrated in the South, Midwest, and Central Plains. Catastrophe losses of $128 in the second quarter of 2021 were primarily from various tornado, wind and hail events, mostly concentrated in Texas and the Southeast.
Losses and LAE Incurred for Group Benefits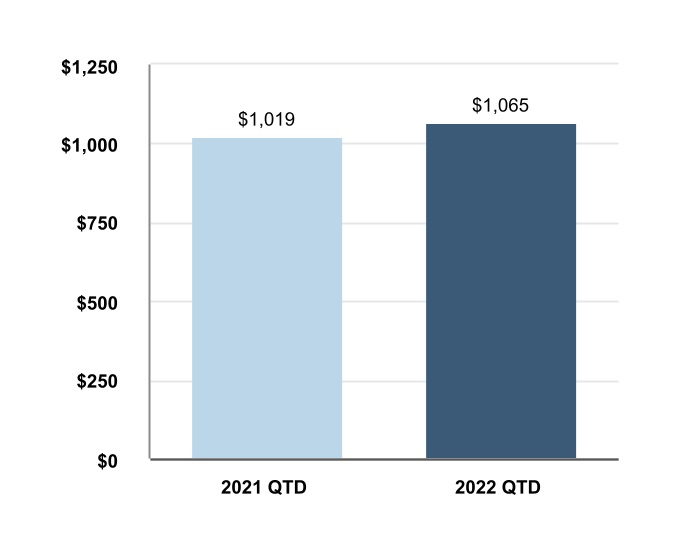
•An increase in Group Benefits of $46, primarily driven by the effect of an increase in earned premiums and a higher group disability loss ratio largely due to a lower New York Paid Family Leave risk adjustment benefit with $10 recorded in the 2022 period versus $22 recorded in the 2021 period, partially offset by a $30 decrease in excess mortality claims.
Amortization of deferred policy acquisition costs increased from the prior year period driven by Commercial Lines, reflecting an increase in earned premiums across all commercial lines of business.
Insurance operating costs and other expenses increased primarily due to:
•An increase in performance-based commissions in Commercial Lines;
•Higher technology costs;
•Higher volume-related staffing costs in Commercial Lines and Group Benefits;
•A reduction in doubtful accounts in the 2021 period; and
•A loss on extinguishment of debt related to the April 2022 redemption of $600 of 7.875% subordinated debentures.
These increases were partially offset by:
•Incremental expense savings driven by the Company’s Hartford Next operational transformation and cost reduction plan.
Interest Expense decreased primarily due to the Company redeeming $600 aggregate principal amount of junior subordinated debentures on April 15, 2022. For further discussion of the debt redemption, see Note 11 - Debt of Notes to Condensed Consolidated Financial Statements.
Income tax expense decreased primarily due to a decline in income before tax. For further discussion of income taxes, see Note 12 - Income Taxes of Notes to Condensed Consolidated Financial Statements.
Part I - Item 2. Management's Discussion and Analysis of Financial Condition and Results of Operations
Six months ended June 30, 2022 compared to the six months ended June 30, 2021
Net income available to common stockholders decreased by $267 primarily driven by:
•A $710, before tax, change to net realized losses in the 2022 period from net realized gains in the 2021 period, primarily driven by a depreciation in value of equity securities in the 2022 period compared to appreciation in the 2021 period, as well as a net loss on sales of fixed maturity securities in the first six months of 2022; and
•Lower net investment income, primarily driven by a decline in valuation of equity fund investments in the 2022 period and lower returns on limited partnerships and other alternative investments.
This decrease was partially offset by:
•An increase in P&C underwriting results of $368, before tax, driven by a change to favorable prior accident year development, lower catastrophe losses, the effect of
Commercial Lines earned premium growth and a lower Commercial Lines current accident year loss and LAE ratio before catastrophes, including a benefit from lower COVID-19 losses, partially offset by higher Personal Lines automobile loss costs and higher underwriting expenses;
•In Group Benefits, lower excess mortality claims of $119, before tax, and the effect of higher fully insured ongoing premiums, partially offset by a higher loss ratio excluding the impact of COVID-19 and an increase in insurance operating costs and other expenses; and
•Legal and consulting costs in the 2021 period associated with the unsolicited proposals from Chubb Limited to acquire the Company.
For a discussion of the Company's operating results by segment, see MD&A - Segment Operating Summaries.
REVENUE
Earned Premiums
Earned premiums increased primarily due to:
•An increase in P&C reflecting an 11% increase in Commercial Lines and a 2% decrease in Personal Lines. Contributing to the increase in Commercial Lines was an increase in small commercial new business, higher policy count retention, earned pricing increases, and the effect of higher audit and endorsement premiums as the result of higher insured exposures, principally in workers’ compensation. For Personal Lines, non-renewals outpaced new business despite an increase in new business and the effect of earned pricing increases; and
•An increase in Group Benefits earned premium of 6% due to an increase in group disability and supplemental health product premiums.
Net Investment Income
Fee income decreased, driven by lower daily average assets within Hartford Funds due to a decline in equity market levels and net outflows during 2022.
Net investment income is lower due to:
•A decline in valuation of equity fund investments in the 2022 period due to the decline in equity market levels;
•Lower income from limited partnerships and other alternative investments driven by lower returns on private equity funds, partially offset by higher real estate fund valuations and greater income from sales of underlying real estate properties;
•Partially offset by a higher level of invested assets.
Part I - Item 2. Management's Discussion and Analysis of Financial Condition and Results of Operations
Net realized gains (losses) changed to a net realized loss in the 2022 period from a net realized gain in the 2021 period, primarily driven by:
•Losses on equity securities in the 2022 period driven by depreciation in value compared to gains on equity securities in the 2021 period due to appreciation in value; and
•Net realized losses on sales of fixed maturity securities in 2022, driven by the increase in interest rates and credit spread widening.
For further discussion of investment results, see MD&A - Investment Results, Net Realized Gains and MD&A - Investment Results, Net Investment Income.
BENEFITS, LOSSES AND EXPENSES
Losses and LAE Incurred for P&C
Benefits, losses and loss adjustment expenses increased $58, comprised of:
•A decline in incurred losses for Property & Casualty of $14 which was driven by:
–A favorable change of $174 in P&C net prior accident year reserve development. Prior accident year reserve development in the 2022 period was a net favorable $94, before tax, primarily driven by reserve decreases in workers' compensation, catastrophes, package business, and commercial property, partially offset by reserve increases in general liability, assumed reinsurance, and commercial automobile liability. Prior accident year reserve development in the 2021 period was a net unfavorable $80 before tax, driven by reserve increases for sexual molestation and sexual abuse claims, primarily to reflect claims made against the Boy Scouts of America ("BSA"). Apart from these reserve increases, prior accident year reserve development in the 2021 period primarily included reserve decreases for catastrophes, workers' compensation, package business, personal automobile, commercial property, and bond, as well as $45 before tax of adverse development for Navigators related to 2018 and prior accident years. While the Navigators’ reserve development has been economically ceded to NICO, the Company recognized a deferred gain under retroactive reinsurance accounting. For further discussion, see Note 9 - Reserve for Unpaid Losses and Loss Adjustment Expenses of Notes to Condensed Consolidated Financial Statements.
Losses and LAE Incurred for Group Benefits
–A decrease in current accident year catastrophe losses of $121, before tax. Catastrophe losses in the 2022 period included losses from tornado, wind and hail events in the South, Midwest and Central Plains, winter storms along the East Coast, and $27 of losses, net of reinsurance, related to the Ukraine conflict. Catastrophe losses in the 2021 period were driven by February winter storms primarily in the South, with the remainder from various tornado, wind and hail events, mostly concentrated in Texas, the Southeast and along the Pacific Coast. Losses of $181 from the February 2021 winter storms was net of a $62 reinsurance recoverable under the Company's per occurrence catastrophe treaty that covers 70% of up to $250 in losses in excess of $100 on catastrophe events occurring within a 7-day period other than from earthquakes and named hurricanes and tropical storms, subject to a $50 annual aggregate deductible.
–Partially offsetting was an increase in P&C CAY loss and loss adjustment expenses before catastrophes of $281, primarily due to the effect of higher earned premiums in Commercial Lines, higher personal automobile claim frequency and severity, and higher non-catastrophe property losses, partially offset by lower COVID-19 incurred losses and lower current accident year loss ratios before COVID-19 in global specialty lines, workers’ compensation, general liability and programs.
•More than offsetting this decrease was an increase in Group Benefits of $71, primarily driven by the effect of an increase in earned premiums, a higher loss ratio on accidental death business, less favorable prior period development on long-term disability and a lower New York
Part I - Item 2. Management's Discussion and Analysis of Financial Condition and Results of Operations
Paid Family Leave risk adjustment benefit with $9 recorded in the 2022 period versus $22 recorded in the 2021 period, partially offset by a $119 decrease in excess mortality claims.
Amortization of deferred policy acquisition costs increased from the prior year period driven by Commercial Lines reflecting an increase in earned premiums across all commercial lines of business.
Insurance operating costs and other expenses increased due to:
•An increase in performance-based commissions in Commercial Lines;
•Higher technology costs;
•Higher volume-related staffing costs in Commercial Lines and Group Benefits; and
•A reduction in doubtful accounts in the 2021 period.
These increases were partially offset by:
•Incremental savings from the Company’s Hartford Next operational transformation and cost reduction plan.
Income tax expense decreased primarily due to a decline in income before tax. For further discussion of income taxes, see Note 12 - Income Taxes of Notes to Condensed Consolidated Financial Statements.
INVESTMENT RESULTS
| | | | | | | | | | | | | | | | | |
Composition of Invested Assets |
| June 30, 2022 | | December 31, 2021 |
| Amount | Percent | | Amount | Percent |
| Fixed maturities, AFS, at fair value | $ | 37,887 | | 72.3 | % | | $ | 42,847 | | 74.2 | % |
| Fixed maturities, at fair value using the fair value option ("FVO") | 342 | | 0.6 | % | | 160 | | 0.3 | % |
| Equity securities, at fair value | 1,728 | | 3.3 | % | | 2,094 | | 3.6 | % |
Mortgage loans (net of ACL of $36 and $29) | 5,852 | | 11.2 | % | | 5,383 | | 9.3 | % |
| Limited partnerships and other alternative investments | 3,856 | | 7.4 | % | | 3,353 | | 5.8 | % |
| Other investments [1] | 203 | | 0.4 | % | | 215 | | 0.4 | % |
| Short-term investments | 2,524 | | 4.8 | % | | 3,697 | | 6.4 | % |
| Total investments | $ | 52,392 | | 100.0 | % | | $ | 57,749 | | 100.0 | % |
[1]Primarily consists of equity fund investments, overseas deposits, consolidated investment funds, and derivative instruments which are carried at fair value.
June 30, 2022 compared to December 31, 2021
Total investments decreased primarily due to a decline in fixed maturities, AFS and short-term investments, partially offset by an increase in limited partnerships and other alternative investments and mortgage loans.
Fixed maturities, AFS decreased primarily due to a decline in valuations due to higher interest rates and wider credit spreads.
Short-term investments decreased primarily due to the redemption of $600 of 7.875% junior subordinated debentures and share repurchases.
Mortgage loans increased largely due to funding of multifamily, industrial, and retail commercial whole loans.
Limited partnerships and other alternative investments increased primarily driven by higher valuations and additional investments.
Part I - Item 2. Management's Discussion and Analysis of Financial Condition and Results of Operations
| | | | | | | | | | | | | | | | | | | | | | | | | | | | | |
| Net Investment Income |
| | Three Months Ended June 30, | | Six Months Ended June 30, |
| | 2022 | 2021 | | 2022 | 2021 |
| (Before tax) | Amount | Yield [1] | Amount | Yield [1] | | Amount | Yield [1] | Amount | Yield [1] |
| Fixed maturities [2] | $ | 346 | | 3.2 | % | $ | 338 | | 3.2 | % | | $ | 677 | | 3.2 | % | $ | 687 | | 3.2 | % |
| Equity securities | 13 | | 2.7 | % | 10 | | 2.7 | % | | 25 | | 2.6 | % | 20 | | 2.8 | % |
| Mortgage loans | 53 | | 3.6 | % | 45 | | 3.7 | % | | 103 | | 3.6 | % | 88 | | 3.8 | % |
| Limited partnerships and other alternative investments | 158 | | 17.3 | % | 191 | | 32.5 | % | | 284 | | 16.3 | % | 303 | | 27.8 | % |
| Other [3] | (7) | | | 18 | | | | 2 | | | 32 | | |
| Investment expense | (22) | | | (21) | | | | (41) | | | (40) | | |
| Total net investment income | $ | 541 | | 3.9 | % | $ | 581 | | 4.4 | % | | $ | 1,050 | | 3.8 | % | $ | 1,090 | | 4.1 | % |
| Total net investment income excluding limited partnerships and other alternative investments | $ | 383 | | 3.0 | % | $ | 390 | | 3.1 | % | | $ | 766 | | 3.0 | % | $ | 787 | | 3.1 | % |
[1]Yields calculated using annualized net investment income divided by the monthly average invested assets at amortized cost, as applicable, excluding repurchase agreement and securities lending collateral, if any, and derivatives book value.
[2]Includes net investment income on short-term investments.
[3]Primarily includes changes in fair value of certain equity fund investments and income from derivatives that qualify for hedge accounting and are used to hedge fixed maturities.
Three months ended June 30, 2022 compared to the three months ended June 30, 2021
Total net investment income declined due to:
•Lower income from limited partnerships and other alternative investments driven by lower returns on private equity funds, partially offset by higher real estate fund valuations and greater income from sales of underlying real estate properties in the 2022 period;
•A decline in valuation of equity fund investments in the 2022 period due to the decline in equity market levels;
•Partially offset by a higher level of invested assets.
Six months ended June 30, 2022 compared to the six months ended June 30, 2021
Total net investment income declined due to:
•A decline in valuation of equity fund investments in the 2022 period due to the decline in equity market levels;
•Lower income from limited partnerships and other alternative investments driven by lower returns on private equity funds, partially offset by higher real estate fund valuations and greater income from sales of underlying real estate properties;
•Partially offset by a higher level of invested assets.
Annualized net investment income yield, excluding limited partnerships and other alternative investments, was down primarily due to negative returns on equity fund investments in the 2022 period.
Average reinvestment rates on fixed maturities and mortgage loans, excluding certain U.S. Treasury securities, for the three and six month periods ended June 30, 2022, were 4.5% and 3.8%, respectively, which were above the average yield of sales and maturities of 3.6% and 3.3%, respectively. Average reinvestment rates for the three and six month periods ended June 30, 2021, were 2.5% and 2.4%, respectively, which were below the average yield of sales and maturities of 2.9% and 2.9%, respectively.
For the 2022 calendar year, we expect the annualized net investment income yield, excluding limited partnerships and other alternative investments, to remain consistent with the portfolio yield earned in 2021 due to the rising rate environment. The estimated impact on annualized net investment income yield is subject to variability due to evolving market conditions, active portfolio management, and the level of non-routine income items, such as make-whole payments, prepayment penalties on mortgage loans and yield adjustments on prepayable securities.
Part I - Item 2. Management's Discussion and Analysis of Financial Condition and Results of Operations
| | | | | | | | | | | | | | | | | |
| Net Realized Gains (Losses) |
| Three Months Ended June 30, | | Six Months Ended June 30, |
| (Before tax) | 2022 | 2021 | | 2022 | 2021 |
| Gross gains on sales of fixed maturities | $ | 15 | | $ | 68 | | | $ | 38 | | $ | 99 | |
| Gross losses on sales of fixed maturities | (80) | | (15) | | | (175) | | (46) | |
| Equity securities [1] | (262) | | 88 | | | (369) | | 131 | |
| Net credit losses on fixed maturities, AFS [2] | — | | — | | | (12) | | 4 | |
| Change in ACL on mortgage loans [3] | (5) | | 10 | | | (7) | | 14 | |
| Intent-to-sell impairments [2] | — | | — | | | (3) | | — | |
| Other, net [4] | (6) | | (4) | | | 45 | | 25 | |
| | | | | |
| | | | | |
| | | | | |
| Net realized gains (losses) | $ | (338) | | $ | 147 | | | $ | (483) | | $ | 227 | |
[1]The net unrealized gains (losses) on equity securities still held as of June 30, 2022, and included in net realized gains (losses) were $(259) and $(366) for the three and six months ended June 30, 2022, respectively. The net unrealized gains (losses) on equity securities still held as of June 30, 2021, and included in net realized gains (losses) were $80 and $118 for the three and six months ended June 30, 2021, respectively.
[2]See Credit Losses on Fixed Maturities, AFS and Intent-to-Sell Impairments within the Investment Portfolio Risks and Risk Management section of the MD&A.
[3]See ACL on Mortgage Loans within the Investment Portfolio Risks and Risk Management section of the MD&A.
[4]For the three and six months ended June 30, 2022, includes gains (losses) from transactional foreign currency revaluation of $15 and $21, respectively, and gains (losses) on non-qualifying derivatives of $14 and $61, respectively. For the three and six months ended June 30, 2021, includes gains (losses) from transactional foreign currency revaluation of $0 and $(7) respectively, and gains (losses) on non-qualifying derivatives of $(29) and $6, respectively.
Three and six months ended June 30, 2022
Gross gains and losses on sales were primarily due to sales of U.S. treasuries for duration management and to fund purchases of spread product, mortgage loans, and alternative investments. Also included were sales of corporate securities and tax-exempt municipals and tender activity.
Equity securities net losses were primarily driven by mark-to-market losses due to the decline in equity market levels.
Other, net gains and losses for the three and six month periods ended June 30, 2022 included gains of $15 and $21, respectively, on transactional foreign currency revaluation, and, losses of $20 and $23, respectively, on FVO securities due to credit spread widening. Also included for the six month period ended June 30, 2022 were gains of $37 on interest rate derivatives driven by an increase in interest rates and $14 on the termination of commodity derivatives driven by an increase in the price of crude oil.
Three and six months ended June 30, 2021
Gross gains and losses on sales were primarily due to an overall reduction to corporate securities and tax-exempt municipals, in addition to sales of U.S. treasuries for duration management.
Equity securities net gains were primarily driven by appreciation in value due to higher equity market levels.
Other, net gains and losses for the three and six month periods ended June 30, 2021, included a gain of $46 on the sale of the Company's 9.7% retained interest in Talcott Resolution, and a loss of $19 and $18, respectively, related to the pending sale of the Company's Continental Europe Operations, which the Company agreed to sell in September of 2020. Also included for the three month period ended June 30, 2021 was a loss of $32 on interest rate derivatives driven by a decrease in interest rates.
Part I - Item 2. Management's Discussion and Analysis of Financial Condition and Results of Operations
CRITICAL ACCOUNTING ESTIMATES
The preparation of financial statements in conformity with U.S. GAAP requires management to make estimates and assumptions that affect the reported amounts of assets and liabilities and disclosure of contingent assets and liabilities at the date of the financial statements and the reported amounts of revenues and expenses during the reporting period. Actual results could differ, and in the past have differed, from those estimates.
The Company has identified the following estimates as critical in that they involve a higher degree of judgment and are subject to a significant degree of variability:
•property and casualty insurance product reserves, net of reinsurance;
•group benefit long-term disability reserves, net of reinsurance;
•evaluation of goodwill for impairment;
•valuation of investments and derivative instruments including evaluation of credit losses on fixed maturities, AFS and ACL on mortgage loans; and
•contingencies relating to corporate litigation and regulatory matters.
In developing these estimates, management makes subjective and complex judgments that are inherently uncertain and subject to material change as facts and circumstances develop. Although variability is inherent in these estimates, management believes the amounts provided are appropriate based upon the facts available upon compilation of the financial statements. Certain of these estimates are particularly sensitive to market conditions, and deterioration and/or volatility in the worldwide debt or equity markets could have a material impact on the Condensed Consolidated Financial Statements.
The Company’s critical accounting estimates are discussed in Part II, Item 7 MD&A in the Company’s 2021 Form 10-K Annual Report. In addition, Note 1 - Basis of Presentation and Significant Accounting Policies of Notes to Consolidated Financial Statements included in the Company's 2021 Form 10-K Annual Report should be read in conjunction with this section to assist with obtaining an understanding of the underlying accounting policies related to these estimates. The following discussion updates certain of the Company’s critical accounting estimates as of June 30, 2022.
|PROPERTY & CASUALTY INSURANCE PRODUCT RESERVES, NET OF REINSURANCE
P&C Loss and Loss Adjustment Expense Reserves, Net of Reinsurance, by Segment as of June 30, 2022
Based on the results of the quarterly reserve review process, the Company determines the appropriate reserve adjustments, if any, to record. Recorded reserve estimates represent the Company's best estimate of the ultimate settlement amount of unpaid losses and loss adjustment expenses. The Company does not use statistical loss distributions or confidence levels in the process of determining its reserve estimate and, as a result, does not disclose reserve ranges. Assumptions used in arriving at the selected actuarial indications consider a number of factors, including the immaturity of emerged claims in recent accident years, emerging trends in the recent past, and the level of volatility within each line of business. In general, adjustments are made more quickly to more mature accident years and less volatile lines of business. Such adjustments of reserves are referred to as “prior accident year development”. Increases in previous estimates of ultimate loss costs are referred to as either an increase in prior accident year reserves or as unfavorable reserve development. Decreases in previous estimates of ultimate loss costs are referred to as either a decrease in prior accident year reserves or as favorable reserve development. Reserve development can influence the comparability of year over year underwriting results and is set forth in the paragraphs and tables that follow.
Part I - Item 2. Management's Discussion and Analysis of Financial Condition and Results of Operations
| | | | | | | | | | | | | | | |
| Rollforward of Property and Casualty Insurance Product Liabilities for Unpaid Losses and LAE for the Six Months Ended June 30, 2022 |
| Commercial Lines | Personal
Lines | Property & Casualty Other Operations | | Total Property & Casualty |
Beginning liabilities for unpaid losses and loss adjustment expenses, gross | $ | 26,906 | | $ | 1,844 | | $ | 2,699 | | | $ | 31,449 | |
| Reinsurance and other recoverables | 4,480 | | 37 | | 1,564 | | | 6,081 | |
Beginning liabilities for unpaid losses and loss adjustment expenses, net | 22,426 | | 1,807 | | 1,135 | | | 25,368 | |
Provision for unpaid losses and loss adjustment expenses | | | | | |
| Current accident year before catastrophes | 2,862 | | 915 | | — | | | 3,777 | |
| Current accident year catastrophes | 148 | | 73 | | — | | | 221 | |
Prior accident year development ("PYD") | (121) | | (3) | | 30 | | | (94) | |
Total provision for unpaid losses and loss adjustment expenses | 2,889 | | 985 | | 30 | | | 3,904 | |
| | | | | |
| Payments | (2,334) | | (1,028) | | (158) | | | (3,520) | |
| | | | | |
| Foreign currency adjustment | (29) | | — | | — | | | (29) | |
Ending liabilities for unpaid losses and loss adjustment expenses, net | 22,952 | | 1,764 | | 1,007 | | | 25,723 | |
| Reinsurance and other recoverables | 4,586 | | 36 | | 1,590 | | | 6,212 | |
Ending liabilities for unpaid losses and loss adjustment expenses, gross | $ | 27,538 | | $ | 1,800 | | $ | 2,597 | | | $ | 31,935 | |
| Earned premiums and fee income | $ | 5,120 | | $ | 1,461 | | | | |
| Loss and loss expense paid ratio [1] | 45.6 | | 70.4 | | | | |
| Loss and loss expense incurred ratio | 56.6 | | 68.1 | | | | |
| Prior accident year development (pts) [2] | (2.4) | | (0.2) | | | | |
[1]The “loss and loss expense paid ratio” represents the ratio of paid losses and loss adjustment expenses to earned premiums and fee income.
[2]“Prior accident year development (pts)” represents the ratio of prior accident year development to earned premiums.
| | | | | | | | | | | | | | | | | | | | | | | | |
| Current Accident Year Catastrophe Losses, Net of Reinsurance | |
| Three Months Ended June 30, 2022 | | Six Months Ended June 30, 2022 | |
| Commercial
Lines | Personal
Lines | Total | | Commercial
Lines | Personal
Lines | Total | |
| Wind and hail | $ | 54 | | $ | 53 | | $ | 107 | | | $ | 71 | | $ | 65 | | $ | 136 | | |
| Winter storms | (4) | | — | | (4) | | | 19 | | 5 | | 24 | | |
| | | | | | | | |
| | | | | | | | |
| Wildfires | — | | 3 | | 3 | | | — | | 3 | | 3 | | |
| | | | | | | | |
| | | | | | | | |
| Ukraine conflict [1] | — | | — | | — | | | 23 | | — | | 23 | | |
| Other international | 2 | | — | | 2 | | | 2 | | — | | 2 | | |
| | | | | | | | |
| Catastrophes before assumed reinsurance | 52 | | 56 | | 108 | | | 115 | | 73 | | 188 | | |
| Global assumed reinsurance business [1] [2] | 15 | | — | | 15 | | | 33 | | — | | 33 | | |
| Total catastrophe losses | $ | 67 | | $ | 56 | | $ | 123 | | | $ | 148 | | $ | 73 | | $ | 221 | | |
| | | | | | | | |
| | | | | | | | |
[1]Total catastrophe losses resulting from the Ukraine conflict were $27, net of reinsurance, including $4 within global assumed reinsurance for the six months ended June 30, 2022, all in the first quarter.
[2]Catastrophe losses incurred on global assumed reinsurance business are not covered under the Company's aggregate property catastrophe treaty. For further information on the treaty, refer to Enterprise Risk Management — Insurance Risk section of this MD&A.
Part I - Item 2. Management's Discussion and Analysis of Financial Condition and Results of Operations
| | | | | | | | | | | | | | |
| | | | |
Unfavorable (Favorable) Prior Accident Year Development for the
Three Months Ended June 30, 2022 |
| | Commercial Lines | Personal
Lines | Property & Casualty Other Operations | Total Property & Casualty Insurance |
| Workers’ compensation | $ | (40) | | $ | — | | $ | — | | $ | (40) | |
| Workers’ compensation discount accretion | 9 | | — | | — | | 9 | |
| General liability | (10) | | — | | 31 | | 21 | |
| Marine | (3) | | — | | — | | (3) | |
| Package business | (13) | | — | | — | | (13) | |
| Commercial property | (6) | | — | | — | | (6) | |
| Professional liability | (9) | | — | | — | | (9) | |
| Bond | (4) | | — | | — | | (4) | |
| Assumed reinsurance | — | | — | | — | | — | |
| Automobile liability | 12 | | — | | — | | 12 | |
| Homeowners | — | | — | | — | | — | |
| | | | |
| | | | |
Net asbestos and environmental ("A&E") reserves | — | | — | | — | | — | |
| Catastrophes | (26) | | (1) | | — | | (27) | |
| Uncollectible reinsurance | — | | — | | 6 | | 6 | |
| Other reserve re-estimates, net | 2 | | 1 | | (7) | | (4) | |
| | | | |
| | | | |
Total prior accident year development | $ | (88) | | $ | — | | $ | 30 | | $ | (58) | |
| | | | | | | | | | | | | | |
Unfavorable (Favorable) Prior Accident Year Development for the
Six Months Ended June 30, 2022 |
| Commercial Lines | Personal
Lines | Property & Casualty Other Operations | Total Property & Casualty Insurance |
| Workers’ compensation | $ | (85) | | $ | — | | $ | — | | $ | (85) | |
| Workers’ compensation discount accretion | 18 | | — | | — | | 18 | |
| General liability | 2 | | — | | 31 | | 33 | |
| Marine | (3) | | — | | — | | (3) | |
| Package business | (24) | | — | | — | | (24) | |
| Commercial property | (21) | | — | | — | | (21) | |
| Professional liability | (9) | | — | | — | | (9) | |
| Bond | (4) | | — | | — | | (4) | |
| Assumed reinsurance | 12 | | — | | — | | 12 | |
| Automobile liability | 12 | | (5) | | — | | 7 | |
| Homeowners | — | | — | | — | | — | |
| | | | |
| | | | |
| Net asbestos and environmental reserves | — | | — | | — | | — | |
| Catastrophes | (29) | | (1) | | — | | (30) | |
| Uncollectible reinsurance | — | | — | | 6 | | 6 | |
| Other reserve re-estimates, net | 10 | | 3 | | (7) | | 6 | |
| | | | |
| | | | |
| Total prior accident year development | $ | (121) | | $ | (3) | | $ | 30 | | $ | (94) | |
Part I - Item 2. Management's Discussion and Analysis of Financial Condition and Results of Operations
| | | | | | | | | | | | | | | |
| Rollforward of Property and Casualty Insurance Product Liabilities for Unpaid Losses and LAE for the Six Months Ended June 30, 2021 |
| | Commercial
Lines | Personal Lines | Property & Casualty Other Operations | | Total Property & Casualty Insurance |
| Beginning liabilities for unpaid losses and loss adjustment expenses, gross | $ | 25,058 | | $ | 1,836 | | $ | 2,728 | | | $ | 29,622 | |
| Reinsurance and other recoverables | 4,271 | | 28 | | 1,426 | | | 5,725 | |
| Beginning liabilities for unpaid losses and loss adjustment expenses, net | 20,787 | | 1,808 | | 1,302 | | | 23,897 | |
| | | | | |
| Provision for unpaid losses and loss adjustment expenses | | | | | |
| Current accident year before catastrophes | 2,635 | | 861 | | — | | | 3,496 | |
| Current accident year catastrophes | 268 | | 74 | | — | | | 342 | |
| Prior accident year development [1] | 133 | | (86) | | 33 | | | 80 | |
| Total provision for unpaid losses and loss adjustment expenses | 3,036 | | 849 | | 33 | | | 3,918 | |
| Change in deferred gain on retroactive reinsurance included in other liabilities [1] | (45) | | — | | — | | | (45) | |
| Payments | (2,112) | | (896) | | (78) | | | (3,086) | |
| | | | | |
| Foreign currency adjustment | (7) | | — | | — | | | (7) | |
| Ending liabilities for unpaid losses and loss adjustment expenses, net | 21,659 | | 1,761 | | 1,257 | | | 24,677 | |
| Reinsurance and other recoverables | 4,456 | | 35 | | 1,414 | | | 5,905 | |
| Ending liabilities for unpaid losses and loss adjustment expenses, gross | $ | 26,115 | | $ | 1,796 | | $ | 2,671 | | | $ | 30,582 | |
| Earned premiums and fee income | $ | 4,596 | | $ | 1,488 | | | | |
| Loss and loss expense paid ratio [2] | 46.0 | | 60.2 | | | | |
| Loss and loss expense incurred ratio | 66.3 | | 57.7 | | | | |
| Prior accident year development (pts) [3] | 2.9 | | (5.8) | | | | |
[1]Prior accident year development does not include the benefit of a portion of losses ceded under the Navigators and A&E Adverse Development Cover ("ADC") which, under retroactive reinsurance accounting, is deferred and is recognized over the period the ceded losses are recovered in cash from National Indemnity Company ("NICO"), a subsidiary of Berkshire Hathaway Inc. For additional information regarding the two adverse development cover reinsurance agreements, refer to Note 9 - Reserve for Unpaid Losses and Loss Adjustment Expenses of Notes to Condensed Consolidated Financial Statements.
[2]The “loss and loss expense paid ratio” represents the ratio of paid losses and loss adjustment expenses to earned premiums and fee income.
[3]“Prior accident year development (pts)” represents the ratio of prior accident year development to earned premiums.
| | | | | | | | | | | | | | | | | | | | | | | |
| Current Accident Year Catastrophe Losses, Net of Reinsurance |
| Three Months Ended June 30, 2021 | | Six Months Ended June 30, 2021 |
| Commercial Lines | Personal
Lines | Total | | Commercial Lines | Personal
Lines | Total |
| Wind and hail | $ | 77 | | $ | 38 | | $ | 115 | | | $ | 98 | | $ | 55 | | $ | 153 | |
| | | | | | | |
| | | | | | | |
| | | | | | | |
| | | | | | | |
| | | | | | | |
| | | | | | | |
| Winter storms [1] | 9 | | (4) | | 5 | | | 154 | | 18 | | 172 | |
| Tropical Storms | 1 | | 1 | | 2 | | | 1 | | 1 | | 2 | |
| Catastrophes before assumed reinsurance | 87 | | 35 | | 122 | | | 253 | | 74 | | 327 | |
| Global assumed reinsurance business [2] | 6 | | — | | 6 | | | 15 | | — | | 15 | |
| Total catastrophe losses | $ | 93 | | $ | 35 | | $ | 128 | | | $ | 268 | | $ | 74 | | $ | 342 | |
| | | | | | | |
| | | | | | | |
| | | | | | | |
| | | | | | | |
| | | | | | | |
| | | | | | | |
| | | | | | | |
| | | | | | | |
[1]Includes catastrophe losses from the February winter storms in Texas and other areas within Commercial Lines and Personal Lines of $210 and $24, respectively, gross of reinsurance, and $154 and $18, respectively, net of reinsurance under the Company's per occurrence property catastrophe treaty covering events other than earthquakes and named hurricanes and tropical storms. The reinsurance covers 70% of up to $250 of losses in excess of $100 from such events occurring within a seven day time period, subject to a $50 annual aggregate deductible. For further information on the treaty, refer to Enterprise Risk Management — Insurance Risk section of this MD&A.
[2]Catastrophe losses incurred on global assumed reinsurance business are not covered under the Company's aggregate property catastrophe treaty. For further information on the treaty, refer to Enterprise Risk Management — Insurance Risk section of this MD&A.
Part I - Item 2. Management's Discussion and Analysis of Financial Condition and Results of Operations
| | | | | | | | | | | | | | |
Unfavorable (Favorable) Prior Accident Year Development for the
Three Months Ended June 30, 2021 |
| | Commercial Lines | Personal Lines | Property & Casualty Other Operations | Total Property & Casualty Insurance |
| Workers’ compensation | $ | (43) | | $ | — | | $ | — | | $ | (43) | |
| Workers’ compensation discount accretion | 9 | | — | | — | | 9 | |
| General liability | — | | — | | — | | — | |
| Marine | (5) | | — | | — | | (5) | |
| Package business | (19) | | — | | — | | (19) | |
| Commercial property | (7) | | — | | — | | (7) | |
| Professional liability | (6) | | — | | — | | (6) | |
| Bond | (14) | | — | | — | | (14) | |
| Assumed Reinsurance | (2) | | — | | — | | (2) | |
| Automobile liability | — | | (20) | | — | | (20) | |
| Homeowners | — | | 4 | | — | | 4 | |
| | | | |
| | | | |
| Net asbestos and environmental reserves | — | | — | | — | | — | |
| Catastrophes | (53) | | (29) | | — | | (82) | |
| Uncollectible reinsurance | — | | — | | (1) | | (1) | |
| Other reserve re-estimates, net | (4) | | 1 | | 1 | | (2) | |
Prior accident year development before change in deferred gain | (144) | | (44) | | — | | (188) | |
| Change in deferred gain on retroactive reinsurance included in other liabilities | 39 | | — | | — | | 39 | |
Total prior accident year development | $ | (105) | | $ | (44) | | $ | — | | $ | (149) | |
| | | | | | | | | | | | | | |
Unfavorable (Favorable) Prior Accident Year Development for the
Six Months Ended June 30, 2021 |
| Commercial Lines | Personal Lines | Property & Casualty Other Operations | Total Property & Casualty Insurance |
| Workers’ compensation | $ | (83) | | $ | — | | $ | — | | $ | (83) | |
| Workers’ compensation discount accretion | 18 | | — | | — | | 18 | |
| General liability | 307 | | — | | — | | 307 | |
| Marine | 1 | | — | | — | | 1 | |
| Package business | (46) | | — | | — | | (46) | |
| Commercial property | (20) | | — | | — | | (20) | |
| Professional liability | (7) | | — | | — | | (7) | |
| Bond | (14) | | — | | — | | (14) | |
| Assumed reinsurance | — | | — | | — | | — | |
| Automobile liability | — | | (43) | | — | | (43) | |
| Homeowners | — | | 1 | | — | | 1 | |
| | | | |
| | | | |
| Net asbestos and environmental reserves | — | | — | | — | | — | |
| Catastrophes | (57) | | (41) | | — | | (98) | |
| Uncollectible reinsurance | (5) | | — | | (5) | | (10) | |
| Other reserve re-estimates, net | (6) | | (3) | | 38 | | 29 | |
| Total prior accident year development | 88 | | (86) | | 33 | | 35 | |
| Change in deferred gain on retroactive reinsurance included in other liabilities | 45 | | — | | — | | 45 | |
| Total prior accident year development | $ | 133 | | $ | (86) | | $ | 33 | | $ | 80 | |
For discussion of the factors contributing to unfavorable (favorable) prior accident year reserve development for both the 2022 and 2021 periods, please refer to Note 9 - Reserve for Unpaid Losses and Loss Adjustment Expenses of Notes to Condensed Consolidated Financial Statements.
Part I - Item 2. Management's Discussion and Analysis of Financial Condition and Results of Operations
| | |
SEGMENT OPERATING SUMMARIES |
| | |
|COMMERCIAL LINES - RESULTS OF OPERATIONS |
Underwriting Summary
| | | | | | | | | | | | | | | | | | | | | | | |
| Three Months Ended June 30, | | Six Months Ended June 30, |
| 2022 | 2021 | Change | | 2022 | 2021 | Change |
| Written premiums | $ | 2,836 | | $ | 2,494 | | 14 | % | | $ | 5,645 | | $ | 4,997 | | 13 | % |
| Change in unearned premium reserve | 221 | | 150 | | 47 | % | | 544 | | 418 | | 30 | % |
| Earned premiums | 2,615 | | 2,344 | | 12 | % | | 5,101 | | 4,579 | | 11 | % |
| Fee income | 10 | | 8 | | 25 | % | | 19 | | 17 | | 12 | % |
| Losses and loss adjustment expenses | | | | | | | |
| Current accident year before catastrophes | 1,467 | | 1,339 | | 10 | % | | 2,862 | | 2,635 | | 9 | % |
| Current accident year catastrophes [1] | 67 | | 93 | | (28 | %) | | 148 | | 268 | | (45 | %) |
| Prior accident year development [1] | (88) | | (105) | | 16 | % | | (121) | | 133 | | (191 | %) |
| Total losses and loss adjustment expenses | 1,446 | | 1,327 | | 9 | % | | 2,889 | | 3,036 | | (5 | %) |
| Amortization of deferred policy acquisition costs | 385 | | 346 | | 11 | % | | 756 | | 690 | | 10 | % |
| Underwriting expenses | 447 | | 405 | | 10 | % | | 872 | | 799 | | 9 | % |
| Amortization of other intangible assets | 7 | | 7 | | — | % | | 14 | | 14 | | — | % |
| Dividends to policyholders | 7 | | 6 | | 17 | % | | 14 | | 12 | | 17 | % |
| | | | | | | |
| Underwriting gain | 333 | | 261 | | 28 | % | | 575 | | 45 | | NM |
| Net servicing income | — | | 7 | | (100 | %) | | 1 | | 9 | | (89 | %) |
| Net investment income [2] | 356 | | 382 | | (7 | %) | | 689 | | 709 | | (3 | %) |
| Net realized gains (losses) [2] | (198) | | 47 | | NM | | (289) | | 91 | | NM |
| | | | | | | |
| Other expenses | (1) | | (6) | | 83 | % | | (8) | | (10) | | 20 | % |
| Income before income taxes | 490 | | 691 | | (29 | %) | | 968 | | 844 | | 15 | % |
| Income tax expense [3] | 101 | | 122 | | (17 | %) | | 196 | | 146 | | 34 | % |
| Net income | $ | 389 | | $ | 569 | | (32 | %) | | $ | 772 | | $ | 698 | | 11 | % |
[1]For additional information on current accident year catastrophes and prior accident year development, see MD&A - Critical Accounting Estimates, Property and Casualty Insurance Product Reserves Development, Net of Reinsurance and Note 9 - Reserve for Unpaid Losses and Loss Adjustment Expenses of Notes to Condensed Consolidated Financial Statements.
[2]For discussion of consolidated investment results, see MD&A - Investment Results.
[3]For discussion of income taxes, see Note 12 - Income Taxes of Notes to Condensed Consolidated Financial Statements.
Part I - Item 2. Management's Discussion and Analysis of Financial Condition and Results of Operations
Premium Measures
| | | | | | | | | | | | | | | | | |
| Three Months Ended June 30, | | Six Months Ended June 30, |
| 2022 | 2021 | | 2022 | 2021 |
| Small Commercial: | | | | | |
| Net new business premium | $ | 201 | | $ | 170 | | | $ | 387 | | $ | 346 | |
| Policy count retention [1] | 85 | % | 84 | % | | 86 | % | 84 | % |
| | | | | |
| Renewal written price increases | 3.2 | % | 3.1 | % | | 3.2 | % | 2.7 | % |
| Renewal earned price increases | 3.4 | % | 2.3 | % | | 3.3 | % | 2.3 | % |
| Policies in-force as of end of period (in thousands) | 1,395 | | 1,329 | | | | |
| Middle Market [2]: | | | | | |
| Net new business premium | $ | 130 | | $ | 147 | | | $ | 250 | | $ | 269 | |
| Policy count retention [1] | 84 | % | 82 | % | | 84 | % | 81 | % |
| | | | | |
| Renewal written price increases | 4.3 | % | 6.2 | % | | 4.5 | % | 6.2 | % |
| Renewal earned price increases | 5.5 | % | 7.6 | % | | 5.7 | % | 7.8 | % |
| | | | | |
| | | | | |
| Global Specialty: | | | | | |
| Global specialty gross new business premium [3] | $ | 226 | | $ | 237 | | | $ | 432 | | $ | 453 | |
| Renewal written price increases [4] | 5.5 | % | 13.4 | % | | 6.7 | % | 15.1 | % |
| | | | | |
| Renewal earned price increases [4] | 9.5 | % | 22.8 | % | | 10.7 | % | 23.5 | % |
| | | | | |
| | | | | |
| | | | | |
[1]Policy count retention represents the ratio of the number of renewal policies issued during the current year period divided by the number of policies issued in the previous calendar year period before considering policies cancelled subsequent to renewal.
[2]Except for net new business premium, metrics for middle market exclude loss sensitive and programs businesses.
[3]Excludes Global Re and Continental Europe Operations and is before ceded reinsurance.
[4]Excludes Global Re, offshore energy policies, credit and political risk insurance policies, political violence and terrorism policies, and any business under which the managing agent of our Lloyd's Syndicate delegates underwriting authority to coverholders and other third parties.
Underwriting Ratios
| | | | | | | | | | | | | | | | | | | | | | | |
| Three Months Ended June 30, | | Six Months Ended June 30, |
| 2022 | 2021 | Change | | 2022 | 2021 | Change |
| Loss and loss adjustment expense ratio | | | | | | | |
| Current accident year before catastrophes | 56.1 | | 57.1 | | (1.0) | | | 56.1 | | 57.5 | | (1.4) | |
| Current accident year catastrophes | 2.6 | | 4.0 | | (1.4) | | | 2.9 | | 5.9 | | (3.0) | |
| Prior accident year development | (3.4) | | (4.5) | | 1.1 | | | (2.4) | | 2.9 | | (5.3) | |
| Total loss and loss adjustment expense ratio | 55.3 | | 56.6 | | (1.3) | | | 56.6 | | 66.3 | | (9.7) | |
| Expense ratio | 31.7 | | 32.0 | | (0.3) | | | 31.8 | | 32.5 | | (0.7) | |
| Policyholder dividend ratio | 0.3 | | 0.3 | | — | | | 0.3 | | 0.3 | | — | |
| Combined ratio | 87.3 | | 88.9 | | (1.6) | | | 88.7 | | 99.0 | | (10.3) | |
| Impact of current accident year catastrophes and prior year development | 0.8 | | 0.5 | | 0.3 | | | (0.5) | | (8.8) | | 8.3 | |
| | | | | | | |
| Underlying combined ratio | 88.1 | | 89.4 | | (1.3) | | | 88.2 | | 90.3 | | (2.1) | |
Part I - Item 2. Management's Discussion and Analysis of Financial Condition and Results of Operations
Net Income
Three and six months ended June 30, 2022 compared to the three and six months ended June 30, 2021
Net income for the three months ended June 30, 2022 decreased primarily due to a change from net realized gains to net realized losses and lower net investment income, partially offset by a higher underwriting gain.
Net income for the six months ended June 30, 2022 increased primarily due to a higher underwriting gain, partially offset by a change from net realized gains to net realized losses and, to a lesser extent, lower net investment income. For further discussion of investment results, see MD&A - Investment Results.
Underwriting Gain
Three and six months ended June 30, 2022 compared to the three and six months ended June 30, 2021
Underwriting gain increased for the three month period ended June 30, 2022 compared to the prior year three month period with the improvement primarily due to the effect of earned premium growth, a decrease in the current accident year loss and loss adjustment expense ratio before catastrophes and lower current accident year catastrophes, partially offset by lower favorable prior accident year development and an increase in underwriting expenses.
Underwriting gain increased for the six month period ended June 30, 2022 compared to the prior year six month period with the improvement primarily due to a change from unfavorable prior accident year development in the prior year period to favorable prior accident year development in the current year period, the effect of earned premium growth, lower current accident year catastrophes and a decrease in the current accident year loss and loss adjustment expense ratio before catastrophes, partially offset by an increase in underwriting expenses.
Underwriting expenses increased in both periods due to higher staffing and technology costs, higher performance-based commissions and a decrease in the allowance for credit losses on premiums receivable in the 2021 period, partially offset by incremental savings from Hartford Next initiatives.
Earned Premiums
[1]Other earned premiums of $11 and $13, for the three months ended June 30, 2021, and 2022, respectively, and $22 and $24 for the six months ended June 30, 2021, and 2022, respectively is included in the total.
Part I - Item 2. Management's Discussion and Analysis of Financial Condition and Results of Operations
Written Premiums
[1]Other written premiums of $11 and $12, for the three months ended June 30, 2021, and 2022, respectively, and $21 and $24 for the six months ended June 30, 2021, and 2022 is included in the total.
Three and six months ended June 30, 2022 compared to the three and six months ended June 30, 2021
Earned premiums for the three and six month periods increased in 2022 due to written premium increases over the prior 12 months as well as due to higher premiums from audits and endorsements, principally in workers’ compensation due to an increasing exposure base from higher payrolls.
Written premiums for the three and six month periods increased in 2022 driven by growth across small commercial, middle & large commercial and global specialty.
•Small commercial written premium increased in both periods driven by exposure growth from higher audit and endorsement premium, new business growth, higher policy count retention, and renewal written pricing increases in all lines. Written premium grew in all lines of business, with the most significant growth in workers' compensation and package business.
•Middle & large commercial written premium increased in both periods driven by renewal written pricing increases in all lines, improved policy count retention and higher audit and endorsement premium, partially offset by a decline in new business. Written premium grew in most lines of business, including general industries, national accounts and programs business.
•Global specialty written premium increased in both periods driven by written pricing increases and for the six month period, higher retention, partially offset by a decline in new
business. Written premium grew in all lines except international, with the most significant growth in global reinsurance, U.S. wholesale and financial lines.
Renewal written pricing increases were recognized in nearly all lines in the three and six month periods, with moderating price increases across most lines in middle market and global specialty.
•In small commercial, renewal written price increases were modestly higher in both the three and six month periods, with workers' compensation pricing slightly positive in 2022 due to rising wages offset by lower rates, along with mid-single digit increases in most other lines.
•In middle market, the Company recognized mid single-digit increases in most lines other than workers’ compensation, which experienced slightly positive written pricing increases as the effect of higher wages offset lower rates.
•In global specialty, we achieved mid single-digit renewal written pricing increases, with increases in marine, property, excess casualty and U.S. financial products and, for the three month period, a slight decrease in written pricing in international lines.
Current Accident Year Loss and LAE Ratio before Catastrophes
Three and six months ended June 30, 2022 compared to the three and six months ended June 30, 2021
Current accident year loss and LAE ratio before catastrophes decreased in both the three and six month periods primarily due to lower loss ratios in global specialty lines, workers’ compensation, general liability and programs and, for the six month period, lower COVID-19 incurred losses, partially offset by higher non-cat property losses, primarily in middle market.
In the six month period, the lower loss ratio in global specialty was partially offset by the effect on the ratio of $11 before tax in reinstatement premium owed to reinsurers related to ceding Ukraine conflict losses and a large ocean marine loss from an oil spill off the coast of Peru.
There were no COVID-19 incurred losses in the three and six months ended June 30, 2022 compared to $3 and $27 of COVID-19 incurred losses in the three and six months ended June 30, 2021, with losses in the six month period of 2021
Part I - Item 2. Management's Discussion and Analysis of Financial Condition and Results of Operations
including $20 in workers’ compensation and $7 in financial and other lines.
Catastrophes and Unfavorable (Favorable) Prior Accident Year Development
Three and six months ended June 30, 2022 compared to the three and six months ended June 30, 2021
Current accident year catastrophe losses for the three months ended June 30, 2022 included losses from tornado, wind and hail events primarily in the South, Midwest and Central Plains.
Current accident year catastrophe losses for the three months ended June 30, 2021 included mostly tornado, wind and hail events, mainly concentrated in Texas and the Southeast.
Current accident year catastrophe losses for the six months ended June 30, 2022 included losses from tornado, wind and hail events primarily in the South, Midwest and Central Plains, winter storms along the East Coast and $27 of losses, net of reinsurance, related to the Ukraine conflict.
Current accident year catastrophe losses net of reinsurance for the six months ended June 30, 2021 included losses from February winter storms primarily in the South, with the remaining losses largely from tornado, wind and hail events, mostly concentrated in Texas, the Southeast and along the Pacific coast.
Prior accident year development was net favorable for the three and six months ended June 30, 2022. Reserve development in the 2022 periods included reserve decreases for workers' compensation, catastrophes, package business and commercial property, partially offset by reserve increases for automobile liability and, for the six month period, assumed reinsurance. In the three and six month periods, an increase in reserves for general liability related to excess casualty and primary construction was largely offset by a reallocation of a portion of reserves for sexual molestation and sexual abuse claims from Commercial Lines to P&C Other Operations. The reallocated reserves relate to excess liability policies written by a legal entity in P&C Other Operations for amounts owed to claimants under the agreement in principle reached with BSA on sexual molestation and sexual abuse claims in third quarter 2021. In total for the Company, there was no change in the liability for settlement amounts owed on BSA claims. The six months ended June 30, 2022 also included reserve decreases for professional liability.
Prior accident year development was net favorable for the three months ended June 30, 2021 and was net unfavorable for the six month period ended June 30, 2021. Reserve development in the 2021 periods included reserve decreases for catastrophes, workers' compensation, package business, commercial property and bond, partially offset by professional liability reserve increases related to Navigators Group on 2018 and prior accident years and, for the six month period, an increase in general liability that included a reserve increase related to the settlement with Boy Scouts of America on sexual molestation and sexual abuse claims.
Prior accident year development in the 2021 periods included reserve increases related to Navigators Group on 2018 and prior accident years that was economically ceded to NICO but for which the benefit was not recognized in earnings as it has been recorded as a deferred gain on retroactive reinsurance.
Part I - Item 2. Management's Discussion and Analysis of Financial Condition and Results of Operations
| | |
|PERSONAL LINES - RESULTS OF OPERATIONS |
Underwriting Summary
| | | | | | | | | | | | | | | | | | | | | | | |
| Three Months Ended June 30, | | Six Months Ended June 30, |
| 2022 | 2021 | Change | | 2022 | 2021 | Change |
| Written premiums | $ | 756 | | $ | 760 | | (1 | %) | | $ | 1,463 | | $ | 1,475 | | (1 | %) |
| Change in unearned premium reserve | 30 | | 22 | | 36 | % | | 17 | | 3 | | NM |
| Earned premiums | 726 | | 738 | | (2 | %) | | 1,446 | | 1,472 | | (2 | %) |
| Fee income | 7 | | 8 | | (13 | %) | | 15 | | 16 | | (6 | %) |
| Losses and loss adjustment expenses | | | | | | | |
| Current accident year before catastrophes | 477 | | 447 | | 7 | % | | 915 | | 861 | | 6 | % |
| Current accident year catastrophes [1] | 56 | | 35 | | 60 | % | | 73 | | 74 | | (1 | %) |
| Prior accident year development [1] | — | | (44) | | 100 | % | | (3) | | (86) | | 97 | % |
| Total losses and loss adjustment expenses | 533 | | 438 | | 22 | % | | 985 | | 849 | | 16 | % |
| Amortization of DAC | 56 | | 58 | | (3 | %) | | 113 | | 116 | | (3 | %) |
| Underwriting expenses | 157 | | 154 | | 2 | % | | 306 | | 302 | | 1 | % |
| Amortization of other intangible assets | — | | — | | — | % | | 1 | | 1 | | — | % |
| Underwriting gain (loss) | (13) | | 96 | | (114 | %) | | 56 | | 220 | | (75 | %) |
| Net servicing income [2] | 4 | | 5 | | (20 | %) | | 8 | | 9 | | (11 | %) |
| Net investment income [3] | 35 | | 40 | | (13 | %) | | 68 | | 75 | | (9 | %) |
| Net realized gains (losses) [3] | (18) | | 6 | | NM | | (27) | | 13 | | NM |
| Other income (expenses) | (1) | | — | | NM | | (1) | | — | | NM |
| Income before income taxes | 7 | | 147 | | (95 | %) | | 104 | | 317 | | (67 | %) |
| Income tax expense [4] | 1 | | 29 | | (97 | %) | | 21 | | 64 | | (67 | %) |
| Net income | $ | 6 | | $ | 118 | | (95 | %) | | $ | 83 | | $ | 253 | | (67) | % |
[1]For additional information on current accident year catastrophes and prior accident year development, see MD&A - Critical Accounting Estimates, Property & Casualty Insurance Product Reserves, Net of Reinsurance and Note 9 - Reserve for Unpaid Losses and Loss Adjustment Expenses of Notes to Condensed Consolidated Financial Statements.
[2]Includes servicing revenues of $19 and $21 for the three months ended June 30, 2022 and 2021, respectively, and $36 and $40 for the six months ended June 30, 2022 and 2021, respectively. Includes servicing expenses of $15 and $16 for the three months ended June 30, 2022 and 2021, respectively, and $28 and $31 for the six months ended June 30, 2022 and 2021, respectively.
[3]For discussion of consolidated investment results, see MD&A - Investment Results.
[4]For discussion of income taxes, see Note 12 - Income Taxes of Notes to Condensed Consolidated Financial Statements.
Written and Earned Premiums
| | | | | | | | | | | | | | | | | | | | | | | |
| Three Months Ended June 30, | | Six Months Ended June 30, |
| Written Premiums | 2022 | 2021 | Change | | 2022 | 2021 | Change |
| Product Line | | | | | | | |
| Automobile | $ | 509 | | $ | 515 | | (1 | %) | | $ | 1,006 | | $ | 1,023 | | (2 | %) |
| Homeowners | 247 | | 245 | | 1 | % | | 457 | | 452 | | 1 | % |
| Total | $ | 756 | | $ | 760 | | (1 | %) | | $ | 1,463 | | $ | 1,475 | | (1 | %) |
| Earned Premiums | | | | | | | |
| Product Line | | | | | | | |
| Automobile | $ | 497 | | $ | 509 | | (2 | %) | | $ | 990 | | $ | 1,016 | | (3 | %) |
| Homeowners | 229 | | 229 | | — | % | | 456 | | 456 | | — | % |
| Total | $ | 726 | | $ | 738 | | (2 | %) | | $ | 1,446 | | $ | 1,472 | | (2 | %) |
Part I - Item 2. Management's Discussion and Analysis of Financial Condition and Results of Operations
Premium Measures
| | | | | | | | | | | | | | | | | |
| Three Months Ended June 30, | | Six Months Ended June 30, |
| Premium Measures | 2022 | 2021 | | 2022 | 2021 |
| Policies in-force end of period (in thousands) | | | | | |
| Automobile | | | | 1,315 | | 1,339 | |
| Homeowners | | | | 756 | | 799 | |
| Net new business premium | | | | | |
| Automobile | $ | 57 | | $ | 56 | | | $ | 115 | | $ | 109 | |
| Homeowners | $ | 19 | | $ | 16 | | | $ | 34 | | $ | 29 | |
| Policy count retention [1] | | | | | |
| Automobile | 84 | % | 85 | % | | 84 | % | 85 | % |
| Homeowners | 84 | % | 85 | % | | 84 | % | 85 | % |
| | | | | |
| | | | | |
| | | | | |
| Renewal written price increase | | | | | |
| Automobile | 4.1 | % | 2.3 | % | | 3.5 | % | 2.1 | % |
| Homeowners | 9.0 | % | 8.6 | % | | 8.9 | % | 8.9 | % |
| Renewal earned price increase | | | | | |
| Automobile | 2.7 | % | 2.0 | % | | 2.5 | % | 2.1 | % |
| Homeowners | 8.4 | % | 8.1 | % | | 8.4 | % | 7.6 | % |
| | | | | |
| | | | | |
| | | | | |
[1]Policy count retention represents the ratio of the number of renewal policies issued during the current year period divided by the number of policies issued in the previous calendar period before considering policies cancelled subsequent to renewal.
Underwriting Ratios
| | | | | | | | | | | | | | | | | | | | | | | |
| Three Months Ended June 30, | | Six Months Ended June 30, |
| Underwriting Ratios | 2022 | 2021 | Change | | 2022 | 2021 | Change |
| Loss and loss adjustment expense ratio | | | | | | | |
| Current accident year before catastrophes | 65.7 | | 60.6 | | 5.1 | | | 63.3 | | 58.5 | | 4.8 | |
| Current accident year catastrophes | 7.7 | | 4.7 | | 3.0 | | | 5.0 | | 5.0 | | — | |
| Prior year development | — | | (6.0) | | 6.0 | | | (0.2) | | (5.8) | | 5.6 | |
| Total loss and loss adjustment expense ratio | 73.4 | | 59.3 | | 14.1 | | | 68.1 | | 57.7 | | 10.4 | |
| Expense ratio | 28.4 | | 27.6 | | 0.8 | | | 28.0 | | 27.4 | | 0.6 | |
| Combined ratio | 101.8 | | 87.0 | | 14.8 | | | 96.1 | | 85.1 | | 11.0 | |
| Impact of current accident year catastrophes and prior year development | (7.7) | | 1.3 | | (9.0) | | | (4.8) | | 0.8 | | (5.6) | |
| Underlying combined ratio | 94.1 | | 88.2 | | 5.9 | | | 91.3 | | 85.9 | | 5.4 | |
Product Combined Ratios
| | | | | | | | | | | | | | | | | | | | | | | |
| Three Months Ended June 30, | | Six Months Ended June 30, |
| 2022 | 2021 | Change | | 2022 | 2021 | Change |
| Automobile | | | | | | | |
| Combined ratio | 101.2 | | 89.2 | | 12.0 | | | 97.0 | | 86.3 | | 10.7 | |
| Underlying combined ratio | 100.0 | | 92.1 | | 7.9 | | | 96.7 | | 89.2 | | 7.5 | |
| Homeowners | | | | | | | |
| Combined ratio | 103.1 | | 82.0 | | 21.1 | | | 94.2 | | 84.4 | | 9.8 | |
| Underlying combined ratio | 82.0 | | 79.2 | | 2.8 | | | 79.7 | | 78.2 | | 1.5 | |
Part I - Item 2. Management's Discussion and Analysis of Financial Condition and Results of Operations
Net Income
Three and six months ended June 30, 2022 compared to the three and six months ended June 30, 2021
Net income decreased in the three and six month periods ended June 30, 2022, largely driven by a decrease in underwriting results, a change from net realized gains to net realized losses and, to a lesser extent, a decrease in net investment income
Underwriting Gain (Loss)
Three and six months ended June 30, 2022 compared to the three and six months ended June 30, 2021
Underwriting gain (loss) changed from a gain to a loss in the three month period and underwriting gain decreased in the six month period, primarily due to a decrease in net favorable prior accident year reserve development and higher current accident year personal loss costs in both automobile and homeowners, and, for the three month period, an increase in current accident year catastrophe losses.
Underwriting expenses increased slightly in both three and six month periods as higher technology costs were largely offset by incremental cost savings from the Hartford Next initiative.
Earned Premiums
Written Premiums
Three and six months ended June 30, 2022 compared to the three and six months ended June 30, 2021
Earned premiums decreased in both the three and six month periods due to the effect of a decline in written premium over the prior twelve months in both Agency channels and in AARP Direct due to non-renewals exceeding new business, predominantly in automobile.
Written premiums decreased in automobile in both the three and six month periods due to the effect of non-renewed premium exceeding new business, with a decline in policy count
Part I - Item 2. Management's Discussion and Analysis of Financial Condition and Results of Operations
retention partially offset by the effect of written pricing increases and an increase in new business over the comparable 2021 period. Written premiums increased in homeowners primarily due to an increase in new business and the effect of written pricing increases, partially offset by slightly lower policy count retention.
Renewal written pricing increases were higher for automobile in the three and six month periods ended June 30, 2022 in response to recent higher loss cost trends while renewal written pricing increases for homeowners remained in the high single-digits in both the three and six month periods of 2021 and 2022.
Policy count retention was modestly lower for both automobile and homeowners.
Policies in-force decreased in the 2022 period in both automobile and homeowners driven by not generating enough new business to offset the loss of non-renewed policies.
Current Accident Year Loss and LAE Ratio before Catastrophes
Three and six months ended June 30, 2022 compared to the three and six months ended June 30, 2021
Current accident year Loss and LAE ratio before catastrophes increased in both automobile and homeowners in both the three and six month periods. The increase in automobile was due to an increase in average claim severity and, for the six month period, higher claim frequency driven by an increase in miles driven. For homeowners, the increase in the current accident year loss and LAE ratio before catastrophes for the three month period was due to an increase in severity and higher weather claim frequency, partially offset by the effect of earned pricing increases. For the six month period, an increase in homeowners' severity was partially offset by earned pricing increases and lower frequency of weather claims. Contributing to the increase in homeowners severity was the effect of higher rebuilding costs and a shift to non-weather claims, which have higher average severity.
Current Accident Year Catastrophes and Unfavorable (Favorable) Prior Accident Year Development
Three and six months ended June 30, 2022 compared to the three and six months ended June 30, 2021
Current accident year catastrophe losses increased in the three months ended June 30, 2022 compared to the prior year period and were relatively flat for the six month period. Current accident year catastrophe losses for the three and six months ended June 30, 2022 included tornado, wind and hail events primarily in the South, Midwest and Central Plains and, for the six month period, winter storms along the East Coast. Current accident year catastrophe losses for the three months ended June 30, 2021 primarily included losses from wind and hail storms in Texas and the Southeast with catastrophes in the six months ended June 30, 2021 also including February winter storms primarily in the South and wind events on the Pacific Coast.
Prior accident year development was less favorable in the three and six month periods, with lower reserve reductions for automobile liability and prior year catastrophes. Net favorable prior accident year development in the six months ended June 30, 2022 period was primarily driven by automobile liability. Net favorable prior accident year development in the three and six month periods in 2021 was driven mostly by reserve reductions in automobile for the 2017 to 2019 accident years and a reduction in prior accident year catastrophes driven by an expected subrogation recovery related to a 2018 California wildfire.
Part I - Item 2. Management's Discussion and Analysis of Financial Condition and Results of Operations
| | |
|PROPERTY & CASUALTY OTHER OPERATIONS - RESULTS OF OPERATIONS |
Underwriting Summary
| | | | | | | | | | | | | | | | | | | | | | | |
| | Three Months Ended June 30, | | Six Months Ended June 30, |
| 2022 | 2021 | Change | | 2022 | 2021 | Change |
| Losses and loss adjustment expenses | | | | | | | |
| Prior accident year development [1] | $ | 30 | | $ | — | | NM | | $ | 30 | | $ | 33 | | (9 | %) |
| Total losses and loss adjustment expenses | 30 | | — | | NM | | 30 | | 33 | | (9 | %) |
| Underwriting expenses | 2 | | 2 | | — | % | | 5 | | 4 | | 25 | % |
| Underwriting loss | (32) | | (2) | | NM | | (35) | | (37) | | 5 | % |
| Net investment income [2] | 16 | | 20 | | (20 | %) | | 32 | | 36 | | (11 | %) |
| Net realized gains (losses) [2] | (9) | | 3 | | NM | | (13) | | 5 | | NM |
| Income (loss) before income taxes | (25) | | 21 | | NM | | (16) | | 4 | | NM |
| Income tax expense (benefit) [3] | (5) | | 4 | | NM | | (4) | | — | | NM |
| Net income (loss) | $ | (20) | | $ | 17 | | NM | | $ | (12) | | $ | 4 | | NM |
[1]For additional information on prior accident year development, see Note 9 - Reserve for Unpaid Losses and Loss Adjustment Expenses of Notes to Condensed Consolidated Financial Statements.
[2]For discussion of consolidated investment results, see MD&A - Investment Results.
[3]For discussion of income taxes, see Note 12 - Income Taxes of Notes to Condensed Consolidated Financial Statements.
Net income (loss)
Three and six months ended June 30, 2022 compared to the three and six months ended June 30, 2021
Net income (loss) changed to a net loss in the three months ended June 30, 2022 compared to net income in the comparable 2021 period, primarily due to an increase in underwriting loss, a change from net realized gains in the 2021 period to net realized losses in the 2022 period and, to a lesser extent, a decrease in net investment income.
Net income (loss) changed to a net loss in the six months ended June 30, 2022 compared to net income in the comparable 2021 period, primarily due to a change from net realized gains in the 2021 period to net realized losses in the 2022 period.
Underwriting loss increased in the three month period, primarily due to unfavorable prior accident year reserve development in the 2022 period primarily due to reallocating a portion of general liability reserves from Commercial Lines to P&C Other Operations related to sexual molestation and sexual abuse claims. The reallocated reserves relate to excess liability policies written by a legal entity in P&C Other Operations for amounts owed to claimants under the agreement in principle reached with BSA on sexual molestation and sexual abuse claims in third quarter 2021. In total for the Company, there was no change in the liability for settlement amounts owed on BSA claims.
Underwriting loss decreased in the six month period, primarily due to a lower amount of unfavorable prior accident year reserve development in the 2022 period. Unfavorable development in the six months ended June 30, 2022 consisted of the sexual molestation and sexual abuse reserves reallocated from Commercial Lines. Unfavorable reserve development for the six months ended June 30, 2021 primarily consisted of an increase in reserves for sexual molestation and sexual abuse claims, primarily on assumed reinsurance, partially offset by a reduction in the allowance for uncollectible reinsurance.
Asbestos and environmental reserve comprehensive annual reviews will occur in the fourth quarter of 2022. For information on A&E reserves, see MD&A - Critical Accounting Estimates, Asbestos and Environmental Reserves included in the Company's 2021 Form 10-K Annual Report.
Part I - Item 2. Management's Discussion and Analysis of Financial Condition and Results of Operations
| | |
|GROUP BENEFITS - RESULTS OF OPERATIONS |
| | | | | | | | | | | | | | | | | | | | | | | |
Operating Summary |
| Three Months Ended June 30, | | Six Months Ended June 30, |
| 2022 | 2021 | Change | | 2022 | 2021 | Change |
| Premiums and other considerations | $ | 1,517 | | $ | 1,427 | | 6 | % | | $ | 3,007 | | $ | 2,845 | | 6 | % |
| Net investment income [1] | 130 | | 136 | | (4 | %) | | 253 | | 263 | | (4 | %) |
| Net realized gains (losses) [1] | (70) | | 28 | | NM | | (86) | | 47 | | NM |
| Total revenues | 1,577 | | 1,591 | | (1 | %) | | 3,174 | | 3,155 | | 1 | % |
| Benefits, losses and loss adjustment expenses | 1,065 | | 1,019 | | 5 | % | | 2,286 | | 2,215 | | 3 | % |
| Amortization of DAC | 9 | | 10 | | (10 | %) | | 18 | | 21 | | (14 | %) |
| Insurance operating costs and other expenses | 365 | | 340 | | 7 | % | | 732 | | 679 | | 8 | % |
| Amortization of other intangible assets | 10 | | 10 | | — | % | | 20 | | 20 | | — | % |
| Total benefits, losses and expenses | 1,449 | | 1,379 | | 5 | % | | 3,056 | | 2,935 | | 4 | % |
| Income before income taxes | 128 | | 212 | | (40 | %) | | 118 | | 220 | | (46 | %) |
| Income tax expense [2] | 24 | | 42 | | (43 | %) | | 20 | | 41 | | (51 | %) |
| Net income | $ | 104 | | $ | 170 | | (39 | %) | | $ | 98 | | $ | 179 | | (45 | %) |
[1]For discussion of consolidated investment results, see MD&A - Investment Results.
[2]For discussion of income taxes, see Note 12 - Income Taxes of Notes to the Condensed Consolidated Financial Statements.
| | | | | | | | | | | | | | | | | | | | | | | |
Premiums and Other Considerations |
| Three Months Ended June 30, | | Six Months Ended June 30, |
| 2022 | 2021 | Change | | 2022 | 2021 | Change |
| Fully insured – ongoing premiums | $ | 1,469 | | $ | 1,378 | | 7 | % | | $ | 2,907 | | $ | 2,750 | | 6 | % |
| Buyout premiums | — | | — | | — | % | | 7 | | 2 | | NM |
| Fee income | 48 | | 49 | | (2 | %) | | 93 | | 93 | | — | % |
| Total premiums and other considerations | $ | 1,517 | | $ | 1,427 | | 6 | % | | $ | 3,007 | | $ | 2,845 | | 6 | % |
| Fully insured ongoing sales, excluding buyouts | $ | 204 | | $ | 99 | | 106 | % | | $ | 593 | | $ | 611 | | (3 | %) |
| | | | | | | | | | | | | | | | | | | | | | | |
Ratios, Excluding Buyouts |
| Three Months Ended June 30, | | Six Months Ended June 30, |
| 2022 | 2021 | Change | | 2022 | 2021 | Change |
| Group disability loss ratio | 66.3 | % | 64.2 | % | 2.1 | | 69.7 | % | 66.3 | % | 3.4 |
| Group life loss ratio | 78.9 | % | 83.6 | % | (4.7) | | 88.6 | % | 96.0 | % | (7.4) |
Total loss ratio | 70.2 | % | 71.4 | % | (1.2) | | 76.0 | % | 77.8 | % | (1.8) |
| Expense ratio [1] | 25.2 | % | 25.1 | % | 0.1 | | 25.5 | % | 25.2 | % | 0.3 |
[1]Integration and transaction costs related to the acquisition of Aetna's U.S. group life and disability business are not included in the expense ratio.
| | | | | | | | | | | | | | | | | | | | | | | |
Margin |
| Three Months Ended June 30, | | Six Months Ended June 30, |
| 2022 | 2021 | Change | | 2022 | 2021 | Change |
| Net income margin | 6.6 | % | 10.7 | % | (4.1) | | | 3.1 | % | 5.7 | % | (2.6) | |
| Adjustments to reconcile net income margin to core earnings margin: | | | | | | | |
| Net realized losses (gains) excluded from core earnings, before tax | 4.1 | % | (1.7 | %) | 5.8 | | | 2.6 | % | (1.4 | %) | 4.0 | |
| Integration and other non-recurring M&A costs, before tax | 0.1 | % | 0.1 | % | — | | | 0.1 | % | 0.1 | % | — | |
| Income tax expense (benefit) | (1.0 | %) | 0.4 | % | (1.4) | | | (0.6 | %) | 0.3 | % | (0.9) | |
| | | | | | | |
| Core earnings margin | 9.8 | % | 9.5 | % | 0.3 | | | 5.2 | % | 4.7 | % | 0.5 | |
Part I - Item 2. Management's Discussion and Analysis of Financial Condition and Results of Operations
Net Income
Three and six months ended June 30, 2022 compared to the three and six months ended June 30, 2021
Net income decreased in the three and six months ended June 30, 2022, largely driven by a change from net realized gains in the 2021 period to net realized losses in the 2022 period, higher insurance operating expenses and a decrease in net investment income, partially offset by additional earnings generated by growth in fully insured ongoing premiums and a reduction in the total loss ratio.
Insurance operating costs and other expenses for both the three and six month period were higher as higher claim costs to handle pandemic related claims and an increase in technology costs were partially offset by incremental expense savings from the Hartford Next operational transformation and cost reduction program.
Fully Insured Ongoing Premiums
[1]Other of $79 and $90 for the three months ended June 30, 2021 and 2022, respectively, and $156 and $177 for the six months ended June 30, 2021 and 2022, respectively, which includes other group coverages such as retiree health insurance, critical illness, accident, hospital indemnity and participant accident coverages.
Three and six months ended June 30, 2022 compared to the three and six months ended June 30, 2021
Fully insured ongoing premiums increased primarily in group disability driven by an increase in exposure on existing accounts resulting from increased enrollment, low unemployment, and wage increases, as well as strong persistency.
Fully insured ongoing sales, excluding buyouts, increased in the three month period in both group disability and group life and decreased in the six month period primarily in group disability due to the prior year period benefiting from the expansion of paid medical leave in several states.
Ratios
Three and six months ended June 30, 2022 compared to the three and six months ended June 30, 2021
Total loss ratio decreased 1.2 points for the three-month period reflecting a lower group life loss ratio, partially offset by a higher group disability loss ratio. The group life loss ratio decreased 4.7 points driven by a 4.9 point decrease in excess mortality. For the three-month period ended June 30, 2022 and 2021, the Company recognized excess mortality losses (benefit) of $(5) and $25, respectively. Included in the excess mortality estimate for the three months ended June 30, 2022 and 2021 are estimated losses of $19 and $88, respectively, for the current accident quarter and favorable development of $24 and $63, respectively, on excess mortality estimates related to prior quarters. The disability loss ratio increased 2.1 points primarily due to a lower New York Paid Family Leave risk adjustment benefit with $10 recorded in the 2022 period versus $22 recorded in the 2021 period. A benefit related to COVID-19 impacts of $5 and $6, respectively, was recognized on short-term disability losses for the three months ended June 30, 2022 and 2021.
Total loss ratio decreased 1.8 points for the six-month period reflecting a lower group life loss ratio, partially offset by a higher group disability loss ratio. The group life loss ratio decreased 7.4 points driven by a 9.8 point decrease in excess mortality claims partially offset by a higher loss ratio on accidental death business. For the six-month period ended June 30, 2022 and 2021, excess mortality losses were $91 and $210, respectively. The group disability loss ratio increased 3.4 points primarily due to a lower New York Paid Family Leave risk adjustment benefit
Part I - Item 2. Management's Discussion and Analysis of Financial Condition and Results of Operations
with $9 recorded in the 2022 period versus $22 recorded in the 2021 period, as well as less favorable prior period development on long-term disability as the 2021 period benefited from low incidence levels earlier in the pandemic. COVID-19 related short-term disability losses of $4 and $7, respectively, were recognized in the six months ended June 30, 2022 and 2021.
Expense ratio increased slightly in both the three and six month periods driven by higher claim costs to handle pandemic related claims and an increase in technology costs, partially offset by incremental expense savings from the Hartford Next operational transformation and cost reduction program and higher earned premiums.
| | |
|HARTFORD FUNDS - RESULTS OF OPERATIONS |
Operating Summary
| | | | | | | | | | | | | | | | | | | | | | | |
| Three Months Ended June 30, | | Six Months Ended June 30, |
| 2022 | 2021 | Change | | 2022 | 2021 | Change |
| Fee income and other revenue | $ | 263 | | $ | 296 | | (11 | %) | | $ | 550 | | $ | 578 | | (5 | %) |
| Net investment income | 1 | | — | | NM | | 2 | | 1 | | 100 | % |
| Net realized gains (losses) | (13) | | 2 | | NM | | (22) | | 4 | | NM |
| Total revenues | 251 | | 298 | | (16 | %) | | 530 | | 583 | | (9 | %) |
| Amortization of contingent deferred commissions [1] | 3 | | 3 | | — | % | | 6 | | 6 | | — | % |
| Operating costs and other expenses | 204 | | 228 | | (11 | %) | | 430 | | 452 | | (5 | %) |
| Total benefits, losses and expenses | 207 | | 231 | | (10 | %) | | 436 | | 458 | | (5 | %) |
| Income before income taxes | 44 | | 67 | | (34 | %) | | 94 | | 125 | | (25 | %) |
| Income tax expense [2] | 10 | | 15 | | (33 | %) | | 18 | | 26 | | (31 | %) |
| Net income | $ | 34 | | $ | 52 | | (35 | %) | | $ | 76 | | $ | 99 | | (23 | %) |
| Daily average Hartford Funds AUM | $ | 136,841 | | $ | 150,527 | | (9 | %) | | $ | 143,449 | | $ | 146,866 | | (2 | %) |
| ROA [3] | 9.9 | | 13.8 | | (28 | %) | | 10.6 | | 13.5 | | (21 | %) |
| Adjustment to reconcile ROA to ROA, core earnings: | | | | | | | |
| Effect of net realized losses (gains) excluded from core earnings, before tax | 3.9 | | (0.5) | | NM | | 3.1 | | (0.5) | | NM |
| Effect of income tax expense (benefit) | (0.9) | | 0.3 | | NM | | (0.6) | | 0.1 | | NM |
| ROA, core earnings [3] | 12.9 | | 13.6 | | (5 | %) | | 13.1 | | 13.1 | | — | % |
[1]Reported in amortization of DAC in the Condensed Consolidated Statements of Operations.
[2]For discussion of income taxes, see Note 12 - Income Taxes of Notes to Condensed Consolidated Financial Statements.
[3]Represents annualized earnings divided by a daily average of assets under management, as measured in basis points.
Hartford Funds Segment AUM
| | | | | | | | | | | | | | | | | | | | | | | |
| Three Months Ended June 30, | | Six Months Ended June 30, |
| 2022 | 2021 | Change | | 2022 | 2021 | Change |
| Mutual Fund and ETF AUM - beginning of period | $ | 133,985 | | $ | 130,254 | | 3 | % | | $ | 142,632 | | $ | 124,627 | | 14 | % |
| Sales - Mutual Fund | 7,965 | | 8,654 | | (8 | %) | | 17,443 | | 17,852 | | (2 | %) |
| Redemptions - Mutual Fund | (9,942) | | (6,300) | | (58 | %) | | (19,987) | | (14,728) | | (36 | %) |
| Net flows - ETF | (34) | | 86 | | (140 | %) | | 109 | | 90 | | 21 | % |
| Net flows - Mutual Fund and ETF | (2,011) | | 2,440 | | (182 | %) | | (2,435) | | 3,214 | | (176 | %) |
| Change in market value and other | (16,568) | | 5,817 | | NM | | (24,791) | | 10,670 | | NM |
| Mutual Fund and ETF AUM - end of period | 115,406 | | 138,511 | | (17 | %) | | 115,406 | | 138,511 | | (17 | %) |
Talcott Resolution life and annuity separate account AUM [1] | 11,992 | | 15,282 | | (22 | %) | | 11,992 | | 15,282 | | (22 | %) |
Hartford Funds AUM - end of period | $ | 127,398 | | $ | 153,793 | | (17 | %) | | $ | 127,398 | | $ | 153,793 | | (17 | %) |
[1]Represents AUM of the life and annuity business sold in May 2018 that is still managed by the Company's Hartford Funds segment.
Part I - Item 2. Management's Discussion and Analysis of Financial Condition and Results of Operations
Mutual Fund and ETF AUM by Asset Class | | | | | | | | | | | | | | | |
| | | | | As of June 30, |
| | | | | 2022 | 2021 | Change |
| Equity - Mutual Funds | | | | | $ | 74,891 | | $ | 93,448 | | (20) | % |
| Fixed Income - Mutual Funds | | | | | 17,388 | | 18,913 | | (8) | % |
| Multi-Strategy Investments - Mutual Funds [1] | | | | | 20,362 | | 23,039 | | (12) | % |
| Equity - ETF | | | | | 1,756 | | 2,251 | | (22) | % |
| Fixed Income - ETF | | | | | 1,009 | | 860 | | 17 | % |
| Mutual Fund and ETF AUM | | | | | $ | 115,406 | | $ | 138,511 | | (17) | % |
[1]Includes balanced, allocation, and alternative investment products.
Net Income
Three and six months ended June 30, 2022 compared to the three and six months ended June 30, 2021
Net income decreased for both the three and six month periods, primarily due to a change from net realized gains to net realized losses related to investments in funds seeded by the Company, and, for the three month period, due to lower fee income net of variable expenses as a result of a decrease in daily average assets under management.
Hartford Funds AUM
June 30, 2022 compared to June 30, 2021
Hartford Funds AUM decreased primarily due to a decrease in market values over the previous twelve months and due to net outflows. Net outflows on mutual fund and ETF were $2,011 and $2,435, respectively, in the three and six months ended June 30, 2022 compared to net inflows of $2,440 and $3,214, respectively, for the three and six months ended June 30, 2021.
Part I - Item 2. Management's Discussion and Analysis of Financial Condition and Results of Operations
| | |
|CORPORATE - RESULTS OF OPERATIONS |
Operating Summary
| | | | | | | | | | | | | | | | | | | | | | | | |
| | Three Months Ended June 30, | | Six Months Ended June 30, |
| | 2022 | 2021 | Change | | 2022 | 2021 | Change |
| Fee income [1] | | $ | 13 | | $ | 14 | | (7 | %) | | $ | 26 | | $ | 26 | | — | % |
| | | | | | | | |
| | | | | | | | |
| Other revenue (loss) | | — | | (2) | | 100 | % | | 1 | | (10) | | 110 | % |
| Net investment income | | 3 | | 3 | | — | % | | 6 | | 6 | | — | % |
| Net realized gains (losses) | | (30) | | 61 | | (149 | %) | | (46) | | 67 | | (169 | %) |
| Total revenues (losses) | | (14) | | 76 | | (118 | %) | | (13) | | 89 | | (115 | %) |
| Benefits, losses and loss adjustment expenses [2] | | 2 | | 2 | | — | % | | 4 | | 3 | | 33 | % |
| | | | | | | | |
| Insurance operating costs and other expenses [1] | | 23 | | 45 | | (49 | %) | | 36 | | 58 | | (38 | %) |
| | | | | | | | |
| | | | | | | | |
| | | | | | | | |
| Interest expense [3] | | 51 | | 57 | | (11 | %) | | 113 | | 114 | | (1 | %) |
| Restructuring and other costs | | 2 | | — | | NM | | 7 | | 11 | | (36 | %) |
| Total benefits, losses and expenses | | 78 | | 104 | | (25 | %) | | 160 | | 186 | | (14 | %) |
| Loss before income taxes | | (92) | | (28) | | NM | | (173) | | (97) | | (78 | %) |
| Income tax benefit [4] | | (21) | | (7) | | NM | | (43) | | (18) | | (139 | %) |
| Net loss | | (71) | | (21) | | NM | | (130) | | (79) | | (65 | %) |
| Preferred stock dividends | | 5 | | 5 | | — | % | | 10 | | 10 | | — | % |
| Net loss available to common stockholders | | $ | (76) | | $ | (26) | | (192) | % | | $ | (140) | | $ | (89) | | (57) | % |
[1]Includes investment management fees and expenses related to managing third party business, including management of the invested assets of Talcott Resolution.
[2]Includes benefits expense on life and annuity business previously underwritten by the Company.
[3]For discussion of debt, see Note 14 - Debt of Notes to Consolidated Financial Statements in The Hartford's 2021 Form 10-K Annual Report.
[4]For discussion of income taxes, see Note 12 - Income Taxes of Notes to the Condensed Consolidated Financial Statements.
Net loss available to common stockholders
Three and six months ended June 30, 2022 compared to the three and six months ended June 30, 2021
Net loss available to common stockholders for the three and six months ended June 30, 2022 increased from the comparable 2021 periods, primarily due a change from net
realized gains in the 2021 periods to net realized losses in the 2022 periods, partially offset by legal and consulting costs in incurred in the 2021 periods associated with the unsolicited proposals from Chubb Limited to acquire the Company, and, for the six month period, the effect of a loss of $11 before tax in the 2021 period from the Company’s previously owned equity interest in Talcott Resolution.
For the three month period, lower interest expense and a higher tax benefit for stock-based compensation were largely offset by a $9 loss on extinguishment of debt in the 2022 period.
Interest Expense
Three and six months ended June 30, 2022 compared to the three and six months ended June 30, 2021
Part I - Item 2. Management's Discussion and Analysis of Financial Condition and Results of Operations
Interest expense decreased for the three months ended June 30, 2022, largely due to the redemption of $600 in 7.875% junior subordinated debentures in April, 2022.
ENTERPRISE RISK MANAGEMENT
The Company’s Board of Directors has ultimate responsibility for risk oversight, as described more fully in our Proxy Statement, while management is tasked with the day-to-day management of the Company’s risks.
The Company manages and monitors risk through risk policies, controls and limits. At the senior management level, an Enterprise Risk and Capital Committee (“ERCC”) oversees the risk profile and risk management practices of the Company.
The Company's enterprise risk management ("ERM") function supports the ERCC and functional committees, and is tasked with, among other things:
•risk identification and assessment;
•the development of risk appetites, tolerances, and limits;
•risk monitoring; and
•internal and external risk reporting.
The Company categorizes its main risks as insurance risk, operational risk and financial risk. Insurance risk and financial risk are described in more detail below. Operational risk, including cybersecurity, and specific risk tolerances for natural catastrophes, terrorism and pandemic risk are described in the ERM section of the MD&A in The Hartford’s 2021 Form 10-K Annual Report.
|INSURANCE RISK
Insurance risk is the risk of losses of both a catastrophic and non-catastrophic nature on the P&C and Group Benefits products the Company has sold. Catastrophe insurance risk is the exposure arising from both natural (e.g., weather, earthquakes, wildfires, pandemics) and man-made catastrophes (e.g., terrorism, cyber-attacks) that create a concentration or aggregation of loss across the Company's insurance or asset portfolios.
Sources of Insurance Risk Non-catastrophe insurance risks exist within each of the Company's segments except Hartford Funds and include:
•Property- Risk of loss to personal or commercial property from automobile related accidents, weather, explosions, smoke, shaking, fire, theft, vandalism, inadequate installation, faulty equipment, collisions and falling objects, and/or machinery mechanical breakdown resulting in physical damage, losses from PV&T and other covered perils.
•Liability- Risk of loss from automobile related accidents, uninsured and underinsured drivers, lawsuits from accidents, defective products, breach of warranty, negligent acts by professional practitioners, environmental claims, latent exposures, fraud, coercion, forgery, failure to fulfill
obligations per contract surety, liability from errors and omissions, losses from CPRI coverages, losses from derivative lawsuits, and other securities actions and covered perils.
•Mortality- Risk of loss from unexpected trends in insured deaths impacting timing of payouts from group life insurance, personal or commercial automobile related accidents, and death of employees or executives during the course of employment, while on disability, or while collecting workers compensation benefits.
•Morbidity- Risk of loss to an insured from illness incurred during the course of employment or illness from other covered perils.
•Disability- Risk of loss incurred from personal or commercial automobile related losses, accidents arising outside of the workplace, injuries or accidents incurred during the course of employment, or from equipment, with each loss resulting in short term or long-term disability payments.
•Longevity- Risk of loss from increased life expectancy trends among policyholders receiving long-term benefit payments.
•Cyber Insurance- Risk of loss to property, breach of data and business interruption from various types of cyber-attacks.
Catastrophe risk primarily arises in the property, automobile, workers' compensation, casualty, group life, and group disability lines of business but could also arise from other coverages such as losses under PV&T and CPRI policies. Not all insurance losses arising from catastrophe risk are categorized as catastrophe losses within the segment operating results. See the term Current Accident Year Catastrophe Ratio within the Key Performance Measures section of MD&A for an explanation of how the Company defines catastrophe losses in its financial reporting.
Impact Non-catastrophe insurance risk can arise from unexpected loss experience, underpriced business and/or underestimation of loss reserves and can have significant effects on the Company’s earnings. Catastrophe insurance risk can arise from various unpredictable events and can have significant effects on the Company's earnings and may result in losses that could constrain its liquidity.
Management The Company's policies and procedures for managing these risks include disciplined underwriting protocols, exposure controls, sophisticated risk-based pricing, risk modeling, risk transfer, and capital management strategies. The Company has established underwriting guidelines for both individual risks, including individual policy limits, and risks in the aggregate, including aggregate exposure limits by geographic zone and peril. The Company uses both internal and third-party models to estimate the potential loss resulting from various catastrophe events and the potential financial impact those events would have on the Company's financial position and results of operations across its businesses.
Part I - Item 2. Management's Discussion and Analysis of Financial Condition and Results of Operations
In addition, certain insurance products offered by The Hartford provide coverage for losses incurred due to cyber events and the Company has assessed and modeled how those products would respond to different events in order to manage its aggregate exposure to losses incurred under the insurance policies we sell. The Company models numerous deterministic scenarios including losses caused by malware, data breach, distributed denial of service attacks, intrusions of cloud environments and attacks of power grids.
Among specific risk tolerances set by the Company, risk limits are set for natural catastrophes, terrorism risk and pandemic risk.
Reinsurance as a Risk Management Strategy
The Company uses reinsurance to transfer certain risks to reinsurance companies based on specific geographic or risk concentrations. A variety of traditional reinsurance products are used as part of the Company's risk management strategy, including excess of loss occurrence-based products that reinsure property and workers' compensation exposures, and individual risk (including facultative reinsurance) or quota share arrangements, that reinsure losses from specific classes or lines of business. The Company has no significant finite risk contracts in place and the statutory surplus benefit from all such prior year contracts is immaterial. The Hartford also participates in governmentally administered reinsurance facilities such as the Florida Hurricane Catastrophe Fund (“FHCF”), the Terrorism
Risk Insurance Program (“TRIPRA”) and other reinsurance programs relating to particular risks or specific lines of business.
Reinsurance for Catastrophes- The Company utilizes various reinsurance programs to mitigate catastrophe losses including excess of loss occurrence-based treaties covering property and workers’ compensation, an aggregate property catastrophe treaty, and individual risk agreements (including facultative reinsurance) that reinsure losses from specific classes or lines of business. The aggregate property catastrophe treaty covers the aggregate losses of catastrophe events designated by the Property Claim Services office of Verisk and, for international business, net losses arising from two or more risks involved in the same loss occurrence totaling at least $0.5, in excess of a $700 retention. The occurrence-based property catastrophe treaty responds in excess of $100 per occurrence, subject to a $50 annual aggregate deducible for all perils other than earthquakes and named hurricanes and tropical storms. For earthquakes and named hurricanes and tropical storms the occurrence based property treaty responds in excess of $350. The occurrence property catastrophe treaty and workers’ compensation catastrophe treaties incepting January 1, 2021, do not cover pandemic losses, as most industry reinsurance programs exclude communicable disease. The Company has reinsurance in place to cover individual group life losses in excess of $1 per person.
Part I - Item 2. Management's Discussion and Analysis of Financial Condition and Results of Operations
Primary Catastrophe Treaty Reinsurance Coverages as of June 30, 2022 [1]
| | | | | | | | |
| Portion of losses reinsured | Portion of losses retained by The Hartford |
| Per Occurrence Property Catastrophe Treaty from 1/1/2022 to 12/31/2022 [1] [2] | | |
| Losses of $0 to $100 | None | 100% retained |
| Losses of $100 to $350 for earthquakes and named hurricanes and tropical storms [3] | None | 100% retained |
| Losses of $100 to $350 from one event other than earthquakes and named hurricanes and tropical storms (subject to a $50 Annual Aggregate Deductible ("AAD")) [3] | 70% of $250 in excess of $100 | 30% co-participation |
| Losses of $350 to $500 from one event (all perils) | 75% of $150 in excess of $350 | 25% co-participation |
| Losses of $500 to $1.1 billion from one event [4] (all perils) | 90% of $600 in excess $500 | 10% co-participation |
| Aggregate Property Catastrophe Treaty for 1/1/2022 to 12/31/2022 [5] | | |
| $0 to $700 of aggregate losses | None | 100% retained |
| $700 to $900 of aggregate losses | 100% | None |
| Workers' Compensation Catastrophe Treaty for 1/1/2022 to 12/31/2022 | | |
| Losses of $0 to $100 from one event | None | 100% retained |
| Losses of $100 to $450 from one event [6] | 80% of $350 in excess of $100 | 20% co-participation |
[1]These treaties do not cover the assumed reinsurance business which purchases its own retrocessional coverage.
[2]In addition to the Per Occurrence Property Catastrophe Treaty, for Florida wind events, The Hartford has purchased the mandatory FHCF reinsurance for the annual period starting at June 1, 2021. Retention and coverage varies by writing company. The writing company with the largest coverage under FHCF is Hartford Insurance Company of the Midwest, with coverage estimated at approximately 90% of $52 in per event losses in excess of a $21 retention (estimates are based on best available information at this time and are periodically updated as information is made available by Florida).
[3]Named hurricanes and tropical storms are defined as any storm or storm system declared to be a hurricane or tropical storm by the US National Hurricane Center, US Weather Prediction Center, or their successor organizations (being divisions of the US National Weather Service).
[4]Portions of this layer of coverage extend beyond a traditional one year term.
[5]The aggregate treaty is not limited to a single event; rather, it is designed to provide reinsurance protection for the aggregate of all catastrophe events (up to $350 per event), either designated by the Property Claim Services office of Verisk or, for international business, net losses arising from two or more risks involved in the same loss occurrence totaling at least $500 thousand. All catastrophe losses, except assumed reinsurance business losses, apply toward satisfying the $700 attachment point under the aggregate treaty.
[6]In addition to the limits shown, the workers' compensation reinsurance includes a non-catastrophe, industrial accident layer, providing coverage for 80% of $30 in per event losses in excess of a $20 retention.
In addition to the property catastrophe reinsurance coverage described in the above table, the Company has other reinsurance agreements that cover property catastrophe losses, some of which provide for reinstatement of limits in the event of a loss with reinstatement provisions varying depending on the layer of coverage. The Per Occurrence Property Catastrophe Treaty, and Workers' Compensation Catastrophe Treaty include a provision to reinstate one limit in the event that a catastrophe loss exhausts limits on one or more layers under the treaties.
Reinsurance for Terrorism- For the risk of terrorism, private sector catastrophe reinsurance capacity is generally limited and largely unavailable for terrorism losses caused by nuclear, biological, chemical or radiological attacks. As such, the Company's principal reinsurance protection against large-scale terrorist attacks is the coverage currently provided through TRIPRA to the end of 2027.
TRIPRA provides a backstop for insurance-related losses resulting from any “act of terrorism”, which is certified by the Secretary of the Treasury, in consultation with the Secretary of Homeland Security and the Attorney General, for losses that exceed a threshold of industry losses of $200. Under the program, in any one calendar year, the federal government will pay a percentage of losses incurred from a certified act of terrorism after an insurer's losses exceed 20% of the Company's eligible direct commercial earned premiums of the
prior calendar year up to a combined annual aggregate limit for the federal government and all insurers of $100 billion. The percentage of losses paid by the federal government is 80%. The Company's estimated deductible under the program is $1.7 billion for 2022. If an act of terrorism or acts of terrorism result in covered losses exceeding the $100 billion annual industry aggregate limit, Congress would be responsible for determining how additional losses in excess of $100 billion will be paid.
Reinsurance for A&E and Navigators Group Reserve Development - The Company has two ADC reinsurance agreements in place, both of which are accounted for as retroactive reinsurance. One agreement covers substantially all A&E reserve development for 2016 and prior accident years (the “A&E ADC”) up to an aggregate limit of $1.5 billion and the other covered substantially all reserve development of Navigators Insurance Company and certain of its affiliates for 2018 and prior accident years (“Navigators ADC”) up to an aggregate limit of $300. As the Company has ceded all of the $300 available limit under the Navigators ADC, there is no remaining limit available as of June 30, 2022. For more information on the A&E ADC and the Navigators ADC, see Note 1, Basis of Presentation and Significant Accounting Policies of Notes to Consolidated Financial Statements, included in The Hartford's 2021 Form 10-K Annual Report, and Note 9 - Reserve for Unpaid Losses and Loss Adjustment Expenses of Notes to Condensed Consolidated Financial Statements.
Part I - Item 2. Management's Discussion and Analysis of Financial Condition and Results of Operations
|FINANCIAL RISK
Financial risks include direct and indirect risks to the Company's financial objectives from events that impact financial market conditions and the value of financial assets. Some events may cause correlated movement in multiple risk factors. The primary sources of financial risks are the Company's invested assets.
Consistent with its risk appetite, the Company establishes financial risk limits to control potential loss on a U.S. GAAP, statutory, and economic basis. Exposures are actively monitored and managed, with risks mitigated where appropriate. The Company uses various risk management strategies, including limiting aggregation of risk, portfolio re-balancing and hedging with over-the-counter ("OTC") and exchange-traded derivatives with counterparties meeting the appropriate regulatory and due diligence requirements. Derivatives are utilized to achieve the following Company-approved objectives: (1) hedging risk arising from interest rate, equity market, commodity market, credit spread and issuer default, price or currency exchange rate risk or volatility; (2) managing liquidity; (3) controlling transaction costs; and (4) engaging in income generation covered call transactions and synthetic replication transactions. Derivative activities are monitored and evaluated by the Company’s compliance and risk management teams and reviewed by senior management. The Company identifies different categories of financial risk, including liquidity, credit, interest rate, equity, and foreign currency exchange.
Liquidity Risk
Liquidity risk is the risk to current or prospective earnings or capital arising from the Company's inability or perceived inability to meet its contractual funding obligations as they come due.
Sources of Liquidity Risk Sources of liquidity risk include funding risk, company-specific liquidity risk and market liquidity risk resulting from differences in the amount and timing of sources and uses of cash as well as company-specific and general market conditions. Stressed market conditions may impact the ability to sell assets or otherwise transact business and may result in a significant loss in value.
Impact Inadequate capital resources and liquidity could negatively affect the Company’s overall financial strength and its ability to generate cash flows from its businesses, borrow funds at competitive rates, and raise new capital to meet operating and growth needs.
Management The Company has defined ongoing monitoring and reporting requirements to assess liquidity across the enterprise under both current and stressed market conditions. The Company measures and manages liquidity risk exposures and funding needs within prescribed limits across legal entities, taking into account legal, regulatory and operational limitations to the transferability of liquid assets among legal entities. The Company also monitors internal and external conditions, and identifies material risk changes and emerging risks that may impact operating cash flows or liquid assets. The liquidity requirements of The Hartford Financial Services Group, Inc. ("HFSG Holding Company") have been and will continue to be met by the HFSG Holding Company's fixed maturities, short-term investments and cash, and dividends from its subsidiaries, principally its insurance operations, as well
as the issuance of common stock, debt or other capital securities and borrowings from its credit facilities as needed. The Company maintains multiple sources of contingent liquidity including a revolving credit facility, an intercompany liquidity agreement that allows for short-term advances of funds among the HFSG Holding Company and certain affiliates, and access to collateralized advances from the Federal Home Loan Bank of Boston ("FHLBB") for certain affiliates. The Company's CFO has primary responsibility for liquidity risk.
Credit Risk and Counterparty Risk
Credit risk is the risk to earnings or capital due to uncertainty of an obligor’s or counterparty’s ability or willingness to meet its obligations in accordance with contractually agreed upon terms. Credit risk is comprised of three major factors: the risk of change in credit quality, or credit migration risk; the risk of default; and the risk of a change in value due to changes in credit spreads.
Sources of Credit Risk The majority of the Company’s credit risk is concentrated in its investment holdings and use of derivatives, but it is also present in the Company’s ceded reinsurance activities and various insurance products.
Impact A decline in creditworthiness is typically reflected as an increase in an investment’s credit spread and an associated decline in the investment's fair value, potentially resulting in recording an ACL and an increased probability of a realized loss upon sale. In certain instances, counterparties may default on their obligations and the Company may realize a loss on default. Premiums receivable, including premiums for retrospectively rated plans, reinsurance recoverable and deductible losses recoverable are also subject to credit risk based on the counterparty’s inability to pay.
Management The objective of the Company’s enterprise credit risk management strategy is to identify, quantify and manage credit risk in aggregate and to limit potential losses in accordance with the Company's credit risk management policy. The Company manages its credit risk by managing aggregations of risk, holding a diversified mix of issuers and counterparties across its investment, reinsurance and insurance portfolios and limiting exposure to any specific reinsurer or counterparty. Potential credit losses can be mitigated through diversification (e.g., geographic regions, asset types, industry sectors), hedging and the use of collateral to reduce net credit exposure.
The Company manages credit risk through the use of various surveillance, analyses and governance processes. The investment and reinsurance areas have formal policies and procedures for counterparty approvals and authorizations, which establish criteria defining minimum levels of creditworthiness and financial stability for eligible counterparties. Potential investments are subject to underwriting reviews and private securities are subject to management approval. Mitigation strategies vary across the three sources of credit risk, but may include:
•Investing in a portfolio of high-quality and diverse securities;
•Selling investments subject to credit risk;
•Hedging through use of credit default swaps;
Part I - Item 2. Management's Discussion and Analysis of Financial Condition and Results of Operations
•Clearing derivative transactions through central clearing houses that require daily variation margin;
•Entering into derivative and reinsurance contracts only with strong creditworthy institutions;
•Requiring collateral; and
•Non-renewing policies/contracts or reinsurance treaties.
The Company has developed credit exposure thresholds which are based upon counterparty ratings. Aggregate counterparty credit quality and exposure are monitored on a daily basis utilizing an enterprise-wide credit exposure information system that contains data on issuers, ratings, exposures, and credit limits. Exposures are tracked on a current and potential basis and aggregated by ultimate parent of the counterparty across investments, reinsurance receivables, insurance products with credit risk, and derivatives.
As of June 30, 2022, the Company had no investment exposure to any credit concentration risk of a single issuer or counterparty greater than 10% of the Company’s stockholders' equity, other than the U.S. government and certain U.S. government agencies. For further discussion of concentration of credit risk in the investment portfolio, see the Concentration of Credit Risk section in Note 5 - Investments of Notes to Condensed Consolidated Financial Statements.
Credit Risk of Derivatives
The Company uses various derivative counterparties in executing its derivative transactions. The use of counterparties creates credit risk that the counterparty may not perform in accordance with the terms of the derivative transaction.
Downgrades to the credit ratings of the Company’s insurance operating companies may have adverse implications for its use of derivatives. In some cases, downgrades may give derivative counterparties for OTC derivatives and clearing brokers for OTC-cleared derivatives the right to cancel and settle outstanding derivative trades or require additional collateral to be posted. In addition, downgrades may result in counterparties and clearing brokers becoming unwilling to engage in or clear additional derivatives or may require additional collateralization before entering into any new trades.
The Company also has derivative counterparty exposure policies which limit the Company’s exposure to credit risk. Credit exposures are generally quantified based on the prior business day’s net fair value, including income accruals, of all derivative positions transacted with a single counterparty for each separate legal entity. The Company enters into collateral arrangements in connection with its derivatives positions and collateral is pledged to or held by, or on behalf of, the Company to the extent the exposure is greater than zero, subject to minimum transfer thresholds. For the six months ended June 30, 2022, the Company incurred no losses on derivative instruments due to counterparty default. For further discussion, see the Derivative Commitments section of Note 13 - Commitments and Contingencies of Notes to Condensed Consolidated Financial Statements.
Use of Credit Derivatives
The Company may also use credit default swaps to manage credit exposure or to assume credit risk to enhance yield.
Credit Risk Reduced Through Credit Derivatives
The Company primarily uses credit derivatives to purchase credit protection with respect to a referenced index. The Company purchases credit protection through credit default swaps to economically hedge and manage credit risk of certain fixed maturity investments across multiple sectors of the investment portfolio.
Credit Risk Assumed Through Credit Derivatives
The Company also enters into credit default swaps that assume credit risk as part of replication transactions. Replication transactions are used as an economical means to synthetically replicate the characteristics and performance of assets that are permissible investments under the Company’s investment policies. These swaps primarily reference indexes of CMBS issuers.
For further information on credit derivatives, see Note 6 - Derivatives of Notes to Condensed Consolidated Financial Statements.
Credit Risk of Business Operations
The Company is subject to credit risk related to the Company's commercial business that is written with large deductible policies or retrospectively-rated plans (referred to as "loss sensitive business"). The Company’s results of operations could be adversely affected if a significant portion of such contract holders failed to reimburse the Company for the deductible amount or the retrospectively rated policyholders failed to pay additional premiums owed. While the Company attempts to manage the risks discussed above through underwriting, credit analysis, collateral requirements, provision for bad debt, and other oversight mechanisms, the Company’s efforts may not be successful.
Interest Rate Risk
Interest rate risk is the risk of financial loss due to adverse changes in the value of assets and liabilities arising from movements in interest rates. Interest rate risk encompasses exposures with respect to changes in the level of interest rates, the shape of the term structure of rates and the volatility of interest rates. Interest rate risk does not include exposure to changes in credit spreads.
Sources of Interest Rate Risk The Company has exposure to interest rate risk arising from investments in fixed maturities and commercial mortgage loans, issuances by the Company of debt securities, preferred stock and similar securities, discount rate assumptions associated with the Company’s claim reserves and pension and other postretirement benefit obligations, and assets that support the Company's pension and other postretirement benefit plans.
Impact Changes in interest rates from current levels can have both favorable and unfavorable effects for the Company.
Management The Company manages its exposure to interest rate risk by constructing investment portfolios that seek to protect the Company from the economic impact associated with changes in interest rates by setting portfolio duration targets that are aligned with the duration of the liabilities that they support. The Company analyzes interest rate risk using various models including parametric models and cash flow simulation under various market scenarios of the liabilities and their supporting investment portfolios. Key metrics that the
Part I - Item 2. Management's Discussion and Analysis of Financial Condition and Results of Operations
Company uses to quantify its exposure to interest rate risk inherent in its invested assets and the associated liabilities include duration, convexity and key rate duration.
The Company primarily utilizes interest rate swaps and, to a lesser extent, futures to mitigate interest rate risk associated with its investment portfolio or liabilities and to manage portfolio duration.
Equity Risk
Equity risk is the risk of financial loss due to changes in the value of global equities or equity indices.
Sources of Equity Risk The Company has exposure to equity risk from invested assets, assets that support the Company’s pension and other postretirement benefit plans, and fee income derived from Hartford Funds assets under management.
Impact The investment portfolio is exposed to losses from market declines affecting equity securities and derivatives, which could negatively impact the Company's reported earnings. In addition, investments in limited partnerships and other alternative investments generally have a level of correlation to domestic equity market levels and can expose the Company to losses in earnings if valuations decline; however, earnings impacts are recognized on a lag as results from private equity investments and other funds are generally reported on a three-month delay. For assets supporting pension and other postretirement benefit plans, the Company may be required to make additional plan contributions if equity investments in the plan portfolios decline in value. Hartford Funds earnings are also significantly influenced by the U.S. and other equity markets. Generally, declines in equity markets will reduce the value of average daily assets under management and the amount of fee income generated from those assets. Increases in equity markets will generally have the inverse impact.
Management The Company uses various approaches in managing its equity exposure, including limits on the proportion of assets invested in equities, diversification of the equity portfolio, and, at times, hedging of changes in equity indices. For assets supporting pension and other postretirement benefit plans, the asset allocation mix is reviewed on a periodic basis.
In order to minimize risk, the pension plans maintain a listing of permissible and prohibited investments and impose concentration limits and investment quality requirements on permissible investment options.
Foreign Currency Exchange Risk
Foreign currency exchange risk is the risk of financial loss due to changes in the relative value between currencies.
Sources of Currency Risk The Company has foreign currency exchange risk in non-U.S. dollar denominated cash, fixed maturities, equities, and derivative instruments. In addition, the Company has non-U.S. subsidiaries, some with functional currencies other than U.S. dollar, and which transact business in multiple currencies resulting in assets and liabilities denominated in foreign currencies.
Impact Changes in relative values between currencies can create variability in cash flows and realized or unrealized gains and losses on changes in the fair value of assets and liabilities.
Management The Company manages its foreign currency exchange risk primarily through asset-liability matching and through the use of derivative instruments. However, legal entity capital is invested in local currencies in order to satisfy regulatory requirements and to support local insurance operations. The foreign currency exposure of non-U.S. dollar denominated investments will most commonly be reduced through the sale of the assets or through hedges using foreign currency swaps and forwards.
Investment Portfolio Risk
The following table presents the Company’s fixed maturities, AFS, by credit quality. The credit ratings referenced throughout this section are based on availability and are generally the midpoint of the available ratings among Moody’s, S&P, and Fitch. If no rating is available from a rating agency, then an internally developed rating is used. Accrued interest receivable related to fixed maturities are recorded in other assets on the Condensed Consolidated Balance Sheets and are not included in the amortized cost or fair value of the fixed maturities. For further information refer to Note 5 - Investments of Notes to Condensed Consolidated Financial Statements.
| | | | | | | | | | | | | | | | | | | | | | | |
Fixed Maturities, AFS by Credit Quality |
| | June 30, 2022 | | December 31, 2021 |
| | Amortized Cost | Fair Value | Percent of Total Fair Value | | Amortized Cost | Fair Value | Percent of Total Fair Value |
| United States Government/Government agencies | $ | 5,617 | | $ | 5,326 | | 14.0 | % | | $ | 5,706 | | $ | 5,881 | | 13.7 | % |
| AAA | 5,775 | | 5,576 | | 14.7 | % | | 5,917 | | 6,133 | | 14.3 | % |
| AA | 7,186 | | 6,847 | | 18.1 | % | | 7,279 | | 7,718 | | 18.0 | % |
| A | 10,212 | | 9,660 | | 25.5 | % | | 10,277 | | 10,962 | | 25.6 | % |
| BBB | 9,256 | | 8,514 | | 22.5 | % | | 9,196 | | 9,708 | | 22.7 | % |
| BB & below | 2,212 | | 1,964 | | 5.2 | % | | 2,413 | | 2,445 | | 5.7 | % |
| Total fixed maturities, AFS | $ | 40,258 | | $ | 37,887 | | 100.0 | % | | $ | 40,788 | | $ | 42,847 | | 100.0 | % |
The fair value of fixed maturities, AFS decreased as compared to December 31, 2021, primarily due to higher interest rates and wider credit spreads. Fixed maturities, FVO are not included in the preceding table. For further discussion on FVO securities, see Note 4 - Fair Value Measurements of Notes to Condensed Consolidated Financial Statements.
Part I - Item 2. Management's Discussion and Analysis of Financial Condition and Results of Operations
| | | | | | | | | | | | | | | | | | | | | | | | | | | | | | | | | | | | | | | | | |
| Fixed Maturities, AFS by Type |
| | June 30, 2022 | | December 31, 2021 |
| | Amortized Cost | ACL | Gross Unrealized Gains | Gross Unrealized Losses | Fair Value | Percent of Total Fair Value | | Amortized Cost | ACL | Gross Unrealized Gains | Gross Unrealized Losses | Fair Value | Percent of Total Fair Value |
Asset backed securities ("ABS") | | | | | | | | | | | | | |
| | | | | | | | | | | | | |
| Consumer loans | $ | 1,105 | | $ | — | | $ | 1 | | $ | (25) | | $ | 1,081 | | 2.9 | % | | $ | 959 | | $ | — | | $ | 11 | | $ | (2) | | $ | 968 | | 2.3 | % |
| | | | | | | | | | | | | |
| Other | 277 | | — | | — | | (16) | | 261 | | 0.7 | % | | 166 | | — | | 2 | | (1) | | 167 | | 0.4 | % |
| | | | | | | | | | | | | |
| CLO | 2,999 | | — | | 2 | | (111) | | 2,890 | | 7.6 | % | | 3,019 | | — | | 8 | | (2) | | 3,025 | | 7.1 | % |
| | | | | | | | | | | | | |
| | | | | | | | | | | | | |
| | | | | | | | | | | | | |
Commercial Mortgage-Backed Securities ("CMBS") | | | | | | | | | | | | | |
| Agency [1] | 1,236 | | (1) | | 18 | | (61) | | 1,192 | | 3.1 | % | | 1,390 | | — | | 75 | | (5) | | 1,460 | | 3.4 | % |
| Bonds | 2,140 | | — | | 1 | | (141) | | 2,000 | | 5.3 | % | | 2,327 | | — | | 92 | | (9) | | 2,410 | | 5.6 | % |
| Interest only | 211 | | — | | 7 | | (12) | | 206 | | 0.5 | % | | 238 | | — | | 12 | | (1) | | 249 | | 0.6 | % |
| Corporate | | | | | | | | | | | | | |
| Basic industry | 806 | | (3) | | 2 | | (64) | | 741 | | 2.0 | % | | 761 | | — | | 34 | | (5) | | 790 | | 1.8 | % |
| Capital goods | 1,334 | | — | | 4 | | (94) | | 1,244 | | 3.3 | % | | 1,442 | | — | | 84 | | (9) | | 1,517 | | 3.5 | % |
| Consumer cyclical | 1,177 | | (1) | | — | | (90) | | 1,086 | | 2.9 | % | | 1,161 | | (1) | | 50 | | (5) | | 1,205 | | 2.8 | % |
| Consumer non-cyclical | 2,155 | | — | | 5 | | (160) | | 2,000 | | 5.3 | % | | 2,473 | | — | | 134 | | (8) | | 2,599 | | 6.1 | % |
| Energy | 1,325 | | (1) | | 6 | | (98) | | 1,232 | | 3.3 | % | | 1,405 | | — | | 99 | | (2) | | 1,502 | | 3.5 | % |
| Financial services | 5,030 | | — | | 3 | | (350) | | 4,683 | | 12.4 | % | | 4,648 | | — | | 214 | | (20) | | 4,842 | | 11.3 | % |
| Tech./comm. | 2,506 | | (1) | | 15 | | (202) | | 2,318 | | 6.1 | % | | 2,658 | | — | | 216 | | (11) | | 2,863 | | 6.7 | % |
| Transportation | 710 | | — | | — | | (67) | | 643 | | 1.7 | % | | 744 | | — | | 43 | | (3) | | 784 | | 1.8 | % |
| Utilities | 1,897 | | (2) | | 12 | | (156) | | 1,751 | | 4.6 | % | | 1,917 | | — | | 141 | | (8) | | 2,050 | | 4.8 | % |
| Other | 491 | | — | | — | | (38) | | 453 | | 1.2 | % | | 535 | | — | | 23 | | (3) | | 555 | | 1.3 | % |
| Foreign govt./govt. agencies | 715 | | (4) | | 2 | | (52) | | 661 | | 1.7 | % | | 883 | | — | | 33 | | (6) | | 910 | | 2.1 | % |
| Municipal bonds | | | | | | | | | | | | | |
| Taxable | 1,083 | | — | | 3 | | (91) | | 995 | | 2.6 | % | | 1,079 | | — | | 83 | | (2) | | 1,160 | | 2.7 | % |
| Tax-exempt | 6,249 | | — | | 121 | | (298) | | 6,072 | | 16.0 | % | | 6,394 | | — | | 704 | | (1) | | 7,097 | | 16.6 | % |
Residential Mortgage-Backed Securities ("RMBS") | | | | | | | | | | | | | |
| Agency | 1,799 | | — | | 3 | | (117) | | 1,685 | | 4.4 | % | | 1,337 | | — | | 44 | | (11) | | 1,370 | | 3.2 | % |
| Non-agency | 2,327 | | — | | — | | (189) | | 2,138 | | 5.6 | % | | 2,101 | | — | | 11 | | (16) | | 2,096 | | 4.9 | % |
| Alt-A | 9 | | — | | — | | — | | 9 | | — | % | | 12 | | — | | 1 | | — | | 13 | | — | % |
| Sub-prime | 95 | | — | | 2 | | — | | 97 | | 0.3 | % | | 160 | | — | | 4 | | — | | 164 | | 0.4 | % |
| U.S. Treasuries | 2,582 | | — | | 7 | | (140) | | 2,449 | | 6.5 | % | | 2,979 | | — | | 86 | | (14) | | 3,051 | | 7.1 | % |
| Total fixed maturities, AFS | $ | 40,258 | | $ | (13) | | $ | 214 | | $ | (2,572) | | $ | 37,887 | | 100.0 | % | | $ | 40,788 | | $ | (1) | | $ | 2,204 | | $ | (144) | | $ | 42,847 | | 100.0 | % |
| Fixed maturities, FVO | | | | | $ | 342 | | | | | | | | $ | 160 | | |
| | | | | | | | | | | | | |
[1]Includes securities with pools of loans issued by the Small Business Administration which are backed by the full faith and credit of the U.S. government.
The fair value of fixed maturities, AFS decreased as compared with December 31, 2021, primarily due to higher interest rates and wider credit spreads. In the first half of 2022, the Company primarily decreased holdings of U.S. treasuries, CMBS, and corporate bonds, while primarily increasing holdings in non-agency and agency RMBS.
Commercial & Residential Real Estate
The following table presents the Company’s exposure to CMBS and RMBS by credit quality included in the preceding Fixed Maturities, AFS by Type table.
Part I - Item 2. Management's Discussion and Analysis of Financial Condition and Results of Operations
| | | | | | | | | | | | | | | | | | | | | | | | | | | | | | | | | | | | | | |
Exposure to CMBS & RMBS Bonds as of June 30, 2022 |
| | AAA | AA | A | BBB | BB and Below | Total |
| Amortized Cost | Fair Value | Amortized Cost | Fair Value | Amortized Cost | Fair Value | Amortized Cost | Fair Value | Amortized Cost | Fair Value | Amortized Cost | Fair Value |
| CMBS | | | | | | | | | | | | |
| Agency [1] | $ | 1,233 | | $ | 1,189 | | $ | 3 | | $ | 3 | | $ | — | | $ | — | | $ | — | | $ | — | | $ | — | | $ | — | | $ | 1,236 | | $ | 1,192 | |
| Bonds | 793 | | 753 | | 558 | | 520 | | 424 | | 394 | | 136 | | 123 | | 229 | | 210 | | 2,140 | | 2,000 | |
| Interest Only | 120 | | 117 | | 81 | | 79 | | — | | — | | 9 | | 9 | | 1 | | 1 | | 211 | | 206 | |
| Total CMBS | 2,146 | | 2,059 | | 642 | | 602 | | 424 | | 394 | | 145 | | 132 | | 230 | | 211 | | 3,587 | | 3,398 | |
| RMBS | | | | | | | | | | | | |
| Agency | 1,778 | | 1,664 | | 21 | | 21 | | — | | — | | — | | — | | — | | — | | 1,799 | | 1,685 | |
| Non-Agency | 1,178 | | 1,104 | | 512 | | 465 | | 351 | | 311 | | 255 | | 230 | | 31 | | 28 | | 2,327 | | 2,138 | |
| Alt-A | — | | — | | — | | — | | — | | — | | 1 | | 1 | | 8 | | 8 | | 9 | | 9 | |
| Sub-Prime | 6 | | 6 | | 28 | | 29 | | 21 | | 21 | | 8 | | 8 | | 32 | | 33 | | 95 | | 97 | |
| Total RMBS | 2,962 | | 2,774 | | 561 | | 515 | | 372 | | 332 | | 264 | | 239 | | 71 | | 69 | | 4,230 | | 3,929 | |
| Total CMBS & RMBS | $ | 5,108 | | $ | 4,833 | | $ | 1,203 | | $ | 1,117 | | $ | 796 | | $ | 726 | | $ | 409 | | $ | 371 | | $ | 301 | | $ | 280 | | $ | 7,817 | | $ | 7,327 | |
| | | | | | | | | | | | | | | | | | | | | | | | | | | | | | | | | | | | | | |
Exposure to CMBS & RMBS Bonds as of December 31, 2021 |
| | AAA | AA | A | BBB | BB and Below | Total |
| Amortized Cost | Fair Value | Amortized Cost | Fair Value | Amortized Cost | Fair Value | Amortized Cost | Fair Value | Amortized Cost | Fair Value | Amortized Cost | Fair Value |
| CMBS | | | | | | | | | | | | |
| Agency [1] | $ | 1,380 | | $ | 1,450 | | $ | 10 | | $ | 10 | | $ | — | | $ | — | | $ | — | | $ | — | | $ | — | | $ | — | | $ | 1,390 | | $ | 1,460 | |
| Bonds | 950 | | 995 | | 571 | | 593 | | 439 | | 453 | | 182 | | 186 | | 185 | | 183 | | 2,327 | | 2,410 | |
| Interest Only | 134 | | 141 | | 92 | | 96 | | 1 | | 1 | | 10 | | 10 | | 1 | | 1 | | 238 | | 249 | |
| Total CMBS | 2,464 | | 2,586 | | 673 | | 699 | | 440 | | 454 | | 192 | | 196 | | 186 | | 184 | | 3,955 | | 4,119 | |
| RMBS | | | | | | | | | | | | |
| Agency | 1,315 | | 1,347 | | 22 | | 23 | | — | | — | | — | | — | | — | | — | | 1,337 | | 1,370 | |
| Non-Agency | 840 | | 845 | | 554 | | 552 | | 477 | | 473 | | 199 | | 196 | | 31 | | 30 | | 2,101 | | 2,096 | |
| Alt-A | — | | — | | — | | — | | — | | — | | — | | — | | 12 | | 13 | | 12 | | 13 | |
| Sub-Prime | 6 | | 7 | | 34 | | 35 | | 47 | | 48 | | 24 | | 24 | | 49 | | 50 | | 160 | | 164 | |
| Total RMBS | 2,161 | | 2,199 | | 610 | | 610 | | 524 | | 521 | | 223 | | 220 | | 92 | | 93 | | 3,610 | | 3,643 | |
| Total CMBS & RMBS | $ | 4,625 | | $ | 4,785 | | $ | 1,283 | | $ | 1,309 | | $ | 964 | | $ | 975 | | $ | 415 | | $ | 416 | | $ | 278 | | $ | 277 | | $ | 7,565 | | $ | 7,762 | |
[1]Includes securities with pools of loans issued by the Small Business Administration which are backed by the full faith and credit of the U.S. government.
The Company also has exposure to commercial mortgage loans. These loans are collateralized by real estate properties that are diversified both geographically throughout the United States and by property type. These commercial loans are originated by the Company as high quality whole loans, and the Company may sell participation interests in one or more loans to third parties. A loan participation interest represents a pro-rata share in interest and principal payments generated by the participated loan, and the relationship between the Company as loan originator, lead participant and servicer and the third party as a participant are governed by a participation agreement.
As of June 30, 2022, mortgage loans had an amortized cost of $5.9 billion and carrying value of $5.9 billion, with an ACL of $36. As of December 31, 2021, mortgage loans had an amortized cost of $5.4 billion and carrying value of $5.4 billion, with an ACL of $29. The increase in the allowance is primarily attributable to the potential impact of current economic
conditions on real estate property valuations and net additions of new loans.
The Company funded $672 of commercial mortgage loans with a weighted average loan-to-value (“LTV”) ratio of 56% and a weighted average yield of 3.1% during the six months ended June 30, 2022. The Company continues to originate commercial mortgage loans in high growth markets across the country focusing primarily on institutional-quality multi-family, industrial, and retail properties with strong LTV ratios. There were no mortgage loans held for sale as of June 30, 2022, or December 31, 2021.
Municipal Bonds
The following table presents the Company's exposure to municipal bonds by type and weighted average credit quality included in the preceding Securities by Type table.
Part I - Item 2. Management's Discussion and Analysis of Financial Condition and Results of Operations
| | | | | | | | | | | | | | | | | | | | | | | |
Available For Sale Investments in Municipal Bonds |
| | June 30, 2022 | | December 31, 2021 |
| | Amortized Cost | Fair Value | Weighted Average Credit Quality | | Amortized Cost | Fair Value | Weighted Average Credit Quality |
| General Obligation | $ | 925 | | $ | 916 | | AA | | $ | 910 | | $ | 1,031 | | AA+ |
| Pre-refunded [1] | 375 | | 390 | | AAA | | 487 | | 519 | | AAA |
| Revenue | | | | | | | |
| Transportation | 1,557 | | 1,493 | | A+ | | 1,404 | | 1,579 | | A+ |
| Health Care | 1,258 | | 1,174 | | A+ | | 1,274 | | 1,397 | | A+ |
| Leasing [2] | 760 | | 721 | | AA- | | 813 | | 874 | | AA- |
| Education | 679 | | 657 | | AA | | 670 | | 748 | | AA |
| Water & Sewer | 425 | | 407 | | AA | | 504 | | 538 | | AA |
| Sales Tax | 348 | | 347 | | AA | | 370 | | 436 | | AA |
| Power | 277 | | 274 | | A | | 317 | | 357 | | A+ |
| Housing | 75 | | 66 | | AA- | | 98 | | 103 | | AA |
| Other | 653 | | 622 | | A+ | | 626 | | 675 | | AA- |
| Total Revenue | 6,032 | | 5,761 | | AA- | | 6,076 | | 6,707 | | AA- |
| Total Municipal | $ | 7,332 | | $ | 7,067 | | AA- | | $ | 7,473 | | $ | 8,257 | | AA- |
[1]Pre-refunded bonds are bonds for which an irrevocable trust containing sufficient U.S. treasury, agency, or other securities has been established to fund the remaining payments of principal and interest.
[2]Leasing revenue bonds are generally the obligations of a financing authority established by the municipality that leases facilities back to a municipality. The notes are typically secured by lease payments made by the municipality that is leasing the facilities financed by the issue. Lease payments may be subject to annual appropriation by the municipality, or the municipality may be obligated to appropriate general tax revenues to make lease payments.
As of June 30, 2022, the largest issuer concentrations were the New York State Dormitory Authority, the New York City Transitional Finance Authority, and the Grand Parkway Transportation Corporation of Texas, which each comprised less than 2% of the municipal bond portfolio and were primarily comprised of general obligation and revenue bonds. As of December 31, 2021, the largest issuer concentrations were the New York State Dormitory Authority, the Pennsylvania State Turnpike Commission, and the State of California, which each comprised less than 3% of the municipal bond portfolio and were primarily comprised of general obligation and revenue bonds. In total, municipal bonds make up 13% of the fair value of the Company's investment portfolio.
Limited Partnerships and Other Alternative Investments
The following table presents the Company’s investments in limited partnerships and other alternative investments which
include real estate funds, private equity funds, and hedge funds and other funds as well as other alternative investments.
Real estate funds consist of investments primarily in real estate joint ventures and, to a lesser extent, equity funds. Private equity funds primarily consist of investments in funds whose assets typically consist of a diversified pool of investments in small to mid-sized non-public businesses with high growth potential and strong owner sponsorship, as well as limited exposure to public markets.
Income or losses on investments in limited partnerships and other alternative investments are recognized on a lag as results from private equity investments and other funds are generally reported on a three-month delay.
| | | | | | | | | | | | | | | | | | | | | | | | | | | | | | | | | | | |
Limited Partnerships and Other Alternative Investments - Net Investment Income |
| Three Months Ended June 30, | | Six Months Ended June 30, |
| | 2022 | | 2021 | | 2022 | | 2021 |
| | Amount | Yield [1] | | Amount | Yield [1] | | Amount | Yield [1] | | Amount | Yield [1] |
| Real estate funds | $ | 88 | | 23.6 | % | | $ | 25 | | 13.6 | % | | $ | 139 | | 19.7 | % | | $ | 26 | | 7.8 | % |
| Private equity funds | 63 | | 18.7 | % | | 117 | | 46.3 | % | | 131 | | 20.5 | % | | 214 | | 46.4 | % |
| Hedge funds and other funds | 5 | | 6.8 | % | | 11 | | 22.7 | % | | 13 | | 9.0 | % | | 19 | | 21.1 | % |
| Other alternative investments [2] | 2 | | 1.4 | % | | 38 | | 36.3 | % | | 1 | | 0.4 | % | | 44 | | 21.3 | % |
| Total | $ | 158 | | 17.3 | % | | $ | 191 | | 32.5 | % | | $ | 284 | | 16.3 | % | | $ | 303 | | 27.8 | % |
[1]Yields calculated using annualized net investment income divided by the monthly average invested assets.
[2]Consists of an insurer-owned life insurance policy which is primarily invested in private equity, fixed income, hedge funds, and public equity.
Part I - Item 2. Management's Discussion and Analysis of Financial Condition and Results of Operations
| | | | | | | | | | | | | | | | | |
Investments in Limited Partnerships and Other Alternative Investments |
| | June 30, 2022 | | December 31, 2021 |
| | Amount | Percent | | Amount | Percent |
| Real estate funds | $ | 1,584 | | 41.1 | % | | $ | 1,315 | | 39.2 | % |
| Private equity funds | 1,445 | | 37.5 | % | | 1,256 | | 37.5 | % |
| Hedge funds and other funds | 318 | | 8.2 | % | | 274 | | 8.2 | % |
| Other alternative investments [1] | 509 | | 13.2 | % | | 508 | | 15.1 | % |
Total | $ | 3,856 | | 100.0 | % | | $ | 3,353 | | 100.0 | % |
[1]Consists of an insurer-owned life insurance policy which is primarily invested in private equity, fixed income, hedge funds, and public equity.
Fixed Maturities, AFS — Unrealized Loss Aging
The total gross unrealized losses were $2.6 billion as of June 30, 2022, and have increased $2,428, from December 31, 2021, primarily due to higher interest rates and wider credit spreads. As of June 30, 2022, $2.2 billion of the gross unrealized losses were associated with fixed maturities, AFS depressed less than 20% of amortized cost. The remaining $0.4 billion of gross unrealized losses were associated with fixed maturities, AFS depressed greater than 20%. The fixed maturities, AFS depressed more than 20% primarily related to corporate fixed maturities and municipal bonds that are mainly depressed because current interest rates are higher and market spreads are wider than at the respective purchase dates.
As part of the Company’s ongoing investment monitoring process, the Company has reviewed its fixed maturities, AFS in an unrealized loss position and concluded that these fixed maturities are temporarily depressed and are expected to recover in value as the investments approach maturity or as market spreads tighten. For these fixed maturities in an unrealized loss position where an ACL has not been recorded, the Company’s best estimate of expected future cash flows are sufficient to recover the amortized cost basis of the investment. Furthermore, the Company neither has an intention to sell nor does it expect to be required to sell these investments. For further information regarding the Company’s ACL analysis, see the Credit Losses on Fixed Maturities, AFS and Intent-to-Sell Impairments section below.
| | | | | | | | | | | | | | | | | | | | | | | | | | | | | | | | | | | |
| Unrealized Loss Aging for Fixed Maturities, AFS Securities |
| | June 30, 2022 | | December 31, 2021 |
Consecutive Months | Items | Amortized Cost | ACL | Unrealized Loss | Fair Value | | Items | Amortized Cost | ACL | Unrealized Loss | Fair Value |
| Three months or less | 1,506 | | $ | 12,389 | | $ | (1) | | $ | (420) | | $ | 11,968 | | | 640 | | $ | 6,193 | | $ | — | | $ | (32) | | $ | 6,161 | |
| Greater than three to six months | 1,947 | | 13,543 | | — | | (1,184) | | 12,359 | | | 404 | | 3,249 | | — | | (55) | | 3,194 | |
| Greater than six to nine months | 544 | | 3,965 | | — | | (385) | | 3,580 | | | 101 | | 571 | | — | | (5) | | 566 | |
| Greater than nine to eleven months | 370 | | 2,846 | | — | | (363) | | 2,483 | | | 171 | | 1,041 | | — | | (29) | | 1,012 | |
| Twelve months or more | 380 | | 1,970 | | (3) | | (220) | | 1,747 | | | 184 | | 631 | | — | | (23) | | 608 | |
| Total | 4,747 | | $ | 34,713 | | $ | (4) | | $ | (2,572) | | $ | 32,137 | | | 1,500 | | $ | 11,685 | | $ | — | | $ | (144) | | $ | 11,541 | |
| | | | | | | | | | | | | | | | | | | | | | | | | | | | | | | | | | | |
| Unrealized Loss Aging for Fixed Maturities, AFS Continuously Depressed Over 20% |
| | June 30, 2022 | | December 31, 2021 |
Consecutive Months | Items | Amortized Cost | ACL | Unrealized Loss | Fair Value | | Items | Amortized Cost | ACL | Unrealized Loss | Fair Value |
| Three months or less | 199 | | $ | 1,480 | | $ | (1) | | $ | (360) | | $ | 1,119 | | | — | | $ | — | | $ | — | | $ | — | | $ | — | |
| Greater than three to six months | 9 | | 36 | | — | | (15) | | 21 | | | — | | — | | — | | — | | — | |
| | | | | | | | | | | |
| | | | | | | | | | | |
| Twelve months or more | 19 | | 5 | | — | | (2) | | 3 | | | 20 | | 5 | | — | | (3) | | 2 | |
| Total | 227 | | $ | 1,521 | | $ | (1) | | $ | (377) | | $ | 1,143 | | | 20 | | $ | 5 | | $ | — | | $ | (3) | | $ | 2 | |
Credit Losses on Fixed Maturities, AFS and Intent-to-Sell Impairments
Three and six months ended June 30, 2022
Changes to the ACL for the three months ended June 30, 2022, were less than $1. For the six months ended June 30, 2022, the Company recorded a net increase in the ACL of $12. The increase was primarily attributable to new expected credit losses on four issuers with Russian exposure. Unrealized losses on
securities with an ACL recognized in other comprehensive income were less than $1 for both the three and six months ended June 30, 2022. For further information, refer to Note 5 - Investments of Notes to Condensed Consolidated Financial Statements.
Intent-to-sell impairments were $0 and $3 for the three and six months ended June 30, 2022, respectively, with impairments in the six month period related to one corporate issuer in the financial services sector.
Part I - Item 2. Management's Discussion and Analysis of Financial Condition and Results of Operations
The Company incorporates its best estimate of future performance using internal assumptions and judgments that are informed by economic and industry specific trends, as well as our expectations with respect to security specific developments.
Future intent-to-sell impairments or credit losses may develop as the result of changes in our intent to sell specific securities that are in an unrealized loss position or if modeling assumptions, such as macroeconomic factors or security specific developments, change unfavorably from our current modeling assumptions, resulting in lower cash flow expectations.
Three and six months ended June 30, 2021
There were no new additions to the ACL or improvements on issuers that had an ACL recognized in the three months ended June 30, 2021. In the six months ended June 30, 2021, the Company recorded net reversals of credit losses on fixed maturities, AFS of $4, including reversals of $6 and additions of $2. The reversals were primarily attributable to increases in the fair value of corporate issuers that had an ACL, primarily related to a large regional and commercial aircraft lessor. Additions relate to new expected credit losses on a media/entertainment company. Unrealized losses on securities with an ACL recognized in other comprehensive income were less than $1 for both the three and six months ended June 30, 2021
There were no intent-to-sell impairments in the three and six months ended June 30, 2021.
ACL on Mortgage Loans
Three and six months ended June 30, 2022
The Company reviews mortgage loans on a quarterly basis to estimate the ACL with changes in the ACL recorded in net realized gains and losses. Apart from an ACL recorded on individual mortgage loans where the borrower is experiencing financial difficulties, the Company records an ACL on the pool of mortgage loans based on lifetime expected credit losses. For further information, refer to Note 5 - Investments of Notes to Condensed Consolidated Financial Statements.
For the three and six months ended June 30, 2022, the Company recorded an increase in the ACL on mortgage loans of $5 and $7, respectively. The increase in the allowance is primarily attributable to the potential impact of current economic conditions on real estate property valuations and net additions of new loans. The Company did not record an ACL on any individual mortgage loans.
Three and six months ended June 30, 2021
For the three and six months ended June 30, 2021, the Company recorded a decrease in the ACL on mortgage loans of $10 and $14, respectively. The decrease in the allowance was the result of improved economic scenarios. The Company did not record an ACL on any individual mortgage loans.
CAPITAL RESOURCES AND LIQUIDITY
The following section discusses the overall financial strength of The Hartford and its insurance operations including their ability to generate cash flows from each of their business segments, borrow funds at competitive rates and raise new capital to meet operating and growth needs.
|SUMMARY OF CAPITAL RESOURCES AND LIQUIDITY
Capital available to the holding company as of June 30, 2022:
•$1.1 billion in fixed maturities, short-term investments, investment sales receivable and cash at The HFSG Holding Company.
•A senior unsecured revolving credit facility that provides for borrowing capacity up to $750 of unsecured credit through October 27, 2026. As of June 30, 2022, there were no borrowings outstanding; and
•An intercompany liquidity agreement that allows for short-term advances of funds among the HFSG Holding Company and certain affiliates of up to $2.0 billion for liquidity and other general corporate purposes. As of June 30, 2022, there were no borrowings outstanding.
2022 expected dividends and other sources of capital:
The future payment of dividends from our subsidiaries is dependent on several factors including the business results, capital position and liquidity of our subsidiaries.
•P&C - The Company's U.S. property and casualty insurance subsidiaries have dividend capacity of $2.0 billion for 2022, with $1.4 billion to $1.5 billion of net dividends expected in 2022, including $750 paid to HFSG Holding Company through June 30, 2022.
•Group Benefits - Hartford Life and Accident Insurance Company ("HLA") has dividend capacity of $241 in 2022 with $200 to $240 of dividends expected in 2022, including $90 paid to HFSG Holding Company through June 30, 2022.
•Hartford Funds - HFSG Holding Company expects to receive $160 to $180 in dividends from Hartford Funds in 2022, including $85 received through June 30, 2022.
Expected liquidity requirements for the next twelve months as of June 30, 2022:
•$194 of interest on debt, including, for the 3-month LIBOR plus 2.125% Notes due 2067, interest at a rate of 4.39% given the 10-year interest rate swap agreement the Company entered into in April 2017;
Part I - Item 2. Management's Discussion and Analysis of Financial Condition and Results of Operations
•$21 dividends on preferred stock, subject to the discretion of the Board of Directors; and
•$505 of common stockholders' dividends, subject to the discretion of the Board of Directors and before share repurchases.
Expected liquidity requirements for beyond the next twelve months as of June 30, 2022:
•Interest on debt and debt repayments, see Note 14 - Debt of Notes to Consolidated Financial Statements in The Hartford's 2021 Form 10-K Annual Report
•Preferred stock and common stock dividends, subject to the discretion of the Board of Directors.
Equity repurchase program:
During the six months ended June 30, 2022, the Company repurchased 12.0 million common shares for $850 under the $3.0 billion share repurchase program authorized by the Board of Directors, effective through December 31, 2022. As of June 30, 2022, the Company has $448 remaining for equity repurchases under this share repurchase program. During the period July 1, 2022 through July 27, 2022, the Company repurchased approximately 1.7 million common shares for $107.
In addition to the authorization covering the period from January 1, 2021 to December 31, 2022, in July, 2022, the Board of Directors approved a share repurchase authorization for up to $3.0 billion effective from August 1, 2022 to December 31, 2024. While the Company has the flexibility to use a portion of the new authorization in 2022, it expects to use the vast majority of the new authorization in 2023 and 2024. The timing of any repurchases is dependent on several factors, including the market price of the Company's securities, the Company's capital position, consideration of the effect of any repurchases on the Company's financial strength or credit ratings, the Company's blackout periods, and other considerations.
|LIQUIDITY REQUIREMENTS AND SOURCES OF CAPITAL
The Hartford Financial Services Group, Inc. ("HFSG Holding Company")
The liquidity requirements of the holding company of The Hartford Financial Services Group, Inc. will primarily be met by HFSG Holding Company's fixed maturities; short-term investments and cash; and dividends from its subsidiaries, principally its insurance operations. The Company maintains sufficient liquidity and has a variety of contingent liquidity resources to manage liquidity across a range of economic scenarios.
The HFSG Holding Company expects to continue to receive dividends from its operating subsidiaries in the future and manages capital in its operating subsidiaries to be sufficient under significant economic stress scenarios. Dividends from
subsidiaries and other sources of funds at the holding company may be used to repurchase shares under the authorized share repurchase program at the discretion of management.
Under significant economic stress scenarios, the Company has the ability to meet short-term cash requirements, if needed, by borrowing under its revolving credit facility or by having its insurance subsidiaries take collateralized advances under a facility with the FHLBB. The Company could also choose to have its insurance subsidiaries sell certain highly liquid, high quality fixed maturities or the Company could issue debt in the public markets under its shelf registration.
Debt
On April 15, 2022, The Hartford redeemed at par $600 aggregate principal amount of its 7.875% junior subordinated debentures due 2042 and recognized, in insurance operating costs and other expenses, a loss on extinguishment of debt of $9, before tax, for unamortized debt issuance costs.
|DIVIDENDS
The Hartford's Board of Directors declared the following quarterly dividends since April 1, 2022:
Common Stock Dividends
| | | | | | | | | | | |
| Declared | Record | Payable | Amount per share |
| May 18, 2022 | June 1, 2022 | July 5, 2022 | $ | 0.385 | |
| July 20, 2022 | September 1, 2022 | October 4, 2022 | $ | 0.385 | |
Preferred Stock Dividends
| | | | | | | | | | | |
| Declared | Record | Payable | Amount per share |
| May 18, 2022 | August 1, 2022 | August 15, 2022 | $ | 375.00 | |
| July 20, 2022 | November 1, 2022 | November 15, 2022 | $ | 375.00 | |
| | | |
There are no current restrictions on the HFSG Holding Company's ability to pay dividends to its stockholders.
For a discussion of restrictions on dividends to the HFSG Holding Company from its insurance subsidiaries, see the following "Dividends from Subsidiaries" discussion. For a discussion of potential restrictions on the HFSG Holding Company's ability to pay dividends, see the risk factor "Our ability to declare and pay dividends is subject to limitations" in Item 1A of Part I of the Company’s Annual Report on Form 10-K for the year ended December 31, 2021.
|DIVIDENDS FROM SUBSIDIARIES
Dividends to HFSG Holding Company from its insurance subsidiaries are restricted by insurance regulation. The Company’s principal insurance subsidiaries are domiciled in the United States and the United Kingdom.
The payment of dividends by Connecticut-domiciled insurers is limited under the insurance holding company laws of Connecticut. These laws require notice to and approval by the state insurance commissioner for the declaration or payment of
Part I - Item 2. Management's Discussion and Analysis of Financial Condition and Results of Operations
any dividend, which, together with other dividends or distributions made within the preceding twelve months, exceeds the greater of (i) 10% of the insurer’s statutory policyholder surplus as of December 31 of the preceding year or (ii) net income (or net gain from operations, if such company is a life insurance company) for the preceding year, in each case determined under statutory insurance accounting principles. In addition, if any dividend of a Connecticut-domiciled insurer exceeds the insurer’s earned surplus, it requires the prior approval of the Connecticut Insurance Commissioner.
Property casualty insurers domiciled in New York, including Navigators Insurance Company ("NIC") and Navigators Specialty Insurance Company ("NSIC"), generally may not, without notice to and approval by the state insurance commissioner, pay dividends out of earned surplus in any twelve-month period that exceeds the lesser of (i) 10% of the insurer’s statutory policyholders’ surplus as of the most recent financial statement on file, or (ii) 100% of its adjusted net investment income, as defined, for the same twelve month period.
The insurance holding company laws of the other jurisdictions in which The Hartford’s insurance subsidiaries are incorporated (or deemed commercially domiciled) generally contain similar (although in certain instances more restrictive) limitations on the payment of dividends. In addition to statutory limitations on paying dividends, the Company also takes other items into consideration when determining dividends from subsidiaries. These considerations include, but are not limited to, expected earnings and capitalization of the subsidiaries, regulatory capital requirements and liquidity requirements of the individual operating company.
Corporate members of Lloyd's syndicates may pay dividends to its parent to the extent of available profits that have been distributed from the syndicate in excess of the Funds at Lloyd's ("FAL") capital requirement and subject to restrictions imposed under UK Company Law. The FAL is determined based on the syndicate’s solvency capital requirement ("SCR") under the Solvency II capital adequacy model, the current regulatory framework governing UK domiciled insurers, plus a Lloyd’s specific economic capital assessment.
Insurers domiciled in the United Kingdom may pay dividends to their parent out of their statutory profits subject to restrictions imposed under U.K. Company law and Solvency II.
Through the first six months of 2022, HFSG Holding Company received $925 of net dividends from its subsidiaries, including $90 from HLA, $85 from Hartford Funds and $750 from its U.S. P&C subsidiaries, excluding $95 of P&C dividends that were subsequently contributed to P&C subsidiaries and $24 of P&C dividends related to interest payments on an intercompany note owed by Hartford Holdings, Inc. ("HHI") to Hartford Fire Insurance Company.
Over the remainder of 2022, the Company anticipates receiving approximately $650 to $750 of net dividends from its U.S. P&C subsidiaries, $110 to $150 of dividends from HLA and $75 to $95 of dividends from Hartford Funds.
|OTHER SOURCES OF CAPITAL FOR THE HFSG HOLDING COMPANY
The Hartford endeavors to maintain a capital structure that provides financial and operational flexibility to its insurance subsidiaries, ratings that support its competitive position in the financial services marketplace (see the "Ratings" section below for further discussion), and stockholder returns. As a result, the Company may from time to time raise capital from the issuance of debt, common equity, preferred stock, equity-related debt or other capital securities and is continuously evaluating strategic opportunities. The issuance of debt, common equity, equity-related debt or other capital securities could result in the dilution of stockholder interests or reduced net income to common stockholders due to additional interest expense or preferred stock dividends.
Shelf Registrations
The Hartford filed an automatic shelf registration statement with the Securities and Exchange Commission ("the SEC") on February 22, 2022 that permits it to offer and sell debt and equity securities during the three-year life of the registration statement.
For further information regarding Shelf Registrations, see Note Note 11 - Debt of Notes to Condensed Consolidated Financial Statements.
Revolving Credit Facility
The Hartford has a senior unsecured revolving credit facility (the "Credit Facility") that provides up to $750 of unsecured credit through October 27, 2026. As of June 30, 2022, no borrowings were outstanding and no letters of credit were issued under the Credit Facility and The Hartford was in compliance with all financial covenants. For further information regarding the Credit Facility, see Note 14 - Debt of Notes to Consolidated Financial Statements included in the Company’s 2021 Form 10-K Annual Report.
Intercompany Liquidity Agreements
The Company has $2.0 billion available under an intercompany liquidity agreement that allows for short-term advances of funds among the HFSG Holding Company and certain affiliates of up to $2.0 billion for liquidity and other general corporate purposes. The Connecticut Department of Insurance ("CTDOI") granted approval for certain affiliated insurance companies that are parties to the agreement to treat receivables from a parent, including the HFSG Holding Company, as admitted assets for statutory accounting purposes.
As of June 30, 2022 there were no amounts outstanding at the HFSG Holding Company.
Collateralized Advances with Federal Home Loan Bank of Boston
The Company’s subsidiaries, Hartford Fire Insurance Company (“Hartford Fire”) and Hartford Life and Accident Insurance Company (“HLA”), are members of the FHLBB. Membership allows these subsidiaries access to collateralized advances, which may be short- or long-term with fixed or variable rates. Advances may be used to support general corporate purposes, which would be presented as short- or long-term debt, or to earn
Part I - Item 2. Management's Discussion and Analysis of Financial Condition and Results of Operations
incremental investment income, which would be presented in other liabilities consistent with other collateralized financing transactions. As of June 30, 2022, there were no advances outstanding.
For further information regarding collateralized advances with FHLBB, see Note 14 - Debt of Notes to Consolidated Financial Statements included in the Company’s 2021 Form 10-K Annual Report.
Lloyd's Letter of Credit Facilities
The Hartford has entered into a committed credit facility agreement with a syndicate of lenders (the "Club Facility") as well as a non-committed $25 credit facility with a lender (the "Bilateral Facility"). The Club Facility has two tranches with one tranche extending a $104 commitment and the other tranche extending a £85 million ($103 as of June 30, 2022) commitment. As of June 30, 2022, letters of credit with an aggregate face amount of $104 and £65 million, or $79, were outstanding under the Club Facility and no letters of credit were outstanding under the Bilateral Facility.
Among other covenants, the Club Facility and Bilateral Facility contain financial covenants regarding The Hartford's consolidated net worth and financial leverage and that limit the amount of letters of credit that can support Funds and Lloyd's, consistent with Lloyd's requirements. As of June 30, 2022, The Hartford was in compliance with all financial covenants of both facilities.
For further information regarding the Club Facility and the Bilateral Facility, see Note 14 - Debt of Notes to Consolidated Financial Statements included in the Company’s 2021 Form 10-K Annual Report.
|PENSION PLANS AND OTHER POSTRETIREMENT BENEFITS
The Company does not have a 2022 required minimum funding contribution for the U.S. qualified defined benefit pension plan and the funding requirements for all pension plans are expected to be immaterial. The Company has not determined whether, and to what extent, contributions may be made to the U.S. qualified defined benefit pension plan in 2022. The Company will monitor the funded status of the U.S. qualified defined benefit pension plan during 2022 to make this determination. For further discussion of pension and other postretirement benefit obligations, see Note 16 - Employee Benefit Plans of Notes to Condensed Consolidated Financial Statements.
|DERIVATIVE COMMITMENTS
Certain of the Company’s derivative agreements contain provisions that are tied to the financial strength ratings, as set by nationally recognized statistical rating agencies, of the individual legal entity that entered into the derivative agreement. If the legal entity’s financial strength were to fall below certain ratings, the counterparties to the derivative agreements could terminate agreements and demand immediate settlement of the outstanding net derivative positions transacted under each agreement. For further information, refer to Note 13 - Commitments and Contingencies of Notes to Condensed Consolidated Financial Statements.
As of June 30, 2022, no derivative positions would be subject to immediate termination in the event of a downgrade of one level below the current financial strength ratings. This could change as a result of changes in our hedging activities or to the extent changes in contractual terms are negotiated.
|INSURANCE OPERATIONS
While subject to variability period to period, underwriting and investment cash flows continue to provide sufficient liquidity to meet anticipated demands. The principal sources of operating funds are premiums, fees earned from insurance and administrative service agreements, and investment income, while investing cash flows primarily originate from maturities and sales of invested assets.
The Company’s insurance operations consist of property and casualty insurance products (collectively referred to as “Property & Casualty Operations”) and Group Benefits.
The Company's insurance operations hold fixed maturity securities including a significant short-term investment position (securities with maturities of one year or less at the time of purchase) to meet liquidity needs. Liquidity requirements that are unable to be funded by the Company's insurance operations' short-term investments would be satisfied with current operating funds, including premiums or investing cash flows, which includes proceeds received through the sale of invested assets. A sale of invested assets could result in significant realized losses.
The following tables represent the fixed maturity holdings, including the aforementioned cash and short-term investments available to meet liquidity needs, for each of the Company’s insurance operations.
| | | | | |
Property & Casualty |
| As of June 30, 2022 |
| Fixed maturities | $ | 29,708 | |
| Short-term investments | 1,068 | |
| Cash | 225 | |
| Less: Derivative collateral | 41 | |
| Total | $ | 30,960 | |
Property & Casualty operations invested assets also include $1.2 billion in equity securities, $4.2 billion in mortgage loans and $3.1 billion in limited partnerships and other alternative investments.
| | | | | |
Group Benefits Operations |
| As of June 30, 2022 |
| Fixed maturities | $ | 8,207 | |
| Short-term investments | 267 | |
| Cash | 25 | |
| Less: Derivative collateral | 16 | |
| Total | $ | 8,483 | |
Group Benefits operations invested assets also include $297 in equity securities, $1.6 billion in mortgage loans and $786 in limited partnerships and other alternative investments.
The primary uses of funds are to pay claims, claim adjustment expenses, commissions and other underwriting and insurance
Part I - Item 2. Management's Discussion and Analysis of Financial Condition and Results of Operations
operating costs, to pay taxes, to purchase new investments and to make dividend payments to the HFSG Holding Company.
Property & Casualty reserves for unpaid losses and loss adjustment expenses as of June 30, 2022 were $31.9 billion. Reserves for Property & Casualty unpaid losses and loss adjustment expenses include case reserves and incurred but not reported ("IBNR"). The ultimate amount to be paid to settle both case reserves and IBNR is an estimate, subject to significant uncertainty. The actual amount to be paid is not finally determined until the Company reaches a settlement with the claimant. Final claim settlements may vary significantly from the present estimates, particularly since many claims will not be settled until well into the future. For a discussion of The Hartford’s judgment in estimating reserves for Property & Casualty see Part II, Item 7, MD&A - Critical Accounting Estimates, Property & Casualty Insurance Product Reserves in the Company's 2021 Form 10-K Annual Report, and for historical payments by reserve line net of reinsurance, see Note 12, Reserve for Unpaid Losses and Loss Adjustment Expenses of Notes to Consolidated Financial Statements included in the Company's 2021 Form 10-K Annual Report. The timing of future payments for the next twelve months and for beyond twelve months could vary materially from historical payment patterns due to, among other things, changes in claim reporting and payment patterns and large unanticipated settlements. In particular, there is significant uncertainty over the claim payment patterns of asbestos and environmental claims.
Group Benefits reserves as of June 30, 2022 were $8.9 billion. Estimated group life and disability obligations are based on assumptions comparable with the Company’s historical experience, modified for recent observed trends. For a discussion of The Hartford’s judgment in estimating reserves for Group Benefits see Part II, Item 7, MD&A - Critical Accounting Estimates, Group Benefit Reserves, Net of Reinsurance, in the Company’s 2021 Form 10-K Annual Report. For additional information about future policy benefits, see Note 10 Reserve for Future Policy Benefits and for historical payments by reserve line, net of reinsurance, see Note 12, Reserve for Unpaid Losses and Loss Adjustment Expenses of Notes to Consolidated Financial Statements included in the Company's
2021 Form 10-K Annual Report. Due to the significance of the assumptions used, payments for the next twelve months and beyond twelve months could materially differ from historical patterns.
Corporate includes reserves of $438 as of June 30, 2022 related to retained run-off liabilities of its former life and annuity business. For additional information about future policy benefits, see Note 10 - Reserve for Future Policy Benefits.
Hartford Funds
Hartford Funds principal sources of operating funds are fees earned from basis points on assets under management with uses primarily for payments to subadvisors and other general operating expenses. As of June 30, 2022, Hartford Funds cash and short-term investments were $228.
|PURCHASE AND OTHER OBLIGATIONS
The Hartford’s unfunded commitments to purchase investments in limited partnerships and other alternative investments, private placements, and mortgage loans are disclosed in Note 15 - Commitments and Contingencies of Notes to Consolidated Financial Statements in The Hartford's 2021 Form 10-K Annual Report. It is anticipated that these unfunded commitments will be funded through the Company’s normal operating and investing activities.
In the normal course of business, the Company enters into contractual commitments to purchase various goods and services such as maintenance, human resources, and information technology. The Company’s operating lease commitments are disclosed in Note 21 - Leases of Notes to Consolidated Financial Statements in The Hartford's 2021 Form 10-K Annual Report. It is anticipated that these purchase commitments and operating lease obligations will be funded through the Company’s normal operating and investing activities.
|CAPITALIZATION
| | | | | | | | | | | |
| Capital Structure |
| June 30, 2022 | December 31, 2021 | Change |
| | | |
| Long-term debt | $ | 4,355 | | $ | 4,944 | | (12 | %) |
Total debt | 4,355 | | 4,944 | | (12 | %) |
| Common stockholders' equity excluding AOCI, net of tax | 17,154 | | 17,337 | | (1 | %) |
| Preferred stock | 334 | | 334 | | — | % |
| AOCI, net of tax | (3,262) | | 172 | | NM |
Total stockholders’ equity | 14,226 | | 17,843 | | (20 | %) |
Total capitalization | $ | 18,581 | | $ | 22,787 | | (18 | %) |
| Debt to stockholders’ equity | 31 | % | 28 | % | |
| Debt to capitalization | 23 | % | 22 | % | |
Total capitalization decreased $4,206 as of June 30, 2022 compared to December 31, 2021 primarily due to an increase in net unrealized losses on fixed maturities, AFS, share repurchases, and the Company's redemption of its 7.875%
junior subordinated debentures, partially offset by net income in excess of common stockholder dividends in the period.
For additional information on AOCI, net of tax, including net unrealized gain (losses) from securities, see Note 15 - Changes
Part I - Item 2. Management's Discussion and Analysis of Financial Condition and Results of Operations
In and Reclassifications From Accumulated Other Comprehensive Income (Loss) and Note 5 - Investments of Notes to Condensed Consolidated Financial Statements. For additional information on debt, see Note 11 - Debt of Notes to Condensed Consolidated Financial Statement and Note 14 -
Debt of Notes to Consolidated Financial Statement in The Hartford's 2021 Form 10-K Annual Report.
|CASH FLOW[1]
| | | | | | | | |
| Six Months Ended June 30, |
| 2022 | 2021 |
| Net cash provided by operating activities | $ | 1,403 | | $ | 1,597 | |
| Net cash provided by (used for) investing activities | $ | 387 | | $ | (579) | |
| Net cash used for financing activities | $ | (1,773) | | $ | (933) | |
| Cash and restricted cash– end of period | $ | 348 | | $ | 308 | |
[1]Cash activities in 2021 include cash flows related to Continental Europe Operations that was sold on December 29, 2021. See Note 22 - Business Dispositions of Notes to Consolidated Financial Statements included in The Hartford's 2021 Form 10-K Annual Report for discussion of this transaction.
Cash provided by operating activities decreased in 2022 as compared to the prior year period primarily driven by an increase in P&C and Group Benefits loss and loss adjustment expenses paid, higher operating expenses, including increased commissions and staffing costs, and an increase in tax payments, partially offset by an increase in P&C and Group Benefits premiums received.
Cash provided by (used for) investing activities increased from net outflows in the 2021 period to net inflows in the 2022 period as a result of change from net payments for to net proceeds from short term investments and a decrease in net payments for equity securities, partially offset by a decrease in net proceeds from fixed maturities as well as an increase in net payments for partnerships.
Cash used for financing activities increased primarily due to the redemption of $600 of 7.875% junior subordinated debentures in the second quarter of 2022, as well as an increase in share repurchases in 2022.
Operating cash flow for the six months ended June 30, 2022 has been adequate to meet liquidity requirements.
|EQUITY MARKETS
For a discussion of the potential impact of the equity markets on capital and liquidity, see the Financial Risk section in this MD&A and the Financial Risk on Statutory Capital section of the MD&A in the Company's 2021 Form 10-K Annual Report.
|RATINGS
Ratings are an important factor in establishing a competitive position in the insurance marketplace and impact the Company's ability to access financing and its cost of borrowing. There can be no assurance that the Company’s ratings will continue for any given period of time, or that they will not be changed. In the event the Company’s ratings are downgraded,
the Company’s competitive position, ability to access financing, and its cost of borrowing, may be adversely impacted.
| | | | | | | | | | | |
Insurance Financial Strength Ratings as of
July 27, 2022 |
| A.M. Best | Standard & Poor’s | Moody’s |
| Hartford Fire Insurance Company | A+ | A+ | A1 |
| Hartford Life and Accident Insurance Company | A+ | A+ | A1 |
| Navigators Insurance Company | A+ | A | Not Rated |
| Other Ratings: | | | |
| The Hartford Financial Services Group, Inc.: | | | |
| Senior debt | a- | BBB+ | Baa1 |
| | | |
| | | |
| | | |
These ratings are not a recommendation to buy, sell or hold any of The Hartford's securities and they may be revised or withdrawn at any time at the discretion of the rating organization. Each agency's rating should be evaluated independently of any other agency's rating. The system and the number of rating categories can vary across rating agencies.
Among other factors, rating agencies consider the level of statutory capital and surplus of our U.S. insurance subsidiaries as well as the level of a measure of GAAP capital held by the Company in determining the Company's financial strength and credit ratings. Rating agencies may implement changes to their capital formulas that have the effect of increasing the amount of capital we must hold in order to maintain our current ratings. See Risk Factors disclosed in Item 1A of Part I of the Company's Annual Report on Form 10-K for the year ended December 31, 2021.
Part I - Item 2. Management's Discussion and Analysis of Financial Condition and Results of Operations
|STATUTORY CAPITAL
| | | | | | | | | | | |
U.S. Statutory Capital Rollforward for the Company's Insurance Subsidiaries |
| Property and Casualty Insurance Subsidiaries [1] [2] | Group Benefits Insurance Subsidiary | Total |
U.S statutory capital at January 1, 2022 | $ | 11,914 | | $ | 2,410 | | $ | 14,324 | |
| Statutory income | 907 | | 144 | | 1,051 | |
| Contributions from (dividends to) parent | (750) | | (90) | | (840) | |
| Other items | (325) | | 4 | | (321) | |
| Net change to U.S. statutory capital | (168) | | 58 | | (110) | |
U.S statutory capital at June 30, 2022 | $ | 11,746 | | $ | 2,468 | | $ | 14,214 | |
[1]The statutory capital for property and casualty insurance subsidiaries in this table does not include the value of an intercompany note owed by HHI to Hartford Fire Insurance Company.
[2]Excludes insurance operations in the U.K.
|CONTINGENCIES
Legal Proceedings
For a discussion regarding The Hartford’s legal proceedings, see the information contained in Note 13 - Commitments and Contingencies of the Notes to Condensed Consolidated Financial Statements.
Legislative and Regulatory Developments
COVID-19 Global Pandemic
State and federal lawmakers continue to propose legislation and regulation to address the effects of the COVID-19 pandemic and to promote recovery from the pandemic. There have been proposals to impose retroactive coverage of COVID-19 claims under existing business interruption coverage provisions. If such proposals were enacted, they could represent a material exposure for the Company. Further, some states have adopted, or are considering incorporating, a presumption that if certain workers become infected with COVID-19, such infection would constitute an occupational disease triggering workers’ compensation coverage. In addition, state insurance regulators, including California, New Jersey and New York, have encouraged (and in some cases required) insurers to offer immediate relief to policyholders. As the COVID-19 global pandemic continues, regulators may require us or we may elect to provide additional consumer and/or business financial relief. We may also see this manifest in the review and approval of new rate filings, with regulators applying heightened scrutiny even when rate reductions are proposed. The duration and scope of such regulatory/Company actions are uncertain, and the impacts of such actions could adversely affect the Company’s insurance business.
Proposals have been introduced in Congress to enact a pandemic risk insurance coverage through a risk sharing mechanism between insurers and the federal government for future pandemics. Timing for any Congressional action with respect to these proposals is uncertain at this time. If such a program were to be enacted, it could represent a significant obligation for the Company in terms of deductible and co-share obligations.
Biden Administration Build Back Better Agenda
During 2021, the Biden Administration called for Congressional action on the President’s Build Back Better Agenda, which outlined funding across traditional infrastructure and human infrastructure in the U.S.
On November 15, 2021, President Biden signed the bipartisan “Infrastructure Investment and Jobs Act” into law, which provided funding for traditional infrastructure such as roads, bridges and highways.
The second phase of Build Back Better proposes funding for a national paid family and medical leave program, clean energy initiatives, affordable childcare and more in the Build Back Better Act.
Notably, a national paid family and medical leave program could affect existing state-based disability and paid leave programs or other products and services that the Company provides through its Group Benefits business.
If enacted, the effect of new proposals from the Build Back Better agenda on the Company’s operations, including the ability to attract new business and retain existing customers is unclear. While Congress is considering partisan action on the Build Back Better agenda, the nature and timing of such action is unclear.
US Tax Reform
As Congress debates action on various spending initiatives, it may consider a variety of proposals to fund the cost of new spending with revenue raising measures. Proposals from the Build Back Better agenda, as well as the Biden Administration commitment to the OECD global minimum tax, could be drivers of tax policy changes, including a possible increase in the corporate tax rate, creation of a corporate minimum tax and other changes to taxes owed on income earned outside of the U.S. These and other tax proposals and regulatory initiatives that may be considered by Congress and/or the U.S. Treasury Department could have a material effect on the Company and its insurance businesses. The nature and timing of any Congressional or regulatory action with respect to any such efforts is unclear.
Post-Brexit UK Regulatory Reforms
The UK Prudential Regulation Authority (“PRA”) is reviewing the Solvency II regime, introduced across the EU during 2016 to align insurance entities’ risk frameworks for managing capital
Part I - Item 2. Management's Discussion and Analysis of Financial Condition and Results of Operations
adequacy and risk management practices, as well as increased transparency and enhanced regulatory supervision.
The PRA also recognizes that climate change presents a material financial risk to insurers and the financial system and
for 2022 the PRA will incorporate the financial risks posed by supervision into its core supervisory approach.
IMPACT OF NEW ACCOUNTING STANDARDS
For a discussion of accounting standards, see Note 1 - Basis of Presentation and Significant Accounting Policies of Notes to Consolidated Financial Statements included in The Hartford’s 2021 Form 10-K Annual Report.
ACRONYMS
| | | | | | | | | | | | |
A&E | Asbestos and Environmental | HLA | Hartford Life and Accident Insurance Company | |
ABS | Asset Backed Securities | IBNR | Incurred But Not Reported | |
ACL | Allowance for Credit Losses | IT | Information Technology | |
ADC | Adverse Development Cover | LCL | Liability for Credit Losses | |
AFS | Available-For-Sale | LIBOR | London Inter-Bank Offered Rate | |
ALAE | Allocated Loss Adjustment Expenses | LTD | Long-Term Disability | |
AOCI | Accumulated Other Comprehensive Income | LTV | Loan-to-Value | |
AUM | Assets Under Management | MD&A | Management's Discussion and Analysis of Financial Conditions and Results of Operations | |
BSA | Boy Scouts of America | NAIC | National Association of Insurance Commissioners | |
CAY | Current Accident Year | NIC | Navigators Insurance Company | |
CLO | Collateralized Loan Obligations | NICO | National Indemnity Company, a subsidiary of Berkshire Hathaway Inc. (“Berkshire”) | |
CMBS | Commercial Mortgage-Backed Securities | NM | Not Meaningful | |
CPRI | Credit and Political Risk Insurance | NOLs | Net Operating Loss Carryforwards or Carrybacks | |
DAC | Deferred Policy Acquisition Costs | NSIC | Navigators Specialty Insurance Company | |
DEI | Diversity, Equity and Inclusion | OCI | Other Comprehensive Income | |
DLR | Disabled Life Reserve | OTC | Over-the-Counter | |
DSCR | Debt Service Coverage Ratio | P&C | Property and Casualty | |
ERCC | Enterprise Risk and Capital Committee | PG&E | PG&E Corporation and Pacific Gas and Electric Company | |
ESPP | The Hartford Employee Stock Purchase Plan | PV&T | Political Violence and Terrorism | |
ETF | Exchange-Traded Funds | PYD | Prior Year Development | |
FAL | Funds at Lloyd's | RBC | Risk-Based Capital | |
FASB | Financial Accounting Standards Board | RMBS | Residential Mortgage-Backed Securities | |
FHLBB | Federal Home Loan Bank of Boston | ROA | Return on Assets | |
FVO | Fair Value Option | ROE | Return on Equity | |
GAAP | Generally Accepted Accounting Principles | SCR | Solvency Capital Requirement | |
HFSG | Hartford Financial Services Group, Inc. | SOFR | Secured Overnight Funding Rate | |
HHI | Hartford Holdings, Inc. | ULAE | Unallocated Loss Adjustment Expenses | |
HIMCO | Hartford Investment Management Company | | | |
| | | | |
| | | | |
| | | | |
| | | | |
Part I - Item 4. Controls and Procedures
EVALUATION OF DISCLOSURE CONTROLS AND PROCEDURES
The Company’s principal executive officer and its principal financial officer, based on their evaluation of the Company’s disclosure controls and procedures (as defined in Exchange Act Rule 13a-15(e)) have concluded that the Company’s disclosure controls and procedures are effective for the purposes set forth in the definition thereof in Exchange Act Rule 13a-15(e) as of June 30, 2022.
CHANGES IN INTERNAL CONTROL OVER FINANCIAL REPORTING
There were no changes in the Company's internal control over financial reporting that occurred during the Company's current fiscal quarter that have materially affected, or are reasonably likely to materially affect, the Company's internal control over financial reporting.
Part II - Item 1. Legal Proceedings
For a discussion regarding The Hartford’s legal proceedings, see the information contained in Note 13 - Commitments and Contingencies of the Notes to Condensed Consolidated Financial Statements.
Investing in The Hartford involves risk. In deciding whether to invest in The Hartford, you should carefully consider the risk factors disclosed in Item 1A of Part I of the Company's Annual Report on Form 10-K for the year ended December 31, 2021, (collectively the "Company's Risk Factors" or individually, the "Company's Risk Factor"), which is incorporated herein by
reference, any of which could have a significant or material adverse effect on the business, financial condition, operating results or liquidity of The Hartford. This information should be considered carefully together with the other information contained in this report and the other reports and materials filed by The Hartford with the SEC.
UNREGISTERED SALES OF EQUITY SECURITIES AND USE OF PROCEEDS PURCHASES OF EQUITY SECURITIES BY THE ISSUER
Repurchases of common stock by the Company during the quarter ended June 30, 2022 are set forth below. During the period from July 1, 2022 to July 27, 2022, the Company repurchased 1.7 million shares for $107.
| | | | | | | | | | | | | | |
| Repurchases of Common Stock by the Issuer for the Three Months Ended June 30, 2022 |
| Period | Total Number
of Shares
Purchased[1] | Average Price Paid Per Share | Total Number of Shares Purchased as Part of Publicly Announced Plans or Programs | Approximate Dollar Value
of Shares that May Yet Be
Purchased Under
the Plans or Programs[2] |
| | | | | (in millions) |
| April 1, 2022 - April 30, 2022 | 2,221,019 | | $ | 72.41 | | 2,212,000 | | $ | 738 | |
| May 1, 2022 - May 31, 2022 | 3,435,763 | | $ | 69.77 | | 3,427,927 | | $ | 498 | |
| June 1, 2022 - June 30, 2022 | 718,886 | | $ | 70.83 | | 715,575 | | $ | 448 | |
Total | 6,375,668 | | $ | 70.81 | | 6,355,502 | | |
| | | | |
| | | | |
[1]Includes 20,166 shares in net settlement of employee tax withholding obligations related to equity awards under the Company's incentive stock plans, which were not part of publicly announced share repurchase authorizations.The Company paid an average price per share of $71.30 in employee tax withholding obligations related to net share settlements in the three months ended June 30, 2022.
[2]On December 17, 2020, the Board of Directors authorized a new equity repurchase plan for $1.5 billion for the period commencing January 1, 2021 through December 31, 2022. The Board of Directors increased this authorization by $1.0 billion on April 22, 2021 and by $500 on October 28, 2021, bringing the aggregate repurchase authorization to $3.0 billion through December 31, 2022. In addition to the authorization covering the period from January 1, 2021 to December 31, 2022, in July, 2022, the Board of Directors approved a share repurchase authorization for up to $3.0 billion effective from August 1, 2022 to December 31, 2024, which is not reflected in the table above. The timing of any repurchases is dependent on several factors, including the market price of the Company's securities, the Company's capital position, consideration of the effect of any repurchases on the Company's financial strength or credit ratings, the Company's blackout periods, and other considerations.
EXHIBITS
| | | | | |
| See Exhibits Index on page | |
THE HARTFORD FINANCIAL SERVICES GROUP, INC.
FOR THE QUARTER ENDED JUNE 30, 2022
FORM 10-Q
EXHIBITS INDEX
| | | | | | | | | | | | | | | | | | |
| Exhibit No. | Description | Form | File No. | Exhibit No | Filing Date | |
| 3.01 | | 8-K | 001-13958 | 3.01 | 10/20/2014 | |
| 3.02 | | 8-K | 001-13958 | 3.1 | 7/21/2016 | |
| 15.01 | | | | | | |
| 31.01 | | | | | | |
| 31.02 | | | | | | |
| 32.01 | | | | | | |
| 32.02 | | | | | | |
| 101.INS | XBRL Instance Document - the instance document does not appear in the Interactive Data File because its XBRL tags are embedded within the Inline XBRL document. | | | | | |
| 101.SCH | Inline XBRL Taxonomy Extension Schema.** | | | | | |
| 101.CAL | Inline XBRL Taxonomy Extension Calculation Linkbase.** | | | | | |
| 101.DEF | Inline XBRL Taxonomy Extension Definition Linkbase.** | | | | | |
| 101.LAB | Inline XBRL Taxonomy Extension Label Linkbase.** | | | | | |
| 101.PRE | Inline XBRL Taxonomy Extension Presentation Linkbase.** | | | | | |
| 104 | The cover page from the Company's Quarterly Report on Form 10-Q for the quarter ended June 30, 2022, formatted in Inline XBRL. | | | | | |
| * | Management contract, compensatory plan or arrangement. | | | | | |
| ** | Filed with the Securities and Exchange Commission as an exhibit to this report. | | | | | |
SIGNATURE
Pursuant to the requirements of the Securities Exchange Act of 1934, the registrant has duly caused this report to be signed on its behalf by the undersigned hereunto duly authorized.
| | | | | | | | | | | | | | |
| | The Hartford Financial Services Group, Inc. |
| | (Registrant) |
| |
| Date: | July 28, 2022 | /s/ Scott R. Lewis |
| | Scott R. Lewis |
| | Senior Vice President and Controller |
| | (Chief accounting officer and duly authorized signatory) |
Exhibit 15.01
July 28, 2022
The Board of Directors and Stockholders of The Hartford Financial Services Group, Inc.
One Hartford Plaza
Hartford, Connecticut 06155
We are aware that our report dated July 28, 2022, on our review of the interim financial information of The Hartford Financial Services Group, Inc. and subsidiaries appearing in this Quarterly Report on Form 10-Q for the quarter ended June 30, 2022, is incorporated by reference in the following registration statements:
| | | | | | | | | | | |
| | | |
| Form S-3 Registration No. | | | Form S-8 Registration Nos. |
| | | |
| 333-262879 | | | 333-105707 |
| | | 333-49170 |
| | | 333-105706 |
| | | 333-34092 |
| | | 033-80665 |
| | | 333-12563 |
| | | 333-125489 |
| | | 333-157372 |
| | | 333-160173 |
| | | 333-168537 |
| | | 333-197671 |
| | | 333-240245 |
/s/ DELOITTE & TOUCHE LLP
Hartford, Connecticut
DocumentExhibit 31.01
THE HARTFORD FINANCIAL SERVICES GROUP, INC.
CERTIFICATION PURSUANT TO
18 U.S.C. SECTION 1350
AS ENACTED BY SECTION 302 OF THE SARBANES-OXLEY ACT OF 2002
I, Christopher J. Swift, certify that:
1.I have reviewed this Quarterly Report on Form 10-Q of The Hartford Financial Services Group, Inc.;
2.Based on my knowledge, this report does not contain any untrue statement of a material fact or omit to state a material fact necessary to make the statements made, in light of the circumstances under which such statements were made, not misleading with respect to the period covered by this report;
3.Based on my knowledge, the financial statements, and other financial information included in this report, fairly present in all material respects the financial condition, results of operations and cash flows of the registrant as of, and for, the periods presented in this report;
4.The registrant’s other certifying officer and I are responsible for establishing and maintaining disclosure controls and procedures (as defined in Exchange Act Rules 13a-15(e) and 15d-15(e)) and internal control over financial reporting (as defined in Exchange Act Rules 13a-15(f) and 15d-15(f)) for the registrant and have:
a.Designed such disclosure controls and procedures, or caused such disclosure controls and procedures to be designed under our supervision, to ensure that material information relating to the registrant, including its consolidated subsidiaries, is made known to us by others within those entities, particularly during the period in which this report is being prepared;
b.Designed such internal control over financial reporting, or caused such internal control over financial reporting to be designed under our supervision, to provide reasonable assurance regarding the reliability of financial reporting and the preparation of financial statements for external purposes in accordance with generally accepted accounting principles;
c.Evaluated the effectiveness of the registrant’s disclosure controls and procedures and presented in this report our conclusions about the effectiveness of the disclosure controls and procedures, as of the end of the period covered by this report based on such evaluation; and
d.Disclosed in this report any change in the registrant’s internal control over financial reporting that occurred during the registrant’s most recent fiscal quarter (the registrant’s fourth fiscal quarter in the case of an annual report) that has materially affected, or is reasonably likely to materially affect, the registrant’s internal control over financial reporting; and
5.The registrant’s other certifying officer and I have disclosed, based on our most recent evaluation of internal control over financial reporting, to the registrant’s auditors and the audit committee of the registrant’s board of directors (or persons performing the equivalent functions):
a.All significant deficiencies and material weaknesses in the design or operation of internal control over financial reporting which are reasonably likely to adversely affect the registrant’s ability to record, process, summarize and report financial information; and
b.Any fraud, whether or not material, that involves management or other employees who have a significant role in the registrant’s internal control over financial reporting.
| | | | | | | | |
| Date: | July 28, 2022 | /s/ Christopher J. Swift
|
| | Christopher J. Swift |
| | Chief Executive Officer |
DocumentExhibit 31.02
THE HARTFORD FINANCIAL SERVICES GROUP, INC.
CERTIFICATION PURSUANT TO
18 U.S.C. SECTION 1350
AS ENACTED BY SECTION 302 OF THE SARBANES-OXLEY ACT OF 2002
I, Beth A. Costello, certify that:
1.I have reviewed this Quarterly Report on Form 10-Q of The Hartford Financial Services Group, Inc.;
2.Based on my knowledge, this report does not contain any untrue statement of a material fact or omit to state a material fact necessary to make the statements made, in light of the circumstances under which such statements were made, not misleading with respect to the period covered by this report;
3.Based on my knowledge, the financial statements, and other financial information included in this report, fairly present in all material respects the financial condition, results of operations and cash flows of the registrant as of, and for, the periods presented in this report;
4.The registrant’s other certifying officer and I are responsible for establishing and maintaining disclosure controls and procedures (as defined in Exchange Act Rules 13a-15(e) and 15d-15(e)) and internal control over financial reporting (as defined in Exchange Act Rules 13a-15(f) and 15d-15(f)) for the registrant and have:
a.Designed such disclosure controls and procedures, or caused such disclosure controls and procedures to be designed under our supervision, to ensure that material information relating to the registrant, including its consolidated subsidiaries, is made known to us by others within those entities, particularly during the period in which this report is being prepared;
b.Designed such internal control over financial reporting, or caused such internal control over financial reporting to be designed under our supervision, to provide reasonable assurance regarding the reliability of financial reporting and the preparation of financial statements for external purposes in accordance with generally accepted accounting principles;
c.Evaluated the effectiveness of the registrant’s disclosure controls and procedures and presented in this report our conclusions about the effectiveness of the disclosure controls and procedures, as of the end of the period covered by this report based on such evaluation; and
d.Disclosed in this report any change in the registrant’s internal control over financial reporting that occurred during the registrant’s most recent fiscal quarter (the registrant’s fourth fiscal quarter in the case of an annual report) that has materially affected, or is reasonably likely to materially affect, the registrant’s internal control over financial reporting; and
5.The registrant’s other certifying officer and I have disclosed, based on our most recent evaluation of internal control over financial reporting, to the registrant’s auditors and the audit committee of the registrant’s board of directors (or persons performing the equivalent functions):
a.All significant deficiencies and material weaknesses in the design or operation of internal control over financial reporting which are reasonably likely to adversely affect the registrant’s ability to record, process, summarize and report financial information; and
b.Any fraud, whether or not material, that involves management or other employees who have a significant role in the registrant’s internal control over financial reporting.
| | | | | | | | |
| Date: | July 28, 2022 | /s/ Beth A. Costello |
| | Beth A. Costello |
| | Executive Vice President and Chief Financial Officer |
DocumentExhibit 32.01
THE HARTFORD FINANCIAL SERVICES GROUP, INC.
CERTIFICATION PURSUANT TO
18 U.S.C. SECTION 1350
AS ENACTED BY SECTION 906 OF THE SARBANES-OXLEY ACT OF 2002
In connection with the Quarterly Report on Form 10-Q for the period ended June 30, 2022 of The Hartford Financial Services Group, Inc. (the “Company”), filed with the Securities and Exchange Commission on the date hereof (the “Report”), the undersigned hereby certifies, pursuant to 18 U.S.C. section 1350 as enacted by section 906 of the Sarbanes-Oxley Act of 2002, that:
1)The Report fully complies with the requirements of section 13(a) or section 15(d) of the Securities Exchange Act of 1934; and
2)The information contained in the Report fairly presents, in all material respects, the financial condition and results of operations of the Company.
| | | | | | | | |
| Date: | July 28, 2022 | /s/ Christopher J. Swift |
| | Christopher J. Swift |
| | Chief Executive Officer |
Document
Exhibit 32.02
THE HARTFORD FINANCIAL SERVICES GROUP, INC.
CERTIFICATION PURSUANT TO
18 U.S.C. SECTION 1350
AS ENACTED BY SECTION 906 OF THE SARBANES-OXLEY ACT OF 2002
In connection with the Quarterly Report on Form 10-Q for the period ended June 30, 2022 of The Hartford Financial Services Group, Inc. (the “Company”), filed with the Securities and Exchange Commission on the date hereof (the “Report”), the undersigned hereby certifies, pursuant to 18 U.S.C. section 1350 as enacted by section 906 of the Sarbanes-Oxley Act of 2002, that:
1)The Report fully complies with the requirements of section 13(a) or section 15(d) of the Securities Exchange Act of 1934; and
2)The information contained in the Report fairly presents, in all material respects, the financial condition and results of operations of the Company.
| | | | | | | | |
| Date: | July 28, 2022 | /s/ Beth A. Costello |
| | Beth A. Costello |
| | Executive Vice President and Chief Financial Officer |