Exhibit 99.1

TRX Gold Corporation
Condensed Interim Consolidated
Financial Statements
(Unaudited)
For the three and nine months ended
May 31, 2022 and 2021
1
TRX Gold Corporation
Condensed Interim Consolidated Statements of Financial Position
(Unaudited)
(Expressed in Thousands of US Dollars)
May 31, 2022 | August 31, 2021 | |||||||
| Assets | ||||||||
| Current Assets | ||||||||
| Cash | $ | $ | ||||||
| Amounts receivable (Note 5) | ||||||||
| Prepaid and other assets (Note 6) | ||||||||
| Inventory (Note 7) | ||||||||
| Total current assets | ||||||||
| Mineral property, plant and equipment (Note 8) | ||||||||
| Exploration and evaluation assets and expenditures (Note 9) | ||||||||
| Total assets | $ | $ | ||||||
| Liabilities | ||||||||
| Current Liabilities | ||||||||
| Amounts payable and accrued liabilities (Note 10) | $ | $ | ||||||
| Income tax payable (Note 11) | ||||||||
| Derivative warrant liabilities (Note 12) | ||||||||
| Total current liabilities | ||||||||
| Provision for reclamation | ||||||||
| Total liabilities | ||||||||
| Shareholders’ equity | ||||||||
| Share capital (Note 13) | ||||||||
| Share based payment reserve (Note 14) | ||||||||
| Warrants reserve | ||||||||
| Accumulated deficit | ( | ) | ( | ) | ||||
| Equity attributable to owners of the Company | ||||||||
| Non-controlling interests (Note 16) | ( | ) | ||||||
| Total shareholders’ equity | ||||||||
| Total Shareholders’ Equity and Liabilities | $ | $ |
Nature of operations (Note 1)
Commitments and Contingencies (Note 23)
The accompanying notes are an integral part of these condensed consolidated interim financial statements.
2
TRX Gold Corporation
Condensed Interim Consolidated Statements of Earnings (Loss) and Comprehensive Income (Loss)
(Unaudited)
(Expressed in Thousands of US Dollars)
Three months ended May 31, | Nine months ended May 31, | |||||||||||||||
| 2022 | 2021 | 2022 | 2021 | |||||||||||||
| Restated – notes 2 and 4 | Restated – notes 2 and 4 | |||||||||||||||
| Revenues | ||||||||||||||||
| Precious metal sales | $ | $ | $ | $ | ||||||||||||
| Cost of sales | ||||||||||||||||
| Production costs | ( | ) | ( | ) | ||||||||||||
| Royalty | ( | ) | ( | ) | ||||||||||||
| Depreciation | ( | ) | ( | ) | ||||||||||||
| Total cost of sales | ( | ) | ( | ) | ||||||||||||
| Gross profit | ||||||||||||||||
| General and administrative expense (Note 18) | ( | ) | ( | ) | ( | ) | ( | ) | ||||||||
| Financial instrument related cost and other (Note 19) | ||||||||||||||||
| Reclamation expense | ( | ) | ( | ) | ( | ) | ( | ) | ||||||||
| Loss on disposal of assets | ( | ) | ( | ) | ( | ) | ( | ) | ||||||||
| Transaction costs on convertible debenture | ( | ) | ( | ) | ||||||||||||
| Foreign exchange | ( | ) | ( | ) | ||||||||||||
| Interest, net and other expense | ( | ) | ( | ) | ( | ) | ||||||||||
| Earnings (loss) before tax | ( | ) | ||||||||||||||
| Income tax expense (Note 11) | ( | ) | ( | ) | ||||||||||||
| Earnings (loss) and comprehensive income (loss) | $ | $ | $ | $ | ( | ) | ||||||||||
| Net earnings (loss) and comprehensive income (loss) attributable to: | ||||||||||||||||
| Non-controlling interest | $ | $ | ( | ) | $ | $ | ( | ) | ||||||||
| Common shares shareholders | $ | $ | $ | ( | ) | $ | ( | ) | ||||||||
| Net earnings (loss) per share attributable to shareholders (Note 13): | ||||||||||||||||
| Basic and diluted | $ | $ | $ | ( | ) | $ | ( | ) | ||||||||
| Weighted average number of shares outstanding (Note 13): | ||||||||||||||||
| Basic | ||||||||||||||||
| Diluted | ||||||||||||||||
The accompanying notes are an integral part of these condensed consolidated interim financial statements.
3
TRX Gold Corporation
Condensed Interim Consolidated Statements of Changes in Equity
(Unaudited)
(Expressed in Thousands of US Dollars)
| Share Capital | Reserves | |||||||||||||||||||||||||||||||
| Number of Shares | Amount | Share based payments | Warrants | Accumulated deficit | Owner's equity | Non-controlling interests | Total equity | |||||||||||||||||||||||||
| Balance at August 31, 2020 | $ | $ | $ | $ | ( | ) | $ | $ | ( | ) | $ | |||||||||||||||||||||
| Issued for cash, net of share issue costs | ||||||||||||||||||||||||||||||||
| Warrants issued (Note 15) | - | ( | ) | ( | ) | ( | ) | |||||||||||||||||||||||||
| Issued for settlement of convertible debentures | ||||||||||||||||||||||||||||||||
| Shares issued for settlement of debts related to convertible and gold loans | ||||||||||||||||||||||||||||||||
| Options exercised (Note 14) | ||||||||||||||||||||||||||||||||
| Transfer of reserve on exercise of options | - | ( | ) | |||||||||||||||||||||||||||||
| Net loss for the period | - | ( | ) | ( | ) | ( | ) | ( | ) | |||||||||||||||||||||||
| Balance at May 31, 2021 | $ | $ | $ | $ | ( | ) | $ | $ | ( | ) | $ | |||||||||||||||||||||
| Share based compensation - common shares | - | |||||||||||||||||||||||||||||||
| Net loss for the period | - | ( | ) | ( | ) | ( | ) | ( | ) | |||||||||||||||||||||||
| Balance at August 31, 2021 | $ | $ | $ | $ | ( | ) | $ | $ | ( | ) | $ | |||||||||||||||||||||
| Shares issued for settlement of debts (Note 13) | ||||||||||||||||||||||||||||||||
| Shares issued for financing (Note 13) | ||||||||||||||||||||||||||||||||
| Shares issued for cash, net of share issue costs (Note 13) | ||||||||||||||||||||||||||||||||
| Options exercised (Note 14) | ( | ) | ||||||||||||||||||||||||||||||
| Shares issued for share based payments (Note 13) | ( | ) | ( | ) | ( | ) | ||||||||||||||||||||||||||
| Warrants issued (Note 15) | - | |||||||||||||||||||||||||||||||
| Share based compensation - expenses (Note 13) | - | |||||||||||||||||||||||||||||||
| Net earnings (loss) for the period | - | ( | ) | ( | ) | |||||||||||||||||||||||||||
| Balance at May 31, 2022 | $ | $ | $ | $ | ( | ) | $ | $ | $ | |||||||||||||||||||||||
The accompanying notes are an integral part of these condensed consolidated interim financial statements.
4
TRX Gold Corporation
Condensed Interim Consolidated Statements of Cash Flow
(Unaudited)
(Expressed in Thousands of US Dollars)
Three months ended May 31, | Nine months ended May 31, | |||||||||||||||
| 2022 | 2021 | 2022 | 2021 | |||||||||||||
| Restated – notes 2 and 4 | Restated – notes 2 and 4 | |||||||||||||||
| Operating | ||||||||||||||||
| Net earnings (loss) | $ | $ | $ | $ | ( | ) | ||||||||||
| Adjustments for items not involving cash: | ||||||||||||||||
| Non-cash items (Note 24) | ( | ) | ( | ) | ( | ) | ||||||||||
| Non-cash cost of share issuance | ( | ) | ||||||||||||||
| Changes in non-cash working capital: | ||||||||||||||||
| Amounts receivable | ( | ) | ( | ) | ||||||||||||
| Inventory | ( | ) | ( | ) | ( | ) | ||||||||||
| Prepaid and other assets | ( | ) | ( | ) | ( | ) | ( | ) | ||||||||
| Amounts payable and accrued liabilities | ||||||||||||||||
| Income tax payable | ||||||||||||||||
| Cash provided by (used in) operating activities | ( | ) | ( | ) | ||||||||||||
| Investing | ||||||||||||||||
| Exploration and evaluation assets and expenditures | ( | ) | ( | ) | ( | ) | ||||||||||
| Pre-adoption of IAS 16 proceeds from gold sales | ||||||||||||||||
| Purchase of mineral property, plant and equipment | ( | ) | ( | ) | ( | ) | ( | ) | ||||||||
| Cash used in investing activities | ( | ) | ( | ) | ( | ) | ( | ) | ||||||||
| Financing | ||||||||||||||||
| Proceeds from issuance of shares and warrants | ||||||||||||||||
| Issue costs | ( | ) | ( | ) | ( | ) | ||||||||||
| Repayment of leases | ( | ) | ||||||||||||||
| Proceeds from issuance of convertible debentures | ||||||||||||||||
| Cash (used in) provided by financing activities | ( | ) | ||||||||||||||
| Net increase (decrease) in cash | ( | ) | ( | ) | ( | ) | ||||||||||
| Cash, beginning of period | ||||||||||||||||
| Cash, end of period | $ | $ | $ | $ | ||||||||||||
The accompanying notes are an integral part of these condensed consolidated interim financial statements.
5
TRX Gold Corporation
Notes to the Condensed Interim Consolidated Financial Statements
(Unaudited)
For the Three and Nine Month Periods Ended May 31, 2022 and 2021
(Expressed in Thousands of US dollars, except for share and per share amounts)
| 1. | Nature of Operations |
The Company was originally incorporated under the corporate name “424547 Alberta Ltd.” in the Province of Alberta on July 5, 1990, under the Business Corporations Act (Alberta). The name of the Company was changed to TRX Gold Corporation on May 27, 2022 (“TRX Gold”, “Group” or the “Company”). The address of the Company’s registered office is 400 3rd Avenue SW, Suite 3700, Calgary, Alberta, T2P 4H2, Canada. The address of the Company’s principal place of business is 150 King Street West, Suite 200, Toronto, Ontario, M5H 1J9. The Company’s principal business activity is the exploration, development and production of mineral property interests. The Company’s mineral properties are located in United Republic of Tanzania (“Tanzania”).
The Company’s common shares are listed on the Toronto Stock Exchange in Canada and New York Stock Exchange American in the United States of America.
| 2. | Basis of Preparation and Significant Accounting Policies |
| a) | Basis of presentation and measurement |
These unaudited condensed interim consolidated financial statements (“interim financial statements”) of the Company and its subsidiaries have been prepared in accordance with International Financial Reporting Standard (“IFRS”), International Accounting Standard 34, Interim Financial Reporting (“IAS 34”), as issued by the International Accounting Standards Board (“IASB”). These interim financial statements do not contain all of the required annual disclosures and should be read in conjunction with the Company’s audited consolidated financial statements for the year ended August 31, 2021.
The interim financial statements have been prepared on a historical cost basis except for certain financial instruments which have been measured at fair value.
Statement of financial position items are classified as current if receipt or payment is due within twelve months. Otherwise, they are presented as non-current.
During the year ended August 31, 2021, the Company changed its presentation currency from the Canadian dollar to the US dollar. The Company believes that the change in presentation currency will provide shareholders with a better reflection of the Company’s business activities and enhance the comparability of the Company’s financial information to its peers. For more details, see Note 4 of these interim financial statements. Reference herein of $ or USD is to US dollars, C$ or CAD is to Canadian dollars.
These interim financial statements were approved by the Board of Directors for issue on July 14, 2022.
| b) | Significant accounting policies |
The accounting policies applied in these interim financial statements are consistent with those applied in the preparation of the Company’s annual consolidated financial statements for the year ended August 31, 2021 except as noted and clarified below.
6
TRX Gold Corporation
Notes to the Condensed Interim Consolidated Financial Statements
(Unaudited)
For the Three and Nine Month Periods Ended May 31, 2022 and 2021
(Expressed in Thousands of US dollars, except for share and per share amounts)
Mineral properties – Construction in progress
All expenditures undertaken in the development, construction, installation and/or completion of mine production facilities to extract, treat, gather, transport and store of minerals are capitalized and initially classified as “Construction in progress”. All expenditures related to the construction of a mine and obtaining access to the orebody are considered to be capital development and are capitalized. Expenses incurred after reaching the orebody are regarded as operating costs and are included in the cost of ore.
Upon the commencement of commercial production, all related assets included in “Construction in progress” are reclassified to “Mineral properties” or “Property, plant and equipment”. Determination of commencement of commercial production is a complex process and requires significant assumptions and estimates. The commencement of commercial production is defined as the date when the mine is capable of operating in the manner intended by management. The Company considers primarily the following factors, among others, when determining the commencement of commercial production:
| · | All major capital expenditures to achieve a consistent level of production and desired capacity have been incurred; |
| · | A reasonable period of testing of the mine plant and equipment has been completed; |
| · | A predetermined percentage of design capacity of the mine and mill has been reached; and |
| · | Required production levels, grades and recoveries have been achieved. |
Amendments to IAS 16, Property Plant and Equipment
The Company has early adopted amendments to IAS 16, Property Plant and Equipment as amended in 2020 and are effective for annual reporting periods beginning on or after January 1, 2022. The amendments prohibit the deduction from the cost of an item of property, plant and equipment any proceeds received from the sales of the items produced while bringing the asset to the location and condition necessary for it to be capable of operating in the manner intended by management. Instead, the entity recognizes the proceeds from the sale of such items, and the cost of producing those items in the Condensed Interim Consolidated Statements of Earnings (Loss) and Comprehensive Income (Loss). There was no impact of this adoption to the comparative periods as these amendments are only applicable to assets accounted for under IAS 16.
Revenue recognition
Revenue from the sale of gold is measured based on the agreed gold price related to the spot gold price specified in a contract with a customer. The Company recognizes revenue when the Company transfers control of its gold over to a customer, either in the form of refined gold or gold doré bars, and no further performance obligation is required from the Company. Typically, the transfer of control occurs when the customer has taken delivery and the consideration is received, or to be received.
7
TRX Gold Corporation
Notes to the Condensed Interim Consolidated Financial Statements
(Unaudited)
For the Three and Nine Month Periods Ended May 31, 2022 and 2021
(Expressed in Thousands of US dollars, except for share and per share amounts)
Inventory
Inventory classifications include stockpiled ore, gold in-circuit inventory, gold doré inventory and supplies. The value of all production inventories includes direct production costs and attributable overhead incurred to bring the materials to their current point in the processing cycle. General and administrative costs for the corporate office are not included in any inventories. All inventories are valued at the lower of cost and net realizable value, with net realizable value determined with reference to market prices, less estimated future production costs to convert inventories into saleable form. If carrying value exceeds net realizable value, a write-down is recognized. The write-down may be reversed in a subsequent period if the circumstances which caused the write-down no longer exists.
| i) | Stockpiled ore represents unprocessed ore that has been mined and is available for future processing. Stockpiled ore is measured by estimating the number of tonnes through physical surveys and contained ounces. Stockpiled ore value is based on the costs incurred, including depreciation and applicable mine-site overheads, in bringing the ore to the stockpile. Costs are added to the stockpiled ore based on current mining costs and are removed at the average costs per tonne of ore in the stockpile. |
| ii) | Gold in-circuit inventory represents material that is currently being processed to extract the contained gold into a saleable form. The amount of gold in-circuit is determined by assay values and by measure of the various gold bearing materials in the recovery process. The in-circuit gold is valued at the average of the beginning inventory and the costs of material fed into the processing stream plus in-circuit conversion costs including applicable mine-site overheads. |
| iii) | Gold doré inventory is saleable gold in the form of doré bars that have been poured. Included in the costs are the direct costs of mining and processing operations as well as direct mine site overheads. |
| iv) | Supplies inventories include equipment parts and other consumables required in the mining and ore processing activities and are valued at the lower of average cost and net realizable value. |
| c) | New accounting pronouncements |
New standards and amendments issued but not yet effective or adopted are described below
| i) | In May 2021, the IASB issued amendments to IAS 12, Income Taxes. The amendments to IAS 12 narrow the scope of the initial recognition exemption so that it no longer applies to transactions which give rise to equal amounts of taxable and deductible temporary differences. The Company is to recognize a deferred tax asset and deferred tax liability for temporary differences arising on initial recognition for certain transactions, including leases and reclamation provisions. The amendments to IAS 12 are effective for annual reporting periods beginning on or after January 1, 2023, with early adoption permitted. |
The Company is currently evaluating the impact of these amendments on its consolidated financial statements prior to the effective date.
8
TRX Gold Corporation
Notes to the Condensed Interim Consolidated Financial Statements
(Unaudited)
For the Three and Nine Month Periods Ended May 31, 2022 and 2021
(Expressed in Thousands of US dollars, except for share and per share amounts)
| ii) | IAS 1, Presentation of Financial Statements In January 2020, the IASB issued an amendment to IAS 1, Presentation of Financial Statements, to clarify one of the requirements under the standard for classifying a liability as non-current in nature. The amendment includes: |
| § | Specifying that an entity’s right to defer settlement must exist at the end of the reporting period; |
| § | Clarifying that classification is unaffected by management’s intentions or expectations about whether the entity will exercise its right to defer settlement; |
| § | Clarifying how lending conditions affect classification; and – Clarifying if the settlement of a liability refers to the transfer of cash, equity instruments, other assets or services. |
| The Company is currently evaluating the impact of these amendments on its consolidated financial statements prior to the effective date. |
| 3. | Significant Accounting Judgments, Estimates and Assumptions |
The preparation of financial statements in conformity with IFRS requires management to make judgments, estimates and assumptions that affect the reported amounts of assets, liabilities and expenses. Estimates and judgments are regularly evaluated and are based on historical experience and other factors, including expectations of future events that are believed to be reasonable under the circumstances. Uncertainty about these assumptions and estimates could result in outcomes that require a material adjustment to the carrying amount of assets or liabilities affected in future periods. The following discusses the most significant accounting policy judgments and accounting estimates that the Company has made in the preparation of the interim financial statements that could result in a material effect during the current reporting period on the carrying amounts of assets and liabilities:
| a) | Accounting Policy Judgements |
The Company made the following critical judgements in applying its accounting policies during the nine months period ended May 31, 2022:
| i) | Exploration and Evaluation Assets and Expenditures |
The application of the Company’s accounting policy for exploration and evaluation assets and expenditures requires judgment to determine whether future economic benefits are likely, from either future exploitation or sale, or whether activities have not reached a stage that permits a reasonable assessment of the existence of reserves, and to determine whether indicators of impairment exist including factors such as, the period for which the Company has the right to explore, expected renewals of exploration rights, whether substantive expenditures on further exploration and evaluation of resource properties are budgeted and evaluation of the results of exploration and evaluation activities up to the reporting date.
| ii) | Determination of Commercial Viability and Technical Feasibility of the Buckreef Gold Project |
The application of the Company’s accounting policy for mineral property development costs required judgment to determine when technical feasibility and commercial viability of the Buckreef Gold Project was demonstrable. The Company considered the positive NI 43-101 compliant Preliminary Feasibility Study (“PFS”) published in 2018, updated resource in 2020, the results from the 120 tonnes per day “tpd” oxide processing plant constructed for testing purposes and interim operation of 360 tpd plant, all of which led to a decision to construct a 1,000+ tpd processing plant with an expectation of generating a positive long-term return on the Buckreef Gold Project based on a positive Net Present Value generated from a discounted cash flow model.
9
TRX Gold Corporation
Notes to the Condensed Interim Consolidated Financial Statements
(Unaudited)
For the Three and Nine Month Periods Ended May 31, 2022 and 2021
(Expressed in Thousands of US dollars, except for share and per share amounts)
| b) | Estimates and Assumptions |
The preparation of interim financial statements in conformity with IFRS requires management to make estimates and assumptions that affect the reported amount of assets and liabilities, the disclosure of contingent assets and liabilities as at the date of the condensed consolidated interim financial statements and the reported amount of revenues and expenses for the reporting period.
The main sources of estimation uncertainty and critical judgments by management applicable to these interim financial statements are the same as those presented in the Company’s consolidated financial statements for the year ended August 31, 2021.
| i) | Exploration and Evaluation Assets and Expenditures |
As noted above, during the three months ended November 30, 2021, with the construction decision from the Board of Directors, the Buckreef Gold Project transitioned from an exploration and evaluation asset under IFRS 6 to mineral property, plant and equipment under IAS 16. At the time of the transition from exploration and evaluation to mineral property, plant and equipment, the Company completed an impairment test as required by IFRS 6. The impairment test compared the carrying amount of the Buckreef Gold Project to its recoverable amount. The recoverable amount is the higher of the value in use and the fair value less costs of disposal. The Company estimated the recoverable amount using the discounted cash flow model as noted above. The significant assumptions that impacted the resulting fair value include future gold prices, capital cost estimates, operating cost estimates, estimated reserves and resources and the discount rate. Upon completion of the impairment tests, the Company concluded that there was no impairment.
| 4. | Change in Presentation Currency |
Effective September 1, 2020, the Company changed its presentation currency to US dollars from CAD dollars. The Company believes that the change in presentation currency will provide shareholders with a better reflection of the Company’s business activities and enhance the comparability of the Company’s financial information to peers. The change in presentation currency represents a voluntary change in accounting policy, which is accounted for retrospectively. The interim consolidated financial statements for all periods presented have been translated into the new presentation currency in accordance with IAS 21 – The Effects of Changes in Foreign Exchange Rates.
The condensed interim consolidated statements of earnings (loss) and comprehensive Income (loss) and the condensed interim consolidated statements of cash flows have been translated into the presentation currency using the average exchange rates prevailing during each reporting period. In the condensed interim consolidated statements of financial position, all assets and liabilities have been translated using the period end exchange rates, and all resulting exchange differences have been recognized in accumulated deficit. Asset and liability amounts previously reported in Canadian dollars have been translated into US dollars as at May 31, 2021, using the period end exchange rates of 1.207 CAD/USD, and shareholders’ equity balances have been translated using historical rates in effect on the date of the transactions.
10
TRX Gold Corporation
Notes to the Condensed Interim Consolidated Financial Statements
(Unaudited)
For the Three and Nine Month Periods Ended May 31, 2022 and 2021
(Expressed in Thousands of US dollars, except for share and per share amounts)
The change in presentation currency resulted in the following impact on the May 31, 2021 condensed interim consolidated statement of financial position:
| As at May 31, 2021 | ||||||||||||
Reported at May 31, 2021 in CAD | Presentation currency change | Restated at May 31, 2021 in USD | ||||||||||
| Consolidated statement of financial position | ||||||||||||
| Cash | ( | ) | ||||||||||
| Other current assets | ( | ) | ||||||||||
| Non-current assets | ( | ) | ||||||||||
| Total assets | ( | ) | ||||||||||
| Current liabilities | ( | ) | ||||||||||
| Long term debt | ( | ) | ||||||||||
| Total liabilities | ( | ) | ||||||||||
| Share capital | ( | ) | ||||||||||
| Reserves | ( | ) | ||||||||||
| Accumulated deficit and other comprehensive income | ( | ) | ( | ) | ||||||||
| Non-controlling interests | ( | ) | ( | ) | ||||||||
| Total shareholders’ equity | ( | ) | ||||||||||
| Total shareholders’ equity and liabilities | ( | ) | ||||||||||
The change in presentation currency resulted in the following impact on the May 31, 2021 consolidated statement of comprehensive income (loss):
Reported at May 31, 2021 in CAD Three months | Presentation currency change | Reported at May 31, 2021 in USD Three months | ||||||||||
| General and administrative expense | ( | ) | ( | ) | ( | ) | ||||||
| Other income (expense) | ||||||||||||
| Net loss and comprehensive loss | ( | ) | ||||||||||
| Earnings per share – basic and diluted | ( | ) |
11
TRX Gold Corporation
Notes to the Condensed Interim Consolidated Financial Statements
(Unaudited)
For the Three and Nine Month Periods Ended May 31, 2022 and 2021
(Expressed in Thousands of US dollars, except for share and per share amounts)
Reported at May 31, 2021 in
Nine months | Presentation currency change | Reported at May 31, 2021 in USD Nine months | ||||||||||
| General and administrative expense | ( | ) | ( | ) | ||||||||
| Other income (expense) | ( | ) | ||||||||||
| Net loss and comprehensive loss | ( | ) | ( | ) | ( | ) | ||||||
| Earnings per share attributable to shareholders – basic and diluted | ( | ) | ( | ) |
The change in presentation currency resulted in the following impact on the May 31, 2021 consolidated statement of cash flow:
Reported at May
31, 2021 in | Presentation currency change | Restated at May 31, 2021 in
| ||||||||||
| Cash used in operating activities | ( | ) | ( | ) | ||||||||
| Cash used in investing activities | ( | ) | ( | ) | ||||||||
| Cash provided by financing activities | ( | ) | ||||||||||
| Net increase in cash | ( | ) | ||||||||||
| Cash beginning of period | ( | ) | ||||||||||
| Cash end of period | ( | ) |
| 5. | Amounts receivable |
May 31, 2022 | August 31, 2021 | |||||||
| Receivable from precious metal sales | $ | |||||||
| Sales tax receivables (1) | ||||||||
| Other | ||||||||
| Amounts Receivable | $ | $ |
| (1) |
12
TRX Gold Corporation
Notes to the Condensed Interim Consolidated Financial Statements
(Unaudited)
For the Three and Nine Month Periods Ended May 31, 2022 and 2021
(Expressed in Thousands of US dollars, except for share and per share amounts)
Below is an aged analysis of the Company’s amounts receivable:
May 31, 2022 | August 31, 2021 | |||||||
| Less than 1 month | $ | $ | ||||||
| 1 to 3 months | ||||||||
| Over 3 months | ||||||||
| $ | $ |
At May 31, 2022, the Company anticipates full recovery of these amounts and therefore no impairment has been recorded against these receivables. The credit risk on the receivables is further discussed in Note 21.
The Company holds no collateral for any receivable amounts outstanding as at May 31, 2022.
| 6. | Prepaid and other assets |
May 31, 2022 | August 31, 2021 | |||||||
| Drilling | $ | $ | ||||||
| Insurance | ||||||||
| Listing fees | ||||||||
| Conference fees | ||||||||
| Other | ||||||||
| Subtotal | 217 | 332 | ||||||
| Financing fees | ||||||||
| Total Prepaid Expenses | $ | $ |
| 7. | Inventory |
Inventory consists of stockpiled ore, gold in-circuit, gold doré and supplies required during the course of exploration, development and production from its operations. IAS 2 requires allocation of fixed and variable production overheads that are incurred in converting materials into finished goods. The following is a breakdown of items in inventory:
May 31, 2022 | August 31, 2021 | |||||||
| Stockpiled ore | $ | $ | ||||||
| In-circuit | ||||||||
| Precious metals inventory | ||||||||
| Supplies | ||||||||
| Total Inventory | $ | $ |
13
TRX Gold Corporation
Notes to the Condensed Interim Consolidated Financial Statements
(Unaudited)
For the Three and Nine Month Periods Ended May 31, 2022 and 2021
(Expressed in Thousands of US dollars, except for share and per share amounts)
| 8. | Mineral property, plant and equipment |
| Construction in progress | Processing plant and related infrastructure | Machinery and equipment | Other | Total | ||||||||||||||||
| Cost | ||||||||||||||||||||
| As at September 1, 2020 | $ | $ | $ | $ | $ | |||||||||||||||
| Additions | ||||||||||||||||||||
| Disposals | ( | ) | ( | ) | ( | ) | ||||||||||||||
| As at August 31, 2021 | $ | $ | $ | $ | $ | |||||||||||||||
| Additions | ||||||||||||||||||||
| Disposals | ( | ) | ( | ) | ||||||||||||||||
| Transfer from E&E assets | ||||||||||||||||||||
| As at May 31, 2022 | $ | $ | $ | $ | $ | |||||||||||||||
| Accumulated depreciation | ||||||||||||||||||||
| As at September 1, 2020 | $ | $ | $ | $ | $ | |||||||||||||||
| Depreciation expense | ||||||||||||||||||||
| Disposals | ( | ) | ( | ) | ( | ) | ||||||||||||||
| As at August 31, 2021 | $ | $ | $ | $ | $ | |||||||||||||||
| Depreciation expense | ||||||||||||||||||||
| Disposals | ( | ) | ( | ) | ||||||||||||||||
| As at May 31, 2022 | $ | $ | $ | $ | $ | |||||||||||||||
| Net book value | - | |||||||||||||||||||
| As at August 31, 2021 | $ | $ | $ | $ | $ | |||||||||||||||
| As at May 31, 2022 | $ | $ | $ | $ | $ |
No depreciation or depletion has been recorded for the Construction in progress assets including transferred E&E assets as they are not ready for use as intended by management.
14
TRX Gold Corporation
Notes to the Condensed Interim Consolidated Financial Statements
(Unaudited)
For the Three and Nine Month Periods Ended May 31, 2022 and 2021
(Expressed in Thousands of US dollars, except for share and per share amounts)
| 9. | Exploration and evaluation assets and expenditures |
The Company explores or acquires gold or other precious metal concessions through its own efforts or through the efforts of its subsidiaries. All of the Company’s concessions are located in Tanzania.
The continuity of expenditures on mineral property is as follows:
Buckreef Gold Project:
At the time of the transition from exploration and evaluation to mineral property, plant and equipment, the Company completed an impairment test as required by IFRS 6. The impairment test compared the carrying amount of the Buckreef Gold Project to its recoverable amount. The recoverable amount is the higher of the value in use and the fair value less costs of disposal. The Company estimated the recoverable amount using the discounted cash flow model as noted above. The significant assumptions that impacted the resulting fair value include future gold prices, capital cost estimates, operating cost estimates, estimated reserves and resources and the discount rate. Upon completion of the impairment tests, the Company concluded that there was no impairment.
| Buckreef | ||||
| Balance, August 31, 2020 | $ | |||
| Exploration expenditures: | ||||
| Camp, field supplies and travel | ||||
| License fees and exploration and field overhead | ||||
| Geological consulting and field wages | ||||
| Trenching and drilling | ||||
| Mine design | ||||
| Mining and processing costs | ||||
| Change in estimate of asset retirement obligation | ( | ) | ||
| Gold sales | ( | ) | ||
| Payments to STAMICO as per Joint Venture agreement | ||||
| Balance, August 31, 2021 | $ | |||
| Exploration expenditures: | ||||
| Camp, field supplies and travel | ||||
| License fees and exploration and field overhead | ||||
| Geological consulting and field wages | ||||
| Trenching and drilling | ||||
| Mine design | ||||
| Mining and processing costs | ||||
| Gold sales | ( | ) | ||
| Payments to STAMICO as per Joint Venture agreement | ||||
| Balance, November 30, 2021 | $ | 40,563 | ||
| Reclassification to mineral property, plant and equipment (Note 8) | ( | ) | ||
| Balance, May 31, 2022 | $ |
15
TRX Gold Corporation
Notes to the Condensed Interim Consolidated Financial Statements
(Unaudited)
For the Three and Nine Month Periods Ended May 31, 2022 and 2021
(Expressed in Thousands of US dollars, except for share and per share amounts)
| 10. | Amounts payable and accrued liabilities |
May 31, 2022 | August 31, 2021 | |||||||
| Amounts payable | $ | $ | ||||||
| Accrued liabilities | ||||||||
| Total Amount Payables and Accrued Liabilities | $ | $ |
The following is an aged analysis of the amounts payable and accrued liabilities:
May 31, 2022 | August 31, 2021 | |||||||
| Less than 1 month | $ | $ | ||||||
| 1 to 3 months | ||||||||
| Over 3 months | ||||||||
| $ | $ |
| 11. | Income tax |
Income
tax expense is recognized based on management’s estimate of the weighted average annual income tax rate expected for the full financial
year. During the three months and nine months ended May 31, 2022, the Company recorded net income at its Buckreef Gold Project and recognized
a current income tax expense of $
| 12. | Derivative warrant liabilities |
Private Placement Warrants:
During the year ended August 31, 2021, the Company issued warrants for the Company’s common shares pursuant to a financing in December 2020 and February 2021 (Note 15).
During the nine months period ended May 31, 2022, the Company issued warrants for the Company’s common shares pursuant to a financing in January 2022 (Note 15).
The balance of the derivative warrant liabilities (level 3) is as follows:
| Amount | ||||
| Balance at August 31, 2020 | $ | |||
| Warrants issued February 11, 2021 (Note 15) | ||||
| Fair value adjustment | ( | ) | ||
| Balance at August 31, 2021 | $ | |||
| Warrants issued January 26, 2022 (Note 15) | ||||
| Fair value adjustment | ( | ) | ||
| Balance at May 31, 2022 | $ |
Derivative warrant
liabilities of $
16
TRX Gold Corporation
Notes to the Condensed Interim Consolidated Financial Statements
(Unaudited)
For the Three and Nine Month Periods Ended May 31, 2022 and 2021
(Expressed in Thousands of US dollars, except for share and per share amounts)
Significant assumptions used in determining the fair value of the derivative warrant liabilities are as follows:
May 31, 2022 | August 31, 2021 | |||||||
| Share price | $ | $ | ||||||
| Risk-free interest rate | % | % | ||||||
| Dividend yield | % | % | ||||||
| Expected volatility | % | % | ||||||
| Remaining term (in years) |
The fair value is classified as level 3 as expected volatility is determined using historical volatility and is therefore not an observable input.
| 13. | Shareholders’ equity |
| a) | Share Capital |
| i) | Activity during the nine month period ended May 31, 2022: |
On September 30, 2021, the Company issued 165,889 common shares at a fair value of $98 (value of outstanding liability settled) to settle outstanding fees owed totaling $98.
On January 20, 2022, the Company entered into a purchase agreement, where the Company, in its sole discretion, will have the right from time to time over a 36-month period to sell up to $10 million of its shares. Upon closing, the Company issued 909,901 common shares at a fair value of $373 (closing price of share on that date) to settle commitment fees related to the purchase agreement.
On January 26, 2022, the Company completed the sale of 17,948,718 common shares together with warrants to purchase 17,948,718 common shares for $7.0 million. The common shares and warrants were issued at $0.39 for each common share and a purchase warrant with the right of each whole warrant to purchase one common share at $0.44 for a period of five years from the issue date. The Company also issued 628,205 placement agent warrants with the same terms and incurred commission and other costs of $0.7 million out of which $0.09 million was allocated to the warrants and expensed in the condensed interim consolidated statements of earnings (loss) and comprehensive income (loss). The warrants issued with the common shares are classified as a liability (Note 12).
The placement agent warrants are considered an equity-settled share-based payment transaction and are measured at their fair value and classified as equity.
On May 31, 2022, the Company issued 1,723,620 common shares with a value of $1.2 million and cash payment of $0.5 million, as withholding taxes, to satisfy the $1.7 million liability associated with the Omnibus Equity Incentive Plan granted to certain senior management of the Company.
| ii) | Activity during the year ended August 31, 2021: |
On February 11, 2021, the Company completed the sale of 32,923,078 common shares together with warrants to purchase 16,461,539 common shares for $21.4 million. The common shares and warrants were issued at $0.65 for each common share and a purchase warrant with the right of each whole warrant to purchase one common share at $0.80 for a period of five years from the issue date. The Company also issued 1,152,307 broker warrants with the same terms and incurred commission and other costs of $1.8 million out of which $0.7 million was allocated to the warrants and expensed in the statement of comprehensive loss. The warrants issued with the common shares are classified as a liability (Note 12). The broker warrants are considered an equity-settled share-based payment transaction and are measured at their fair value and classified as equity.
17
TRX Gold Corporation
Notes to the Condensed Interim Consolidated Financial Statements
(Unaudited)
For the Three and Nine Month Periods Ended May 31, 2022 and 2021
(Expressed in Thousands of US dollars, except for share and per share amounts)
On December 23, 2020, the Company completed the sale of 5,554,588 common shares together with warrants to purchase 2,777,268 common shares for $3.0 million in the aggregate. The common shares and warrants were issued at $0.54 for each common share and a one-half purchase warrant with the right of each whole warrant to purchase one common share at $1.50 for a period of three years from the issue date. The warrants are classified as equity.
During the year ended August 31, 2021, $7.0 million of Tranche A Convertible Debentures, representing the entire outstanding balance, were converted and retired resulting in the issuance of 12,150,447 common shares of the Company. The fair value of the convertible debentures at the dates of conversion was in aggregate of $7.0 million.
| b) | Earnings (loss) per share: |
For the three months and nine months period ended May 31, 2022 and 2021, share warrants and stock options were excluded from the calculation of diluted earnings per share due to the exercise prices being greater than the average market price of the Company’s common shares for the respective periods.
For the three and nine months period ended May 31, 2022, 3,872,000 and nil of the outstanding share options and 31,930,340 and 41,970,074 outstanding warrants were excluded from the computation of diluted earnings (loss) per share.
| 14. | Share based payment reserve |
| Period/year ended | May 31, 2022 | August 31, 2021 | ||||||
| Balance at beginning of period/year | $ | $ | ||||||
| Share based compensation – expense (Note 17) | ||||||||
| Transfer of reserve on exercise of options and other share-based awards | ( | ) | ( | ) | ||||
| Balance at end of period/year | $ | $ |
Omnibus Equity Incentive Plan
Effective June 26, 2019, the Company adopted the Omnibus Equity Incentive Plan dated June 26, 2019 (the “Omnibus Plan”), which Omnibus Plan was approved by the shareholders on August 16, 2019, subsequently updated and approved by the shareholders on February 25, 2022.
The purposes of the Omnibus Plan are: (a) to advance the interests of the Company by enhancing the ability of the Company and its subsidiaries to attract, motivate and retain employees, officers, directors, and consultants, which either of directors or officers may be consultants or employees; (b) to reward such persons for their sustained contributions; and (c) to encourage such persons to take into account the long-term corporate performance of the Company.
The Omnibus Plan provides for the grant of options, restricted share units, deferred share units and performance share units (collectively, the “Omnibus Plan Awards”), all of which are described in detail in the Form 20-F Annual Report for the year ended August 31, 2021.
The Omnibus Plan provides for the grant of other share-based awards to participants (“Other Share-Based Awards”), which awards would include the grant of common shares. All Other Share-Based Awards will be granted by an agreement evidencing the Other Share-Based Awards granted under the Omnibus Plan.
18
TRX Gold Corporation
Notes to the Condensed Interim Consolidated Financial Statements
(Unaudited)
For the Three and Nine Month Periods Ended May 31, 2022 and 2021
(Expressed in Thousands of US dollars, except for share and per share amounts)
Subject to adjustments as provided for under the Omnibus Plan, the maximum number of shares issuable pursuant to Omnibus Plan Awards outstanding at any time under the Omnibus Plan shall not exceed 10% of the aggregate number of common shares outstanding from time to time on a non-diluted basis; provided that the acquisition of common shares by the Company for cancellation shall not constitute non-compliance with the Omnibus Plan for any Omnibus Plan Awards outstanding prior to such purchase of common shares for cancellation.
As at May 31, 2022, the Company had (August 31, 2021 – ) options available for issuance under the Omnibus Plan.
The continuity of outstanding stock options for the nine month period ended May 31, 2022 and year ended August 31, 2021 is as follows:
Number of stock options | Weighted average exercise price per share | |||||||
| Balance – August 31, 2020 | CAD $ | |||||||
| Options exercised | ( | ) | CAD $ | |||||
| Balance – August 31, 2021 | CAD $ | |||||||
| Options exercised | ( | ) | CAD $ | |||||
| Options expired | ( | ) | CAD $ | |||||
| Balance – May 31, 2022 | CAD $ |
Options to purchase common shares carry exercise prices and terms to maturity as follows:
| Remaining | ||||||||||||||||||
| Exercise price (1) | Number of options | Expiry | contractual | |||||||||||||||
| Outstanding $ | Outstanding | Exercisable | Date | life (years) (1) | ||||||||||||||
| CAD $ | ||||||||||||||||||
| CAD $ | ||||||||||||||||||
| CAD $ | ||||||||||||||||||
| CAD $ | ||||||||||||||||||
| (1) |
19
TRX Gold Corporation
Notes to the Condensed Interim Consolidated Financial Statements
(Unaudited)
For the Three and Nine Month Periods Ended May 31, 2022 and 2021
(Expressed in Thousands of US dollars, except for share and per share amounts)
| 15. | Warrants reserve |
Warrant issuances:
Activity during the nine month period ended May 31, 2022:
During
the nine month period ended May 31, 2022, the Company issued
The
The
Activity during the year ended August 31, 2021:
During
the year ended August 31, 2021, the Company issued
The
The
The
20
TRX Gold Corporation
Notes to the Condensed Interim Consolidated Financial Statements
(Unaudited)
For the Three and Nine Month Periods Ended May 31, 2022 and 2021
(Expressed in Thousands of US dollars, except for share and per share amounts)
Warrants outstanding:
The continuity of outstanding warrants for the nine months ended May 31, 2022 and year ended August 31, 2021 is as follows:
Number of warrants | Weighted average exercise price per share | |||||||
| Balance – August 31, 2020 | ||||||||
| Warrants issued | ||||||||
| Balance – August 31, 2021 | ||||||||
| Warrants issued | ||||||||
| Warrants expired | ( | ) | ||||||
| Balance – May 31, 2022 |
At May 31, 2022, the following warrants and compensation warrants were outstanding:
Number of Warrants |
Exercise price |
Expiry date | ||||||||||
| Convertible debenture warrants – July 27, 2020 | $ | |||||||||||
| Private placement financing warrants – December 23, 2020 | $ | |||||||||||
| Private placement financing warrants – February 11, 2021 | $ | |||||||||||
| Private placement financing broker warrants – February 11, 2021 | $ | |||||||||||
| Private placement financing warrants – January 26, 2022 | $ | |||||||||||
| Private placement financing placement agent warrants – January 26, 2022 | $ | |||||||||||
| Balance, May 31, 2022 |
The outstanding warrants have a weighted average exercise price of $and weighted average remaining contractual life of years.
21
TRX Gold Corporation
Notes to the Condensed Interim Consolidated Financial Statements
(Unaudited)
For the Three and Nine Month Periods Ended May 31, 2022 and 2021
(Expressed in Thousands of US dollars, except for share and per share amounts)
| 16. | Non-controlling interest |
The changes to the non-controlling interest for the nine month period ended May 31, 2022 and year ended August 31, 2021 are as follows:
| Year ended | May 31, 2022 | August 31, 2021 | ||||||
| Balance at beginning of period/year | $ | ( | ) | $ | ( | ) | ||
| Non-controlling interest’s 45% share of Buckreef Gold’s comprehensive earnings (loss) | ( | ) | ||||||
| Balance at end of period/year | $ | $ | ( | ) |
The following is summarized financial information for Buckreef Gold:
May 31, 2022 | August 31, 2021 | |||||||
| Current assets | $ | $ | ||||||
| Long term assets | ||||||||
| Current liabilities | ( | ) | ( | ) | ||||
| Asset retirement obligation | ( | ) | ( | ) | ||||
| Advances from parent | ( | ) | ( | ) | ||||
| Revenue | ||||||||
| Comprehensive earnings (loss) for the period/year | $ | $ | ( | ) |
| 17. | Related party transactions |
Related parties include the Board of Directors and officers, extended relatives and enterprises that are controlled by these individuals as well as certain consultants performing similar functions.
Remuneration of Directors and key management personnel of the Company was as follows:
Three months ended May 31, 2022 | Three months ended May 31, 2021 | Nine months ended May 31, 2022 | Nine months ended May 31, 2021 | |||||||||||||
| Remuneration1 | $ | ( | ) | $ | ( | ) | $ | ( | ) | $ | ( | ) | ||||
| Share based expense | ( | ) | ( | ) | ||||||||||||
| Total | $ | ( | ) | ( | ) | $ | ( | ) | $ | ( | ) |
| (1) |
22
TRX Gold Corporation
Notes to the Condensed Interim Consolidated Financial Statements
(Unaudited)
For the Three and Nine Month Periods Ended May 31, 2022 and 2021
(Expressed in Thousands of US dollars, except for share and per share amounts)
As
of May 31, 2022, included in amounts payable is $
During the year ended August 31, 2021, the Company granted common shares upon hiring key management personnel in the aggregate of:
| a) | 1.56 million common shares having a fair market value of $1.1 million on the respective start dates of the key Management (December 1, 2020 to May 18, 2021). |
| b) | Common shares on the first, second and third anniversary dates of the greater of up to 2.02 million, 3.55 million and 2.82 million common shares; or common shares having a fair market value of to $1.4 million, $2.5 million and $2.0 million provided that 80% of such issuance shall be guaranteed and 20% shall be subject to certain financial milestones to be determined by the Board of Directors respectively. |
The common shares had a value of $ million at grant date that is amortized over the service period. $million was recognized during the nine months period ended May 31, 2022 (for the nine months period ended May 31, 2021 - $nil).
| 18. | General and administrative expense |
Three months ended May 31, 2022 | Three months ended May 31, 2021 | Nine months ended May 31, 2022 | Nine months ended May 31, 2021 | |||||||||||||
| Directors’ fees | $ | ( | ) | $ | ( | ) | $ | ( | ) | $ | ( | ) | ||||
| Office and general | ( | ) | ( | ) | ( | ) | ( | ) | ||||||||
| Shareholder information | ( | ) | ( | ) | ( | ) | ( | ) | ||||||||
| Professional fees | ( | ) | ( | ) | ( | ) | ( | ) | ||||||||
| Salaries, benefits and consulting | ( | )) | ( | ) | ( | ) | ( | ) | ||||||||
| Severance | ( | ) | ( | ) | ||||||||||||
| Share based expense | ( | ) | ( | ) | ||||||||||||
| Travel and accommodation | ( | ) | ( | ) | ( | ) | ( | ) | ||||||||
| Depreciation | ( | ) | ( | ) | ( | ) | ( | ) | ||||||||
| Other | ( | ) | ( | ) | ( | ) | ( | ) | ||||||||
| General and administrative expense | $ | ( | ) | $ | ( | ) | $ | ( | ) | $ | ( | ) |
23
TRX Gold Corporation
Notes to the Condensed Interim Consolidated Financial Statements
(Unaudited)
For the Three and Nine Month Periods Ended May 31, 2022 and 2021
(Expressed in Thousands of US dollars, except for share and per share amounts)
| 19. | Financial instrument related costs and other |
Three months ended May 31, 2022 | Three months ended May 31, 2021 | Nine months ended May 31, 2022 | Nine months ended May 31, 2021 | |||||||||||||
| Gain on derivative warrant liabilities | $ | $ | $ | $ | ||||||||||||
| Transaction costs on derivative warrant liabilities | ( | ) | ( | ) | ( | ) | ||||||||||
| Change in fair value of convertible debentures | ( | ) | ||||||||||||||
| Withholding tax costs | ( | ) | ( | ) | ||||||||||||
| Total financial instrument related costs and other | $ | $ | $ | $ |
| 20. | Management of Capital |
The Company's objective when managing capital is to obtain adequate levels of funding to support its exploration and development activities, to obtain corporate and administrative functions necessary to support organizational functioning, to obtain sufficient funding to further the identification and development of precious metals deposits, and to develop and construct a low cost open-pit gold mine.
The Company manages its capital structure based on the funds available to the Company, in order to support the exploration and development of mineral properties. The Board of Directors does not establish quantitative return on capital criteria for management, but rather relies on the expertise of the Company's management to sustain future development of the business. The Company defines capital to include its shareholders’ equity. In order to carry out the planned exploration and pay for administrative costs, the Company will spend its existing working capital and may raise additional amounts as needed. The Company will continue to assess new properties and seek to acquire an interest in additional properties if it feels there is sufficient geologic or economic potential and if it has adequate financial resources to do so. Management reviews its capital management approach on an ongoing basis and believes that this approach, given the relative size of the Company, is reasonable. There were no changes in the Company's approach to capital management during the nine month period ended May 31, 2022. The Company is not subject to externally imposed capital requirements.
The
Company considers its capital to be shareholders’ equity, which is comprised of share capital, reserves, and deficit, which as
at May 31, 2022 totaled $
The Company may raise capital, as necessary, to meet its needs and take advantage of perceived opportunities and, therefore, does not have a numeric target for its capital structure. Funds are primarily secured through equity capital raised by way of private placements, however, debt and other financing alternatives may be utilized as well. There can be no assurance that the Company will be able to continue raising equity capital in this manner.
The Company invests all capital that is surplus to its immediate operational needs in short term, liquid and highly rated financial instruments, such as cash, and short-term guarantee deposits, all held with major North American financial institutions and North American treasury deposits.
24
TRX Gold Corporation
Notes to the Condensed Interim Consolidated Financial Statements
(Unaudited)
For the Three and Nine Month Periods Ended May 31, 2022 and 2021
(Expressed in Thousands of US dollars, except for share and per share amounts)
| 21. | Financial Instruments |
Fair Value of Financial Instruments
Cash and derivative warrant liabilities are classified as fair value through profit and loss. Amounts payable are classified as other financial liabilities, which are measured at amortized cost. Amounts receivable are measured at amortized cost.
The carrying value of the Company’s cash, amounts receivable, amounts payable approximate their fair value due to the relatively short-term nature of these instruments.
Fair value estimates are made at a specific point in time, based on relevant market information and information about financial instruments. These estimates are subject to and involve uncertainties and matters of significant judgment, therefore cannot be determined with precision. Changes in assumptions could significantly affect the estimates.
The Company classifies its financial instruments carried at fair value according to a three-level hierarchy that reflects the significance of the inputs used in making the fair value measurements. The three levels of fair value hierarchy are as follows:
| · | Level 1 – Unadjusted quoted prices in active markets for identical assets or liabilities; |
| · | Level 2 – Inputs other than quoted prices that are observable for assets and liabilities, either directly or indirectly; and |
| · | Level 3 – Inputs for assets or liabilities that are not based on observable market data. |
As of May 31, 2022 and August 31, 2021, cash is recorded at fair value under level 1 within the fair value hierarchy, and derivative warrant liabilities (Note 12) are classified as level 3.
The following table shows the valuation techniques used in measuring Level 3 fair values for derivative warrant liabilities, as well as the significant unobservable inputs used.
| Type | Valuation Technique | Key Inputs | ||
| Derivative warrant liabilities |
Key observable inputs · Share price (May 31, 2022: $0.34, August 31, 2021: $0.41) · Risk-free interest rate (May 31, 2022: 2.14% to 2.77%, August 31, 2021: 0.19% to 0.67%) · Dividend yield (May 31, 2022: 0%, August 31, 2021: 0%)
Key unobservable inputs · Expected volatility (May 31, 2022: 47% to 55%, August 31, 2021: 60% to 70%) |
Sensitivity Analysis
For the fair values of derivative warrant liabilities, reasonably possible changes to expected volatility, the significant unobservable input, holding other inputs constant would have the following effects:
| Derivative Warrant Liabilities | May 31, 2022 | |||||||
| Comprehensive Loss | Increase | Decrease | ||||||
| Expected volatility (20% movement vs. the model input) | $ | $ | ( | ) | ||||
25
TRX Gold Corporation
Notes to the Condensed Interim Consolidated Financial Statements
(Unaudited)
For the Three and Nine Month Periods Ended May 31, 2022 and 2021
(Expressed in Thousands of US dollars, except for share and per share amounts)
A summary of the Company’s risk exposures as they relate to financial instruments are reflected below:
Credit Risk
Credit risk is the risk of an unexpected loss if a third party to a financial instrument fails to meet its contractual obligations. The Company is subject to credit risk on the cash balances at the bank and accounts and other receivables and the carrying value of those accounts represent the Company’s maximum exposure to credit risk. The amounts receivable consists primarily of amounts due from gold sales and government taxation authorities. The Company has not recorded an impairment or allowance for credit risk as at May 31, 2022, or August 31, 2021.
Liquidity Risk
The
Company’s approach to managing liquidity risk is to ensure that it will have sufficient liquidity to meet liabilities when due.
As at May 31, 2022, the Company had cash of $10.5 million, current assets of $14.7 million and current liabilities of $10.1 million.
Current working capital of the Company is $
Foreign Currency Risks
The Company is exposed to the financial risk related to the fluctuation of foreign exchange rates. The Company has offices in Canada, USA, and Tanzania, and holds cash mainly in Canadian, Tanzanian shillings and United States currencies. A significant change in the currency exchange rates between the US dollar relative to Canadian dollar and Tanzanian shillings could have an effect on the Company’s results of operations, financial position, or cash flows. At May 31, 2022, the Company had no hedging agreements in place with respect to foreign exchange rates. As the majority of the transactions of the Company are denominated in US and Tanzanian Shilling currencies, movements in the foreign exchange rates may not have a material impact on the consolidated statements of comprehensive income (loss).
| 22. | Segmented information |
Operating Segments
At May 31, 2022 the Company’s operations comprise of a single reporting operating segment engaged in mineral exploration and development in Tanzania. The Company’s corporate division only earns interest revenue that is considered incidental to the activities of the Company and therefore does not meet the definition of an operating segment as defined in IFRS 8 ‘Operating Segments’. As the operations comprise a single reporting segment, amounts disclosed in the condensed interim consolidated financial statements also represent operating segment amounts.
An operating segment is defined as a component of the Company:
| · | that engages in business activities from which it may earn revenues and incur expenses; |
| · | whose operating results are reviewed regularly by the entity’s chief operating decision maker; and |
| · | for which discrete financial information is available. |
26
TRX Gold Corporation
Notes to the Condensed Interim Consolidated Financial Statements
(Unaudited)
For the Three and Nine Month Periods Ended May 31, 2022 and 2021
(Expressed in Thousands of US dollars, except for share and per share amounts)
Geographic Segments
The Company is in the business of mineral exploration and production in the country of Tanzania. During the nine months ended May 31, 2022, revenue was derived from one source. Information concerning the Company’s geographic locations is as follows:
Nine months ended
| Nine months ended
| |||||||
| Revenue | ||||||||
| Tanzania | $ | $ | ||||||
| $ | $ |
May 31, 2022 | August 31, 2021 | |||||||
| Non-current assets | ||||||||
| Canada | $ | $ | ||||||
| Tanzania | ||||||||
| $ | $ |
| 23. | Commitments and Contingencies |
Commitments:
In order to maintain existing site mining and exploration licenses, the Company is required to pay annual license fees. As at May 31, 2022 and August 31, 2021 these licenses remained in good standing and the Company is up to date on license payments.
Contingencies:
The Company is involved in litigation and disputes arising in the normal course of operations. Management is of the opinion that the outcome of any potential litigation will not have a material adverse impact on the Company’s financial position or results of operations. Accordingly, no provisions for the settlement of outstanding litigation and potential claims have been accrued.
27
TRX Gold Corporation
Notes to the Condensed Interim Consolidated Financial Statements
(Unaudited)
For the Three and Nine Month Periods Ended May 31, 2022 and 2021
(Expressed in Thousands of US dollars, except for share and per share amounts)
| 24. | Non-cash items |
Three months ended May 31, 2022 | Three months ended May 31, 2021 | Nine months ended May 31, 2022 | Nine months ended May 31, 2021 | |||||||||||||
| Depreciation | $ | $ | $ | $ | ||||||||||||
| Gain (loss) on derivative warrant liabilities | ( | ) | ( | ) | ||||||||||||
| Change in fair value of convertible debentures | ||||||||||||||||
| Share based expense | ( | ) | ( | ) | ||||||||||||
| Reclamation expense | ||||||||||||||||
| Forgiveness of interest | ( | ) | ||||||||||||||
| Loss on assets disposal | ||||||||||||||||
| Total Non-cash items | $ | ( | ) | $ | ( | ) | $ | $ | ( | ) |
28
Exhibit 99.2
TRX GOLD CORPORATION
MANAGEMENT’S DISCUSSION AND ANALYSIS
QUARTERLY REPORT ON THE THIRD QUARTER OF 2022
For the three and nine month periods ended May 31, 2022
| Management’s Discussion and Analysis May 31, 2022 |
The following Management’s Discussion and Analysis (“MD&A”) of the financial condition and results of operations for TRX Gold Corporation (“TRX Gold” or the “Company”) should be read in conjunction with the unaudited interim condensed consolidated financial statements for the three and nine months ended May 31, 2022 and 2021 (the “Q3 2022 Interim Financial Statements”), as well as the Company’s audited consolidated financial statements and MD&A for the year ended August 31, 2021 included in the Company's Annual Report on Form 20-F for the year ended August 31, 2021. The financial statements and related notes of TRX Gold have been prepared in accordance with International Financial Reporting Standards (“IFRS”). Additional information, including our press releases, has been filed electronically on SEDAR and is available online under the Company’s profile at www.sedar.com and on our website at www.TRXGold.com.
This MD&A reports our activities through July 13, 2022 unless otherwise indicated. References to the 3rd quarter of 2022 or Q3 2022, and the 3rd quarter of 2021 mean the three months ended May 31, 2022 and 2021, respectively. Unless otherwise noted, all references to currency in this MD&A refer to US dollars. Unless clearly otherwise referenced to a specific table, numbers referenced refer to numbered Endnotes on page 32.
Mr. Andrew Mark Cheatle, P.Geo., MBA, ARSM, is the Company’s in-house Qualified Person under National Instrument 43-101 “Standards of Disclosure for Mineral Projects” (“NI 43-101”) and has reviewed and approved the scientific and technical information in this MD&A. Mr. Cheatle is the Chief Operating Officer and a Director of TRX Gold and a Director of the Company’s subsidiaries, including Buckreef Gold Company Limited (“Buckreef Gold”) and Tanzanian American International Development 2000 Limited (“Tanzam2000”). Therefore, he is not considered to be independent under NI 43-101. Mr. Cheatle has over 30 years of relevant industry experience, a Master of Business Administration (MBA) from Capella University, USA (2005), and an Honours Degree in Geology from the Royal School of Mines, Imperial College, London, UK (1985). He is a registered professional geoscientist with Professional Geoscientists of Ontario, Canada (Reg. No. 0166).
Disclosure and Cautionary Statement Regarding Forward Looking Information
This MD&A contains certain forward-looking statements and forward-looking information, including without limitation statements about TRX Gold’s future business, operations and production capabilities. All statements, other than statements of historical fact, included herein are forward-looking statements and forward-looking information that involve various risks and uncertainties. There can be no assurance that such statements will prove to be accurate, and actual results and future events could differ materially from those anticipated in such statements. Although TRX Gold believes the expectations expressed in such forward-looking statements are based on reasonable assumptions, such statements are not guarantees of future performance. The actual achievements of TRX Gold or other future events or conditions may differ materially from those reflected in the forward-looking statements due to a variety of risks, uncertainties and other factors. These risks, uncertainties and factors include general business, legal, economic, competitive, political, regulatory and social uncertainties; actual results of exploration activities and economic evaluations; fluctuations in currency exchange rates; changes in costs; future prices of gold and other minerals; mining method, production profile and mine plan; delays in exploration, development and construction activities; changes in government legislation and regulation; the ability to obtain financing on acceptable terms and in a timely manner or at all; contests over title to properties; employee relations and shortages of skilled personnel and contractors; and the speculative nature of, and the risks involved in, the exploration, development and mining business.
| 1 |
| Management’s Discussion and Analysis May 31, 2022 |
Certain information presented in this MD&A may constitute “forward-looking statements” and “forward looking information” within the meaning of the Private Securities Litigation Reform Act of 1995 and under securities legislation applicable in Canada, respectively. Such forward-looking statements and information are based on numerous assumptions, and involve known and unknown risks, uncertainties, and other factors, including risks inherent in mineral exploration and development, which may cause the actual results, performance, or achievements of the Company to be materially different from any projected future results, performance, or achievements expressed or implied by such forward-looking statements and information. Investors are referred to our description of the risk factors affecting the Company, as contained in our U.S. Securities and Exchange Commission (“SEC”) filings, including our Annual Report on Form 20-F and Report of Foreign Private Issuer on Form 6-K, as amended, for more information concerning these risks, uncertainties, and other factors.
TRX Gold Corporation
TRX Gold along with its joint venture partner, State Mining Corporation (“STAMICO”) is advancing a significant gold project at Buckreef Gold in Tanzania. The Buckreef Gold Project is anchored by an expanded Mineral Resource published in May 2020. Measured Mineral Resource is 19.98 million tonnes (“MT”) at 1.99 grams per tonne (“g/t”) gold (“Au”) containing 1,281,161 ounces (“oz”) of gold and Indicated Mineral Resource is 15.89 MT at 1.48 g/t gold containing 755,119 oz of gold for a combined tonnage of 35.88 MT at 1.77 g/t gold containing 2,036,280 oz of gold. The Buckreef Gold Project also contains an Inferred Mineral Resource of 17.8 MT at 1.11g/t gold for contained gold of 635,540 oz of gold. The Company is actively investigating and assessing multiple exploration targets on its property. Please refer to the Company’s Updated Mineral Resources Estimate for Buckreef Gold Project, dated May 15, 2020 and filed under the Company’s profile on SEDAR and with the SEC on June 23, 2020 (the “Technical Report”), for more information. Buckreef Gold is being advanced in a value accretive sustainable manner through:
Expanding Production Profile: A 360 tonne per day (“tpd”) processing plant is being expanded to 1,000+ tpd, enabling a near term production profile of 15,000 - 20,000 oz of gold per year. Positive operating cash flow will be utilized for value enhancing activities, including exploration and the Sulphide Development Project.
Exploration: Continuing with a drilling program with the goal of expanding resources, discovering new resources and converting resources to reserves, by: (i) step-out drilling in the northeast extension and south of Buckreef Main; (ii) infill drilling to upgrade Mineral Resources currently in the Inferred category in Buckreef Main; (iii) infill drilling program of Buckreef West; (iv) developing an exploration program for the newly discovered Anfield Zone; (v) upgrading historical mineral resources at Bingwa and Tembo; and (vi) identifying new prospects at Buckreef Gold Project, and in the East African region.
Sulphide Development Project: Unlocking the value of the Sulphide Development Project in which the ‘sulphide ore’ encompasses approximately 90% of the Resources. It is the goal of the Company to exceed the metrics as outlined in the Technical Report, including annual production and strip ratio.
| 2 |
| Management’s Discussion and Analysis May 31, 2022 |
Q3 2022 Highlights
Q3 2022 was another milestone for the Company as it reflected the first full quarter operating the 360 tpd processing plant at full design capacity and using the cash flow generated from mining operations to fund successful exploration. During Q3 2022 the Company recorded its highest quarterly: (i) production, (ii) sales, (iii) gross profit margins, (iv) net income, and (iv) operating cash flow, at a low cash cost1 of $508 per gold ounce. Also, during the quarter the Company also announced a 250 meter extension of the Buckreef Gold Main Zone to 1.8 kilometers and positive assay results from the northeast step-out drilling program on the Buckreef Gold Main Zone. These positive results continue to demonstrate the immense opportunity at Buckreef Gold and reflect an initial step towards successful execution of the Company’s sustainable business plan where cash flow from operations funds value creating activities, including exploration.
Key highlights for Q3 2022 include:
| · | The Company achieved zero lost time to injuries and had no confirmed COVID-19 cases at site. |
| · | Successfully completed the first full quarter operating the 360 tpd mill at Buckreef Gold to nameplate capacity. This is the first phase of 360 tonnes per day (tpd) for the 1,000+ tpd processing plant. The 360 tpd expansion phase was completed on time and on budget (capital cost of $1.6 million). |
| · | Poured 2,733 ounces of gold in Q3 2022, a new quarterly production record at Buckreef Gold, exceeding previous production guidance of 750-800 ounces of gold per month. Sold 3,033 ounces of gold in Q3 2022, a new quarterly sales record resulting in the Company being operating cash flow positive ($2.0 million) for the second consecutive quarter. |
| · | Recognized revenue of $5.7 million in Q3 2022, cost of sales of $1.5 million and cash costs1 of $508 per ounce of gold, below guidance, generating strong gross profit of $4.2 million, gross profit margin of 73% and record quarterly net income attributable to common shareholders of $2.0 million. |
| · | As steady state processing has now been achieved on the 360 tpd processing plant, the Company continues to expect production to be 750-800 oz of gold per month2 at a total average cash cost1 of $725-825/oz, in line with previous guidance, until the larger oxide ore processing plant is commissioned. |
| · | Buckreef Gold continued to advance construction on the 1,000+ tpd processing plant. During the quarter the Company made significant progress on the plant build, including successful completion of geotechnical earthworks, carbon-in-leaching (“CIL”) tank farm foundation construction, ball mill foundation and plinth curing, plant steel fabrication, tank construction, and procurement of all key long lead items, thus removing considerable timeline risk for plant commissioning. |
| · | The expansion to 1,000+ tpd remains on budget and is expected to be completed in calendar Q3 2022 with forecasted production of 15,000 – 20,000 oz of gold per year. The Company will provide further guidance on production and cash costs on the larger 1,000+ tpd processing plant in subsequent quarters. |
| · | Buckreef Gold confirmed an extension of the Buckreef Main Zone by 250 meters (16% increase in the strike length of the Buckreef Main Zone to 1.8 kilometers) and reported positive assay results from the northeast step-out drilling program on the Buckreef Gold Main Zone. |
| · | Buckreef Gold added an additional drill rig to expand the exploration program and, to date, has drilled 21 holes representing over 7,415 meters in the northeast extension of Buckreef Main Zone. |
| · | Buckreef Gold has finalized the planning for a 10,000 meter (approximate) infill and extension drill program to: (i) upgrade Mineral Resources currently in the Inferred category in Buckreef Gold Main Zone, and (ii) commence infill drilling at Buckreef West. This program has commenced and it is the Company’s intention to begin exploration drilling at the newly discovered Anfield Zone and extend the Eastern Porphyry Zone this year. |
| 3 |
| Management’s Discussion and Analysis May 31, 2022 |
| · | Buckreef Gold was granted an extension to the renewal date for the Special Mining License (SML 04/92) at Buckreef Gold extending the SML renewal period for Buckreef Gold by an additional 5 years from 2027 to 2032. |
| · | The Company announced a name change from “Tanzanian Gold Corporation” to “TRX Gold Corporation” which was approved by way of special resolution at the Company’s annual general and special meeting of shareholders held on February 25, 2022. The name change better reflects the great strides that the Company has made over the last 18 months as evidenced by the record operating and financial results achieved in Q3 2022. |
Q3 Operational and Financial Details
Mining and Processing
| · | Buckreef Gold reported zero lost time to injuries and had no confirmed COVID-19 related cases at site in Q3 2022. For the nine month period ended May 31, 2022, including contractors, Buckreef Gold recorded a safety incident frequency rate of 0 (per million hours). The Company’s two main contractors FEMA Mining and STAMICO Drilling also recorded a safety incident frequency rate of 0 (per million hours). |
| · | In Q3 2022, Buckreef Gold successfully completed the first full quarter operating Phase 1 of the 1,000+ tpd processing plant at nameplate capacity of 360 tpd. The expanded processing plant construction was completed in line with the scheduled completion date of September/October 2021 at a capital cost of US$1.6 million, within guidance. In-house construction was completed by the Buckreef Gold and TRX Gold teams in conjunction with key consultants/contractors, including: (i) Ausenco; (ii) Solo Resources; and (iii) CSI Energy Group. |
| · | During Q3 2022, Buckreef Gold poured 2,733 ounces of gold and sold 3,033 ounces of gold, both quarterly records for the Company. Record sales have resulted in positive operating cash flow at Buckreef Gold for the second consecutive quarter. The 360 tpd processing plant achieved the following in Q3 2022: (i) average throughput of 378 tpd; (ii) plant availability of 93%; and (iii) average recovery rate of 91% with consistent tailings grade, regardless of head grade. |
| · | Total ore mined in Q3 2022 increased to 55 thousand tonnes (“kt”) from 47 kt in Q2 2022. In Q3 2022 the strip ratio was 4.4 (waste:ore tonnes) and on a ‘project to date’ basis is 4.5 (waste:ore tonnes). Mining activity during the quarter has continued to build up a significant inventory of mined material on the ROM pad. |
| · | As at May 31 2022, the run-of-mine (“ROM”) pad contained 81,867 tonnes at 1.37 g/t with an estimated 3,613 ounces of gold. A further stockpile of crushed mill feed of 8,439 tonnes at 3.38 g/t containing an estimated 917 ounces of gold has been accumulated between the crusher and mill. The increased stockpile balance provides support for the Company to meet its production guidance in the upcoming quarters. |
| · | During Q3 2022 the site team finalized the planning for construction for the next phase of the tailings storage facility (TSF-2 raise) and the permit to advance construction is anticipated in calendar Q3 2022 at an estimated capital cost of $0.4 million. The liner material has been purchased and is in transit to site and construction is expected to commence in calendar Q3 2022. Planning for the third phase of the tailings storage facility (TSF-3) is underway and geotechnical work has commenced. Construction of TSF-3 is expected to commence in calendar Q3/Q4 2022 at an estimated capital cost of $0.8 million. Combined, with TSF-2, this new TSF capacity is expected to provide an additional two years of storage. |
| · | In calendar Q4 2022 work will commence on the final road alignment around the SML which will enable full life of mine access to the Main Zone. The estimated capital cost of this road alignment is approximately $0.8 million. |
| 4 |
| Management’s Discussion and Analysis May 31, 2022 |
1,000+ TPD Plant Construction Progress
| · | During Q3 2022 Buckreef Gold continued to advance construction of a 1,000+ tpd processing plant while simultaneously operating the 360 tpd processing plant. During and subsequent to the quarter, significant progress was made including completion of earthworks, construction of the tank line 3 foundation and bund wall. Concurrently, steel for the tanks was fabricated at a local workshop in Mwanza and transported to site for tank construction. To date, five (5) tanks were constructed to final height and welding continues to progress on schedule. The remaining two (2) tanks were stacked in the first week of July. Additionally, significant progress was made on installation of the tanks’ internal components, including launders, baffles, tailings discharge, carbon screen and trash screen. Fabrication has also commenced on the conveyors required by the crushing system and plant. |
| · | The ball mill foundations and plinths have been completed and cured. The bund wall surrounding the ball mills is now approximately 75% complete. CSI Energy have been contracted to perform mechanical installation of the ball mills and various electrical works throughout the project. All long-lead orders have been procured and are being delivered to site on schedule as provided by the manufacturers. |
| · | The targeted completion date of the 1,000+ tpd processing plant continues to be calendar Q3 2022 and the larger processing plant is expected to produce 15,000 – 20,000 oz of gold per year based on the initial mine plan and grade profile, which was developed in conjunction with SGS Canada Inc. (“SGSC”). This initial mine plan incorporates approximately 10% of the resources in the Buckreef Main Zone. The Company continues to budget capital expenditures for the expanded 1,000+ tpd processing plant of approximately $4.0 million. To date, excluding VAT, approximately $2.2 million of the total project capital expenditures have been incurred. |
Exploration
| · | Buckreef Gold confirmed an extension of the Buckreef Main Zone by 250 meters (16% increase in the strike length of the Buckreef Main Zone to 1.8 kilometers) and reported positive assay results from the northeast step-out drilling program on the Buckreef Gold Main Zone. |
| · | The results are positive and significant for the Company as they demonstrate: (i) good width and grade of mineralization consistent with the Buckreef Main Zone; (ii) successful step-out extending the strike length of known mineralization; (iii) gold mineralization open to NE and at depths to 250-300m, again consistent with the Buckreef Main Zone; and (iv) the immense opportunity to generate and drill significant exploration targets to expand the scale and scope of the Buckreef Gold project. |
| · | Buckreef Gold added an additional drill rig to expand the exploration program and, to date, has drilled 21 holes representing over 7,415 meters in the northeast extension of Buckreef Main Zone. |
| · | Buckreef Gold has finalized the planning for a 10,000 meter (approximate) infill and extension drill program to: (i) upgrade Mineral Resources currently in the inferred category in Buckreef Gold Main Zone, and (ii) commence infill drilling at Buckreef West. This program has commenced and it is the Company’s intention to begin exploration drilling at the newly discovered Anfield Zone and extend the Eastern Porphyry Zone this year. |
| · | Following completion of infill drilling at the Buckreef South pit area the Company has planned additional drilling to test for extension of gold mineralization to the southwest beyond the existing Mineral Resources. Drilling in this area commenced in June 2022. |
| · | TRX Gold believes the property and immediate surrounding area to be highly prospective for economic gold mineralization. Within the last year the Anfield Zone was discovered. The Anfield Zone lies ‘on-trend’ between a historical mineral resource (the Eastern Porphyry) and an adjacent mining facility with nearly 3km of untested shear zone located 500 meters to the east of the Buckreef Main Zone. High grade fresh rock samples were retrieved from an artisanal mine shaft. Geological assessment of the property and adjacent leases continues and will continue to pick up pace throughout 2022. |
| 5 |
| Management’s Discussion and Analysis May 31, 2022 |
Sulphide Development Project
| · | The Sulphide Development Project, in which the ‘sulphide ore’ encompasses approximately 90% of the Buckreef Main Zone’s 2.0 MT Measured and Indicated Mineral Resources, is a key value driver for the Company. Unlocking this value is an important objective for the Company. The Sulphide Development Project will evaluate the options for a high return large scale project. It is the goal of the Company to exceed the metrics outlined in the Technical Report, including annual production and strip ratio. We continue to work with our principal consultants on advancing the Sulphide Development Project. |
| · | Buckreef Gold has commenced the long-lead items for de-risking the Sulphide Development Project, including: (i) geotechnical characterization to determine the ultimate pit slopes of the 2 km long open pit. This work commenced in Q2 2022 with consultants SGSC and Terrane Geoscience; and (ii) the variability metallurgical study for the first 5-7 years of potential production of the Sulphide Development Project. To date a total of 19 metallurgical holes (2,367 meters) have been completed along the entire strike of the Buckreef Main deposit, these holes have been logged and are in preparation for shipment for metallurgical testing. A request for proposal (“RFP”) for this study has been submitted to various laboratories and this process is expected to be completed in the near future. |
| · | The Company, in conjunction with Ausenco, has finalized locations for the Sulphide Processing Plant, Dry Stack Tailings Facility, Waste Rock Piles and other infrastructure. All locations are subject to successful ‘condemnation drilling.’ |
| · | The exploration drilling program will also focus on infill drilling at Buckreef West, inferred mineral resources and strike extensions, both to the northeast and southwest of the Main Zone which if successful, has the potential to increase tonnes to the indicated mineral resource category. |
Environmental, Social and Corporate Governance (“ESG”)
| · | The Company is committed to working to the highest ESG standards and has initiated several programs, while continuing to develop a broader framework and policies. There were no reportable environmental or community related incidents during the third quarter. Buckreef Gold continues to expand its ESG program, successfully partnering with the Geita District and Regional Commissioners on school, water and health projects. |
| · | Buckreef Gold continues to work with the Geita District Council and local wards to collaboratively identify key programs that focus on short to long term educational needs, which in turn is aligned with Buckreef Gold’s local hiring practices and includes Science, Technology, Engineering and Mathematics (STEM) and gender goals. |
| · | A Memorandum of Understanding (“MoU”) was signed in Q2 2022 between Buckreef and Geita District Council to provide support around education in the wards of Lwamgasa, Kaseme, Busanda and Bugulula. These wards are host wards for the mine site and a total of 321M Tanzania Shillings (approximately US$ 138 thousand) has been committed by Buckreef for 2022 to support priority areas as agreed with the District Council. |
| · | As part of this MoU, in Q3 2022 the Company completed construction of a multi-purpose laboratory at the Isingiro secondary school (Lwamgasa Ward), three new classrooms at the Tembo primary school (Bugulula Ward), walkways at the Kasota Health Center (Kaseme Ward) and commenced construction on an Outpatient Building (Busanda Ward). |
| · | Buckreef Gold’s operations: (i) are connected to the Tanzanian national electricity grid and utilize grid power which is significantly and increasingly sourced from hydroelectric facilities in Tanzania; (ii) recycle all water used in its operations; (iii) do not discharge water from its operations; (iv) workforce are 100% Tanzanian citizens; (v) development and building activities are focused on maximizing local content; (vi) exhibit a ‘100 mile diet’ by procuring all food locally; and (vii) sulphide development is expected to utilize dry stack tailings. |
| 6 |
| Management’s Discussion and Analysis May 31, 2022 |
| · | The Company supports local procurement in all activities by first sourcing within the immediate wards, then out to district, region and nation. Only those items or services not available in Tanzania are purchased externally, first prioritizing East Africa, Africa, then globally. |
| · | The Company will continue to develop a broader ESG program and identify its contribution to the UN Sustainable Development Goals (SDGs) over the course of calendar 2022. |
Financial
| · | Gold ounces poured in the quarter were 2,733 ounces – a quarterly production record for Buckreef Gold. Gold ounces sold were 3,033 ounces at an average realized price1 of US$1,890 per ounce. |
| · | Q3 2022 record production and sales have resulted in the Company being operating cash flow positive, the second consecutive quarter in the Company’s history. This positive trajectory is expected to continue in Q4 2022. |
| · | Following record sales during Q3 2022, the Company recognized revenue of $5.7 million, cost of sales of $1.5 million and cash costs1 of $508 per ounce, generating strong gross profit of $4.2 million (73% gross profit margin), record quarterly net income attributable to common shareholders of $2.0 million and operating cash flow of $2.0 million. |
| · | As at May 31, 2022, the Company had cash of $10.5 million and net working capital of $4.5 million. After adjusting for $3.4 million in derivative liabilities which will only be settled by issuing equity of the Company, working capital on an adjusted basis was $7.9 million. |
| · | As the Company advances and the production profile expands, management continually evaluates its liquidity requirements and available sources of financing including but not limited to: (i) cash flow from operations; (ii) corporate debt; (iii) project specific debt; (iv) off-take financing; and (v) equity financing. The Company will be prudent in how it capitalizes the Company over the short, medium and long-term with shareholder value being an overarching consideration. |
Other
| · | During 2021, TRX Gold through Buckreef Gold hired a surveying consultant (Property Matrix Company Limited) to commence the land compensation process required under Tanzanian mining law. The land compensation process has been fully accrued in the Company’s financial statements and as of May 31, 2022, approximately 98% of project affected persons have been paid representing 96% of the overall dollar amount. This process is expected to be completed prior to the Company’s fiscal year-end. |
| · | In Q3 2022, Buckreef Gold was granted an extension to the renewal date for the Special Mining License (SML 04/92). The Company received a certificate for Renewal of Special Mining License (SML) from the Mining Commission, a division of the Ministry of Minerals of the United Republic of Tanzania. The Special Mining License renewal period for Buckreef Gold has now been extended by an additional 5 years from 2027 to 2032. Under the Tanzanian Mining Act, a SML confers on the holder the exclusive right to carry out mining operations and to prospect (within the SML) for minerals as specified in the license. The duration of the Special Mining License covers the estimated life of mine, with specified renewals over that period. The Company anticipates the life of mine will extend significantly beyond 2032, and therefore the Company will apply to renew the SML prior to the renewal date, in accordance with the requirements under the Tanzanian Mining Act. |
| 7 |
| Management’s Discussion and Analysis May 31, 2022 |
Operational Overview
The Buckreef Gold Project
The Company is focused on the Buckreef Gold Project located in the Geita District of the Geita Region south of Lake Victoria, approximately 110 km southwest of the City of Mwanza, Tanzania (Figure 1). The Buckreef Gold Project area can be accessed by ferry across Smiths Sound, via a paved national road and, thereafter, via well maintained unpaved regional roads. The Buckreef Gold Project comprises five prospects, namely Buckreef, Bingwa, Tembo, Eastern Porphyry and Anfield. The Buckreef Gold Project itself encompasses three main mineralized zones: Buckreef South, Buckreef Main and Buckreef North. The Buckreef Gold Project is fully licensed for mining and the extraction of gold.
The Buckreef Gold Project Mineral Resources as of May 15, 2020, are as follows:
| Measured | Indicated | Inferred | Total (Measured + Indicated) | |||||||||
| Tonnes | Grade | Au | Tonnes | Grade | Au | Tonnes | Grade | Au | Tonnes | Grade | Au | |
| Area | MT | g/t | Oz | MT | g/t | Oz | MT | g/t | Oz | MT | g/t | Oz |
| Buckreef | 19.98 | 1.99 | 1,281,160 | 15.89 | 1.48 | 755,120 | 17.82 | 1.11 | 635,540 | 35.88 | 1.77 | 2,036,280 |
| Eastern Porphyry | 0.09 | 1.20 | 3,366 | 1.02 | 1.17 | 38,339 | 1.24 | 1.39 | 55,380 | 1.10 | 1.18 | 41,705 |
| Tembo | 0.02 | 0.99 | 531 | 0.19 | 1.77 | 10,518 | 0.27 | 1.92 | 16,461 | 0.20 | 1.70 | 11,048 |
| Bingwa | 0.90 | 2.84 | 82,145 | 0.49 | 1.48 | 23,331 | 0.22 | 1.49 | 10,541 | 1.39 | 2.36 | 105,477 |
| Total | 20.99 | 2.03 | 1,367,202 | 17.59 | 1.46 | 827,308 | 19.55 | 1.14 | 717,922 | 38.57 | 1.77 | 2,194,510 |
Note: Main Zone at 0.4g/t cut-off, and Eastern Porphyry, Bingwa and Tembo at 0.5 g/t cut-off
Mineral Resources inclusive of Mineral Reserves
Mineral Resources that are not Mineral Reserves do not have demonstrated economic viability
All resources below 540mRL classified as inferred
Estimates over variable widths of 2 to 40m
Bulk Density ranges 2.0g/cm3 to 2.8g/cm3
55% attributable to the Company
Effective Date: May 15, 2020
Mineral Reserves remained as of the May 15, 2020 Technical Report and are tabulated below.
| Buckreef Reserves | Tonnes | Grade | In Situ Gold Content | |
| (Mt) | Au (g/t) | Kg | oz | |
| Proven-Stockpile | 119,726 | 1.86 | 223 | 7,160 |
| Proven | 9,352,183 | 1.72 | 16,092 | 517,358 |
| Probable | 9,730,764 | 1.36 | 13,265 | 426,492 |
| Mineral Reserves | 19,202,673 | 1.54 | 29,580 | 951,010 |
| 1) Mineral Reserves is inclusive of Mineral Reserve shapes, mining recovery, mining dilution and open pit preproduction development costs. Mineral Reserve estimate includes dilution. | ||||
| 2) Mineral Reserve was estimated using NI 43-101F compliant Standards on Mineral Resources and Reserves, Definitions. | ||||
| 3) Contained metal may differ due to rounding. | ||||
Mineral Resource and Reserve Statements
The Company did not conduct any new work that would warrant material changes in the previously reported Mineral Resource and Mineral Reserve statements during this reporting period.
| 8 |
| Management’s Discussion and Analysis May 31, 2022 |
Figure 1: Location of Buckreef Gold Project Licences on Lake Victoria Greenstone Belt
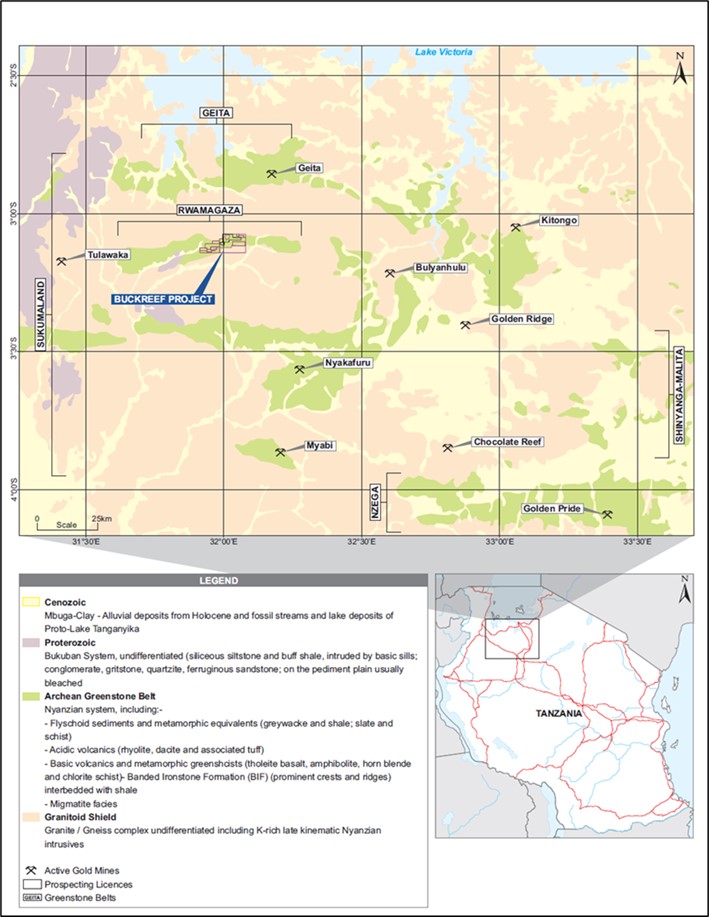
| 9 |
| Management’s Discussion and Analysis May 31, 2022 |
Processing Plant and Operations
In Q3 2022, Buckreef Gold successfully completed the first full quarter operating Phase 1 of the 1,000+ tpd processing plant at its nameplate capacity of 360 tpd.
Select operating, financial and stockpile information follows below:
Select Operating and Financial Data
| Unit | Three months ended May 31, 2022 | Three months ended February 28, 2022 | |||
| Operating Data | |||||
| Ore Mined | k tonnes | 55 | 47 | ||
| Waste Mined | k tonnes | 244 | 109 | ||
| Total Mined | k tonnes | 299 | 156 | ||
| Strip Ratio | w:o | 4.4 | 2.3 | ||
| Mining Rate | tpd | 3,250 | 1,734 | ||
| Mining Cost (Variable) | US$/t | $2.84 | $3.07 | ||
| Plant Ore Milled | k tonnes | 34.8 | 25.8 | ||
| Head Grade | g/t | 2.67 | 2.88 | ||
| Plant Utilization | % | 93 | 92 | ||
| Plant Recovery Rate | % | 91 | 90 | ||
| Processing Cost (Fixed) | US$ ('000s) | $159 | $151 | ||
| Processing Cost (Variable) | US$/t | $14.15 | $15.59 | ||
| Plant Mill Throughput | tpd | 378 | 286 | ||
| Gold Ounces Poured | oz | 2,733 | 2,132 | ||
| Gold Ounces Sold | oz | 3,033 | 1,812 | ||
| Financial Data | |||||
| Revenue1 | $ ('000s) | 5,732 | 3,334 | ||
| Gross Profit | $ ('000s) | 4,190 | 1,891 | ||
| Net income (loss) | $/share | 0.01 | (0.01) | ||
| Operating Cash Flow | $ ('000s) | 2,011 | 1,544 | ||
| Average Realized Price2 | $/oz | 1,890 | 1,840 | ||
| Cash Costs2 | $/oz | 508 | 796 | ||
| 1 Revenue includes immaterial amounts from the sale of by-product silver and copper. | |||||
| 2 Refer to the "Non-IFRS Performance Measure" section. | |||||
| 10 |
| Management’s Discussion and Analysis May 31, 2022 |
Operations Discussion
Gold Production and Sales
During Q3 2022, Buckreef Gold poured 2,733 ounces of gold and sold 3,033 ounces of gold, both new quarterly records for the Company. The record production and sales has resulted in positive operating cash flow at Buckreef Gold and TRX Gold for the second consecutive quarter.
Mining
Total ore mined in Q3 2022 increased to 55 thousand tonnes (kt) from 47 kt in Q2 2022. In Q3 2022 the strip ratio was 4.4 (waste:ore tonnes) and on a ‘project to date’ basis is 4.5 (waste:ore tonnes). During Q3 2022 Buckreef continued to build up a significant inventory of mined material.
Mining costs per tonne (variable) primarily reflect contractor mining costs following the hiring of FEMA in Q1 2022 on a two-year contract to mine ore, waste and to construct the TSF at Buckreef Gold. Mining costs per tonne (variable) of $2.84 in Q3 2022 were lower as compared to Q2 2022 ($3.07) primarily due to the impact of higher tonnes mined on the fixed portion of the mining contractor management fee, combined with usage of a more efficient portable rock breaker for rock fragmentation during the quarter in place of contractor blasting activity.
Processing
The 360 tpd processing plant operated at nameplate capacity in Q3 2022 and achieved the following statistics: (i) average throughput of 378 tpd; (ii) plant availability of 93%; and (iii) average recovery rate of 91% with consistent tailings grade, regardless of head grade.
Processing costs per tonne (variable) of $14.15 in Q3 2022 reflected a decrease relative to Q2 2022 ($15.59) primarily due to greater efficiency of grinding media and chemical consumption in Q3 2022.
Stockpile, Gold in Circuit (GIC) and Finished Goods Inventory
At the end of May 2022, Buckreef Gold reported the following stockpile statistics: (i) the ROM pad contained 81,867 tonnes at 1.37 g/t with an estimated 3,613 ounces of gold; and (ii) crushed mill feed of 8,439 tonnes at 3.38 g/t containing an estimated 917 ounces of gold. As at May 31, 2022, Buckreef Gold also had 539 ounces of gold in circuit, reflecting a buildup of metal inventory in the CIL tanks which will be processed in Q4 2022. The significant stockpile and GIC balance at Q3 2022 provide support for the Company to meet its production guidance in the upcoming quarters.
| 11 |
| Management’s Discussion and Analysis May 31, 2022 |
A summary of the stockpile statistics is contained in the table below:
| Table: RoM Stockpile Summary (as at 31 May 2022) | |||||
| Summary RoM Stockpile | Volume (m3) | Tonnes | Grade (g/t Au) | Metal (oz) | |
| High Grade | 2,406 | 6,587 | 3.54 | 750 | |
| Medium Grade | 22,259 | 40,186 | 1.58 | 2,042 | |
| Low Grade | 20,405 | 35,093 | 0.76 | 820 | |
| Total (RoM) | 45,070 | 81,867 | 1.37 | 3,613 | |
| Crushed | 3,038 | 8,439 | 3.38 | 917 | |
| Total | 48,108 | 90,306 | 1.56 | 4,530 | |
| 12 |
| Management’s Discussion and Analysis May 31, 2022 |
Figure 2: Buckreef Gold Mine Oxide Mineral Reserve Starter Pit (View to the Northeast, May 2022)
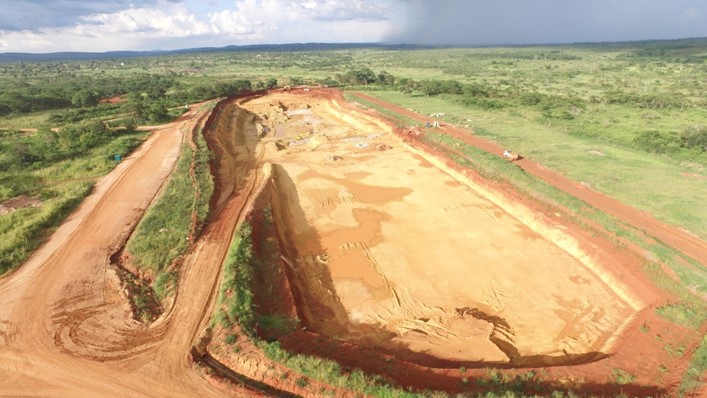
Figure 3: CIL Tank Construction at 1,000 tpd Plant at Buckreef Gold Mine (July 2022)
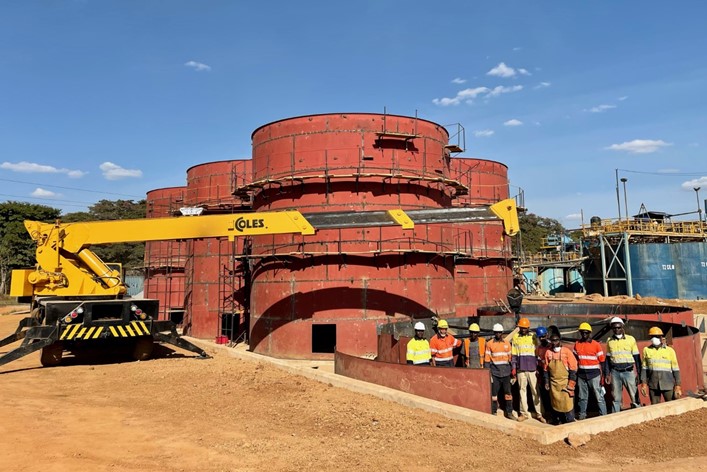
| 13 |
| Management’s Discussion and Analysis May 31, 2022 |
Figure 4: Buckreef Gold Expanded 360 TPD Processing Plant Integrated With 120 TPD Processing Plant (Q3 2022)
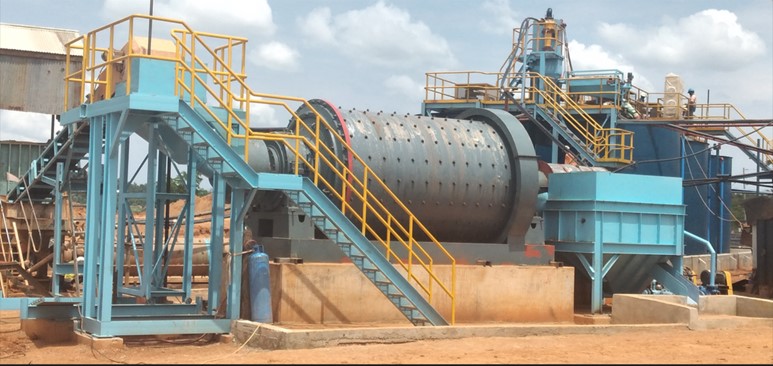
Figure 5: Buckreef Gold Drill Rig in Northeast Extension (Q3 2022)
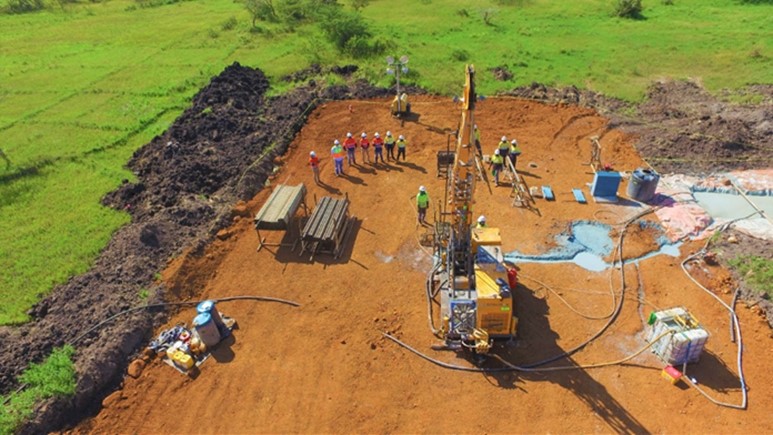
| 14 |
| Management’s Discussion and Analysis May 31, 2022 |
Exploration & Mineral Resources
TRX Gold and Buckreef Gold continue to evaluate the full potential of the Buckreef Gold property and identify opportunities for the discovery of additional mineral resources and their conversion to mineral reserves. Successful exploration will also provide greater production flexibility and growth. To achieve this goal the Company, in conjunction with Buckreef Gold, has:
| · | Re-evaluated the Buckreef Main Zone for strike extensions, off-shoot splays, and at depth potential. The deposit is open in all directions (See Figure 6). To date the Company has tested the NE Extension and successfully identified gold mineralization over an additional 250 m; |
| · | Drilled the Buckreef West target, a splay off the Buckreef Main Zone, with positive drill results and further follow-up drilling will occur in 2022. Buckreef West has the potential to add additional resources to the oxide and sulphide mine plans (see Figure 7); |
| · | In 2021 the Company discovered the Anfield Zone, a parallel structure 500 meters to the east of the Buckreef Main Zone and with evidence of an additional 3 km of shear zone target (See Figure 7). Initial grab sample results have been high-grade, including three samples grading 37.52 g/t, 28.55 g/t and 14.42 g/t respectively; |
| · | Following completion of infill drilling at the Buckreef South pit area the Company has planned additional drilling to test for extension of gold mineralization to the southwest beyond the existing Mineral Resources. Drilling in this area commenced in June 2022; and |
| · | Evaluated and identified numerous other targets at Buckreef Gold, which form part of an exploration pipeline or ‘Exploration Triangle’ at the Buckreef Gold Project. |
Buckreef Gold Main Zone Drilling Results and Interpretation
The Buckreef Main Zone has been re-evaluated and exploration targets to expand the zone have been identified. Results to date evidence a vertically extensive shear zone extending nearly 2 km on strike in a northeast, southwest trend. The deposit is open along strike and at depth. Analysis of drill hole intersections and the mineral resource block model indicates that higher grade shoots exist within the deposit and that these are of sufficient width and grade to be of interest for future underground mining. Should this be the case the deposit may have a significantly extended Life of Mine.
The significant mineralized intercepts of the Buckreef Main Zone are as shown in the Figure 6. It is evident that the deposit remains open on trend to the northeast and southwest. As noted, the Company has initiated a drill program, specifically to explore potential mineralization extensions to the NE and SW and to upgrade Inferred Mineral Resources.
Buckreef Gold – Fiscal 2022 Exploration to Date
Buckreef Gold confirmed an extension of the Buckreef Main Zone by 250 meters (m) (16% increase in the strike length of the Buckreef Main Zone to 1.8 kilometers) and reported positive assay results from the northeast step-out drilling program on the Buckreef Gold Main Zone.
The results are positive and significant for the Company as they demonstrate: (i) good width and grade of mineralization consistent with the Buckreef Main Zone; (ii) successful step-out extending the strike length of known mineralization; (iii) gold mineralization open to NE and at depths to 250-300m, again consistent with the Buckreef Main Zone; and (iv) the immense opportunity to generate and drill significant exploration targets to expand the scale and scope of the Buckreef Gold project.
| 15 |
| Management’s Discussion and Analysis May 31, 2022 |
Highlights include:
| · | Select intercepts: |
| § | Hole BMDD233 intersected 19.5m grading @ 2.35 g/t Au from 203.0m, including: (i) 6.0m grading @ 6.27 g/t Au at 215.0m; and (ii) 39.4m grading @ 2.19 g/t from 361.9m. |
| § | Hole BMDD228 intersected 25.5m grading @ 1.01 g/t Au from 348.5m; and |
| § | Hole BMDD236 intersected 28.0m grading @ 3.27 g/t Au from 299.0m, including 7.05m grading @ 7.22 g/t Au at 300.0m. |
| · | Extension of Buckreef Main Zone by 250m: Expansion of gold mineralization by 250m (16% increase in the strike length of the Buckreef Main Zone to 1.8kms) on the Buckreef Gold deposit which already contains over 2.0 million ounces of gold in the Measured and Indicated Mineral Resources in the Buckreef Main Zone. The Buckreef Main Zone continues to be open further to the NE and extending to the Buckreef Special Mining License boundary (see Figures 8, 9 & 10). Results to date from the drill program are tabulated below in Table 1.1. |
| · | Expansion of Exploration Program: Buckreef Gold has drilled 21 holes to date representing over 7,415 meters in the NE extension of Buckreef Main Zone and has added an additional drill rig to expand the exploration program. Buckreef Gold has finalized the planning for an additional 10,000m (approximate) infill and extension drill program to: (i) upgrade Mineral Resources currently in the Inferred category in Buckreef Gold Main Zone, and (ii) commence infill drilling at Buckreef West. This program has commenced and it is the Company’s intention to begin exploration drilling at the newly discovered Anfield Zone and extend the Eastern Porphyry Zone this year. This exploration program combined with the extension of the Buckreef Main Zone is expected to expand the scope and scale of the Buckreef Gold project. |
Table 1.1: Buckreef Main Zone Northeast Extension (NEE) Assay Results3
| North East Extension Prospect Assay Results | ||||||||||||
| Hole ID | Hole Type | Drill Holes Location | Sample Depth | Width (m) | Assay Grade (g/t) | Lithology | Comment | |||||
| Easting (m) | Northing (m) | RL (m) | Azimuth | Dip | From (m) | To (m) | ||||||
| BMDD228 | DD | 391440.5 | 9658844.7 | 1222.2 | 126 | -58 | 307.60 | 310.60 | 3.00 | 3.85 | Msz | Shear zone with Mild alteration |
| 337.50 | 363.00 | 25.50 | 1.01 | Shear zone with Mild alteration | ||||||||
| BMDD231 | DD | 391496.5 | 9658894.2 | 1219.7 | 126 | -60 | 348.50 | 351.61 | 3.11 | 3.10 | Msz | Mineralised shear zone |
| 349.79 | 350.79 | 1.00 | 7.08 | Msz | Mineralised shear zone | |||||||
| 373.14 | 376.25 | 3.11 | 2.21 | Msz | Mineralised shear zone | |||||||
| BMDD232 | DD | 391538.0 | 9658925.8 | 1223.2 | 126 | -62 | 103.86 | 108.85 | 4.99 | 1.10 | Msz | Shear zone with mild alteration |
| 130.07 | 137.29 | 7.22 | 0.87 | Msz | Shear zone with mild alteration | |||||||
| 143.47 | 152.12 | 8.65 | 0.50 | Msz | Shear zone with mild alteration | |||||||
| 187.06 | 192.18 | 5.12 | 0.53 | Msz | Shear zone with mild alteration | |||||||
| BMDD233 | DD | 391504.7 | 9658948.2 | 1226.0 | 126 | -65 | 17.92 | 23.00 | 5.08 | 0.72 | Msz | Shear zone with mild alteration |
| 193.00 | 195.89 | 2.89 | 1.35 | Msz | Mineralised shear zone | |||||||
| 203.00 | 222.52 | 19.52 | 2.35 | Msz | Shear zone with strong alteration | |||||||
| 215.09 | 221.13 | 6.04 | 6.27 | Msz | Shear zone with strong alteration | |||||||
| 361.89 | 401.26 | 39.37 | 2.19 | Msz | Mineralised shear zone | |||||||
| BMDD234 | DD | 391485.0 | 9659021.0 | 1229.0 | 126 | -63 | 326.21 | 331.80 | 5.59 | 0.47 | Msz | Shear zone with mild alteration |
| BMDD235 | DD | 391543.0 | 9658995.0 | 1222.0 | 126 | -63 | 140.20 | 144.70 | 4.50 | 0.58 | Msz | Mineralised shear zone |
| BMDD236 | DD | 391548.0 | 9659036.0 | 1228.0 | 126 | -62 | 299.00 | 327.00 | 28.00 | 3.27 | Msz | Shear zone with strong alteration |
| 300.00 | 307.05 | 7.05 | 7.22 | Msz | Shear zone with strong alteration | |||||||
| 16 |
| Management’s Discussion and Analysis May 31, 2022 |
Figure 6: Long section of Buckreef Main Zone (View to the West) Showing 1 Meter Composite Values and Technical Report Pit Outline. The Area of Current Exploration to the NE of the Main Zone is Highlighted
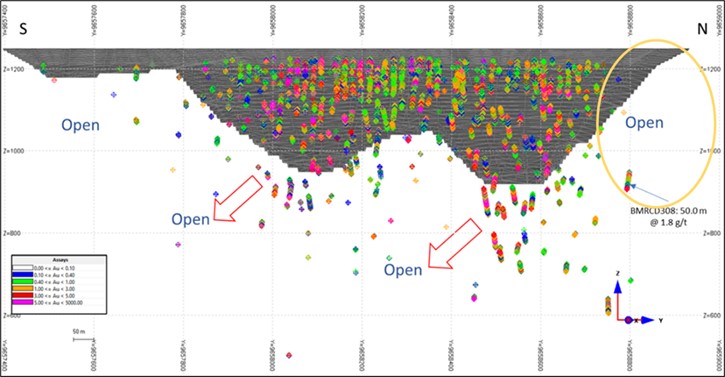
Figure 7: NE Buckreef Main Zone Exploration Target Highlighted and in Relation to the Anfield Zone

| 17 |
| Management’s Discussion and Analysis May 31, 2022 |
Figure 8: Map Showing Mineralization Extension and Location of Drill Results at Buckreef Main Zone Northeast Extension (Drone Base Image Date – May 2021. Oxide Pit outline as of April 2022)
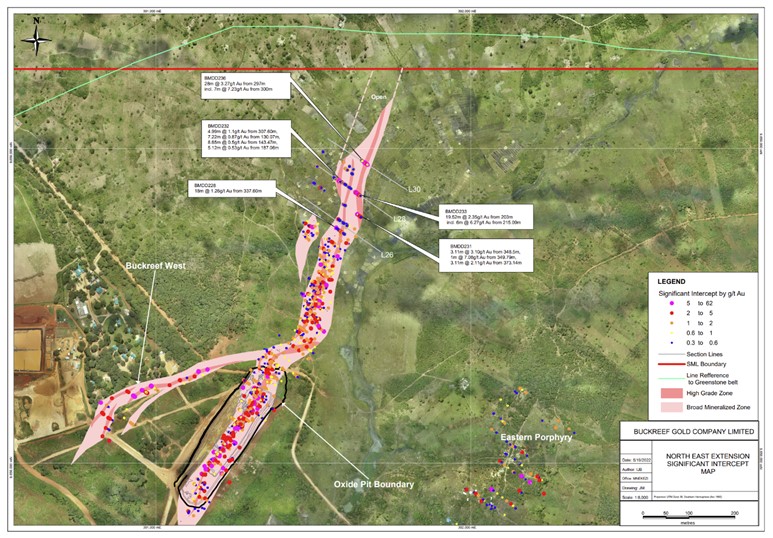
| 18 |
| Management’s Discussion and Analysis May 31, 2022 |
Figure 9: Section 30 – Looking to North-East
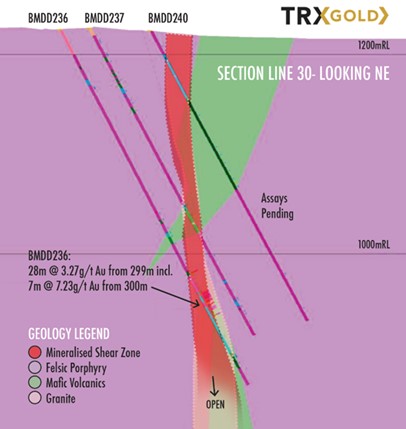
Figure 10: Section 28 – Looking to North-East
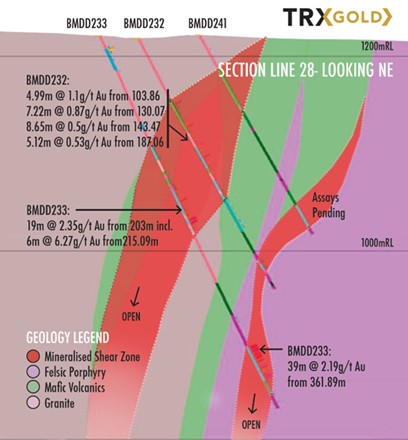
| 19 |
| Management’s Discussion and Analysis May 31, 2022 |
Sulphide Development Project – Preliminary Metallurgical Results and Ongoing Work
During fiscal Q2 2022, the Company working with Ausenco, revised and elaborated the RFP process and refined technical requirements, including studies for dry stack tailing parameters. In the prior quarter the Company had identified a number of laboratories to complete this work to undertake the metallurgical variability phase for Buckreef Gold which will encompass the first 5-7 years of production from the sulphide operation at Buckreef Gold. This study will build on the prior work of SGSC on deeper parts of the mineral resource and data gathered during processing of the oxide, transitional mineral reserve.
SGS Lakefield was retained to complete initial metallurgical test work at their Lakefield, Ontario facility on the sulphide component of the mineral resource, this work was completed in 2021. As part of the initial (2021) study, three diamond core samples taken from the fresh rock (‘sulphide’ mineral resource) of the Buckreef Gold deposit were submitted to SGS Lakefield for the study.
The study highlights include:
| · | The following intercepts and gold recoveries have been confirmed in the report: |
| ü | MC01: 0.54 g/t Au over 78.88 meters – 94.1% |
| ü | MC02: 19.4 g/t Au over 27.99 meters – 95.4% |
| ü | MC03: 1.71 g/t Au over 52.53 meters – 85.3% |
| · | A straightforward flowsheet consisting of: |
| ü | Primary grinding to P80 = ~100-150 µm |
| ü | Rougher flotation |
| ü | Regrind of the rougher concentrate to ~15-20 µm (P80) |
| ü | Cyanide leaching of the reground flotation concentrate |
| ü | Cyanide leaching of the flotation tailing |
| · | No refractory association of gold with arsenic sulphide was detected; |
| · | The samples tested did not exhibit any preg-robbing or other refractory characteristics; |
| · | Clean tailings, high probability of mine tailings not being acid generating, confirming the approach of dry stack tailings going forward; and |
| · | Further opportunities to improve gold extraction from MC03 have been identified through diagnostic leach testing. |
| 20 |
| Management’s Discussion and Analysis May 31, 2022 |
In 2020, three diamond drill holes were completed for the purposes of initial, modern era metallurgical test work. Diamond drill hole details are tabulated below:
| Hole ID | Hole Type | Composite | Drill Holes Location | Sample Depth | Width (m) | Grade (g/t) | Recovery % | Comment | |||||
| ID | Easting (m) | Northing (m) | RL (m) | Azimuth | Dip | From (m) | To (m) | ||||||
| BMMT001 | DD | MC01 | 391562.00 | 9658608.00 | 1220.00 | 303 | -72 | 77.50 | 156.80 | 78.88 | 0.54 | 94.1 | Partial to completely altered mineralised shear zone |
| 5% quartz veining | |||||||||||||
| BMMT002 | DD | MC02 | 391320.00 | 9658036.00 | 1223.00 | 307 | -69 | 239.9 | 267.89 | 27.99 | 19.4 | 95.4 | Partial to completely altered mineralised shear zone |
| BMMT003 | DD | MC03 | 391593.00 | 9658358.00 | 1217.00 | 310 | -63 | 222.81 | 275.34 | 52.53 | 1.71 | 85.3 | Partial to completely altered mineralised shear zone |
| with minor graphitic altered fractutured surfaces | |||||||||||||
| The sample chain of custody was managed by SGS Tanzania team, as per local sample export regulations. Reported results are from composite diamond drilled core samples. Intervals of core for metallurgical testwork analyzed are full HQ core size. Diamond drilled core has been a HQ size and recoveries are consistently 100% across all drill holes intercept reported. | |||||||||||||
| Sampling and analytical procedures are subject to a comprehensive quality assurance and quality control program. The QAQC program involves insertion of duplicate samples, blanks and certified reference materials in the sample stream. Gold analyses are performed by screened metallics assaying protocols. | |||||||||||||
| Interval represents drilled length in meters, and not true width | |||||||||||||
| Sample Preparation and analysis are performed by independent SGS (Lakefield) Laboratory, Ontario, Canada | |||||||||||||
The samples were extracted as fresh drill core from areas/zones with known lithologies from within the current project’s open pit limit. The samples were selected by TRX Gold and confirmed by the SGS geological services group that worked together doing the metallurgical sample selection. The investigation included ore characterization, comminution, mineralogy, head analyses, and potential for gold preg-robbing, and evaluated the amenability of the three samples to two primary processing flowsheet options, that incorporate comminution (crushing and grinding), gravity separation, flotation and cyanidation unit operations.
Metallurgical testing for the sulphide development project has moved to variability testing of the first 5-7 years of production and will continue throughout 2022 including tailing characteristics for dry stack tailings. Geotechnical and groundwater work will continue on identified areas (i.e. plant, tailings, waste rock storage facility). To date, a total of 19 holes (2,367 meters) have been completed for the metallurgical program. These metallurgical sample holes have been logged and are in preparation for shipment. Similar to the initial metallurgical test work, the samples will be analyzed for:
| · | Overall gold recoveries; |
| · | Process design to achieve those recoveries (grindability, retention times, straight CIL or flotation/regrind); |
| · | Any pregnant solution robbing or refractory mineralogy; |
| · | Acid Mine Drainage (if any) characteristics; and |
| · | Dry stack tailings characteristics. |
An RFP for this study has been submitted to various laboratories during Q3 2022 and the RFP process is well underway.
| 21 |
| Management’s Discussion and Analysis May 31, 2022 |
Quarterly Financial Highlights
For the three months ended May 31, 2022, Buckreef Gold produced and sold 2,733 and 3,033 ounces of gold, respectively – both quarterly records for the Company.
Effective for the three months ended February 28, 2022 the Company early adopted the IAS 16, Property Plant and Equipment (PP&E) amendment which prohibits the deduction from the cost of PP&E any proceeds received from the sales produced while bringing the asset to the condition intended by management. Instead, the Company recognizes the proceeds from the sale of such items, and the cost of producing those items in the Statements of Earnings and Comprehensive Income (Loss).
Following early adoption of IAS 16, the Company recognized revenue on the Statements of Earnings and Comprehensive Income (Loss) of $5.7 million for the three months ended May 31, 2022 ($9.1 million for the nine months ended May 31, 2022).
Cost of sales, which includes production costs, royalties and depreciation, was $1.5 million generating a strong gross profit margin of $4.2 million or 73% during Q3 2022 and net earnings attributable to shareholders of $2.0 million.
The quarterly sales record (3,033 ounces) generated positive operating cash flow of $2.0 million in Q3 2022 – the second consecutive quarter of positive operating cash flow in the Company’s history. Positive operating cash flow will be used to help fund value creating activities, including exploration and the sulphide development project.
At May 31, 2022 the Company had a cash balance of $10.5 million and a working capital surplus of $7.9 million after adjusting for current liabilities which will only be settled by issuing equity.
Capital Expenditures
The Company incurred a total of $4.5 million in cash capital expenditures during the three months ended May 31, 2022. Net additions increased as the Company continued to invest in infrastructure and development for the Buckreef Gold property during the quarter. Net additions during Q3 2022 primarily included capital expenditures related to expansion of the processing plant to 1,000+ tonnes per day ($2 million), including costs related to completion of earthworks, construction of the tank line 3 foundation and bund wall, steel procurement, fabrication, construction and welding of the CIL tanks, procurement and installation of the tanks’ internal components, including launders, baffles, tailings discharge, carbon screen and trash screen and fabrication on the conveyors required by the crushing system and plant. Construction for the ball mill foundations and plinths have also been completed and cured and the bund wall surrounding the ball mills is now approximately 75% complete. Additionally, during the quarter the Company capitalized costs for development drilling related to the 10,000 meter diamond drill program with STAMICO ($1.3 million), pre-stripping mine development activity with FEMA ($0.3 million), TSF-3 design work ($0.2 million) and costs related to procurement of a new enterprise resource planning software tool at Buckreef Gold ($0.1 million).
| 22 |
| Management’s Discussion and Analysis May 31, 2022 |
Selected Financial Information
The following information has been extracted from the Company’s unaudited consolidated financial statements prepared in accordance with International Financial Reporting Standards (“IFRS”), for the three and nine months ended May 31, 2022 and the years ended August 31, 2021 and 2020.
| $(000's) | As at and for the three months ended May 31, 2022 | As at and for the nine months ended May 31, 2022 | As at and for the year ended August 31, 2021 | As at and for the year ended August 31, 2020 |
| Net earnings (loss) and comprehensive income (loss) attributable to shareholders | 1,971 | (2,009) | (5,283) | (12,145) |
| Basic earnings (loss) per share | 0.01 | (0.01) | (0.02) | (0.07) |
| Diluted earnings (loss) per share | 0.01 | (0.01) | (0.02) | (0.07) |
| Total assets | 65,639 | 65,639 | 56,518 | 38,139 |
| Total long term financial liabilities | 2,781 | 2,781 | 2,681 | 2,680 |
Financial Results
Three months ended May 31, 2022
| Three months ended | ||||||||
| May 31 | ||||||||
| 2022 | 2021 | |||||||
| Revenue | $ | 5,732 | $ | - | ||||
| Cost of sales | (1,542 | ) | - | |||||
| Gross profit | 4,190 | - | ||||||
| General and administrative expense | (2,518 | ) | (2,089 | ) | ||||
| Financial instrument related cost and other | 1,334 | 2,541 | ||||||
| Reclamation expense | (12 | ) | (62 | ) | ||||
| Loss on disposal of assets | (26 | ) | (26 | ) | ||||
| Transaction costs on convertible debenture | - | (25 | ) | |||||
| Foreign exchange | 333 | (306 | ) | |||||
| Interest, net and other expense | (5 | ) | - | |||||
| Current income tax expense | (108 | ) | - | |||||
| Net earnings and comprehensive income | $ | 3,188 | $ | 33 | ||||
| Net earnings (loss) and comprehensive income (loss) attributable to non-controlling interests | 1,217 | (483 | ) | |||||
| Net earnings (loss) and comprehensive income (loss) attributable to shareholders | 1,971 | 516 | ||||||
Revenue
For the three months ended May 31, 2022, the Company recognized revenue of $5.7 million. Note that the financial statements for the comparable period do not present revenue, cost of sales or gross profit as Buckreef Gold early adopted the IAS 16 amendment as disclosed in the three and six months ended February 28, 2022 financial statements. Gold sales and related costs prior to that date were capitalized to exploration and evaluation assets and expenditures. During the period, the Company sold 3,033 ounces of gold at a realized price1 of $1,890 per ounce.
| 23 |
| Management’s Discussion and Analysis May 31, 2022 |
Cost of sales
Cost of sales for the three months ended May 31, 2022 were $1.5 million and are comprised of production costs, (including mining, processing, site services and site general and administrative costs), royalties and depreciation. Assets are depreciated on a straight-line basis over their useful life, or depleted on a units-of-production basis over the reserves to which they relate. During the period, the Company recorded cash costs1 of $508 per ounce, below guidance, mainly due to a build-up of inventory stockpiles in Q3 2022 (28 kt), lower mining costs due to usage of a more efficient portable rock breaker for rock fragmentation during the quarter in place of contractor blasting activity, and lower processing costs due to more efficient consumption of grinding media and chemicals during the quarter.
General and administrative expense
During the three months ended May 31, 2022, the Company recorded general and administrative expense of $2.5 million compared to $2.1 million for the previous year comparable period. The increase in general and administrative expense was mainly due to an increase in Share Based Payments (2022 - $0.6 million, 2021 - $nil) related to the vesting of the common shares granted by the Company upon hiring key management personnel during the year ended August 31, 2021.
Financial instrument related cost and other
During the three months ended May 31, 2022, the Company had a financial instrument related gain of $1.3 million compared to a gain of $2.5 million in the prior year period due to a lower gain on revaluation of derivative warrant liabilities. The gain on revaluation of derivative warrant liabilities (Q3 2022 - $1.3 million gain, Q3 2021 - $2.5 million gain) was principally due to a decrease in the share price using the Black Scholes option pricing model (Q3 2022 - $0.34, Q3 2021 - $0.50).
Foreign Exchange
During the three months ended May 31, 2022, the Company had a foreign exchange gain of $0.3 million compared to a loss of $0.3 million in the prior year period. The variance compared to the prior period was primarily due to a depreciation of the Tanzanian Shilling relative to the US Dollar during Q3 2022.
Current income tax expense
Income tax expense is recognized based on management’s estimate of the weighted average annual income tax rate expected for the full financial year. During the three months ended May 31, 2022, the Company recorded net income at Buckreef Gold and recognized a current income tax payable of $0.1 million (May 31, 2021 - $nil) based on current Tanzanian statutory tax rates.
Net earnings (loss) and comprehensive earnings (loss) attributable to shareholders
The Company reported net earnings for the three month period ended May 31, 2022 of $2.0 million (basic and diluted earnings per share of $0.01, respectively), compared to net earnings of $0.5 million in the prior year period (basic and diluted earnings per share of $0.00, respectively).The increase in net income is primarily the result of an increase in gross profit of $4.2 million following sales of $5.7 million and cost of sales of $1.5 million during Q3 2022. This was partially offset by a lower gain on revaluation of derivative warrant liabilities in the current period versus the prior comparative period ($1.2 million), an increase in general and administrative expense related to an increase in share based payments ($0.4 million) and income tax expense of $0.1 million following recognition of net income at Buckreef Gold.
| 24 |
| Management’s Discussion and Analysis May 31, 2022 |
Nine months ended May 31, 2022
| Nine months ended | ||||||||
| May 31 | ||||||||
| 2022 | 2021 | |||||||
| Revenue | $ | 9,066 | $ | - | ||||
| Cost of sales | (2,985 | ) | - | |||||
| Gross profit | 6,081 | - | ||||||
| General and administrative expense | (7,015 | ) | (5,146 | ) | ||||
| Financial instrument related cost and other | 1,115 | 4,634 | ||||||
| Reclamation expense | (100 | ) | (131 | ) | ||||
| Loss on disposal of assets | (26 | ) | (26 | ) | ||||
| Transaction costs on convertible debenture | - | (708 | ) | |||||
| Foreign exchange | 247 | (383 | ) | |||||
| Interest, net and other expense | (15 | ) | (6 | ) | ||||
| Current income tax expense | (259 | ) | - | |||||
| Net earnings (loss) and comprehensive income (loss) | $ | 28 | $ | (1,766 | ) | |||
| Net earnings (loss) and comprehensive income (loss) attributable to non-controlling interests | 2,037 | (1,200 | ) | |||||
| Net loss and comprehensive loss attributable to shareholders | (2,009 | ) | (566 | ) | ||||
Revenue
Revenue for the nine months ended May 31, 2022 was $9.1 million following early adoption of the IAS 16 amendment in Q2 2022. Gold sales prior to Q2 2022 were capitalized to exploration and evaluation assets and expenditures. During the period, the Company sold 4,845 ounces of gold at a realized price1 of $1,871 per ounce.
Cost of sales
Cost of sales for the nine months ended May 31, 2022 were $3.0 million following early adoption of IAS 16 in Q2 2022. Costs of sales prior to Q2 2022 were capitalized to exploration and evaluation assets and expenditures. During the period, the Company recorded cash costs1 of $616 per ounce, below guidance, mainly due to a build-up of inventory stockpiles combined with lower mining costs and lower processing costs in Q3 2022.
General and administrative expense
During the nine months ended May 31, 2022, the Company recorded general and administrative expenses of $7.0 million compared to $5.1 million for the prior year comparable period. The increase in general and administrative expense was mainly due to an increase in Share Based Payments (2022 - $2.1 million, 2021 - $nil) related to the vesting of the common shares granted by the Company upon hiring key management personnel during the year ended August 31, 2021.
Financial instrument related cost and other
During the nine months ended May 31, 2022, the Company had a financial instrument related gain of $1.1 million compared to a gain of $4.6 million in the prior year period. The variance compared to the prior period was primarily due to a lower gain on revaluation of derivative warrant liabilities. The gain on revaluation of derivative warrant liabilities in both periods was mainly related to a decrease in the share price using the Black Scholes option pricing model.
| 25 |
| Management’s Discussion and Analysis May 31, 2022 |
Current income tax expense
Income tax expense is recognized based on management’s estimate of the weighted average annual income tax rate expected for the full financial year. During the nine months ended May 31, 2022, the Company recorded net income at its Buckreef Gold Project and recognized a current income tax payable of $0.3 million (May 31, 2021 - $nil) based on current Tanzanian statutory tax rates.
Net loss and comprehensive loss attributable to shareholders
The Company reported a net loss for the nine month period ended May 31, 2022 of $2.0 million (basic and diluted loss per share of $0.01, respectively), compared to a net loss of $0.6 million in the prior year period (basic and diluted earnings per share of $0.00, respectively). The increase in the net loss is primarily the result of an increase in financial instrument related costs due to a lower gain on revaluation of derivative warrant liabilities in the current period versus the prior comparative period ($3.5 million) and an increase in general and administrative expense related to an increase in share based payments ($2.1 million). This was partially offset by an increase in gross profit attributable to shareholders following Buckreef Gold revenues of $9.1 million, cost of sales of $3.0 million and gross profit of $6.1 million on a year to date basis.
Summary of Quarterly Results
| ($(000's), except per share amounts) | ||||||||||||||||||||||||||||||||
| US$ unless otherwise stated | 2022 Q3 | 2022 Q2 | 2022 Q1 | 2021 Q4 | 2021 Q3 | 2021 Q2 | 2021 Q1 | 2020 Q4 | ||||||||||||||||||||||||
| Revenue | 5,732 | 3,334 | - | - | - | - | - | - | ||||||||||||||||||||||||
| Earnings (loss) and comprehensive income (loss | 3,188 | (1,002 | ) | (2,158 | ) | (5,311 | ) | 33 | (164 | ) | (1,635 | ) | C$(6,359) | |||||||||||||||||||
| Net earnings (loss) and comprehensive (income ) loss attributable to: | ||||||||||||||||||||||||||||||||
| Non-controlling interests | (1,217 | ) | (956 | ) | 136 | 3,316 | 483 | 197 | 520 | 823 | ||||||||||||||||||||||
| Common shareholders | 1,971 | (1,958 | ) | (2,022 | ) | (1,995 | ) | 516 | 33 | (1,115 | ) | (5,536 | ) | |||||||||||||||||||
Liquidity and Capital Resources
At May 31, 2022 the Company had $10.5 million of cash (August 31, 2021 - $13.4 million) and working capital of $4.5 million (August 31, 2021 – $8.0 million). After adjusting for current liabilities which will only be settled by issuing equity, adjusting working capital is $7.9 million (August 31, 2021 - $10.1 million).
The decrease in cash of $2.9 million over the year ended August 31, 2021 was primarily due to an increase in capital expenditures related to the final commissioning of the 360 tpd processing plant and capital expenditures related to the construction of an expanded 1,000+ tpd processing plant, which is expected to be completed in calendar Q3 2022. Capital was also utilized to fund exploration related to the 10,000 meter diamond drilling program with STAMICO, construction of a tailings storage facility (TSF) as well as other general operating expenses at Buckreef Gold. The decrease in cash related to the increase in capital expenditures was partially offset by net proceeds from the registered direct offering of $6.4 million in Q2 2022 and an increase in operating cash flow in Q2 and Q3 2022. During Q3 the company poured 2,733 ounces of gold (Q2 2022: 2,132) and sold 3,033 ounces of gold (Q2 2022: 1,812), both new records for Buckreef Gold. The rapid advance of production has resulted in Buckreef Gold being operating cash flow positive again in Q3, the second consecutive quarter in the Company’s history. This positive trajectory is expected to continue in Q4.
As of May 31, 2022, the Company has accumulated losses of $119.5 million (August 31, 2021 – $117.5 million).
To supplement the Company liquidity, during Q2 2022, TRX Gold successfully closed the previously announced registered direct offering with a single institutional investor for net proceeds of approximately $6.4 million, providing the Company with additional liquidity to help fund acceleration of its business plan.
| 26 |
| Management’s Discussion and Analysis May 31, 2022 |
In addition, to provide the Company with access to supplementary liquidity, in Q2 2022 TRX Gold entered into a purchase agreement with Lincoln Park Capital Fund, LLC (“Lincoln Park”). This agreement provides TRX Gold with the right to sell up to $10 million of its shares to Lincoln Park over a 36-month period at its sole discretion. TRX Gold will control the timing and amount of any sales to Lincoln Park and will use the proceeds as needed to develop the Buckreef Gold asset. As of May 31, 2022, TRX Gold has made no sales of common shares to Lincoln Park.
Commitments
In order to maintain existing site mining and exploration licenses, the Company is required to pay annual license fees. As at May 31, 2022 these licenses remained in good standing and the Company is up to date on license payments.
Contingencies
The Company is involved in litigation and disputes arising in the normal course of operations. Management is of the opinion that the outcome of any potential litigation will not have a material adverse impact on the Company’s financial position or results of operations. Accordingly, no provisions for the settlement of outstanding litigation and potential claims have been accrued.
Off-Balance Sheet Arrangements
The Company has no off-balance sheet arrangements.
Transactions with Related Parties
The Company may enter into related party transactions that are in the normal course of business. Transactions with Related Parties disclosure can be found in Note 17 of the Q3 2022 Interim Financial Statements.
| 27 |
| Management’s Discussion and Analysis May 31, 2022 |
Omnibus Equity Incentive Plan
Effective June 26, 2019, the Company adopted the Omnibus Equity Incentive
Plan dated June 26, 2019 (the “Omnibus Plan”), which Omnibus Plan was approved by the shareholders on
August 16, 2019, subsequently updated and approved by the shareholders on February 25, 2022.
The purposes of the Omnibus Plan are: (a) to advance the interests of the Company by enhancing the ability of the Company and its subsidiaries to attract, motivate and retain employees, officers, directors, and consultants, which either of directors or officers may be consultants or employees; (b) to reward such persons for their sustained contributions; and (c) to encourage such persons to consider the long-term corporate performance of the Company.
The Omnibus Plan provides for the grant of options, restricted share units (“RSUs”), deferred share units (“DSUs”) and performance share units (“PSUs”) (collectively, the “Omnibus Plan Awards”), all of which are described in detail in the Form 20-F Annual Report for the year ended August 31, 2021, and the Information Circular dated January 21, 2022, filed on SEDAR on January 27, 2022.
The Omnibus Plan provides for the grant of other share-based awards to participants (“Other Share-Based Awards”), which awards would include the grant of common shares. All Other Share-Based Awards will be granted by an agreement evidencing the Other Share-Based Awards granted under the Omnibus Plan.
Subject to adjustments as provided for under the Omnibus Plan, the maximum number of shares issuable pursuant to Omnibus Plan Awards outstanding at any time under the Omnibus Plan shall not exceed 10% of the aggregate number of common shares outstanding from time to time on a non-diluted basis; provided that the acquisition of common shares by the Company for cancellation shall not constitute non-compliance with the Omnibus Plan for any Omnibus Plan Awards outstanding prior to such purchase of common shares for cancellation.
For more particulars about the Omnibus Plan, we refer you to the copy of the Omnibus Plan included with the Form 20-F Annual Report. The Omnibus Plan replaces all previous equity compensation plans of the Company, including the Restricted Stock Unit Plan and Stock Option Plan.
Changes in Accounting Polices and Critical Accounting Estimates and Judgements
Significant accounting policies as well as any changes in accounting policies are discussed in Note 2 “Basis of Preparation and Significant Accounting Policies” and Note 3 “Significant Accounting Judgments, Estimates and Assumptions” of the Company’s Q3 2022 Interim Financial Statements.
Financial Instruments and Financial Risk Management
For details of the Company’s financial instruments, risk exposures relating to financial instruments and sensitivity analysis, refer to Note 21 of the Company’s Q3 2022 Interim Financial Statements.
| 28 |
| Management’s Discussion and Analysis May 31, 2022 |
Non-IFRS Performance Measures
Average realized price per ounce of gold sold
Average realized price per ounce of gold sold is a non-IFRS measure and does not constitute a measure recognized by IFRS and does not have a standardized meaning defined by IFRS. Average realized price per ounce of gold sold is calculated by dividing gold sales proceeds received by the Company for the relevant period by the ounces of gold sold. It may not be comparable to information in other gold producers’ reports and filings.
Dollar amounts are expressed in thousands of US dollars.
| Three Months Ended | Nine Months Ended | |||||||
| May 31, 2022 | May 31, 2022 | |||||||
| Revenue per financial statements | $ | 5,732 | $ | 9,066 | ||||
| Ounces of gold sold | 3,033 | 4,845 | ||||||
| Average realized price gold sold | $ | 1,890 | $ | 1,871 |
Cash costs per ounce of gold sold
Cash cost per ounce of gold sold is a non-IFRS performance measure and does not constitute a measure recognized by IFRS and does not have a standardized meaning defined by IFRS. Cash cost per ounce may not be comparable to information in other gold producers’ reports and filings. The following table provides a reconciliation of total cash costs per ounce of gold sold to cost of goods sold per the financial statements for the three and nine months ended May 31, 2022.
Dollar amounts are expressed in thousands of US dollars.
| Three Months Ended | Nine Months Ended | |||||||
| May 31, 2022 | May 31, 2022 | |||||||
| Cost of good sold per financial statements | $ | 1,542 | $ | 2,985 | ||||
| Ounces of gold sold | 3,033 | 4,845 | ||||||
| Cash costs per ounce of gold sold | $ | 508 | $ | 616 |
The Company has included “average realized price per ounce of gold sold” and “cash costs per ounce of gold sold” as non-IFRS performance measures throughout this MD&A as TRX Gold believes that these generally accepted industry performance measures provide a useful indication of the Company’s operational performance. The Company believes that certain investors use this information to evaluate the Company’s performance and ability to generate cash flow. Accordingly, they are intended to provide additional information and should not be considered in isolation or as a substitute for measures of performance prepared in accordance with IFRS.
| 29 |
| Management’s Discussion and Analysis May 31, 2022 |
Disclosure of Outstanding Share Data
As at the date of this MD&A, there were 276,068,684 common shares outstanding, 41,970,074 share purchase warrants outstanding, nil RSUs/PSUs/DSUs outstanding, and 5,336,000 stock options outstanding.
Risks Factors
The Company is subject to a number of extraneous risk factors over which it has no control. These factors are common to most mineral exploration and development companies and include, among others: project ownership, exploration and development risk, depressed equity markets and related financing risk, commodity price risk, fluctuating exchange rates, environmental risk, insurance risk, sovereign risk. For further details on the risk factors affecting the Company, please see the Company’s Form 20-F Annual Report for year ended August 31, 2021 filed with the SEC on December 3, 2021 and on SEDAR as the Company’s Annual Information Form on November 29, 2021.
Internal Control Over Financial Reporting (“ICFR”)
Management of the Company is responsible for establishing and maintaining adequate internal controls over financial reporting (“ICFR”) for the Company as defined in Rule 13a-15(f) under the Securities and Exchange Act of 1934. The Company’s management, including the Company’s Chief Executive Officer (“CEO”) and Chief Financial Officer (“CFO”) have conducted an evaluation of the design and effectiveness of the Company’s ICFR as of August 31, 2021. In making this assessment, the Company’s management used the criteria established in Internal Control – Integrated Framework, issued by the Committee of Sponsoring Organizations of the Treadway Commission (“COSO 2013 Framework”). This evaluation included review of the documentation of controls, evaluation of the design effectiveness of controls, testing of the operating effectiveness of controls and a conclusion on this evaluation. Based on this evaluation, Management concluded that ICFR was not effective for the three-month period ended November 30, 2021 due to the following material weaknesses: (i) lack of timely review and approval of certain journal entries and reconciliations; (ii) lack of related oversight and accuracy for recognition of certain charges in the Company’s books; and (iii) lack of adequate oversight related to the development and performance of internal controls. Due to the limited number of personnel in the Company, there are inherent limitations related to segregation of duties amongst personnel to perform adequate oversight, review and approvals.
Remediation of Material Weaknesses
The control deficiencies described above were concluded on by management during the year ended August 31, 2021. The Company has prioritized the remediation of the material weaknesses described above and is working under the oversight of the Audit Committee to resolve the issue.
Specific actions to remediate these material weaknesses include the following:
| · | Engagement of a local Tanzanian Certified Public Accounting firm to review the Buckreef Gold, Tanzam 2000 and Tancan books and records, from the invoice level, to ensure completeness and accuracy of recordkeeping in the appropriate account, entity and period. No material misstatements, either individually or in aggregate were identified. |
| · | Reduced Delegation of Authority limits over cash payments to a zero-dollar approval threshold. Executive management (CFO, COO) and site General Managers review and approve every dollar of expenditure and only advance funds for payment based on approved invoices, signed by site GMs and approved by the CFO and COO. |
| · | Hired a VP Finance and Corporate Controller to supplement review and approval of invoices, journal entries, reconciliations, financial statements and note disclosure to improve segregation of duties and internal controls around financial reporting. |
| 30 |
| Management’s Discussion and Analysis May 31, 2022 |
| · | Hired a Senior Procurement Officer at Buckreef Gold to enhance supply chain controls, approvals and authorizations while improving segregation of duties around the procure to pay process. |
| · | Hired two new inventory storekeepers at Buckreef Gold to improve segregation of duties around inventory management, stock count inspections, supplies reconciliations and inventory controls. |
| · | Hired an experienced Finance Manager at Buckreef Gold to enhance the review and approval of mine site journal entries, financial reconciliations, entity level financial statements, segregation of duties and internal controls around financial reporting. |
| · | Enhanced use of ERP to automate certain reconciliations, including fixed asset continuity and depreciation schedules, to eliminate risk of manual spreadsheet errors and to automate more timely review and approval of certain processes. |
| · | Engagement of a third party service provider to assist in the review, implementation and evaluation of Company’s controls and procedures. |
The Company is currently in the process of implementing and documenting its systems of internal controls related to remediate the material weaknesses identified above. However, the Company has been unable to complete this implementation by the required reporting date due to, amongst other things, a limited number of staff at the Company.
It is the Company’s intention to formally review, document and implement the Company’s key controls, including ITGCs, ICFR and DC&P as per the COSO 2013 Framework, as well as develop key risk control matrices to mitigate the risk of material weaknesses in the future.
Additional Information
The Company is a Canadian public company listed on the Toronto Stock Exchange trading under the symbol “TNX” and also listed on the NYSE American trading under the symbol “TRX”. Additional information about the Company and its business activities is available on SEDAR at www.sedar.com; with the SEC at sec.gov; and the Company’s website at www.TRXgold.com.
Approval
The Board of Directors of TRX Gold Corporation has approved the disclosure contained in the interim MD&A. A copy of this interim MD&A will be provided to anyone who requests it. It is also available on the SEDAR website at www.sedar.com
| 31 |
| Management’s Discussion and Analysis May 31, 2022 |
Endnotes
1 Refer to “Non-IFRS Performance Measures” section.
2 The 360 tpd Plant estimates
have not been prepared in accordance with the results of the Company’s 2018 Pre-Feasibility Study, reflected in the Company’s
May 15, 2020 Technical Report. The 18-Month mining plan estimates are based upon an internal mine model reviewed by SGSC and cost inputs
as validated by actual mining and processing costs from the 120 tpd test plan over the 9 months ended
May 31, 2021. No assurance can be given that the 18-Month Estimate (Monthly Average) will reflect actual results. See “Disclosure
and Cautionary Statement Regarding Forward Looking Information”.
3 Notes Regarding Sample Protocol QA/QC: The sample chain of custody is managed by the Buckreef Gold geology team on site. Reported results are from diamond drilled core samples. Intervals of core to be analyzed are split into half using a mechanized core cutter, with one half sent to the Laboratory for geochemical analysis and the remaining half kept in storage for future reference and uses. Diamond drilled core has been a HQ size and recoveries are consistently 100% across all drill holes intercept reported.
Sampling and analytical procedures are subject to a comprehensive quality assurance and quality control program. The QA/QC program involves insertion of duplicate samples, blanks and certified reference materials in the sample stream. Gold analyses are performed by standard fire assaying protocols using a 50-gram charge with atomic absorption (AAS) finish and a gravimetric finish performed for assays greater than 10 grams per tonne.
Sample Preparation and analysis are performed by independent SGS Laboratory in Mwanza, Tanzania. SGS Laboratory is ISO17025 accredited and employs a Laboratory Information Management System for sample tracking, quality control and reporting.
The results summarized in this release are from Buckreef Main Zone NEE prospect. The prospect is an extension of the known Buckreef Main Zone. The intersections reported here are a down-hole length and may not represent true width, but the true width is estimated to be approximately 60% of true width.
32