
Welltower Inc. |
||||
34- | ||||
(State or other jurisdiction of incorporation) |
(Commission File Number) |
(IRS Employer Identification No.) | ||
Welltower OP Inc. |
||||
(State or other jurisdiction of incorporation) |
(Commission File Number) |
(IRS Employer Identification No.) | ||
(Address of principal executive offices) |
(Zip Code) |
Written communications pursuant to Rule 425 under the Securities Act (17 CFR 230.425) |
Soliciting material pursuant to Rule 14a-12 under the Exchange Act (17 CFR 240.14a-12) |
Pre-commencement communications pursuant to Rule 14d-2(b) under the Exchange Act (17 CFR 240.14d-2(b)) |
Pre-commencement communications pursuant to Rule 13e-4(c) under the Exchange Act (17 CFR 240.13e-4(c)) |
Title of each class |
Trading Symbol(s) |
Name of each exchange on which registered | ||
Title of each class |
Trading Symbol(s) |
Name of each exchange on which registered | ||
Item 2.02 |
Results of Operation and Financial Condition. |
Item 9.01 |
Financial Statements and Exhibits. |
| 99.1 | Business Update Presentation of Welltower Inc. dated May 10, 2022. | |
| 104 | Cover Page Interactive Data File – the cover page XBRL tags are embedded within the Inline XBRL document. | |
| WELLTOWER INC. | ||
| By: | /s/ Matthew McQueen | |
| Name: | Matthew McQueen | |
| Title: | Executive Vice President – General | |
| Counsel & Corporate Secretary | ||
| WELLTOWER OP INC. | ||
| By: | /s/ Matthew McQueen | |
| Name: | Matthew McQueen | |
| Title: | President | |
Exhibit 99.1
Business Update May 10, 2022 Welltower
Forward Looking Statements and Risk Factors This document contains “forward-looking statements” as defined in the Private Securities Litigation Reform Act of 1995. When Welltower uses words such as “may,” “will,” “intend,” “should,” “believe,” “expect,” “anticipate,” “project,” “pro forma,” “estimate” or similar expressions that do not relate solely to historical matters, Welltower is making forward-looking statements. Forward-looking statements, including statements related to Funds From Operations guidance, are not guarantees of future performance and involve risks and uncertainties that may cause Welltower’s actual results to differ materially from Welltower’s expectations discussed in the forward-looking statements. This may be a result of various factors, including, but not limited to: the impact of the COVID-19 pandemic; uncertainty regarding the implementation and impact of the CARES Act and future stimulus or other COVID-19 relief legislation; the status of the economy; the status of capital markets, including availability and cost of capital; issues facing the health care industry, including compliance with, and changes to, regulations and payment policies, responding to government investigations and punitive settlements and operators’/tenants’ difficulty in cost effectively obtaining and maintaining adequate liability and other insurance; changes in financing terms; competition within the health care and seniors housing industries; negative developments in the operating results or financial condition of operators/tenants, including, but not limited to, their ability to pay rent and repay loans; Welltower’s ability to transition or sell properties with profitable results; the failure to make new investments or acquisitions as and when anticipated; natural disasters and other acts of God affecting Welltower’s properties; Welltower’s ability to re-lease space at similar rates as vacancies occur; Welltower’s ability to timely reinvest sale proceeds at similar rates to assets sold; operator/tenant or joint venture partner bankruptcies or insolvencies; the cooperation of joint venture partners; government regulations affecting Medicare and Medicaid reimbursement rates and operational requirements; liability or contract claims by or against operators/tenants; unanticipated difficulties and/or expenditures relating to future investments or acquisitions; environmental laws affecting Welltower’s properties; changes in rules or practices governing Welltower’s financial reporting; the movement of U.S. and foreign currency exchange rates; Welltower’s ability to maintain its qualification as a REIT; key management personnel recruitment and retention; and other risks described in Welltower’s reports filed from time to time with the SEC. Welltower undertakes no obligation to update or revise publicly any forward-looking statements, whether because of new information, future events or otherwise, or to update the reasons why actual results could differ from those projected in any forward-looking statements.
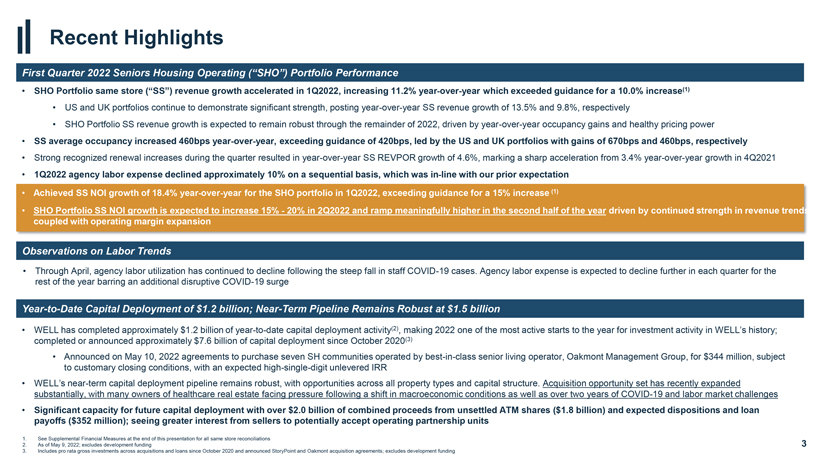
Recent Highlights First Quarter 2022 Seniors Housing Operating (“SHO”) Portfolio Performance • SHO Portfolio same store (“SS”) revenue growth accelerated in 1Q2022, increasing 11.2% year-over-year which exceeded guidance for a 10.0% increase(1) • US and UK portfolios continue to demonstrate significant strength, posting year-over-year SS revenue growth of 13.5% and 9.8%, respectively • SHO Portfolio SS revenue growth is expected to remain robust through the remainder of 2022, driven by year-over-year occupancy gains and healthy pricing power • SS average occupancy increased 460bps year-over-year, exceeding guidance of 420bps, led by the US and UK portfolios with gains of 670bps and 460bps, respectively • Strong recognized renewal increases during the quarter resulted in year-over-year SS REVPOR growth of 4.6%, marking a sharp acceleration from 3.4% year-over-year growth in 4Q2021 • 1Q2022 agency labor expense declined approximately 10% on a sequential basis, which was in-line with our prior expectation • Achieved SS NOI growth of 18.4% year-over-year for the SHO portfolio in 1Q2022, exceeding guidance for a 15% increase (1) • SHO Portfolio SS NOI growth is expected to increase 15%—20% in 2Q2022 and ramp meaningfully higher in the second half of the year driven by continued strength in revenue trends coupled with operating margin expansion Observations on Labor Trends • Through April, agency labor utilization has continued to decline following the steep fall in staff COVID-19 cases. Agency labor expense is expected to decline further in each quarter for the rest of the year barring an additional disruptive COVID-19 surge Year-to-Date Capital Deployment of $1.2 billion; Near-Term Pipeline Remains Robust at $1.5 billion • WELL has completed approximately $1.2 billion of year-to-date capital deployment activity(2), making 2022 one of the most active starts to the year for investment activity in WELL’s history; completed or announced approximately $7.6 billion of capital deployment since October 2020(3) • Announced on May 10, 2022 agreements to purchase seven SH communities operated by best-in-class senior living operator, Oakmont Management Group, for $344 million, subject to customary closing conditions, with an expected high-single-digit unlevered IRR • WELL’s near-term capital deployment pipeline remains robust, with opportunities across all property types and capital structure. Acquisition opportunity set has recently expanded substantially, with many owners of healthcare real estate facing pressure following a shift in macroeconomic conditions as well as over two years of COVID-19 and labor market challenges • Significant capacity for future capital deployment with over $2.0 billion of combined proceeds from unsettled ATM shares ($1.8 billion) and expected dispositions and loan payoffs ($352 million); seeing greater interest from sellers to potentially accept operating partnership units 1. See Supplemental Financial Measures at the end of this presentation for all same store reconciliations 2. As of May 9, 2022; excludes development funding 3 3. Includes pro rata gross investments across acquisitions and loans since October 2020 and announced StoryPoint and Oakmont acquisition agreements; excludes development funding
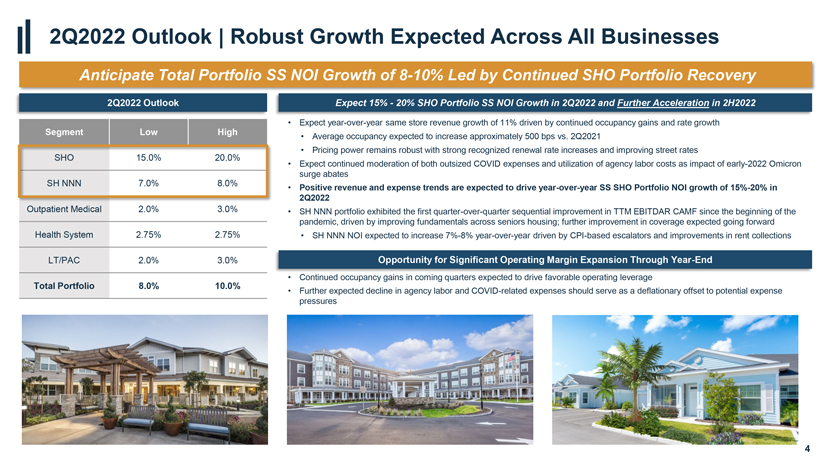
2Q2022 Outlook | Robust Growth Expected Across All Businesses Anticipate Total Portfolio SS NOI Growth of 8-10% Led by Continued SHO Portfolio Recovery 2Q2022 Outlook Segment Low High Outpatient Medical 2.0% 3.0% Health System 2.75% 2.75% LT/PAC 2.0% 3.0% Total Portfolio 8.0% 10.0% Expect 15%—20% SHO Portfolio SS NOI Growth in 2Q2022 and Further Acceleration in 2H2022 • Expect year-over-year same store revenue growth of 11% driven by continued occupancy gains and rate growth • Average occupancy expected to increase approximately 500 bps vs. 2Q2021 • Pricing power remains robust with strong recognized renewal rate increases and improving street rates • Expect continued moderation of both outsized COVID expenses and utilization of agency labor costs as impact of early-2022 Omicron surge abates • Positive revenue and expense trends are expected to drive year-over-year SS SHO Portfolio NOI growth of 15%-20% in 2Q2022 • SH NNN portfolio exhibited the first quarter-over-quarter sequential improvement in TTM EBITDAR CAMF since the beginning of the pandemic, driven by improving fundamentals across seniors housing; further improvement in coverage expected going forward • SH NNN NOI expected to increase 7%-8% year-over-year driven by CPI-based escalators and improvements in rent collections Opportunity for Significant Operating Margin Expansion Through Year-End • Continued occupancy gains in coming quarters expected to drive favorable operating leverage • Further expected decline in agency labor and COVID-related expenses should serve as a deflationary offset to potential expense pressures
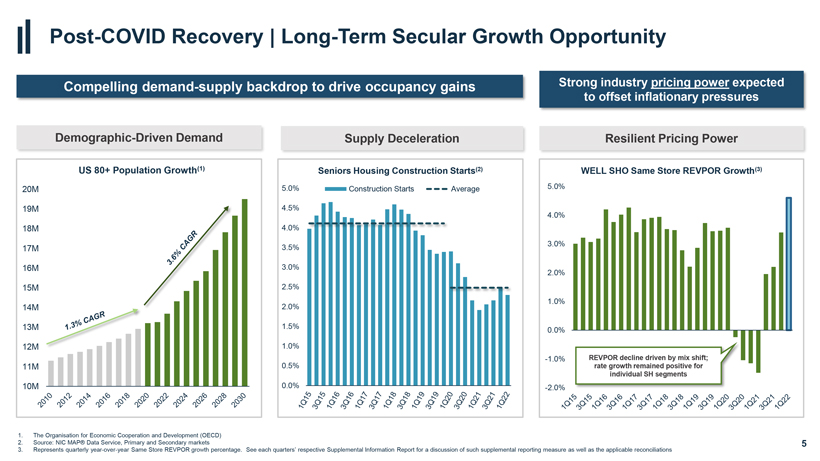
Post-COVID Recovery | Long-Term Secular Growth Opportunity Compelling demand-supply backdrop to drive occupancy gains Strong industry pricing power expected to offset inflationary pressures Demographic-Driven Demand US 80+ Population Growth(1) 20M 19M 18M 17M 16M 15M 14M 13M 12M 11M 10M 1. The Organisation for Economic Cooperation and Development (OECD) 2. Source: NIC MAP® Data Service, Primary and Secondary markets 3. Represents quarterly year-over-year Same Store REVPOR growth percentage. See each quarters’ respective Supplemental Information Report for a discussion of such supplemental reporting measure as well as the applicable reconciliations Supply Deceleration Seniors Housing Construction Starts(2) Construction Starts Average 5.0% 4.5% 4.0% 3.5% 3.0% 2.5% 2.0% 1.5% 1.0% 0.5% 0.0% Resilient Pricing Power WELL SHO Same Store REVPOR Growth(3) 5.0% 4.0% 3.0% 2.0% 1.0% 0.0% -1.0% -2.0%
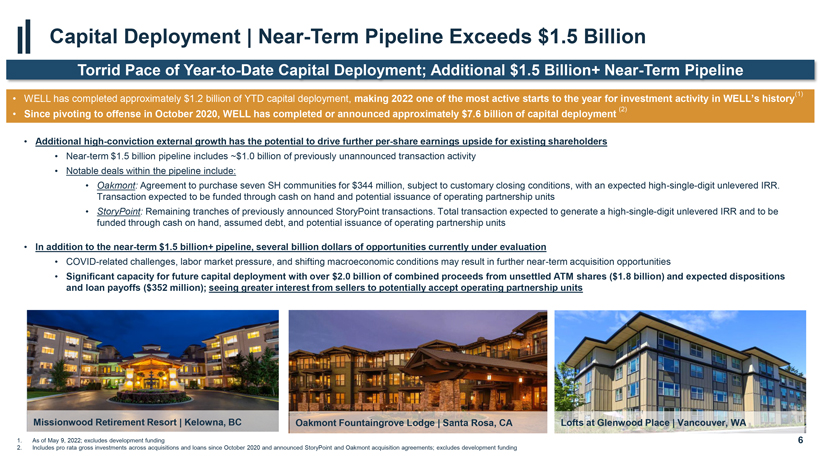
REVPOR decline driven by mix shift; rate growth remained positive for individual SH segments Capital Deployment | Near-Term Pipeline Exceeds $1.5 Billion Torrid Pace of Year-to-Date Capital Deployment; Additional $1.5 Billion+ Near-Term Pipeline (1) • WELL has completed approximately $1.2 billion of YTD capital deployment, making 2022 one of the most active starts to the year for investment activity in WELL’s history (2) • Since pivoting to offense in October 2020, WELL has completed or announced approximately $7.6 billion of capital deployment Additional high-conviction external growth has the potential to drive further per-share earnings upside for existing shareholders • Near-term $1.5 billion pipeline includes ~$1.0 billion of previously unannounced transaction activity • Notable deals within the pipeline include: • Oakmont: Agreement to purchase seven SH communities for $344 million, subject to customary closing conditions, with an expected high-single-digit unlevered IRR. Transaction expected to be funded through cash on hand and potential issuance of operating partnership units • StoryPoint: Remaining tranches of previously announced StoryPoint transactions. Total transaction expected to generate a high-single-digit unlevered IRR and to be funded through cash on hand, assumed debt, and potential issuance of operating partnership units • In addition to the near-term $1.5 billion+ pipeline, several billion dollars of opportunities currently under evaluation • COVID-related challenges, labor market pressure, and shifting macroeconomic conditions may result in further near-term acquisition opportunities • Significant capacity for future capital deployment with over $2.0 billion of combined proceeds from unsettled ATM shares ($1.8 billion) and expected dispositions and loan payoffs ($352 million); seeing greater interest from sellers to potentially accept operating partnership units Missionwood Retirement Resort | Kelowna, BCOakmont Fountaingrove Lodge | Santa Rosa, CA Lofts at Glenwood Place | Vancouver, WA 1. As of May 9, 2022; excludes development funding 2. Includes pro rata gross investments across acquisitions and loans since October 2020 and announced StoryPoint and Oakmont acquisition agreements; excludes development funding Oakmont Capriana | Brea, CA Wingate | Needham, MA Oakmont of Segovia | Palm Desert, CA 7 1. Includes pro rata gross investments across acquisitions and loans since January 1, 2022 through May 9, 2022; excludes development funding
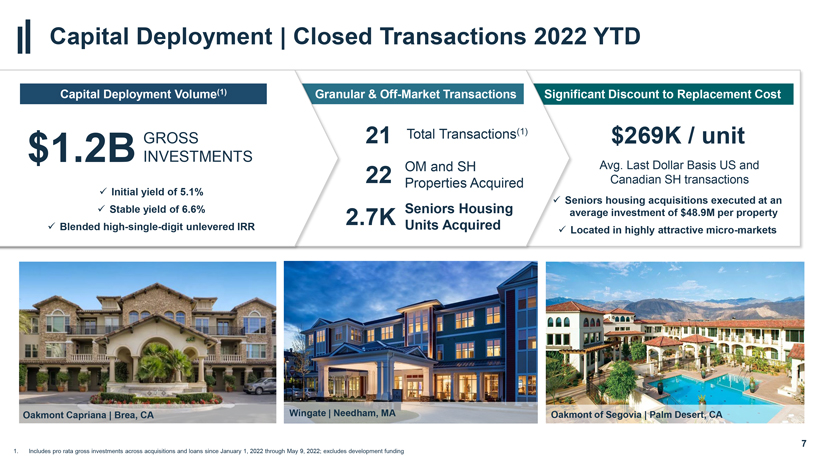
Capital Deployment | Closed Transactions 2022 YTD
Capital Deployment Volume(1)
GROSS
$1.2B INVESTMENTS
? Initial yield of 5.1%
? Stable yield of 6.6%
? Blended high-single-digit unlevered IRR
ular & Off-Market Transactions
21 Total
Transactions(1)
22 OM and SH
Properties Acquired
2.7K Seniors Housing Units Acquired
ficant Discount to Replacement Cost
$269K / unit
Avg. Last Dollar Basis US and Canadian SH transactions
? Seniors housing acquisitions executed at an average investment of $48.9M per property
?
Located in highly attractive micro-markets

Seniors Housing Update
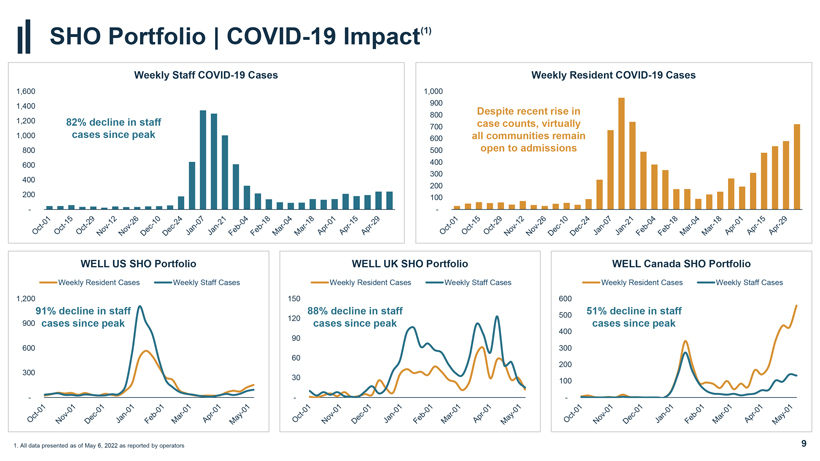
SHO Portfolio | COVID-19 Impact(1)
Weekly Resident COVID-19 Cases
1,000
900
800 Despite recent rise in 700 case counts, virtually 600 all communities remain 500 open
to admissions
400 300 200 100
-
1. All data presented as of May 6, 2022 as reported by operators
Weekly Staff COVID-19 Cases
82% decline in staff cases since peak
1,600 1,400 1,200 1,000 800 600 400 200
WELL US SHO Portfolio
Weekly Resident Cases Weekly Staff Cases
1,200
91% decline in staff 900 cases since peak
600
300
WELL UK SHO Portfolio
Weekly Resident Cases Weekly Staff Cases
88% decline in staff cases since peak
150 120 90 60 30
WELL Canada SHO Portfolio
Weekly Resident Cases Weekly Staff Cases
51% decline in staff cases since peak
600 500 400 300 200 100
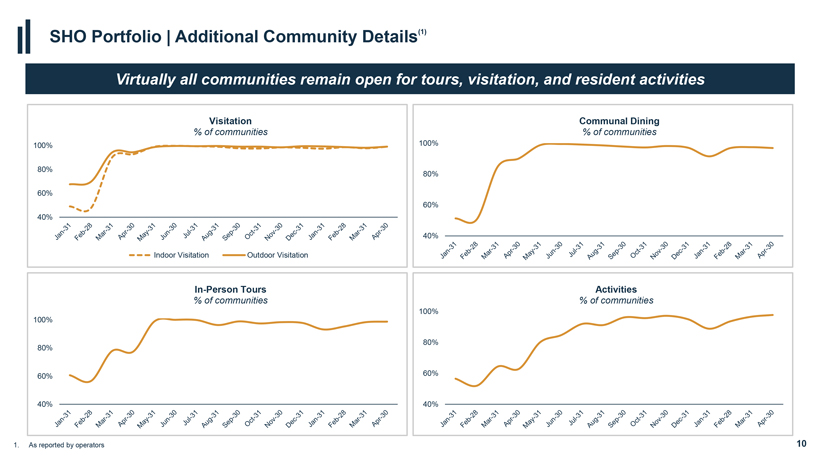
SHO Portfolio | Additional Community Details(1)
Virtually all communities remain open for tours, visitation, and resident activities
Visitation
% of communities
Communal Dining
% of communities
100% 80% 60% 40%
Indoor Visitation Outdoor Visitation
100% 80% 60% 40%
Activities
% of communities
100%
80%
60%
40%
100% 80% 60% 40%
In-Person Tours
% of communities
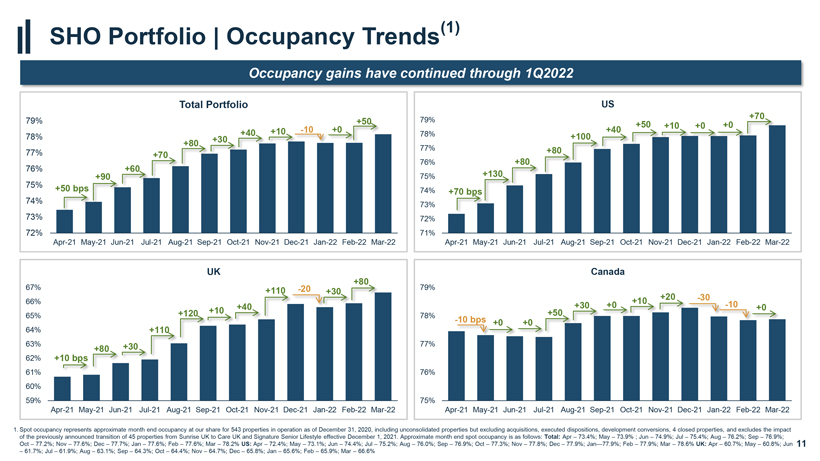
SHO Portfolio | Occupancy
Trends(1)
Occupancy gains have continued through 1Q2022
79%
78%
77% 76% 75% 74% 73% 72%
Apr-21 May-21 Jun-21 Jul-21 Aug-21 Sep-21 Oct-21 Nov-21 Dec-21 Jan-22 Feb-22 Mar-22
Apr-21 May-21 Jun-21 Jul-21 Aug-21 Sep-21 Oct-21 Nov-21 Dec-21 Jan-22 Feb-22 Mar-22
79% 78% 77% 76% 75% 74% 73% 72% 71%
67% 66% 65% 64% 63% 62% 61% 60% 59%
79% 78% 77% 76% 75%
Apr-21 May-21 Jun-21 Jul-21 Aug-21 Sep-21 Oct-21 Nov-21 Dec-21 Jan-22 Feb-22 Mar-22
1. Spot occupancy represents approximate month end occupancy at our share for 543 properties in operation as of
December 31, 2020, including unconsolidated properties but excluding acquisitions, executed dispositions, development conversions, 4 closed properties, and excludes the impact of the previously announced transition of 45 properties from Sunrise
UK to Care UK and Signature Senior Lifestyle effective December 1, 2021. Approximate month end spot occupancy is as follows: Total: Apr – 73.4%; May – 73.9% ; Jun – 74.9%; Jul – 75.4%; Aug – 76.2%; Sep – 76.9%; Oct
– 77.2%; Nov – 77.6%; Dec – 77.7%; Jan – 77.6%; Feb – 77.6%; Mar – 78.2% US: Apr – 72.4%; May – 73.1%; Jun – 74.4%; Jul – 75.2%; Aug – 76.0%; Sep – 76.9%; Oct – 77.3%; Nov –
77.8%; Dec – 77.9%; Jan—77.9%; Feb – 77.9%; Mar – 78.6% UK: Apr – 60.7%; May – 60.8%; Jun
– 61.7%; Jul – 61.9%; Aug –
63.1%; Sep – 64.3%; Oct – 64.4%; Nov – 64.7%; Dec – 65.8%; Jan – 65.6%; Feb – 65.9%; Mar – 66.6%
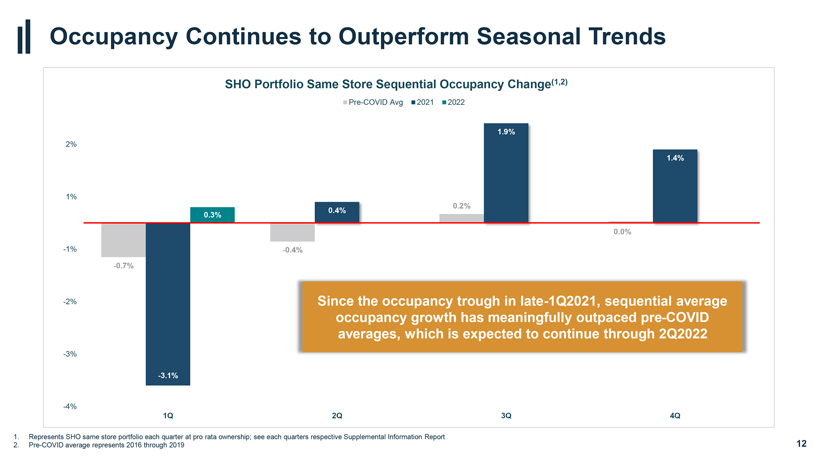
Occupancy Continues to Outperform Seasonal Trends
SHO Portfolio Same Store Sequential Occupancy Change(1,2)
Pre-COVID Avg 2021 2022
Since the
occupancy trough in late-1Q2021, sequential average occupancy growth has meaningfully outpaced pre-COVID averages, which is expected to continue through 2Q2022
1. Represents SHO same store portfolio each quarter at pro rata ownership; see each quarters respective Supplemental Information Report
2. Pre-COVID average represents 2016 through 2019
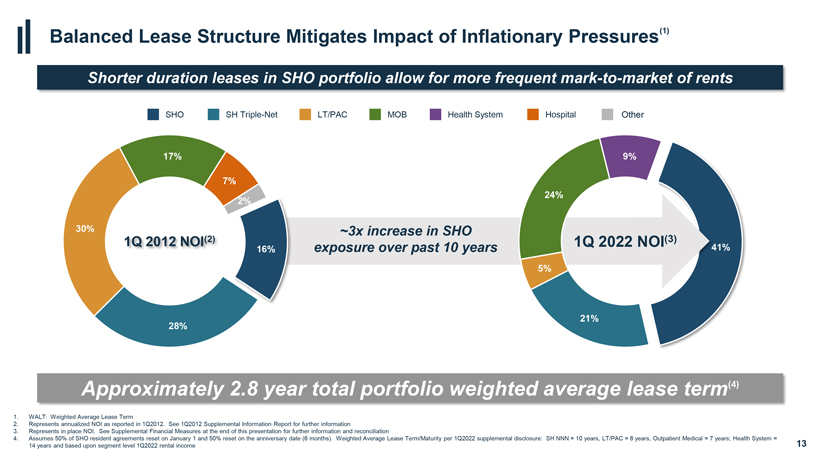
Approximately 2.8 year total portfolio weighted average lease term(4)
1. WALT: Weigh
2. Represents annualized NOI as
reported in 1Q2012. See 10May22 Q2 Supplemental 16:40
Information Report for furthr information
3. Represents in place
NOI. See Supplemental Financial Measures at the end of this presentation for further information and reconciliation
4. Assumes 50% of SHO resident agreements reset
on January 1 and 50% reset on the anniversary date (6 months). Weighted Average Lease Term/Maturity per 1Q2022 supplemental disclosure: SH NNN = 10 years, LT/PAC = 8 years, Outpatient Medical = 7 years; Health System =
14 years and based upon segment level 1Q2022 rental income 13
Balanced Lease Structure Mitigates Impact of Inflationary Pressures(1)
Shorter duration leases in SHO portfolio allow for more frequent mark-to-market of rents
SHO
SH Triple-Net
LT/PAC
MOB
Health System
Hospital
Life Other
1Q 2012 NOI(2)
~3x increase in SHO exposure over past 10 years
1Q 2022 NOI(3)
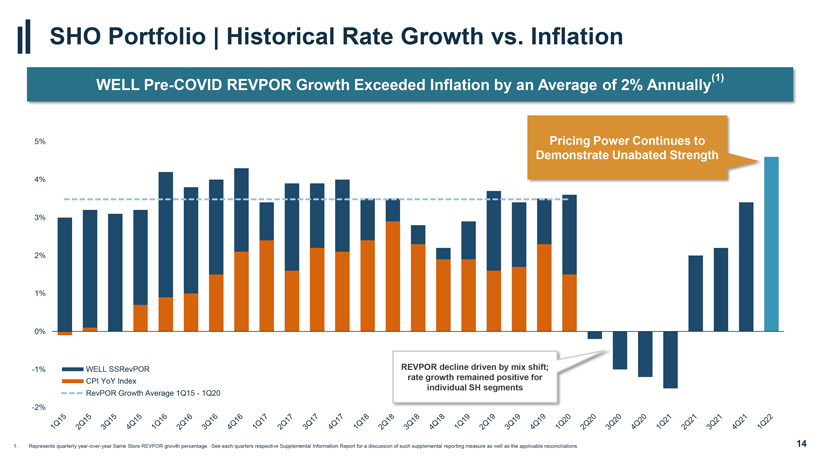
SHO Portfolio | Historical Rate Growth vs. Inflation
(1)
WELL Pre-COVID REVPOR Growth Exceeded Inflation by
an Average of 2% Annually
Pricing Power Continues to Demonstrate Unabated Strength
WELL SSRevPOR CPI YoY Index
RevPOR Growth Average 1Q15—1Q20
REVPOR decline driven by mix shift; rate growth remained positive for individual SH segments
1. Represents quarterly year-over-year Same Store REVPOR growth percentage. See each quarters respective Supplemental Information Report for a discussion of such supplemental reporting measure as well as the applicable reconciliations
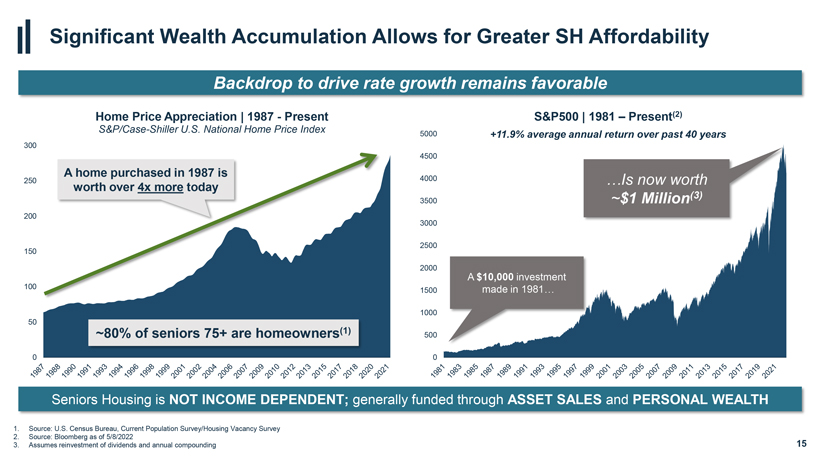
Seniors Housing is NOT INCOME DEPENDENT; generally funded through ASSET SALES and PERSONAL WEALTH
1. Source: U.S. Census Bureau, Current Population Survey/Housing Vacancy Survey
2. Source:
Bloomberg as of 5/8/2022
3. Assumes reinvestment of dividends and annual compounding 15
Significant Wealth Accumulation Allows for Greater SH Affordability
Backdrop to drive rate growth remains favorable
Home Price Appreciation | 1987—Present
S&P/Case-Shiller U.S. National Home Price Index
S&P500 | 1981 –
Present(2)
+11.9% average annual return over past 40 years
…Is now worth
~$1 Million(3)
~80% of seniors 75+ are homeowners(1)

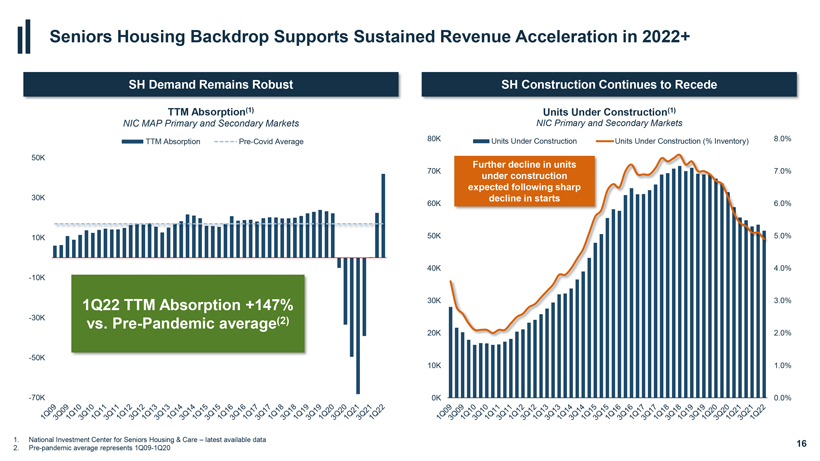
Seniors Housing Backdrop Supports Sustained Revenue Acceleration in 2022+
SH Demand Remains Robust
SH Construction Continues to Recede
TTM Absorption(1)
NIC MAP Primary and Secondary Markets
TTM Absorption Pre-Covid Average
Units Under Construction(1)
NIC Primary and Secondary Markets
Units Under Construction Units Under Construction (%
Inventory)
Further decline in units under construction expected following sharp decline in starts
1Q22 TTM Absorption +147% vs. Pre-Pandemic average(2)
50K 30K 10K -10K -30K -50K -70K
80K 70K 60K 50K 40K 30K 20K 10K
0K
8.0%
7.0%
6.0%
5.0%
4.0%
3.0%
2.0%
1.0%
0.0%
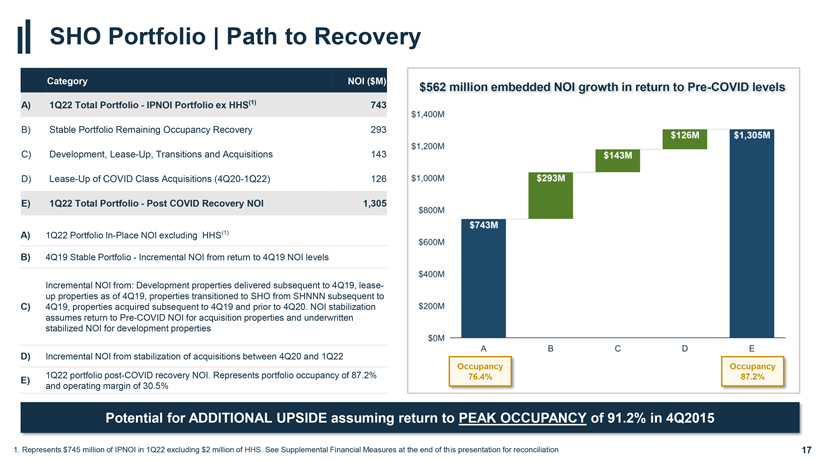
SHO Portfolio | Path to Recovery
Category NOI ($M)
A) 1Q22 Total Portfolio—IPNOI Portfolio ex HHS(1) 743
B) Stable Portfolio Remaining Occupancy Recovery 293 C) Development, Lease-Up, Transitions and Acquisitions 143 D) Lease-Up of COVID Class Acquisitions (4Q20-1Q22) 126
E) 1Q22 Total Portfolio—Post COVID Recovery NOI 1,305
A) 1Q22 Portfolio In-Place NOI excluding HHS(1)
B)
4Q19 Stable Portfolio—Incremental NOI from return to 4Q19 NOI levels
Incremental NOI from: Development properties delivered subsequent to 4Q19, lease-up properties as of 4Q19, properties transitioned to SHO from SHNNN subsequent to C) 4Q19, properties acquired subsequent to 4Q19 and prior to 4Q20. NOI stabilization assumes return to Pre-COVID NOI for acquisition properties and underwritten stabilized NOI for development properties
D) Incremental NOI from
stabilization of acquisitions between 4Q20 and 1Q22
1Q22 portfolio post-COVID recovery NOI. Represents portfolio occupancy of 87.2%
E) and operating margin of 30.5%
$562 million embedded NOI growth in return to Pre-COVID levels
Occupancy
76.4%
Occupancy
87.2%
Potential for ADDITIONAL UPSIDE assuming return to PEAK OCCUPANCY of 91.2% in 4Q2015
-001 Page 17
1. Represents $745 million of IPNOI in 1Q22 excluding $2 million of HHS. See Supplemental Financial Measures at the end of this presentation for reconciliation
Capital Deployment Update

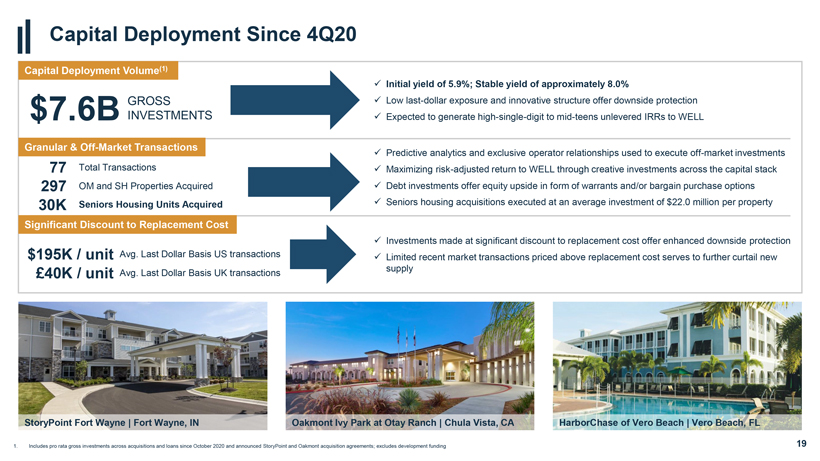
Capital Deployment Since 4Q20
Capital Deployment Volume(1)
? Initial yield of 5.9%; Stable yield of approxima
tely 8.0%
GROSS ? Low last-dollar exposure and innovative structure offer downside protection
$7.6B INVESTMENTS ? Expected to generate high-single-digit to mid-teens unlevered IRRs to WELL
Granular & Off-Market Transactions
?
Predictive analytics and exclusive operator relationships used to execute off-market investments
77 Total Transactions ?
Maximizing risk-adjusted return to WELL through creative investments across the capital stack 297 OM and SH Properties Acquired ? Debt investments offer equity upside in form of warrants and/or bargain purchase options 30K Seniors Housing Units
Acquired ? Seniors housing acquisitions executed at an average investment of $22.0 million per property
Significant Discount to Replacement Cost
? Investments made at significant discount to replacement cost offer enhanced downside protection $195K / unit Avg. Last Dollar Basis US transactions ? Limited recent market
transactions priced above replacement cost serves to further curtail new supply 40K / unit Avg. Last Dollar Basis UK transactions
StoryPoint Fort Wayne | Fort Wayne, IN Oakmont PageIvy 19 Park at Otay Ranch | Chula Vista, CA
1. Includes pro rata gross investments across acquisitions and loans since October 2020 and announced StoryPoint and Oakmont acquisition agreements; excludes
development funding
HarborChase of Vero Beach | Vero Beach, FL
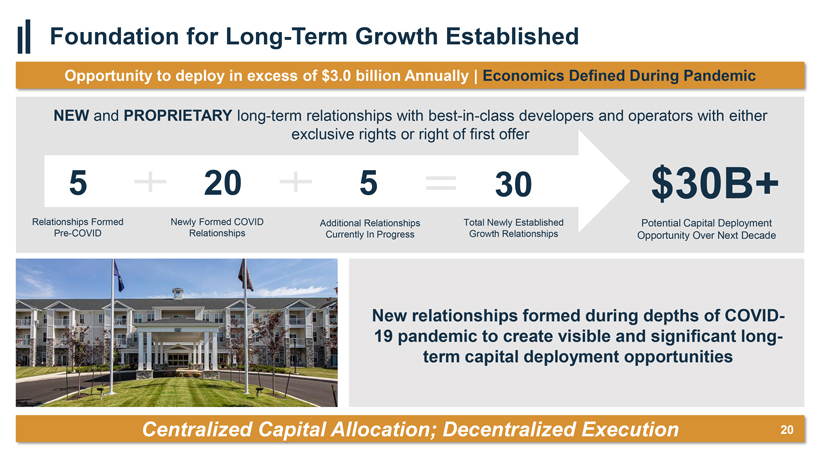
Foundation for Long-Term Growth Established
Opportunity to deploy in excess of $3.0 billion Annually | Economics Defined During Pandemic
NEW and PROPRIETARY long-term relationships with best-in-class developers and operators with either
exclusive rights or right of first offer
New relationships formed during depths of
COVID-19 pandemic to create visible and significant long-term capital deployment opportunities
Capital
Decentralized Execution
Relationships Formed Newly Formed COVID Additional Relationships Total Newly Established Potential Capital Deployment
Pre-COVID Relationships Currently In Progress Growth Relationships Opportunity Over Next Decade

Welltower Overview
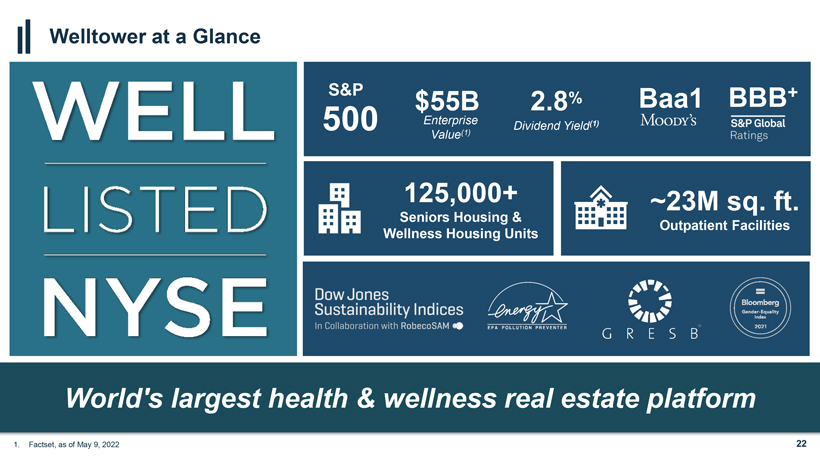
World’s largest health & wellness real estate platform
Welltower at a Glance
Enterprise Value(1)
Dividend Yield(1)
125,000+
Seniors Housing & Wellness Housing Units
~23M sq. ft.
Outpatient Facilities
SHANKH MITRA TIMOTHY G. MCHUGH JOHN F. BURKART
Chief Executive Officer & Chief Financial Officer Chief Operating Officer Chief Investment Officer
MATTHEW G. MCQUEEN AYESHA MENON JOSHUA T. FIEWEGER
General Counsel & Senior Vice
President Chief Accounting Officer
Corporate Secretary Wellness
Housing & Development
Leadership Team
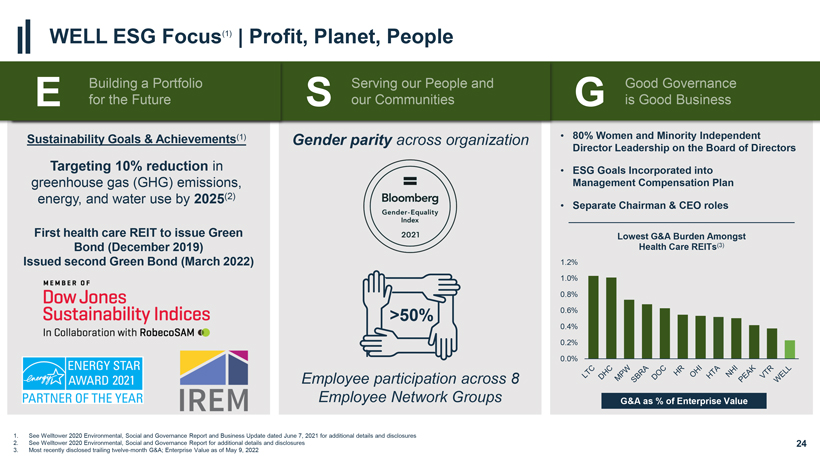
WELL ESG Focus(1) | Profit, Planet, People
Building a Portfolio Serving our People and E for the Future S our Communities
Sustainability
Goals & Achievements(1) Gender parity across organization
Targeting 10% reduction in greenhouse gas (GHG) emissions, energy, and water use by 2025(2)
First health care REIT to issue Green Bond (December 2019) Issued second Green Bond (March 2022)
>50%
Employee participation across 8
Employee Network Groups
Page 24
1. See Welltower 2020 Environmental, Social and Governance Report and Business Update dated June 7, 2021 for additional details and disclosures
2. See Welltower 2020 Environmental, Social and Governance Report for additional details and disclosures
3. Most recently disclosed trailing twelve-month G&A; Enterprise Value as of May 9, 2022
Good Governance
G is Good Business
• 80% Women and Minority Independent Director Leadership on the Board of Directors
•
ESG Goals Incorporated into Management Compensation Plan
• Separate Chairman & CEO roles
Lowest G&A Burden Amongst Health Care REITs(3)
1.2%
1.0%
0.8%
0.6%
0.4%
0.2%
0.0%
G&A as % of Enterprise Value
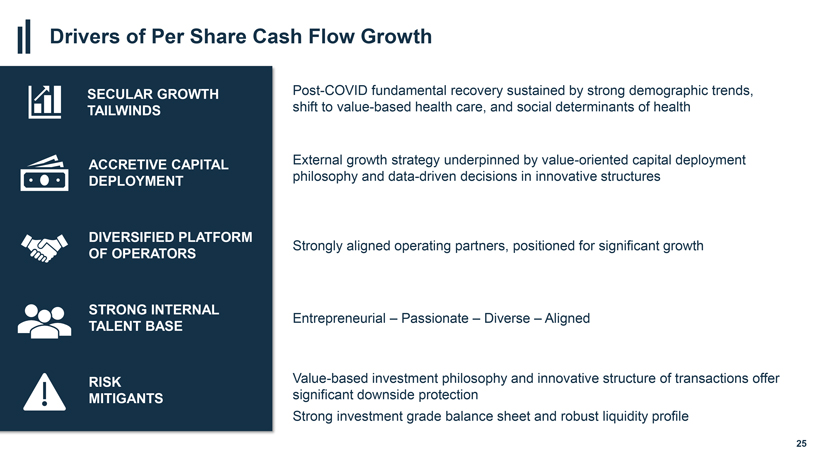
Drivers of Per Share Cash Flow Growth
SECULAR GROWTH Post-COVID fundamental recovery sustained by strong demographic trends, TAILWINDS shift to value-based health care, and social determinants of health
ACCRETIVE CAPITAL External growth strategy underpinned by value-oriented capital deployment DEPLOYMENT philosophy and data-driven decisions in innovative structures
DIVERSIFIED PLATFORM
Strongly aligned operating partners, positioned for significant growth
OF OPERATORS
STRONG INTERNAL
Entrepreneurial – Passionate – Diverse – Aligned
TALENT BASE
RISK Value-based investment philosophy and innovative structure of transactions offer MITIGANTS significant
downside protection Strong investment grade balance sheet and robust liquidity profile

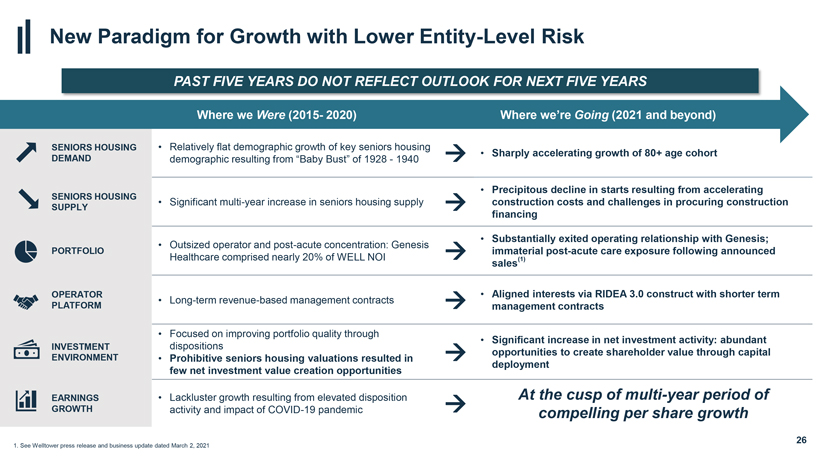
New Paradigm for Growth with Lower Entity-Level Risk
PAST FIVE YEARS DO NOT REFLECT OUTLOOK FOR NEXT FIVE YEARS
Where we Were (2015- 2020) Where
we’re Going (2021 and beyond)
SENIORS HOUSING • Relatively flat demographic growth of key seniors housing
• Sharply accelerating growth
of 80+ age cohort
DEMAND demographic resulting from “Baby Bust” of 1928—1940 ?
• Precipitous
decline in starts re
sulting from accelerating
SENIORS HOUSING
• Significant multi-year increase in seniors housing supply construction costs and challenges in procuring construction
SUPPLY ?
financing
•
ntially exited operating relationship with Genesis;
• Outsized operator and post-acute concentration: Genesis
PORTFOLIO ? immaterial
post-acute care exposure following announced
Healthcare comprised nearly 20% of WELL NOI (1)
sales
OPERATOR • Aligned interests via RIDEA 3.0 construct with shorter term
• Long-term revenue-based management contracts
PLATFORM ? management contracts
• Focused on improving portfolio quality through
• Significant
increase in net inve
stment activity: abundant
INVESTMENT dispositions
opportunities to create s
hareholder value through capital
ENVIRONMENT • Prohibitive seniors housing valuations resulted in ?
deployment
few net investment value creation opportunities
EARNINGS • Lackluster growth resulting
from elevated disposition At the cusp of multi-year period of
GROWTH activity and impact of COVID-19 pandemic ? compelling
per share growth
26
1. See Welltower press release and business update dated
March 2, 2021
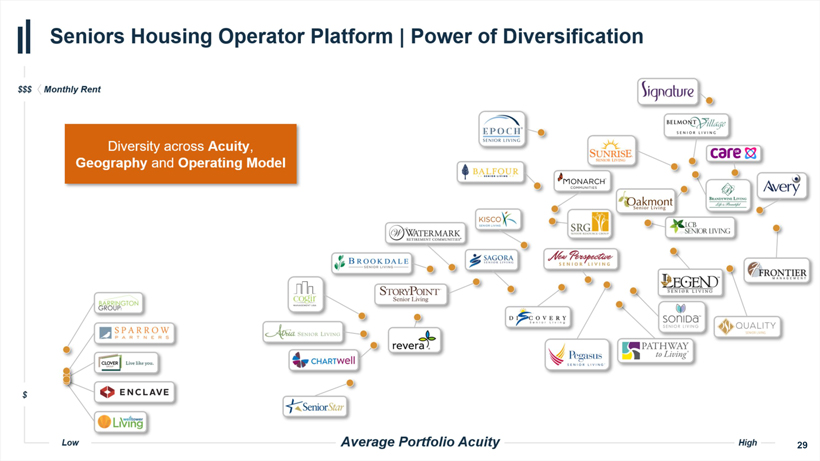
Seniors Housing
Seniors Housing Operator Platform | Power of Diversification
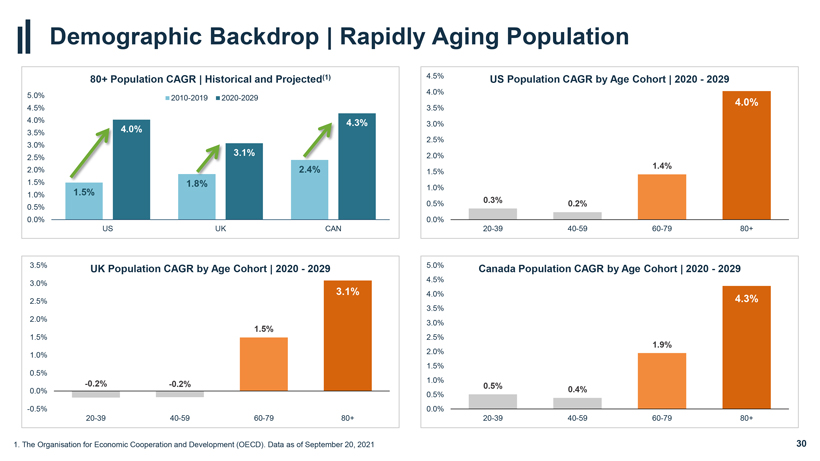
Demographic Backdrop | Rapidly Aging Population
1. The Organisation for Economic Cooperation and Development (OECD). Data as of September 20, 2021
80+ Population CAGR | Historical and Projected(1)
2010-2019 2020-2029
5.0%
4.5%
4.0%
3.5%
3.0%
2.5%
2.0%
1.5%
1.0%
0.5%
0.0%
UK Population CAGR by Age Cohort | 2020—2029
3.5%
3.0%
2.5%
2.0%
1.5%
1.0%
0.5%
0.0% -0.5%
-0.2%
-0.2%
1.
3.1%
US Population CAGR by Age Cohort | 2020—2029
0.3%
0.2%
1.4%
Canada Population CAGR by Age Cohort | 2020—2029
5.0%
4.5%
4.0%
3.5%
3.0%
2.5%
2.0%
1.5%
1.0%
0.5%
0.0%
0.5%
0.4%
1.9%
4.3%
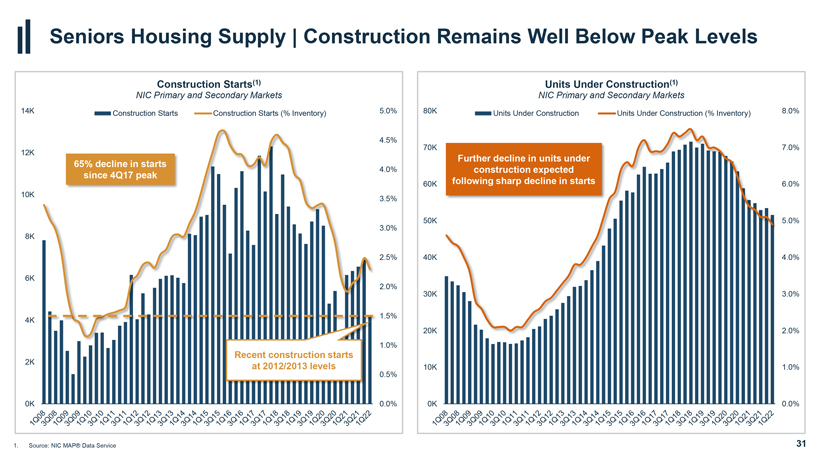
Seniors Housing Supply | Construction Remains Well Below Peak Levels
Construction Starts(1)
NIC Primary and Secondary Markets
Construction Starts Construction Starts (% Inventory)
65% decline in starts since 4Q17 peak
Recent construction starts at 2012/2013 levels
14K 12K 10K
8K 6K 4K 2K 0K
Units Under Construction(1)
NIC Primary and Secondary Markets
Units Under Construction Units Under Construction (%
Inventory)
Further decline in units under construction expected following sharp decline in starts
80K 70K 60K 50K 40K 30K 20K 10K
0K

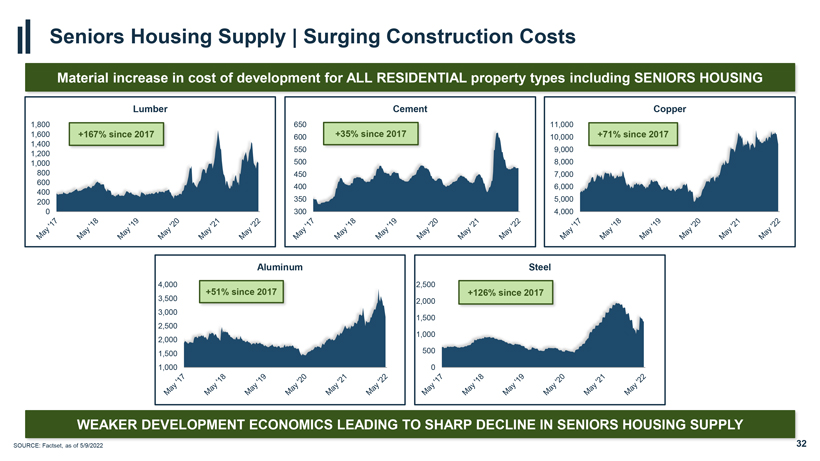
Seniors Housing Supply | Surging Construction Costs
Material increase in cost of development for ALL RESIDENTIAL property types including SENIORS HOUSING
1,800 1,600 1,400 1,200 1,000 800 600 400 200 0
+167% since 2017
Lumber
Cement
+35% since 2017
Copper
+71% since 2017
11,000 10,000 9,000 8,000 7,000 6,000 5,000 4,000
Aluminum
+51% since 2017
4,000 3,500 3,000 2,500 2,000 1,500 1,000
+126% since 2017
Steel
320796 WEAKER
-001 DEVELOPMENT 10May22 16:40 ECONOMICS PageLEADING 32
TO SHARP DECLINE IN SENIORS HOUSING SUPPLY
33
Balance Sheet Update
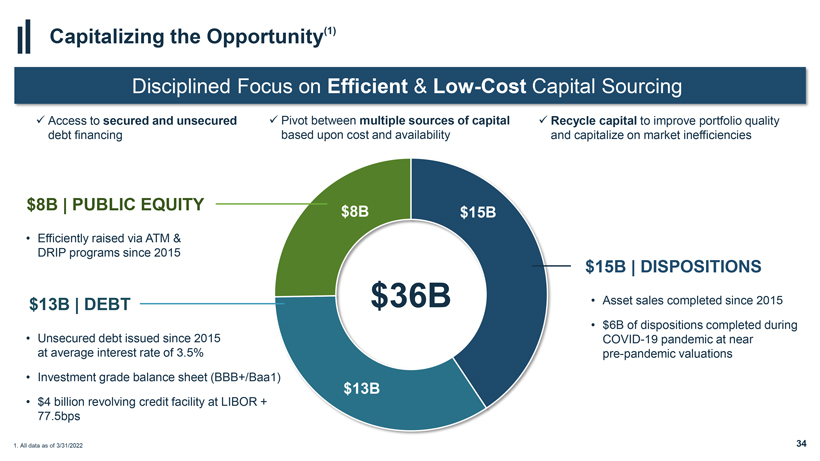
Capitalizing the Opportunity(1)
Disciplined Focus on Efficient & Low-Cost Capital Sourcing
? Access to secured and unsecured ? Pivot between multiple sources of capital ? Recycle capital to
improve portfolio quality debt financing based upon cost and availability and capitalize on market inefficiencies
$8B | PUBLIC EQUITY
$8B
• Efficiently raised via ATM &
DRIP programs since 2015
$15B | DISPOSITIONS
• Asset sales completed since 2015
• $6B of dispositions completed during COVID-19 pandemic at near pre-pandemic valuations
1. All data as of 3/31/2022
34
$13B | DEBT
• Unsecured debt issued since 2015 at average interest rate of 3.5%
• Investment
grade balance sheet (BBB+/Baa1)
• $4 billion revolving credit facility at LIBOR +
77.5bps
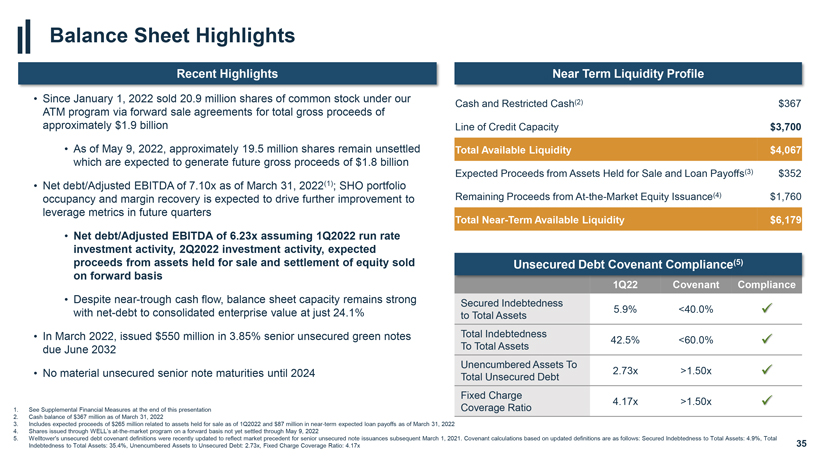
Balance Sheet Highlights
Recent Highlights
• Since January 1, 2022 sold 20.9 million
shares of common stock under our ATM program via forward sale agreements for total gross proceeds of approximately $1.9 billion
• As of May 9, 2022,
approximately 19.5 million shares remain unsettled which are expected to generate future gross proceeds of $1.8 billion
• Net debt/Adjusted EBITDA
of 7.10x as of March 31, 2022(1); SHO portfolio occupancy and margin recovery is expected to drive further improvement to leverage metrics in future quarters
• Net debt/Adjusted EBITDA of 6.23x assuming 1Q2022 run rate investment activity, 2Q2022 investment activity, expected proceeds from assets held for sale and
settlement of equity sold on forward basis
• Despite near-trough cash flow, balance sheet capacity remains strong with
net-debt to consolidated enterprise value at just 24.1%
• In March 2022, issued $550 million in 3.85% senior
unsecured green notes due June 2032
• No material unsecured senior note maturities until 2024
Near Term Liquidity Profile
Cash and Restricted Cash(2) $367 Line of Credit Capacity $3,700
Total Available Liquidity $4,067
Expected Proceeds from Assets Held for Sale and Loan Payoffs(3) $352
Remaining Proceeds from At-the-Market Equity Issuance(4) $1,760
Total Near-Term Available Liquidity $6,179
Unsecured Debt Covenant Compliance(5)
1Q22 Covenant Compliance
Secured Indebtedness
5.9% <40.0% ? to Total Assets Total Indebtedness
42.5% <60.0% ? To Total Assets
Unencumbered Assets To
2.73x >1.50x ? Total Unsecured Debt Fixed Charge
4.17x >1.50x ? Coverage Ratio
4.17x >1.50x ?
1. See Supplemental Financial Measures at the end of this presentation Coverage Ratio
2. Cash
balance of $367 million as of March 31, 2022
3. Includes expected 320796 proceeds - 001 of
$265 million related to assets 10May22 held for sale as 16:40 of Q2
22 and $87 million inPage n r-term expected 35 loan payoffs as of March 31, 2022
4. Shares issued through WELL’s at-the-market program on a forward basis not yet settled
through May 9, 2022
5. Welltower’s unsecured debt covenant definitions were recently updated to reflect market precedent for senior unsecured note
issuances subsequent March 1, 2021. Covenant calculations based on updated definitions are as follows: Secured Indebtedness to Total Assets: 4.9%, Total Indebtedness to Total Assets: 35.4%, Unencumbered Assets to Unsecured Debt: 2.73x, Fixed
Charge Coverage Ratio: 4.17x
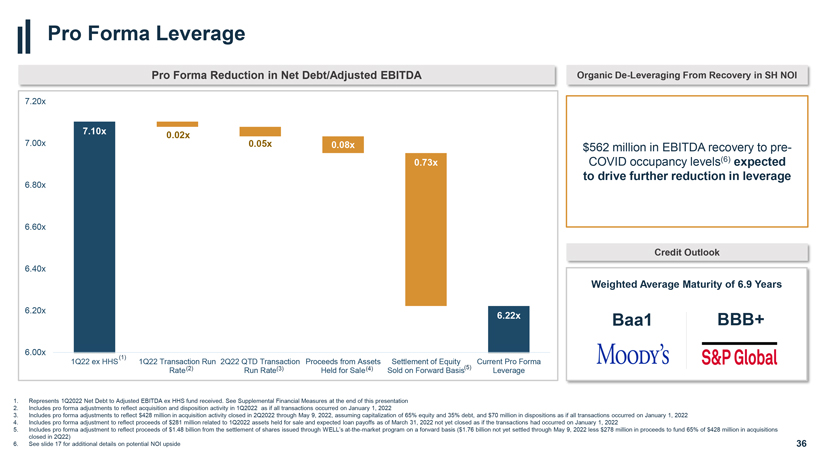
Pro Forma Leverage
Pro
Forma Reduction in Net Debt/Adjusted EBITDA
1Q22 ex HHS
1Q22 Transaction Run
2Q22 QTD Transaction
Proceeds from Assets
Settlement of Equity
Current Pro Forma
Rate(2)
Run Rate(3)
Held for Sale(4)
Sold on Forward Basis(5)
Leverage
1. Represents 1Q2022 Net Debt to Adjusted EBITDA ex HHS fund received. See
Supplemental Financial Measures at the end of this presentation
2. Includes pro forma adjustments to reflect acquisition and disposition activity in 1Q2022 as if
all transactions occurred on January 1, 2022
3. Includes pro forma adjustments to reflect $428 million in acquisition activity closed in 2Q2022 through
May 9, 2022, assuming capitalization of 65% equity and 35% debt, and $70 million in dispositions as if all transactions occurred on January 1, 2022
4. Includes proforma adjustment to reflect proceeds of
$28 million related to Q2 22 assets held for sale and loan payoffs as of March 31, 2022 not yet closed as if the transactions had occurred on
January 1, 2022
5. Includes pro forma adjustment to reflect proceeds of $1.48 billion from the settlement of shares issued through WELL’s at-the-market program on a forward basis ($1.76 billion not yet settled through May 9, 2022 less $278 million in proceeds to fund 65% of $428 million in
acquisitions
Weighted Average Maturity of 6.9 Years
Baa1 BBB+
closed in 2Q22)
6. See slide 17 for additional details on potential NOI upside
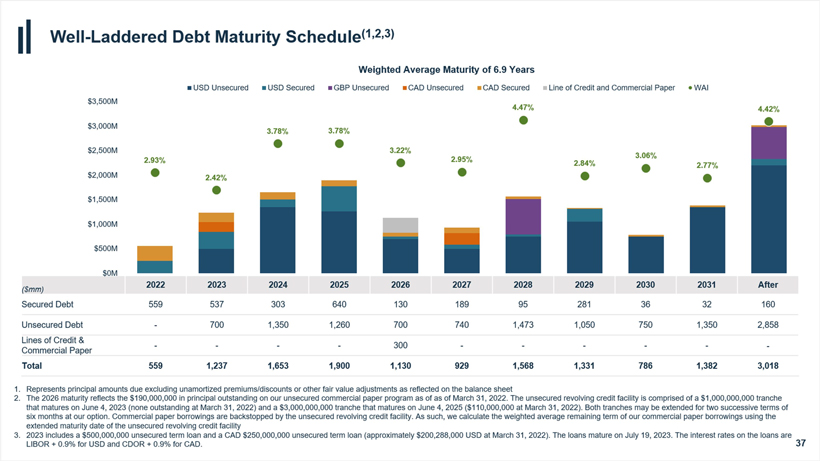
1. Represents principal amounts
due excluding unamortized premiums/discounts or other fair value adjustments as reflected on the balance sheet
2. The 2026 maturity reflects the $190,000,000 in
principal outstanding on our unsecured commercial paper program as of as of March 31, 2022. The unsecured revolving credit facility is comprised of a $1,000,000,000 tranche
that matures on June 4, 2023 (none outstanding at March 31, 2022) and a $3,000,000,000 tranche that matures on June 4, 2025 ($110,000,000 at March 31, 2022).
Both tranches may be extended for two successive terms of
six months at our option. Commercial paper borrowings are backstopped by the unsecured revolving credit
facility. As such, we calculate the weighted average remaining term of our commercial paper borrowings using the
extended maturity date of the unsecured revolving
credit facility
3. 2023 includes a $500,000,000 unsecured term loan and a CAD $250,000,000 unsecured term loan (approximately $200,288,000 USD at March 31,
2022). The loans mature on July 19, 2023. The interest rates on the loans are
LIBOR + 0.9% for USD and CDOR + 0.9% for CAD.
38

Supplemental Financial Measures
Non-GAAP Financial Measures
We believe that revenues, net income and net income attributable to common stockholders (“NICS”), as defined by U.S. generally accepted accounting principles (“U.S.
GAAP”), are the most appropriate earnings measurements. However, we consider Net Operating Income (“NOI”), In-Place NOI (“IPNOI”), Same Store NOI (“SSNOI”), REVPOR and Same
Store REVPOR (“SS REVPOR”), EBITDA and Adjusted EBITDA to be useful supplemental measures of our operating performance. Excluding EBITDA and Adjusted EBITDA these supplemental measures are disclosed on our pro rata ownership basis.
Pro rata amounts are derived by reducing consolidated amounts for minority partners’ noncontrolling ownership interests and adding our minority ownership
share of unconsolidated amounts. We do not control unconsolidated investments. While we consider pro rata disclosures useful, they may not accurately depict the legal and economic implications of our joint venture arrangements and should be used
with caution.
Our supplemental reporting measures and similarly entitled financial measures are widely used by investors, equity and debt analysts and rating
agencies in the valuation, comparison, rating and investment recommendations of companies. Our management uses these financial measures to facilitate internal and external comparisons to historical operating results and in making operating
decisions. Additionally, these measures are utilized by the Board of Directors to evaluate management.
None of the supplemental reporting measures represent net
income or cash flow provided from operating activities as determined in accordance with U.S. GAAP and should not be considered as alternative measures of profitability or liquidity. Finally, the supplemental reporting measures, as defined by us, may
not be comparable to similarly entitled items reported by other real estate investment trusts or other companies. Multi-period amounts may not equal the sum of the individual quarterly amounts due to rounding.
39
NOI, IPNOI, SSNOI, REVPOR & SS REVPOR
We define NOI as total revenues, including tenant reimbursements, less property operating expenses. Property operating expenses represent costs associated with managing,
maintaining and servicing tenants for our properties. These expenses include, but are not limited to, property-related payroll and benefits, property management fees paid to operators, marketing, housekeeping, food service, maintenance, utilities,
property taxes and insurance. General and administrative expenses represent costs unrelated to property operations and transaction costs. These expenses include, but are not limited to, payroll and benefits, professional services, office expenses
and depreciation of corporate fixed assets.
IPNOI represents NOI excluding interest income, other income and non-IPNOI and
adjusted for timing of current quarter portfolio changes such as acquisitions, development conversions, segment transitions, dispositions and investments held for sale.
SSNOI is used to evaluate the operating performance of our properties using a consistent
population which controls for changes in the composition of our portfolio. As used herein, same store is generally defined as those revenue-generating properties
in the portfolio for the relevant year-over-year reporting periods. Land parcels, loans and sub-leases as well as any properties acquired, developed/redeveloped (including major refurbishments where 20% or
more of units are simultaneously taken out of commission for 30 days or more), sold or classified as held for sale during that period are excluded from the same store amounts. Properties undergoing operator and/or segment transitions (except Seniors
Housing Triple-net to Seniors Housing Operating with the same operator) are also excluded from same store amounts. Normalizers include adjustments that in management’s opinion are appropriate in
considering SSNOI, a supplemental, non-GAAP performance measure. None of these adjustments, which may increase or decrease SSNOI, are reflected in our financial statements prepared in accordance with U.S.
GAAP. Significant normalizers (defined as any that individually exceed 0.50% of SSNOI growth per property type) are separately disclosed and explained in the relevant supplemental reporting package. No reconciliation of the forecasted range for
SSNOI on a combined basis or by property type is included in this release because we are unable to quantify certain amounts that would be required to be included in the comparable GAAP financial measure without unreasonable efforts, as we believe
such reconciliation would imply a degree of precision that could be confusing or misleading to investors.
No reconciliation of the forecasted range for SSNOI on a
combined basis or by property type is included in this release because we are unable to quantify certain amounts that would be required to be included in the comparable GAAP financial measure without unreasonable efforts, and we believe such
reconciliation would
imply a degree of precision that could be confusing or misleading to investors.
REVPOR represents the average revenues generated per occupied room per month at our seniors housing operating properties. It is calculated as our pro rata version of total resident
fees and services revenues from the income statement divided by average monthly occupied room days. SS REVPOR is used to evaluate the REVPOR performance of our properties under a consistent population which eliminates changes in the composition of
our portfolio. It is based on the same pool of properties used for SSNOI and includes any revenue normalizations used for SSNOI. We use REVPOR and SS REVPOR to evaluate the revenue-generating capacity and profit potential of its seniors housing
operating portfolio independent of fluctuating occupancy rates. They are also used in comparison against industry and competitor statistics, if known, to evaluate the quality of our seniors housing operating portfolio.
We believe NOI, IPNOI, SSNOI, REVPOR and SS REVPOR provide investors relevant and useful information because they measure the operating performance of our properties at the
property level on an unleveraged basis. We use these metrics to make decisions about resource allocations and to assess the property level performance of our properties.
40
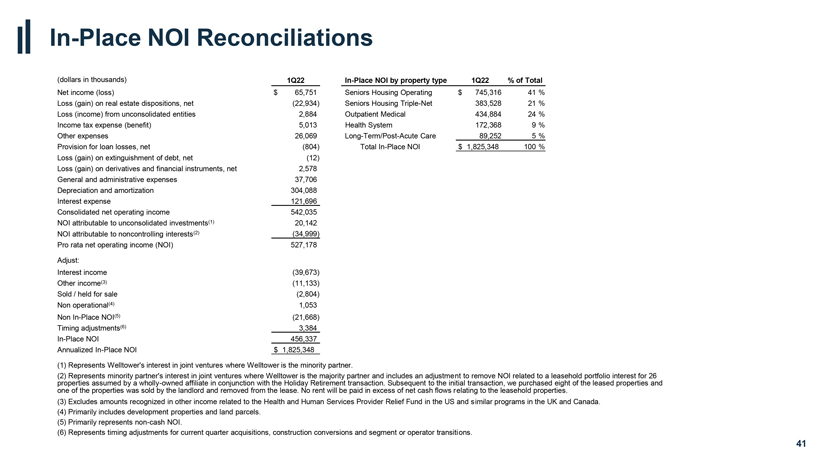
In-Place NOI Reconciliations
(1) Represents Welltower’s interest in joint ventures where Welltower is the minority partner.
(2) Represents minority partner’s interest in joint ventures where Welltower is the majority partner and includes an adjustment to remove NOI related to a leasehold portfolio
interest for 26
properties assumed by a wholly-owned affiliate in conjunction with the Holiday Retirement transaction. Subsequent to the initial transaction, we
purchased eight of the leased properties and one of the properties was sold by the landlord and removed from the lease. No rent will be paid in excess of net cash flows relating to the leasehold properties.
(3) Excludes amounts recognized in other income related to the Health and Human Services Provider Relief Fund in the US and similar programs in the UK and Canada.
(4) Primarily includes development properties and land parcels.
(5) Primarily represents non-cash NOI
(6) Represents timing adjustments for current quarter acquisitions, construction conversions and segment or operator transitions.
41
(dollars in thousands)
Net income (loss)
Loss (gain) on real estate dispositions, net
Loss (income) from unconsolidated entities
Income tax expense (benefit)
Other expenses
Provision for loan losses, net
Loss (gain) on extinguishment of debt, net
Loss (gain) on derivatives and financial
instruments, net
General and administrative expenses
Depreciation and
amortization
Interest expense
Consolidated net operating income
NOI attributable to unconsolidated investments(1)
NOI attributable to noncontrolling
interests(2)
Pro rata net operating income (NOI)
Adjust:
Interest income
Other income(3)
Sold / held for sale
Non operational(4)
Non In-Place NOI(5)
Timing adjustments(6)
In-Place NOI
Annualized
In-Place NOI
In-Place NOI by property type
Seniors Housing Operating $ Seniors Housing Triple-Net Outpatient Medical Health System Long-Term/Post-Acute Care Total In-Place NOI $
1Q22 $ 65,751 (22,934) 2,884 5,013 26,069 (804) (12) 2,578 37,706 304,088 121,696 542,035 20,142 (34,999) 527,178
(39,673) (11,133) (2,804) 1,053 (21,668) 3,384 456,337 $ 1,825,348
1Q22 % of Total
745,316 41 % 383,528 21 % 434,884 24 %
172,368 9 % 89,252 5 % 1,825,348 100 %
1. Represents Welltower’s interests in joint ventures where Welltower is the minority partner.
2. Represents minority partners’ interests in joint ventures where Welltower is the majority partner and includes an adjustment to remove NOI related to
certain leasehold properties.
3. Represents SHO revenues at Welltower pro rata ownership.
4. Includes where appropriate adjustments to reflect consistent property ownership percentages, to translate Canadian properties at a USD/CAD rate of 1.2684 and to translate UK
properties at a GBP/USD rate of 1.38.
5. Represents SS SHO revenues at Welltower pro rata ownership.
6. Represents average occupied units for SS properties on a pro
rata basis.
7. Represents pro rata SS average revenues generated
per occupied room per month.
42
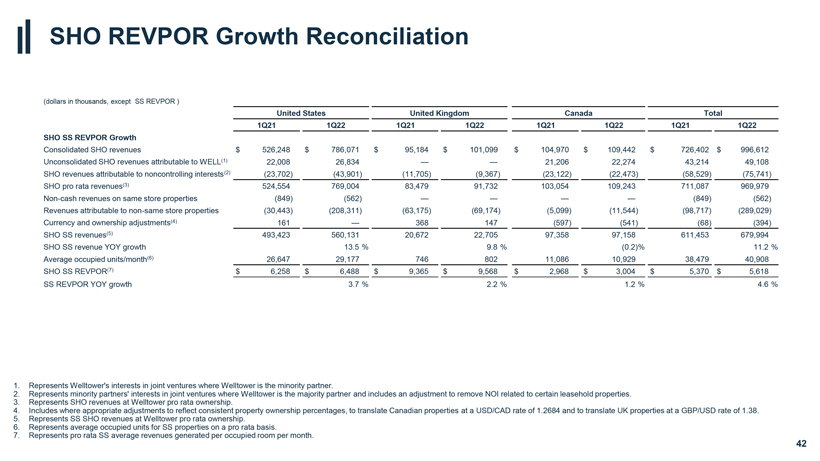
SHO REVPOR Growth Reconciliation
(dollars in thousands, except SS REVPOR )
SHO SS REVPOR Growth
Consolidated SHO revenues
Unconsolidated SHO revenues attributable to WELL(1) SHO revenues
attributable to noncontrolling interests(2) SHO pro rata revenues(3) Non-cash revenues on same store properties Revenues attributable to non-same store properties
Currency and ownership adjustments(4) SHO SS revenues(5) SHO SS revenue YOY growth Average occupied units/month(6) SHO SS REVPOR(7) SS REVPOR YOY growth
United
States United Kingdom Canada Total
1Q21 1Q22 1Q21 1Q22 1Q21 1Q22 1Q21 1Q22
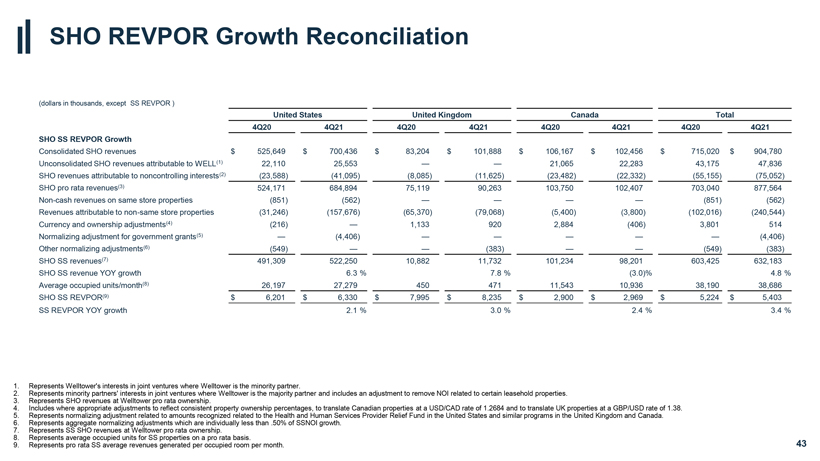
SHO REVPOR Growth Reconciliation
1. Represents Welltower’s interests in joint ventures where Welltower is the minority partner.
2. Represents minority partners’ interests in joint ventures where Welltower is the majority partner and includes an adjustment to remove NOI related to certain leasehold
properties.
3. Represents SHO revenues at Welltower pro rata ownership.
4.
Includes where appropriate adjustments to reflect consistent property ownership percentages, to translate Canadian properties at a USD/CAD rate of 1.2684 and to translate UK properties at a GBP/USD rate of 1.38.
5. Represents normalizing adjustment related to amounts recognized related to the Health and Human Services Provider Relief Fund in the United States and similar programs in the
United Kingdom and Canada.
6. Represents aggregate normalizing adjustments which are individually less than .50% of SSNOI growth
7. Represents SS SHO revenues at Welltower pro rata ownership.
8. Represents average occupied
units for SS properties on a pro rata basis.
9. Represents pro rata SS average revenues generated per occupied room per month. 43
(dollars in thousands, except SS REVPOR )
SHO SS REVPOR Growth
Consolidated SHO revenues
Unconsolidated SHO revenues attributable to WELL(1) SHO revenues
attributable to noncontrolling interests(2) SHO pro rata revenues(3) Non-cash revenues on same store properties Revenues attributable to non-same store properties
Currency and ownership adjustments(4) Normalizing adjustment for government grants(5) Other normalizing adjustments(6) SHO SS revenues(7) SHO SS revenue YOY growth Average occupied units/month(8) SHO SS REVPOR(9) SS REVPOR YOY growth
United States United Kingdom Canada Total
4Q20 4Q21 4Q20 4Q21 4Q20 4Q21 4Q20 4Q21
$ 525,649 $ 700,436 $ 83,204 $ 101,888 $ 106,167 $ 102,456 $ 715,020 $ 904,780 22,110 25,553 — — 21,065 22,283 43,175 47,836 (23,588) (41,095) (8,085) (11,625) (23,482)
(22,332) (55,155) (75,052) 524,171 684,894 75,119 90,263 103,750 102,407 703,040 877,564 (851) (562) — — — — (851) (562) (31,246) (157,676) (65,370) (79,068) (5,400) (3,800) (102,016) (240,544) (216) — 1,133 920 2,884 (406)
3,801 514
— (4,406) — — — — — (4,406) (549) — — (383) — — (549) (383) 491,309 522,250 10,882 11,732 101,234
98,201 603,425 632,183
6.3 % 7.8 % (3.0)% 4.8 % 26,197 27,279 450 471 11,543 10,936 38,190 38,686 $ 6,201 $ 6,330 $ 7,995 $ 8,235 $ 2,900 $ 2,969 $
5,224 $ 5,403
2.1 % 3.0 % 2.4 % 3.4 %
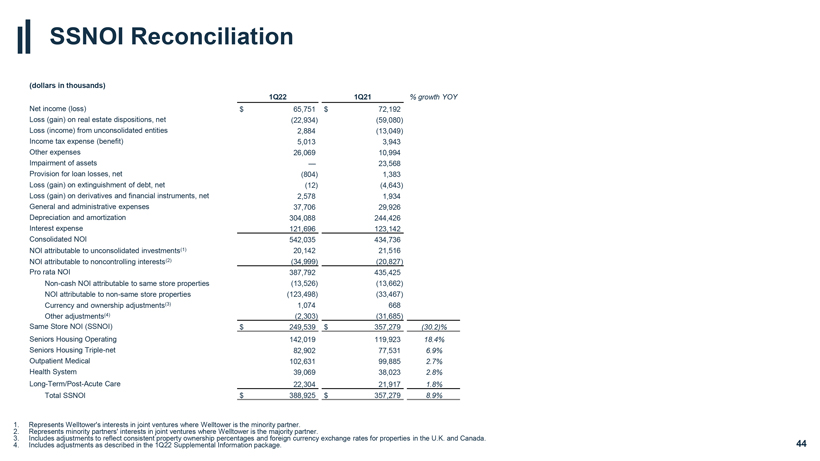
SSNOI Reconciliation
(dollars in thousands)
Net income (loss)
Loss (gain) on real estate dispositions, net Loss (income) from unconsolidated entities Income tax expense (benefit) Other expenses Impairment of assets Provision for loan losses,
net Loss (gain) on extinguishment of debt, net
Loss (gain) on derivatives and financial instruments, net General and administrative expenses Depreciation and
amortization Interest expense Consolidated NOI
NOI attributable to unconsolidated investments(1) NOI attributable to noncontrolling interests(2) Pro rata NOI
Non-cash NOI attributable to same store properties NOI attributable to non-same
store properties Currency and ownership adjustments(3) Other adjustments(4) Same Store NOI (SSNOI) Seniors Housing Operating Seniors Housing
Triple-net Outpatient Medical Health System Long-Term/Post-Acute Care Total SSNOI
1Q22 $ 65,751 (22,934) 2,884 5,013 26,069
—
(804) (12) 2,578 37,706 304,088 121,696 542,035 20,142 (34,999)
387,792 (13,526) (123,498) 1,074 (2,303) $ 249,539 142,019 82,902 102,631 39,069 22,304 $ 388,925
1Q21 % growth YOY $ 72,192 (59,080) (13,049) 3,943 10,994
23,568 1,383 (4,643) 1,934 29,926 244,426 123,142 434,736 21,516 (20,827) 435,425 (13,662) (33,467) 668 (31,685) $ 357,279 (30.2)% 119,923 18.4% 77,531 6.9% 99,885 2.7% 38,023 2.8% 21,917 1.8% $ 357,279 8.9%
EBITDA and Adjusted EBITDA
We measure our credit strength both in terms of leverage ratios and coverage ratios. The leverage ratios indicate how much of our balance sheet capitalization is
related to long-term debt, net of cash and cash equivalents and restricted cash. We expect to maintain capitalization ratios and coverage ratios sufficient to maintain a capital structure consistent with our current profile. The ratios are based on
EBITDA and Adjusted EBITDA. EBITDA is defined as earnings (net income per income statement) before interest expense, income taxes, depreciation and amortization. Adjusted EBITDA is defined as EBITDA excluding unconsolidated entities and including
adjustments for stock-based compensation expense, provision for loan losses, gains/losses on extinguishment of debt, gains/losses/impairments on properties, gains/losses on derivatives and financial instruments, other expenses, additional other
income and other impairment charges. We believe that EBITDA and Adjusted EBITDA, along with net income, are important supplemental measures because they provide additional information to assess and evaluate the performance of our operations. Our
leverage ratios include net debt to Adjusted EBITDA. Net debt is defined as total long-term debt, excluding operating lease liabilities, less cash and cash equivalents and restricted cash.
45
Net Debt to Adjusted EBITDA
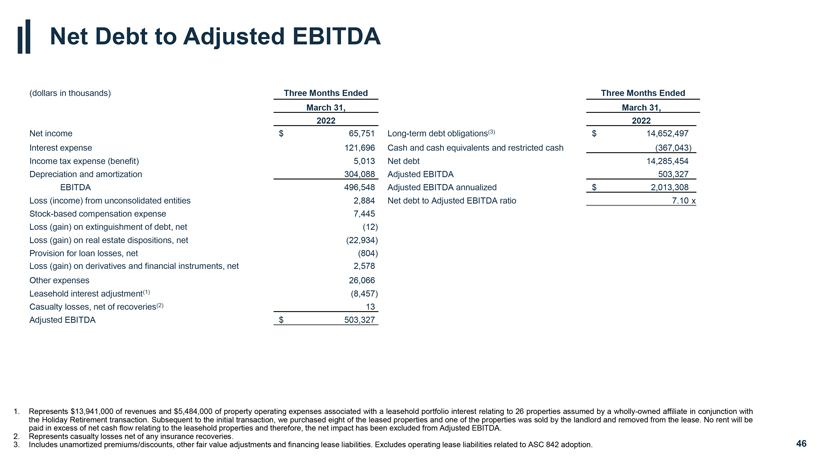
1. Represents $13,941,000 of revenues and $5,484,000 of property operating expenses associated with a leasehold portfolio interest relating to 26 properties
assumed by a wholly-owned affiliate in conjunction with
the Holiday Retirement transaction. Subsequent to the initial transaction, we purchased eight of the leased
properties and one of the properties was sold by the landlord and removed from the lease. No rent will be
paid in excess of net cash flow relating to the leasehold
properties and therefore, the net impact has been excluded from Adjusted EBITDA.
2. Represents casualty losses net of any insurance recoveries.
3. Includes unamortized premiums/discounts, other fair value adjustments and financing lease liabilities. Excludes operating lease liabilities related to ASC 842 adoption.
46
(dollars in thousands)
Net income Interest expense
Income tax expense (benefit) Depreciation and amortization EBITDA
Loss (income) from unconsolidated entities Stock-based compensation expense Loss (gain) on extinguishment of debt, net Loss (gain) on real estate dispositions, net
Provision for loan losses, net
Loss (gain) on derivatives and financial instruments, net Other expenses Leasehold interest adjustment(1) Casualty losses, net of
recoveries(2) Adjusted EBITDA
Three Months Ended
March 31,
2022 $ 65,751 121,696 5,013 304,088 496,548 2,884 7,445 (12) (22,934) (804) 2,578 26,066 (8,457) 13 $ 503,327
Long-term debt obligations(3)
Cash and cash equivalents and restricted cash Net debt Adjusted
EBITDA
Adjusted EBITDA annualized Net debt to Adjusted EBITDA ratio
Three
Months Ended March 31, 2022 $ 14,652,497 (367,043) 14,285,454 503,327 $ 2,013,308
7.10 x
Pro Forma Net Debt to Adjusted EBITDA
(dollars in thousands)
Three Months 1Q22 2Q22 Announced ATM Forward March 31, 2022 Held-
Three Months Ended
Ended March 31, Acquisitions and Acquisitions and Sale Settlement for-Sale Dispositions
March 31, 2022
2022 (Actual) (1) HHS Received(2) Dispositions (3) Loan Funding (4) (5) & Loan Payoffs (6) (Pro Forma)
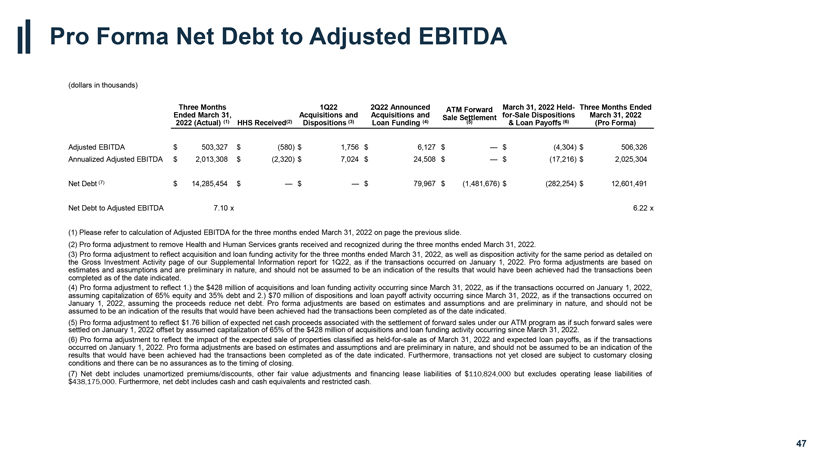
Adjusted EBITDA $ 503,327 $ (580) $ 1,756 $ 6,127 $ — $ (4,304) $ 506,326
Annualized
Adjusted EBITDA $ 2,013,308 $ (2,320) $ 7,024 $ 24,508 $ — $ (17,216) $ 2,025,304
Net Debt (7) $ 14,285,454 $ — $ — $ 79,967 $ (1,481,676) $
(282,254) $ 12,601,491
Net Debt to Adjusted EBITDA 7.10 x 6.22 x
(1) Please
refer to calculation of Adjusted EBITDA for the three months ended March 31, 2022 on page the previous slide.
(2) Pro forma adjustment to remove Health and
Human Services grants received and recognized during the three months ended March 31, 2022.
(3) Pro forma adjustment to reflect acquisition and loan funding
activity for the three months ended March 31, 2022, as well as disposition activity for the same period as detailed on
the Gross Investment Activity page of
our Supplemental Information report for 1Q22, as if the transactions occurred on January 1, 2022. Pro forma adjustments are based on estimates and assumptions and are preliminary in nature, and should not be assumed to be an indication of the
results that would have been achieved had the transactions been completed as of the date indicated.
(4) Pro forma adjustment to reflect 1.) the $428 million
of acquisitions and loan funding activity occurring since March 31, 2022, as if the transactions occurred on January 1, 2022, assuming capitalization of 65% equity and 35% debt and 2.) $70 million of dispositions and loan payoff
activity occurring since March 31, 2022, as if the transactions occurred on January 1, 2022, assuming the proceeds reduce net debt. Pro forma adjustments are based on estimates and assumptions and are preliminary in nature, and should not
be assumed to be an indication of the results that would have been achieved had the transactions been completed as of the date indicated.
(5) Pro forma adjustment
to reflect $1.76 billion of expected net cash proceeds associated with the settlement of forward sales under our ATM program as if such forward sales were settled on January 1, 2022 offset by assumed capitalization of 65% of the
$428 million of acquisitions and loan funding activity occurring since March 31, 2022.
(6) Pro forma adjustment to reflect the impact of the expected
sale of properties classified as held-for-sale as of March 31, 2022 and expected loan payoffs, as if the transactions occurred on January 1, 2022. Pro forma
adjustments are based on estimates and assumptions and are preliminary in nature, and should not be assumed to be an indication of the results that would have been achieved had the transactions been completed as of the date indicated. Furthermore,
transactions not yet closed are subject to customary closing conditions and there can be no assurances as to the timing of closing.
(7) Net debt includes
unamortized premiums/discounts, other fair value adjustments and financing lease liabilities of $110,824,000 but excludes operating lease liabilities of $438,175,000. Furthermore, net debt includes cash and cash equivalents and restricted cash.
47

48