Exhibit 99.1

1Q 2022
SmartFinancial Announces Results for the First Quarter 2022
Highlights for the First Quarter of 2022
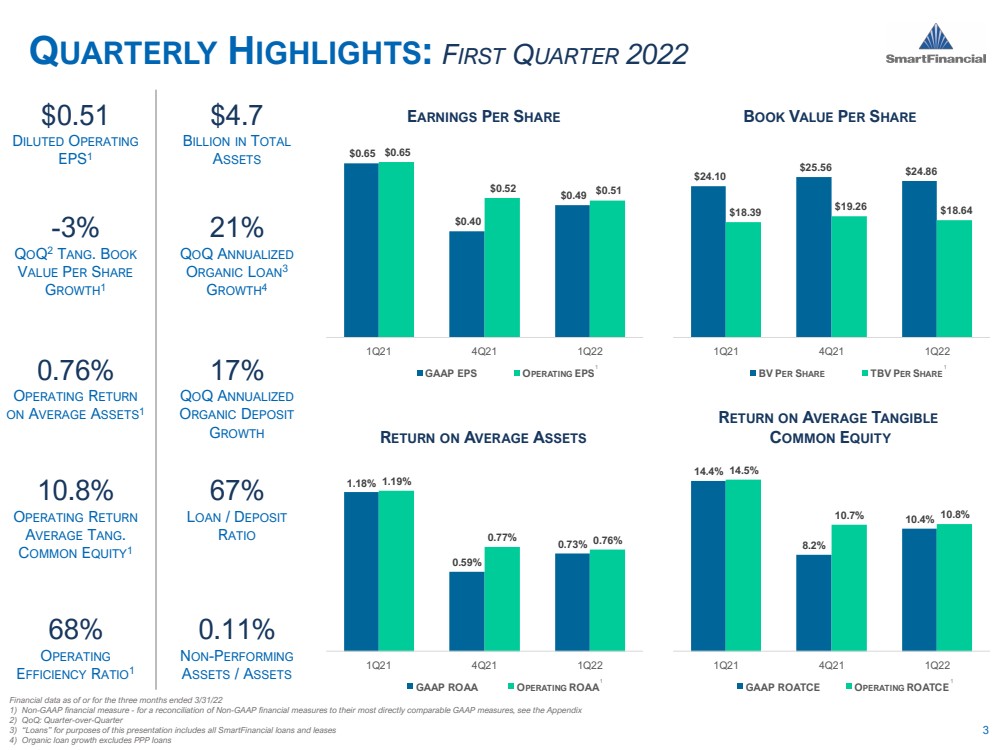
| ● | Operating earnings1 of $8.6 million, or $0.51 per diluted common share, for the first quarter of 2022 |
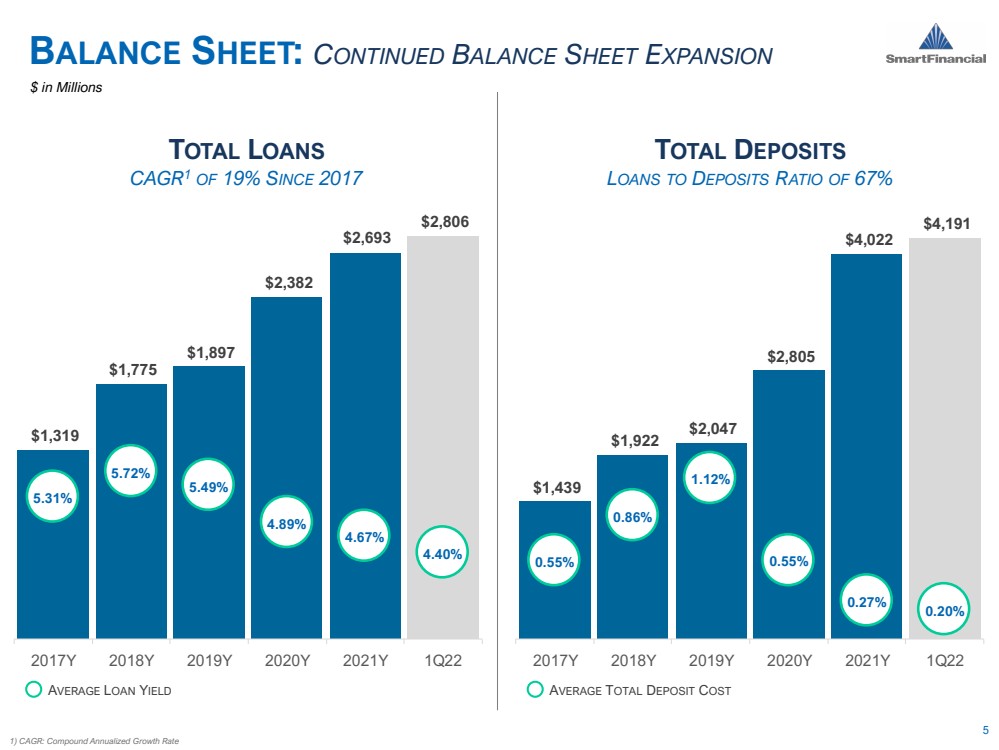
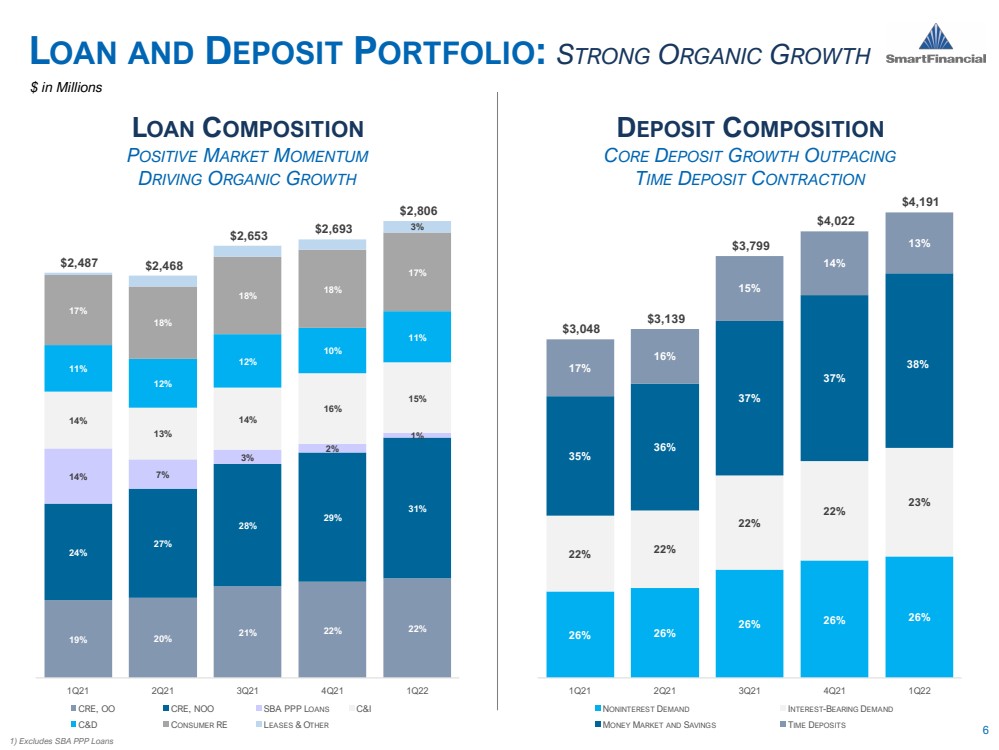
| ● | Net organic loan and lease growth of over $136.9 million - 21% annualized quarter-over-quarter increase |
| ● | Non-time deposit growth of over $195.0 million – 23% annualized quarter-over-quarter increase |
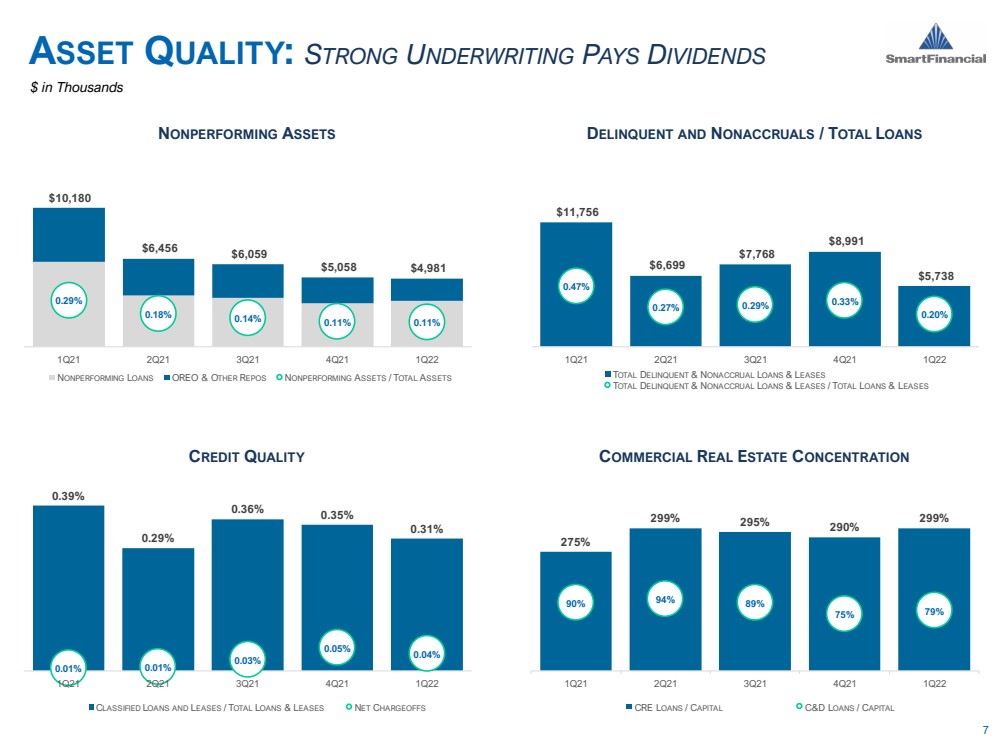
| ● | Credit quality remains solid with nonperforming assets to total assets of 0.11% |
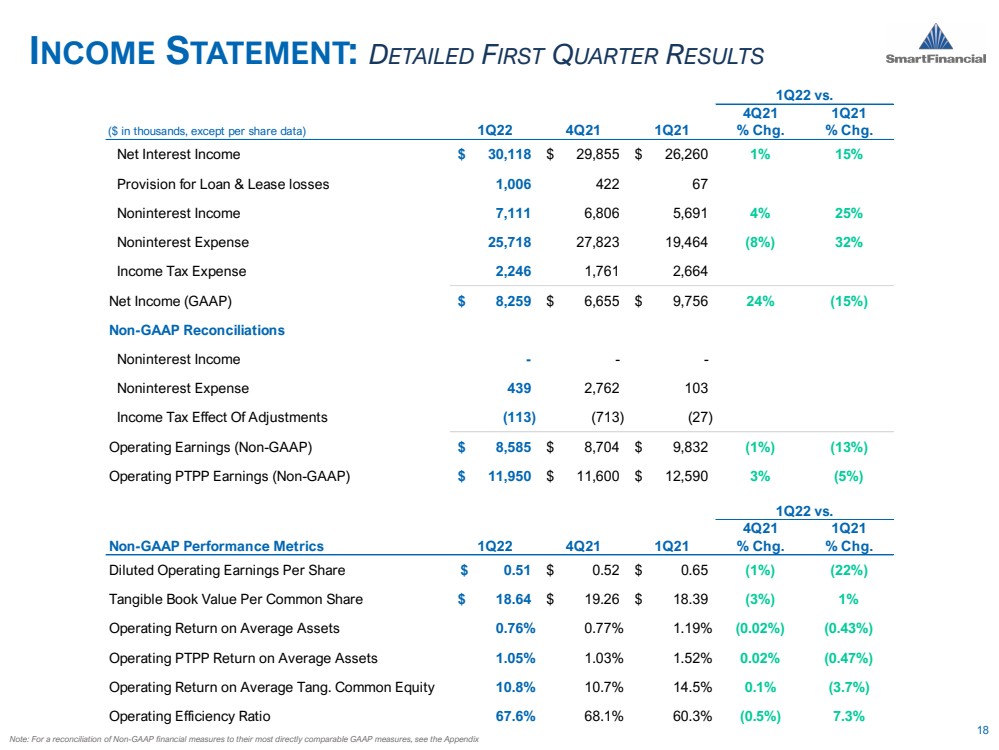
KNOXVILLE, TN – April 25, 2022 - SmartFinancial, Inc. ("SmartFinancial" or the "Company"; NASDAQ: SMBK), today announced net income of $8.3 million, or $0.49 per diluted common share, for the first quarter of 2022, compared to net income of $9.8 million, or $0.65 per diluted common share, for the first quarter of 2021, and compared to prior quarter net income of $6.7 million, or $0.40 per diluted common share. Operating earnings1, which excludes securities gains, merger related and restructuring expenses and non-operating items, totaled $8.6 million, or $0.51 per diluted common share, in the first quarter of 2022, compared to $9.8 million, or $0.65 per diluted common share, in the first quarter of 2021, and compared to $8.7 million, or $0.52 per diluted common share, in the fourth quarter of 2021.
Billy Carroll, President & CEO, stated: “I am extremely pleased with our results for the first quarter. Both loans and deposits grew at an outstanding pace, as our sales team executed our organic growth strategy. Our wealth platform, insurance platform and equipment finance group all also had strong performance. Earnings performance was on target and while keeping an eye on inflationary pressure in our economy, we remain bullish on the company’s 2022 outlook.”
SmartFinancial's Chairman, Miller Welborn, concluded: “2022 has certainly started on a good note for us. Just as we projected and forecasted our plan is on track. The execution at all levels shows our commitment and discipline to be a top performing bank”.
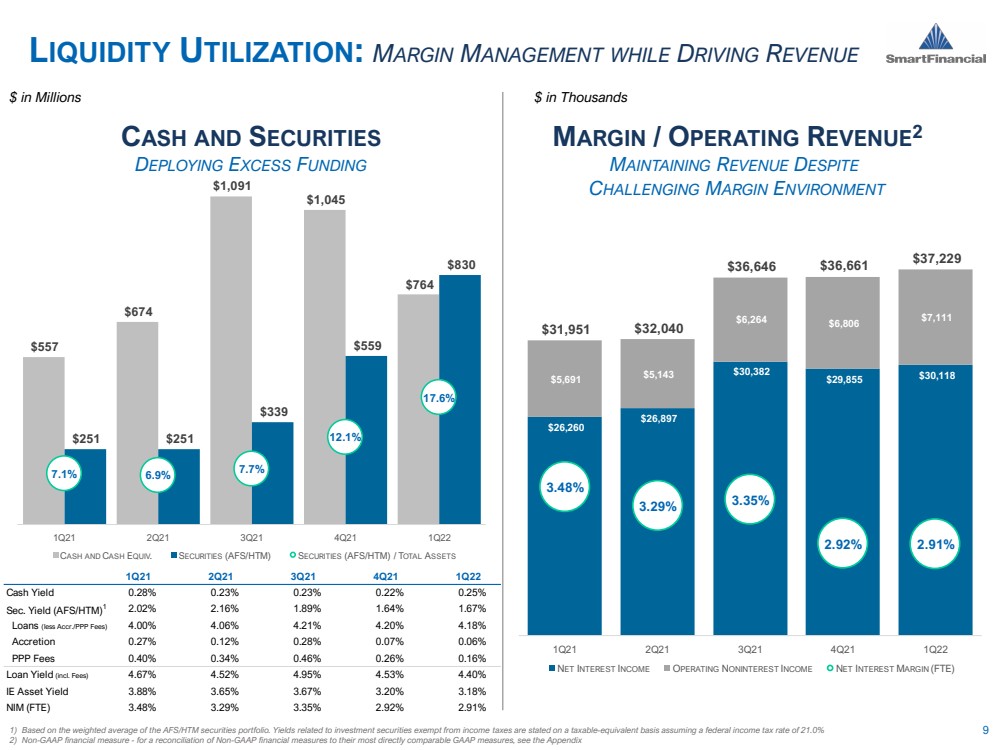
Net Interest Income and Net Interest Margin
Net interest income was $30.1 million for the first quarter of 2022, compared to $29.9 million for the prior quarter. Average earning assets totaled $4.22 billion, an increase of $139.1 million. The growth in average earnings assets was primarily driven by an increase in average securities of $276.1 million and average loans and leases of $54.3 million, offset by a decrease in average interest-earning cash of $190.1 million, primarily from the purchase of securities. Average interest-bearing liabilities increased $121.8 million, related to continued core deposit growth.
The tax equivalent net interest margin was 2.91% for the first quarter of 2022, compared to 2.92% for the prior quarter. The tax equivalent net interest margin was positively impacted by several factors, mainly the continued deployment of excess cash and cash equivalents into loans and securities. However, the deployment of total cash and cash equivalents was partially offset by a quarter-over-quarter deposit increase of over $169.4 million. Additionally, the yield on interest-earning assets was negatively impacted due to a decrease quarter-over-quarter in loan discount and Payroll Protection Program (“PPP”) fee accretion of $727 thousand.
The yield on interest-bearing liabilities decreased to 0.36% for the first quarter of 2022 compared to 0.39% for the prior quarter. The cost of average interest-bearing deposits was 0.27% for the first quarter of 2022 compared to 0.29% for the prior quarter, a decrease of 2 basis points. The lower cost of average deposits was attributable to the growth of non-time deposits and the continued maturation and repricing of time deposits. The cost of total deposits for the first quarter of 2022 was 0.20% compared to 0.22% in the prior quarter.
The following table presents selected interest rates and yields for the periods indicated:
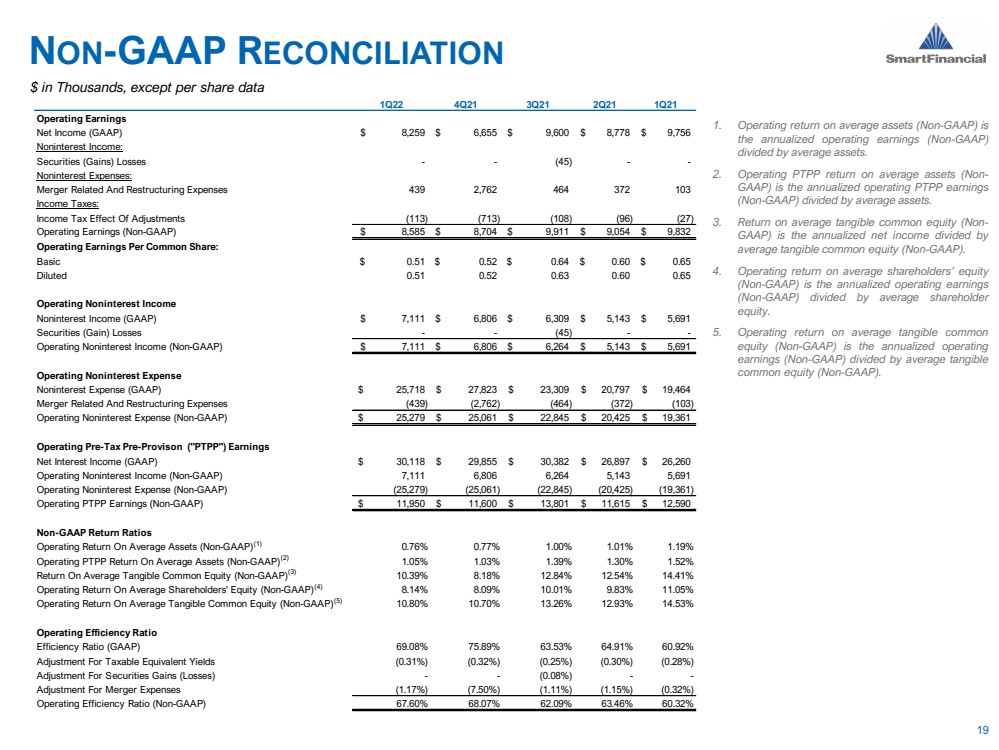
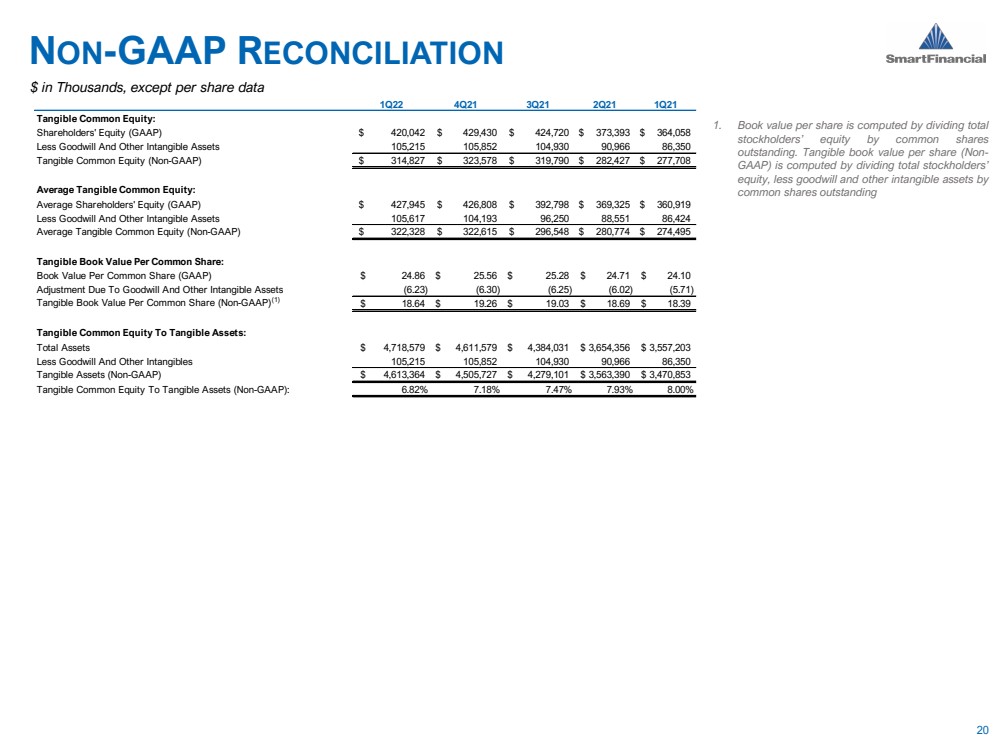
1 Non-GAAP measures. See “Non-GAAP Financial Measures” for more information and see the Non-GAAP reconciliation