As filed with the Securities and Exchange Commission on April 29, 2020
UNITED STATES
SECURITIES AND EXCHANGE COMMISSION
WASHINGTON, D.C. 20549
FORM 20-F
|
ANNUAL REPORT PURSUANT TO SECTION 13 OR 15(d) OF
THE SECURITIES EXCHANGE ACT OF 1934 |
Commission file number 001-13142
| Embotelladora Andina S.A. |
| (Exact name of Registrant as specified in its charter) |
| Andina Bottling Company |
| (Translation of Registrant’s name into English) |
| Republic of Chile |
| (Jurisdiction of incorporation or organization) |
|
Miraflores 9153, 7th Floor Renca - Santiago, Chile |
| (Address of principal executive offices) |
|
Ignacio Morales, Tel. (56-2) 2338-0520 E-mail: ignacio.morales @koandina.com Miraflores 9153, 7th Floor - Renca - Santiago, Chile |
| (Name, Telephone, E-mail and/or Facsimile number and Address of Company Contact Person) |
Securities registered or to be registered pursuant to Section 12(b) of the Act.
| Title of each class | Trading Symbol | Name of each exchange on which registered |
| Series A Shares, Series B Shares of Registrant represented by American Depositary Shares |
AKO.A AKO.B |
New York Stock Exchange |
Securities registered or to be registered pursuant to Section 12(g) of the Act: None
Securities for which there is a reporting obligation pursuant to Section 15(d) of the Act: None
Indicate the number of outstanding shares of each of the issuer’s classes of capital or common stock as of the close of the period covered by the annual report.
| Series A Shares | 473,289,301 | |
| Series B Shares | 473,281,303 |
Indicate by check mark if the registrant is a well-known seasoned issuer, as defined in Rule 405 of the Securities Act.
x Yes ¨ No
If this report is an annual or transition report, indicate by check mark if the registrant is not required to file reports pursuant to Section 13 or 15(d) of the Securities Exchange Act of 1934.
¨ Yes x No
Indicate by check mark whether the registrant (1) has filed all reports required to be filed by Section 13 or 15(d) of the Securities Exchange Act of 1934 during the preceding 12 months (or for such shorter period that the registrant was required to file such reports), and (2) has been subject to such filing requirements for the past 90 days.
x Yes ¨ No
Indicate by check mark whether the registrant has submitted electronically every Interactive Data File required to be submitted pursuant to Rule 405 of Regulation S-T (§232.405 of this chapter) during the preceding 12 months (or for such shorter period that the registrant was required to submit such files).
x Yes ¨ No
Indicate by check mark whether the registrant is a large accelerated filer, an accelerated filer, a non-accelerated filer, or an emerging growth company. See the definitions of “large accelerated filer,” “accelerated filer,” and “emerging growth company” in Rule 12b-2 of the Exchange Act. (Check one):
| Large accelerated filer x | Accelerated filer ¨ | Non-accelerated filer ¨ | Emerging growth company ¨ |
If an emerging growth company that prepares its financial statements in accordance with U.S. GAAP, indicate by check mark if the registrant has elected not to use the extended transition period for complying with any new or revised financial accounting standards† provided pursuant to Section 13(a) of the Exchange Act. ¨
†The term ‘‘new or revised financial accounting standard’’ refers to any update issued by the Financial Accounting Standards Board to its Accounting Standards Codification after April 5, 2012.
Indicate by check mark which basis of accounting the registrant has used to prepare the financial statements included in this filing:
| U.S. GAAP ¨ | International Financial Reporting Standards as issued by the International Accounting Standards Board x |
Other ¨ |
If “Other” has been checked in response to the previous question, indicate by check mark which financial statement item the registrant has elected to follow.
¨ Item 17 ¨ Item 18
If this is an annual report, indicate by check mark whether the registrant is a shell company (as defined in Rule 12b-2 of the Exchange Act).
¨ Yes x No
TABLE OF CONTENTS
1
Certain Definitions
Unless the context otherwise requires, as used in this annual report the following terms have the meanings set forth below:
| · | the “Company,” “we,” “Andina” and “Coca-Cola Andina” means Embotelladora Andina S.A. and its consolidated subsidiaries; | |
| · | “Andina Argentina” means our subsidiary, Embotelladora del Atlántico S.A., or EDASA; | |
| · | “Andina Brazil” means our subsidiary, Rio de Janeiro Refrescos Ltda. and its subsidiaries; | |
| · | “AEASA” means our subsidiary, Andina Empaques Argentina S.A; | |
| · | “EDASA” means our subsidiary, Embotelladora del Atlántico S.A.; | |
| · | “PARESA” means our subsidiary, Paraguay Refrescos S.A; | |
| · | “Envases CMF” means our affiliate, Envases CMF S.A.; | |
| · | “ECSA” means our subsidiary, Envases Central S.A.; | |
| · | “Vital Jugos” means our subsidiary, VJ S.A., previously known as Vital S.A. and subsequently Vital Jugos S.A.; | |
| · | “VASA” means our subsidiary, Vital Aguas S.A.; | |
| · | “TAR” means our subsidiary, Transportes Andina Refrescos Ltda; | |
| · | “TP” means our subsidiary, Transportes Polar S.A; | |
| · | “The Coca-Cola Company” means The Coca-Cola Company or any of its subsidiaries, including without limitation Coca-Cola de Chile S.A. (“CC Chile”), which operates in Chile, Recofarma Industrias do Amazonas Ltda. (“CC Brazil”), which operates in Brazil, and Servicios y Productos para Bebidas Refrescantes S.R.L. (“CC Argentina”), which operates in Argentina; | |
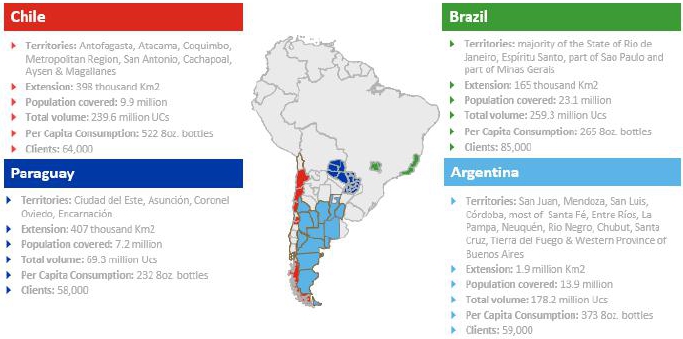
| · | the “Chilean territory” means the regions of Antofagasta, Atacama, Coquimbo, Metropolitan Region of Santiago, Aysén and Magallanes and the provinces of Cachapoal and San Antonio; | |
| · | the “Brazilian territory” means the greater part of the State of Rio de Janeiro, the totality of the State of Espírito Santo and parts of the state of São Paulo and the state of Minas Gerais; | |
| · | the “Argentine territory” means the provinces of Córdoba, Mendoza, San Juan, San Luis, Santa Fe, Entre Rios, La Pampa, Neuquén, Río Negro, Chubut, Santa Cruz, Tierra del Fuego as well as the western part of the province of Buenos Aires; and, | |
| · | the “Paraguayan territory” means the country of Paraguay. |
Presentation of Financial and Certain Other Information
Unless otherwise specified, references herein to “dollars”, “U.S. dollars” or “US$” are to United States dollars; references to “pesos”, “Chilean pesos”, “Ch$” or “ThCh$” are to Chilean pesos; references to “Argentine pesos” or “AR$” are to Argentine pesos; references to “real”, “reais” or “R$” are to Brazilian reais; and references to “guaraníes”, “guaraní” or “G$” are to Paraguayan guaraníes. References to “UF” are to Unidades de Fomento. The UF is an inflation-indexed Chilean monetary unit with a value in Chilean pesos that is adjusted daily to reflect changes in the official consumer price index of the Instituto Nacional de Estadísticas (the “Chilean National Institute of Statistics”). The UF is adjusted in monthly cycles. Each day in the period beginning on the tenth day of the current month through the ninth day of the succeeding month, the nominal peso value of the UF is indexed up (or down in the event of deflation) in order to reflect a proportionate amount of the change in the Chilean consumer price index during the prior calendar month. Certain percentages and amounts contained in this annual report have been rounded for ease of presentation.
The Company’s consolidated financial statements for the years ended December 31, 2019, 2018, 2017, 2016 and 2015 were prepared in accordance with International Financial Reporting Standards (hereinafter “IFRS”) issued by the International Accounting Standards Board (hereinafter “IASB”).
Our consolidated financial statements are presented in Chilean pesos. Our consolidated financial statements reflect the results of our subsidiaries located in Brazil, Argentina and Paraguay, converted to Chilean pesos (our functional and presentation currency). IFRS requires assets and liabilities to be converted from the functional currency of our subsidiaries outside Chile to our reporting currency (Chilean peso) at the end of period exchange rates and income and expense accounts to be converted at the average monthly exchange rate for the month in which income or expense is recognized for subsidiaries that do not operate in hyperinflationary economies.
In the case of our Argentine subsidiaries, which have been operating in an environment that during 2018 and 2019 was classified as hyperinflationary, the conversion criteria from the functional currency of those subsidiaries to our presentation currency is the following:
2
| · | The statement of financial position (balance sheet): Non-cash items are expressed in the current currency at the balance sheet date and translated to the presentation currency of the closing exchange rate. Losses and gains are included in net earnings (fiscal year income). | |
| · | First adoption of a hyperinflationary economy was in 2018: Losses and gains by correction of current non-monetary items the previous year are recorded in accumulated results as of January 1, 2018. | |
| · | The income statement: Income statement items are expressed in the current currency unit at the end of the reporting period, using the variation of the general price index from the date on which the expenses and revenues were accrued, and translated to the presentation currency at closing exchange rate. | |
| · | Cash flow statement: Cash flow statement items are expressed in the current currency unit at the end of the reporting period and translated to the presentation currency at closing exchange rate. |
For more information on the effects of the hyperinflationary environment in Argentina see note 2.5 of our consolidated financial statements included herein.
Unless otherwise specified, our financial data is presented herein in Chilean pesos.
Forward-Looking Statements
This annual report includes forward looking statements, principally under the captions, “Item 4. Information on the Company—Part B. Business Overview,” “Item 3. Key Information—Part D. Risk Factors,” and “Item 5. Operating and Financial Review and Prospects.” We have based these forward-looking statements largely on our current beliefs, expectations and projections about future events and financial trends affecting our business. Examples of such forward-looking statements include:
| · | statements of our plans, objectives or goals, including those related to anticipated trends, competition or regulation; |
| · | statements about our future economic performance and that of Chile or other countries in which we operate; |
| · | statements about our exposure to market risks, including interest rate risks, foreign exchange risk and equity price risk; and |
statements of assumptions underlying such statements.
Words such as “believes,” “expects,” “anticipates,” “projects,” “intends,” “should,” “could,” “may,” “seeks,” “aim,” “combined,” “estimates,” “probability,” “risk,” “target,” “goal,” “objective,” “future” or similar expressions are intended to identify forward-looking statements but are not the exclusive means of identifying such statements. These statements may relate to (i) our asset growth and financing plans, (ii) trends affecting our financial condition or results of operations and (iii) the impact of competition and regulations, but are not limited to such topics. Forward-looking statements are not guarantees of future performance and involve risks and uncertainties, and actual results may differ materially and adversely from those described in such forward-looking statements included in this annual report as a result of various factors (including, without limitation, the actions of competitors, future global economic conditions, market conditions, foreign exchange rates and operating and financial risks), many of which are beyond our control. The occurrence of any such factors not currently expected by us would significantly alter the results set forth in these statements.
You should understand that the following important factors, in addition to those discussed elsewhere in this annual report, could affect our future results and could cause those results or other outcomes to differ materially and adversely from those expressed in our forward-looking statements:
| · | changes in general economic, business, political or other conditions in the regions where we operate; | |
| · | changes in the legal and regulatory framework of the beverage sector in the regions where we operate; | |
| · | the monetary and interest rate policies of the central banks of the countries in which we operate; | |
| · | unanticipated movements or volatility in interest rates, foreign exchange rates, equity prices or other rates or prices; | |
| · | changes in, or our failure to comply with, laws and regulations in the countries where we operate; | |
| · | changes in taxes; | |
| · | our inability to hedge certain risks economically; | |
| · | potential effects of weather conditions, earthquakes, tsunamis or other natural disasters; | |
| · | the outcome of litigation against us; | |
| · | the nature and extent of competition in the beverage industry in Latin America and the effect of competition on the prices we are able to charge for our products; | |
| · | volatility and fluctuations in demand for our products and the effect of such changes on the volume that we are able to sell and the price that we are able to charge for our products; | |
| · | capital and credit market conditions, including the availability of credit and changes in interest rates; |
3
| · | delays in the development of our projects, changes to our investment plans due to changes in demand, authorizations, expropriations, etc.; |
| · | actions of our shareholders; |
| · | unanticipated increases in financing and other costs or the inability to obtain additional debt or equity financing on attractive terms if at all; and |
| · | the factors described under “Risk Factors”. |
The forward-looking statements contained in this document speak only as of the date of this annual report, and we do not undertake any obligation to update any forward-looking statement to reflect events or circumstances after the date hereof or to reflect the occurrence of unanticipated events, unless required by law.
Market Data
We have computed the information contained in this annual report regarding annual volume and per capita growth rates and levels, and market share, product segment, and population data in our bottling territories, based upon accumulated statistics developed by us. Market share information presented with respect to soft drinks, juices, waters and beer is based on data supplied by A.C. Nielsen Company.
4
| ITEM 1. | IDENTITY OF DIRECTORS, SENIOR MANAGEMENT AND ADVISERS |
Not applicable.
| ITEM 2. | OFFER STATISTICS AND EXPECTED TIMETABLE |
Not applicable.
| ITEM 3. | KEY INFORMATION |
A. Selected Financial Data
The following tables present certain summary consolidated and other financial and operating information of Andina at the dates and for the periods indicated. This information should be read in conjunction with and is qualified in its entirety by reference to our consolidated financial statements.
The summary consolidated financial information as of December 31, 2018 and 2019 and for the years ended December 31, 2017, 2018 and 2019 has been derived from our audited consolidated financial statements included in this annual report. The summary consolidated financial information as of December 31, 2015, 2016 and 2017 and for the years ended December 31, 2015 and 2016 has been derived from our audited consolidated financial statements not included herein.
Our consolidated financial statements are prepared in accordance IFRS and presented in Chilean pesos. Our consolidated financial statements reflect the results of our subsidiaries located in Brazil, Argentina and Paraguay, converted to Chilean pesos (our functional and reporting currency). IFRS requires assets and liabilities to be converted from the functional currency of our subsidiaries outside Chile to our reporting currency (Chilean peso) at the end of period exchange rates and income and expense accounts to be converted at the average monthly exchange rate for the month in which income or expense is recognized for subsidiaries that do not operate in hyperinflationary economies.
Our Argentine subsidiaries have been operating in an environment that in 2018 and 2019 was classified as hyperinflationary. For a description of the conversion criteria from the functional currency to the presentation currency, see “Introduction – Presentation of Financial and Certain Other Information” and note 2.5 of our consolidated financial statements included herein.
5
| For the year ended December 31, | ||||||||||||||||||||
| 2015 | 2016 | 2017 | 2018 | 2019 | ||||||||||||||||
| (in million Chilean pesos) | ||||||||||||||||||||
| INCOME STATEMENT DATA | ||||||||||||||||||||
| Net sales | 1,877,394 | 1,777,459 | 1,848,879 | 1,672,916 | 1,779,025 | |||||||||||||||
| Cost of sales | (1,106,706 | ) | (1,033,910 | ) | (1,069,025 | ) | (968,028 | ) | (1,048,344 | ) | ||||||||||
| Gross profit | 770,688 | 743,549 | 779,854 | 704,888 | 730,681 | |||||||||||||||
| Other income | 472 | 1,761 | 551 | 2,609 | 40,947 | |||||||||||||||
| Distribution expenses | (202,491 | ) | (183,677 | ) | (192,928 | ) | (165,775 | ) | (166,996 | ) | ||||||||||
| Administrative expenses | (352,601 | ) | (346,203 | ) | (348,199 | ) | (313,743 | ) | (325,904 | ) | ||||||||||
| Other expenses | (21,983 | ) | (22,765 | ) | (16,701 | ) | (16,058 | ) | (26,183 | ) | ||||||||||
| Other (expense) income, net | (6,301 | ) | (3,387 | ) | (2,537 | ) | (2,708 | ) | 3 | |||||||||||
| Financial income | 10,118 | 9,662 | 11,194 | 3,940 | 45,156 | |||||||||||||||
| Financial expenses | (55,669 | ) | (51,375 | ) | (55,220 | ) | (55,015 | ) | (46,209 | ) | ||||||||||
| Share of (loss) profit of investments accounted for using the equity method | (2,328 | ) | (263 | ) | (80 | ) | 1,411 | (3,415 | ) | |||||||||||
| Foreign exchange differences | (2,856 | ) | (68 | ) | (1,370 | ) | (1,449 | ) | (4,131 | ) | ||||||||||
| Loss from differences in indexed financial assets and liabilities | (7,308 | ) | (6,378 | ) | (3,763 | ) | (5,085 | ) | (7,536 | ) | ||||||||||
| Net income before income taxes | 129,741 | 140,856 | 170,798 | 153,016 | 236,413 | |||||||||||||||
| Income tax expense | (41,643 | ) | (48,807 | ) | (51,797 | ) | (55,565 | ) | (61,167 | ) | ||||||||||
| Net income | 88,098 | 92,049 | 119,001 | 97,451 | 175,246 | |||||||||||||||
| BALANCE SHEET DATA | ||||||||||||||||||||
| Assets | ||||||||||||||||||||
| Current assets | ||||||||||||||||||||
| Cash and cash equivalents | 129,160 | 141,264 | 136,242 | 137,539 | 157,568 | |||||||||||||||
| Other financial assets | 87,492 | 60,153 | 14,138 | 684 | 347 | |||||||||||||||
| Other non-financial assets | 8,686 | 8,601 | 5,612 | 5,949 | 16,189 | |||||||||||||||
| Trade and other accounts receivable, net | 176,386 | 190,524 | 191,285 | 174,113 | 191,078 | |||||||||||||||
| Accounts receivable from related parties | 4,611 | 5,789 | 5,370 | 9,450 | 10,836 | |||||||||||||||
| Inventories | 133,333 | 144,709 | 131,363 | 151,320 | 147,641 | |||||||||||||||
| Current tax assets | 7,742 | 1,702 | - | 2,532 | 9,815 | |||||||||||||||
| Total current assets | 547,410 | 552,742 | 484,010 | 481,586 | 533,474 | |||||||||||||||
| Non-current assets | ||||||||||||||||||||
| Other financial assets | 181,491 | 80,181 | 74,259 | 97,362 | 110,784 | |||||||||||||||
| Other non-financial assets | 18,290 | 35,247 | 47,349 | 34,977 | 125,636 | |||||||||||||||
| Trade and other receivables | 5,932 | 3,528 | 2,396 | 1,271 | 524 | |||||||||||||||
| Accounts receivable from related parties | 15 | 148 | 156 | 74 | 283 | |||||||||||||||
| Investments accounted for under the equity method | 54,191 | 77,198 | 86,809 | 102,411 | 99,867 | |||||||||||||||
| Intangible assets other than goodwill | 665,666 | 680,996 | 663,273 | 668,823 | 675,075 | |||||||||||||||
| Goodwill | 95,836 | 102,920 | 93,598 | 117,229 | 121,222 | |||||||||||||||
| Property, plant and equipment | 640,530 | 666,151 | 659,750 | 710,771 | 722,719 | |||||||||||||||
| Deferred tax assets | - | - | 3,213 | - | 1,364 | |||||||||||||||
| Total non-current assets | 1,661,951 | 1,646,367 | 1,630,849 | 1,732,918 | 1,857,474 | |||||||||||||||
| Total assets | 2,209,361 | 2,199,110 | 2,114,859 | 2,214,505 | 2,390,948 | |||||||||||||||
| Liabilities | ||||||||||||||||||||
| Current liabilities | ||||||||||||||||||||
| Other financial liabilities | 62,218 | 64,801 | 67,981 | 56,115 | 40,594 | |||||||||||||||
| Trade and other accounts payable | 212,526 | 242,836 | 257,519 | 238,110 | 243,701 | |||||||||||||||
| Accounts payable to related parties | 48,653 | 44,120 | 33,961 | 45,828 | 53,638 | |||||||||||||||
| Provisions | 326 | 683 | 2,676 | 3,486 | 2,069 | |||||||||||||||
| Income taxes payable | 7,495 | 10,829 | 3,185 | 9,339 | 6,762 | |||||||||||||||
| Employee benefits current provisions | 31,791 | 35,653 | 35,956 | 33,211 | 38,393 | |||||||||||||||
| Other non-financial liabilities | 17,565 | 20,613 | 27,008 | 33,774 | 26,502 | |||||||||||||||
| Total current liabilities | 380,574 | 419,535 | 428,287 | 419,862 | 411,658 | |||||||||||||||
| Non-current liabilities | ||||||||||||||||||||
| Other long-term current financial liabilities | 765,299 | 721,571 | 675,767 | 716,564 | 743,327 | |||||||||||||||
| Trade and other payables | 9,303 | 9,510 | 1,133 | 736 | 620 | |||||||||||||||
| Accounts payable to related parties | - | - | - | - | 19,778 | |||||||||||||||
| Provisions | 63,976 | 72,399 | 62,948 | 58,967 | 67,039 | |||||||||||||||
| Deferred income tax liabilities | 130,202 | 125,609 | 125,205 | 145,246 | 169,450 | |||||||||||||||
| Post-employment benefit liabilities | 8,230 | 8,158 | 8,286 | 9,416 | 10,173 | |||||||||||||||
| Other non-financial liabilities | 243 | 159 | - | - | - | |||||||||||||||
| Total non-current liabilities | 977,253 | 937,405 | 873,339 | 930,928 | 1,010,386 | |||||||||||||||
| Issued capital | 270,738 | 270,738 | 270,738 | 270,738 | 270,738 | |||||||||||||||
| Retained earnings | 274,755 | 295,709 | 335,523 | 462,221 | 600,918 | |||||||||||||||
| Other reserves | 284,982 | 254,159 | 185,049 | 110,854 | 76,994 | |||||||||||||||
| Equity attributable to equity holders of the parent | 830,474 | 820,606 | 791,310 | 843,813 | 948,650 | |||||||||||||||
| Non-controlling interests | 21,060 | 21,564 | 21,923 | 19,902 | 20,254 | |||||||||||||||
| Total equity | 851,534 | 842,170 | 813,233 | 863,715 | 968,904 | |||||||||||||||
| Total liabilities and equity | 2,209,361 | 2,199,110 | 2,114,859 | 2,214,505 | 2,390,948 | |||||||||||||||
6
| For the year ended December 31, | ||||||||||||||||||||
| 2015 | 2016 | 2017 | 2018 | 2019 | ||||||||||||||||
| (in million Chilean pesos, except share and per share data and other operating data) | ||||||||||||||||||||
| CASH FLOW DATA | ||||||||||||||||||||
| Net cash flows generated from operating activities | 264,909 | 223,447 | 247,960 | 235,279 | 255,148 | |||||||||||||||
| Net cash flows used in investing activities | (103,131 | ) | (113,916 | ) | (168,831 | ) | (118,086 | ) | (110,048 | ) | ||||||||||
| Net cash flows provided by (used in) financing activities | (98,560 | ) | (98,225 | ) | (78,346 | ) | (114,635 | ) | (127,113 | ) | ||||||||||
| Net increase in cash and cash equivalents before exchange differences | 63,218 | 11,306 | 783 | 2,558 | 17,988 | |||||||||||||||
| Effects of exchange differences on cash and cash equivalents | (13,571 | ) | 797 | (5,805 | ) | 3,574 | 4,048 | |||||||||||||
| Effects of inflation on cash and cash equivalents in Argentina | - | - | - | (4,836 | ) | (2,007 | ) | |||||||||||||
| Net increase (decrease) in cash and cash equivalents | 49,647 | 12,103 | (5,022 | ) | 1,296 | 20,029 | ||||||||||||||
| Cash and cash equivalents - beginning of year | 79,514 | 129,161 | 141,264 | 136,242 | 137,539 | |||||||||||||||
| Cash and cash equivalents - end of year | 129,161 | 141,264 | 136,242 | 137,539 | 157,568 | |||||||||||||||
| OTHER FINANCIAL DATA | ||||||||||||||||||||
| Depreciation and amortization | 100,632 | 97,334 | 99,164 | 99,594 | 111,087 | |||||||||||||||
| Capital expenditures | 112,400 | 128,217 | 168,858 | 121,063 | 110,683 | |||||||||||||||
| Dividends paid | 53,670 | 67,584 | 75,536 | 85,475 | 85,475 | |||||||||||||||
| Basic and diluted earnings per share: | ||||||||||||||||||||
| Series A(1) | 88.40 | 91.08 | 118.56 | 97.20 | 174.79 | |||||||||||||||
| Series B(1) | 97.24 | 100.19 | 130.42 | 106.92 | 192.27 | |||||||||||||||
| Basic and diluted earnings per ADR(2) | ||||||||||||||||||||
| Series A(2) | 530.40 | 546.48 | 711.36 | 583.20 | 1,048.73 | |||||||||||||||
| Series B(2) | 583.44 | 601.14 | 782.52 | 641.52 | 1,153.60 | |||||||||||||||
| Capital Stock | ||||||||||||||||||||
| Series A | 473,289,301 | 473,289,301 | 473,289,301 | 473,289,301 | 473,289,301 | |||||||||||||||
| Series B | 473,281,303 | 473,281,303 | 473,281,303 | 473,281,303 | 473,281,303 | |||||||||||||||
| Issued Capital | 270,738 | 270,738 | 270,738 | 270,738 | 270,738 | |||||||||||||||
| Total dividends declared | ||||||||||||||||||||
| Total Series A Shares | 29,344 | 33,130 | 37,153 | 40,703 | 41,223 | |||||||||||||||
| Total Series B Shares | 32,278 | 36,443 | 40,868 | 44,772 | 45,345 | |||||||||||||||
| OTHER OPERATING DATA (unaudited) | ||||||||||||||||||||
| Sales volume | ||||||||||||||||||||
| Coca-Cola trade brand soft drinks (millions of UCs)(3) | 653.8 | 613.2 | 587.9 | 579.2 | 570.8 | |||||||||||||||
| Other beverages (millions of UCs) (3)(4) | 166.1 | 165.8 | 168.5 | 171.3 | 175.6 | |||||||||||||||
| (1) | Calculation of profits per share considers the average amount of outstanding shares existing at each date. |
| (2) | Each ADR represents six shares of common stock of the corresponding series of shares. |
| (3) | UCs or Unit cases refer to 192 ounces of finished beverage product (24 eight-ounce servings) or 5.68 liters. |
| (4) | Includes waters, juices, beer and other spirits. |
Note: Totals may not sum due to rounding.
7
Exchange Rates
Chile
Chile has two currency markets, the Mercado Cambiario Formal (the “Formal Exchange Market”) and the Mercado Cambiario Informal (the “Informal Exchange Market”). The Formal Exchange Market is comprised of banks and other entities authorized by the Chilean Central Bank. The Informal Exchange Market is comprised of entities that are not expressly authorized to operate in the Formal Exchange Market, such as certain foreign exchange houses and travel agencies, among others. The Chilean Central Bank is empowered to require that certain purchases and sales of foreign currencies be carried out on the Formal Exchange Market. See also “Item 10. Additional Information—D. Exchange Controls— Foreign Investment and Exchange Controls in Chile”.
Both the Formal and Informal Exchange Markets are driven by free market forces. Current regulations require that the Chilean Central Bank be informed of certain transactions and that they be effectuated through the Formal Exchange Market.
The U.S. dollar observed exchange rate (dólar observado), which is reported by the Chilean Central Bank and published daily in the Official Gazette (Diario Oficial), is the weighted average exchange rate of the previous business day’s transactions in the Formal Exchange Market. The Chilean Central Bank has the power to intervene by buying or selling foreign currency on the Formal Exchange Market to attempt to maintain the observed exchange rate within a desired range. During the past few years, the Chilean Central Bank has attempted to keep the observed exchange rate within a certain range only under special circumstances. Although the Chilean Central Bank is not required to purchase or sell dollars at any specific exchange rate, it generally uses spot rates for its transactions. Other banks generally carry out authorized transactions at spot rates as well.
The Informal Exchange Market reflects transactions carried out at the informal exchange rate. There are no limits imposed on the extent to which the rate of exchange in the Informal Exchange Market can fluctuate above or below the observed exchange rate. In recent years, the variation between the observed exchange rate and the informal exchange rate has not been significant.
Argentina
Over the last 20 years, Argentina’s monetary policy has fluctuated between extremes. On September 1, 2019, after four years of unrestricted foreign exchange, Argentina reinstated foreign exchange controls as a measure to reduce the amount of Argentine pesos available in the market and reduce the demand for foreign currency, and stabilize the value of the Argentine peso. Among other provisions set forth in such legislation, the most relevant aspects of the new foreign exchange rules provide new regulation that impact the following areas and situations: (i) exports and imports of services; (ii) payments of profits and dividends; (iii) sale of non-produced non-financial assets; (iv) external financial loans disbursed as of September 1, 2019; (v) repayment local notes offerings in dollars; (vi) payment of principal and interest external financial indebtedness; (vii) payments in foreign currency among residents; and (viii) purchase of foreign currency by individuals, entities and non-residents. In addition, the capacity of individuals and companies to exchange Argentine pesos for foreign currencies has been conditioned to prior approval from the Argentine Central Bank. As a consequence, under current Argentine law we are restricted from accessing the official foreign exchange market to make dividend payments to us from our Argentine subsidiaries without prior approval from the Argentine Central Bank.
The foreign exchange restrictions and various other government policies have fanned the return to different exchange rates, both “official” and “parallel” (black market). The official exchange rate is fixed by the Argentine government and it currently and historically diverges widely from the parallel exchange rate. Although initially framed as “temporary,” these foreign exchange restrictions have been extended indefinitely. While we cannot predict future government policies, we believe the foreign exchange restrictions are likely to continue for the foreseeable future.
Brazil
The Central Bank of Brazil allows the real/U.S. dollar exchange rate to float freely and has intervened occasionally to control unstable fluctuations in foreign exchange rates. We cannot predict whether the Central Bank of Brazil or the Brazilian government will continue to let the real float freely or will intervene in the exchange rate market through a currency band system or otherwise.
Prior to March 14, 2005, under Brazilian regulations, foreign exchange transactions were carried out on either the commercial rate exchange market or the floating rate exchange market. Rates in the two markets were generally the same. On March 14, 2005, the National Monetary Council of Brazil (Conselho Monetário Nacional) unified the two markets.
8
Paraguay
The price of the U.S. currency in Paraguay is determined by the interaction between the supply and demand of this currency, and the Central Bank of Paraguay (BCP) has the ability to intervene in order to minimize the effects of potential large variations.
Standing out among foreign exchange income are exports (including border trade mainly with Brazil), foreign direct investment (FDI), remittances from relatives living abroad (in previous periods this impact was more significant). Imports stand out regarding dollar expenditures.
Until 2013, the flow of U.S. dollar income and expenditures was characterized by a large influx (income) of U.S. dollars in the first part of the year due to soybean exports. Currently, due to the various investments made, the influx still exists, but income throughout the year is more balanced.
B. CAPITALIZATION AND INDEBTEDNESS
Not applicable.
C. REASONS FOR THE OFFER AND USE OF PROCEEDS
Not applicable.
D. RISK FACTORS
We are subject to various economic, political, social and competitive conditions. Any of the following risks, if they materialize, could materially and adversely affect our business, results of operations, prospects and financial condition.
Risks Relating to our Company
We rely heavily on our relationship with The Coca-Cola Company, which has substantial influence over our business and operations; and changes in this relationship may adversely affect our business.
The Coca-Cola Company has substantial influence on the conduct of our business. The interests of The Coca-Cola Company may be different from the interests of our other shareholders. 68% and 70% of our net sales for 2018 and 2019, respectively, were derived from the distribution of soft drinks under The Coca-Cola Company trademarks, while 22% and 23% of our net sales for 2018 and 2019, respectively, were derived from the distribution of other beverages also bearing trademarks owned by The Coca-Cola Company. In addition, The Coca-Cola Company currently owns, directly or through its subsidiaries, 14.65% of our Series A shares (representing 7.3% of our total shares) and benefits from certain rights under a shareholders’ agreement. We produce, market and distribute Coca-Cola products through standard bottler agreements between our bottler subsidiaries and The Coca-Cola Company. The Coca-Cola Company has the ability to exert a substantial influence on the business of the Company through its rights under the bottler agreements. According to the bottler agreements, The Coca-Cola Company unilaterally sets the prices for Coca-Cola concentrate that they sell to us. The Coca-Cola Company may in the future increase the price we pay for the concentrate, increasing our costs. The Coca-Cola Company also monitors our prices and has the right to review and approve our marketing, operating and advertising plans. These factors may impact our profit margins, which could adversely affect our net income and results of operations.
Our marketing campaigns for Coca-Cola products are designed and controlled by The Coca-Cola Company. The Coca-Cola Company also makes significant contributions to our marketing expenses, although it is not required to contribute a particular amount. Accordingly, The Coca-Cola Company may discontinue or reduce such contribution at any time. Pursuant to the bottler agreements, we are required to submit a business plan to The Coca-Cola Company for prior approval on a yearly basis. In accordance with our bottler agreements, The Coca-Cola Company may, among other things, require that we demonstrate the financial ability to meet our business plan, and if we are not able to demonstrate our financial capacity, The Coca-Cola Company may terminate our rights to produce, market and distribute Coca-Cola soft drinks or other Coca-Cola beverages in territories where we have such approval. Under these bottler agreements, we are prohibited from producing, bottling, distributing or selling any products that could be substituted for, be confused with or be considered an imitation of soft drinks or other beverages and products under the trademarks of The Coca-Cola Company.
9
We depend on The Coca-Cola Company to renew our bottler agreements, which are subject to termination by The Coca-Cola Company in the event we default or upon expiration of their respective terms. We currently are party to four bottler agreements: one agreement for Chile, which expires in 2023, one agreement for Brazil, which expires in 2022, one agreement for Argentina, which expires in 2022, and one agreement for Paraguay, which expires in September 2020. We cannot provide any assurance that our bottler agreements will be maintained or renewed upon their termination. Even if they are renewed, we cannot provide any assurance that renewal will be granted on the same terms as those currently in effect. Termination, non-extension or non-renewal of any of our bottler agreements would prevent us from selling Coca-Cola trademark beverages in the affected territory, which would have a material adverse effect on our business, financial condition and results of operation.
In addition, any acquisition we make of bottlers of Coca-Cola products in other territories may require, among other things, the consent of The Coca-Cola Company under bottler agreements to which such other bottlers are subject. We cannot assure you that The Coca-Cola Company will consent to any future geographic expansion of our Coca-Cola beverage business.
We cannot assure you that our relationship with The Coca-Cola Company will not deteriorate or otherwise undergo significant changes in the future. If such changes do occur, our operations and financial results and condition could be materially affected.
The beverage business environment is changing rapidly including as a result of epidemic diseases such as the recent outbreak of the COVID-19 pandemic, and increased health and environmental concerns, and if we do not address evolving consumer product and shopping preferences, our business could suffer.
The beverage business environment in our territories is dynamic and constantly evolving rapidly as a result of, among other things, changes in consumer preferences, including changes based on health and nutrition considerations and obesity concerns; shifting consumer preferences and needs; changes in consumer lifestyles; concerns regarding location of origin or source of ingredients and raw materials, and the environmental and sustainability impact of the product manufacturing process; consumer shopping patterns that are changing with the digital revolution; consumer emphasis on transparency related to our products and packaging; and competitive product and pricing pressures. While we have reduced the amounts of sugar in multiple beverages across our portfolio and increased availability of low or no-calorie soft drinks, if we are unable to successfully adapt in this environment, our participation in the sales of beverages and financial results in general would be negatively affected.
Increased concern about the health effects of sugar and other sweeteners in beverages could result in changes to the beverage business.
Consumers, public health officials and government agencies in the majority of our markets, are increasingly concerned with public health consequences associated with obesity, particularly among young people. Additionally, some researchers, health advocates and dietary guidelines are encouraging consumers to reduce consumption of sugar-sweetened beverages and beverages sweetened with nutritive or alternative sweeteners. Increasing public concern about these issues, the possibility of taxes on sugar-sweetened beverages or other sweeteners, additional governmental regulations concerning the marketing, labeling, packaging or sale of our beverages and any negative publicity resulting from actual or threatened legal actions against beverage companies relating to the marketing, labeling or sale of beverages may reduce demand for our products or increase the cost, which could adversely affect our profitability.
Our business is highly competitive, including with respect to price competition, which may adversely affect our net profits and margins.
The beverage business is highly competitive in each of the territories in which we operate. We compete with bottlers of local and regional brands, including low cost beverages and Pepsi products. This competition in each of the regions where we operate is likely to continue, and we cannot assure you that it will not intensify in the future, which could materially and adversely affect our financial condition and results of operations. If we do not continuously strengthen our capabilities in marketing and innovation to maintain our brand loyalty and market share, our business and results of operations could be negatively affected.
If our raw material costs increase, including as a result of U.S. dollar/local currency exchange risk and price volatility, our profitability may be affected.
In addition to water, our most significant raw materials are (1) concentrate, which we acquire from affiliates of The Coca-Cola Company, (2) sweeteners and (3) packaging materials. Our most significant packaging raw material costs arise from the purchase of resin and plastic preforms to make plastic bottles and from the purchase of finished plastic bottles, the prices of which are related to crude oil prices and global resin supply. Prices for concentrate are determined by The Coca-Cola Company and The Coca-Cola Company has unilaterally increased concentrate prices in the past and may do so again in the future. We cannot assure you that The Coca-Cola Company will not increase the price of the concentrate for Coca-Cola trademark beverages or change the manner in which these prices will be calculated in the future. The prices for our remaining raw materials are driven by market prices and local availability, the imposition of import duties and restrictions and fluctuations in exchange rates. We may not be successful in negotiating or implementing measures to mitigate the negative effect that increased raw material costs may have in the pricing of our products or our results.
10
We purchase our raw materials from both domestic and international suppliers, some of which must be approved by The Coca-Cola Company, which may limit the number of suppliers available to us. Because the prices of our main raw materials –except for concentrate– are denominated in U.S. dollars, we are subject to local currency risk with respect to each of our operations. If any of the Chilean peso, Brazilian real, Argentine peso, or Paraguayan guaraní were to depreciate significantly against the U.S. dollar, the cost of certain raw materials in our respective territories could rise significantly, which could have an adverse effect on our financial condition and results of operations. We cannot assure you that these currencies will not lose value against the U.S. dollar in the future. Additionally, some raw material prices are subject to high volatility, which could also have a material adverse effect on our profitability. The supply or cost of specific raw materials could be adversely affected by domestic or global price changes, strikes, weather conditions, taxes, governmental controls or other factors. Any sustained interruption in the supply of these raw materials or any significant increase in their price could have a material adverse effect on our financial performance.
Instability in the supply of utility services and oil prices may adversely impact our results of operations.
Our operations depend on a stable supply of utilities and fuel in the countries where we operate. Electrical power outages could lead to increased energy prices and possible service interruptions. We cannot assure you that in the future we will not experience energy interruptions that could materially and adversely affect our business. In addition, a significant increase in energy prices would raise our costs, which could materially impact our results of operations. Fluctuations in oil prices have adversely affected our cost of energy and transportation in the regions where we operate, and we expect that they will continue to do so in the future. We cannot assure you that fuel prices will not increase in the future, and that such an increase would not have a significant effect on our financial performance.
Water scarcity and poor water quality could adversely impact our production costs and capacity.
Water is the main ingredient in substantially all of our products. It is also a limited resource in many parts of the world, facing unprecedented challenges from overexploitation, increasing pollution and poor management. As demand for water continues to increase around the world, and as the quality of available water deteriorates, we may incur increasing production costs or face capacity constraints that could adversely affect our profitability. We obtain water from various sources in our territories, including springs, wells, rivers and municipal and state water companies pursuant to concessions granted by governments in our various territories. We also anticipate future discussions on new regulations in Chile and other countries where we operate relating to future ownership of water resources, including possible nationalization, and stricter controls on water usage. Water scarcity or changes in governmental regulations aimed at rationing water in the regions where we operate could affect our water supply and therefore our business.
We cannot assure you that water will be available in sufficient quantities to meet our future production needs or will prove sufficient to meet our current water supply needs.
Significant additional labeling or warning requirements may inhibit sales of our products.
The countries in which we operate may adopt significant advertising restrictions as well as additional product labeling or warning requirements relating to the chemical content or perceived adverse health consequences of certain of our Coca-Cola products or other products. The Chilean Congress passed Law No. 20,606 with respect to labeling of certain consumer products, including soft drinks and bottled juices and waters such as ours. The law became effective in June 2016 and its implementation has been carried out in stages, with labeling requirements becoming progressively stricter in June 2018 and June 2019. Given the uncertainty surrounding the interpretation of the law, we may occasionally be subject to costs and penalties associated with non-compliance, which are difficult to predict. These requirements may adversely affect sales of our products and our results of operations.
Our business may be adversely affected if we are unable to maintain brand image and product quality.
Our beverage business is highly dependent on maintaining the reputation of our products in the countries where we operate. If we fail to maintain high standards for product quality, our reputation and ability to remain a distributor of The Coca-Cola Company beverages in the countries where we operate could be jeopardized. Negative publicity or incidents related to our products may reduce their demand and could have a material adverse effect on our financial performance. If any of our products is defective or found to contain contaminants, or causes injury or illness, we may be subject to legal claims filed by consumers, product recalls, business interruptions and/or other liabilities.
We take significant precautions in order to minimize any risk of defects or contamination in our products. These precautions include quality-control programs for raw materials, the production process and our final products. We also have established procedures to correct as soon as practicable any problems that are detected. However, the precautions and procedures we implement may not be sufficient to protect us from potential incidents.
11
Trademark infringement could adversely impact our beverage business.
A significant portion of our sales derives from sales of beverages branded with trademarks of The Coca-Cola Company, as well as other trademarks. If other parties attempt to misappropriate trademarks we use, we may be unable to protect these trademarks. The maintenance of the reputation of these brands is essential for the future success of our beverage business. Misappropriation of trademarks we use, or challenges thereto, could have a material adverse effect on our financial performance.
We may not be able to successfully implement our expansion strategies or achieve the expected operational efficiencies or synergies from potential acquisitions.
We have, and we may continue to, acquire businesses and pursue other strategic transactions as part of our expansion strategies. We cannot assure you that we will be successful in identifying opportunities and consummating acquisitions and other strategic transactions on favorable terms or at all. These types of transactions may involve additional risks to our Company, including operating in geographic regions or with beverage categories in which we have less or no operating history. Depending on the size and timing of an acquisition or transaction, we may be required to raise future financing to consummate the acquisition or transaction. Moreover, even if we are able to consummate a transaction, acquisitions and other strategic opportunities may involve significant risks and uncertainties.
Key elements to achieving the benefits and expected synergies of our acquisitions are the integration of acquired businesses’ operations into our own in a timely and effective manner and the retention of qualified and experienced key personnel. We may incur in unforeseen liabilities in connection with acquiring, taking control of, or managing beverage operations and other businesses and may encounter difficulties and unforeseen or additional costs in restructuring and integrating them into our operating structure. These difficulties include distraction of management from current operations, difficulties in integration with our existing business and technology, greater than expected liabilities and expenses, inadequate return on capital, and unidentified issues not discovered in our pre-acquisition investigations and evaluations of those strategies and acquisitions. We cannot assure you that these efforts will be successful or completed as expected by us, and our business, financial condition, results of operations could be adversely affected if we are unable to do so.
Weather conditions or natural disasters may adversely affect our business.
Lower temperatures and higher rainfall may negatively impact consumer patterns, which may result in lower per capita consumption of our beverages. Additionally, adverse weather conditions or natural disasters may affect road infrastructure in the countries in which we operate and limit our ability to sell and distribute our products. For example, in February of 2010 our business experienced a temporary interruption in our production as a result of the 8.8 magnitude earthquake in central Chile; and in March 2015, flash floods in the north of Chile interrupted our production and distribution in such territory.
Our business is subject to risks arising from the ongoing COVID-19 pandemic.
The recent outbreak of the Novel Coronavirus 2019 (COVID-19), which has been declared by the World Health Organization to be a “public health emergency of international concern”, has spread across most of the world. Countries around the world have adopted extraordinary measures to contain the spread of COVID-19, including imposing travel restrictions and bans, closing borders, establishing restrictions on public gatherings, instructing residents to practice social distancing, requiring closures of non-essential businesses, issuing stay-at-home advisories and orders, implementing quarantines and similar actions. The impact to date of the COVID-19 pandemic on global economic conditions has significantly increased economic uncertainty and is likely to cause a global recession. We cannot predict how long the COVID-19 pandemic will continue or how long current or future governments’ restrictions will remain in place. Furthermore, even if the initial outbreaks of COVID-19 subside, we cannot predict whether subsequent outbreaks will reoccur, or whether governments will implement longer-term measures that continue to affect industries.
Given uncertainties regarding the impact of the COVID-19 pandemic, we cannot predict accurately the extent to which the COVID-19 outbreak could affect our business and results of operations. COVID-19 poses the risk that we or our employees, contractors, suppliers and other partners may be limited or prevented from conducting business activities for an indefinite period of time, including due to shutdowns that may be requested or mandated by governmental authorities. While our operations have not been materially disrupted to date, the COVID-19 pandemic and government measures taken to contain the spread of the virus could disrupt our supply chain and the manufacture or shipment of our products, and adversely impact our business or results of operations. Additionally, the COVID-19 pandemic and government measures have disrupted certain of our sales channels, in particular as a result of the temporary mandatory closing of restaurants and bars and prohibition on social gathering events, which adversely affects our sales volumes to these channels. We cannot predict how much of an impact the COVID-19 pandemic and government measures will ultimately have on these sales channels, including whether many channels will be able to resume their operations after the virus is contained. Nor can we predict how much or for how long consumer spending patterns may change as a result of these developments.
12
The COVID-19 pandemic and government measures could in the future adversely affect our business and results of operations, potentially materially. In addition, an outbreak of other epidemics in the future, such as the bird flu, influenza, SARS, the Ebola virus and the Zika virus, could also result in a similar impact.
Our insurance coverage may not adequately cover losses resulting from the risks for which we are insured.
We maintain insurance for our principal facilities and other assets. Our insurance coverage protects us in the event we suffer certain losses resulting from fire, terrorism and natural disasters, such as earthquake and floods, or from business interruptions caused by such events. In addition, we maintain other insurance policies for general liability and product contamination. We cannot assure you that our insurance coverage will be sufficient or will provide adequate compensation for losses that we may incur.
If we are unable to protect our information systems against data corruption, cyber-based attacks or network security breaches, our operations could be disrupted.
We are increasingly dependent on information technology networks and systems, including over the Internet, to process, transmit and store electronic information. In particular, we depend on our information technology infrastructure for digital marketing activities and electronic communications among us and our clients, suppliers and also among our subsidiaries and facilities. Security breaches or infrastructure flaws can create system disruptions, shutdowns or unauthorized disclosure of confidential information. If we are unable to prevent such breaches or flaws, our operations could be disrupted, or we may suffer financial damage or loss because of lost or misappropriated information.
Cyber threats are rapidly evolving and the means for obtaining access to information in digital and other storage media are becoming increasingly sophisticated. Cyber threats and cyber-attackers can be sponsored by countries or sophisticated criminal organizations or be the work of single “hackers” or small groups of “hackers”.
We are in the process of analyzing the adequacy of our information technology systems and installing new and upgrading existing information technology systems in order to achieve industry standard levels of protection for the Company’s data and business processes against risk of data security breach and cyber-attack. We are working to strengthen the integrity of our data network and expect this process to continue over the coming years. Insider or employee cyber and security threats are increasingly a concern for all companies, including ours. Nevertheless, as cyber threats evolve, change and become more difficult to detect and successfully defend against, one or more cyber-attacks might defeat our or a third-party service provider’s security measures in the future and obtain the personal information of customers or employees. Employee error or other irregularities may also defeat of security measures and result in a breach of information systems. Moreover, hardware, software or applications we use may have inherent defects of design, manufacture or operations or could be inadvertently or intentionally implemented or used in a manner that could compromise information security. A security breach and loss of information may not be discovered for a significant period of time after it occurs. While we have no knowledge of a material security breach to date, any compromise of data security could result in a violation of applicable privacy and other laws or standards, the loss of valuable business data, or a disruption of our business. A security breach involving the misappropriation, loss or other unauthorized disclosure of sensitive or confidential information could give rise to unwanted media attention, materially damage our customer relationships and reputation, and result in fines or liabilities, which may not be covered by our insurance policies.
Perception of risk in emerging economies may impede our access to international capital markets, hinder our ability to finance our operations and adversely affect our financial performance.
International investors, as a general rule, consider the countries in which we operate to be emerging market economies. Consequently, economic conditions and the market for securities of emerging market countries influence investors’ perceptions of Chile, Brazil, Argentina and Paraguay and their evaluation of securities of companies located in these countries.
During periods of heightened investor concern regarding emerging market economies, in particular in recent years Argentina, the countries where we operate may experience significant outflows of U.S. dollars.
In addition, during these periods companies based in the countries where we operate have faced higher costs for raising funds, both domestically and abroad, as well as limited access to international capital markets, which have negatively affected the prices of the aforementioned countries’ securities. Although economic conditions are different in each of the emerging-market countries, investors’ reactions to developments in one of these countries may affect the securities of issuers in the others. For example, adverse developments in emerging market countries may lead to decreased investor interest in the securities of Chilean companies.
13
Our business may be adversely affected if we fail to renew collective bargaining labor agreements on satisfactory terms or experience strikes or other labor unrest.
A substantial portion of our employees is covered by collective bargaining labor agreements. These agreements generally expire every year. Our inability to renegotiate these agreements on satisfactory terms could cause work stoppages and interruptions, which may adversely impact our operations. Changes to the terms and conditions of existing agreements could also increase our costs or otherwise have an adverse effect on our operational efficiency. We experience periodic strikes and other forms of labor unrest through the ordinary course of business. We cannot assure you labor interruptions or other labor unrest will not occur in the future. If we experience strikes, work stoppages or other forms of labor unrest at any of our production facilities, our ability to supply beverages to customers could be impaired, which would reduce our net operating revenues and could expose us to customer claims.
Our business is subject to extensive regulation, which is complex and subject to change.
We are subject to local regulations in each of the territories in which we operate. The main areas of regulation are water, environment, labor, taxation, health, consumer protection, advertising and antitrust. Regulation could affect our ability to set prices for our products. The adoption of new laws or regulations or a stricter interpretation or enforcement thereof in the countries in which we operate may increase our operating costs or impose restrictions on our operations which, in turn, may adversely affect our financial condition, business and results. Further changes in current regulations may result in increased compliance costs, which may have an adverse effect on our results or financial condition.
In the past, voluntary price restraints or statutory price controls have been imposed in several of the countries in which we operate. Currently there are no restraints or price controls applicable to our products in any of the territories in which we operate, except with respect to a limited number of products in Argentina. However, we cannot assure you that government authorities in any country in which we operate will not impose statutory price controls, or that we will not be requested to impose voluntary price restraints in the future. The potential imposition of restraints or price controls in the future may have an adverse effect on our results and financial condition.
Our business is subject to increasing environmental regulation, which may result in increases in our operating costs or adverse changes in consumer demand.
We are subject to various environmental laws and regulations in the countries where we operate, which apply to our products, containers and activities. If these environmental laws and regulations are strengthened or newly established in jurisdictions in which we conduct our businesses, we may be required to incur considerable expenses in order to comply with such laws and regulations. We are also subject to uncertainty regarding the interpretation of the environmental laws and regulations of the countries in which we operate, and any ambiguity or uncertainty regarding the interpretation or application of regulations can result in increased production costs or penalties for non-compliance, which are difficult to predict. Such increased expenses may have a material adverse effect on our results of operations and financial position. To the extent we determine that it is not financially sound for us to continue to comply with such laws and regulations, we may have to curtail or discontinue our activities in the affected business areas.
In addition, concerns over the environmental impact of plastic may reduce the consumption of our products sold in plastic bottles or result in additional taxes that could adversely affect consumer demand. In 2019 alone, three bills seeking to restrict the production and sale of single-use plastics in Chile were introduced for consideration by the Chilean Congress. Currently, we cannot predict whether these laws will pass. While the legislative process is still in its early stages, if enacted, these bills may have an adverse effect on our results of operations.
If we were to become subject to adverse judgments or determinations in legal proceedings to which we are, or may become, a party, our future profitability could suffer through significant liabilities, a reduction of sales, increased costs or damage to our reputation.
In the ordinary course of our business, we become involved in various claims, lawsuits, investigations and governmental and administrative proceedings, some of which are or may be significant. We are currently a party to certain legal proceedings. Adverse judgments or determinations in one or more of these proceedings could require us to change the way we do business or use substantial resources in adhering to the settlements. These could have a material adverse effect on our business, including, among other consequences, by significantly increasing the costs required to operate our business. Ineffective communications during or after these proceedings could amplify the negative effects, if any, of these proceedings on our reputation and may result in a negative market impact on the price of our securities. We evaluate these litigation claims and legal proceedings to assess the likelihood of unfavorable outcomes and to estimate, if possible, the amount of potential losses. Based on these assessments and estimates, we establish reserves and/or disclose the relevant litigation claims or legal proceedings, as appropriate. These assessments and estimates are based on the information available to management at the time and involve a significant amount of management judgment. Actual outcomes or losses may differ materially from our current assessments and estimates.
14
In addition, during recent years, the Company has been subject to judicial proceedings and administrative investigations associated with alleged monopolistic practices. In December 2019, the Chilean Supreme Court overturned a dismissal by the Chilean Antitrust Court of an antitrust complaint filed against us and remanded the case to the Antitrust Court for a full decision on the merits. We believe the likelihood of loss remains low. Although these proceedings and investigations have not resulted in any convictions or penalties for the Company, we cannot assure that this will not occur in the future. Antitrust complaints may be submitted in Chile without any prior admissibility test and, as a result, we cannot predict whether unsubstantiated claims against us will be filed. Possible sanctions in matters of competition could have an adverse effect on our business.
The countries in which we operate may adopt new tax laws or modify existing laws to increase taxes applicable to our business or reduce existing tax incentives.
We cannot assure you that any governmental authority in any country where we operate will not impose new taxes or increase the taxes on our products in the future. The imposition of new taxes, the increases in taxes or the reduction of tax incentives may have a material adverse effect on our business, financial condition and results.
For example, in Chile on September 29, 2014 Law No. 20,780 was enacted which was subsequently amended by Law No. 20,899, on February 8, 2016 (the “Tax Reform”). The Tax Reform introduced a new tax regime for corporations, the Semi-Integrated Regime established in article 14(B) of the Chilean Income Law, increasing the tax burden, among other changes.
In Argentina in December 2017, a tax reform was passed, which came into force in 2018. The most important consequence for the Company is the reduction in the previous income tax rate from 35% to 30% for the fiscal years 2018 and 2019 and from 2020 onwards the rate decreases to 25%. However, this reduction is only available when profits are reinvested. In addition, a tax of 7% must be paid at the time of distribution of dividends for the first two years and 13% from 2020 onwards. However, as of the date of this annual report, the Argentine government had suspended the corporate income tax rate decrease previously contemplated for fiscal year 2020. As a result, the corporate income tax rate will remain at 30% and the income tax rate on dividends will remain at 7%. In relation to gross income tax, in 2019 there was a 0.5% average reduction in the gross income tax rate for industry activity in provinces of Argentina where Andina has no productive plants, while the 0.5% reduction planned for 2020 has been suspended. Municipal rates in 2019 and so far as of the date of this annual report, remain unchanged, with few insignificant exceptions.
Andina enjoys the benefit of a zero-tax rate on gross income in the province of Córdoba, Argentina, until the year 2021 under an industrial promotion. For further information, see also “Risks Relating to Brazil – Changes in tax laws may increase our tax burden and reduce tax incentives, and as a result negatively affect our profitability.”
Brazilian tax proceedings may result in a significant tax liability.
Our subsidiary Rio de Janeiro Refrescos Ltda. is party in several tax proceedings in which the Brazilian federal tax authorities argue the alleged existence of liabilities associated with value added tax on industrialized products for an approximate total amount of R$ 2 billion (equivalent to approximately US$488 million). These proceedings are at different administrative as well as judicial procedural stages. We disagree with the Brazilian tax authorities’ position and believe that Rio de Janeiro Refrescos Ltda. is entitled to claim Imposto sobre Productos Industrializados (IPI) tax credits in connection with its purchases of certain exempt raw materials from suppliers located in the Manaus Free Trade Zone. We believe that the Brazilian tax authorities’ claims are without merit. Our external Brazilian counsel has advised us that it believes that Rio de Janeiro Refrescos Ltda.’s likelihood of loss in most of these proceedings is classified as possible to remote (i.e., approximately 30%). Despite the foregoing, the outcome of these claims is subject to uncertainty, and it is difficult to predict their final resolution or any other negative repercussions from this dispute with the Brazilian tax authorities to The Coca-Cola Company or its bottling companies in Brazil, including our Brazilian subsidiaries.
The termination of the Heineken product distribution agreement in Brazil and our potential inability to secure a substitute supplier could adversely affect our profitability.
In July 2017 Heineken Brazil unilaterally notified us of the termination of the agreement by virtue of which Rio de Janeiro Refrescos Ltda. commercializes and distributes Heineken-branded beers in Brazil. Rio de Janeiro Refrescos Ltda. understood that the expiration of the agreement was scheduled for 2022 and we submitted the dispute to arbitration. In October 2019, a non-appealable decision was rendered in our favor.
We continue distributing Heineken-branded products in Brazil and expect to do so until the termination of the agreement in March 2022. However, if following the termination of the agreement we are unable to secure a substitute supplier of beer in Brazil, our business and results of operations may be adversely affected. Heineken-branded products represent 21.7% of our consolidated net sales in Brazil during 2019.
15
If we do not successfully comply with laws and regulations designed to combat corruption in countries in which we sell our products, we could become subject to fines, penalties or other regulatory sanctions, and our sales and profitability could suffer.
Although we are committed to conducting business in a legal and ethical manner in compliance with local and international statutory requirements and standards applicable to our business, there is a risk that our employees or representatives may take actions that violate applicable laws and regulations that generally prohibit the making of improper payments to foreign government officials for the purpose of obtaining or keeping business, including laws relating to the 1997 OECD Convention on Combating Bribery of Foreign Public Officials in International Business Transactions or the U.S. Foreign Corrupt Practices Act.
We may not be able to recruit or retain key personnel.
The implementation of our strategic business plans could be undermined by a failure to recruit or retain key personnel or the unexpected loss of senior employees, including in acquired companies. We face various challenges inherent in the management of a large number of employees over diverse geographical regions. Key employees may choose to leave their employment for a variety of reasons, including reasons beyond our control. The impact of the departure of key employees cannot be determined and may depend on, among other things, our ability to recruit other individuals of similar experience and skill. It is not certain that we will be able to attract or retain key employees and successfully manage them, which could disrupt our business and have an unfavorable material effect on our financial position, income from operations and competitive position.
A devaluation of the currencies of the countries where we have our operations, with regard to the Chilean peso, can negatively affect the results reported by the Company in Chilean pesos.
The Company reports its results in Chilean pesos, while a large part of its revenues and Adjusted EBITDA comes from countries that use other currencies. During 2018 and 2019, 32% and 35% of the Company’s net sales were generated in Brazil, 25% and 22% in Argentina, and 9% and 9% in Paraguay, while 33% and 34% of Adjusted EBITDA was generated in Brazil, 19% and 16% in Argentina, and 12% and 12% in Paraguay, respectively. If the currencies of these countries depreciate against the Chilean peso, this would have a negative effect on the results and financial condition of the Company, which are reported in Chilean pesos.
The imposition of exchange controls could restrict the entry and exit of funds to and from the countries in which we operate, which could significantly limit our financial capacity.
The imposition of exchange controls in the countries in which we operate could affect our ability to repatriate profits, which could significantly limit our ability to pay dividends to our shareholders. Additionally, it may limit the ability of our foreign subsidiaries to finance payments of U.S. dollar denominated liabilities required by foreign creditors.
Negative information on social media and similar platforms could adversely affect our reputation.
Negative or inaccurate information concerning us or The Coca-Cola trademarks may be posted on social media and similar platforms of Internet-based communications at any time. This information may affect our reputation, and adversely impact our business and results of operations.
Risks Relating to Chile
Our growth and profitability depend to a significant degree on economic conditions in Chile.
Our operations in Chile represented 39.4% and 37.7% of our assets as of December 31, 2018 and December 31, 2019, respectively, and 34.1% and 34.2% of our net sales for 2018 and 2019, respectively. Accordingly, our business, financial condition, and results of operations depend, to a considerable extent, upon economic conditions in Chile.
International and local economic conditions may adversely affect the Chilean economy, and unfavorable general economic conditions could negatively affect the affordability of and demand for some of our products in the country. In difficult economic conditions, consumers may seek to reduce discretionary spending by forgoing purchases of our products or buying low cost brands offered by competitors. Any of these events could have an adverse effect on our business, financial condition and results of operations.
16
According to data published by the Central Bank, the Chilean economy grew at a rate of 2.3% in 2015, 1.3% in 2016, 1.5% in 2017, 4.0% in 2018 and 1.1% in 2019. Our financial condition and results of operations could also be adversely affected by changes over which we have no control, including, without limitation:
| · | political or economic developments in or affecting Chile; |
| · | the economic or other policies of the Chilean government, which has a substantial influence over many aspects of the private sector; |
| · | tax rates and policies; |
| · | regulatory changes or administrative practices of Chilean authorities; |
| · | inflation and governmental policies to combat inflation; |
| · | currency exchange movements; and |
| · | global and regional economic conditions. |
We cannot assure you that the future development of the Chilean economy will not impair our ability to successfully carry out our business plan or materially adversely affect our business, financial condition or results of operations.
Civil unrest in Chile could have a material adverse effect on general economic conditions in Chile and our business, results of operations and financial condition.
Beginning on October 18, 2019, widespread protests have taken place in Chile. The protests began over the government’s announcement of an increase in subway fares in Santiago and quickly grew into broader unrest over economic inequality, including claims about transportation costs, funding for education, health care costs and pension amounts, among others. Demonstrations spread across the country and resulted in violent, and sometimes deadly acts, causing significant damage to subway stations in Santiago, shops, houses and other public and private property. The Chilean government imposed a state of emergency and nighttime curfews in Santiago and other cities; however, protests and violence continued. Additionally, the Chilean government announced a reshuffling of the cabinet and a series of social and economic reforms to tackle issues at the heart of the unrest, including cancellation of the increased subway fares, increases in government-subsidized pension, a guaranteed minimum monthly income, affordable medical insurance, lowering the price of medicine and a cancellation of energy price hikes. Chile’s Congress also reached an agreement to reform the country’s constitution. Following an agreement between Chilean political parties, a nationwide plebiscite has now been set for October 25, 2020, to ask Chileans if they want a new constitution and, if so, how the new constitution should be drafted.
We cannot predict the extent to which the Chilean economy will be affected by the civil unrest, nor can we predict if government policies enacted as a response to the civil unrest will have a negative impact on the Chilean economy. Changes in government policies may include higher tax rates and other changes in laws and policies that could result in a less favorable environment for private businesses. Despite looting and vandalism at our distribution center in Puente Alto, our operations have not been affected in any material respect to date. We cannot assure you that looting and vandalism will not affect our production and logistics infrastructure in the future. Also, if the protests continue or worsen, future government policies to preempt, or in response to unrest, may materially affect the Chilean economy, and thereby our business, financial condition and results of operation.
The Chilean peso is subject to depreciation and volatility, which could adversely affect our business.
The Chilean peso has been subject to large nominal devaluations in the past and may be subject to significant fluctuations in the future. The main drivers of exchange rate volatility in past years were the significant fluctuations of commodity prices, as well as general uncertainty and trade imbalances in the global markets. The Chilean peso depreciated 17% during 2015, appreciated 6% and 8% during 2016 and 2017, respectively, and depreciated 13% and 8% during 2018 and 2019, respectively, compared to the closing exchange rate as of the end of the prior period for the U.S. dollar in nominal terms.
A significant part of the raw materials used by the Company are in U.S. dollars, therefore a devaluation of the Chilean peso against the U.S. dollar can affect our costs and margins in a significant way.
In addition, as we report our results of operations in Chilean pesos, fluctuations in the value of the Chilean peso versus the Brazilian real, the Argentine peso and the Paraguayan guaraní could also impact our reported performance in Chilean pesos.
17
Inflation in Chile and government measures to curb inflation may disrupt our business and have an adverse effect on our financial condition and results of operations.
Although Chilean inflation has decreased in recent years, Chile has experienced significant levels of inflation in the past. The rates of inflation in Chile, which in, 2015, 2016, 2017, 2018 and 2019 were, 4.4%, 2.7%, 2.3%, 2.6% and 3.0%, respectively, as measured by changes in the consumer price index and as reported by the Chilean National Institute of Statistics, could adversely affect the Chilean economy and have a material adverse effect on our financial condition and results of operations if we are unable to increase our prices in line with inflation. We cannot assure you that Chilean inflation will not increase in the future.
The measures taken by the Central Bank in the past to control inflation have often included maintaining a conservative monetary policy with high interest rates, thereby restricting the availability of credit and economic growth. Inflation, measures to combat inflation, and public speculation about possible additional actions by the government have also contributed in the past to economic uncertainty in Chile and to heightened volatility in its securities markets. Periods of higher inflation may also slow the growth rate of the Chilean economy, which could lead to reduced demand for our products and decreased sales. Inflation is also likely to increase some of our costs and expenses, given that the majority of our supply contracts in Chile are UF-denominated or are indexed to the Chilean consumer price index. We cannot assure you that, under competitive pressure, we will be able to carry out price increases, which could adversely impact our operating margins and operating income. Additionally, an important part of our financial debt in Chile is UF-denominated, and therefore the value of the debt reflects any increase of the inflation in Chile.
A severe earthquake or tsunami in Chile could adversely affect the Chilean economy and our network infrastructure.
Chile lies on the Nazca tectonic plate, one of the world’s most seismically active regions. Chile has been adversely affected by powerful earthquakes in the past, including an 8.0 magnitude earthquake that struck Santiago in 1985 and a 9.5 magnitude earthquake in 1960 which is the largest earthquake ever recorded.
In February 2010, an 8.8 magnitude earthquake struck the central and south-central regions of Chile. The quake epicenter was located 200 miles southwest of Santiago and 70 miles north of Concepción, Chile’s second largest city. The regions of Bío Bío and Maule were the most severely affected regions, especially the coastal area, which, shortly after the earthquake, was hit by a tsunami that significantly damaged cities and port facilities. The Valparaíso and Metropolitan regions were also severely affected. At least 1.5 million homes were damaged, and more than 500 people were killed. As a result of these developments, economic activity in Chile was adversely affected in March 2010. Legislation was passed to raise the corporate income tax rate in order to pay for reconstruction following the earthquake and tsunami, which had an adverse effect on our results.
A severe earthquake and/or tsunami in Chile in the future could have an adverse impact on the Chilean economy and on our business, financial condition and results of operation, including our production and logistics network.
Risks Relating to Brazil
Our business operations in Brazil are dependent on economic conditions in Brazil.
Our operations in Brazil represented 36.8% and 40.1% of our assets as of December 31, 2018 and December 31, 2019, respectively, and 32.3% and 34.8% of our net sales for 2018 and 2019, respectively. Because demand for soft drinks and beverage products is usually correlated to economic conditions prevailing in the relevant local market, developments in economic conditions in Brazil, and measures taken by the Brazilian government, have had and are expected to continue to have an impact on our business, results of operations and financial condition.
The Brazilian economy has historically been characterized by unstable economic cycles and interventions by the Brazilian government. Brazilian GDP contracted by 3.5% and 3.3% in 2015 and 2016, respectively, grew by 1.1%, 1.3% and 1.2% in 2017, 2018 and 2019, respectively, according to the Brazilian Institute of Geography and Statistics (Instituto Brasileiro de Geografia e Estatistica). The Brazilian government has often changed monetary, taxation and other policies to influence the course of Brazil’s economy. Our business, results of operations and financial condition may be adversely affected by, among others, the following factors:
18
| · | expansion or contraction of the Brazilian economy; |
| · | exchange rate fluctuations; |
| · | high inflation rates; |
| · | changes in fiscal or tax policies; |
| · | changes in monetary policy, including an increase in interest rates; |
| · | exchange control policies and restrictions on remittances abroad; |
| · | investment levels; |
| · | liquidity of domestic capital and credit markets; |
| · | employment levels and labor and social security regulations; |
| · | energy or water shortages or rationalization; |
| · | changes in environmental regulation; |
| · | social and political instability; and |
| · | other developments in or affecting Brazil. |
The Brazilian economy is also affected by international economic and market conditions in general, especially economic and market conditions in the United States, the European Union and China.
Historically volatile political, social and economic conditions in Brazil could adversely affect our business and results of operations.
Brazil’s political environment has historically influenced, and continues to influence, the performance of the country’s economy. Political crisis have affected and continue to affect the confidence of investors and the general public, which have historically resulted in economic deceleration.
Economic instability in Brazil has contributed to a decline in market confidence in the Brazilian economy as well as to a deteriorating political environment. In addition, various ongoing investigations into allegations of money laundering and corruption being conducted by the Office of the Brazilian Federal Prosecutor, including the largest such investigation, known as “Operação Lava Jato,” have negatively impacted the Brazilian economy and political environment. The potential outcome of these investigations is uncertain, but they have already had an adverse impact on the image and reputation of the implicated companies, and on the general market perception of the Brazilian economy. We cannot predict whether the ongoing investigations will result in further political and economic instability, or if new allegations against government officials and/or executives of private companies will arise in the future.
Jair Bolsonaro was elected as the President of Brazil in October 2018. His election led to a market recovery and the recovery of the value of the local stock market. However, we cannot assure that this confidence in the market will remain, nor that the policies promoted by the new government will be beneficial to the economy or our business. A failure by the Brazilian government to implement necessary reforms may result in diminished confidence in the Brazilian government’s fiscal condition and budget, which could result in downgrades of Brazil’s sovereign foreign credit rating by credit rating agencies, negatively impact Brazil’s economy, lead to further depreciation of the real and an increase in inflation and interest rates, adversely affecting our business, financial condition and results of operations.
Inflation and the Brazilian government’s measures to curb inflation, including by increasing interest rates, may contribute to economic uncertainty in Brazil.
Brazil has historically experienced high rates of inflation, including periods of hyperinflation before 1995. Several measures have been implemented by the Brazilian government in an effort to curb rising inflation, but we cannot predict whether these policies will be effective. According to the National Consumer Price Index (Índice Nacional de Preços ao Consumidor Amplo, or “IPCA”), published by the Brazilian Institute of Geography and Statistics (Instituto Brasileiro de Geografia e Estatística, “IBGE”), Brazilian annual rates of inflation for consumer prices were 10.7% in 2015, 6.3% in 2016, 2.9% in 2017, 3.7% in 2018 and 4.1% in 2019.
Inflationary pressures may result in governmental interventions in the economy, including policies that could adversely affect the general performance of the Brazilian economy, which, in turn, could adversely affect our business operations in Brazil. Inflation may also increase our costs and expenses, and we may be unable to transfer such costs to our customers, reducing our profit margins and net income. In addition, inflation could also affect us indirectly, as our customers may also be affected and have their financial capacity reduced. Any decrease in our net sales or net income, as well as any reduction in our financial performance, may also result in a reduction in our net operating margin. Our customers and suppliers may be affected by high inflation rates and such effects on our customers and suppliers may adversely affect us.
19
The Brazilian real is subject to depreciation and volatility, which could adversely affect our business, financial condition and results of operations.
The Brazilian currency has been subject to significant fluctuations over the past three decades. Throughout this period, the Brazilian government has implemented various economic plans and exchange rate policies, including sudden devaluations, periodic mini devaluations (during which the frequency of adjustments has ranged from daily to monthly), exchange controls, dual exchange market and floating exchange rate systems. Although long-term devaluation of the real is generally related to the rate of inflation in Brazil, the devaluation of the real over shorter periods has resulted in significant fluctuations in the exchange rate between the Brazilian currency, the U.S. dollar and other currencies. The Brazilian real depreciated 47% during 2015, appreciated 17% during 2016 and depreciated 2%, 17%, and 4% during 2017, 2018 and 2019, respectively, compared to the closing exchange rate as of the end of the prior period for the U.S. dollar in nominal terms.
A significant part of the raw materials we use in Brazil are priced in U.S. dollars, so a depreciation of the Brazilian real against the U.S. dollar has a significant adverse effect in our costs and margins.
Any depreciation of the real against the U.S. dollar could create additional inflationary pressure, which might result in the Brazilian government adopting restrictive policies to combat inflation. This could lead to increases in interest rates, which might negatively affect the Brazilian economy as a whole, as well as our results of operations, in addition to restricting our access to international financial markets. It also reduces the U.S. dollar value of our revenues. On the other hand, future appreciation of the real against the U.S. dollar might result in the deterioration of Brazil’s current and capital accounts, as well as a weakening of Brazilian GDP growth derived from exports. We cannot assure you that the real will not again fluctuate significantly against the U.S. dollar in the future and, as a result, have an adverse effect on our business, results of operations and financial condition.
Changes in tax laws may increase our tax burden and reduce tax incentives and, as a result, negatively affect our profitability.
The Brazilian government regularly implements changes to tax regimes that may increase our and our customers’ tax burdens. These changes include modifications in the tax rates and, on occasion, enactment of temporary taxes, the proceeds of which are earmarked for designated governmental purposes. In the past, the Brazilian government has presented certain tax reform proposals, which have been mainly designed to simplify the Brazilian tax system, to avoid internal disputes within and between the Brazilian states and municipalities, and to redistribute tax revenues. The tax reform proposals provide for changes in the rules governing the federal Social Integration Program (Programa de Integração Social, or “PIS”) and Social Security Contribution (Contribuição para o Financiamento da Seguridade Social, or “COFINS”) taxes, the state Tax on the Circulation of Goods and Services (Imposto Sobre a Circulação de Mercadorias e Serviços, or “ICMS”) and some other taxes, such as increases in payroll taxes. These proposals may not be approved and passed into law. The effects of these proposed tax reform measures and any other changes that result from enactment of additional tax reforms have not been, and cannot be, quantified. However, some of these measures, if enacted, may result in increases in our overall tax burden, which could negatively affect our overall financial performance. In addition, the Brazilian beverage industry experiences unfair competition arising from tax evasion, which is primarily due to the high level of taxes on beverage products in Brazil. An increase in taxes may lead to an increase in tax evasion, which could result in unfair pricing practices in the industry.
Since 2018, the Brazilian government has gradually altered the value-added tax on industrialized products (Imposto sobre Produtos Industrializados or “IPI”) applicable to soft drinks concentrate. This measure has negatively affected our operations, since it significantly reduced the tax credit derived from the purchases of concentrate from the Manaus Free Trade Zone that currently benefits Rio de Janeiro Refrescos, and the soft drinks industry as a whole. Such alterations have been implemented gradually, as follows: (1) 20% IPI rate until September 2018; (2) 4% IPI rate from October to December 2018; (3) 12% IPI rate in the first half of 2019; (4) 8% IPI rate from July 1, 2019 to September 30, 2019; (5) 10% IPI rate from October 1, 2019 to December 31, 2019; (6) 4% IPI rate from January 1, 2020 to May 31, 2020; (7) 8% IPI rate from June 1, 2020 to November 30, 2020; and (8) 4% IPI rate from December 1, 2020 onwards. Any further reductions of the IPI may adversely affect our financial condition and results of operations.
Given the high tax burden in Brazil, federal and state authorities of that country offer a series of significant tax incentives to certain territories and/or localities in order to attract investment, particularly for manufacturers and other companies operating and investing in Brazil. Coca-Cola Andina Brazil has received some of these tax incentives and its results have been positively affected by these incentives. Although these incentives have generally been renewed in the past, we cannot assure that they will continue to be renewed in the future. Current tax incentives from the State of Rio de Janeiro in connection with the development and construction of the Duque de Caxias production plant are due to expire in October 2020 and may not be renewed. Termination, non-extension or non-renewal of tax incentives could have a material adverse effect on our business, financial condition and results of operation.
20
Risks Relating to Argentina
Our business operations in Argentina are dependent on economic conditions in Argentina.
Our operations in Argentina represented 10.9% and 10.1% of our assets as of December 31, 2018 and December 31, 2019, respectively, and 24.7% and 22.2% of our net sales for 2018 and 2019, respectively. Developments in economic, political, regulatory and social conditions in Argentina, and measures taken by the Argentine government, have had and are expected to continue to have an impact on our business, results of operations and financial condition.
Historically, the Argentine economy has experienced periods of high levels of instability and volatility, low or negative economic growth and high and variable inflation and devaluation levels. According to the National Statistics and Census Institute (Instituto Nacional de Estadísticas y Censos, or “INDEC”), Argentine GDP grew in real terms 2.6% in 2015, contracted by 2.1% in 2016, grew by 2.7% in 2017 and contracted by 2.5% and 2.2% in 2018 and 2019, respectively.
Argentine economic conditions are dependent on a variety of factors, including the following:
| · | domestic production, international demand and prices for Argentina’s principal commodity exports; |
| · | the competitiveness and efficiency of domestic industries and services; |
| · | the stability and competitiveness of the Argentine peso against foreign currencies; |
| · | the rate of inflation; |
| · | the government’s fiscal deficits; |
| · | the government’s public debt levels; |
| · | foreign and domestic investment and financing; and |
| · | governmental policies and the legal and regulatory environment. |
Government policies and regulation—which at times have been implemented through informal measures and have been subject to radical shifts—that have had a significant impact on the Argentine economy in the past have included, among others: monetary policy, including exchange controls, capital controls, high interest rates and a variety of measures to curb inflation, restrictions on exports and imports, price controls, mandatory wage increases, taxation and government intervention in the private sector.
We cannot assure you that the future development of the Argentine economy will not impair our ability to successfully carry out our business plan or materially adversely affect our business, financial condition or results of operations.
Political and economic instability in Argentina may recur, which could have a material adverse effect on our Argentine operations and on our financial condition and results of operations.
Argentina has a history of political and economic instability that often results in abrupt changes in government policies. Argentine governments have pursued different, and often contradictory, policies to those of preceding administrations. In recent decades, succeeding administrations have implemented interventionist policies, which included nationalization, debt renegotiation, price controls, and exchange restrictions, as well as market-friendly policies, such as export tax reductions, elimination of currency controls, deregulation of utility prices, negotiation of free trade agreements and implementation of pro-investor initiatives.
In October 2019, Argentine presidential, legislative and certain provincial and municipal governments elections were held and Alberto Fernández was elected president. The new administration took office on December 10, 2019. Certain members of the current government coalition, including president Alberto Fernández and vice president Cristina Fernández de Kirchner, were part of administrations which in the past were characterized by high levels of government intervention and policies at times disadvantageous to investors and the private sector. As a result, there is uncertainty regarding the policies and changes in regulation that the new Argentine government will implement. On December 23, 2019, the new Argentine government passed a law granting emergency powers to the executive branch, among other measures. We cannot predict what policies the new Argentine government will implement under these emergency powers.
21
We cannot provide assurance that the Argentine government will not adopt policies, over which we have no control, that adversely affect the Argentine economy and impair our Argentine operations and our business, financial condition or results of operations.
Inflation in Argentina may adversely affect our operations, which could adversely impact our financial condition and results of operations.
Argentina has experienced high levels of inflation in recent decades. Argentina’s historically high rates of inflation resulted mainly from its lack of control over fiscal policy and the money supply. Argentina continues to face high inflationary pressures. The INDEC in 2017 reported that the consumer price index (índice de precios al consumidor or “CPI”) increased 24.8%, while the wholesale price index (índice de precios internos al por mayor or “WPI”) increased 18.8%. In 2018, the INDEC registered a variation in the CPI of 47.6% and an increase in WPI of 73.5%. In 2019, the INDEC registered an increase in CPI of 53.7%, while the WPI increased 58.5%.
During 2018 and 2019, Argentina met the criteria to be considered a hyperinflationary economy as provided by IAS 29 guidelines, which include, among other characteristics, a cumulative inflation rate over three years that approaches or exceeds 100%. Accordingly, IAS 29 must be applied for financial statements for fiscal years ending on or after July 1, 2018. IAS 29 requires non-monetary assets and liabilities, shareholders’ equity and comprehensive income to be restated in terms of a measuring unit current at the period end. IAS 29 also requires the use of a general price index to reflect changes in purchasing power. As a result, since July 2018, we began to apply IAS 29 in the preparation of our financial statements and report the results of our operations in Argentina as if this economy was hyperinflationary from January 1, 2018. In addition, by application of IAS 29, we had to translate figures in Argentine pesos to Chilean pesos using the period closing exchange rate (and not the average exchange rate), thus reducing our results of operations and net earnings. We cannot predict for how long Argentina will be considered a hyperinflationary economy and we will have to apply IAS 29 to the preparation of our financial statements.
In the past, inflation has materially undermined the Argentine economy and the government’s ability to generate conditions that foster economic growth. High inflation or a high level of price instability may materially and adversely affect the business volume of the financial system. This result, in turn, could adversely affect the level of economic activity and employment in the country.
High inflation would also undermine Argentina’s foreign competitiveness and adversely affect economic activity, employment, real salaries, consumption and interest rates, thereby materially and adversely affecting economic activity and consumers’ income and their purchasing power, all of which could have a material adverse effect on our financial condition and operating results.
Between 2007 and 2015, the INDEC, which is the only institution in Argentina with the statutory authority to produce official national statistics, experienced significant institutional and methodological changes that gave rise to controversy regarding the reliability of the information that it produces, including inflation, GDP and unemployment data, resulting in allegations that the inflation rate in Argentina and the other rates calculated by INDEC could be substantially different than as indicated in official reports. While the previous administration undertook reforms and the credibility of the national statistics systems has since been restored, we cannot assure you that the new or future administrations will not implement policies that may affect the national statistics system undermining consumer and investor confidence, which ultimately could affect our business, results of operations and financial condition.
The Argentine peso is subject to depreciation and volatility, which could adversely affect our financial condition and results of operations.
Fluctuations in the value of the peso continue to affect the Argentine economy. Since January 2002, the peso has fluctuated significantly in value, often following periods of high inflation and currency controls that artificially appreciated the value of the currency. Frequent devaluations have had an adverse effect on the ability of the Argentine government and Argentine companies to make timely payments on their foreign currency denominated obligations, have significantly reduced wages in real terms, and have adversely impacted the stability of businesses whose success depends on the domestic market demand.
In an effort to reduce downward pressure on the value of the Argentine peso, the Argentine government has at times implemented policies aimed at maintaining the level of reserves of the Banco Central de la República Argentina (“BCRA”) that limit the purchase of foreign currency by private companies and individuals. Currently, access to the foreign exchange market is subject to several restrictions and governmental authorizations.
In 2015, 2016, 2017, 2018 and 2019, the Argentine peso depreciated 52%, 22%, 17%, 102% and 59%, respectively, compared to the closing exchange rate as of the end of the prior period for the U.S. dollar. A significant part of the raw materials used by the company in Argentina are in U.S. dollars, so a devaluation of the Argentine peso against the U.S. dollar can affect our costs and margins in a significant way.
22
The depreciation of the Argentine peso may have a negative impact on the ability of certain Argentine businesses to service their foreign currency denominated debt, significantly reduce real wages and jeopardize the stability of businesses which success depends on domestic market demand. It may also, adversely affect the Argentine government’s ability to honor its foreign debt obligations. A significant appreciation of the Argentine peso against the U.S. dollar also presents risks for the Argentine economy, including the possibility of a reduction in exports as a consequence of the loss of external competitiveness. Any such appreciation could also have a negative effect on economic growth and employment, and reduce tax revenues.
Given the economic and political conditions in Argentina, we cannot predict whether, and to what extent, the value of the Argentine peso may depreciate or appreciate against the U.S. dollar, the euro or other foreign currencies. We cannot predict how these conditions will affect the consumption of our products. Moreover, we cannot predict whether the new Argentine government will continue its monetary, fiscal, and exchange rate policy and, if so, what impact any of these changes could have on the value of the Argentine peso and, accordingly, on our financial condition, results of operations and cash flows, and on our ability to transfer funds abroad in order to comply with commercial or financial obligations.
The Argentine government could impose certain restrictions on currency conversions and remittances abroad, which could affect the timing and amount of any dividends or other payment we receive from our Argentine subsidiary.
Beginning in December 2015, the Argentine government gradually eased restrictions which significantly curtailed access to the foreign exchange market by individuals and private sector entities and affected our ability to declare and distribute dividends with respect to our Argentine subsidiary. These measures included informal restrictions, which consisted of de facto measures restricting local residents and companies from purchasing foreign currency through the foreign exchange market to make payments abroad, such as dividends and payment for the importation of goods and services.
On September 1, 2019, in a response to the weakening of the Argentine peso following the results of the primary elections, the Argentine government temporarily reinstated certain exchange restrictions. The new controls apply with respect to access to the foreign exchange market by residents (both companies and natural persons) for savings and investment purposes abroad, the payment of external financial debts abroad, the payment of dividends in foreign currency abroad, the payment of imports of goods and services, and the obligation to repatriate and settle for Argentine pesos the proceeds from exports of goods and services, among others. Under current Argentine law, we are restricted from accessing the official foreign exchange market to make dividend payments to us from our Argentine subsidiaries without prior approval from the Argentine Central Bank.
It is not possible to anticipate whether these measures will be in force after December 31, 2019 or if the new administration which took office on December 10, 2019 will impose additional restrictions. The Argentine government could maintain or impose new exchange control regulations, restrictions and take other measures in response to capital flight or a significant depreciation of the peso, which could limit access to the international capital markets, adversely affect Argentina’s economy, and further impair our ability to declare and distribute dividends from our Argentine subsidiaries.
The Argentine government’s ability to obtain financing from international capital markets may be limited or costly, which may impair its ability to implement reforms and foster economic growth.
At the end of 2001, the Argentine government defaulted in part of its sovereign debt. In 2005 and 2010, Argentina conducted exchange offers to restructure part of its sovereign debt that had been in default since the end of 2001. Through these exchange offers, Argentina restructured over 92% of its eligible defaulted debt. In April 2016, after a series of judicial actions by Argentina’s bondholders, the Argentine government settled substantially all of the remaining defaulted debt. Additionally, as a result partially of emergency measures undertaken by the government in response to the crisis of 2001 and 2002, foreign shareholders of several Argentine companies filed claims with the International Centre for Settlement of Investment Disputes (“ICSID”), alleging that those measures diverged from the just and equal treatment standards set forth in bilateral investment treaties to which Argentina is a party. The ICSID ruled against the Argentine government in a number of these proceedings, and the Argentine government has settled some but not all of these claims.
In December 2019, the Argentine government delayed payment on roughly US$9 billion in U.S. dollar-denominated short-term debt, postponing payment until August 2020 while announcing to its creditors that it will seek to restructure the country’s debt obligations, including loans from the International Monetary Fund, which extended a US$57 billion bailout program. As a result, rating agency Fitch downgraded Argentina to “restricted default” and Standard & Poor’s changed its country rating to “selective default”.
23
While Argentina had regained access to the international capital markets, actions by the Argentine government, or investor perceptions of the country’s creditworthiness, could curtail access in the future or could significantly increase borrowing costs, limiting the government’s ability to foster economic growth. Limited or costly access to international financing for the private sector could also affect our business, financial condition and results of operations.
The government may order salary increases to be paid to employees in the private sector, which could increase our operating costs and affect our results of operations.
In the past, the Argentine government has passed laws, regulations and decrees requiring companies in the private sector to increase wages and provide specified benefits to employees. On December 23, 2019, the Argentine government passed a law granting emergency powers to the executive branch which, among others, include the ability to mandate increases to private sector wages. Due to persistent high levels of inflation, labor organizations regularly demand significant wage increases. In 2015, 2016, 2017, 2018 and 2019 the increase in the federally-mandated minimum wage was 27%, 35%, 17%, 28% and 48%, respectively, and for these same years the market average salary increase for workers was 32%, 33%, 26%, 32% and 48%, respectively. In addition, the Argentine government has arranged various measures to mitigate the impact of inflation and exchange rate fluctuation in wages. Due to high levels of inflation, both public and private sector employers continue to experience significant pressure to further increase salaries.
Labor relations in Argentina are governed by specific legislation, such as Labor Law No. 20,744 and Law No. 14,250 on Collective Bargaining Agreements, which, among other things, dictate how salary and other labor negotiations are to be conducted. In the future, the government could take new measures requiring salary increases or additional benefits for workers, and the labor force and labor unions may apply pressure in support of such measures. Any such increase in wages or worker benefit could result in added costs and reduced results of operations for Argentine companies, including us.
Government measures to preempt or respond to social unrest may adversely affect the Argentine economy and our business.
In recent decades, Argentina has experienced significant social and political turmoil, including civil unrest, riots, looting, nationwide protests, strikes and street demonstrations. Social and political tension and high levels of poverty and unemployment continue. Unions frequently stage nationwide strikes and protests, and riots and lootings of shops and supermarkets in cities around the country have taken place at times of social turmoil.
Future government policies to preempt, or in response to, social unrest may include expropriation, nationalization, forced renegotiation or modification of existing contracts, suspension of the enforcement of creditors’ rights, new taxation policies and changes in laws and policies affecting foreign trade and investment. Such policies could destabilize the country and adversely and materially affect the Argentine economy, and thereby our business, results of operations and financial condition.
Risks Relating to Paraguay
Our business operations in Paraguay are dependent on economic conditions in Paraguay.
Our operations in Paraguay represented 12.9% and 12.1% of our assets as of December 31, 2018 and December 31, 2019, respectively, and 8.9% and 8.9% of our net sales for 2018 and 2019, respectively. Because demand for soft drinks and beverage products is generally related to the economic conditions prevailing in the local market which, in turn, depend on the macroeconomic and political conditions of the country, our financial situation and our results of operations could be adversely affected by changes in these factors over which we have no control.
Paraguay has a history of economic and political instability, exchange controls, frequent changes in regulatory policies, corruption and weak judicial security. Paraguayan GDP grew by 3%, 4%, 5% and 3% in 2015, 2016, 2017 and 2018, respectively; and did not grow in 2019, according to the Paraguayan Central Bank. Paraguayan GDP is closely tied to the performance of Paraguay’s agricultural sector, which can be volatile.
The situation of the Paraguayan economy is also strongly influenced by the economic situation in Argentina and Brazil. A deterioration in the economic situation of these countries could adversely affect the Paraguayan economy and, in turn, our financial condition and operating results.
Inflation in Paraguay may adversely affect our financial condition and results of operations.
Although inflation in Paraguay has remained stable at around 4% over the last five years, we cannot assure that inflation in Paraguay will not increase significantly. An increase in inflation in Paraguay could decrease the purchasing power of our consumers in the country, which could adversely affect our volumes and impact our sales income.
24
The Paraguayan guaraní is subject to depreciation and volatility, which could adversely affect our financial condition and results of operations.
The exchange rate of Paraguay is free and floating and the Paraguay Central Bank, actively participates in the exchange market in order to reduce volatility. Since a portion of our total costs (30%) in Paraguay for raw material and supplies are denominated in U.S. dollars, a significant depreciation of the local currency could adversely affect our financial situation and results.
The Paraguayan guaraní depreciated by 26% in 2015, appreciated by 1% and 3% in 2016 and 2017, respectively, and depreciated by 7% and 8% in 2018 and 2019, respectively, in each case compared to the closing exchange rate as of the end of the prior period of the U.S. dollar.
The local currency follows regional and global trends. When the U.S. dollar’s value increases, and raw materials lose value in Paraguay, this directly impacts Paraguay’s generation of foreign exchange which occurs mainly through the export of raw materials. A deterioration in the economic growth of Paraguay as result of a significant depreciation of the Paraguayan guaraní could have an effect on our business, financial condition and results of operations.
Risk Factors Relating to the ADRs and Common Stock
Preemptive rights may be unavailable to ADR holders.
According to the Ley de Sociedades Anónimas No. 18,046 and the Reglamento de Sociedades Anónimas (collectively, the “Chilean Companies Law”), whenever we issue new shares for cash, we are required to grant preemptive rights to holders of our shares (including shares represented by ADRs), giving them the right to purchase a sufficient number of shares to maintain their existing ownership percentage. However, we may not be able to offer shares to United States holders of ADRs pursuant to preemptive rights granted to our shareholders in connection with any future issuance of shares unless a registration statement under the U.S. Securities Act of 1933, as amended, is effective with respect to such rights and shares, or an exemption from the registration requirements of the U.S. Securities Act of 1933, as amended, is available.
Under the procedure established by the Central Bank of Chile, the foreign investment agreement of a Chilean company with an existing ADR program will become subject to an amendment (which will also be deemed to incorporate all laws and regulations applicable to international offerings in effect as of the date of the amendment) that will extend the benefits of such contract to new shares issued pursuant to a preemptive rights offering to existing ADR owners and to other persons residing and domiciled outside of Chile that exercise preemptive rights, upon request to the Central Bank of Chile. We intend to evaluate at the time of any rights offering the costs and potential liabilities associated with any such registration statement as well as the indirect benefits to us of enabling United States ADR holders to exercise preemptive rights and any other factors that we consider appropriate at the time, and then make a decision as to whether to file such registration statement.
We cannot assure you that any registration statement would be filed. To the extent ADR holders are unable to exercise such rights because a registration statement has not been filed, the depositary will attempt to sell such holders’ preemptive rights and distribute the net proceeds thereof if a secondary market for such rights exists and a premium can be recognized over the cost of any such sale. If such rights cannot be sold, they will expire, and ADR holders will not realize any value from the grant of such preemptive rights. In any such case, such holder’s equity interest in the Company would be diluted proportionately.
Shareholders’ rights are less well-defined in Chile than in other jurisdictions, including the United States.
Under the United States federal securities laws, as a foreign private issuer, we are exempt from certain rules that apply to domestic United States issuers with equity securities registered under the United States Securities Exchange Act of 1934, as amended, including the proxy solicitation rules, the rules requiring disclosure of share ownership by directors, officers and certain shareholders. We are also exempt from certain of the corporate governance requirements of the Sarbanes-Oxley Act of 2002 and the New York Stock Exchange, Inc., including the requirements concerning independent directors.
Our corporate affairs are governed by the laws of Chile and our estatutos or bylaws. Under such laws, our shareholders may have fewer or less well-defined rights than they might have as shareholders of a corporation incorporated in a U.S. jurisdiction.
Pursuant to Law No. 19,705, enacted in December 2000, the controlling shareholders of an open stock corporation can only sell their controlling shares through a tender offer to all shareholders in which the bidder would have to buy all of the offered shares up to the percentage determined by it, where the price paid is substantially higher than the market price (i.e., when the price paid was higher than the average market price for a period starting 90 days before the proposed transaction and ending 30 days before such proposed transaction, plus 10%).
25
The market for our shares may be volatile and illiquid.
The Chilean securities markets are substantially smaller, less liquid and more volatile than major securities markets in the United States. The Bolsa de Comercio de Santiago (the “Santiago Stock Exchange”), which is Chile’s principal securities exchange, had a market capitalization of approximately US$205,798 million as of December 31, 2019 and an average monthly trading volume of approximately US$3,369 million for the year. The lack of liquidity is owed, in part, to the relatively small size of the Chilean securities markets and may have a material adverse effect on the trading prices of our shares. Because the market for our ADRs depends, in part, on investors’ perception of the value of our underlying shares, this lack of liquidity for our shares in Chile may have a significant effect on the trading prices of our ADRs.
| ITEM 4. | INFORMATION ON THE COMPANY |
| A. | HISTORY AND DEVELOPMENT OF THE COMPANY |
Overview
Our legal name is Embotelladora Andina S.A., and our commercial name is Coca-Cola Andina. We were incorporated and organized under Chilean law as a sociedad anónima on February 7, 1946. An abstract of our bylaws is registered with the Registro de Comercio del Conservador de Bienes Raíces de Santiago (Public Registry of Commerce of the Real Estate Commission Administrator of the City of Santiago) under No. 581 of the year 1946. Pursuant to our bylaws, our term of duration is indefinite.
Our common shares are listed and traded on the Santiago Stock Exchange and on the Bolsa Electrónica de Chile (the Chilean Electronic Stock Exchange) and, until October 2018, were listed on the Bolsa de Corredores de Valparaiso (the Valparaiso Brokers Stock Exchange), which closed operations in October 2018.
Our Series A and Series B ADRs representing our Series A and Series B shares, respectively, are listed on the New York Stock Exchange. Our principal executive offices are located at Avenida Miraflores 9153, Floor 7, Renca, Santiago, Chile. Our telephone number is +562-2338-0520 and our website is www.koandina.com.
Our depositary agent for the ADRs in the United States is The Bank of New York Mellon Corporation, located at 240 Greenwich Street, New York, New York 10286. Our depositary agent’s telephone number is (212) 815-2296. Our authorized representative in the United States is Puglisi & Associates, located at 850 Library Avenue, Suite 204, Newark, Delaware 19711, United States, and its phone number is (302) 738-6680.
History
Chile
In 1941, The Coca-Cola Company licensed a private Chilean company to produce Coca-Cola soft drinks in Chile and production began in 1943. In 1946, the original licensee withdrew from the license arrangement and a group of U.S. and Chilean investors formed Andina, which became The Coca-Cola Company’s sole licensee in Chile.
Between 1946 and the early 1980s, Andina developed the Chilean market for Coca-Cola soft drinks with a system of production and distribution facilities covering the central and southern regions of Chile. In the early 1980s, Andina sold its Coca-Cola licenses for most areas outside the Santiago metropolitan region and concentrated on the development of its soft drink business in the Santiago area. Although we are no longer the sole Coca-Cola bottler in Chile, we have been the principal manufacturer of Coca-Cola products in Chile for an uninterrupted period of 73 years.
In 1998, we purchased a 49% stake in Vital S.A. from The Coca-Cola Company. Concurrently, The Coca-Cola Company purchased Vital S.A. mineral water springs located in Chanqueahue, 80 miles south of Santiago. As part of the transaction, the Vital bottler agreement was replaced with a Minute Maid International Inc. juice bottler agreement and a new mineral water bottling agreement with The Coca-Cola Company.
The production and packaging business of water, juices and non-carbonated beverages licensed by The Coca-Cola Company in Chile was restructured in 2005. Vital Aguas S.A. (“VASA”) was created in 2005 in order to develop the processing, production and packaging of mineral water and other waters by Agua Mineral de Chanqueahue Vital. Andina and Embonor S.A. continued the development of juices and non-carbonated beverages through their ownership stakes in Vital S.A., holding 66.5% and 33.5%, respectively. In January 2011, the juice production business was restructured to allow the incorporation of the other Coca-Cola bottlers in Chile to the ownership of Vital S.A., which changed its name initially to Vital Jugos S.A. and then to VJ S.A. in 2019. Andina and Embonor hold 65% and 35% stakes in Vital Jugos, respectively.
26
In 2001, we entered into a joint venture with Cristalerías de Chile to produce PET bottles. On January 27, 2012, Coca-Cola Embonor through its subsidiary, Embonor Empaques S.A., acquired Cristalerías de Chile’s stake equivalent to a 50% ownership interest in Envases CMF.
On October 16, 2012, in order to reinforce our leadership position among Coca-Cola bottlers in South America, the Company completed its merger with Embotelladoras Coca-Cola Polar S.A. (“Polar”). Polar was a Coca-Cola bottler with operations in Chile, where it serviced territories in the II, III, IV, XI and XII regions, as well as parts of Argentina, as described below, and all of Paraguay. The merger granted former shareholders of Polar a 19.68% ownership interest in the merged entity, however the Company controls its day to day operations. As a result of the transaction, we also acquired additional indirect ownership interests in Vital Jugos, Vital Aguas and Envases Central.
On January 28, 2016, the Company incorporated a closed joint-stock company called Coca-Cola Del Valle New Ventures S.A. (“Coca-Cola Del Valle”). Embotelladora Andina S.A. contributed 35% of the capital of Coca-Cola Del Valle, with Embonor S.A. and Coca-Cola de Chile S.A. contributing the remaining 15% and 50%, respectively. The main corporate purpose of Coca-Cola Del Valle is the development and production of juices, waters and non-carbonated beverages under brands owned by The Coca-Cola Company that Andina and Coca-Cola Embonor S.A. are authorized to commercialize and distribute in their respective franchise territories.
On August 1, 2016, the Company signed an agreement with Monster Energy Company for the distribution of Monster Energy products in the Chilean territory covered by Andina, which we began distributing in September 2016.
On March 28, 2017, The Coca-Cola Company, together with its bottlers in Latin America, announced the closing of the acquisition from Unilever of the AdeS vegetable protein-based beverage business. Andina began distributing AdeS products in Chile in July 2017.
In January 2018, the Company, Embonor S.A., Coca-Cola del Valle New Ventures S.A., and Coca-Cola de Chile S.A., as buyers, and Inversiones Siemel S.A. as seller, entered into a stock purchase agreement under which the parties agreed to transfer 100% ownership of the shares of Comercializadora Novaverde S.A. (“Novaverde”), a Chilean company dedicated to the production and distribution of juices, ice cream, and other food, mainly under the brand “Guallarauco” subject to certain conditions precedent. The transaction did not include the acquisition of the avocado sales business line and the General Mills representation. In October 2018, the purchase of 100% of the shares of Novaverde was completed.
In May 2018, Diageo Chile Ltda., Embonor S.A. and Embotelladora Andina S.A. signed an agreement for the distribution in Chile of the brands belonging to Diageo, including Johnnie Walker, Baileys, Smirnoff, Guinness, Pampero, among others.
In October 2019, Cooperativa Agrícola Pisquera Elqui Ltda. (“Capel”), Embonor S.A. and Andina, signed an agreement for the distribution in Chile of products bearing the brands belonging to Capel, including Capel (brand), Alto del Carmen, Monte Fraile, Brujas de Salamanca, Artesanos del Cochiguaz, among others.
Brazil
Andina Brazil, our Brazilian subsidiary, began production and distribution of Coca-Cola soft drinks in Rio de Janeiro in 1942. In June 1994, we acquired 100% of the capital stock of Andina Brazil for approximately US$120 million and contributed an additional US$31 million to Andina Brazil’s capital immediately after the acquisition to repay certain indebtedness of Andina Brazil. In 2000, we purchased a Coca-Cola franchise licensee NVG through Andina Brazil for a territory in Brazil comprising the State of Espírito Santo and part of the States of Rio de Janeiro and Minas Gerais, for US$74.5 million.
In 2004, Andina Brazil entered into a franchise swap agreement with the Brazilian subsidiary of The Coca-Cola Company, Recofarma Indústria do Amazonas Ltda., for an exchange of franchising rights, goods and other assets of Andina Brazil in the territory of Governador Valadares in the State of Minas Gerais, and other franchise rights of The Coca-Cola Company in the territories of Nova Iguaçu in the state of Rio de Janeiro, which were previously owned by Companhia Mineira de Refrescos S.A.
In 2007, The Coca-Cola Company along with the Coca-Cola bottlers in Brazil created a joint venture, Mais Indústria de Alimentos, in order to enhance the non-carbonated business for the entire system in that country, and in 2008 The Coca-Cola system acquired a second company that produces non-carbonated beverages called Sucos del Valle do Brasil Ltda. These two companies merged in 2011 and SABB (Sistema de Alimentos y Bebidas do Brasil) was created.
27
In 2010, The Coca-Cola Company along with its bottlers, acquired in a joint venture the company Leão Junior S.A. with a consolidated presence and market share in Andina Brazil’s region in the category of iced tea. Leão Junior S.A. commercializes the Matte Leão brand, among others. Andina Brazil controls 18.20% of Leão Junior S.A. Andina Brazil holds a 10.74% average ownership interest in Leão Junior S.A. and SABB.
In November 2012, Andina Brazil acquired a 40% stake in Sorocaba Refrescos S.A., a Coca-Cola bottler located in the state of São Paulo, for R$146,946,004.
On October 11, 2013, Andina Brazil, acquired 100% of the capital stock of Companhia de Bebidas Ipiranga (“Ipiranga”) in an all-cash transaction. Ipiranga is also a Coca-Cola bottler with operations in part of the States of São Paulo and part of the State of Minas Gerais. This acquisition was previously arranged between the parties through an agreement signed on July 10, 2013. The final price paid was R$1,155,445,998.
During 2013, there was a restructuring of the juice and mate herb (“yerba mate”) business, pursuant to which the companies in which Andina Brazil held an interest were merged. As a result of the restructuring, Andina Brazil ended up with a 9.57% ownership interest in Leão Alimentos y Bebidas Ltda., the legal successor of these companies. This percentage increased to 10.87% as a result of our acquisition of, and subsequent merger with, Compañía de Bebidas Ipiranga that held an ownership interest in Leão Alimentos y Bebidas Ltda. During 2014, Andina Brazil sold 2.05% of its ownership interest in Leão Alimentos e Bebidas Ltda., remaining with a final ownership interest of 8.82%.
During 2015 and 2016, Andina Brazil made two capital increases in Leão Alimentos e Bebidas Ltda. for a total amount of R$ 39.9 million. Andina Brazil’s ownership interest in Leão Alimentos e Bebidas Ltda. did not increase, given that all of the shareholders of Leão Alimentos e Bebidas Ltda. proportionally participated in the capital increase.
During 2016, Andina Brazil, along with Coca-Cola Brazil and the other bottlers in Brazil, acquired Laticinios Verde Campo Ltda. The purchase was made through Trop Frutas do Brasil Ltda. a subsidiary of Leão Alimentos e Bebidas Ltda. Andina Brazil acquired 7.5% of Laticinios Verde Campo Ltda. in R$ 29.5 million.
In 2016, Andina Brazil signed an agreement with Monster Energy Company for the distribution of Monster Energy products in Andina Brazil’s territory. These products began being distributed on November 1, 2016.
In 2016, Andina Brazil closed its production facility in Cariacica, state of Espírito Santo, leaving only two production facilities, in the States of Rio de Janeiro and São Paulo.
In 2017, Andina Brazil bought, together with Coca-Cola Brazil and the other Coca-Cola bottlers in Brazil, the company UBI 3 Participações Ltda. The operation was carried out to make the distribution and marketing of AdeS products in Brazil viable. Andina Brazil bought 8.50% of UBI 3 Participações Ltda. for R$21.4 million. Andina Brazil began distributing AdeS products in June 2017.
In August 2017, Andina Brazil increased its ownership interest in Leão Alimentos e Bebidas Ltda. from 8.8% to 10.3%. The value of the additional ownership interest acquired was R $26.5 million.
In March 2018, Andina Brazil started the production of soft drinks at the new Duque de Caxias plant in the state of Rio de Janeiro, and in January 2019, the production of mineral waters started in the same plant.
Argentina
Production of Coca-Cola soft drinks in Argentina began in 1943 with operations in the province of Córdoba, Argentina, through Inti S.A.I.C., (“INTI”). In July 1995, we, through an investment company incorporated in Argentina called Inversiones del Atlántico S.A., (“IASA”), acquired a 59% interest in Embotelladoras del Atlántico S.A. (“EDASA”, the parent company of Rosario Refrescos S.A. and Mendoza Refrescos S.A.). These entities were subsequently merged to create Rosario Mendoza Refrescos S.A., (“ROMESA”). In 1996, we acquired an additional 35.9% interest in EDASA, an additional 78.7% interest in INTI, a 100% interest in CIPET (a PET plastic bottle and packaging business located in Buenos Aires) and a 15.2% interest in Cican S.A. During 1997, the operations of ROMESA were merged with INTI. In 1999, EDASA was merged into IASA. In 2000, IASA was merged into INTI, forming Embotelladora del Atlántico S.A. (“EDASA”). In 2002, CIPET merged into EDASA. During 2007, EDASA’s ownership interest in Cican S.A. was sold to FEMSA.
28
In 2011, EDASA's shareholders resolved to form Andina Empaques Argentina S.A., through a spin-off of all of EDASA’s Packaging Division, including all tangible and intangible assets related thereto. Accounting and tax effects began on January 1, 2012. Subsequently, EDASA absorbed Coca-Cola Polar Argentina S.A.
Additionally, as a result of the Company’s merger with Polar which was completed in October 16, 2012, the Company gained territory serviced by Polar in Argentina, consisting of territories in Santa Cruz, Neuquén, El Chubut, Tierra del Fuego, Río Negro, La Pampa and the western part of the province of Buenos Aires.
On December 2, 2015 the National Commission for the defense of Competition in the Republic of Argentina, a non-concentrated organism under the administration of the Undersecretary of Trade of the Secretary of Trade of Ministry of Economy and Public Finances, notified EDASA of Resolution No. 640 issued by the Secretary of Trade of the Ministry of Economy and Public Finances on November 24, 2015, under which it authorized and approved the economic concentration caused by the (i) merger by incorporation between the Chilean company Embotelladora Andina S.A., as surviving entity, and Embotelladoras Coca-Cola Polar S.A., and (ii) the merger by incorporation between EDASA as surviving entity, and Coca-Cola Polar Argentina S.A., respectively, under article 13, inc. a) of Law 25,156 (old Anti-Trust Law).
On March 28, 2017, EDASA acquired 13.0% of the shares of the company Alimentos de Soja S.A.U., dedicated to the production of vegetable protein-based beverages marketed under the brand “AdeS”. The sale of Alimentos de Soja S.A.U. shares was carried out within the framework of a global transaction under the terms of which The Coca-Cola Company and certain Coca-Cola bottlers acquired the “AdeS” liquid soy-based food business from the Unilever Group in Brazil, Mexico, Argentina, Colombia, Paraguay, Uruguay, Bolivia and Chile. EDASA began distributing AdeS products in July 2017. In 2018, EDASA acquired shares of Alimentos de Soja S.A.U. (currently Alimentos de Soja S.A.), increasing its ownership interest to 14.3%. The amount of shares transferred was sufficient to provide EDASA a percentage of shares approximately proportional to its market share in the territory.
On December 13, 2017, EDASA, together with Monster Energy Company, entered into an agreement in which Monster Energy Company named Embotelladora del Atlántico S.A. as distributor in the franchise territory of Andina Argentina of the products bearing the "Monster" brand for an initial period of 10 years. In February 2018, we began commercializing and distributing Monster products entering the category for energy drinks.
Paraguay
PARESA is the first authorized Coca-Cola Bottler Company in Paraguay, which started its operations in May 13, 1965. In 1967, Plant 1 was opened with a capacity of 400,000 annual unit cases. In 1980, the Barcequillo Plant - located on Km 3.5 Barcequillo of the Ñemby route, in the City of San Lorenzo- was opened, reaffirming and applying the concept of the highest end technology of bottling. Beginning in 2004, PARESA became property of the Grupo Polar from Chile, continuing its operations in the Paraguayan market. On October 1, 2012, PARESA became part of Grupo Coca-Cola Andina due to the merger of Embotelladoras Coca-Cola Polar S.A. into Embotelladora Andina S.A.
On March 28, 2017, The Coca-Cola Company, together with its bottlers in Latin America, announced the closing of the acquisition from Unilever of the AdeS vegetable protein-based beverage business.
PARESA began distributing AdeS and Monster products in July 2017 and May 2019, respectively.
Capital Expenditures
The following table sets forth our capital expenditures by country for the 2017-2019 period:
| Year ended December 31, | ||||||||||||
| 2017 | 2018 | 2019 | ||||||||||
| (in millions of Ch$) | ||||||||||||
| Chile | 50,337 | 52,094 | 51,543 | |||||||||
| Brazil | 81,322 | 32,536 | 21,343 | |||||||||
| Argentina | 29,538 | 26,749 | 24,343 | |||||||||
| Paraguay | 7,661 | 9,684 | 13,454 | |||||||||
| Total | 168,858 | 121,063 | 110,683 | |||||||||
Our total capital expenditures were Ch$168,858 million in 2017, Ch$121,063 million in 2018 and Ch$110,683 in 2019.
29
In 2019, capital expenditures were principally related to the following:
Argentina
| · | Returnable containers (glass and PET bottles) and cases for bottles, |
| · | Coolers - Cold Equipment, |
| · | Can Line Project (Monte Cristo plant – fine tuning), |
| · | Refillable PET (Ref PET) Returnable Labeling Project (Monte Cristo plant and Bahia Blanca plant – fine tuning), |
| · | Ref PET Blowing Project (Monte Cristo plant), |
| · | Front Office project (implementation stage 1 which will be completed in 2020), and |
| · | Purchase of forklifts and transpallets. |
Brazil
| · | Finalization of the Duque de Caxias plant, |
| · | Production lines and equipment for the Duque de Caxias plant, |
| · | Implementation of returnable labelling project, |
| · | Returnable containers (Ref PET and glass bottles) and plastic bottle cases, |
| · | Cold equipment, post-mix and other equipment for the point of sale, |
| · | Improvements in the management systems, |
| · | Machinery to increase efficiency and productive capacity, and |
| · | Renewal of part of the trucks and forklifts for industrial and logistics areas. |
Chile
| · | New One-Way (OW) line for soft drinks and water, |
| · | Labelling project central zone, |
| · | Production room adjustment, and |
| · | Renewal distribution fleet. |
Paraguay
| · | Fructose production facilities, |
| · | Online blowing Line 3, |
| · | Extension of deposits, |
| · | “Front Office” project, |
| · | Returnable bottles and plastic cases, and |
| · | Cold equipment. |
We have budgeted US$160-170 million for our capital expenditures in 2020, which is expected to be mainly destined to:
| · | Improve our information technologies with a main focus on big data and artificial intelligence, |
| · | Improve our productive capacity (mainly returnable labeling projects, and a production line in Paraguay), |
| · | Improve infrastructure for greater flexibility (mainly in Paraguay and Chile), |
| · | Returnable bottles and containers (optimizing the use of multipurpose bottles), and |
| · | Cold equipment (with energy efficiency savings and better customer service). |
For 2020, we estimate that internally generated funds will finance a large part of our budgeted capital expenditure. Our capital expenditure plan for 2020 may change based on market conditions and how the economy evolves in the countries where we operate. In particular, we are reviewing our capital expenditures plan for the year 2020 due to the changing conditions resulting from the effects of the COVID-19 crisis.
30
| B. | BUSINESS OVERVIEW |
We are the third largest bottler of Coca-Cola trademark beverages in Latin America in terms of sales volume. We are the largest bottler of Coca-Cola trademark beverages in Chile and Argentina and the third largest in Brazil, in each case in terms of sales volume. We are also the only bottler of Coca-Cola trademark beverages in Paraguay.
In 2019, we had consolidated net sales of Ch$1,779,025 million and total sales volume of 746.4 million unit cases of beverages.
In addition to our soft drinks business, which accounted for 68% of our consolidated net sales during 2019, we also:
| · | produce, sell and distribute fruit juices, other fruit-flavored beverages, sport drinks, flavored waters, mineral and purified water in Chile, Argentina, Brazil and Paraguay under trademarks owned by The Coca-Cola Company; |
| · | manufacture polyethylene terephthalate (“PET”) bottles and preforms, returnable PET bottles, cases and plastic caps, primarily for our own use in the packaging of our beverages in Chile and Argentina; |
| · | produce, sell and distribute ice tea, mate beverages, and sell and distribute lactose free dairy products in Brazil; |
| · | produce, sell and distribute seed-based beverages in Argentina under trademarks owned by The Coca-Cola Company, and sell and distribute these products in Brazil, Chile and Paraguay; |
| · | sell and distribute energy drinks in Argentina, Brazil, Chile and Paraguay under trademarks owned by Monster Energy Company; |
| · | sell and distribute beer in Brazil under the brands Amstel, Bavaria, Heineken, Kaiser, Sol and Xingu; |
| · | distribute beer, wine and cider in the south of Argentina; |
| · | sell and distribute spirits and wine in Chile; and |
| · | distribute ice cream and other frozen products under the Guallarauco brand in Chile. |
Our Territories
The following map shows our territories, estimates of the population to which we offer products, the number of retailers of our beverages and the per capita consumption of our beverages as of December 31, 2019.
Per capita consumption data for a territory is determined by dividing total beverage sales volume, excluding the sales to other Coca-Cola bottlers within the territory by the estimated population within such territory, and is expressed on the basis of the number of eight-ounce servings of our products. One of the factors we use to evaluate the development of local volume sales in our territories and to determine product potential is the per capital consumption of our beverages.
31
Our Product Overview
We produce, market and distribute the following Coca-Cola trademark beverages and brands licensed from third parties throughout our franchise territories. In addition, we distribute Heineken brand beer in Brazil, beer, wine and cider in southern Argentina, and spirits and wine in Chile. The following table sets forth the brands of the products that we distribute by country as of December 31, 2019:
| Chile | Brazil | Argentina | Paraguay | |||||
| Colas | ||||||||
| Coca-Cola | ü | ü | ü | ü | ||||
| Coca-Cola Light | ü | ü | ||||||
| Coca-Cola Zero/Sin Azúcar | ü | ü | ü | ü | ||||
| Coca-Cola Energy | ü | |||||||
| Coca-Cola Plus Café | ü | |||||||
| Flavored soft drinks | ||||||||
| Cantarina | ü | |||||||
| Crush | ü | ü | ||||||
| Fanta | ü | ü | ü | ü | ||||
| Fanta Zero/Sin Azúcar | ü | ü | ü | ü | ||||
| Inca Kola | ü | |||||||
| Inca Kola Zero/Sin Azúcar | ü | |||||||
| Kuat | ü | |||||||
| Kuat Zero | ü | |||||||
| Nordic Mist | ü | |||||||
| Nordic Mist Zero | ü | |||||||
| Nordic Mist Agua Tónica | ü | |||||||
| Quatro Zero | ü | |||||||
| Schweppes | ü | ü | ü | |||||
| Schweppes Zero | ü | |||||||
| Schweppes Tónica | ü | ü | ü | |||||
| Sprite | ü | ü | ü | ü | ||||
| Sprite Zero/Sin Azúcar | ü | ü | ü | ü | ||||
| & Nada | ü | ü | ||||||
| Yas | ü | |||||||
| Juices | ||||||||
| Cepita | ü | |||||||
| Del Valle | ü | |||||||
| Andina Del Valle | ü | |||||||
| Kapo | ü | ü | ||||||
| Frugos | ü | |||||||
| AdeS | ü | ü | ü | ü | ||||
| Guallarauco | ü | |||||||
| Waters | ||||||||
| Aquarius | ü | ü | ü | |||||
| Benedictino | ü | |||||||
| Bonaqua | ü | |||||||
| Crystal | ü | |||||||
| Dasani | ü | |||||||
| Glaceau Vitamin Water | ü | |||||||
| Kin | ü | ü | ||||||
| Glaceau SmartWater | ü | |||||||
| Guallarauco | ü | |||||||
| Vital | ü | |||||||
| Tropical | ü |
32
| Chile | Brazil | Argentina | Paraguay | |||||
| Other Non-alcoholic Beverages | ||||||||
| Black | ü | |||||||
| Burn | ü | |||||||
| Monster | ü | ü | ü | ü | ||||
| Fuze | ü | |||||||
| I9 | ü | |||||||
| Matte Leão | ü | |||||||
| Powerade | ü | ü | ü | ü | ||||
| Powerade Zero | ü | ü | ||||||
| Minilac Verde Campo | ü | |||||||
| Shake Whey Verde Campo | ü | |||||||
| Beer | ||||||||
| Amstel | ü | ü | ||||||
| Bavaria | ü | |||||||
| Blue Moon | ü | |||||||
| Guiness Original | ü | |||||||
| Grolsch | ü | |||||||
| Heineken | ü | ü | ||||||
| Imperial | ü | |||||||
| Isenbeck | ü | |||||||
| Kaiser | ü | |||||||
| Kunstmann | ü | |||||||
| Miller | ü | |||||||
| Palermo | ü | |||||||
| Schneider | ü | |||||||
| Sol | ü | ü | ||||||
| Warsteiner | ü | |||||||
| Xingu | ü | |||||||
| Spirits and Wine | ||||||||
| Baileys | ü | |||||||
| Bourbon Bulleit | ü | |||||||
| Gin Tanqueray | ü | |||||||
| Rum Cacique | ü | |||||||
| Rum Pampero | ü | |||||||
| Rum Zacapa | ü | |||||||
| Sheridan’s | ü | |||||||
| Tequila Don Julio | ü | |||||||
| Vodka Ciroc | ü | |||||||
| Vodka Smirnoff | ü | |||||||
| Whisky Bell’s | ü | |||||||
| Whisky Buchanan’s | ü | |||||||
| Whisky J&B | ü | |||||||
| Whisky Johnnie Walker | ü | |||||||
| Whisky Old Parr | ü | |||||||
| Whisky Sandy Mac | ü | |||||||
| Whisky Singleton | ü | |||||||
| Whisky Vat-69 | ü | |||||||
| Whisky White Horse | ü | |||||||
| Pisco Monte Fraile | ü | |||||||
| Pisco Hacienda La Torre | ü | |||||||
| Pisco Alto del Carmen | ü | |||||||
| Pisco Capel | ü | |||||||
| Pisco Brujas de Salamanca | ü |
33
| Chile | Brazil | Argentina | Paraguay | |||||
| Pisco Artesanos del Cochiguaz | ü | |||||||
| Rum Maddero | ü | |||||||
| Wine Prólogo Late Harvest | ü | |||||||
| Sparkling Wine Pkador | ü | |||||||
| Sparkling Wine Francisco de Aguirre | ü | |||||||
| Sparkling Wine Sensus | ü | |||||||
| Sparkling Wine Nola Zero | ü | |||||||
| Sparkling Wine Myla | ü | |||||||
| Pisco Sour Estrella del Elqui | ü | |||||||
| Pisco Sour Nola Zero | ü | |||||||
| Cocktail Inca de Oro Sour | ü | |||||||
| Cider 1888 | ü | |||||||
| Cider Real | ü | |||||||
| Wine Colón | ü | |||||||
| Wine La Celia | ü | |||||||
| Wine Eugenio Bustos | ü | |||||||
| Wine Graffigna | ü | |||||||
| Wine Grosso | ü | |||||||
| Ice Creams and Frozen Products | ||||||||
| Guallarauco | ü |
In addition, in Chile, through the Koolife business unit, we import and distribute some other Coca-Cola trademark beverages, such as Coca-Cola Caffeine Free, Coca-Cola Zero Cherry, Coca-Cola Zero Vanilla, Aloe Gloe (organic aloe vera), Coca-Cola Plus Espresso, Zico coconut water, among others.
We produce, market and distribute Coca-Cola products in our franchise territories through standard bottler agreements between our bottler subsidiaries and the local subsidiary in each jurisdiction of The Coca-Cola Company. We consider our relationship with The Coca-Cola Company to be an integral part of our business strategy.
We seek to enhance our business throughout the franchise territories by developing existing markets, penetrating other soft drink, waters and juices markets, forming strategic alliances with retailers to increase consumer demand for our products, increasing productivity, and by further internationalizing our operations.
Reporting Segments
The following discussion analyzes our product sales and customers by reporting segments.
Chile
In Chile, we produce, market and distribute our beverages under The Coca-Cola Company trademarks in the metropolitan region of Santiago and the provinces of Cachapoal and San Antonio, as well as the regions of Antofagasta, Atacama, Coquimbo, Aysén and Magallanes.
During 2019, Chile accounted for 32.1% and 34.2% of our volume and consolidated net sales, respectively.
Soft Drinks: Our Chilean soft drink operations accounted for net sales in 2019 of Ch$408,468 million. We measure sales volume in terms of unit cases (UCs). The following table highlights historical sales and volume of Coca-Cola soft drinks sold in Chile for the periods indicated:
34
| Year ended December 31, | ||||||||||||||||||||||||
| 2017 | 2018 | 2019 | ||||||||||||||||||||||
| (in millions) | ||||||||||||||||||||||||
| Ch$ | UCs | Ch$ | UCs | Ch$ | UCs | |||||||||||||||||||
| Colas | 271,723 | 110.3 | 284,155 | 112.5 | 305,205 | 119.3 | ||||||||||||||||||
| Flavored soft drinks | 119,906 | 47.4 | 106,627 | 42.2 | 103,263 | 38.9 | ||||||||||||||||||
| Total | 391,629 | 157.7 | 390,782 | 154.7 | 408,468 | 158.2 | ||||||||||||||||||
As of December 31, 2019, we sold our products to approximately 64,000 customers in Chile. The following table highlights the type of customer in Chile for our products:
| Year ended December 31, | ||||||||||||
| 2017 | 2018 | 2019 | ||||||||||
| (%) | ||||||||||||
| Mom & Pops (1) | 47 | 46 | 46 | |||||||||
| Supermarkets | 29 | 30 | 28 | |||||||||
| On premise | 12 | 12 | 15 | |||||||||
| Wholesale distributors | 12 | 12 | 11 | |||||||||
| Total | 100 | 100 | 100 | |||||||||
| (1) | Mom & Pops are neighborhood stores (grocery stores, minimarkets, kiosks, liquor stores, bakeries, etc.) characterized by providing daily shopping needs, and differentiated because they are nearby, and products are available in smaller formats. |
Other Beverages: Coca-Cola Andina, through VJ S.A., produces and sells juices, fruit flavored beverages and sports drinks. Juices are manufactured and commercialized under the brands Andina del Valle (juices and fruit nectars), Kapo (juice drink), Glaceau Vitamin Water (water with added vitamins and minerals), Aquarius (juice drink) and Powerade (isotonic). Vital Aguas S.A. is in charge of bottling mineral and mineralized water under the brands Vital and SmartWater (sparkling and still versions). Also, Andina (in Chile) and ECSA produce purified water under the brand Benedictino.
In September 2016 and July 2017, the Company began the distribution in Chile of products under the trademarks of Monster and AdeS, respectively. In 2018, the Company began selling and distributing certain Guallarauco products and spirits from the company Diageo, and in 2019 the Company began with the sale and distribution of liquors and wine of the company Capel.
In 2019, net sales of waters, juices, seed-based beverages, sports drinks, energy drinks and spirits in Chile were Ch$200,484 million.
Brazil
In Brazil, we produce, market and distribute our beverages under The Coca-Cola Company trademarks in the majority of the State of Rio de Janeiro and the entirety of the State of Espírito Santo and since October 1, 2013 in part of the state of São Paulo and part of the state of Minas Gerais, as a consequence of the consummation of the Ipiranga acquisition on October 1, 2013. During 2019, Brazil accounted for 34.7% and 34.8% of our volume and consolidated net sales, respectively.
Soft Drinks: The Brazilian soft drink operations accounted for net sales of Ch$360,792 million. The following table highlights historical sales and volume of Coca-Cola soft drinks sold in Brazil for the periods indicated:
| Year ended December 31, | ||||||||||||||||||||||||
| 2017 | 2018 | 2019 | ||||||||||||||||||||||
| (in millions) | ||||||||||||||||||||||||
| Ch$ | UCs | Ch$ | UCs | Ch$ | UCs | |||||||||||||||||||
| Colas | 300,804 | 150.8 | 245,955 | 152.0 | 264,929 | 145.6 | ||||||||||||||||||
| Flavored soft drinks | 86,741 | 50.9 | 80,601 | 49.4 | 95,862 | 61.2 | ||||||||||||||||||
| Total | 387,545 | 201.7 | 326,016 | 201.4 | 360,792 | 206.8 | ||||||||||||||||||
35
As of December 31, 2019, we sold our products to approximately 85,000 customers in Brazil. The following table highlights the type of customer in Brazil for our products:
| Year ended December 31, | ||||||||||||
| 2017 | 2018 | 2019 | ||||||||||
| (%) | ||||||||||||
| Mom & Pops (1) | 40 | 23 | 24 | |||||||||
| Supermarkets | 34 | 34 | 32 | |||||||||
| On premise | 18 | 17 | 17 | |||||||||
| Wholesale distributors | 8 | 26 | 28 | |||||||||
| Total | 100 | 100 | 100 | |||||||||
| (1) | Mom & Pops are neighborhood stores (grocery stores, minimarkets, kiosks, liquor stores, bakeries, etc.) characterized by providing daily shopping needs, and differentiated because they are nearby, and products are available in smaller formats. |
Note: The large difference of figures in the Mom & Pops and Wholesale distributors channels when comparing 2018 and 2019 with 2017 is because in 2017 the volume of Wholesale Distributors and Deposits were considered as part of the Mom & Pops volume, unlike the other years where it is assigned to Wholesale Distributors. If the same criteria had been applied in 2017, the Mom & pops channel mix would be 23.8% in 2017.
Other Beverages: We sell and distribute beer under the Amstel, Bavaria, Heineken, Kaiser, Sol and Xingu labels. We sell and distribute water under the labels Crystal and SmartWater, ready-to-drink juices under the labels Del Valle Frut e Fresh, Del Valle Mais, Del Valle 100%, Del Valle Nutri, Del Valle Água de Coco, Del Valle Concentrado, Sabores Caseros and Kapo, energy drinks under the brand names Burn and Monster, isotonic drinks under i9 and Powerade brand names and Fuze Ice Tea, Fuze Matte Leão, Matte Leão and Guaraná Leão ready-to-drink teas. We also sell and distribute seed-based beverages, AdeS Juice and AdeS Milk, under the brand name AdeS and Shake Whey and Minilac lactose-free beverages under the brand name Verde Campo. As of November 2016 and June 2017, the Company began the distribution in its Brazilian franchise territories of products under the trademarks of Monster and AdeS, respectively.
In 2019, net sales of beer, waters, juices, ready-to-drink teas, seed-based beverages, sports drinks and energy drinks in Brazil were Ch$258,530 million.
Argentina
In Argentina, we produce, market and distribute our beverages under The Coca-Cola Company trademarks in the entirety of the provinces of Córdoba, Mendoza, San Juan, San Luis, Entre Rios, western part of the province of Buenos Aires and most of Santa Fe, as well as La Pampa, Neuquén, Río Negro, Chubut, Santa Cruz, and Tierra del Fuego. During 2019, Argentina accounted for 23.9% and 22.2% of our sales volume and consolidated net sales, respectively.
Soft Drinks: The Argentine soft drink operations accounted for net sales of Ch$313,866 million in 2019. The following table highlights historical sales and volume of Coca-Cola soft drinks sold in Argentina for the periods indicated:
| Year ended December 31, | ||||||||||||||||||||||||
| 2017 | 2018 | 2019 | ||||||||||||||||||||||
| (in millions) | ||||||||||||||||||||||||
| Ch$ | UCs | Ch$ | UCs | |||||||||||||||||||||
| Colas | 308,462 | 123.5 | 235,678 | 119.0 | 222,140 | 108.9 | ||||||||||||||||||
| Flavored soft drinks | 136,410 | 50.9 | 95,125 | 48.0 | 91,726 | 40.8 | ||||||||||||||||||
| Total | 444,872 | 174.4 | 330,803 | 167.0 | 313,866 | 149.7 | ||||||||||||||||||
36
As of December 31, 2019, we sold our products to approximately 59,000 clients in Argentina. The following table highlights the type of client in Argentina for our products:
| Year ended December 31, | ||||||||||||
| 2017 | 2018 | 2019 | ||||||||||
| (%) | ||||||||||||
| Mom & Pops (1) | 34 | 33 | 33 | |||||||||
| Supermarkets | 33 | 31 | 31 | |||||||||
| On premise | 3 | 3 | 4 | |||||||||
| Wholesale distributors | 30 | 32 | 32 | |||||||||
| Total | 100 | 100 | 100 | |||||||||
| (1) | Mom & Pops are neighborhood stores (grocery stores, minimarkets, kiosks, liquor stores, bakeries, etc.) characterized by providing daily shopping needs, and differentiated because they are nearby, and products are available in smaller formats. |
Other Beverages: In Argentina, we produce and distribute ready-to-drink juices under the Cepita brand name. We also produce and sell water under the brands Kin, Bonaqua (sparkling and still mineral water), Aquarius (flavored waters), and Powerade (sports drink). During 2017, we incorporated the AdeS brand (ready to drink soy-based beverage) through a Joint Venture with The Coca-Cola Company and the rest of the bottlers (Andina Argentina bills this business on behalf and by order of the AdeS S.A. joint venture). In 2018 we incorporated the Monster brand (energy drink) to our portfolio, through a purchase and sale model. Also, we distribute beer including Palermo, Schneider, Heineken, Amstel, Bieckert, Sol, Imperial, Kunstmann, Miller, Isenbeck, Grolsch and Warsteiner; wine under the brands La Celia, Eugenio Bustos, Graffigna and Colon; and cider under the brands 1888 and Real.
In 2019, net sales of juices, waters, seed-based beverages, sports and energy drinks in Argentina were Ch$70,990 million. These values also consider the commission for distribution of beer, wine and cider.
Paraguay
In Paraguay, we produce, market and distribute our beverages under The Coca-Cola Company trademarks in the entire country. During 2019, Paraguay accounted for 9.3% and 8.9% of our volume and consolidated net sales, respectively.
Soft Drinks: The Paraguayan soft drinks operations accounted for net sales of Ch$124,856 million. The following table highlights historical sales and volume of Coca-Cola soft drinks sold in Paraguay for the periods indicated:
| Year ended December 31, | ||||||||||||||||||||||||
| 2017 | 2018 | 2019 | ||||||||||||||||||||||
| (in millions) | ||||||||||||||||||||||||
| Ch$ | UCs | Ch$ | UCs | |||||||||||||||||||||
| Colas | 68,020 | 30.8 | 67,538 | 32.1 | 72,303 | 30.6 | ||||||||||||||||||
| Flavored soft drinks | 45,295 | 23.3 | 50,557 | 24.0 | 52,553 | 25.6 | ||||||||||||||||||
| Total | 113,315 | 54.1 | 118,095 | 56.1 | 124,856 | 56.2 | ||||||||||||||||||
37
As of December 31, 2019, we sold our products to approximately 58,000 customers in Paraguay. The following table highlights the type of customer in Paraguay for our products:
| Year ended December 31(1), | ||||||||||||
| 2017 | 2018 | 2019 | ||||||||||
| (%) | ||||||||||||
| Mom & Pops (2) | 34 | 34 | 36 | |||||||||
| Supermarkets | 15 | 16 | 17 | |||||||||
| On premise | 14 | 14 | 13 | |||||||||
| Wholesale distributors | 36 | 36 | 34 | |||||||||
| Total | 100 | 100 | 100 | |||||||||
| (1) | In 2019, we changed how we define our types of customer in Paraguay, and as a result we have reclassified our sales volume per type of customer for each of the years shown in the table above. |
| (2) | Mom & Pops are neighborhood stores (grocery stores, minimarkets, kiosks, liquor stores, bakeries, etc.) characterized by providing daily shopping needs, and differentiated because they are nearby, and products are available in smaller formats. |
Other Beverages: In Paraguay, we produce and distribute juices ready to be consumed under the trademark Frugos and we import and distribute seed-based drinks under the AdeS trademark. We also manufacture and sell water under the trademarks Dasani (purified water), Aquarius (flavored water), Kin (mineral water) and isotonic drinks like Powerade. We also manufacture and sell energy drinks under the trademark Monster (since May 2019).
In 2019, net sales of juices, waters, seed-based beverages, isotonic and energy drinks in Paraguay were Ch$34,036 million.
Distribution
Chile
Soft Drinks, Juices and Waters: In Chile, we distribute our products through a distribution system that includes: (i) third-party owned trucks (491 trucks) that provide an exclusive distribution service and (ii) our own trucks (234 trucks). In 2019, 88% was distributed by exclusive third-party transport companies and 12% by companies of the Andina group. Distribution of all of Andina beverages in Chile takes place from distribution centers and production facilities. In most cases, the transport company collects payment from the customer in cash or check. Where applicable, the driver also either collects empty returnable glass or PET bottles of the same type and quantity as the ones being delivered or collects cash deposits for the net returnable bottles delivered. This task is particularly significant in the Chilean territory where returnable containers accounted for approximately 44.7% of total soft drinks volume in 2019. Certain important customers (such as supermarkets), maintain accounts receivables with us, which are settled on average every 41 days after invoices are issued.
Brazil
Soft Drinks, Juices and Waters: In Brazil, we generally distribute Coca-Cola products through a distribution system that includes: (i) own trucks (ii) trucks operated by independent distributors pursuant to non-exclusive distribution arrangements, and (iii) trucks operated by independent transport companies on an exclusive basis with us. In 2019, 9.6% was distributed by exclusive distributors, 10.5% by independent transport companies and 79.9% by our own trucks. Distribution of all of Andina Brazil’s beverages takes place from distribution centers and production facilities.
Other Beverages: Andina Brazil uses its distribution system to distribute beer in the Brazilian territory. Andina Brazil started distributing beer in the 1980s as a result of the acquisition of Cervejarias Kaiser S.A. (“Kaiser”) by a consortium of Coca-Cola bottlers (including Andina Brazil) in Brazil. In March 2002, the Canadian brewing company Molson Inc. acquired Kaiser. In 2006, FEMSA acquired from Molson a controlling ownership interest in Kaiser and in 2010, Heineken acquired a controlling interest in FEMSA’s beer operation. Andina Brazil buys beer from Heineken at a price determined by Heineken and sells it to its customers with a fixed margin. In the case of certain discount sales that have been approved by Heineken, Heineken shares between 50% and 100% of the cost of such discounts. In 2019, Andina Brazil’s net sales of beer were Ch$134,701 million.
The Coca-Cola Company and the Brazilian Association of Coca-Cola Manufacturers entered into an agreement regarding the distribution through the Coca-Cola System of beer produced and imported by Heineken. The agreement was signed on March 19, 2002 and is renewable for a period of 20 years.
38
In July 2017 Heineken Brazil unilaterally notified us of the termination of the agreement by virtue of which Andina Brazil commercializes and distributes Heineken-branded beers in Brazil. Andina Brazil understood that the expiration of the agreement was scheduled for 2022 and submitted the dispute to arbitration. On October 31, 2019, a non-appealable decision was rendered in Andina Brazil’s favor. Andina Brazil continues distributing Heineken-branded products in Brazil and expects to do so until the termination of the agreement in March 2022.
Andina Brazil is not allowed to produce, bottle, sell or obtain any interest in any bottled or tap beer under any other label or in any bottle or packaging that could be confused with brand beers, except as may be mutually agreed in writing between Andina Brazil and Heineken.
Argentina
Soft Drinks, Juices and Waters: In 2019, 68% of EDASA’s Coca-Cola soft drinks were distributed by direct distribution and 32% by other distributors and wholesale distribution (indirect distribution). The direct distribution is done by a group of independent transport companies, on an exclusive basis.
Other Beverages: Andina Argentina uses its distribution system to distribute beer in the territory composed by the provinces of La Pampa, Neuquén, Río Negro, Chubut, Santa Cruz, Tierra del Fuego and the following parts of the Province of Buenos Aires: Bahía Blanca, Tornquist, Coronel M.L.Rosales, Coronel Dorrego, Villarino, Daireaux, Guamini, Adolfo Alsina, Coronel Suarez, Coronel Pringles, Saavedra, Puán, Saliqueló, Municipio Urbano de Monte Hermoso, Benito Juárez, Gonzalez Chávez, Tres Arroyos, Carmen de Patagones, Olavarría, Azul, Tapalqué, Laprida, Lamadrid, Arrecifes, Chacabuco, Colón, Pergamino, Rojas, Salto, Bartolomé Mitre, Capitán Sarmiento, 9 de Julio, 25 de Mayo, General Alvear, Chivilcoy, Alberti, Bragado, Junín, Viamonte, Arenales, L.N.Alem, Lincoln, General Pinto, Ameghino, Tres Lomas, Pehuajó, Carlos Casares, Hipólito Yrigoyen, Bolívar, Carlos Pellegrini, Trenque Lauquen, Rivadavia, Carlos Tejedor, General Villegas. Andina Argentina began distributing beer in 2012 due to the merger with Coca-Cola Polar. Since mid-2019, wine and cider have been added to the business. Andina Argentina distributes on behalf of and according to an order by CICSA (Compañía Industrial Cervecera S.A.) at a set price which is segmented for each of the regions where the contract operates, and for which Andina Argentina receives a commission.
The Coca-Cola Company and two bottlers (ex-Coca-Cola Polar Argentina S.A., today Andina Argentina, and ex Juan Bautista Guerrero S.A., today Salta Refrescos S.A. of the Arca group) executed a master agreement regarding the distribution of beer manufactured or imported by CICSA, through the Coca-Cola distribution system. The distribution master agreement was executed on June 12, 2003 for an initial period of five years, with successive extensions every three years, and the last one agreed on November 29, 2017 for a new five-year term expiring on June 12, 2022. On August 1, 2019, an addendum to this agreement was signed to amend the commissions, and include wine and cider within the scope of the distribution agreement.
In addition, on December 13, 2017, EDASA executed an agreement with Monster Energy Company for the distribution and commercialization of energy drinks of the “Monster” trademark for an initial period of 10 years in the territory within the franchise of Andina Argentina, with the consent of The Coca-Cola Company.
Paraguay
Soft Drinks, Juices and Waters: PARESA distributed 88.3% of its products through direct distribution (independent transport companies), and 11.7% through wholesale distributors.
39
Competition
We face intense competition throughout the franchise territories principally from bottlers of competing soft drink brands. See “Item 3. Key Information — Risk Factors — Risks Related to our Company—Our Business is highly competitive including with respect to price competition which may adversely affect our net profits and margins”. Our business is highly competitive including with respect to price competition which may adversely affect our net profits and margins. The following table presents the market share of our main competitors in Chile, Brazil, Argentina and Paraguay for the periods indicated:
Soft Drinks Market Share
| 2017 | 2018 | 2019 | ||||||||||||||||||||||||||||||||||||||||||||||
| Chile | Brazil | Argentina | Paraguay | Chile | Brazil | Argentina | Paraguay | Chile | Brazil | Argentina | Paraguay | |||||||||||||||||||||||||||||||||||||
| (%) | ||||||||||||||||||||||||||||||||||||||||||||||||
| Coca-Cola soft drinks | 68 | 62 | 62 | 69 | 67 | 62 | 63 | 72 | 67 | 62 | 63 | 73 | ||||||||||||||||||||||||||||||||||||
| Pepsi Bottler soft drinks | 28 | 17 | 17 | 9 | 29 | 17 | 16 | 8 | 30 | 17 | 14 | 7 | ||||||||||||||||||||||||||||||||||||
| Other soft drinks | 4 | 21 | 21 | 22 | 4 | 21 | 21 | 20 | 4 | 21 | 23 | 20 | ||||||||||||||||||||||||||||||||||||
| Total | 100 | 100 | 100 | 100 | 100 | 100 | 100 | 100 | 100 | 100 | 100 | 100 | ||||||||||||||||||||||||||||||||||||
Source: A.C. Nielsen.
Chile
Soft Drinks: The soft drink segment of the Chilean beverage industry is highly competitive. The most important areas of competition are product image, pricing, advertising, ability to deliver product in popular bottle sizes, distribution capacity, and the number of returnable bottles held by retailers or by consumers. Returnable bottles can be exchanged at the time of new purchases in lieu of paying a bottle deposit, thereby decreasing the purchase price. Our main competitor in the Chilean franchise territory is Embotelladora Chilenas Unidas or ECUSA, a subsidiary of Compañía Cervecerías Unidas S.A. or CCU, the largest brewer in Chile. ECUSA produces and distributes Pepsi-Cola products and its own brands (soft drinks and bottled water). Based on reports by A.C. Nielsen, we estimate that in 2019, our average soft drink market share within our franchise territories was 66.7%.
Other Beverages: Our principal competitor in the water segment is CCU, but there is also competition from low priced brands (“B-brands”). Our principal competitors in the juice segment are, Watt’s-CCU joint venture, Corpora Tres Montes and three of the leading dairy producers in Chile: Soprole S.A., Nestlé Chile S.A. and Loncoleche. The Chilean market for fruit-flavored beverages also includes low-cost, lower-quality fruit juice concentrates and artificially flavored powdered beverage mixes. We do not consider these products competition for our waters and juices business because we believe that these products are of lower quality and value. Based on reports by A.C. Nielsen, we estimate that in 2019, our market share within our Chilean franchise territories reached approximately 37.8% for juices and others segment and approximately 42.2% for waters.
Brazil
Soft Drinks: The soft drink segment of the Brazilian beverage industry is highly competitive. The most important areas of competition are product image, pricing, advertising and distribution capacity (including the number and location of sales outlets). According to A.C. Nielsen, our main soft drink competitor in the Brazilian territory is American Beverage Company or AmBev, the largest beer producer and distributor in Brazil and also produces soft drinks, including Pepsi-Cola products. Based on reports by A.C. Nielsen, we estimate that in 2019, our average soft drink market share within our Brazilian franchise territories was approximately 61.7%.
Other Beverages: In the beer sector, Andina Brazil’s main competitor is AmBev which during 2019 had a very dominant position in the Brazilian market. In Andina Brazil our market share for waters reached 18.3%, where we distribute under the Crystal brand mineral water and SmartWater. In the segment of juices and others our market share was 48.7%.
Argentina
Soft Drinks: The soft drink segment of the Argentine beverage industry is highly competitive. The most important areas of competition are product image, pricing, advertising, ability to produce bottles in popular sizes and distribution capacity. Our greatest competitor in Argentina is Pepsi, commercialized by InBev. The most significant B-brand competitors are: Pritty, Refresh Now (Manaos), and Produnoa (Secco). Based on reports by A.C. Nielsen, we estimate that in 2019, our average soft drink market share within our Argentine franchise territories reached approximately 62.9%.
40
Other Beverages: We service the market for plain and flavored water through the Bonaqua, Kin and Aquarius brands, through which we have 17.4% of the market. In addition, the market of juices and others is serviced through the Cepita juice brand, Powerade in isotonic and seed-based beverages AdeS, where we have a market share of 45.3%.
Paraguay
Soft Drinks: The soft drink segment of the Paraguayan beverage industry is highly competitive. The most important areas of competition are product image, pricing, advertising, ability to produce bottles in popular sizes and the number of returnable bottles held by retailers or by consumers.
Our greatest competitor, local brand “Niko/De La Costa,” is produced and bottled by Embotelladora Central S.A., which had a 9.1% market share in 2019. B-brands in Paraguay represented 22.7% of the soft drink industry. In 2019, Pepsi had a market share of 7.5%, and is produced and marketed by Vierci Group, a local franchisee. Based on reports by A.C. Nielsen, we estimate that in 2019, our average soft drinks market share within our Paraguayan franchise territories was approximately 73.4%.
Other Beverages: We are leaders in all non-carbonated categories. In waters, we have a market share of 47.6% with our Dasani, Aquarius, Tropical and Kin brands. The market for juices and others is serviced through the Frugos and AdeS brands, Powerade in sport drinks, and Monster in energy drinks, where we had a market share of 59.0% in 2019.
Seasonality
Each of our lines of business are seasonal. Most of our beverage products have their highest sales volumes during the South American spring and summer (October through March), with the exception of nectar products, which have a slightly higher sales volume during the South American winter and autumn (April through September).
Packaging
Overview
Through Envases CMF S.A. in Chile (50% owned by Andina and 50% owned by Embonor), and Andina Empaques Argentina S.A. (“AEASA”) in Argentina we produce PET bottles in both returnable and non-returnable formats and plastic caps. On average, returnable PET bottles can be used up to 12 times. Non-returnable PET bottles also are produced in various sizes and are used by a variety of soft drink producers and, in Chile, by producers of edible oil products, wine and personal hygiene products.
Sales
Total sales of AEASA reached Ch$18,509 million, of which Ch$8,730 million corresponded to sales to EDASA, Ch$2,668 million corresponded to sales to other related companies of the group and Ch$7,111 million corresponded to sales to third parties.
Competition
AEASA is the supplier of returnable bottles, preforms, plastic caps and cases for Coca-Cola Bottlers in Argentina, also supplying some formats to Coca-Cola bottlers in Chile, Bolivia and Paraguay. In Argentina, we compete principally with Alpla S.A. and Amcor.
CMF is the principal supplier of returnable bottles, non-returnable PET, plastic caps and cases for Coca-Cola bottlers in Chile. The industry in Chile presents few manufacturers of non-returnable PET bottles which are significantly smaller to those of CMF. The second national manufacturer of non-returnable PET bottles is Plasco S.A., which does not compete with CMF as it is the bottle manufacturer of ECUSA (Chilean Pepsi bottler).
Raw Materials and Supplies
The main raw materials used in the production of Coca-Cola soft drinks are concentrate, sweetener, water and carbon dioxide gas. Production also requires glass and plastic bottles, bottle caps and labels. Water used in soft drink production is treated for impurities and adjusted for taste reasons. All raw materials, especially water, are subjected to continuous quality control.
Chile
Soft Drinks: Main suppliers of raw materials for the production of soft drinks:
41
| · | Concentrate: Coca-Cola de Chile S.A. |
| · | Sweetener: Iansa Ingredientes S.A., Sucden Chile S.A. and Comercializadora de Productos Panor Ltda. |
| · | Carbon dioxide gas: Linde Gas Chile S.A. |
| · | Containers (bottles): Envases CMF S.A. (PET and RefPET), Cristalerías de Chile S.A. (glass) and Cristalerías Toro S.A.C.I. (glass). |
| · | Caps: Envases CMF S.A. and Sinea S.A. |
During 2019, 83% of the variable cost of sales for soft drinks corresponded to main raw materials and acquired finished products by Andina in Chile. The raw material cost mix is divided as follows: concentrate represents 72%; sweeteners 13%; non-returnable bottles 10%; bottle caps 3%, carbon dioxide 1% and other raw material 1%. Water does not constitute an important raw material cost. Additionally, the cost of finished products purchased from our subsidiaries, such as ECSA, is included within the cost of sales of soft drinks. These costs represent 15% of the total costs of sales of soft drinks and correspond mainly to cans, PET bottles and sweeteners.
Other Beverages: The principal raw materials used by Vital Jugos in the production of juices and as a percentage of total raw material costs, are sweeteners 2.4%, fruit pulp and juices 8.1%, concentrate 32.4%, containers 20.6%, wrapping material 4.2%, caps 3.1% and other raw material 2.6% all of which during 2019 accounted for 73.4% of total costs for sales of juice, including packaging.
The principal raw materials used by Vital Aguas in the production of still and sparkling mineral water and as a percentage of total raw material costs are: packaging 30%, concentrate 26%, caps 6%, wrapping material 4%, carbonation 1%, and other raw materials 2%, all of which during 2019 accounted for 69% of total costs for sales of water, including packaging.
Brazil
Soft Drinks: Main suppliers of raw materials for the production of soft drinks:
| · | Concentrate: Recofarma Industrias do Amazonas Ltda. |
| · | Sweetener: Usina Alta Mogiana S.A. Açúcar e Alcool. |
| · | Water: Companhia Estadual de Água e Esgotos CEDAE (only Jacarepaguá). |
| · | Preforms: Lorenpet Industria e Comercio de Plásticos Ltda. |
| · | Containers (RefPET): RioPet Embalagens S.A. |
| · | Aluminum cans and aluminum caps: Ball Embalagens Ltda. |
| · | Caps: Bericap do Brasil Ltda. |
| · | Electricity/Gas: Ecogen Rio Solucoes Energeticas S.A. |
| · | Reselling of products: Cervejarias Kaiser Brasil S.A. |
| · | Thermo-contractible: Patena Industria e Comercio de Resinas e Filmes Plasticos Ldta. |
| · | Tetra: Tetra Pak Ltda. |
| · | Juices: Citrus Juice Eireli. |
In 2019, 75.1% of the variable cost of sales for soft drinks produced by Andina Brazil corresponded to main raw materials. The cost of each raw material within the total of main raw materials is the following: concentrate (including juice used for some flavors) represents 48.0%; sugar and artificial sweeteners 17.9%; non-returnable bottles 14.4%; cans 11.8%; bottle caps 3.3%; carbon dioxide 1.8% and other raw material 2.8%.
Argentina
Main suppliers of raw materials for the production of soft drinks:
| · | Concentrate: Servicios y Productos para Bebidas Refrescantes S.R.L. |
| · | Sweetener: Complejo Azucarero Concepcion. |
| · | Carbon dioxide gas, Carbonic gas and Nitrogen: Praxair Argentina S.R.L. |
| · | Containers (bottles): Dak Americas Argentina S.A. (PET), Andina Empaques Argentina S.A. (PET and RefPET), and Cattorini Hermanos S.A.C.I.F.E.I. (glass). |
| · | Cans: Ball Beverage Can South America. |
| · | Electric energy: Compañía Administradora del Mercado Mayorista Eléctrico S.A., EPEC (CAMMESA), and Termoandes S.A. |
| · | Thermo-contractible: Rio Chico S.A. |
42
In 2019, 63.7% of the variable cost of sales for soft drinks produced by Andina Argentina corresponded to main raw materials. The cost of each raw material as a percentage of the total cost of raw materials is as follows: concentrate 60.8%, sugar and artificial sweeteners 13.9%, non-returnable bottles 16.3%, bottle caps 3.3%, carbon dioxide 0.5%, cans and caps 2.8%, and other raw materials 2.4%. Additionally, the cost of finished products purchased from third parties is included within the cost of sales of soft drinks. These costs represent 1.7% of the total costs of sales of soft drinks and correspond to can formats and other formats of soft drinks which are not produced by Andina Argentina during 2019. At the end of 2018, a canning line was installed at the Monte Cristo plant allowing us to have our own supply of this product since 2019.
PET Packaging: The principal raw material required for production of PET bottles is PET resin. During 2019, this raw material was mainly purchased from DAK Americas de Argentina S.A. and Ecopek S.A. In the case of plastic caps and cases, the main raw material required for their production is HDPE resin (high density polyethylene), which during the year 2019 was bought mainly from PBB Polisur S.A.
In 2019, AEASA’s costs for PET resin accounted for 39% of the total variable cost of its sales of PET bottles and preforms.
Paraguay
Main suppliers of raw materials for the production of soft drinks:
| · | Concentrate: Recofarma Industrias do Amazonas Ltda., and Servicios y Productos Argentina. |
| · | Sugar: Industria Paraguaya de Alcoholes S.A., and Azucarera Paraguaya S.A. |
| · | Containers (bottles): Cattorini Hnos. (glass). |
| · | Plastic caps: Andina Empaques Argentina and Sinea S.A. |
| · | Preforms: Industrias PET S.A. |
| · | Electric energy: ANDE-Administración Nacional de Electricidad. |
| · | Resale products: Alimentos de Soja S.A. and Embotelladora del Atlántico S.A. - Monster Energy. |
| · | Tetra: Tetra Pak Ltda. |
| · | Fructose: Ingredion Argentina S.R.L. and Arcor S.A. |
During 2019, 73% of the variable cost of sales for beverages produced by PARESA corresponded to main raw materials. The composition of this raw material cost is as follows: concentrate represents 48%, sugar and artificial sweeteners 19%, non-returnable bottles 14%, AdeS finished product cost 7%, bottle caps 4%, carbon dioxide 1% and other raw materials 7%.
Marketing
We and The Coca-Cola Company jointly promote and market Coca-Cola products in our franchise territories, in accordance with the terms of our respective bottler agreements. We advertise in major communications media. We focus our advertising efforts on increasing brand recognition by consumers and improving our customer relations. National advertising campaigns are designed and proposed by The Coca-Cola Company’s local affiliates, with our input at the local or regional level.
In 2019, we paid approximately 60% of the advertising and promotional expenses incurred by The Coca-Cola Company in our franchise territories. Nearly all media advertising and promotional materials for Coca-Cola soft drinks are produced and distributed by The Coca-Cola Company. See “Item 4. Information on the Company —Bottler Agreements.” Marketing and promotional programs, including television, radio and print advertising, point-of-sale advertising, sales promotions and entertainment are developed by The Coca-Cola Company for all Vital Jugos’ and Vital Aguas’ products.
Pursuant to the existing distribution agreements with Heineken and Monster, these companies are responsible for planning and managing advertising, marketing and promotional activities related to beer and energy drinks, respectively. Andina Brazil, however, is free to undertake marketing or promotional activities with Heineken’s and Monster’s prior approval. The parties have agreed to assume jointly the costs of certain promotional activities (radio or television) and for certain outdoor events which take place in the Rio de Janeiro, Espírito Santo and Ribeirão Preto regions.
In Argentina, in accordance with the existing distribution agreement with CICSA, CICSA is responsible for planning and managing advertising, marketing and promotional activities related to beer, wine and cider. Andina Argentina, however, is free to undertake marketing or promotional activities with CICSA’s prior approval. The parties have agreed that CICSA will assume the costs of promotional activities (radio, television, outdoor advertising and media) in the region.
43
In September 2016, November 2016, February 2018 and May 2019, Andina (Chile), Andina Brazil, Andina Argentina and Paraguay Refrescos, respectively, began to commercialize the energy drink, called Monster Energy. This brand is part of the collaboration agreement entered into during 2015 by The Coca-Cola Company and Monster Energy, which included the distribution of its products in the territories of the Coca-Cola System, such as Chile, Brazil, Argentina and Paraguay.
Channel Marketing
In order to provide more dynamic and specialized marketing of our products, our strategy is to divide our market into distribution channels. Our main channels are small retailers, “on premise” consumption such as restaurants and bars, supermarkets and third-party distributors. Presence in these channels entails a comprehensive and detailed analysis of the purchasing patterns and preferences of various groups of soft drinks and other beverages consumers in each type of location or distribution channel. In response to this analysis, we seek to tailor our product, price, packaging and distribution strategies to meet the particular needs of and exploit the potential of each channel.
We believe that the implementation of our channel marketing strategy also enables us to respond to competitive initiatives with channel-specific responses. This focused response capability isolates the effects of competitive pressure in a specific channel, thereby avoiding costlier market-wide responses. Our channel marketing activities are facilitated by our management information systems. We have invested significantly in creating such systems, including providing hand-held computer and data gathering equipment to support the gathering of product, consumer and delivery information, as well as applications that may be used on smartphones enabled to use these applications. All of which is required to implement our channel marketing strategies effectively for most of our sales routes in Chile, Brazil, Argentina and Paraguay. We will continue investing to increase pre-sale coverage in our territories.
Our consolidated total advertising expenditures were Ch$29,210 million, Ch$17,346 million and Ch$27,113 million in 2017, 2018 and 2019, respectively.
Bottler Agreements
General
Our status as a The Coca-Cola Company franchisee is based on the bottler agreements that the Company has entered into with The Coca-Cola Company by which it has the license to produce and distribute Coca-Cola brand products within its operating franchise territories in Chile, Brazil, Argentina and Paraguay. The Company’s operations are highly dependent on maintaining and renewing the bottler agreements which provide for the production and distribution of Coca-Cola brand products under certain terms and provisions.
The bottler agreements are international standard contracts. The Coca-Cola Company enters into with bottlers outside the United States for the sale of concentrates and beverage basis for certain Coca-Cola soft drinks and non-soft drink beverages. These are renewable upon request by the bottler and at the sole discretion of The Coca-Cola Company. We cannot assure you that the bottler agreements will be renewed upon their expiration or that they will be renewed upon the same or better terms.
Concentrates and beverage basis
The bottler agreements provide that we will purchase our entire requirement of concentrates and beverage basis for Coca-Cola soft drinks and other Coca-Cola beverages from The Coca-Cola Company and other authorized suppliers. Although under the bottler agreements, The Coca-Cola Company, in its sole discretion, may set the price of concentrates and beverage basis, among other terms, we set the price of products sold to retailers at our discretion, subject only to certain price restrictions.
As of the date of this annual report, we are the sole producer of Coca-Cola soft drinks and other Coca-Cola beverages in our franchise territories. Although this right is not exclusive, The Coca-Cola Company even though it has the ability to do so, has never authorized any other entity to produce or distribute Coca-Cola soft drinks or other Coca-Cola beverages in such territories, although we cannot assure you that in the future it will not do so. In the case of post-mix soft drinks, the bottler agreements explicitly establish such non-exclusive rights.
The bottler agreements include an acknowledgment by us that The Coca-Cola Company is the sole owner of the trademarks that identify the Coca-Cola soft drinks and other Coca-Cola beverages and of any secret formula used in concentrates.
44
Production and Distribution
All distribution must be in authorized containers. The Coca-Cola Company has the right to approve, at its sole discretion, any and all kinds of packages and containers for beverages, including their size, shape and any of their attributes. The Coca-Cola Company has the authority at its sole discretion to redesign or discontinue any package of any of the Coca-Cola products, subject to certain limitations, so long as Coca-Cola soft drinks and other Coca-Cola beverages are not all discontinued at the same time. We are prohibited from producing or handling any other beverage products, other than those of The Coca-Cola Company or other products or packages that would imitate, infringe or cause confusion with the products, trade dress, containers or trademarks of The Coca-Cola Company, or from acquiring or holding an interest in a party that engages in such activities. The bottler agreements also impose restrictions concerning the use of certain trademarks, authorized containers, packaging and labeling of The Coca-Cola Company and prohibit bottlers from distributing Coca-Cola soft drinks or other Coca-Cola beverages outside their designated territories.
The bottler agreements require us to maintain adequate production and distribution facilities; inventories of bottles, caps, boxes, cartons and other exterior packaging or materials; to undertake adequate quality control measures prescribed by The Coca-Cola Company; to develop, stimulate, and fully satisfy the demand for Coca-Cola soft drinks and other Coca-Cola beverages and that we use all approved means, and spend such funds on advertising and other forms of marketing, as may be reasonably required to meet that objective; and to maintain financial capacity as may be reasonably necessary to assure performance by us and our affiliates of our obligations before to The Coca-Cola Company. All bottler agreements require us to submit, on an annually basis, our business plans for such franchise territories to The Coca-Cola Company, including without limitation, marketing, management and promotional and advertising plans for the following year.
Advertising and marketing
The Coca-Cola Company has no obligation to contribute to our expenditures for advertising and marketing, but it may, at its discretion, contribute to such expenditures and perform independent advertising and marketing activities, as well as cooperative advertising and sales promotion that would require our cooperation and support. In each of the franchise territories, The Coca-Cola Company has been contributing approximately 40-50% of our advertising and marketing expenses, but no assurances can be given that equivalent contributions or any contributions at all will be made in the future.
Assignments and other provisions
Each bottler is prohibited from, directly or indirectly, assigning, transferring or pledging its bottler agreement, or any interest therein, whether voluntarily, involuntarily or by operation of law, without the prior consent of The Coca-Cola Company, and each bottler agreement is subject to termination by The Coca-Cola Company in the event of default by us. Moreover, no material change of ownership or control in the bottler may occur without the prior consent of The Coca-Cola Company.
Termination
The Coca-Cola Company may terminate a bottler agreement immediately by written notice to the bottler in the event that, among other events, (i) the bottler suspends payments to creditors, declares bankruptcy, is declared bankrupt, is expropriated or nationalized, is liquidated, dissolved, changes its legal structure, or pledges or mortgages its assets; (ii) the bottler does not comply with instructions and standards established by The Coca-Cola Company relating to the production of its authorized soft drink products; (iii) the bottler ceases to be controlled by its controlling shareholders (without the prior consent of The Coca-Cola Company); or (iv) the terms of the bottler agreement become contrary to the applicable law.
Either party to any bottler agreement may, within 60 days’ notice thereof to the other party, terminate the bottler agreement in case of default of the other party, provided that such default is not remedied during such period.
In addition, if a bottler does not wish to pay the required price for concentrate for any Coca-Cola products, it must notify The Coca-Cola Company within 30 days of receipt of The Coca-Cola Company’s new prices. In the case of any Coca-Cola soft drink or other Coca-Cola beverages other than Coca-Cola concentrate, the franchise regarding such product shall be deemed automatically canceled three months after The Coca-Cola Company’s receipt of the bottler’s notice of refusal. In the case of Coca-Cola concentrate, the bottler agreements shall be deemed terminated three months after The Coca-Cola Company’s receipt of the bottler’s notice of refusal.
The Coca-Cola Company may also terminate the bottler agreements if the bottler or any individual or legal entity that controls it, engages in the production of any non-Coca-Cola beverage, whether through direct ownership of such operations or through control or administration thereof, provided that, upon request, the bottler shall be given six months to remedy such situation.
45
Chile
Our licenses for the territories in Chile expire in January 2023.
In 2005 Vital S.A. and The Coca-Cola Company entered into a Juice Bottler Agreement by which The Coca-Cola Company authorized Vital S.A. to produce, prepare and bottle in packaging previously approved by The Coca-Cola Company the previously mentioned trademarks.
Andina and Embonor have the right to purchase products from Vital Jugos. This contract was renewed on January 1, 2019 and expires on December 31, 2020. Additionally, Andina, Vital Jugos and Embonor have agreed with The Coca-Cola Company to produce, bottle and commercialize these products at their respective plants.
In 2005, Vital Aguas and The Coca-Cola Company entered into a Water Manufacturing and Packaging Agreement for the preparation and packaging of beverages in connection with the Vital, Chanqueahue, Vital de Chanqueahue, and Dasani brands incorporating at the beginning of 2008 the Benedictino brand to the product portfolio manufactured by Vital Aguas under the agreement. This contract was renewed on January 1, 2019 and expires on December 31, 2020.
Brazil
Our licenses for the territories in Brazil expire in October 2022.
Argentina
Our licenses for the territories in Argentina expire in September 2022.
Paraguay
Our licenses for the territories in Paraguay expire in September 2020.
Regulation
General
We are subject to a full range of government regulations generally applicable to companies engaged in business in our franchise territories, including but not limited to labor, social security, public health, consumer protection, environmental, sanitation, employee safety, securities and anti-trust laws. Currently, no material legal or administrative proceedings are pending against us with respect to any regulatory matter in any of our franchise territories except those listed as such in “Item 3. Key Information—Risk Factors” and “Item 8. Financial Information—Contingencies”.
We believe that, to the best of our knowledge we are in compliance in all material respects with applicable statutory and administrative regulations relating to our business in each of our franchise territories.
Chile: There are no special licenses or permits specifically required to manufacture and distribute soft drinks and juices in the Chilean territory. Food and beverage producers in Chile, however, must obtain authorization from, and are supervised by the Health Ministry’s respective regional offices (Secretaría Regional Ministerial de Salud), which inspects production facilities and takes liquid samples for analysis on a regular basis. Our main plant in Renca obtained its permit to operate on October 6, 2011 which has been granted for an indefinite period. Likewise, the permits we have to operate our other plants in Chile, have also been granted for an indefinite period. In addition, production and distribution of mineral water is subject to special regulations such that mineral water may be drawn only from sources designated for such purpose by supreme decree. Certification of compliance with such decree is provided by the National Health Service, the Undersecretary’s Office of the Ministry of Health (Servicio de Salud Metropolitano del Ambiente). Our mineral water production facilities have received the required certification.
Brazil: Labor laws, in addition to mandating employee benefits, include regulations to ensure sanitary and safe working conditions in our production facilities located in Brazil. Food and beverage producers in Brazil must register their products with and receive a ten-year permit from the Ministry of Agriculture and Provisioning and the Ministry of Health. Our permits from said Ministries are valid and in force for a term of ten years for each product we produce. Although we cannot assure you that they will be renewed, we have not experienced any material difficulties in renewing our permits in the past nor do we expect to experience any difficulties in the future. The Ministries do not regularly inspect facilities, but they do send inspectors to investigate any complaints it receives.
46
Argentina: While most laws applicable to EDASA are enforced at the federal level, some, such as sanitary and environmental regulations, are primarily enforced by provincial and municipal governments. Licenses or permits are required for the manufacture or distribution of beverages in the Argentine territory, which are evidenced through national records of food establishment and food products. Additionally, our production facilities are subject to registration with federal and provincial authorities and to supervision by municipal health agencies, which certify compliance with applicable laws.
Paraguay: PARESA is registered with the Ministry of Industry and Trade in Paraguay, which issues and renews the industrial registry. Food and beverage producers in Paraguay must register with the Ministry of Health, which performs inspections of plants and monitors products in the market. Industries must also have an environmental license issued by the Ministry of Environment and Sustainable Development, which is the main body responsible for monitoring compliance with environmental laws. In addition to establishing the mandatory employee benefits, include safe working and sanitary conditions at industrial installations within Paraguay. PARESA maintains all of its licenses, permits and registrations issued by these institutions and ensures compliance with the regulations and ordinances of the municipalities where its plant is located.
Environmental Matters
It is our policy to conduct environmentally sound operations on a basis consistent with applicable laws and within criteria established by The Coca-Cola Company. Although regulation of matters relating to the protection of the environment is not as well-developed in the franchise territories as in the United States and other industrialized countries, we expect that additional laws and regulations may be enacted in the future with respect to environmental matters that may impose additional restrictions on us which could materially or adversely affect our results of operations in the future. There are no material legal or administrative proceedings pending against us in any of the franchise territories with respect to environmental matters, and we believe that, to the best of our knowledge, we are in compliance in all material respects with all environmental regulations applicable to us.
Chile
The Chilean government has several regulations governing environmental matters relating to our operations.
Law N° 19,300, addressing general environmental concerns, passed in March 1994, regulates general environmental issues and fundamental aspects applicable to our activities and that could require the hiring of independent experts to conduct studies or environmental impact statements of any future project or activity that may be affected by the provisions of Law N° 19,300. In January 2010, the aforementioned law was amended by Law N° 20,417, which created a new environmental agency, the Environment Ministry, the Environmental Assessment Service and the Environment Superintendence. In January 2012, Law N° 20,600 was published which created the Environmental Tribunals (3), which came into operation on December 2012.
Law N° 20,920 passed in June 2016, sets the framework for waste management, the extended liability of the producer and the promotion of recycling, which aims to reduce waste generation and encourage reuse, recycling and other types of valorization, in order to protect people’s health and the environment.
Brazil
Our Brazilian operations are subject to several environmental laws, none of which currently impose substantial restrictions on us. The Brazilian Constitution establishes the broad guidelines for the new treatment of environmental concerns. Environmental issues are regulated at federal, state and municipal levels. The Brazilian Constitution empowers the public authorities to develop regulations designed to preserve and restore the environment and to control industrial processes that affect human life. Violations of these regulations are subject to criminal, civil and administrative penalties.
In addition, Law N° 6,938 of 1981, known as the Brazilian Environmental Policy, introduced an environmental regime under which no environmental damage is exempt from coverage. This legislation is based on the idea that even a polluting waste tolerated under the established standards could cause environmental damage, and therefore subjects the party causing such damage to the payment of an indemnity. Moreover, as mentioned above, activities damaging to the environment lead to criminal and administrative penalties, provided for in Law N° 9,605 of 1998 or the Environmental Crimes Act.
Numerous governmental bodies have jurisdiction over environmental matters. At the federal level, the Ministério do Meio Ambiente (Brazilian Ministry of Environment) and the Conselho Nacional do Meio-Ambiente or CONAMA dictate environmental policy, including, without limitation, initiating environmental improvement projects, establishing a system of fines and administrative penalties and reaching agreements on environmental matters with offending industries. The Instituto Brasileiro do Meio Ambiente e dos Recursos Naturais Renováveis or IBAMA, enforces environmental regulations set by CONAMA, including by developing several activities for the preservation and conservation of natural heritage and controlling and supervising the use of natural resources. In addition, various federal authorities have jurisdiction over specific industrial sectors, but none of these currently affect us.
47
Finally, various state and local authorities regulate environmental matters in the Brazilian territory including the Instituto Estadual do Ambiente or INEA, the main environmental authority in Rio de Janeiro, and the Instituto Estadual de Medio Ambiente e Recursos Hídricos (“IEMA”), the main authority on environmental issues in Espirito Santo, and the Companhia de Tecnologia de Saneamento Ambiental - CETESB, the main environmental authority in São Paulo. FEEMA, IEMA and CETESB periodically inspect industrial sites. We believe that we are in compliance in all material respects with the standards established by all the governmental authorities applicable to our operations in Brazil. We cannot assure you, however, that additional regulations will not be enacted in the future, and that such restrictions would not have a material adverse effect on our results or operations. The operation in Brazil as that of Chile counts with all certifications mentioned in terms of Quality, Environment and Occupational Health and Safety and those associated with Food Safety and Best Practices in Food Processing.
Argentina
The Argentine Constitution, as amended in 1994, allows any individual who believes a third party may be damaging the environment to initiate an action against it. No action of this nature has been initiated against EDASA, but we cannot ensure that it will not be initiated in the future. Though provincial governments have primary regulatory authority over environmental matters, municipal and federal authorities also have authority competent to enact decrees and laws on environmental issues. Thus, municipalities can set policy on local environmental matters, such as waste management, while the federal government regulates inter-province environmental issues, such as transport of hazardous waste or environmental matters covered by international treaties.
In 2002, the National Congress approved federal Law N° 25,612, Comprehensive Management of Industrial Residues and Service Activities (Gestión Integral de Residuos Industriales y de Actividades de Servicios) and Law N° 25,675, General Environmental Law (Ley General del Ambiente) establishing minimum guidelines for the protection of the sustainable environmental management and the protection of biodiversity, applicable throughout Argentina. The law establishes the purposes, principles and instruments of the national environmental policy, the concept of “minimum guidelines,” the judicial purview and the rules governing environmental education and information, citizens’ participation and self-management, among other provisions.
Provincial governments within the Argentine territory have enacted laws establishing a framework for the preservation of the environment. Provincial laws that are applicable to industrial facilities at EDASA, among others are Law N° 7,343 of the Province of Córdoba and its supplemental N° 10,208 since 2014, Law N° 11,459 of the Province of Buenos Aires and Environmental Code N° 5,439 of the Chubut province. These laws contain principles on environmental policy and management, as well as rules on environmental impact assessment. They also give certain agencies jurisdiction over environmental issues.
Almost all provinces as well as many municipalities have established rules regarding the use of water, the sewage system and the disposal of liquids into underground flows of water or rivers. There are currently no claims pending against EDASA related to these rules, whose violation normally results in a fine.
Paraguay
The environmental framework comprises several national and local environmental regulations. The Paraguayan Constitution of 1992 states that everyone has the right to live in a healthy and ecologically balanced environment and has the obligation to preserve it. All damage caused to the environment will carry the obligation to repair and compensate.
Law 1561/00 chartered the three primary environmental agencies in Paraguay. These are: The Ministry of the Environment and Sustainable Development of Paraguay (Ministerio del Ambiente y Desarrollo Sostenible or “MADES”), National Environmental Council (Consejo Nacional del Ambiente or “CONAM”), and National Environmental System (Sistema Nacional del Ambiente or “SISNAM”). The Law establishes the authority and responsibility of these agencies to develop and oversee the national environmental policy.
The Ministry of the Environment and Sustainable Development is the main environmental body responsible for the development and implementation of national environmental laws and it is also the authority responsible for implementing most of the national environmental regulations and for monitoring their compliance. The CONAM is responsible for investigating and establishing the main goals in the environmental policies, which the MADES must then implement. The SISNAM is integrated by several bodies, including governmental and municipal agencies and private sector stakeholders, all interested in solving environmental issues. The SISNAM provides a discussion forum for the public and private sectors to work together collectively, developing ideas and plans to promote a sustainable development.
48
Environmental Impact: Law 294/93 states the rights and obligations that will be triggered by any damage caused to the environment and provides the obligation to restore the environment to its previous state or, if that is technically impossible, to make a payment or provide compensation.
Water Resources Act of Paraguay: Law 3239/07 on water resources establishes the sustainable management of all waters (superficial, ground, atmospheric) and the territories that generate such waters, regardless of their location, physical condition or natural occurrence within the Paraguayan territory, in order to make it socially, economically and environmentally sustainable for the people living in the territory of Paraguay. The supervising agency is the Ministry of Environment and Sustainable Development. Superficial and ground waters are property of the State’s public domain. The law establishes the following order of priority for the use of water: i) fulfillment of the needs of aquatic ecosystems; ii) social use within the home environment; iii) use and enjoyment for agricultural activities, including aquaculture; iv) use and utilization for power generation; v) use and enjoyment for other industrial activities and vi) use and enjoyment for other activities. The use of water for productive purposes is subject to the authorization granted by the State through a permit (for the use of small amounts of water) or through concessions (prior public bidding process), in both cases after the payment of applicable fees. Authorizations may be revoked based on the occurrence of situations contemplated under the law. Concessions may be expropriated for public benefit or be terminated in certain situations established by the law. In addition, a National Registry of Water Resources has been created to keep record of all individuals or legal entities that utilize water resources or engage in activities related to them.
49
| C. | ORGANIZATIONAL STRUCTURE |
The following chart presents a summary of our direct and indirect ownership interests in our subsidiaries and associated companies:

50
The following table presents information relating to the main activities of our subsidiaries and associated companies, as well as our direct and indirect ownership interests in them as of the date of this document:
| Subsidiary | Activity | Country of Incorporation |
Percentage of direct and indirect ownership | ||||
| Embotelladora Andina Chile S.A. (1)............ | Manufacture, bottle, distribute, and commercialize non-alcoholic beverages. | Chile | 99.99 | ||||
| VJ S.A. (4) | Manufacture, distribute, and commercialize all kinds of food products, juices, and beverages. | Chile | 65.00 | ||||
| Vital Aguas S.A. (4) | Manufacture, distribute, and commercialize all kinds of waters and beverages in general. | Chile | 66.50 | ||||
| Servicios Multivending Ltda. | Commercialize products through equipment and vending machines. | Chile | 99.99 | ||||
| Transportes Andina Refrescos Ltda. | Provide administrative services and management of domestic and foreign ground transportation. | Chile | 99.99 | ||||
| Transporte Polar S.A. (5) | Provide administrative services and management of domestic and foreign ground transportation. | Chile | 99.99 | ||||
| Envases Central S.A. (4) | Manufacture and packaging of all kinds of beverages and commercialize all kinds of packaging. | Chile | 59.27 | ||||
| Andina Bottling Investments S.A. (12) | Manufacture, bottle and commercialize beverages and food in general. Invest in other companies. | Chile | 99.99 | ||||
| Andina Bottling Investments Dos S.A. | Carry out exclusively foreign permanent investments and lease all kinds of real estate. | Chile | 99.99 | ||||
| Andina Inversiones Societarias S.A. | Invest in all types of companies and commercialize food products in general. | Chile | 99.99 | ||||
| Comercializadora Novaverde S.A | Process and commercialize fruits, ice cream, vegetables and food in general, under the Guallarauco trademark. | Chile | 35.00 | ||||
| Rio de Janeiro Refrescos Ltda. (8) | Manufacture and commercialize beverages in general, powdered juices and other related semi-processed products. | Brazil | 99.99 | ||||
| Embotelladora del Atlántico S.A. (2) | Manufacture, bottle, distribute, and commercialize non-alcoholic beverages. | Argentina | 99.99 | ||||
| Andina Empaques S.A. (2) | Design, produce, and commercialize plastic products mainly packaging. | Argentina | 99.98 | ||||
| Alimentos de SOJA S.A. (11) | Manufacture, commercialize, import, export, transformation, fraction, package and distribute food products and beverages in general, and their raw materials and related products and by-products. | Argentina | 14.30 | ||||
| Paraguay Refrescos S.A. (5) | Manufacture, bottle, distribute, and commercialize non-alcoholic beverages. | Paraguay | 97.83 | ||||
| Abisa Corp. | Invest in financial instruments, for its own account or on behalf of third parties. | British Virgin Islands | 99.99 | ||||
| Aconcagua Investing Ltda. (5) | Invest in financial instruments, for its own account or on behalf of third parties. | British Virgin Islands | 99.99 | ||||
| Red de Transportes Comerciales Ltda. (7) | Provide administrative services and management of domestic and foreign ground transportation. | Chile | 99.99 | ||||
51
| Associates | Activity | Country of Incorporation |
Percentage of direct and indirect ownership | ||||
| Envases CMF S.A. | Manufacture, acquire and commercialize all types of containers and packaging; and provide bottling services. | Chile | 50.00 | ||||
| Coca-Cola del Valle New Ventures S.A.(9) | Manufacture, distribute and commercialize all kinds of juices, waters and beverages in general. | Chile | 35.00 | ||||
| Leão Alimentos e Bebidas Ltda. (6) | Manufacture, bottle and commercialize beverages and food in general. Invest in other companies. | Brazil | 10.26 | ||||
| Trop Frutas do Brasil Ltda.(10) | Manufacture, commercialize and export natural fruit pulp and coconut water. | Brazil | 7.52 | ||||
| Sorocaba Refrescos S.A.(3) | Manufacture, bottle and commercialize beverages and food in general. Invest in other companies. | Brazil | 40.00 | ||||
| SRSA Participações Ltda.(3) | Purchase and sale of real estate investments and property management. | Brazil | 40.00 | ||||
| Kaik Participações Ltda. | Invest in other companies with own resources. | Brazil | 11.32 | ||||
| UBI 3 Participações Ltda | Invest in other companies with own resources. Purchase and sale of real estate investments and property management. | Brazil | 8.5 | ||||
| (1) | At the Special Shareholders’ Meeting held on November 22, 2011, the shareholders of Embotelladora Andina Chile S.A. agreed to increase its capital of the latter from Ch$10,000,000 (divided into 10,000 shares) to Ch$4,778,206,076 (divided into 4,778,206 shares). It was agreed that the capital increase was to be subscribed and paid by the shareholder Embotelladora Andina S.A. through the contribution of movable goods and real estate property, which are identified in the minutes of the Shareholders’ Meeting. |
| (2) | At the extraordinary general shareholders’ meeting held on November 1st, 2011, Embotelladora del Atlántico S.A. decided to divide part of its equity to form a new company, Andina Empaques Argentina S.A., for the purpose of developing the design, manufacture and sale of all kinds of plastic products or products derived from the industry for plastics, primarily in the packaging division. Accounting and tax effects began on January 1, 2012. |
| (3) | In October 2012, 40% of the Brazilian company Sociedad Brasilera Sorocaba Refrescos S.A. was acquired for a total price of R$146.9 million. |
| (4) | Vital Aguas, Vital Jugos, and Envases Central, modified their percentage interests, due to the merger with Embotelladoras Coca-Cola Polar in 2012. |
| (5) | Companies incorporated during 2012, due to the merger with Embotelladoras Coca-Cola Polar S.A. |
| (6) | During the first quarter of 2013, there was a reorganization of the companies that manufacture juice products and mate in Brazil, with the merger of Holdfab2 Participações Ltda. and Sistema de Alimentos de Bebidas Do Brasil Ltda. into a single company that is the legal continuing entity, namely Leão Alimentos e Bebidas Ltda. According to the current business scheme in Brazil for this company, during 2014 a 2.05% ownership interest held by Rio de Janeiro Refrescos Ltda. in Leão Alimentos e Bebidas Ltda. was sold to the rest of the bottlers’ system in Brazil. |
| (7) | Companies created to facilitate the restructuring of the distribution process in Chile. |
| (8) | During the fourth quarter of 2013 Rio de Janeiro Refrescos Ltda. acquired Companhia de Bebidas Ipiranga, which was legally merged into this entity. |
| (9) | Coca-Cola del Valle New Ventures S.A. was incorporated during 2016. |
| (10) | As a result of company restructuring in 2016, Trop Frutas do Brasil Ltda, began to depend on the group of bottlers from The Coca-Cola System in Brazil, Rio de Janeiro Refrescos Ltda, holds a 7.52% direct ownership interest in that company. |
| (11) | At the end of the fiscal year 2017, Embotelladora Andina S.A., indirectly through Embotelladora del Atlántico S.A. (EDASA) held an ownership interest of 12.96% (76,507,211 shares) in the stock capital of Alimentos de Soja S.A. On August 23, 2018, the capitalization of contributions made by the shareholders in 2017 was approved. As a result of such capitalization, EDASA maintained its ownership percentage (84,692,875 shares). On August 24, 2018, EDASA acquired 8,849,363 shares from the shareholder Salta Refrescos S.A., according to the volume quotas, and as a result the ownership interest of EDASA increased to 14.30% (93,542,238 shares). Additionally, on August 28, 2018 and December 3, 2018, two capital increases were approved for which EDASA's holding increased to 113,431,590 and then 130,449,895 shares, respectively, maintaining its ownership interest of 14.30%. |
| (12) | In November 2019, Inversiones Los Andes Ltda. (ILA) was merged into Andina Bottling Investments S.A. (ABISA) for corporate purposes. As a consequence of the merger, ILA was absorbed by ABISA, which became the owner of the shares issued by Embotelladora del Atlántico S.A. (EDASA), Aconcagua Investing Limitada and Paraguay Refrescos S.A. (PARESA), previously held by ILA. |
52
| D. | PROPERTY, PLANTS AND EQUIPMENT |
We own production plants in each of the principal population centers that comprise the franchise territories. In addition, we own distribution centers and administrative offices in each of the franchise territories. We also use (i) facilities owned by third parties through lease agreements and (ii) facilities owned by third parties through contracts other than lease agreements, such as distribution contracts. The following table sets forth our principal real property (in square meters) and other facilities that we use in each of the franchise territories:
| MAIN USE | Square meters | Property | ||||
| ARGENTINA | ||||||
| Embotelladora del Atlántico S.A. | ||||||
| Azul | Distribution Centers / Warehouses | 600 | Third Parties | |||
| Bahía Blanca* | Offices / Production of Soft Drinks / Distribution Center / Warehouses | 102,708 | Own | |||
| Bahía Blanca | Warehouses (Don Pedro) | 6,000 | Leased | |||
| Bahía Blanca | Commercial Offices | 903 | Leased | |||
| Bahía Blanca* | Real Estate (parking lot) | 73,150 | Own | |||
| Bahía Blanca | Warehouses (M&F Palletizer -EDF deposit) | 1,400 | Leased | |||
| Bariloche | Offices / Distribution Centers / Warehouses | 1,870 | Leased | |||
| Bialet Masse* | Real Estate** | 880 | Own | |||
| Bolivar | Commercial Logistic Operations | 700 | Third Parties | |||
| Bragado | Commercial Offices | 38 | Leased | |||
| Carlos Casares | Commercial Logistic Operations | 345 | Third Parties | |||
| Carlos Paz | Commercial Offices | 270 | Leased | |||
| Carmen de Patagones | Commercial Offices / Warehouses / Crossdocking | 1,600 | Leased | |||
| Chacabuco* | Offices / Distribution Centers / Warehouses | 25,798 | Own | |||
| Chivilcoy | Distribution Centers / Warehouses | 1,350 | Third Parties | |||
| Chivilcoy | Commercial Offices | 72 | Leased | |||
| Comodoro Rivadavia | Offices / Distribution Centers / Warehouses | 7,500 | Leased | |||
| Concepcion del Uruguay | Crossdocking | n/a | Third Parties | |||
| Concepcion del Uruguay | Commercial Offices | 118 | Leased | |||
| Concordia | Commercial Offices / Third party Distribution Centers / Warehouses | 1,289 | Leased | |||
| Córdoba* | Offices /Production of soft drinks and other still beverages / Distribution Centers / Warehouses / Real estate | 959,585 | Own | |||
| Córdoba (H.Primo) | Commercial Offices / parking lot / Deposit | 1,173 | Leased | |||
| Córdoba (San Isidro)* | Deposit and Offices | 8,808 | Own | |||
| Córdoba | Deposit (Cencosud) | n/a | Leased | |||
| Córdoba | Deposit (Rigar) | 8,800 | Leased | |||
| Córdoba | Deposit (Ricardo Balbín) | 2,500 | Leased | |||
| Córdoba | Deposit (Agnolon) | 6,000 | Leased | |||
| Coronel Pringles | Commercial Logistic Operations | 675 | Third Parties | |||
| Coronel Suarez | Offices / Third party Distribution Centers / Warehouses / Deposit | 1,000 | Leased | |||
| Embalse | Commercial Logistic Operations | 600 | Third Parties | |||
| General Pico* | Offices / Distribution Centers / Warehouses | 15,525 | Own | |||
| General Roca | Distribution Centers / Warehouses | 2,548 | Third Parties | |||
| Gualeguaychu | Commercial Offices / Warehouses | 2,392 | Leased |
53
| Junin (Buenos Aires) | Cross Docking | 995 | Third Parties | |||
| Junin (Buenos Aires) | Commercial Offices | 108 | Leased | |||
| Junin (Mendoza) | Commercial Offices | 234 | Leased | |||
| Mendoza* | Offices / Distribution Centers / Warehouses | 36,452 | Own | |||
| Monte Hermoso* | Real Estate** | 300 | Own | |||
| Neuquén* | Offices / Distribution Centers / Warehouses | 10,157 | Own | |||
| Olavarria | Offices / Distribution Centers / Warehouses | 3,065 | Leased | |||
| Paraná | Commercial Offices | 318 | Leased | |||
| Pehuajo | Offices / Distribution Centers / Warehouses | 1,060 | Leased | |||
| Pergamino* | Offices / Cross Docking | 15,700 | Own | |||
| Puerto Madryn | Commercial Offices | 115 | Leased | |||
| Rafaela | Commercial Logistic Operations | 1,000 | Third Parties | |||
| Rio Gallegos | Distribution Centers / Warehouses | 2,491 | Leased | |||
| Rio Grande | Offices / Distribution Centers / Warehouses | 2,460 | Leased | |||
| Río IV* | Housing | 1,914 | Own | |||
| Río IV* | Private Passageway | 5,170 | Own | |||
| Río IV* | Cross Docking | 7,482 | Own | |||
| Río IV | Commercial Offices | 93 | Leased | |||
| Rio Tercero | Commercial Logistic Operations | 600 | Third Parties | |||
| Rivadavia (Mendoza)* | Deposit** | 800 | Own | |||
| Rosario* | Offices / Distribution Centers / Warehouses / Parking Lot / Real Estate | 27,814 | Own | |||
| San Francisco | Commercial Offices | 63 | Leased | |||
| San Francisco | Crossdocking | 800 | Third Parties | |||
| San Juan* | Offices / Distribution Centers / Warehouses | 48,036 | Own | |||
| San Luis* | Commercial Offices / Distribution Centers / Warehouses | 5,205 | Own | |||
| San Martin de Los Andes | Offices / Distribution Center / Warehouses | 1,500 | Third Parties | |||
| San Nicolas | Crossdocking | 1,320 | Third Parties | |||
| San Nicolas | Commercial Offices | 50 | Leased | |||
| San Rafael | Commercial Offices | 58 | Leased | |||
| Santa Fe | Commercial Offices | 238 | Leased | |||
| Santa Rosa | Distribution Centers / Warehouses | 1,200 | Third Parties | |||
| Santo Tomé* | Administrative Offices / Distribution Centers / Warehouses | 88,309 | Own | |||
| Trelew* | Offices / Production of Soft Drinks / Distribution Centers / Warehouses | 51,000 | Own | |||
| Trelew | Warehouses | 1,500 | Leased | |||
| Trenque Lauquen | Distribution Center / Warehouses / Commercial Offices | 1,185 | Third Parties | |||
| Tres Arroyos | Offices / Crossdocking / Warehouses | 1,548 | Leased | |||
| Ushuaia | Offices / Distribution Centers / Warehouses | 1,360 | Leased | |||
| Ushuaia | Commercial Offices | 94 | Leased | |||
| Venado Tuerto | Commercial Offices / Distribution Centers / Warehouses | 2,449 | Leased | |||
| Villa Maria | Commercial Offices | 125 | Leased |
54
| Villa Maria | Crossdocking | 1,200 | Third Parties | |||
| Villa Mercedes | Commercial Offices | 70 | Leased | |||
| Villa Mercedes | Crossdocking | 600 | Third Parties | |||
| Andina Empaques Argentina S.A. | ||||||
| Buenos Aires* | Production of bottles, PET Preforms, Plastic Caps and Cases | 27,043 | Own | |||
| Buenos Aires | Deposit adjoining the production plant | 1,041 | Leased | |||
| Buenos Aires | Deposit adjoining the production plant | 940 | Leased | |||
| BRAZIL | ||||||
| Rio de Janeiro Refrescos Ltda. | ||||||
| Jacarepaguá | Offices / Production of Soft Drinks / Distribution Center / Warehouses | 249,470 | Own | |||
| Duque de Caxias* | Offices / Production of Soft Drinks / Distribution Center / Warehouses | 2,243,953 | Own | |||
| Nova Iguaçu* | Distribution Centers / Warehouses | 82,618 | Own | |||
| Bangu* | Distribution Centers | 44,389 | Own | |||
| Campos* | Distribution Centers | 36,083 | Own | |||
| Cabo Frio* | Distribution Centers** | 1,985 | Own | |||
| São Pedro da Aldeia 1* | Distribution Centers | 10,139 | Concession | |||
| Itaperuna* | Crossdocking | 2,500 | Leased | |||
| Caju 1* | Distribution Centers | 4,866 | Own | |||
| Caju 2* | Distribution Centers | 8,058 | Own | |||
| Caju 3* | Parking Lot | 7,400 | Leased | |||
| Vitória (Cariacica)* | Distribution Centers | 93,320 | Own | |||
| Cachoeiro do Itapemirim * | Crossdocking | 8,000 | Leased | |||
| Linhares* | Crossdocking | 1,500 | Leased | |||
| Ribeirão Preto | Offices / Production of Soft Drinks / Distribution Center / Warehouses | 238,096 | Own | |||
| Ribeirão Preto* | Real Estate | 279,557 | Own | |||
| Franca* | Distribution Centers | 32,500 | Own | |||
| Mococa* | Distribution Centers | 33,669 | Leased | |||
| Araraquara* | Distribution Centers | 11,658 | Own | |||
| São Paulo* | Apartment | 69 | Own | |||
| São Joao da Boa Vista, Araraquara,São Paulo* | Crossdocking | 20,773 | Own | |||
| São Pedro da Aldeia 2* | Parking Lot | 6,400 | Concession | |||
| Itaipu* | Commercial Offices | 750 | Leased | |||
| Nova Friburgo* | Commercial Offices / Crossdocking | 350 | Leased | |||
| CHILE | ||||||
| Embotelladora Andina S.A. | ||||||
| Renca* | Offices / Production of Soft Drinks / Distribution Center / Warehouses | 380,833 | Own |
55
| Renca* | Warehouses | 55,562 | Own | |||
| Renca* | Warehouses | 11,211 | Own | |||
| Renca* | Warehouses | 46,965 | Own | |||
| Carlos Valdovinos* | Distribution Centers / Warehouses | 106,820 | Own | |||
| Puente Alto * | Distribution Centers / Warehouses | 68,682 | Own | |||
| Maipú* | Distribution Centers / Warehouses | 45,833 | Own | |||
| Demetrop (Metropolitan Region) | Warehouses | n/a | Leased | |||
| Trailerlogistic (Metropolitan Region) | Warehouses | n/a | Leased | |||
| Monster (Metropolitan Region) | Warehouses | n/a | Leased | |||
| Rancagua* | Distribution Centers / Warehouses | 25,920 | Own | |||
| San Antonio* | Distribution Centers / Warehouses | 19,809 | Own | |||
| Antofagasta * | Offices / Production of Soft Drinks / Distribution Center / Warehouses | 34,729 | Own | |||
| Antofagasta * | Offices / Production of Soft Drinks / Distribution Center / Warehouses | 8,028 | Own | |||
| Calama* | Distribution Centers / Warehouses | 10,700 | Own | |||
| Tocopilla* | Distribution Centers / Warehouses | 562 | Own | |||
| Coquimbo* | Offices / Production of Soft Drinks / Distribution Center / Warehouses | 31,383 | Own | |||
| Copiapó* | Distribution Centers / Warehouses | 26,800 | Own | |||
| Ovalle* | Distribution Centers / Warehouses | 6,223 | Own | |||
| Vallenar* | Distribution Centers / Warehouses | 5,000 | Own | |||
| Illapel | Distribution Centers / Warehouses | n/a | Leased | |||
| Punta Arenas* | Offices / Production of Soft Drinks / Distribution Center / Warehouses | 109,517 | Own | |||
| Coyhaique* | Distribution Centers / Warehouses | 5,093 | Own | |||
| Puerto Natales | Distribution Centers / Warehouses | 850 | Leased | |||
| VJ S.A. | ||||||
| Renca* | Offices / Production of Juices | 40,000 | Own | |||
| Vital Aguas S.A. | ||||||
| Rengo* | Offices / Production of Waters | 573,620 | Own | |||
| Envases Central S.A. | ||||||
| Renca* | Offices / Production of Soft Drinks | 51,907 | Own | |||
| PARAGUAY | ||||||
| Paraguay Refrescos S.A. | ||||||
| San Lorenzo* | Offices / Production of Soft Drinks / Warehouses | 275,292 | Own | |||
| Coronel Oviedo* | Offices / Warehouses | 32,911 | Own | |||
| Encarnación* | Offices / Warehouses | 12,744 | Own | |||
| Ciudad del Este* | Offices / Warehouses | 14,620 | Own |
* Free of encumbrance properties.
**Inactive: facilities that are not being use currently by the Company.
Leased: facilities owned by third parties, used by the Company through a lease agreement.
Third Parties: facilities owned by third parties, used by the Company through contracts other than lease agreements, such as distribution contracts.
Own: facilities owned by the Company.
56
Capacity by Line of Business
Set forth below is certain information concerning the installed capacity and approximate average utilization of our production facilities, by line of business.
| Year Ended December 31, | ||||||||||||||||||||||||
| 2018 | 2019 | |||||||||||||||||||||||
| Annual Total Installed Capacity(1) | Average Capacity Utilization (%) | Capacity Utilization During Peak Month (%) | Annual Total Installed Capacity(1) | Average Capacity Utilization (%) | Capacity Utilization During Peak Month (%) | |||||||||||||||||||
| Soft drinks (millions of UCs): | ||||||||||||||||||||||||
| Andina Chile | 298 | 50 | 60 | 337 | 45 | 63 | ||||||||||||||||||
| Andina Brazil | 449 | 51 | 56 | 430 | 58 | 62 | ||||||||||||||||||
| Andina Argentina | 305 | 51 | 62 | 344 | 44 | 55 | ||||||||||||||||||
| Paraguay Refrescos | 114 | 46 | 63 | 118 | 45 | 59 | ||||||||||||||||||
| Other beverages (millions of UCs) | ||||||||||||||||||||||||
| Andina Chile | 22 | 43 | 54 | 22 | 50 | 72 | ||||||||||||||||||
| Andina Brazil | 39 | 49 | 52 | 45 | 47 | 42 | ||||||||||||||||||
| Andina Argentina | 92 | 47 | 56 | 105 | 25 | 36 | ||||||||||||||||||
| Paraguay Refrescos | 30 | 34 | 40 | 29 | 40 | 54 | ||||||||||||||||||
| ECSA/VJSA/VASA……………. | 103 | 55 | 60 | 115 | 49 | 54 | ||||||||||||||||||
| PET packaging (millions of bottles) (2) | 67 | 54 | 66 | 46 | 42 | 60 | ||||||||||||||||||
| Preforms (millions of preforms) (2) | 978 | 82 | 99 | 968 | 67 | 93 | ||||||||||||||||||
| Plastic caps (millions of caps) (2) | 1,000 | 60 | 94 | 1,000 | 54 | 88 | ||||||||||||||||||
| Cases(2) | 0.7 | 92 | 100 | 0.7 | 68 | 100 | ||||||||||||||||||
| (1) | Annual Total Installed Capacity assumes production of the mix of products and containers produced in 2018 and 2019. Capacity calculation was standardized for all operations. Thus, calculation considers Overall Equipment Effectiveness budgeted for the years 2018 and 2019. |
| (2) | Andina Empaques Argentina only. The annual capacity for PET packaging decreased in 2019 because a blower machine was transferred to the Córdoba plant. |
In 2019, we continued to modernize and renovate our manufacturing facilities in order to maximize efficiency and productivity. We also made significant improvements to our auxiliary services and complementary processes such as water treatment plants and effluent treatment stations. We believe we have the capacity in each of the franchise territories to meet consumer demand for each product format. Because bottling is a seasonal business with significantly higher demand during the South American summer and spring and because soft drinks are perishable, it is necessary for bottlers to carry significant over-capacity in order to meet the substantially greater seasonal demand. We assure the quality of our products through worldwide class practices and procedures maintaining quality control laboratories and structures in each production facility where raw materials are tested and where we analyze samples of our products.
As of December 31, 2019, we had total installed annual production capacity, including soft drinks, fruit juices, and water, of 1,545 million unit cases. Our primary facilities include:
| · | through Coca-Cola Andina, in the Chilean territory, four soft drink and other beverages production facilities with 23 production lines, with total installed annual capacity of 359 million unit cases (23.2% of our total installed annual capacity); |
| · | through Vital Jugos in the Chilean territory, one fruit juice production facility, with 15 production lines, with total installed annual capacity of 38 million unit cases (2.5% of our total installed annual capacity); |
| · | through Envases Central in the Chilean territory, one fruit juice production facility, with 3 production line, with total installed annual capacity of 36 million unit cases (2.3% of our total installed annual capacity); |
| · | through Vital Aguas in the Chilean territory, one mineral water production facility, with 2 production lines, with total installed annual capacity of 42 million unit cases (2.7% of our total installed annual capacity); |
| · | through Rio de Janeiro Refrescos in the Brazilian territory, three soft drink production facilities with 18 production lines with total installed annual capacity of 430 million unit cases (27.8% of our total installed annual capacity); and 10 production lines for juices, tea and water which satisfy the franchise’s needs and re-sales to other Bottlers in Brazil, with total installed annual capacity of 45 million unit cases (2.9% of our total installed annual capacity); |
| · | through Embotelladora del Atlántico in the Argentine territory, three soft drink production facilities with 17 production lines with a total installed annual capacity of 344 million unit cases (22.3% of our total installed annual capacity); three production lines for juices that covers the needs of our franchise with a total installed annual capacity of 70 million unit cases (4.5% of our total installed annual capacity), and one production line for waters and sensitive products with a total installed annual capacity of 35 million unit cases (2.3% of our total installed annual capacity); |
| · | through Andina Empaques Argentina S.A. in the Argentine territory, one production facility for bottles, preforms and plastic caps that covers the needs of the Coca-Cola system in that country. It has 13 preform injectors, two bottle blowers, two injectors for plastic caps and one production line for cases, with a total installed annual capacity of 2,015 million units considering PET bottles, preforms, plastic caps and cases; |
| · | through PARESA in the Paraguayan territory, one production facility located in San Lorenzo, with seven production lines with a total installed annual capacity of 132 million unit cases (8.5% of our total installed annual capacity); and three tetra pack lines with a total installed annual capacity of 15 million unit cases (1.0% of our total installed annual capacity). |
57
| ITEM 4A. | UNRESOLVED SECURITIES AND EXCHANGE COMMISSION STAFF COMMENTS |
Not applicable.
| ITEM 5. | OPERATING AND FINANCIAL REVIEW AND PROSPECTS |
| A. | OPERATING RESULTS 2019 |
Results of operation
Set forth below is a discussion and analysis of our results of operation for the years ended December 31, 2019, 2018 and 2017.
Our consolidated financial results for the years ended December 31, 2019, 2018 and 2017 include the results of our subsidiaries in Chile, Brazil, Argentina and Paraguay. Our consolidated financial statements reflect the results of the subsidiaries outside Chile, converted into Chilean pesos (our functional and reporting currency).
IFRS requires that assets and liabilities of our subsidiaries outside of Chile be converted from the functional currency to the presentation currency (Chilean peso) at year-end exchange rates, and that income and expense accounts are converted at monthly average exchange rates for the month in which they are recognized for those subsidiaries that do not operate in hyperinflationary economies.
In the case of our Argentine subsidiaries, which have been operating in an environment that during 2018 and 2019 was classified as hyperinflationary, the conversion criteria from the functional currency of those subsidiaries to our presentation currency is the following:
| · | The statement of financial position (balance sheet): Non-cash items are expressed in the current currency at the balance sheet date and translated to the presentation currency at the closing exchange rate. Losses and gains are included in net earnings (fiscal year income). |
| · | First adoption of a hyperinflationary economy was in 2018: Losses and gains by correction of current non-monetary items the previous year are recorded in accumulated results as of January 1, 2018. |
| · | The income statement: Income statement items are expressed in the current currency unit at the end of the reporting period, using the variation of the general price index from the date on which the expenses and revenues were accrued, and translated to the presentation currency at closing exchange rate. |
| · | Cash flow statement: Cash flow statement items are expressed in the current currency unit at the end of the reporting period and translated to the presentation currency at closing exchange rate. |
For more information on the effects of the hyper-inflationary environment in Argentina, see note 2.5 of our consolidated financial statements included herein.
The Impact of the Ongoing COVID-19 Pandemic
As a result of the impact that the ongoing COVID-19 pandemic is having across the world, including its more recent outbreak in the countries where we operate, we have taken measures necessary to protect the health and safety of our employees and to ensure the continuity of our operations. Among the measures we have taken are the following:
58
| · | the launch of a campaign to educate our employees on actions to be taken to avoid the spread of the virus; |
| · | sending home any employee that has been exposed to the virus; | |
| · | implementation of additional cleaning protocols for our facilities; |
| · | modifying certain work practices and activities, without affecting our operational standards; for instance, home office has been implemented for those employees whose work can be performed remotely, and domestic and international traveling has been canceled; and |
| · | providing personal protection and cleaning products (including face masks and sanitizers) to those employees who need to keep working at our plants and distribution centers or in the transportation of our products. |
Beginning mid-March 2020, governments around the world, including in the countries where we operate, have adopted extraordinary measures to contain the spread of COVID-19 and reduce infection rates, including, in some cases, the closing of schools, universities, shopping centers, restaurants and bars, prohibiting social gathering events, issuing stay-at-home orders and establishing quarantine requirements, imposing additional sanitary requirements on exports and imports, and limiting international travel and closing borders. Governments in the countries where we operate have also announced economic stimulus programs for families and businesses, including in Argentina a temporary restriction on workforce reductions. These government measures are affecting our Company and our customers. As these measures become more restrictive or are extended in time, our Company’s priority will continue to be to protect the health and safety of our employees and to continue operating to serve our customers and communities in the best way we can. To date, our operations have not been required to close and we are not aware of the virus affecting any significant part of our workforce.
Since mid-March 2020, as a result of the ongoing COVID-19 pandemic and government measures to contain the virus, we have experienced volatility in our sales volume across our channels. During this period, we have experienced, on a consolidated basis, a sharp decline in sales volumes in our on premise channel, which primarily consists of restaurants, bars and similar establishments that have been temporarily shut down by government measures. We have also experienced a decline in our wholesale channel and more moderate overall declines in our supermarkets and traditional channels. These changes in our sales volumes, however, have varied significantly across the four countries where we operate. Because these changes in sales volumes are very recent, and the pandemic and government measures are evolving rapidly, we believe it is too soon to draw conclusions about longer term trends in consumer spending patterns and how they may affect our future operating and financial results.
Due to uncertainties regarding the COVID-19 pandemic and the above-mentioned government restrictions, including how long these conditions may persist, and uncertainties regarding the effects they will have on our sales volumes and our business in general, we cannot predict accurately the ultimate financial impact from these new trends. In any event, we estimate that we will not face liquidity constraints, or difficulties in complying with covenants under our debt instruments. We do not anticipate any significant provisions or impairments at this time. In addition, we are reviewing our investment and expense plan for the year to adapt it to these new trends.
Factors affecting comparability
The comparability of our consolidated financial statements for 2018 and 2019 versus prior periods is influenced by the adoption of IFRS conversion rules for subsidiaries operating under a hyperinflationary economy in Argentina. This standard requires that the results of operations in Argentina be presented as if this economy were hyperinflationary from January 1, 2018 and, as a result, requires a restatement of accumulated results as of that month. In addition, due to the adoption of IAS 29, we had to translate figures from Argentinean pesos to Chilean pesos, using the closing exchange rate of the period. The IFRS standard does not require that the comparative financial information for 2017 to be restated as of the closing of 2019, since the functional currency of the reporting company is the Chilean peso.
Except as expressed in the preceding paragraph, there are no events during the periods presented that significantly affect the comparability of the figures presented.
59
Summary of Results of Operations for the Years ended December 31, 2017, 2018 and 2019
The following tables set forth our sales volume, net sales and gross profit for the years ended December 31, 2017, 2018 and 2019:
| Year ended December 31, | ||||||||||||
| 2017 | 2018 | 2019 | ||||||||||
| (millions of unit cases (1)) | ||||||||||||
| Sales volume: | ||||||||||||
| Chile | ||||||||||||
| Soft drinks | 157.7 | 154.7 | 158.2 | |||||||||
| Mineral water | 39.0 | 40.5 | 44.6 | |||||||||
| Juices | 34.3 | 36.0 | 36.1 | |||||||||
| Beer & Spirits | - | 0.2 | 0.6 | |||||||||
| Total | 231.0 | 231.4 | 239.6 | |||||||||
| Brazil | ||||||||||||
| Soft drinks | 201.7 | 201.5 | 206.8 | |||||||||
| Mineral water | 6.0 | 7.7 | 11.5 | |||||||||
| Juices | 22.2 | 24.0 | 22.3 | |||||||||
| Beer | 19.0 | 16.0 | 18.7 | |||||||||
| Total | 248.9 | 249.2 | 259.3 | |||||||||
| Argentina | ||||||||||||
| Soft drinks | 174.4 | 167.0 | 149.7 | |||||||||
| Mineral water | 26.1 | 23.2 | 18.5 | |||||||||
| Juices | 10.9 | 11.7 | 10.0 | |||||||||
| Total | 211.4 | 201.9 | 178.2 | |||||||||
| Paraguay | ||||||||||||
| Soft drinks | 54.1 | 56.1 | 56.2 | |||||||||
| Mineral water | 6.6 | 7.0 | 7.9 | |||||||||
| Juices | 4.3 | 5.0 | 5.2 | |||||||||
| Total | 65.0 | 68.2 | 69.3 | |||||||||
| (1) | Unit cases refer to 192 ounces of finished beverage product (24 eight-ounce servings) or 5.68 liters. |
Note: Totals may not sum due to rounding.
| Year ended December 31, | ||||||||||||||||||||||||
| 2017 | 2018 | 2019 | ||||||||||||||||||||||
| Ch$ millions | % of Total | Ch$ millions | % of Total | Ch$ millions | % of Total | |||||||||||||||||||
| Net sales: | ||||||||||||||||||||||||
| Chile | 551,873 | 29.8 | 570,939 | 34.1 | 608,952 | 34.2 | ||||||||||||||||||
| Brazil | 603,898 | 32.7 | 540,510 | 32.3 | 619,321 | 34.8 | ||||||||||||||||||
| Argentina | 553,788 | 30.0 | 413,561 | 24.7 | 394,636 | 22.2 | ||||||||||||||||||
| Paraguay | 141,277 | 7.6 | 149,588 | 8.9 | 158,892 | 8.9 | ||||||||||||||||||
| Inter-country eliminations (1) | (1,957 | ) | (0.1 | ) | (1,682 | ) | (0.1 | ) | (2,776 | ) | (0.2 | ) | ||||||||||||
| Total net sales | 1,848,879 | 100.0 | 1,672,916 | 100.0 | 1,779,025 | 100.0 | ||||||||||||||||||
| (1) | Eliminations represent intercompany sales. |
Note: Totals may not sum due to rounding.
60
The following tables set forth our results of operations for the years ended December 31, 2018 and 2019.
| Year ended December 31, | ||||||||||||||||
| 2018 | 2019 | |||||||||||||||
| Ch$ millions | % of net sales | Ch$ millions | % of net sales | |||||||||||||
| Net sales | 1,672,916 | 100.0 | 1,779,025 | 100.0 | ||||||||||||
| Cost of sales | (968,028 | ) | (57.9 | ) | (1,048,344 | ) | (58.9 | ) | ||||||||
| Gross profit | 704,888 | 42.1 | 730,681 | 41.1 | ||||||||||||
| Distribution, administrative and sales expenses | (479,518 | ) | (28.7 | ) | (492,900 | ) | (27.7 | ) | ||||||||
| Other (expense) income, net (1) | (72,354 | ) | (4.3 | ) | (1,368 | ) | (0.1 | ) | ||||||||
| Income taxes | (55,565 | ) | (3.3 | ) | (61,167 | ) | (3.4 | ) | ||||||||
| Net income | 97,451 | 5.8 | 175,246 | 9.9 | ||||||||||||
| (1) | Includes other expenses, other income (expense), financial income, financial costs, share in profit of investees accounted under the equity method, foreign exchange gains (losses) and gains (losses) from indexed financial assets and liabilities. |
| Chile | Brazil | Argentina | Paraguay | Eliminations | Total (1) | |||||||||||||||||||||||||||||||||||||||||||
| Millons Ch$ | 2018 | 2019 | 2018 | 2019 | 2018 | 2019 | 2018 | 2019 | 2018 | 2019 | 2018 | 2019 | ||||||||||||||||||||||||||||||||||||
| Net sales | 570,939 | 608,952 | 540,510 | 619,321 | 413,561 | 394,636 | 149,588 | 158,892 | (1,682 | ) | (2,776 | ) | 1,672,916 | 1,779,025 | ||||||||||||||||||||||||||||||||||
| Cost of sales | (336,720 | ) | (359,466 | ) | (329,529 | ) | (384,839 | ) | (214,648 | ) | (214,447 | ) | (88,813 | ) | (92,368 | ) | 1,682 | 2,776 | (968,028 | ) | (1,048,344 | ) | ||||||||||||||||||||||||||
| Gross profit | 234,219 | 249,486 | 210,981 | 234,482 | 198,913 | 180,189 | 60,775 | 66,524 | — | — | 704,888 | 730,681 | ||||||||||||||||||||||||||||||||||||
| Distribution, administrative and sales expenses | (152,088 | ) | (161,508 | ) | (131,499 | ) | (144,297 | ) | (159,146 | ) | (148,150 | ) | (31,688 | ) | (34,073 | ) | — | — | (474,421 | ) | (488,028 | ) | ||||||||||||||||||||||||||
| Corporate expenses | — | — | — | — | — | — | — | — | — | — | (5,097 | ) | (4,872 | ) | ||||||||||||||||||||||||||||||||||
| (1) | Totals may not sum due to rounding. |
Net Sales
Our sales volume was 746.4 million unit cases during the year ended December 31, 2019, a 0.6% decrease compared to 750.6 million unit cases in 2018. Volume for soft drinks decreased 1.5%, volume for juices decreased 3.9%, while waters increased 5.3% and beer and spirits increased 19.6%, in each case during the year ended December 31, 2019, compared to 2018. The increase of sales volume of beer and spirits is explained by sales increase in the sales of beer in Brazil due to the expansion of the sales area during 2019 and consumer preference of Heineken brand, and by the sales increase of spirits in Chile due to the agreements signed with Diageo and Capel in May 2018 and October 2019, respectively.
Our net sales were Ch$1,779,025 million during the year ended December 31, 2019, a 6.3% increase compared to Ch$1,672,916 million during 2018. Our net sales increased mainly as a result of increased sales in Brazil, Chile and Paraguay, mainly due to the positive volumes in those countries, and higher average revenue per unit case sold. This was partially offset by lower sales in Argentina, mainly as a result of the decrease in sales volume.
Soft drinks represented 67.9% of net sales during the year ended December 31, 2019, compared to 69.7% during 2018.
Chile
Our sales volume in Chile was 239.6 million unit cases during the year ended December 31, 2019, a 3.5% increase compared to 231.4 million unit cases during 2018. Volume for soft drinks, juices, waters, beer and spirits in Chile increased 2.2%, 0.4%, 10.1% and 305.4%, respectively, in each case during the year ended December 31, 2019, compared to 2018.
61
Our average market share for soft drinks in Chile during the year ended December 31, 2019, according to A.C. Nielsen Company, was 66.7% (in terms of volume), compared to 66.8% for 2018, and 68.9% (in terms of average sales), compared to 69.2% for 2018.
Our net sales in Chile were Ch$608,952 million during the year ended December 31, 2019, a 6.7% increase compared to Ch$570,939 million during 2018, which is explained mainly by the aforementioned increase in volume sold and higher revenues per unit case.
Our net sales of soft drinks in Chile were Ch$408,468 million during the year ended December 31, 2019, a 4.5% increase when compared to Ch$390,782 million in 2018, primarily as a result of higher revenues per unit case and higher volume sold. Our net sales of juices, waters, beer and spirits in Chile were Ch$200,484 million during the year ended December 31, 2019, a 11.3% increase compared to Ch$180,157 million during 2018, primarily as a result of higher revenues per unit case and higher volume.
Brazil
Our sales volume in Brazil was 259.3 million unit cases during the year ended December 31, 2019, a 4.1% increase compared to 249.2 million unit cases during 2018. Volume for soft drinks, waters and beer in Brazil increased 2.6%, 49.6% and 16.9%, respectively, while volume for juices decreased 7.0%, in each case during the year ended December 31, 2019, compared to 2018. The increase of sales volume of waters is explained by the increase in the production in Duque de Caxias plant, which enabled us to reduce prices, improve our competitiveness and expand our coverage in the territory, and thereby increasing the sales volume during 2019. As aforementioned, the increase of sales volume of beer is explained by the expansion of the sales area in 2019 and consumer preference of Heineken brand.
Our average market share for soft drinks in Brazil, during the year ended December 31, 2019, according to A.C. Nielsen Company, was 61.7% (in terms of volume), compared to 62.0% for 2018, and 68.1% (in terms of average sales), compared to 67.6% for 2018.
Our net sales in Brazil were Ch$619,321 million during the year ended December 31, 2019, a 14.6% increase compared to Ch$540,510 million during 2018.
Our net sales of soft drinks in Brazil were Ch$360,792 million during the year ended December 31, 2019, a 10.7% increase compared to Ch$326,016 million during 2018. In local currency, net sales of soft drinks increased 9.3%, mainly as a result of higher revenues per unit case and higher volume sold. Our net sales of juices, waters and beer in Brazil were Ch$258,530 million during the year ended December 31, 2019, a 20.5% increase compared to Ch$214,494 million during 2018. In local currency, net sales of juices, water and beer increased 19.1%, mainly as a result of the increase in volume sold as well as higher average revenues per unit case sold.
Argentina
Our sales volume in Argentina was 178.2 million unit cases during the year ended December 31, 2019, a 11.7% decrease compared to 201.9 million unit cases during 2018. Volume for soft drinks in Argentina decreased 10.4%, waters decreased 20.0%, and volume for juices decreased by 14.3%, in each case during the year ended December 31, 2019 compared to 2018. The decrease of sales volumes is explained by the negative macroeconomic environment faced by the country during 2019.
Our average market share for soft drinks in Argentina during the year ended December 31, 2019, according to A.C. Nielsen Company, was 62.9% (in terms of volume), compared to 62.6% for 2018, and 71.6% (in terms of average sales), compared to 70.0% for 2018.
Our net sales in Argentina were Ch$394,636 million during the year ended December 31, 2019, a 4.6% decrease compared to Ch$413,561 million during 2018. This was mainly explained by the decrease in sales volume and partially compensated by the effect of the conversion of results into Chilean pesos and a higher average revenue per unit case sold.
Our net sales of soft drinks in Argentina were Ch$313,866 million during the year ended December 31, 2019, a 5.1% decrease compared to Ch$330,875 million during 2018. In local currency, net sales of soft drinks decreased 9.7% in real terms, mainly as a result of the lower volume sold. Our net sales of juices and waters in Argentina were Ch$70,923 million during the year ended December 31, 2019, a 4.8% decrease compared to Ch$74,528 million during 2018. In local currency, net sales of juices and water decreased 28.3% in real terms, mainly due to the previously mentioned decline in volumes, and partially offset by a higher average price per unit case sold.
62
Paraguay
Our sales volume in Paraguay was 69.3 million unit cases during the year ended December 31, 2019, a 1.7% increase compared to 68.2 million unit cases during 2018. Volume for soft drinks, juices and waters in Paraguay increased 0.1%, 4.1% and 12.5%, respectively, in each case during the year ended December 31, 2019, compared to 2018.
Our average market share for soft drinks in Paraguay during the year ended December 31, 2019, according to A.C. Nielsen Company, was 73.4% (in terms of volume) compared to 71.6% for 2018, and 78.3% (in terms of average sales) compared to 77.4% for 2018 according to the same source.
Our net sales in Paraguay were Ch$158,892 million during the year ended December 31, 2019, a 6.2% increase compared to Ch$149,588 million during 2018, mainly resulting from higher revenues per unit case in local currency and increased volume.
Our net sales of soft drinks in Paraguay were Ch$124,856 million during the year ended December 31, 2019, a 5.7% increase compared to Ch$118,095 million during 2018, primarily as a result of higher revenues per unit case in local currency. In local currency, our net sales of soft drinks increased 4.6%, primarily as a result of higher revenues per unit case. Our net sales of juices and waters in Paraguay were Ch$34,036 million during the year ended December 31, 2019, an 8.1% increase compared to Ch$31,493 million during 2018, primarily as a result of higher volume. In local currency, net sales of juices and waters increased by 6.8%, primarily as a result of the increase in sales volume, which was partially offset by a lower average price per unit case sold.
Cost of Sales
Our cost of sales was Ch$1,048,344 million during the year ended December 31, 2019, an 8.3% increase, compared to Ch$968,028 million during 2018. The cost of sales per unit case increased 8.9% in the same period. This increase was mainly due to (i) the higher volume sold in Brazil and in Chile, (ii) the effect of the devaluation of the Argentine peso and the Paraguayan guaraní on our dollarized costs, (iii) a greater cost of concentrate in Brazil, and (iv) a shift in the mix towards products carrying a higher unit cost in Brazil and Chile. The foregoing was partially offset by (i) the lower cost of sugar in the four countries in which we operate, and (ii) the lower sales volume in Argentina. Our cost of sales represented 58.9% of net sales for the year ended December 31, 2019, compared to 57.9% for 2018.
Chile
Our cost of sales in Chile was Ch$359,466 million during the year ended December 31, 2019, a 6.8% increase compared to Ch$336,720 million during 2018. The cost of sales per unit case increased 3.1% in the same period. This was mainly due to (i) greater volume sold, (ii) the shift in the mix towards products that carry a higher unit cost, and (iii) a higher cost of PET resin. This was partially offset by a lower cost of sugar. Our cost of sales in Chile represented 59.0% of net sales in Chile for both the year ended December 31, 2019, and the year ended December 31, 2018.
Brazil
Our cost of sales in Brazil was Ch$384,839 million during the year ended December 31, 2019, a 16.8% increase compared to Ch$329,529 million during 2018. The cost of sales per unit case increased 12.2% in the same period. In local currency total cost of sales increased 15.4%, mainly due to (i) greater concentrate costs generated as a consequence of the decrease of Manaus IPI (lower tax credit), and the increase in price in some of our categories (ii) the increase in our sales volumes, and (iii) the shift in the mix towards products carrying a greater unit price, such as beer. This was partially offset by the lower sugar prices and the lower use of sugar given the reformulations we implemented. Our cost of sales in Brazil represented 62.1% of net sales in Brazil for the year ended December 31, 2019, compared to 61.0% for 2018.
Argentina
Our cost of sales in Argentina was Ch$214,447 million during the year ended December 31, 2019, a 0.1% decrease compared to Ch$214,648 million during 2018. The cost of sales per unit case increased 13.2% in the same period. In local currency (in real terms, based on currency rates as of December 2019) cost of sales decreased 4.9% mainly due to (i) lower sales volumes, (ii) lower sugar costs, and (iii) lower labor costs. This was partially offset by the effect of the devaluation of the Argentine peso over our dollarized costs. Our cost of sales in Argentina represented 54.3% of net sales in Argentina for the year ended December 31, 2019, compared to 51.9% for 2018.
63
Paraguay
Our cost of sales in Paraguay was Ch$92,368 million during the year ended December 31, 2019, a 4.0% increase compared to Ch$88,813 million during 2018. Cost of sales per unit case increased 2.3% during the same period. In local currency, cost of sales increased 2.9%. This is mainly explained by the negative impact of the devaluation of local currency on our dollarized costs and was partially offset by the reduction in sugar and fructose prices. Our cost of sales in Paraguay represented 58.1% of net sales in Paraguay for the year ended December 31, 2019, compared to 59.4% for 2018.
Gross Profit
Due to the factors described above, our gross profit was Ch$730,681 million during the year ended December 31, 2019, a 3.7% increase compared to Ch$704,888 million during 2018. Our gross profit represented 41.1% of our net sales during the year ended December 31, 2019, compared to 42.1% of our net sales in 2018.
Distribution, administrative and sales expenses
We had distribution, administrative and sales expenses of Ch$492,900 million during the year ended December 31, 2019, a 2.8% increase compared to Ch$479,518 million during 2018. This increase in distribution, administrative and sales expenses, was mainly due to (i) greater freight costs in Brazil, Chile and Paraguay, (ii) greater labor costs in Brazil, Chile and Paraguay, and (iii) higher advertising expenses in Brazil, Chile and Paraguay. This was partially offset by (i) the effect of lower volumes on distribution expenses in Argentina and (ii) lower labor expenses and services provided by third parties in Argentina, which grew below local inflation levels. Our distribution, administrative and sales expenses represented 27.7% of our net sales during the year ended December 31, 2019, compared to 28.7% for 2018.
Chile
In Chile, our distribution, administrative and sales expenses were Ch$161,508 million during the year ended December 31, 2019, a 6.2% increase compared to Ch$152,088 million during 2018. This was mainly due to greater labor costs, greater distribution expenses and higher advertising expenses. Our distribution, administrative and sales expenses in Chile represented 26.5% of our net sales in Chile during the year ended December 31, 2019, compared to 26.6% for 2018.
Brazil
In Brazil, our distribution, administrative and sales expenses were Ch$144,297 million during the year ended December 31, 2019, a 9.7% increase compared to Ch$131,499 million during 2018. In local currency, they increased 8.2%, mainly due to (i) greater advertising expenses, (ii) greater distribution freight expenses, and (iii) greater labor costs. Our distribution, administrative and sales expenses in Brazil represented 23.3% of our net sales in Brazil during the year ended December 31, 2019, compared to 24.3% for 2018.
Argentina
In Argentina, our distribution, administrative and sales expenses were Ch$148,150 million during the year ended December 31, 2019, a 6.9% decrease compared to Ch$159,146 million during 2018. In local currency (in real terms, based on currency rates as of December 2019), the distribution, administrative and sales expenses decreased 11.4%, mainly due to (i) the effect of lower volumes over distribution expenses, (ii) lower labor costs and services provided by third parties, which grew below local inflation levels, and (iii) the reverse of a provision related to local taxes. Our distribution, administrative and sales expenses in Argentina represented 37.5% of our net sales in Argentina during the year ended December 31, 2019, compared to 38.5% for 2018.
Paraguay
In Paraguay, our distribution, administrative and sales expenses were Ch$34,073 million during the year ended December 31, 2019, a 7.5% increase, compared to Ch$31,688 million during 2018. The distribution, administrative and sales expenses in local currency in Paraguay increased 6.5%, which is mainly due to (i) greater labor costs, (ii) greater advertising expenses, and (iii) higher freight expenses. Our distribution, administrative and sales expenses in Paraguay represented 21.4% of our net sales in Paraguay during the year ended December 31, 2019, compared to 21.2% for 2018.
64
Other Income (Expense), Net
The following table sets forth our other income (expense), net for the year ended December 31, 2018 and 2019:
| Year Ended December 31, | ||||||||
| 2018 | 2019 | |||||||
| (in millions of Ch$) | ||||||||
| Other income (expense) | (16,157 | ) | 14,767 | |||||
| Financial income | 3,940 | 45,156 | ||||||
| Financial costs | (55,015 | ) | (46,209 | ) | ||||
| Share of income (losses) from affiliated companies and joint business that are accounted for using the equity method | 1,411 | (3,415 | ) | |||||
| Exchange rate differences | (1,449 | ) | (4,131 | ) | ||||
| Gain (loss) from differences in indexed financial assets and liabilities | (5,085 | ) | (7,536 | ) | ||||
| Other income (expense), net | (72,354 | ) | (1,368 | ) | ||||
We had other expenses, net, of Ch$1,368 million during the year ended December 31, 2019, a 98.1% decrease compared to Ch$72,354 million during 2018. The decrease is mainly explained by the recognition of a tax credit in Brazil and its monetary restatement, which impacted by Ch$40,282 million in other income and by Ch$35,543 million in financial income (net of financial costs), respectively. This decrease in expenses is partially offset by a greater recognition of losses from investments in related companies (Leão Alimentos e Bebidas Ltda.), because a write-off of fixed assets due to an impairment recognition.
Income Taxes
We had income taxes of Ch$61,167 million during the year ended December 31, 2019, a 10.1% increase compared to Ch$55,565 million during 2018. This increase is mainly explained by the recognition of income tax resulting from tax credits from previous years recognized by the operation in Brazil, which involved an increase in income tax by Ch$25,780 million in 2019. This increase in income tax expenses is partially offset by the depreciation of the Chilean peso against the dollar (7.8%) which led to the recognition of tax expenses derived from the exchange rate differences.
Net Income
Due to the factors described above, we had net income of Ch$175,246 million during the year ended December 31, 2019, an 79.8% increase compared to Ch$97,451 million during 2018. Our net income represented 9.9% of our net sales during the year ended December 31, 2019, compared to 5.8% for 2018.
Summary of Results of Operations for the Years ended December 31, 2017 and 2018
For information regarding the results of operations for the years ended December 31, 2017 and December 31, 2018, See “Item 5. Operating and Financial Review and Prospects –A. Operating Results 2018 –Summary of Results of Operations for the years ended December 31, 2016, 2017 and 2018” in our Company’s annual report on Form 20-F for the fiscal year endede December 31, 2018.
Basis of Presentation
The aforementioned discussion should be read in conjunction with and is qualified in its entirety by reference to the consolidated financial statements, including the notes thereto.
These consolidated financial statements have been prepared in accordance with IFRS issued by the IASB.
These financial statements reflect the consolidated financial position of Embotelladora Andina S.A. and its subsidiaries as of December 31, 2019 and 2018 as well as the operating results, changes in shareholders’ equity and cash flows for the years ended December 31, 2019, 2018 and 2017, all of which were approved by the board of directors on April 16, 2020.
65
Our consolidated financial results include the results of our subsidiaries located in Chile, Brazil, Argentina and Paraguay. Our subsidiaries outside Chile prepare their financial statements in accordance with IFRS and to comply with local regulations in accordance with generally accepted accounting principles of the country in which they operate. The consolidated financial statements reflect the results of the subsidiaries outside of Chile, converted to Chilean pesos (functional and reporting currency of the parent company) and are presented in accordance with IFRS. The IFRS require that balances of subsidiaries be converted from their functional currency to the presentation currency (Chilean peso). The conversion for subsidiaries operating in non-hyperinflationary environments (Brazil and Paraguay) is performed by converting the assets and liabilities of subsidiaries at year-end exchange rates, and income and expense accounts must be converted at monthly average exchange rates of the month in which they are recognized. In the case of subsidiaries operating in hyperinflationary environments (Argentina), non-monetary assets and liabilities and income statements are restated by the inflation rate of the hyperinflationary economy, bringing its effects to the income statement. These restated balances are converted from the functional currency to the presentation currency at the closing exchange rate of each year.
Critical Accounting Estimates
Discussion of critical accounting estimates
In the ordinary course of business, we have made a number of estimates and assumptions relating to the reporting of our results of operations and financial position in the preparation of financial statements in conformity with IFRS. We cannot assure you that actual results will not differ from those estimates. We believe that the following discussion addresses our most critical accounting policies, which are those that are most important to the portrayal of our financial condition and results of operations and require management’s most difficult, subjective and complex judgments, often as a result of the need to make estimates and assumptions about the effect of matters that are inherently uncertain. For a more detailed discussion of accounting policies significant to our operations, please see Note 2 to our Consolidated Financial Statements.
Impairment of goodwill and intangible assets of indefinite useful life
The Company tests if goodwill and intangible assets of indefinite useful life have suffered impairment loss on an annual basis or whenever there are indicators of impairment. The recoverable amounts of cash generating units are determined based on calculations of the value in use. The key variables that management calculates include the volume of sales, prices, marketing expenses and other economic factors. The estimation of these variables requires a material administrative judgment as those variables imply inherent uncertainties. However, the assumptions are consistent with our internal planning. Therefore, management evaluates, and updates estimates according to the conditions affecting the variables. If these assets are deemed to have become impaired, they will be written off at their estimated fair value or future recovery value according to discounted cash flows. Discounted free cash flows in the cash generating unit of the Parent Company in Chile as well as the subsidiaries in Brazil, Argentina and Paraguay generated greater values than their respective assets, including goodwill for the Brazilian, Argentine and Paraguayan subsidiaries.
Fair value of assets and liabilities
IFRS requires, in certain cases, that assets and liabilities be recorded at their fair value. Fair value is the amount at which an asset can be purchased or sold or the amount at which a liability can be incurred or liquidated in an actual transaction among parties duly informed under conditions of mutual independence, different from a forced liquidation.
The basis for measuring assets and liabilities at fair value are the current prices in the active market. Lacking such an active market, we estimate said values based on the best information available, including the use of models or other valuation techniques.
We estimated the fair value of the intangible assets acquired as a result of mergers and acquisitions based on the multiple period excess earning method, which implies the estimation of future cash flows generated by intangible assets, adjusted by cash flows that do not come from intangible assets, but from other assets. For this, we estimated the time during which the intangible asset will generate cash flows, the cash flows themselves, cash flows from other assets and a discount rate.
Other assets acquired and implicit liabilities in the business combination are carried at fair value using valuation methods that are considered appropriate under the circumstances including the cost of depreciated recovery and recent transaction values for comparable assets, among others. These methodologies require certain inputs to be estimated, including the estimation of future cash flows.
66
Allowances for expected credit losses
We evaluate the possibility of collecting trade accounts receivables using several factors. We apply a simplified approach in calculating expected credit losses. Accordingly, we do not track changes in credit risk, but instead recognize a loss allowance based on lifetime expected credit losses at each reporting date. We have established a provision matrix that is based on our historical credit loss experience, adjusted for forward-looking factors specific to the debtors and the economic environment.
Useful life, residual value and impairment of property, plant, and equipment
Property, plant, and equipment are recorded at cost and depreciated using the straight-line method over the estimated useful life of those assets. Changes in circumstances, such as technological advances, changes to our business model, or changes in our capital strategy might modify the effective useful lives compared to our estimates. Whenever we determine that the useful life of property, plant and equipment might be shortened, it depreciates the excess between the net book value and the estimated recoverable amount according to the revised remaining useful life. Factors such as changes in the planned use of manufacturing equipment, dispensers, and transportation equipment or computer software could make the useful lives of assets shorter. We review the impairment of long-lived assets each time events or changes in circumstances indicate that the book value of any of those assets might not be recovered. The estimate of future cash flows is based, among other things, on certain assumptions about the expected operating profits in the future. Our estimates of discounted cash flows may differ from real cash flows because of, among other reasons, technological changes, economic conditions, changes in the business model, or changes in the operating profit. If the sum of discounted cash flows that have been projected (excluding interest) is less than the carrying value of the asset, the asset will be written down to its estimated recoverable value.
Liabilities for bottle and case collateral
We have a liability for deposits received for bottles and cases provided to our customers and distributors. The liability represents the deposit value that we may be required to remit upon receipt from the customer or distributor of the bottles and cases, in good condition, along with the original invoice. The liability is not subject to price level restatements as per current agreements with customers and distributors. We estimate the liability for deposits based on a periodic inventory of bottles loaned to customers and distributors, estimates of bottles in circulation and a weighted average historical deposit value per bottle or case. Significant management judgment is involved in estimating the number of bottles in circulation, the deposit value that could be subject to redemption and the timing of disbursements related to this liability.
Impact of Foreign Currency Fluctuations
Pursuant to the methodology of conversion of IFRS, the assets and liabilities of the subsidiaries of Brazil and Paraguay are converted from their functional currency (Brazilian real and Paraguayan guaraní, respectively) to the presentation currency of the Parent company (Chilean peso), at the closing exchange rate, and income accounts at the exchange rate of the date of each transaction or at the average exchange rate of each month in which these are performed. In the case of subsidiaries operating in hyperinflationary environments (Argentina, beginning in 2018), non-monetary assets and liabilities and income statements items are restated by the inflation rate of the hyperinflationary economy, bringing its effects to the income statement. These restated balances are converted from the functional currency to the presentation currency at the closing exchange rate of each year. The effects of these conversions are presented as other comprehensive income not affecting the results of the fiscal years ended as of December 31, 2017, 2018 and 2019. The conversion effect resulting from bringing assets and liabilities (including the effects of intercompany accounts designated as an integral part of the investment) from the functional currency to the presentation currency, according to the methodology described above, resulted in a decrease of other comprehensive income of Ch$32,402 million in 2019 (a net decrease of Ch$69,597 million in 2018 and a net decrease of Ch$68,333 million in 2017).
In order to protect us from the effects on income resulting from the volatility of the Brazilian real and the Chilean peso against the U.S. dollar, we maintain derivative contracts (cross currency swaps) to cover almost 100% of U.S. dollar-denominated financial liabilities.
Additionally, according to our currency hedge policy, we enter into forward contracts on a monthly basis to protect against the risk of variation of the U.S. dollar against our local currencies, which has an impact on some of our principal raw materials. Our balance sheets reflect these dollar forward contracts against the Argentine peso, the Brazilian real, the Chilean peso and the Paraguayan guaraní.
The mark to market of these contracts are recorded according to the hedge accounting methodology outlined in IFRS standards, i.e., the valuation at fair value is carried to equity accounts, and when the effect on results of the hedged item occurs, the effects of derivatives contracts, are recycled from equity to operating results. For further information about the instruments we use to protect against foreign currency risk, see “Item 11. Quantitative and Qualitative Disclosures about Market Risk—Foreign Currency Risk”.
67
Impact of Governmental Policies
Our business is dependent upon the economic conditions prevailing in our countries of operation. Various governmental economic, fiscal, monetary and political policies, such as those related to inflation or foreign exchange, may affect these economic conditions, and in turn may impact our business. These government policies may also affect investments by our shareholders.
For a discussion of political factors and governmental, economic, fiscal and monetary policies that could materially affect investments by U.S. shareholders as well as our operations, please refer to “Item 3. Key Information—Risk Factors” and “Item 10. Additional Information”.
| B. | LIQUIDITY AND CAPITAL RESOURCES |
Capital Resources, Treasury and Funding Policies
The products we sell are usually paid for in cash or short-term credit, and therefore our main source of financing comes from the cash flow of our operations. This cash flow has been generally sufficient to cover the investments necessary for the normal course of our business, as well as the distribution of dividends approved at our general shareholders meeting. Nevertheless, in 2013 we issued international bonds to finance the acquisition of the 100% stake of Ipiranga in Brazil for R$1,155 million (equivalent to Ch$261,245 million). Should additional funding be required for potential future investments in geographic expansion or other needs, our main sources of financing are expected to be: (i) debt offerings in the Chilean and foreign capital markets (ii) borrowings from commercial banks, both internationally and in the local markets where we have operations; and; (iii) public equity offerings.
Certain restrictions could exist to transfer funds from our operating subsidiaries to our parent company, however during 2019, we received dividends from subsidiaries in Argentina, Brazil and Paraguay. On September 1, 2019, the Argentine government reinstated certain exchange restrictions. We cannot assure you that we will not face restrictions in the future regarding the distribution of dividends from our foreign subsidiaries.
Our management believes that we have access to financial resources to maintain our current operations and provide for our current capital expenditure and working capital requirements, scheduled debt payments, interest and income tax payments and dividend payments to shareholders.
The amount and frequency of future dividends to our shareholders will be determined at the general shareholders meeting upon the proposal of our board of directors in light of our earnings and financial condition at such time, and we cannot assure you that dividends will be declared in the future. However, it should be noted that Chilean Corporate Law requires us to distribute at least 30% of any profits generated each year.
Our board of directors has been empowered by our shareholders to define our financing and investment policies. Our bylaws do not define a strict financing structure, nor do they limit the types of investments we may make. Traditionally, we have preferred to use our own resources to finance our investments.
Our financing policy contemplates that each subsidiary finance its own operations. From this perspective, each subsidiary’s management focuses on cash generation and should establish clear targets for operating income, capital expenditures and levels of working capital. These targets are reviewed on a monthly basis to ensure that their objectives are met. Should additional financing needs arise, either as a result of a cash deficit or to take advantage of market opportunities, our general policy is to prefer local financing to allow for natural hedging. If local financing conditions are not acceptable, because of costs or other constraints, Andina will provide financing, or our subsidiary could finance itself in a currency different than the local one, and use derivative instruments to hedge against the operation’s functional currency.
Our cash management policy contemplates that cash surpluses be invested in a portfolio of investment grade securities until such time as our board of directors makes a final decision as to the disposition of the surplus.
Derivative instruments are utilized only for business purposes, and not for speculative purposes. Pursuant to our currency hedge policy, forward currency contracts are used in some operations to cover the risk of local currency devaluation relative to the U.S. dollar in an amount not greater than the budgeted purchases of U.S. dollar-denominated raw materials. Depending on market conditions, instead of forward currency contracts, from time to time we prefer to utilize our cash surplus to purchase raw materials in advance to obtain better prices and a fixed exchange rate.
68
Cash Flows from Operating Activities 2019 vs. Cash Flows from Operating Activities 2018
Cash flows from operating activities during 2019 amounted to Ch$255,148 million compared to Ch$235,279 million in 2018. The increase in cash flow generation was mainly due to higher collection from customers during 2019.
Cash Flows from Operating Activities 2018 vs. Cash Flows from Operating Activities 2017
See “Item 5.Operating and Financial Review and Prospects –B. Liquidity and Capital Resources –Capital Resources, Treasury and Funding Policies”, in our Company’s annual report on Form 20-F for the fiscal year ended December 31, 2018.
Cash Flows from Investing Activities 2019 vs. Cash Flows from Investing Activities 2018
Cash flows for investment activities (includes purchase and sale of property, plant and equipment; investments in associated companies; and financial Investments) amounted to Ch$110,048 million in 2019 compared to Ch$118,086 million during 2018. During 2019 we made lower investments in property, plant and equipment in the amount of Ch$10,380 million and there is also an effect resulting from lower redemptions proceeds from financial instruments in the amount of Ch$20,286 million in 2018 not presented in 2019.
Cash Flows from Investing Activities 2018 vs. Cash Flows from Investing Activities 2017
See “Item 5.Operating and Financial Review and Prospects –B. Liquidity and Capital Resources –Capital Resources, Treasury and Funding Policies”, in our Company’s annual report on Form 20-F for the fiscal year ended December 31, 2018.
Cash Flows from Financing Activities 2019 vs. Cash Flows from Financing Activities 2018
Financing activities generated a negative cash flow of Ch$127,112 million in 2019, decreasing Ch$12,477 million compared to 2018, mainly explained by an increase in financial expenses in Chile for interest paid. Our financing activities are directly related to dividend distributions to shareholders, which resulted in a utilization of cash resources amounting to Ch$86,266 million compared to Ch$87,536 million during 2018. Also payments of bank loans and bonds are part of our financing activities.
As of December 31, 2019, 17 short-term credit lines are available for an amount equivalent to Ch$201,163 million, of which the equivalent of Ch$201,155 million corresponds to 16 unused lines of credit that remain available. In Argentina, we had the equivalent of Ch$33,147 million in credit available from seven lines of credit, out of which an amount of Ch$33,138 million remained unused as of December 31, 2019. In Brazil, we had the equivalent of Ch$134,405 million in credit available from 5 lines of credit, which have not been used. In Chile, we had the equivalent of Ch$7,600 million in credit available from three lines of credit, which have not been used. In Paraguay, we had the equivalent of Ch$26,011 million in credit available from two lines of credit, which have not been used.
Cash Flows from Financing Activities 2018 vs. Cash Flows from Financing Activities 2017
See “Item 5.Operating and Financial Review and Prospects –B. Liquidity and Capital Resources –Capital Resources, Treasury and Funding Policies”, in our Company’s annual report on Form 20-F for the fiscal year ended December 31, 2018.
Liabilities
As of December 31, 2019, our total liabilities, excluding non-controlling interest, were Ch$1,422,044 million, representing a 5.3% increase compared to December 31, 2018.
Current liabilities decreased by Ch$8,204 million, 2.0% compared to December 2018, which is explained by the decrease in other current financial liabilities (-Ch$15,521 million) mainly due to the decrease in net debt between banks and the public, and by the decrease in other current non-financial liabilities (-Ch$7,272 million). The previous decreases are partially offset by the increase in accounts payable to related entities (Ch$7,810 million) for higher accounts payable by our Brazilian subsidiary, and due to an increase in trade accounts payable and other accounts payable (Ch$5,591 million).
Non-current liabilities increased by Ch$79,458 million, 8.5% compared to December 2018, mainly due to the increase in other non-current financial liabilities (Ch$26,763 million), explained by the monetary restatement of local bond in UF and dollars, and for the increase of liabilities due to the recognition of rights-of-use under the application of IFRS 16. Also there is an increase of deferred tax liabilities (Ch$24,204 million) which is explained by the recognition of tax credits in Brazil, and the increase in accounts payable to related companies (Ch$19,778 million), due to an accounts payable between our subsidiary in Brazil and The Coca-Cola Company subsidiary in the same country, related to the recognition of the same tax credits in Brazil.
69
As of December 31, 2019, our bond obligation had a weighted average interest rate of 3.8% in UF and 5% in USD while our bank obligation had a weighted average interest rate of 6.7% for debts in R$, 62.0% for debts in AR$ and 4.26% for debts in Ch$.
Summary of Significant Debt Instruments
As of December 31, 2019, the Company is in compliance with all its debt covenants which are summarized below:
Series B Local Bonds (BANDI-B1; BANDI-B2)
During 2001, we issued in Chile Series B bonds. This issuance was structured into two series, one of which matured in 2008. As of December 31, 2019, Series B is the outstanding series with sub-series B1 and B2. During 2001, UF 3.7 million in bonds were issued with final maturity in 2026, bearing an annual interest rate of 6.5%. The Series B Local Bonds are subject to the following restrictive covenants:
| · | Maintain an indebtedness level where Consolidated Financial Liabilities to Consolidated Equity does not exceed 1.20 times. For these purposes Consolidated Financial Liabilities are regarded as Current Liabilities bearing interest, namely: (i) other current financial liabilities, plus (ii) other non-current financial liabilities, less (iii) active balances of derivative financial instruments, taken to cover exchange rate risks or interest rate risks on financial liabilities accounted for under “Other Current Financial Assets” and “Other Non-current Financial Assets” of the Company’s Consolidated Statement of Financial Position. Consolidated Equity is regarded as total equity including non-controlling interests. |
| · | Maintain and not lose, sell, assign, or transfer to a third party the geographical area today called the “Metropolitan Region”, as franchised territory in Chile by The Coca-Cola Company, for the development, production, sale and distribution of products and brands of such licensor, in accordance with the respective bottling agreement or license, renewable from time to time. |
| · | Not lose, sell, assign, or transfer to a third party any other territory of Argentina or Brazil, which to date is franchised to the Company by The Coca-Cola Company for the manufacture, production, sale and distribution of products and brands of such licensor; as long as these territories account for more than 40% of the Company’s Adjusted Consolidated Operating Flow. |
| · | Maintain consolidated assets free of any pledge, mortgage or other lien by an amount, less than or equal to 1.3 times the Company’s unsecured consolidated current liabilities. |
Unsecured consolidated current liabilities are the Company’s total liabilities, obligations and debts that are not secured with real guarantees on goods and assets of the latter, made voluntarily or by agreement by the Company less the active balances of derivative financial instruments, taken to cover exchange rate risks or interest rate risks on financial liabilities accounted for under Other Current Financial Assets and Other Non-current Financial Assets of the Company’s Consolidated Statement of Financial Position.
Consolidated Assets are assets free of any pledge, mortgage or other lien, as well as those assets that have real liens, mortgage or encumbrances that operate only by law less the active balances of derivative financial instruments, taken to cover exchange rate risks or interest rate risks on financial liabilities accounted for under Other Current Financial Assets and Other Non-current Financial Assets of the Company’s Consolidated Statement of Financial Position.
Series C Local Bonds (BKOP-C)
As a consequence of our merger with Polar, we became an obligor under the following outstanding bonds issued by Polar in Chile in 2010.
| · | Series C bonds due 2031, bearing interest at a variable annual rate equal to 4.00%. |
This series is subject to the following restrictions:
| · | Maintain a level of Net Financial Indebtedness within its quarterly financial statements that may not exceed 1.5 times, measured by figures included in the Company Consolidated Statement of Financial Position. For these purposes, net financial indebtedness level is defined as the ratio of net financial debt to total equity of the Company (equity attributable to the owners of the controllers plus non-controlling interests). Net financial debt means the difference between the Company financial debt and cash. |
70
| · | Maintain consolidated assets free of any pledge, mortgage or other encumbrances for an amount at least equal to 1.3 times of the Company unsecured consolidated liabilities. |
Unencumbered Assets are (a) assets that meet the following conditions: (i) they are the property of the Company, (ii) they are classified under Total Assets in the Company’s Financial Statement and, (iii) they are free of any pledge, mortgage or other levies constituted in favor of third parties, less (b) Other Current Financial Assets and Other Non-Current Financial Assets included in the Company’s Financial Statements (to the extent they correspond to the active balances of derivative financial instruments, taken to cover exchange rate risks or interest rate risks on financial liabilities).
Unsecured Total Liabilities are (a) liabilities included under Total Current Liabilities and Total Non-Current Liabilities on the Company Financial Statements which do not benefit from preferences or privileges, less (b) Other Current Financial Assets and Other Non-Current Financial Assets of the Company’s Financial Statements (to the extent they correspond to the active balances of derivative financial instruments, taken to cover exchange rate risks or interest rate risks on financial liabilities).
| · | Not invest in instruments issued by related parties or carry out operations with related parties other than those related to the general purpose of the entities, in conditions that are less favorable to those of the Company in relation to those prevailing in the market. |
| · | Maintain a Net Financial Coverage level greater than 3.0 times. Net financial coverage is the ratio between the Company’s EBITDA for the past 12 months and the Company’s net financial expenses (financial income minus financial expenses) for the past 12 months. However, this restriction will be considered breached when the mentioned net financial coverage level is lower than the level previously indicated during two consecutive quarters. |
Series C, D and E Local Bonds (BANDI-C; BANDI-D; BANDI-E)
During 2013 and 2014, Andina placed local bonds in the Chilean market. The issuance was structured into three series.
| · | UF 1.0 million of Series C Bonds due 2020 were issued in August 2013, bearing an annual interest rate of 3.5%; |
| · | UF 4.0 million of Series D Bonds due 2034 were issued in August 2013, bearing an annual interest rate of 3.8%; |
| · | UF 3.0 million of Series E Bonds due 2035 were issued in March 2014, bearing an annual interest rate of 3.75%. |
The Series C, D and E local bonds are subject to the following restrictions:
| · | Maintain an indebtedness level where Consolidated Financial Liabilities shall not exceed Consolidated Equity by 1.20 times. |
For these purposes Consolidated Financial Liabilities means Current Liabilities bearing interest, namely: (i) other current financial liabilities, plus (ii) other non-current financial liabilities, less (iii) active balances of derivative financial instruments, taken to cover exchange rate risks or interest rate risks on financial liabilities accounted for under Other Current Financial Assets and Other Non-current Financial Assets of the issuer’s Consolidated Statement of Financial Position.
Consolidated Equity is total equity including non-controlling interests.
| · | Maintain Consolidated Assets free of any pledge, mortgage or other lien by an amount, at least equal to 1.3 times of the Issuer’s unsecured consolidated current liabilities. |
Unsecured Consolidated Current Liabilities are the Company’s total liabilities, obligations and debts that are not secured with real guarantees on goods and assets of the latter, made voluntarily or by agreement by the Company, less the active balances of derivative financial instruments, taken to cover exchange rate risks or interest rate risks on financial liabilities accounted for under Other Current Financial Assets and Other Non-current Financial Assets of the Company’s Consolidated Statement of Financial Position.
For purposes of determining Consolidated Assets these will consider assets free of any pledge, mortgage or other lien, as well as those assets that have real liens, mortgage or encumbrances that operate only by law. Therefore, Consolidated Assets free of any lien, mortgage or other encumbrance are regarded as those assets for which no real lien, mortgage or other encumbrance has been made voluntarily or by agreement by the Company, less the active balances of derivative financial instruments, taken to cover exchange rate risks or interest rate risks on financial liabilities accounted for under Other Current Financial Assets and Other Non-current Financial Assets of the Company’s Consolidated Statement of Financial Position.
71
| · | Maintain and not lose, sell, assign, or transfer to a third party the Metropolitan Region, as franchised territory in Chile by The Coca-Cola Company for the production, sale and distribution of products and brands of the licensor. Losing said territory means the non-renewal, cancellation, early termination or annulment of the license agreement granted by The Coca-Cola Company for the Metropolitan Region. |
| · | Not lose, sell, assign, or transfer to a third party any other territory of Argentina or Brazil, which as of the issuance date of the Series C, D and E local bonds were franchised to the Company by The Coca-Cola Company for the manufacture, production, sale and distribution of products and brands of The Coca-Cola Company; as long as these territories account for more than 40% of the Company’s Adjusted Consolidated Operating Flow of the audited fiscal year immediately prior to the moment when such loss, sale, assignment or transfer occurs. For these purposes Adjusted Consolidated Operating Flow is the addition of the following accounting items of the Issuer’s Consolidated Statement of Financial Position: (i) Gross Income, including revenue and cost of sales, less (ii) Distribution Costs, less (iii) Administrative Expenses, plus (iv) Participation in Earnings (Losses) of Associates and Joint Ventures accounted for using the Equity Method, plus (v) Depreciation, plus (vi) Amortization of Intangibles. |
Series F Local Bonds (BANDI-F)
During 2018, Andina undertook the partial repurchase (US$210 million) of the Senior Notes due 2023, which was refinanced with the placement of the Series F Local Bonds in the Chilean local market. These bonds were issued in October 2018, in the amount of UF5.7 million, accruing an annual interest rate of 2.8% and with a maturity of 2039.
The Series F local bonds are subject to the following restrictions:
| · | Maintain an indebtedness level where Consolidated Financial Liabilities shall not exceed Consolidated Equity by 1.20 times. |
For these purposes Consolidated Financial Liabilities means Current Liabilities bearing interest, namely: (i) other current financial liabilities, plus (ii) other non-current financial liabilities, less (iii) active balances of derivative financial instruments, taken to cover exchange rate risks or interest rate risks on financial liabilities accounted for under Other Current Financial Assets and Other Non-current Financial Assets of the issuer’s Consolidated Statement of Financial Position.
Consolidated Equity is total equity including non-controlling interests.
| · | Maintain Consolidated Assets free of any pledge, mortgage or other lien by an amount, at least equal to 1.3 times of the Issuer’s unsecured consolidated current liabilities. |
Unsecured Consolidated Current Liabilities are the Company’s total liabilities, obligations and debts that are not secured with real guarantees on goods and assets of the latter, made voluntarily or by agreement by the Company, less the active balances of derivative financial instruments, taken to cover exchange rate risks or interest rate risks on financial liabilities accounted for under Other Current Financial Assets and Other Non-current Financial Assets of the Company’s Consolidated Statement of Financial Position.
For purposes of determining Consolidated Assets these will consider assets free of any pledge, mortgage or other lien, as well as those assets that have real liens, mortgage or encumbrances that operate only by law. Therefore, Consolidated Assets free of any lien, mortgage or other encumbrance shall be regarded as those assets for which no real lien, mortgage or other encumbrance has been made voluntarily or by agreement by the Company, less the active balances of derivative financial instruments, taken to cover exchange rate risks or interest rate risks on financial liabilities accounted for under Other Current Financial Assets and Other Non-current Financial Assets of the Company’s Consolidated Statement of Financial Position.
| · | Maintain and not lose, sell, assign, or transfer to a third party the Metropolitan Region, as franchised territory in Chile by The Coca-Cola Company for the production, sale and distribution of products and brands of the licensor. Losing said territory means the non-renewal, cancellation, early termination or annulment of the license agreement granted by The Coca-Cola Company for the Metropolitan Region. |
| · | Not lose, sell, assign, or transfer to a third party any other territory of Argentina or Brazil, which as of the issuance date of the Series F local bonds, is franchised to the Company by The Coca-Cola Company for the manufacture, production, sale and distribution of products and brands of The Coca-Cola Company; as long as these territories account for more than 40% of the Company’s Adjusted Consolidated Operating Flow of the audited fiscal year immediately prior to the moment when said loss, sale, assignment or transfer occurs. For these purposes Adjusted Consolidated Operating Flow is the addition of the following accounting items of the Issuer’s Consolidated Statement of Financial Position: (i) Gross Income, including revenue and cost of sales, less (ii) Distribution Costs, less (iii) Administrative Expenses, plus (iv) Participation in Earnings (Losses) of Associates and Joint Ventures accounted for using the Equity Method, plus (v) Depreciation, plus (vi) Amortization of Intangibles. |
72
Senior Notes due 2023
In October 2013, we issued US$575 million of Senior Notes in the U.S. market under 144A/Reg S regulations. These notes are unsecured obligations with the whole principal amount due in 2023. The proceeds from these notes were used to finance a portion of the purchase price for our acquisition of Ipiranga and for general corporate purposes.
In October 2018, as part of the Company’s debt reprofiling, Andina undertook a partial repurchase of the Senior Notes in the amount of US$210 million (which was refinanced with the placement of Series F Local Bonds in the Chilean local market), with a total remaining outstanding amount of Senior Notes of US$365 million.
Recent Bond Issuance
Senior Notes Due 2050
On January 21, 2020, the Company issued a 30-year corporate bond in the international markets for US$300 million due 2050, with an annual coupon rate of 3.950%. The use of funds from this operation are general corporate purposes which could include an eventual payment of existing liabilities, financing of potential acquisitions and improvement of the company's liquidity position.
In parallel, derivatives have been contracted (Cross Currency Swaps) that cover 100% of US dollar-denominated financial obligations redenominating them to UF.
| C. | RESEARCH AND DEVELOPMENT, PATENTS AND LICENSES |
Given the nature of the business and the support provided by The Coca-Cola Company as franchisor to its bottlers, the Company’s research and development expenses are not meaningful. For more information on patents and licenses, see “Item 4. Information on the Company – Bottler Agreements”.
| D. | TREND INFORMATION |
Our results will likely continue to be influenced by changes in the level of consumer demand in the countries in which we operate, resulting from governmental economic measures that are or may be implemented in the future. Additionally, principal raw materials used in the production of soft drinks, such as sugar and resin, may experience price increases in the future. Such price increases may affect our results if we are unable to pass the cost increases on to the sales price of our products due to depressed consumer demand and/or heightened competition.
Increased competition from low-price brands is another factor that could limit our ability to grow, and thus negatively affect our results.
Additionally, exchange rate fluctuations, in particular the potential devaluations relative to the U.S. dollar of local currencies in the countries in which we operate, may adversely affect our results because of the impact on the cost of U.S. dollar-denominated raw materials and the conversion of monetary assets.
Finally, the recent outbreak of the COVID-19 pandemic and the extraordinary measures adopted by the government to contain the spread of the virus, could adversely affect our business and results of operations. For more information see “Item 3. Key Information – D. Risk Factors – Our business is subject to risks arising from the ongoing COVID-19 pandemic”.
| E. | OFF-BALANCE SHEET ARRANGEMENTS |
As of December 31, 2019, we did not have any material off-balance sheet arrangements.
73
| F. | CONTRACTUAL OBLIGATIONS |
The following table sets forth our principal contractual and commercial obligations as of December 31, 2019:
| Payments Due by Period | ||||||||||||||||||||
| Less than 1 year | 1-3 Years | 3-5 Years | More than 5 years | Total | ||||||||||||||||
| (in millions of Ch$) | ||||||||||||||||||||
| Debt with financial institutions (1) | 724 | 2,226 | 89 | 0 | 3,039 | |||||||||||||||
| Bonds (1) (2) | 42,979 | 82,237 | 341,251 | 558,316 | 1,024,782 | |||||||||||||||
| Lease obligations (1) | 8,664 | 22,162 | 19,120 | 10,177 | 60,122 | |||||||||||||||
| Purchase obligations (1) (3) | 19,109 | 68,786 | 7,323 | 0 | 95,218 | |||||||||||||||
| Total | 71,476 | 175,410 | 367,783 | 568,493 | 1,183,162 | |||||||||||||||
| (1) | Includes interest |
| (2) | See Note 17 to our consolidated financial statements for additional information. |
| (3) | This includes: (i) Brazilian cogeneration contract (ii) our IT services contract and, (iii) some services and raw material contracts, mainly for sugar. |
The following table presents future expirations for additional long-term liabilities. These expirations have been estimated based on accounting estimates because the liabilities do not have specific dates of future payment, as allowance for severance indemnities, contingencies, and liabilities are included.
| Maturity Years | ||||||||||||||||
| Total | 1-3 Years | 3-5 Years | More than 5 Years | |||||||||||||
| (Millions Ch$ 2019) | ||||||||||||||||
| Provisions | 67,039 | 968 | 66,070 | 0 | ||||||||||||
| Other long-term liabilities | 10,085 | 736 | 439 | 8,910 | ||||||||||||
| Total long-term liabilities | 77,124 | 1,704 | 66,509 | 8,910 | ||||||||||||
| G. | SAFE HARBOR |
See “Introduction - Presentation of Financial and Certain Other Information—Forward-Looking Statements”.
74
| ITEM 6. | DIRECTORS, SENIOR MANAGEMENT AND EMPLOYEES |
| A. | DIRECTORS AND SENIOR MANAGEMENT |
Pursuant to Chilean law, we are managed by a group of executive officers under the supervision of our board of directors. The Company’s operations in Chile, Brazil, Argentina and Paraguay report to the Corporate Office.
Board of Directors
In accordance with our current bylaws, the board of directors is comprised of fourteen (14) directors. The directors may or may not be shareholders and are elected at general shareholders meetings for a three-year term, re-election being permitted. Cumulative voting is permitted for the election of directors.
In the event of a vacancy, the board of directors may appoint a replacement to fill the vacancy, and the entire board of directors must be elected or re-elected at the next regularly scheduled general shareholders meeting.
The shareholders agreement regulates the election of directors of the Company by the controlling shareholders (See “Item 7. Major Shareholders and Transactions with Related Companies”). In addition, pursuant to the terms and conditions of the deposit agreement entered between the Company and the Bank of New York dated as of December 14, 2000, (the “Deposit Agreement”), if no instructions are received by The Bank of New York Mellon, as depositary (the “Depositary”), it shall give a discretionary proxy to a person designated by the chairman of our board of directors with respect to the shares or other deposited securities that represent the ADRs.
The following table sets forth information with respect to the current directors of the Company, which have been recently reelected at our general shareholders meeting dated April 16, 2020:
| Name | Age(3) | Date of expiration current term | Position | |||
| Juan Claro | 69 | April 16, 2023 | Chairman | |||
| Arturo Majlis | 57 | April 16, 2023 | Director | |||
| Eduardo Chadwick | 60 | April 16, 2023 | Director | |||
| Salvador Said(1) | 55 | April 16, 2023 | Director | |||
| José Antonio Garcés | 53 | April 16, 2023 | Director | |||
| Gonzalo Said(1) | 55 | April 16, 2023 | Director | |||
| Roberto Mercadé | 51 | April 16, 2023 | Director | |||
| Gonzalo Parot(2) | 67 | April 16, 2023 | Director | |||
| Georges de Bourguignon | 57 | April 16, 2023 | Director | |||
| Pilar Lamana(2) | 55 | April 16, 2023 | Director | |||
| Rodrigo Vergara | 57 | April 16, 2023 | Director | |||
| Felipe Joannon | 60 | April 16, 2023 | Director | |||
| Marco Antonio Araujo | 53 | April 16, 2023 | Director | |||
| Mariano Rossi | 53 | April 16, 2023 | Director |
| (1) | Salvador Said is first cousin of Gonzalo Said. |
| (2) | Independent from controlling shareholder pursuant to Article 50 bis, paragraph 6 of the Chilean Public Company Law N° 18,046. |
| (3) | Age at December 31, 2019. |
The following are brief biographies of each of the Company’s directors:
Mr. Juan Claro has been a member of our board of directors since April 2004. He is an entrepreneur, who also serves as a director in several publicly traded and private companies.
Mr. Arturo Majlis has been a member of our board of directors since April 1997. He is an attorney at law, and he is currently principal partner of the law firm Grasty, Quintana, Majlis y Compañía. He also serves as a director in several publicly traded and private companies.
Mr. Eduardo Chadwick has been a member of our board of directors since June 2012. He holds a degree in civil industrial engineering, and he is currently an entrepreneur. He also serves as a director in several publicly traded and private companies.
75
Mr. José Antonio Garcés has been a member of our board of directors since April 1992. He holds a degree in business administration, and he is currently general manager of Inversiones San Andrés Ltda. He also serves as director in several publicly traded and private companies.
Mr. Gonzalo Said has been a member of our board of directors since April 1993. He holds a degree in business administration, and he is currently an entrepreneur. He also serves as director in several publicly traded and private companies.
Mr. Salvador Said has been a member of our board of directors since April 1992. He holds a degree in business administration, and he is currently Director of Said Holding Group. He also serves as director in in several publicly traded and private companies.
Mr. Roberto Mercadé has been a member of our board of directors since April 2019. He is an industrial engineer and previously was on the board of ARCA-Lindley in Peru, Escuela Campo Alegre in Venezuela and American International School of Johannesburg in South Africa.
Mr. Gonzalo Parot has been a member of our board of directors since April 2009. He is an engineer and he is currently the Principal Partner and CEO at Elex Consulting Group. He also serves as director in several publicly traded and private companies.
Mr. Georges de Bourguignon has been member of our board of directors since April 2016. He is an economist, founder of Asset Chile and he is currently executive director of Asset Chile. He also serves as director in several publicly traded and private companies.
Mrs. Pilar Lamana has been a member of our board of directors since April 2017. She holds a degree in business administration, and she is currently a business consultant.
Mr. Marco Antonio Araujo has been a member of our board of directors since April 2020. He is an industrial engineering and he is currently the Representative Director, Executive Vice President and Chief Financial Officer of Coca-Cola (Japan) Company, Limited.
Mr. Mariano Rossi has been a member of our board of directors since June 2012. He holds a degree in administration and business management, and he is currently a business consultant.
Mr. Rodrigo Vergara has been a member of our board of directors since April 2018. He is as an economist and a professor at the Institute of economics of the Faculty of Economic and Administrative Sciences of Chile’s Pontificia Universidad Católica. He also serves as director in several publicly and traded and private companies.
Mr. Felipe Joannon has been a member of our board of directors since April 2018. He is an economist and he is currently director of several publicly traded companies.
Executive Officers
The following table includes information regarding our senior executives:
| Name | Age | Position | ||
| Miguel Ángel Peirano | 60 | Chief Executive Officer | ||
| Andrés Wainer | 49 | Chief Financial Officer | ||
| Fernando Jaña | 42 | Chief Strategic Planning Officer | ||
| Jaime Cohen | 52 | Chief Legal Officer | ||
| Martín Idígoras | 45 | Chief IT Officer | ||
| Gonzalo Muñoz | 58 | Chief Human Resources Officer | ||
| Fabián Castelli | 54 | General Manager of Embotelladora del Atlántico S.A. | ||
| Renato Barbosa | 59 | General Manager of Rio de Janeiro Refrescos Ltda. | ||
| José Luis Solorzano | 49 | General Manager of Embotelladora Andina S.A. | ||
| Francisco Sanfurgo | 65 | General Manager of Paraguay Refrescos S.A. |
Mr. Peirano joined the Company in 2011, as Chief Executive Officer. Prior to joining Andina, he worked at Coca-Cola FEMSA, where he was COO of the Mercosur Division from 2009 until 2011; President of FEMSA Cerveza Brazil from 2006 until 2008; CEO of Coca-Cola FEMSA Argentina from 2003 through 2005; and previously responsible for the Management Areas of Operations / Marketing / Production / Strategic Planning in Argentina. He also worked as a consultant at McKinsey & Company from 1991 until 1996 in Argentina, Spain, Germany, Chile and Brazil.
76
Mr. Wainer joined the Company in 1996 as a research analyst in the corporate office. In 2000, he was appointed Development Manager in EDASA and in 2001, he returned to the corporate office as Research and Development Officer. In 2006, he was appointed finance and administration manager at the Chilean operation and in November 2010, he returned to the corporate office as Chief Financial Officer. Mr. Wainer also worked at Econsult and Banedwards Corredores de Bolsa.
Mr. Jaña joined the Company in 2014, as Project and Innovation Manager. In 2017 he was appointed General Manager of Coca-Cola Del Valle New Ventures. In 2019 was appointed Chief Strategic Planning Officer. He previously worked at Cencosud and CCU.
Mr. Cohen joined the Company in 2008, as Chief Legal Officer. Prior to joining Andina, he held a similar position at Socovesa S.A. from 2004. He formed part of the legal division of Citibank from 2000 until 2004. He also was an attorney at the law offices of Cruzat, Ortuzar & Mackenna and Baker & McKenzie from 1996 until 1999. He began his professional career in 1993 as lawyer at Banco de A. Edwards.
Mr. Idígoras joined the Company in 2018 as Chief IT Officer. Prior to joining Coca-Cola Andina, he served for more than 17 years at Cencosud, during which time he held the roles of CIO Home Improvement Division from 2015 until 2018, Regional Manager Center of Expertise SAP from 2014 until 2015, and Regional CTO from 2010 until June 2014. Mr. Idígoras has also worked at Correo Argentino and Arcor.
Mr. Muñoz joined the Company in 2015 as Chief Human Resources officer. Prior to joining Andina he worked at British American Tobacco as Human Resources Director in Mexico and Human Resources Southern Cone Director. He also held several other positions at British American Tobacco such as Finance Director and General Manager in several Latin-American countries.
Mr. Castelli joined the Company in 1994, holding the position of Traditional Sales Manager in Mendoza. He is currently General Manager of Andina Argentina (since April 2014). Previously, he was Commercial Manager of Andina Argentina (2010), Marketing Manager from 2000 until 2010, Commercial Planning Manager from 1997 until 2000, Marketing Services Manager between 1996 and 1997, Traditional Sales Manager - Mendoza between 1994 and 1995.
Mr. Barbosa joined the Company on January 1, 2012 as General Manager of our operation in Brazil. He has worked in the Coca-Cola System for 24 years, primarily as General Manager of Brasal, a Coca-Cola bottling company servicing the western central part of Brazil. He also has worked for other large companies such as McDonald’s and Banco do Brasil.
Mr. Solorzano joined the Company in April 2003, where he served in various managerial positions in the commercial area, passing through the management of key accounts sales, traditional channel sales management, and management of marketing and commercial areas. In March of 2010, he served as General Manager of Andina’s Argentine operations. On April 1, 2014 he was appointed General Manager of Andina Chile. Prior to joining Andina, he worked as marketing manager, plant manager and business manager of Coca-Cola Polar, for five years. Prior to joining Coca-Cola bottler system, he worked at Malloa.
Mr. Sanfurgo joined the Company in 2012, after the merger with Embotelladoras Coca-Cola Polar as General Manager of Paraguay Refrescos S.A. In 1990, he joined Embotelladoras Coca-Cola Polar S.A. as General Manager of Embotelladora Austral (Punta Arenas — Chile). Since 2005 he has been General Manager of Paraguay Refrescos S.A.
| B. | COMPENSATION |
Compensation of Executive Officers
In the case of senior executives, compensation plans are composed of a fixed remuneration and a variable remuneration, which is paid through a performance bonus, both of which are defined according to the competitive and offer conditions of each market, and their amounts vary according to the position and/or degree of responsibility. The performance bonuses are payable only to the extent that the goals defined annually for the Company are met, in accordance with the corporate performance management policy.
For the year ended December 31, 2019 the amount of fixed compensations paid to Coca-Cola Andina’s executive officers amounted to Ch$4,167 million (Ch$3,782 million in 2018). Likewise, the amount of compensation paid in performance bonuses amounted to Ch$2,407 million (Ch$2,517 million in 2018).
For the year ended December 31, 2019 severance payments to managers and executive officers of Embotelladora Andina S.A. were Ch$55 million. During the period ended December 31, 2018 severance payments were made to managers and executive officers of Embotelladora Andina S.A. for the amount of Ch$52 million.
77
We do not make available to the public information as to the compensation of our executive officers on an individual basis, as disclosure of such information is not required under Chilean law.
Compensation of Directors
Directors receive an annual fee for their services and participation as members of the board of directors and committees. The amounts paid to each director varies in accordance with the position held and the period of time during which such position is held. Total compensation paid to each director during 2019, which was approved by our shareholders, was as follows:
| 2019 | Directors’ Compensation ThCh$ | Executive Committee ThCh$ | Directors’ and Audit Committee ThCh$ | Total ThCh$ | ||||||||||||
| Juan Claro González(1) | 144,000 | 144,000 | ||||||||||||||
| Arturo Majlis Albala | 72,000 | 72,000 | 144,000 | |||||||||||||
| Gonzalo Said Handal | 72,000 | 72,000 | 144,000 | |||||||||||||
| Jose Antonio Garcés Silva | 72,000 | 72,000 | 144,000 | |||||||||||||
| Salvador Said Somavía | 72,000 | 72,000 | 24,000 | 168,000 | ||||||||||||
| Eduardo Chadwick Claro | 72,000 | 72,000 | 144,000 | |||||||||||||
| Gonzalo Parot Palma(2) | 72,000 | 24,000 | 96,000 | |||||||||||||
| Manuel Arroyo Prieto(3) | 22,600 | 22,600 | ||||||||||||||
| Rodrigo Vergara Montes | 72,000 | 72,000 | ||||||||||||||
| Mariano Rossi | 72,000 | 72,000 | ||||||||||||||
| Roberto Mercadé Rovira(4) | 49,400 | 49,400 | ||||||||||||||
| Georges de Bourguignon Arndt | 72,000 | 72,000 | ||||||||||||||
| Enrique Rapetti(5) | 72,000 | 72,000 | ||||||||||||||
| María del Pilar Lamana Gaete(2) | 72,000 | 24,000 | 96,000 | |||||||||||||
| Felipe Joannon Vergara | 72,000 | 72,000 | ||||||||||||||
| Total Gross | 1,080,000 | 360,000 | 72,000 | 1,512,000 | ||||||||||||
| (1) | Includes Ch$72 million additional as Chairman of the Board. |
| (2) | Independent from controlling shareholder pursuant to Article 50 bis, paragraph 6 of the Chilean Public Company Law N° 18,046. |
| (3) | Left the Board in April 2019. |
| (4) | Joined the Board in April 2019. |
| (5) | Left the Board in April 2020. |
For the year that ended December 31, 2019, the aggregate amount of compensation we paid to all directors and executive officers as a group was Ch$8,141 million of which Ch$6,629 million was paid to our executive officers. We do not disclose to our shareholders or otherwise make available to the public information as to the compensation of our executive officers on an individual basis, as disclosure of such information is not required under Chilean law. We only maintain a retirement plan for our chief executive officer.
| C. | BOARD PRACTICES |
Our board of directors has regularly scheduled meetings at least once a month, and extraordinary meetings are convened when called by the chairman or when requested by one or more directors. The quorum for a meeting of the board of directors is established by the presence of an absolute majority of its directors. Directors serve terms of three years from the date they are elected. Resolutions are adopted by the affirmative vote of a majority of those directors present at the meeting, with the chairman determining the outcome of any tie vote.
Benefits upon Termination of Employment
There are no contracts providing benefits to directors upon termination of employment.
Executive Committee
Our board of directors is counseled by an Executive Committee that proposes Company policies and is currently comprised by the following Directors: Mr. Eduardo Chadwick Claro, Mr. Arturo Majlis Albala, Mr. José Antonio Garcés Silva (junior), Mr. Gonzalo Said Handal, and Mr. Salvador Said Somavía, who were elected during the ordinary Board Meeting held on April 26, 2018. The Executive Committee is also comprised by the Chairman of the Board, Mr. Juan Claro González and our chief executive officer. This committee meets permanently throughout the year and normally holds one or two monthly sessions.
78
Directors’ Committee
Pursuant to Article 50 bis of Chilean Company Law N°18,046 and in accordance to the dispositions of Circular N°1,956 and Circular N°560 of the Chilean Superintendence of Securities and Insurance, today known as the Financial Market Commission (Comisión para el Mercado Financiero – “CMF”) a new Directors’ Committee was elected during the Board Meeting held on April 26, 2018, applying the same election criteria set forth by Circular N°1,956. The directors Mrs. Pilar Lamana Gaete and Mr. Gonzalo Parot Palma (both as Independent Directors), and Mr. Salvador Said Somavía comprised the Committee. Mr. Gonzalo Parot Palma is the Chairman of the Company’s Directors’ Committee.
The duties performed by this Committee during 2019, following the same categorization of faculties and responsibilities established by Article 50 bis of Company Law N°18,046 of the Chilean Superintendence of Securities and Insurance, were the following:
| · | Examine the reports of external auditors, the balance sheets and other financial statements, presented by the administrators of the Company, and take a position on such reports before they were presented to shareholders for their approval. |
| · | Analyze and prepare the proposal of external auditors and private rating agencies to the Board of Directors, which were suggested to the respective Shareholders’ Meeting. |
| · | Examine information regarding the operations referred to by Title XVI of Law N°18,046 and issue a report on those operations. |
| · | Examine the salary systems and compensation plans of the Company’s managers, principal officers and employees. |
| · | Review anonymous reports. |
| · | Review and approve the 20F and compliance with Rule 404 of the Sarbanes-Oxley Act. |
| · | Prepare the budget proposal for the Committee’s operation. |
| · | Review Internal Audit Reports. |
| · | Periodically interview the Company’s external auditors’ representatives. |
| · | Interview human resources managers. |
| · | Review operating budget between related companies (production Joint Ventures). |
| · | Review Internal Control Model. |
| · | Analyze and approve the Internal Audit certification processes. |
| · | Review and approve press releases that refer to the Company’s communications. |
| · | Review the Company’s four Operations’ Internal Control Standards, including Critical Risks in accounting processes, compliance of corporate policies, tax contingencies, IT and status of Internal and External Audit observations. |
| · | Analyze Management and Risk Control Model. |
| · | Analyze IAS 29. |
| · | Review Crime Prevention Model Law No. 20,393. |
| · | Review progress on implementation of IT systems. |
| · | Review corporate insurances, including cyber-safety. |
| · | Review judicial contingencies in the four operations. |
| · | Review Impairment test model. |
| · | Review judicial procedure and contingency analysis. |
| · | Review relevant tax risks. |
| · | Analyze possible improvements to corporate governance. |
| · | Prepare the Annual Management Report. |
Finally, during 2019, the Directors’ Committee incurred expenses of Ch$122,657,510. These expenses relate to consultancies on anti-trust and legal matters, among others.
Sarbanes-Oxley Audit Committee
In accordance with NYSE and SEC requirements regarding compliance with the Sarbanes-Oxley Act, the Board of Directors established an Audit Committee on July 26, 2005. The current Audit Committee was elected during the Board Meeting held on April 26, 2018. The Committee is comprised by the directors Mrs. Pilar Lamana Gaete, Mr. Gonzalo Parot Palma, and Mr. Salvador Said Somavía determining that Mrs. Pilar Lamana Gaete and Mr. Gonzalo Parot Palma fulfill the independence standards set forth in the Sarbanes-Oxley Act and SEC and NYSE regulations. Also, Mr. Parot was appointed by the Board of Directors as the financial expert in accordance with the definitions of the listing standards of the NYSE and the Sarbanes-Oxley Act.
79
The resolutions, agreements and organization of the Sarbanes-Oxley Audit Committee are governed by the rules relating to Board Meetings and to the Company’s Directors’ Committee. Since its creation, the sessions of the Sarbanes-Oxley Audit Committee have been held with the Directors’ Committee, since some of the functions are very similar and the members of both of these Committees are the same.
The Sarbanes-Oxley Audit Committee Charter that is available on our website: www.koandina.com, defines the duties and responsibilities of this Committee. The Sarbanes-Oxley Audit Committee is responsible for analyzing the Company’s financial statements; supporting the financial supervision and rendering of accounts; ensuring management’s development of reliable internal controls; ensuring compliance by the audit department and external auditors of their respective roles; and reviewing auditing practices.
For the period ended December 31, 2019, the Sarbanes-Oxley Audit Committee incurred in expenses of Ch$46,904,316.
Culture, Ethics & Sustainability Committee
The Culture, Ethics and Sustainability Committee was established during the Board Meeting held on January 28, 2014. This Committee is comprised by three directors, who are appointed by the Board of Directors and will occupy their posts until their successors are elected, or until resignation or dismissal. After the resignation of the director Mrs. Susana Tonda in March 2018, the current members of the Culture, Ethics and Sustainability Committee are Mr. José Antonio Garcés Silva, Mr. Felipe Joannon Vergara and Mr. Gonzalo Said Handal, in addition to the Chairman of the Board.
| D. | EMPLOYEES |
Overview
As of December 31, 2019, we had 17,586 employees, including 4,271 in Chile (3,163 own and 1,108 outsourced), 8,032 in Brazil (7,675 own and 357 outsourced), 3,059 in Argentina (2,986 own and 73 outsourced) and 1,646 in Paraguay (1,137 own and 509 outsourced). From the total employees, 691 were temporary employees in Chile, 341 were temporary employees in Argentina, 0 were temporary in Brazil and 155 were temporary employees in Paraguay. During the South American Summer, it is customary for us to increase the number of employees in order to meet peak demand. Additionally, in Vital Jugos, Vital Aguas and Envases Central we had 260, 95 and 182 employees, respectively, for a total aggregate amount of 537 employees for those three companies. On the other hand, the corporate office had 41 employees.
As of December 31, 2019, 1,860; 735; 2,038 and 410 of our employees in Chile, Brazil, Argentina and Paraguay, respectively, were members of unions.
Management believes that the Company has good relations with its employees.
The following table represents a breakdown of our employees for the years ended December 31, 2018 and 2019:
| 2018 | ||||||||||||||||||||||||||||||||||||||||||||||||
| Chile(1) | Brazil | Argentina(2) | Paraguay | |||||||||||||||||||||||||||||||||||||||||||||
| Total | Union | Non-Union | Total | Union | Non-Union | Total | Union | Non-Union | Total | Union | Non-Union | |||||||||||||||||||||||||||||||||||||
| Executives | 74 | 0 | 74 | 63 | 1 | 62 | 104 | 0 | 104 | 37 | 0 | 37 | ||||||||||||||||||||||||||||||||||||
| Technicians and professionals | 488 | 2 | 486 | 998 | 49 | 949 | 749 | 11 | 738 | 317 | 45 | 272 | ||||||||||||||||||||||||||||||||||||
| Workers | 2,959 | 1,616 | 1,343 | 6,834 | 870 | 5,964 | 1,961 | 1,823 | 138 | 1,141 | 314 | 827 | ||||||||||||||||||||||||||||||||||||
| Temporary workers | 653 | 0 | 653 | 0 | 0 | 0 | 370 | 297 | 73 | 105 | 0 | 105 | ||||||||||||||||||||||||||||||||||||
| Total | 4,174 | 1,618 | 2,556 | 7,895 | 920 | 6,975 | 3,176 | 2,126 | 1,050 | 1,600 | 359 | 1,241 | ||||||||||||||||||||||||||||||||||||
| 2019 | ||||||||||||||||||||||||||||||||||||||||||||||||
| Chile(1) | Brazil | Argentina(2) | Paraguay | |||||||||||||||||||||||||||||||||||||||||||||
| Total | Union | Non-Union | Total | Union | Non-Union | Total | Union | Non-Union | Total | Union | Non-Union | |||||||||||||||||||||||||||||||||||||
| Executives | 70 | 0 | 70 | 53 | 1 | 52 | 97 | 0 | 97 | 38 | 0 | 38 | ||||||||||||||||||||||||||||||||||||
| Technicians and professionals | 481 | 2 | 479 | 981 | 38 | 943 | 738 | 10 | 728 | 335 | 53 | 282 | ||||||||||||||||||||||||||||||||||||
| Workers | 3,029 | 1,858 | 1,172 | 6,998 | 696 | 6,302 | 1,883 | 1,757 | 126 | 1,168 | 357 | 811 | ||||||||||||||||||||||||||||||||||||
| Temporary workers | 691 | 1 | 690 | 0 | 0 | 0 | 341 | 271 | 70 | 105 | 0 | 105 | ||||||||||||||||||||||||||||||||||||
| Total | 4,271 | 1,860 | 2,411 | 8,032 | 735 | 7,297 | 3,059 | 2,038 | 1,021 | 1,646 | 410 | 1,236 | ||||||||||||||||||||||||||||||||||||
| 2018 | ||||||||||||
| Vital Aguas/Vital Jugos/Envases Central | ||||||||||||
| Total | Union | Non-Union | ||||||||||
| Executives | 1 | 0 | 1 | |||||||||
| Technicians and professionals | 168 | 44 | 124 | |||||||||
| Workers | 324 | 265 | 59 | |||||||||
| Temporary workers | 9 | 1 | 8 | |||||||||
| Total | 502 | 310 | 192 | |||||||||
80
| 2019 | ||||||||||||
| Vital Aguas/Vital Jugos/Envases Central | ||||||||||||
| Total | Union | Non-Union | ||||||||||
| Executives | 10 | 0 | 10 | |||||||||
| Technicians and professionals | 135 | 44 | 91 | |||||||||
| Workers | 375 | 270 | 105 | |||||||||
| Temporary workers | 17 | 1 | 16 | |||||||||
| Total | 537 | 315 | 222 | |||||||||
| (1) | Information for Chile includes only Andina Chile. |
| (2) | Argentina includes AEASA. |
Note: The number of employees is calculated as equivalent to full time hours, which means that extraordinary hours are considered as additional employees.
Chile
In Chile, we continue to make provisions for severance indemnities in accordance with our collective bargaining agreements and labor legislations, in the amount of one month’s salary for every year of employment subject to certain restrictions. In addition, we complement our employees’ contribution to our health insurance system, thus decreasing health costs for the employees’ families. Employees are required to contribute funds for financing pension funds, which are mainly managed by private entities.
In Chile 62.29% of employees with indefinite work contracts are affiliated with a labor union organization, with a total of 13 labor union organizations and a total of 17 Collective Instruments. The following are the collective bargaining agreements in force as of December 31, 2019:
The agreements in force as of December 31, 2019 in Santiago are:
| i. | collective agreement with Labor Union No. 1, that mainly represents workers from the Operations area, effective from December 1, 2018 until 30 November 2021; |
| ii. | collective agreement with Labor Union No. 2 that mainly represents the logistics administration staff and operations specialists, effective from June 1, 2018 until June 1, 2021; |
| iii. | collective agreement with Labor Union No. 3, which mainly represents staff in the Sales area, effective from May 1, 2018 until April 30, 2021; |
| iv. | collective agreement with workers, which mainly represents staff in the administration area, effective from July 1, 2018 until June 30, 2021; |
| v. | collective agreement with a group of workers in the logistics area of the Puente Alto facility, effective from January 1, 2018 until June 30, 2020; |
| vi. | collective agreement with the TAR Union, representing distribution staff, effective from July 1, 2019 until June 30, 2022; and |
| vii. | collective agreement with a group of workers in the Operations area of the new Renca plant, which effective from July 1, 2018 until June 30, 2021. |
The agreements in force as of December 31, 2019 in Coquimbo are:
| i. | collective agreement with Labor Union No. 1, consisting mainly of workers from the production area, effective from March 1, 2016 until February 28, 2020; |
| ii. | collective agreement with the National Workers Union No. 1 representing a portion of the administration workers and sales force, effective from January 1, 2017 through December 31, 2019; |
| iii. | collective agreement consisting mainly of administrative workers, effective from September 1, 2019 until August 31, 2022; and |
| iv. | collective agreement of sales force, effective from April 1, 2019 until March 31, 2022. |
The collective agreements in force as of December 31, 2019 in Antofagasta are:
| i. | collective agreement with the Workers Union No.1, consisting mainly of workers in the Production area, effective from September 15, 2017 until September 14, 2020; |
| ii. | collective agreement with the Workers Union No.2, made up of staff from different areas, effective from December 1, 2019 until November 30, 2022; |
| iii. | collective agreement with the sales force negotiating group, effective from October 1, 2016 until September 30, 2022; and |
| iv. | collective agreement with transportation workers from the base zone, effective from May 4, 2017 until May 4, 2020. |
Finally, the collective agreements in force as of December 31, 2019 in Punta Arenas are:
81
| i. | collective agreement with the Workers' Union of Punta Arenas, which mainly represents workers in the production area, effective from August 1, 2019 until July 31, 2022; and |
| ii. | collective agreement with Interarea staff effective from January 1, 2017 until December 31, 2019. |
Brazil
In Brazil, 9.58% of our employees are members of labor unions. Collective bargaining agreements are negotiated on an industry-wide basis, although companies can negotiate special terms for their affiliates that apply to all employees in each jurisdiction where companies have a plant. Collective bargaining agreements are generally binding for one year.
With respect to Andina Brazil, there are 30 collective bargaining agreements in force as of December 31, 2019.
16 agreements for employees in the State of Rio de Janeiro:
| i. | the Soft Drink Industry Employees’ Union agreement from July 1, 2019 to June 30, 2020; |
| ii. | the Sales Force Union agreement from May 1, 2019 to April 30, 2020; |
| iii. | The Sales Force II Union agreement from August 1, 2019 to July 31, 2020; |
| iv. | the “Forklift” Operator Union agreement from May 1, 2019 to April 30, 2020; |
| v. | the “Forklift” II Operator Union agreement from August 1, 2019 to July 31, 2020; |
| vi. | the Driver and Helper of the Lagos Region Union agreement from May 1, 2019 to April 30, 2020; |
| vii. | the Driver and Helper of the Lagos Region II Union agreement from May 1, 2019 to April 30, 2020; |
| viii. | Collective bargaining agreement executed with the Drivers and Nova Iguaçu Helpers effective from May 1, 2019 to April 30, 2020; |
| ix. | Agreement with the Drivers and Helpers Workers’ Union of Rio de Janeiro in force since May 1, 2019 to April 30, 2020; |
| x. | Agreement with the Drivers and Helpers Workers’ Union of Campos dos Goytacazes in force since May 1, 2019 to April 30, 2020; |
| xi. | Agreement with the Drivers and Helpers Workers’ Union of Itaperuna in force since May 1, 2019 to April 30, 2020; |
| xii. | Agreement with the Drivers and Helpers Workers’ Union of Duque de Caxias in force since May 1, 2019 to April 30, 2020; |
| xiii. | Agreement with the Drivers and Helpers Workers’ Union of Nova Friburgo in force since May 1, 2019 to April 30, 2020; |
| xiv. | Agreement with the Drivers and Helpers Workers’ Union of São Gonçalo in force since May 1, 2019 to April 30, 2020; |
| xv. | Agreement with the Market Promoters Force Union in force since May 1, 2019 to April 30, 2020; and |
| xvi. | The Duque de Caxias Soft Drink Industry Employees’ Union agreement in negotiation. |
5 agreements for employees in the State of Espírito Santo:
| i. | the Sales Force Union agreement from May 1, 2019 to April 30, 2020; |
| ii. | Agreement with the Drivers and Helpers Workers’ Union of Vitória in force since May 1, 2019 to April 30, 2020; |
| iii. | Agreement with the Drivers and Helpers Workers’ Union at the North of the State of Espírito Santo in force since May 1, 2019 to April 30, 2020; |
| iv. | Agreement with the Drivers and Helpers Workers’ Union at the South of the State of Espírito Santo in force since May 1, 2019 to April 30, 2020; and |
| v. | the Trade Employees Union agreement from November 1, 2019 to October 31, 2020. |
9 agreements with employees from the State of São Paulo:
| i. | Workers Union for the Beverage Industry of Ribeirão Preto since October 1, 2019 to September 1, 2020; |
| ii. | Agreement with the Trade Workers Union for the region of Araraquara since October 1, 2019 to September 1, 2020; |
| iii. | Agreement with the Trade Workers Union for the region of Franca since October 1, 2019 to September 1, 2020; |
| iv. | Agreement with the Transportation Workers Union for the regions of Ribeirão Preto since May 1, 2019 to April 30, 2020; |
| v. | Agreement with the Transportation Workers Union for the regions of Franca since May 1, 2019 to April 30, 2020; |
| vi. | Agreement with the Transportation Workers Union for the regions of Araquara since May 1, 2019 to April 30, 2020; |
| vii. | Agreement with the Transportation Workers Union for the regions of Mococa since May 1, 2019 to April 30, 2020; |
| viii. | Agreement with the Security Technicians Union for the region of Ribeirão Preto, Franca, Araraquara and Mococa since May 1, 2019 to April 30, 2020; and |
| ix. | Agreement with the Salesmen Union of the State of São Paulo in negotiation. |
82
These agreements do not require us to increase wages on a collective basis. Selected increases were granted, however, according to inflation. We provide benefits to our employees according to the relevant legislation and to the collective bargaining agreements. Andina Brazil experienced its most recent work stoppages in December 2014, for three days organized by the drivers of internal buses in the Espirito Santo operation. However, as this operation no longer uses internal buses, such work stoppages are not expected to occur in the future.
Argentina
In Argentina, 66.6% of EDASA’s employees are parties to collective bargaining agreements and are represented by local workers’ unions associated with a national federation of unions. The Argentine Chamber of Non-Alcoholic Beverages of the Argentine Republic (Cámara Argentina de Industria de Bebidas sin Alcohol de la República Argentina (the “Chamber”) and the Argentine Workers Federation of Carbonated Water (Federación Argentina de Trabajadores de Aguas Gaseosas) (the “Federation”) are parties to a collective bargaining agreement that began July 29, 2008. On October 23, 2019, the Chamber and the Federation entered into a new collective bargaining agreement establishing new salaries, new non- salary benefits and a new complementary regulation on company contributions.
Argentine law requires severance payments upon dismissal without cause in an amount at least equal to an average of one-month’s wages for each year of employment or a fraction thereof if employed longer than three months. Severance payments are subject to maximum and minimum amounts fixed by legislations and jurisprudence of the Justice Supreme Court of Argentina.
All employee contributions are made to the state social security system. Most of the health system in the Argentine territory is run by the unions through contributions from employees within the Collective Work Agreements (CCT — Convenios Colectivos de Trabajo).
Paraguay
In Paraguay, 24.9% of PARESA’s employees are members of labor unions. Collective bargaining agreements are negotiated with the company (Coca-Cola Paresa Paraguay). Unions can negotiate special terms for their members, which are applicable to all employees. Collective bargaining agreements generally have a two year term of duration.
The collective bargaining agreements that are in force as of December 31, 2019 are:
| i. | Collective bargaining agreement executed with the Authentic Workers’ Union of Paraguay Refrescos effective from July 1, 2019 to June 30, 2021; |
| ii. | Employees’ Union of Paraguay Refrescos agreement effective from June 2018 to May 2020; and |
| iii. | Workers’ Union of Paraguay Refrescos agreement in negotiation. |
| E. | SHARE OWNERSHIP |
The following table sets forth the amount and percentage of our shares beneficially owned by our directors, members of the Directors’ Committee and executive officers as of December 31, 2019.
| Series A | Series B | |||||||||||||||||||||||||||||||||||||||||||||||
Beneficial Owner | % Class | Direct Owner | % Class | Indirect Owner | % Class | Beneficial Owner | % Class | Direct Owner | % Class | Indirect Owner | % Class | |||||||||||||||||||||||||||||||||||||
| Shareholder | ||||||||||||||||||||||||||||||||||||||||||||||||
| José Antonio Garcés Silva | — | — | — | — | 52,987,375 | 11.19 | — | — | — | — | 25,728,183 | 5.43 | ||||||||||||||||||||||||||||||||||||
| Arturo Majlis Albala | — | — | — | — | 2,150 | 0.00045 | — | — | 5,220 | 0.0011 | 2,150 | 0.00045 | ||||||||||||||||||||||||||||||||||||
| Salvador Said Somavía | — | — | — | — | 52,987,375 | 11.19 | — | — | — | — | 49,650,863 | 10 | ||||||||||||||||||||||||||||||||||||
| Gonzalo Said Handal | — | — | — | — | 52,989,375 | 11.19 | 11,761,462 | 3.094 | — | — | 37,864,863 | 8.018 | ||||||||||||||||||||||||||||||||||||
| Eduardo Chadwick Claro | — | — | — | — | 53,182,985 | 11.19 | — | — | — | — | 29,394,622 | 6 | ||||||||||||||||||||||||||||||||||||
83
| ITEM 7. | MAJOR SHAREHOLDERS AND RELATED PARTY TRANSACTIONS |
| A. | MAJOR SHAREHOLDERS |
The following table sets forth certain information concerning beneficial ownership of our capital stock with respect to the principal shareholders known to us who maintain at least a 5% beneficial ownership in our shares and with respect to all of our directors and executive officers as a group as of December 31, 2019:
| Series A | Series B | |||||||||||||||
| Shareholder | Shares | % Class | Shares | % Class | ||||||||||||
| Controlling shareholders(1) | 263,718,512 | 55.72 | 142,787,331 | 33.13 | ||||||||||||
| The Bank of New York Mellon(2) | 2,461,146 | 0.42 | 19,952,898 | 4.24 | ||||||||||||
| The Coca-Cola Company, directly or through subsidiaries | 69,348,241 | 14.65 | — | — | ||||||||||||
| AFPs as a group (Chilean pension funds) | 38,402,663 | 8.11 | 69,616,526 | 15.46 | ||||||||||||
| Principal foreign mutual funds as a group | 53,362,306 | 11.39 | 130,028,552 | 26.30 | ||||||||||||
| Executive officers as a group | — | — | — | — | ||||||||||||
| Directors as a group(3) | 212,149,260 | 45 | 142,638,531 | 30.13 | ||||||||||||
| (1) | Our controlling shareholders are: Inversiones SH Seis Limitada, Inversiones Cabildo SpA, Inversiones Lleuque Limitada, Inversiones Nueva Delta S.A., Inversiones Nueva Delta Dos S.A., Inversiones Playa Amarilla SpA, Inversiones Playa Negra SpA, Inversiones Don Alfonso Limitada, Inversiones El Campanario Limitada, Inversiones Los Robles Limitada, Inversiones Las Niñas Dos SpA.; the estates of Jaime Said Demaría and Alberto Hurtado Fuenzalida; and José Said Saffie and José Antonio Garcés Silva. |
| (2) | Acting as Depositary for ADRs. |
| (3) | Represents shares held directly and indirectly by Mr. Gonzalo Said Handal, Mr. José Antonio Garcés Silva (junior), Mr. Salvador Said Somavía, Mr. Eduardo Chadwick Claro and Mr. Arturo Majlis Albala. |
As of December 31, 2019, approximately 88.19% of our Series A shares and 69.46% of our Series B shares are held in Chile. It is not practicable for us to determine the number of record holders in Chile.
Our controlling shareholders act pursuant to a shareholders’ agreement that establishes that this group will exercise joint control in order to ensure a majority vote at shareholders’ meetings and board meetings. Our controlling shareholders pass resolutions with the approval of at least four of the five parties, except with respect to the following matters, which require an unanimous decision:
| · | carrying out of new business activities different from our current line of business (unless related to “ready to drink products” or Coca-Cola products); | |
| · | amendment of the number of our directors; | |
| · | issuances of new shares; | |
| · | spin-offs or mergers; | |
| · | capital increases (subject to certain indebtedness thresholds); and | |
| · | the joint acquisition of our Series A shares. |
In connection with The Coca-Cola Company’s investment in us, The Coca-Cola Company and our controlling shareholders entered into a Shareholders’ Agreement dated September 5, 1996, as amended (the “Amended and Restated Shareholders Agreement or Shareholders’ Agreement”-included as exhibit to this annual report), providing for certain restrictions on the transfer of shares of our capital stock by the Coca-Cola Shareholders and our controlling shareholders. Specifically, our controlling shareholders are restricted from transferring its Series A shares without the prior authorization of The Coca-Cola Company. The Shareholders’ Agreement also provides for certain corporate governance matters, including the right of the Coca-Cola shareholders to elect two members of our board of directors so long as The Coca-Cola Company and its subsidiaries collectively own, in aggregate, certain percentage of the Series A shares. In addition, in related agreements, our controlling shareholders granted The Coca-Cola Company an option, exercisable upon the occurrence of certain changes in the beneficial ownership of the Controlling Group, to acquire 100% of the Series A shares held by our controlling shareholders at a price and in accordance with procedures established in such agreements.
| B. | RELATED PARTY TRANSACTIONS |
In the ordinary course of our business, we engage in a variety of transactions with certain of our affiliates and related parties. Financial information concerning these transactions is set forth in Note 12.3 to our consolidated financial statements and were carried out under the following conditions: (i) they were previously approved by the Company’s Board of Directors, with the abstention of the director involved in the corresponding case; (ii) the purpose of these transactions was to contribute to the Company’s interest; and (iii) they were consistent with prevailing market price, terms and conditions at the time of their approval. Our Directors’ Committee is responsible for evaluating transactions with related parties and for reporting these transactions to the full board of directors. See “Item 6. Directors, Senior Management and Employees—Directors’ Committee”.
84
Our management believes, to the best of its knowledge, that it has complied in all material respects with the Chilean Public Company law regarding to the transactions with related parties in effect as of December 31, 2019. There can be no assurance, however, that these regulations will not be modified in the future.
| C. | INTERESTS OF EXPERTS AND COUNSEL |
Not applicable.
| ITEM 8. | FINANCIAL INFORMATION |
| A. | CONSOLIDATED STATEMENTS AND OTHER FINANCIAL INFORMATION |
See “Item 18 - Financial Statements” for our consolidated financial statements filed as part of this annual report.
Contingencies
We are party to certain legal proceedings that have arisen during the normal course of business, and we believe none of them are likely to have a material adverse effect on our financial condition. In accordance with accounting principles, the provisions regarding legal proceedings must be recorded if said procedures are reasonably probable to be resolved against the Company.
The following table represents accounting provisions made as of December 31, 2018 and 2019, for potential loss contingencies stemming from labor, tax, commercial and other litigation faced by our Company:
| For the year ended December 31, | ||||||||
| 2018 | 2019 | |||||||
| Million Ch$ | ||||||||
| Chile | 5,970 | 2,065 | ||||||
| Brazil | 55,519 | 66,070 | ||||||
| Argentina | 949 | 968 | ||||||
| Paraguay | 15 | 3 | ||||||
| Total | 62,453 | 69,108 | ||||||
For more details, see note 23 of our consolidated financial statements included herein.
Dividend Policy
The declaration and payment of dividends are determined, subject to the limitations set forth below, by the affirmative vote of a majority of our shareholders at a general shareholders’ meeting, based upon the recommendation of our board of directors.
At our annual ordinary shareholders’ meeting, our board of directors submits our annual financial statements for the preceding fiscal year together with reports prepared by our Audit Committee for approval by our shareholders. Once our shareholders have approved our annual financial statements, they determine the allocation of our net income, after provision for income taxes and legal reserves for the preceding year and considering the accumulation of losses from prior periods. All shares of our capital stock outstanding at the time a dividend or other distribution is declared are entitled to share equally in that dividend or other distribution, except that holders of our Series B shares are entitled to a dividend 10% greater than any dividend on Series A shares.
Pursuant to Chilean law, we must distribute cash dividends equal to at least 30% of our annual net income, calculated in accordance with IFRS. If we do not record any net income in a given year, we are not legally required to distribute dividends from accumulated earnings. At the general shareholders meeting held in April of 2019, our shareholders authorized our board of directors to distribute, at its discretion, interim dividends during 2019 and 2020.
85
During 2017, 2018 and 2019, our respective general shareholders meetings approved additional dividend payments to be paid from retained earnings, given our significant cash generation. These additional dividend payments for 2017, 2018 and 2019 are not indicative of whether or not additional dividend payments will be made in any future period.
The following table sets forth the amount in Chilean pesos of dividends declared and paid per share each year and the U.S. dollar amounts paid to shareholders (each ADR represents six shares), on each of the respective payment dates:
| Aggregate Amount | ||||||||||||||||||||||||||||
| Dividend | Fiscal year with | of Dividends | Series A | Series B | ||||||||||||||||||||||||
| Approval | Dividend | respect to which | Declared and Paid | Ch$ per | US$ per | Ch$ per | US$ per | |||||||||||||||||||||
| Date | payment Date | dividend was declared | (Ch$ millions) | share | share | share | share | |||||||||||||||||||||
| 12-20-2019 | 01-23-2020 | 2019 | 22,462 | 22.60 | 0.02927 | 24.86 | 0.03220 | |||||||||||||||||||||
| 09-24-2019 | 10-24-2019 | 2019 | 21,369 | 21.50 | 0.02961 | 23.65 | 0.03257 | |||||||||||||||||||||
| 04-17-2019 | 08-29-2019 | Accumulated earnings | 21,369 | 21.50 | 0.02969 | 23.65 | 0.03266 | |||||||||||||||||||||
| 04-17-2019 | 05-30-2019 | 2018 | 21,369 | 21.50 | 0.03036 | 23.65 | 0.03339 | |||||||||||||||||||||
| 12-20-2018 | 01-24-2019 | 2018 | 21,369 | 21.50 | 0.03199 | 23.65 | 0.03519 | |||||||||||||||||||||
| 09-25-2018 | 10-25-2018 | 2018 | 21,369 | 21.50 | 0.03127 | 23.65 | 0.03440 | |||||||||||||||||||||
| 04-19-2018 | 08-30-2018 | Accumulated earnings | 21,369 | 21.50 | 0.03160 | 23.65 | 0.03475 | |||||||||||||||||||||
| 04-19-2018 | 05-31-2018 | 2017 | 21,369 | 21.50 | 0.03406 | 23.65 | 0.03746 | |||||||||||||||||||||
| 12-22-2017 | 01-25-2018 | 2017 | 21,369 | 21.50 | 0.03587 | 23.65 | 0.03946 | |||||||||||||||||||||
| 09-27-2017 | 10-26-2017 | 2017 | 18,884 | 19.00 | 0.03018 | 20.90 | 0.03319 | |||||||||||||||||||||
| 04-26-2017 | 08-31-2017 | Accumulated earnings | 18,884 | 19.00 | 0.03021 | 20.90 | 0.03323 | |||||||||||||||||||||
| 04-26-2017 | 05-30-2017 | 2016 | 18,884 | 19.00 | 0.02814 | 20.90 | 0.03095 | |||||||||||||||||||||
| 12-22-2016 | 01-26-2017 | 2016 | 18,884 | 19.00 | 0.02931 | 20.90 | 0.03224 | |||||||||||||||||||||
| 09-27-2016 | 10-27-2016 | 2016 | 16,896 | 17.00 | 0.02601 | 18.70 | 0.02861 | |||||||||||||||||||||
| 04-21-2016 | 08-27-2016 | Accumulated earnings | 16,896 | 17.00 | 0.02564 | 18.70 | 0.02821 | |||||||||||||||||||||
| 04-21-2016 | 05-27-2016 | 2015 | 16,896 | 17.00 | 0.02473 | 18.70 | 0.02721 | |||||||||||||||||||||
| 12-22-2015 | 01-28-2016 | 2015 | 16,896 | 17.00 | 0.02374 | 18.70 | 0.02611 | |||||||||||||||||||||
| 09-29-2015 | 10-29-2015 | 2015 | 14,908 | 15.00 | 0.02182 | 16.50 | 0.02400 | |||||||||||||||||||||
| 04-22-2015 | 08-28-2015 | Accumulated earnings | 14,908 | 15.00 | 0.02144 | 16.50 | 0.02358 | |||||||||||||||||||||
| 04-22-2015 | 05-29-2015 | 2014 | 14,908 | 15.00 | 0.02429 | 16.50 | 0.02673 | |||||||||||||||||||||
| 12-18-2014 | 01-29-2015 | 2014 | 8,946 | 9.00 | 0.01446 | 9.90 | 0.01590 | |||||||||||||||||||||
At our general shareholders meeting held on April 16, 2020, the distribution of dividends corresponding to the 2019 year was approved. The general shareholders meeting approved to distribute definitive dividends for the amount of Ch$25,841,367,092, and additional dividends for the amount of Ch$25,841,367,092, which are expected to be paid in May and August, 2020.
| B. | SIGNIFICANT CHANGES |
We are not aware of any changes bearing upon our financial condition since the date of the financial statements included in this annual report.
| ITEM 9. | THE OFFER AND LISTING |
| A. | OFFER AND LISTING DETAILS |
Our common shares are listed and traded on the Santiago Stock Exchange and on the Bolsa Electrónica de Chile (the Chilean Electronic Stock Exchange) and, until October 2018, were listed on the Bolsa de Corredores de Valparaiso (the Valparaiso Brokers Stock Exchange), which closed operations in October 2018.
Also, our common shares have been traded in the United States on the New York Stock Exchange (“NYSE”) since July 14, 1994 in the form of ADRs, which represent six common shares. The Depositary for the ADRs is The Bank of New York Mellon.
86
The total number of registered ADR holders we had at December 2019 was 20 (15 in the Series A ADRs and 5 in the Series B ADRs). As of that date the ADRs represented 2.37% of the total number of our issued and outstanding shares. On December 31, 2019 the closing price for the Series A shares on the Santiago Stock Exchange was Ch$1,879.90 per share (US$ 15.60 per Series A ADR) and Ch$2,179 for the Series B shares (US$ 17.50 per Series B ADR). At December 31, 2019, there were 410,191 Series A ADRs (equivalent to 2,461,146 Series A shares) and 3,325,483 Series B ADRs (equivalent to 19,952,898 Series B shares).
Trading activity on the Santiago Stock Exchange is on average substantially less than that on the principal national securities exchanges in the United States. We estimate that for the year ended December 31, 2019, Andina’s shares were traded on the Santiago Stock Exchange on an average of approximately 69% and 100% of such trading days, for Series A and Series B shares, respectively.
Other than as previously discussed in “Item 7 - Major Shareholders” we are not aware of any other existing contracts or documents that impose material limitations or qualifications on the rights of shareholders of our listed securities.
Debt Securities
The Central Bank is responsible, inter alia, for Chile’s monetary policies and exchange controls. The Central Bank has authorized Chilean issuers to offer bonds in Chile and abroad under the terms of Chapter XIV of the Compendium of Foreign Exchange Regulations (Compendio de Normas de Cambios Internacionales or CFER). The following paragraphs summarize some of the Central Bank rules on international bond issuances. This summary does not intend to be complete and those interested in a full description should refer to Chapter XIV of the CFER.
Effective April 19, 2001 the CFER greatly simplified the procedure to register capital contributions, investments and foreign loans, including bonds issuances. Payments or remittances of funds, to or from Chile, in connection with credits granted abroad should be made through the Formal Exchange Market, which is composed by the main commercial banks that operate in Chile. When foreign currency resulting from loans or bonds is made available to the beneficiary in the country, the intervening bank should issue the pertinent “Form” and request certain information from the debtor and creditor, as applicable, pursuant to Chapter XIV.
Payments or remittances of foreign currency as capital, interest, adjustments, profits and other benefits originating in the transactions regulated under Chapter XIV must be reported to the Central Bank as follows: (i) if the foreign currency represents a remittance made from Chile, the intervening Formal Exchange Market bank should issue the above form; (ii) the issuer or borrower should inform the Central Bank, within the first 10 days of the month following the date of the transaction, if the foreign currency used to make the pertinent payments originates from credit transactions for which the foreign currency has been used directly abroad or if the corresponding payment obligation is fulfilled abroad using funds other than those indicated in Chapter XIV.
Any change in the terms of the transaction must be reported to the Central Bank within 10 days after formalization. This requirement applies, among others, to the substitution of the debtor or creditor, total or partial assignments of credits or rights and the modification of the financial terms of the respective credit regarding investments or capital contributions.
Exchange rule amendments dated April 2001 established that transactions recorded prior to April 19, 2001 will continue to be governed by the rules in force at the time they were recorded, but that the parties may choose to apply the new regulations.
These procedures also apply to foreign loans obtained through the placement of convertible bonds, in which case the issuer shall report to the Central Bank any increase or decrease in their registered amount as a result of the conversion of convertible bonds denominated and payable in Chilean pesos, for other convertible bonds denominated and payable in foreign currency or shares, as applicable, acquired by foreign investors with proceeds that had entered Chile under the terms of Chapter XIV.
According to Chapter XIV, the Central Bank established that credits relating to acts, agreements or contracts which create a direct obligation of payment or remittance of foreign currency abroad by persons domiciled or residing in Chile, that exceed on an individual basis the sum of US$100,000 or the equivalent in other foreign currencies, absent any special rule in the CFER, shall be reported to the Chilean Central Bank by the obligor either directly or through a Formal Exchange Market entity using the forms contained in the CFER, within 10 days from formalization.
In February 1999, after obtaining the requisite authorization from the Central Bank, we issued bonds in the international markets, subject to the exchange regulations in effect at that time. The main difference between the exchange regime applicable to our bond issuances and those currently in effect, is that in the case of our bond issuances the Central Banks warrants the access to currency markets. However, the regime applicable to our bond issuance has less flexibility as far as the procedures to carry out payments or remittances to bond holders.
87
We cannot give any assurance that the Central Bank will not impose future restrictions applicable to the holders of debt securities, nor can we make any evaluation of the duration or impact of such restrictions, if imposed.
| B. | PLAN OF DISTRIBUTION |
Not applicable.
| C. | MARKETS |
See “Item 9. The Offer and Listing—A. Offer and Listing Details”.
| D. | SELLING SHAREHOLDERS |
Not applicable.
| E. | DILUTION |
Not applicable.
| ITEM 10. | ADDITIONAL INFORMATION |
| A. | SHARE CAPITAL |
Not applicable.
| B. | MEMORANDUM AND ARTICLES OF ASSOCIATION |
Our bylaws (“Estatutos”) are included as an exhibit to this annual report, and are also available on our website www.koandina.com, under Corporate Governance/Board of Directors/Deeds of Incorporation. The following is a summary of the material provisions of our bylaws. The last amendment of our bylaws was approved on July 12, 2012.
Organization
We are a publicly held company and were incorporated on February 7, 1946. Our legal domicile is the city of Santiago, Chile, notwithstanding the special domiciles of offices, agencies or branches that are established in the country as well as abroad. Our duration is indefinite.
Purposes
Our corporate purposes are to execute and develop the following:
| · | Develop one or more industrial establishments dedicated to the business, operations and activities to manufacture, produce, transform, bottle, can, distribute, transport, import, export, purchase, sell and market in general, in any form and in any way, any type of food product and in particular any type of mineral water, juice, beverage and drink in general or other similar products, and raw materials or semi-finished materials used in such activities and/or products complementary or related to the preceding businesses and activities; |
| · | Develop one or more agricultural or agro industrial establishments and farmland dedicated to the business, operations and development of agricultural activities and agro industry in general; |
| · | Produce, transform, distribute, transport, import, export, purchase, sell and market in general, in any form and in any way, any type of agricultural products and/or agro industrial products and raw materials, or semi-finished materials used in such activities, and/or products complementary or related to the preceding activities; |
| · | Manufacture, distribute, transport, import, export, purchase, sell and market in general, in any form and in any way, any type of container; and execute and develop any type of material recycling process and activity; |
| · | Accept from and/or grant the representation of trademarks, products and/or licenses related to such businesses, activities, operations and products to national or foreign companies; |
| · | Provide any type of service and/or technical assistance in any way related to the goods, products, businesses and activities referred to in the preceding letters; |
| · | Invest cash surplus, even in the capital market; and |
| · | In general, undertake all other businesses and activities supplementary or linked to the above mentioned operations. |
88
We may execute our objectives directly or by participating as a partner or shareholder in other companies or by acquiring rights or interests in any other type of association related to the aforementioned activities.
Voting Rights
Our capital equity is divided into Series A shares and Series B shares, both preferred and with no par value, whose features, rights and privileges are the following:
| · | The preference of Series A shares consists solely of the right to elect twelve out of the fourteen board members of the Company. Series A shares are entitled to full voting rights without limitations. |
| · | The preference of Series B shares consists solely of the right to receive all and any of the per share dividends we may distribute, whether temporary, definitive, minimum mandatory, additional, or eventual, increased by 10%. Series B shares are entitled to a limited voting right, voting only with respect to the election of two board members for the Company. |
| · | The preferences of Series A and B shares will remain in effect through December 31, 2130. Once this period has expired, Series A and B will be eliminated and the shares which comprise them shall automatically become common shares without any preferences whatsoever, therefore eliminating the division of shares into series. |
Board of Directors and Shareholder Meetings
The members of the board of Directors are proposed and elected every three years during the general annual shareholders meeting. Separate voting of the Series A and Series B shareholder elect board members. As mentioned, Series A shares elect twelve directors, and Series B shares elect two Directors.
Board members are elected by separate voting at Series A and Series B shareholders meeting and will hold their offices for three years with the possibility to be re-elected for an indefinite number of periods. Even though we have not established a formal process that allows our shareholders to communicate with the directors, shareholders desiring to do so may share their opinions, considerations or recommendations before or during the corresponding shareholders’ meeting which will be heard and attended by the Chairman of the Board, or by the Chief Executive Officer, as the case may be, and any such recommendations will be submitted for resolution by the shareholders in attendance during the meeting.
Regular general shareholders meetings are held once a year within the first four months following the date of the annual balance sheet. We prepare a balance sheet annually on our operations as of December 31, which is presented together with the profit and loss statement, the report by the auditors and annual report to the respective shareholders meeting. The board sends a copy of the balance sheet, annual report, report by the auditors and respective notes to each of the shareholders registered in the registry no later than by the date the first summons is published. Special shareholders meetings may be held at any time according to corporate needs and to discuss and decide upon any matter within the competence thereof, provided it is indicated in the summons. Being a shareholder of the Company is the only condition for entry to a shareholder’s meeting.
| C. | MATERIAL CONTRACTS |
On August 1, 2016, Embotelladora Andina S.A., along with Monster Energy Company, entered into an agreement by which Monster Energy Company appointed Embotelladora Andina S.A. as distributor of products bearing the trademark “Monster” within its licensed territory in Chile (Antofagasta, Atacama, Coquimbo, Valparaíso, San Antonio, Cachapoal, Aysén and Magallanes). Similarly, on August 2, 2016, Coca-Cola Andina Brazil along with Monster Energy Company entered into an agreement by which Monster Energy Company appointed Coca-Cola Andina Brazil authorizing it to commercialize and distribute the products bearing the trademark “Monster” within its licensed territory in Brazil (majority of the State of Rio de Janeiro, entirety of the state of Espírito Santo, part of São Paulo, and part of Minas Gerais), beginning November 1, 2016, for a period of 10 years. On December 13, 2017, EDASA together with Monster Energy Company, executed an agreement whereby Monster Energy Company named Embotelladora del Atlántico S.A. as distributor of products bearing the “Monster” trademark for an initial period of 10 years in the territory within the franchise of Andina Argentina, with the consent of The Coca-Cola Company. On May 11, 2018, Paraguay Refrescos S.A. along with Monster Energy Company entered into an agreement by which Monster Energy Company appointed Paraguay Refrescos S.A. authorizing it to commercialize and distribute products bearing the trademark "Monster" within its licensed territory in Paraguay (totality of the country), beginning on December 1, 2018, for a period of 10 years.
89
See “Item 4. Information on the Company - Bottler Agreements and Item 5. Operating and Financial Review and Prospects - Summary of Significant Debt Instruments".
| D. | EXCHANGE CONTROLS |
Foreign Investment and Exchange Controls in Chile
The Central Bank is responsible, among other matters, for setting monetary policies and exchange controls in Chile. As of April 19, 2001, the Chilean Central Bank (“CCB”) eliminated prior foreign exchange controls, imposed certain reporting requirements and determined that certain operations be conducted through the Formal Exchange Market (“FEM”). The main purpose of these amendments, as declared by the Central Bank, is to facilitate the flow of capital into Chile and outside the country and to foster foreign investment.
Equity investments in Chile (including investments in stock) by non-resident persons or entities must comply with some existing exchange control restrictions.
Any foreign individual or legal entity, as well as Chileans with residence abroad, can invest in Chile through the New Direct Foreign Investment Statute or by Chapter XIV of the Foreign Exchange Regulations of the Central Bank.
Under the New Direct Foreign Investment Statute, any legal entity or individual that qualifies as foreign investor under the terms of the aforementioned Statute, may request a certificate to be issued by the Foreign Investment Promotion Agency, confirming its status as foreign investor, and enabling access to the new foreign investment regime.
During 2001, the CCB eliminated certain exchange controls. For instance, it revoked Chapter XXVI of the CFER, which regulated the issuance and placement of ADRs by Chilean corporations. Pursuant to the new rules, the Central Bank’s approval is no longer a pre-condition for ADR issuances or foreign investment contracts with the CCB. ADR issuances are now regarded as an ordinary foreign investment, and the only requirements are that the CCB be informed of the transaction, by fulfilling the rules of Chapter XIV of the CFER, that mainly establishes that the monies come in or leave the country exclusively through the Formal Exchange Market, if the recipient of the investment decides to enter the foreign currency to the country or if it carries out payments or remittances from Chile.
Notwithstanding these changes, exchange transactions authorized prior to April 19, 2001 remained subject to the rules in force as of the date of such transactions. The new exchange regime did not affect Chapter XXVI of the CFER and the Foreign Investment Contract (“FIC”) between Andina, the Central Bank and The Bank of New York Mellon (as Depositary of the shares represented by ADRs). Notwithstanding the previous, the parties to the FIC may choose to adopt the norms imposed by the CCB, resigning to those of the FIC, and which has been the option we have taken until this date. The FIC is the agreement by which access to the FEM is given to the Depositary and ADR holders. The FIC adopted the dispositions of Chapter XXVI and was celebrated pursuant to Article 47 of the Constitutional Organic Act of the CCB.
Under Chapter XXVI of the CFER, if the funds to purchase the common shares underlying the ADRs are brought into Chile, the Depositary must deliver, on behalf of foreign investors, an annex providing information on the transaction to the Formal Exchange Market entity involved, together with a letter instructing such entity to deliver the foreign currency or the equivalent amount in pesos, on or before the date the foreign currency is brought or is to be brought into Chile.
Repatriation of amounts received with respect to deposited common shares or common shares withdrawn from deposits on surrender of ADRs (including amounts received as cash dividends and proceeds from the sale in Chile of the underlying common shares and any rights arising there from) need be made through the FEM. The FEM entity intervening in the repatriation must provide certain information to the CCB on the following banking business day.
Under Chapter XXVI and the FIC, the CCB agreed to grant to the Depositary, on behalf of ADR holders, and to any investor not residing nor domiciled in Chile who acquire shares or replace ADRs for common stock, which we refer to as “Withdrawn Shares”, FEM access to convert Chilean pesos into U.S. dollars and to remit those dollars outside Chile including amounts received as: (i) cash dividends; (ii) proceeds from the sale in Chile of Withdrawn Shares; (iii) proceeds from the sale in Chile of preemptive rights to subscribe for additional shares; (iv) proceeds from the liquidation, merger or consolidation of Andina; (v) proceeds resulting from capital decreases or earnings or liquidations; and (vi) other distributions, including those in respect of any re-capitalization resulting from holding shares, ADRs or by Withdrawn Shares.
The guarantee of FEM access under the FIC will extend to the participants of the ADR offering if the following requirements are met: (i) that the funds to purchase the shares underlying the ADRs are brought into Chile and converted into Chilean pesos through the FEM; (ii) that the purchase of the underlying shares is made on a Chilean stock exchange; and (iii) that within five business days from the conversion of the funds into Chilean pesos, the CCB is informed that the funds converted were used to purchase the underlying shares, if those funds are not invested in shares within that period, it can access the FEM to reacquire foreign currency, provided that the request is submitted to the CCB within seven banking business days of the initial conversion into pesos.
90
Chapter XXVI provides that FEM access in connection with dividend payments is conditioned to our certifying to the CCB that a dividend payment has been made and that any applicable tax has been withheld. Chapter XXVI also provides that FEM access in connection with the sale of Withdrawn Shares, or distribution thereon, is conditioned upon receipt by the CCB (i) a certificate by the Depositary or custodian, as the case may be, that the shares have been withdrawn in exchange for delivery of the appropriate ADRs, and (ii) a waiver of the benefits of the FIC with respect to ADRs (except in connection with the proposed sale of the shares) until the Withdrawn Shares are re-deposited.
FEM access under any of the circumstances described above is not automatic. Pursuant to Chapter XXVI, such access needs the CCB’s approval on a request submitted to that end through a banking institution established in Chile. The FIC provides that if the CCB has not acted upon the request within seven banking days, the request is deemed to have been granted.
Under current Chilean law, the CCB cannot unilaterally change the FIC. The Chilean Courts (although not binding on future judicial decisions) also have established that the FIC cannot be annulled by future legislative changes. No assurance can be given, however, that additional Chilean restrictions applicable to the holders of ADRs, to the disposition of underlying shares, or to the repatriation of proceeds from their disposition, will not be imposed in the future; nor can there be any assessment of the duration or impact of any restrictions that might be imposed. If for whatever reason, including changes in the FIC or Chilean law, the Depositary is prevented from converting Chilean pesos into U.S. dollars, the investors shall receive dividends or other payments in Chilean pesos, which shall subject the investors to exchange rate risks. It cannot be guaranteed that the CFER, as amended, or any other exchange regulation will not be amended in the future, or that if new regulations are enacted that they shall have no material bearing on Andina or the ADR holders.
No assurance can be given that Andina will be able to purchase U.S. dollars in the local exchange market at any time in the future, nor that any such purchase will be for the amounts necessary to pay any sum due under any of its capital or debt instruments. Likewise, it is not possible to guarantee that changes to the regulations of the CCB or other legislative changes relating to exchange controls will not restrict or impair Andina’s ability to purchase U.S. dollars in order to make payment on its debt instruments.
| E. | TAXATION |
Tax Considerations Relating to Equity Securities
Chilean Tax Considerations.
The following discussion summarizes the material Chilean income tax consequences of an investment in Andina’s stock or ADRs by an individual who is not domiciled or resident in Chile or a legal entity that is not organized under the laws of Chile and does not have a permanent establishment in Chile (“foreign holder”). This discussion is based upon Chilean income tax laws presently in force and administrative jurisprudence, including Ruling No. 324 of January 29, 1990 of the Servicio de Impuestos Internos (the Chilean Internal Revenue Service or “SII”) and other applicable regulations and rulings that are subject to change without notice. The discussion is not intended as tax advice to any particular investor, which can be rendered only in light of that investor’s particular tax situation. Each investor or potential investor is encouraged to seek independent tax advice with respect to consequences of investing in Andina’s stock or ADRs.
Dividends
Dividend distributions to investors who are juridical or natural persons residing or domiciled abroad, are affected by an additional tax ("withholding at the source") at a rate of 35%, with the right to credit for corporate income tax (First Category Tax) paid by Andina (today a rate of 27%). However, distributions made to investors residing or domiciled in countries that do not have a treaty to avoid double taxation with Chile, are affected by an additional withholding equivalent to 35% of the corporate income tax credit, thus limiting the credit for this tax at 65%. This limitation does not apply to distributions made to residents in countries that have a treaty, who can impute 100% of the credit.
Distributions made to investors residing or domiciled in Chile are affected by personal taxes ("Supplementary Global Tax") which has progressive rates ranging from 0% to 35%. The tax credit limitation applies to these investors so they are taxed with a higher tax ("debit") equivalent to 35% of the corporate income tax credit.
91
Capital Gains
Gains recognized from the sale or exchange of ADRs by a foreign holder outside of Chile are not subject to Chilean taxation. Gains recognized from a sale of common shares will be subject to both the corporate income tax and the additional tax (the first can be credited against the latter), unless they are shares that are sold on the stock exchange and that have been acquired on the stock exchange, or are shares of first issue, in which case gains are not affected by income taxation in Chile.
The tax basis of shares of common stock received in exchange for ADRs will be determined in accordance with the valuation procedure set forth in the Deposit Agreement, which values shares of common stock at the highest reported sales price at which they trade on the Santiago Stock Exchange on the date of the withdrawal of the shares of common stock from the Depositary. Consequently, the conversion of ADRs into shares of common stock, and the immediate sale of the shares for the value established under the Deposit Agreement, will not generate a capital gain subject to taxation in Chile. However, in the case where the sale of the shares is made on a day that is different than the date in which the exchange is recorded, capital gain subject to taxation in Chile may be generated. In connection thereto, on October 1, 1999 the Chilean Internal Revenue Service issued Ruling No. 3,708 whereby it allowed Chilean issuers of ADRs to amend the deposit agreements to which they are parties in order to include a clause that states that, in the case that the exchanged shares are sold by the ADRs’ holders on a Chilean stock exchange either on the same day in which the exchange is recorded or within the two business days prior to such date, the acquisition price of such exchanged shares shall be the price registered in the invoice issued by the stock broker that participated in the sale transaction. As this amendment has been included in the Deposit Agreement, the capital gain that may be generated if the exchange date is different than the date on which the shares received in exchange for ADRs were sold, would not be subject to taxation, to the extent that the SII's criterion is maintained and the contributor in good faith adopts this criterion, which the contributor must certify to the satisfaction of the authority in case of observation.
The distribution and exercise of preemptive rights relating to the shares of common stock will not be subject to Chilean taxation. Any gain from the sale or transfer of preemptive rights in relation to common shares will be subject to both corporate income tax and additional tax (the first may be credited against the latter).
Other Chilean Taxes
No Chilean inheritance, gift or succession taxes apply to the transfer or disposition of the ADRs by a foreign holder, but such taxes generally will apply to the transfer at death or by gift of shares of common stock by a foreign holder. No Chilean stamp, issue, registration or similar taxes or duties apply to foreign holders of ADRs or shares of common stock.
Withholding Tax Certificates
Upon request, we will provide to foreign holders appropriate documentation evidencing the payment of Chilean withholding taxes.
United States Tax Considerations Relating to ADRs or Shares of Common Stock.
The following discussion summarizes certain U.S. federal income tax consequences of an investment ADRs or shares of common stock. This discussion is based upon U.S. federal income tax laws presently in force. The discussion is not a full description of all tax considerations that may be relevant to a decision to purchase ADRs or shares of common stock. In particular, the discussion is directed only to U.S. holders (as defined below) that hold ADRs or shares of common stock as capital assets, and it does not address the tax treatment of holders that are subject to special tax rules under the Internal Revenue Code of 1986 as amended (the “Code”), such as financial institutions, regulated investment companies, real estate investment trusts, partnerships or other pass-through entities, dealers in securities or currencies, traders in securities that elect to use a mark-to-market method of accounting for their securities holdings, insurance companies, tax-exempt entities, persons holding ADRs or shares of common stock as part of a hedging, integrated, conversion or constructive sale transaction or a straddle, holders that own or are deemed to own 10% or more of our shares (by vote or value), persons required to accelerate the recognition of any item of gross income with respect to ADRs or shares of common stock as a result of such income being recognized on an applicable financial statement, persons liable for alternative minimum tax or persons whose “functional currency” is not the U.S. dollar. Furthermore, the discussion below is based upon the provisions of the Code and regulations, rulings and judicial decisions thereunder as of the date hereof, and such authorities may be repealed, revoked or modified so as to result in U.S. federal income tax consequences different from those discussed below. In addition, the discussion below assumes that the Deposit Agreement, and all other related agreements, will be performed in accordance with their terms. If a partnership holds our ADRs or shares of common stock, the tax treatment of a partner will generally depend upon the status of the partner and the activities of the partnership. Partners in a partnership holding ADRs or shares of common stock should consult their tax advisors. This summary does not contain a detailed description of all the United States federal income tax consequences to a holder in light of its particular circumstances and does not address the Medicare tax on net investment income or the effects of any state, local or non-United States tax laws.
92
Prospective purchasers should consult their tax advisors about the federal, state, local and foreign tax consequences to them of the purchase, ownership and disposition of ADRs or shares of common stock.
As used herein, the term “U.S. holder” means a beneficial of ADRs or shares of common stock that is (i) an individual U.S. citizen or resident, (ii) a corporation (or any other entity treated as a corporation for U.S. federal income tax purposes) created or organized in or under the laws of the United States, any state thereof or the District of Columbia, (iii) an estate the income of which is subject to U.S. federal income taxation regardless of its source or (iv) a trust that: (a) is subject to the primary supervision of a court within the United States and with respect to which one or more U.S. persons have the authority to control all substantial decisions of the trust or (b) has a valid election in effect under applicable U.S. Treasury regulations to be treated as a U.S. person.
If the obligations contemplated by the Deposit Agreement are performed in accordance with its terms, ADR holders generally will be treated for U.S. federal income tax purposes as the owners of the shares of common stock represented by those ADRs. Deposits or withdrawals of shares of common stock by U.S. holders in exchange for ADRs will not result in the realization of gain or loss for U.S. federal income tax purposes.
Cash Dividends and Other Distributions
Cash distributions (including the amount of any Chilean taxes withheld) paid to U.S. holders with respect to the ADRs or shares of common stock generally will be treated as dividend income to such U.S. holders, to the extent paid out of our current or accumulated earnings and profits, as determined under U.S. federal income tax principles. Such income will be includable in the gross income of a U.S. holder as ordinary income on the day received by the Depositary, in the case of ADRs, or by the U.S. holder, in the case of shares of common stock. The dividends will not be eligible for the dividends received deduction allowed to corporations under the Code. With respect to non-corporate U.S. holders, certain dividends received from a qualified foreign corporation may be subject to reduced rates of taxation. A foreign corporation is treated as a qualified foreign corporation with respect to dividends received from that corporation on shares (or ADRs backed by such shares) that are readily tradable on an established securities market in the United States. U.S. Treasury Department guidance indicates that our ADRs (which are listed on the New York Stock Exchange, but not our shares of common stock), are readily tradable on an established securities market in the United States. Thus, we do not believe that dividends that we pay on our shares of our common stock that are not represented by ADRs currently meet the conditions required for these reduced tax rates. There can be no assurance that our ADRs will be considered readily tradable on an established securities market in later years. Non-corporate holders that do not meet a minimum holding period requirement during which they are not protected from the risk of loss or that elect to treat the dividend income as “investment income” pursuant to section 163(d)(4) of the Code will not be eligible for the reduced rates of taxation regardless of our status as a qualified foreign corporation. In addition, the rate reduction will not apply to dividends if the recipient of a dividend is obligated to make related payments with respect to positions in substantially similar or related property. This disallowance applies even if the minimum holding period has been met. Non-corporate U.S. holders should consult their own tax advisors regarding the application of these rules given their particular circumstances.
Dividends paid in Chilean pesos will be includable in income in a U.S. dollar amount based on the exchange rate in effect on the day of receipt by the Depositary, in the case of ADRs, or by the U.S. holder, in the case of shares of common stock, regardless of whether the Chilean pesos are converted into U.S. dollars. If the Chilean pesos received as dividends are not converted into U.S. dollars on the date of receipt, a U.S. holder will have a basis in the Chilean pesos equal to their U.S. dollar value on the date of receipt. Any gain or loss realized on a subsequent conversion or other disposition of the Chilean pesos will be treated as U.S. source ordinary income or loss, regardless of whether the pesos are converted into U.S. dollars.
The Chilean additional tax (net of any credit for the corporate tax), paid by or for the account of any U.S. holder may be eligible, subject to generally applicable limitations and conditions, for credit against the U.S. holder’s federal income tax liability. For purposes of calculating the foreign tax credit, dividends paid with respect to the ADRs or shares of common stock generally will be foreign source income and will generally constitute passive category income. Furthermore, in certain circumstances, a U.S. holder that: (i) has held ADRs or shares of common stock for less than a specified minimum period during which it is not protected from risk of loss or (ii) is obligated to make payments related to the dividends, will not be allowed a foreign tax credit for foreign taxes imposed on dividends paid on ADRs or shares of common stock. The rules governing the foreign tax credit are complex. Investors are urged to consult their tax advisors regarding the availability of the foreign tax credit under their particular circumstances.
Distributions to U.S. holders of additional shares of common stock or preemptive rights with respect to shares of common stock that are made as part of a pro rata distribution to all shareholders of the Company generally should not be subject to U.S. federal income tax.
93
To the extent that the amount of any distribution exceeds our current and accumulated earnings and profits for a taxable year, as determined under U.S. federal income tax principles, the distribution will first be treated as a tax-free return of capital, causing a reduction in the adjusted basis of the ADRs or shares of common stock (thereby increasing the amount of gain, or decreasing the amount of loss, to be recognized by the investor on a subsequent disposition of the ADRs or shares of common stock), and the balance in excess of adjusted basis will be taxed as capital gain recognized on a sale or exchange. Consequently, such distributions in excess of our current and accumulated earnings and profits generally would not give rise to foreign source income and a U.S. holder generally would not be able to use the foreign tax credit arising from any Chilean withholding tax imposed on such distributions unless such credit can be applied (subject to applicable limitations) against U.S. taxes due on other foreign source income in the appropriate category for foreign tax credit purposes. However, we do not expect to keep earnings and profits in accordance with U.S. federal income tax principles. Therefore, a U.S. holder should expect that a distribution will generally be treated as a dividend (as discussed above).
Passive Foreign Investment Company
We do not believe that we are, for U.S. federal income tax purposes, a passive foreign investment company (a “PFIC”) and expect to continue our operations in such a manner that we will not be a PFIC. If, however, we are or become a PFIC, U.S. holders could be subject to additional U.S. federal income taxes on gain recognized with respect to the ADRs or shares of common stock and on certain distributions, plus an interest charge on certain taxes treated as having been deferred by the U.S. holder under the PFIC rules of the U.S. federal income tax laws.
Non-corporate U.S. holders will not be eligible for reduced rates of taxation on any dividends received from us, if we are a PFIC in the taxable year in which such dividends are paid or in the preceding taxable year.
Capital Gains
U.S. holders that hold ADRs or shares of common stock as capital assets will recognize capital gain or loss for U.S. federal income tax purposes on the sale or other disposition of such ADRs or shares (or preemptive rights with respect to such shares) held by the U.S. holder or the Depositary. Capital gains of non-corporate U.S. holders (including individuals) derived with respect to capital assets held for more than one year are eligible for reduced rates of taxation. The deductibility of capital losses is subject to limitations. Any gain or loss recognized by a U.S. holder generally will be treated as U.S. source gain or loss. Consequently, in the case of a disposition of shares of common stock (which, unlike a disposition of ADRs, may be taxable in Chile), the U.S. holder may not be able to use the foreign tax credit for any Chilean tax imposed on the gain unless it can apply (subject to applicable limitations) the credit against tax due on other income from foreign sources.
Estate and Donation Taxation
As mentioned in the section "Chilean Tax Considerations – Other Chilean Taxes", in Chile no taxes are applied to inheritance, donations or transfer at the time of death with respect to ADRs by a foreign holder; however, these taxes will apply in the case of transfer at death or by gift, of common shares. The amount of any estate tax paid to Chile may qualify for credit against the amount of U.S. federal estate tax affecting the estate of a U.S. holder. U.S. holders should consult their personal tax advisors to determine whether and to what extent they may be entitled to such credit. Chilean tax on donations generally will not be treated as a creditable foreign tax for U.S. tax purposes.
Information Reporting and Backup Withholding
In general, information reporting requirements will apply to dividends in respect of ADRs or shares of common stock or the proceeds received on the sale, exchange, or other disposition of ADRs or shares of common stock paid within the United States (and in certain cases, outside of the United States) to U.S. holders other than certain exempt recipients. Likewise, a backup withholding tax may apply to such payments if the U.S. holder fails to provide an accurate taxpayer identification number or certification of exempt status or fails to report interest and dividends required to be shown on its federal income tax returns. The amount of any backup withholding from a payment to a U.S. holder will be allowed as a refund or a credit against the U.S. holder’s U.S. federal income tax liability, provided the required information is furnished to the Internal Revenue Service.
| F. | DIVIDENDS AND PAYING AGENTS |
Not applicable.
| G. | STATEMENT BY EXPERTS |
Not applicable.
94
| H. | DOCUMENTS ON DISPLAY |
We are subject to the informational reporting requirements of the U.S. Securities Exchange Act of 1934, as amended, which requires that we file periodic reports and other information with the SEC. As a foreign private issuer, we file annual reports on Form 20-F as opposed to Form 10-K. We do not file quarterly reports on Form 10-Q but furnish quarterly reports and reports in relation to material events on Form 6-K. As a foreign private issuer, we are exempt from the rules under the U.S. Securities Exchange Act of 1934, as amended, prescribing the furnishing and content of proxy statements and short-swing profit disclosure and liability.
You may read and copy all or any portion of the annual report or other information in our files in the SEC’s public reference room at 100 F Street, N.E., Washington, D.C. 20549. You can also access to these documents through the SEC’s website at www.sec.gov, and access –and request– a hard copy of them through our corporate website www.koandina.com. You can also request copies of these documents upon payment of a duplicating fee, by writing to the SEC. Please call the SEC at 1-800-SEC-0330 for further information on the operation of the public reference rooms. In addition, reports and other information concerning us may be inspected at the offices of the New York Stock Exchange, Inc., 20 Broad Street, New York, New York 10005, on which our ADRs are listed.
We also file reports with the Chilean Comisión para el Mercado Financiero (“CMF”). You may read and copy any materials filed with the CMF directly from its website www.cmfchile.cl or from our corporate website www.koandina.com or request a hard copy through our website also. The documents referred to in this annual report can be inspected at Miraflores 9153, Piso 7, Renca, Santiago, Chile.
| I. | SUBSIDIARY INFORMATION |
Not applicable.
| ITEM 11. | QUANTITATIVE AND QUALITATIVE DISCLOSURES ABOUT MARKET RISK |
The main sources of systematic risks that the Company is exposed to are: changes in interest rates and changes in currency exchange rates.
Particularly, interest rates increase, and currency exchange rates depreciation may affect the Company financial strategy given the various currency denominated debt the company currently holds. To protect the Company against market volatility, hedging policies have been set with the objective to regulate the use of financial derivatives by management. The use of these instruments had been strictly designed for hedging purposes, leaving out any speculation and trading use.
Interest Rate Risk
The Company’s debt is mainly denominated in UF (local inflation indexed Chilean currency) and U.S. dollar fixed rate bonds. Bank debt represents a smaller proportion of the total debt and it’s denominated in various local currencies in either fixed or variable rates. Given that the main portion of the debt is in fixed rate, the main risk is the interest rate increase at the moment of refinancing mature debt.
On the other side, our cash is invested in certain short-term securities mainly in fixed interest rate.
The following table provides information about the Company’s debt (bonds & bank debt) and short-term investments that have exposure to changes in interest rates as of December 31, 2019.
95
| Expected Maturity Date | Fair Value | |||||||||||||||||||||||||||||||
| 2020 | 2021 | 2022 | 2023 | 2024 | 2025 Onwards | Total | Total | |||||||||||||||||||||||||
| (in millions Ch$) | ||||||||||||||||||||||||||||||||
| Interest Earning Assets | ||||||||||||||||||||||||||||||||
| Time deposits | 13 | - | - | - | - | - | 13 | 13 | ||||||||||||||||||||||||
| Interest rate (weighted average) | 8.82 | % | - | - | - | - | - | 8.82 | % | - | ||||||||||||||||||||||
| Interest Bearing Liabilities | ||||||||||||||||||||||||||||||||
| International bonds (144A/RegS) (1) | 2,981 | - | - | 270,960 | - | - | 273,941 | 296,653 | ||||||||||||||||||||||||
| Fixed Rate [US$] 144A Bonds | 5.00 | % | - | - | 5.00 | % | - | - | 5.00 | % | - | |||||||||||||||||||||
| Local Chilean Bonds (1) | 18,623 | 11,218 | 11,599 | 12,130 | 12,698 | 400,358 | 466,626 | 534,125 | ||||||||||||||||||||||||
| Fixed Rate [UF] - Local Chilean Bonds (weighted average) | 4.63 | % | 5.61 | % | 5.64 | % | 5.68 | % | 5.72 | % | 3.51 | % | 3.78 | % | - | |||||||||||||||||
| Total public debt (Bonds) | 21,604 | 11,218 | 11,599 | 283,090 | 12,698 | 400,358 | 740,567 | 830,778 | ||||||||||||||||||||||||
| Bank debt - Chile | 749 | 736 | - | - | - | - | 1,485 | - | ||||||||||||||||||||||||
| Weighted average interest rate Ch$ | 2.13 | % | 2.13 | % | - | - | - | - | 2.13 | % | - | |||||||||||||||||||||
| Bank debt - Argentina | 8 | - | - | - | - | - | 8 | - | ||||||||||||||||||||||||
| Weighted average interest rate AR$ | 62.00 | % | - | - | - | - | - | 62.00 | % | - | ||||||||||||||||||||||
| Bank debt - Brazil | 681 | 45 | 45 | 45 | 39 | - | 855 | - | ||||||||||||||||||||||||
| Weighted average interest rate R$ | 6.91 | % | 6.00 | % | 6.00 | % | 6.00 | % | 6.00 | % | - | 6.72 | % | - | ||||||||||||||||||
| Total bank debt | 1,438 | 781 | 45 | 45 | 39 | - | 2,348 | 2,301 | ||||||||||||||||||||||||
| (1) | Includes issuance deferred costs: |
| International Bonds Issuance Costs: Current:
Ch$416 million, Non-Current: Ch$1,933 million Local Chilean Bonds: Current: Ch$169 million, Non-Current: Ch$1,055 million |
Foreign Currency Risk
As of December 31, 2019, the only foreign currency used by the Company to finance its operation is the U.S dollar, all the rest of the company’s bank and public debt is denominated in local operation currencies (UF, Chilean Peso, Argentinean Peso, Brazilian real and Paraguayan guaraníes).
The following table summarizes the financial instruments held to December 31, 2019, denominated in U.S. dollars:
| (Denominated in U.S. Dollars instruments) | 2020 | 2021 | 2022 | 2023 | 2024 | 2025 Onwards | Total | Fair Value | ||||||||||||||||||||||||
| (in millions Ch$) | ||||||||||||||||||||||||||||||||
| Assets | ||||||||||||||||||||||||||||||||
| Cash and cash equivalents | 16,733 | 0 | 0 | 0 | 0 | 0 | 16,733 | 16,733 | ||||||||||||||||||||||||
| Liabilities | ||||||||||||||||||||||||||||||||
| Bonds debt (1) | (2,981 | ) | 0 | 0 | (270,960 | ) | 0 | 0 | (273,941 | ) | (296,653 | ) | ||||||||||||||||||||
| Leasing debt | (222 | ) | (509 | ) | 0 | (343 | ) | 0 | 0 | (1,074 | ) | 0 | ||||||||||||||||||||
| Net debt | 13,530 | (509 | ) | 0 | (271,303 | ) | 0 | 0 | (258,282 | ) | (279,920 | ) | ||||||||||||||||||||
| (2) | Includes issuance deferred costs: |
| International Bonds Issuance Costs: Current:
Ch$416 million, Non-Current: Ch$1,933 million Local Chilean Bonds: Current: Ch$169 million, Non-Current: Ch$1,055 million. |
96
In order to protect the Company from the effects on results due to the volatility of the Brazilian real against the U.S. dollar, we have entered into currency swaps that cover 99% of our dollar-denominated financial obligations, thereby mitigating our exchange rate exposure.
As of December 31, 2019, the Company’s net exposure to existing assets and liabilities in foreign currencies, discounting our derivatives contracts, was Ch$10,867,119.
| ITEM 12. | DESCRIPTION OF SECURITIES OTHER THAN EQUITY SECURITIES |
| A. | DEBT SECURITIES |
Not applicable.
| B. | WARRANTS AND RIGHTS |
Not applicable.
| C. | OTHER SECURITIES |
Not applicable.
| D. | AMERICAN DEPOSITARY RECEIPTS |
Fees and Charges
The Bank of New York Mellon serves as the depositary for our ADRs. ADR holders are required to pay various fees to the depositary, and the depositary may refuse to provide any service for which a fee is assessed until the applicable fee has been paid.
ADR holders are required to pay the depositary amounts in respect of expenses incurred by the depositary or its agents on behalf of ADR holders, including expenses arising from compliance with applicable law, taxes or other governmental charges, or conversion of foreign currency into U.S. dollars. The depositary may decide in its sole discretion to seek payment by either billing holders or by deducting the fee from one or more cash dividends or other cash distributions.
ADR holders are also required to pay additional fees for certain services provided by the depositary, as set forth in the table below.
| Depositary service | Fee payable by ADR holders | |
| Issuance and delivery of ADRs, including in connection with share distributions | Up to US$5.00 per 100 ADSs (or portion thereof) | |
| Withdrawal of shares underlying ADRs | Up to US$5.00 per 100 ADSs (or portion thereof) | |
| Registration for the transfer of shares | Registration or transfer fees that may from time to time be in effect | |
| Cash distribution fees | US$0.02 or less per ADS |
In addition, holders may be required to pay a fee for the distribution or sale of securities. Such fee (which may be deducted from such proceeds) would be for an amount equal to the lesser of (1) the fee for the issuance of ADRs that would be charged as if the securities were treated as deposited shares and (2) the amount of such proceeds.
Fees Incurred in Past Annual Period
From January 1, 2019 to December 31, 2019, we received from the depositary US$90,151 for continuing annual stock exchange listing fees, standard out-of-pocket maintenance costs for the ADRs (consisting of the expenses of postage and envelopes for mailing annual and interim financial reports, printing and distributing dividend checks, electronic filing of U.S. Federal tax information, mailing required tax forms, stationery, postage, facsimile, and telephone calls), any applicable performance indicators relating to the ADR facility, underwriting fees and legal fees.
97
Fees to be Paid in the Future
The Bank of New York Mellon, as depositary, has agreed to reimburse us for expenses they incur that are related to establishment and maintenance expenses of the ADR program. The depositary has agreed to reimburse us for its continuing annual stock exchange listing fees. The depositary has also agreed to pay the standard out-of-pocket maintenance costs for the ADRs, which consist of the expenses of postage and envelopes for mailing annual and interim financial reports, printing and distributing dividend checks, electronic filing of U.S. Federal tax information, mailing required tax forms, stationery, postage, facsimile, and telephone calls. It has also agreed to reimburse us annually for certain investor relationship programs or special investor relations promotional activities. In certain instances, the depositary has agreed to provide additional payments to us based on any applicable performance indicators relating to the ADR facility. There are limits on the amount of expenses for which the depositary will reimburse us, but the amount of reimbursement available to us is not necessarily tied to the amount of fees the depositary collects from investors.
The depositary collects its fees for delivery and surrender of ADRs directly from investors depositing shares or surrendering ADRs for the purpose of withdrawal or from intermediaries acting for them. The depositary collects fees for making distributions to investors by deducting those fees from the amounts distributed or by selling a portion of distributable property to pay the fees. The depositary may collect its annual fee for depositary services by deduction from cash distributions or by directly billing investors or by charging the book-entry system accounts of participants acting for them. The depositary may generally refuse to provide fee-attracting services until its fees for those services are paid.
98
| ITEM 13. | DEFAULTS, DIVIDEND ARREARAGES AND DELINQUENCIES |
Not applicable.
| ITEM 14. | MATERIAL MODIFICATIONS TO THE RIGHTS OF SECURITY HOLDERS AND USE OF PROCEEDS |
In 1996, our shareholders approved the reclassification of our common stock into two new series of shares. Pursuant to the reclassification, each outstanding share of our common stock was replaced by one newly issued Series A share and one newly issued Series B share.
The Series A and Series B shares are principally differentiated by their voting and economic rights. The modification of our bylaws as of June 25, 2012, increased the number of directors from 7 to 14. The holders of the Series A shares have full voting power and are entitled to elect 12 of 14 members of the board of directors, and the holders of the Series B shares have no voting rights but for the right to elect 2 members of the board of directors. In addition, holders of Series B shares are entitled to a dividend 10% greater than any dividend on Series A shares.
After the reclassification, the Superintendence of Pension Fund Managers (Superintendencia de Administradores de Fondos de Pensiones) decreed that Chilean pension funds would not be permitted to acquire Series B Shares due to their limited voting rights. In 2004, however, the Superintendence reversed, and approved Series B shares as investment instruments for Chilean Pension funds. Series A shares have always been eligible as investment instruments for Chilean pensions funds.
| ITEM 15. | CONTROLS AND DISCLOSURE PROCEDURES |
Disclosure Controls and Procedures
We have evaluated, with the participation of our chief executive officer and chief financial officer, the effectiveness of our disclosure controls and procedures as of December 31, 2019. There are inherent limitations to the effectiveness of any system of disclosure controls and procedures, including the possibility of human error and the circumvention or overriding of the controls and procedures. Accordingly, even effective disclosure controls and procedures can only provide reasonable assurance of achieving their control objectives. Based upon our evaluation, our chief executive officer and chief financial officer concluded that our disclosure controls and procedures were effective to provide reasonable assurance that the information required to be disclosed by us in the reports that we file or submit under the Exchange Act is recorded, processed, summarized and reported, within the time periods specified in the applicable rules and forms, and that it is accumulated and communicated to our management, including our chief executive officer and chief financial officer, as appropriate to allow timely decisions regarding required disclosure.
Management’s Annual Report on Internal Control over Financial Reporting
Our management is responsible for establishing and maintaining adequate internal control over financial reporting, as such term is defined in Rules 13a—15(f) and 15d—15(f) under the Securities Exchange Act of 1934, as amended. Under the supervision and with the participation of our management, including our chief executive officer and chief financial officer, we conducted an evaluation of effectiveness of our internal control over financial reporting based on the framework in Internal Control—Integrated Framework (2013) issued by the Committee of Sponsoring Organizations of the Treadway Commission.
Our internal control over financial reporting is a process designed to provide reasonable assurance regarding the reliability of financial reporting and the preparation of financial statements for external purposes in accordance with IFRS as issued by the IASB. Our internal control over financial reporting includes those policies and procedures that (i) pertain to maintenance of records that, in reasonable detail, accurately and fairly reflect the transactions and dispositions or our assets; (ii) provide reasonable assurance that transactions are recorded as necessary to permit preparation of financial statements in accordance with IFRS as issued by the IASB, and that our receipts and expenditures are being made only in accordance with authorizations of our management and directors; and (iii) provide reasonable assurance regarding prevention or timely detection of unauthorized acquisition, use, or disposition of our assets that could have a material effect on our financial statements.
Because of its inherent limitations, internal control over financial reporting may not prevent or detect misstatements. Also, projections of any evaluation of effectiveness to future periods are subject to the risk that controls may become inadequate because of changes in conditions, or that the degree of compliance with the policies or procedures may deteriorate. Based on our evaluation under the framework in Internal Controls—Integrated framework (2013) issued by the Committee of Sponsoring Organizations of the Tread way Commission, our management concluded that our internal control over financial reporting was effective as of December 31, 2019.
99
The effectiveness of our internal control over financial reporting as of December 31, 2019 has been audited by our registered independent accounting firm, which opinion is stated in their report, included on pages F-2 and F-3 herein.
Changes in Internal Control over Financial Reporting
There have been no changes in our internal control over financial reporting identified in connection with the evaluation required under Rules 13a-15 or 15d-15 that occurred during the period covered by this annual report that has materially affected, or is reasonably likely to materially affect, our internal control over financial reporting.
| ITEM 16. | [RESERVED] |
| ITEM 16A. | AUDIT COMMITTEE FINANCIAL EXPERT |
Our board of directors has designated Mr. Gonzalo Parot Palma as our Audit Committee Financial Expert, as defined in the instructions to Item 16A of Form 20-F. Our board of directors has also determined that Mrs. Pilar Lamana Gaete and Mr. Gonzalo Parot Palma are independent directors as defined in Section 303A.02 of the NYSE’s Listed Company Manual.
| ITEM 16B. | CODE OF ETHICS |
We have adopted a Code of Ethics that constitutes a code of ethics for our directors and employees. This Code applies to our Board of Directors, chief executive officer and all senior financial officers of our Company, including the chief financial officer or any other persons performing similar functions, as well as to all other officers and employees of the Company. Our Code of Ethics is available on our website www.koandina.com. If we make any substantive amendment to the Code or grant any waivers, including any implicit waiver, from a provision of the Code, we will disclose the nature of such amendment or waiver on the above mentioned website through a 6-K form.
| ITEM 16C. | PRINCIPAL ACCOUNTANT FEES AND SERVICES |
Fees Paid to Independent Public Accountants
The following table sets forth, for each of the years indicated, the kinds of fees paid to our external auditors and the percentage of each of the fees out of the total amount paid to them.
| Year ended December 31, | ||||||||||||||||
| 2018 | 2019 | |||||||||||||||
| Services rendered | Fees millions Ch$ | % of Total Fees | Fees millions Ch$ | % of Total Fees | ||||||||||||
| Audit fees (1) | 835 | 100 | % | 842 | 100 | % | ||||||||||
| Audit-related fees (2) | — | — | — | — | ||||||||||||
| Tax fees (3) | — | — | — | — | ||||||||||||
| Other fees | — | — | — | — | ||||||||||||
| Total | 835 | 100 | % | 842 | 100 | % | ||||||||||
| (1) | Audit fees consist of services that would normally be provided in connection with statutory and regulatory filings or engagements, including services that generally only the independent accountant can reasonably provide. |
| (2) | Audit-related fees relate to assurance and associated services that traditionally are performed by the independent accountant, including attestation services that are not required by statute or regulation; accounting consultation and audits in connection with mergers, acquisitions and divestitures; employee benefit plan audits; and consultation concerning financial accounting and reporting standards. |
| (3) | Tax fees relate to services performed by the tax division for tax compliance, planning, and advice. |
100
Directors’ Committee and Audit Committee Pre-Approval Policies and Procedures
We have adopted pre-approval policies and procedures under which all non-audit services provided by our external auditors must be pre-approved by our Directors’ Committee. Once the proposed service is approved, our subsidiaries or we formalize the engagement of services. In addition, the members of our board of directors are briefed on matters discussed by the Directors’ Committee.
| ITEM 16D. | EXEMPTIONS FROM THE LISTING STANDARDS FOR AUDIT COMMITTEES |
Our Audit Committee is comprised of Gonzalo Parot Palma, Salvador Said Somavía and Pilar Lamana Gaete.
We disclose that, with respect to the current membership of Mr. Salvador Said Somavía on our Audit Committee, the Company has relied on the exemption from the independence requirements provided by Rule 10A-3(b)(1)(iv)(D) of the Securities and Exchange Act of 1934, as amended. Pursuant to said rule, a member of the Committee who is an affiliate of the foreign private issuer or a representative of such an affiliate that has only observer status on, and is not a voting member or the chair of, the audit committee, and is not an executive officer of the foreign private issuer, may be exempted from the independence requirement.
Mr. Salvador Said Somavía meets, for the duration of his membership, the requirements of Rule 10A-3(b)(1)(iv)(D) because he (i) is a representative of our controlling shareholder group; (ii) has an observer-only status on our Audit Committee; (iii) is not an officer of the Company or any of our subsidiaries; and (iv) does not receive, directly or indirectly, compensation from us or any of our subsidiaries other than in his capacity as member of our Audit Committee.
Our reliance on the exemption provided by Rule 10A-3 of the Exchange Act, with respect to Mr. Salvador Said Somavía, would not materially adversely affect the ability of our Audit Committee to act independently.
| ITEM 16E. | PURCHASERS OF EQUITY SECURITIES BY THE ISSUER AND AFFILIATED PURCHASERS |
During 2019, no issuer or affiliated parties made purchases pursuant to publicly announced plans or programs or not pursuant to such plans.
| ITEM 16F. | CHANGE IN REGISTRANT’S CERTIFYING ACCOUNTANT |
Not applicable.
| ITEM 16G. | CORPORATE GOVERNANCE |
NYSE and Chilean Corporate Governance Requirements
In accordance with Section 303A.11 of the NYSE’s Listed Company Manual, the following table sets forth significant differences between Chilean corporate governance practices and those corporate governance practices followed by domestic corporations under NYSE listing standards. Significant ways in which our corporate governance practices differ from those followed by U.S. companies under NYSE listing standards are also publicly available on our website at www.koandina.com.
| ITEM | NYSE REQUIREMENTS | CHILEAN LAW REQUIREMENTS | ||
| 303A.01 Independent Directors |
Members of the Board of Directors must be independent in their majority. | There is no legal obligation to have a Board of Directors composed mainly of independent members. In addition, according to section 303A regarding Controlled Companies, the requirements of 303A do not apply to our Company. | ||
| 303A.02 Independence Tests |
Members of the Board of Directors must meet the Test of Independence. | No similar legal obligation exists under Chilean law. However, article 50 bis of the Corporations Law require appointing at least one independent director. Law considers independent such director that within the last 18 months is not involved in certain circumstances, such as: having an economic interest in the company or other group, having a relationship with such persons, be director of nonprofit organizations, among others, and comply with a declaration of independence. |
101
| ITEM | NYSE REQUIREMENTS | CHILEAN LAW REQUIREMENTS | ||
| 303A.03 Executive Sessions |
Non-Management Directors must meet regularly without management of the company. | No similar legal obligation exists under Chilean law. Under Chilean law, the position of director of a corporation is incompatible with the position of manager, auditor, accountant or president of the company. The Non-Management Director does not exist under Chilean law. Directors, however, are required to convene in legally established meetings to resolve matters required by Chilean Corporation Law. | ||
| 303A.04 Nominating/Corporate Governance Committee |
Listed companies must have a Nominating/Corporate Governance Committee composed entirely of independent directors and must have a written charter addressing certain matters. | There is no similar legal obligation under Chilean law. Andina has a Directors’ Committee whose functions are set by Chilean Corporation Law. In addition, section 303 A regarding Controlled Companies does not apply to our Company. | ||
| 303A.05 Compensation Committee |
Listed companies must have a Compensation Committee composed entirely of independent directors and must have a written charter addressing certain matters. | There is no similar legal obligation under Chilean law. In accordance with Chilean law, the above-mentioned Directors’ Committee is in charge of reviewing management compensation. In addition, section 303 A regarding Controlled Companies does not apply to our Company. | ||
| 303A.06 Audit Committee |
Listed companies must have an Audit Committee that satisfies the requirements of Rule 10A-3 under the Exchange Act. The Audit Committee must have a minimum of three members. In addition to any requirement of Rule 10A-3(b)(1), all Audit Committee members must satisfy the requirements for independence set out in Section 303 A.02. The Audit Committee must have a written charter addressing certain matters. |
No similar legal obligation exists under Chilean law. However, in accordance with the Chilean Public Companies Law 18,046, public companies that have a net worth of more than 1.5 million UFs and/or at least a 12.5% of its issued shares with voting rights are held by individual shareholders who control or own less than 10% of such shares must have a Directors’ Committee, formed by three members who are in their majority independent of the controller. Andina designated an Audit Committee in accordance with Rule 10 A.3.The functions of this committee are described under “Item 6. Directors, Senior Management and Employees-Board Practices”. | ||
| 303A.07 Internal Audit Function |
Listed companies must maintain an Internal Audit Function to provide management and the Audit Committee with ongoing assessments of the company’s risk management processes and systems of internal control. A listed company may choose to outsource this function to a third party service provider other than its independent auditor. | There is no similar obligation under Chilean law. Chilean law requires that companies must have both account inspectors and external auditors. However, Andina has an Internal Auditor who reports to the Audit Committee. | ||
| 303A.08 Voting on Compensation Plans |
Shareholders must have the opportunity to vote on the creation or amendment of compensation plans regarding board members, executives and employees. | There is no similar obligation under Chilean law, with the exception of Directors’ compensation which annually approved during the general shareholders meeting. | ||
| 303A.09 Corporate Governance Guidelines |
Listed companies must adopt and disclose Corporate Governance Practices. | Chilean Law does not require the adoption of Corporate Governance Practices because Chilean Corporate Law have established them. However, the CMF in General Rule No. 385 requires publicly traded corporations to report their corporate governance practices. |
102
| ITEM | NYSE REQUIREMENTS | CHILEAN LAW REQUIREMENTS | ||
| 303A.10 Code of Ethics and Business Conduct |
A company must adopt a Code of Business Conduct for its directors, officers and employees. Such company must disclose any waiver of its code of conduct that is granted to an officer or director. | There is no legal obligation to adopt a Code of Business Conduct. Chilean law requires that a company have a set of internal regulations which regulate the company and its relations with personnel. Such regulations must contain, among other things, regulations related to ethics and good behavior. Notwithstanding the above, a company may create internal codes of conduct, provided they do not require or prohibit behavior that contravenes Chilean law. In 1996, Andina created a Code of Ethics and Business Conduct that applies to the entire Company. Andina has posted this information on its website www.koandina.com. | ||
| 303A.11 Foreign Private Issuer Disclosure |
A company must provide a summary description of significant differences between its home country corporate governance practices and the corporate governance requirements established by the NYSE as applicable to U.S. domestic listed companies | No similar obligation exists under Chilean law. However, Andina has posted this information on its website www.koandina.com. | ||
| 303A.12 Certification Requirements |
Each listed company CEO must certify to the NYSE each year that he or she is not aware of any violation by the company of NYSE corporate governance listing standards. Each listed company CEO must promptly notify the NYSE in writing after any executive officer of the listed company becomes aware of any material non-compliance with any of the applicable provisions of Section 303 A. Each listed company must submit an executed Written Affirmation annually to the NYSE. In addition, each listed company must submit an interim Written Affirmation each time a change occurs to the Board of Directors or any of the committees subject to Section 303 A. The annual and interim Written Affirmations must be in the form specified by the NYSE. | No similar obligation exists under Chilean law. However, in accordance with Chilean law, the directors of a company must annually submit for approval the company’s annual report and financial statements to its shareholders at the company’s annual shareholders’ meeting. Similarly, public companies must, from time to time, provide all relevant company information by means of the publications and notifications established by law. | ||
| 303A.13 Public Reprimand |
The NYSE may issue a Public Reprimand letter to any listed company, regardless of the type of security listed or country of incorporation if it determines the company has violated a NYSE listing standard. | No similar obligation exists under Chilean law, with the exception of sanctions imposed by the CMF. | ||
| 307 Company Website |
Listed Companies must have a company website which is accessible from the United States. The website must contain in it all NYSE requirements including those referring to Corporate Governance. | No similar obligation exists under Chilean law. However, if a listed company does have a website, the company must make available on its website certain information required by the rules under Chilean Company Law N° 18,046. |
| ITEM 16H. | MINE SAFETY DISCLOSURE |
Not applicable.
103
| ITEM 17. | FINANCIAL STATEMENTS |
Reference is made to Item 18 for a list of all financial statements filed as part of this annual report.
| ITEM 18. | FINANCIAL STATEMENTS |
The following financial statements, together with the report of independent registered accounting firm, are filed as part of this annual report:
104
| ITEM 19. | EXHIBITS |
The exhibits filed with or incorporated by reference in this annual report are listed in the exhibit index below.
EXHIBIT INDEX
105
106
107
| 8.1 | List of our subsidiaries (filed herein). | |
| 12.1 | Certification of Miguel Ángel Peirano, Chief Executive Officer, pursuant to Rule 13-a14(a) (17 CFR 240.13a-12(a)) or Rule 15d-14(a) (17 CFR 240.15d-14(a)) (filed herein). | |
| 12.2 | Certification of Andrés Wainer, Chief Financial Officer pursuant to Rule 13-a14(a) (17 CFR 240.13a-12(a)) or Rule 15d-14(a) (17 CFR 240.15d-14(a)) (filed herein). | |
| 13.1 | Certification of Miguel Ángel Peirano, Chief Executive Officer, pursuant to 18 U.S.C. Chapter 63, Section 1350, (filed herein). | |
| 13.2 | Certification of Andrés Wainer, Chief Financial Officer, pursuant to 18 U.S.C. Chapter 63, Section 1350, (filed herein). | |
| 101.INS | XBRL Instance Document. | |
| 101.SCH | XBRL Taxonomy Extension Schema Document. | |
| 101.CAL | XBRL Taxonomy Extension Calculation Linkbase Document. | |
|
101.DEF |
XBRL Taxonomy Extension Definition Linkbase Document. | |
|
101.LAB |
XBRL Taxonomy Extension Label Linkbase Document. | |
| 101.PRE | XBRL Taxonomy Extension Presentation Linkbase Document. |
108
SIGNATURES
The registrant hereby certifies that it meets all of the requirements for filing on Form 20-F and that it has duly caused and authorized the undersigned to sign this annual report on its behalf.
| Embotelladora Andina S.A. | |
| (Registrant) | |
| /s/ Miguel Ángel Peirano /s/ Andrés Wainer | |
| (Signature) |
Date: April 29, 2020
109
EMBOTELLADORA ANDINA S.A. AND SUBSIDIARIES
Consolidated Financial Statements
As of December 31, 2019 and 2018
Report of Independent Registered Public Accounting Firm
To the Shareholders and the Board of Directors of Embotelladora Andina S.A.
Opinion on the Consolidated Financial Statements
We have audited the accompanying consolidated statements of financial position of Embotelladora Andina S.A. and subsidiaries (the Company) as of December 31, 2019 and 2018, the related consolidated statements of income, other comprehensive income, changes in equity and cash flows for each of the three years in the period ended December 31, 2019, and the related notes (collectively referred to as the “consolidated financial statements”). In our opinion, the consolidated financial statements present fairly, in all material respects, the consolidated financial position of the Company as of December 31, 2019 and 2018, and the consolidated results of its operations and its cash flows for each of the three years in the period ended December 31, 2019, in conformity with International Financial Reporting Standards (IFRS), as issued by the International Accounting Standards Board.
We also have audited, in accordance with the standards of the Public Company Accounting Oversight Board (United States) (PCAOB), the Company's internal control over financial reporting as of December 31, 2019, based on criteria established in Internal Control-Integrated Framework issued by the Committee of Sponsoring Organizations of the Treadway Commission (2013 framework) and our report dated April 28, 2020 expressed an unqualified opinion thereon.
Basis for Opinion
These consolidated financial statements are the responsibility of the Company's management. Our responsibility is to express an opinion on the Company's financial statements based on our audits. We are a public accounting firm registered with the PCAOB and are required to be independent with respect to the Company in accordance with the U.S. federal securities laws and the applicable rules and regulations of the Securities and Exchange Commission and the PCAOB.
We conducted our audits in accordance with the standards of the PCAOB. Those standards require that we plan and perform the audit to obtain reasonable assurance about whether the consolidated financial statements are free of material misstatement, whether due to error or fraud. Our audits included performing procedures to assess the risks of material misstatement of the consolidated financial statements, whether due to error or fraud, and performing procedures that respond to those risks. Such procedures included examining, on a test basis, evidence regarding the amounts and disclosures in the consolidated financial statements. Our audits also included evaluating the accounting principles used and significant estimates made by management, as well as evaluating the overall presentation of the consolidated financial statements. We believe that our audits provide a reasonable basis for our opinion.
Critical Audit Matters
The critical audit matters communicated below are matters arising from the current period audit of the financial statements that were communicated or required to be communicated to the audit committee and that: (1) relate to accounts or disclosures that are material to the financial statements and (2) involved our especially challenging, subjective or complex judgments. The communication of critical audit matters does not alter in any way our opinion on the consolidated financial statements, taken as a whole, and we are not, by communicating the critical audit matters below, providing separate opinions on the critical audit matters or on the accounts or disclosures to which they relate.
F-1
| | | Impairment of indefinite lived assets - distribution rights and goodwill |
| Description of the Matter | |
As disclosed in Notes 15 and 16 to the consolidated financial statements, Distribution Rights and Goodwill were Ch$ 666,755 million and Ch$ 121,222 million respectively as of December 31, 2019. The Company carries out an impairment test annually, or more frequently if indicators of impairment require the performance of an interim impairment assessment.
Auditing management impairment tests was complex and specially challenging due to the significant measurement uncertainty in determining the fair values of the reporting units. In particular the fair value estimates are sensitive to changes in significant assumptions such as discount rate, revenue growth rate, operating margins, consumer trends and other market and economic conditions.
|
| How We Addressed the Matter in our Audit | |
We obtained an understanding, evaluated the design and tested the operating effectiveness of controls over the distribution rights and goodwill impairment test. For example, we tested controls over the significant assumptions, such as discount rate, projected cash flow, terminal growth rate, revenue growth rates, among others, used in the fair value computation process.
To test the fair values of the reporting units, our audit procedures included, among others, assessing the methodologies used by the Company with the assistance of our valuation specialists; testing the underlying data; evaluating significant assumptions, such as volume growth and product mix, with the assistance of our valuation specialists; comparing significant assumptions to current market and economic trends and historical results of the Company's business and performing a sensitivity analysis of significant assumptions to evaluate the changes in the fair value of the reporting units resulting from changes in those assumptions. We also evaluated the financial statements disclosures included in Notes 2.8, 15 and 16.
|
| | | Tax Contingencies in Brazil |
| Description of the Matter | |
As described in Note 23 to the consolidated financial statements, the Company is party to administrative and legal proceedings arising from various tax claims. The provision regarding these claims recorded as of December 31, 2019, only includes those claims in which the probability of loss was assessed as more-likely-than-not based on current available information. The Company uses significant judgment in determining whether its technical merits are more-likely-than-not to be sustained in the court, considering the complexity of the Brazilian tax environment and lack of jurisprudence for certain tax matters. To carry out this assessment, management monitors the evolution of court ruling trends and is assisted by the Company’s external legal counsel.
Auditing management’s assessment of the probability of a loss on tax claims is complex, highly judgmental and based on interpretations of tax laws and legal rulings, as there is significant estimation uncertainty related to the ultimate outcome of court decisions, the evolution of jurisprudence and the position of the Brazilian tax authorities. |
F-2
| How We Addressed the Matter in our Audit | |
We obtained an understanding, evaluated the design and tested the operating effectiveness of controls over the identification and evaluation of tax claims, including management’s process to determine whether the technical merits are more-likely-than-not to be sustained in the court.
To test the Company’s assessment of the probability of a loss on tax claims, our audit procedures included, among others, involving of our tax professionals to assess the Company’s technical merits and in evaluating a sample of legal opinions or other tax advice obtained by the Company; independently corresponding with certain key external tax and legal advisers of the Company; comparing the evolution of the loss probability assessment by the Company for significant matters and evaluating the Company’s current assessment using our knowledge of, and experience with, the application of tax laws by the relevant tax authorities. We also evaluated the financial statements disclosures included in notes in Notes 19 and 23.
|
/s/ EY Audit SpA
We have served as the Company's auditor since 2017.
Santiago, Chile
April 28, 2020
F-3
Report of Independent Registered Public Accounting Firm
To the Shareholders and the Board of Directors of Embotelladora Andina S.A.
Opinion on Internal Control over Financial Reporting
We have audited Embotelladora Andina S.A .’s internal control over financial reporting as of December 31, 2019, based on criteria established in Internal Control-Integrated Framework issued by the Committee of Sponsoring Organizations of the Treadway Commission (2013 framework) (the COSO criteria). In our opinion, Embotelladora Andina S.A. (the Company) maintained, in all material respects, effective internal control over financial reporting as of December 31, 2019, based on the COSO criteria.
We also have audited, in accordance with the standards of the Public Company Accounting Oversight Board (United States) (PCAOB), the accompanying consolidated statements of financial position of Embotelladora Andina S.A. as of December 31, 2019 and 2018, the related consolidated statements of income, other comprehensive income, changes in equity and cash flows for each of the three years then ended December 31, 2019, and the related notes and our report dated April 28, 2020 expressed an unqualified opinion thereon.
Basis for Opinion
The Company's management is responsible for maintaining effective internal control over financial reporting and for its assessment of the effectiveness of internal control over financial reporting included in the accompanying Report on Internal Control over Financial Reporting. Our responsibility is to express an opinion on the Company's internal control over financial reporting based on our audit. We are a public accounting firm registered with the PCAOB and are required to be independent with respect to the Company in accordance with the U.S. federal securities laws and the applicable rules and regulations of the Securities and Exchange Commission and the PCAOB.
We conducted our audit in accordance with the standards of the PCAOB. Those standards require that we plan and perform the audit to obtain reasonable assurance about whether effective internal control over financial reporting was maintained in all material respects.
Our audit included obtaining an understanding of internal control over financial reporting, assessing the risk that a material weakness exists, testing and evaluating the design and operating effectiveness of internal control based on the assessed risk, and performing such other procedures as we considered necessary in the circumstances. We believe that our audit provides a reasonable basis for our opinion.
F-4
Definition and Limitations of Internal Control over Financial Reporting
A company's internal control over financial reporting is a process designed to provide reasonable assurance regarding the reliability of financial reporting and the preparation of financial statements for external purposes in accordance with generally accepted accounting principles. A company's internal control over financial reporting includes those policies and procedures that (1) pertain to the maintenance of records that, in reasonable detail, accurately and fairly reflect the transactions and dispositions of the assets of the company; (2) provide reasonable assurance that transactions are recorded as necessary to permit preparation of financial statements in accordance with generally accepted accounting principles, and that receipts and expenditures of the company are being made only in accordance with authorizations of management and directors of the company; and (3) provide reasonable assurance regarding prevention or timely detection of unauthorized acquisition, use, or disposition of the company's assets that could have a material effect on the financial statements.
Because of its inherent limitations, internal control over financial reporting may not prevent or detect misstatements. Also, projections of any evaluation of effectiveness to future periods are subject to the risk that controls may become inadequate because of changes in conditions, or that the degree of compliance with the policies or procedures may deteriorate.
/s/ EY Audit SpA
Santiago, Chile
April 28, 2020
F-5
EMBOTELLADORA ANDINA S.A. AND SUBSIDIARIES
Consolidated Financial Statements
| I. | Consolidated Statements of Financial Position as of December 31, 2019 and 2018 | F-7 |
| II. | Consolidated Statements of Income by Function For the periods ended December 31, 2019, 2018 and 2017 | F-9 |
| III. | Consolidated Statements of Comprehensive Income For the periods ended December 31, 2019, 2018 and 2017 | F-10 |
| IV. | Consolidated Statements of Changes in Equity For the periods ended December 31, 2019, 2018 and 2017 | F-11 |
| V. | Consolidated Statements of Direct Cash Flows For the periods ended December 31, 2019, 2018 and 2017 | F-13 |
| VI. | Notes to the Consolidated Financial Statements | F-14 |
| 1. | Corporate information | F-14 |
| 2. | Presentation bases of consolidated financial statements and applicable accounting criteria | F-15 |
| 3. | Financial information by segment | F-36 |
| 4. | Cash and cash equivalents | F-40 |
| 5. | Other financial assets, current and non-current | F-40 |
| 6. | Other non-financial assets, current and non-current | F-41 |
| 7. | Trade and other receivables | F-42 |
| 8. | Inventory | F-43 |
| 9. | Tax assets and liabilities | F-44 |
| 10. | Income tax and deferred taxes | F-45 |
| 11. | Property, plant and equipment | F-48 |
| 12. | Related parties | F-53 |
| 13. | Employee benefits, current and non-current | F-55 |
| 14. | Investments accounted for using the equity method | F-57 |
| 15. | Intangible assets other than goodwill | F-60 |
| 16. | Goodwill | F-62 |
| 17. | Other financial liabilities, current and non-current | F-62 |
| 18. | Trade accounts payable and other accounts payable | F-74 |
| 19. | Other provisions, current and non-current | F-74 |
| 20. | Other non-financial liabilities | F-75 |
| 21. | Equity | F-75 |
| 22. | Derivative Assets and liabilities | F-82 |
| 23. | Litigations and contingencies | F-85 |
| 24. | Financial risk management | F-88 |
| 25. | Expenses by nature | F-93 |
| 26. | Other income | F-93 |
| 27. | Other expenses by function | F-94 |
| 28. | Income and financial costs | F-94 |
| 29. | Other (loss) gains | F-95 |
| 30. | Local and foreign currency | F-96 |
| 31. | Subsequent events | F-100 |
F-6

EMBOTELLADORA ANDINA S.A. AND SUBSIDIARIES
Consolidated Statements of Financial Position
| ASSETS | NOTE | 12.31.2019 | 12.31.2018 | |||||||||
| ThCh$ | ThCh$ | |||||||||||
| Current assets: | ||||||||||||
| Cash and cash equivalents | 4 | 157,567,986 | 137,538,613 | |||||||||
| Other financial assets | 5 | 347,278 | 683,567 | |||||||||
| Other non-financial assets | 6 | 16,188,965 | 5,948,923 | |||||||||
| Trade and other accounts receivable, net | 7 | 191,077,588 | 174,113,323 | |||||||||
| Accounts receivable from related companies | 12.1 | 10,835,768 | 9,450,263 | |||||||||
| Inventory | 8 | 147,641,224 | 151,319,709 | |||||||||
| Current tax assets | 9 | 9,815,294 | 2,532,056 | |||||||||
| Total Current Assets | 533,474,103 | 481,586,454 | ||||||||||
| Non-Current Assets: | ||||||||||||
| Other financial assets | 5 | 110,784,311 | 97,362,295 | |||||||||
| Other non-financial assets | 6 | 125,636,150 | 34,977,264 | |||||||||
| Trade and other receivables | 7 | 523,769 | 1,270,697 | |||||||||
| Accounts receivable from related parties | 12.1 | 283,118 | 74,340 | |||||||||
| Investments accounted for under the equity method | 14 | 99,866,733 | 102,410,945 | |||||||||
| Intangible assets other than goodwill | 15 | 675,075,375 | 668,822,553 | |||||||||
| Goodwill | 16 | 121,221,661 | 117,229,173 | |||||||||
| Property, plant and equipment | 11 | 722,718,863 | 710,770,968 | |||||||||
| Deferred tax assets | 10.2 | 1,364,340 | - | |||||||||
| Total Non-Current Assets | 1,857,474,320 | 1,732,918,235 | ||||||||||
| Total Assets | 2,390,948,423 | 2,214,504,689 | ||||||||||
The accompanying notes 1 to 32 form an integral part of these Consolidated Financial Statements
F-7
EMBOTELLADORA ANDINA S.A. AND SUBSIDIARIES
Consolidated Statements of Financial Position
| LIABILITIES AND EQUITY | NOTE | 12.31.2019 | 12.31.2018 | |||||||||
| ThCh$ | ThCh$ | |||||||||||
| LIABILITIES | ||||||||||||
| Current Liabilities: | ||||||||||||
| Other financial liabilities | 17 | 40,593,878 | 56,114,977 | |||||||||
| Trade and other accounts payable | 18 | 243,700,553 | 238,109,847 | |||||||||
| Accounts payable to related parties | 12.2 | 53,637,601 | 45,827,859 | |||||||||
| Provisions | 19 | 2,068,984 | 3,485,613 | |||||||||
| Income taxes payable | 9 | 6,762,267 | 9,338,612 | |||||||||
| Employee benefits current provisions | 13 | 38,392,854 | 33,210,979 | |||||||||
| Other non-financial liabilities | 20 | 26,502,215 | 33,774,214 | |||||||||
| Total Current Liabilities | 411,658,352 | 419,862,101 | ||||||||||
| Other financial liabilities, non-current | 17 | 743,327,057 | 716,563,778 | |||||||||
| Accounts payable, non-current | 18 | 619,587 | 735,665 | |||||||||
| Accounts payable to related companies, non-current | 12.2 | 19,777,812 | - | |||||||||
| Other provisions, non-current | 19 | 67,038,566 | 58,966,913 | |||||||||
| Deferred tax liabilities | 10.2 | 169,449,747 | 145,245,948 | |||||||||
| Employee benefits non-current provisions | 13 | 10,173,354 | 9,415,541 | |||||||||
| Non-Current Liabilities: | 1,010,386,123 | 930,927,845 | ||||||||||
| Equity: | 21 | |||||||||||
| Issued capital | 270,737,574 | 270,737,574 | ||||||||||
| Retained earnings | 600,918,265 | 462,221,463 | ||||||||||
| Other reserves | 76,993,851 | 110,854,089 | ||||||||||
| Equity attributable to equity holders of the parent | 948,649,690 | 843,813,126 | ||||||||||
| Non-controlling interests | 20,254,258 | 19,901,617 | ||||||||||
| Total Equity | 968,903,948 | 863,714,743 | ||||||||||
| Total Liabilities and Equity | 2,390,948,423 | 2,214,504,689 | ||||||||||
The accompanying notes 1 to 32 form an integral part of these Consolidated Financial Statements
F-8
EMBOTELLADORA ANDINA S.A. AND SUBSIDIARIES
Consolidated Statements of Income by Function
for the periods between January 1 and December 31, 2019, 2018 and 2017
| 01.01.2019 | 01.01.2018 | 01.01.2017 | ||||||||||||||
| 12.31.2019 | 12.31.2018 | 12.31.2017 | ||||||||||||||
| NOTE | ThCh$ | ThCh$ | ThCh$ | |||||||||||||
| Net sales | 1,779,025,115 | 1,672,915,799 | 1,848,878,619 | |||||||||||||
| Cost of sales | 8 | (1,048,343,767 | ) | (968,027,774 | ) | (1,069,024,964 | ) | |||||||||
| Gross Profit | 730,681,348 | 704,888,025 | 779,853,655 | |||||||||||||
| Other income | 26 | 40,947,158 | 2,609,168 | 550,834 | ||||||||||||
| Distribution expenses | 25 | (166,996,289 | ) | (165,775,484 | ) | (192,927,875 | ) | |||||||||
| Administrative expenses | 25 | (325,903,809 | ) | (313,742,853 | ) | (348,199,321 | ) | |||||||||
| Other expenses | 27 | (26,182,847 | ) | (16,057,763 | ) | (16,701,471 | ) | |||||||||
| Other (loss) gains | 29 | 2,876 | (2,707,859 | ) | (2,537,269 | ) | ||||||||||
| Financial income | 28 | 45,155,791 | 3,940,244 | 11,194,375 | ||||||||||||
| Financial expenses | 28 | (46,209,020 | ) | (55,014,660 | ) | (55,220,369 | ) | |||||||||
| Share of profit (loss) of investments in associates and joint ventures accounted for using the equity method | 14.3 | (3,415,083 | ) | 1,411,179 | (80,360 | ) | ||||||||||
| Foreign exchange differences | (4,130,543 | ) | (1,449,256 | ) | (1,370,910 | ) | ||||||||||
| Income by indexation units | (7,536,466 | ) | (5,085,140 | ) | (3,762,930 | ) | ||||||||||
| Net income before income taxes | 236,413,116 | 153,015,601 | 170,798,359 | |||||||||||||
| Income tax expense | 10.1 | (61,166,891 | ) | (55,564,855 | ) | (51,797,634 | ) | |||||||||
| Net income | 175,246,225 | 97,450,746 | 119,000,725 | |||||||||||||
| Net income attributable to | ||||||||||||||||
| Owners of the controller | 173,721,928 | 96,603,371 | 117,835,790 | |||||||||||||
| Non-controlling interests | 1,524,297 | 847,375 | 1,164,935 | |||||||||||||
| Net income | 175,246,225 | 97,450,746 | 119,000,725 | |||||||||||||
| Earnings per Share, basic and diluted | Ch$ | Ch$ | Ch$ | |||||||||||||
| Earnings per Series A Share | 21.5 | 174.79 | 97.20 | 118.56 | ||||||||||||
| Earnings per Series B Share | 21.5 | 192.27 | 106.92 | 130.42 | ||||||||||||
The accompanying notes 1 to 32 form an integral part of these Consolidated Financial Statements
F-9
EMBOTELLADORA ANDINA S.A. AND SUBSIDIARIES
Consolidated Statements of Comprehensive Income
for the periods between January 1 and December 31, 2019, 2018 and 2017
| 01.01.2019 | 01.01.2018 | 01.01.2017 | ||||||||||
| 12.31.2019 | 12.31.2018 | 12.31.2017 | ||||||||||
| ThCh$ | ThCh$ | ThCh$ | ||||||||||
| Net income | 175,246,225 | 97,450,746 | 119,000,725 | |||||||||
| Other Comprehensive Income: | ||||||||||||
| Components of other comprehensive income that will not be reclassified to net income for the period, before taxes | ||||||||||||
| Actuarial losses from defined benefit plans | (379,007 | ) | (63,463 | ) | (329,477 | ) | ||||||
| Components of other comprehensive income that will be reclassified to net income for the period, before taxes | ||||||||||||
| Gain (losses) from exchange rate translation differences | (41,844,584 | ) | (72,455,525 | ) | (68,831,435 | ) | ||||||
| Gain (losses) from cash flow hedges | (1,865,233 | ) | (13,151,841 | ) | (813,844 | ) | ||||||
| Income tax related to components of other comprehensive income that will not be reclassified to net income for the period | ||||||||||||
| Income tax benefit related to defined benefit plans | 102,332 | 16,184 | 84,017 | |||||||||
| Income tax related to components of other comprehensive income that will be reclassified to net income for the period | ||||||||||||
| Income tax related to exchange rate translation differences | 9,295,546 | 2,476,204 | 232,666 | |||||||||
| Income tax related to cash flow hedges | 683,482 | 2,554,551 | 167,348 | |||||||||
| Other comprehensive income, total | (34,007,464 | ) | (80,623,890 | ) | (69,490,725 | ) | ||||||
| Total comprehensive income | 141,238,761 | 16,826,856 | 49,510,000 | |||||||||
| Total comprehensive income attributable to: | ||||||||||||
| Equity holders of the controller | 139,861,690 | 16,370,635 | 48,725,522 | |||||||||
| Non-controlling interests | 1,377,071 | 456,221 | 784,478 | |||||||||
| Total comprehensive income | 141,238,761 | 16,826,856 | 49,510,000 | |||||||||
The accompanying notes 1 to 32 form an integral part of these Consolidated Financial Statements
F-10

EMBOTELLADORA ANDINA S.A. AND SUBSIDIARIES
Consolidated Statements of Changes in Equity for the periods
between January 1 and December 31, 2019, 2018 and 2017
| Other reserves | ||||||||||||||||||||||||||||||||||||||||
| Issued capital | Reserves
for exchange rate differences | Cash
flow hedge reserve | Actuarial gains or losses in employee benefits | Other reserves | Total
other reserve, net of tax s | Retained earnings | Controlling Equity | Non- Controlling interests | Total Equity | |||||||||||||||||||||||||||||||
| ThCh$ | ThCh$ | ThCh$ | ThCh$ | ThCh$ | ThCh$ | ThCh$ | ThCh$ | ThCh$ | ThCh$ | |||||||||||||||||||||||||||||||
| Opening balance as of 01.01.2019 | 270,737,574 | (306,674,528 | ) | (13,668,932 | ) | (1,954,077 | ) | 433,151,626 | 110,854,089 | 462,221,463 | 843,813,126 | 19,901,617 | 863,714,743 | |||||||||||||||||||||||||||
| Changes in Equity | ||||||||||||||||||||||||||||||||||||||||
| Comprehensive Income | ||||||||||||||||||||||||||||||||||||||||
| Earnings | - | - | - | - | - | 173,721,928 | 173,721,928 | 1,524,297 | 175,246,225 | |||||||||||||||||||||||||||||||
| Other comprehensive income | - | (32,401,812 | ) | (1,181,751 | ) | (276,675 | ) | - | (33,860,238 | ) | - | (33,860,238 | ) | (147,226 | ) | (34,007,464 | ) | |||||||||||||||||||||||
| Comprehensive income | - | (32,401,812 | ) | (1,181,751 | ) | (276,675 | ) | - | (33,860,238 | ) | 173,721,928 | 139,861,690 | 1,377,071 | 141,238,761 | ||||||||||||||||||||||||||
| Dividends | - | - | - | - | - | - | (86,568,579 | ) | (86,568,579 | ) | (1,024,430 | ) | (87,593,009 | ) | ||||||||||||||||||||||||||
| Increase (decrease) from other changes | - | - | - | - | - | - | 51,543,453 | 51,543,453 | - | 51,543,453 | ||||||||||||||||||||||||||||||
| Total changes in equity | - | (32,401,812 | ) | (1,181,751 | ) | (276,675 | ) | - | (33,860,238 | ) | 138,696,802 | 104,836,564 | 352,641 | 105,189,205 | ||||||||||||||||||||||||||
| Ending balance as of 12.31.2019 | 270,737,574 | (339,076,340 | ) | (14,850,683 | ) | (2,230,752 | ) | 433,151,626 | 76,993,851 | 600,918,265 | 948,649,690 | 20,254,258 | 968,903,948 | |||||||||||||||||||||||||||
|
Other reserves | ||||||||||||||||||||||||||||||||||||||||
| Issued capital | Reserves
for exchange rate differences | Cash
flow hedge reserve | Actuarial gains or losses in employee benefits | Other
reserves | Total
other reserves, net of tax | Retained earnings | Controlling Equity | Non- Controlling interests | Total Equity | |||||||||||||||||||||||||||||||
| ThCh$ | ThCh$ | ThCh$ | ThCh$ | ThCh$ | ThCh$ | ThCh$ | ThCh$ | ThCh$ | ThCh$ | |||||||||||||||||||||||||||||||
| Opening balance as of 01.01.2018 | 270,737,574 | (237,077,572 | ) | (3,094,671 | ) | (1,915,587 | ) | 427,137,058 | 185,049,228 | 335,523,254 | 791,310,056 | 21,923,293 | 813,233,349 | |||||||||||||||||||||||||||
| Changes in accounting policies | - | - | - | - | - | - | 79,499,736 | 79,499,736 | - | 79,499,736 | ||||||||||||||||||||||||||||||
| Restated opening balance | 270,737,574 | (237,077,572 | ) | (3,094,671 | ) | (1,915,587 | ) | 427,137,058 | 185,049,228 | 415,022,990 | 870,809,792 | 21,923,293 | 892,733,085 | |||||||||||||||||||||||||||
| Changes in Equity | ||||||||||||||||||||||||||||||||||||||||
| Comprehensive Income | ||||||||||||||||||||||||||||||||||||||||
| Earnings | - | - | - | - | - | - | 96,603,371 | 96,603,371 | 847,375 | 97,450,746 | ||||||||||||||||||||||||||||||
| Other comprehensive income | - | (69,596,956 | ) | (10,597,290 | ) | (38,490 | ) | - | (80,232,736 | ) | - | (80,232,736 | ) | (391,154 | ) | (80,623,890 | ) | |||||||||||||||||||||||
| Comprehensive income, total | - | (69,596,956 | ) | (10,597,290 | ) | (38,490 | ) | - | (80,232,736 | ) | 96,603,371 | 16,370,635 | 456,221 | 16,826,856 | ||||||||||||||||||||||||||
| Dividends | - | - | - | - | - | - | (85,475,291 | ) | (85,475,291 | ) | (2,477,897 | ) | (87,953,188 | ) | ||||||||||||||||||||||||||
| Increase (decrease) from other changes | - | - | 23,029 | - | 6,014,568 | 6,037,597 | 36,070,393 | 42,107,990 | - | 42,107,990 | ||||||||||||||||||||||||||||||
| Total changes in equity | - | (69,596,956 | ) | (10,574,261 | ) | (38,490 | ) | 6,014,568 | (74,195,139 | ) | 47,198,473 | (26,996,666 | ) | (2,021,676 | ) | (29,018,342 | ) | |||||||||||||||||||||||
| Ending balance as of 12.31.2018 | 270,737,574 | (306,674,528 | ) | (13,668,932 | ) | (1,954,077 | ) | 433,151,626 | 110,854,089 | 462,221,463 | 843,813,126 | 19,901,617 | 863,714,743 | |||||||||||||||||||||||||||
The accompanying notes 1 to 32 form an integral part of these Consolidated Financial Statements
F-11
| Other reserves | ||||||||||||||||||||||||||||||||||||||||
| Issued
capital |
Reserves
for exchange rate differences |
Cash
flow hedge reserve |
Actuarial gains or losses in employee benefits |
Other reserves |
Total
other reserves, net of tax |
Retained earnings |
Controlling Equity |
Non- Controlling interests |
Total Equity | |||||||||||||||||||||||||||||||
| ThCh$ | ThCh$ | ThCh$ | ThCh$ | ThCh$ | ThCh$ | ThCh$ | ThCh$ | ThCh$ | ThCh$ | |||||||||||||||||||||||||||||||
| Opening balance as of 01/01/2017 | 270,737,574 | (168,744,355 | ) | (2,448,175 | ) | (1,785,032 | ) | 427,137,058 | 254,159,496 | 295,708,512 | 820,605,582 | 21,564,445 | 842,170,027 | |||||||||||||||||||||||||||
| Changes in Equity | ||||||||||||||||||||||||||||||||||||||||
| Comprehensive Income | ||||||||||||||||||||||||||||||||||||||||
| Earnings | - | - | - | - | - | - | 117,835,790 | 117,835,790 | 1,164,935 | 119,000,725 | ||||||||||||||||||||||||||||||
| Other comprehensive income | - | (68,333,217 | ) | (646,496 | ) | (130,555 | ) | - | (69,110,268 | ) | - | (69,110,268 | ) | (380,457 | ) | (69,490,725 | ) | |||||||||||||||||||||||
| Comprehensive income | - | (68,333,217 | ) | (646,496 | ) | (130,555 | ) | - | (69,110,268 | ) | 117,835,790 | 48,725,522 | 784,478 | 49,510,000 | ||||||||||||||||||||||||||
| Dividends | - | - | - | - | - | - | (78,021,048 | ) | (78,021,048 | ) | (425,630 | ) | (78,446,678 | ) | ||||||||||||||||||||||||||
| Total changes in equity | - | (68,333,217 | ) | (646,496 | ) | (130,555 | ) | - | (69,110,268 | ) | 39,814,742 | (29,295,526 | ) | 358,848 | (28,936,678 | ) | ||||||||||||||||||||||||
| Ending balance as of 12/31/2017 | 270,737,574 | (237,077,572 | ) | (3,094,671 | ) | (1,915,587 | ) | 427,137,058 | 185,049,228 | 335,523,254 | 791,310,056 | 21,923,293 | 813,233,349 | |||||||||||||||||||||||||||
The accompanying notes 1 to 32 form an integral part of these Consolidated Financial Statements
F-12
EMBOTELLADORA ANDINA S.A. AND SUBSIDIARIES
Consolidated Statements of Direct Cash Flows
for the periods between January 1 and December 31, 2019, 2018 and 2017
| 01.01.2019 | 01.01.2018 | 01.01.2017 | ||||||||||||||
| Cash flows provided by (used in) Operating Activities | NOTE | 12.31.2019 | 12.31.2018 | 12.31.2017 | ||||||||||||
| Cash flows provided by Operating Activities | ThCh$ | ThCh$ | ThCh$ | |||||||||||||
| Receipts from the sale of goods and the rendering of services (including taxes) | 2,626,374,510 | 2,296,830,656 | 2,388,420,701 | |||||||||||||
| Payments for Operating Activities | ||||||||||||||||
| Payments to suppliers for goods and services (including taxes) | (1,802,751,639 | ) | (1,526,444,730 | ) | (1,495,009,304 | ) | ||||||||||
| Payments to and on behalf of employees | (203,681,853 | ) | (199,460,816 | ) | (221,146,637 | ) | ||||||||||
| Other payments for operating activities (value-added taxes on purchases, sales and others) | (292,958,045 | ) | (267,827,342 | ) | (333,155,023 | ) | ||||||||||
| Dividends received | 411,041 | 601,022 | 1,540,090 | |||||||||||||
| Interest payments | (36,141,477 | ) | (41,353,013 | ) | (53,103,434 | ) | ||||||||||
| Interest received | 1,539,120 | 3,545,313 | 8,240,023 | |||||||||||||
| Income tax payments | (34,198,767 | ) | (29,904,176 | ) | (40,654,077 | ) | ||||||||||
| Other cash movements (tax on bank debits Argentina and others) | (3,444,416 | ) | (707,552 | ) | (7,171,991 | ) | ||||||||||
| Cash flows provided by (used in) Operating Activities | 255,148,474 | 235,279,362 | 247,960,348 | |||||||||||||
| Cash flows provided by (used in) Investing Activities | ||||||||||||||||
| Contributions made in associates | - | (15,615,466 | ) | (15,570,161 | ) | |||||||||||
| Proceeds from sale of Property, plant and equipment | 18,904 | 260,116 | 99,421 | |||||||||||||
| Purchase of Property, plant and equipment | (110,683,258 | ) | (121,063,273 | ) | (168,857,680 | ) | ||||||||||
| Purchase of intangible assets | (448,307 | ) | - | (11,923,449 | ) | |||||||||||
| Proceeds from other long-term assets (redemption of term deposits over 90 days) | - | 13,883,132 | 81,258,426 | |||||||||||||
| Purchase of other long-term assets (term deposits over 90 days) | - | - | (41,059,494 | ) | ||||||||||||
| Payments on forward, term, option and financial exchange agreements | 1,135,034 | 6,403,152 | 1,374,638 | |||||||||||||
| Other payments on the purchase of financial instruments | (70,373 | ) | (1,953,309 | ) | (14,153,111 | ) | ||||||||||
| Net cash flows used in Investing Activities | (110,048,000 | ) | (118,085,648 | ) | (168,831,410 | ) | ||||||||||
| Cash Flows generated from (used in) Financing Activities | ||||||||||||||||
| Proceeds from short-term loans obtained | 50,297,337 | 29,850,728 | 71,801,741 | |||||||||||||
| Loan payments | (74,332,889 | ) | (44,234,859 | ) | (52,146,995 | ) | ||||||||||
| Lease liability payments | (2,989,457 | ) | (2,395,966 | ) | (4,745,884 | ) | ||||||||||
| Dividend payments by the reporting entity | (86,265,896 | ) | (87,535,698 | ) | (74,968,175 | ) | ||||||||||
| Other inflows (outflows) of cash (Placement and payment of public obligations) | (13,821,732 | ) | (10,319,483 | ) | (18,286,457 | ) | ||||||||||
| Net cash flows (used in) generated by Financing Activities | (127,112,637 | ) | (114,635,278 | ) | (78,345,770 | ) | ||||||||||
| Net increase in cash and cash equivalents before exchange differences | 17,987,837 | 2,558,436 | 783,168 | |||||||||||||
| Effects of exchange differences on cash and cash equivalents | 4,048,168 | 3,574,340 | (5,804,932 | ) | ||||||||||||
| Effects of exchange differences on cash and cash equivalents | (2,006,632 | ) | (4,836,279 | ) | - | |||||||||||
| Net decrease in cash and cash equivalents | 20,029,373 | 1,296,497 | (5,021,764 | ) | ||||||||||||
| Cash and cash equivalents – beginning of period | 4 | 137,538,613 | 136,242,116 | 141,263,880 | ||||||||||||
| Cash and cash equivalents - end of period | 4 | 157,567,986 | 137,538,613 | 136,242,116 | ||||||||||||
The accompanying notes 1 to 32 form an integral part of these Consolidated Financial Statements
F-13
|
EMBOTELLADORA ANDINA S.A. AND SUBSIDIARIES
Notes to the Consolidated Financial Statements
Embotelladora Andina S.A. RUT (Chilean Tax Id. N°) 91.144.000-8 (hereinafter “Andina,” and together with its subsidiaries, the “Company”) is an open stock corporation, whose corporate address and principal offices are located at Miraflores 9153, borough of Renca, Santiago, Chile. The Company is registered under No. 00124 of the Securities Registry and is regulated by Chile’s Financial Market Commission (hereinafter “CMF”) and pursuant to Chile’s Law 18,046 is subject to the supervision of this entity. It is also registered with the U.S. Securities and Exchange Commission (hereinafter “SEC”) and its stock is traded on the New York Stock Exchange since 1994.
The principal activities of Embotelladora Andina S.A. are to manufacture, bottle, commercialize and/or distribute Coca-Cola products and brands registered by The Coca-Cola Company (“TCCC”). The Company has operations and is licensed by The Coca-Cola Company in its territories Chile, Brazil, Argentina and Paraguay. In Chile, the geographic areas in which the Company has distribution franchises are the Metropolitan Region II Region of Antofagasta, III Region of Atacama, IV Region of Coquimbo, the Province of San Antonio, V Region of Valparaiso, the province of Cachapoal, VI Region del Libertador General Bernardo O’Higgins, XI Region de Aysén del General Carlos Ibáñez del Campo; and XII Region of Magallanes and Chilean Antartic.. In Brazil, its territories include the city of Rio de Janeiro and the central and northern parts of the state of Rio de Janeiro, the city of Vitória and the whole state of Espirito Santo and the city of Ribeirão Preto and part of the state of Sao Paulo and Minas Gerais. In Argentina, the territories include Mendoza, Córdoba, San Luis, Entre Ríos, Santa Fe, Rosario, Santa Cruz, Neuquén, El Chubut, Tierra del Fuego, Río Negro, La Pampa and the western zone of the Province of Buenos Aires. In Paraguay, the franchised territory covers the whole country. License agreements for the territories in Chile expire in October 2023. In Argentina they expire in 2022; in Brazil they expire in 2022 and in Paraguay they expire in 2020.
Said licenses are renewable upon the request of the licensee and at the sole discretion of The Coca-Cola Company.
As of the date of these consolidated financial statements, regarding Andina’s principal shareholders, the Controlling Group holds 55.72% of the outstanding shares with voting rights, corresponding to the Series A shares. The Controlling Group is composed of the Chadwick Claro, Garcés Silva, Hurtado Berger, Said Handal and Said Somavía families, who control the Company in equal parts.
F-14
|
2 - BASIS OF PREPARATION OF CONSOLIDATED FINANCIAL STATEMENTS AND APPLICATION OF ACCOUNTING CRITERIA
2.1 Accounting principles and basis of preparation
The Company’s Consolidated Financial Statements for the periods ended December 31, 2019 and 2018, have been prepared in accordance with the International Financial Reporting Standards (hereinafter "IFRS") issued by the International Accounting Standards Board (hereinafter "IASB").
These Consolidated Financial Statements have been prepared following the going concern principle by applying the historical cost method, with the exception, according to IFRS, of those assets and liabilities that are recorded at fair value.
These Consolidated Statements reflect the consolidated financial position of Embotelladora Andina S.A. and its Subsidiaries as of December 31, 2019 and 2018 and the related consolidated statements of income, comprehensive income, changes in equity and cash flows for each of the three years in the period ended December 31, 2019, 2018 and 2017 and the related notes .
The Company’s 2019 local statutory consolidated financial statements in Spanish were approved by the Company’s Board of Directors on February 25, 2020, with subsequent events first being considered through that date. Those local statutory consolidated financial statements consisted of consolidated statement of financial position as of December 31, 2019 and 2018 along with consolidated income statement, consolidated statement of comprehensive income, consolidated statement of changes in equity, and consolidated statement of cash flows (and related disclosures), each for the two years then ended. Those consolidated financial statements were then subsequently approved by the Company’s shareholders during its April 16 , 2020 meeting.
Included in this 2019 consolidated financial statements are consolidated statement of financial position as of December 31, 2019 and 2018, along with consolidated income statement, consolidated statement of comprehensive income, consolidated statement of changes in equity and consolidated statement of cash flows (and the related disclosures) for each of the three years ended December 31, 2019 2018 and 2017. This three-year presentation of operations, changes in equity and of cash flows is required by the rules of the United States Securities and Exchange Commission. The accompanying English language IFRS consolidated financial statements are consistent with the previously issued local statutory consolidated financial statements. This three-year English language IFRS consolidated financial statements were approved for issuances by the Board of Directors during a session held on April 28, 2020, with subsequent events considered through this later date.
These Consolidated Financial Statements have been prepared based on the accounting records maintained by the Parent Company and by the other entities that are part of the Company and are presented in thousands of Chilean pesos (unless expressly stated) as this is the functional and presentation currency of the Company. Foreign operations are included in accordance with the accounting policies established in Notes 2.5.
F-15
|
2.2 Subsidiaries and consolidation
Subsidiary entities are those companies directly or indirectly controlled by Embotelladora Andina. Control is obtained when the Company has power over the investee, when it has exposure or is entitled to variable returns from its involvement in the investee and when it has the ability to use its power to influence the amount of investor returns. They include assets and liabilities, results of operations, and cash flows for the periods reported. Income or losses from subsidiaries acquired or sold are included in the Consolidated Financial Statements from the effective date of acquisition through the effective date of disposal, as applicable.
The acquisition method is used to account for the acquisition of subsidiaries. The consideration transferred for the acquisition of the subsidiary is the fair value of assets transferred, equity securities issued, liabilities incurred or assumed on the date that control is obtained. Identifiable assets acquired, and identifiable liabilities and contingencies assumed in a business combination are accounted for initially at their fair values at the acquisition date. Goodwill is initially measured as the excess of the aggregate of the consideration transferred and the fair value of non-controlling interest over the net identifiable assets acquired and liabilities assumed. If the consideration is less than the fair value of the net assets of the subsidiary acquired, the difference is recognized directly in the income statement.
Intercompany transactions, balances and unrealized gains on transactions between Group entities are eliminated. Unrealized losses are also eliminated. When necessary, the accounting policies of the subsidiaries are modified to ensure uniformity with the policies adopted by the Group.
The interest of non-controlling shareholders is presented in the consolidated statement of changes in equity and the consolidated statement of income by function under "Non-Controlling Interest" and “Earnings attributable to non-controlling interests", respectively.
F-16
| |
The consolidated financial statements include all assets, liabilities, income, expenses, and cash flows of the Company and its subsidiaries after eliminating balances and transaction among the Group’s entities, the subsidiary companies included in the consolidation are the following:
| Ownership interest | ||||||||||||||||||||||||||
| 12.31.2019 | 12.31.2018 | |||||||||||||||||||||||||
| Taxpayer ID | Company Name | Direct | Indirect | Total | Direct | Indirect | Total | |||||||||||||||||||
| 59.144.140-K | Abisa Corp S.A. | - | 99.99 | 99.99 | - | 99.99 | 99.99 | |||||||||||||||||||
| Foreign | Aconcagua Investing Ltda. | 0.71 | 99.28 | 99.99 | 0.71 | 99.28 | 99.99 | |||||||||||||||||||
| 96.842.970-1 | Andina Bottling Investments S.A. | 99.90 | 0.09 | 99.99 | 99.90 | 0.09 | 99.99 | |||||||||||||||||||
| 96.972.760-9 | Andina Bottling Investments Dos S.A. | 99.90 | 0.09 | 99.99 | 99.90 | 0.09 | 99.99 | |||||||||||||||||||
| Foreign | Andina Empaques Argentina S.A. | - | 99.98 | 99.98 | - | 99.98 | 99.98 | |||||||||||||||||||
| 96.836.750-1 | Andina Inversiones Societarias S.A. | 99.98 | 0.01 | 99.99 | 99.98 | 0.01 | 99.99 | |||||||||||||||||||
| 76.070.406-7 | Embotelladora Andina Chile S.A. | 99.99 | - | 99.99 | 99.99 | - | 99.99 | |||||||||||||||||||
| Foreign | Embotelladora del Atlántico S.A. | 0.92 | 99.07 | 99.99 | 0.92 | 99.07 | 99.99 | |||||||||||||||||||
| 96.705.990-0 | Envases Central S.A. | 59.27 | - | 59.27 | 59.27 | - | 59.27 | |||||||||||||||||||
| 96.971.280-6 | Inversiones Los Andes Ltda. (1) | - | - | - | 99.99 | - | 99.99 | |||||||||||||||||||
| Foreign | Paraguay Refrescos S.A. | 0.08 | 97.75 | 97.83 | 0.08 | 97.75 | 97.83 | |||||||||||||||||||
| 76.276.604-3 | Red de Transportes Comerciales Ltda. | 99.90 | 0.09 | 99.99 | 99.90 | 0.09 | 99.99 | |||||||||||||||||||
| Foreign | Rio de Janeiro Refrescos Ltda. | - | 99.99 | 99.99 | - | 99.99 | 99.99 | |||||||||||||||||||
| 78.536.950-5 | Servicios Multivending Ltda. | 99.90 | 0.09 | 99.99 | 99.90 | 0.09 | 99.99 | |||||||||||||||||||
| 78.861.790-9 | Transportes Andina Refrescos Ltda. | 99.90 | 0.09 | 99.99 | 99.90 | 0.09 | 99.99 | |||||||||||||||||||
| 96.928.520-7 | Transportes Polar S.A. | 99.99 | - | 99.99 | 99.99 | - | 99.99 | |||||||||||||||||||
| 76.389.720-6 | Vital Aguas S.A. | 66.50 | - | 66.50 | 66.50 | - | 66.50 | |||||||||||||||||||
| 93.899.000-k | Vital Jugos S.A. | 15.00 | 50.00 | 65.00 | 15.00 | 50.00 | 65.00 | |||||||||||||||||||
(1) Company merged into Andina Bottling Investments SA.
2.3 Investments in associates and joint ventures
Ownership interest held by the Group in joint ventures and associates are recorded following the equity method. According to the equity method, the investment in an associate or joint venture is initially recorded at cost. As of the date of acquisition, the investment in the statement of financial position is recorded by the proportion of its total assets, which represents the Group's participation in its capital, once adjusted, where appropriate, the effect of the transactions made with the Group, plus goodwill that have been generated in the acquisition of the company.
Dividends received from these companies are recorded by reducing the value of the investment and the results obtained by them, which correspond to the Group according to its ownership, are recorded under the item “Participation in profit (loss) of associates accounted for by the equity method.”
F-17
|
2.3.1 Investments in Associates
Associates are all entities over which the Group exercises significant influence but does not have control, significant influence is the power to intervene in the financial and operating policy decisions of the associate, without having control or joint control over it. The results of these associates are accounted for using the equity method. Accounting policies of the associates are changed, where necessary, to ensure conformity with the policies adopted by the Company and unrealized gains are eliminated.
2.4 Financial reporting by operating segment
“IFRS 8 Operating Segments” requires that entities disclose information on the results of operating segments. In general, this is information that Management and the Board of Directors use internally to assess performance of segments and allocate resources to them. Therefore, the following operating segments have been determined based on geographic location:
| · | Operation in Chile |
| · | Operation in Brazil |
| · | Operation in Argentina |
| · | Operation in Paraguay |
2.5 Functional currency and presentation currency
2.5.1 Functional currency
Items included in the financial statements of each of the entities in the Company are measured using the currency of the primary economic environment in which the entity operates (“functional currency”). The functional currency of each of the Operations is the following:
| Company | Functional currency | |
| Embotelladora del Atlántico | Argentine Peso (ARS) | |
| Embotelladora Andina | Chilean Peso (CLP) | |
| Paraguay Refrescos | Paraguayan Guaraní (PYG) | |
| Rio de Janeiro Refrescos | Brazil Real (BRL) |
Foreign currency-denominated monetary assets and liabilities are converted to the functional currency at the spot exchange rate in effect on the closing date.
F-18
|
All differences arising from the liquidation or conversion of monetary items are recorded in the income statement, with the exception of the monetary items designated as part of the hedging of the Group's net investment in a business abroad. These differences are recorded in another overall result until the disposal of the net investment, at which point they are reclassified to the income statement. Tax adjustments attributable to exchange differences in these monetary items are also recognized in another overall outcome.
Non-monetary items that are valued at historical cost in a foreign currency are converted using the exchange rate in effect at the date of the initial transaction. Non-monetary items measured at fair value in a foreign currency are converted using the exchange rate in effect at the date on which fair value is determined. Losses or gains arising from the conversion of non-monetary items measured at fair value are recorded in accordance with the recognition of losses or gains arising from the change in the fair value of the respective item (e.g., exchange differences arising from items whose fair value gains or losses are recognized in another overall result or in results are also recognized in another overall result or in results, respectively).
Functional currency in hyperinflationary economies
Beginning July 2018, Argentina's economy is considered as hyperinflationary, according to the criteria established in the International Accounting Standard No. 29 “Financial information in hyperinflationary economies” (IAS 29). This determination was carried out based on a series of qualitative and quantitative criteria, including an accumulated inflation rate of more than 100% for three years. In accordance with IAS 29, the financial statements of companies in which Embotelladora Andina S.A. participates in Argentina have been retrospectively restated by applying a general price index to the historical cost, in order to reflect the changes in the purchasing power of the Argentine peso, as of the closing date of these financial statements.
Non-monetary assets and liabilities were restated since February 2003, the last date an inflation adjustment was applied for accounting purposes in Argentina. In this context, it should be mentioned that the Group made its transition to IFRS on January 1, 2004, applying the attributed cost exemption for Property, plant and equipment.
For consolidation purposes in Embotelladora Andina S.A. and as a result of the adoption of IAS 29, the results and financial situation of our Argentine subsidiaries were converted to the closing exchange rate (ARS/CLP) as December 31, 2019, in accordance with IAS 21 "Effects of foreign currency exchange rate variations", when dealing with a hyperinflationary economy.
The comparative amounts in the consolidated financial statements are those that were presented as current year amounts in the relevant prior year financial statements (i.e. not adjusted for subsequent changes in the price level or exchange rates). This results in differences between the closing equity of the previous year and the opening equity of the current year and, as an accounting policy choice, these changes are presented as follows: (a) the remeasurement of beginning balances under IAS 29 as an adjustment to equity and (b) the subsequent effects, including retranslation under IAS 21, as “Exchange differences on translation of foreign operations” in other comprehensive income.
Inflation for the periods January to December 2019 and 2018 amounted to 54.85% and 47.6%, respectively. The first-time adoption of IAS 29 in 2018 resulted in a positive adjustment in the accumulated consolidated results of Embotelladora Andina S.A., for CLP 79,499,736 thousand (net of deferred taxes) as of January 1, 2018.
F-19
|
2.5.2 Presentation currency
The presentation currency is the Chilean peso, which is the functional currency of the parent company, for such purposes, the financial statements of subsidiaries are translated from the functional currency to the presentation currency.
The financial statements of these subsidiaries are remeasured as if its functional currency was the reporting currency of the parent company. The financial statements were translated as indicated below.
| a. | Translation of financial statements whose functional currency does not correspond to hyperinflationary economies (Brazil and Paraguay) |
Financial statements measured as indicated are translated to the presentation currency as follows:
| · | The statement of financial position is translated to the closing exchange rate at the financial statement date and the income statement is translated at the average monthly exchange rates, the differences that result are recognized in equity under other comprehensive income. |
| · | Cash flow income statement are also translated at average exchange rates for each transaction. |
| · | In the case of the disposal of an investment abroad, the component of other comprehensive income (OCI) relating to that investment is reclassified to the income statement. |
| b. | Translation of financial statements whose functional currency corresponds to hyperinflationary economies (Argentina) |
Financial statements of economies with a hyperinflationary economic environment, are recognized according to IAS 29 Financial Information in Hyperinflationary Economies, and subsequently converted to Chilean pesos as follows:
| · | The statement of financial position sheet is translated at the closing exchange rate at the financial statements date; |
| · | The income statement is translated at the closing exchange rate at the financial statements date |
| · | The statement of cash flows is converted to the closing exchange rate at the date of the financial statements. |
| · | In the case of the disposal of an investment abroad, the component of other comprehensive income (OCI) relating to that investment is reclassified to the income statement. |
2.5.3 Exchange rates
Exchange rates regarding the Chilean peso in effect at the end of each period are as follows:
| Date | USD | BRL | ARS | PGY | ||||||||||||
| 12.31.2019 | 748.74 | 185.76 | 12.50 | 0.116 | ||||||||||||
| 12.31.2018 | 694.77 | 179.30 | 18.43 | 0.117 | ||||||||||||
| 12.31.2017 | 614.75 | 185.84 | 32.96 | 0.110 | ||||||||||||
F-20
|
2.6 Property, plant, and equipment
The elements of Property, plant and equipment, are valued for their acquisition cost, net of their corresponding accumulated depreciation, and of the impairment losses they have experienced.
The cost of the items of Property, plant and equipment include in addition to the price paid for the acquisition: i) the financial expenses accrued during the construction period that are directly attributable to the acquisition, construction or production of qualified assets, which are those that require a substantial period of time before being ready for use, such as production facilities. The Group defines a substantial period as one that exceeds twelve months. The interest rate used is that corresponding to specific financing or, if it does not exist, the weighted average financing rate of the Company making the investment; and ii) personnel expenses directly related to the construction in progress.
Construction in progress is transferred to operating assets after the end of the trial period when they are available for use, from which moment depreciation begins.
Subsequent costs are included in the asset’s carrying amount or recognized as a separate asset only when it is probable that future economic benefits associated with the items of Property, plant and equipment will flow to the Company and the cost of the item can be measured reliably. The carrying amount of the replaced part is derecognized. Repairs and maintenance are charged to the income statement in the reporting period in which they are incurred.
Land is not depreciated since it has an indefinite useful life. Depreciation on other assets is calculated using the straight-line method to allocate their cost or revalued amounts to their residual values over their estimated useful lives.
The estimated useful lives by asset category are:
| Assets | Range in years | |||
| Buildings | 30-50 | |||
| Plant and equipment | 10-20 | |||
| Warehouse installations and accessories | 10-30 | |||
| Furniture and supplies | 4-5 | |||
| Motor vehicles | 5-7 | |||
| Other Property, plant and equipment | 3-8 | |||
| Bottles and containers | 2-8 |
The residual value and useful lives of Property, plant and equipment are reviewed and adjusted at the end of each fiscal year, if appropriate.
When the value of an asset is greater than its estimated recoverable amount, the value is written down immediately to its recoverable amount.
Gains and losses on disposals of property, plant, and equipment are calculated by comparing the proceeds to the carrying amount and are charged to other expenses by function or other gains, as appropriate in the statement of comprehensive income.
If there are items available for sale and comply with the conditions of IFRS 5 "Non-current assets held for sale and discontinued operations" are separated from Property, plant and equipment and are presented within current assets at the lower value between the book value and its fair value less selling costs.
F-21
|
2.7 Intangible assets and Goodwill
2.7.1 Goodwill
Goodwill represents the excess of the consideration transferred over the Company’s interest in the net fair value of the net identifiable assets of the subsidiary and the fair value of the non-controlling interest in the subsidiary on the acquisition date. Since goodwill is an intangible asset with indefinite useful life, it is recognized separately and tested annually for impairment. Goodwill is carried at cost less accumulated impairment losses.
Gains and losses on the sale of an entity include the carrying amount of goodwill related to that entity.
Goodwill is assigned to each cash generating unit (CGU) or group of cash-generating units, from where it is expected to benefit from the synergies arising from the business combination. Such CGUs or groups of CGUs represent the lowest level in the organization at which goodwill is monitored for internal management purposes.
2.7.2 Distribution rights
Distribution rights are contractual rights to produce and/or distribute products under the Coca-Cola brand and other brands in certain territories in Argentina, Brazil, Chile and Paraguay that were acquired during Business Combination. Distribution rights are born from the process of valuation at fair value of the assets and liabilities of companies acquired in business combinations. Distribution rights have an indefinite useful life and are not amortized, (as they are permanently renewed by The Coca-Cola Company) and therefore are subject to impairment tests on an annual basis.
2.7.3 Software
Carrying amounts correspond to internal and external software development costs, which are capitalized once the recognition criteria in IAS 38, Intangible Assets, have been met. Their accounting recognition is initially realized for their acquisition or production cost and, subsequently, they are valued at their net cost of their corresponding accumulated amortization and of the impairment losses that, if applicable, they have experienced. The aforementioned software is amortized within four years.
2.8 Impairment of non-financial assets
Assets that have an indefinite useful life, such as intangibles related to distribution rights and goodwill, are not amortized and are tested annually for impairment or more frequently if events or changes in circumstances indicate a potential impairment. Assets that are subject to amortization are tested for impairment whenever there is an event or change in circumstances indicating that the carrying amount may not be recoverable. An impairment loss is recognized for the amount by which the carrying value of the asset exceeds its recoverable amount. The recoverable amount is the greater of an asset’s fair value less costs to sell or its value in use.
For the purposes of assessing impairment, assets are grouped at the lowest levels for which there are separately identifiable cash flows (cash generating units - CGU).
Regardless of what was stated in the previous paragraph, in the case of CGUs to which goodwill or intangible assets have been assigned with an indefinite useful life, the analysis of their recoverability is carried out systematically at the end of each fiscal year. These indications may include new legal provisions, change in the economic environment that affects business performance indicators, competition movements, or the disposal of an important part of a CGU.
F-22
|
Management reviews business performance based on geographic segments. Goodwill is monitored at the operating segment level that includes the different cash generating units in operations in Chile, Brazil, Argentina and Paraguay. The impairment of distribution rights is monitored geographically in the CGU or group of cash generating units, which correspond to specific territories for which Coca-Cola distribution rights have been acquired. These cash generating units or groups of cash generating units are composed of the following segments:
| - | Operation in Chile (excluding the Metropolitan Region, Rancagua Province and San Antonio Province); |
| - | Operation in Argentina (North and South region); |
| - | Operation in Brazil (State of Rio de Janeiro and Espirito Santo, Ipiranga territories, investment in the Sorocaba associate and investment in the Leão Alimentos S.A. associate); |
| - | Operation in Paraguay |
To check if goodwill has suffered a loss due to impairment of value, the Company compares the book value thereof with its recoverable value, and recognizes an impairment loss, for the excess of the asset's carrying amount over its recoverable amount. To determine the recoverable values of the CGU, management considers the discounted cash flow method as the most appropriate.
The main assumptions used in the annual test are:
| a) | Discount rate |
The discount rate applied in the annual test carried out in December 2019 was estimated using the CAPM (Capital Asset Pricing Model) methodology, which allows estimating a discount rate according to the level of risk of the CGU in the country where it operates. A nominal discount rate before tax is used according to the following table:
| Discount rates 2019 | Discount rates 2018 | |||||||
| Argentina | 35.3 | % | 21.2 | % | ||||
| Chile | 8.5 | % | 8.1 | % | ||||
| Brazil | 11.4 | % | 10.9 | % | ||||
| Paraguay | 11.5 | % | 10.1 | % | ||||
Management carries out the process of annual goodwill impairment assessments as of December 31 of each year for each CGU.
| b) | Other assumptions |
The financial projections to determine the net present value of the future cash flows of the CGUs are modeled based on the main historical variables and the respective budgets approved by the CGU. In this regard, a conservative growth rate is used, which reaches 3% for the carbonated beverage category and up to 7% for less developed categories such as juices and waters. Beyond the fifth year of projection, growth perpetuity rates are established per operation ranging from 1% to 2.5% depending on the degree of maturity of the consumption of the products in each operation. In this sense, the variables with greatest sensitivity in these projections are the discount rates applied in the determination of the net present value of projected cash flows, growth perpetuities and EBITDA margins considered in each CGU.
In order to sensitize the changes in key assumptions, variations were applied to the key asssumptions used in the model. Ranges used for each of the modified variables are:
| - | Discount Rate: Increase / Decrease of up to 100 bps as a value in the rate at which future cash flows are discounted to bring them to present value |
| - | Perpetuity: Increase / Decrease of up to 75 bps in the rate to calculate the perpetual growth of future cash flows |
| - | EBITDA margin: Increase / Decrease of 100bps of EBITDA margin of operations, which is applied per year for the projected periods, that is, for the years 2020-2024 |
F-23
The Company conducts impairment analyses on an annual basis, as a result of tests conducted as of December 31, 2019 and 2018, no signs of impairments in any of the CGUs were identified, assuming conservative EBITDA margin projections in line with market history.
Despite the deterioration in macroeconomic conditions experienced by the economies of the countries where cash-generating units operate, the impairment test resulted in recovery values higher than the book values including sensitivity calculations to which it was submitted.
2.9 Financial instruments
A financial instrument is any contract that results in the recognition of a financial asset in one entity and a financial liability or equity instrument in another entity.
2.9.1 Financial assets
Pursuant to IFRS 9 “Financial Instruments”, except for certain trade accounts receivable, the Group initially measures a financial asset at its fair value plus transaction costs, in the case of a financial asset that is not at fair value, reflecting changes in P&L.
According to IFRS 9, financial assets are subsequently measured at (i) fair value with changes in P&L (FVPL), (ii) amortized cost or (iii) fair value through other comprehensive income (FVOCI). The classification is based on two criteria: (a) the Group's business model for the purpose of managing financial assets to obtain contractual cash flows; and (b) if the contractual cash flows of financial instruments represent "solely payments of principal and interest” on the outstanding principal amount (the “SPPI criterion”).
The subsequent classification and measurement of the Group's financial assets are as follows:
| - | Financial asset at amortized cost for financial instruments that are maintained within a business model with the objective of maintaining the financial assets to collect contractual cash flows that meet the SPPI criterion. This category includes the Group’s trade and other accounts receivable. |
| - | Financial assets measured at fair value with changes in other comprehensive income (FVOCI), with gains or losses recognized in P&L at the time of liquidation. Financial assets in this category correspond to the Group's instruments that meet the SPPI criterion and are kept within a business model both to collect cash flows and to sell. |
Other financial assets are classified and subsequently measures as follows:
| - | Equity instruments at fair value with changes in other comprehensive income (FVOCI) without recognizing earnings or losses in P&L at the time of liquidation. This category only includes equity instruments that the Group intends to keep in the foreseeable future and that the Group has irrevocably chosen to classify in this category in the initial recognition or transition. |
| - | Financial assets at fair value with changes in P&L (FVPL) include derivative instruments and equity instruments quoted that the Group had not irrevocably chosen to classify at FVOCI in the initial recognition or transition. This category also includes debt instruments whose cash flow characteristics do not comply with the SPPI criterion or are not kept within a business model whose objective is to recognize contractual cash flows or sale. |
F-24
A financial asset (or, where applicable, a portion of a financial asset or a portion of a group of similar financial assets) is initially disposed (for example, canceled in the Group's consolidated financial statements) when:
| - | The rights to receive cash flows from the asset have expired, |
| - | The Group has transferred the rights to receive the cash flows of the asset or has assumed the obligation to pay all cash flows received without delay to a third party under a transfer agreement; and the Group (a) has substantially transferred all risks and benefits of the asset, or (b) has not substantially transferred or retained all risks and benefits of the asset, but has transferred control of the asset. |
2.9.2 Financial Liabilities
Financial liabilities are classified as a fair value financial liability at the date of their initial recognition, as appropriate, with changes in results, loans and credits, accounts payable or derivatives designated as hedging instruments in an effective coverage.
All financial liabilities are initially recognized at fair value and transaction costs directly attributable are netted from loans and credits and accounts payable.
The Group's financial liabilities include trade and other accounts payable, loans and credits, including those discovered in current accounts, and derivative financial instruments.
The classification and subsequent measurement of the Group's financial liabilities are as follows:
| - | Fair value financial liabilities with changes in results include financial liabilities held for trading and financial liabilities designated in their initial recognition at fair value with changes in results. The losses or gains of liabilities held for trading are recognized in the income statement. |
| - | Loans and credits are valued at cost or amortized using the effective interest rate method. Gains and losses are recognized in the income statement when liabilities are disposed, as well as interest accrued in accordance with the effective interest rate method. |
A financial liability is disposed of when the obligation is extinguished, cancelled or expires. Where an existing financial liability is replaced by another of the same lender under substantially different conditions, or where the conditions of an existing liability are substantially modified, such exchange or modification is treated as a disposal of the original liability and the recognition of the new obligation. The difference in the values in the respective books is recognized in the statement of income.
2.9.3 Offsetting financial instruments
Financial assets and financial liabilities are offset with the corresponding net amount presenting the corresponding net amount in the statement of financial position, if:
| - | There is currently a legally enforceable right to offset the amounts recognized, and |
| - | It is intended to liquidate them for the net amount or to realize the assets and liquidate the liabilities simultaneously. |
2.10 Derivatives financial instruments and hedging activities
The Company and its subsidiaries use derivative financial instruments to mitigate risks relating to changes in foreign currency and exchange rates associated with raw materials, and loan obligations. Derivatives are initially recognized at fair value on the date a derivative contract is entered into and are subsequently re-measured at their fair value at each closing date. Derivatives are accounted as financial assets when the fair value is positive and as financial liabilities when the fair value is negative. The method of recognizing the resulting gain or loss depends on whether the derivative is designated as a hedging instrument, and if so, the nature of the item being hedged.
F-25
2.10.1 Derivative financial instruments designated as cash flow hedges
At the inception of the transaction, the group documents the relationship between hedging instruments and hedged items, as well as its risk management objectives and strategy for undertaking various hedging transactions. The group also documents its assessment, both at hedge inception and on an ongoing basis, of whether the derivatives that are used in hedging transactions are highly effective in offsetting changes in cash flows of hedged items.
The effective portion of changes in the fair value of derivatives that are designated and qualify as cash flow hedges is recognized in other comprehensive income. The gain or loss relating to the ineffective portion is recognized immediately in the consolidated income statement within "other gains (losses)” Amounts accumulated in equity are reclassified to profit or loss in the periods when the hedged item affects profit or loss (for example, when foreign currency denominated financial liabilities are translated into their functional currencies). The gain or loss relating to the effective portion of cross currency swaps hedging the effects of changes in foreign exchange rates are recognized in the consolidated income statement within "foreign exchange differences.” When a hedging instrument expires or is sold, or when a hedge no longer meets the criteria for hedge accounting, any cumulative gain or loss existing in equity at that time remains in equity and is recognized when the forecast transaction is ultimately recognized in the consolidated income statement.
2.10.2 Derivative financial instruments not designated for hedging
The fair value of derivative financial instruments that do not qualify for hedge accounting pursuant to IFRS are immediately recognized in the consolidated income statement under "Other income and losses". The fair value of these derivatives is recorded under "other current financial assets" or "other current financial liabilities" in the statement of financial position.”
The Company does not use hedge accounting for its foreign investments.
The Company also evaluates the existence of derivatives implicitly in contracts and financial instruments as stipulated by IFRS 9 and classifies them pursuant to their contractual terms and the business model of the group. As of December 31, 2019, the Company had no implicit derivatives.
2.10.3 Fair value hierarchy
Fair value is the price that would be received to sell an asset or paid to transfer a liability in an orderly transaction between market participants on the date of the transaction. Fair value is based on the presumption that the transaction to sell the asset or to transfer the liability takes place;
| - | In the asset or liability main market, or |
| - | In the absence of a main market, in the most advantageous market for the transaction of those assets or liabilities. |
The Company maintains assets related to foreign currency derivative contracts which were classified as Other current and non-current financial assets and Other current and non-current financial liabilities, respectively, and are accounted at fair value within the statement of financial position. The Company uses the following hierarchy to determine and disclose the fair value of financial instruments with assessment techniques:
Level 1: Quote values (unadjusted) in active markets for identical assets or liabilities
Level 2: Valuation techniques for which the lowest level variable used, which is significant for the calculation, is directly or indirectly observable
Level 3: Valuation techniques for which the lowest level variable used, which is significant for the calculation, is not observable.
F-26
During the reporting periods there were no transfers of items between fair value measurement categories. All of which were valued during the period using Level 2.
| 2.11 | Inventories |
Inventories are stated at the lower of cost and net realizable value. Cost is determined using the weighted average cost method. The cost of finished goods and work in progress includes raw materials, direct labor, other direct costs and manufacturing overhead (based on operating capacity) to bring the goods to marketable condition, but it excludes interest expense. Net realizable value is the estimated selling price in the ordinary course of business, less applicable variable selling expenses. Spare parts and production materials are stated at the lower of cost or net realizable value.
The initial cost of inventories includes the transfer of losses and gains from cash flow hedges, recognized under other comprehensive income, related to the purchase of raw materials.
Estimates are also made for obsolescence of raw materials and finished products based on turnover and age of the related goods.
| 2.12 | Trade receivables |
Trade accounts receivables and other accounts receivable are measured and recognized at the transaction price at the time they are generated pursuant to IFRS 15, since they do not have a significant financial component, less provision for expected credit losses.
The Group recognizes an allowance for expected credit losses. The Group applies a simplified approach in calculating expected credit losses. Therefore, the Group does not track changes in credit risk, but instead recognizes a loss allowance based on lifetime ECLs at each reporting date. The Group has established a provision matrix that is based on its historical credit loss experience, adjusted for forward-looking factors specific to the debtors and the economic environment.
The carrying amount of the asset is reduced by the provision of expected credit losses, and the loss is recognized in administrative expenses in the consolidated income statement by function.
| 2.13 | Cash and cash equivalents |
Cash and cash equivalents include cash on hand, bank balances, time deposits and other short-term highly liquid and low risk of change in value investments and mutual funds with original short-term maturities equal to or less than three months from the date of acquisition.
| 2.14 | Other financial liabilities |
Resources obtained from financial institutions as well as the issuance of debt securities are initially recognized at fair value, net of costs incurred during the transaction. Then, liabilities are valued by accruing interests in order to equal the current value with the future value of liabilities payable, using the effective interest rate method.
General and specific borrowing costs directly attributable to the acquisition, construction or production of qualified assets, considered as those that require a substantial period of time in order to get ready for their forecasted use or sale, are added to the cost of those assets until the period in which the assets are substantially ready to be used or sold.
F-27
| 2.15 | Income tax |
The Company and its subsidiaries in Chile account for income tax according to the net taxable income calculated based on the rules in the Income Tax Law. Subsidiaries in other countries account for income taxes according to the tax regulations of the country in which they operate.
Deferred income taxes are calculated using the liability method on temporary differences arising between the tax bases of assets and liabilities and their carrying amounts in the Consolidated Financial Statements, using the tax rates that have been enacted or substantively enacted on the balance sheet date and are expected to apply when the deferred income tax asset is realized, or the deferred income tax liability is settled.
Deferred income tax assets are recognized only to the extent that it is probable that future taxable profits will be available against which the temporary differences can be utilized.
The Company does not recognize deferred income taxes for temporary differences from investments in subsidiaries in which the Company can control the timing of the reversal of the temporary differences and it is probable that they will not be reversed in the near future.
| 2.16 | Employee benefits |
The Company records a liability regarding indemnities for years of service that will be paid to employees in accordance with individual and collective agreements subscribed with employees, which is recorded at actuarial value in accordance with IAS 19 “Employee Benefits”.
Results from updated of actuarial variables are recorded within other comprehensive income in accordance with IAS 19.
Additionally, the Company has retention plans for some officers, which have a provision pursuant to the guidelines of each plan. These plans grant the right to certain officers to receive a cash payment on a certain date once they have fulfilled with the required years of service.
The Company and its subsidiaries have recorded a provision to account for the cost of vacations and other employee benefits on an accrual basis. These liabilities are recorded under current non-financial liabilities.
| 2.17 | Provisions |
Provisions for litigation and other contingencies are recognized when the Company has a present legal or constructive obligation as a result of past event, it is probable that an outflow of resources will be required to settle the obligation, and the amount can be reliably estimated.
Provisions are measured at the present value of the expenditures expected to be required to settle the obligation using a pre-tax rate that reflects current market assessments of the time value of money and the risks specific to the obligation.
2.18 Leases
In accordance with IFRS 16 “Leases” Embotelladora Andina analyzes, at the beginning of the contract, the economic background of the agreement, to determine if the contract is, or contains, a lease, evaluating whether the agreement transfers the right to control the use of an identified asset for a period of time in exchange for a consideration. Control is considered to exist if the client has i) the right to obtain substantially all the economic benefits from the use of an identified asset; and ii) the right to direct the use of the asset.
F-28
The Company when operating as a lessee, at the beginning of the lease (on the date the underlying asset is available for use) records an asset for the right-of-use in the statement of financial position (under Property, plant and equipment) and a lease liability (under Other financial liabilities). This asset is initially recognized at cost, which includes: i) value of the initial measurement of the lease liability; ii) lease payments made up to the start date less lease incentives received; iii) the initial direct costs incurred; and iv) the estimation of costs for dismantling or restoration. Subsequently, the right-of-use asset is measured at cost, adjusted by any new measurement of the lease liability, less accumulated depreciation and accumulated losses due to impairment of value. The right-of-use asset is depreciated in the same terms as the rest of similar depreciable assets, if there is reasonable certainty that the lessee will acquire ownership of the asset at the end of the lease. If such certainty does not exist, the asset depreciates at the shortest period between the useful life of the asset or the lease term.
On the other hand, the lease liability is initially measured at the present value of the lease payments, discounted at the incremental loan rate of the Company, if the interest rate implicit in the lease could not be easily determined. Lease payments included in the measurement of the liability include: i) fixed payments, less any lease incentive receivable; ii) variable lease payments; iii) residual value guarantees; iv) exercise price of a purchase option; and v) penalties for lease termination.
The lease liability is increased to reflect the accumulation of interest and is reduced by the lease payments made. In addition, the carrying amount of the liability is measured again if there is a modification in the terms of the lease (changes in the term, in the amount of payments or in the evaluation of an option to buy or change in the amounts to be paid). Interest expense is recognized as an expense and is distributed among the periods that constitute the lease period, so that a constant interest rate is obtained in each year on the outstanding balance of the lease liability.
Short-term leases, equal to or less than one year, or lease of low-value assets are excepted from the application of the recognition criteria described above, recording the payments associated with the lease as an expense in a linear manner throughout the lease term. The Company does not act as lessor.
2.19 Deposits for returnable containers
This liability comprises cash collateral, or deposit, received from customers for bottles and other returnable containers made available to them.
This liability pertains to the deposit amount that is reimbursed when the customer or distributor returns the bottles and containers in good condition, together with the original invoice. The liability is estimated based on the number of bottles given to clients and distributors, the estimated number of bottles in circulation, and a historical average weighted value per bottle or containers. Deposits for returnable containers are presented as a current liability in other financial liabilities because the Company does not have legal rights to defer settlement for a period in excess of one year. However, the Company does not anticipate any material cash settlements for such amounts during the upcoming year.
2.20 Revenue recognition
The Company recognizes revenue when control over a good or service is transferred to the client. Control refers to the ability of the client to direct the use and obtain substantially all the benefits of the goods and services exchanged. Revenue is measured based on the consideration to which it is expected to be entitled for such transfer of control, excluding amounts collected on behalf of third parties.
F-29
Management has defined the following indicators for revenue recognition, applying the five-step model established by IFRS 15 “Revenue from contracts with customers”: 1) Identification of the contract with the customer; 2) Identification of performance obligations; 3) Determination of the transaction price; 4) Assignment of the transaction price; and 5) Recognition of revenue.
All the above conditions are met at the time the products are delivered to the customer. Net sales reflect the units delivered at list price, net of promotions, discounts and taxes.
The revenue recognition criteria of the good provided by Embotelladora Andina corresponds to a single performance obligation that transfers the product to be received to the customer.
2.21 Contributions of The Coca-Cola Company
The Company receives certain discretionary contributions from The Coca-Cola Company (TCCC) mainly related to the financing of advertising and promotional programs for its products in the territories where the Company has distribution licenses. The contribution received from TCCC are recognized in net income after the conditions agreed with TCCC in order to become a creditor to such incentive have been fulfilled, they are recorded as a reduction in the marketing expenses included in the Administration Expenses account. Given its discretionary nature, the portion of contributions received in one period does not imply it will be repeated in the following period.
| 2.22 | Dividend payments |
Dividend distribution to Company shareholders is recorded as a liability in the Company’s Consolidated Financial Statements, considering the 30% minimum dividend of the period’s earnings established by Chilean Corporate Law, unless otherwise agreed in the respective meeting, by the unanimity of the issued shares.
Interim and final dividends are recorded at the time of their approval by the competent body, which in the first case is normally the Board of Directors of the Company, while in the second case it is the responsibility of General Shareholders’ Meeting.
| 2.23 | Critical accounting estimates and judgments |
The Company makes estimates and judgments concerning the future. Actual results may differ from previously estimated amounts.
In preparing the consolidated financial statements, the Company has used certain judgments and estimates made to quantify some of the assets, liabilities, income, expenses and commitments.
Following is a summary of the estimates and judgments that might have a material impact on future financial statements.
2.23.1 Impairment of goodwill and intangible assets with indefinite useful lives
The Company tests annually whether goodwill and intangible assets with indefinite useful life (such as distribution rights) have suffered any impairment. The recoverable amounts of cash generating units are generating units are determined based on value in use calculations. The key variables used in the calculations include sales volumes and prices, discount rates, marketing expenses and other economic factors including inflation. The estimation of these variables requires a use of estimates and judgments as they are subject to inherent uncertainties; however, the assumptions are consistent with the Company’s internal planning end past results. Therefore, management evaluates, and updates estimates according to the conditions affecting the variables. If these assets are considered to have been impaired, they will be written off at their estimated fair value or future recovery value according to the discounted cash flows analysis. As of December 31, 2019, discounted cash flows in the Company's cash generating units in Chile, Brazil, Argentina and Paraguay generated a higher value than the carrying values of the respective net assets, including goodwill of the Brazilian, Argentinian and Paraguayan subsidiaries.
F-30
2.23.2 Fair Value of Assets and Liabilities
IFRS requires in certain cases that assets and liabilities be recorded at their fair value. Fair value is the price that would be received for selling an asset or paid to transfer a liability in a transaction ordered between market participants at the date of measurement.
The basis for measuring assets and liabilities at fair value are their current prices in an active market. For those that are not traded in an active market, the Company determines fair value based on the best information available by using valuation techniques.
In the case of the valuation of intangibles recognized as a result of acquisitions from business combinations, the Company estimates the fair value based on the "multi-period excess earning method", which involves the estimation of future cash flows generated by the intangible assets, adjusted by cash flows that do not come from these, but from other assets. The Company also applies estimations over the period during which the intangible assets will generate cash flows, cash flows from other assets, and a discount rate.
Other assets acquired, and liabilities assumed in a business combination are carried at fair value using valuation methods that are considered appropriate under the circumstances. Assumptions include the depreciated cost of recovery and recent transaction values for comparable assets, among others. These valuation techniques require certain inputs to be estimated, including the estimation of future cash flows.
2.23.3 Allowances for expected credit losses
The Group uses a provision matrix to calculate expected credit losses for trade receivables. Provisions are based on due days for various groups of customer segments that have similar loss patterns (i.e. by geography region, product type, customer type and rating, and credit letter coverage and other forms of credit insurance).
The provision matrix is initially based on the historically observed non-compliance rates for the Group. The Group will calibrate the matrix to adjust the historical credit loss experience with forward-looking information. For example, if expected economic conditions (i.e. gross domestic product) are expected to deteriorate over the next year, which can lead to more non-compliances in the industry, historical default rates are adjusted. At each closing date, the observed historical default rates are updated and changes in prospective estimates are analyzed. The assessment of the correlation between observed historical default rates, expected economic conditions and expected credit losses are significant estimates.
2.23.4 Useful life, residual value and impairment of property, plant, and equipment
Property, plant, and equipment are recorded at cost and depreciated using the straight-line method over the estimated useful life of those assets. Changes in circumstances, such as technological advances, changes to the Company’s business model, or changes in its capital strategy might modify the effective useful lives as compared to our estimates. Whenever the Company determines that the useful life of Property, plant and equipment might be shortened, it depreciates the excess between the net book value and the estimated recoverable amount according to the revised remaining useful life. Factors such as changes in the planned usage of manufacturing equipment, dispensers, transportation equipment and computer software could make the useful lives of assets shorter. The Company reviews its long-lived assets for impairment whenever events or changes in circumstances indicate that the carrying value of any of those assets may not be recovered. The estimate of future cash flows is based, among other factors, on certain assumptions about the expected operating profits in the future. The Company’s estimation of discounted cash flows may differ from actual cash flows because of, among other reasons, technological changes, economic conditions, changes in the business model, or changes in operating profit. If the sum of the projected discounted cash flows (excluding interest) is less than the carrying amount of the asset, the asset shall be written-off to its estimated recoverable value.
F-31
2.23.5 Liabilities for deposits of returnable container
The Company records a liability for deposits received in exchange for bottles and containers provided to its customers and distributors. This liability represents the amount of deposits that must be reimbursed if the customer or distributor returns the bottles and containers in good condition, together with the original invoice. This liability is estimated based on the number of bottles given on loan to customers and distributors, estimates of bottles in circulation and the weighted average historical cost per bottle or container. Management uses professional judgment in order to estimate this liability, including the number of bottles in circulation, the amount of deposit that must be reimbursed and the timing of disbursements.
2.24.1 New Standards, Interpretations and Amendments for annual periods beginning on or after January 1, 2019.
Standards and interpretations, as well as the improvements and amendments to IFRS, which have been issued, effective at the date of these financial statements, are detailed below. The Company has applied these rules concluding that they will not significantly affect the financial statements.
| Standards, Interpretations, Amendments | Mandatory application date | |||||
| IFRS 16 | Leases | January 1, 2019 | ||||
| IFRIC 23 | Uncertainty over Income Tax Treatments | January 1, 2019 |
IFRS 16 “Leases”
IFRS 16 replaces IAS17 “Leases”, IFRIC 4 “Determining Whether an Arrangement Contains a Lease”, SIC-15 “Operating Leases Incentives” and SIC-27 “Evaluating the Substance of Transactions in the Legal Form of a Lease.” The standard establishes the principles for the recognition, measurement, presentation and disclosure of leases and requires that lessees consider most leases in a single balance sheet model.
The lessor's accounting under IFRS 16 remains substantially unchanged from IAS 17. Lessors will continue to classify leases as operating or financial leases using principles similar to those in IAS 17.
The Group adopted IFRS 16 using the amended retrospective adoption method, with an initial application date of January 1, 2019. The Group chose to use the transition practice to not re-evaluate whether a contract is, or contains, a lease as of January 1, 2019. Instead, the Group applied the rule only to contracts that were previously identified as leases applying IAS 17 and IFRIC 4 on the date of initial application. The Group also chose to use the recognition exemptions for leases that, on the start date, have a lease term of 12 months or less and do not contain a purchase option (short-term leases), and leases for which the underlying asset is of low value (low-value assets).
The effects of adopting IFRS 16 are as follows:
| Consolidated Statement of Financial Position | 12.31.2018 | IFRS 16 Adjustments |
01.01.2019 | |||||||||||||
| Assets | ||||||||||||||||
| Property, Plant & Equipment (several) | 17,805,700 | (17,805,700 | ) | (i) | ||||||||||||
| Right of use | - | 37,380,774 | 37,380,774 | (i) | ||||||||||||
| Liabilities | (ii) | |||||||||||||||
| Lease liabilities short-term | 1,534,467 | 4,410,510 | 5,944,977 | |||||||||||||
| Lease liabilities long-term | 13,797,468 | 12,309,239 | 26,106,707 | |||||||||||||
F-32
| i. | Right-of-use assets consisting of CLP 17,805,700 from transfers of other Property, Plant and Equipment assets and CLP 19,575,074 for assets arising from operating leases. | |
| ii. | Lease Liabilities increase |
Following the adoption of IFRS 16, the Group applied a single recognition and measurement approach for all leases for which it is the tenant, except for short-term leases and low-value asset leases. The Group recognized lease liabilities for lease payments and right-of-use assets that represent the right to use the underlying assets. In accordance with the amended retrospective adoption method, the Group recognized assets and liabilities for the total future payments committed in the contracts.
IFRIC 23 “Uncertainty over Income Tax Treatments”
The Interpretation addresses the accounting of income taxes when tax treatments imply uncertainty that affects the application of IAS 12 “Income taxes”. It does not apply to taxes or encumbrances that are outside the scope of IAS 12, nor does it specifically include requirements related to interests and penalties associated with uncertain tax treatments. The Interpretation specifically addresses the following:
| • | If an entity considers the treatment of uncertain tax positions separately | |
| • | The assumptions that an entity makes about the assessment of tax treatments by tax authorities | |
| • | How an entity determines fiscal gain (tax loss), tax bases, unused tax losses, unused tax credits and tax rates. | |
| • | How an entity considers changes in facts and circumstances. |
This interpretation began its effective application as of January 1, 2019. The application of IFRIC 23 has not generated impacts on the consolidated financial statements of Embotelladora Andina and its subsidiaries.
Amendments to IFRS that have been issued effective as of the date of these financial statements, are detailed below.
| Amendments | Application date | |||
| IFRS 3 | Business combinations - interests previously held in a joint operation | January 1, 2019 | ||
| IFRS 9 | Financial instruments - payments with negative compensation | January 1, 2019 | ||
| IFRS 11 | Joint agreements - interests previously held in a joint operation | January 1, 2019 | ||
| IAS 12 | Income taxes - tax consequences of payments related to financial instruments classified as equity | January 1, 2019 | ||
| IAS 23 | Loan costs - eligible loan costs to be capitalized | January 1, 2019 | ||
| IAS 28 | Investments in associates - long-term investments in associates or joint ventures | January 1, 2019 | ||
| IAS 19 | Employee benefits - amendment, reduction or liquidation of the plan | January 1, 2019 |
Company Management evaluates the impact of the amendments listed above, once such transactions are carried out.
F-33
2.24.2 New Accounting Standards, Interpretations and Amendments with effective application for annual periods beginning on or after January 1, 2020.
Standards and interpretations, as well as IFRS amendments, which have been issued, but have still not become effective as of the date of these financial statements are set forth below. The Company has not made an early adoption of these standards.
| Standards and Interpretations | Mandatory application date | |||
| Conceptual Framework | Revised Conceptual Framework | January 1, 2020 | ||
| IFRS 17 | Insurance Contracts | January 1, 2021 |
Revised Conceptual Framework
The IASB issued a Revised Conceptual Framework in March 2018, incorporating some new concepts, providing updated definitions and recognition criterion for assets and liabilities and clarifying some important concepts. Changes in the Conceptual Framework may affect the application of IFRS when no standard applies to a given transaction or event. The Revised Conceptual Framework becomes effective for periods ending on or after January 1, 2020.
IFRS 17 Insurance Contracts
In May 2017, the IASB issued IFRS 17 Insurance Contracts, a new comprehensive accounting standard for insurance contracts that covers recognition, measurement, presentation and disclosure. The new rule applies to all types of insurance contracts, regardless of the type of entity that issues them, being effective for periods beginning on or after January 1, 2021, with required comparative figures, early application is allowed, provided that the entity also applies IFRS 9 and IFRS 15.
Amendments to IFRS which have been issued and will become in effect on January 1, 2020 are detailed below:
| Amendments | Implementation date | |||
| IFRS 3 | Definition of a business | January 1,2020 | ||
| IAS 1 and IAS 8 | Definition of material | January 1,2020 | ||
| IFRS 9, IAS 39 and IFRS 7 | Reference Interest Rate Reform | January 1,2020 | ||
| IFRS 10 and IAS 28 | Consolidated Financial Statements - sale or contribution of assets between an investor and its associate or joint venture | To be determined |
IFRS 3 Business Combinations - Definition of Business
The IASB issued amendments to the definition of business in IFRS 3 Business Combinations, to help entities determine whether an acquired set of activities and assets is a business or not. The IASB clarifies the minimum requirements for defining a business, eliminates the assessment of whether market participants are able to replace any missing elements, includes guidance to help entities assess whether a process acquired is substantial, reduces the definitions of a business and products and introduces an optional fair value concentration test.
Amendments have to be applied to business combinations or asset acquisitions that occur on or after the start of the first annual reporting period beginning on or after January 1, 2020. As a result, entities do not have to review transactions that occurred in previous periods. Early application is permitted and must be disclosed.
Because the amendments apply prospectively to transactions or other events that occur on or after the date of the first application, most entities will probably not be affected by these amendments in the transition. However, those entities that consider the acquisition of a set of activities and assets after implementing the amendments must first update their accounting policies in a timely manner.
Amendments may also be relevant in other areas of IFRS (e.g. they may be relevant when a controller loses control of a subsidiary and has anticipated the sale or contribution of assets between an investor and its associate or joint venture) (Amendments to IFRS 10 and IAS 28).
F-34
The Company will perform an impact assessment of the amendment once it takes effect.
IAS 1 Presentation of Financial Statements and IAS 8 Accounting Policies, Changes in Accounting Estimates and Errors – Definition of Material
In October 2018, the IASB issued amendments to IAS 1 Presentation of Financial Statements and IAS 8 Accounting Policies, changes in accounting estimates and errors, to align the definition of "material" in all standards and to clarify certain aspects of the definition. The new definition states that information is material if when omitted, misstated, or reasonably hidden could be expected to influence decisions that primary users of general-purpose of the financial statements make based on those financial statements, which provide financial information about a specific reporting entity.
Amendments should be applied prospectively. Early application is permitted and must be disclosed.
While amendments to the definition of material are not expected to have a significant impact on an entity's financial statements, the introduction of the term "hide" in the definition could impact the way materiality judgments are made, increasing the importance of how information is communicated and organized in the financial statements.
The Company will perform an impact assessment of the amendment once it takes effect.
IFRS 9, IAS 39 and IFRS 7 Reference Interest Rate Reform
In September 2019, the IASB issued amendments to IFRS 9, IAS 39 and IFRS 7, which concludes the first stage of its work to respond to the effects of the reform of interbank offer rate (IBOR) in financial information. The amendments provide temporary exceptions that allow hedge accounting to continue during the uncertain period, prior to replacing existing benchmark interest rates with near-risk free alternative interest rates.
Amendments should be applied retrospectively. However, any hedge relationship that has previously been discontinued cannot be reinstated with the application of these amendments, nor can a hedge relationship be designated using the retrospect reasoning benefit. Early application is permitted and must be disclosed.
The Company will perform an impact assessment of the amendment once it takes effect.
IFRS 10 Consolidated Financial Statements and IAS 28 Investments in Associates and Joint Ventures – sale or contribution of assets between an investor and its associate or joint venture
Amendments to IFRS 10 Consolidated Financial Statements and IAS 28 Investments in Associates and Joint Ventures (2011) address a recognized inconsistency between IFRS 10 requirements and IAS 28 (2011) requirements in the treatment of the sale or contribution of assets between an investor and its associate or joint venture. The amendments, issued in September 2014, state that when the transaction involves a business (whether it is in a subsidiary or not) all gains, or losses generated are recognized. A partial gain or loss is recognized when the transaction involves assets that do not constitute a business, even when the assets are in a subsidiary. The mandatory implementation date of these amendments is yet to be determined because the IASB is awaiting the results of its research project on accounting according to the equity method of accounting. These amendments must be applied retrospectively, and early adoption is allowed, which must be disclosed.
The Company will perform an impact assessment of the amendment once it takes effect.
F-35
3 – FINANCIAL REPORTING BY SEGMENT
The Company provides financial information by segments according to IFRS 8 “Operating Segments,” which establishes standards for reporting by operating segment and related disclosures for products and services, and geographic areas.
The Company’s Board of Directors and Management measures and assesses performance of operating segments based on the operating income of each of the countries where there are Coca-Cola franchises.
The operating segments are determined based on the presentation of internal reports to the Company´s chief strategic decision-maker. The chief operating decision-maker has been identified as the Company´s Board of Directors who makes the Company’s strategic decisions.
The following operating segments have been determined for strategic decision making based on geographic location:
| · | Operation in Chile |
| · | Operation in Brazil |
| · | Operation in Argentina |
| · | Operation in Paraguay |
The four operating segments conduct their businesses through the production and sale of soft drinks and other beverages, as well as packaging materials.
Expenses and revenue associated with the Corporate Officer were assigned to the operation in Chile in the soft drinks segment because Chile is the country that manages and pays the corporate expenses, which would also be substantially incurred, regardless of the existence of subsidiaries abroad.
Total revenues by segment include sales to unrelated customers and inter-segments, as indicated in the consolidated statement of income of the Company.
F-36
A summary of the Company’s operating segments in accordance to IFRS is as follows:
| For the period ended December 31, 2019 | Chile Operation |
Argentina Operation |
Brazil Operation |
Paraguay Operation |
Intercompany Eliminations |
Consolidated total |
|||||||||||||||||
| ThCh$ | ThCh$ | ThCh$ | ThCh$ | ThCh$ | ThCh$ | ||||||||||||||||||
| Softdrinks | 408,467,731 | 313,866,082 | 360,791,744 | 124,855,857 | (366,490 | ) | 1,207,614,924 | ||||||||||||||||
| Other beverages | 200,484,390 | 70,990,286 | 258,529,540 | 34,036,153 | (450,559 | ) | 563,589,810 | ||||||||||||||||
| Packaging | - | 9,779,472 | - | - | (1,959,091 | ) | 7,820,381 | ||||||||||||||||
| Net sales | 608,952,121 | 394,635,840 | 619,321,284 | 158,892,010 | (2,776,140 | ) | 1,779,025,115 | ||||||||||||||||
| Cost of sales | (359,465,664 | ) | (214,447,259 | ) | (384,838,875 | ) | (92,368,109 | ) | 2,776,140 | (1,048,343,767 | ) | ||||||||||||
| Distribution expenses | (59,076,433 | ) | (56,421,024 | ) | (42,673,570 | ) | (8,825,262 | ) | (166,996,289 | ) | |||||||||||||
| Administrative expenses | (114,250,801 | ) | (89,276,114 | ) | (98,071,441 | ) | (24,305,453 | ) | (325,903,809 | ) | |||||||||||||
| Finance income | 1,286,021 | 1,346,501 | 42,327,682 | 195,587 | - | 45,155,791 | |||||||||||||||||
| Finance expense | (13,151,176 | ) | 999,370 | (34,057,214 | ) | 0 | - | (46,209,020 | ) | ||||||||||||||
| Interest expense, net (1) | (11,865,155 | ) | 2,345,871 | 8,270,468 | 195,587 | - | (1,053,229 | ) | |||||||||||||||
| Share of the entity in income of associates | 381,255 | - | (3,796,338 | ) | - | - | (3,415,083 | ) | |||||||||||||||
| Income tax expense | (12,838,517 | ) | (6,902,265 | ) | (36,821,377 | ) | (4,604,732 | ) | - | (61,166,891 | ) | ||||||||||||
| Other income (loss) | (15,109,823 | ) | (3,235,926 | ) | 21,754,242 | (308,315 | ) | - | 3,100,178 | ||||||||||||||
| Net income of the segment reported | 36,726,983 | 26,699,123 | 83,144,393 | 28,675,726 | - | 175,246,225 | |||||||||||||||||
| Depreciation and amortization | 46,105,063 | 25,369,034 | 29,945,887 | 9,667,300 | - | 111,087,284 | |||||||||||||||||
| Current assets | 244,504,165 | 76,354,086 | 171,349,293 | 41,266,559 | - | 533,474,103 | |||||||||||||||||
| Non-current assets | 657,069,423 | 165,116,212 | 786,979,234 | 248,309,451 | - | 1,857,474,320 | |||||||||||||||||
| Segment assets, total | 901,573,588 | 241,470,298 | 958,328,527 | 289,576,010 | - | 2,390,948,423 | |||||||||||||||||
| Carrying amount in associates and joint ventures accounted for using the equity method, total |
49,703,673 | - | 50,163,060 | - | - | 99,866,733 | |||||||||||||||||
| Segment disbursements of non-monetary assets | 51,542,820 | 24,343,002 | 21,343,312 | 13,454,124 | - | 110,683,258 | |||||||||||||||||
| Current liabilities | 193,298,799 | 68,120,885 | 124,248,587 | 25,990,081 | - | 411,658,352 | |||||||||||||||||
| Non-current liabilities | 474,576,722 | 13,350,651 | 506,297,573 | 16,161,177 | - | 1,010,386,123 | |||||||||||||||||
| Segment liabilities, total | 667,875,521 | 81,471,536 | 630,546,160 | 42,151,258 | - | 1,422,044,475 | |||||||||||||||||
| Cash flows provided by in Operating Activities | 145,551,360 | 30,440,761 | 63,145,540 | 16,010,813 | - | 255,148,474 | |||||||||||||||||
| Cash flows (used in) provided by Investing Activities |
(50,706,748 | ) | (24,790,752 | ) | (21,096,376 | ) | (13,454,124 | ) | - | (110,048,000 | ) | ||||||||||||
| Cash flows (used in) provided by Financing Activities |
(100,352,068 | ) | (616,475 | ) | (25,654,792 | ) | (489,302 | ) | - | (127,112,637 | ) | ||||||||||||
(1) Financial expenses associated with external financing for the purchase of companies, including capital contributions are presented in this item.
F-37
| For the period ended December 31, 2018 | Chile Operation | Argentina Operation (2) | Brazil Operation | Paraguay Operation | Intercompany Eliminations | Consolidated total | ||||||||||||||||||
| ThCh$ | ThCh$ | ThCh$ | ThCh$ | ThCh$ | ThCh$ | |||||||||||||||||||
| Softdrinks | 390,782,296 | 330,874,797 | 326,015,740 | 118,095,369 | (72,170 | ) | 1,165,696,032 | |||||||||||||||||
| Other beverages | 180,156,806 | 75,341,941 | 214,493,809 | 31,492,883 | - | 501,485,439 | ||||||||||||||||||
| Packaging | - | 7,343,785 | - | - | (1,609,457 | ) | 5,734,328 | |||||||||||||||||
| Net sales | 570,939,102 | 413,560,523 | 540,509,549 | 149,588,252 | (1,681,627 | ) | 1,672,915,799 | |||||||||||||||||
| Cost of sales | (336,719,937 | ) | (214,647,052 | ) | (329,529,112 | ) | (88,813,300 | ) | 1,681,627 | (968,027,774 | ) | |||||||||||||
| Distribution expenses | (55,798,363 | ) | (62,899,574 | ) | (38,835,833 | ) | (8,241,714 | ) | (165,775,484 | ) | ||||||||||||||
| Administrative expenses | (109,373,432 | ) | (93,149,904 | ) | (88,809,386 | ) | (22,410,131 | ) | (313,742,853 | ) | ||||||||||||||
| Finance income | 1,686,041 | 14,750 | 2,019,489 | 219,964 | - | 3,940,244 | ||||||||||||||||||
| Finance expense | (23,713,774 | ) | (192,602 | ) | (31,108,284 | ) | - | - | (55,014,660 | ) | ||||||||||||||
| Interest expense, net (1) | (22,027,733 | ) | (177,852 | ) | (29,088,795 | ) | 219,964 | - | (51,074,416 | ) | ||||||||||||||
| Share of the entity in income of associates | 298,359 | - | 1,112,820 | - | - | 1,411,179 | ||||||||||||||||||
| Income tax expense | (22,000,539 | ) | (18,874,454 | ) | (10,088,988 | ) | (4,600,874 | ) | - | (55,564,855 | ) | |||||||||||||
| Other income (loss) | (11,540,167 | ) | (2,639,386 | ) | (8,399,463 | ) | (111,834 | ) | - | (22,690,850 | ) | |||||||||||||
| Net income of the segment reported | 13,777,290 | 21,172,301 | 36,870,792 | 25,630,363 | - | 97,450,746 | ||||||||||||||||||
| Depreciation and amortization | 42,353,664 | 20,474,446 | 26,830,835 | 9,935,501 | - | 99,594,446 | ||||||||||||||||||
| Current assets | 228,108,768 | 80,908,212 | 135,259,768 | 37,309,706 | - | 481,586,454 | ||||||||||||||||||
| Non-current assets | 644,395,166 | 160,587,931 | 679,183,347 | 248,751,791 | - | 1,732,918,235 | ||||||||||||||||||
| Segment assets, total | 872,503,934 | 241,496,143 | 814,443,115 | 286,061,497 | - | 2,214,504,689 | ||||||||||||||||||
| Carrying amount in associates and joint ventures accounted for using the equity method, total | 50,136,065 | - | 52,274,880 | - | - | 102,410,945 | ||||||||||||||||||
| Capital expenditures and other | 67,709,231 | 28,702,138 | 32,536,213 | 9,684,466 | - | 138,632,048 | ||||||||||||||||||
| Current liabilities | 186,831,021 | 83,013,418 | 128,146,943 | 21,870,719 | - | 419,862,101 | ||||||||||||||||||
| Non-current liabilities | 477,319,648 | 17,066,746 | 420,218,066 | 16,323,385 | - | 930,927,845 | ||||||||||||||||||
| Segment liabilities, total | 664,150,669 | 100,080,164 | 548,365,009 | 38,194,104 | - | 1,350,789,946 | ||||||||||||||||||
| Cash flows provided by in Operating Activities | 150,035,425 | 28,899,457 | 44,949,860 | 11,394,620 | - | 235,279,362 | ||||||||||||||||||
| Cash flows (used in) provided by Investing Activities | (47,164,236 | ) | (28,700,733 | ) | (32,536,213 | ) | (9,684,466 | ) | - | (118,085,648 | ) | |||||||||||||
| Cash flows (used in) provided by Financing Activities | (98,560,576 | ) | (10,644,812 | ) | (5,099,823 | ) | (330,067 | ) | - | (114,635,278 | ) | |||||||||||||
(1) Financial expenses associated with external financing for the purchase of companies, including capital contributions are presented in this item.
(2) Pursuant the application of IAS 19 in Argentina, assets and liabilities increased by ThCh $ 97,318,892 and ThCh $ 16,093,780, respectively. The effect in the income statement was a net loss of ThCh $ 15,743,592.
F-38
| For the period ended December 31, 2017 | Chile Operation | Argentina Operation | Brazil Operation | Paraguay Operation | Intercompany Eliminations | Consolidated total | ||||||||||||||||||
| ThCh$ | ThCh$ | ThCh$ | ThCh$ | ThCh$ | ThCh$ | |||||||||||||||||||
| Softdrinks | 391,629,010 | 444,872,352 | 387,545,053 | 113,314,824 | (96,999 | ) | 1,337,264,240 | |||||||||||||||||
| Other beverages | 160,244,448 | 99,712,939 | 216,352,694 | 27,962,406 | - | 504,272,487 | ||||||||||||||||||
| Packaging | - | 9,202,768 | - | - | (1,860,876 | ) | 7,341,892 | |||||||||||||||||
| Net sales | 551,873,458 | 553,788,059 | 603,897,747 | 141,277,230 | (1,957,875 | ) | 1,848,878,619 | |||||||||||||||||
| Cost of sales | (328,579,003 | ) | (294,370,581 | ) | (362,686,353 | ) | (85,346,902 | ) | 1,957,875 | (1,069,024,964 | ) | |||||||||||||
| Distribution expenses | (54,777,094 | ) | (87,032,428 | ) | (43,483,958 | ) | (7,634,395 | ) | - | (192,927,875 | ) | |||||||||||||
| Administrative expenses | (110,969,260 | ) | (106,504,163 | ) | (109,095,660 | ) | (21,630,238 | ) | - | (348,199,321 | ) | |||||||||||||
| Finance income | 19,057,630 | 2,116,590 | 6,575,528 | 257,906 | (16,813,279 | ) | 11,194,375 | |||||||||||||||||
| Finance expense | (32,594,796 | ) | (4,663,527 | ) | (34,767,713 | ) | (7,612 | ) | 16,813,279 | (55,220,369 | ) | |||||||||||||
| Interest expense, net* | (13,537,166 | ) | (2,546,937 | ) | (28,192,185 | ) | 250,294 | - | (44,025,994 | ) | ||||||||||||||
| Share of the entity in income of associates | 246,084 | (243 | ) | (326,201 | ) | - | - | (80,360 | ) | |||||||||||||||
| Income tax expense | (16,871,257 | ) | (17,683,875 | ) | (13,719,506 | ) | (3,522,996 | ) | - | (51,797,634 | ) | |||||||||||||
| Other income (loss) | (11,312,509 | ) | (10,441,173 | ) | (1,855,039 | ) | (213,025 | ) | - | (23,821,746 | ) | |||||||||||||
| Net income of the segment reported | 16,073,253 | 35,208,659 | 44,538,845 | 23,179,968 | - | 119,000,725 | ||||||||||||||||||
| Depreciation and amortization | 42,688,326 | 17,648,018 | 27,879,514 | 10,948,033 | - | 99,163,891 | ||||||||||||||||||
| Current assets | 223,245,173 | 97,529,488 | 132,815,545 | 30,419,844 | - | 484,010,050 | ||||||||||||||||||
| Non-current assets | 636,482,010 | 96,532,150 | 663,556,969 | 234,278,288 | - | 1,630,849,417 | ||||||||||||||||||
| Segment assets, total | 859,727,183 | 194,061,638 | 796,372,514 | 264,698,132 | - | 2,114,859,467 | ||||||||||||||||||
| Carrying amount in associates and joint ventures accounted for using the equity method, total | 33,789,538 | - | 53,019,531 | - | - | 86,809,069 | ||||||||||||||||||
| Capital expenditures and other | 64,480,973 | 40,347,989 | 91,198,657 | 14,476,783 | - | 210,504,402 | ||||||||||||||||||
| Current liabilities | 169,508,083 | 105,886,744 | 135,595,156 | 17,297,339 | - | 428,287,322 | ||||||||||||||||||
| Non-current liabilities | 463,997,113 | 1,368,167 | 393,125,740 | 14,847,776 | - | 873,338,796 | ||||||||||||||||||
| Segment liabilities, total | 633,505,196 | 107,254,911 | 528,720,896 | 32,145,115 | - | 1,301,626,118 | ||||||||||||||||||
| Cash flows provided by Operating Activities | 79,451,122 | 38,904,028 | 98,783,329 | 30,821,869 | - | 247,960,348 | ||||||||||||||||||
| Cash flows (used in) provided by Investing Activities | (49,677,671 | ) | (40,344,994 | ) | (64,331,960 | ) | (14,476,785 | ) | - | (168,831,410 | ) | |||||||||||||
| Cash flows (used in) provided by Financing Activities | (91,800,089 | ) | 16,891,759 | (3,437,440 | ) | - | - | (78,345,770 | ) | |||||||||||||||
F-39
The composition of Cash and cash equivalents is as follows:
| By item | 12.31.2019 | 12.31.2018 | ||||||
| ThCh$ | ThCh$ | |||||||
| Cash | 2,331,714 | 2,907,276 | ||||||
| Bank balances | 51,176,617 | 46,425,927 | ||||||
| Time deposits | - | 1,500,315 | ||||||
| Other fixed rate instruments | 104,059,655 | 86,705,095 | ||||||
| Total cash and cash equivalents | 157,567,986 | 137,538,613 | ||||||
Time deposits expire in less than three months from their acquisition date and accrue market interest for this type of short-term investment. Other fixed-income instruments mainly correspond to mutual funds with a maturity of less than 90 days, from the date of investment. There are no restrictions for significant amounts available to cash.
| By currency | 12.31.2019 | 12.31.2018 | ||||||
| ThCh$ | ThCh$ | |||||||
| USD | 16,733,249 | 5,917,041 | ||||||
| EUR | 9,722 | 51,401 | ||||||
| ARS | 3,830,199 | 6,726,906 | ||||||
| CLP | 78,420,966 | 86,121,695 | ||||||
| PGY | 12,383,873 | 10,680,600 | ||||||
| BRL | 46,189,977 | 28,040,970 | ||||||
| Cash and cash equivalents | 157,567,986 | 137,538,613 | ||||||
5 – OTHER CURRENT AND NON-CURRENT FINANCIAL ASSETS
The composition of other financial assets is as follows:
| Balance | ||||||||||||||||
| Current | Non-current | |||||||||||||||
| Other financial assets | 12.31.2019 | 12.31.2018 | 12.31.2019 | 12.31.2018 | ||||||||||||
| ThCh$ | ThCh$ | ThCh$ | ThCh$ | |||||||||||||
| Financial assets measured at amortized cost (1) | 30,073 | 14,040 | 1,216,865 | - | ||||||||||||
| Financial assets at fair value (2) | 317,205 | 669,527 | 98,918,457 | 87,446,662 | ||||||||||||
| Other financial assets measured at amortized cost (3) | - | - | 10,648,989 | 9,915,663 | ||||||||||||
| Total | 347,278 | 683,567 | 110,784,311 | 97,362,295 | ||||||||||||
(1) Financial instruments held by the Company other than cash and cash equivalents. They mainly consist of time deposits with short-term maturities (more than 90 days).
(2) See detail in Note 22
(3) Correspond to the rights in the Argentinean company Alimentos de Soya S.A., which are framed in the purchase of the "AdeS" brand managed by The Coca-Cola Company at the end of 2016.
F-40
6 – OTHER CURRENT AND NON-CURRENT NON-FINANCIAL ASSETS
The composition of other non-financial assets is as follows:
| Balance | ||||||||||||||||
| Current | Non-current | |||||||||||||||
| Other non-financial assets | 12.31.2019 | 12.31.2018 | 12.31.2019 | 12.31.2018 | ||||||||||||
| ThCh$ | ThCh$ | ThCh$ | ThCh$ | |||||||||||||
| Prepaid expenses | 11,242,456 | 4,967,255 | 595,045 | 810,662 | ||||||||||||
| Tax credit remainder (1) | 180,695 | 18,022 | 103,540,639 | 13,322,720 | ||||||||||||
| Guaranty deposit | 422 | 3,013 | - | - | ||||||||||||
| Judicial deposits | - | - | 19,226,030 | 18,590,597 | ||||||||||||
| Others (2) | 4,765,392 | 960,633 | 2,274,436 | 2,253,285 | ||||||||||||
| Total | 16,188,965 | 5,948,923 | 125,636,150 | 34,977,264 | ||||||||||||
(1) In November 2006, Rio de Janeiro Refrescos Ltda. ("RJR") filed a court order No. 0021799-23.2006.4.02.5101 seeking recognition of the right to exclude ICMS (Tax on Commerce and Services) from the PIS (Program of Social Integration) and COFINS (Contribution for the Financing of Social Security) calculation base, as well as recognition of the right to obtain reimbursement of amounts unduly collected since November 14, 2001, duly restated using the Selic interest rate. On May 20, 2019, the ruling favoring RJR became final, allowing the recovery of amounts overpaid from November 14, 2001 to August 2017. It is worth noting that in September 2017, RJR had already obtained a Security Mandate, which granted it the right to exclude, from that date, the ICMS from the PIS and COFINS calculation base.
The company took steps to assess the total amount of the credit at issue for the period of unduly collection of taxes from November 2001 to August 2017, totaling CLP 103,540 million (BRL 567 million, of which BRL 357 million corresponds to capital and BRL 210 million to interest and monetary restatement. These amounts were recorded as of December 31, 2019. In addition, the company acknowledged the indirect costs (attorneys' fees, consulting, auditing, indirect taxes and other obligations) resulting from the recognition of the right acquired in court, totaling BRL 161 million.
The payment of income tax occurs when liquidating the credit, thus the respective deferred tax liability recorded was CLP 25,200 million (BRL 138 million).
Compañía de Bebidas Ipiranga ("CBI") acquired in September 2013, also filed a court order No. 0014022-71.2000.4.03.6102 in order to recognize the same issue as the one previously described for RJR. In September 2019, the ruling favoring CBI became final, allowing the recovery of the amounts overpaid from September 12, 1990 to December 1, 2013 (date when CBI was incorporated by RJR). CBI's credit will be generated in the name of RJR, however, pursuant to the contractual clause ("Subscription Agreement for Shares and Exhibits"), as soon as collected by RJR, this payment should be immediately paid to former CBI shareholders (supervention favoring former CBI shareholders).
F-41
In addition, RJR has an associate called Sorocaba Refrescos SA ("Sorocaba"), where it has a 40% shareholding in the capital, which also filed a court order seeking recognition of the right to the same issue as RJR's action. On June 13, 2019, the ruling favoring Sorocaba became final, allowing the recovery of the amounts overpaid from July 5, 1992 until the date on which the decision became final. The amount of this credit will be calculated and the respective impacts on RJR’s results derived from its participation in Sorocaba will be recognized in the fiscal year ended December 31, 2020.
Based on the information available for the CBI and Sorocaba lawsuits, the Company concluded that there was not enough documentary support to say that the credit is almost certain for the tax authorities and therefore, did not record the respective asset in the booking accounts.
(2) Other non-financial assets are mainly composed of advances to suppliers
7 – TRADE AND OTHER RECEIVABLES
The composition of trade and other receivables is as follows:
| Balance | ||||||||||||||||
| Current | Non-current | |||||||||||||||
| Trade debtors and other accounts receivable, Net | 12.31.2019 | 12.31.2018 | 12.31.2019 | 12.31.2018 | ||||||||||||
| ThCh$ | ThCh$ | ThCh$ | ThCh$ | |||||||||||||
| Trade debtors | 150,509,528 | 147,728,216 | - | 66,510 | ||||||||||||
| Other debtors | 39,620,246 | 16,722,240 | 466,007 | 1,204,187 | ||||||||||||
| Other accounts receivable | 947,814 | 9,662,867 | 57,762 | - | ||||||||||||
| Total | 191,077,588 | 174,113,323 | 523,769 | 1,270,697 | ||||||||||||
| Balance | ||||||||||||||||
| Current | Non-current | |||||||||||||||
| Trade debtors and other accounts receivable, Gross | 12.31.2019 | 12.31.2018 | 12.31.2019 | 12.31.2018 | ||||||||||||
| ThCh$ | ThCh$ | ThCh$ | ThCh$ | |||||||||||||
| Trade debtors | 153,654,549 | 150,933,965 | - | 66,510 | ||||||||||||
| Other debtors | 42,719,679 | 19,552,539 | 466,007 | 1,204,187 | ||||||||||||
| Other accounts receivable | 1,196,347 | 9,925,027 | 57,762 | - | ||||||||||||
| Total | 197,570,575 | 180,411,531 | 523,769 | 1,270,697 | ||||||||||||
F-42
The stratification of the portfolio is as follows:
| Balance | ||||||||
|
12.31.2019
|
12.31.2018
|
|||||||
| Current trade debtors without impairment impact | ThCh$ | ThCh$ | ||||||
| Less than one month | 148,150,717 | 144,172,500 | ||||||
| Between one and three months | 1,872,144 | 2,066,514 | ||||||
| Between three and six months | 838,277 | 601,042 | ||||||
| Between six and eight months | 482,596 | 851,009 | ||||||
| Older than eight months | 2,310,815 | 3,309,410 | ||||||
| Total | 153,654,549 | 151,000,475 | ||||||
The Company has approximately 276,000 clients, which may have balances in the different sections of the stratification. The number of clients is distributed geographically with 65,400 in Chile, 89,200 in Brazil, 64,400 in Argentina and 57,000 in Paraguay.
| 12.31.2019 | 12.31.2018 | |||||||
| ThCh$ | ThCh$ | |||||||
| Debtors for current credit operations | 153,654,549 | 150,933,965 | ||||||
| Non-current credit operations | - | 66,510 | ||||||
| Total | 153,654,549 | 151,000,475 | ||||||
The movement in the allowance for expected credit losses is presented below:
| 12.31.2019 | 12.31.2018 | |||||||
| ThCh$ | ThCh$ | |||||||
| Opening balance | 6,298,208 | 6,494,113 | ||||||
| Increase (decrease) | 1,762,246 | 1,629,761 | ||||||
| Provision reversal | (1,184,953 | ) | (1,257,591 | ) | ||||
| Increases (decrease) for changes of foreign currency | (382,514 | ) | (568,075 | ) | ||||
| Sub – total movements | 194,779 | (195,905 | ) | |||||
| Ending balance | 6,492,987 | 6,298,208 | ||||||
The composition of inventories is detailed as follows:
| Details | 12.31.2019 | 12.31.2018 | ||||||
| ThCh$ | ThCh$ | |||||||
| Raw materials (1) | 93,524,911 | 86,102,495 | ||||||
| Finished goods | 32,337,670 | 37,213,848 | ||||||
| Spare parts and supplies | 20,769,626 | 28,777,180 | ||||||
| Work in progress | 567,973 | 780,324 | ||||||
| Other inventories | 3,625,488 | 1,049,165 | ||||||
| Obsolescence provision (2) | (3,184,444 | ) | (2,603,303 | ) | ||||
| Total | 147,641,224 | 151,319,709 | ||||||
The cost of inventory recognized as cost of sales as of December 31, 2019 and 2018, is CLP 1,048,343,767 thousand and CLP 968,027,774 thousand, respectively.
| (1) | Approximately 80% is composed of concentrate and sweeteners used in the preparation of beverages, as well as caps and PET supplies used in the packaging of the product. |
| (2) | The obsolescence provision is related mainly with the obsolescence of spare parts classified as inventories and to a lesser extent to finished products and raw materials. The general standard is to provision all those multi-functional spare parts without utility in rotation in the last four years prior to the technical analysis technical to adjust the provision. In the case of raw materials and finished products, the obsolescence provision is determined according to maturity. |
F-43
9 – TAX ASSETS AND LIABILITIES
The composition of current tax accounts receivable is the following:
| Tax assets | 12.31.2019 | 12.31.2018 | ||||||
| ThCh$ | ThCh$ | |||||||
| Tax credits (1) | 9,815,294 | 2,532,056 | ||||||
| Total | 9,815,294 | 2,532,056 | ||||||
(1) Tax credits correspond to income tax credits on training expenses, purchase of Property, plant and equipment, and donations.
The composition of current tax accounts payable is the following:
| Tax liabilities | 12.31.2019 | 12.31.2018 | 12.31.2017 | |||||||||
| ThCh$ | ThCh$ | ThCh$ | ||||||||||
| Income tax expense | 6,762,267 | 9,338,612 | 3,184,965 | |||||||||
| Total | 6,762,267 | 9,338,612 | 3,184,965 | |||||||||
F-44
10 – INCOME TAX EXPENSE AND DEFERRED TAXES
10.1 Income tax expense
The current and deferred income tax expenses are detailed as follows:
| Details | 12.31.2019 | 12.31.2018 | 12.31.2017 | |||||||||
| ThCh$ | ThCh$ | ThCh$ | ||||||||||
| Current income tax expense | 35,439,707 | 38,313,980 | 40,183,261 | |||||||||
| Current tax adjustment previous period | 713,992 | 312,403 | 137,455 | |||||||||
| Withholding tax expense foreign subsidiaries | 4,534,145 | 7,364,213 | 6,730,031 | |||||||||
| Other current tax expense (income) | (425,958 | ) | 474,105 | (5,733 | ) | |||||||
| Current income tax expense | 40,261,886 | 46,464,701 | 47,045,014 | |||||||||
| Expense (income) for the creation and reversal of temporary differences of deferred tax and others | 20,905,005 | 9,100,154 | 4,752,620 | |||||||||
| Expense (income) for deferred taxes | 20,905,005 | 9,100,154 | 4,752,620 | |||||||||
| Total income tax expense | 61,166,891 | 55,564,855 | 51,797,634 | |||||||||
The distribution of national and foreign tax expenditure is as follows:
| Income taxes | 12.31.2019 | 12.31.2018 | 12.31.2017 | |||||||||
| ThCh$ | ThCh$ | ThCh$ | ||||||||||
| Current taxes | ||||||||||||
| Foreign | (24,315,576 | ) | (24,442,984 | ) | (30,258,395 | ) | ||||||
| National | (15,946,310 | ) | (22,021,717 | ) | (16,786,619 | ) | ||||||
| Current tax expense | (40,261,886 | ) | (46,464,701 | ) | (47,045,014 | ) | ||||||
| Deferred taxes | ||||||||||||
| Foreign | (24,012,798 | ) | (9,121,332 | ) | (4,667,982 | ) | ||||||
| National | 3,107,793 | 21,178 | (84,638 | ) | ||||||||
| Deferred tax expense | (20,905,005 | ) | (9,100,154 | ) | (4,752,620 | ) | ||||||
| Income tax expense | (61,166,891 | ) | (55,564,855 | ) | (51,797,634 | ) | ||||||
F-45
The reconciliation of the tax expense using the statutory rate with the tax expense using the effective rate is as follows:
| Reconciliation of effective rate | 12.31.2019 | 12.31.2018 | 12.31.2017 | |||||||||
| ThCh$ | ThCh$ | ThCh$ | ||||||||||
| Net income before taxes | 236,413,116 | 153,015,601 | 170,798,359 | |||||||||
| Tax expense at legal rate (27.0%) | (63,831,541 | ) | (41,314,212 | ) | (43,553,581 | ) | ||||||
| Effect of a different tax rate in other jurisdictions | (3,471,705 | ) | 967,671 | (4,971,103 | ) | |||||||
| Permanent differences: | ||||||||||||
| Non-taxable revenues | 9,507,807 | 12,522,541 | 9,645,068 | |||||||||
| Non-deductible expenses | (4,664,045 | ) | (11,141,237 | ) | (4,020,729 | ) | ||||||
Reversal of tax provision | (3,316,278 | ) | (295,632 | ) | 125,021 | |||||||
| Effect of monetary tax restatement Chilean companies | 5,199,589 | 2,566,163 | (1,465,753 | ) | ||||||||
| Foreign subsidiaries tax withholding expense and other legal tax debits and credits | (590,718 | ) | (18,870,149 | ) | (7,556,557 | ) | ||||||
| Adjustments to tax expense | 6,136,355 | (15,218,314 | ) | (3,272,950 | ) | |||||||
| Tax expense at effective rate | (61,166,891 | ) | (55,564,855 | ) | (51,797,634 | ) | ||||||
| Effective rate | 25.9 | % | 36.3 | % | 30.6 | % | ||||||
The applicable income tax rates in each of the jurisdictions where the Company operates are the following:
| Rate | ||||||||||||
| Country | 2019 | 2018 | 2017 | |||||||||
| Chile | 27.0 | % | 27.0 | % | 25.5 | % | ||||||
| Brazil | 34.0 | % | 34.0 | % | 34.0 | % | ||||||
| Argentina | 30.0 | % | 30.0 | % | 35.0 | % | ||||||
| Paraguay | 10.0 | % | 10.0 | % | 10.0 | % | ||||||
F-46
10.2 Deferred income taxes
The net cumulative balances of temporary differences that give rise to deferred tax assets and liabilities are detailed as follows:
| 12.31.2019 | 12.31.2018 | |||||||||||||||
| Temporary differences | Assets | Liabilities | Assets | Liabilities | ||||||||||||
| ThCh$ | ThCh$ | ThCh$ | ThCh$ | |||||||||||||
| Property, plant and equipment | 5,445,810 | 51,414,971 | 5,420,447 | 46,181,359 | ||||||||||||
| Obsolescence provision | 1,588,563 | - | 910,076 | 112,359 | ||||||||||||
| ICMS exclusion credit | - | 25,651,794 | - | - | ||||||||||||
| Employee benefits | 5,418,561 | 12,157 | 5,169,161 | 131,829 | ||||||||||||
| Post-employment benefits | 148,853 | 787,576 | 90,941 | 1,014,354 | ||||||||||||
| Tax loss carry forwards (1) | 7,607,813 | - | 9,137,392 | - | ||||||||||||
| Tax goodwill Brazil | 10,341,033 | - | 18,836,838 | - | ||||||||||||
| Contingency provision | 34,109,458 | - | 26,796,262 | - | ||||||||||||
| Foreign Exchange differences (2) | 9,284,450 | - | 13,083,953 | - | ||||||||||||
| Allowance for doubtful accounts | 756,895 | - | 1,262,977 | - | ||||||||||||
| Coca-Cola incentives (Argentina) | - | - | 352,061 | - | ||||||||||||
| Assets and liabilities for placement of bonds | 390,163 | 1,187,649 | - | 1,327,727 | ||||||||||||
| Lease liabilities | 2,242,439 | - | 1,328,320 | - | ||||||||||||
| Inventories | 447,192 | - | 347,470 | - | ||||||||||||
| Distribution rights | - | 163,107,412 | - | 173,273,994 | ||||||||||||
| Others | - | 3,705,078 | - | 5,940,224 | ||||||||||||
| Subtotal | 77,781,230 | 245,866,637 | 82,735,898 | 227,981,846 | ||||||||||||
| Total assets and liabilities net | 1,364,340 | 169,449,747 | - | 145,245,948 | ||||||||||||
| (1) | Tax losses mainly associated with the subsidiary Embotelladora Andina Chile S.A. In Chile tax losses have no expiration date |
| (2) | Corresponds to deffered taxes for exchange rate differences generated on the translation of debt expressed in foreign currency in the subsidiary Rio de Janeiro Refrescos Ltda. and which for tax purposes are recognized in Brazil when incurred. |
The movement in deferred income tax accounts is as follows:
| Movement | 12.31.2019 | 12.31.2018 | 12.31.2017 | |||||||||
| ThCh$ | ThCh$ | ThCh$ | ||||||||||
| Opening Balance | 145,245,948 | 121,991,585 | 125,608,802 | |||||||||
| Increase (decrease) in deferred tax | 20,905,005 | 11,303,016 | (3,417,011 | ) | ||||||||
| Increase (decrease) due to foreign currency translation (*) | 1,934,454 | 11,951,347 | (200,206 | ) | ||||||||
| Total movements | 22,839,459 | 23,254,363 | (3,617,217 | ) | ||||||||
| Ending balance | 168,085,407 | 145,245,948 | 121,991,585 | |||||||||
(*) Includes IAS 29 effect, due to inflation in Argentina
F-47
11 – PROPERTY, PLANT AND EQUIPMENT
Property, plant and equipment are detailed below at the end of each period:
| Property, plant and equipment, gross | 12.31.2019 | 12.31.2018 | ||||||
| ThCh$ | ThCh$ | |||||||
| Construction in progress | 27,290,581 | 26,048,670 | ||||||
| Land | 104,196,754 | 100,479,196 | ||||||
| Buildings | 299,282,674 | 371,279,937 | ||||||
| Plant and equipment | 571,154,695 | 623,568,795 | ||||||
| Information technology equipment | 23,912,963 | 22,752,205 | ||||||
| Fixed installations and accessories | 46,062,659 | 43,717,907 | ||||||
| Vehicles | 55,128,493 | 53,682,179 | ||||||
| Leasehold improvements | 214,886 | 144,914 | ||||||
| Rights of use (1) | 40,498,400 | - | ||||||
| Other properties, plant and equipment (2) | 452,600,945 | 438,350,022 | ||||||
| Total Property, plant and equipment, gross | 1,620,343,050 | 1,680,023,825 | ||||||
Accumulated depreciation of Property, plant and equipment | 12.31.2019 |
12.31.2018 | ||||||
| ThCh$ | ThCh$ | |||||||
| Buildings | (87,308,899 | ) | (157,119,586 | ) | ||||
| Plant and equipment | (385,801,471 | ) | (416,164,810 | ) | ||||
| Information technology equipment | (18,911,118 | ) | (17,567,484 | ) | ||||
| Fixed installations and accessories | (26,219,378 | ) | (22,660,738 | ) | ||||
| Vehicles | (33,167,346 | ) | (31,883,578 | ) | ||||
| Leasehold improvements | (144,865 | ) | (112,737 | ) | ||||
| Rights of use (1) | (8,254,568 | ) | - | |||||
| Other properties, plant and equipment (2) | (337,816,542 | ) | (323,743,924 | ) | ||||
| Total accumulated depreciation | (897,624,187 | ) | (969,252,857 | ) | ||||
| Total Property, plant and equipment, net | 722,718,863 | 710,770,968 | ||||||
(1) For adoption of IFRS 16. See details of underlying assets in Note 11.1
(2) The net balance of each of these categories is presented below:
| Other Property, plant and equipment, net | 12.31.2019 | 12.31.2018 | ||||||
| ThCh$ | ThCh$ | |||||||
| Bottles | 44,071,742 | 51,522,834 | ||||||
| Marketing and promotional assets | 57,442,154 | 45,739,948 | ||||||
| Other Property, plant and equipment | 13,270,507 | 17,343,316 | ||||||
| Total | 114,784,403 | 114,606,098 | ||||||
F-48
11.1 Movements
Movements in Property, plant and equipment are detailed as follows:
| Construction in progress |
Land | Buildings, net | Plant and equipment, net |
IT equipment net |
Fixed facilities and accessories, net |
Vehicles, net | Leasehold improvements, net |
Others | Rights-of-use | Property, plant & equipment, net |
||||||||||||||||||||||||||||||||||
| ThCh$ | ThCh$ | ThCh$ | ThCh$ | ThCh$ | ThCh$ | ThCh$ | ThCh$ | ThCh$ | ThCh$ | ThCh$ | ||||||||||||||||||||||||||||||||||
| Opening balance at January 1, 2019 | 26,048,670 | 100,479,196 | 214,160,351 | 207,403,985 | 5,184,721 | 21,057,169 | 21,798,601 | 32,177 | 114,606,098 | - | 710,770,968 | |||||||||||||||||||||||||||||||||
| Additions | 49,134,461 | - | 749,800 | 11,582,259 | 675,974 | 7,271 | (342,001 | ) | 1,309 | 32,640,210 | - | 94,449,283 | ||||||||||||||||||||||||||||||||
| Right-of use additions (3) | - | - | - | - | - | - | - | - | - | 21,721,728 | 21,721,728 | |||||||||||||||||||||||||||||||||
| Disposals | (8,761 | ) | - | (5,902 | ) | (352,204 | ) | (977 | ) | (8,911 | ) | (52,095 | ) | (155 | ) | (1,135,304 | ) | - | (1,564,309 | ) | ||||||||||||||||||||||||
| Transfers between items of Property, plant and equipment | (48,358,902 | ) | 2,268,316 | 430,971 | 20,735,065 | 1,019,048 | 1,379,012 | 7,650,847 | 65,250 | 14,810,393 | - | - | ||||||||||||||||||||||||||||||||
| Right-of-use transfers | (25,991 | ) | - | (266,007 | ) | (13,788,120 | ) | (23,712 | ) | - | (1,181,465 | ) | - | (2,520,405 | ) | 17,805,700 | - | |||||||||||||||||||||||||||
| Depreciation expense | - | - | (7,681,481 | ) | (37,572,910 | ) | (1,949,851 | ) | (2,977,512 | ) | (6,267,039 | ) | (30,737 | ) | (42,410,016 | ) | (98,889,546 | ) | ||||||||||||||||||||||||||
| Amortization (2) | - | - | - | - | - | - | - | - | - | (8,254,568 | ) | (8,254,568 | ) | |||||||||||||||||||||||||||||||
| Increase (decrease) due to foreign currency translation differences | 688,063 | 1,529,526 | 4,685,319 | 3,228,519 | 83,757 | 386,253 | 464,563 | 2,177 | 2,216,555 | 1,024,539 | 14,309,271 | |||||||||||||||||||||||||||||||||
| Other increase (decrease) (1) | (186,959 | ) | (80,284 | ) | (99,276 | ) | (5,883,370 | ) | 12,885 | (1 | ) | (110,264 | ) | - | (3,423,128 | ) | (53,567 | ) | (9,823,964 | ) | ||||||||||||||||||||||||
| Total movements | 1,241,911 | 3,717,558 | (2,186,576 | ) | (22,050,761 | ) | (182,876 | ) | (1,213,888 | ) | 162,546 | 37,844 | 178,305 | 32,243,832 | 11,947,895 | |||||||||||||||||||||||||||||
| Ending balance at December 31, 2019 | 27,290,581 | 104,196,754 | 211,973,775 | 185,353,224 | 5,001,845 | 19,843,281 | 21,961,147 | 70,021 | 114,784,403 | 32,243,832 | 722,718,863 | |||||||||||||||||||||||||||||||||
| (1) | Mainly correspond to effects of IAS 29 in Argentina. |
| (2) | Of the total of CLP 8,254,468 thousand recorded as amortization for the current period, CLP 5,994,037 thousand correspond to right-of-use amortization arising from the adoption of the IFRS, effective beginning on January 1, 2019. The remaining CLP 2,260,531 thousand correspond to depreciation (today amortization) of goods acquired under the financial lease method, which until December 31, 2018 were classified and valued pursuant to the accounting criteria of property, plant and equipment. |
| (3) | For IFRS 16 adoption |
F-49
Right-of-use asset as of December 31, 2019 is composed as follows:
Rights of use |
Gross asset | Depreciation | ||||||
| ThCh$ | ThCh$ | |||||||
| Buildings | 1,454,555 | (294,791 | ) | |||||
| Plant and equipment | 28,109,470 | (4,856,397 | ) | |||||
| IT Equipment | 283,473 | (69,209 | ) | |||||
| Motor vehicles | 5,198,413 | (1,776,055 | ) | |||||
| Others | 5,452,489 | (1,258,116 | ) | |||||
| Total | 40,498,400 | (8,254,568 | ) | |||||
Interest expense for lease liabilities for the period ended December 31, 2019 amounts to CLP 2,282,221 thousand.
F-50
| Construction in progress | Land | Buildings, net | Plant
and equipment, net | IT Equipment, net | Fixed
facilities and accessories, net | Vehicles, net | Leasehold improvements, net | Other,
net | Property,
plant and equipment, net | |||||||||||||||||||||||||||||||
| ThCh$ | ThCh$ | ThCh$ | ThCh$ | ThCh$ | ThCh$ | ThCh$ | ThCh$ | ThCh$ | ThCh$ | |||||||||||||||||||||||||||||||
| Opening balance at January 1, 2018 | 84,118,716 | 96,990,155 | 162,385,848 | 155,833,080 | 4,627,325 | 19,589,877 | 29,263,265 | 7,415 | 106,934,818 | 659,750,499 | ||||||||||||||||||||||||||||||
| Additions | 65,284,334 | - | 504,675 | 17,924,606 | 783,299 | 165,226 | 1,451,462 | 1,430 | 42,793,277 | 128,908,309 | ||||||||||||||||||||||||||||||
| Disposals | - | (5,465 | ) | (209,713 | ) | (1,002,133 | ) | - | - | (203,036 | ) | - | (1,588,050 | ) | (3,008,397 | ) | ||||||||||||||||||||||||
| Transfers between items of Property, plant and equipment | (109,893,610 | ) | - | 45,032,440 | 54,460,571 | 622,222 | 1,481,081 | (2,218,354 | ) | 22,000 | 10,493,650 | - | ||||||||||||||||||||||||||||
| Depreciation expense | - | - | (7,001,828 | ) | (39,182,401 | ) | (1,830,295 | ) | (2,668,535 | ) | (5,201,263 | ) | (11,112 | ) | (41,727,195 | ) | (97,622,629 | ) | ||||||||||||||||||||||
| Increase (decrease) due to foreign currency translation differences | (6,880,059 | ) | (4,615,830 | ) | (14,485,709 | ) | (17,048,903 | ) | (414,850 | ) | (4,048,135 | ) | (1,722,767 | ) | 169 | (16,954,922 | ) | (66,171,006 | ) | |||||||||||||||||||||
| Other increase (decrease) (1) | (6,580,711 | ) | 8,110,336 | 27,934,638 | 36,419,165 | 1,397,020 | 6,537,655 | 429,294 | 12,275 | 14,654,520 | 88,914,192 | |||||||||||||||||||||||||||||
| Total movements | (58,070,046 | ) | 3,489,041 | 51,774,503 | 51,570,905 | 557,396 | 1,467,292 | (7,464,664 | ) | 24,762 | 7,671,280 | 51,020,469 | ||||||||||||||||||||||||||||
| Ending balance at December 31, 2018 | 26,048,670 | 100,479,196 | 214,160,351 | 207,403,985 | 5,184,721 | 21,057,169 | 21,798,601 | 32,177 | 114,606,098 | 710,770,968 | ||||||||||||||||||||||||||||||
(1) Mainly correspond to the effects of adopting IAS 29 in Argentina.
F-51
| Construction in progress |
Land | Buildings, net | Plant
and equipment, net |
IT Equipment, net |
Fixed facilities and accessories, net |
Vehicles, net | Leasehold improvements, net |
Other,
net |
Property,
plant and equipment, net |
|||||||||||||||||||||||||||||||
| ThCh$ | ThCh$ | ThCh$ | ThCh$ | ThCh$ | ThCh$ | ThCh$ | ThCh$ | ThCh$ | ThCh$ | |||||||||||||||||||||||||||||||
| Opening balance at January 1, 2017 | 49,986,111 | 91,961,876 | 173,073,161 | 190,402,625 | 6,122,912 | 20,466,113 | 23,896,425 | 190,523 | 110,051,139 | 666,150,885 | ||||||||||||||||||||||||||||||
| Additions | 89,392,003 | 4,955,929 | 1,674,734 | 4,992,508 | 945,827 | - | 1,512,162 | 13,529 | 44,451,636 | 147,938,328 | ||||||||||||||||||||||||||||||
| Disposals | - | - | (300,079 | ) | (700,973 | ) | (1,062,530 | ) | (4,161 | ) | (173,190 | ) | - | (790,242 | ) | (3,031.175 | ) | |||||||||||||||||||||||
| Transfers between items of Property, plant and equipment | (41,957,409 | ) | - | 3,450,060 | 24,250,647 | 1,133,684 | 2,548,441 | 2,253,061 | - | 8,321,516 | - | |||||||||||||||||||||||||||||
| Depreciation expense | - | - | (5,880,770 | ) | (36,026,939 | ) | (2,190,107 | ) | (2,112,681 | ) | (5,303,332 | ) | (61,033 | ) | (45,746,096 | ) | (97,320,958 | ) | ||||||||||||||||||||||
| Increase (decrease) due to foreign currency translation differences | (13,319,346 | ) | 72,350 | (9,538,737 | ) | (20,492,851 | ) | (320,634 | ) | (1,307,835 | ) | 7,441,057 | (34,272 | ) | (7,670,229 | ) | (45,170,497 | ) | ||||||||||||||||||||||
| Other increase (decrease) (1) | 17,357 | - | (92,521 | ) | (6,591,937 | ) | (1,827 | ) | - | (362,918 | ) | (101,332 | ) | (1,682,906 | ) | (8,816,084 | ) | |||||||||||||||||||||||
| Total movements | 34,132,605 | 5,028,279 | (10,687,313 | ) | (34,569,545 | ) | (1,495,587 | ) | (876,236 | ) | 5,366,840 | (183,108 | ) | (3,116,321 | ) | (6,400,386 | ) | |||||||||||||||||||||||
| Ending balance at December 31, 2017 | 84,118,716 | 96,990,155 | 162,385,848 | 155,833,080 | 4,627,325 | 19,589,877 | 29,263,265 | 7,415 | 106,934,818 | 659,750,499 | ||||||||||||||||||||||||||||||
(1) Mainly correspond to property, plant & equipment write-offs.
F-52
Balances and main transactions with related parties are detailed as follows:
12.1 Accounts receivable:
| 12.31.2019 | 12.31.2018 | |||||||||||||||||||||||||||
| Taxpayer ID | Company | Relationship | Country | Currency | Current | Non-current | Current | Non-current | ||||||||||||||||||||
| ThCh$ | ThCh$ | ThCh$ | ThCh$ | |||||||||||||||||||||||||
| 96.891.720-K | Embonor S.A. | Shareholder related | Chile | CLP | 6,589,539 | - | 4,344,082 | - | ||||||||||||||||||||
| 96.714.870-9 | Coca-Cola de Chile S.A. | Shareholder | Chile | CLP | 14,839 | 283,118 | 2,175,934 | 74,340 | ||||||||||||||||||||
| Foreign | Coca Cola de Argentina | Director related | Argentina | ARS | 1,203,389 | - | 1,684,357 | - | ||||||||||||||||||||
| Foreign | UBI 3 (AdeS) | Shareholder related | Argentina | ARS | - | - | 455,823 | - | ||||||||||||||||||||
| Foreign | Alimentos de Soja S.A.U. | Shareholder related | Argentina | ARS | 428,802 | - | 371,712 | - | ||||||||||||||||||||
| 96.517.210-2 | Embotelladora Iquique S.A. | Shareholder related | Chile | CLP | 278,176 | - | 228,387 | - | ||||||||||||||||||||
| 86.881.400-4 | Envases CMF S.A. | Associate | Chile | CLP | 217,510 | - | 161,460 | - | ||||||||||||||||||||
| 96.919.980-7 | Cervecería Austral S.A. | Director related | Chile | USD | 45,644 | - | 26,557 | - | ||||||||||||||||||||
| 77.755.610-K | Comercial Patagona Ltda. | Director related | Chile | CLP | 3,872 | - | 1,951 | - | ||||||||||||||||||||
| 78.826.410-9 | Guallarauco | Associate | Chile | CLP | 2,003,203 | - | - | - | ||||||||||||||||||||
| 76.140.057-6 | Monster | Associate | Chile | CLP | 50,794 | - | - | - | ||||||||||||||||||||
| Total | 10,835,768 | 283,118 | 9,450,263 | 74,340 | ||||||||||||||||||||||||
12.2 Accounts payable:
| 12.31.2019 | 12.31.2018 | |||||||||||||||||||||||||||
| Taxpayer ID | Company | Relationship | Country | Currency | Current | Non-current | Current | Non-current | ||||||||||||||||||||
| M$ | M$ | M$ | M$ | |||||||||||||||||||||||||
| 96.714.870-9 | Coca-Cola de Chile S.A. | Shareholder | Chile | CLP | 20,555,135 | - | 21,286,933 | - | ||||||||||||||||||||
| Foreign | Recofarma do Indústrias Amazonas Ltda. | Shareholder related | Brazil | BRL | 14,888,934 | 19,777,812 | 8,681,099 | - | ||||||||||||||||||||
| 86.881.400-4 | Envases CMF S.A. | Associate | Chile | CLP | 6,359,797 | - | 5,702,194 | - | ||||||||||||||||||||
| Foreign | Ser. y Prod. para Bebidas Refrescantes S.R.L. | Shareholder | Argentina | ARS | 5,887,070 | - | 5,479,714 | - | ||||||||||||||||||||
| Foreign | Leão Alimentos e Bebidas Ltda. | Associate | Brazil | BRL | 1,841,377 | - | 3,132,515 | - | ||||||||||||||||||||
| Foreign | Monster Energy Brasil Com de Bebidas Ltda. | Shareholder related | Brazil | BRL | 827,300 | - | 664,565 | - | ||||||||||||||||||||
| 76.572.588-7 | Coca-Cola del Valle New Ventures S.A. | Associate | Chile | CLP | 1,247,961 | - | 649,046 | - | ||||||||||||||||||||
| 89.996.200-1 | Envases del Pacífico S.A. | Director related | Chile | CLP | 25,202 | - | 139,468 | - | ||||||||||||||||||||
| 96.891.720-K | Embonor S.A. | Shareholder related | Chile | CLP | 275,565 | - | 92,325 | - | ||||||||||||||||||||
| Foreign | Alimentos de Soja S.A.U. | Shareholder related | Argentina | ARS | 929,986 | - | - | - | ||||||||||||||||||||
| Foreign | Verde Campo | Shareholder related | Brazil | BRL | 765,521 | - | - | - | ||||||||||||||||||||
| Foreign | Coca-Cola Panama | Shareholder related | Panama | USD | 7,739 | - | - | - | ||||||||||||||||||||
| Foreign | Sorocaba Refrescos S.A. | Associate | Brazil | BRL | 26,014 | - | - | - | ||||||||||||||||||||
| Total | 53,637,601 | 19,777,812 | 45,827,859 | - | ||||||||||||||||||||||||
F-53
12.3 Transactions:
| Taxpayer ID | Company | Relationship | Country | Transaction Description | Currency | Accumulated 12.31.2019 | Accumulated 12.31.2018 | ||||||||
| ThCh$ | ThCh$ | ||||||||||||||
| 96.714.870-9 | Coca-Cola de Chile S.A. | Shareholders | Chile | Concentrate purchase | CLP | 150,548,253 | 149,933,143 | ||||||||
| 96.714.870-9 | Coca-Cola de Chile S.A. | Shareholders | Chile | Purchase of advertising services | CLP | 4,369,500 | 3,508,010 | ||||||||
| 96.714.870-9 | Coca-Cola de Chile S.A. | Shareholders | Chile | Water source lease | CLP | 5,324,194 | - | ||||||||
| 96.714.870-9 | Coca-Cola de Chile S.A. | Shareholders | Chile | Sale of raw materials and others | CLP | 1,196,793 | 1,156,744 | ||||||||
| 86.881.400-4 | Envases CMF S.A. | Associate | Chile | Purchase of bottles | CLP | 19,422,280 | 14,319,777 | ||||||||
| 86.881.400-4 | Envases CMF S.A. | Associate | Chile | Purchase of raw materials | CLP | 16,814,062 | 18,914,788 | ||||||||
| 86.881.400-4 | Envases CMF S.A. | Associate | Chile | Purchase of caps | CLP | 281,174 | 107,859 | ||||||||
| 86.881.400-4 | Envases CMF S.A. | Associate | Chile | Purchase of services and others | CLP | 6,425,579 | 1,593,798 | ||||||||
| 86.881.400-4 | Envases CMF S.A. | Associate | Chile | Purchase of containers | CLP | 521,466 | 4,096,502 | ||||||||
| 86.881.400-4 | Envases CMF S.A. | Associate | Chile | Sale of containers /raw materials | CLP | 6,132,091 | 3,981,631 | ||||||||
| 96.891.720-K | Embonor S.A. | Shareholder related | Chile | Sale of finished products | CLP | 50,315,292 | 41,933,095 | ||||||||
| 96.891.720-K | Embonor S.A. | Shareholder related | Chile | Sale of services and others | CLP | 268,526 | - | ||||||||
| 96.891.720-K | Embonor S.A. | Shareholder related | Chile | Minimum dividend | CLP | 212,517 | - | ||||||||
| 96.517.310-2 | Embotelladora Iquique S.A. | Shareholder related | Chile | Sale of finished products | CLP | 3,208,559 | 2,570,315 | ||||||||
| 89.996.200-1 | Envases del Pacífico S.A. | Director related | Chile | Purchase of raw materials and materials | CLP | 93,117 | 1,007,382 | ||||||||
| 94.627.000-8 | Parque Arauco S.A | Director related | Chile | Space lease | CLP | - | 91,685 | ||||||||
| Foreign | Recofarma do Indústrias Amazonas Ltda. | Shareholder related | Brazil | Concentrate purchase | BRL | 91,426,935 | 95,449,139 | ||||||||
| Foreign | Recofarma do Indústrias Amazonas Ltda. | Shareholder related | Brazil | Reimbursement and other purchases | BRL | 5,977,419 | 7,641,736 | ||||||||
| Foreign | Serv. y Prod. para Bebidas Refrescantes S.R.L. | Shareholder related | Argentina | Concentrate purchase | ARS | 97,321,567 | 98,947,407 | ||||||||
| Foreign | Serv. y Prod. para Bebidas Refrescantes S.R.L. | Shareholder related | Argentina | Advertising participation | ARS | 4,111,764 | 5,727,498 | ||||||||
| Foreign | KAIK Participações | Associate | Brazil | Reimbursement and other purchases | BRL | 39,382 | 42,292 | ||||||||
| Foreign | Sorocaba Refrescos S.A. | Associate | Brazil | Purchase of products | BRL | 1,049,709 | 698,090 | ||||||||
| Foreign | Leão Alimentos e Bebidas Ltda. | Associate | Brazil | Purchase of products | BRL | - | 357,286 | ||||||||
| 76.572.588-7 | Coca Cola Del Valle New Ventures SA | Associate | Chile | Sale of services and others | CLP | 3,959,962 | 1,391,110 | ||||||||
| Foreign | Alimentos de Soja S.A.U. | Shareholder related | Argentina | Payment of commissions and services | ARS | 802,563 | 1,623,794 | ||||||||
| Foreign | Alimentos de Soja S.A.U. | Shareholder related | Argentina | Purchase of products | ARS | 4,274,236 | - | ||||||||
| Foreign | Trop Frutas do Brasil Ltda. | Associate | Brazil | Purchase of products | BRL | - | 86,994 | ||||||||
| 96.633.550-5 | Sinea S.A. | Ownership held by an officer’s uncle | Chile | Purchase of raw materials | - | 581,508 |
F-54
| 12.4 | Salaries and benefits received by key management |
Salaries and benefits paid to the Company’s key management personnel including directors and managers are detailed as follows:
| Description | 12.31.2019 | 12.31.2018 | 12.31.2017 | |||||||||
| ThCh$ | ThCh$ | ThCh$ | ||||||||||
| Executive wages, salaries and benefits | 6,267,936 | 6,056,337 | 6,454,846 | |||||||||
| Director allowances | 1,512,000 | 1,495,123 | 1,513,100 | |||||||||
| Benefit accrued in the last five years and paid during the fiscal year | 305,674 | 242,907 | 334,477 | |||||||||
| Benefit for contract termination | 54,819 | 51,534 | - | |||||||||
| Total | 8,140,429 | 7,845,901 | 8,302,423 | |||||||||
13 – CURRENT AND NON-CURRENT EMPLOYEE BENEFITS
Employee benefits are detailed as follows:
| Description | 12.31.2019 | 12.31.2018 | ||||||
| ThCh$ | ThCh$ | |||||||
| Accrued vacation | 17,584,587 | 19,536,809 | ||||||
| Participation in profits and bonuses | 20,896,357 | 13,674,170 | ||||||
| Indemnities for years of service | 10,085,264 | 9,415,541 | ||||||
| Total | 48,566,208 | 42,626,520 | ||||||
| ThCh$ | ThCh$ | |||||||
| Current | 38,392,854 | 33,210,979 | ||||||
| Non-current | 10,173,354 | 9,415,541 | ||||||
| Total | 48,566,208 | 42,626,520 | ||||||
| 13.1 | Pensions and post-employment benefits |
The movements of employee benefits, valued pursuant to Note 2 are detailed as follows:
| Movements | 12.31.2019 | 12.31.2018 | ||||||
| ThCh$ | ThCh$ | |||||||
| Opening balance | 9,415,541 | 8,286,355 | ||||||
| Service costs | 784,984 | 957,593 | ||||||
| Interest costs | 354,471 | 565,167 | ||||||
| Actuarial losses | (210,956 | ) | 271,045 | |||||
| Benefits paid | (258,776 | ) | (664,619 | ) | ||||
| Total | 10,085,264 | 9,415,541 | ||||||
F-55
13.1.1 Assumptions
The actuarial assumptions used are detailed as follows:
| Assumptions | 12.31.2019 | 12.31.2018 | ||||||
| Discount rate | 2.7% | 2.7% | ||||||
| Expected salary increase rate | 2.0% | 2.0% | ||||||
| Turnover rate | 5.4% | 5.4% | ||||||
| Mortality rate | RV-2014 | RV-2009 | ||||||
| Retirement age of women | 60 years | 60 years | ||||||
| Retirement age of men | 65 years | 65 years | ||||||
| 13.2 | Personnel expenses |
Personnel expenses included in the consolidated statement of income are as follows:
| Description | 12.31.2019 | 12.31.2018 | 12.31.2017 | |||||||||
| ThCh$ | ThCh$ | ThCh$ | ||||||||||
| Wages and salaries | 194,740,646 | 195,162,903 | 215,715,214 | |||||||||
| Employee benefits | 58,005,213 | 50,254,164 | 50,127,117 | |||||||||
| Severance benefits | 6,987,184 | 5,535,410 | 7,410,936 | |||||||||
| Other personnel expenses | 13,389,967 | 16,014,364 | 14,205,259 | |||||||||
| Total | 273,123,010 | 266,966,841 | 287,458,526 | |||||||||
13.3 Number of employees
| Description | 12.31.2019 | 12.31.2018 | 12.31.2017 | |||||||||
| Number of employees | 16,167 | 16,098 | 15,924 | |||||||||
| Average number of employees | 15,444 | 15,364 | 15,364 | |||||||||
F-56
14 – INVESTMENTS IN ASSOCIATES ACCOUNTED FOR USING THE EQUITY METHOD
Investments in associates using equity method of accounting are detailed as follows:
| Functional | Investment value | Ownership interest | ||||||||||||||||||||
| Taxpayer ID | Company | Country | Currency | 12.31.2019 | 12.31.2018 | 12.31.2019 | 12.31.2018 | |||||||||||||||
| ThCh$ | ThCh$ | |||||||||||||||||||||
| 86.881.400-4 | Envases CMF S.A. (1) | Chile | CLP | 18,561,835 | 18,743,604 | 50.00 | % | 50.00 | % | |||||||||||||
| Foreign | Leão Alimentos e Bebidas Ltda. (2) | Brazil | BRL | 17,896,839 | 21,727,894 | 10.26 | % | 10.26 | % | |||||||||||||
| Foreign | Kaik Participações Ltda. (2) | Brazil | BRL | 1,313,498 | 1,228,256 | 11.32 | % | 11.32 | % | |||||||||||||
| Foreign | SRSA Participações Ltda. | Brazil | BRL | 65,301 | 94,706 | 40.00 | % | 40.00 | % | |||||||||||||
| Foreign | Sorocaba Refrescos S.A. | Brazil | BRL | 24,636,945 | 22,979,029 | 40.00 | % | 40.00 | % | |||||||||||||
| Foreign | Trop Frutas do Brasil Ltda. (2) | Brazil | BRL | 6,250,481 | 6,244,839 | 7.52 | % | 7.52 | % | |||||||||||||
| 76.572.588.7 | Coca-Cola del Valle New Ventures S.A. | Chile | CLP | 31,141,834 | 31,392,617 | 35.00 | % | 35.00 | % | |||||||||||||
| Total | 99,866,733 | 102,410,945 | ||||||||||||||||||||
| (1) | In Envases CMF S.A., regardless of the percentage of ownership interest, it was determined that no controlling interest was held, only a significant influence, given that there was not a majority vote of the Board of Directors to make strategic business decisions. |
| (2) | In these companies, regardless of the percentage of ownership interest held, the Company has significant influence, given that it has a representative on each entity’s Board of Directors. |
F-57
14.1 Movement
The movement of investments in other entities accounted for using the equity method is shown below:
| Description | 12.31.2019 | 12.31.2018 | 12.31.2017 | |||||||||
| Opening balance |
ThCh$
|
ThCh$ | ThCh$ | |||||||||
| 102,410,945 | 86,809,069 | 77,197,781 | ||||||||||
| Other investment increases in associates (Capital contributions to Leão Alimentos e Bebidas Ltda. and Coca-Cola del Valle New Ventures S.A.) | - | 15,615,466 | 15,570,161 | |||||||||
| Dividends received | (1,076,491 | ) | (403,414 | ) | (1,540,090 | ) | ||||||
| Share in operating income | (2,495,621 | ) | 2,194,144 | 932,340 | ||||||||
| Amortization unrealized income in associates | (919,462 | ) | 85,268 | 85,268 | ||||||||
| Increase (decrease) in foreign currency translation, investments in associates | 1,947,362 | (1,889,588 | ) | (5,436,391 | ) | |||||||
| Ending balance | 99,866,733 | 102,410,945 | 86,809,069 | |||||||||
The main movements are explained below:
| · | In December 2019, Leão Alimentos e Bebidas Ltda. performed an impairment provision at its Linhares Plant for BRL 256 million. Andina recognized as results for the 2019 fiscal year, a loss of CLP 4,671 million. | |
| · | In 2019 Sorocaba Refrescos S.A., Coca-Cola del Valle and CMF distributed dividends. | |
| · | During 2018, Embotelladora Andina S.A. made a capital contribution in Coca-Cola del Valle New Ventures S.A. for CLP 15,615,466 thousand. |
14.2 Reconciliation of share of profit in investments in associates:
| Description | 12.31.2019 | 12.31.2018 | 12.31.2017 | |||||||||
| ThCh$ | ThCh$ | ThCh$ | ||||||||||
| Share of profit of investment accounted for using the equity method | (2,495,621 | ) | 2,194,144 | 932,340 | ||||||||
| Unrealized earnings from product inventory acquired from associates and not sold at the end of the period, which is presented as a discount in the respective asset account (containers and / or inventory) | (394,490 | ) | (868,233 | ) | (1,097,968 | ) | ||||||
| Amortization goodwill in the sale of fixed assets of Envases CMF S.A. | 85,266 | 85,268 | 85,268 | |||||||||
| Amortization goodwill preferred rights CCDV S.A. | (610,238 | ) | - | - | ||||||||
| Income statement balance | (3,415,083 | ) | 1,411,179 | (80,360 | ) | |||||||
F-58
14.3 Summary financial information of associates:
The following table presents summarized information regarding the Company’s equity investees as of December 2019:
| Envases CMF S.A. |
Sorocaba Refrescos S.A. |
Kaik Participações Ltda. | SRSA Participações Ltda. |
Leão Alimentos e Bebidas Ltda. |
Trop Frutas do Brasil Ltda. |
Coca-Cola del Valle New Ventures S.A. |
||||||||||||||||||||||
| ThCh$ | ThCh$ | ThCh$ | ThCh$ | ThCh$ | ThCh$ | ThCh$ | ||||||||||||||||||||||
| Total assets | 77,994,582 | 116,551,131 | 11,661,828 | 393,856 | 248,493,994 | 104,778,397 | 107,388,847 | |||||||||||||||||||||
| Total liabilities | 39,826,283 | 54,650,105 | 35 | 229,780 | 38,137,061 | 27,158,470 | 18,693,717 | |||||||||||||||||||||
| Total revenue | 58,640,058 | 69,343,990 | 337,450 | 160,342 | 139,769,189 | 47,252,571 | 31,914,825 | |||||||||||||||||||||
| Net income (loss) of associate | 1,449,997 | 3,948,798 | 337,450 | 160,342 | 2,320,841 | (1,177,262 | ) | 4,297,003 | ||||||||||||||||||||
| Reporting date | 12.31.2019 | 11.30.2019 | 11.30.2019 | 11.30.2019 | 11.30.2019 | 11.30.2019 | 11.30.2019 | |||||||||||||||||||||
The following table presents summarized information regarding the Company’s equity investees as of December 2018:
| Envases CMF S.A. |
Sorocaba Refrescos S.A. |
Kaik Participações Ltda. | SRSA Participações Ltda. |
Leão Alimentos e Bebidas Ltda. |
Trop Frutas do Brasil Ltda. |
Coca-Cola del Valle New Ventures S.A. |
||||||||||||||||||||||
| ThCh$ | ThCh$ | ThCh$ | ThCh$ | ThCh$ | ThCh$ | ThCh$ | ||||||||||||||||||||||
| otal assets | 78,714,139 | 106,598,837 | 10,850,626 | 513,823 | 257,149,411 | 96,963,355 | 101,275,213 | |||||||||||||||||||||
| Total liabilities | 40,800,603 | 49,151,318 | 34 | 277,055 | 57,538,296 | 21,568,158 | 11,582,021 | |||||||||||||||||||||
| Total revenue | 53,073,645 | 57,570,452 | 348,705 | 233,182 | 161,749,228 | 12,169,188 | 2,673,496 | |||||||||||||||||||||
| Net income (loss) of associate | 1,086,050 | 936,360 | 348,705 | 233,182 | 2,000,217 | 7,753,517 | 1,506,540 | |||||||||||||||||||||
| Reporting date | 12-31.2018 | 11-30-2018 | 11-30-2018 | 11-30-2018 | 11-30-2018 | 11-30-2018 | 12-31-2018 | |||||||||||||||||||||
F-59
15 - INTANGIBLE ASSETS OTHER THAN GOODWILL
Intangible assets other than goodwill are detailed as follows:
| December 31, 2019 | December 31, 2018 | |||||||||||||||||||||||
| Gross | Accumulated | Net | Gross | Accumulated | Net | |||||||||||||||||||
| Description | Value | Amortization | Value | Value | Amortization | Value | ||||||||||||||||||
| ThCh$ | ThCh$ | ThCh$ | ThCh$ | ThCh$ | ThCh$ | |||||||||||||||||||
| Distribution rights (1) | 667,148,383 | (393,187 | ) | 666,755,196 | 661,285,834 | (259,434 | ) | 661,026,400 | ||||||||||||||||
| Software | 34,347,843 | (26,484,427 | ) | 7,863,416 | 31,526,159 | (24,160,202 | ) | 7,365,957 | ||||||||||||||||
| Others | 750,309 | (293,546 | ) | 456,763 | 728,198 | (298,002 | ) | 430,196 | ||||||||||||||||
| Total | 702,246,535 | (27,171,160 | ) | 675,075,375 | 693,540,191 | (24,717,638 | ) | 668,822,553 | ||||||||||||||||
| (1) | Correspond to the contractual rights to produce and distribute Coca-Cola products in certain parts of Argentina, Brazil, Chile and Paraguay. Distribution rights result from the valuation process at fair value of the assets and liabilities of the companies acquired in business combinations. Production and distribution contracts are renewable for periods of 5 years with Coca-Cola. The nature of the business and renewals that Coca-Cola has permanently done on these rights, allow qualifying them as indefinite contracts. |
F-60
The distribution rights together with the assets that are part of the cash-generating units, are annually subjected to the impairment test. Such distribution rights have an indefinite useful life and are not subject to amortization: except for the Monster rights that are amortized in the term of the agreement which is 4 years.
| Distribution rights | 12.31.2019 | 12.31.2018 | ||||||
| ThCh$ | ThCh$ | |||||||
| Chile (excluding Metropolitan Region, Rancagua and San Antonio) | 305,235,247 | 304,888,183 | ||||||
| Brazil (Rio de Janeiro, Espirito Santo, Ribeirão Preto and investments in Sorocaba y Leão Alimentos e Bebidas Ltda.) | 187,616,890 | 181,583,404 | ||||||
| Paraguay | 171,841,663 | 172,594,328 | ||||||
| Argentina (North and South) | 2,061,396 | 1,960,485 | ||||||
| Total | 666,755,196 | 661,026,400 | ||||||
The movement and balances of identifiable intangible assets are detailed as follows:
| January 1 to December 31, 2019 | January 1 to December 31, 2018 | |||||||||||||||||||||||||||||||
| Distribution | Distribution | |||||||||||||||||||||||||||||||
| Description | Rights | Others | Software | Total | Rights | Others | Software | Total | ||||||||||||||||||||||||
| THCH$ | THCH$ | THCH$ | THCH$ | THCH$ | THCH$ | THCH$ | THCH$ | |||||||||||||||||||||||||
| Opening balance | 661,026,400 | 430,196 | 7,365,957 | 668,822,553 | 656,294,617 | 470,918 | 6,507,343 | 663,272,878 | ||||||||||||||||||||||||
| Additions | - | - | 3,296,558 | 3,296,558 | - | - | 3,718,038 | 3,718,038 | ||||||||||||||||||||||||
| Amortization | (133,753 | ) | - | (2,324,225 | ) | (2,457,978 | ) | (112,601 | ) | (40,722 | ) | (1,971,417 | ) | (2,124,740 | ) | |||||||||||||||||
| Other increases (decreases) (1) | 5,862,549 | 26,567 | (474,874 | ) | 5,414,242 | 4,844,384 | - | (888,007 | ) | 3,956,377 | ||||||||||||||||||||||
| Ending balance | 666,755,196 | 456,763 | 7,863,416 | 675,075,375 | 661,026,400 | 430,196 | 7,365,957 | 668,822,553 | ||||||||||||||||||||||||
| (1) | Mainly corresponds to restatement due to the effects of translation of distribution rights of foreign subsidiaries. |
F-61
Movement in Goodwill is detailed as follows:
| Operating segment | 01.01.2019 | Foreign currency translation differences where functional currency is different from presentation currency and hyperinflation | 12.31.2019 | |||||||||
| ThCh$ | ThCh$ | ThCh$ | ||||||||||
| Chilean operation | 8,503,023 | - | 8,503,023 | |||||||||
| Brazilian operation | 73,080,100 | 2,593,972 | 75,674,072 | |||||||||
| Argentine operation | 28,318,129 | 1,432,109 | 29,750,238 | |||||||||
| Paraguayan operation | 7,327,921 | (33,593 | ) | 7,294,328 | ||||||||
| Total | 117,229,173 | 3,992,488 | 121,221,661 | |||||||||
| Operating segment | 01.01.2018 | Foreign currency translation differences where functional currency is different from presentation currency and hyperinflation | 12.31.2018 | |||||||||
| ThCh$ | ThCh$ | ThCh$ | ||||||||||
| Chilean operation | 8,503,023 | - | 8,503,023 | |||||||||
| Brazilian operation | 73,509,080 | (428,980 | ) | 73,080,100 | ||||||||
| Argentine operation | 4,672,971 | 23,645,158 | 28,318,129 | |||||||||
| Paraguayan operation | 6,913,143 | 414,778 | 7,327,921 | |||||||||
| Total | 93,598,217 | 23,630,956 | 117,229,173 | |||||||||
| Operating segment | 01.01.2017 | Foreign currency translation differences where functional currency is different from presentation currency and hyperinflation | 12.31.2017 | |||||||||
| ThCh$ | ThCh$ | ThCh$ | ||||||||||
| Chilean operation | 8,503,023 | - | 8,503,023 | |||||||||
| Brazilian operation | 81,145,834 | (7,636,754 | ) | 73,509,080 | ||||||||
| Argentine operation | 5,972,515 | (1,299,544 | ) | 4,672,971 | ||||||||
| Paraguayan operation | 7,298,133 | (384,990 | ) | 6,913,143 | ||||||||
| Total | 102,919,505 | (9,321,288 | ) | 93,598,217 | ||||||||
17 – OTHER CURRENT AND NON-CURRENT FINANCIAL LIABILITIES
Liabilities are detailed as follows:
| Balance | ||||||||||||||||
| Current | Non-current | |||||||||||||||
| 12.31.2019 | 12.31.2018 | 12.31.2019 | 12.31.2018 | |||||||||||||
| ThCh$ | ThCh$ | ThCh$ | ThCh$ | |||||||||||||
| Bank loans (17.1.1 – 2) | 1,438,161 | 21,542,736 | 909,486 | 2,439,253 | ||||||||||||
| Bonds payable, net1 (17.2) | 21,604,601 | 20,664,481 | 718,962,871 | 700,327,057 | ||||||||||||
| Deposits in guarantee | 11,163,005 | 12,242,464 | - | - | ||||||||||||
| Derivative contract liabilities (see note 22) | 374,576 | 130,829 | - | - | ||||||||||||
| Leasing agreements (17.4.1 – 2) | 6,013,535 | 1,534,467 | 23,454,700 | 13,797,468 | ||||||||||||
| Total | 40,593,878 | 56,114,977 | 743,327,057 | 716,563,778 | ||||||||||||
1 Amounts net of placement expenses and discounts related to placement
F-62
The fair value of financial assets and liabilities is presented below:
| Current | Book Value 12.31.2019 | Fair Value 12.31.2019 | Book Value 12.31.2018 | Fair Value 12.31.2018 | |||||||||||
| THCH$ | THCH$ | THCH$ | THCH$ | ||||||||||||
| Cash and cash equivalent (2) | 157,567,986 | 157,567,986 | 137,538,613 | 137,538,613 | |||||||||||
| Other financial assets (1) | 317,205 | 317,205 | 669,527 | 669,527 | |||||||||||
| Trade debtors and other accounts receivable (2) | 191,077,588 | 191,077,588 | 174,113,323 | 174,113,323 | |||||||||||
| Accounts receivable related companies (2) | 10,619,740 | 10,619,740 | 9,450,263 | 9,450,263 | |||||||||||
| Bank loans (2) | 1,438,161 | 1,434,255 | 21,542,736 | 21,542,736 | |||||||||||
| Bonds payable (2) | 21,604,601 | 24,188,060 | 20,664,481 | 20,664,481 | |||||||||||
| Bottle guaranty deposits (2) | 11,163,005 | 11,163,005 | 12,242,464 | 12,242,464 | |||||||||||
| Derivative contracts liabilities (see note 20) (1) | 374,576 | 374,576 | 130,829 | 130,829 | |||||||||||
| Leasing agreements (2) | 6,013,535 | 6,013,535 | 1,534,467 | 1,534,467 | |||||||||||
| Accounts payable (2) | 243,700,553 | 243,700,553 | 238,109,847 | 238,109,847 | |||||||||||
| Accounts payable related companies (2) | 53,637,601 | 53,637,601 | 45,827,859 | 45,827,859 | |||||||||||
| Non-current | 12.31.2019 | 12.31.2019 | 12.31.2018 | 12.31.2018 | ||||||||||||
| THCH$ | THCH$ | THCH$ | THCH$ | |||||||||||||
| Other financial assets (1) | 98,918,457 | 98,918,457 | 97,362,295 | 97,362,295 | ||||||||||||
| Accounts receivable, non-current (2) | 523,769 | 523,769 | 1,270,697 | 1,270,697 | ||||||||||||
| Accounts receivable related companies (2) | 283,118 | 283,118 | 74,340 | 74,340 | ||||||||||||
| Bank loans (2) | 909,486 | 867,025 | 2,439,253 | 2,307,396 | ||||||||||||
| Bonds payable (2) | 718,962,871 | 803,017,145 | 700,327,057 | 755,694,265 | ||||||||||||
| Leasing agreements (2) | 23,454,700 | 23,454,700 | 13,797,468 | 13,797,468 | ||||||||||||
| Accounts payable, non-current (2) | 619,587 | 619,587 | 735,665 | 735,665 | ||||||||||||
| (1) | Fair values are based on discounted cash flows using market discount rates at the close of the six-month and one-year period and are classified as Level 2 of the fair value measurement hierarchies. |
| (2) | Financial instruments such as: Cash and Cash Equivalents, Trade and Other Accounts Receivable, Accounts Receivable, Bottle Guarantee Deposits and Trade Accounts Payable, and Other Accounts Payable present a fair value that approximates their carrying value, considering the nature and term of the obligation. The business model is to maintain the financial instrument in order to collect/pay contractual cash flows, in accordance with the terms of the contract, where cash flows are received/cancelled on specific dates that exclusively constitute payments of principal plus interest on that principal. These instruments are revalued at amortized cost. |
F-63
17.1.1 Bank obligations, current
| Maturity | Total | |||||||||||||||||||||||||||||||||||||
| Indebted entity | Creditor entity | Type of | Effective | Nominal | Up to | 90 days to | at | at | ||||||||||||||||||||||||||||||
| Tax ID | Name | Country | Tax ID | Name | Country | Currency | Amortization | Rate | Rate | 90 days | 1 year | 12.31.2019 | 12.31.2018 | |||||||||||||||||||||||||
| THCH$ | THCH$ | THCH$ | THCH$ | |||||||||||||||||||||||||||||||||||
| 96.705.990-0 | Envases Central S.A. | Chile | 97.006.000-6 | Banco BCI | Chile | UF | Semiannually | 2.13 | % | 2.13 | % | 374,419 | 374,419 | 748,838 | 726,943 | |||||||||||||||||||||||
| Foreign | Embotelladora del Atlántico S.A. | Argentina | Foreign | Banco de la Nación Argentina | Argentina | ARS | Monthly | 20.00 | % | 20.00 | % | - | - | - | 1,071 | |||||||||||||||||||||||
| Foreign | Embotelladora del Atlántico S.A. | Argentina | Foreign | Banco Galicia y Buenos Aires S.A. | Argentina | ARS | Upon maturity | 82.00 | % | 82.00 | % | 8,453 | - | 8,453 | - | |||||||||||||||||||||||
| Foreign | Rio de Janeiro Refrescos Ltda. | Brazil | Foreign | Banco Itaú | Brazil | BRL | Monthly | 6.63 | % | 6.63 | % | 635,727 | - | 635,727 | 171,415 | |||||||||||||||||||||||
| Foreign | Rio de Janeiro Refrescos Ltda. | Brazil | Foreign | Banco Santander | Brazil | BRL | Monthly | 7.15 | % | 7.15 | % | - | - | - | 277,517 | |||||||||||||||||||||||
| Foreign | Rio de Janeiro Refrescos Ltda. | Brazil | Foreign | Banco Itaú | Brazil | BRL | Quarterly | 4.50 | % | 4.50 | % | 11,678 | 33,465 | 45,143 | 2,455,578 | |||||||||||||||||||||||
| Foreign | Rio de Janeiro Refrescos Ltda. | Brazil | Foreign | Banco Santander | Brazil | BRL | Quarterly | 6.24 | % | 6.24 | % | - | - | - | 17,910,212 | |||||||||||||||||||||||
| Total | 1,438,161 | 21,542,736 | ||||||||||||||||||||||||||||||||||||
17.1.2 Bank obligations, non-current
| Maturity | ||||||||||||||||||||||||||||||||||||||||||||||
| Indebted Entity | Creditor Entity | Type | Effective | Nominal | 1
year up to | More
than 2 years | More
than 3 years | More
than 4 years | More than 5 | at | ||||||||||||||||||||||||||||||||||||
| Tax ID | Name | Country | Tax ID | Name | Country | Currency | Amortization | Rate | Rate | 2 years | Up to 3 years | Up to 4 years | Up to 5 years | Years | 12.31.2019 | |||||||||||||||||||||||||||||||
| ThCh$ | ThCh$ | ThCh$ | ThCh$ | ThCh$ | ThCh$ | |||||||||||||||||||||||||||||||||||||||||
| 96.705.990-0 | Envases Central S.A. | Chile | 97.006.000-6 | Banco BCI | Chile | UF | Semiannually | 2.13 | % | 2.13 | % | 736,033 | - | - | - | - | 736,033 | |||||||||||||||||||||||||||||
| Foreign | Rio de Janeiro Refrescos Ltda. | Brazil | Foreign | Banco Itaú | Brazil | BRL | Monthly | 6.63 | % | 6.63 | % | 44,621 | 44,621 | 44,621 | 39,590 | - | 173,453 | |||||||||||||||||||||||||||||
| Total | 909,486 | |||||||||||||||||||||||||||||||||||||||||||||
F-64
17.1.2 Bank obligations, non-current previous
| Maturity | |||||||||||||||||||||||||||||||||||||||||
| Indebted Entity | Creditor Entity | Type of | Effective | Nominal | 1 year to | More than 2 | More than | More than 4 | More than 5 | At | |||||||||||||||||||||||||||||||
| Tax ID | Name | Country | Tax ID | Name | Country | Currency | Amortization | Rate | Rate | 2 years | Up to 3 years | Up to 4 years | Up to 5 years | years | 12.31.2018 | ||||||||||||||||||||||||||
| THCH$ | THCH$ | THCH$ | THCH$ | THCH$ | THCH$ | ||||||||||||||||||||||||||||||||||||
| 96.705.990-0 | Envases Central S.A. | Chile | 97.006.000-6 | Banco BCI | Chile | UF | Semiannually | 2.1 | % | 2.1 | % | 1,434,786 | - | - | - | - | 1,434,786 | ||||||||||||||||||||||||
| Foreign | Rio de Janeiro Refrescos Ltda. | Brazil | Foreign | Banco Itaú | Brazil | BRL | Monthly | 6.6 | % | 6.6 | % | 72,439 | 43,033 | 43,033 | 81,225 | - | 239,730 | ||||||||||||||||||||||||
| Foreign | Rio de Janeiro Refrescos Ltda. | Brazil | Foreign | Banco Santander | Brazil | BRL | Monthly | 7.2 | % | 7.2 | % | 151,873 | - | - | - | - | 151,873 | ||||||||||||||||||||||||
| Foreign | Rio de Janeiro Refrescos Ltda. | Brazil | Foreign | Banco Santander | Brazil | BRL | Quarterly | 6.2 | % | 6.2 | % | - | - | - | - | - | - | ||||||||||||||||||||||||
| Foreign | Rio de Janeiro Refrescos Ltda. | Brazil | Foreign | Banco Itaú | Brazil | BRL | Quarterly | 4.5 | % | 4.5 | % | 612,864 | - | - | - | - | 612,864 | ||||||||||||||||||||||||
| Total | 2,439,253 | ||||||||||||||||||||||||||||||||||||||||
17.1.3 Current and non-current bank obligations “Restrictions”
Bank obligations are not subject to restrictions for the reported periods.
F-65
17.2 Bonds payable
During 2018, Andina carried out a debt restructuring process that consisted of a partial repurchase in the amount of USD 210 million of the 144A/RegS Senior Notes and refinancing it with the placement of Series F bonds in the local market in the amount of UF 5.7 million due 2039 and accruing an annual interest rate of 2.83%. The costs corresponding to the repurchase of bonds, associated with premium payments, overpricing and proportional amortization of placement costs and discounts in bonds in original U.S. Dollars amounting to CLP 9,583,000 thousand, were recorded in results under the item financial costs.
| Current | Non-current | Total | ||||||||||||||||||||||
| Composition of bonds payable | 12.31.2019 | 12.31.2018 | 12.31.2019 | 12.31.2018 | 12.31.2019 | 12.31.2018 | ||||||||||||||||||
| ThCh$ | ThCh$ | ThCh$ | ThCh$ | ThCh$ | ThCh$ | |||||||||||||||||||
| Bonds (face value) 2 | 22,189,595, | 21,038,064 | 721,950,553 | 704,048,747 | 744,140,148 | 725,086,811 | ||||||||||||||||||
17.2.1 Current and non-current balances
Bonds payable correspond to bonds in UF issued by the parent company on the Chilean market and bonds in U.S. dollars issued by the Parent Company on the international market. A detail of these instruments is presented below:
| Current | Non-current | |||||||||||||||||||||||||||||||||
| Bonds | Series | Current Nominal amount | Adjustment Unit | Interest Rate | Final Maturity | Interest
payment | 12.31.2019 | 12.31.2018 | 12.31.2019 | 12.31.2018 | ||||||||||||||||||||||||
| ThCh$ | ThCh$ | ThCh$ | ThCh$ | |||||||||||||||||||||||||||||||
| CMF Registration N°254 06.13.2001 | B | 1,891,186 | UF | 6.5 | % | 06-01-2026 | Semi-annually | 7,160,809 | 6,598,389 | 46,659,296 | 52,132,023 | |||||||||||||||||||||||
| CMF Registration N°641 08.23.2010 | C | 1,500,000 | UF | 4.0 | % | 08-15-2031 | Semi-annually | 630,731 | 614,152 | 42,464,910 | 41,348,685 | |||||||||||||||||||||||
| CMF Registration N°759 08.20.2013 | C | 250,000 | UF | 3.5 | % | 08-16-2020 | Semi-annually | 7,168,907 | 7,069,487 | - | 6,891,448 | |||||||||||||||||||||||
| CMF Registration N°760 08.20.2013 | D | 4,000,000 | UF | 3.8 | % | 08-16-2034 | Semi-annually | 1,587,051 | 1,545,334 | 113,239,760 | 110,263,160 | |||||||||||||||||||||||
| CMF Registration N°760 04.02.2014 | E | 3,000,000 | UF | 3.75 | % | 03-01-2035 | Semi-annually | 1,048,938 | 1,027,009 | 84,929,828 | 82,697,378 | |||||||||||||||||||||||
| CMF Registration N°912 10.10.2018 | F | 5,700,000 | UF | 2.83 | % | 09-25-2039 | Semi-annually | 1,195,700 | 1,013,805 | 161,366,658 | 157,125,003 | |||||||||||||||||||||||
| Bonds USA | - | 365,000,000 | USD | 5.0 | % | 10-01-2023 | Semi-annually | 3,397,459 | 3,169,888 | 273,290,101 | 253,591,050 | |||||||||||||||||||||||
| Total | 22,189,595 | 21,038,064 | 721,950,553 | 704,048,747 | ||||||||||||||||||||||||||||||
Accrued interest included in the current portion of bonds payable as of December 31, 2019 and 2018 amounts to CLP 7,983,770 thousand and CLP 7,856,274 thousand, respectively.
2 Amounts gross, not consider placement expenses and discounts related to placement
F-66
17.2.3 Non-current maturities
| Year of maturity | Total non- current | |||||||||||||||||||||||
| Series | more than 1 to 2 | more than 2 to 3 | more than 3 to 4 | More than 5 | 12.31.2019 | |||||||||||||||||||
| ThCh$ | ThCh$ | ThCh$ | ThCh$ | ThCh$ | ||||||||||||||||||||
| CMF Registration N°254 06.13.2001 | B | 7,327,269 | 7,803,536 | 8,310,767 | 23,217,724 | 46,659,296 | ||||||||||||||||||
| CMF Registration N°641 08.23.2010 | C | 3,860,446 | 3,860,446 | 3,860,447 | 30,883,571 | 42,464,910 | ||||||||||||||||||
| CMF Registration N°760 08.20.2013 | D | - | - | - | 113,239,760 | 113,239,760 | ||||||||||||||||||
| CMF Registration N°760 04.02.2014 | E | - | - | - | 84,929,828 | 84,929,828 | ||||||||||||||||||
| CMF Registration N°912 10.10.2018 | F | - | - | - | 161,366,658 | 161,366,658 | ||||||||||||||||||
| Bonds USA | - | - | - | 273,290,101 | - | 273,290,101 | ||||||||||||||||||
| Total | 11,187,715 | 11,663,982 | 285,461,315 | 413,637,541 | 721,950,553 | |||||||||||||||||||
17.2.4 Market rating
The bonds issued on the Chilean market had the following rating:
AA : ICR Compañía Clasificadora de Riesgo Ltda. rating
AA : Fitch Chile Clasificadora de Riesgo Limitada rating
The rating of bonds issued on the international market had the following rating:
BBB : Standard&Poors Global Ratings
BBB+ : Fitch Ratings Inc.
17.2.5 Restrictions
17.2.5.1 Restrictions regarding bonds placed abroad.
Obligations with bonds placed abroad are not affected by financial restrictions for the periods reported
17.2.5.2 Restrictions regarding bonds placed in the local market.
For purposes of the calculation of the covenants, the amount of EBITDA that was agreed on each bond issue is included.
Restrictions on the issuance of bonds for a fixed amount registered under number 254.
| · | Maintain an indebtedness level where Consolidated Financial Liabilities to Consolidated Equity does not exceed 1.20 times. For these purposes Consolidated Financial Liabilities shall be regarded as Liabilities Receivables accruing interest, namely: (i) other current financial liabilities, plus (ii) other non-current financial liabilities, less (iii) asset balances of derivative financial instruments, taken to cover exchange rate or interest rate risks on financial liabilities under "Other Current Financial Assets" and "Other non-current Financial Assets" of the Issuer’s Consolidated Financial Statements. Consolidated Equity will be regarded as total equity including non-controlling interest. |
F-67
As of December 31, 2019, indebtedness level is 0.71 times of Consolidated Equity.
| · | Maintain, and in no manner lose, sell, assign or transfer to a third party, the geographical area currently denominated as the “Metropolitan Region” (Región Metropolitana) as a territory in Chile in which we have been authorized by The Coca-Cola Company for the development, production, sale and distribution of products and brands of the licensor, in accordance to the respective bottler or license agreement, renewable from time to time. |
| · | Not lose, sell, assign, or transfer to a third party any other territory of Argentina or Brazil, which as of this date is franchised by TCCC to the Company for the development, production, sale and distribution of products and brands of such licensor, as long as any of these territories account for more than 40% of the Issuer's Adjusted Consolidated Operating Cash Flow. |
| · | Maintain consolidated assets free of any pledge, mortgage or other encumbrances for an amount at least equal to 1.3 times of the issuer’s unsecured consolidated liabilities. |
Unsecured consolidated liabilities payable shall be regarded as the total liabilities, obligations and debts of the issuer that are not secured by real guarantees on goods and assets of the latter, voluntarily and conventionally constituted by the issuer less the asset balances of derivative financial instruments, taken to cover exchange rate or interest rate risks on financial liabilities under "Other Current Financial Assets" and "Other non-current Financial Assets" of the Issuer’s Consolidated Statement of Financial Position.
Consolidated Assets free of any pledge, mortgage or other lien will only be regarded as those assets free of any pledge, mortgage or other real lien voluntarily and conventionally constituted by the issuer less asset balances of derivative financial instruments, taken to cover exchange rate or interest rate risks on financial liabilities and under "Other Current Financial Assets" and "Other non-current Financial Assets" of the Issuer’s Consolidated Statement of Financial Position.
As of December 31, 2019, this ratio is 1.71 times.
Restrictions to bond lines registered in the Securities Registered under number 641.
| · | Maintain a level of "Net Financial Debt" within its quarterly financial statements that may not exceed 1.5 times, measured over figures included in its consolidated statement of financial position. To this end, net financial debt shall be defined as the ratio between net financial debt and total equity of the issuer (equity attributable to controlling owners plus non-controlling interest). On its part, net financial debt will be the difference between the Issuer's financial debt and cash. |
As of December 31, 2019, Net Financial Debt level was 0.66 times.
| · | Maintain consolidated assets free of any pledge, mortgage or other encumbrances for an amount at least equal to 1.3 times of the issuer’s unsecured consolidated liabilities. |
Unencumbered assets refer to the assets that are the property of the issuer; classified under Total Assets of the Issuer’s Financial Statements; and that are free of any pledge, mortgage or other liens constituted in favor of third parties, less "Other Current Financial Assets" and "Other Non-Current Financial Assets" of the Issuer’s Financial Statements (to the extent they correspond to asset balances of derivative financial instruments, taken to hedge exchange rate and interest rate risk of the financial liabilities).
Unsecured total liabilities correspond to: liabilities from Total Current Liabilities and Total Non-Current Liabilities of Issuer’s Financial Statement which do not benefit from preferences or privileges, less "Other Current Financial Assets" and "Other Non-Current Financial Assets" of the Issuer’s Financial Statements (to the extent they correspond to asset balances of derivative financial instruments, taken to hedge exchange rate and interest rate risk of the financial liabilities).
F-68
As of December 31, 2019, this ratio is 1.71 times.
| · | Maintain a level of "Financial net coverage" in its quarterly financial statements of more than 3 times. Net financial coverage means the ratio between the Issuer's Ebitda for the past 12 months and net financial expenses (financial income less financial expenses) of the issuer for the past 12 months. However, this restriction will be considered breached when the mentioned net financial coverage level is lower than the level previously indicated during two consecutive quarters. |
As of December 31, 2019, Net Financial Coverage level is 306.38 times.
Restrictions to bond lines registered in the Securities Registrar under numbers 759 and 760 D-E.
| · | Maintain an indebtedness level where Consolidated Financial Liabilities to Consolidated Equity does not exceed 1.20 times. For these purposes Consolidated Financial Liabilities shall be regarded as Liabilities Receivables accruing interest, namely: (i) other current financial liabilities, plus (ii) other non-current financial liabilities, less (iii) cash and cash equivalent and (iv) other current financial assets, and (v) other non-current financial assets (to the extent they are asset balances of derivative financial instruments, taken to hedge exchange rate or interest rate risks on financial liabilities). Consolidated Equity will be regarded as total equity including non-controlling interest. |
As of December 31, 2019, Indebtedness Level is 0.54 times of Consolidated Equity.
| · | Maintain consolidated assets free of any pledge, mortgage or other encumbrances for an amount at least equal to 1.3 times of the issuer’s unsecured consolidated liabilities payable. |
Unsecured Consolidated Liabilities Payable shall be regarded as the total liabilities, obligations and debts of the issuer that are not secured by real guarantees on goods and assets of the latter, voluntarily and conventionally constituted by the issuer less the asset balances of derivative financial instruments, taken to cover exchange rate or interest rate risks on financial liabilities under "Other Current Financial Assets" and "Other non-current Financial Assets" of the Issuer’s Consolidated Statement of Financial Position.
The following will be considered in determining Consolidated Assets: assets free of any pledge, mortgage or other lien, as well as those assets having a pledge, mortgage or real encumbrances that operate solely by law, less asset balances of derivative financial instruments, taken to hedge exchange rate or interest rate risks on financial liabilities under "Other Current Financial Assets" and "Other non-current Financial Assets" of the Issuer’s Consolidated Financial Statements. Therefore, Consolidated Assets free of any pledge, mortgage or other lien will only be regarded as those assets free of any pledge, mortgage or other real lien voluntarily and conventionally constituted by the issuer less asset balances of derivative financial instruments, taken to cover exchange rate or interest rate risks on financial liabilities and under "Other Current Financial Assets" and "Other non-current Financial Assets" of the Issuer’s Consolidated Statement of Financial Position.
As of December 31, 2019, this ratio is 1.71 times.
| · | Maintain, and in no manner, lose, sell, assign or transfer to a third party, the geographical area currently denominated as the “Metropolitan Region” as a territory franchised to the Issuer in Chile by The Coca-Cola Company, hereinafter also referred to as "TCCC" or the "Licensor" for the development, production, sale and distribution of products and brands of said licensor, in accordance to the respective bottler or license agreement, renewable from time to time. Losing said territory, means the non-renewal, early termination or cancellation of this license agreement by TCCC, for the geographical area today called "Metropolitan Region". This reason shall not apply if, as a result of the loss, sale, transfer or disposition, of that licensed territory is purchased or acquired by a subsidiary or an entity that consolidates in terms of accounting with the Issuer. |
| · | Not lose, sell, assign, or transfer to a third party any other territory of Argentina or Brazil, which as of the issuance date of these instruments is franchised by TCCC to the Issuer for the development, production, sale and distribution of products and brands of such licensor, as long as any of these territories account for more than 40% of the Issuer's Adjusted Consolidated Operating Cash Flow of the audited period immediately before the moment of loss, sale, assignment or transfer. For these purposes, the term "Adjusted Consolidated Operating Cash Flow" shall mean the addition of the following accounting accounts of the Issuer's Consolidated Statement of Financial Position: (i) "Gross Profit" which includes regular activities and cost of sales; less (ii) "Distribution Costs"; less (iii) "Administrative Expenses"; plus (iv) "Participation in profits (losses) of associates and joint ventures that are accounted for using the equity method"; plus (v) "Depreciation"; plus (vi) "Intangibles Amortization". |
F-69
Restrictions to bond lines registered in the Securities Registrar under number 912.
| · | Maintain an indebtedness level where Consolidated Financial Liabilities to Consolidated Equity does not exceed 1.20 times. |
For these purposes Consolidated Financial Liabilities shall be regarded as Liabilities Receivables accruing interest, namely: (i) other current financial liabilities, plus (ii) other non-current financial liabilities, less (iii) cash and cash equivalent and (iv) other current financial assets, and (v) other non-current financial assets (to the extent they are asset balances of derivative financial instruments, taken to hedge exchange rate or interest rate risks on financial liabilities). Consolidated Equity will be regarded as total equity including non-controlling interest.
As of December 31, 2019, this ratio equals 0.65 times.
| · | Maintain consolidated assets free of any pledge, mortgage or other encumbrances for an amount at least equal to 1.3 times of the issuer’s unsecured consolidated liabilities payable. |
Unsecured Consolidated Liabilities Payable shall be regarded as the total liabilities, obligations and debts of the issuer that are not secured by real guarantees on goods and assets of the latter, voluntarily and conventionally constituted by the issuer less the asset balances of derivative financial instruments, taken to cover exchange rate or interest rate risks on financial liabilities under "Other Current Financial Assets" and "Other non-current Financial Assets" of the Issuer’s Consolidated Statement of Financial Position.
The following will be considered in determining Consolidated Assets: assets free of any pledge, mortgage or other lien, as well as those assets having a pledge, mortgage or real encumbrances that operate solely by law, less asset balances of derivative financial instruments, taken to hedge exchange rate or interest rate risks on financial liabilities under "Other Current Financial Assets" and "Other non-current Financial Assets" of the Issuer’s Consolidated Financial Statements. Therefore, Consolidated Assets free of any pledge, mortgage or other lien will only be regarded as those assets free of any pledge, mortgage or other real lien voluntarily and conventionally constituted by the issuer less asset balances of derivative financial instruments, taken to cover exchange rate or interest rate risks on financial liabilities and under "Other Current Financial Assets" and "Other non-current Financial Assets" of the Issuer’s Consolidated Statement of Financial Position.
As of December 31, 2019, this ratio equals 1.71 times.
| · | Not lose, sell, assign, or transfer to a third party any other territory of Argentina or Brazil, which as of the issuance date of local bonds Series C, D and E is franchised by TCCC to the Issuer for the development, production, sale and distribution of products and brands of such licensor, as long as any of these territories account for more than 40% of the Issuer's Adjusted Consolidated Operating Cash Flow of the audited period immediately before the moment of loss, sale, assignment or transfer. For these purposes, the term "Adjusted Consolidated Operating Cash Flow" shall mean the addition of the following accounting accounts of the Issuer's Consolidated Statement of Financial Position: (i) "Gross Profit" which includes regular activities and cost of sales; less (ii) "Distribution Costs"; less (iii) "Administrative Expenses"; plus (iv) "Participation in profits (losses) of associates and joint ventures that are accounted for using the equity method"; plus (v) "Depreciation"; plus (vi) "Intangibles Amortization". |
As of December 31, 2018, the Company complies with all financial collaterals.
F-70
17.2.6 Repurchased bonds
In addition to UF bonds, the Company holds bonds that it has repurchased in full through companies that are included in the consolidation:
The subsidiary Rio de Janeiro Refrescos Ltda. maintains a liability corresponding to a bond issuance for US $75 million due in December 2020 and semi-annual interest payments. As of December 31, 2019, these issues are held by Andina. On January 1, 2013, Abisa Corp S.A. transferred the totality of this asset to Embotelladora are Andina S.A., the latter becoming the creditor of the above-mentioned Brazilian subsidiary. Consequently, the assets and liabilities related to the transaction have been eliminated from these Consolidated Financial Statements. In addition, the transaction has been treated as a net investment of the group in the Brazilian subsidiary; consequently, the effects of exchange rate differences between the dollar and the functional currency of each one has been recorded in other comprehensive income.
17.3 Derivative contract obligations
Please see details in Note 22
F-71
17.4.1 Current liabilities for leasing agreements
| Maturity | Total | ||||||||||||||||||||||||||||||||||||
| Indebted Entity | Creditor Entity | Type of | Effective | Nominal | Up to | 90 days up to | At | At | |||||||||||||||||||||||||||||
| Name | Country | Tax ID | Name | Country | Currency | Amortization | Rate | Rate | 90 days | 1 year | 12.31.2019 | 12.31.2018 | |||||||||||||||||||||||||
| THCH$ | THCH$ | THCH$ | THCH$ | ||||||||||||||||||||||||||||||||||
| Rio de Janeiro Refrescos Ltda. | Brazil | Foreign | Banco Santander | Brazil | BRL | Monthly | 9.65 | % | 9.47 | % | - | - | - | 11,996 | |||||||||||||||||||||||
| Rio de Janeiro Refrescos Ltda. | Brazil | Foreign | Citibank | Brazil | BRL | Monthly | 8.54 | % | 8.52 | % | - | - | - | 75,260 | |||||||||||||||||||||||
| Rio de Janeiro Refrescos Ltda. | Brazil | Foreign | Cogeração - Light ESCO | Brazil | BRL | Monthly | 13.00 | % | 12.28 | % | 200,472 | 639,030 | 839,502 | 109,573 | |||||||||||||||||||||||
| Rio de Janeiro Refrescos Ltda. | Brazil | Foreign | Tetra Pack | Brazil | BRL | Monthly | 7.65 | % | 7.39 | % | 87,735 | 273,119 | 360,854 | 716,978 | |||||||||||||||||||||||
| Rio de Janeiro Refrescos Ltda. | Brazil | Foreign | Imóveis | Brazil | BRL | Monthly | 8.20 | % | 8.20 | % | 90,234 | 210,104 | 300,338 | 339,665 | |||||||||||||||||||||||
| Rio de Janeiro Refrescos Ltda. | Brazil | Foreign | Leão | Brazil | BRL | Monthly | 6.56 | % | 6.56 | % | 127,226 | 370,160 | 497,386 | 280,995 | |||||||||||||||||||||||
| Embotelladora del Atlántico S.A. | Argentina | Foreign | Tetra Pak SRL | Argentina | USD | Monthly | 12.00 | % | 12.00 | % | 33,204 | 99,611 | 132,815 | - | |||||||||||||||||||||||
| Embotelladora del Atlántico S.A. | Argentina | Foreign | Banco Comafi | Argentina | USD | Monthly | 12.00 | % | 12.00 | % | 22,184 | 66,555 | 88,739 | - | |||||||||||||||||||||||
| Embotelladora del Atlántico S.A. | Argentina | Foreign | Real Estate | Argentina | ARS | Monthly | 50.00 | % | 50.00 | % | 66,607 | 122,713 | 189,320 | - | |||||||||||||||||||||||
| Vital Aguas S.A | Chile | 76.389.720-6 | Coca Cola del Valle New Ventures S.A | Chile | CLP | Lineal | 6.20 | % | 6.20 | % | 292,471 | 877,413 | 1,169,884 | - | |||||||||||||||||||||||
| Envases Central S.A | Chile | 96.705.990-0 | Coca Cola del Valle New Ventures S.A | Chile | CLP | Lineal | 6.20 | % | 6.20 | % | 549,750 | 1,649,248 | 2,198,998 | - | |||||||||||||||||||||||
| Paraguay Refrescos SA | Paraguay | 80.003.400-7 | Tetra Pack Ltda. Suc. Py | Paraguay | PGY | Monthly | 0.00 | % | 0.00 | % | 58,925 | 176,774 | 235,699 | - | |||||||||||||||||||||||
| Total | 6,013,535 | 1,534,467 | |||||||||||||||||||||||||||||||||||
The Company maintains lease agreements on forklifts, vehicles, real estate and machinery. These leases have an average life of between one and eight years without including a renewal option in the contracts.
F-72
17.4.2 Non-current liabilities for leasing agreements, non-current
| Maturity | |||||||||||||||||||||||||||||||||||||||||||
| Indebted Entity | Creditor Entity | Type of | Effective | Nominal | 1 year up to | 2 years up to | 3 years up to | 4 years up to | More than | At | |||||||||||||||||||||||||||||||||
| Name | Country | Rut | Name | Country | Currency | Amortization | Rate | Rate | 2 years | 3 years | 4 years | 5 years | 5 years | 12.31.2019 | |||||||||||||||||||||||||||||
| M$ | M$ | M$ | M$ | M$ | M$ | ||||||||||||||||||||||||||||||||||||||
| Rio de Janeiro Refrescos Ltda. | Brazil | Foreign | Cogeração - Light ESCO | Brazil | BRL | Monthly | 13.00 | % | 12.28 | % | 948,466 | 1,071,766 | 1,211,096 | 1,368,538 | 8,101,730 | 12,701,596 | |||||||||||||||||||||||||||
| Rio de Janeiro Refrescos Ltda. | Brazil | Foreign | Tetra Pack | Brazil | BRL | Monthly | 7.65 | % | 7.39 | % | 271,264 | 111,005 | - | - | - | 382,269 | |||||||||||||||||||||||||||
| Rio de Janeiro Refrescos Ltda. | Brazil | Foreign | Real estate | Brazil | BRL | Monthly | 8.20 | % | 8.20 | % | 97,784 | 9,144 | - | - | - | 106,928 | |||||||||||||||||||||||||||
| Rio de Janeiro Refrescos Ltda. | Brazil | Foreign | Leão Alimentos e Bebidas Ltda. | Brazil | BRL | Monthly | 6.56 | % | 6.56 | % | 365,671 | 355,172 | 339,020 | 331,185 | 375,688 | 1,766,736 | |||||||||||||||||||||||||||
| Embotelladora del Atlántico S.A. | Argentina | O-E | Tetra Pak SRL | Argentina | USD | Monthly | 12.00 | % | 12.00 | % | - | 398,442 | - | 343,104 | - | 741,546 | |||||||||||||||||||||||||||
| Embotelladora del Atlántico S.A. | Argentina | O-E | Banco Comafi | Argentina | USD | Monthly | 12.00 | % | 12.00 | % | - | 110,924 | - | - | - | 110,924 | |||||||||||||||||||||||||||
| Embotelladora del Atlántico S.A. | Argentina | O-E | Real estate | Argentina | ARS | Monthly | 50.00 | % | 50.00 | % | - | 55,222 | - | - | - | 55,222 | |||||||||||||||||||||||||||
| Vital Aguas S.A | Chile | 76.572.588-7 | Coca Cola del Valle New Ventures S.A | Chile | CLP | Monthly | 6.2 | % | 0.27 | % | 2,242,278 | - | - | - | - | 2,242,278 | |||||||||||||||||||||||||||
| Envases Central S.A | Chile | 76.572.588-7 | Coca Cola del Valle New Ventures S.A | Chile | CLP | Monthly | 6.7 | % | 0.27 | % | 4,947,745 | - | - | - | - | 4,947,745 | |||||||||||||||||||||||||||
| Paraguay Refrescos SA | Paraguay | 80.003.400-7 | Tetra Pack Ltda. Suc. Py | Paraguay | PGY | Monthly | 0.00 | % | 0.00 | % | 399,456 | 399,456 | |||||||||||||||||||||||||||||||
| Total | 23,454,700 | ||||||||||||||||||||||||||||||||||||||||||
17.4.3 Non-current liabilities for leasing agreements (previous year)
| Maturity | |||||||||||||||||||||||||||||||||||||||||||||
| Indebted Entity | Creditor Entity | Type of | Effective | Nominal | 1 year up to | 2 years up to | 3 years up to | 4 years up to | More than | At | |||||||||||||||||||||||||||||||||||
| Name | Country | Rut | Name | Country | Currency | Amortization | Rate | Rate | 2 years | 3 years | 4 years | 5 years | 5 years | 12.31.2018 | |||||||||||||||||||||||||||||||
| M$ | M$ | M$ | M$ | M$ | M$ | ||||||||||||||||||||||||||||||||||||||||
| Rio de Janeiro Refrescos Ltda. | Brazil | Foreign | Cogeração - Light ESCO | Brazil | BRL | Monthly | 13.00 | % | 12.28 | % | 810,185 | 915,509 | 1,034,525 | 1,169,014 | 9,466,995 | 13,396,228 | |||||||||||||||||||||||||||||
| Rio de Janeiro Refrescos Ltda. | Brazil | Foreign | Tetra Pack | Brazil | BRL | Monthly | 7.65 | % | 7.39 | % | 401,240 | - | - | - | - | 401,240 | |||||||||||||||||||||||||||||
| 13,797,468 | |||||||||||||||||||||||||||||||||||||||||||||
Leasing agreement obligations are not subject to financial restrictions for the reported periods.
F-73
18 – TRADE AND OTHER ACCOUNTS PAYABLE
Trade and other current accounts payable are detailed as follows:
| Classification | 12.31.2019 | 12.31.2018 | ||||||
| ThCh$ | ThCh$ | |||||||
| Current | 243,700,553 | 238,109,847 | ||||||
| Non-current | 619,587 | 735,665 | ||||||
| Total | 244,320,140 | 238,845,512 | ||||||
| Item | 12.31.2019 | 12.31.2018 | ||||||
| ThCh$ | ThCh$ | |||||||
| Trade accounts payable | 172,142,472 | 174,486,806 | ||||||
| Withholding tax | 53,326,254 | 47,693,379 | ||||||
| Others | 18,851,414 | 16,665,327 | ||||||
| Total | 244,320,140 | 238,845,512 | ||||||
19 – OTHER PROVISIONS, CURRENT AND NON-CURRENT
19.1 Balances
The composition of provisions is as follows:
| Detail | 12.31.2019 | 12.31.2018 | ||||||
| ThCh$ | ThCh$ | |||||||
| Litigation (1) | 69,107,550 | 62,452,526 | ||||||
| Total | 69,107,550 | 62,452,526 | ||||||
| Current | 2,068,984 | 3,485,613 | ||||||
| Non-current | 67,038,566 | 58,966,913 | ||||||
| Total | 69,107,550 | 62,452,526 | ||||||
| (1) | Correspond to the provision made for the probable losses of fiscal, labor and commercial contingencies, based on the opinion of our legal advisors, according to the following detail: |
| Detail (see note 23.1) | 12.31.2019 | 12.31.2018 | ||||||
| ThCh$ | ThCh$ | |||||||
| Tax contingencies | 38,853,059 | 47,991,514 | ||||||
| Labor contingencies | 10,569,754 | 10,376,830 | ||||||
| Civil contingencies | 19,684,737 | 4,084,182 | ||||||
| Total | 69,107,550 | 62,452,526 | ||||||
F-74
19.2 Movements
The movement of principal provisions over litigation is detailed as follows:
| Detail | 12.31.2019 | 12.31.2018 | ||||||
| ThCh$ | ThCh$ | |||||||
| Opening balance as of January 1 | 62,452,526 | 65,624,166 | ||||||
| Additional provisions | 121,003 | 46,657 | ||||||
| Increases (decrease) in existing provisions (*) | (13,085,051 | ) | (4,998,530 | ) | ||||
| Payments | 21,506,141 | 6,139,963 | ||||||
| Reversal of unused provision | (2,511,589 | ) | (2,157,152 | ) | ||||
| Increase (decrease) due to foreign exchange differences | 624,520 | (2,202,578 | ) | |||||
| Total | 69,107,550 | 62,452,526 | ||||||
(*) During 2019 and 2018, provisions consisting of fines demanded by the Brazilian tax authority on the use of tax credits resulting from favorable sentencing to Rio de Janeiro Refrescos Ltda.
20 – OTHER NON-FINANCIAL LIABILITIES
Other current and non-current liabilities at each reporting period end are detailed as follows:
| Description | 12.31.2019 | 12.31.2018 | ||||||
| ThCh$ | ThCh$ | |||||||
| Dividends payable | 22,639,150 | 21,584,314 | ||||||
| Other | 3,863,065 | 12,189,900 | ||||||
| Total | 26,502,215 | 33,774,214 | ||||||
21.1 Number of shares:
| Number
of shares subscribed at nominal value | Number of shares paid in | Number of voting shares | ||||||||||||||||||||||
| Series | 2019 | 2018 | 2019 | 2018 | 2019 | 2018 | ||||||||||||||||||
| A | 473,289,301 | 473,289,301 | 473,289,301 | 473,289,301 | 473,289,301 | 473,289,301 | ||||||||||||||||||
| B | 473,281,303 | 473,281,303 | 473,281,303 | 473,281,303 | 473,281,303 | 473,281,303 | ||||||||||||||||||
F-75
21.1.1 Equity:
| Subscribed Capital | Paid-in capital | |||||||||||||||
| Series | 2019 | 2018 | 2019 | 2018 | ||||||||||||
| ThCh$ | ThCh$ | ThCh$ | ThCh$ | |||||||||||||
| A | 135,379,504 | 135,379,504 | 135,379,504 | 135,379,504 | ||||||||||||
| B | 135,358,070 | 135,358,070 | 135,358,070 | 135,358,070 | ||||||||||||
| Total | 270,737,574 | 270,737,574 | 270,737,574 | 270,737,574 | ||||||||||||
21.1.2 Rights of each series:
| · | Series A: Elects 12 of the 14 Directors |
| · | Series B: Receives an additional 10% of dividends distributed to Series A and elects 2 of the 14 Directors. |
21.2 Dividend policy
According to Chilean law, cash dividends must be paid equal to at least 30% of annual net profit, barring a unanimous vote by shareholders to the contrary. If there is no net profit in a given year, the Company will not be legally obligated to pay dividends from retained earnings. At the ordinary Shareholders’ Meeting held in April 2019, the shareholders agreed to pay out of the 2018 earnings a final dividend additional to the 30% required by Chile’s Law 18,046 which will be paid in May 2019, and an additional dividend that will be paid in August 2019.
Pursuant to Circular Letter N° 1,945 of the Chilean Financial Market Commission (CMF) dated September 29, 2009, the Company’s Board of Directors decided to maintain the initial adjustments from adopting IFRS as accumulated earnings for future distribution.
The dividends declared and paid per share are presented below:
| Periods | Dividend type | Profits imputable to dividends | Ch$ per Series A Share | Ch$ per Series B Share | ||||||||
| 2018 January | Interim | 2017 Earnings | 21.50 | 23.65 | ||||||||
| 2018 May | Final | 2017 Earnings | 21.50 | 23.65 | ||||||||
| 2018 August | Additional | Accumulated Earnings | 21.50 | 23.65 | ||||||||
| 2018 October | Interim | 2018 Earnings | 21.50 | 23.65 | ||||||||
| 2019 January | Interim | 2018 Earnings | 21.50 | 23.65 | ||||||||
| 2019 May | Final | 2018 Earnings | 21.50 | 23.65 | ||||||||
| 2019 August | Additional | Accumulated Earnings | 21.50 | 23.65 | ||||||||
| 2019 October | Interim | 2019 Earnings | 21.50 | 23.65 | ||||||||
| 2020 January | Interim | 2019 Earnings | 22.60 | 24.86 | ||||||||
F-76
21.3 Other Reserves
The balance of other reserves includes the following:
| Description | 12.31.2019 | 12.31.2018 | 12.31.2017 | |||||||||
| ThCh$ | ThCh$ | ThCh$ | ||||||||||
| Polar acquisition | 421,701,520 | 421,701,520 | 421,701,520 | |||||||||
| Foreign currency translation reserves | (339,076,340 | ) | (306,674,528 | ) | (237,077,572 | ) | ||||||
| Cash flow hedge reserve | (14,850,683 | ) | (13,668,932 | ) | (3,094,671 | ) | ||||||
| Reserve for employee benefit actuarial gains or losses | (2,230,752 | ) | (1,954,077 | ) | (1,915,587 | ) | ||||||
| Legal and statutory reserves | 5,435,538 | 5,435,538 | 5,435,538 | |||||||||
| Other | 6,014,568 | 6,014,568 | - | |||||||||
| Total | 76,993,851 | 110,854,089 | 185,049,228 | |||||||||
21.3.1 Polar acquisition
This amount corresponds to the difference between the valuation at fair value of the issuance of shares of Embotelladora Andina S.A. and the book value of the paid capital of Embotelladoras Coca-Cola Polar S.A., which was finally the value of the capital increase notarized in legal terms.
21.3.2 Cash flow hedge reserve
They arise from the fair value of the existing derivative contracts that have been qualified for hedge accounting at the end of each financial period. When contracts are expired, these reserves are adjusted and recognized in the income statement in the corresponding period (see Note 22).
21.3.3 Reserve for employee benefit actuarial gains or losses
Corresponds to the restatement effect of employee benefits actuarial losses that according to IAS 19 amendments must be carried to other comprehensive income.
F-77
21.3.4 Legal and statutory reserves
In accordance with Official Circular N° 456 issued by the Chilean Financial Market Commission (CMF), the legally required price-level restatement of paid-in capital for 2009 is presented as part of other equity reserves and is accounted for as a capitalization from Other Reserves with no impact on net income or retained earnings under IFRS. This amount totaled CLP 5,435,538 thousand as of December 31, 2009.
21.3.5 Foreign currency translation reserves
This corresponds to the conversion of the financial statements of foreign subsidiaries whose functional currency is different from the presentation currency of the Consolidated Financial Statements. Additionally, exchange differences between accounts receivable kept by the companies in Chile with foreign subsidiaries are presented in this account, which have been treated as investment equivalents accounted for using the equity method. Translation reserves are detailed as follows:
| Details | 12.31.2019 | 12.31.2018 | 12.31.2017 | |||||||||
| ThCh$ | ThCh$ | ThCh$ | ||||||||||
| Brazil | (102,922,548 | ) | (99,990,343 | ) | (90,156,924 | ) | ||||||
| Argentina | (246,415,922 | ) | (201,118,180 | ) | (128,348,112 | ) | ||||||
| Paraguay | 6,133,700 | 8,623,849 | (4,862,332 | ) | ||||||||
| Exchange rate differences in related companies | 4,128,430 | (14,189,854 | ) | (13,710,204 | ) | |||||||
| Total | (339,076,340 | ) | (306,674,528 | ) | (237,077,572 | ) | ||||||
The movement of this reserve for the fiscal years ended December 31, 2019 and 2018, is detailed as follows:
| Details | 12.31.2019 | 12.31.2018 | 12.31.2017 | |||||||||
| ThCh$ | ThCh$ | ThCh$ | ||||||||||
| Brazil | 15,386,079 | (10,313,069 | ) | (32,963,533 | ) | |||||||
| Argentina | (45,297,742 | ) | (72,770,068 | ) | (19,961,899 | ) | ||||||
| Paraguay | (2,490,149 | ) | 13,486,181 | (15,407,785 | ) | |||||||
| Exchange rate differences in related companies | - | - | - | |||||||||
| Total | (32,401,812 | ) | (69,596,956 | ) | (68,333,217 | ) | ||||||
21.3.6 Consolidated statements of comprehensive income
As of December 31, 2019, 2018 and 2017, the detail of the comprehensive income and expense of the term is as follows:
| Gross Balance | Tax | Net Balance | ||||||||||
| Cash Flow for hedge (1) | (1,865,233 | ) | 683,482 | (1,181,751 | ) | |||||||
| Exchange rate translation differences (1) | (41,844,584 | ) | 9,295,546 | (32,549,038 | ) | |||||||
| Benefit relate to defined benefit plans | (379,007 | ) | 102,332 | (276,675 | ) | |||||||
| Total Comprenhensive income as of December 31, 2019 | (44,088,824 | ) | 10,081,360 | (34,007,464 | ) | |||||||
F-78
| Gross Balance | Tax | Net Balance | ||||||||||
| Cash Flow for hedge (1) | (13,151,841 | ) | 2,554,551 | (10,597,290 | ) | |||||||
| Exchange rate translation differences (1) | (72,455,525 | ) | 2,476,204 | (69,979,321 | ) | |||||||
| Benefit relate to defined benefit plans | (63,463 | ) | 16,184 | (47.279 | ) | |||||||
| Total Comprenhensive income as of December 31, 2018 | (85,670,829 | ) | 5,046,939 | (80,623,890 | ) | |||||||
| Gross Balance | Tax | Net Balance | ||||||||||
| Cash Flow for hedge (1) | (813,844 | ) | 167,348 | (646,496 | ) | |||||||
| Exchange rate translation differences (1) | (68,831,435 | ) | 232,666 | (68,598,769 | ) | |||||||
| Benefit relate to defined benefit plans | (329,477 | ) | 84,017 | (245,460 | ) | |||||||
| Total Comprenhensive income as of December 31, 2017 | (69,974,756 | ) | 484,031 | (69,490,725 | ) | |||||||
| (1) | These concepts will be reclassified to the statements of income when it is settled. |
The movement of comprehensive income and expense is as follows:
| As of December 31, 2019: |
Cash Flow Hedge |
Exchange rate Differences |
Benefit related to defines benefit plans |
|||||||||
| M$ | M$ | M$ | ||||||||||
| Increase (decrease) | (1.724.004 | ) | (41,844,584 | ) | 53,511 | |||||||
| Deferred taxes | 340.835 | 9,295,546 | (14,448 | ) | ||||||||
| Reclassification to the result by function | 118.779 | - | (432,518 | ) | ||||||||
| Reclassification of deferred taxes related to other reserves | 82.639 | - | 116,780 | |||||||||
| Total Changes in Equity | (1,181,751 | ) | (32,549,038 | ) | (276,675 | ) | ||||||
| Equity holders of the parent | (1,181,751 | ) | (32,401,812 | ) | (276,675 | ) | ||||||
| Non-Controlling interests | - | (147,226 | ) | - | ||||||||
| Total Changes in equity as of December 31, 2019 | (1,181,751 | ) | (32,549,038 | ) | (276,675 | ) | ||||||
| As of December 31, 2018: |
Cash Flow Hedge |
Exchange rate Differences |
Benefit related to defines benefit plans |
|||||||||
| M$ | M$ | M$ | ||||||||||
| Increase (decrease) | (63,699,788 | ) | (72,455,525 | ) | (334,508 | ) | ||||||
| Deferred taxes | 20,217,065 | 2,476,204 | 89,366 | |||||||||
| Reclassification to the result by function | 48,415,956 | - | 271,045 | |||||||||
| Reclassification of deferred taxes related to other reserves | (15,530,523 | ) | - | (73,182 | ) | |||||||
| Total Changes in Equity | (10,597,290 | ) | (69,979,321 | ) | (47,279 | ) | ||||||
| Equity holders of the parent | (10,597,290 | ) | (69,592,296 | ) | (43,150 | ) | ||||||
| Non-Controlling interests | - | (387,025 | ) | (4,129 | ) | |||||||
| Total Changes in equity as of December 31, 2018 | (10,597,290 | ) | (69,979,321 | ) | (47,279 | ) | ||||||
| As of December 31, 2017: |
Cash Flow Hedge |
Exchange rate Differences |
Benefit related to defines benefit plans |
|||||||||
| M$ | M$ | M$ | ||||||||||
| Increase (decrease) | (14,172,572 | ) | (68,831,435 | ) | (476,044 | ) | ||||||
| Deferred taxes | 3,875,908 | 232,666 | 121,390 | |||||||||
| Reclassification to the result by function | 13,352,835 | - | 146,564 | |||||||||
| Reclassification of deferred taxes related to other reserves | (3,702,667 | ) | - | (37,370 | ) | |||||||
| Total Changes in Equity | (646,496 | ) | (68,598,769 | ) | (245,460 | ) | ||||||
| Equity holders of the parent | (646,496 | ) | (68,333,217 | ) | (130,555 | ) | ||||||
| Non-Controlling interests | - | (265,552 | ) | (114,905 | ) | |||||||
| Total Changes in equity as of December 31, 2017 | (646,496 | ) | (68,598,769 | ) | (245,460 | ) | ||||||
F-79
21.4 Non-controlling interests
This is the recognition of the portion of equity and income from subsidiaries owned by third parties. This account is detailed as follows:
| Non-controlling Interests | ||||||||||||||||||||||||||||||||||||
| Ownership % | Shareholders’ Equity | Income | ||||||||||||||||||||||||||||||||||
| Details | 2019 | 2018 | 2017 |
December 2019 |
December 2018 |
December 2017 |
December 2019 |
December 2018 |
December 2017 |
|||||||||||||||||||||||||||
| ThCh$ | ThCh$ | ThCh$ | ThCh $ | ThCh $ | ThCh $ | |||||||||||||||||||||||||||||||
| Embotelladora del Atlántico S.A. | 0.0171 | 0.0171 | 0.0171 | 26,342 | 23,260 | 13,765 | 4,183 | 3,633 | 5,590 | |||||||||||||||||||||||||||
| Andina Empaques Argentina S.A. | 0.0209 | 0.0209 | 0.0209 | 2,290 | 2,113 | 2,213 | 409 | 96 | 711 | |||||||||||||||||||||||||||
| Paraguay Refrescos S.A. | 2.1697 | 2.1697 | 2.1697 | 5,368,470 | 5,378,074 | 5,045,792 | 622,188 | 556,112 | 502,945 | |||||||||||||||||||||||||||
| Vital S.A. | 35.0000 | 35.0000 | 35.0000 | 7,904,741 | 7,674,785 | 9,261,108 | 263,442 | 271,063 | 283,327 | |||||||||||||||||||||||||||
| Vital Aguas S.A. | 33.5000 | 33.5000 | 33.5000 | 1,803,884 | 1,986,493 | 2,117,098 | 105,870 | 36,696 | 151,647 | |||||||||||||||||||||||||||
| Envases Central S.A. | 40.7300 | 40.7300 | 40.7300 | 5,148,531 | 4,836,892 | 5,483,317 | 528,205 | (20,225 | ) | 220,715 | ||||||||||||||||||||||||||
| Total | 20,254,258 | 19,901,617 | 21,923,293 | 1,524,297 | 847,375 | 1,164,935 | ||||||||||||||||||||||||||||||
The following tables presents summarized information regarding the Company´s subsidiaries owned by third parties as of December 31, 2019, 2018 and 2017:
| December 31,2019 |
Embotelladora Del Atlantico S.A. |
Andina Empaques Argentina S.A. |
Paraguay Refrescos S.A. |
Vital Jugos S.A. |
Vital Aguas S.A. |
Envases Central S.A. |
||||||||||||||||||
| Total current assets | 73,309,861 | 4,350,074 | 41,266,559 | 18,534,272 | 5,266,575 | 16,265,862 | ||||||||||||||||||
| Total non-current assets | 160,885,628 | 9,433,294 | 248,309,451 | 15,475,979 | 8,527,624 | 20,903,184 | ||||||||||||||||||
| Total current liabilities | 66,987,371 | 2,212,255 | 25,990,081 | 11,150,695 | 5,794,282 | 18,732,369 | ||||||||||||||||||
| Total non-current liabilities | 12,732,620 | 618,031 | 16,161,177 | 274,583 | 2,615,188 | 5,796,119 | ||||||||||||||||||
| Net sales | 384,856,368 | 18,509,124 | 158,892,010 | 46,818,385 | 18,201,656 | 70,633,817 | ||||||||||||||||||
| Net Income | 24,531,815 | 1,954,024 | 28,675,727 | 752,692 | 316,031 | 1,296,840 | ||||||||||||||||||
F-80
| December 31,2018 |
Embotelladora Del Atlantico S.A. |
Andina Empaques Argentina S.A. |
Paraguay Refrescos S.A. |
Vital Jugos S.A. |
Vital Aguas S.A. |
Envases Central S.A. |
||||||||||||||||||
| Total current assets | 78,222,876 | 4,329,932 | 37,309,706 | 16,005,424 | 4,616,490 | 13,737,336 | ||||||||||||||||||
| Total non-current assets | 156,224,157 | 9,251,880 | 248,751,791 | 16,969,708 | 5,287,639 | 12,239,333 | ||||||||||||||||||
| Total current liabilities | 82,148,269 | 2,309,810 | 21,870,719 | 11,018,878 | 3,803,117 | 13,063,735 | ||||||||||||||||||
| Total non-current liabilities | 15,897,476 | 1,169,270 | 16,323,385 | 28,298 | 171,184 | 1,041,400 | ||||||||||||||||||
| Net sales | 406,216,738 | 16,034,964 | 149,588,252 | 56,724,318 | 15,859,403 | 59,433,099 | ||||||||||||||||||
| Net Income | 21,304,406 | 458,980 | 25,630,364 | 774,466 | 109,539 | (112,302 | ) | |||||||||||||||||
| December 31,2017 |
Embotelladora Del Atlantico S.A. |
Andina Empaques Argentina S.A. |
Paraguay Refrescos S.A. |
Vital Jugos S.A. |
Vital Aguas S.A. |
Envases Central S.A. |
||||||||||||||||||
| Total current assets | 97,285,008 | 7,143,561 | 30,419,844 | 21,135,712 | 4,296,412 | 8,343,734 | ||||||||||||||||||
| Total non-current assets | 94,369,129 | 6,413,307 | 234,278,288 | 19,691,418 | 5,876,875 | 14,243,627 | ||||||||||||||||||
| Total current liabilities | 109,594,738 | 2,944,499 | 17,297,339 | 14,244,283 | 3,698,382 | 7,410,662 | ||||||||||||||||||
| Total non-current liabilities | 1,339,723 | 28,444 | 14,487,776 | 128,071 | 157,558 | 1,710,709 | ||||||||||||||||||
| Net sales | 544,585,291 | 20,698,427 | 141,277,230 | 68,884,622 | 14,642,493 | 39,205,943 | ||||||||||||||||||
| Net Income | 32,781,977 | 3,398,080 | 23,179,968 | 809,507 | 452,679 | 541,927 | ||||||||||||||||||
F-81
21.5 Earnings per share
The basic earnings per share presented in the statement of comprehensive income is calculated as the quotient between income for the period and the average number of shares outstanding during the same period.
Earnings per share used to calculate basic and diluted earnings per share is detailed as follows:
| 12.31.2019 | ||||||||
| Earnings per share | SERIES A | SERIES B | ||||||
| Earnings attributable to shareholders (CLP 000’s) | 82,725,427 | 90,996,501 | ||||||
| Average weighted number of shares | 473,289,301 | 473,281,303 | ||||||
| Earnings per share (in CLP) | 174.79 | 192.27 | ||||||
| 12.31.2018 | ||||||||
| Earnings per share | SERIES A | SERIES B | ||||||
| Earnings attributable to shareholders (ThCh$) | 46,001,994 | 50,601,377 | ||||||
| Average weighted number of shares | 473,289,301 | 473,281,303 | ||||||
| Earnings per share (in CLP) | 97.20 | 106.92 | ||||||
| 12.31.2017 | ||||||||
| Earnings per share | SERIES A | SERIES B | ||||||
| Earnings attributable to shareholders (ThCh$) | 56,112,755 | 61,723,035 | ||||||
| Average weighted number of shares | 473,289,301 | 473,281,303 | ||||||
| Earnings per share (in CLP) | 118.56 | 130.42 | ||||||
22 – DERIVATIVE ASSETS AND LIABILITIES
Embotelladora Andina currently maintains “Cross Currency Swaps” and “Currency Forward” agreements as derivative financial instruments.
Cross Currency Swaps (“CCS”), also known as interest rate and currency swaps, are valued by the method of discounted future cash flows at a market rate corresponding to the risk of the operation. CCS are currently maintained to re-denominate debt incurred in currency and rate in USD to currency and rate in BRL. To discount future flows in BRL and USD, the Zero coupon curves of the BRL and the Zero coupon USD are used, respectively.
On the other hand, the fair value of forward currency contracts is calculated in reference to current forward exchange rates for contracts with similar maturity profiles.
As of December 31, 2019 and 2018, the Company held the following derivative instruments:
22.1 Derivatives accounted for as cash flow hedges:
Cross Currency Swaps associated with US Bonds
At December 31, 2019, the Company held cross currency swap derivative contracts to convert US Dollar public bond obligations of USD 360 million into Real liabilities to hedge the Company’s exposure to variations in foreign exchange rates. Said contracts are valued at their value and the net value to be received as of December 31, 2019 amounted to CLP 98,918,457 thousand. These swap contracts have the same terms of the underlying bond obligation and expire in 2023.
The amount of exchange differences recognized in the statement of income related to financial liabilities in U.S. dollars and the identified effective portion that was absorbed by the amounts recognized under comprehensive income.
F-82
22.2. Forward currency transactions expected to be very likely:
During 2019 and 2018, the Company entered into foreign currency forward contracts to hedge its exposure to expected future raw materials purchases in US Dollars during these years. The total amount of outstanding forward contracts was USD 46.9 million as of December 31, 2019 (USD 56.8 million as of December 31, 2018).
Futures contracts that ensure prices of future raw materials have not been designated as hedge agreements, since they do not fulfill IFRS documentation requirements, whereby its effects on variations in fair value are accounted for directly under statements of income in the "other gains and losses" account.
Fair value hierarchy
As of December 31, 2019, the Company held assets for derivative contracts for CLP 99,235,662 thousand (CLP 88,116,189 thousand as of December 31, 2018) and held liabilities for derivative contracts as of December 31, 2019 for CLP 374,576 thousand (CLP 130,829 thousand as of December 31, 2018). Those contracts covering existing items have been classified in the same category of hedged, the net amount of derivative contracts by concepts covering forecasted items have been classified in financial assets and financial liabilities. All the derivative contracts are carried at fair value in the consolidated statement of financial position. The Company uses the following hierarchy for determining and disclosing the fair value of financial instruments by valuation technique:
Level 1: quoted (unadjusted) prices in active markets for identical assets or liabilities
Level 2: Inputs other than quoted prices included in level 1 that are observable for the assets and liabilities, either directly (that is, as prices) or indirectly (that is, derived from prices)
Level 3: Inputs for assets and liabilities that are not based on observable market data.
During the reporting period, there were no transfers of items between fair value measurement categories; all of which were valued during the period using level 2.
| Fair Value Measurements at December 31, 2019 | ||||||||||||||||
| Quoted prices in active markets |
Observable market data |
Unobservable market data |
||||||||||||||
| for identical assets or liabilities |
||||||||||||||||
| (Level 1) | (Level 2) | (Level 3) | Total | |||||||||||||
| THCH$ | THCH$ | THCH$ | THCH$ | |||||||||||||
| Assets | ||||||||||||||||
| Current assets | ||||||||||||||||
| Other current financial assets | - | 317,205 | - | 317,205 | ||||||||||||
| Other non-current financial assets | - | 98,918,457 | - | 98,918,457 | ||||||||||||
| Total assets | - | 99,235,662 | - | 99,235,662 | ||||||||||||
|
Liabilities |
||||||||||||||||
| Current liabilities | ||||||||||||||||
| Other current financial liabilities | - | 374,576 | - | 374,576 | ||||||||||||
| Total liabilities | - | 374,576 | - | 374,576 | ||||||||||||
F-83
| Fair Value Measurements at December 31, 2018 | ||||||||||||||||
|
Quoted prices in |
Observable market data |
Unobservable market data |
||||||||||||||
| for identical assets or liabilities |
||||||||||||||||
| (Level 1) | (Level 2) | (Level 3) | Total | |||||||||||||
| ThCh$ | ThCh$ | ThCh$ | ThCh$ | |||||||||||||
| Assets | ||||||||||||||||
| Current assets | ||||||||||||||||
|
Other current financial assets |
- | 669,527 | 669,527 | |||||||||||||
| Other non-current financial assets | - | 87,446,662 | - | 87,446,662 | ||||||||||||
| Total assets | - | 88,116,189 | - | 88,116,189 | ||||||||||||
|
Liabilities |
||||||||||||||||
| Current liabilities | ||||||||||||||||
| Other current financial liabilities | - | 130,829 | - | 130,829 | ||||||||||||
| Total liabilities | - | 130,829 | - | 130,829 | ||||||||||||
F-84
23 – LITIGATION AND CONTINGENCIES
23.1 Lawsuits and other legal actions:
In the opinion of the Company's legal counsel, the Parent Company and its subsidiaries do not face legal or extrajudicial contingencies that might result in material or significant losses or gains, except for the following:
1) Embotelladora del Atlántico S.A. faces labor, tax, civil and trade lawsuits. Accounting provisions have been made for the contingency of a probable loss because of these lawsuits, totaling ThCh$ 942,173. Management considers it unlikely that non-provisioned contingencies will affect the Company's income and equity, based on the opinion of its legal counsel. Additionally, Embotelladora del Atlántico S.A. maintains time deposits for an amount of ThCh$ 457,576 to guaranty judicial liabilities
2) Rio de Janeiro Refrescos Ltda. faces labor, tax, civil and trade lawsuits. Accounting provisions have been made for the contingency of a probable loss because of these lawsuits, totaling ThCh$ 66,070,162. Management considers it unlikely that non-provisioned contingencies will affect the Company's income and equity, based on the opinion of its legal counsel. As it is customary in Brazil, Rio de Janeiro Refrescos Ltda. maintains Deposit in courts and assets given in pledge to secure the compliance of certain processes, irrespective of whether these have been classified as a possible, probable or remote. The amounts deposited or pledged as legal guarantees As of December 31, 2019 and 2018, amounted to ThCh$ 32,166,823 and ThCh$ 31,143,415, respectively.
Part of the assets held under warranty by Rio de Janeiro Refrescos Ltda. as of December 31, 2014, are in the process of being released and others have already been released in exchange for guarantee insurance and bond letters for BRL 1,152,911,259, with different Financial Institutions and Insurance Companies in Brazil, these entities receive an annual commission fee of 0.59%. and become responsible of fulfilling obligations with the Brazilian tax authorities should any trial result against Rio de Janeiro Refrescos Ltda. Additionally, if the warranty and bail letters are executed, Rio de Janeiro Refrescos Ltda. promises to reimburse to the financial institutions and Insurance Companies any amounts disbursed by them to the Brazilian government.
Main contingencies faced by Rio de Janeiro Refrescos are as follows:
| a) | Tax contingencies resulting from credits on tax on industrialized products (IPI). |
Rio de Janeiro Refrescos is a party to a series of proceedings under way, in which the Brazilian federal tax authorities demand payment of value-added tax on industrialized products (Imposto sobre Produtos Industrializados, or IPI) allegedly owed by ex-Companhia de Bebidas Ipiranga. The initial amount demanded reached BRL 1,330,473,161 (historical amount without adjustments), corresponding to different trials related to the same cause. In September 2014, one of these trials for BRL 598,745,218, was settled in favor of the Company, and additionally during 2017 several trials were settled in favor of the Company in the amount for BRL 135,282,155 however, there are new lawsuits arising after the purchase of ex-Companhia de Bebidas Ipiranga (October 2013) that amount to BRL 375,286,356.
The Company does not share the position of the Brazilian tax authority in these procedures and considers that Companhia de Bebidas Ipiranga was entitled to claim IPI tax credits in connection with purchases of certain exempt raw materials from suppliers located in the Manaus free trade zone.
Based on the opinion of its advisers, and legal outcomes to date, Management estimates that these procedures do not represent probable losses and has not recorded a provision on these matters.
Notwithstanding the above, the IFRS related to business combination in terms of distribution of the purchase price establish that contingencies must be measured one by one according to their probability of occurrence and discounted at fair value from the date on which it is deemed the loss can be generated. According to this criterion, from a total of identified contingencies amounting BRL 694,085,017 (including readjustments of current lawsuits), the Company recorded a provision for the beginning of business combination accounting in the amount BRL 213,122,274 equivalent to ThCh$ 39,608,019.
| b) | Tax contingencies on ICMS and IPI causes. |
They refer mainly to tax settlements issued by advance appropriation of ICMS credits on fixed assets, payment of the replacement of ICMS tax to the operations, untimely IPI credits calculated on bonuses, among other claims.
The Company does not consider that these judgments will result in significant losses, given that their loss, according to its legal counsel, is considered unlikely. However, the accounting standards of financial information related to business combination in terms of distribution of the purchase price, establish contingencies must be valued one by one according to their probability of occurrence and discounted to fair value from the date on which it is deemed that the loss can be generated. Based on this criterion, a starting provision has been made in the accounting of the business combination for BRL 77,587,076 equivalent to ThCh$ 14,412,520.
3) Embotelladora Andina S.A. and its Chilean subsidiaries face labor, tax, civil and trade lawsuits. Accounting provisions have been made for the contingency of a probable loss because of these lawsuits, totaling ThCh$ 2,065,496. Management considers it is unlikely that non-provisioned contingencies will affect income and equity of the Company, in the opinion of its legal advisors.
4) Paraguay Refrescos S.A. faces tax, trade, labor and other lawsuits. Accounting provisions have been made for the contingency of any loss because of these lawsuits amounting to ThCh$ 3,488. Management considers it is unlikely that non-provisioned contingencies will affect income and equity of the Company, in the opinion of its legal advisors.
F-85
23.2 Direct guarantees and restricted assets:
Guarantees and restricted assets are detailed as follows:
Guarantees that commit assets included in the financial statements:
| Committed assets | Accounting value | |||||||||||||||
| Guaranty creditor | Debtor name | Relationship | Guaranty | Type | 12-31-2019 | 12-31-2018 | ||||||||||
| ThCh$ | ThCh$ | |||||||||||||||
| Gas Licuado Lipigas S.A. | Embotelladora Andina S.A. | Parent company | Cash | Trade debtors and other accounts receivable | - | 1,140 | ||||||||||
| Transportes San Martin | Embotelladora Andina S.A. | Parent company | Cash | Trade debtors and other accounts receivable | 2,805 | - | ||||||||||
| Cooperativa Agrícola Pisquera Elqui Limitada | Embotelladora Andina S.A. | Parent company | Cash | Other non-current financial assets | 1,216,865 | - | ||||||||||
| Inmob. e invers. supetar Ltda. | Transportes Polar | Subsidiary | Cash | Other non-current non-financial assets | 4,579 | 4,579 | ||||||||||
| Maria Lobos Jamet | Transportes Polar | Subsidiary | Cash | Other non-current non-financial assets | 2,565 | 2,565 | ||||||||||
| Bodega San Francisco | Transportes Polar | Subsidiary | Cash | Other non-current non-financial assets | 6,483 | - | ||||||||||
| Employee claims | Rio de Janeiro Refrescos Ltda. | Subsidiary | Deposit in court | Other non-current non-financial assets | 6,600,863 | 5,336,644 | ||||||||||
| Civil and tax claims | Rio de Janeiro Refrescos Ltda. | Subsidiary | Deposit in court | Other non-current non-financial assets | 12,186,432 | 12,597,136 | ||||||||||
| Government entities | Rio de Janeiro Refrescos Ltda. | Subsidiary | Plant & equipment | Property, Plant & Equipment | 13,379,610 | 13,209,635 | ||||||||||
| Distribuidora Baraldo S.H. | Embotelladora del Atlántico S.A. | Subsidiary | Deposit in court | Other non-current non-financial assets | 250 | 369 | ||||||||||
| Acuña Gomez | Embotelladora del Atlántico S.A. | Subsidiary | Deposit in court | Other non-current non-financial assets | 375 | 553 | ||||||||||
| Nicanor López | Embotelladora del Atlántico S.A. | Subsidiary | Deposit in court | Other non-current non-financial assets | 268 | 395 | ||||||||||
| Labarda | Embotelladora del Atlántico S.A. | Subsidiary | Deposit in court | Other non-current non-financial assets | 5 | 7 | ||||||||||
| Municipalidad Bariloche | Embotelladora del Atlántico S.A. | Subsidiary | Deposit in court | Other non-current non-financial assets | 36,313 | 21,420 | ||||||||||
| Municipalidad San Antonio Oeste | Embotelladora del Atlántico S.A. | Subsidiary | Deposit in court | Other non-current non-financial assets | 27,598 | 40,682 | ||||||||||
| Municipalidad Carlos Casares | Embotelladora del Atlántico S.A. | Subsidiary | Deposit in court | Other non-current non-financial assets | 1,116 | 1,645 | ||||||||||
| Municipalidad Chivilcoy | Embotelladora del Atlántico S.A. | Subsidiary | Deposit in court | Other non-current non-financial assets | 172,602 | 254,430 | ||||||||||
| Others | Embotelladora del Atlántico S.A. | Subsidiary | Deposit in court | Other non-current non-financial assets | 53 | 78 | ||||||||||
| Granada Maximiliano | Embotelladora del Atlántico S.A. | Subsidiary | Deposit in court | Other non-current non-financial assets | 2,250 | 3,317 | ||||||||||
| Cicsa | Embotelladora del Atlántico S.A. | Subsidiary | Cash deposit | Other current non-financial assets | 3,128 | 4,612 | ||||||||||
| Other lessors | Embotelladora del Atlántico S.A. | Subsidiary | Cash deposit | Other current non-financial assets | 15,289 | 46,169 | ||||||||||
| Aduana de EZEIZA | Embotelladora del Atlántico S.A. | Subsidiary | Cash deposit | Other current non-financial assets | 422 | 3,013 | ||||||||||
| Municipalidad de Junin | Embotelladora del Atlántico S.A. | Subsidiary | Deposit in court | Other non-current non-financial assets | 360 | 1,592 | ||||||||||
| Almada Jorge | Embotelladora del Atlántico S.A. | Subsidiary | Deposit in court | Other non-current non-financial assets | 3,054 | 4,949 | ||||||||||
| Municipalidad de Picun Leufu | Embotelladora del Atlántico S.A. | Subsidiary | Deposit in court | Other non-current non-financial assets | - | 72 | ||||||||||
| Mirgoni Marano | Embotelladora del Atlántico S.A. | Subsidiary | Deposit in court | Other non-current non-financial assets | 76 | 112 | ||||||||||
| Farias Matias Luis | Embotelladora del Atlántico S.A. | Subsidiary | Deposit in court | Other non-current non-financial assets | 1,401 | 309 | ||||||||||
| Temas Industriales SA - Embargo General de Fondos | Embotelladora del Atlántico S.A. | Subsidiary | Deposit in court | Other non-current non-financial assets | 156,759 | 231,077 | ||||||||||
| Gomez Alejandra Raquel | Embotelladora del Atlántico S.A. | Subsidiary | Deposit in court | Other non-current non-financial assets | - | 35 | ||||||||||
| Lopez Gustavo Gerardo C/Inti Saic Y Otros | Embotelladora del Atlántico S.A. | Subsidiary | Cash deposit | Other current financial assets | - | 226 | ||||||||||
| Tribunal Superior De Justicia De La Provincia De Córdoba | Embotelladora del Atlántico S.A. | Subsidiary | Deposit in court | Other non-current non-financial assets | - | 290 | ||||||||||
| DBC SA C CERVECERIA ARGENTINA SA ISEMBECK | Embotelladora del Atlántico S.A. | Subsidiary | Deposit in court | Other non-current non-financial assets | 28,129 | 41,465 | ||||||||||
| Coto Cicsa | Embotelladora del Atlántico S.A. | Subsidiary | Deposit in court | Other non-current non-financial assets | 5,001 | - | ||||||||||
| Cencosud | Embotelladora del Atlántico S.A. | Subsidiary | Deposit in court | Other non-current non-financial assets | 3,125 | - | ||||||||||
| Marcus A.Peña | Paraguay Refrescos | Subsidiary | Real estate | Property, Plant & Equipment | 3,955 | 4,164 | ||||||||||
| Mauricio J Cordero C | Paraguay Refrescos | Subsidiary | Real estate | Property, Plant & Equipment | 917 | 904 | ||||||||||
| José Ruoti Maltese | Paraguay Refrescos | Subsidiary | Real estate | Property, Plant & Equipment | 738 | 758 | ||||||||||
| Alejandro Galeano | Paraguay Refrescos | Subsidiary | Real estate | Property, Plant & Equipment | 1,275 | 1,251 | ||||||||||
| Ana Maria Mazó | Paraguay Refrescos | Subsidiary | Real estate | Property, Plant & Equipment | 1,213 | 1,191 | ||||||||||
| 33,865,874 | 31,816,784 | |||||||||||||||
F-86
Guarantees provided without obligation of assets included in the financial statements:
| Committed assets | Amounts involved | |||||||||||||||
| Guaranty creditor | Debtor name | Relationship | Guaranty | Type | 12.31.2019 | 12.31.2018 | ||||||||||
| ThCh$ | ThCh$ | |||||||||||||||
| Employee procedures | Rio de Janeiro Refrescos Ltda. | Subsidiary | Guaranty receipt | Legal proceeding | 2.819.285 | 2,601,353 | ||||||||||
| Administrative procedures | Rio de Janeiro Refrescos Ltda. | Subsidiary | Guaranty receipt | Legal proceeding | 10.432.633 | 8,233,853 | ||||||||||
| Federal Government | Rio de Janeiro Refrescos Ltda. | Subsidiary | Guaranty receipt | Legal proceeding | 138.635.908 | 116,192,877 | ||||||||||
| State Government | Rio de Janeiro Refrescos Ltda. | Subsidiary | Guaranty receipt | Legal proceeding | 54.803.911 | 43,015,207 | ||||||||||
| Sorocaba Refrescos | Rio de Janeiro Refrescos Ltda. | Associate | Loan | Guarantor | 3.715.186 | 3,586,095 | ||||||||||
| Others | Rio de Janeiro Refrescos Ltda. | Subsidiary | Guaranty receipt | Legal proceeding | 3.757.062 | 3,236,092 | ||||||||||
| Aduana de EZEIZA | Embotelladora del Atlántico S.A. | Subsidiary | Surety insurance | Faithful compliance of contract | 673.854 | 699,502 | ||||||||||
| Aduana de EZEIZA | Andina Empaques Argentina S.A. | Subsidiary | Surety insurance | Faithful compliance of contract | 506.623 | 182,459 | ||||||||||
F-87
24 – FINANCIAL RISK MANAGEMENT
The Company’s businesses are exposed to a variety of financial and market risks (including foreign exchange risk, interest rate risk and price risk). The Company’s global risk management program focuses on the uncertainty of financial markets and seeks to minimize potential adverse effects on the performance of the Company. The Company uses derivatives to hedge certain risks. A description of the primary policies established by the Company to manage financial risks are provided below:
Interest Rate Risk
As of December 31, 2019, the Company maintains all its debt liabilities at a fixed rate as to avoid fluctuations in financial expenses resulting from tax rate increases.
The Company’s greatest indebtedness corresponds to own issued Chilean local bonds at a fixed rate for UF 16,457 million denominated in UF (“UF”), a currency indexed to inflation in Chile (Company sales are correlated with the UF variation).
There is also the Company’s indebtedness on the international market through a 144A/RegS Bond at a fixed rate for USD 365 million (original amount issued USD 575 million and partial prepayment in October 2019 for USD 210 million), denominated in dollars, and practically 100% of which has been re-denominated to BRL through Cross Currency Swaps.
Credit risk
The credit risk to which the Company is exposed comes mainly from trade accounts receivable maintained with retailers, wholesalers and supermarket chains in domestic markets; and the financial investments held with banks and financial institutions, such as time deposits, mutual funds and derivative financial instruments.
| a. | Trade accounts receivable and other current accounts receivable |
Credit risk related to trade accounts receivable is managed and monitored by the area of Finance and Administration of each business unit. The Company has a wide base of more than 100 thousand clients implying a high level of atomization of accounts receivable, which are subject to policies, procedures and controls established by the Company. In accordance with such policies, credits must be based objectively, non-discretionary and uniformly granted to all clients of a same segment and channel, provided these will allow generating economic benefits to the Company. The credit limit is checked periodically considering payment behavior. Trade accounts receivable pending of payment are monitored on a monthly basis.
F-88
| i. | Sale Interruption: |
In accordance with Corporate Credit Policy, the interruption of sale must be within the following framework: when a customer has outstanding debts for an amount greater than USD 250,000, and over 60 days expired, sale is suspended. The General Manager in conjunction with the Finance and Administration Manager authorize exceptions to this rule, and if the outstanding debt should exceed USD 1,000,000, and in order to continue operating with that client, the authorization of the Chief Financial Officer is required. Notwithstanding the foregoing, each operation can define an amount lower than USD 250,000 according to the country’s reality.
| ii. | Impairment |
The impairment recognition policy establishes the following criteria for provisions: 30% is provisioned for 31 to 60 days overdue, 60% between 60 and 91 days, 90% between 91 and 120 days overdue and 100% for more than 120 days. Exemption of the calculation of global impairment is given to credits whose delays in the payment correspond to accounts disputed with the customer whose nature is known and where all necessary documentation for collection is available, therefore, there is no uncertainty on recovering them. However, these accounts also have an impairment provision as follows: 40% for 91 to 120 days overdue, 80% between 120 and 170, and 100% for more than 170 days.
| iii. | Prepayment to suppliers |
The Policy establishes that USD 25,000 prepayments can only be granted to suppliers if its value is properly and fully provisioned. The Treasurer of each subsidiary must approve supplier warranties that the Company receives for prepayments before signing the respective service contract. In the case of domestic suppliers, a warranty ballot (or the instrument existing in the country) shall be required, in favor of Andina executable in the respective country, non-endorsable, payable on demand or upon presentation and its validity will depend on the term of the contract. In the case of foreign suppliers, a stand-by credit letter will be required which shall be issued by a first line bank; in the event that this document is not issued in the country where the transaction is done, a direct bank warranty will be required. Subsidiaries can define the best way of safeguarding the Company’s assets for prepayments under USD 25,000.
| iv. | Guarantees |
In the case of Chile, we have insurance with Compañía de Seguros de Crédito Continental S.A. (AA rating –according to Fitch Chile and Humphreys rating agencies) covering the credit risk regarding trade debtors in Chile.
The rest of the operations do not have credit insurance, instead mortgage guarantees are required for volume operations of wholesalers and distributors in the case of trade accounts receivables. In the case of other debtors, different types of guarantees are required according to the nature of the credit granted.
Historically, uncollectible trade accounts have been lower than 0.5% of the Company’s total sales.
F-89
| b. | Financial investments |
The Company has a Policy that is applicable to all the companies of the group in order to cover credit risks for financial investments, restricting both the types of instruments as well as the institutions and degree of concentration. The companies of the group can invest in:
| i. | Time deposits: only in banks or financial institutions that have a risk rating equal or higher than Level 1 (Fitch) or equivalent for deposits of less than 1 year and rated A or higher (S&P) or equivalent for deposits of more than 1 year. |
| ii. | Mutual funds: investments with immediate liquidity and no risk of capital (funds composed of investments at a fixed-term, current account, fixed rate Tit BCRA, negotiable obligations, Over Night, etc.) in all those counter-parties that have a rating greater than or equal to AA-(S&P) or equivalent, Type 1 Pacts and Mutual Funds, with a rating greater than or equal to AA+ (S&P) or equivalent. |
| iii. | Other investment alternatives must be evaluated and authorized by the office of the Chief Financial Officer. |
Exchange Rate Risk
The company is exposed to three types of risk caused by exchange rate volatility:
a) Exposure of foreign investment
This risk originates from the translation of net investment from the functional currency of each country (Brazilian Real, Paraguayan Guaraní, and Argentine Peso) to the Parent Company’s reporting currency (Chilean Peso). Appreciation or devaluation of the Chilean Peso with respect to the functional currencies of each country, originates decreases and increases in equity, respectively. The Company does not hedge this risk.
a.1 Investment in Argentina
As of December 31, 2019, the Company maintains a net investment of ThCh$ 159,998,762. in Argentina, composed by the recognition of assets amounting to ThCh$ 241,470,298 and liabilities amounting to ThCh$ 81,471,536. These investments accounted for 22.0% of the Company’s consolidated sales revenues
As of December 31, 2019, the Argentine peso devalued by 32.2% with respect to the Chilean peso.
If the exchange rate of the Argentine Peso devalued an additional 5% with respect to the Chilean Peso, the Company would have lower income from the operation in Argentina of ThCh$ 309,180 and a decrease in equity of ThCh$ 4,568,317, originated by lower asset recognition of ThCh$ 7,801,317 and by lower liabilities recognition of ThCh$ 3,233,000.
F-90
a.2 Investment in Brazil
As of December 31, 2019, the Company maintains a net investment of CLP 327,782,367 thousand in Brazil, composed by the recognition of assets amounting to ThCh$ 958,328,527 and liabilities amounting to ThCh$ 630,546,160. These investments accounted for 34.8% of the Company's consolidated sales revenues.
As of December 31, 2019, the Brazilian Real devalued by 3.6% with respect to the Chilean peso.
If the exchange rate of the Brazilian Real devalued an additional 5% with respect to the Chilean Peso, the Company would have lower income from the operation in Brazil of ThCh$ 3,959,257 and a decrease in equity of ThCh$ 13,126,491, originated by lower asset recognition of ThCh$ 40,179,105 and by lower liabilities recognition of ThCh$ 27,052,614.
a.3 Investment in Paraguay
As of December 31, 2019, the Company maintains a net investment of ThCh$ 247,424,752 in Paraguay, composed by the recognition of assets amounting to ThCh$ 289,576,010 and liabilities amounting to ThCh$ 42,151,258. These investments accounted for 8.9% of the Company's consolidated sales revenues.
As of December 31, 2019, the Paraguayan Guarani devalued by 0.5% with respect to the Chilean peso.
If the exchange rate of the Paraguayan Guaraní devalued by 5% with respect to the Chilean Peso, the Company would have lower income from the operations in Paraguay of ThCh$ 1,365,519 and a decrease in equity of ThCh$ 11,749,100 originated by lower asset recognition of ThCh$ 13,559,529 and lower liabilities recognition of ThCh$ 1,810,429.
b) Net exposure of assets and liabilities in foreign currency
This risk stems mostly from carrying liabilities in US dollar, so the volatility of the US dollar with respect to the functional currency of each country generates a variation in the valuation of these obligations, with consequent effect on results.
As of December 31, 2019, the Company maintains a net debt position with a net liability position in USD totaling ThCh$ 258,679,281, basically composed of bonds payable and leasing contracts for ThCh$ 275,412,530 partially offset by financial assets denominated in dollars for ThCh$ 16,733,249.
All U.S. Dollar liabilities amounting to ThCh$ 275,412,530 correspond to dollar liabilities of the Chilean, Argentinean and Brazilian operations and are, therefore, exposed to the volatility of the Chilean peso against the U.S. Dollar.
In order to protect the Company from the effects on income resulting from the volatility of the Brazilian Real and the Chilean Peso against the U.S. dollar, the Company maintains derivative contracts (cross currency swaps) to cover almost 100% of US dollar-denominated financial liabilities.
By designating such contracts as hedging derivatives, the effects on income for variations in the Chilean Peso and the Brazilian Real against the US dollar, are mitigated annulling its exposure to exchange rates.
The Company's net exposure as of December 31, 2019, to foreign currency over existing assets and liabilities, discounting the derivatives contracts, is an asset position of ThCh$10,867,119.
F-91
c) Exposure of assets purchased or indexed to foreign currency
This risk originates from purchases of raw materials and investments in Property, plant and equipment, whose values are expressed in a currency other than the functional currency of the subsidiary. Changes in the value of costs or investments can be generated through time, depending on the volatility of the exchange rate.
In order to minimize this risk, the Company maintains a currency hedging policy stipulating that it is necessary to enter into foreign currency derivatives contracts to lessen the effect of the exchange rate over cash expenditures expressed in US dollars, corresponding mainly to payment to suppliers of raw materials in each of the operations. This policy stipulates a 12-month forward horizon.
Commodities risk
The Company is subject to a risk of price fluctuations in the international markets mainly for sugar, PET resin and aluminum, which are inputs used to produce beverages and containers, which together, account for 35% to 40% of operating costs. Procurement and anticipated purchase contracts are made frequently to minimize and/or stabilize this risk. To minimize this risk or stabilize often supply contracts and anticipated purchases are made when market conditions warrant.
Liquidity risk
The products we sell are mainly paid for in cash and short-term credit; therefore, the Company´s main source of financing comes from the cash flow of our operations. This cash flow has historically been sufficient to cover the investments necessary for the normal course of our business, as well as the distribution of dividends approved by the General Shareholders’ Meeting. Should additional funding be required for future geographic expansion or other needs, the main sources of financing to consider are: (i) debt offerings in the Chilean and foreign capital markets (ii) borrowings from commercial banks, both internationally and in the local markets where the Company operates; and (iii) public equity offerings
The following table presents an analysis of the Company’s committed maturities for liability payments throughout the coming years:
| Maturity | ||||||||||||||||||||
| Item | 1 year | More than 1 year up to 2 |
More than 2 years up to 3 |
More than 3 up to 4 |
More than 5 years |
|||||||||||||||
| ThCh$ | ThCh$ | ThCh$ | ThCh$ | ThCh$ | ||||||||||||||||
| Bank debt | 724,370 | 1,439,072 | 786,812 | 44,621 | 44,621 | |||||||||||||||
| Bonds payable | 42,979,308 | 41,194,718 | 41,041,811 | 314,179,008 | 585,387,621 | |||||||||||||||
| Lease obligations | 8,663,557 | 11,228,497 | 10,933,557 | 10,817,417 | 18,479,429 | |||||||||||||||
| Contractual obligations | 19,108,905 | 63,130,570 | 5,654,968 | 4,823,313 | 2,499,886 | |||||||||||||||
| Total | 71,476,140 | 116,992,857 | 58,417,148 | 329,864,359 | 606,411,557 | |||||||||||||||
F-92
Other expenses by nature are:
| 01.01.2019 | 01.01.2018 | 01.01.2017 | ||||||||||
| Details | 12.31.2019 | 12.31.2018 | 12.31.2017 | |||||||||
| ThCh$ | ThCh$ | ThCh$ | ||||||||||
| Direct production costs | 877,716,948 | 759,229,954 | 815,455,280 | |||||||||
| Payroll and employee benefits | 273,123,010 | 266,966,841 | 287,458,526 | |||||||||
| Transportation and distribution | 138,486,337 | 137,428,173 | 163,361,088 | |||||||||
| Advertising | 27,113,322 | 17,345,951 | 29,209,904 | |||||||||
| Depreciation and amortization | 111,087,284 | 99,594,446 | 99,163,891 | |||||||||
| Repairs and maintenance | 30,528,180 | 28,120,098 | 34,253,824 | |||||||||
| Other expenses | 83,188,784 | 138,860,648 | 181,249,647 | |||||||||
| Total (1) | 1,541,243,865 | 1,447,546,111 | 1,610,152,160 | |||||||||
(1) Corresponds to the addition of cost of sales, administration expenses and distribution cost.
Other income by function is detailed as follows:
| 01.01.2019 | 01.01.2018 | 01.01.2017 | ||||||||||
| Details | 12.31.2019 | 12.31.2018 | 12.31.2017 | |||||||||
| ThCh$ | ThCh$ | ThCh$ | ||||||||||
| Gain on disposal of Property, plant and equipment | 265,514 | 1,984,547 | 312,470 | |||||||||
| Recovery AFIP claim | - | 232,617 | - | |||||||||
| Recovery PIS and COFINS credits (1) | 40,281,550 | - | - | |||||||||
| Others | 400,094 | 392,004 | 238,364 | |||||||||
| Total | 40,947,158 | 2,609,168 | 550,834 | |||||||||
| (1) | See Note 6 for more information regarding recovery |
F-93
27 – OTHER EXPENSES BY FUNCTION
Other expenses by function are detailed as follows:
| 01.01.2019 | 01.01.2018 | 01.01.2017 | ||||||||||
| Details | 12.31.2019 | 12.31.2018 | 12.31.2017 | |||||||||
| ThCh$ | ThCh$ | ThCh$ | ||||||||||
| Contingencies and non-operating fees | 17,690,171 | 10,192,495 | 5.377.190 | |||||||||
| Tax on bank debits | 4,356,973 | 4,653,929 | 7,669,234 | |||||||||
| Write-offs, disposal and loss of Property, plant and equipment | 2,978,194 | 262,366 | 3,025,497 | |||||||||
| Others | 1,157,509 | 948,973 | 629,550 | |||||||||
| Total | 26,182,847 | 16,057,763 | 16,701,471 | |||||||||
28 – FINANCIAL INCOME AND EXPENSES
Financial income and expenses are detailed as follows:
| a) | Financial income |
| 01.01.2019 | 01.01.2018 | 01.01.2017 | ||||||||||
| Detail | 12.31.2019 | 12.31.2018 | 12.31.2017 | |||||||||
| ThCh$ | ThCh$ | ThCh$ | ||||||||||
| Interest income | 3,249,550 | 1,046,580 | 8,370,338 | |||||||||
| Guaranty restatement Ipiranga acquisition | 27,219 | - | - | |||||||||
| Recovery PIS and COFINS credits (1) | 39,780,620 | - | - | |||||||||
| Other financial income | 2,098,402 | 2,893,664 | 2,824,037 | |||||||||
| Total | 45,155,791 | 3,940,244 | 11,194,375 | |||||||||
| (1) | See Note 6 for more information regarding recovery |
| b) | Financial costs |
| 01.01.2019 | 01.01.2018 | 01.01.2017 | ||||||||||
| Details | 12.31.2019 | 12.31.2018 | 12.31.2017 | |||||||||
| ThCh$ | ThCh$ | ThCh$ | ||||||||||
| Bond interest | 38,153,036 | 38,547,682 | 42,178,816 | |||||||||
| Bank loan interest | 1,337,670 | 1,828,588 | 5,553,485 | |||||||||
| Other financial costs | 6,718,314 | 14,638,390 | 7,488,068 | |||||||||
| Total | 46,209,020 | 55,014,660 | 55,220,369 | |||||||||
F-94
Other (losses) gains are detailed as follows:
| 01.01.2019 | 01.01.2018 | 01.01.2017 | ||||||||||
| Details | 12.31.2019 | 12.31.2018 | 12.31.2017 | |||||||||
| ThCh$ | ThCh$ | ThCh$ | ||||||||||
| (Losses) gains on ineffective portion of hedge derivatives | - | (2,707,802 | ) | (2,536,079 | ) | |||||||
| Other income and expenses | 2,876 | (57 | ) | (1,190 | ) | |||||||
| Total | 2,876 | (2,707,859 | ) | (2,537,269 | ) | |||||||
F-95
30. LOCAL AND FOREIGN CURRENCY
Local and foreign currency balances are the following:
| CURRENT ASSETS | 12.31.2019 | 12.31.2018 | ||||||
| THCH$ | THCH$ | |||||||
| Cash and cash equivalent | 157,567,986 | 137,538,613 | ||||||
| USD | 16,733,249 | 5,917,041 | ||||||
| EUR | 9,722 | 51,401 | ||||||
| CLP | 78,420,966 | 86,121,695 | ||||||
| BRL | 46,189,977 | 28,040,970 | ||||||
| ARS | 3,830,199 | 6,726,906 | ||||||
| PGY | 12,383,873 | 10,680,600 | ||||||
| Other financial assets, current | 347,278 | 683,567 | ||||||
| CLP | 275,407 | 355,126 | ||||||
| BRL | 13,498 | 14,040 | ||||||
| ARS | 16,575 | 300,359 | ||||||
| PGY | 41,798 | 14,042 | ||||||
| Other non-financial assets, current | 16,188,965 | 5,948,923 | ||||||
| USD | 893,571 | 45,053 | ||||||
| EUR | 615,636 | - | ||||||
| UF | 410,203 | 78,623 | ||||||
| CLP | 5,642,901 | 3,589,253 | ||||||
| BRL | 1,738,793 | 1,275,073 | ||||||
| ARS | 3,918,728 | 460,125 | ||||||
| PGY | 2,969,133 | 500,796 | ||||||
| Trade accounts and other accounts receivable | 191,077,588 | 174,113,323 | ||||||
| USD | 1,431,079 | 863,794 | ||||||
| EUR | - | 52,332 | ||||||
| UF | 453,469 | 1,414,800 | ||||||
| CLP | 83,328,449 | 73,028,244 | ||||||
| BRL | 79,586,461 | 66,585,089 | ||||||
| ARS | 19,088,164 | 25,000,141 | ||||||
| PGY | 7,189,966 | 7,168,923 | ||||||
| Accounts receivable related entities | 10,835,768 | 9,450,263 | ||||||
| USD | 45,644 | 26,557 | ||||||
| CLP | 9,157,922 | 6,911,814 | ||||||
| ARS | 1,632,202 | 2,511,892 | ||||||
| Inventory | 147,641,224 | 151,319,709 | ||||||
| USD | 6,027,076 | 2,197,382 | ||||||
| EUR | - | 12,522 | ||||||
| CLP | 48,320,784 | 50,130,341 | ||||||
| BRL | 43,820,564 | 36,797,523 | ||||||
| ARS | 34,262,914 | 46,394,230 | ||||||
| PGY | 15,209,886 | 15,787,711 | ||||||
| Current tax assets | 9,815,294 | 2,532,056 | ||||||
| CLP | 9,815,294 | - | ||||||
| BRL | - | 2,532,056 | ||||||
| Total current assets | 533,474,103 | 481,586,454 | ||||||
| USD | 25,130,619 | 9,049,827 | ||||||
| EUR | 625,358 | 116,255 | ||||||
| UF | 863,672 | 1,493,423 | ||||||
| CLP | 234,961,723 | 220,136,473 | ||||||
| BRL | 171,349,293 | 135,244,751 | ||||||
| ARS | 62,748,782 | 81,393,653 | ||||||
| PGY | 37,794,656 | 34,152,072 | ||||||
F-96
| NON-CURRENT ASSETS | 12.31.2019 | 12.31.2018 | ||||||
| ThCh$ | ThCh$ | |||||||
| Other non-current financial assets | 110,784,311 | 97,362,295 | ||||||
| UF | 1,216,865 | - | ||||||
| BRL | 98,918,457 | 87,446,661 | ||||||
| ARS | 10,648,989 | 9,915,634 | ||||||
| Other non-current, non-financial assets | 125,636,150 | 34,977,264 | ||||||
| USD | - | 22,917 | ||||||
| UF | 318,533 | 314,283 | ||||||
| CLP | 47,531 | 47,532 | ||||||
| BRL | 122,922,979 | 32,070,120 | ||||||
| ARS | 2,223,600 | 2,315,682 | ||||||
| PGY | 123,507 | 206,730 | ||||||
| Accounts receivable, non-current | 523,769 | 1,270,697 | ||||||
| UF | 465,371 | 1,204,097 | ||||||
| ARS | 636 | 90 | ||||||
| PGY | 57,762 | 66,510 | ||||||
| Accounts receivable related entities, non-current | 283,118 | 74,340 | ||||||
| CLP | 283,118 | 74,340 | ||||||
| Investments accounted for using the equity method | 99,866,733 | 102,410,945 | ||||||
| CLP | 49,703,673 | 50,136,221 | ||||||
| BRL | 50,163,060 | 52,274,724 | ||||||
| ARS | - | - | ||||||
| Intangible assets other than goodwill | 675,075,375 | 668,822,553 | ||||||
| USD | 3,959,421 | 4,960,399 | ||||||
| CLP | 307,324,953 | 306,508,710 | ||||||
| BRL | 189,240,893 | 182,657,545 | ||||||
| ARS | 2,708,445 | 2,101,571 | ||||||
| PGY | 171,841,663 | 172,594,328 | ||||||
| Goodwill | 121,221,661 | 117,229,173 | ||||||
| CLP | 9,523,767 | 9,523,767 | ||||||
| BRL | 74,653,328 | 72,059,356 | ||||||
| ARS | 29,750,238 | 28,318,129 | ||||||
| PGY | 7,294,328 | 7,327,921 | ||||||
| Property, plant & equipment | 722,718,863 | 710,770,968 | ||||||
| USD | - | - | ||||||
| EUR | - | 381,732 | ||||||
| CLP | 282,861,852 | 271,625,978 | ||||||
| BRL | 251,080,517 | 252,674,783 | ||||||
| ARS | 119,784,304 | 117,532,176 | ||||||
| PGY | 68,992,190 | 68,556,299 | ||||||
| Deferred tax assets | 1,364,340 | - | ||||||
| CLP | 1,364,340 | - | ||||||
| Total non-current assets | 1,857,474,320 | 1,732,918,235 | ||||||
| USD | 3,959,421 | 4,983,316 | ||||||
| EUR | - | 381,732 | ||||||
| UF | 2,000,769 | 1,518,380 | ||||||
| CLP | 651,109,234 | 637,916,548 | ||||||
| BRL | 786,979,234 | 679,183,189 | ||||||
| ARS | 165,116,212 | 160,183,282 | ||||||
| PGY | 248,309,450 | 248,751,788 | ||||||
F-97
| 12.31.2019 | 12.31.2018 | |||||||||||||||||||||||
| CURRENT LIABILITIES | Up to 90 days | 90 days up to1 year |
Total | Up to 90 days | 90 days up to1 year |
Total | ||||||||||||||||||
| THCH$ | THCH$ | THCH$ | THCH$ | THCH$ | THCH$ | |||||||||||||||||||
| Other financial liabilities, current | 9,719,894 | 30,873,984 | 40,593,878 | 9,377,421 | 46,737,556 | 56,114,977 | ||||||||||||||||||
| USD | 55,388 | 3,147,441 | 3,202,829 | 130,829 | 3,304,011 | 3,434,840 | ||||||||||||||||||
| UF | 7,535,228 | 11,836,936 | 19,372,164 | 7,831,899 | 10,536,509 | 18,368,408 | ||||||||||||||||||
| CLP | 842,221 | 11,700,946 | 12,543,167 | - | 9,681,676 | 9,681,676 | ||||||||||||||||||
| BRL | 1,153,072 | 2,119,141 | 3,272,213 | 1,413,622 | 20,833,877 | 22,247,499 | ||||||||||||||||||
| ARS | 75,060 | 704,921 | 779,981 | 1,071 | 1,357,285 | 1,358,356 | ||||||||||||||||||
| PGY | 58,925 | 1,364,599 | 1,423,524 | - | 1,024,198 | 1,024,198 | ||||||||||||||||||
| Trade accounts and other accounts payable, current | 228,259,216 | 15,441,337 | 243,700,553 | 234,715,484 | 3,394,363 | 238,109,847 | ||||||||||||||||||
| USD | 10,049,567 | - | 10,049,567 | 14,514,082 | - | 14,514,082 | ||||||||||||||||||
| EUR | 2,024,156 | - | 2,024,156 | 4,311,724 | 59,951 | 4,371,675 | ||||||||||||||||||
| UF | 2,044,871 | - | 2,044,871 | 192,055 | - | 192,055 | ||||||||||||||||||
| CLP | 84,602,547 | 15,441,337 | 100,043,884 | 81,099,246 | 3,334,412 | 84,433,658 | ||||||||||||||||||
| BRL | 75,051,089 | - | 75,051,089 | 68,940,973 | - | 68,940,973 | ||||||||||||||||||
| ARS | 40,826,489 | 40,826,489 | 54,846,437 | - | 54,846,437 | |||||||||||||||||||
| PGY | 13,660,497 | - | 13,660,497 | 10,805,605 | - | 10,805,605 | ||||||||||||||||||
| Other currencies | - | - | - | 5,362 | - | 5,362 | ||||||||||||||||||
| Accounts payable to related entities, current | 53,637,601 | - | 53,637,601 | 45,687,476 | 140,383 | 45,827,859 | ||||||||||||||||||
| USD | - | - | - | - | ||||||||||||||||||||
| CLP | 28,471,399 | - | 28,471,399 | 27,729,583 | 140,383 | 27,869,966 | ||||||||||||||||||
| BRL | 19,279,132 | - | 19,279,132 | 12,478,179 | - | 12,478,179 | ||||||||||||||||||
| ARS | 5,887,070 | - | 5,887,070 | 5,479,714 | - | 5,479,714 | ||||||||||||||||||
| PGY | - | - | - | - | - | - | ||||||||||||||||||
| Other current provisions | 1,637,799 | 431,185 | 2,068,984 | 1,789,275 | 1,696,338 | 3,485,613 | ||||||||||||||||||
| CLP | 1,637,799 | 427,697 | 2,065,496 | 1,789,275 | 1,681,178 | 3,470,453 | ||||||||||||||||||
| PGY | - | 3,488 | 3,488 | - | 15,160 | 15,160 | ||||||||||||||||||
| Current tax liabilities | 3,097,223 | 3,665,044 | 6,762,267 | 4,302,370 | 5,036,242 | 9,338,612 | ||||||||||||||||||
| CLP | 896,975 | - | 896,975 | 4,302,370 | 1,184,842 | 5,487,212 | ||||||||||||||||||
| BRL | 2,107,381 | - | 2,107,381 | - | - | - | ||||||||||||||||||
| ARS | 92,867 | 3,446,054 | 3,538,921 | - | 2,980,634 | 2,980,634 | ||||||||||||||||||
| PGY | - | 218,990 | 218,990 | - | 870,766 | 870,766 | ||||||||||||||||||
| Employee benefits current provisions | 26,513,813 | 11,879,041 | 38,392,854 | 10,189,264 | 23,021,715 | 33,210,979 | ||||||||||||||||||
| CLP | 1,241,603 | 5,509,351 | 6,750,954 | 1,177,114 | 4,854,163 | 6,031,277 | ||||||||||||||||||
| BRL | 20,681,694 | - | 20,681,694 | - | 17,180,455 | 17,180,455 | ||||||||||||||||||
| ARS | 4,590,516 | 5,260,142 | 9,850,658 | 9,012,150 | - | 9,012,150 | ||||||||||||||||||
| PGY | - | 1,109,548 | 1,109,548 | - | 987,097 | 987,097 | ||||||||||||||||||
| Other current non-financial liabilities | 328,441 | 26,173,774 | 26,502,215 | 1,346,839 | 32,427,375 | 33,774,214 | ||||||||||||||||||
| CLP | 327,847 | 26,064,658 | 26,392,505 | 869,964 | 32,276,377 | 33,146,341 | ||||||||||||||||||
| ARS | 594 | 5,286 | 5,880 | 476,875 | - | 476,875 | ||||||||||||||||||
| PGY | - | 103,830 | 103,830 | - | 150,998 | 150,998 | ||||||||||||||||||
| Total current liabilities | 323,193,987 | 88,464,365 | 411,658,352 | 307,408,129 | 112,453,972 | 419,862,101 | ||||||||||||||||||
| USD | 10,104,955 | 3,147,441 | 13,252,396 | 14,644,911 | 3,304,011 | 17,948,922 | ||||||||||||||||||
| EUR | 2,024,156 | - | 2,024,156 | 4,311,724 | 59,951 | 4,371,675 | ||||||||||||||||||
| UF | 9,580,099 | 11,836,936 | 21,417,035 | 8,023,954 | 10,536,509 | 18,560,463 | ||||||||||||||||||
| CLP | 118,020,391 | 59,143,989 | 177,164,380 | 116,967,552 | 53,153,031 | 170,120,583 | ||||||||||||||||||
| BRL | 118,272,368 | 2,119,141 | 120,391,509 | 82,832,774 | 38,014,332 | 120,847,106 | ||||||||||||||||||
| ARS | 51,472,596 | 9,416,403 | 60,888,999 | 69,816,247 | 4,337,919 | 74,154,166 | ||||||||||||||||||
| PGY | 13,719,422 | 2,800,455 | 16,519,877 | 10,805,605 | 3,048,219 | 13,853,824 | ||||||||||||||||||
| Other currencies | - | - | - | 5,362 | - | 5,362 | ||||||||||||||||||
F-98
| 12.31.2019 | 12.31.2018 | |||||||||||||||||||||||||||||||
| NON-CURRENT LIABILITIES | More than 1 year up to 3 |
More than 3 and up to 5 |
More than 5 years |
Total | More than 1 year up to 3 |
More than 3 and up to 5 |
More than 5 years |
Total | ||||||||||||||||||||||||
| ThCh$ | ThCh$ | ThCh$ | ThCh$ | ThCh$ | ThCh$ | ThCh$ | ThCh$ | |||||||||||||||||||||||||
| Other financial liabilities, non-current | 34,794,568 | 299,661,490 | 408,870,999 | 743,327,057 | 28,642,101 | 276,409,074 | 411,512,603 | 716,563,778 | ||||||||||||||||||||||||
| USD | 509,366 | 271,700,335 | - | 272,209,701 | - | 250,976,154 | - | 250,976,154 | ||||||||||||||||||||||||
| UF | 22,584,954 | 24,627,105 | 400,393,581 | 447,605,640 | 25,634,958 | 23,105,123 | 402,045,609 | 450,785,690 | ||||||||||||||||||||||||
| CLP | 7,926,056 | - | - | 7,926,056 | - | - | - | - | ||||||||||||||||||||||||
| BRL | 3,319,514 | 3,334,050 | 8,477,418 | 15,130,982 | 3,007,143 | 2,327,797 | 9,466,994 | 14,801,934 | ||||||||||||||||||||||||
| ARS | 55,222 | - | - | 55,222 | - | - | - | - | ||||||||||||||||||||||||
| PGY | 399,456 | - | - | 399,456 | - | - | - | - | ||||||||||||||||||||||||
| Accounts payable, non-current | 619,587 | - | - | 619,587 | 735,665 | - | - | 735,665 | ||||||||||||||||||||||||
| USD | - | - | - | - | 585,289 | - | - | 585,289 | ||||||||||||||||||||||||
| CLP | 618,509 | - | - | 618,509 | 148,680 | - | - | 148,680 | ||||||||||||||||||||||||
| ARS | 1,078 | - | - | 1,078 | 1,696 | - | - | 1,696 | ||||||||||||||||||||||||
| Accounts payable related entities | 19,777,812 | - | - | 19,777,812 | - | - | - | - | ||||||||||||||||||||||||
| BRL | 19,777,812 | - | - | 19,777,812 | - | - | - | - | ||||||||||||||||||||||||
| Other provisions, non-current | 968,404 | 66,070,162 | - | 67,038,566 | 3,448,042 | 55,518,871 | - | 58,966,913 | ||||||||||||||||||||||||
| CLP | - | - | - | - | 2,500,000 | - | - | 2,500,000 | ||||||||||||||||||||||||
| BRL | - | 66,070,162 | - | 66,070,162 | - | 55,518,871 | - | 55,518,871 | ||||||||||||||||||||||||
| ARS | 968,404 | - | - | 968,404 | 948,042 | - | - | 948,042 | ||||||||||||||||||||||||
| Deferred Tax liabilities | 12,834,788 | 49,848,536 | 106,766,423 | 169,449,747 | 16,607,605 | 101,512,040 | 27,126,303 | 145,245,948 | ||||||||||||||||||||||||
| UF | - | - | 1,298,050 | 1,298,050 | - | - | - | - | ||||||||||||||||||||||||
| CLP | 1,449,404 | 181,418 | 90,271,026 | 91,901,848 | 497,175 | 81,630,530 | 11,899,975 | 94,027,680 | ||||||||||||||||||||||||
| BRL | - | 49,667,118 | - | 49,667,118 | - | 19,881,510 | - | 19,881,510 | ||||||||||||||||||||||||
| ARS | 11,385,384 | - | - | 11,385,384 | 16,110,430 | - | - | 16,110,430 | ||||||||||||||||||||||||
| PGY | - | - | 15,197,347 | 15,197,347 | - | - | 15,226,328 | 15,226,328 | ||||||||||||||||||||||||
| Employee benefits non-current provisions | 1.114.051 | 148,954 | 8,910,349 | 10,173,354 | 742,297 | 240,148 | 8,433,096 | 9,415,541 | ||||||||||||||||||||||||
| CLP | 461,587 | 148,954 | 8,910,349 | 9,520,890 | 230,528 | 240,148 | 8,433,096 | 8,903,772 | ||||||||||||||||||||||||
| ARS | 88,090 | - | - | 88,090 | - | - | - | - | ||||||||||||||||||||||||
| PGY | 564,374 | - | - | 564,374 | 511,769 | - | - | 511,769 | ||||||||||||||||||||||||
| Total non-current liabilities | 70,109,210 | 415,729,142 | 524,547,771 | 1,010,386,123 | 50,175,710 | 433,680,133 | 447,072,002 | 930,927,845 | ||||||||||||||||||||||||
| USD | 509,366 | 271,700,335 | - | 272,209,701 | 585,289 | 250,976,154 | - | 251,561,443 | ||||||||||||||||||||||||
| UF | 22,584,954 | 24,627,105 | 401,691,631 | 448,903,690 | 25,634,958 | 23,105,123 | 402,045,609 | 450,785,690 | ||||||||||||||||||||||||
| CLP | 10,455,556 | 330,372 | 99,181,375 | 109,967,303 | 3,376,383 | 81,870,678 | 20,333,071 | 105,580,132 | ||||||||||||||||||||||||
| BRL | 23,097,326 | 119,071,330 | 8,477,418 | 150,646,074 | 3,007,143 | 77,728,178 | 9,466,994 | 90,202,315 | ||||||||||||||||||||||||
| ARS | 12,498,178 | - | - | 12,498,178 | 17,060,168 | - | - | 17,060,168 | ||||||||||||||||||||||||
| PGY | 963,830 | - | 15,197,347 | 16,161,177 | 511,769 | - | 15,226,328 | 15,738,097 | ||||||||||||||||||||||||
F-99
i) On January 21, 2020, the Company issued corporate bonds on the international market for USD 300 million. The use of proceeds from this operation will be for general corporate purposes which could include the eventual payment of existing liabilities, financing of potential acquisitions and improving the liquidity of the Company. The transaction consisted of issuing a 30-year bond totaling USD 300 million with a bullet structure and an annual coupon rate of 3.950%.
At the same time, derivatives (Cross Currency Swaps) have been contracted hedging 100% of the bond's financial liabilities that are denominated in U.S. dollars by redenominating that liability to UF.
ii) On February 24, 2020, the tax reform was approved in Chile, which becomes effective immediately, however, most of the effects will begin to materialize in the 2021 Income Tax Statement, the Company will assess the possible impacts in the relevant period.
iii) As a result of the impact that the ongoing COVID-19 pandemic is having across the world, including its more recent outbreak in the countries where we operate, we have taken measures necessary to protect the health and safety of our employees and to ensure the continuity of our operations. Among the measures we have taken are the following:
| • | the launch of a campaign to educate our employees on actions to be taken to avoid the spread of the virus; |
| • | sending home any employee that has been exposed to the virus; |
| • | implementation of additional cleaning protocols for our facilities; |
| • | modifying certain work practices and activities, without affecting our operational standards; for instance, home office has been implemented for those employees whose work can be performed remotely, and domestic and international traveling has been canceled; and |
| • | providing personal protection and cleaning products (including face masks and sanitizers) to those employees who need to keep working at our plants and distribution centers or in the transportation of our products. |
Beginning mid-March 2020, governments around the world, including in the countries where we operate, have adopted extraordinary measures to contain the spread of COVID-19 and reduce infection rates, including, in some cases, the closing of schools, universities, shopping centers, restaurants and bars, prohibiting social gathering events, issuing stay-at-home orders and establishing quarantine requirements, imposing additional sanitary requirements on exports and imports, and limiting international travel and closing borders. Governments in the countries where we operate have also announced economic stimulus programs for families and businesses, including in Argentina a temporary restriction on workforce reductions. These government measures are affecting our Company and our customers. As these measures become more restrictive or are extended in time, our Company’s priority will continue to be to protect the health and safety of our employees and to continue operating to serve our customers and communities in the best way we can. To date, our operations have not been required to close and we are not aware of the virus affecting any significant part of our workforce.
Since mid-March 2020, as a result of the ongoing COVID-19 pandemic and government measures to contain the virus, we have experienced volatility in our sales volume across our channels. During this period, we have experienced, on a consolidated basis, a sharp decline in sales volumes in our on premise channel, which primarily consists of restaurants, bars and similar establishments that have been temporarily shut down by government measures. We have also experienced a decline in our wholesale channel and more moderate overall declines in our supermarkets and traditional channels. These changes in our sales volumes, however, have varied significantly across the four countries where we operate. Because these changes in sales volumes are very recent, and the pandemic and government measures are evolving rapidly, we believe it is too soon to draw conclusions about longer term trends in consumer spending patterns and how they may affect our future operating and financial results.
Due to uncertainties regarding the COVID-19 pandemic and government restrictions, including how long these conditions may persist, and uncertainties regarding the effects they will have on our sales volumes and our business in general, we cannot predict accurately the ultimate financial impact on our Company. In any event, we estimate that we will not face liquidity constraints, or difficulties in complying with covenants under our debt instruments. We do not anticipate any significant provisions or impairments at this time. In addition, we are reviewing our investment and expense plan for the year to adapt it to these new trends.
No other events have occurred after December 31, 2019 that may significantly affect the Company's consolidated financial situation.
F-100