UNITED STATES
SECURITIES AND EXCHANGE COMMISSION
Washington, D.C. 20549
SCHEDULE 14A
Proxy Statement Pursuant to Section 14(a) of the
Securities Exchange Act of 1934
(Amendment No. )
Filed by the Registrant ☒ Filed by a Party other than the Registrant ☐
Check the appropriate box:
| ☐ | Preliminary Proxy Statement | |||
| ☐ | Confidential, for Use of the Commission Only (as permitted by Rule 14a-6(e)(2)) | |||
| ☐ | Definitive Proxy Statement | |||
| ☒ | Definitive Additional Materials | |||
| ☐ | Soliciting Material Pursuant to §240.14a-12 | |||
DOMTAR CORPORATION | ||||
| (Name of Registrant as Specified In Its Charter) | ||||
| (Name of Person(s) Filing Proxy Statement, if other than the Registrant) | ||||
| Payment of Filing Fee (Check the appropriate box): | ||||
| ☒ | No fee required. | |||
| ☐ | Fee computed on table below per Exchange Act Rules 14a-6(i)(1) and 0-11. | |||
| (1) | Title of each class of securities to which transaction applies:
| |||
|
| ||||
| (2) | Aggregate number of securities to which transaction applies:
| |||
|
| ||||
| (3) | Per unit price or other underlying value of transaction computed pursuant to Exchange Act Rule 0-11 (set forth the amount on which the filing fee is calculated and state how it was determined):
| |||
|
| ||||
| (4) | Proposed maximum aggregate value of transaction:
| |||
|
| ||||
| (5) | Total fee paid: | |||
|
| ||||
| ☐ | Fee paid previously with preliminary materials. | |||
| ☐ | Check box if any part of the fee is offset as provided by Exchange Act Rule 0-11(a)(2) and identify the filing for which the offsetting fee was paid previously. Identify the previous filing by registration statement number, or the Form or Schedule and the date of its filing. | |||
| (1) | Amount Previously Paid:
| |||
|
| ||||
| (2) | Form, Schedule or Registration Statement No.:
| |||
|
| ||||
| (3) | Filing Party:
| |||
|
| ||||
| (4) | Date Filed:
| |||
|
| ||||
BUILDING ON OUR CAPABILITIES 2019 ANNUAL REPORT
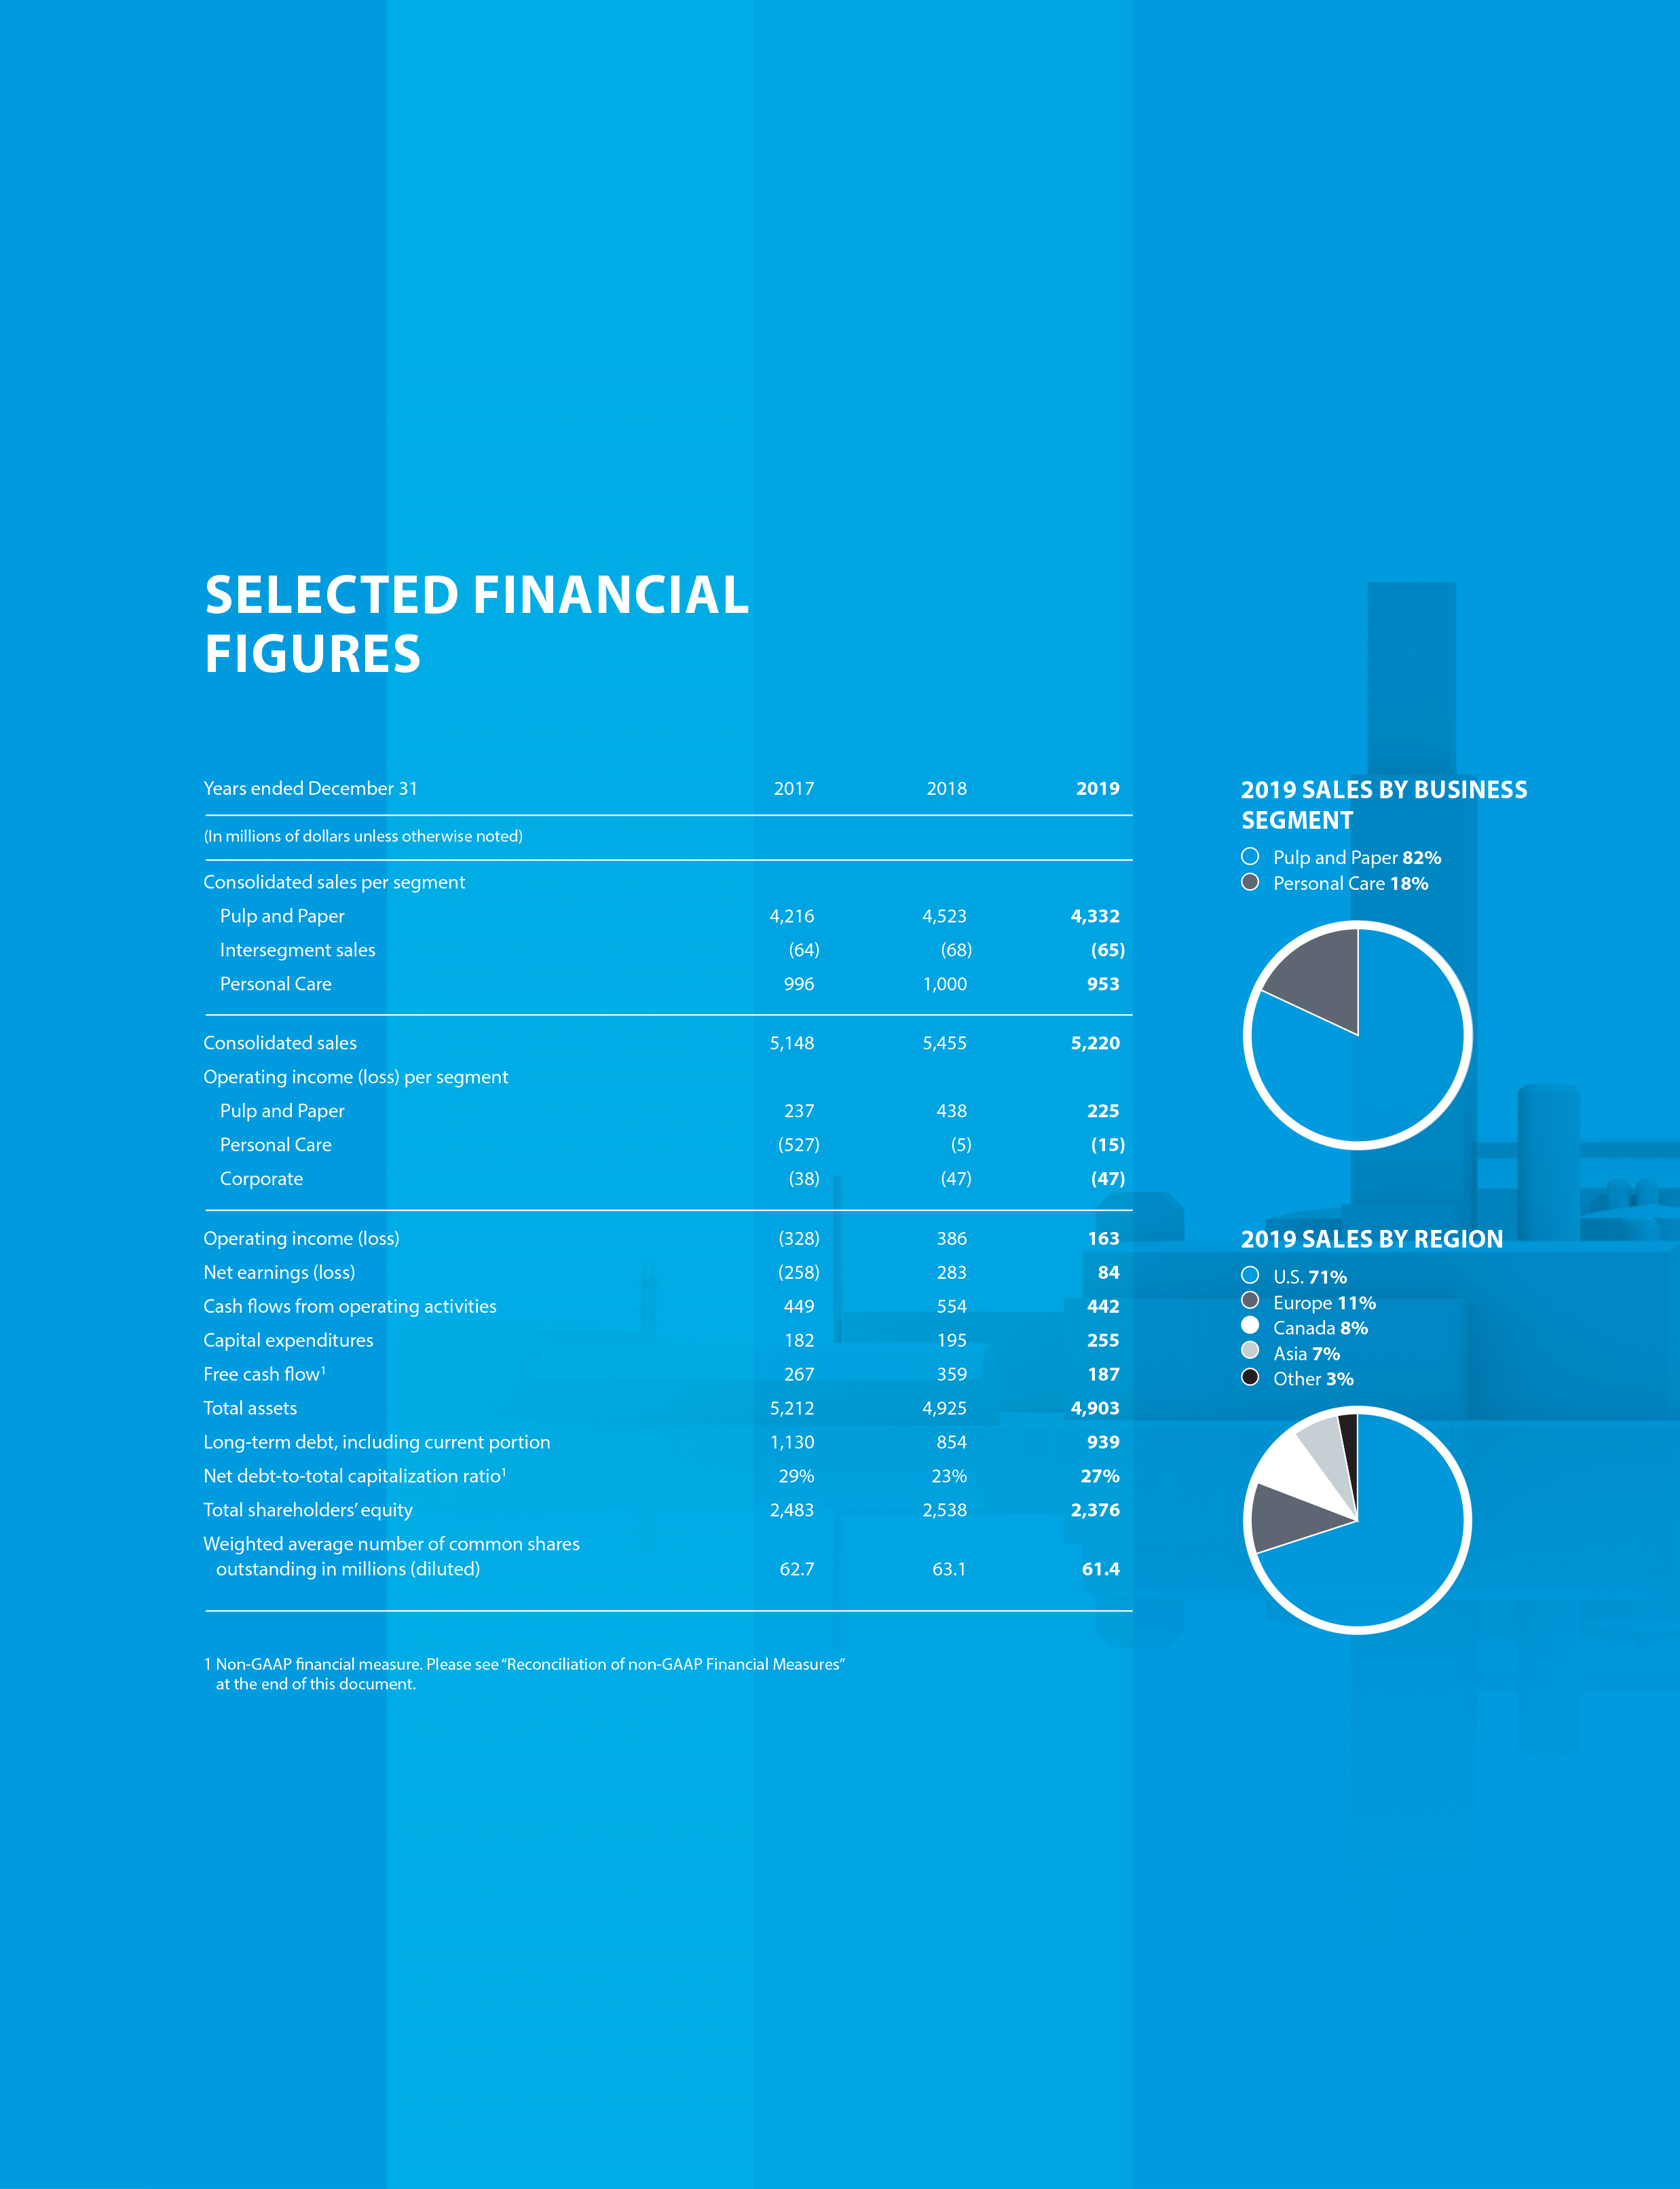
SELECTED ED FINANCIAL FIGURES Years ended December 31 2017 2018 2019 2019 SALES BY BUSINESS SEGMENT (In millions of dollars unless otherwise noted) Pulp and Paper 82% Consolidated sales per segment Personal Care 18% Pulp and Paper 4,216 4,523 4,332 Intersegment sales (64) (68) (65) Personal Care 996 1,000 953 Consolidated sales 5,148 5,455 5,220 Operating income (loss) per segment Pulp and Paper 237 438 225 Personal Care (527) (5) (15) Corporate (38) (47) (47) Operating income (loss) (328) 386 163 2019 SALES BY REGION Net earnings (loss) (258) 283 84 U.S. 71% Cash flows from operating activities 449 554 442 Europe 11% Canada 8% Capital expenditures 182 195 255 Asia 7% Free cash flow1 267 359 187 Other 3% Total assets 5,212 4,925 4,903 Long-term debt, including current portion 1,130 854 939 Net debt-to-total capitalization ratio1 29% 23% 27% Total shareholders’ equity 2,483 2,538 2,376 Weighted average number of common shares outstanding in millions (diluted) 62.7 63.1 61.4 1 Non-GAAP financial measure. Please see “Reconciliation of non-GAAP Financial Measures” at the end of this document.
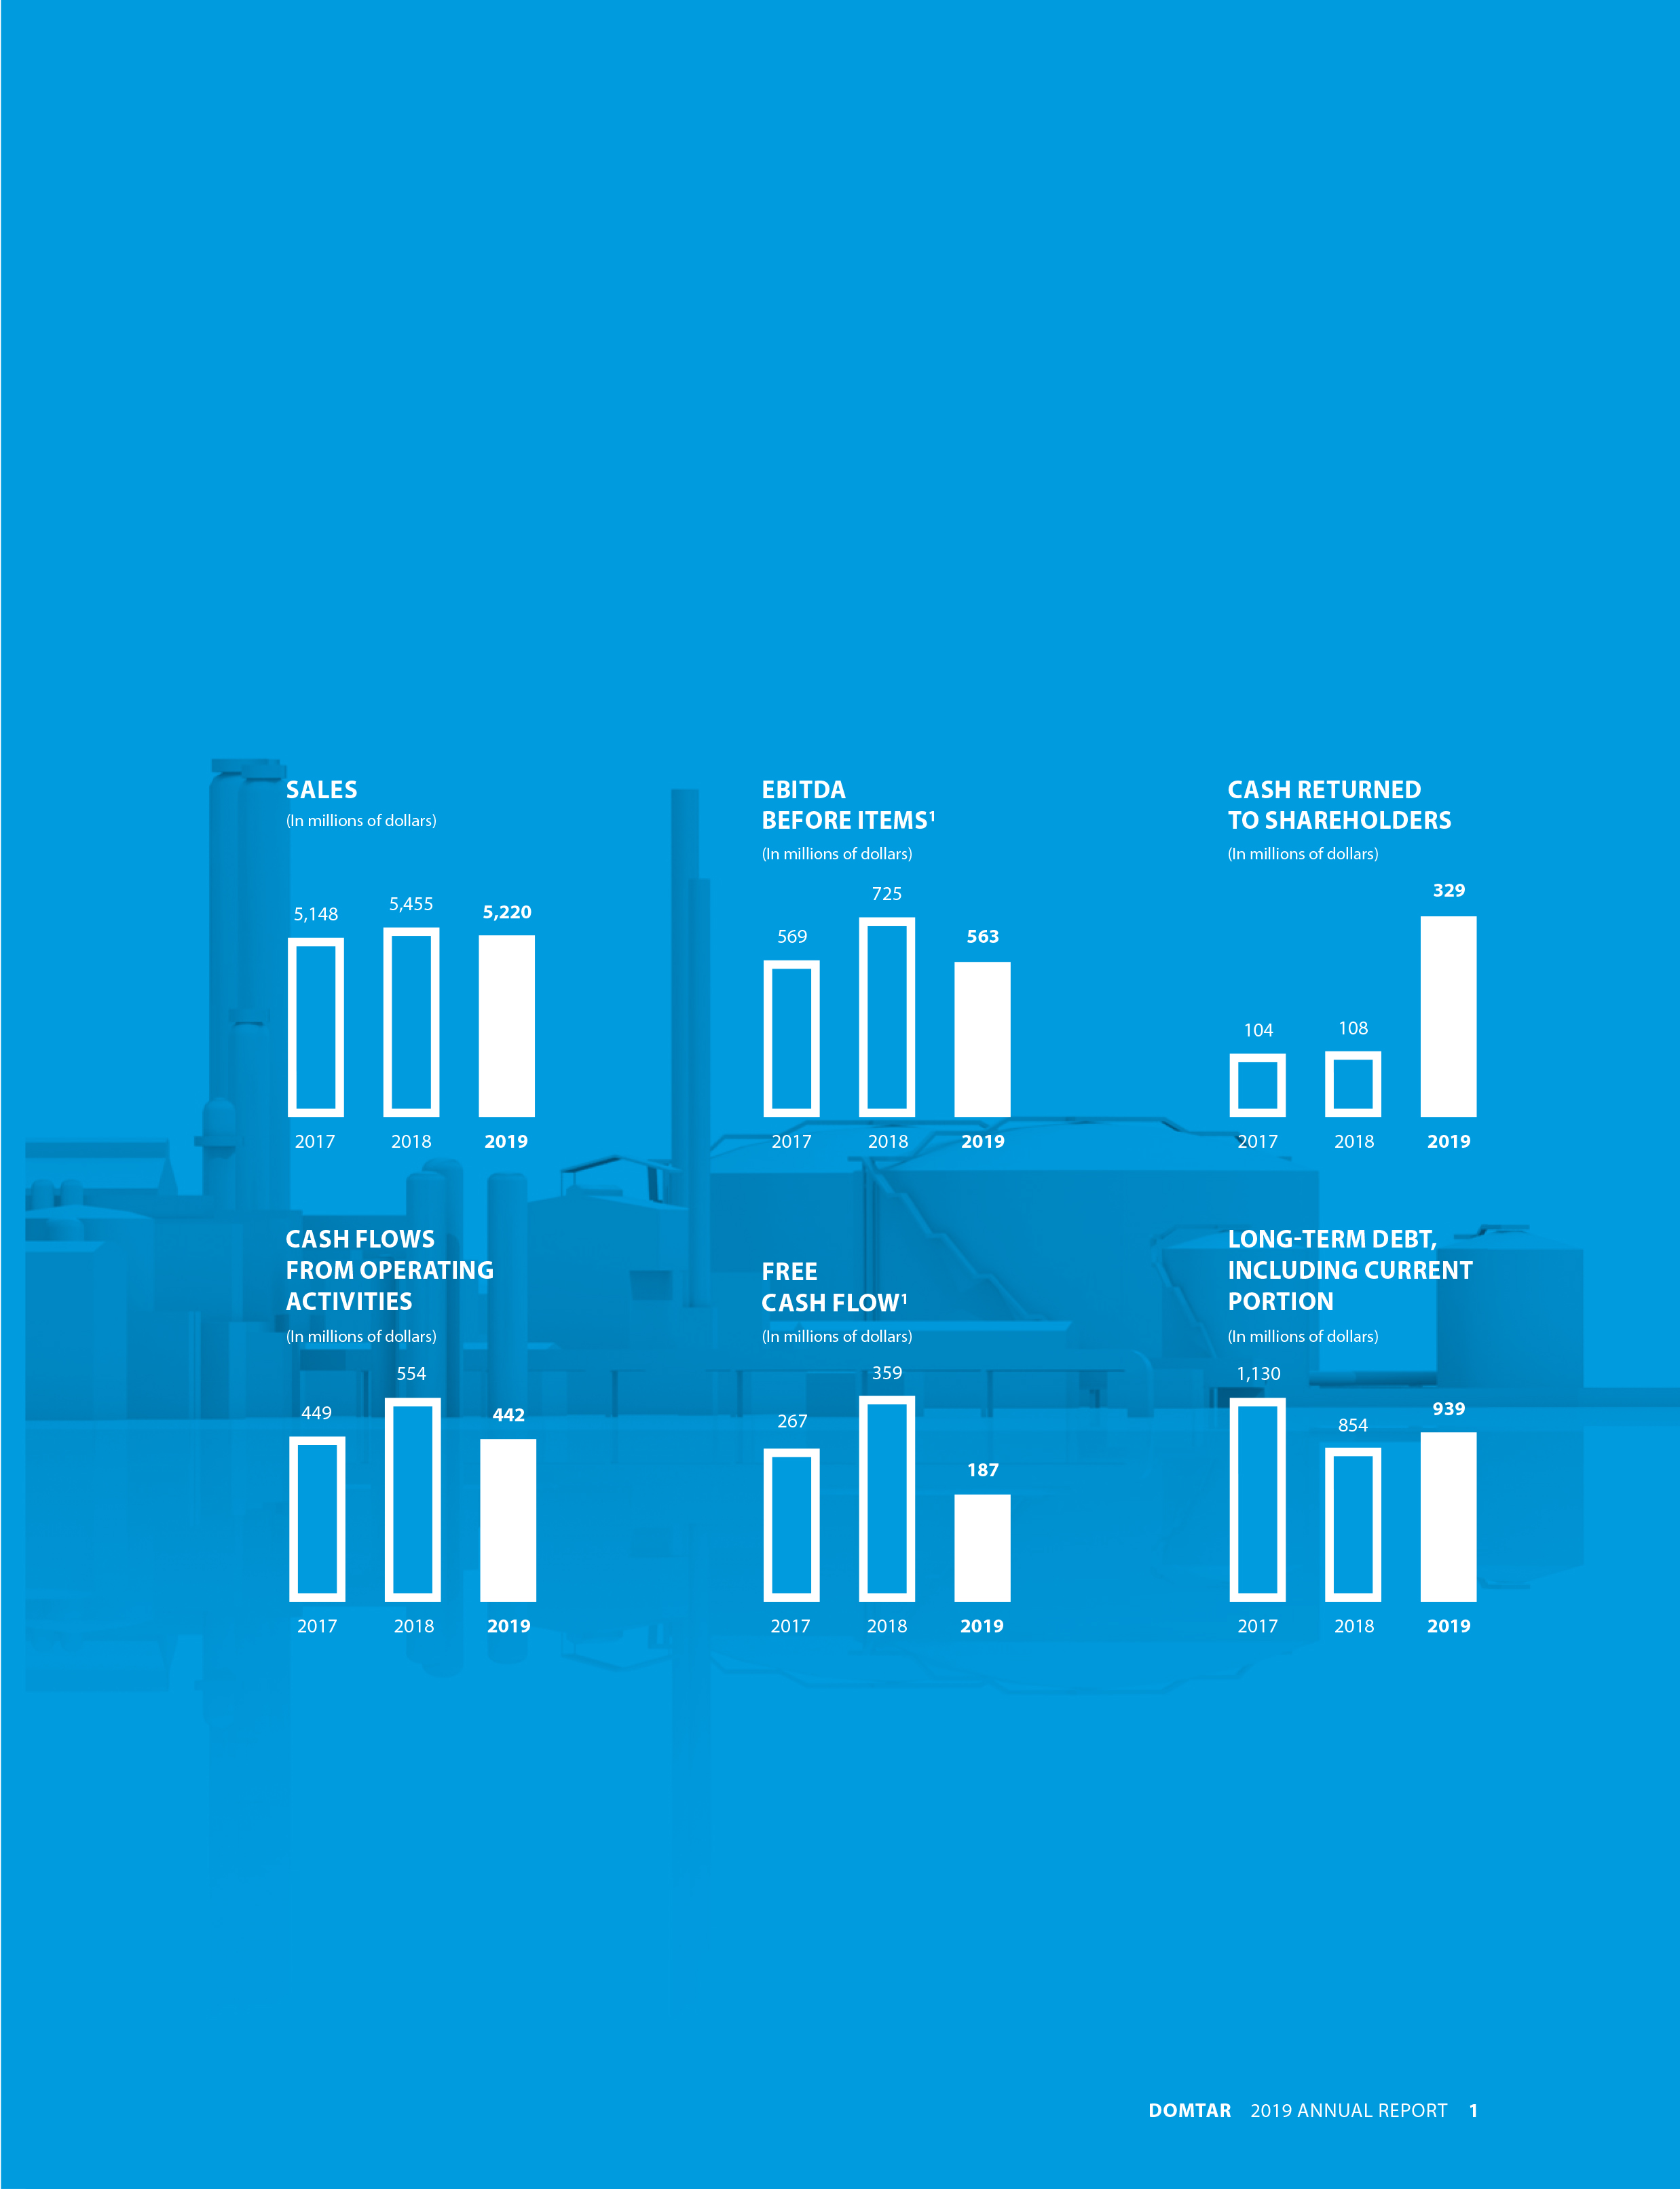
SALES EBITDA CASH RETURNED (In millions of dollars) BEFORE ITEMS1 TO SHAREHOLDERS (In millions of dollars) (In millions of dollars) 725 329 5,455 5,220 5,148 569 563 104 108 2017 2018 2019 2017 2018 2019 2017 2018 2019 CASH FLOWS LONG-TERM DEBT, FROM OPERATING FREE INCLUDING CURRENT ACTIVITIES CASH FLOW1 PORTION (In millions of dollars) (In millions of dollars) (In millions of dollars) 554 359 1,130 449 442 939 267 854 187 2017 2018 2019 2017 2018 2019 2017 2018 2019 DOMTAR 2019 ANNUAL REPORT 1
MESSAGE
TO SHAREHOLDERS
BUILDING ON OUR CAPABILITIES
DOMTAR CONTINUES TO BUILD ON ITS CAPABILITIES AND EXECUTE A WELL-DEFINED STRATEGY TO MAXIMIZE THE VALUE OF EACH OF ITS BUSINESSES.
Led by a strong team, Domtar is well positioned to drive growth, return capital to shareholders and reach the next stage in its evolution as a leading North American pulp and paper company and a recognized personal care products supplier.
Despite market challenges in 2019, we showed resilience and delivered strong results, including $442 million in cash flows from operating activities. The businesses in which we operate are adjusting to market volatility, and we continue to be agile and flexible in these changing market conditions. Our solid financial position allowed us to return $329 million to our shareholders for the year through dividends and share buy-backs, while we continue to invest strategically in our assets.
Our commitment to operating responsibly and sustainably remains steadfast. Versatile and renewable wood fiber is the foundation of our business. As a fiber innovator, we are proud of our record as a sustainability leader for the benefit of our people, our communities and our planet.
RESILIENT PAPER BUSINESS
Our paper business EBITDA margins1 improved in 2019 compared to the prior year due to pricing and improved product mix. We continue to provide best-in-class service to our customers and to increase our share of wallet with them, while pursuing new sales opportunities.
We remain committed to balancing our supply with customer demand, maintaining lower inventories and minimizing our downtime costs. We took approximately 300,000 short tons of market downtime during the year to match our capacity with customer demand before permanently idling 204,000 short tons of paper capacity. Our ability to adjust quickly to changing market conditions reflects both the agility of our team and the optionality of our asset base. We have shown that we can find creative uses for our paper assets as demand declines, and we have identified repurposing optionality for approximately half of our remaining paper capacity.
We continue to invest in projects that strengthen our best-performing mills, reduce our cost structure and support new capabilities. As we accelerate our efforts in the development of innovative products for plastic substitution and other emerging markets, we remain focused on being North America’s uncoated freesheet market leader and supplier of choice for our paper customers.
EXPANDING MARKET PULP BUSINESS
While 2019 was a challenging year for pulp pricing, our growth plans remain on track. We made progress toward improving our cost position through targeted investments and continuous improvement projects, while aligning our business with winning customers and markets. Tissue, hygiene and select specialty pulp markets are showing global demand growth, and our product mix evolved further in their direction during the year.
| 1 | Non-GAAP financial measure. Please see “Reconciliation of non-GAAP Financial Measures” at the end of this document. |
2 DOMTAR 2019 ANNUAL REPORT

“WHETHER IT’S THE QUALITY OF OUR ASSETS, THE MARKETS IN WHICH WE OPERATE, OR THE STRENGTH AND CREATIVITY OF OUR PEOPLE, DOMTAR IS WELL POSITIONED FOR LONG-TERM SUCCESS.” DOMTAR 2019 ANNUAL REPORT 3
MESSAGE
TO SHAREHOLDERS
Domtar is a major pulp supplier with high-performing, low-cost mills and has the ability to meet customer needs for high-quality products in North America and globally. We plan to continue improving customer and product mix, enhancing our value proposition and increasing productivity so that we can fully realize the capability of our assets.
FOCUSED PERSONAL CARE BUSINESS
In Personal Care, we improved EBITDA margins1 when compared to the prior year, and we simplified and stabilized the business to compete more effectively in a challenging global market. These actions included consolidating our North American manufacturing footprint, streamlining expenses, and simplifying our operating structure and work processes, which resulted in productivity improvements and supply chain efficiencies. While executing our margin improvement plan, we also achieved some important wins in our infant diaper business that will scale up this year.
We have built the foundation for a lower cost position and established the commercial focus required to unlock future growth and profitability. Looking ahead, we will focus on delivering on our commercial commitments, developing our strategic customer relationships and investing to serve our customers in the longer term.
DISCIPLINED CAPITAL ALLOCATION
The shareholder returns consistently generated by Domtar through the years are driven by a successful and sustainable business strategy underpinned by disciplined capital allocation. Across our businesses, our objective is to make sound investments that will help sustain earnings throughout the business cycle.
In paper, we maximize value by providing best-in-class service and keeping our supply in line with our customers’ demand. Capital is judiciously allocated to projects that increase productivity and efficiency across our operations in support of higher profitability. Paper manufacturing assets no longer required to serve our customers will be repurposed in a timely manner to their next best use, being either low-cost pulp or competitive containerboard. In our growing pulp business, we are investing strategically to strengthen the long-term competitiveness of our assets, while the priority in Personal Care is to reach the profitability potential of our current asset base.
With strong cash generation and a solid balance sheet, we also have the capacity to consider value-creating acquisitions. In terms of targets, we will favor only meaningful, fiber-based opportunities with a strong overlap with our existing businesses.
We will maintain a balanced capital allocation approach by returning the majority of future free cash flows1 to shareholders, while maintaining the flexibility to deploy capital to the highest value-creating options.
CREATING A SUSTAINABLE FUTURE
While striving to make Domtar even more resilient and successful, we are also committed to operating responsibly. Wood fiber, the building block of all our products, is a highly versatile and renewable resource. Our unwavering support for sustainable forestry is evidenced by our actions in both Domtar-owned lands and in our continuing efforts to help small landowners achieve certification for their forest management. Additionally, we are among the leaders in the use of renewable energy to power our mills and the beneficial reuse of manufacturing by-products. Each year, our goal is to outperform industry benchmarks and other key sustainability performance indicators, including the safety of our workplaces and well-being of our people.
| 1 | Non-GAAP financial measure. Please see “Reconciliation of non-GAAP Financial Measures” at the end of this document. |
4 DOMTAR 2019 ANNUAL REPORT
Our latest sustainability report was published last year, and it provides a full picture of our approach and performance. Operating responsibly, ethically and sustainably is embedded in Domtar’s culture, and we will continue to report with candor and transparency on the issues that matter most to our stakeholders. TAKING DOMTAR TO THE NEXT LEVEL We are focused on transforming Domtar into a growth company while living up to our values of agility, caring and innovation. I am confident that we have the capabilities to move forward on our current path, while driving value for all our stakeholders. Our readiness and adaptability are reflected in the strength of our team and the potential opportunities we have identified. By remaining focused and disciplined in areas where we can add value and improve our business, we will make Domtar even stronger. Thank you to our employees for their hard work and creativity, our customers for their partnership nd trust, and our shareholders for their continued support and investment in Domtar. I also recognize and appreciate our management team and Board members for their vision and leadership. Sincerely, John D. Williams President and Chief Executive Officer DOMTAR 2019 ANNUAL REPORT 5
MANAGEMENT
COMMITTEE AND
LEADERSHIP
Domtar upholds the highest standards of business integrity and corporate social responsibility. These are reflected in our wide range of policies, regularly reviewed and updated, to promote strong governance, best practices, diversity and sustainability.
Our commitment to operating responsibly is supported by our Code of Business Conduct and Ethics applicable to all employees and Board members. Strict Corporate Governance Guidelines are the basis for our robust compliance program. For more information on our governance practices, or to consult our proxy statement, please visit domtar.com.
|
 | |||
MANAGEMENT |
||||
1. John D. Williams President and
3. Michael D. Garcia President
5. Zygmunt Jablonski Senior Vice President
and
|
2. Daniel Buron Senior Vice President and
4. Michael Fagan President
6. Patrick Loulou Senior Vice President
|
|||
| 6 DOMTAR 2019 ANNUAL REPORT | ||||
 |
|||||||
BOARD OF |
COMMITTEE |
||||||
1. Robert E. Apple Chief Operating Officer Miami, Florida Member of our
4. Brian M. Levitt Chairman of the Board Member of our
7. Denis Turcotte Managing Partner and |
2. Giannella Alvarez Corporate Director Member of our
5. David G. Maffucci Corporate Director Isle of Palms, South Carolina Member of our
8. John D. Williams President and Member of our
|
3. David J. Illingworth Corporate Director Member of our
6. Pamela B. Strobel Corporate Director Member of our
9. Mary A. Winston President WinsCo Enterprises, Inc. Member of our
|
Audit Committee David G. Maffucci, Chair |
||||
Environmental, Health, Safety Denis Turcotte, Chair |
|||||||
Finance Committee Brian M. Levitt, Chair |
|||||||
Human Resources Committee Pamela B. Strobel, Chair |
|||||||
| Nominating and Corporate Robert E. Apple, Chair |
|||||||
DOMTAR 2019 ANNUAL REPORT 7 |
|||||||
BUSINESS OVERVIEW |
 | |
| PULP AND PAPER |
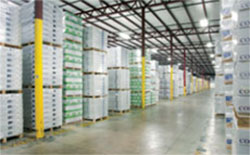
Domtar is the largest integrated manufacturer and marketer of uncoated freesheet paper in North America and an important supplier of specialty and packaging papers, with an annual paper production capacity of 2.9 million short tons. We are also one of the largest global pulp manufacturers, and a major supplier of high-quality papergrade, fluff and specialty pulp. We produce over 4 million air-dried metric tons of pulp in total, approximately half for internal use and the balance for sale to third parties.
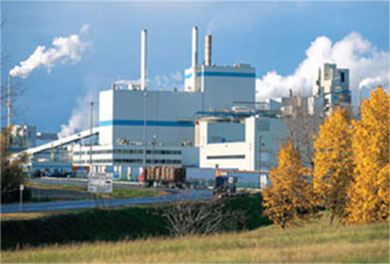
Our pulp and paper business is built on a network of wood fiber converting assets strategically located across the United States and Canada. Over the past decade, we have repurposed 1.7 million short tons of our paper capacity to manufacture products for growing markets. We invest annually in projects that strengthen our best-performing mills while actively seeking new opportunities to redeploy assets no longer needed for paper production.
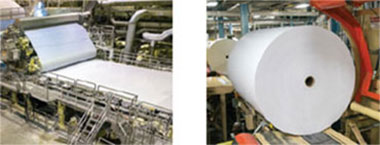
TRUSTED PAPER PARTNER
Maintaining our position as the leading North American uncoated freesheet paper manufacturer, Domtar sold just over 2.8 million short tons of paper in 2019. We provide a wide range of communication, specialty and packaging papers to a variety of customers, primarily in the United States, including merchants, retail outlets, stationers, printers, converters and end-users. Domtar is committed to remaining the long-term paper supplier of choice for its customers.
8 DOMTAR 2019 ANNUAL REPORT
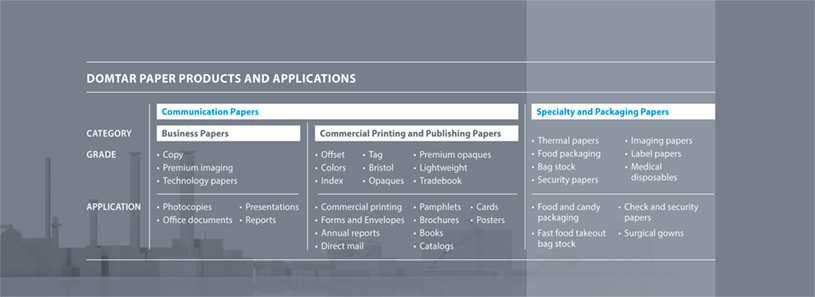
Communication papers
Communication papers represent the majority of our total sales, with business papers being the largest product offering within this category. They are sold mainly to major North American retailers, independent office supply dealers and paper merchants. We offer a selection of our own recognized business paper brands, including Xerox® Paper and Specialty Media, ImagePrint® MultiUse and EarthChoice® Office Paper, and we also assist our customers in developing their own store brands.
Our communication papers are also used for commercial printing and publishing. In this category, customers are primarily paper merchants and converters who further process the paper to its final end-use state such as into books, pamphlets or envelopes, depending on the application. Cougar®, Lynx® Opaque Ultra and Husky® Opaque Offset are among our most recognized brands in this category.
Specialty and packaging papers
We manufacture specialty and packaging papers destined for applications as far ranging as food packaging and medical supplies. In addition, we supply base stock for thermal papers used to make cash register receipts, ATM print outs and lottery tickets, as well as an extensive range of industrial papers for applications such as sandpaper or tile backing, among other uses.
We continue to leverage our innovation and new product development pipeline to grow our position in specialty papers. We see an opportunity in this category to use specialty paper as a substitution for single-use plastics as customers increasingly seek alternatives for such items as straws and food packaging.
Right-sizing our paper
production capacity
We produce paper at 10 mills in the United States and Canada, supported by an efficient network of 13 offsite and onsite converting and forms manufacturing operations. In 2019, we permanently shut down two paper machines located in the United States, thereby reducing our uncoated freesheet production capacity by 204,000 short tons, in addition to taking approximately 300,000 short tons of market-related downtime during the year, to balance supply with our customers’ demand.
DOMTAR 2019 ANNUAL REPORT 9
BUSINESS OVERVIEW
PULP AND PAPER SEGMENT
PAPER MARKET DYNAMICS
In 2019, 6.5 million short tons of uncoated freesheet paper were manufactured in North America, representing an approximately 10% decline compared to the previous year. This reflects market-related downtime and permanent paper production capacity reductions in response to the market developments.
North American demand was nearly 7 million short tons, an 8.4% decrease compared to 2018. This decline exceeded the long-term secular trend due mostly to customer destocking. For its part, the North American specialty papers market is expected to continue to grow in line with population growth, and the manufacturing and construction sectors.
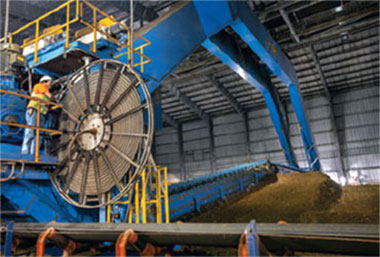
FOCUSED ON GROWTH IN
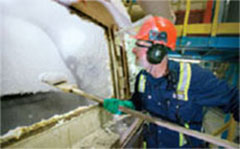
MARKET PULP
Domtar is a major global producer of softwood and fluff pulp. We operate two stand-alone pulp mills in Canada and one in the Southern United States, and we produce market pulp in six of our integrated North American pulp and paper mills. In 2019, we shipped 1.6 million air-dried metric tons of papergrade, fluff and specialty pulp to a diverse range of customers in over 50 countries around the world, in line with shipments in prior years. In 2020, we expect volume growth driven by our strategic investments, the restart of our Espanola, Ontario, mill and additional market pulp from our Ashdown, Arkansas, mill following the paper machine closure late last year.
Most of the pulp we sell is used in products that serve growing end-use markets. Our papergrade pulp is used for manufacturing consumer products

such as bathroom and facial tissue, and paper towels. Domtar Lighthouse® fluff pulp is mainly used in the absorbent core of infant diapers, adult incontinence products, feminine hygiene products and airlaid nonwovens. Our specialty pulp customers produce a wide variety of products ranging from specialty and packaging papers to electrical insulating papers and building products.
| DOMTAR
PULP SHIPMENTS BY END USES1 | |||
| End Use | % of
Total Shipments | ||
| Absorbent Hygiene | 43% | ||
| Towel and Tissue | 34% | ||
| Specialty Paper and Materials | 18% | ||
| Printing and Writing | 5% | ||
1 Includes pulp shipments to Personal Care
10 DOMTAR 2019 ANNUAL REPORT

| Market pulp is subject to short-term fluctuations in selling prices, and 2019 was a challenging year in both domestic and global markets. However, the historical trend in average prices over a period of consecutive years has been positive. Our growing pulp business is well-positioned in attractive markets with a favorable medium to long-term outlook.
In 2019, we invested in strategic projects at several mills to improve our overall competitive position in the global pulp market. These investments included projects to increase energy efficiency and related environmental benefits, reduce fiber loss and maximize resource use, as well as improved productivity. |
LEADING THE SHIFT TO A BIO-BASED ECONOMY
As a fiber innovator working with one of the world’s most renewable resources, Domtar has extensive experience turning wood fiber into useful, sustainable products. In recent years, we have accelerated our fiber-based product development activities to create new revenue opportunities from biomaterials, as the world shifts to a bio-based economy.
We have developed BioChoice® Lignin, a kraft lignin that can be used in the production of resins, thermoplastics and other chemicals, and to produce products as an alternative to common petroleum-based products, including plastics. We are also a major partner in CelluForce, a world leader in the commercial production of CelluForce NCC®, which is a form of Cellulose NanoCrystals. Produced from the cellulose in trees, it is abundant, renewable and biodegradable. Its properties help improve product performance in materials for the oil and gas, health care, and food and beverage industries, among others. |

DOMTAR 2019 ANNUAL REPORT 11
BUSINESS OVERVIEW
PULP AND PAPER SEGMENT

PULP MARKET DYNAMICS
Global demand for chemical market pulp in 2019 was approximately 64.2 million air-dried metric tons, compared to 61.2 million tons in 2018. North American demand was 7.4 million tons, a 0.5% increase, while demand in China was 23.9 million tons, a 16% increase when compared to 2018.
Papergrade wood pulp consumption is expected to grow by an average of 1.6% per year for 2020-2023. Demand for wood pulp in China is projected to generate the largest portion of this growth, with an expected annual growth rate of 3.1% during the same period. For 2020-2023, global tissue demand is expected to grow on average 2.7% per year. As a result, global tissue demand is projected to rise well over 4 million tons, fueling demand for chemical market pulp.
World fluff pulp demand is forecast to expand at a 2.4% annual rate over the next five years. This is expected to be driven by the growth in the use of disposable diapers in less developed economies and incontinence products in developed economies as the population ages. Worldwide demand for absorbent hygiene products by units is expected to grow 2.9% over the same period.
12 DOMTAR 2019 ANNUAL REPORT


BUSINESS OVERVIEW
PERSONAL CARE SEGMENT
PERSONAL CARE
Domtar is a recognized manufacturer of high-quality and innovative absorbent hygiene products, which we also design, market and distribute. We are one of the leading suppliers of adult incontinence products sold into North America and Europe. We are also a recognized supplier of infant diaper products and engineered absorbent materials.
Our five manufacturing plants are supported by a sales force in Europe and the United States. We sell our products primarily in North America and Europe, as well as in other countries around world.
IMPROVING QUALITY OF LIFE
Our vision is to be a global leader in absorbent hygiene markets by meeting the diverse needs of consumers through effective, affordable and widely available personal care solutions. Each year, we manufacture and ship billions of products for adults, infants and children that help improve their quality of life. Our products are designed with the consumer in mind, focused on leakage protection, absorbency, comfort, fit and aesthetics.
Adult incontinence products
We produce high-quality branded and partner-branded products for people – both young and old – living with light to heavy incontinence. Our proprietary brands include Attends®, Indasec®, IndasSlip® and Reassure®. Additionally, we make partner brands for major retailers around the world.
We serve institutional and consumer channels with products available online, in pharmacies and stores, and through healthcare services. In 2019, we shipped over 2.6 billion units of adult diapers, a 3% increase when compared to 2018 reflecting strong product and customer growth.

14 DOMTAR 2019 ANNUAL REPORT

Infant, child and youth products
We design and make baby diapers, training, youth pants and bed mats. Our brand names include Comfees®, ChelinoTM, NeneTM and BambinoTM We also work closely with major retailers supplying partner brand diapers for their own stores. In 2019, we shipped nearly 1.5 billion units of baby diapers, which was lower than in 2018 largely due to the planned exit of unprofitable customers.

Engineered absorbent materials
We are also innovators in producing ultrathin, disposable absorbent composites for manufacturing companies worldwide. Some of the world’s largest branded and private label manufacturers – including Domtar – incorporate our NovaThin® and NovaZorb® brand cores into a wide range of consumer products. These include feminine hygiene, adult incontinence, baby diapers, medical and healthcare applications, and food packaging.
POSITIONING FOR SUCCESS
In 2019, our personal care business was focused on margin improvement in a challenging global market. We consolidated our manufacturing footprint with the closure of our Waco, Texas, facility in the second quarter of 2019, and further optimized our production lines and capabilities across the network. We made solid progress in our asset repositioning and start-up activities in North America.
We also continued to adjust our product and customer mix in order to reduce complexity and align ourselves with strategic, long-term customers. This has enabled us to lower our cost position and create opportunities for future growth and profitability. While executing our margin improvement plan, we achieved some important customer wins in our infant diaper business that will scale up in 2020.
MARKET DYNAMICS
The adult incontinence category continues to show solid growth, estimated at 3% to 5% annually, as the world’s population ages. It is expected that in 10 years’ time over 12% of the projected total world population will be 65 or older. Lower pricing in this
product category is in large part driven by pressure to reduce public spending on healthcare costs and on the availability of reimbursement programs. This category represents about two-thirds of Personal Care’s total sales, and our strategy for 2020 is to focus on higher margin segments, install and ramp-up new capacity to support growth and capture insource savings.
The infant diaper market is currently experiencing flat to declining demand due to low birth rates, but the importance of this category to key retailers is expected to remain strong given the purchasing power of the infant diaper shopper. Oversupply is also driving pricing pressure. We are focused on growing our partner branded opportunities and expanding our relationships with major retailers that are committed to this space.
In 2020, we will remain focused on developing and scaling strategic customer, channel and supplier partnerships both in the adult incontinence and infant categories to capture opportunities for growth.
DOMTAR 2019 ANNUAL REPORT 15

SHAREHOLDER
INFORMATION
| DIVIDENDS DECLARED IN 2019 | |||
| Declared | Record Date | Payable Date | Amount |
| Feb. 20, 2019 | April 2, 2019 | April 15, 2019 | 0.435 |
| May 8, 2019 | July 2, 2019 | July 16, 2019 | 0.455 |
| Aug. 7, 2019 | Oct. 2, 2019 | Oct. 15, 2019 | 0.455 |
| Nov. 6, 2019 | Jan. 2, 2020 | Jan. 15, 2020 | 0.455 |
EXCHANGE LISTINGS
NYSE: UFS
TSX: UFS
DIVIDEND POLICY
Subject to approval by its Board of Directors, Domtar pays a quarterly dividend on its common stock.
TRANSFER AGENT AND REGISTRAR
By regular mail
Computershare
PO Box 505000
Louisville, KY 40233-5000
By overnight delivery
Computershare
462 South 4th Street, Suite 1600
Louisville, KY 40202
North American Toll Free Number:
1-877-282-1168
Tel.: 1-781-575-2879
computershare.com/investor
ANNUAL MEETING
Wednesday, May 6, 2020, 07:45 a.m. ET
Domtar Corporate Office
234 Kingsley Park Drive
Fort Mill, SC 29715
INVESTOR RELATIONS
Investor Relations Department
Domtar Corporation
395 de Maisonneuve Blvd. West
Montreal, QC H3A 1L6
Tel.: 514-848-5049
Email: ir@domtar.com
Electronic versions of this report, SEC filings and other publications are available at domtar.com
2020 EARNINGS RELEASE SCHEDULE
First Quarter 2020: Thursday, April 30, 2020
Second Quarter 2020: Thursday, July 30, 2020
Third Quarter 2020: Thursday, October 29, 2020
Fourth Quarter 2020: Thursday, February 11, 2021
Each quarterly earnings release with accompanying financial tables will be issued before markets open, followed by a 10:00 a.m. ET conference call to discuss results. The above-mentioned dates are tentative and will be confirmed approximately three weeks prior to the official earnings release date.
DOMTAR 2019 ANNUAL REPORT
RECONCILIATION OF NON-GAAP
FINANCIAL MEASURES
The following table sets forth certain non-U.S. generally accepted accounting principles (“GAAP”) financial metrics identified in bold as “Earnings before items”, “Earnings before items per diluted share”, “EBITDA”, “EBITDA margin”, “EBITDA before items”, “EBITDA margin before items”, “Free cash flow”, “Net debt” and “Net debt-to-total capitalization”. Management believes that the financial metrics are useful to understand our operating performance and benchmark with peers within the industry. The Company calculates “Earnings before items” and “EBITDA before items” by excluding the after-tax (pre-tax) effect of specified items. These metrics are presented as a complement to enhance the understanding of operating results but not in substitution for GAAP results.
| (In millions of dollars, unless otherwise noted) | 2017 | 2018 | 2019 | ||||||
| Reconciliation of “Earnings before items” to Net earnings (loss) | |||||||||
| Net earnings (loss) | ($) | (258 | ) | 283 | 84 | ||||
| (+) | Pension settlement loss | ($) | — | — | 22 | ||||
| (+) | Impairment of long-lived assets | ($) | 573 | 5 | 46 | ||||
| (+) | Closure and restructuring costs | ($) | 1 | 6 | 32 | ||||
| (+) | Litigation settlement | ($) | — | 2 | — | ||||
| (-) | Net gains on disposals of property, plant and equipment | ($) | (11 | ) | (3 | ) | — | ||
| (-) | Reversal of contingent consideration | ($) | (2 | ) | — | — | |||
| (-) | U.S. Tax Reform | ($) | (140 | ) | (2 | ) | — | ||
| (=) | Earnings before items | ($) | 163 | 291 | 184 | ||||
| (/) | Weighted avg. number of common shares outstanding (diluted) | (millions) | 62.7 | 63.1 | 61.4 | ||||
| (=) | Earnings before items per diluted share | ($) | 2.60 | 4.61 | 3.00 | ||||
| Reconciliation of “EBITDA” and “EBITDA before items” to Net earnings (loss) | |||||||||
| Net earnings (loss) | ($) | (258 | ) | 283 | 84 | ||||
| (+) | Equity loss, net of taxes | ($) | — | 2 | 2 | ||||
| (+) | Income tax expense (benefit) | ($) | (125 | ) | 57 | 2 | |||
| (+) | Interest expense, net | ($) | 66 | 62 | 52 | ||||
| (+) | Depreciation and amortization | ($) | 321 | 308 | 293 | ||||
| (+) | Impairment of long-lived assets | ($) | 578 | 7 | 58 | ||||
| (-) | Net gains on disposals of property, plant and equipment | ($) | (13 | ) | (4 | ) | — | ||
| (=) | EBITDA | ($) | 569 | 715 | 491 | ||||
| (/) | Sales | ($) | 5,148 | 5,455 | 5,220 | ||||
| (=) | EBITDA margin | (%) | 11% | 13% | 9% | ||||
| EBITDA | ($) | 569 | 715 | 491 | |||||
| (+) | Pension settlement loss | ($) | — | — | 30 | ||||
| (+) | Closure and restructuring costs | ($) | 2 | 8 | 42 | ||||
| (+) | Litigation settlement | ($) | — | 2 | — | ||||
| (-) | Reversal of contingent consideration | ($) | (2 | ) | — | — | |||
| (=) | EBITDA before items | ($) | 569 | 725 | 563 | ||||
| (/) | Sales | ($) | 5,148 | 5,455 | 5,220 | ||||
| (=) | EBITDA margin before items | (%) | 11% | 13% | 11% | ||||
| Reconciliation of “Free cash flow” to Cash flows from operating activities | |||||||||
| Cash flows from operating activities | ($) | 449 | 554 | 442 | |||||
| (-) | Additions to property, plant and equipment | ($) | (182 | ) | (195 | ) | (255 | ) | |
| (=) | Free cash flow | ($) | 267 | 359 | 187 | ||||
| “Net debt-to-total capitalization” computation | |||||||||
| Bank indebtedness | ($) | — | — | 9 | |||||
| (+) | Long-term debt due within one year | ($) | 1 | 1 | 1 | ||||
| (+) | Long-term debt | ($) | 1 129 | 853 | 938 | ||||
| (=) | Debt | ($) | 1 130 | 854 | 948 | ||||
| (-) | Cash and cash equivalents | ($) | (139 | ) | (111 | ) | (61 | ) | |
| (=) | Net debt | ($) | 991 | 743 | 887 | ||||
| (+) | Shareholders' equity | ($) | 2,483 | 2,538 | 2,376 | ||||
| (=) | Total capitalization | ($) | 3,474 | 3,281 | 3,263 | ||||
| Net debt | ($) | 991 | 743 | 887 | |||||
| (/) | Total capitalization | ($) | 3,474 | 3,281 | 3,263 | ||||
| (=) | Net debt-to-total capitalization | (%) | 29% | 23% | 27% | ||||
“Earnings before items”, “Earnings before items per diluted share”, “EBITDA”, “EBITDA margin”, “EBITDA before items”, “EBITDA margin before items”, “Free cash flow”, “Net debt” and “Net debt-to-total capitalization” have no standardized meaning prescribed by GAAP and are not necessarily comparable to similar measures presented by other companies and therefore should not be considered in isolation or as a substitute for Net earnings (loss) or any other earnings statement, cash flow statement or balance sheet financial information prepared in accordance with GAAP. It is important for readers to understand that certain items may be presented in different lines by different companies on their financial statements, thereby leading to different measures for different companies.
DOMTAR 2019 ANNUAL REPORT
RECONCILIATION OF NON-GAAP
FINANCIAL MEASURES BY SEGMENT
The following table sets forth certain non-U.S. generally accepted accounting principles (“GAAP”) financial metrics identified in bold as “Operating income (loss) before items”, “EBITDA before items” and “EBITDA margin before items” by reportable segment. Management believes that the financial metrics are useful to understand our operating performance and benchmark with peers within the industry. The Company calculates the segmented “Operating income (loss) before items” by excluding the pre-tax effect of specified items. These metrics are presented as a complement to enhance the understanding of operating results but not in substitution for GAAP results.
| Pulp and Paper | Personal Care | Corporate | |||||||||||||||||||
| (In millions of dollars, unless otherwise noted) | 2017 | 2018 | 2019 | 2017 | 2018 | 2019 | 2017 | 2018 | 2019 | ||||||||||||
| Reconciliation of Operating
income (loss) to “Operating income (loss) before items” |
|||||||||||||||||||||
| Operating income (loss) | ($) | 237 | 438 | 225 | (527 | ) | (5 | ) | (15 | ) | (38 | ) | (47 | ) | (47 | ) | |||||
| (+) | Impairment of long-lived assets | ($) | — | — | 32 | 578 | 7 | 26 | — | — | — | ||||||||||
| (-) | Net gains on disposals of property, plant and equipment | ($) | (4 | ) | (4 | ) | — | — | — | — | (9 | ) | — | — | |||||||
| (+) | Closure and restructuring costs | ($) | — | — | 22 | 2 | 8 | 20 | — | — | — | ||||||||||
| (+) | Litigation settlement | ($) | — | — | — | — | — | — | — | 2 | — | ||||||||||
| (-) | Reversal of contingent consideration | ($) | — | — | — | — | — | — | (2 | ) | — | — | |||||||||
| (=) | Operating income (loss) before items | ($) | 233 | 434 | 279 | 53 | 10 | 31 | (49 | ) | (45 | ) | (47 | ) | |||||||
| Reconciliation
of “Operating income (loss) before items” to “EBITDA before items” |
|||||||||||||||||||||
| Operating income (loss) before items | ($) | 233 | 434 | 279 | 53 | 10 | 31 | (49 | ) | (45 | ) | (47 | ) | ||||||||
| (+) | Pension settlement loss | ($) | — | — | 30 | — | — | — | — | — | — | ||||||||||
| (+) | Non-service components of net periodic benefit cost | ($) | 13 | 19 | (20 | ) | — | — | — | (2 | ) | (1 | ) | (3 | ) | ||||||
| (+) | Depreciation and amortization | ($) | 254 | 238 | 228 | 67 | 70 | 65 | — | — | — | ||||||||||
| (=) | EBITDA before items | ($) | 500 | 691 | 517 | 120 | 80 | 96 | (51 | ) | (46 | ) | (50 | ) | |||||||
| (/) | Sales | ($) | 4,216 | 4,523 | 4,332 | 996 | 1,000 | 953 | — | — | — | ||||||||||
| (=) | EBITDA margin before items | (%) | 12% | 15% | 12% | 12% | 8% | 10% | — | — | — | ||||||||||
“Operating income (loss) before items”, “EBITDA before items” and “EBITDA margin before items” have no standardized meaning prescribed by GAAP and are not necessarily comparable to similar measures presented by other companies and therefore should not be considered in isolation or as a substitute for Operating income (loss) or any other earnings statement, cash flow statement or balance sheet financial information prepared in accordance with GAAP. It is important for readers to understand that certain items may be presented in different lines by different companies on their financial statements, thereby leading to different measures for different companies.

PRODUCTION
NOTES
Paper
Cover printed on 80 lb. Cougar® Cover, Smooth Finish. Insert printed on 70 lb. Cougar® Text, Smooth Finish. Form 10-K printed on 40 lb. Lynx® Opaque Ultra Text, Smooth Finish.
Printing
Cover and insert printed with UV inks on a Heidelberg Speedmaster CD 102 press 6-color units with in-line coater and full inter-deck and end-of-press extended delivery UV drying systems.


DOMTAR 2019 ANNUAL REPORT

