UNITED STATES

SECURITIES AND EXCHANGE COMMISSION

Washington, D.C. 20549


FORM 10-Q

(Mark One)


xQUARTERLY REPORT PURSUANT TO SECTION 13 OR 15(d) OF THE SECURITIES EXCHANGE ACT OF 1934


For the quarterly period ended June 30, 2019


OR


¨TRANSITION REPORT PURSUANT TO SECTION 13 OR 15(d) OF THE SECURITIES EXCHANGE ACT OF 1934


For the transition period from ______________ to _______________


Commission File Number 001-35521


CLEARSIGN COMBUSTION CORPORATION

(Exact name of registrant as specified in its charter)


WASHINGTON

(State or other jurisdiction of
incorporation or organization)


26-2056298

(I.R.S. Employer
Identification No.)


12870 Interurban Avenue South

Seattle, Washington 98168

(Address of principal executive offices)


(206) 673-4848

(Registrant’s telephone number, including area code)


No change

(Former name, former address and former fiscal year, if changed since last report)


Securities registered pursuant to Section 12(b) of the Act:


Title of each class   Trading Symbol(s)   Name of each exchange on which
registered
         
Common Stock   CLIR   The Nasdaq Stock Market LLC


Indicate by check mark whether the registrant (1) has filed all reports required to be filed by Section 13 or 15(d) of the Securities Exchange Act of 1934 during the preceding 12 months (or for such shorter period that the registrant was required to file such reports), and (2) has been subject to such filing requirements for the past 90 days. Yes x No ¨


Indicate by check mark whether the registrant has submitted electronically every Interactive Data File required to be submitted pursuant to Rule 405 of Regulation S-T (§232.405 of this chapter) during the preceding 12 months (or for such shorter period that the registrant was required to submit such files). Yes x No ¨


Indicate by check mark whether the registrant is a large accelerated filer, an accelerated filer, a non-accelerated filer, a smaller reporting company or an emerging growth company. See the definitions of “large accelerated filer,” “accelerated filer,” “smaller reporting company” and “emerging growth company” in Rule 12b-2 of the Exchange Act.


Large accelerated filer ¨ Accelerated filer ¨
   
Non-accelerated filer x Smaller reporting company x
  Emerging growth company ¨


If an emerging growth company, indicate by check mark if the registrant has elected not to use the extended transition period for complying with any new or revised financial accounting standards provided pursuant to Section 13(a) of the Exchange Act. ¨


Indicate by check mark whether the registrant is a shell company (as defined in Rule 12b-2 of the Exchange Act).  Yes ¨  No x


As of August 14, 2019, the issuer has 26,702,261 shares of common stock, par value $0.0001, issued and outstanding


TABLE OF CONTENTS


PART I FINANCIAL INFORMATION 3
     
Item 1. Condensed Consolidated Financial Statements 3
     
  Condensed Consolidated Balance Sheets as of June 30, 2019 and December 31, 2018 (Unaudited) 3
     
  Condensed Consolidated Statements of Operations for the three and six months ended June 30, 2019 and 2018 (Unaudited) 4
     
  Condensed Consolidated Statements of Stockholders’ Equity for the  three month periods during the six months ended June 30, 2019 and 2018 (Unaudited) 5
     
  Condensed Consolidated Statements of Cash Flows for the six months ended June 30, 2019 and 2018 (Unaudited) 6
     
  Notes to Unaudited Condensed Consolidated Financial Statements 7
     
Item 2. Management’s Discussion and Analysis of Financial Condition and Results of Operations 17
     
Item 3. Quantitative and Qualitative Disclosures About Market Risk 24
     
Item 4. Controls and Procedures 24
     
PART II OTHER INFORMATION 25
     
Item 1. Legal Proceedings 25
     
Item 1A. Risk Factors 25
     
Item 2. Unregistered Sales of Equity Securities and Use of Proceeds 25
     
Item 3. Defaults Upon Senior Securities 25
     
Item 4. Mine Safety Disclosures 25
     
Item 5. Other Information 25
     
Item 6. Exhibits 26
     
SIGNATURES 27


 2 


PART I-FINANCIAL INFORMATION


ITEM 1.         CONDENSED CONSOLIDATED FINANCIAL STATEMENTS


ClearSign Combustion Corporation and Subsidiary

Condensed Consolidated Balance Sheets

(Unaudited)


   June 30,   December 31, 
   2019   2018 
ASSETS  
         
Current Assets:          
Cash and cash equivalents  $9,657,000   $8,949,000 
Short-term investments   1,988,000    6,923,000 
     Contract assets   42,000    39,000 
Prepaid expenses and other assets   629,000    500,000 
Total current assets   12,316,000    16,411,000 
           
Fixed assets, net   384,000    457,000 
Patents and other intangible assets, net   1,530,000    1,759,000 
Other assets   10,000    10,000 
           
Total Assets  $14,240,000   $18,637,000 
           
LIABILITIES AND STOCKHOLDERS' EQUITY          
           
Current Liabilities:          
Accounts payable and accrued liabilities  $946,000   $1,080,000 
Current portion of lease liabilities   190,000    216,000 
Accrued compensation and taxes   321,000    341,000 
Total current liabilities   1,457,000    1,637,000 
Long Term Liabilities:          
 Long term lease liabilities   79,000    91,000 
Total liabilities   1,536,000    1,728,000 
           
Commitments and contingencies          
           
Stockholders' Equity:          
Preferred stock, $0.0001 par value, zero shares issued and outstanding   -    - 
Common stock, $0.0001 par value, 26,702,261 and 26,697,261  shares issued and          
outstanding at June 30, 2019 and December 31, 2018, respectively   3,000    3,000 
Additional paid-in capital   76,967,000    76,417,000 
Accumulated deficit   (64,266,000)   (59,511,000)
Total stockholders' equity   12,704,000    16,909,000 
           
Total Liabilities and Stockholders' Equity  $14,240,000   $18,637,000 


The accompanying notes are an integral part of these condensed consolidated financial statements.


 3 


ClearSign Combustion Corporation and Subsidiary

Condensed Consolidated Statements of Operations

(Unaudited)


   For the Three Months Ended
June 30,
  

For the Six Months Ended

June 30,

 
   2019   2018   2019   2018 
                 
Sales  $-   $-   $-   $530,000 
Cost of goods sold   -    20,000    1,000    415,000 
                     
Gross profit (loss)   -    (20,000)   (1,000)   115,000 
                     
Operating expenses:                    
Research and development, net of grants   864,000    1,019,000    1,766,000    2,153,000 
General and administrative   1,583,000    1,351,000    3,057,000    2,630,000 
                     
Total operating expenses   2,447,000    2,370,000    4,823,000    4,783,000 
                     
Loss from operations   (2,447,000)   (2,390,000)   (4,824,000)   (4,668,000)
                     
Other income:                    
Interest income   21,000    1,000    69,000    1,000 
                     
Net loss  $(2,426,000)  $(2,389,000)  $(4,755,000)  $(4,667,000)
                     
Net loss per share - basic and fully diluted  $(0.09)  $(0.11)  $(0.18)  $(0.24)
                     
Weighted average number of shares outstanding - basic and fully diluted   26,699,788    21,362,596    26,698,546    19,549,975 


The accompanying notes are an integral part of these condensed consolidated financial statements.


 4 


ClearSign Combustion Corporation and Subsidiary

Condensed Consolidated Statements of Stockholders' Equity

(Unaudited)

For the Three month periods during the Six Months Ended June 30, 2019


  Common Stock   Additional   Accumulated   Total
Stockholders'
 
   Shares   Amount   Paid-In Capital   Deficit   Equity 
                     
Balances at December 31, 2018   26,697,261   $3,000   $76,417,000   $(59,511,000)  $16,909,000 
Shares issued for services ($1.44 per share)   2,500    -    3,000    -    3,000 
Fair value of stock options issued in payment of accrued compensation   -    -    100,000    -    100,000 
Share based compensation   -    -    233,000    -    233,000 
Net loss   -    -    -    (2,329,000)   (2,329,000)
Balances at March 31, 2019   26,699,761    3,000    76,753,000    (61,840,000)   14,916,000 
Shares issued for services ($1.44 per share)   2,500    -    4,000    -    4,000 
Fair value of stock options issued for board service   -    -    69,000    -    69,000 
Share based compensation   -    -    141,000    -    141,000 
Net loss   -    -    -    (2,426,000)   (2,426,000)
Balances at June 30, 2019   26,702,261   $3,000   $76,967,000   $(64,266,000)  $12,704,000 


    Common Stock     Additional     Accumulated     Total
Stockholders'
 
    Shares     Amount     Paid-In Capital     Deficit     Equity  
                               
                                         
Balances at December 31, 2017     15,608,853     $ 2,000     $ 52,441,000     $ (50,011,000 )   $ 2,432,000  
Shares issued in stock offering ($2.25 per share)     5,750,000       -       12,937,000       -       12,937,000  
Issuance costs of rights offering     -       -       (1,014,000 )     -       (1,014,000 )
Shares issued for services ($3.50 per share)     2,500       -       9,000       -       9,000  
Share Based Compensation     -       -       50,000       -       50,000  
Net loss     -       -       -       (2,278,000 )     (2,278,000 )
Balances at March 31, 2018     21,361,353       2,000       64,423,000       (52,289,000 )     12,136,000  
Shares issued for services ($3.50 per share)     2,500       -       8,000       -       8,000  
Shares issued for board service ($1.85 per share)     54,056       -       100,000       -       100,000  
Share Based Compensation     -       -       61,000       -       61,000  
Net loss     -       -       -       (2,389,000 )     (2,389,000 )
Balances at June 30, 2018     21,417,909     $ 2,000     $ 64,592,000     $ (54,678,000 )   $ 9,916,000  


The accompanying notes are an integral part of these condensed consolidated financial statements.


 5 


ClearSign Combustion Corporation

Condensed Consolidated Statements of Cash Flows

(Unaudited)


   For the Six Months Ended June 30, 
   2019   2018 
Cash flows from operating activities:          
Net loss  $(4,755,000)  $(4,667,000)
Adjustments to reconcile net loss to net cash used in operating activities:          
Common stock issued for services   7,000    117,000 
Share based compensation   443,000    111,000 
Depreciation and amortization   130,000    167,000 
Abandonment and impairment of capitalized patent costs   396,000    - 
Change in operating assets and liabilities:          
Contract assets   (3,000)   145,000 
Prepaid expenses and other assets   (129,000)   (327,000)
Accounts payable and accrued liabilities   (136,000)   41,000 
Accrued compensation and taxes   80,000    (168,000)
Net cash used in operating activities   (3,967,000)   (4,581,000)
           
Cash flows from investing activities:          
Acquisition of fixed assets   (17,000)   (19,000)
Disbursements for patents and other intangible assets   (243,000)   (211,000)
Maturity of short term treasury bills   4,935,000    - 
Net cash provided by (used in) investing activities   4,675,000    (230,000)
           
Cash flows from financing activities:          
Proceeds from issuance of common stock, net of offering costs   -    11,923,000 
Net cash provided by financing activities   -    11,923,000 
           
Net increase in cash and cash equivalents   708,000    7,112,000 
Cash and cash equivalents, beginning of period   8,949,000    1,247,000 
Cash and cash equivalents, end of period  $9,657,000   $8,359,000 
           
Supplemental disclosure of non-cash operating activities:          
           
During the six months ended June 30, 2019, the Company issued stock options to purchase a total of 159,100 shares of common stock to certain of its officers and employees in satisfaction of $100,000 of accrued compensation at December 31, 2018.          


The accompanying notes are an integral part of these condensed consolidated financial statements.


 6 


ClearSign Combustion Corporation

Notes to Unaudited Condensed Consolidated Financial Statements


Note 1 – Organization and Description of Business


ClearSign Combustion Corporation (ClearSign or the Company) designs and develops technologies for the purpose of improving key performance characteristics of combustion systems, including emission and operational performance, energy efficiency and overall cost-effectiveness. The Company’s primary technologies include its Duplex™ technology, which achieves very low emissions without the need of external flue gas recirculation, selective catalytic reduction, or higher excess air operation, and its Electrodynamic Combustion Control™ or ECC™ technology, which introduces a computer-controlled electric field into the combustion region that may better control gas-phase chemical reactions and improve system performance and cost-effectiveness. The Company is headquartered in Seattle, Washington and was incorporated in the state of Washington in 2008.  On July 28, 2017, the Company incorporated a subsidiary, ClearSign Asia Limited, in Hong Kong to represent the Company’s business and technological interests throughout Asia. Through ClearSign Asia Limited, the Company has established a Wholly Foreign Owned Enterprise (WFOE) in China – ClearSign Combustion (Beijing) Environmental Technologies Co., LTD.


Liquidity


The Company’s technologies are currently in field development and have generated nominal revenues from operations to date to meet operating expenses. In order to generate meaningful revenues, the technologies must be fully developed, gain market recognition and acceptance, and develop a critical level of successful sales and product installations. The Company has historically financed its operations primarily through issuances of equity securities, including $11.9 million in proceeds, net of offering costs, from a stock offering completed on February 27, 2018 and $11.6 million in proceeds, net of offering costs, from a stock offering completed on July 20, 2018. The Company has incurred losses since its inception totaling $64,266,000 and expects to experience operating losses and negative cash flows for the foreseeable future. Management believes that the successful growth and operation of the Company’s business is dependent upon its ability to obtain adequate sources of funding through co-development agreements, strategic partnering agreements, or equity or debt financing to adequately support research and development efforts, protect intellectual property, form relationships with strategic partners, and provide for working capital and general corporate purposes. There can be no assurance that the Company will be successful in achieving its long-term plans as set forth above, or that such plans, if consummated, will result in profitable operations or enable the Company to continue in the long-term as a going concern.


Note 2 – Summary of Significant Accounting Policies


Basis of Presentation


The accompanying unaudited condensed consolidated financial statements have been prepared in accordance with the rules and regulations of the Securities and Exchange Commission (the “SEC”) for Form 10-Q. Accordingly, certain information and footnote disclosures normally included in financial statements prepared in accordance with generally accepted accounting principles have been condensed or omitted pursuant to such rules and regulations. The condensed balance sheet at December 31, 2018 has been derived from the Company’s audited financial statements.


In the opinion of management, these consolidated financial statements reflect all normal recurring and other adjustments necessary for a fair presentation. These consolidated financial statements should be read in conjunction with the audited consolidated financial statements included in the Company’s Annual Report on Form 10-K for the year ended December 31, 2018. Operating results for interim periods are not necessarily indicative of operating results for an entire fiscal year or any other future periods.


The accompanying unaudited condensed consolidated financial statements include the accounts of ClearSign and its subsidiary. Intercompany balances and transactions have been eliminated in consolidation.


 7 


Use of Estimates


The preparation of financial statements in conformity with accounting principles generally accepted in the United States of America requires management to make certain estimates and assumptions that affect the reported amounts of assets and liabilities and disclosure of contingent assets and liabilities at the date of the financial statements and the reported amounts of revenues and expenses during the reporting period. Actual results could differ from those estimates.


Revenue Recognition and Cost of Sales


The Company recognizes revenue and related cost of goods sold in accordance with FASB ASC 606 Revenue from Contracts with Customers (ASC 606). Revenues and cost of goods sold are recognized once the goods or services are delivered to the customer’s control and performance obligations are satisfied. Typically, the Company’s contracts with customers have performance obligations regarding air emissions and operational performance that are satisfied upon completion of service. Since this is the singular performance obligation and cannot be achieved until the air emissions and operational performance have been successfully tested, revenue related to the contracts is recognized upon project completion.


The Company’s contracts generally include progress payments from the customer upon completion of defined milestones. As these payments are received they are offset against accumulated project costs and recorded as either contract assets or contract liabilities. Upon completion of the performance obligations and acceptance by the customer the projects can be recorded as revenue.


The Company's contracts with customers contain no variable considerations or incentives or discounts that would cause revenue to be allocated or adjusted over time. Therefore, no separate methods of evaluating the contracts other than consideration of the price at achievement of the performance objectives was used in satisfying the review requirements of ASC 606.


Contract Acquisition Costs and Practical Expedients


For contracts that have a duration of less than one year, the Company follows ASC 606, practical expedients and expenses those costs when incurred; for contracts with a life exceeding one year, the Company records those costs when performance obligations related to the contract are completed. The Company generally expenses sales commissions when earned. The Company records those costs within general and administrative expenses.


Product Warranties


The Company warrants all installed products against defects in materials and workmanship for a period specified in each contract by replacing failed parts. Accruals for product warranties are based on historical warranty experience and current product performance trends, and are recorded at the time revenue is recognized as a component of cost of sales. The warranty liabilities are reduced by material and labor costs used to replace parts over the warranty period in the periods in which the costs are incurred. The Company periodically assesses the adequacy of its recorded warranty liabilities and adjusts the amounts as necessary, and such adjustments could be material in the future if estimates differ significantly from actual warranty expense. The warranty liabilities are included in accrued liabilities in the balance sheets.


Cash and Cash Equivalents


Highly liquid investments purchased with an original maturity of three months or less are considered cash equivalents. Cash is maintained with a commercial bank where accounts are generally guaranteed by the Federal Deposit Insurance Corporation up to $250,000. The Company’s deposits may at times exceed this limit. The Company also maintains a cash balance in China which is insured up to $75,000 (500,000RMB). The Company has not experienced losses in such accounts and believes it is not exposed to any significant credit risk on cash and cash equivalents.


 8 


Short-Term Investments


Short-term investments consist of U.S. treasury bills with original maturities of twelve months or less and greater than three months. These short-term investments are classified as held to maturity and are recorded on an amortized cost basis which approximates fair value.


Accounts Receivable and Allowance for Doubtful Accounts


Accounts receivable are recorded at the invoiced amount. An allowance for doubtful accounts is established, as necessary, based on past experience and other factors which, in management’s judgment, deserve current recognition in estimating bad debts. The determination of the collectability of amounts due from customer accounts requires the Company to make judgments regarding future events and trends. Allowances for doubtful accounts are determined based on assessing the Company’s portfolio on an individual customer and on an overall basis. This process consists of a review of historical collection experience, current aging status of the customer accounts, and the financial condition of the Company’s customers. Based on a review of these factors, the Company may establish or adjust the allowance for specific customers and the accounts receivable portfolio as a whole.


Fixed Assets and Leases


Fixed assets are recorded at cost. Leases are recorded in accordance with FASB ASC 842 Leases. For those leases with a term greater than one year, the Company recognizes on the balance sheet at the time of lease inception or modification a right-of-use asset and a lease liability, initially measured at the present value of the lease payments. Lease costs are recognized in the income statement over the lease term on a straight-line basis. Operating leases with a term of 1 year or less are recognized on a straight line basis over the term. Depreciation is computed using the straight-line method over the estimated useful lives of the respective assets. Leasehold improvements are depreciated over the life of the lease or their useful life, whichever is shorter. All other fixed assets are depreciated over two to four years. Maintenance and repairs are expensed as incurred.


Patents and Trademarks


Patents and trademarks are recorded at cost. Amortization is computed using the straight-line method over the estimated useful lives of the assets once they are awarded.


Impairment of Long-Lived Assets


The Company tests long-lived assets for impairment whenever events or changes in circumstances indicate that the carrying amount of an asset may not be recoverable through the estimated undiscounted cash flows expected to result from the use and eventual disposition of the assets. In that event, a loss is recognized based on the amount by which the carrying amount exceeds the fair value of the long-lived assets. Fair value is determined based on the present value of estimated expected cash flows using a discount rate commensurate with the risks involved, quoted market prices, or appraised values depending upon the nature of the assets. Loss on long-lived assets to be disposed of is determined in a similar manner, except that fair values are reduced for the cost of disposal.


Fair Value of Financial Instruments


Fair value is the price that would be received to sell an asset or paid to transfer a liability in an orderly transaction between market participants at the measurement date. Assets and liabilities measured at fair value are categorized based on whether or not the inputs are observable in the market and the degree that the inputs are observable. The categorization of financial assets and liabilities within the valuation hierarchy is based upon the lowest level of input that is significant to the fair value measurement. The three levels of inputs used to establish fair value are the following:


·Level 1 – Quoted prices in active markets for identical assets or liabilities;
·Level 2 – Inputs other than Level 1 that are observable, either directly or indirectly, such as quoted prices for similar assets or liabilities, quoted prices in markets that are not active, or other inputs that are observable or can be corroborated by observable market data for substantially the full term of the assets or liabilities; and


 9 


·Level 3 – Unobservable inputs that are supported by little or no market activity and that are significant to the fair value of the assets or liabilities.


The Company's financial instruments primarily consist of cash and cash equivalents, short-term investments, accounts payable and accrued expenses. As of the balance sheet dates, the estimated fair values of the financial instruments were not materially different from their carrying values as presented on the balance sheets. This is primarily attributable to the short-term maturities of these instruments.


The Company did not identify any other non-recurring assets and liabilities that are required to be presented in the balance sheets at fair value.


Research and Development


The cost of research and development is expensed as incurred. Research and development costs consist of salaries, benefits, share based compensation, consulting fees, rent, utilities, depreciation, and consumables.


During the six months ended June 30, 2019, the Company received $108,000 to partially fund specific research and development activity relating to its ECC technology. Since these funds were provided without expectation of reciprocation, except notification of research results, the funds received were offset against the related research and development costs incurred.


Income Taxes


The Company accounts for income taxes using an asset and liability approach which allows for the recognition and measurement of deferred tax assets based upon the likelihood of realization of tax benefits in future years. Under the asset and liability approach, deferred taxes are provided for the net tax effects of temporary differences between the carrying amounts of assets and liabilities for financial reporting purposes and the amounts used for income tax purposes. A valuation allowance is provided for deferred tax assets if it is more likely than not these items will either expire before the Company is able to realize their benefits, or that future deductibility is uncertain. Tax benefits from an uncertain tax position are recognized only if it is more likely than not that the tax position will be sustained on examination by the taxing authorities based on the technical merits of the position. The tax benefits recognized in the consolidated financial statements from such a position are measured based on the largest benefit that has a greater than 50 percent likelihood of being realized upon ultimate resolution.


Stock-Based Compensation


The costs of all employee stock options, as well as other equity-based compensation arrangements, are reflected in the consolidated financial statements based on the estimated fair value of the awards on the grant date. That cost is recognized over the period during which an employee is required to provide service in exchange for the award. Stock compensation for stock granted to non-employees is determined as the fair value of the consideration received or the fair value of equity instruments issued, whichever is more reliably measured.


Foreign Operations


The accompanying consolidated financial statements as of June 30, 2019 and December 31, 2018 include assets amounting to approximately $231,000 and $199,000, respectively, relating to operations of the Company in China. It is always possible unanticipated events in foreign countries could disrupt the Company’s operations.


 10 


Foreign Currency


The functional currency of ClearSign Asia Limited is the U.S. dollar. The Company remeasures the transactions denominated in Chinese Yuan at the average exchange rate in effect during the period. At the end of each reporting period, the Company remeasures ClearSign Asia Limited’s monetary assets and liabilities to the U.S. dollar using exchange rates in effect at the end of the reporting period. The Company remeasures its non-monetary assets and liabilities at historical exchange rates. The Company records gains and losses related to remeasurement in other income (expense), net in the consolidated statements of operations. Foreign currency exchange gain (losses) has not been significant in any period presented and the Company has not undertaken any hedging transactions related to foreign currency exposure.


Net Loss per Common Share


Basic loss per share is computed by dividing loss available to common stockholders by the weighted-average number of common shares outstanding. Diluted loss per share is computed similar to basic loss per share except that the denominator is increased to include additional common shares available upon exercise of stock options and warrants using the treasury stock method, except for periods for which no common share equivalents are included because their effect would be anti-dilutive. At June 30, 2019 and 2018, potentially dilutive shares outstanding amounted to 2,253,033 and 3,500,619, respectively.


Recently Adopted Standards


In June 2018 FASB issued ASU No. 2018-07 Compensation-Stock Compensation. The amendments in this update expand the scope of Topic 718 to include share based payment transactions for acquiring goods and services from nonemployees. An entity should apply the requirements of Topic 718 to nonemployee awards except for specific guidance on inputs to an option pricing model and the attribution of cost (that is, the period of time over which share-based payment awards vest and the pattern of cost recognition over that period). The amendments specify that Topic 718 applies to all share-based payment transactions in which a grantor acquires goods or services to be used or consumed in a grantor’s own operations by issuing share-based payment awards. The amendments also clarify that Topic 718 does not apply to share-based payments used to effectively provide (1) financing to the issuer or (2) awards granted in conjunction with selling goods or services to customers as part of a contract accounted for under Topic 606, Revenue from Contracts with Customers. The ASU is effective for all entities for fiscal years beginning after December 15, 2018, including interim periods within those years. The Company currently does not believe this amendment applies to any of its transactions at this time.


Management does not believe that any other recently issued, but not yet effective, authoritative guidance, if currently adopted, would have a material impact on the Company’s consolidated financial statement presentation or disclosures.


Note 3 – Fixed Assets


Fixed assets are summarized as follows:


   June 30,   December 31, 
   2019   2018 
   (unaudited)     
Machinery and equipment  $863,000   $853,000 
Office furniture and equipment   193,000    186,000 
Leasehold improvements   150,000    150,000 
Right of use asset-operating leases   710,000    637,000 
Accumulated depreciation and amortization   (1,532,000)   (1,369,000)
   $384,000   $457,000 


The Company has a triple net operating lease for office and laboratory space in Seattle, Washington through March 2020 with rent of approximately $12,000 per month plus triple net operating costs. The Company also has a triple net operating lease for office space in Tulsa, Oklahoma through August 2019 with monthly rent of approximately $2,000 per month plus triple net operating costs. Both leases include lessee renewal options for three years at the then prevailing market rate. The Company exercised the option to renew the Tulsa lease for three additional years in August 2019. The rent for the Tulsa lease will be approximately $2,200 a month beginning September 2019 through August 2022 with an annual 2.5% increase. The Company has an operating lease for office space in Beijing, China through November 2020 with a monthly rent of approximately $6,000.


 11 


Lease costs for the six months ended June 30, 2019 and 2018 and other quantitative disclosures are as follows (unaudited):


   For the three months ended June 30,   For the six months ended June 30, 
   2019   2018   2019   2018 
Lease cost:                    
Operating lease cost  $58,000   $53,000   $117,000   $106,000 
Total lease cost  $58,000   $53,000   $117,000   $106,000 
                     
Other information:                    
Cash paid for amounts included in the measurement of lease liabilities:                    
Operating cash flows from operating leases       $119,000           
                     
Right-of-use assets obtained in exchange for new operating lease liabilities       $73,000           
For operating lease:                    
Weighted average remaining lease term (in years)        1.59           
Weighted average discount rate        5.71%          


At June 30, 2019, the Company recorded a right-of-use asset and operating lease liability amounting to $73,000 upon extension of the lease for its office space in Tulsa, Oklahoma through August 2022.


Minimum future payments under the Company’s leases at June 30, 2019 and their application to the corresponding lease liabilities are as follows (unaudited):


   Discounted lease liability payments   Payments due under lease agreements 
2019 (remaining 6 months)   112,000    119,000 
2020   114,000    121,000 
2021   25,000    27,000 
2022   18,000    19,000 
Total  $269,000   $286,000 


Note 4 – Patents and Other Intangible Assets


Patents and other intangible assets are summarized as follows:


 12 


   June 30,   December 31, 
   2019   2018 
   (Unaudited)     
Patents          
Patents pending  $1,063,000   $1,202,000 
Issued patents   633,000    761,000 
    1,696,000    1,963,000 
Trademarks          
Trademarks pending   63,000    55,000 
Registered trademarks   23,000    23,000 
    86,000    78,000 
Other   8,000    8,000 
    1,790,000    2,049,000 
Accumulated amortization   (260,000)   (290,000)
   $1,530,000   $1,759,000 


The Company monitors and assesses the net realizable value of the Company’s patent portfolio at each reporting period. As a result of management’s assessment of the Company’s patent portfolio in terms of cost-effectiveness and alignment with the focus on those patents that have significant future commercial value to the Company, an impairment charge of $396,000 was recorded during the quarter ended June 30, 2019.


Future amortization expense associated with issued patents and registered trademarks as of June 30, 2019 is estimated as follows (unaudited):


2019 (remaining 6 months)  $67,000 
2020   130,000 
2021   94,000 
2022   66,000 
2023   33,000 
Thereafter   6,000 
   $396,000 


Note 5 – Sales, Contract Assets and Contract Liabilities


The Company recognized no revenue during the six months ended June 30, 2019. For the six months ended June 30, 2018, the Company recognized revenues totaling $530,000 from completed flare projects. At June 30, 2019, the Company had contract assets of $42,000 and contract liabilities of $0. The cost of goods sold of $1,000, recognized during the six months ended June 30, 2019, related to additional warranty costs incurred for previously completed contracts.


Note 6 – Stockholders’ Equity


Common Stock and Preferred Stock


The Company is authorized to issue 62,500,000 shares of common stock and 2,000,000 shares of preferred stock. Preferences, limitations, voting powers and relative rights of any preferred stock to be issued may be determined by the Company’s Board of Directors. The Company has not issued any shares of preferred stock.


 13 


Equity Incentive Plan


The Company has adopted and the Company’s shareholders have approved the ClearSign Combustion Corporation 2011 Equity Incentive Plan (the Plan) which permits the Company to grant to eligible participants, including officers, employees, directors, consultants and advisors, options to purchase shares of common stock, stock awards and stock bonuses. The Compensation Committee of the Board of Directors is authorized to administer the Plan and establish the grant terms, including the grant price, vesting period and exercise date. At the Company’s Annual Meeting held on May 8, 2019, the shareholders approved an amendment to the Plan that (i) increased the number of shares of common stock in the reserve by 1,231,593 to a total of 4,004,214 shares of common stock, representing approximately 15% of the number of shares of the Company’s stock outstanding and (ii) increased the number of shares that may be issued pursuant to the evergreen provision, if any, to the lesser of 15% of any new shares issued by the Company during the quarter immediately prior to the adjustment date or such lesser amount as the Board of Directors shall determine. Therefore, as of June 30, 2019, the number of shares of common stock reserved for issuance under the Plan totaled 4,004,214.


In the six months ended June 30, 2019, the Company made awards of stock options for the purchase of an aggregate 1,298,718 shares of common stock to its employees and directors from the Plan. Of these awards, options covering 159,100 shares of common stock were awarded in lieu of cash bonuses for 2018 and the expense was recorded during the year ended December 31, 2018. An option for the purchase of 258,618 shares of common stock was issued  from the Plan to the Company’s Chief Executive Officer as part of options for the purchase of an aggregate 600,000 shares of common stock granted to him in conjunction with his recruitment and employment, as described below. Options covering an additional 381,000 shares of common stock have been issued as payment to the Company’s directors and are described below. The remaining stock options awards covering 500,000 shares of common stock have exercise prices at the grant date fair value ranging from $0.87 to $2.25 per share, contractual lives of 10 years, and vest over 2 years. The fair value of the stock options estimated on the date of grant using the Black-Scholes option valuation model was $259,000. The following weighted-average assumptions were utilized in the calculation of the fair value of the stock options:


Expected life   5.75  years
Weighted average volatility   71%  
Forfeiture rate   20%  
Weighted average risk-free interest rate   2.51%  
Expected dividend rate   0%  


Outstanding stock option awards at June 30, 2019 and December 31, 2018 totaled 2,173,033 shares and 880,277 shares, respectively, with the right to purchase 1,152,607 shares and 587,962 shares being vested and exercisable at June 30, 2019 and December 31, 2018, respectively. The recognized compensation expense associated with stock option awards for the three and six months ended June 30, 2019 and 2018 totaled $92,000 and $216,000 and $61,000 and $111,000, respectively. On June 30, 2019 the number of shares reserved under the Plan but unissued totaled 1,239,302. At June 30, 2019, there was $418,000 of total unrecognized compensation cost related to non-vested share based compensation arrangements granted under the Plan. That cost is expected to be recognized over a weighted average period of 2.0 years. The intrinsic value of outstanding stock options was $71,000 at June 30, 2019.


During 2019, the Company’s directors are compensated solely in stock option awards. In addition to being paid for their services as directors, individual directors are paid for committee membership, for services as a committee chair and for services as a lead director. 381,000 options for the purchase of shares of common stock were granted to members of the Board of Directors  for service during 2019. The options have an exercise price of $1 and vest in equal increments at the end of each quarter. The recognized expense associated with Board stock option awards for the three and six months ended June 30, 2019 and 2018 totaled $69,000 and $69,000, and $0 and $0, respectively. At June 30, 2019 there was $68,000 of unrecognized cost related to non-vested Board fees granted under the Plan. The following assumptions were utilized in the calculation of the fair value of the stock options:


Expected life   5.75  years
Weighted average volatility   71%  
Forfeiture rate   20%  
Weighted average risk-free interest rate   2.25%  
Expected dividend rate     0%  


 14 


Consultant Stock Plan


The Company has a Consultant Stock Plan (the Consultant Plan) which provides for the granting of shares of common stock to consultants who provide services related to capital raising, investor relations, and making a market in or promoting the Company’s securities. The Company’s officers, employees, and board members are not entitled to receive awards from the Consultant Plan. The Compensation Committee of the Board of Directors is authorized to administer the Consultant Plan and establish the grant terms. The number of shares reserved for issuance under the Consultant Plan on June 30, 2019 totaled 253,342 with 195,092 of those shares unissued. The Consultant Plan provides for quarterly increases in the available number of authorized shares equal to the lesser of 1% of any new shares issued by the Company during the quarter immediately prior to the adjustment date or such lesser amount as the Board of Directors shall determine. The Company granted 10,000 shares of common stock to a consultant under the Consultant Plan for services performed and to be performed during the period from August 13, 2018 to August 31, 2019. The fair value of the stock at the time of grant was $1.44 per share for a total value of $14,000. The Consultant Plan expense for the three and six months ended June 30, 2019 and 2018 was $4,000 and $7,000 and $8,000 and $17,000, respectively.


Inducement Stock Options


Pursuant to the rules of The Nasdaq Stock Market, and in compliance with those rules, the Company may issue equity awards, including stock options, as an inducement to an individual to accept employment with the Company. Inducement awards need not be approved by the Company’s shareholders. During the six months ending June 30, 2019 the Company granted options to purchase 600,000 shares of common stock as an inducement to its President and Chief Executive Officer to accept the Company’s offer of employment. (See Note 7.) The stock options have exercise prices at the award date fair value ranging from $1.16 to $2.25 per share, contractual lives of 10 years, and vest over 2 years. An option to purchase 258,618 shares was issued from the Company’s 2011 Equity Incentive Plan. Non-qualified stock options covering the remaining 341,382 shares were issued from the Company’s reserve of authorized but unissued shares of common stock. The fair value of the stock options estimated on the date of grant using the Black-Scholes option valuation model was $329,000. The recognized compensation expense associated with these awards for the three and six months ended June 30, 2019 was $49,000 and $158,000, respectively. The remaining unrecognized compensation expense associated with these awards is $171,000. The following weighted-average assumptions were utilized in the calculation of the fair value of the stock options:


Expected life   5.75  years
Weighted average volatility   71%  
Forfeiture rate   20%  
Weighted average risk-free interest rate   2.55%  
Expected dividend rate     0%  


Warrants


At June 30, 2019, warrants for the purchase of 80,000 shares of common stock at an exercise price of $1.80 per share were outstanding and had a remaining life of 1.64 years.


The intrinsic value of the outstanding warrants was $0 at June 30, 2019.


 15 


Note 7 – Commitments and Contingencies


On January 28, 2019 (the “Effective Date”), the Company and Colin James Deller entered into an employment agreement (the “Agreement”) pursuant to which the Company employed Dr. Deller as its President until April 1, 2019, at which time Dr. Deller became the Company’s Chief Executive Officer. Pursuant to the Agreement, the Company pays Dr. Deller an annual salary of $350,000. As an inducement to accept employment with the Company, Dr. Deller was also granted an incentive option to purchase 400,000 shares of the Company’s common stock at an exercise price of $1.16 per share and an incentive option to purchase 200,000 shares of the Company’s common stock at an exercise price of $2.25 per share. Each option has a term of 10 years and will vest as follows: the right to purchase one-third of the shares of common stock subject to the option vested on the Effective Date; the right to purchase one-third of the shares will vest on the first anniversary of the grant date; and the right to purchase one-third of the shares will vest on the second anniversary of the grant date. The Company also agreed to pay certain expenses, not to exceed the sum of $100,000, related to Dr. Deller’s move from Tulsa, Oklahoma to Seattle, Washington, including reasonable expenses related to the sale of his home in Tulsa. As a temporary adjustment for the difference in the cost of living between Tulsa and Seattle (the “Relocation Adjustment”), for a period of four years (the “Payment Period”) from the Effective Date, the Company has also agreed to pay up to $6,000 a month to Dr. Deller for expenses related to temporary housing and travel to and from Tulsa to Seattle. If Dr. Deller purchases a home in the Seattle area, the Relocation Adjustment will continue to be paid through the expiration of the Payment Period, although the Relocation Adjustment may be adjusted or terminated upon mutual agreement of Dr. Deller and the Company. The Agreement may be terminated by the Company for cause, as defined in the Agreement, due to Dr. Deller’s death or disability, upon 30 days’ notice to Dr. Deller or as a result of a change in control, as defined in the Agreement. With the exception of a termination for cause, if Dr. Deller’s employment is terminated by the Company, aside from accrued but unpaid salary, bonus (if any) and business expenses, Dr. Deller will receive the balance of the unpaid Relocation Adjustment and six months of his annual salary.


Through June 30, 2019, the Company has paid Dr. Deller $16,000 in Relocation Adjustment payments to reimburse temporary housing costs.


Litigation


From time to time the Company may become involved in various lawsuits and legal proceedings which arise in the ordinary course of business. Litigation is subject to inherent uncertainties and an adverse result in any such matter may harm the Company’s business. As of the date of this report, the Company is not a party to any material pending legal proceedings.


Indemnification Agreements


The Company maintains indemnification agreements with its directors and officers that may require the Company to indemnify these individuals against liabilities that arise by reason of their status or service as directors or officers, except as prohibited by law.


Subsequent Event


The Company received a letter from Nasdaq on July 9, 2019 stating that it has regained compliance with all listing requirements.


SPECIAL NOTE REGARDING FORWARD-LOOKING STATEMENTS AND OTHER INFORMATION CONTAINED IN THIS REPORT


This report contains forward-looking statements within the meaning of the Private Securities Litigation Reform Act of 1995 and the provisions of Section 27A of the Securities Act of 1933, as amended, and Section 21E of the Securities Exchange Act of 1934, as amended. Forward-looking statements give our current expectations or forecasts of future events. You can identify these statements by the fact that they do not relate strictly to historical or current facts. You can find many (but not all) of these statements by looking for words such as “approximates,” “believes,” “hopes,” “expects,” “anticipates,” “estimates,” “projects,” “intends,” “plans,” “would,” “should,” “could,” “may,” “will” or other similar expressions in this report. In particular, these include statements relating to future actions; prospective products, applications, customers, or technologies; future performance or results of anticipated products; anticipated expenses; and future financial results. These forward-looking statements are subject to certain risks and uncertainties that could cause actual results to differ materially from our historical experience and our present expectations or projections. Factors that could cause actual results to differ materially from those discussed in the forward-looking statements include, but are not limited to:


  · our history of losses;
  · our ability to successfully develop and implement our technology and achieve profitability;
  · our limited operating history;
  · emerging competition and rapidly advancing technology in our industry that may outpace our technology;
  · changes in government regulations that could substantially reduce, or even eliminate, the need for our technology;
  · customer demand for the products and services we develop;


 16 


  · the impact of competitive or alternative products, technologies and pricing;
  · our ability to manufacture any products we design;
  · general economic conditions and events and the impact they may have on us and our potential customers;
  · our ability to obtain adequate financing in the future;
  · our ability to continue as a going concern;
  · our success at managing the risks involved in the foregoing items; and
  · other factors discussed in this report and in the section titled “Risk Factors” in our Annual Report on Form 10-K.


Forward-looking statements may appear throughout this report, including, without limitation, Item 2 “Management’s Discussion and Analysis of Financial Condition and Results of Operations.” The forward-looking statements are based upon management’s beliefs and assumptions and are made as of the date of this report. We undertake no obligation to publicly update or revise any forward-looking statements included in this report. You should not place undue reliance on these forward-looking statements.


Unless otherwise stated or the context otherwise requires, the terms “ClearSign,” “we,” “us,” “our” and the “Company” refer to ClearSign Combustion Corporation and its subsidiary.


ITEM 2.MANAGEMENT’S DISCUSSION AND ANALYSIS OF FINANCIAL CONDITION AND RESULTS OF OPERATIONS


The following discussion and analysis of our financial condition and results of operations should be read in conjunction with the unaudited consolidated condensed financial statements and related notes included elsewhere in this Quarterly Report on Form 10-Q as well as our audited financial statements and related notes included in our Annual Report on Form 10-K. In addition to historical information, this discussion and analysis here and throughout this Form 10-Q contains forward-looking statements that involve risks, uncertainties and assumptions. Our actual results may differ materially from those anticipated in these forward-looking statements due to a number of factors, including but not limited to, the risks described in the section titled “Risk Factors” in our Annual Report on Form 10-K.


OVERVIEW


We design and develop technologies that have been shown to significantly improve key performance characteristics of combustion systems, including emission and operational performance, energy efficiency and overall cost-effectiveness. We believe that our patented Duplex™ technology can enhance the performance of combustion systems in a broad range of markets, including the energy (upstream oil production and down-stream refining), institutional commercial and industrial boiler, chemical, and petrochemical industries. Our Duplex technology, which is our primary technology, uses a porous ceramic matrix at a distance to a burner to significantly reduce flame length and achieve very low emissions without the need for external flue gas recirculation, selective catalytic reduction, or excess air systems. To date, our operations have been funded primarily through sales of our equity securities. We have earned nominal revenue since inception in 2008.


Duplex has been successfully installed in commercial projects across four different combustion applications. Based on the results of our testing and initial field installations, we believe that Duplex is more effective and cost-efficient than current industry-standard air pollution control technologies, such as selective catalytic reduction devices, low- and ultra-low NOx burners (which address nitrogen oxides or NOx), external flue gas recirculation systems and other similar technologies. Such systems are used in our current target market segments of petroleum refining and petrochemical process heaters, large-scale once through steam generators (OTSGs), enclosed flares, institutional commercial and industrial boilers and other similar equipment.


 17 


Based on the limited operating data we have obtained from installations, burners utilizing ClearSign’s ceramic Duplex technology provide increased heat transfer efficiency compared to standard burner designs. This is consistent with the physics of heat transfer and the mechanisms by which the ceramic technology functions. The increased heat transfer efficiency as reported results in cost savings in the low to mid-single digit range which produces an extremely attractive pay-back period for an investment in ClearSign technology-based burners. In addition, since the flames in a Duplex system are established within the confines of a ceramic enclosure and form with minimal “bulking up” from dilutive inert flue gasses, the flame volumes are small, thus virtually eliminating flame impingement and enabling the burners to function better in tightly spaced heaters. As a result, heaters utilizing ClearSign technology require less maintenance, operate at a lower cost, have increased productivity when heater operation is otherwise constrained by the internal furnace volume, and, more importantly, have decreased process downtime.


We were incorporated in Washington on January 23, 2008. The address of our corporate headquarters is 12870 Interurban Avenue South, Seattle, Washington 98168 and our telephone number is (206) 673-4848. Our website can be accessed at www.clearsign.com. The information contained on or that may be obtained from our website is not a part of this report. To date, our operations have been located in the United States, but e have opened an office in Beijing to further our pursuit of opportunities in China and are reviewing opportunities in Europe.


Our Industry


The combustion and emissions control markets are significant, both in the wide array of industries in which the systems are used and in the amount of money spent in installing and upgrading systems. Combustion systems are used to provide heat for all manner of industrial processes, including boilers, furnaces, kilns and gas turbines. In order to maximize energy efficiency while keeping pace with regulatory guidelines for air pollution emissions, operators of combustion systems are continually installing, maintaining and upgrading a variety of costly process control, air pollution control and monitoring systems. Although we believe that there are many potential markets for our Duplex technology, to date we have prioritized the introduction of Duplex to petroleum refining process heaters, steam generation, district heating and enclosed flares.


Our Proprietary Technology


Our Duplex burner technology consists of an industrial burner body and a downstream porous ceramic matrix. When the unreacted mix of gaseous fuel and air is directed at the ceramic matrix, the mixture ignites and stabilizes within the matrix itself. Because the fuel and air have more time to mix, the homogeneous mixture mitigates NOx-forming hot spots and chemistry that are typically produced. The mixing and combustion in the ceramic matrix results in a dramatically shorter flame, and modification of the matrix enables a high level of control over the shape of the flame allowing it to be optimized for a wide range of different applications. NOx, a regulated greenhouse gas pollutant comprised largely of nitrogen oxide and nitrogen dioxide, is greatly reduced to levels of 5 ppm or below, depending on the specific application, without any external fans or associated power, thereby minimizing harmful emissions while improving system efficiency. A shorter flame can often allow for operation of the furnace at a higher capacity. We believe Duplex’s radiant heat transfer from the ceramic matrix enhances thermal efficiency, minimizes the possibility of flame impingement and reduces the likelihood of carbon deposits forming on the inside surfaces of the process tubes (coking) or failure of process tubes, thereby extending the length of time a heater can remain in operation before the need for maintenance.


Our Duplex Plug & Play® product provides a more simplified, pre-engineered and standardized direct burner replacement for traditional refinery process heaters. We believe that this product will reduce the customized engineering associated with typical retrofits and lend itself to mass production. The product derives its name from the fact that it is designed to allow quick and easy installation into a multi-burner heater or furnace and possibly allow the heater to continue operating during installation rather than be shut down. The ability to install the Duplex Plug & Play while the remaining burner system is operational will allow customers to limit down time and shorten the sales cycle often prolonged by annual or semi-annual scheduled maintenance.


 18 


To date, we have deployed our Duplex technology through retrofits and replacements of existing burners and complete replacement units in the case of our Plug & Play products. Retrofits often involve engineering around an existing burner architecture that can complicate the Duplex installation, whereas replacements are more straightforward and more amenable to being sold and installed by third parties, enabling more expansive channels to market. This is especially the case after the introduction of our Duplex Plug & Play technology in February 2017 and simplified control and operation in April 2019. Because of this, we have focused the development of our technology to provide designs that can be included into our customers’ equipment as self-contained modules or assemblies rather than as individual projects involving the re-engineering of existing burner systems. In this form, we believe that ClearSign burner technology is ideally suited for installation into new heaters and burner replacement markets, including heater and furnace types requiring large quantities of burners. We have also developed flare and boiler burner technology into a similar repeatable form to aid its inclusion in standard industry equipment on a commercial scale.


For simplification and marketing, we have adopted the term “ClearSign Coreä,” to refer to the inclusion of this standardized Duplex technology into a variety of combustion systems including, but not limited to, burners, furnaces, boilers, heaters, thermal oxidizers and flares.


We have now achieved emission results in multiple applications that were superior to current local Best Available Control Technology (BACT) levels in multiple installations in California related to three of our five target industries. We intend to continue to demonstrate Duplex capabilities through (i) working with local air quality officials to demonstrate the effectiveness of the technology, (ii) operating in-place units, (iii) engineering and testing with new customers, (iv) pursuing additional lab research and developing new applications (e.g. institutional commercial and industrial boilers) and next generation improvements to Duplex design and standardization, including the pursuit of more complete systems similar to the Duplex Plug & Play for application in other vertical markets, and (v) assisting our customers in making emission results available for designation as BACT by local regulatory bodies.


Business Model and Monetization Strategy


As described above, we have developed our Duplex technology into standardized configurations that can be incorporated into equipment sold by the major vendors in the industry in an effort to gain quick access to our large global markets and that for brand recognition and marketing purposes, we have named the inclusion of our technology into OEM equipment as the “ClearSign Coreä”. This approach allows us to sell our technology business to business, through an arrangement similar to a license, to selected alliance companies which then manufacture and deliver the complete equipment to the final customers. The objective of this business model is to enable ClearSign to leverage our technology and the vast resources and networks of our supply partners to sell to the global markets. The details of such collaborative agreements will vary depending on the nature of the individual markets and requirements to achieve an optimum collaboration with our partners. At this time, we have entered into one such agreement and have received demonstrated interest in collaboration from other major equipment suppliers in all major verticals and target markets.


 19 


Our Target Markets


We compete in the combustion and emissions control markets. These are highly competitive industries that are currently dominated by companies that have both substantially greater infrastructure, customer support networks, and financial resources than we do as well as established products. Based on the testing and the field installations completed to date, however, we believe that our Duplex technology provides a unique and powerful ability to improve energy efficiency and operational performance, while at the same time significantly reducing emissions, leading to an overall cost-effective installation. Further, we believe that the ClearSign burner technology is well suited to create substantial synergistic value through its incorporation into the mainstream commercial offerings of the market incumbents as a “ClearSign Coreä”, thus leveraging the ClearSign technology and the established breadth and capabilities of collaborating companies.


We are targeting the following segments of the combustion market:


·institutional commercial and industrial boiler segment;
·refinery and petrochemical segment;
·large industrial segment;
·enclosed flare segment; and
·enhanced oil recovery segment  


In each segment, we are marketing solutions with our Duplex technology that we believe could simultaneously improve both operational efficiency and pollution control characteristics through (a) cost-effective retrofitting of our Duplex technology into existing standard system designs, and (b) new system designs.


Our target markets are greatly affected by air emission regulations and economic conditions, including the price and profitability related to crude oil and its processing. We believe that operators in all of our target markets are under intense pressure to meet current and proposed federal, state and local emissions standards. The standards applicable to our target markets have been developed over the past 50 years with broad political input. Due to the localized effects of poor air quality, we anticipate these standards to continue regardless of national political leadership.


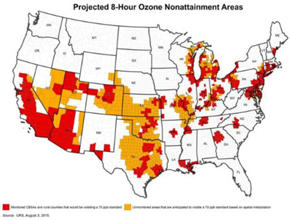
Emissions standards in the United States largely emanate from the Clean Air Act, which is administered by the Environmental Protection Agency (EPA) and regulates six common criteria air pollutants, including ground-level ozone. These regulations are enforced by state and local air quality districts as part of their compliance plans. As a precursor to ground-level ozone, NOx is a regulated pollutant by local air quality districts in order to achieve the EPA limits. The 8-hour ground-level ozone regulations have been reduced from 84 parts per billion (ppb) in 1997, to 75 ppb in 2008, and 70 ppb in 2015, with the requirement of realizing these levels approximately 25 years following the year of legislation. The areas of non-attainment related to this 1997 limit of 84 ppb are depicted below in the map on the left and the projected areas of non-attainment related to the 2015 limit of 70 ppb are depicted below in the map on the right.


Non-attainment areas under the 1997 limit of 84 ppb   Projected non-attainment areas under the 2015 limit of 70 ppb
Source: EPA, August 2016   Source: URS, August 2015


 20 


Additionally, we believe that current emissions standards in Europe, China, the Middle East, other parts of Asia and Canada will continue to trend towards stricter air emission standards as these jurisdictions seek to achieve cleaner air. Existing and new emissions standards in such jurisdictions may create additional market opportunities for us.


Historically, we have funded our operations through the sale of our securities. Over the years we have raised gross proceeds of $72 million and net proceeds of $65.9 million through six offerings of our securities.


Our costs include employee salaries and benefits, compensation paid to consultants, materials and supplies for research, costs associated with development activities including materials, sub-contractors, travel and administration, legal and accounting expenses, sales and marketing costs, general and administrative expenses, and other costs associated with an early stage, publicly-traded technology company. We currently have 15 full-time employees. We anticipate increasing the number of employees required to support our activities in the areas of research and development, sales and marketing, and general and administrative functions. We also expect to incur consulting expenses related to technology development commensurate with our current levels, because using third party expertise and resources is more cost effective than maintaining full time resources, and we expect to incur increasing expenses to protect our intellectual property.


The amount that we spend for any specific purpose may vary significantly, and could depend on a number of factors including, but not limited to, the pace of progress of our commercialization and development efforts, actual needs with respect to product testing, development and research, market conditions, and changes in or revisions to our sales and marketing strategies. 


Research, development, and commercial acceptance of new technologies are, by their nature, unpredictable.  Although we undertake development and commercialization efforts with reasonable diligence, there can be no assurance that the net proceeds from our securities offerings will be sufficient to enable us to develop our technology to the extent needed to create future sales to sustain operations.  If the net proceeds from these offerings are insufficient for this purpose, we will consider other options to continue our path to commercialization, including, but not limited to, additional financing through follow-on equity offerings, debt financing, co-development agreements, sale or licensing of developed intellectual or other property, or other alternatives.


We cannot assure that our technologies will be accepted, that we will ever earn revenues sufficient to support our operations, or that we will ever be profitable. Furthermore, we have no committed source of financing and we cannot assure that we will be able to raise money as and when we need it to continue our operations. If we cannot raise funds as and when we need them, we may be required to scale back our development plans by reducing expenditures for employees, consultants, business development and marketing efforts or to otherwise severely curtail, or even to cease, our operations.


 21 


CRITICAL ACCOUNTING POLICIES


The following discussion and analysis of financial condition and results of operations is based upon our financial statements, which have been prepared in conformity with accounting principles generally accepted in the United States of America. Certain accounting policies and estimates are particularly important to the understanding of our financial position and results of operations and require the application of significant judgment by our management or can be materially affected by changes from period to period in economic factors or conditions that are outside of our control. As a result, they are subject to an inherent degree of uncertainty. In applying these policies, our management uses their judgment to determine the appropriate assumptions to be used in the determination of certain estimates. Those estimates are based on our historical operations, our future business plans and projected financial results, the terms of existing contracts, our observance of trends in the industry, information provided by our customers and information available from other outside sources, as appropriate. See Note 2 to our unaudited condensed consolidated financial statements included elsewhere in this report for a more complete description of our significant accounting policies.


Revenue Recognition and Cost of Goods Sold. The Company recognizes revenue and related cost of goods sold in accordance with FASB ASC 606 Revenue from Contracts with Customers (ASC 606). Revenues and cost of goods sold are recognized once the goods or services are delivered to the customer’s control and performance obligations are satisfied. Typically, the Company’s contracts with customers have performance obligations regarding air emissions and operational performance that are satisfied upon completion of service. Since this is the singular performance obligation and cannot be achieved until the air emissions and operational performance have been successfully tested, revenue related to the contracts is recognized upon project completion.


Product Warranties. The Company warrants all installed products against defects in materials and workmanship for a period specified in each contract by replacing failed parts. Accruals for product warranties are based on historical warranty experience and current product performance trends, and are recorded at the time revenue is recognized as a component of cost of sales. The warranty liabilities are reduced by material and labor costs used to replace parts over the warranty period in the periods in which the costs are incurred. The Company periodically assesses the adequacy of its recorded warranty liabilities and adjusts the amounts as necessary and such adjustments could be material in the future if estimates differ significantly from actual warranty expense. The warranty liabilities are included in accrued liabilities in the balance sheets.


Research and Development. The cost of research and development is expensed as incurred. Research and development costs consist of salaries, benefits, share-based compensation, consulting fees, rent, utilities, depreciation, and consumables.


Stock-Based Compensation. The costs of all employee stock options, as well as other equity-based compensation arrangements, are reflected in the condensed consolidated financial statements based on the estimated fair value of the awards on the grant date. That cost is recognized over the period during which an employee is required to provide service in exchange for the award. Stock compensation for stock granted to non-employees is determined as the fair value of the consideration received or the fair value of equity instruments issued, whichever is more reliably measured.


Fair Value of Financial Instruments. Fair value is the price that would be received to sell an asset or paid to transfer a liability in an orderly transaction between market participants at the measurement date. Assets and liabilities measured at fair value are categorized based on whether or not the inputs are observable in the market and the degree that the inputs are observable. The categorization of financial assets and liabilities within the valuation hierarchy is based upon the lowest level of input that is significant to the fair value measurement.


The Company's financial instruments primarily consist of cash and cash equivalents, accounts payable, accrued expenses and short-term investments in government securities. As of the balance sheet date, the estimated fair values of the financial instruments were not materially different from their carrying values as presented on the balance sheets. This is primarily attributed to the short maturities of these instruments. The Company did not identify any other non-recurring assets and liabilities that are required to be presented in the balance sheets at fair value.


 22 


RESULTS OF OPERATIONS


Comparison of the Three and Six Months Ending June 30, 2019 and 2018


Sales and Gross Profit. We earned no revenues during the three and six month periods ended June 30, 2019 and we incurred $0 and $1,000 in additional warranty costs for previously completed contracts during the same periods. We earned $530,000 in revenues and realized a gross profit of $135,000 from the installation of our Duplex technology in two enclosed ground flares for a major California oil producer and in an OTSG owned by another major California oil producer during the six month period ended June 30, 2018.


Operating Expenses. Operating expenses, consisting of research and development (R&D) and general and administrative (G&A) expenses, increased by approximately $77,000 to $2,447,000 for the three month period ended June 30, 2019, as compared to $2,370,000 for the three month period ended June 30, 2018. During the three month period ended June 30, 2019, the Company decreased its R&D expenses by $155,000, or approximately 15%, to $864,000 as compared to $1,019,000 for the three month period ended June 30, 2018. The decrease in R&D expenses was due primarily to decreased field testing and development costs related to our Duplex technology. G&A expenses increased by $232,000, or approximately 17%, to $1,583,000 for the three month period ended June 30, 2019, as compared to $1,351,000 for the three month period ended June 30, 2018, resulting primarily from the impairment charge recorded as a result of management’s assessment of the Company’s patent portfolio in terms of cost-effectiveness and alignment with the focus on those patents that have significant future commercial value to the Company. During the six month period ended June 30, 2019, operating expenses increased by approximately 1% or $40,000, to $4,823,000, as compared to $4,783,000 for the six month period ended June 30, 2018. The Company’s R&D expenses decreased by $387,000 during the six month period ended June 30, 2019, or approximately 18%, due to decreases in field testing costs. G&A expenses during the six month period ended June 30, 2019 increased by $427,000, or approximately 16%, to $3,057,000, mainly due to the aforementioned review process of the efficacy of our patent portfolio which resulted in impairment charges of $396,000.


Loss from Operations. Our loss from operations increased during the three months ended June 30, 2019 by $57,000, to $2,447,000 from $2,390,000 in the three months ended June 30, 2018 and increased for the six months ended June 30, 2019 by $156,000, to $4,824,000 as compared with $4,668,000 for the six months ended June 30, 2018.


Interest Income. Due to the net proceeds received from our private offering in July 2018 that were invested in short-term treasury bills our interest income from investments for the three months ended June 30, 2019 was $21,000 as compared to $1,000 in the three month period ended June 30, 2018. For the six month period ended June 30, 2019 the interest income was $69,000 compared to $1,000 in the six month period ended June 30, 2018.


Net Loss. Primarily as a result of increased G&A and no gross profit, our net loss for the three month period ended June 30, 2019 was $2,426,000 as compared to a net loss of $2,389,000 for the three month period ended June 30, 2018, resulting in an increase in net loss of $37,000, and our net loss for the six month period ended June 30, 2019 was $4,755,000 as compared to a net loss of $4,667,000 for the same period in 2018, resulting in an increase in net loss of $88,000 or approximately 2%.


Liquidity and Capital Resources


In order to generate meaningful revenues, our technologies must be fully developed, gain market recognition and acceptance and develop a critical level of successful sales and product installations. In addition, management believes that the successful growth and operation of our business is dependent upon our ability to obtain adequate sources of funding through co-development agreements, strategic partnering agreements, or equity or debt financing to adequately support research and development efforts, protect intellectual property, form relationships with strategic partners and provide for working capital and general corporate purposes. There can be no assurance that we will be successful in achieving our long-term plans, or that such plans, if consummated, will result in profitable operations or enable us to continue in the long-term as a going concern.


At June 30, 2019, our cash and cash equivalent balance totaled $9,657,000 compared to $8,949,000 at December 31, 2018. This increase resulted primarily from the maturity of a short-term investment treasury bill. Assuming that our expenses do not increase significantly and that we make no material acquisitions, we anticipate that the current available cash and cash equivalent balance will be sufficient to fund the Company’s ongoing business activities for at least twelve months from the date of filing of this report.


At June 30, 2019, our current assets were in excess of current liabilities resulting in working capital of $10,859,000 compared to $14,774,000 at December 31, 2018. The decrease in working capital resulted primarily from the funds used in operations and invested in intangible and fixed assets.


Operating activities for the six months ended June 30, 2019 resulted in cash outflows of $3,967,000 which were due primarily to the loss for the period of $4,755,000. These were offset primarily by other non-cash expenses of $130,000, impairment loss of $396,000, and services paid with common stock and stock options of $450,000, and net decrease in working capital exclusive of cash, by $188,000. Operating activities for the six months ended June 30, 2018 resulted in cash outflows of $4,581,000, which were due primarily to the loss for the period of $4,667,000. These were offset primarily by other non-cash expenses of $167,000, services paid with common stock and stock options of $228,000, and net increase in working capital, exclusive of cash, by $309,000.


 23 


Investing activities for the six months ended June 30, 2019 resulted in cash inflows of $4,675,000 from the maturity of short term treasury bills, offset by $243,000 in cash used for development of patents and $17,000 for acquisition of fixed assets, compared to $211,000 in disbursements for patent development and $19,000 for the acquisition of fixed assets during the same period of 2018.


There were no net cash inflows from financing activities in the six months ended June 30, 2019. In the six months ending June 30, 2018, we received net proceeds of $11,923,000 from a public offering of our common stock.


Off-Balance Sheet Transactions


We do not have any off-balance sheet transactions.


ITEM 3.QUANTITATIVE AND QUALITATIVE DISCLOSURES ABOUT MARKET RISK


As a smaller reporting company we are not required to provide this information.


ITEM 4.CONTROLS AND PROCEDURES


Disclosure Controls and Procedures


Disclosure controls and procedures include, without limitation, controls and procedures designed to ensure that information required to be disclosed by an issuer in the reports that it files or submits under the Securities Exchange Act of 1934, as amended, is accumulated and communicated to the issuer’s management, including its principal executive and principal financial officers, or persons performing similar functions, as appropriate, to allow timely decisions regarding required disclosure. Our management, with the participation of our Chief Executive Officer (CEO) (principal executive officer) and our Interim Chief Financial Officer (CFO) (principal financial and accounting officer), has concluded that, as of June 30, 2019, our disclosure controls and procedures are effective.


Changes in Internal Control over Financial Reporting


There have been no material changes in our internal control over financial reporting that occurred during the quarter ended June 30, 2019 that have materially affected, or are reasonably likely to materially affect, our internal controls over financial reporting.


Inherent Limitations on Effectiveness of Controls


Our management, including our CEO and CFO, does not expect that our disclosure controls and procedures or our internal control over financial reporting will prevent or detect all errors and all fraud. A control system, no matter how well-designed and operated, can provide only reasonable, not absolute, assurance that the control system’s objectives will be met. The design of a control system must reflect the fact that there are resource constraints, and the benefits of controls must be considered relative to their costs. Further, because of the inherent limitations in all control systems, no evaluation of controls can provide absolute assurance that misstatements due to error or fraud will not occur or that all control issues and instances of fraud, if any, have been detected. The design of any system of controls is based in part on certain assumptions about the likelihood of future events, and there can be no assurance that any design will succeed in achieving its stated goals under all potential future conditions. Projections of any evaluation of the effectiveness of controls to future periods are subject to risks. Over time, controls may become inadequate because of changes in conditions or deterioration in the degree of compliance with policies or procedures.


 24 


PART II-OTHER INFORMATION


ITEM 1.LEGAL PROCEEDINGS


From time to time we may become involved in various lawsuits and legal proceedings which arise in the ordinary course of business. However, litigation is subject to inherent uncertainties and an adverse result in these or other matters may arise from time to time that may harm our business. We are currently not aware of any such legal proceedings or claims that we believe will have a material adverse effect on our business, financial condition or operating results.


ITEM 1A.RISK FACTORS


We incorporate herein by reference the risk factors included under Item 1A of our Annual Report on Form 10-K for the year ended December 31, 2018 which we filed with the Securities and Exchange Commission on March 12, 2019.


A cybersecurity incident or other technology disruptions could negatively impact our business and our relationships with customers.


We use computers in substantially all aspects of our business operations. We also use mobile devices and other online activities to connect with our employees, suppliers and customers. Such uses give rise to cybersecurity risks, including security breaches, espionage, system disruption, theft, the compromise of trade secrets and inadvertent release of information. Our business involves the storage and transmission of sensitive and/or confidential information and intellectual property, including customers’ and suppliers’ information, private information about employees and financial and strategic information about us. If we fail to assess and identify cybersecurity risks associated with our operations, we may become increasingly vulnerable to such risks. Additionally, while we have implemented measures to prevent security breaches and cyber incidents, our preventative measures and incident response efforts may not be entirely effective. The theft, destruction, loss, misappropriation, or release of sensitive and/or confidential information or intellectual property, or interference with our information technology systems, could result in business disruption, negative publicity, brand damage, violation of privacy laws, loss of customers, potential liability and competitive disadvantage all of which could have a material adverse effect on our business, financial condition or results of operations.


ITEM 2.UNREGISTERED SALES OF EQUITY SECURITIES AND USE OF PROCEEDS


On June 30, 2019 we issued 2,500 shares of common stock, having a per share value of $1.44, the closing price of our common stock on October 31, 2018, the date of grant, from our 2013 Consultant Stock Plan to our investor relations firm, Firm IR, for services provided in the three months ended June 30, 2019.


ITEM 3.DEFAULTS UPON SENIOR SECURITIES


Not applicable.


ITEM 4.MINE SAFETY DISCLOSURES


Not applicable.


ITEM 5.OTHER INFORMATION


Not applicable


 25 


ITEM 6.EXHIBITS


Exhibit
Number
  Document
     
3.1.1   Articles of Incorporation of ClearSign Combustion Corporation(1)
     
3.1.2   Articles of Amendment to Articles of Incorporation of ClearSign Combustion Corporation(2)
     
3.1.3   Articles of Amendment to Articles of Incorporation of ClearSign Combustion Corporation (3)
     
3.2.1   Bylaws (1)
     
3.2.2   Amendment to Bylaws (4)
     
31.1   Rule 13a-14(a)/15d-14(a) Certification of Chief Executive Officer*
     
31.2   Rule 13a-14(a)/15d-14(a) Certification of Interim Chief Financial Officer*
     
32.1   Section 1350 Certification of Chief Executive Officer and Interim Chief Financial Officer+
     
101.INS   XBRL Instant Document*
     
101.SCH   XBRL Taxonomy Extension Schema Document*
     
101.CAL   XBRL Taxonomy Extension Calculation Linkbase Document*
     
101.DEF   XBRL Taxonomy Extension Definition Linkbase Document*
     
101.LAB   XBRL Taxonomy Extension Label Linkbase Document*
     
101.PRE   XBRL Taxonomy Extension Presentation Linkbase Document*


*Filed herewith

+Furnished herewith


(1) Incorporated by reference from the registration statement on Form S-1, as amended, file number 333-177946, originally filed with the Securities and Exchange Commission on November 14, 2011.

(2) Incorporated by reference from the pre-effective amendment no. 2 to the registration statement on Form S-1 filed with the Securities and Exchange Commission on February 7, 2012.

(3) Incorporated by reference from the registrant’s definitive proxy statement on Schedule 14a filed with the Securities and Exchange Commission on April 4, 2019.

(4) Incorporated by reference from the registrant’s Current Report on Form 8-K filed with the Securities and Exchange Commission on June 12, 2019.


 26 


SIGNATURES


Pursuant to the requirements of the Securities Exchange Act of 1934, as amended, the registrant has duly caused this report to be signed on its behalf by the undersigned, thereunto duly authorized.


  CLEARSIGN COMBUSTION CORPORATION
  (Registrant)


Date: August 14, 2019

     
By: /s/ Colin James Deller
    Colin James Deller
    Chief Executive Officer
     
  By: /s/ Brian G. Fike
    Brian G. Fike
    Interim Chief Financial Officer


 27 


Exhibit 31.1

CERTIFICATION


I, Colin James Deller, certify that:


1.I have reviewed this quarterly report on Form 10-Q of ClearSign Combustion Corporation;


2.Based on my knowledge, this report does not contain any untrue statement of a material fact or omit to state a material fact necessary to make the statements made, in light of the circumstances under which such statements were made, not misleading with respect to the period covered by this report;


3.Based on my knowledge, the financial statements, and other financial information included in this report, fairly present in all material respects the financial condition, results of operations and cash flows of the registrant as of, and for, the periods presented in this report;


4.The registrant’s other certifying officer(s) and I are responsible for establishing and maintaining disclosure controls and procedures (as defined in Exchange Act Rules 13a-15(e) and 15-d-15(e)) and internal control over financial reporting (as defined in Exchange Act Rules 13a-15(f) and 15d-15(f)) for the registrant and have:


a)Designed such disclosure controls and procedures, or caused such disclosure controls and procedures to be designed under our supervision, to ensure that material information relating to the registrant, including any consolidated subsidiaries, is made known to us by others within those entities, particularly during the period in which this report is being prepared;


b)Designed such internal control over financial reporting, or caused such internal control over financial reporting to be designed under our supervision, to provide reasonable assurance regarding the reliability of financial reporting and the preparation of financial statements for external purposes in accordance with generally accepted accounting principles;


c)Evaluated the effectiveness of the registrant’s disclosure controls and procedures and presented in this report our conclusions about the effectiveness of the disclosure controls and procedures, as of the end of the period covered by this report based on such evaluation; and


d)Disclosed in this report any change in the registrant’s internal control over financial reporting that occurred during the registrant’s most recent fiscal quarter (the registrant’s fourth fiscal quarter in the case of an annual report) that has materially affected, or is reasonably likely to materially affect, the registrant’s internal control over financial reporting; and


5.The registrant’s other certifying officer(s) and I have disclosed, based on our most recent evaluation of internal control over financial reporting, to the registrant’s auditors and the audit committee of the registrant’s board of directors (or persons performing the equivalent functions):


a)All significant deficiencies and material weaknesses in the design or operation of internal control over financial reporting which are reasonably likely to adversely affect the registrant’s ability to record, process, summarize and report financial information; and


b)Any fraud, whether or not material, that involves management or other employees who have a significant role in the registrant’s internal control over financial reporting.


Date: August 14, 2019


/s/ Colin James Deller  

Colin James Deller

Chief Executive Officer (Principal Executive Officer)


Exhibit 31.2

CERTIFICATION


I, Brian G. Fike, certify that:


1.I have reviewed this quarterly report on Form 10-Q of ClearSign Combustion Corporation;


2.Based on my knowledge, this report does not contain any untrue statement of a material fact or omit to state a material fact necessary to make the statements made, in light of the circumstances under which such statements were made, not misleading with respect to the period covered by this report;


3.Based on my knowledge, the financial statements, and other financial information included in this report, fairly present in all material respects the financial condition, results of operations and cash flows of the registrant as of, and for, the periods presented in this report;


4.The registrant’s other certifying officer(s) and I are responsible for establishing and maintaining disclosure controls and procedures (as defined in Exchange Act Rules 13a-15(e) and 15-d-15(e)) and internal control over financial reporting (as defined in Exchange Act Rules 13a-15(f) and 15d-15(f)) for the registrant and have:


a)Designed such disclosure controls and procedures, or caused such disclosure controls and procedures to be designed under our supervision, to ensure that material information relating to the registrant, including any consolidated subsidiaries, is made known to us by others within those entities, particularly during the period in which this report is being prepared;


b)Designed such internal control over financial reporting, or caused such internal control over financial reporting to be designed under our supervision, to provide reasonable assurance regarding the reliability of financial reporting and the preparation of financial statements for external purposes in accordance with generally accepted accounting principles;


c)Evaluated the effectiveness of the registrant’s disclosure controls and procedures and presented in this report our conclusions about the effectiveness of the disclosure controls and procedures, as of the end of the period covered by this report based on such evaluation; and


d)Disclosed in this report any change in the registrant’s internal control over financial reporting that occurred during the registrant’s most recent fiscal quarter (the registrant’s fourth fiscal quarter in the case of an annual report) that has materially affected, or is reasonably likely to materially affect, the registrant’s internal control over financial reporting; and


5.The registrant’s other certifying officer(s) and I have disclosed, based on our most recent evaluation of internal control over financial reporting, to the registrant’s auditors and the audit committee of the registrant’s board of directors (or persons performing the equivalent functions):


a)All significant deficiencies and material weaknesses in the design or operation of internal control over financial reporting which are reasonably likely to adversely affect the registrant’s ability to record, process, summarize and report financial information; and


b)Any fraud, whether or not material, that involves management or other employees who have a significant role in the registrant’s internal control over financial reporting.


Date: August 14, 2019  
   
/s/ Brian G. Fike  
Brian G. Fike  
Interim Chief Financial Officer (Principal Financial and Accounting Officer)  


Exhibit 32.1


CERTIFICATION


In connection with the periodic report of ClearSign Combustion Corporation (the “Company”) on Form 10-Q for the quarterly period ended June 30, 2019 as filed with the Securities and Exchange Commission (the “Report”), we, Colin James Deller, Chief Executive Officer (Principal Executive Officer) and Brian G. Fike, Interim Chief Financial Officer (Principal Financial and Accounting Officer) of the Company, hereby certify as of the date hereof, solely for purposes of Rule 13a-14(b) of the Securities Exchange Act of 1934, as amended (the “Exchange Act”) and Title 18, Chapter 63, Section 1350 of the United States Code, that to the best of our knowledge:


(1)       The Report fully complies with the requirements of Section 13(a) or 15(d), as applicable, of the Exchange Act, and


(2)       The information contained in the Report fairly presents, in all material respects, the financial condition and results of operations of the Company at the dates and for the periods indicated.


Date: August 14, 2019  
   
/s/ Colin James Deller  
Colin James Deller  
Chief Executive Officer (Principal Executive Officer)  
   
/s/ Brian G. Fike  
Brian G. Fike  
InterimChief Financial Officer (Principal Financial and Accounting Officer)  


This certification accompanies the Form 10-Q to which it relates, is not deemed filed with the Securities and Exchange Commission and is not to be incorporated by reference into any filing of ClearSign Combustion Corporation under the Securities Act of 1933, as amended, or the Securities Exchange Act of 1934, as amended (whether made before or after the date of the Form 10-Q), irrespective of any general incorporation language contained in such filing.


v3.19.2
Document and Entity Information - shares
6 Months Ended
Jun. 30, 2019
Aug. 14, 2019
Document and Entity Information    
Document Type 10-Q  
Amendment Flag false  
Document Period End Date Jun. 30, 2019  
Document Fiscal Year Focus 2019  
Document Fiscal Period Focus Q2  
Entity Registrant Name CLEARSIGN COMBUSTION CORP  
Entity Central Index Key 0001434524  
Current Fiscal Year End Date --12-31  
Entity Current Reporting Status Yes  
Entity Filer Category Non-accelerated Filer  
Trading Symbol CLIR  
Entity Common Stock, Shares Outstanding   26,702,261
Entity Emerging Growth Company false  
Entity Shell Company false  
Entity Small Business true  
v3.19.2
Condensed Consolidated Balance Sheets - USD ($)
Jun. 30, 2019
Dec. 31, 2018
Current Assets:    
Cash and cash equivalents $ 9,657,000 $ 8,949,000
Short-term investments 1,988,000 6,923,000
Contract assets 42,000 39,000
Prepaid expenses and other assets 629,000 500,000
Total current assets 12,316,000 16,411,000
Fixed assets, net 384,000 457,000
Patents and other intangible assets, net 1,530,000 1,759,000
Other assets 10,000 10,000
Total Assets 14,240,000 18,637,000
Current Liabilities:    
Accounts payable and accrued liabilities 946,000 1,080,000
Current portion of lease liabilities 190,000 216,000
Accrued compensation and taxes 321,000 341,000
Total current liabilities 1,457,000 1,637,000
Long Term Liabilities:    
Long term lease liabilities 79,000 91,000
Total liabilities 1,536,000 1,728,000
Stockholders' Equity:    
Preferred stock, $0.0001 par value, zero shares issued and outstanding 0 0
Common stock, $0.0001 par value, 26,702,261 and 26,697,261 shares issued and outstanding at June 30, 2019 and December 31, 2018, respectively 3,000 3,000
Additional paid-in capital 76,967,000 76,417,000
Accumulated deficit (64,266,000) (59,511,000)
Total stockholders' equity 12,704,000 16,909,000
Total Liabilities and Stockholders' Equity $ 14,240,000 $ 18,637,000
v3.19.2
Consolidated Balance Sheets (Parenthetical) - $ / shares
Jun. 30, 2019
Dec. 31, 2018
Condensed Consolidated Balance Sheets    
Preferred stock, par value (in dollars per share) $ 0.0001 $ 0.0001
Preferred stock, shares issued 0 0
Preferred stock, shares outstanding 0 0
Common stock, par value (in dollars per share) $ 0.0001 $ 0.0001
Common stock, shares issued 26,702,261 26,697,261
Common stock, shares outstanding 26,702,261 26,697,261
v3.19.2
Condensed Consolidated Statements of Operations - USD ($)
3 Months Ended 6 Months Ended
Jun. 30, 2019
Jun. 30, 2018
Jun. 30, 2019
Jun. 30, 2018
Condensed Consolidated Statements of Operations        
Sales $ 0 $ 0 $ 0 $ 530,000
Cost of goods sold 0 20,000 1,000 415,000
Gross profit (loss) 0 (20,000) (1,000) 115,000
Operating expenses:        
Research and development, net of grants 864,000 1,019,000 1,766,000 2,153,000
General and administrative 1,583,000 1,351,000 3,057,000 2,630,000
Total operating expenses 2,447,000 2,370,000 4,823,000 4,783,000
Loss from operations (2,447,000) (2,390,000) (4,824,000) (4,668,000)
Other income:        
Interest income 21,000 1,000 69,000 1,000
Net loss $ (2,426,000) $ (2,389,000) $ (4,755,000) $ (4,667,000)
Net loss per share - basic and fully diluted $ (0.09) $ (0.11) $ (0.18) $ (0.24)
Weighted average number of shares outstanding - basic and fully diluted 26,699,788 21,362,596 26,698,546 19,549,975
v3.19.2
Condensed Consolidated Statements of Stockholders' Equity - USD ($)
Common Stock [Member]
Additional Paid-In Capital [Member]
Retained Earnings [Member]
Total
Balances at Dec. 31, 2017 $ 2,000 $ 52,441,000 $ (50,011,000) $ 2,432,000
Balances (in shares) at Dec. 31, 2017 15,608,853      
Shares issued in stock offering ($2.25 per share)   12,937,000 0 12,937,000
Shares issued in stock offering ($2.25 per share) 5,750,000      
Issuance costs of rights offering   (1,014,000) 0 (1,014,000)
Shares issued for services   9,000 0 9,000
Shares issued for services (in shares) 2,500      
Share Based Compensation   50,000 0 50,000
Net loss     (2,278,000) (2,278,000)
Balances at Mar. 31, 2018 $ 2,000 64,423,000 (52,289,000) 12,136,000
Balances (in shares) at Mar. 31, 2018 21,361,353      
Balances at Dec. 31, 2017 $ 2,000 52,441,000 (50,011,000) 2,432,000
Balances (in shares) at Dec. 31, 2017 15,608,853      
Net loss       (4,667,000)
Balances at Jun. 30, 2018 $ 2,000 64,592,000 (54,678,000) 9,916,000
Balances (in shares) at Jun. 30, 2018 21,417,909      
Balances at Mar. 31, 2018 $ 2,000 64,423,000 (52,289,000) 12,136,000
Balances (in shares) at Mar. 31, 2018 21,361,353      
Shares issued for services $ 0 8,000 0 8,000
Shares issued for services (in shares) 2,500      
Shares issued for board service ($1.85 per share) $ 0 100,000 0 100,000
Shares issued for board service ($1.85 per share) (in Shares) 54,056      
Share Based Compensation   61,000 0 61,000
Net loss $ 0 0 (2,389,000) (2,389,000)
Balances at Jun. 30, 2018 $ 2,000 64,592,000 (54,678,000) 9,916,000
Balances (in shares) at Jun. 30, 2018 21,417,909      
Balances at Dec. 31, 2018 $ 3,000 76,417,000 (59,511,000) 16,909,000
Balances (in shares) at Dec. 31, 2018 26,697,261      
Shares issued for services   3,000   3,000
Shares issued for services (in shares) 2,500      
Fair value of stock options issued in payment of accrued compensation $ 0 100,000 0 100,000
Share Based Compensation   233,000   233,000
Net loss     (2,329,000) (2,329,000)
Balances at Mar. 31, 2019 $ 3,000 76,753,000 (61,840,000) 14,916,000
Balances (in shares) at Mar. 31, 2019 26,699,761      
Balances at Dec. 31, 2018 $ 3,000 76,417,000 (59,511,000) 16,909,000
Balances (in shares) at Dec. 31, 2018 26,697,261      
Net loss       (4,755,000)
Balances at Jun. 30, 2019 $ 3,000 76,967,000 (64,266,000) 12,704,000
Balances (in shares) at Jun. 30, 2019 26,702,261      
Balances at Mar. 31, 2019 $ 3,000 76,753,000 (61,840,000) 14,916,000
Balances (in shares) at Mar. 31, 2019 26,699,761      
Shares issued for services   4,000   4,000
Shares issued for services (in shares) 2,500      
Fair value of stock options issued in payment of accrued compensation   69,000   69,000
Share Based Compensation   141,000   141,000
Net loss     (2,426,000) (2,426,000)
Balances at Jun. 30, 2019 $ 3,000 $ 76,967,000 $ (64,266,000) $ 12,704,000
Balances (in shares) at Jun. 30, 2019 26,702,261      
v3.19.2
Condensed Consolidated Statements of Stockholders' Equity (Parenthetical) - $ / shares
3 Months Ended
Jun. 30, 2019
Mar. 31, 2019
Jun. 30, 2018
Mar. 31, 2018
Condensed Consolidated Statements of Stockholders' Equity        
Common stock for services per share issue one $ (1.44) $ (1.44) $ (3.50) $ (3.50)
Stock Issued During Period Board Services Per Share     $ (1.85)  
Stock Issued During Period Rights Offering Per Share       $ (2.25)
v3.19.2
Condensed Consolidated Statements of Cash Flows - USD ($)
6 Months Ended
Jun. 30, 2019
Jun. 30, 2018
Cash flows from operating activities:    
Net loss $ (4,755,000) $ (4,667,000)
Adjustments to reconcile net loss to net cash used in operating activities:    
Common stock issued for services 7,000 117,000
Share based compensation 443,000 111,000
Depreciation and amortization 130,000 167,000
Abandonment and impairment of capitalized patent costs 396,000 0
Change in operating assets and liabilities:    
Contract assets (3,000) 145,000
Prepaid expenses and other assets (129,000) (327,000)
Accounts payable and accrued liabilities (136,000) 41,000
Accrued compensation and taxes 80,000 (168,000)
Net cash used in operating activities (3,967,000) (4,581,000)
Cash flows from investing activities:    
Acquisition of fixed assets (17,000) (19,000)
Disbursements for patents and other intangible assets (243,000) (211,000)
Maturity of short term treasury bills 4,935,000 0
Net cash provided by (used in) investing activities 4,675,000 (230,000)
Cash flows from financing activities:    
Proceeds from issuance of common stock, net of offering costs 0 11,923,000
Net cash provided by financing activities 0 11,923,000
Net increase in cash and cash equivalents 708,000 7,112,000
Cash and cash equivalents, beginning of year 8,949,000 1,247,000
Cash and cash equivalents, end of year $ 9,657,000 $ 8,359,000
v3.19.2
Condensed Consolidated Statements of Cash Flows (Parenthetical) - USD ($)
6 Months Ended
Jun. 30, 2019
Dec. 31, 2018
Cash Flow Noncash Operating Activities Disclosure [Abstract]    
Stock Issued During Period, Shares, Share-based Compensation, Net of Forfeitures 159,100  
Due to Officers or Stockholders, Current   $ 100,000
v3.19.2
Organization and Description of Business
6 Months Ended
Jun. 30, 2019
Organization and Description of Business  
Organization and Description of Business

Note 1 – Organization and Description of Business

ClearSign Combustion Corporation (ClearSign or the Company) designs and develops technologies for the purpose of improving key performance characteristics of combustion systems, including emission and operational performance, energy efficiency and overall cost-effectiveness. The Company’s primary technologies include its Duplex™ technology, which achieves very low emissions without the need of external flue gas recirculation, selective catalytic reduction, or higher excess air operation, and its Electrodynamic Combustion Control™ or ECC™ technology, which introduces a computer-controlled electric field into the combustion region that may better control gas-phase chemical reactions and improve system performance and cost-effectiveness. The Company is headquartered in Seattle, Washington and was incorporated in the state of Washington in 2008. On July 28, 2017, the Company incorporated a subsidiary, ClearSign Asia Limited, in Hong Kong to represent the Company’s business and technological interests throughout Asia. Through ClearSign Asia Limited, the Company has established a Wholly Foreign Owned Enterprise (WFOE) in China – ClearSign Combustion (Beijing) Environmental Technologies Co., LTD.

Liquidity

The Company’s technologies are currently in field development and have generated nominal revenues from operations to date to meet operating expenses. In order to generate meaningful revenues, the technologies must be fully developed, gain market recognition and acceptance, and develop a critical level of successful sales and product installations. The Company has historically financed its operations primarily through issuances of equity securities, including $11.9 million in proceeds, net of offering costs, from a stock offering completed on February 27, 2018 and $11.6 million in proceeds, net of offering costs, from a stock offering completed on July 20, 2018. The Company has incurred losses since its inception totaling $64,266,000 and expects to experience operating losses and negative cash flows for the foreseeable future. Management believes that the successful growth and operation of the Company’s business is dependent upon its ability to obtain adequate sources of funding through co-development agreements, strategic partnering agreements, or equity or debt financing to adequately support research and development efforts, protect intellectual property, form relationships with strategic partners, and provide for working capital and general corporate purposes. There can be no assurance that the Company will be successful in achieving its long-term plans as set forth above, or that such plans, if consummated, will result in profitable operations or enable the Company to continue in the long-term as a going concern.


v3.19.2
Summary of Significant Accounting Policies
6 Months Ended
Jun. 30, 2019
Summary of Significant Accounting Policies  
Summary of Significant Accounting Policies

Note 2 – Summary of Significant Accounting Policies

Basis of Presentation

The accompanying unaudited condensed consolidated financial statements have been prepared in accordance with the rules and regulations of the Securities and Exchange Commission (the “SEC”) for Form 10‑Q. Accordingly, certain information and footnote disclosures normally included in financial statements prepared in accordance with generally accepted accounting principles have been condensed or omitted pursuant to such rules and regulations. The condensed balance sheet at December 31, 2018 has been derived from the Company’s audited financial statements.

In the opinion of management, these consolidated financial statements reflect all normal recurring and other adjustments necessary for a fair presentation. These consolidated financial statements should be read in conjunction with the audited consolidated financial statements included in the Company's Annual Report on Form 10‑K for the year ended December 31, 2018. Operating results for interim periods are not necessarily indicative of operating results for an entire fiscal year or any other future periods.

The accompanying unaudited condensed consolidated financial statements include the accounts of ClearSign and its subsidiary. Intercompany balances and transactions have been eliminated in consolidation.

Use of Estimates

The preparation of financial statements in conformity with accounting principles generally accepted in the United States of America requires management to make certain estimates and assumptions that affect the reported amounts of assets and liabilities and disclosure of contingent assets and liabilities at the date of the financial statements and the reported amounts of revenues and expenses during the reporting period. Actual results could differ from those estimates.

Revenue Recognition and Cost of Sales

The Company recognizes revenue and related cost of goods sold in accordance with FASB ASC 606 Revenue from Contracts with Customers (ASC 606). Revenues and cost of goods sold are recognized once the goods or services are delivered to the customer’s control and performance obligations are satisfied. Typically, the Company’s contracts with customers have performance obligations regarding air emissions and operational performance that are satisfied upon completion of service. Since this is the singular performance obligation and cannot be achieved until the air emissions and operational performance have been successfully tested, revenue related to the contracts is recognized upon project completion.

The Company’s contracts generally include progress payments from the customer upon completion of defined milestones. As these payments are received they are offset against accumulated project costs and recorded as either contract assets or contract liabilities. Upon completion of the performance obligations and acceptance by the customer the projects can be recorded as revenue.

The Company’s contracts with customers contain no variable considerations or incentives or discounts that would cause revenue to be allocated or adjusted over time. Therefore, no separate methods of evaluating the contracts other than consideration of the price at achievement of the performance objectives was used in satisfying the review requirements of ASC 606.

Contract Acquisition Costs and Practical Expedients

For contracts that have a duration of less than one year, the Company follows ASC 606, practical expedients and expenses those costs when incurred; for contracts with a life exceeding one year, the Company records those costs when performance obligations related to the contract are completed. The Company generally expenses sales commissions when earned. The Company records those costs within general and administrative expenses.

Product Warranties

The Company warrants all installed products against defects in materials and workmanship for a period specified in each contract by replacing failed parts. Accruals for product warranties are based on historical warranty experience and current product performance trends, and are recorded at the time revenue is recognized as a component of cost of sales. The warranty liabilities are reduced by material and labor costs used to replace parts over the warranty period in the periods in which the costs are incurred. The Company periodically assesses the adequacy of its recorded warranty liabilities and adjusts the amounts as necessary, and such adjustments could be material in the future if estimates differ significantly from actual warranty expense. The warranty liabilities are included in accrued liabilities in the balance sheets.

Cash and Cash Equivalents

Highly liquid investments purchased with an original maturity of three months or less are considered cash equivalents. Cash is maintained with a commercial bank where accounts are generally guaranteed by the Federal Deposit Insurance Corporation up to $250,000. The Company’s deposits may at times exceed this limit. The Company also maintains a cash balance in China which is insured up to $75,000  (500,000RMB). The Company has not experienced losses in such accounts and believes it is not exposed to any significant credit risk on cash and cash equivalents.

Short-Term Investments

Short-term investments consist of U.S. treasury bills with original maturities of twelve months or less and greater than three months. These short-term investments are classified as held to maturity and are recorded on an amortized cost basis which approximates fair value.

Accounts Receivable and Allowance for Doubtful Accounts

Accounts receivable are recorded at the invoiced amount. An allowance for doubtful accounts is established, as necessary, based on past experience and other factors which, in management’s judgment, deserve current recognition in estimating bad debts. The determination of the collectability of amounts due from customer accounts requires the Company to make judgments regarding future events and trends. Allowances for doubtful accounts are determined based on assessing the Company’s portfolio on an individual customer and on an overall basis. This process consists of a review of historical collection experience, current aging status of the customer accounts, and the financial condition of the Company’s customers. Based on a review of these factors, the Company may establish or adjust the allowance for specific customers and the accounts receivable portfolio as a whole.

Fixed Assets and Leases

Fixed assets are recorded at cost. Leases are recorded in accordance with FASB ASC 842 Leases. For those leases with a term greater than one year, the Company recognizes on the balance sheet at the time of lease inception or modification a right-of-use asset and a lease liability, initially measured at the present value of the lease payments. Lease costs are recognized in the income statement over the lease term on a straight-line basis. Operating leases with a term of 1 year or less are recognized on a straight line basis over the term. Depreciation is computed using the straight-line method over the estimated useful lives of the respective assets. Leasehold improvements are depreciated over the life of the lease or their useful life, whichever is shorter. All other fixed assets are depreciated over two to four years. Maintenance and repairs are expensed as incurred.

Patents and Trademarks

Patents and trademarks are recorded at cost. Amortization is computed using the straight-line method over the estimated useful lives of the assets once they are awarded.

Impairment of Long-Lived Assets

The Company tests long-lived assets for impairment whenever events or changes in circumstances indicate that the carrying amount of an asset may not be recoverable through the estimated undiscounted cash flows expected to result from the use and eventual disposition of the assets. In that event, a loss is recognized based on the amount by which the carrying amount exceeds the fair value of the long-lived assets. Fair value is determined based on the present value of estimated expected cash flows using a discount rate commensurate with the risks involved, quoted market prices, or appraised values depending upon the nature of the assets. Loss on long-lived assets to be disposed of is determined in a similar manner, except that fair values are reduced for the cost of disposal.

Fair Value of Financial Instruments

Fair value is the price that would be received to sell an asset or paid to transfer a liability in an orderly transaction between market participants at the measurement date. Assets and liabilities measured at fair value are categorized based on whether or not the inputs are observable in the market and the degree that the inputs are observable. The categorization of financial assets and liabilities within the valuation hierarchy is based upon the lowest level of input that is significant to the fair value measurement. The three levels of inputs used to establish fair value are the following:

·

Level 1 – Quoted prices in active markets for identical assets or liabilities;

·

Level 2 – Inputs other than Level 1 that are observable, either directly or indirectly, such as quoted prices for similar assets or liabilities, quoted prices in markets that are not active, or other inputs that are observable or can be corroborated by observable market data for substantially the full term of the assets or liabilities; and

·

Level 3 – Unobservable inputs that are supported by little or no market activity and that are significant to the fair value of the assets or liabilities.

The Company’s financial instruments primarily consist of cash and cash equivalents, short-term investments, accounts payable and accrued expenses. As of the balance sheet dates, the estimated fair values of the financial instruments were not materially different from their carrying values as presented on the balance sheets. This is primarily attributable to the short-term maturities of these instruments.

The Company did not identify any other non-recurring assets and liabilities that are required to be presented in the balance sheets at fair value.

Research and Development

The cost of research and development is expensed as incurred. Research and development costs consist of salaries, benefits, share based compensation, consulting fees, rent, utilities, depreciation, and consumables.

During the six months ended June 30, 2019, the Company received $108,000 to partially fund specific research and development activity relating to its ECC technology. Since these funds were provided without expectation of reciprocation, except notification of research results, the funds received were offset against the related research and development costs incurred.

Income Taxes

The Company accounts for income taxes using an asset and liability approach which allows for the recognition and measurement of deferred tax assets based upon the likelihood of realization of tax benefits in future years. Under the asset and liability approach, deferred taxes are provided for the net tax effects of temporary differences between the carrying amounts of assets and liabilities for financial reporting purposes and the amounts used for income tax purposes. A valuation allowance is provided for deferred tax assets if it is more likely than not these items will either expire before the Company is able to realize their benefits, or that future deductibility is uncertain. Tax benefits from an uncertain tax position are recognized only if it is more likely than not that the tax position will be sustained on examination by the taxing authorities based on the technical merits of the position. The tax benefits recognized in the consolidated financial statements from such a position are measured based on the largest benefit that has a greater than 50 percent likelihood of being realized upon ultimate resolution.

Stock-Based Compensation

The costs of all employee stock options, as well as other equity-based compensation arrangements, are reflected in the consolidated financial statements based on the estimated fair value of the awards on the grant date. That cost is recognized over the period during which an employee is required to provide service in exchange for the award. Stock compensation for stock granted to non-employees is determined as the fair value of the consideration received or the fair value of equity instruments issued, whichever is more reliably measured.

Foreign Operations

The accompanying consolidated financial statements as of June 30, 2019 and December 31, 2018 include assets amounting to approximately $231,000 and $199,000, respectively, relating to operations of the Company in China. It is always possible unanticipated events in foreign countries could disrupt the Company’s operations.

Foreign Currency

The functional currency of ClearSign Asia Limited is the U.S. dollar. The Company remeasures the transactions denominated in Chinese Yuan at the average exchange rate in effect during the period. At the end of each reporting period, the Company remeasures ClearSign Asia Limited’s monetary assets and liabilities to the U.S. dollar using exchange rates in effect at the end of the reporting period. The Company remeasures its non-monetary assets and liabilities at historical exchange rates. The Company records gains and losses related to remeasurement in other income (expense), net in the consolidated statements of operations. Foreign currency exchange gain (losses) has not been significant in any period presented and the Company has not undertaken any hedging transactions related to foreign currency exposure.

Net Loss per Common Share

Basic loss per share is computed by dividing loss available to common stockholders by the weighted-average number of common shares outstanding. Diluted loss per share is computed similar to basic loss per share except that the denominator is increased to include additional common shares available upon exercise of stock options and warrants using the treasury stock method, except for periods for which no common share equivalents are included because their effect would be anti-dilutive. At June 30, 2019 and 2018, potentially dilutive shares outstanding amounted to 2,253,033 and 3,500,619, respectively.

Recently Adopted Standards

In June 2018 FASB issued ASU No. 2018‑07 Compensation-Stock Compensation. The amendments in this update expand the scope of Topic 718 to include share based payment transactions for acquiring goods and services from nonemployees. An entity should apply the requirements of Topic 718 to nonemployee awards except for specific guidance on inputs to an option pricing model and the attribution of cost (that is, the period of time over which share-based payment awards vest and the pattern of cost recognition over that period). The amendments specify that Topic 718 applies to all share-based payment transactions in which a grantor acquires goods or services to be used or consumed in a grantor’s own operations by issuing share-based payment awards. The amendments also clarify that Topic 718 does not apply to share-based payments used to effectively provide (1) financing to the issuer or (2) awards granted in conjunction with selling goods or services to customers as part of a contract accounted for under Topic 606, Revenue from Contracts with Customers. The ASU is effective for all entities for fiscal years beginning after December 15, 2018, including interim periods within those years. The Company currently does not believe this amendment applies to any of its transactions at this time.

Management does not believe that any other recently issued, but not yet effective, authoritative guidance, if currently adopted, would have a material impact on the Company’s consolidated financial statement presentation or disclosures.


v3.19.2
Fixed Assets
6 Months Ended
Jun. 30, 2019
Fixed Assets  
Fixed Assets

Note 3 – Fixed Assets

Fixed assets are summarized as follows:


June 30, 


December 31, 


2019


2018


(unaudited)


Machinery and equipment


$

863,000


$

853,000

Office furniture and equipment


193,000


186,000

Leasehold improvements


150,000


150,000

Right of use asset-operating leases


710,000


637,000

Accumulated depreciation and amortization


(1,532,000)


(1,369,000)


$

384,000


$

457,000


The Company has a triple net operating lease for office and laboratory space in Seattle, Washington through March 2020 with rent of approximately $12,000 per month plus triple net operating costs. The Company also has a triple net operating lease for office space in Tulsa, Oklahoma through August 2019 with monthly rent of approximately $2,000 per month plus triple net operating costs. Both leases include lessee renewal options for three years at the then prevailing market rate. The Company exercised the option to renew the Tulsa lease for three additional years in August 2019. The rent for the Tulsa lease will be approximately $2,200 a month beginning September 2019 through August 2022 with an annual 2.5% increase. The Company has an operating lease for office space in Beijing, China through November 2020 with a monthly rent of approximately $6,000.

Lease costs for the six months ended June 30, 2019 and 2018 and other quantitative disclosures are as follows (unaudited):


For the three months ended June 30,


For the six months ended June 30,


2019


2018


2019


2018


Lease cost:


Operating lease cost


$

58,000


$

53,000


$

117,000


$

106,000


Total lease cost


$

58,000


$

53,000


$

117,000


$

106,000


Other information:


Cash paid for amounts included in the measurement of lease liabilities:


Operating cash flows from operating leases


$

119,000


Right-of-use assets obtained in exchange for new operating lease liabilities


$

73,000


For operating lease:


Weighted average remaining lease term (in years)


1.59


Weighted average discount rate


5.71

%  


At June 30, 2019, the Company recorded a right-of-use asset and operating lease liability amounting to $73,000 upon extension of the lease for its office space in Tulsa, Oklahoma through August 2022.


Minimum future payments under the Company’s leases at June 30, 2019 and their application to the corresponding lease liabilities are as follows (unaudited):


Discounted lease


Payments due under


liability payments


lease agreements

2019 (remaining 6 months)


112,000


119,000

2020


114,000


121,000

2021


25,000


27,000

2022


18,000


19,000

Total


$

269,000


$

286,000


v3.19.2
Patents and Other Intangible Assets
6 Months Ended
Jun. 30, 2019
Patents and Other Intangible Assets  
Patents and Other Intangible Assets

Note 4 – Patents and Other Intangible Assets

Patents and other intangible assets are summarized as follows:


June 30, 


December 31, 


2019


2018


(Unaudited)


Patents


Patents pending


$

1,063,000


$

1,202,000

Issued patents


633,000


761,000


1,696,000


1,963,000

Trademarks


Trademarks pending


63,000


55,000

Registered trademarks


23,000


23,000


86,000


78,000

Other


8,000


8,000


1,790,000


2,049,000

Accumulated amortization


(260,000)


(290,000)


$

1,530,000


$

1,759,000


The Company monitors and assesses the net realizable value of the Company’s patent portfolio at each reporting period. As a result of management’s assessment of the Company’s patent portfolio in terms of cost-effectiveness and alignment with the focus on those patents that have significant future commercial value to the Company, an impairment charge of $396,000 was recorded during the quarter ended June 30, 2019.

Future amortization expense associated with issued patents and registered trademarks as of June 30, 2019 is estimated as follows (unaudited):


2019 (remaining 6 months)


$

67,000

2020


130,000

2021


94,000

2022


66,000

2023


33,000

Thereafter


6,000


$

396,000


v3.19.2
Sales, Contract Assets and Contract Liabilities
6 Months Ended
Jun. 30, 2019
Sales, Contract Assets and Contract Liabilities  
Sales, Contract Assets and Contract Liabilities

Note 5 – Sales, Contract Assets and Contract Liabilities

The Company recognized no revenue during the six months ended June 30, 2019. For the six months ended June 30, 2018, the Company recognized revenues totaling $530,000 from completed flare projects. At June 30, 2019, the Company had contract assets of $42,000 and contract liabilities of $0. The cost of goods sold of $1,000, recognized during the six months ended June 30, 2019, related to additional warranty costs incurred for previously completed contracts.


v3.19.2
Stockholders' Equity
6 Months Ended
Jun. 30, 2019
Stockholders' Equity  
Stockholders' Equity

Note 6 – Stockholders’ Equity

Common Stock and Preferred Stock

The Company is authorized to issue 62,500,000 shares of common stock and 2,000,000 shares of preferred stock. Preferences, limitations, voting powers and relative rights of any preferred stock to be issued may be determined by the Company’s Board of Directors. The Company has not issued any shares of preferred stock.

Equity Incentive Plan

The Company has adopted and the Company’s shareholders have approved the ClearSign Combustion Corporation 2011 Equity Incentive Plan (the Plan) which permits the Company to grant to eligible participants, including officers, employees, directors, consultants and advisors, options to purchase shares of common stock, stock awards and stock bonuses. The Compensation Committee of the Board of Directors is authorized to administer the Plan and establish the grant terms, including the grant price, vesting period and exercise date. At the Company's Annual Meeting held on May 8, 2019, the shareholders approved an amendment to the Plan that (i) increased the number of shares of common stock in the reserve by 1,231,593 to a total of 4,004,214 shares of common stock, representing approximately 15% of the number of shares of the Company's stock outstanding and (ii) increased the number of shares that may be issued pursuant to the evergreen provision, if any, to the lesser of 15% of any new shares issued by the Company during the quarter immediately prior to the adjustment date or such lesser amount as the Board of Directors shall determine. Therefore, as of June 30, 2019, the number of shares of common stock reserved for issuance under the Plan totaled 4,004,214.

In the six months ended June 30, 2019, the Company made awards of stock options for the purchase of an aggregate 1,298,718 shares of common stock to its employees and directors from the Plan. Of these awards, options covering 159,100 shares of common stock were awarded in lieu of cash bonuses for 2018 and the expense was recorded during the year ended December 31, 2018. An option for the purchase of 258,618 shares of common stock was issued  from the Plan to the Company's Chief Executive Officer as part of options for the purchase of an aggregate 600,000 shares of common stock granted to him in conjunction with his recruitment and employment, as described below. Options covering an additional 381,000 shares of common stock have been issued as payment to the Company's directors and are described below. The remaining stock options awards covering 500,000 shares of common stock have exercise prices at the grant date fair value ranging from $0.87 to $2.25 per share, contractual lives of 10 years, and vest over 2 years. The fair value of the stock options estimated on the date of grant using the Black-Scholes option valuation model was $259,000. The following weighted-average assumptions were utilized in the calculation of the fair value of the stock options:


Expected life


 5.75

years

Weighted average volatility


71

%

Forfeiture rate


20

%

Weighted average risk-free interest rate


2.51

%

Expected dividend rate


0

%


Outstanding stock option awards at June 30, 2019 and December 31, 2018 totaled 2,173,033 shares and 880,277 shares, respectively, with the right to purchase 1,152,607 shares and 587,962 shares being vested and exercisable at June 30, 2019 and December 31, 2018, respectively. The recognized compensation expense associated with stock option awards for the three and six months ended June 30, 2019 and 2018 totaled $92,000  and  $216,000 and $61,000 and $111,000, respectively. On June 30, 2019 the number of shares reserved under the Plan but unissued totaled 1,239,302. At June 30, 2019, there was $418,000 of total unrecognized compensation cost related to non-vested share based compensation arrangements granted under the Plan. That cost is expected to be recognized over a weighted average period of 2.0 years.The intrinsic value of outstanding stock options was $71,000 at June 30, 2019.

During 2019, the Company’s directors are compensated solely in stock option awards.  In addition to being paid for their services as directors, individual directors are paid for committee membership, for services as a committee chair and for services as a lead director.  381,000 options for the purchase of  shares of common stock were granted to members of the Board of Directors for service during 2019.  The options have an exercise price of $1 and vest in equal increments at the end of each quarter.  The recognized expense associated with Board stock option awards for the three and six months ended June 30, 2019 and 2018 totaled $69,000 and $69,000, and $0 and $0, respectively.  At June 30, 2019 there was $68,000 of unrecognized cost related to non-vested Board fees granted under the Plan. The following assumptions were utilized in the calculation of the fair value of the stock options:


Expected life


5.75

years

Weighted average volatility


71

%

Forfeiture rate


20

%

Weighted average risk-free interest rate


2.25

%

Expected dividend rate


0

%


Consultant Stock Plan

The Company has a Consultant Stock Plan (the Consultant Plan) which provides for the granting of shares of common stock to consultants who provide services related to capital raising, investor relations, and making a market in or promoting the Company’s securities. The Company’s officers, employees, and board members are not entitled to receive awards from the Consultant Plan. The Compensation Committee of the Board of Directors is authorized to administer the Consultant Plan and establish the grant terms. The number of shares reserved for issuance under the Consultant Plan on June 30, 2019 totaled 253,342 with 195,092 of those shares unissued. The Consultant Plan provides for quarterly increases in the available number of authorized shares equal to the lesser of 1% of any new shares issued by the Company during the quarter immediately prior to the adjustment date or such lesser amount as the Board of Directors shall determine. The Company granted 10,000 shares of common stock to a consultant under the Consultant Plan for services performed and to be performed during the period from August 13, 2018 to August 31, 2019. The fair value of the stock at the time of grant was $1.44 per share for a total value of $14,000. The Consultant Plan expense for the three and six months ended June 30, 2019 and 2018 was $4,000 and $7,000 and $8,000 and $17,000, respectively.

Inducement Stock Options

Pursuant to the rules of The Nasdaq Stock Market, and in compliance with those rules, the Company may issue equity awards, including stock options, as an inducement to an individual to accept employment with the Company. Inducement awards need not be approved by the Company’s shareholders. During the six months ending June 30, 2019 the Company granted options to purchase 600,000 shares of common stock as an inducement to its President and Chief Executive Officer to accept the Company’s offer of employment. (See Note 7.) The stock options have exercise prices at the award date fair value ranging from $1.16 to $2.25 per share, contractual lives of 10 years, and vest over 2 years. An option to purchase 258,618 shares was issued from the Company’s 2011 Equity Incentive Plan. Non-qualified stock options covering the remaining 341,382 shares were issued from the Company’s reserve of authorized but unissued shares of common stock. The fair value of the stock options estimated on the date of grant using the Black-Scholes option valuation model was $329,000. The recognized compensation expense associated with these awards for the three and six months ended June 30, 2019 was $49,000 and $158,000, respectively. The remaining unrecognized compensation expense associated with these awards is $171,000. The following weighted-average assumptions were utilized in the calculation of the fair value of the stock options:


Expected life


5.75

years

Weighted average volatility


71

%

Forfeiture rate


20

%

Weighted average risk-free interest rate


2.55

%

Expected dividend rate


0

%


Warrants

At June 30, 2019, warrants for the purchase of 80,000 shares of common stock at an exercise price of $1.80 per share were outstanding and had a remaining life of 1.64 years.

The intrinsic value of the outstanding warrants was $0 at June 30, 2019.

v3.19.2
Commitments and Contingencies
6 Months Ended
Jun. 30, 2019
Commitments and Contingencies  
Commitments and Contingencies

Note 7 – Commitments and Contingencies

On January 28, 2019 (the “Effective Date”), the Company and Colin James Deller entered into an employment agreement (the “Agreement”) pursuant to which the Company employed Dr. Deller as its President until April 1, 2019, at which time Dr. Deller became the Company’s Chief Executive Officer. Pursuant to the Agreement, the Company pays Dr. Deller an annual salary of $350,000. As an inducement to accept employment with the Company, Dr. Deller was also granted an incentive option to purchase 400,000 shares of the Company’s common stock at an exercise price of $1.16 per share and an incentive option to purchase 200,000 shares of the Company’s common stock at an exercise price of $2.25 per share. Each option has a term of 10 years and will vest as follows: the right to purchase one-third of the shares of common stock subject to the option vested on the Effective Date; the right to purchase one-third of the shares will vest on the first anniversary of the grant date; and the right to purchase one-third of the shares will vest on the second anniversary of the grant date. The Company also agreed to pay certain expenses, not to exceed the sum of $100,000, related to Dr. Deller’s move from Tulsa, Oklahoma to Seattle, Washington, including reasonable expenses related to the sale of his home in Tulsa. As a temporary adjustment for the difference in the cost of living between Tulsa and Seattle (the “Relocation Adjustment”), for a period of four years (the “Payment Period”) from the Effective Date, the Company has also agreed to pay up to $6,000 a month to Dr. Deller for expenses related to temporary housing and travel to and from Tulsa to Seattle. If Dr. Deller purchases a home in the Seattle area, the Relocation Adjustment will continue to be paid through the expiration of the Payment Period, although the Relocation Adjustment may be adjusted or terminated upon mutual agreement of Dr. Deller and the Company. The Agreement may be terminated by the Company for cause, as defined in the Agreement, due to Dr. Deller’s death or disability, upon 30 days’ notice to Dr. Deller or as a result of a change in control, as defined in the Agreement. With the exception of a termination for cause, if Dr. Deller’s employment is terminated by the Company, aside from accrued but unpaid salary, bonus (if any) and business expenses, Dr. Deller will receive the balance of the unpaid Relocation Adjustment and six months of his annual salary.

Through June 30, 2019, the Company has paid Dr. Deller $16,000 in Relocation Adjustment payments to reimburse temporary housing costs.

Litigation

From time to time the Company may become involved in various lawsuits and legal proceedings which arise in the ordinary course of business. Litigation is subject to inherent uncertainties and an adverse result in any such matter may harm the Company’s business. As of the date of this report, the Company is not a party to any material pending legal proceedings.

Indemnification Agreements

The Company maintains indemnification agreements with its directors and officers that may require the Company to indemnify these individuals against liabilities that arise by reason of their status or service as directors or officers, except as prohibited by law.


Subsequent Event


The Company received a letter from Nasdaq on July 9, 2019 stating that it has regained compliance with all listing requirements.


v3.19.2
Summary of Significant Accounting Policies (Policies)
6 Months Ended
Jun. 30, 2019
Summary of Significant Accounting Policies  
Basis of Presentation

Basis of Presentation

The accompanying unaudited condensed consolidated financial statements have been prepared in accordance with the rules and regulations of the Securities and Exchange Commission (the “SEC”) for Form 10‑Q. Accordingly, certain information and footnote disclosures normally included in financial statements prepared in accordance with generally accepted accounting principles have been condensed or omitted pursuant to such rules and regulations. The condensed balance sheet at December 31, 2018 has been derived from the Company’s audited financial statements.

In the opinion of management, these consolidated financial statements reflect all normal recurring and other adjustments necessary for a fair presentation. These consolidated financial statements should be read in conjunction with the audited consolidated financial statements included in the Company's Annual Report on Form 10‑K for the year ended December 31, 2018. Operating results for interim periods are not necessarily indicative of operating results for an entire fiscal year or any other future periods.

The accompanying unaudited condensed consolidated financial statements include the accounts of ClearSign and its subsidiary. Intercompany balances and transactions have been eliminated in consolidation.

Use of Estimates

Use of Estimates

The preparation of financial statements in conformity with accounting principles generally accepted in the United States of America requires management to make certain estimates and assumptions that affect the reported amounts of assets and liabilities and disclosure of contingent assets and liabilities at the date of the financial statements and the reported amounts of revenues and expenses during the reporting period. Actual results could differ from those estimates.

Revenue Recognition and Cost of Sales

Revenue Recognition and Cost of Sales

The Company recognizes revenue and related cost of goods sold in accordance with FASB ASC 606 Revenue from Contracts with Customers (ASC 606). Revenues and cost of goods sold are recognized once the goods or services are delivered to the customer’s control and performance obligations are satisfied. Typically, the Company’s contracts with customers have performance obligations regarding air emissions and operational performance that are satisfied upon completion of service. Since this is the singular performance obligation and cannot be achieved until the air emissions and operational performance have been successfully tested, revenue related to the contracts is recognized upon project completion.

The Company’s contracts generally include progress payments from the customer upon completion of defined milestones. As these payments are received they are offset against accumulated project costs and recorded as either contract assets or contract liabilities. Upon completion of the performance obligations and acceptance by the customer the projects can be recorded as revenue.

The Company’s contracts with customers contain no variable considerations or incentives or discounts that would cause revenue to be allocated or adjusted over time. Therefore, no separate methods of evaluating the contracts other than consideration of the price at achievement of the performance objectives was used in satisfying the review requirements of ASC 606.

Contract acquisition costs and practical expedients

Contract Acquisition Costs and Practical Expedients

For contracts that have a duration of less than one year, the Company follows ASC 606, practical expedients and expenses those costs when incurred; for contracts with a life exceeding one year, the Company records those costs when performance obligations related to the contract are completed. The Company generally expenses sales commissions when earned. The Company records those costs within general and administrative expenses.

Product Warranties

Product Warranties

The Company warrants all installed products against defects in materials and workmanship for a period specified in each contract by replacing failed parts. Accruals for product warranties are based on historical warranty experience and current product performance trends, and are recorded at the time revenue is recognized as a component of cost of sales. The warranty liabilities are reduced by material and labor costs used to replace parts over the warranty period in the periods in which the costs are incurred. The Company periodically assesses the adequacy of its recorded warranty liabilities and adjusts the amounts as necessary, and such adjustments could be material in the future if estimates differ significantly from actual warranty expense. The warranty liabilities are included in accrued liabilities in the balance sheets.

Cash and Cash Equivalents

Cash and Cash Equivalents

Highly liquid investments purchased with an original maturity of three months or less are considered cash equivalents. Cash is maintained with a commercial bank where accounts are generally guaranteed by the Federal Deposit Insurance Corporation up to $250,000. The Company’s deposits may at times exceed this limit. The Company also maintains a cash balance in China which is insured up to $75,000  (500,000RMB). The Company has not experienced losses in such accounts and believes it is not exposed to any significant credit risk on cash and cash equivalents.

Short-Term Investments

Short-Term Investments

Short-term investments consist of U.S. treasury bills with original maturities of twelve months or less and greater than three months. These short-term investments are classified as held to maturity and are recorded on an amortized cost basis which approximates fair value.

Accounts Receivable and Allowance for Doubtful Accounts

Accounts Receivable and Allowance for Doubtful Accounts

Accounts receivable are recorded at the invoiced amount. An allowance for doubtful accounts is established, as necessary, based on past experience and other factors which, in management’s judgment, deserve current recognition in estimating bad debts. The determination of the collectability of amounts due from customer accounts requires the Company to make judgments regarding future events and trends. Allowances for doubtful accounts are determined based on assessing the Company’s portfolio on an individual customer and on an overall basis. This process consists of a review of historical collection experience, current aging status of the customer accounts, and the financial condition of the Company’s customers. Based on a review of these factors, the Company may establish or adjust the allowance for specific customers and the accounts receivable portfolio as a whole.

Fixed Assets and Leases

Fixed Assets and Leases

Fixed assets are recorded at cost. Leases are recorded in accordance with FASB ASC 842 Leases. For those leases with a term greater than one year, the Company recognizes on the balance sheet at the time of lease inception or modification a right-of-use asset and a lease liability, initially measured at the present value of the lease payments. Lease costs are recognized in the income statement over the lease term on a straight-line basis. Operating leases with a term of 1 year or less are recognized on a straight line basis over the term. Depreciation is computed using the straight-line method over the estimated useful lives of the respective assets. Leasehold improvements are depreciated over the life of the lease or their useful life, whichever is shorter. All other fixed assets are depreciated over two to four years. Maintenance and repairs are expensed as incurred.

Patents and Trademarks

Patents and Trademarks

Patents and trademarks are recorded at cost. Amortization is computed using the straight-line method over the estimated useful lives of the assets once they are awarded.

Impairment of Long-Lived Assets

Impairment of Long-Lived Assets

The Company tests long-lived assets for impairment whenever events or changes in circumstances indicate that the carrying amount of an asset may not be recoverable through the estimated undiscounted cash flows expected to result from the use and eventual disposition of the assets. In that event, a loss is recognized based on the amount by which the carrying amount exceeds the fair value of the long-lived assets. Fair value is determined based on the present value of estimated expected cash flows using a discount rate commensurate with the risks involved, quoted market prices, or appraised values depending upon the nature of the assets. Loss on long-lived assets to be disposed of is determined in a similar manner, except that fair values are reduced for the cost of disposal.

Fair Value of Financial Instruments

Fair Value of Financial Instruments

Fair value is the price that would be received to sell an asset or paid to transfer a liability in an orderly transaction between market participants at the measurement date. Assets and liabilities measured at fair value are categorized based on whether or not the inputs are observable in the market and the degree that the inputs are observable. The categorization of financial assets and liabilities within the valuation hierarchy is based upon the lowest level of input that is significant to the fair value measurement. The three levels of inputs used to establish fair value are the following:

·

Level 1 – Quoted prices in active markets for identical assets or liabilities;

·

Level 2 – Inputs other than Level 1 that are observable, either directly or indirectly, such as quoted prices for similar assets or liabilities, quoted prices in markets that are not active, or other inputs that are observable or can be corroborated by observable market data for substantially the full term of the assets or liabilities; and

·

Level 3 – Unobservable inputs that are supported by little or no market activity and that are significant to the fair value of the assets or liabilities.

The Company’s financial instruments primarily consist of cash and cash equivalents, short-term investments, accounts payable and accrued expenses. As of the balance sheet dates, the estimated fair values of the financial instruments were not materially different from their carrying values as presented on the balance sheets. This is primarily attributable to the short-term maturities of these instruments.

The Company did not identify any other non-recurring assets and liabilities that are required to be presented in the balance sheets at fair value.

Research and Development

Research and Development

The cost of research and development is expensed as incurred. Research and development costs consist of salaries, benefits, share based compensation, consulting fees, rent, utilities, depreciation, and consumables.

During the six months ended June 30, 2019, the Company received $108,000 to partially fund specific research and development activity relating to its ECC technology. Since these funds were provided without expectation of reciprocation, except notification of research results, the funds received were offset against the related research and development costs incurred.

Income Taxes

Income Taxes

The Company accounts for income taxes using an asset and liability approach which allows for the recognition and measurement of deferred tax assets based upon the likelihood of realization of tax benefits in future years. Under the asset and liability approach, deferred taxes are provided for the net tax effects of temporary differences between the carrying amounts of assets and liabilities for financial reporting purposes and the amounts used for income tax purposes. A valuation allowance is provided for deferred tax assets if it is more likely than not these items will either expire before the Company is able to realize their benefits, or that future deductibility is uncertain. Tax benefits from an uncertain tax position are recognized only if it is more likely than not that the tax position will be sustained on examination by the taxing authorities based on the technical merits of the position. The tax benefits recognized in the consolidated financial statements from such a position are measured based on the largest benefit that has a greater than 50 percent likelihood of being realized upon ultimate resolution.

Stock-Based Compensation

Stock-Based Compensation

The costs of all employee stock options, as well as other equity-based compensation arrangements, are reflected in the consolidated financial statements based on the estimated fair value of the awards on the grant date. That cost is recognized over the period during which an employee is required to provide service in exchange for the award. Stock compensation for stock granted to non-employees is determined as the fair value of the consideration received or the fair value of equity instruments issued, whichever is more reliably measured.

Foreign Operations

Foreign Operations

The accompanying consolidated financial statements as of June 30, 2019 and December 31, 2018 include assets amounting to approximately $231,000 and $199,000, respectively, relating to operations of the Company in China. It is always possible unanticipated events in foreign countries could disrupt the Company’s operations.

Foreign Currency

Foreign Currency

The functional currency of ClearSign Asia Limited is the U.S. dollar. The Company remeasures the transactions denominated in Chinese Yuan at the average exchange rate in effect during the period. At the end of each reporting period, the Company remeasures ClearSign Asia Limited’s monetary assets and liabilities to the U.S. dollar using exchange rates in effect at the end of the reporting period. The Company remeasures its non-monetary assets and liabilities at historical exchange rates. The Company records gains and losses related to remeasurement in other income (expense), net in the consolidated statements of operations. Foreign currency exchange gain (losses) has not been significant in any period presented and the Company has not undertaken any hedging transactions related to foreign currency exposure.

Net Loss per Common Share

Net Loss per Common Share

Basic loss per share is computed by dividing loss available to common stockholders by the weighted-average number of common shares outstanding. Diluted loss per share is computed similar to basic loss per share except that the denominator is increased to include additional common shares available upon exercise of stock options and warrants using the treasury stock method, except for periods for which no common share equivalents are included because their effect would be anti-dilutive. At June 30, 2019 and 2018, potentially dilutive shares outstanding amounted to 2,253,033 and 3,500,619, respectively.

Recently Adopted Standards

Recently Adopted Standards

In June 2018 FASB issued ASU No. 2018‑07 Compensation-Stock Compensation. The amendments in this update expand the scope of Topic 718 to include share based payment transactions for acquiring goods and services from nonemployees. An entity should apply the requirements of Topic 718 to nonemployee awards except for specific guidance on inputs to an option pricing model and the attribution of cost (that is, the period of time over which share-based payment awards vest and the pattern of cost recognition over that period). The amendments specify that Topic 718 applies to all share-based payment transactions in which a grantor acquires goods or services to be used or consumed in a grantor’s own operations by issuing share-based payment awards. The amendments also clarify that Topic 718 does not apply to share-based payments used to effectively provide (1) financing to the issuer or (2) awards granted in conjunction with selling goods or services to customers as part of a contract accounted for under Topic 606, Revenue from Contracts with Customers. The ASU is effective for all entities for fiscal years beginning after December 15, 2018, including interim periods within those years. The Company currently does not believe this amendment applies to any of its transactions at this time.

Management does not believe that any other recently issued, but not yet effective, authoritative guidance, if currently adopted, would have a material impact on the Company’s consolidated financial statement presentation or disclosures.

v3.19.2
Fixed Assets (Tables)
6 Months Ended
Jun. 30, 2019
Fixed Assets  
Summary of Fixed Assets

Fixed assets are summarized as follows:


June 30, 


December 31, 


2019


2018


(unaudited)


Machinery and equipment


$

863,000


$

853,000

Office furniture and equipment


193,000


186,000

Leasehold improvements


150,000


150,000

Right of use asset-operating leases


710,000


637,000

Accumulated depreciation and amortization


(1,532,000)


(1,369,000)


$

384,000


$

457,000


Schedule Of Leases Cost

Lease costs for the six months ended June 30, 2019 and 2018 and other quantitative disclosures are as follows (unaudited):


For the three months ended June 30,


For the six months ended June 30,


2019


2018


2019


2018


Lease cost:


Operating lease cost


$

58,000


$

53,000


$

117,000


$

106,000


Total lease cost


$

58,000


$

53,000


$

117,000


$

106,000


Other information:


Cash paid for amounts included in the measurement of lease liabilities:


Operating cash flows from operating leases


$

119,000


Right-of-use assets obtained in exchange for new operating lease liabilities


$

73,000


For operating lease:


Weighted average remaining lease term (in years)


1.59


Weighted average discount rate


5.71

%  


At June 30, 2019, the Company recorded a right-of-use asset and operating lease liability amounting to $73,000 upon extension of the lease for its office space in Tulsa, Oklahoma through August 2022.

Schedule of Future Minimum Rental Payments for Operating Leases

At June 30, 2019, the Company recorded a right-of-use asset and operating lease liability amounting to $73,000 upon extension of the lease for its office space in Tulsa, Oklahoma through August 2022.


Minimum future payments under the Company’s leases at June 30, 2019 and their application to the corresponding lease liabilities are as follows (unaudited):


Discounted lease


Payments due under


liability payments


lease agreements

2019 (remaining 6 months)


112,000


119,000

2020


114,000


121,000

2021


25,000


27,000

2022


18,000


19,000

Total


$

269,000


$

286,000


v3.19.2
Patents and Other Intangible Assets (Tables)
6 Months Ended
Jun. 30, 2019
Patents and Other Intangible Assets  
Schedule of Patents and other intangible assets

Patents and other intangible assets are summarized as follows:


June 30, 


December 31, 


2019


2018


(Unaudited)


Patents


Patents pending


$

1,063,000


$

1,202,000

Issued patents


633,000


761,000


1,696,000


1,963,000

Trademarks


Trademarks pending


63,000


55,000

Registered trademarks


23,000


23,000


86,000


78,000

Other


8,000


8,000


1,790,000


2,049,000

Accumulated amortization


(260,000)


(290,000)


$

1,530,000


$

1,759,000


Schedule of future amortization expense

Future amortization expense associated with issued patents and registered trademarks as of June 30, 2019 is estimated as follows (unaudited):


2019 (remaining 6 months)


$

67,000

2020


130,000

2021


94,000

2022


66,000

2023


33,000

Thereafter


6,000


$

396,000


v3.19.2
Stockholders' Equity (Tables)
6 Months Ended
Jun. 30, 2019
Equity Incentive Plan [Member]  
Schedule of weighted-average assumptions used in calculation of fair value of stock options

. The following weighted-average assumptions were utilized in the calculation of the fair value of the stock options:


Expected life


 5.75

years

Weighted average volatility


71

%

Forfeiture rate


20

%

Weighted average risk-free interest rate


2.51

%

Expected dividend rate


0

%


Board of Directors [Member]  
Schedule of weighted-average assumptions used in calculation of fair value of stock options


Expected life


5.75

years

Weighted average volatility


71

%

Forfeiture rate


20

%

Weighted average risk-free interest rate


2.25

%

Expected dividend rate


0

%


Employee Stock Option [Member]  
Schedule of weighted-average assumptions used in calculation of fair value of stock options


Expected life


5.75

years

Weighted average volatility


71

%

Forfeiture rate


20

%

Weighted average risk-free interest rate


2.55

%

Expected dividend rate


0

%


v3.19.2
Organization and Description of Business (Details) - USD ($)
1 Months Ended
Jul. 20, 2018
Feb. 27, 2018
Jun. 30, 2019
Dec. 31, 2018
Organization and Description of Business        
Proceeds from Issuance of Common Stock $ 11,600,000 $ 11,900,000    
Accumulated deficit     $ (64,266,000) $ (59,511,000)
v3.19.2
Summary of Significant Accounting Policies - Contract acquisition costs (Details)
6 Months Ended
Jun. 30, 2019
Summary of Significant Accounting Policies  
Revenue, Practical Expedient, Incremental Cost of Obtaining Contract [true false] true
v3.19.2
Summary of Significant Accounting Policies - Cash (Details) - Jun. 30, 2019
CNY (¥)
USD ($)
Cash and Cash Equivalents [Line Items]    
Cash, FDIC Insured Amount   $ 250,000
CHINA    
Cash and Cash Equivalents [Line Items]    
Cash, FDIC Insured Amount ¥ 500,000 $ 75,000
v3.19.2
Summary of Significant Accounting Policies - Fixed Assets and Leases (Details) - Leasehold Improvements [Member]
6 Months Ended
Jun. 30, 2019
Minimum [Member]  
Property, Plant and Equipment [Line Items]  
Property, Plant and Equipment, Estimated Useful Lives P2Y
Maximum [Member]  
Property, Plant and Equipment [Line Items]  
Property, Plant and Equipment, Estimated Useful Lives P4Y
v3.19.2
Summary of Significant Accounting Policies - Other (Details) - USD ($)
6 Months Ended
Jun. 30, 2019
Jun. 30, 2018
Dec. 31, 2018
Variable Interest Entity [Line Items]      
Weighted Average Number of Shares Outstanding, Diluted 2,253,033 3,500,619  
Tax Benefits Recognized (in Percent) 50.00%    
Assets $ 14,240,000   $ 18,637,000
Funds Received 108,000    
CHINA      
Variable Interest Entity [Line Items]      
Assets $ 231,000   $ 199,000
v3.19.2
Fixed Assets - Summary (Details) - USD ($)
Jun. 30, 2019
Dec. 31, 2018
Fixed Assets    
Machinery and equipment $ 863,000 $ 853,000
Office furniture and equipment 193,000 186,000
Leasehold improvements 150,000 150,000
Right of use asset-operating leases 710,000 637,000
Accumulated depreciation and amortization (1,532,000) (1,369,000)
Property, Plant and Equipment, Net, Total $ 384,000 $ 457,000
v3.19.2
Fixed Assets - Lease costs (Details) - USD ($)
3 Months Ended 6 Months Ended
Jun. 30, 2019
Jun. 30, 2018
Jun. 30, 2019
Jun. 30, 2018
Lease cost:        
Operating lease cost $ 58,000 $ 53,000 $ 117,000 $ 106,000
Total lease cost 58,000 53,000 117,000 $ 106,000
Cash paid for amounts included in the measurement of lease liabilities:        
Operating cash flows from operating leases   119,000    
Right-of-use assets obtained in exchange for new operating lease liabilities   $ 73,000    
For operating lease:        
Weighted average remaining lease term (in years)   1 year 7 months 2 days    
Weighted average discount rate   5.71%    
Right of use asset 73,000   73,000  
Operating lease liability $ 73,000   $ 73,000  
v3.19.2
Fixed Assets - Minimum future payments (Details)
Jun. 30, 2019
USD ($)
Payments Due Under Lease Agreement [Member]  
2019 (remaining 6 months) $ 119,000
2020 121,000
2021 27,000
2022 19,000
Total 286,000
Discounted Lease Liabilities Payments [Member]  
2019 (remaining 6 months) 112,000
2020 114,000
2021 25,000
2022 18,000
Total $ 269,000
v3.19.2
Fixed Assets - Lease descriptions (Details)
6 Months Ended
Jun. 30, 2019
USD ($)
Operating Lease, Cost $ 6,000
Lease One [Member]  
Triple Net Operating Cost 12,000
Lease Two [Member]  
Triple Net Operating Cost 2,000
Future Operating Lease Cost $ 2,200
Operating Lease Rent Annual Increased Percentage 2.5
v3.19.2
Patents and Other Intangible Assets - Summary (Details) - USD ($)
6 Months Ended
Jun. 30, 2019
Dec. 31, 2018
Patents $ 1,696,000 $ 1,963,000
Trademarks 86,000 78,000
Other 8,000 8,000
Patents and other intangible assets 1,790,000 2,049,000
Accumulated amortization (260,000) (290,000)
Finite-Lived Intangible Assets, Net 1,530,000 1,759,000
Amount charge for patent process of reassessing 396,000  
Patents Pending [Member]    
Patents 1,063,000 1,202,000
Issued Patents [Member]    
Patents 633,000 761,000
Trademarks Pending [Member]    
Trademarks 63,000 55,000
Registered Trademarks [Member]    
Trademarks $ 23,000 $ 23,000
v3.19.2
Patents and Other Intangible Assets - Future amortization expense (Details)
Jun. 30, 2019
USD ($)
Patents and Other Intangible Assets  
2019 (remaining 6 months) $ 67,000
2020 130,000
2021 94,000
2022 66,000
2023 33,000
Thereafter 6,000
Finite-Lived Intangible Assets, Net $ 396,000
v3.19.2
Sales, Contract Assets and Contract Liabilities (Details) - USD ($)
3 Months Ended 6 Months Ended
Jun. 30, 2019
Jun. 30, 2019
Dec. 31, 2018
Cost of Goods and Services Sold   $ 1,000  
Contract with Customer, Asset, Net, Current $ 42,000 42,000 $ 39,000
Contract with Customer, Liability, Current 0 0  
Flare Projects [Member]      
Revenue from Contract with Customer, Including Assessed Tax $ 0 $ 530,000  
v3.19.2
Stockholders' Equity - Equity Incentive Plan Assumptions (Details) - Equity Incentive Plan [Member]
6 Months Ended
Jun. 30, 2019
Share-based Compensation Arrangement by Share-based Payment Award [Line Items]  
Expected life 5 years 9 months
Weighted average volatility 71.00%
Forfeiture rate 20.00%
Weighted average risk-free interest rate 2.51%
Expected dividend rate 0.00%
Board of Directors [Member]  
Share-based Compensation Arrangement by Share-based Payment Award [Line Items]  
Expected life 5 years 9 months
Weighted average volatility 71.00%
Forfeiture rate 20.00%
Weighted average risk-free interest rate 2.25%
Expected dividend rate 0.00%
v3.19.2
Stockholders' Equity - Incentive Stock Options Assumptions (Details) - Employee Stock Option [Member]
6 Months Ended
Jun. 30, 2019
Weighted average volatility 71.00%
Forfeiture rate 20.00%
Weighted average risk-free interest rate 2.55%
Expected dividend rate 0.00%
v3.19.2
Stockholders' Equity - Grants and Expense (Details) - USD ($)
3 Months Ended 6 Months Ended
May 08, 2019
Jun. 30, 2019
Jun. 30, 2018
Jun. 30, 2019
Jun. 30, 2018
Dec. 31, 2018
Class of Stock [Line Items]            
Common Stock, Shares Authorized   62,500,000   62,500,000    
Preferred Stock, Shares Authorized   2,000,000   2,000,000    
Employee Service Share-based Compensation, Nonvested Awards, Compensation Cost Not yet Recognized   $ 418,000   $ 418,000    
Share-based Compensation Arrangement by Share-based Payment Award, Options, Grants in Period, Gross       259,000    
Share-based Compensation Arrangement by Share-based Payment Award, Options, Outstanding, Intrinsic Value   $ 71,000   $ 71,000    
Class of Warrant or Right, Exercise Price of Warrants or Rights   $ 1.80   $ 1.80    
Warrants Intrinsic Value Outstanding   $ 0   $ 0    
Class of Warrant or Right, Number of Securities Called by Warrants or Rights   80,000   80,000    
Share-based Compensation Arrangement by Share-based Payment Award, Options, Vested and Expected to Vest, Exercisable, Number   1,152,607   1,152,607   587,962
Stock Issued During Period In Lieu of Cash Bonus       159,100    
Warrants and Rights Remaining Term       1 year 7 months 21 days    
Employee Stock Option [Member]            
Class of Stock [Line Items]            
Employee Service Share-based Compensation, Nonvested Awards, Compensation Cost Not yet Recognized   $ 171,000   $ 171,000    
Share-based Compensation Arrangement by Share-based Payment Award, Options, Grants in Period, Gross       600,000    
Share-based Compensation Arrangement by Share-based Payment Award, Options, Outstanding, Weighted Average Remaining Contractual Term2       10 years    
Share-based Compensation Arrangements by Share-based Payment Award, Options, Grants in Period, Weighted Average Exercise Price       $ 2.25    
Allocated Share-based Compensation Expense   $ 49,000   $ 158,000    
Share-based Compensation Arrangement by Share-based Payment Award, Award Vesting Period1       2 years    
Employee Stock Option [Member] | Minimum [Member]            
Class of Stock [Line Items]            
Share-based Compensation Arrangement by Share-based Payment Award, Options, Grants in Period, Weighted Average Grant Date Fair Value       $ 1.16    
Consultant Plan [Member]            
Class of Stock [Line Items]            
Common Stock, Capital Shares Reserved for Future Issuance   253,342   253,342    
Increase Decrease Of Share Based Compensation Arrangement By Share Based Payment Award Percentage       1.00%    
Consultant Plan Expenses   $ 4,000 $ 8,000 $ 7,000 $ 17,000  
Shares Reserved Unissued   195,092   195,092    
Consultant Plan [Member] | Employee Stock Option [Member]            
Class of Stock [Line Items]            
Share-based Compensation Arrangement by Share-based Payment Award, Options, Grants in Period, Gross       329,000    
Consultant Plan Two [Member]            
Class of Stock [Line Items]            
Share-based Compensation Arrangement by Share-based Payment Award, Options, Grants in Period, Gross       10,000    
Share-based Compensation Arrangement by Share-based Payment Award, Options, Grants in Period, Weighted Average Grant Date Fair Value       $ 1.44    
Share Based Compensation Arrangement By Share Based Payment Award Options Value Grants In Period Weighted Average Grant Date Fair Value       $ 14,000    
2011 Equity Incentive Plan [Member] | Employee Stock Option [Member]            
Class of Stock [Line Items]            
Share-based Compensation Arrangement by Share-based Payment Award, Options, Grants in Period, Gross       258,618    
Non-Qualified Stock Option [Member] | Employee Stock Option [Member]            
Class of Stock [Line Items]            
Share-based Compensation Arrangement by Share-based Payment Award, Options, Grants in Period, Gross       341,382    
Equity Incentive Plan [Member]            
Class of Stock [Line Items]            
Share-based Compensation Arrangement by Share-based Payment Award, Number of Additional Shares Authorized 1,231,593          
Share-based Compensation Arrangement by Share-based Payment Award, Number of Shares Authorized 4,004,214          
Share-based Compensation Arrangement by Share-based Payment Award, Percentage of Outstanding Stock Maximum 15.00%          
Common Stock, Capital Shares Reserved for Future Issuance   4,004,214   4,004,214    
Increase Decrease Of Share Based Compensation Arrangement By Share Based Payment Award Percentage       15.00%    
Share-based Compensation Arrangement by Share-based Payment Award, Options, Grants in Period, Gross       1,298,718    
Share-based Compensation Arrangement by Share-based Payment Award, Options, Outstanding, Weighted Average Remaining Contractual Term2       10 years    
Class of Warrant or Right, Exercise Price of Warrants or Rights   $ 1   $ 1    
Allocated Share-based Compensation Expense   $ 92,000 61,000 $ 216,000 111,000  
Share-based Compensation Outstanding - Reserved but unissued shares under the Plan   2,173,033   2,173,033   880,277
Shares Reserved Unissued   1,239,302   1,239,302    
Share-based Compensation Arrangement by Share-based Payment Award, Award Vesting Period1       2 years    
Equity Incentive Plan [Member] | Minimum [Member]            
Class of Stock [Line Items]            
Share-based Compensation Arrangement by Share-based Payment Award, Options, Grants in Period, Weighted Average Grant Date Fair Value       $ 0.87    
Equity Incentive Plan [Member] | Maximum [Member]            
Class of Stock [Line Items]            
Share-based Compensation Arrangement by Share-based Payment Award, Options, Grants in Period, Weighted Average Grant Date Fair Value       $ 2.25    
Equity Incentive Plan [Member] | Employee Stock Option [Member]            
Class of Stock [Line Items]            
Estimated common stock subject to options issued       381,000    
Equity Incentive Plan [Member] | Chief Executive Officer [Member] | Employee Stock Option [Member]            
Class of Stock [Line Items]            
Share-based Compensation Arrangement by Share-based Payment Award, Options, Grants in Period, Gross       258,618    
Equity Incentive Plan [Member] | Director [Member] | Employee Stock Option [Member]            
Class of Stock [Line Items]            
Share-based Compensation Arrangement by Share-based Payment Award, Options, Grants in Period, Gross       381,000    
Equity Incentive Plan [Member] | Other Employees [Member] | Employee Stock Option [Member]            
Class of Stock [Line Items]            
Share-based Compensation Arrangement by Share-based Payment Award, Options, Grants in Period, Gross       500,000    
Equity Incentive Plan [Member] | Board of Directors [Member]            
Class of Stock [Line Items]            
Employee Service Share-based Compensation, Nonvested Awards, Compensation Cost Not yet Recognized   $ 68,000   $ 68,000    
Equity Incentive Plan [Member] | Board of Directors [Member] | Employee Stock Option [Member]            
Class of Stock [Line Items]            
Allocated Share-based Compensation Expense   $ 69,000 $ 0 $ 69,000 $ 0  
v3.19.2
Commitments and Contingencies (Details) - USD ($)
6 Months Ended
Jan. 28, 2019
Jun. 30, 2019
Loss Contingencies [Line Items]    
Relocation Expenses   $ 16,000
Employment Agreement [Member]    
Loss Contingencies [Line Items]    
Salary and Wage, Excluding Cost of Good and Service Sold $ 350,000  
Labor and Related Expense $ 100,000  
Share-based Compensation Arrangement by Share-based Payment Award, Options, Vested and Expected to Vest, Exercisable, Weighted Average Remaining Contractual Term 10 years  
Employment Early Termination Living Allowance Per Month $ 6,000  
Payment period 4 years  
Termination notification period 30 days  
Salary payment period, early termination 6 months  
Employment Agreement [Member] | Share-based Compensation Award, Tranche One [Member]    
Loss Contingencies [Line Items]    
Share-based Compensation Arrangement by Share-based Payment Award, Award Vesting Rights, Percentage 33.33%  
Employment Agreement [Member] | Share-based Compensation Award, Tranche Two [Member]    
Loss Contingencies [Line Items]    
Share-based Compensation Arrangement by Share-based Payment Award, Award Vesting Period 1 year  
Share-based Compensation Arrangement by Share-based Payment Award, Award Vesting Rights, Percentage 33.33%  
Employment Agreement [Member] | Share-based Compensation Award, Tranche Three [Member]    
Loss Contingencies [Line Items]    
Share-based Compensation Arrangement by Share-based Payment Award, Award Vesting Period 2 years  
Share-based Compensation Arrangement by Share-based Payment Award, Award Vesting Rights, Percentage 33.33%  
Employment Agreement [Member] | Exercise Price $1.16 per share [Member] | Share-based Compensation Award, Tranche One [Member]    
Loss Contingencies [Line Items]    
Share-based Compensation Arrangement by Share-based Payment Award, Options, Vested and Expected to Vest, Outstanding, Number 400,000  
Share-based Compensation Arrangement by Share-based Payment Award, Options, Vested and Expected to Vest, Exercisable, Weighted Average Exercise Price $ 1.16  
Employment Agreement [Member] | Exercise Price $2.25 per share [Member] | Share-based Compensation Award, Tranche Two [Member]    
Loss Contingencies [Line Items]    
Share-based Compensation Arrangement by Share-based Payment Award, Options, Vested and Expected to Vest, Outstanding, Number 200,000  
Share-based Compensation Arrangement by Share-based Payment Award, Options, Vested and Expected to Vest, Exercisable, Weighted Average Exercise Price $ 2.25