
UNITED STATES
SECURITIES AND EXCHANGE COMMISSION
Washington, D.C. 20549
FORM 6-K
REPORT OF FOREIGN ISSUER
PURSUANT TO RULE 13A-16 OR 15D-16 OF
THE SECURITIES EXCHANGE ACT OF 1934
For the month of June, 2019
Commission File Number: 1-15224
Energy Company of Minas Gerais
(Translation of Registrant’s Name Into English)
Avenida Barbacena, 1219
30190-131 Belo Horizonte, Minas Gerais, Brazil
(Address of Principal Executive Offices)
Indicate by check mark whether the registrant files or will file annual reports under cover of Form 20-F or Form 40-F.
Form 20-F ☒ Form 40-F ☐
Indicate by check mark if the registrant is submitting the Form 6-K in paper as permitted by Regulation S-T Rule 101(b)(1): ☐
Indicate by check mark if the registrant is submitting the Form 6-K in paper as permitted by Regulation S-T Rule 101(b)(7): ☐
Indicate by check mark whether by furnishing the information contained in this Form, the registrant is also thereby furnishing the information to the Commission pursuant to Rule 12g3-2(b) under the Securities Exchange Act of 1934.
Yes ☐ No ☒
If “Yes” is marked, indicate below the file number assigned to the registrant in connection with Rule 12g3-2(b): N/A
Forward-Looking Statements
This report contains statements about expected future events and financial results that are forward-looking and subject to risks and uncertainties. Actual results could differ materially from those predicted in such forward-looking statements. Factors which may cause actual results to differ materially from those discussed herein include those risk factors set forth in our most recent Annual Report on Form 20-F filed with the Securities and Exchange Commission. CEMIG undertakes no obligation to revise these forward-looking statements to reflect events or circumstances after the date hereof, and claims the protection of the safe harbor for forward-looking statements contained in the Private Securities Litigation Reform Act of 1995.
SIGNATURES
Pursuant to the requirements of the Securities Exchange Act of 1934, the registrant has duly caused this report to be signed on its behalf by the undersigned, thereunto duly authorized.
| COMPANHIA ENERGÉTICA DE MINAS GERAIS – CEMIG | ||
|
By: |
/s/ Maurício Fernandes Leonardo Jr. | |
| Name: Maurício Fernandes Leonardo Júnior Title: Chief Finance and Investor Relations Officer | ||
Date: June 11, 2019
1. SUMMARY OF MINUTES OF THE 755TH MEETING OF THE BOARD OF DIRECTORS DATED MARCH 21, 2019
1
COMPANHIA ENERGÉTICA DE MINAS GERAIS – CEMIG
LISTED COMPANY– CNPJ 17.155.730/0001-64 – NIRE 31300040127
BOARD OF DIRECTORS
SUMMARY OF MINUTES
OF THE
755TH MEETING
| I Date, time and place: |
March 21, 2019, at 9.30 a.m., at Avenida Barbacena 1200, Santo Agostinho, Belo Horizonte, Minas Gerais State, Brazil. |
| II | The following were present: |
|
Board members: |
Adézio de Almeida Lima, Marco Antônio Soares da Cunha Castello Branco, José Pais Rangel, Luiz Guilherme Piva, Marco Aurélio Crocco Afonso, Patricia Gracindo Marques de Assis Bentes,
|
Márcio José Peres, Geber Soares de Oliveira, Manoel Eduardo Lima Lopes, Cristian Regis Duarte Silva, José Maria Rabelo, and Ricardo Wagner Righi de Toledo. |
These members all stated they had no conflict of interest with the matters on the agenda of this meeting.
| III | Meeting committee |
The Board Member Adézio de Almeida Lima chaired the meeting, in accordance with the by-laws. After verifying existence of a quorum and reporting that the Executive Board had recommended approval of the matter on the agenda, he invited Virginia Kirchmeyer Vieira to be secretary of the meeting.
| IV | Decisions |
Change in the composition of the Executive Board:
The Board unanimously approved the following:
| a) | Mr. Ronaldo Gomes de Abreu no longer to be Interim Chief Generation and Transmission Officer, after his successor is sworn in, for which the scheduled date is April 1, 2019. |
He will continue to be Chief Corporate Management Officer, and interim Chief Distribution and Sales Officer.
|
Av. Barbacena 1200 Santo Agostinho 30190-131 Belo Horizonte, Minas Gerais, Brazil Tel.: +55 31 3506-5024 Fax +55 31 3506-5025
This text is a translation, provided for information only. The original text in Portuguese is the legally valid version. | ||||||||||||||
2
| b) | Election as Chief Generation and Transmission Officer, to serve the rest of the present period of office of two years, that is to say until the first meeting of the Board of Directors after the Annual General Meeting to be held in 2020, and scheduled to be sworn in on April 1, 2019, of |
|
Paulo Mota Henriques |
– Brazilian, married, electrical engineer, bearer of identity card MG 2173956 SSP/MG and CPF 492.530.426-72, resident and domiciled at Rua Rio Negro 850/501, Alto Barroca, CEP 30.431-058, Belo Horizonte, Minas Gerais.
|
The Chief Officer elected declared, in advance, that he is not the subject of any prohibition on exercise of commercial activity, that he complies with the legal requirements and is not subject to any of the prohibitions described in Law 6404/1976, Law 13303/2016 or any of the other rules and regulations applicable; and made solemn commitment to become aware of, obey and comply with the principles, ethical values and rules established by the Code of Professional Conduct of Cemig, and the Code of Ethical Conduct of Government Workers and Senior Administration of the State of Minas Gerais.
The Chair then reported that the Executive Board is now as follows:
|
Cledorvino Belini – |
Chief Executive Officer, and also on interim basis Deputy CEO, Chief Counsel and Chief Officer for Human Relations;
| |
|
Daniel Faria Costa –
|
Chief Officer for Management of Holdings;
| |
|
Dimas Costa –
|
Chief Trading Officer;
| |
|
Maurício Fernandes Leonardo Júnior – |
Chief Finance and Investor Relations Officer; and Interim Chief Institutional Relations and Communication Officer;
| |
|
Paulo Mota Henriques –
|
Chief Generation and Transmission Officer; and
| |
|
Ronaldo Gomes de Abreu – |
Chief Distribution and Sales Officer, and also Interim Chief Corporate Management Officer.
|
| V | Closing: There being no further business, the meeting was closed and these minutes were written, and signed by the Chair, by Board members and by me, Virginia Kirchmeyer Vieira. |
(Signed by:)
|
Virginia Kirchmeyer Vieira, |
Adézio de Almeida Lima, | |
| Marco Antônio Soares da Cunha Castello Branco, | José Pais Rangel, | |
| Luiz Guilherme Piva, | Marco Aurélio Crocco Afonso, | |
| Patricia Gracindo Marques de Assis Bentes, | Márcio José Peres, | |
| Geber Soares de Oliveira,
|
Manoel Eduardo Lima Lopes.
|
This is a true copy of the original.
Virginia Kirchmeyer Vieira
|
Av. Barbacena 1200 Santo Agostinho 30190-131 Belo Horizonte, Minas Gerais, Brazil Tel.: +55 31 3506-5024 Fax +55 31 3506-5025
This text is a translation, provided for information only. The original text in Portuguese is the legally valid version. | ||||||||||||||
3
2. MINUTES OF THE EXTRAORDINARY GENERAL MEETING OF STOCKHOLDERS HELD ON MARCH 25, 2019
4
COMPANHIA ENERGÉTICA DE MINAS GERAIS – CEMIG
CNPJ 17.155.730/0001-64 — NIRE 31300040127
MINUTES
OF THE
EXTRAORDINARY GENERAL MEETING OF STOCKHOLDERS
HELD ON
MARCH 25, 2019
| Date, time and place: | March 25, 2019, at 11 a.m., at Av. Barbacena 1200, 21st floor, Santo Agostinho, Belo Horizonte, Minas Gerais, Brazil. | |
| Convocation: | The Meeting was regularly called by publication of the convocation announcement: on February 23, 26 and 27, 2019, in the publication ‘Minas Gerais’, on pages 47, 36 and 37 and 30, respectively; and on February 23, 24 and 25, in the publication ‘O Tempo’, on pages 26, 22 and 18, respectively. | |
| Attendance, quorum: | Stockholders of Companhia Energética de Minas Gerais – Cemig representing 81.26% of the shares holding the right to vote were present, as verified in the Stockholders Attendance Book, in which all signed, thus establishing a quorum for opening of this Meeting. Mr. Wieland Silberschneider, member of the Audit Board, was also present. | |
| Meeting committee: | Mr. Danilo Antônio de Souza Castro was elected by show of hands to chair the meeting, and invited me, Carlos Henrique Cordeiro Finholdt, to be Secretary of the Meeting. The meeting having been opened, stockholders unanimously approved issuance of these minutes in summary form. Stockholders had the right to present statements of vote, and/or statements of protest or dissidence, it being required that these be numbered and authenticated by the Committee, and filed at the Company’s head office. |
Agenda of the Meeting:
Decisions on the following:
| I | Changes to the by-laws. |
| II | Changes to the Board of Directors; with election of new members. |
| III | Approval and authorization of signature of the Protocol of Absorption and Justification, with RME – Rio Minas Energia Participações S.A., to specify the terms and conditions that will govern the absorption of RME by Cemig; authorization for absorption of RME by Cemig, and, subsequently, the consequent extinction of the absorbed company; ratification, under and for the purposes of Article 8 of Law 6404/1976, of the appointment of the three expert analysts to provide a valuation of the Stockholders’ equity of RME; and approval of the Valuation Opinion on RME, made in accordance with Law 6404/1976. |
|
Av. Barbacena 1200 Santo Agostinho 30190-131 Belo Horizonte, Minas Gerais, Brazil Tel.: +55 31 3506-5024 Fax +55 31 3506-5025
This text is a translation, provided for information only. The original text in Portuguese is the legally valid version. | ||||||||||||||
5
| IV | Approval and authorization of signature of the Protocol of Absorption and Justification, with Luce Empreendimentos e Participações S.A. (Lepsa), to specify the terms and conditions that will govern the absorption of Lepsa by Cemig; authorization for absorption of Lepsa by Cemig, and, subsequently, the consequent extinction of the absorbed company; ratification, under and for the purposes of Article 8 of Law 6404/1976, of the appointment of the three expert analysts to provide a valuation of the Stockholders’ equity of Lepsa, made in accordance with Law 6404/1976. |
Reading of documents and receipt of votes:
Reading of the documents related to the matters on the agenda of the meeting was dispensed with, unanimously, since their content was entirely known to the stockholders.
Registration of request for multiple vote:
Per a letter in the Company’s possession, the stockholder Fundo de Investimentos em Ações Dinâmica Energia (FIA Dinâmica) requested adoption of multiple vote; requiring 346,684,877 votes for the election of each member of the Board of Directors.
Decisions of the Meeting:
The stockholders decided:
| I) | To approve, with votes representing 296,684,646 shares in favor and 97,228,176 abstentions, the following proposal to change the by-laws, presented to this meeting by the representatives of: |
| – | the majority stockholder and |
| – | the stockholder FIA Dinâmica, |
with a separate vote received by the stockholder BNDES Participações S.A. (‘BNDESPar’):
| 1) | To change Clause 2, altering the address of the head office, to read as follows: |
| “Clause 2 | The Company shall have its head office and management in Belo Horizonte, capital city of the State of Minas Gerais, Brazil, and may open offices, representations or any other establishments in or outside Brazil, upon authorization by the Executive Board.” |
At the request of the representatives of the stockholder BNDESPar it is recorded here that the address of the Company’s head office is:
Av. Barbacena 1200 – 18th Floor, Santo Agostinho, Belo Horizonte, Minas Gerais, Brazil.
|
Av. Barbacena 1200 Santo Agostinho 30190-131 Belo Horizonte, Minas Gerais, Brazil Tel.: +55 31 3506-5024 Fax +55 31 3506-5025
This text is a translation, provided for information only. The original text in Portuguese is the legally valid version. | ||||||||||||||
6
| 2) | To change the head paragraph of Clause 13, deleting its §1 and re-numbering the subsequent paragraphs, to eliminate the post of substitute member of the Board of Directors, to read: |
| “Clause 13 | The Board of Directors of the Company shall comprise nine members, of whom one shall be the Chair, and another the Deputy Chair. | |
| §1 | The members of the Board of Directors shall be elected for concurrent periods of office of 2 (two) years, and may be dismissed at any time, by the General Meeting of Stockholders. Re-election for a maximum of 3 (three) consecutive periods of office is permitted, subject to the requirements and prohibitions established in the applicable legislation and regulations. | |
| §2 | The following rules apply to the composition of the Board of Directors:
(a) The following two groups of stockholders each have the right to elect one member, in separate votes, in accordance with the applicable legislation: (i) the minority holders of common shares; and (ii) the holders of preferred shares.
(b) At least 25% (twenty five per cent) of the members must be independent, or at least one of them, if there is a decision for the minority stockholders to exercise their option to use the multiple vote mechanism, in the terms of Article 141 of Law 6404/1976.
(c) The employees have the right to elect one member, subject to the terms of Federal Law 12353 of December 28, 2010, as applicable.
(d) In any event, the majority of the members shall be elected by the controlling stockholder of the Company. | |
| §3 | For election and for holding of office, the member of the Board of Directors representing the employees is subject to all the criteria, requirements, impediments and prohibitions specified in Law 6404/1976, Law 13303 of June 30, 2016, and regulations made under those laws. | |
| §4 | Without prejudice to the impediments and prohibitions specified in these by-laws, the member of the Board of Directors representing the employees shall not take part in debate and decisions on subjects that involve union relationships, remuneration, and/or benefits, including matters relating to private pension plans and/or other assistance plans, and/or in any other situation in which a conflict of interest is characterized. | |
| §5 | The Boards of Directors of the wholly-owned subsidiaries Cemig Distribuição S.A. and Cemig Geração e Transmissão S.A. shall be made up of the same members and substitute members elected to the Board of Directors of the Company, for periods running concurrently from start to termination, being remunerated for only one of these positions. | |
| §6 | The posts of Chair of the Board of Directors and Chief Executive Officer of the Company may not be held by the same person. | |
| §7 | The members of the Board of Directors may have other remunerated activities, provided that there is no incompatibility of time and/or conflict of interests. | |
| §8 | The Board of Directors may confer delegation of powers to the Executive Board for approval and signature of legal transactions related to the ordinary acts of management, including sale of electricity. |
|
Av. Barbacena 1200 Santo Agostinho 30190-131 Belo Horizonte, Minas Gerais, Brazil Tel.: +55 31 3506-5024 Fax +55 31 3506-5025
This text is a translation, provided for information only. The original text in Portuguese is the legally valid version. | ||||||||||||||
7
| 3) | To change §1 of Clause 15, to reflect elimination of the post of substitute member of the Board of Directors, to read as follows: |
| “Clause 15 | – [...]
| |
| §1 | Meetings of the Board of Directors shall be called by its Chair or Deputy Chair, with at least 10 (ten) days’ prior notice in writing or by email, containing the agenda. Convocation is not necessary when all the members of the Board of Directors, or their substitute members, are present. The Chair may call meetings of the Board of Directors on the basis of urgency without their being subject to this period of notice, provided that the other members of the Board are advised of the convocation.” |
| 4) | To change Clause 19, reducing the number of Executive Officers (members of the Executive Board) from eleven to seven, to read as follows: |
| “Clause 19 | The Executive Board shall comprise seven Executive Officers, who may be stockholders, resident in Brazil, elected by the Board of Directors for a period of two years, subject to the requirements of the applicable legislation and regulations. Re-election for a maximum of three consecutive periods of office is permitted.” |
| 5) | To change the drafting of the head paragraph of Clause 20, due to reduction of posts on the Executive Board, to read: |
| “Clause 20 | In the event of any of the other members of the Executive Board being absent, or on leave, or their seat being vacant, or in the event of impediment of their position, or their resignation, that Board may, on approval by a majority of its members, attribute temporary exercise of the related functions to another member of that Board.
| |
| §1 | The member of the Executive Board elected in this way shall hold the position for the remaining time of the period of office of the Executive Officer who is substituted.” |
| 6) | To change Clause 23, to insert sub-clauses ‘j’, ‘k’ and ‘l’ in Sub-item ‘I’, dealing with the duties of the Chief Executive Officer, to the following: |
| “Clause 23 | – [...]
| |
| I | Duties of the Chief Executive Officer: (...);
j) To coordinate policy and actions in management of people in the Company and in its wholly-owned and other subsidiaries.
k) To plan, coordinate and manage the legal activities of the Company and its wholly-owned and other subsidiaries.
l) To coordinate and administer processes and activities related to communication and institutional relations, externally and internally, in the area related to the Company and its wholly-owned and other subsidiaries.” |
|
Av. Barbacena 1200 Santo Agostinho 30190-131 Belo Horizonte, Minas Gerais, Brazil Tel.: +55 31 3506-5024 Fax +55 31 3506-5025
This text is a translation, provided for information only. The original text in Portuguese is the legally valid version. | ||||||||||||||
8
| 7) | To change Clause 23, removing its sub-items II, IX, X and XI, which dealt with the duties of the Deputy CEO, the Chief Officer for Management of People, the Chief Counsel, and the Chief Office for Institutional Relations, and consequently re-numbering the other Sub-items of that Clause, with inclusion of the function of regulation in Sub-item II, which deals with the duties of the Chief Finance and Investor Relations Officer, to read as follows: |
| “Clause 23 | – [...]
| |
| II | Duties of the Chief Finance and Investor Relations Officer:
To manage the processes and activities relating to the financial area, relations with investors, and regulation.
| |
| III | Duties of the Chief Corporate Management Officer:
To plan and arrange the activities relating to supply of materials and services, infrastructure, information technology, telecommunications and transactional services.
| |
| IV | Duties of the Chief Distribution and Sales Officer:
To manage the processes and activities of distribution of electricity and sales, in the Regulated Market.
| |
| V | Duties of the Chief Generation and Transmission Officer:
To manage the processes and activities of generation and transmission of electricity.
| |
| VI | Duties of the Chief Trading Officer:
To manage the processes and activities related to trading and sale of electricity and the use of the electricity system, market planning, and commercial relationship, in the Free Market.
| |
| VII | Duties of the Chief Officer for Management of Holdings:
To manage the processes and activities relating to accompaniment of the management of: the Company’s wholly-owned subsidiaries, with the exception of Cemig GT and Cemig D; other subsidiaries; affiliated companies; and negotiation and implementation of partnerships, consortia, associations and special-purpose companies; obeying the Policy on Holdings.”
|
| 8) | To change the head paragraph of Clause 30, to exclude the expression “led by a Chief Officer”, maintaining the area of Compliance within the duties of the CEO – to read as follows: |
| “Clause 30 | The area of Compliance, linked to the Chief Executive Officer, is responsible for:” |
| 9) | To change the head paragraph of Article 53, to exclude reference to the substitute member nominated as representative of the employees, to read as follows: |
| “Clause 53 | Until the representative of the employees on the Board of Directors is chosen in accordance with sub-clause ‘c’ of §3 and §4 of Clause 13 of these by-laws, an employee who complies with the specific requirements shall be designated, and the unions representing the various groups of employees shall be advised of the designation.” |
The changes proposed to Clauses 18 and 24 of the by-laws were withdrawn from the original proposal. At the request of the representative of the stockholder BNDES Participações S.A. (BNDESPar), it is recorded here that the present address of the company is: Av. Barbacena 1200, 18th Floor, Santo Agostinho, Belo Horizonte, Minas Gerais, Brazil.
|
Av. Barbacena 1200 Santo Agostinho 30190-131 Belo Horizonte, Minas Gerais, Brazil Tel.: +55 31 3506-5024 Fax +55 31 3506-5025
This text is a translation, provided for information only. The original text in Portuguese is the legally valid version. | ||||||||||||||
9
At the request of the stockholder Fundo de Investimento em Ações Dinâmica (‘FIA Dinâmica’), these minutes record its statement that, although it voted in favor of the proposal, it believes that the abolition of substitute members of the Board of Directors was adverse for the Company’s governance, since substitute members sat on the committees advising the Board, contributing to the analysis of matters that are submitted to the Board for decision.
| II) | The Board decided to approve, as a consequence of the changes decided above, consolidation of the text of the by-laws with the changes approved above, in the form of Appendix I to these minutes. |
| III) | Changes to the Board of Directors: the Meeting decided that the following members of the Board of Directors would no longer hold their positions, save that the sitting members shall maintain their positions until their replacements are sworn in, i.e. until April 2, 2019: |
Sitting members:
|
Adézio de Almeida Lima;
|
Bernardo Afonso Salomão de Alvarenga;
| |
|
Luiz Guilherme Piva;
|
Marco Antônio Soares da Cunha Castello Branco;
| |
|
José Pais Rangel;
|
Marcelo Gasparino da Silva;
| |
|
Marco Aurélio Crocco Afonso;
|
and Patrícia Gracindo Marques de Assis Bentes;
|
Substitute members:
|
Cristian Regis Duarte Silva;
|
Alcione Maria Martins Comonian;
| |
|
Geber Soares de Oliveira;
|
Manoel Eduardo Lima Lopes;
| |
|
José João Abdalla Filho;
|
José Maria Rabelo;
| |
|
and
|
Ricardo Wagner Righi de Toledo.
|
| IV | The Meeting elected the following members to the Board of Directors, to serve the current period of office of two years, that is to say, until the Annual General Meeting to be held in 2020; |
| – | while also recording that: on March 22, 2019, at 6.48 p.m., the Company received Report 25/2019 (Proceeding in Case 19957.00364 4/2019–05) from the CVM, in which the CVM stated that it was impossible for this meeting, being an EGM of a mixed private-public-sector company, to avoid certain conflicts of interest arising from characteristics of the persons nominated for election to the Board of Directors: |
| 1) | The fact that the Remote Voting Form shows a total of 156,355,380 preferred shares, i.e. representing more than 10% of the preferred shares, gives rise to a procedure for separate election, as per Article 141, §4, II, of Law 6404/1976. |
A separate vote was held, in which votes representing 55,905,344 shares, attributed by the representative of the holders of preferred shares, elected:
|
José João Abdalla Filho
|
– Brazilian, single, banker, domiciled in Rio de Janeiro, RJ, at Av. Presidente Vargas 463/13º andar, Centro, CEP 20071-003, bearer of Identity Card 14394711 SSP/SP, and CPF 245730788-00.
|
The representative of the stockholder FIA Dinâmica reported that Mr. José Pais Rangel had withdrawn his candidacy, due to the potential conflict of interest indicated by the Company’s Audit Committee. It is here also stated for the record that the Board Member now elected expressly resigned his membership of the Board of Directors of Engie, thus removing the impediment previously found by the Company’s Audit Committee.
|
Av. Barbacena 1200 Santo Agostinho 30190-131 Belo Horizonte, Minas Gerais, Brazil Tel.: +55 31 3506-5024 Fax +55 31 3506-5025
This text is a translation, provided for information only. The original text in Portuguese is the legally valid version. | ||||||||||||||
10
| 2) | The following candidates were elected by adoption of multiple vote, attributed by the representative of the stockholder State of Minas Gerais: |
with 346,684,877 votes,
|
Antônio Rodrigues dos Santos e Junqueira
|
– Brazilian, married, company manager, domiciled in São Paulo, SP, at Rua Professor Carlos de Carvalho 74/82, Itaim Bibi, CEP 04531-080, bearer of Identity Card 07405196-2 Detran/RJ and CPF 093966667-77;
|
with 346,684,877 votes,
|
Cledorvino Belini
|
– Brazilian, married, company manager, domiciled in Belo Horizonte, Minas Gerais at Av. Barbacena 1200, 18th floor, Santo Agostinho, CEP 30190-131, bearer of Identity Card MG-6539933 and CPF 116050068-15;
|
with 346,684,877 votes,
|
José Reinaldo Magalhães
|
– Brazilian, married, economist, domiciled in Rio de Janeiro, RJ, at Rua Nascimento Silva 224/301, Ipanema, CEP 22421-024, bearer of Identity Card M-607363 SSP/MG and CPF 227177906-59;
|
with 346,684,877 votes,
|
Márcio Luiz Simões Utsch
|
– Brazilian, widower, graduate in law, domiciled in São Paulo, SP, at Rua Lourenço de Almeida 487/71, Vila Nova Conceição, CEP 04508-000, bearer of Identity Card M-1167351 SSP/MG, and CPF 220418776-34;
|
and with 346,684,877 votes,
|
Romeu Donizete Rufino
|
– Brazilian, married, graduate in accountancy, domiciled in Coromandel, Minas Gerais, at Rua Pedrinho Pereira 342, Taquaril, CEP 38550-000, Identity Card 003551 SSP/DF, and CPF 143921601-06.
|
The nominations put forward by the stockholder The State of Minas Gerais had been previously considered and approved by the Company’s Audit Committee.
|
Av. Barbacena 1200 Santo Agostinho 30190-131 Belo Horizonte, Minas Gerais, Brazil Tel.: +55 31 3506-5024 Fax +55 31 3506-5025
This text is a translation, provided for information only. The original text in Portuguese is the legally valid version. | ||||||||||||||
11
| 3) | The following candidate was elected by adoption of multiple vote, with votes representing 346,684,877 shares attributed by the representative of the stockholder Fundo de Investimento em Ações Dinâmica (‘FIA Dinâmica’): |
|
Marcelo Gasparino da Silva
|
– Brazilian, married, lawyer, domiciled in Florianópolis, Santa Catarina, at Rua Esteves Júnior 605/1411, Centro, CEP 88015-130, Identity Card 2302967 SSP/SC, and CPF 807383469-34.
|
The candidate expressly resigned from membership of the Board of Directors of Celesc, thus removing the impediment previously found by the Company’s Audit Board.
| 4) | The following candidate was elected by adoption of multiple vote, with votes representing 380,400,944 shares attributed by the representative of the stockholder BNDES Participações S.A. (BNDESPar): |
|
Renata Bezerra Cavalcanti
|
– Brazilian, divorced, engineer, domiciled in Rio de Janeiro, RJ, at Rua General Urquiza 44/202, Leblon, CEP 22431-040, bearer of Identity Card 2477529 IFP/RJ and CPF 374778977-34.
|
For this seat the following names were put forward and votes cast as follows:
with 290,415,356 votes, attributed by the representative of the stockholder Fundo de Investimento em Ações Dinâmica (‘FIA Dinâmica’),
|
Rodrigo de Mesquita Pereira
|
– Brazilian, married, lawyer, domiciled in São Paulo, SP, at Rua Dr. Fernandes Coelho 85/6, Pinheiros, CEP 05423-040, bearer of Identity Card 8364447-7 SSP/SP and CPF 091622518-64;
|
and with 15,398,677 votes, attributed by the representative of the controlling stockholder, The State of Minas Gerais:
|
Afonso Henriques Moreira Santos
|
– Brazilian, married, engineer, domiciled at Itajubá, MG, at Rua Prefeito José Maria Silveira Campos 506, Pinheirinho, CEP 37500-200, bearer of Identity card MG-737136 SSP/MG and CPF 271628506-34.
|
Election to this seat is conditional upon consideration and approval by the Company’s Audit Board, under Law 13303/2060 and orientation by the CVM, referred to above.
In the event that the candidate put forward by BNDESPar does not meet the legal requirements, the seat will go to the second most voted candidate – nominated by FIA Dinâmica; in the event of that candidate not meeting the requirements, the seat will be held by the third most voted candidate, nominated by The State of Minas Gerais; and in the event of none of the three persons nominated meeting the legal requirements, the seat will remain vacant until a further General Meeting is called for election of the replacement.
| 5) | Due to the changes to the by-laws approved above, which include abolition of the positions of substitute members of the Board of Directors, and in view of the provisions of Clause 53 of the by-laws, until the process of election of the representative of the Company’s employees is completed, it was decided to appoint, to the seat on the Board representing the employee, the person who previously was the substitute member: |
|
Márcio José Peres
|
– Brazilian, married, engineer, domiciled in Belo Horizonte, Minas Gerais, at Av. Barbacena 1200, 12º andar, Santo Agostinho, CEP 30190-131, bearer of Identity Card 12729567-7 SSP/SP and CPF 713401066-04;
|
|
Av. Barbacena 1200 Santo Agostinho 30190-131 Belo Horizonte, Minas Gerais, Brazil Tel.: +55 31 3506-5024 Fax +55 31 3506-5025
This text is a translation, provided for information only. The original text in Portuguese is the legally valid version. | ||||||||||||||
12
The Board members elected and the Board Member nominated declared – in advance – that they are not subject to any prohibition on exercise of commercial activity, that they do not occupy any post in a company which could be considered to be a competitor of the Company, and that they do not have nor represent any interest conflicting with that of Cemig; and they made a solemn commitment to become aware of, obey and comply with the principles, ethical values and rules established by the Code of Professional Conduct of Companhia Energética de Minas Gerais – Cemig, and the Code of Ethical Conduct of Government Workers and Senior Administration of the State of Minas Gerais. Swearing-in is conditional upon presentation of the statements required in the related federal and state legislation.
| V | By 396,203,078 votes in favor, with 8,209 abstentions, the Meeting ratified, in accordance with Article 8 of Law 6404/1976, appointment of the three expert valuers, |
Mr. Flávio de Almeida Araújo, CRC/MG 86.861,
Mr. Leonardo Felipe Mesquita, CRC/MG 85.260, and
Mr. Leonardo George de Magalhães, CRC/MG 53.140,
to provide a valuation, under and for the purposes of Article 8 of Law 6404/1976, of the Stockholders’ equity of Luce Empreendimentos e Participações S. A. (Lepsa);
approved the Valuation Opinion valuing the equity of Lepsa, carried out in accordance with Law 6404/1976.
approved, and authorized signature, with Lepsa, of, the Protocol of Absorption and Justification, setting out the terms and conditions to govern the absorption of Lepsa by Cemig, in accordance with Articles 224 and 225 of Law 6404/1976;
and authorized absorption of Lepsa by Cemig, and, subsequently, the consequent extinction of the absorbed company.
| VI | By 396,203,078 votes in favor, with 8,209 abstentions, the Meeting ratified, in accordance with Article 8 of Law 6404/1976, appointment of the three expert valuers, |
Mr. Flávio de Almeida Araújo, CRC/MG 86.861,
Mr. Leonardo Felipe Mesquita, CRC/MG 85.260, and
Mr. Leonardo George de Magalhães, CRC/MG 53.140,
to provide a valuation, under and for the purposes of Article 8 of Law 6404/1976, of the Stockholders’ equity of Rio Minas Energia Participações S.A. (RME);
approved the Valuation Opinion valuing the equity of RME, carried out in accordance with Law 6404/1976;
approved, and authorized signature, with RME, of, the Protocol of Absorption and Justification, setting out the terms and conditions to govern the absorption of RME by Cemig, in accordance with Articles 224 and 225 of Law 6404/1976;
and authorized for absorption of RME by Cemig, and, subsequently, the consequent extinction of the absorbed company.
The mergers approved in items V and VI above shall come into effect after holding of Annual and Extraordinary General Meetings of Stockholders of the companies referred to, which must, respectively, approve the financial statements for the 2018 business year, and the absorption, itself, with the consequent extinction of those companies.
|
Av. Barbacena 1200 Santo Agostinho 30190-131 Belo Horizonte, Minas Gerais, Brazil Tel.: +55 31 3506-5024 Fax +55 31 3506-5025
This text is a translation, provided for information only. The original text in Portuguese is the legally valid version. | ||||||||||||||
13
Closing:
The meeting being opened to the floor, and since no-one wished to make any statements, these minutes were written, read, approved unanimously, and signed by those present:
| Secretary of the Meeting: | Carlos Henrique Cordeiro Finholdt | |||
| For the stockholder The State of Minas Gerais: | Danilo Antônio de Souza Castro Luiz Marcelo Carvalho Campos,
| |||
| For the stockholder Romário Fernando da Silva: | Luciano de Araujo Ferraz, Virginia Kirchmeyer Vieira,
| |||
| Daniel Alves Ferreira, for: | ||||
| Abu Dhabi Retirement Pensions and Benefits Fund; |
Amundi Funds; | |||
| Artisan Partners Global Funds plc; |
British Coal Staff Superannuation Scheme; | |||
| Capital Group Emerging Markets Restricted Equity Common Trust (US); | ||||
| Capital International Emerging Markets Fund; | ||||
| Emerging Markets Growth Fund Inc.; |
Emerging Markets Equity Fund; | |||
| FIA Dinâmica Energia; |
Fidelity UCITS II ICAV / Fidelity M; | |||
| Forsta Ap-Fonden; |
Franklin Templeton Investment Funds; | Gaspart Participações; | ||
| Global Trust Company FBO AQR Collective Investment Trust - AQR Emerging Equities Collective Investment Fund; | ||||
| HSBC Global Investment Funds—Brazil Equity; | ||||
| HSBC Global Investment Funds—Economic Scale Gem Equity; | ||||
| Invesco FTSE; | ||||
| IT NOW Ibovespa Fundo De Índice; |
IT NOW IDIV Fundo de Índice; | IT NOW IGCT Fundo de Índice; | ||
| IT NOW ISE Fundo de Índice; |
IT NOW PIBB IBRX-50 Fundo de Índice; | |||
| Itaú Ações Dividendos FI; |
Itaú Ações Infra Estrutura FI; | Itaú Ações Small Cap FI; | ||
| Itaú Brasil EUA Multimercado FI; |
Itaú Caixa Ações FI; | |||
| Itaú Dunamis Fundo De Investimento Em Ações; |
Itaú Excelência Social Ações Fundo De Investimento; | |||
| Itaú FTSE Rafi Brazil 50 Capped Index FIA; |
Itaú Governança Corporativa Ações FI; | |||
| Itaú Hedge Multimercado Fundo de Investimento; |
Itaú Hedge Plus Multimercado FI; | |||
| Itaú Ibovespa Ativo Master FIA; |
Itaú IBRX Ativo Master FIA; | |||
| Itaú Index Ações Ibovespa FI; |
Itaú Index Ações IBRX FI; | Itaú Long and Short Plus Multimercado FI; | ||
| Itaú Momento Ações Fundo De Investimento; |
Itaú Multimercado Equity Hedge Advanced 30 FI; | |||
| Itaú Multimercado Global Equity Hedge FI; |
Itaú Multimercado Long and Short FI; | |||
| Itaú Phoenix Ações FI; |
Itaú Previdência IBRX FIA; | |||
| Itaú Small Cap Master Fundo de Investimento Em Ações; | ||||
| Itaú Small Cap Valuation FIA; |
Itaú Solutions Long and Short FI; | |||
|
Av. Barbacena 1200 Santo Agostinho 30190-131 Belo Horizonte, Minas Gerais, Brazil Tel.: +55 31 3506-5024 Fax +55 31 3506-5025
This text is a translation, provided for information only. The original text in Portuguese is the legally valid version. | ||||||||||||||
14
| JNL/Mellon Capital Emerging Markets Index Fund; | ||||
| JP Morgan Brazil Investment Trust Plc; |
JP Morgan Funds; | |||
| KS Delaware II LLC; |
KS Delaware LLC; | |||
| Long Bias Multimercado FI; |
Luiz Barsi Filho; | Mineworkers’ Pension Scheme; | ||
| Morgan Stanley Investment Funds Global Balanced Defensive Fund; | ||||
| Morgan Stanley Investment Funds Global Balanced Fund; | ||||
| Public Employees Retirement System of Ohio; |
Quant IB – Multimercado FI; | |||
| RBC Emerging Markets Dividend Fund; |
RBC Funds (Lux) – Emerging Markets Value Equity Fund; | |||
| RBC Quant Emerging Markets Equity Leaders ETF; | ||||
| SCRI – Robeco QI Institutional Emerging Markets Enhanced Index Equities Fund; | ||||
| The Master Trust Bank of Japan, Ltd. as Trustee for MTBJ400045828; | ||||
| The Master Trust Bank of Japan, Ltd. as Trustee for MTBJ400045829; | ||||
| The Master Trust Bank of Japan, Ltd. as Trustee for MTBJ400045835; | ||||
| The Master Trust Bank of Japan, Ltd. as Trustee for MUTB400045792; | ||||
| The Master Trust Bank of Japan, Ltd. as Trustee for MUTB400045794; | ||||
| The Master Trust Bank of Japan, Ltd. as Trustee for MUTB400045795; | ||||
| Vanguard ESG International Stock ETF; | ||||
| Vantagetrust III Master Collective Investment Funds Trust; | ||||
| Veneza Institucional Fundo de Investimento em Ações; | ||||
| Victorian Superannuation Fund; WM Ibovespa Plus Fundo de Investimento em Ações; | ||||
| WM Small Cap Fundo de Investimento em Ações. | ||||
| Carlos Vinícius Barcellos Dieguez | ||||
| For BNDESPar: | Igor Pinheiro Moreira |
| ||
| For Cemig: | Carlos Renato de Almeida | Alexandre de Queiroz Rodriguez | ||
|
|
Alexandre Eustáquio Sydney Horta | Rogério Henrique Costa Matos | ||
|
|
Eduardo Reis Domingues | Antônio Carlos Velez Braga | ||
| For the Audit Board: |
|
Wieland Silberschneider | ||
|
Av. Barbacena 1200 Santo Agostinho 30190-131 Belo Horizonte, Minas Gerais, Brazil Tel.: +55 31 3506-5024 Fax +55 31 3506-5025
This text is a translation, provided for information only. The original text in Portuguese is the legally valid version. | ||||||||||||||
15
3. MATERIAL ANNOUNCEMENT DATED APRIL 9, 2019: RENOVA SIGNS WITH AES TIETÊ FOR PURCHASE OF ALTO SERTÃO III
16
COMPANHIA ENERGÉTICA DE MINAS GERAIS – CEMIG
LISTED COMPANY – CNPJ 17.155.730/0001-64 – NIRE 31300040127
MATERIAL ANNOUNCEMENT
Renova signs with AES Tietê for purchase of Alto Sertão III
In accordance with CVM Instruction 358 of January 3, 2002 as amended, Cemig (Companhia Energética de Minas Gerais – listed, with securities traded on the stock exchanges of São Paulo, New York and Madrid), hereby informs the public, the Brazilian Securities Commission (CVM), the São Paulo stock exchange (B3) and the market in general, as follows:
Cemig’s affiliated company Renova Energia S.A. has today published the following Material Announcement:
“Complementing the Material Announcement published on March 21, 2019 and in compliance with CVM Instruction 358/2002, as amended, Renova Energia S.A. (RNEW11) hereby informs its stockholders and the market in general as follows:
On today’s date Renova has signed a share purchase agreement for sale to AES Tietê Energia S.A. of the Alto Sertão III wind farm complex, and certain wind projects in development.
| 1 | The transaction comprises: |
| (a) | sale of the Alto Sertão III complex, divided into: |
| – | Phase A, with installed capacity of 438 MW, for R$ 350 million, and |
| – | Phase B, with capacity of 305 MW to be installed, for R$ 90 million; and |
| (b) | an option to acquire wind projects in development, for generation capacity of up to 1.1 GW, for up to R$ 76 million. |
| 2 | The overall price may be augmented by an agreed earn-out amount, if the performance of Phase A exceeds the reference level specified in the negotiation. |
The transaction will settle the debt owed to creditors of the project, since AES Tietê will assume the financial debt, estimated at R$ 988 million, most of which is owed to the BNDES. Completion is subject to compliance with certain conditions precedent that are usual in this type of transaction.
The Company reiterates its commitment to keeping stockholders and the market in general fully and timely informed in accordance with the applicable legislation.
Belo Horizonte, April 9, 2019.
Daniel Faria Costa
Acting Chief Finance and Investor Relations Officer
|
Av. Barbacena 1200 Santo Agostinho 30190-131 Belo Horizonte, Minas Gerais, Brazil Tel.: +55 31 3506-5024 Fax +55 31 3506-5025
This text is a translation, provided for information only. The original text in Portuguese is the legally valid version. | ||||||||||||||
17
4. MATERIAL ANNOUNCEMENT DATED APRIL 24, 2019: MERGER OF RME AND LEPSA INTO CEMIG COMPLETED
18
COMPANHIA ENERGÉTICA DE MINAS GERAIS – CEMIG
LISTED COMPANY – CNPJ 17.155.730/0001-64 – NIRE 31300040127
MATERIAL ANNOUNCEMENT
Merger of RME and Lepsa into Cemig completed
In compliance with CVM Instruction 358 of January 3, 2002 as amended, Cemig (Companhia Energética de Minas Gerais – listed in São Paulo, New York and Madrid) hereby reports as follows to the Brazilian Securities Commission (CVM), the São Paulo Stock Exchange (B3) and the market:
On today’s date the process of merger of the following two companies into Cemig was completed:
| • | Luce Empreendimentos e Participações S.A. (‘Lepsa’); and |
| • | Rio Minas Energia Participações S.A. (‘RME’). |
With cessation of the existence of RME and Lepsa, the stockholders’ agreement of Light S.A. (‘Light’), signed December 30, 2009 and amended November 13, 2018, immediately ceases to exist, loses its object, and obligations under it are terminated.
Cemig approved the absorption of RME and Lepsa at the Extraordinary General Meeting of Stockholders held on March 25, 2019.
Since this is an absorption of a wholly-owned subsidiary, there will be no capital increase nor need for issue of new shares by Cemig.
Note also that this merger does not change the aggregate percentage equity interest in Light held by Cemig.
Cemig reiterates its commitment to keep stockholders and the market timely informed in accordance with applicable law and regulations.
Belo Horizonte, April 24, 2019
Maurício Fernandes Leonardo Júnior
Chief Finance and Investor Relations Officer
|
Av. Barbacena 1200 Santo Agostinho 30190-131 Belo Horizonte, Minas Gerais, Brazil Tel.: +55 31 3506-5024 Fax +55 31 3506-5025
This text is a translation, provided for information only. The original text in Portuguese is the legally valid version. | ||||||||||||||
19
5. MATERIAL ANNOUNCEMENT DATED APRIL 25, 2019: BNDESPAR NOTIFIES TAG-ALONG SALE OF HOLDING IN RENOVA TO CEMIG GT
20
COMPANHIA ENERGÉTICA DE MINAS GERAIS – CEMIG
LISTED COMPANY – CNPJ 17.155.730/0001-64 – NIRE 31300040127
MATERIAL ANNOUNCEMENT
BNDESPar notifies tag-along sale of holding in Renova to Cemig GT
Complementing the Material Announcement published on March 21, 2019 and in compliance with CVM Instruction 358 of January 3, 2002 as amended, Cemig (Companhia Energética de Minas Gerais – listed with securities traded in São Paulo, New York and Madrid) hereby reports as follows to the Brazilian Securities Commission (CVM), the São Paulo Stock Exchange (Brasil, Bolsa, Balcão – B3) and the market:
On April 24, 2019 Cemigs wholly-owned subsidiary Cemig Geração e Transmissão S.A. (‘Cemig GT’), received notice from BNDES Participações S.A. (‘BNDESPar’), of exercise of BNDESPar’s right of joint sale (‘tag-along’) over the totality of the shares held by BNDESPar in Renova Energia S.A. (‘Renova’) – comprising 696,683 Units representing a total of 5.01% of the share capital of Renova – in accordance with the terms of the Stockholders’ Agreement to which Cemig GT adhered on September 29, 2014.
Under that stockholders’ agreement, in the event of any of the controlling stockholders of Renova wishing to transfer any shares bound by that agreement, BNDESPar has a right of joint sale, giving it the option of transferring its entire holding of Units (each Unit comprising two preferred shares and one common share) to the acquiring party, in the same transaction and on the same terms.
The transaction is still subject to several conditions precedent specified in the Share Purchase Agreement.
Cemig reiterates its commitment by keep stockholders and the market appropriately informed in accordance with the applicable law and regulations.
Belo Horizonte, April 25, 2019
Maurício Fernandes Leonardo Júnior
Chief Finance and Investor Relations Officer
|
Av. Barbacena 1200 Santo Agostinho 30190-131 Belo Horizonte, Minas Gerais, Brazil Tel.: +55 31 3506-5024 Fax +55 31 3506-5025
This text is a translation, provided for information only. The original text in Portuguese is the legally valid version. | ||||||||||||||
21
6. MATERIAL ANNOUNCEMENT DATED APRIL 29, 2019: TAESA CONCLUDED THE ACQUISITION OF 23.0355% OF SHARES OF EMPRESA DE TRANSMISSÃO DO ALTO URUGUAI S.A.
22
COMPANHIA ENERGÉTICA DE MINAS GERAIS – CEMIG
LISTED COMPANY – CNPJ 17.155.730/0001-64 – NIRE 31300040127
MATERIAL ANNOUNCEMENT
Cemig (Companhia Energética de Minas Gerais, listed in São Paulo, New York and Madrid), in compliance with CVM Instruction 358 of January 3, 2002 as amended, hereby reports to the Brazilian Securities Commission (CVM), the São Paulo Stock Exchange (B3) and the market as follows:
Cemig’s affiliated company Transmissora Aliança de Energia Elétrica S.A. (‘Taesa’) has today published the following Material Announcement:
“Transmissora Aliança de Energia Elétrica S.A. (“Taesa” or “Company”), pursuant to CVM Instruction 358/02, as amended, hereby announces to its shareholders, the market in general and other interested parties that, further to the material facts disclosed on September 27, October 4, November 26, 2018 and January 15, 2019 and to the notices disclosed on March 14 and 25, and on April 12, 2019, regarding the acquisition of some lots from Eletrobras Auction No. 01/2018 (“Auction”), it concluded, on this date, the acquisition of 23.0355% of shares of Empresa de Transmissão do Alto Uruguai S.A. – ETAU (“Acquisition”), with the payment of R$ 32,880,396.40, under the terms set forth in the sales and purchase agreement, after the fullfilment of all precedent conditions applicable to the Acquisition.
After the conclusion of this operation, the Company, which held before 52.5838% of shareholding interest in ETAU, now holds 75.6193% of ETAUs total shares. The Company will not consolidate ETAU’s results in its financial statements, since it is a company whose control is shared with the other shareholders DME Energética S.A. – DMEE and Companhia Estadual de Energia Elétrica – CEEE, as defined in its shareholders’ agreement.”
Belo Horizonte, April 29, 2019.
Maurício Fernandes Leonardo Júnior
Chief Finance and Investor Relations Officer
|
Av. Barbacena 1200 Santo Agostinho 30190-131 Belo Horizonte, Minas Gerais, Brazil Tel.: +55 31 3506-5024 Fax +55 31 3506-5025
This text is a translation, provided for information only. The original text in Portuguese is the legally valid version. | ||||||||||||||
23
7. MINUTES OF THE ANNUAL GENERAL MEETING OF STOCKHOLDERS HELD ON MAY 3, 2019
24
COMPANHIA ENERGÉTICA DE MINAS GERAIS – CEMIG
CNPJ 17.155.730/0001-64 – NIRE 31300040127
MINUTES
OF THE
ANNUAL GENERAL MEETING OF STOCKHOLDERS
HELD ON
MAY 3, 2019
Date, time and place:
May 3, 2019 at 11 a.m., at:
Av. Barbacena 1200, 21st Floor, Santo Agostinho, Belo Horizonte, Minas Gerais, Brazil.
Convocation and publication:
The Meeting was regularly called by publication of the convocation announcement on April 3, 4 and 5, 2019, in the publication Minas Gerais, on pages 25, 22 and 23 respectively, and in the publication O Tempo, on pages 21, 25 and 08, respectively. The Report of Management and the financial statements for 2018, and the related complementary documents, were widely disclosed in the press; placed at the disposal of stockholders on March 30, and April 2 and 3, 2019 in Minas Gerais, on pages 71, 30 and 25, respectively; and on March 30 and 31, and April 1, in O Tempo, on pages 23, 20 and 20, respectively; and were also published in the same two newspapers, on April 23, 2019, on pages 27 to 66 of Caderno 1 in Minas Gerais, and pages 2 to 41 in the Caderno Balanço section of O Tempo.
The summary statement of votes by Remote Voting Form was published to the market on April 30, 2019, and will be at the disposal of stockholders for them to consult.
Attendance, quorum:
Stockholders of Companhia Energética de Minas Gerais – Cemig representing 74.82% of the shares holding the right to vote were present, as verified in the Stockholders’ Attendance Book, in which all signed, thus establishing a quorum for opening of this Meeting.
The following were also present:
| Maurício Fernandes Leonardo Júnior –
Wieland Silberschneider –
Pedro Carlos de Mello –
Leonardo Júnio Vilaça – |
Chief Finance and Investor Relations Officer of Cemig;
member of the Audit Board of Cemig;
member of the Audit Committee of Cemig; and
for Ernst & Young Auditores Independentes. |
|
Av. Barbacena 1200 Santo Agostinho 30190-131 Belo Horizonte, Minas Gerais, Brazil Tel.: +55 31 3506-5024 Fax +55 31 3506-5025
This text is a translation, provided for information only. The original text in Portuguese is the legally valid version. | ||||||||||||||
25
Meeting committee:
Luiz Marcelo Carvalho Campos was elected by show of hands to chair the meeting, and invited me, Carlos Henrique Cordeiro Finholdt, to be Secretary of the Meeting. The meeting having been opened, stockholders unanimously approved issuance of these minutes in summary form. Stockholders had the right to present statements of vote, and/or statements of protest or dissidence, it being required that these be numbered and authenticated by the Committee, and filed at the Company’s head office.
Agenda:
Decisions on the following:
| 1 | Examination, debate and voting on the Report of Management and the Financial Statements for the year ended Monday, December 31, 2018, and the related complementary documents. |
| 2 | Allocation of the Net profit for 2018, of R$ 1,700,099,000; and of the negative balance of Retained earnings in the amount of R$ 114,769,000. |
| 3 | Form and date of payment of the minimum obligatory dividend, of R$ 867,350,000. |
| 4 | Remuneration of the Managers, the members of the Audit Board, and the Audit Committee. |
Reading of documents and receipt of votes:
Reading of the documents related to the matters on the agenda of the meeting was dispensed with, unanimously, since their content was entirely known to the stockholders.
Decisions:
The stockholders, recording the separate vote of the stockholder BNDESPar in relation to items 1, 3 and 4 of the convocation, decided as follows:
| I | To approve, by majority, as per the final voting summary attached, the Report of Management and the Financial Statements for the year ended December 31, 2018, and the related complementary documents. |
| II | To authorize, by majority vote, as per the final voting summary attached, the following allocation of the net profit for 2018, in the amount of R$ 1,700,999,000, and the negative balance of Retained earnings, of R$ 72,305, relating to the initial adoption of CPC 48 / IFRS 9 and CPC 47 / IFRS 15, comprising the amount of R$ 157,266,000, less the amount of R$ 42,497,000 reflecting realization of the deemed cost of PP&E and reversal of R$ 42,464,000 of expired dividends: |
| a) | R$ 867,350,000 as minimum obligatory dividends, to stockholders, as follows: |
| – | R$ 210,000,000 in the form of Interest on Equity, to be paid in two equal installments, by June 28 and December 30, 2019, to stockholders whose names were on the Company’s Nominal Share Registry on December 21, 2018; |
| – | R$ 657,350,000 in the form of dividends for the 2018 business year, to be paid by December 30, 2019 to stockholders whose names are on the Company’s Nominal Share Registry on the date on which the Annual General Meeting is held; |
| b) | R$ 751,207,000 to be held in Stockholders’ equity in the Retained earnings reserve, to provide funding for the Company’s consolidated planned investments in 2019, as per a capital budget; and |
| c) | R$ 9,237,000 to be held in Stockholders’ equity in the Tax incentives reserve, relating to tax incentives obtained in 2018 as a result of investments made in the region of Sudene. |
|
Av. Barbacena 1200 Santo Agostinho 30190-131 Belo Horizonte, Minas Gerais, Brazil Tel.: +55 31 3506-5024 Fax +55 31 3506-5025
This text is a translation, provided for information only. The original text in Portuguese is the legally valid version. | ||||||||||||||
26
The payment may be brought forward, depending on availability of funds and at the discretion of the Executive Board.
For subclause ‘b’ above, the representative of the stockholder The State of Minas Gerais presented a proposal to change the amount from R$ 708,743,000 to R$ 751,207,000, for inclusion of expired dividends.
| III | The Meeting approved the following proposal for setting the remuneration of the managers – comprising the Board of Directors, the Executive Board, the members of the Audit Board and the Audit Committee – by majority vote, as per the final voting summary attached: |
| 1) | Allocation of the Annual Global Amount for Remuneration of the Managers, Audit Board members, and Audit Committee, of up to |
| R$ 23,259,187.88 | (twenty three million two hundred fifty nine thousand one hundred eighty seven Reais and eighty eight centavos), |
– noting that there will be no alteration to the individual remuneration currently in effect – to include health insurance for the Executive Officers, to be contracted at the same level of the Health Plan in effect for the employees of the company, and variable remuneration, the following monthly fees to be payable:
| to the Chief Executive Officer,
|
R$ 85,000.00 (eighty five thousand Reais);
| |
| and to each of the other Chief Officers, | R$ 67,000.00 (sixty seven thousand Reais). |
| 2) | That the monthly remuneration of each one of the members of the Board of Directors – excluding members that are also Chief Officers, and subject to the condition relating to the payment of the jeton mentioned in item 4 below – shall be: |
for the Chair of the Board of Directors, thirty per cent of the remuneration of the Chief Executive Officer, i.e. it shall be: R$ 25,500.00 (twenty five thousand five hundred Reais)
and for the other members of the Board of Directors, 30% of the average remuneration of a Chief Officer, i.e. it shall be: R$ 20,590.90 (twenty thousand five hundred ninety Reais 90 centavos).
| 3) | That the members of the Board of Directors shall receive eighty per cent of the monthly remuneration stipulated, the rest being divided into jetons paid to those who attend meetings. |
If there is more than one meeting in the month, the jeton shall be divided proportionately between the number of meetings held in the month; if there is no meeting in the month, the sitting member and the substitute member shall receive the total amount of the monthly remuneration.
| 4) | That the monthly remuneration of each sitting member of the Audit Board shall be 20% (twenty per cent) of the average remuneration of a Chief Officer of the Company, that is to say it shall be: |
R$ 13,727.27 (thirteen thousand seven hundred twenty seven Reais and twenty seven centavos);
and also that the monthly remuneration of each Substitute Member of the Audit Board shall be 80% (eighty per cent) of the monthly remuneration of the Sitting Member, that is to say it shall be
R$ 10,981.81 (ten thousand nine hundred eighty one Reais and 81 centavos),
in both cases excluding the benefits normally applicable under the Law.
|
Av. Barbacena 1200 Santo Agostinho 30190-131 Belo Horizonte, Minas Gerais, Brazil Tel.: +55 31 3506-5024 Fax +55 31 3506-5025
This text is a translation, provided for information only. The original text in Portuguese is the legally valid version. | ||||||||||||||
27
| 5) | To establish that the monthly remuneration of each one of the members of the Audit Committee shall be: R$ 20,590.90 (twenty thousand five hundred ninety Reais and ninety centavos). |
| 6) | To establish that the members of the Board of Directors that are also members of the Audit Committee shall receive only the remuneration of the latter. |
| 7) | To establish that Members of the Board of Directors and sitting and substitute members of the Audit Board, and members of the Audit Committee who are resident in municipalities other than that of the Company’s head office shall be reimbursed such expenses on accommodation and travel (within Brazil) as are necessary for their attendance at the meetings of those Boards or that Committee or for carrying out their functions or when invited by the CEO to a meeting at the Company, and shall also receive, as cost support for travel, R$ 800 for each trip for attendance. |
| 8) | To establish that the fees of the members of the Executive Board, the Board of Directors and the Audit Board and the members of the Audit Committee shall be paid on the same date as the Company adopts for its employees. |
| 9) | To establish that the variable remuneration of the Chief Officers and the targets and performance indicators for their calculation shall be stipulated by the Board of Directors, as per the Policy on Remuneration for Chief Officers, limited to the value of the annual global allocation stated above. |
|
Av. Barbacena 1200 Santo Agostinho 30190-131 Belo Horizonte, Minas Gerais, Brazil Tel.: +55 31 3506-5024 Fax +55 31 3506-5025
This text is a translation, provided for information only. The original text in Portuguese is the legally valid version. | ||||||||||||||
28
Closing
The Chair stated that the publications by the Company specified in Law 6404 of December 15, 1976 will be made in the newspapers Minas Gerais, official publication of the State, and in O Tempo, without prejudice to possible publication in other newspapers.
The meeting being opened to the floor, and since no-one wished to make any statements, these minutes were written, read, approved unanimously, and signed by those present:
| Secretary: | Carlos Henrique Cordeiro Finholdt. | |
| For The State of Minas Gerais: | Luiz Marcelo Carvalho Campos. | |
| For the stockholder Romário Fernando da Silva: | Luciano de Araújo Ferraz, Virginia Kirchmeyer Vieira. | |
| For BNDES Participações S.A. – BNDESPar: | Luciana Najan Silva da Cruz. | |
| For the Executive Board: | Maurício Fernandes Leonardo Júnior. | |
| Paulo Roberto Bellentani Brandão, for: British Coal Staff Superannuation Scheme, Bureau of Labor Funds-Labor Pension Fund, Franklin Templeton Investment Funds, KS Delaware II LLC, KS Delaware LLC, Mineworkers Pension Scheme, The Master Trust Bank of Japan, Ltd. as Trustee For MTBJ400045828, Vanguard Emerging Markets Stock Index Fund, Vanguard ESG International Stock ETF, Vanguard Fiduciary Trust Company Institutional Total International Stock Market Index Trust, Vanguard Total International Stock Index Fund, a Series of Vanguard Star Funds, Fundo de Investimentos em Ações Dinâmica Energia (FIA Dinâmica), Gaspart Participações S.A., and Luiz Barsi Filho. | ||
| For the Audit Board: | Alexandre Eustáquio Sydney Horta, Rogério Henrique Costa Matos, Wieland Silberschneider; | |
| For the Audit Committee: | Pedro Carlos de Mello; | |
| For Ernst & Young Auditores Independentes: | Leonardo Júnio Vilaça. | |
|
Av. Barbacena 1200 Santo Agostinho 30190-131 Belo Horizonte, Minas Gerais, Brazil Tel.: +55 31 3506-5024 Fax +55 31 3506-5025
This text is a translation, provided for information only. The original text in Portuguese is the legally valid version. | ||||||||||||||
29
| VOTING SUMMARY – Base date: May 3, 2019 | ||||||||||||||||
| Annual General Meeting of Stockholders May 3, 2019 – 11 a.m. | ||||||||||||||||
| 1 – Examination, debate and voting on the Report of Management and the Financial Statements for the year ended December 31, 2018, and the related complementary documents (ON Shares): |
| |||||||||||||||
| Asset |
Approve | Reject | Abstain | Total votes | ||||||||||||
| Common (ON) shares |
310.143.361 | 282 | 54.713.041 | 364.856.684 | ||||||||||||
| 2 – Allocation of the Net profit for 2018, in the amount of R$ 1,700,099,000, and of the negative balance of Retained earnings in the amount of R$ 114,769,000 (ON Shares); |
| |||||||||||||||
| Asset |
Approve | Reject | Abstain | Total votes | ||||||||||||
| Common (ON) shares |
364.518.722 | 282 | 337.680 | 364.856.684 | ||||||||||||
| 3 – Decision on the form and date of payment of the minimum obligatory dividends, in the amount of R$ 867,350,000 (ON Shares); |
| |||||||||||||||
| Asset |
Approve | Reject | Abstain | Total votes | ||||||||||||
| Common (ON) shares |
310.176.012 | 54.342.992 | 337.680 | 364.856.684 | ||||||||||||
| 4 – Decision on the remuneration of the Managers, the members of the Audit Board, and the members of the Audit Committee (ON shares). |
| |||||||||||||||
| Assets |
Approve | Reject | Abstain | Total votes | ||||||||||||
| Common (ON) shares |
301.841.060 | 8.334.952 | 54.680.672 | 364.856.684 | ||||||||||||
|
Av. Barbacena 1200 Santo Agostinho 30190-131 Belo Horizonte, Minas Gerais, Brazil Tel.: +55 31 3506-5024 Fax +55 31 3506-5025
This text is a translation, provided for information only. The original text in Portuguese is the legally valid version. | ||||||||||||||
30
8. NOTICE TO STOCKHOLDERS DATED MAY 3, 2019: DECLARATION OF DIVIDENDS AND INTEREST ON EQUITY
31
COMPANHIA ENERGÉTICA DE MINAS GERAIS – CEMIG
LISTED COMPANY – CNPJ 17.155.730/0001-64
NOTICE TO STOCKHOLDERS
Declaration of Dividends and Interest on Equity
The Annual General Meeting of Stockholders held on May 3, 2019, decided as follows:
| 1. | DIVIDENDS: |
| a) | Of the net profit of R$ 1,700,099,000 for the business year 2018, R$ 867,350,000 will be allocated as minimum obligatory dividend to stockholders as follows: |
| ✓ | R$ 210,000,000 as Interest on Equity, corresponding to R$ 0.144013969 per share, to be accounted as part of the minimum obligatory dividend for 2018. Of this amount income tax of 15% will be withheld at source, in accordance with the legislation. |
Payment will be made in two equal installments, by June 28 and December 30, 2019, to stockholders whose names are on the Company’s Nominal Share Registry on December 21, 2018. The shares traded ‘ex–’ these rights on December 26, 2018.
| ✓ | R$ 657,350,000 in the form of dividends for the 2018 business year, equal to R$ 0.450798011 per share, to be paid to stockholders whose names are on the Company’s Nominal Share Registry on the date on which the Annual General Meeting was held, i.e. on May 3, 2019. |
The dividends will be paid in a single installment, by December 30, 2019 – this date may be brought forward in accordance with availability of cash, at the option of the Executive Board. The shares will trade ‘ex–’ this right on May 6, 2019.
For stockholders whose shares are not held in custody by CBLC and whose registration details are not up to date, we recommend visiting any branch of Banco Itaú Unibanco S.A. (the Institution which administers Cemig’s Nominal Share Registry System), with their identification documents, for the necessary updating.
Belo Horizonte, May 3, 2019
Maurício Fernandes Leonardo Júnior
Chief Finance and Investor Relations Officer
|
Av. Barbacena 1200 Santo Agostinho 30190-131 Belo Horizonte, Minas Gerais, Brazil Tel.: +55 31 3506-5024 Fax +55 31 3506-5025
This text is a translation, provided for information only. The original text in Portuguese is the legally valid version. | ||||||||||||||
32
9. EARNINGS RELEASE 1Q2019: PUBLICATION OF RESULTS DATED MAY 16, 2019
33

PUBLICATION OF RESULTS
CEMIG REPORTS
1Q19 EBITDA
R$ 1,461 MILLION
Main factors in 1Q19:
| ◾ | Sales of electricity to final consumers of Cemig D were up 5.1% year-on-year. |
| ◾ | Revenue in Cemig GT was maximized by an efficient strategy of seasonalization. |
| ◾ | The Programmed Voluntary Retirement Plan was reopened for 2019. |
| ◾ | Financial revenue gain of R$ 152,311, on the hedge transactions for the Eurobond issue |
| Indicators (GWh) |
1Q19 | 1Q18 | % | |||||||||
| Electricity sold (excluding CCEE) |
13,758 | 12,954 | 6.21 | |||||||||
| Indicators (R$ ’000) |
1Q19 | 1Q18 | % | |||||||||
| Sales on CCEE |
252,616 | 134,327 | 88.06 | |||||||||
| Net Debt |
12,748,293 | 13,068,790 | (2.45 | ) | ||||||||
| Gross revenue |
9,054,702 | 7,649,423 | 18.37 | |||||||||
| Net revenue |
5,913,178 | 4,935,431 | 19.81 | |||||||||
| Ebitda (IFRS) |
1,461,184 | 1,007,003 | 45.10 | |||||||||
| Net profit |
797,239 | 464,595 | 71.60 | |||||||||
| Ebitda Margem |
24.71 | % | 20.41 | % | 4.30p.p | |||||||
| Av. Barbacena 1200 Santo Agostinho 30190-131 Belo Horizonte, Minas Gerais, Brazil Tel.: +55 31 3506-5024 Fax +55 31 3506-5025
This text is a translation, provided for information only. The original text in Portuguese is the legally valid version. | ||||||||||
34
Conference call
Publication of 1Q19 results
Webcast and Conference call
Thursday, May 16, 2019, 4 p.m. Brasília time
The transmission will have simultaneous translation in English and can be seen by Webcast, at http://ri.cemig.com.br, or through conference call on:
+ 55 (11) 2188-0155 (1st option) or
+ 55 (11) 2188-0188 (2nd option)
Password: CEMIG
|
Playback of Video Webcast: Website: http://ri.cemig.com.br Click on the banner and download. Available for 90 days |
Conference call – Playback: Tel: (11) 2188-0400 Password: CEMIG Português Available from MAy 17 to 31, 2019 |
Cemig Investor Relations
Web: http://ri.cemig.com.br/
Email: ri@cemig.com.br
Tel.: +55 (31) 3506-5024
Fax: +55 (31) 3506-5025
Cemig’s Executive Investor Relations Team
| • | Chief Finance and Investor Relations Officer |
Maurício Fernandes Leonardo Júnior
| • | General Manager, Investor Relations |
Antônio Carlos Vélez Braga
| • | Manager, Investor Market |
Robson Laranjo
| Av. Barbacena 1200 Santo Agostinho 30190-131 Belo Horizonte, Minas Gerais, Brazil Tel.: +55 31 3506-5024 Fax +55 31 3506-5025
This text is a translation, provided for information only. The original text in Portuguese is the legally valid version. | ||||||||||
35
Contents
| CONFERENCE CALL |
35 | |||
| CONTENTS |
36 | |||
| DISCLAIMER |
37 | |||
| OUR SHARES |
37 | |||
| CEMIG’S LONG-TERM RATINGS |
38 | |||
| ADOPTION OF IFRS |
39 | |||
| PROFIT AND LOSS ACCOUNTS |
39 | |||
| 1Q19 RESULTS |
40 | |||
| CEMIG’S CONSOLIDATED ELECTRICITY MARKET |
40 | |||
| THE ELECTRICITY MARKET OF CEMIG D |
42 | |||
| PHYSICAL TOTALS OF TRANSPORT AND DISTRIBUTION MWH |
43 | |||
| THE ELECTRICITY MARKET OF CEMIG GT |
44 | |||
| SUPPLY QUALITY INDICATORS – DEC AND FEC |
44 | |||
| CONSOLIDATED OPERATIONAL REVENUE |
45 | |||
| TAXES AND CHARGES ON REVENUE |
48 | |||
| OPERATIONAL COSTS AND EXPENSES |
49 | |||
| DEFAULT |
50 | |||
| SHARE OF PROFIT (LOSS), NET, OF ASSOCIATES AND JOINT VENTURES |
52 | |||
| FINANCIAL REVENUE AND EXPENSES |
52 | |||
| EBITDA |
52 | |||
| DEBT |
53 | |||
| RESULTS BY BUSINESS SEGMENT |
55 | |||
| APPENDICES |
56 | |||
| CAPEX |
56 | |||
| SOURCES AND USES OF POWER – BILLED MARKET |
57 | |||
| PLANTS |
60 | |||
| RAP (PERMITTED ANNUAL TRANSMISSION REVENUE) – 2018-2019 CYCLE |
61 | |||
| TABLES |
62 |
| Av. Barbacena 1200 Santo Agostinho 30190-131 Belo Horizonte, Minas Gerais, Brazil Tel.: +55 31 3506-5024 Fax +55 31 3506-5025
This text is a translation, provided for information only. The original text in Portuguese is the legally valid version. | ||||||||||
36
Disclaimer
Certain statements and estimates in this material may represent expectations about future events or results, which are subject to risks and uncertainties, which may be known or unknown. There is no guarantee that the events or results will take place as referred to in these expectations.
These expectations are based on the present assumptions and analyses from the point of view of our management, in accordance with their experience and other factors such as the macroeconomic environment, market conditions in the electricity sector, and expected future results, many of which are not under Cemig’s control.
Important factors that could lead to significant differences between actual results and the projections about future events or results include Cemig’s business strategy, Brazilian and international economic conditions, technology, Cemig’s financial strategy, changes in the electricity sector, hydrological conditions, conditions in the financial and energy markets, uncertainty on our results from future operations, plans and objectives, and other factors. Due to these and other factors, Cemig’s results may differ significantly from those indicated in or implied by such statements.
The information and opinions herein should not be understood as a recommendation to potential investors, and no investment decision should be based on the veracity, currentness or completeness of this information or these opinions. None of Cemig’s professionals nor any of their related parties or representatives shall have any liability for any losses that may result from use of the content of this material.
To evaluate the risks and uncertainties as they relate to Cemig, and to obtain additional information about factors that could give rise to different results from those estimated by Cemig, please consult the section on Risk Factors included in the Reference Form filed with the Brazilian Securities Commission (CVM) – and in the 20-F form filed with the U.S. Securities and Exchange Commission (SEC).
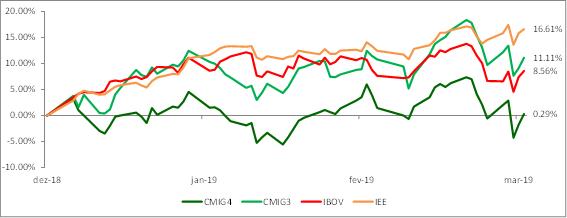
Our shares
| Security |
Ticker | Currency | March 31, 2019 |
Close of 2018 |
Change in the period, % |
|||||||||||||||
| Cemig PN |
CMIG4 | R$ | 13.47 | 13.43 | 0.29 | % | ||||||||||||||
| Cemig ON |
CMIG3 | R$ | 16.27 | 14.65 | 11.11 | % | ||||||||||||||
| ADR PN |
CIG | US$ | 3.46 | 3.45 | 0.28 | % | ||||||||||||||
| ADR ON |
CIG.C | US$ | 4.03 | 3.83 | 5.34 | % | ||||||||||||||
| Ibovespa |
IBOV | — | 95,415 | 87,887 | 8.56 | % | ||||||||||||||
| Power industry index |
IEEX | — | 57,449 | 49,266 | 16.61 | % | ||||||||||||||
Source: Economática – Adjusted for corporate action, including dividends.
Trading volume in Cemig’s preferred shares (CMIG4) totaled R$ 9.98 billion in 1Q19, a daily average of R$ 166.33 million – this is 89.59% higher than in 1Q18. Average daily trading in the common (ON) shares was R$ 25.77 million. Cemig’s shares, by volume (aggregate of common (ON) and preferred (PN) shares), were the second most liquid in Brazil’s electricity sector in the period, and among the most traded in the whole Brazilian equity market.
On the New York Stock Exchange the volume traded in ADRs for Cemig’s preferred shares (CIG) in 1Q19 was US$ 974.74 million. We see this as reflecting recognition by the investor market of Cemig as a global investment option.
| Av. Barbacena 1200 Santo Agostinho 30190-131 Belo Horizonte, Minas Gerais, Brazil Tel.: +55 31 3506-5024 Fax +55 31 3506-5025
This text is a translation, provided for information only. The original text in Portuguese is the legally valid version. | ||||||||||
37
The São Paulo stock exchange Ibovespa index rose 8.56% in the quarter, closing the quarter at 95,415 points. Cemig’s shares also rose in the quarter – the common shares by 11.11%, and the preferred shares by 0.29%. Cemig’s ADRs, in New York, were also up in the quarter: the ADRs for the common shares by 5.34%, and the ADRs for the preferred shares by 0.28%.
Cemig’s long-term ratings
This table shows long-term credit ratings and outlook for Cemig’s companies as provided by the principal rating agencies:
Brazilian rating:
| Agency |
Cemig |
Cemig D |
Cemig GT | |||||||||
| Rating |
Outlook |
Rating |
Outlook |
Rating |
Outlook | |||||||
| Fitch | A–(bra) | Positive | A–(bra) | Positive | A–(bra) | Positive | ||||||
| S&P | brA+ | Stable | brA+ | Stable | brA+ | Stable | ||||||
| Moody’s | Baa2.br | Stable | Baa2.br | Stable | Baa2.br | Stable | ||||||
Global rating:
| Agency |
Cemig |
Cemig D |
Cemig GT | |||||||||
| Rating |
Outlook |
Rating |
Outlook |
Rating |
Outlook | |||||||
| Fitch | B+ | Positive | B+ | Positive | B+ | Positive | ||||||
| S&P | B | Stable | B | Stable | B | Stable | ||||||
| Moody’s | B1 | Stable | B1 | Stable | B1 | Stable | ||||||
Ratings of Cemig Eurobond:
| Agency |
Cemig |
Cemig GT | ||||||
| Rating |
Outlook |
Rating |
Outlook | |||||
| Fitch | B+ | Positive | B+ | Positive | ||||
| S&P | B | Stable | B | Stable | ||||
| Av. Barbacena 1200 Santo Agostinho 30190-131 Belo Horizonte, Minas Gerais, Brazil Tel.: +55 31 3506-5024 Fax +55 31 3506-5025
This text is a translation, provided for information only. The original text in Portuguese is the legally valid version. | ||||||||||
38
Adoption of IFRS
The results presented below are prepared in accordance with Brazilian accounting rules, which now embody harmonization to IFRS (International Financial Reporting Standards), and are in thousands of Reais (R$ ’000)
PROFIT AND LOSS ACCOUNTS
| Consolidated R$ ’000 |
1Q19 | 1Q18 | % | |||||||||
| Continued Operations |
||||||||||||
| REVENUE |
5,913,178 | 4,935,431 | 19.81 | |||||||||
| OPERATING COSTS |
||||||||||||
| Personnel |
(365,041 | ) | (331,664 | ) | 10.06 | |||||||
| Employees’ and managers’ profit shares |
(66,037 | ) | ( 19,577 | ) | 237.32 | |||||||
| Post-retirement benefits |
(100,909 | ) | (83,271 | ) | 21.18 | |||||||
| Materials |
(20,490 | ) | (15,290 | ) | 34.01 | |||||||
| Outsourced services |
(283,728 | ) | (235,793 | ) | 20.33 | |||||||
| Electricity purchased for resale |
(2,594,181 | ) | (2,263,693 | ) | 14.60 | |||||||
| Depreciation and amortization |
(230,896 | ) | (212,991 | ) | 8.41 | |||||||
| Operating provisions |
(109,006 | ) | (133,208 | ) | (18.17 | ) | ||||||
| Charges for use of the national grid |
(333,796 | ) | (392,542 | ) | (14.97 | ) | ||||||
| Gas bought for resale |
(394,982 | ) | (263,233 | ) | 50.05 | |||||||
| Infrastructure construction costs |
(199,118 | ) | (180,669 | ) | 10.21 | |||||||
| Other operating expenses, net |
(51,932 | ) | (66,362 | ) | (21.74 | ) | ||||||
|
|
|
|
|
|
|
|||||||
| TOTAL COST |
(4,750,116 | ) | (4,198,293 | ) | 13.14 | |||||||
| Share of profit (loss) in associates and joint ventures |
67,226 | 56,874 | 18.20 | |||||||||
| Operational profit before financial revenue (expenses) and taxes |
1,230,288 | 794,012 | 54.95 | |||||||||
| Finance income |
350,518 | 241,854 | 44.93 | |||||||||
| Finance expenses |
(452,078 | ) | (399,654 | ) | 13.12 | |||||||
|
|
|
|
|
|
|
|||||||
| Pre-tax profit |
1,128,728 | 636,212 | 77.41 | |||||||||
| Current and deferred income tax and Social Contribution tax |
(331,489 | ) | (171,617 | ) | 93.16 | |||||||
|
|
|
|
|
|
|
|||||||
| Profit for the business year from going concern operations |
797,239 | 464,595 | 71.60 | |||||||||
|
|
|
|
|
|
|
|||||||
| Net profit for the period attributable to equity holders of the parent |
797,076 | 464,449 | 71.62 | |||||||||
| Net profit for the period attributable to non-controlling interests |
163 | 146 | 11.64 | |||||||||
| Av. Barbacena 1200 Santo Agostinho 30190-131 Belo Horizonte, Minas Gerais, Brazil Tel.: +55 31 3506-5024 Fax +55 31 3506-5025
This text is a translation, provided for information only. The original text in Portuguese is the legally valid version. | ||||||||||
39
1Q19 RESULTS
Cemig reports net profit of R$ 797,239 in 1Q19, compared to R$ 464,595 in 4Q18.
This higher figure was due to:
| ◾ | sales of power to final consumers of Cemig GT 5.1% higher year-on-year; |
| ◾ | Cemig GT’s revenue from transactions on the Wholesale Power Exchange (CCEE) 112.94% higher, due to a greater seasonal effect in 1Q19, associated with higher Generation Scaling Factors (GSF), with a higher volume of sales in the secondary market; |
| ◾ | Net financial revenue of R$ 152,311, reflecting the effects of the gain in value of the hedge for the Eurobond issue |
Cemig’s consolidated electricity market
The Cemig Group sells electricity through its distribution company, Cemig Distribuição (‘Cemig D’), its generation and transmission company, Cemig Geração e Transmissão (‘Cemig GT’), and other wholly-owned subsidiaries: Horizontes Energia, Sá Carvalho, Cemig PCH, Rosal Energia, CE Praias de Parajuru, CE Volta do Rio, Cemig Geração Camargos, Cemig Geração Itutinga, Cemig Geração Salto Grande, Cemig Geração Três Marias, Cemig Geração Leste, Cemig Geração Oeste, and Cemig Geração Sul.
These companies sell electricity to:
| (I) | Captive consumers in Cemig’s concession area in the State of Minas Gerais; |
| (II) | Free Consumers in both the State of Minas Gerais and other States of Brazil, in the Free Market (Ambiente de Contratação Livre, or ACL); |
| (III) | other agents of the electricity sector – traders, generators and independent power producers, also in the ACL; and |
| (IV) | Distributors, in the Regulated Market (Ambiente de Contratação Regulada, or ACR). |
In 1Q19 the Cemig group sold a total volume of 13,758,035 MWh, which was 6.2% more than in 1Q18.
Sales of electricity to final consumers, plus Cemig’s own consumption, totaled 10,680,542 MWh, or 3.5% plus than in 1Q16.
Sales to distributors, traders, other generating companies and independent power producers in 1Q19 totaled 3,077,493 MWh – or 16.9% more than in 1Q18.
In March 2019 the Cemig group invoiced 8,434,983 clients – this consumer base was 0.8% larger than the number of clients billed in March 2018. Of these, 8,434,620 were in the group comprising final consumers and Cemig’s own consumption; and 363 were other agents in the Brazilian power industry.
| Av. Barbacena 1200 Santo Agostinho 30190-131 Belo Horizonte, Minas Gerais, Brazil Tel.: +55 31 3506-5024 Fax +55 31 3506-5025
This text is a translation, provided for information only. The original text in Portuguese is the legally valid version. | ||||||||||
40
The chart below itemizes the Cemig Group’s sales to final consumers in the year, by consumer category:
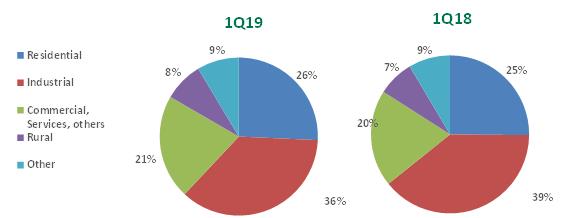
Total consumption of electricity (GWh)
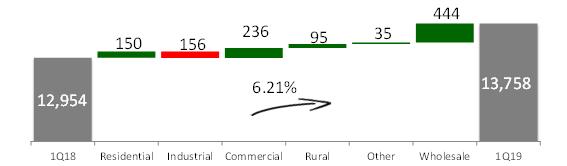
| MWh | Change,% | Average price 1Q19 R$/ MWh |
Average price 1Q18 R$/ MWh |
|||||||||||||||||
| Consolidated |
1Q19 | 1Q18 | ||||||||||||||||||
| Residential |
2,743,798 | 2,593,117 | 5.81 | 895.99 | 739.64 | |||||||||||||||
| Industrial |
3,872,005 | 4,028,060 | (3.87 | ) | 294.56 | 274.52 | ||||||||||||||
| Commercial, Services and Others |
2,279,357 | 2,042,937 | 11.57 | 587.46 | 523.40 | |||||||||||||||
| Rural |
860,624 | 765,502 | 12.43 | 530.85 | 447.76 | |||||||||||||||
| Public authorities |
223,700 | 213,598 | 4.73 | 686.60 | 565.78 | |||||||||||||||
| Public lighting |
351,964 | 343,406 | 2.49 | 428.58 | 362.30 | |||||||||||||||
| Public services |
339,111 | 322,058 | 5.30 | 493.93 | 416.92 | |||||||||||||||
|
|
|
|
|
|
|
|
|
|
|
|||||||||||
| Subtotal |
10,670,559 | 10,308,678 | 3.51 | 549.81 | 467.12 | |||||||||||||||
|
|
|
|
|
|||||||||||||||||
| Own consumption |
9,983 | 12,124 | (17.66 | ) | — | — | ||||||||||||||
| Wholesale supply to agents in Free and Regulated Markets(*) |
3,077,493 | 2,632,799 | 16.89 | 265.52 | 266.44 | |||||||||||||||
|
|
|
|
|
|
|
|
|
|
|
|||||||||||
| Total |
13,758,035 | 12,953,601 | 6.21 | 479.82 | 416.71 | |||||||||||||||
|
|
|
|
|
|
|
|
|
|
|
|||||||||||
| (*) | Includes Regulated Market Electricity Sale Contracts (CCEARs) and ‘bilateral contracts’ with other agents. |
| Av. Barbacena 1200 Santo Agostinho 30190-131 Belo Horizonte, Minas Gerais, Brazil Tel.: +55 31 3506-5024 Fax +55 31 3506-5025
This text is a translation, provided for information only. The original text in Portuguese is the legally valid version. | ||||||||||
41
THE ELECTRICITY MARKET OF CEMIG D
Electricity billed to captive clients and electricity transported for Free Clients and distributors with access to Cemig D’s networks totaled 11,279,316 MWh in 1Q19, or 4.08% more than in 1Q18. There are two components of this increase: consumption of the captive market 5.1% higher YoY, and use of the network by Free Clients 2.7% higher YoY.
| Captive market + Energy carried |
1Q19 | 1Q18 | % | |||||||||
| Residential |
2,743,798 | 2,593,117 | 5.81 | |||||||||
| Industrial |
4,992,954 | 4,883,770 | 2.24 | |||||||||
| Commercial, Services and Others |
1,687,684 | 1,643,371 | 2.70 | |||||||||
| Rural |
863,882 | 769,122 | 12.32 | |||||||||
| Public authorities |
223,700 | 213,598 | 4.73 | |||||||||
| Public lighting |
351,964 | 343,406 | 2.49 | |||||||||
| Public services |
339,111 | 322,058 | 5.30 | |||||||||
| Concession holder |
76,223 | 69,197 | 10.15 | |||||||||
|
|
|
|
|
|
|
|||||||
| Total |
11,279,316 | 10,837,639 | 4.08 | |||||||||
|
|
|
|
|
|
|
|||||||
Residential
Residential volume was 5.81% higher in 1Q19 than 1Q18, reflecting three factors:
| ◾ | high temperatures in the period; |
| ◾ | addition of 60,771 new consumer units; |
| ◾ | more calendar days in 1Q19 (92.5 days) that in 1Q18 (89.8 days). |
Industrial
Industrial volume was 2.24% higher in 1Q19 than 1Q18, reflecting two factors:
| ◾ | in gthe captive market, one major new high voltage client (A2) was added later in 2018, not included in the comparison base in the first quarter of 2018; and |
| ◾ | the volume of power transported was higher, mainly due to increases in (i) ferro alloys (4.00%)and (ii) extractive industries (9.50%). |
Commercial and Services
Volume sold to this user category was 2.70% higher year-on-year, mainly reflecting higher temperatures in the period. It also reflects a reduction of 0.65% in the volume of energy billed to captive consumers; and volume of energy transported for free clients 33.16% higher year-on-year. The significant growth in total consumption by Free Market customers mainly reflects an increase in their number – there were 17.5% more Free Consumers in 1Q19 than 1Q18.
Rural
Consumption by rural consumers 12.32% higher year-on-year in 2019 mainly reflects lower rainfall in the period. Consumption by irrigation users was 31.8% higher, while the increase for all other conventional farming was 6.0%.
| Av. Barbacena 1200 Santo Agostinho 30190-131 Belo Horizonte, Minas Gerais, Brazil Tel.: +55 31 3506-5024 Fax +55 31 3506-5025
This text is a translation, provided for information only. The original text in Portuguese is the legally valid version. | ||||||||||
42
Number of clients
The Cemig group billed 8,433,739 customers in March 2019 (this excludes the group’s own consumption). Of this total, 1,181 are Free Clients, which use Cemig D’s distribution network.
| Cemig D |
Number of clients | Change,% | ||||||||||
| 1Q19 | 1Q18 | |||||||||||
| Residential |
6,844,886 | 6,784,115 | 0.90 | |||||||||
| Industrial |
71,893 | 73,496 | (2.18 | ) | ||||||||
| Commercial, Services and Others |
722,549 | 717,716 | 0.67 | |||||||||
| Rural |
708,490 | 707,157 | 0.19 | |||||||||
| Public authorities |
64,855 | 63,805 | 1.65 | |||||||||
| Public lighting |
6,378 | 6,125 | 4.13 | |||||||||
| Public services |
13,507 | 13,152 | 2.70 | |||||||||
|
|
|
|
|
|
|
|||||||
| 8,432,558 | 8,365,566 | 0.80 | ||||||||||
| Total energy carried |
||||||||||||
| Industrial |
587 | 547 | 7.31 | |||||||||
| Commercial |
585 | 498 | 17.47 | |||||||||
| Rural |
6 | 4 | 50.00 | |||||||||
| Concession holder |
3 | 3 | — | |||||||||
|
|
|
|
|
|
|
|||||||
| 1,181 | 1,052 | 12.26 | ||||||||||
| Total |
8,433,739 | 8,366,618 | 0.80 | |||||||||
|
|
|
|
|
|
|
|||||||
Physical totals of transport and distribution – MWh
| Metered market |
MWh | Change, | ||||||||||
| 1Q19 | 1Q18 | % | ||||||||||
| Total energy carried |
||||||||||||
| Transported for distributors (metered) |
78,883 | 66,927 | 17.86 | |||||||||
| Transported for Free Clients (metered) |
4,885,065 | 4,853,355 | 0.65 | |||||||||
| Own load + Distributed generation (1)(2) |
||||||||||||
| Consumption by captive market – Billed supply |
6,529,473 | 6,213,246 | 5.09 | |||||||||
| Losses in distribution network |
1,656,080 | 1,660,417 | (0.26 | ) | ||||||||
|
|
|
|
|
|
|
|||||||
| Total energy carried |
13,149,501 | 12,793,946 | 2.78 | |||||||||
|
|
|
|
|
|
|
|||||||
| (1) | Includes distributed microgeneration. |
| (2) | Includes own consumption |
| Av. Barbacena 1200 Santo Agostinho 30190-131 Belo Horizonte, Minas Gerais, Brazil Tel.: +55 31 3506-5024 Fax +55 31 3506-5025
This text is a translation, provided for information only. The original text in Portuguese is the legally valid version. | ||||||||||
43
The electricity market of Cemig GT
Cemig GT billed a total of 6,994,836 MWh in 1Q19, 6.49% more than in 1Q18.
The number of clients billed by Cemig GT was 5.14% higher than at the end of March 2018, totaling 1,678. Of these: 1,313 were industrial, commercial and rural clients, 28 were distribution companies, and 29 were companies in the category of traders, generators and independent power producers.
Consumption by industrial clients was 5.73% lower year-on-year, due to a higher seasonal effect at the beginning of 2019, in which less power was allocated in the first half and more in the second half of the year. Meanwhile, consumption in the commercial market segment was 33.16% higher year-on-year, due to an increasing number of clients migrating from the captive market to the free market. Cemig GT added 94 commercial clients from March 2018 to March 2019.
In 1Q19 total sales to traders were 2,407,704 MWh, or 21.02% more than in 1Q18. In February 2019, Cemig had a high volume of excess supply, which was partially sold to traders.
Sales in the Regulated Market in 1Q19, including sales to Cemig D, totaled 599,280 MWh, or 5.08% less than in 1Q18, due to a difference in seasonal variations of the distributors, and contractual adjustments.
| Cemig GT |
(MWh) | Change,% | ||||||||||
| 1Q19 | 1Q18 | |||||||||||
| Free Clients |
||||||||||||
| Industrial |
3,076,197 | 3,263,105 | (5.73 | ) | ||||||||
| Commercial |
911,151 | 684,255 | 33.16 | |||||||||
| Rural |
504 | — | — | |||||||||
| Free Market – Free contracts |
2,407,704 | 1,989,515 | 21.02 | |||||||||
| Regulated Market |
568,071 | 600,086 | (5.34 | ) | ||||||||
| Regulated Market – Cemig D |
31,209 | 31,270 | (0.20 | ) | ||||||||
|
|
|
|
|
|
|
|||||||
| Total |
6,994,836 | 6,568,231 | 6.49 | |||||||||
|
|
|
|
|
|
|
|||||||
Supply quality indicators – DEC and FEC
Cemig is continuously taking action to improve operational management, organization of the logistics of its emergency services, and its permanent routine of preventive inspection and maintenance of substations and distribution lines and networks. It also invests in training of its staff for improved qualifications, state-of-the-art technologies, and standardization of work processes, aiming to maintain the quality of electricity supply, and as a result maintain satisfaction of clients and consumers.
| Av. Barbacena 1200 Santo Agostinho 30190-131 Belo Horizonte, Minas Gerais, Brazil Tel.: +55 31 3506-5024 Fax +55 31 3506-5025
This text is a translation, provided for information only. The original text in Portuguese is the legally valid version. | ||||||||||
44
The charts below show Cemig’s indicators for duration and frequency of outages – DEC (Average Interruption Duration, in hours), and FEC (Average Interruption Frequency, in number of outages), since January 2016.
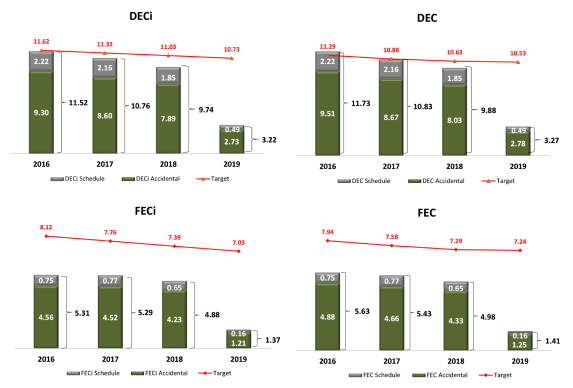
Consolidated operational revenue
Revenue from supply of electricity:
Total revenue from supply of electricity in 1Q19 was R$ 6,601,417, or 22.30% higher than in 1Q18 (R$ 5,397,905).
Final consumers
Total revenue from electricity sold to final consumers, excluding Cemig’s own consumption, in 1Q19 was R$ 5,841,016, or 23.40% more than in 1Q18 (R$ 4,733,392). The main factors in this revenue were:
| ◾ | – the Annual Tariff Adjustment for Cemig D effective May 28, 2018, with average upward effect on consumer tariffs of 23.19%; and |
| ◾ | Volume of power sold to final consumers 3.51% higher year-on-year, led especially by the residential consumer category, due to (a) higher temperatures and (b) addition of new consumers. |
| Av. Barbacena 1200 Santo Agostinho 30190-131 Belo Horizonte, Minas Gerais, Brazil Tel.: +55 31 3506-5024 Fax +55 31 3506-5025
This text is a translation, provided for information only. The original text in Portuguese is the legally valid version. | ||||||||||
45
| 1Q19 | 1Q18 | Change,% | ||||||||||||||||||||||||||||||
| MWh | R$ | Average price (R$/MWh) (1) |
MWh | R$ | Average price (R$/MWh) (1) |
MWh | R$ | |||||||||||||||||||||||||
| Residential |
2,743,798 | 2,458,438 | 896.00 | 2,593,117 | 1,917,981 | 739.64 | 5.81 | 28.18 | ||||||||||||||||||||||||
| Industrial |
3,872,005 | 1,140,542 | 294.56 | 4,028,060 | 1,105,786 | 274.52 | (3.87 | ) | 3.14 | |||||||||||||||||||||||
| Commercial, Services and Others |
2,279,357 | 1,339,038 | 587.46 | 2,042,937 | 1,069,278 | 523.40 | 11.57 | 25.23 | ||||||||||||||||||||||||
| Rural |
860,624 | 456,879 | 530.87 | 765,502 | 342,763 | 447.76 | 12.43 | 33.29 | ||||||||||||||||||||||||
| Public authorities |
223,700 | 153,592 | 686.60 | 213,598 | 120,850 | 565.78 | 4.73 | 27.09 | ||||||||||||||||||||||||
| Public lighting |
351,964 | 150,845 | 428.58 | 343,406 | 124,416 | 362.30 | 2.49 | 21.24 | ||||||||||||||||||||||||
| Public services |
339,111 | 167,496 | 493.93 | 322,058 | 134,272 | 416.92 | 5.30 | 24.74 | ||||||||||||||||||||||||
|
|
|
|
|
|
|
|
|
|
|
|
|
|
|
|
|
|||||||||||||||||
| Subtotal |
10,670,559 | 5,866,830 | 549.81 | 10,308,678 | 4,815,346 | 467.12 | 3.51 | 21.84 | ||||||||||||||||||||||||
| Own consumption |
9,983 | — | — | 12,124 | — | — | (17.66 | ) | — | |||||||||||||||||||||||
| Supply not yet invoiced, net |
— | (25,814 | ) | — | — | (81,954 | ) | — | — | (68.50 | ) | |||||||||||||||||||||
|
|
|
|
|
|
|
|
|
|
|
|
|
|
|
|
|
|||||||||||||||||
| 10,680,542 | 5,841,016 | 546.88 | 10,320,802 | 4,733,392 | 458.63 | 3.49 | 23.40 | |||||||||||||||||||||||||
| Wholesale supply to agents in Free and Regulated Markets(2) |
3,077,493 | 817,138 | 265.52 | 2,632,799 | 701,491 | 266.44 | 16.89 | 16.49 | ||||||||||||||||||||||||
| Wholesale supply not yet invoiced, net |
— | (56,737 | ) | — | — | (36,978 | ) | — | — | 53.43 | ||||||||||||||||||||||
|
|
|
|
|
|
|
|
|
|
|
|
|
|
|
|
|
|||||||||||||||||
| Total |
13,758,035 | 6,601,417 | 479.82 | 12,953,601 | 5,397,905 | 416.71 | 6.21 | 22.30 | ||||||||||||||||||||||||
|
|
|
|
|
|
|
|
|
|
|
|
|
|
|
|
|
|||||||||||||||||
| (1) | Average price does not include supply not yet invoiced. |
| (2) | Includes Regulated Market Electricity Sale Contracts (CCEARs) and ‘bilateral contracts’ with other agents. |
Revenue from Use of Distribution Systems (the TUSD charge)
This is revenue from charging Free Consumers the Tariff for Use of the Distribution System (TUSD), on the volume of energy distributed. In 1Q19 this revenue was R$ 630,044, or 68.58% more than in 1Q18 (R$ 373,741) – the higher figure reflected the increase of 65.60% granted for the TUSD in the Annual Tariff Adjustment (covering both power transport volume, and demand levels) in effect from May 2018 (full effect in 2019).
CVA and Other financial components in tariff adjustments
In its interim accounting information Cemig recognizes the difference between actual non-controllable costs (in which the contribution to the CDE – the Energy Development Account – and electricity bought for resale, are significant components) and the costs that were used in calculating rates charged to consumers. In 1Q19 the amount for reimbursement in the subsequent tariff was R$ 120,350 – this is 72.72% below the amount subject to reimbursement in 1Q18, of R$ 441,156. The difference mainly reflects higher costs of power supply in 2018, in relation to the coverage by the tariff (this difference generates a higher financial asset to be reimbursed to the Company through the next tariff adjustment).
| Av. Barbacena 1200 Santo Agostinho 30190-131 Belo Horizonte, Minas Gerais, Brazil Tel.: +55 31 3506-5024 Fax +55 31 3506-5025
This text is a translation, provided for information only. The original text in Portuguese is the legally valid version. | ||||||||||
46
Changes in balances of financial assets and liabilities:
| R$ ’000 | ||||
| Balance at Dec. 31, 2017 |
(45,790 | ) | ||
|
|
|
|||
| Net total of financial liabilities constituted |
178,444 | |||
| Asset realized |
262,712 | |||
| Payments from the Flag Tariff Centralizing Account (‘CCRBT’) |
(153,267 | ) | ||
| Updating – Selic rate |
447 | |||
|
|
|
|||
| Balance at Mar. 31, 2018 |
242,546 | |||
|
|
|
|||
| Balance at Dec. 31, 2018 |
1,080,693 | |||
| Net total of financial liabilities constituted |
167,230 | |||
| Asset realized |
(46,880 | ) | ||
| Payments from the Flag Tariff Centralizing Account (‘CCRBT’) |
(74,534 | ) | ||
| Updating – Selic rate |
20,906 | |||
|
|
|
|||
| Balance at Mar. 31, 2019 |
1,147,415 | |||
|
|
|
|||
The increase in the balance of CVA receivable was mainly the result of increased costs of electricity in 2018 – resulting in a higher difference between the actual expense and the amount allocated for this in the tariff calculation. This difference generates a financial asset to be reimbursed to the Company in the next tariff adjustment.
Payments from the Flag Tariff Centralizing Account
The ‘Flag Account’ (Conta Centralizadora de Recursos de Bandeiras Tarifárias – CCRBT or ‘Conta Bandeira’) manages the funds that are collected from captive customers of distribution concessions and permission holders operating in the national grid, and are paid, on behalf of the CDE, directly to the Flag Account. The resulting funds are passed through by the Wholesale Trading Chamber (CCEE) to distribution agents, based on the differences between (a) realized costs of thermal generation and exposure to short-term market prices and (b) the amounts covered by the tariff.
Revenue from transactions on the Wholesale Trading Exchange (CCEE)
Revenue from transactions in energy on the CCEE in 1Q19 was R$ 252,616, or 88.06% higher than in 1Q18 (R$ 134,327). The higher figure mainly reflects higher physical guarantee allocations, and higher Generation Scaling Factors (GSFs) in 1Q19 than in 1Q18, increasing the available excess supply – and this excess supply was valued at a higher Spot Price (PLD) than in 1Q18, contributing to the higher figure for revenue from transactions on the CCE.
| Period |
CCEE |
GSF | ||||||||
| Sub-market |
Average price R$/MWh |
|||||||||
| January |
Southeast/Center-West | 192.10 | 1.624 | |||||||
| February |
Southeast/Center-West | 443.66 | 1.484 | |||||||
| March |
Southeast/Center-West | 234.49 | 1.367 | |||||||
| Av. Barbacena 1200 Santo Agostinho 30190-131 Belo Horizonte, Minas Gerais, Brazil Tel.: +55 31 3506-5024 Fax +55 31 3506-5025
This text is a translation, provided for information only. The original text in Portuguese is the legally valid version. | ||||||||||
47
Revenue from supply of gas
Cemig reports revenue from supply of gas totaling R$ 596,278 in 1Q19, compared to R$ 428,071 in 1Q18 – 39.29% higher YoY. This is basically due to the higher volume of gas sold to the market of thermoelectric generating plants in 1Q19 than in 1Q18.
| Market (’000 m3/day) |
2014 | 2015 | 2016 | 2017 | 2018 | 1Q19 | ||||||||||||||||||
| Residential |
0.72 | 1.04 | 3.38 | 11.44 | 17.73 | 16.88 | ||||||||||||||||||
| Commercial |
23.15 | 22.42 | 24.68 | 32.67 | 39.37 | 37.87 | ||||||||||||||||||
| Industrial |
2,849.24 | 2,422.78 | 2,173.76 | 2,453.22 | 2,400.41 | 2,299.88 | ||||||||||||||||||
| Other expenses |
99.64 | 119.87 | 120.19 | 126.15 | 155.14 | 155.47 | ||||||||||||||||||
|
|
|
|
|
|
|
|
|
|
|
|
|
|||||||||||||
| Total market excluding thermal plants |
2,972.75 | 2,566.11 | 2,322.01 | 2,623.47 | 2,612.65 | 2,510.10 | ||||||||||||||||||
| Thermal generation |
1,223.99 | 1,309.13 | 591.52 | 990.89 | 414.04 | 992.56 | ||||||||||||||||||
|
|
|
|
|
|
|
|
|
|
|
|
|
|||||||||||||
| Total |
4,196.74 | 3,875.24 | 2,913.53 | 3,614.36 | 3,026.69 | 3,502.67 | ||||||||||||||||||
|
|
|
|
|
|
|
|
|
|
|
|
|
|||||||||||||
Supply of gas to the residential market began in March 2013. In December 2018, a total of 41,377 households were invoiced.
| Number of clients |
2014 | 2015 | 2016 | 2017 | 2018 | 1Q19 | ||||||||||||||||||
| Residential |
1,446 | 3,820 | 14,935 | 30,605 | 41,377 | 43,157 | ||||||||||||||||||
| Commercial |
177 | 218 | 394 | 591 | 756 | 792 | ||||||||||||||||||
| Industrial |
111 | 113 | 112 | 107 | 109 | 105 | ||||||||||||||||||
| Others |
88 | 62 | 49 | 50 | 57 | 58 | ||||||||||||||||||
| Thermal generation |
2 | 2 | 2 | 2 | 2 | 2 | ||||||||||||||||||
|
|
|
|
|
|
|
|
|
|
|
|
|
|||||||||||||
| Total |
1,824 | 4,215 | 15,492 | 31,355 | 42,301 | 44,114 | ||||||||||||||||||
|
|
|
|
|
|
|
|
|
|
|
|
|
|||||||||||||
Taxes and charges on Revenue
The total of these taxes and charges, reported as deductions from revenue, was R$ 3,141,524 in 1Q19 – or 15.75% more than in 1Q18 (R$ 2,713,992).
Consumer charges – the ‘Flag’ Tariff system
The ‘Flag’ Tariff bands are activated as a result of low levels of water in the system’s reservoirs – tariffs are temporarily increased due to scarcity of rain. The ‘red’ band has two levels – Level 1 and Level 2. Level 2 comes into effect when scarcity is more intense. Activation of the flag tariffs generates an impact on billing in the subsequent month.
Consumer charges resulting from the ‘Flag’ tariff system were higher in 1Q19, at R$ 111,156, than in 1Q18 (R$ 116,771) – or 90.45% lower year-on-year.
The lower figure is because no ‘red’ or ‘yellow’ flag tariffs were activated in first quarter 2019 – the entire quarter took place under the ‘green’ flag. By contrast, in December 2017, the ‘red’ tariff band was in force, at Level I, with effects on the amount billed in January 2018.
| The ‘Flag’ Tariff component – history | ||||||
| Dec. 2018 | Jan. 2019 | Feb. 2019 | Mar. 2019 | |||
| Green | Green | Green | Green | |||
| Dec. 2017 | Jan. 2018 | Feb. 2018 | Mar. 2018 | |||
| Red | Green | Green | Green | |||
| Av. Barbacena 1200 Santo Agostinho 30190-131 Belo Horizonte, Minas Gerais, Brazil Tel.: +55 31 3506-5024 Fax +55 31 3506-5025
This text is a translation, provided for information only. The original text in Portuguese is the legally valid version. | ||||||||||
48
Operational costs and expenses
Operational costs and expenses totaled R$ 4,750,116 in 1Q19, or 13.14% more than in 1Q18 (R$ 4,198,293). The following paragraphs comment on the main variations:
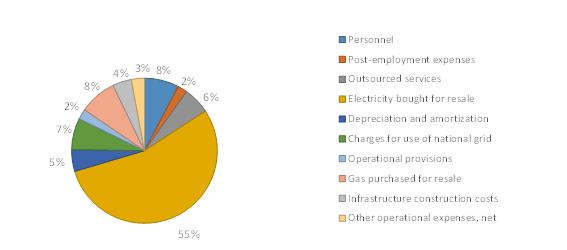
Personnel
The expense on personnel in 1Q19 was R$ 365,041, or 10.06% more than in 1Q18 (R$ 331,664).
The increase arises from: accounting of an expense of R$ 21,491 on the 2019 Programmed Voluntary Retirement Plan – corresponding to 155 employees joining the plan; from the 4.00% salary increase in effect from November 2018; and from the increase in the number of employees arising from the result of the latest public competition.
Number of employees
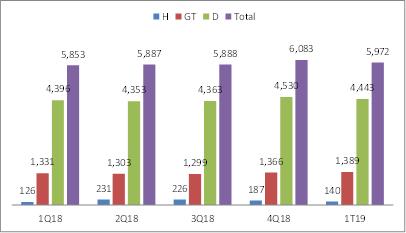
| Av. Barbacena 1200 Santo Agostinho 30190-131 Belo Horizonte, Minas Gerais, Brazil Tel.: +55 31 3506-5024 Fax +55 31 3506-5025
This text is a translation, provided for information only. The original text in Portuguese is the legally valid version. | ||||||||||
49
2019 Programmed Voluntary Retirement Plan
In March 2019, the Company approved reopening of the voluntary retirement plan (as the ‘2019 PDVP’), for applications made over the period April 1–10, 2019; and also changes to the requirements for qualification, but with the same financial advantages, which include: the payments specified by law for non-voluntary severance, including payment for the period of prior notice; and deposit of the 40% ‘penalty payment’ of the amount in the employee’s FGTS account, which is formally applicable by law only to non-justified dismissals; and the other payment, specified in the legislation.
Electricity purchased for resale
This expense in 1Q19 was 14.60% higher YoY, at R$ 2,594,181, which compares with R$ 2,263,693 in 1Q18. This arises mainly from the following items:
| ◾ | (i) Higher expenses on purchase of supply in the spot market: R$ 513,977 in 1Q19, compared to R$ 219,111 in 1Q18. This variation arises mainly from transactions in supply on the CCEE (Wholesale Training Exchange). The power supply deficit in January and February 2019, with total volume of 50,228 MWh – which made it necessary to buy supply on the spot market. In 1Q18, there was an excess of supply, of 223,166 MWh, resulting in sales on the CCEE, consequently reducing the net expense in that period. |
| ◾ | (ii) Expenses on supply from Itaipu 15.58% higher, at R$ 333,156 in 1Q19, compared to R$ 288,243 in 1Q18. This is mainly due to the higher exchange rate for the dollar in 1Q19 than 1Q18. |
This is a non-manageable cost: the difference between the amounts used as a reference for calculation of tariffs and the costs actually incurred is compensated for in the subsequent tariff adjustment.
| 1Q19 | 1Q18 | % | ||||||||||
| Supply from Itaipu Binacional |
333,156 | 288,243 | 15.58 | |||||||||
| Physical guarantee quota contracts |
178,931 | 171,384 | 4.40 | |||||||||
| Quotas for Angra I and II nuclear plants |
67,293 | 66,712 | 0.87 | |||||||||
| Spot market |
513,977 | 219,111 | 134.57 | |||||||||
| Proinfa Program |
95,308 | 79,848 | 19.36 | |||||||||
| ‘Bilateral’ contracts |
113,646 | 105,085 | 8.15 | |||||||||
| Electricity acquired in Regulated Market auctions |
710,792 | 723,513 | (1.76 | ) | ||||||||
| Acquired in Free Market |
831,814 | 823,936 | 0.96 | |||||||||
| Pasep and Cofins credits |
(250,736 | ) | (214,139 | ) | 17.09 | |||||||
|
|
|
|
|
|
|
|||||||
| 2,594,181 | 2,263,693 | 14.60 | ||||||||||
|
|
|
|
|
|
|
|||||||
Default
In 2019 the economy was marked by two main features: instability in the financial market, and continuation of the slow process of recovery in economic activity.
In spite of the GDP growth reported for 2018, we note that certain indices at the start of 2019 call for caution – such as increasing levels of unemployment, and reduction in levels of business confidence.
To be sure of overcoming the effects of an economic scenario that still appears to be unfavorable, and to combat the historic level of default, in 2019 Cemig is maintaining its high levels of efforts for collection from consumers that are in default. Some results have already been achieved. The level in 1Q19 was the same as in 2018. Since December 2016 there has been no significant increase in Cemig’s default percentages, showing that this situation is being held under control. In the residential consumer category – the largest proportion of the captive market, results in 2019 are showing a more optimistic outlook – with default 12% lower than in 1Q18. In view of this, we expect to see a fall in the total financial volume of default from now on.
| Av. Barbacena 1200 Santo Agostinho 30190-131 Belo Horizonte, Minas Gerais, Brazil Tel.: +55 31 3506-5024 Fax +55 31 3506-5025
This text is a translation, provided for information only. The original text in Portuguese is the legally valid version. | ||||||||||
50
Cemig uses various tools of communication and collection to prevent increase in default. These include contact by telephone and email, collection requests by text and by letter, negative posting on credit registers, collection through the courts and, principally, disconnection of supply. Aneel Resolution 414 allows supply to be cut off after 15 days from receipt of a notice by a defaulting consumer.
The company is continuing with a robust plan for consumer disconnections in 2019, under which it expects to carry out more than 1 million consumer disconnections – over the aggregate of all the types of consumer – in a year, for the second year running.
With more intense application of the tools for collection, and actual disconnection of past due consumers, the Company is even more confident that default indices will be reduced in the coming periods.

Gas bought for resale
In 1Q19 the Company recorded an expense of R$ 394,982 on acquisition of gas, 50.05% more than its comparable expense of R$ 263,233 in 1Q18. This is basically the result of the volume of gas sold being 19% higher (at 315,240 m³ in 1 Q19, compared to 264,115 m³ in 1Q18), and an increase of 37% in the cost of gas bought from Petrobras.
Post-retirement obligations
The impact of the Company’s post-retirement obligation on operating profit was an expense of R$ 100,909 in 1Q19 – which compares with an expense of R$ 83,271 in 1Q18. This is mainly the result of reduction in the discount rate used in the actuarial calculation – which increased the amount of the actuarial liabilities, and consequently the scale of the expense reported.
| Av. Barbacena 1200 Santo Agostinho 30190-131 Belo Horizonte, Minas Gerais, Brazil Tel.: +55 31 3506-5024 Fax +55 31 3506-5025
This text is a translation, provided for information only. The original text in Portuguese is the legally valid version. | ||||||||||
51
Share of profit (loss), net, of associates and joint ventures
The net loss from equity method calculation of gains in non-consolidated investees in 1Q19 was a gain of R$ 67,226, compared to a gain of R$ 56,874 in 2018. The losses recognized in 1Q18 were basically related to the investments in: (a) Renova, and (b) Santo Antônio Energia. No loss on the investment in Renova was recognized in 1Q19, since this had been written off in December 2018, due to that investees uncovered liabilities. Also, the negative equity method result from the investment in Santo Antônio Energia was 74.28% lower in 1Q19 than in 1Q18.
Financial revenue and expenses
Cemig reported net financial expenses in 1Q19 of R$ 101,560, which compares with net financial expenses of R$ 157,800 in 1Q18. The main factors are:
| ◾ | Higher gain on the hedge transactions contracted to protect the Eurobond issue: the gain in 1Q19 was R$ 152,311, compared to a gain of R$ 97,517 in 1Q18. The higher figure was the result of the dollar future curve moving upward, resulting in both the call spread and the asset becoming more valuable; and also due to the curve for the future DI interest rate (the liability side of the transaction) moving downward, contributing to an increase in fair value. |
| ◾ | Higher net result of monetary updating on the balances of CVA and Other financial components in tariff adjustments: net gain of R$ 20,906 in 1Q19, compared to net gain of R$ 447 in 1Q18, basically reflecting the higher balance of net assets in 1Q19 than in 1Q18. |
Ebitda
Cemig’s consolidated Ebitda in 1Q19 was 45.10% higher than in 1Q18. The higher figure basically portrays sales of power supply to final consumers 3.51% higher year-on-year, and sales of power supply on the CCEE (Wholesale Trading Exchange) 88.06% higher year-on-year. Ebitda margin in 1Q19 was 24.71%, compared to 20.41% in 1Q18.
| Ebitda |
1Q19 | 1Q18 | Change,% | |||||||||
| Net profit for the period |
797,239 | 464,595 | 71.60 | % | ||||||||
| + Income tax and Social Contribution tax |
331,489 | 171,617 | 93.16 | % | ||||||||
| + Net financial revenue (expenses) |
101,560 | 157,800 | (35.64 | %) | ||||||||
| + Depreciation and amortization |
230,896 | 212,991 | 8.41 | % | ||||||||
|
|
|
|
|
|
|
|||||||
| = Ebitda |
1,461,184 | 1,007,003 | 45.10 | % | ||||||||
|
|
|
|
|
|
|
|||||||
| Av. Barbacena 1200 Santo Agostinho 30190-131 Belo Horizonte, Minas Gerais, Brazil Tel.: +55 31 3506-5024 Fax +55 31 3506-5025
This text is a translation, provided for information only. The original text in Portuguese is the legally valid version. | ||||||||||
52
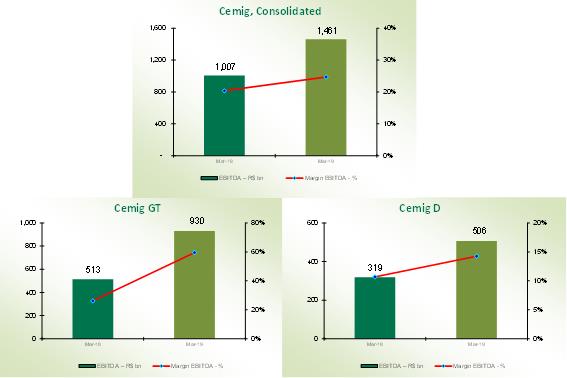
DEBT
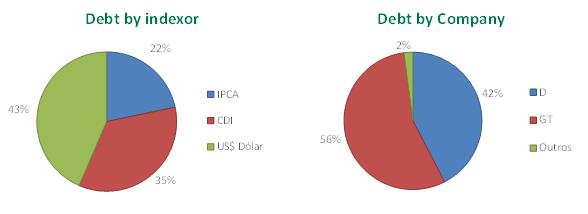
The Company’s total consolidated debt at March 31, 2019 was R$ 14,136,817. This is 4.30% lower than at December 31, 2018. In 1Q19 a total of R$ 769,148 was amortized, of which R$ 515,242 was debt of Cemig D.
| Av. Barbacena 1200 Santo Agostinho 30190-131 Belo Horizonte, Minas Gerais, Brazil Tel.: +55 31 3506-5024 Fax +55 31 3506-5025
This text is a translation, provided for information only. The original text in Portuguese is the legally valid version. | ||||||||||
53

| Mar. 31, 2019 | Dec. 31, 2018 | Change% | ||||||||||
| Cemig |
||||||||||||
| Total debt |
14,136,817 | 14,771,828 | (4.30 | ) | ||||||||
| Net debt |
12,748,293 | 13,068,790 | (2.45 | ) | ||||||||
| Cemig GT |
||||||||||||
| Total debt |
8,123,919 | 8,198,912 | (0.91 | ) | ||||||||
| Net debt |
7,580,835 | 7,713,870 | (1.72 | ) | ||||||||
| Cemig D |
||||||||||||
| Total debt |
5,712,282 | 6,263,408 | (8.80 | ) | ||||||||
| Net debt |
5,138,383 | 5,347,136 | (3.90 | ) | ||||||||
| Gasmig |
||||||||||||
| Total debt |
267,383 | 339,386 | (21.22 | ) | ||||||||
| Net debt |
102,663 | 230,626 | (55.49 | ) | ||||||||
| Av. Barbacena 1200 Santo Agostinho 30190-131 Belo Horizonte, Minas Gerais, Brazil Tel.: +55 31 3506-5024 Fax +55 31 3506-5025
This text is a translation, provided for information only. The original text in Portuguese is the legally valid version. | ||||||||||
54
Results by business segment
| INFORMATION BY SEGMENT ON MARCH 31, 2019 |
||||||||||||||||||||||||||||
| DESCRIPTION |
ELECTRICITY | GAS | OTHER(1) | ELIMINATIONS | TOTAL | |||||||||||||||||||||||
| GENERATION(1) | TRANSMISSION | DISTRIBUTION(1) | ||||||||||||||||||||||||||
| ASSETS OF THE SEGMENT |
14,813,536 | 3,893,771 | 36,627,133 | 1,873,628 | 2,525,195 | 480,364 | 60,213,627 | |||||||||||||||||||||
| INVESTMENT IN AFFILIATES AND JOINTLY-CONTROLLED ENTITIES |
4,088,270 | 1,197,190 | — | — | 16,344 | — | 5,301,804 | |||||||||||||||||||||
| ADDITIONS TO THE SEGMENT |
6,549 | — | 6,720 | — | — | — | 13,269 | |||||||||||||||||||||
| ADDITIONS TO FINANCIAL ASSETS |
— | 28,087 | 153,482 | 8,555 | — | — | 190,124 | |||||||||||||||||||||
| GOING CONCERN OPERATIONS |
||||||||||||||||||||||||||||
| NET REVENUE |
1,783,080 | 140,429 | 3,550,422 | 473,989 | 36,158 | (70,900 | ) | 5,913,178 | ||||||||||||||||||||
| COST OF ELECTRICITY AND GAS |
||||||||||||||||||||||||||||
| Electricity purchased for resale |
(782,919 | ) | — | (1,828,301 | ) | — | — | 17,039 | (2,594,181 | ) | ||||||||||||||||||
| Charges for use of the national grid |
(46,085 | ) | — | (338,942 | ) | — | — | 51,231 | (333,796 | ) | ||||||||||||||||||
| Gas bought for resale |
— | — | — | (394,982 | ) | — | — | (394,982 | ) | |||||||||||||||||||
|
|
|
|
|
|
|
|
|
|
|
|
|
|
|
|||||||||||||||
| Total |
(829,004 | ) | — | (2,167,243 | ) | (394,982 | ) | — | 68,270 | (3,322,959 | ) | |||||||||||||||||
|
|
|
|
|
|
|
|
|
|
|
|
|
|
|
|||||||||||||||
| OPERATING COSTS AND EXPENSES |
||||||||||||||||||||||||||||
| Personnel |
(59,150 | ) | (31,969 | ) | (247,659 | ) | (11,077 | ) | (15,186 | ) | — | (365,041 | ) | |||||||||||||||
| Employees’ and managers’ profit shares |
(8,828 | ) | (6,461 | ) | (46,261 | ) | — | (4,487 | ) | — | (66,037 | ) | ||||||||||||||||
| Post-retirement obligations |
(12,627 | ) | (9,041 | ) | (68,291 | ) | — | (10,950 | ) | — | (100,909 | ) | ||||||||||||||||
| Materials |
(4,678 | ) | (833 | ) | (14,585 | ) | (388 | ) | (10 | ) | 4 | (20,490 | ) | |||||||||||||||
| Outsourced services |
(26,483 | ) | (8,130 | ) | (239,462 | ) | (4,422 | ) | (6,917 | ) | 1,686 | (283,728 | ) | |||||||||||||||
| Depreciation and amortization |
(44,406 | ) | — | (148,849 | ) | (18,857 | ) | (525 | ) | — | (212,637 | ) | ||||||||||||||||
| Operational provisions (reversals) |
(2,716 | ) | — | (13,116 | ) | — | (2,427 | ) | — | (18,259 | ) | |||||||||||||||||
| Construction costs |
(25,781 | ) | (4,330 | ) | (59,136 | ) | (1,746 | ) | (18,013 | ) | — | (109,006 | ) | |||||||||||||||
| Other operational expenses net |
— | (28,087 | ) | (160,201 | ) | (10,830 | ) | — | — | (199,118 | ) | |||||||||||||||||
| Total cost of operation |
(2,940 | ) | (4,200 | ) | (41,692 | ) | (2,700 | ) | (1,340 | ) | 940 | (51,932 | ) | |||||||||||||||
|
|
|
|
|
|
|
|
|
|
|
|
|
|
|
|||||||||||||||
| OPERATING COSTS AND EXPENSES |
(187,609 | ) | (93,051 | ) | (1,039,252 | ) | (50,020 | ) | (59,855 | ) | 2,630 | (1,427,157 | ) | |||||||||||||||
|
|
|
|
|
|
|
|
|
|
|
|
|
|
|
|||||||||||||||
| OPERATING COSTS AND EXPENSES |
(1,016,613 | ) | (93,051 | ) | (3,206,495 | ) | (445,002 | ) | (59,855 | ) | 70,900 | (4,750,116 | ) | |||||||||||||||
|
|
|
|
|
|
|
|
|
|
|
|
|
|
|
|||||||||||||||
| Share of profit (loss) in associates and joint ventures |
36,679 | 34,311 | — | — | (3,764 | ) | — | 67,226 | ||||||||||||||||||||
|
|
|
|
|
|
|
|
|
|
|
|
|
|
|
|||||||||||||||
| OPER. PROFIT BEFORE FIN. REV. (EXP.) AND TAXES |
803,146 | 81,689 | 343,927 | 28,987 | (27,461 | ) | — | 1,230,288 | ||||||||||||||||||||
|
|
|
|
|
|
|
|
|
|
|
|
|
|
|
|||||||||||||||
| Financial revenues |
181,319 | 14,598 | 119,282 | 30,410 | 4,909 | — | 350,518 | |||||||||||||||||||||
| Financial expenses |
(236,037 | ) | (26,066 | ) | (173,856 | ) | (6,431 | ) | (9,688 | ) | — | (452,078 | ) | |||||||||||||||
|
|
|
|
|
|
|
|
|
|
|
|
|
|
|
|||||||||||||||
| PRE-TAX PROFIT |
748,428 | 70,221 | 289,353 | 52,966 | (32,240 | ) | — | 1,128,728 | ||||||||||||||||||||
|
|
|
|
|
|
|
|
|
|
|
|
|
|
|
|||||||||||||||
| Income tax and Social Contribution tax |
(219,251 | ) | (10,765 | ) | (100,999 | ) | (18,824 | ) | 18,350 | — | (331,489 | ) | ||||||||||||||||
|
|
|
|
|
|
|
|
|
|
|
|
|
|
|
|||||||||||||||
| RESULT OF GOING CONCERN OPERATIONS |
529,177 | 59,456 | 188,354 | 34,142 | (13,890 | ) | — | 797,239 | ||||||||||||||||||||
|
|
|
|
|
|
|
|
|
|
|
|
|
|
|
|||||||||||||||
| Interest of the controlling shareholders |
529,177 | 59,456 | 188,354 | 33,979 | (13,890 | ) | — | 797,076 | ||||||||||||||||||||
| Interest of non-controlling shareholder |
— | — | — | 163 | — | — | 163 | |||||||||||||||||||||
|
|
|
|
|
|
|
|
|
|
|
|
|
|
|
|||||||||||||||
| 529,177 | 59,456 | 188,354 | 34,142 | (13,890 | ) | — | 797,239 | |||||||||||||||||||||
|
|
|
|
|
|
|
|
|
|
|
|
|
|
|
|||||||||||||||
| Av. Barbacena 1200 Santo Agostinho 30190-131 Belo Horizonte, Minas Gerais, Brazil Tel.: +55 31 3506-5024 Fax +55 31 3506-5025
This text is a translation, provided for information only. The original text in Portuguese is the legally valid version. | ||||||||||
55
APPENDICES
CAPEX
| R$ ’000 |
Mar. 31, 2019 Realized |
2019 Planned |
||||||
| GENERATION |
||||||||
| Investment program |
21,574 | 76,245 | ||||||
| Capital contributions |
5,622 | 28,621 | ||||||
| Aliança Norte |
||||||||
| SPC – Guanhães |
— | 953 | ||||||
| SPC – Amazônia Energia Participações (Belo Monte) |
15,952 | 19,766 | ||||||
| Itaocara hydroelectric plant |
— | 282 | ||||||
| Baguari Energia |
— | 26,583 | ||||||
| — | 40 | |||||||
| TRANSMISSION |
||||||||
| Investment program |
28,282 | 263,352 | ||||||
| 28,282 | 263,352 | |||||||
| Cemig D |
||||||||
| Investment program |
167,573 | 1,078,417 | ||||||
| 167,573 | 1,078,417 | |||||||
| Holding company |
||||||||
| Infrastructure |
10,391 | 97,787 | ||||||
| Capital contributions |
— | 240 | ||||||
| Axxiom |
||||||||
| Cemig GD (Distributed generation) |
— | 10,000 | ||||||
| Cemig Overseas |
10,337 | 60,337 | ||||||
| Gas consortium |
35 | 46 | ||||||
| Efficientia – Distributed generation |
19 | 6 | ||||||
| — | 25,000 | |||||||
| Acquisitions – Centroeste |
||||||||
| — | 2,158 | |||||||
| TOTAL |
227,820 | 1,515,801 | ||||||
| Av. Barbacena 1200 Santo Agostinho 30190-131 Belo Horizonte, Minas Gerais, Brazil Tel.: +55 31 3506-5024 Fax +55 31 3506-5025
This text is a translation, provided for information only. The original text in Portuguese is the legally valid version. | ||||||||||
56
Sources and uses of power – billed market
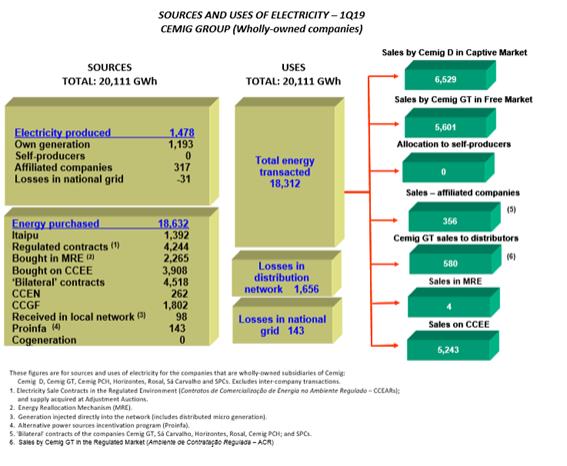
| Av. Barbacena 1200 Santo Agostinho 30190-131 Belo Horizonte, Minas Gerais, Brazil Tel.: +55 31 3506-5024 Fax +55 31 3506-5025
This text is a translation, provided for information only. The original text in Portuguese is the legally valid version. | ||||||||||
57

| Av. Barbacena 1200 Santo Agostinho 30190-131 Belo Horizonte, Minas Gerais, Brazil Tel.: +55 31 3506-5024 Fax +55 31 3506-5025
This text is a translation, provided for information only. The original text in Portuguese is the legally valid version. | ||||||||||
58
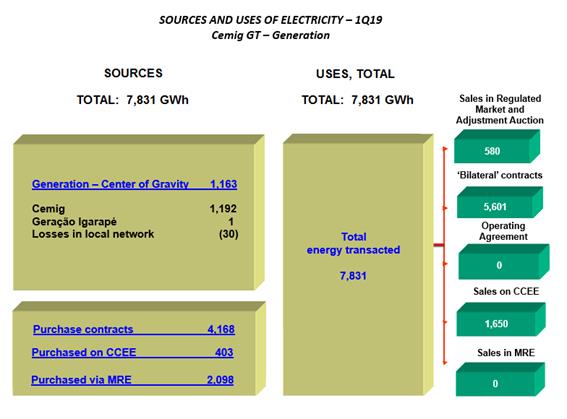
| Av. Barbacena 1200 Santo Agostinho 30190-131 Belo Horizonte, Minas Gerais, Brazil Tel.: +55 31 3506-5024 Fax +55 31 3506-5025
This text is a translation, provided for information only. The original text in Portuguese is the legally valid version. | ||||||||||
59
| Generation Power Plant |
Cemig Group Company | Type of Power Plant |
CEMIG´s Stake |
Installed Capacity (MW) |
Assured Power Level (avg. MW) |
Expiration of Concession | ||||||||||||
| Emborcação |
CEMIG GT | UHE | 100.00 | % | 1,192.00 | 499.70 | 23-jul-25 | |||||||||||
| Belo Monte |
Norte | UHE | 12.91 | % | 976.52 | 589.93 | 26-ago-45 | |||||||||||
| Santo Antônio |
SAE | UHE | 18.13 | % | 646.90 | 439.45 | 12-jun-43 | |||||||||||
| Nova Ponte |
CEMIG GT | UHE | 100.00 | % | 510.00 | 270.10 | 23-jul-25 | |||||||||||
| Irapé |
CEMIG GT | UHE | 100.00 | % | 399.00 | 207.90 | 28-fev-35 | |||||||||||
| Três Marias |
CEMIG G. TRÊS MARIAS | UHE | 100.00 | % | 396.00 | 71.70 | 4-jan-46 | |||||||||||
| Nilo Peçanha |
Light Energia | PCH | 48.86 | % | 185.69 | 163.05 | 4-jun-26 | |||||||||||
| Aimorés |
ALIANÇA | UHE | 45.00 | % | 148.50 | 81.86 | 20-dez-35 | |||||||||||
| Igarapé |
CEMIG GT | UTE | 100.00 | % | 131.00 | 71.30 | 13-ago-24 | |||||||||||
| Salto Grande |
CEMIG G. SALTO GRANDE | UHE | 100.00 | % | 102.00 | 22.50 | 4-jan-46 | |||||||||||
| Amador Aguiar I |
ALIANÇA | UHE | 39.32 | % | 94.36 | 60.70 | 29-ago-36 | |||||||||||
| Ilha dos Pombos |
Light Energia | PCH | 48.86 | % | 91.46 | 53.41 | 4-jun-26 | |||||||||||
| Queimado |
CEMIG GT | UHE | 82.50 | % | 86.63 | 56.02 | 2-jan-33 | |||||||||||
| Amador Aguiar II |
ALIANÇA | UHE | 39.32 | % | 82.56 | 51.78 | 29-ago-36 | |||||||||||
| Funil |
ALIANÇA | UHE | 45.00 | % | 81.00 | 38.07 | 20-dez-35 | |||||||||||
| Sá Carvalho |
Sá Carvalho S.A | UHE | 100.00 | % | 78.00 | 56.10 | 1-dez-24 | |||||||||||
| Fontes Nova |
Light Energia | PCH | 48.86 | % | 64.49 | 48.28 | 4-jun-26 | |||||||||||
| Rosal |
Rosal Energia S. A | UHE | 100.00 | % | 55.00 | 29.10 | 8-mai-32 | |||||||||||
| Itutinga |
CEMIG G. ITUTINGA | UHE | 100.00 | % | 52.00 | 8.40 | 4-jan-46 | |||||||||||
| Igarapava |
ALIANÇA | UHE | 23.69 | % | 49.75 | 31.80 | 30-dez-28 | |||||||||||
| Pereira Passos |
Light Energia | PCH | 48.86 | % | 48.81 | 23.70 | 4-jun-26 | |||||||||||
| Baguari |
BAGUARI ENERGIA | UHE | 34.00 | % | 47.60 | 28.80 | 15-ago-41 | |||||||||||
| Camargos |
CEMIG G. CAMARGOS | UHE | 100.00 | % | 46.00 | 6.30 | 4-jan-46 | |||||||||||
| Volta do Rio |
CEMIG GT | EOL | 100.00 | % | 42.00 | 18.41 | 26-dez-31 | |||||||||||
| Retiro Baixo |
Retiro Baixo Energética SA | UHE | 49.90 | % | 40.92 | 18.26 | 25-ago-41 | |||||||||||
| Porto Estrela |
ALIANÇA | UHE | 30.00 | % | 33.60 | 18.54 | 10-jul-32 | |||||||||||
| Praias de Parajuru |
CEMIG GT | EOL | 100.00 | % | 28.80 | 8.39 | 24-set-32 | |||||||||||
| Santa Branca |
Light Energia | PCH | 48.86 | % | 27.39 | 14.85 | 4-jun-26 | |||||||||||
| Pai Joaquim |
CEMIG PCH S.A | PCH | 100.00 | % | 23.00 | 13.91 | 1-abr-32 | |||||||||||
| Piau |
CEMIG G. SUL | PCH | 100.00 | % | 18.01 | 4.06 | 4-jan-46 | |||||||||||
| Gafanhoto |
CEMIG G. OESTE | PCH | 100.00 | % | 14.00 | 2.00 | 4-jan-46 | |||||||||||
| Cachoeirão |
Hidrelétrica Cachoeirão | PCH | 49.00 | % | 13.23 | 8.02 | 25-jul-30 | |||||||||||
| Dores de Guanhães |
Guahães Energia | PCH | 73.92 | % | 10.35 | 5.28 | 22-nov-32 | |||||||||||
| Outras |
— | — | — | 241.15 | 113.17 | — | ||||||||||||
| Total |
— | 6,057.72 | 3,134.84 | |||||||||||||||
| Av. Barbacena 1200 Santo Agostinho 30190-131 Belo Horizonte, Minas Gerais, Brazil Tel.: +55 31 3506-5024 Fax +55 31 3506-5025
This text is a translation, provided for information only. The original text in Portuguese is the legally valid version. | ||||||||||
60
RAP (Permitted Annual Transmission Revenue) — 2018-2019 cycle
| RAP (Permitted Annual Revenue—Transmission )—2018/2019 cycle |
||||||||||||
| Annual Permitted Revenue (RAP) |
RAP | % Cemig | Cemig | |||||||||
| Cemig GT |
636,554,792 | 100.00 | % | 636,554,792 | ||||||||
| Cemig GT |
613,825,685 | 100.00 | % | 613,825,685 | ||||||||
| Cemig Itajuba |
22,729,108 | 100.00 | % | 22,729,108 | ||||||||
| Centroeste |
18,140,778 | 51.00 | % | 9,251,797 | ||||||||
| Taesa |
2,603,803,047 | 21.68 | % | 564,504,501 | ||||||||
| NOVATRANS |
413,508,982 | 89,648,747 | ||||||||||
| TSN |
279,621,010 | 60,621,835 | ||||||||||
| ETEO |
91,908,539 | 19,925,771 | ||||||||||
| ETAU |
25,248,700 | 5,473,918 | ||||||||||
| PATESA |
26,074,447 | 5,652,940 | ||||||||||
| GTESA |
5,821,869 | 1,262,181 | ||||||||||
| MUNIRAH |
38,039,315 | 8,246,924 | ||||||||||
| BRASNORTE |
10,222,969 | 2,216,340 | ||||||||||
| NTE |
125,209,896 | 27,145,505 | ||||||||||
| STE |
85,255,564 | 18,483,406 | ||||||||||
| ATE I |
155,388,531 | 33,688,233 | ||||||||||
| ATE II |
240,249,968 | 52,086,193 | ||||||||||
| ATE III |
119,808,219 | 25,974,422 | ||||||||||
| EATE |
113,603,471 | 24,629,232 | ||||||||||
| ETEP |
25,613,916 | 5,553,097 | ||||||||||
| ENTE |
117,370,143 | 25,445,847 | ||||||||||
| ECTE |
9,417,220 | 2,041,653 | ||||||||||
| ERTE |
26,343,256 | 5,711,218 | ||||||||||
| STC |
18,095,274 | 3,923,055 | ||||||||||
| Lumitrans |
11,114,590 | 2,409,643 | ||||||||||
| EBTE |
35,751,304 | 7,750,883 | ||||||||||
| ESDE |
6,735,387 | 1,460,232 | ||||||||||
| ETSE |
3,828,599 | 830,040 | ||||||||||
| São Gotardo |
5,175,272 | 1,121,999 | ||||||||||
| Transleste |
12,762,885 | 2,766,994 | ||||||||||
| Transirapé |
10,187,862 | 2,208,728 | ||||||||||
| Transudeste |
7,646,872 | 1,657,842 | ||||||||||
| Mariana |
14,678,343 | 3,182,265 | ||||||||||
| Miracema |
62,138,421 | 13,471,610 | ||||||||||
| Aimores |
37,920,467 | 8,221,157 | ||||||||||
| Paraguaçu |
56,602,538 | 12,271,430 | ||||||||||
| ESTE |
53,611,420 | 11,622,956 | ||||||||||
| Janaúba |
185,421,948 | 40,199,478 | ||||||||||
| ERB1 |
140,457,477 | 30,451,181 | ||||||||||
| EDTE |
32,968,372 | 7,147,543 | ||||||||||
| Light |
9,728,156 | 48.86 | % | 4,753,177 | ||||||||
| RAP TOTAL CEMIG |
1,215,064,267 | |||||||||||
| Av. Barbacena 1200 Santo Agostinho 30190-131 Belo Horizonte, Minas Gerais, Brazil Tel.: +55 31 3506-5024 Fax +55 31 3506-5025
This text is a translation, provided for information only. The original text in Portuguese is the legally valid version. | ||||||||||
61
Tables
Cemig D
| CEMIG D Market |
||||||||||||||||
| (GWh) | GW | |||||||||||||||
| Quarter |
Captive Consumers | TUSD ENERGY(1) | T.E.D(2) | TUSD PICK(3) | ||||||||||||
| 1Q17 |
6,249 | 4,274 | 10,523 | 30 | ||||||||||||
| 2Q17 |
6,314 | 4,287 | 10,601 | 30 | ||||||||||||
| 3Q17 |
6,232 | 4,586 | 10,817 | 31 | ||||||||||||
| 4Q18 |
6,259 | 4,591 | 10,850 | 31 | ||||||||||||
| 1Q18 |
6,213 | 4,637 | 10,850 | 31 | ||||||||||||
| 2Q18 |
6,343 | 4,873 | 11,216 | 30 | ||||||||||||
| 3Q18 |
6,309 | 4,870 | 11,179 | 30 | ||||||||||||
| 4Q18 |
6,406 | 4,906 | 11,313 | 31 | ||||||||||||
| 1Q19 |
6,529 | 4,760 | 11,289 | 33 | ||||||||||||
| (1) | Refers to the quantity of electricity for calculation of the regulatory charges charged to free consumer clients (“Portion A”) |
| (2) | Total electricity distributed |
| (3) | Sum of the demand on which the TUSD is invoiced, according to demand contracted (“Portion B”). |
| Operating Revenues (R$ million) |
1Q19 | 4Q18 | 1Q18 | QoQ | YoY | |||||||||||||||
| Sales to end consumers |
4,890 | 4,868 | 3,835 | 0.45% | 27.51% | |||||||||||||||
| Revenue from Use of Distribution Systems (the TUSD charge) |
636 | 629 | 380 | 1.11% | 67.37% | |||||||||||||||
| CVA and Other financial components in tariff adjustment |
120 | 190 | 441 | -36.84% | -72.79% | |||||||||||||||
| Construction revenue |
160 | 213 | 170 | -24.88% | -5.88% | |||||||||||||||
| Others |
302 | 367 | 360 | -17.71% | -16.11% | |||||||||||||||
| Subtotal |
6,108 | 6,267 | 5,186 | -2.54% | 17.78% | |||||||||||||||
| Deductions |
2,558 | 2,954 | 2,203 | -13.41% | 16.11% | |||||||||||||||
| Net Revenues |
3,550 | 3,313 | 2,983 | 7.15% | 19.01% | |||||||||||||||
| Operating Expenses (R$million) |
1Q19 | 4Q18 | 1Q18 | QoQ | Y oY | |||||||||||||||
| Personnel |
248 | 295 | 226 | -15.93% | 9.73% | |||||||||||||||
| Employees’ and managers’ profit sharing |
46 | 39 | 14 | 17.95% | 228.57% | |||||||||||||||
| Forluz—Post-retirement obligations |
68 | 58 | 55 | 17.24% | 23.64% | |||||||||||||||
| Materials |
15 | 19 | 12 | -21.05% | 25.00% | |||||||||||||||
| Outsourced services |
239 | 261 | 199 | -8.43% | 20.10% | |||||||||||||||
| Amortization |
162 | 155 | 145 | 4.52% | 11.72% | |||||||||||||||
| Operating provisions |
59 | 81 | 85 | -27.16% | -30.59% | |||||||||||||||
| Charges for Use of Basic Transmission Network |
339 | 344 | 371 | -1.45% | -8.63% | |||||||||||||||
| Energy purchased for resale |
1,828 | 1,541 | 1,485 | 18.62% | 23.10% | |||||||||||||||
| Construction Cost |
160 | 213 | 170 | -24.88% | -5.88% | |||||||||||||||
| Other Expenses |
42 | 78 | 47 | -46.15% | -10.64% | |||||||||||||||
| Total |
3,206 | 3,084 | 2,809 | 3.96% | 14.13% | |||||||||||||||
| Statement of Results (R$ million) |
1Q19 | 4Q18 | 1Q18 | QoQ | Y oY | |||||||||||||||
| Net Revenue |
3,550 | 3,313 | 2,983 | 7.15% | 19.01% | |||||||||||||||
| Operating Expenses |
3,206 | 3,084 | 2,809 | 3.96% | 14.13% | |||||||||||||||
| EBIT |
344 | 229 | 174 | 50.22% | 97.70% | |||||||||||||||
| EBITDA |
506 | 384 | 319 | 31.77% | 58.62% | |||||||||||||||
| Financial Result |
-55 | 4 | -70 | — | -21.43% | |||||||||||||||
| Provision for Income Taxes, Social Cont & Deferred Income Tax |
-101 | -44 | -38 | 129.55% | 165.79% | |||||||||||||||
| Net Income |
188 | 189 | 66 | -0.53% | 184.85% | |||||||||||||||
| Av. Barbacena 1200 Santo Agostinho 30190-131 Belo Horizonte, Minas Gerais, Brazil Tel.: +55 31 3506-5024 Fax +55 31 3506-5025
This text is a translation, provided for information only. The original text in Portuguese is the legally valid version. | ||||||||||
62
Cemig GT
| Operating Revenues |
1Q19 | 4Q18 | 1Q18 | QoQ | YoY | |||||||||||||||
| Sales to end consumers |
953 | 1,015 | 886 | -6.1% | 7.6% | |||||||||||||||
| Supply |
834 | 741 | 679 | 12.6% | 22.8% | |||||||||||||||
| Revenues from Trans. Network |
163 | 146 | 143 | 11.6% | 14.0% | |||||||||||||||
| Gain on monetary updating of Concession Grant Fee |
81 | 75 | 82 | 8.0% | -1.2% | |||||||||||||||
| Transactions in the CCEE |
259 | 17 | 122 | 1423.5% | 112.3% | |||||||||||||||
| Construction revenue |
28 | 83 | 1 | -66.3% | 2700.0% | |||||||||||||||
| Transmission indemnity revenue |
32 | 42 | 50 | -23.8% | -36.0% | |||||||||||||||
| Generation indemnity revenue |
— | -27 | 17 | — | — | |||||||||||||||
| Others |
54 | 72 | -21 | -25.0% | -357.1% | |||||||||||||||
| Subtotal |
2,404 | 2,164 | 1,959 | 11.1% | 22.7% | |||||||||||||||
| Deductions |
449 | 411 | 397 | 9.2% | 13.1% | |||||||||||||||
| Net Revenues |
1,955 | 1,753 | 1,562 | 11.5% | 25.2% | |||||||||||||||
| Operating Expenses |
1Q19 | 4Q18 | 1Q18 | QoQ | YoY | |||||||||||||||
| Personnel |
91 | 93 | 80 | -2.2% | 13.8% | |||||||||||||||
| Employees’ and managers’ profit sharing |
15 | 13 | 4 | 15.4% | 275.0% | |||||||||||||||
| Forluz— Post-retirement obligations |
21 | 18 | 18 | 16.7% | 16.7% | |||||||||||||||
| Materials |
5 | 10 | 2 | -50.0% | 150.0% | |||||||||||||||
| Outsourced services |
34 | 51 | 26 | -33.3% | 30.8% | |||||||||||||||
| Depreciation and Amortization |
47 | 39 | 36 | 20.5% | 30.6% | |||||||||||||||
| Operating provisions |
30 | 39 | 9 | -23.1% | 233.3% | |||||||||||||||
| Charges for Use of Basic Transmission Network |
46 | 45 | 70 | 2.2% | -34.3% | |||||||||||||||
| Energy purchased for resale |
783 | 987 | 796 | -20.7% | -1.6% | |||||||||||||||
| Construction Cost |
28 | 83 | 1 | -66.3% | 2700.0% | |||||||||||||||
| Other Expenses |
9 | 9 | 13 | — | -30.8% | |||||||||||||||
| Total |
1,109 | 1,387 | 1,055 | -20.0% | 5.1% | |||||||||||||||
| Statement of Results |
1Q19 | 4Q18 | 1Q18 | QoQ | YoY | |||||||||||||||
| Net Revenue |
1955 | 1,753 | 1562 | 11.5% | 25.2% | |||||||||||||||
| Operating Expenses |
1109 | 1,387 | 1055 | -20.0% | 5.1% | |||||||||||||||
| EBIT |
846 | 366 | 507 | 131.1% | 66.9% | |||||||||||||||
| Equity gain in subsidiaries |
37 | -101 | -31 | -136.6% | -219.4% | |||||||||||||||
| Restatement of prior equity holding in the subsidiaries acquired |
— | 80 | — | — | — | |||||||||||||||
| Adjustment for impairment of Investments |
— | -127 | — | — | — | |||||||||||||||
| EBITDA |
930 | 257 | 512 | 261.9% | 81.6% | |||||||||||||||
| Financial Result |
-65 | 669 | -106 | -109.7% | -38.7% | |||||||||||||||
| Provision for Income Taxes, Social Cont & Deferred Income Tax |
-234 | -301 | -123 | -22.3% | 90.2% | |||||||||||||||
| Net Income |
584 | 633 | 247 | -7.7% | 136.4% | |||||||||||||||
| Av. Barbacena 1200 Santo Agostinho 30190-131 Belo Horizonte, Minas Gerais, Brazil Tel.: +55 31 3506-5024 Fax +55 31 3506-5025
This text is a translation, provided for information only. The original text in Portuguese is the legally valid version. | ||||||||||
63
Cemig
| Energy Sales (Consolidated)(GWh) |
1Q19 | 4Q18 | 1Q18 | QoQ | YoY | |||||||||||||||
| Residential |
2,744 | 2,618 | 2,593 | 4.81% | 5.82% | |||||||||||||||
| Industrial |
3,872 | 4,554 | 4,028 | -14.98% | -3.87% | |||||||||||||||
| Commercial |
2,279 | 2,185 | 2,043 | 4.30% | 11.55% | |||||||||||||||
| Rural |
860 | 837 | 766 | 2.75% | 12.27% | |||||||||||||||
| Others |
916 | 916 | 879 | — | 4.21% | |||||||||||||||
| Subtotal |
10,671 | 11,110 | 10,309 | -3.95% | 3.51% | |||||||||||||||
| Own Consumption |
10 | 8 | 12 | 25.00% | -16.67% | |||||||||||||||
| Supply |
3,077 | 3,223 | 2,633 | -4.53% | 16.86% | |||||||||||||||
| TOTAL |
13,758 | 14,341 | 12,954 | -4.07% | 6.21% | |||||||||||||||
| Energy Sales |
1Q19 | 4Q18 | 1Q18 | QoQ | YoY | |||||||||||||||
| Residential |
2,458 | 2,390 | 1,918 | 2.85% | 28.15% | |||||||||||||||
| Industrial |
1,140 | 1,304 | 1,105 | -12.58% | 3.17% | |||||||||||||||
| Commercial |
1,339 | 1,302 | 1,069 | 2.84% | 25.26% | |||||||||||||||
| Rural |
457 | 467 | 343 | -2.14% | 33.24% | |||||||||||||||
| Others |
472 | 509 | 379 | -7.27% | 24.54% | |||||||||||||||
| Electricity sold to final consumers |
5,866 | 5,972 | 4,814 | -1.77% | 21.85% | |||||||||||||||
| Unbilled Supply, Net |
-82 | -16 | -118 | 412.50% | -30.51% | |||||||||||||||
| Supply |
817 | 749 | 702 | 9.08% | 16.38% | |||||||||||||||
| TOTAL |
6,601 | 6,705 | 5,398 | -1.55% | 22.29% | |||||||||||||||
| Operating Revenues |
1Q19 | 4Q18 | 1Q18 | QoQ | YoY | |||||||||||||||
| Sales to end consumers |
5,841 | 5,887 | 4,733 | -0.78% | 23.41% | |||||||||||||||
| TUSD |
630 | 625 | 374 | 0.80% | 68.45% | |||||||||||||||
| CVA and Other financial components in tariff adjustment |
120 | 190 | 441 | -36.84% | -72.79% | |||||||||||||||
| Transmission concession revenue |
117 | 101 | 101 | 15.84% | 15.84% | |||||||||||||||
| Transmission Indemnity Revenue |
32 | 42 | 49 | -23.81% | -34.69% | |||||||||||||||
| Generation Indemnity Revenue |
— | -27 | 17 | — | — | |||||||||||||||
| Gain on monetary updating of Concession Grant Fee |
80 | 75 | 81 | 6.67% | -1.23% | |||||||||||||||
| Transactions in the CCEE |
253 | 28 | 134 | 803.57% | 88.81% | |||||||||||||||
| Supply |
817 | 750 | 701 | 8.93% | 16.55% | |||||||||||||||
| Gas supply |
596 | 543 | 428 | 9.76% | 39.25% | |||||||||||||||
| Construction revenue |
199 | 306 | 178 | -34.97% | 11.80% | |||||||||||||||
| Others |
369 | 447 | 412 | -17.45% | -10.44% | |||||||||||||||
| Subtotal |
9,054 | 8,967 | 7,649 | 0.97% | 18.37% | |||||||||||||||
| Deductions |
3,141 | 3,495 | 2,714 | -10.13% | 15.73% | |||||||||||||||
| Net Revenues |
5,913 | 5,472 | 4,935 | 8.06% | 19.82% | |||||||||||||||
| Operating Expenses |
1Q19 | 4Q18 | 1Q18 | QoQ | YoY | |||||||||||||||
| Personnel |
365 | 422 | 332 | -13.43% | 9.94% | |||||||||||||||
| Employees’ and managers’ profit sharing |
66 | 54 | 20 | 21.82% | 230.00% | |||||||||||||||
| Forluz—Post-Retirement Employee Benefits |
101 | 87 | 83 | 16.53% | 21.69% | |||||||||||||||
| Materials |
20 | 30 | 15 | -32.39% | 33.33% | |||||||||||||||
| Outsourced services |
284 | 334 | 236 | -15.01% | 20.34% | |||||||||||||||
| Energy purchased for resale |
2,594 | 2,508 | 2,264 | 3.43% | 14.58% | |||||||||||||||
| Depreciation and Amortization |
231 | 216 | 213 | 7.00% | 8.45% | |||||||||||||||
| Operating Provisions |
109 | 65 | 133 | 67.99% | -18.05% | |||||||||||||||
| Charges for use of the national grid |
334 | 338 | 393 | -1.21% | -15.01% | |||||||||||||||
| Gas bought for resale |
395 | 340 | 263 | 16.14% | 50.19% | |||||||||||||||
| Construction costs |
199 | 307 | 181 | -35.14% | 9.94% | |||||||||||||||
| Other Expenses |
52 | 140 | 66 | -62.82% | -21.21% | |||||||||||||||
| Total |
4,750 | 4,840 | 4,199 | -1.86% | 13.12% | |||||||||||||||
| Av. Barbacena 1200 Santo Agostinho 30190-131 Belo Horizonte, Minas Gerais, Brazil Tel.: +55 31 3506-5024 Fax +55 31 3506-5025
This text is a translation, provided for information only. The original text in Portuguese is the legally valid version. | ||||||||||
64
| Financial Result Breakdown |
1Q19 | 4Q18 | 1Q18 | QoQ | YoY | |||||||||||||||
| FINANCE INCOME |
||||||||||||||||||||
| Income from cash investments |
25 | 35 | 24 | -28.57% | 4.17% | |||||||||||||||
| Arrears fees on sale of energy |
87 | 92 | 76 | -5.43% | 14.47% | |||||||||||||||
| Monetary variations—CVA |
21 | 27 | — | -22.22% | ||||||||||||||||
| Monetary updating on Court escrow deposits |
7 | 2 | 6 | 250.00% | 16.67% | |||||||||||||||
| Pasep and Cofins charged on finance income |
-9 | -34 | -9 | -73.53% | — | |||||||||||||||
| Gain on Financial instruments—Swap |
152 | 570 | 98 | -73.33% | 55.10% | |||||||||||||||
| Financial update obtained in the arbitration process |
— | 77 | — | |||||||||||||||||
| Liabilities with related parties |
23 | 56 | — | -58.93% | ||||||||||||||||
| Others |
45 | 30 | 47 | 50.00% | -4.26% | |||||||||||||||
| 351 | 855 | 242 | -58.95% | 45.04% | ||||||||||||||||
| FINANCE EXPENSES |
||||||||||||||||||||
| Costs of loans and financings |
303 | 312 | 287 | -2.88% | 5.57% | |||||||||||||||
| Foreign exchange variations |
32 | -199 | 16 | — | — | |||||||||||||||
| Monetary updating—loans and financings |
44 | 24 | 39 | 83.33% | 12.82% | |||||||||||||||
| Charges and monetary updating on post-retirement obligation |
15 | 14 | 18 | 0.07 | - 0.17 | |||||||||||||||
| Others |
58 | 35 | 40 | 65.71% | 45.00% | |||||||||||||||
| 452 | 186 | 400 | 1.43 | 0.13 | ||||||||||||||||
| NET FINANCE INCOME (EXPENSES) |
-101 | 669 | -158 | — | -36.08% | |||||||||||||||
| Statement of Results |
1Q19 | 4Q18 | 1Q18 | QoQ | YoY | |||||||||||||||
| Net Revenue |
5,913 | 5,472 | 4,935 | 8.06% | 19.82% | |||||||||||||||
| Operating Expenses |
4,750 | 4,840 | 4,199 | -1.86% | 13.12% | |||||||||||||||
| EBIT |
1,163 | 632 | 736 | 83.95% | 58.02% | |||||||||||||||
| Share of profit (loss) in associates and joint ventures |
67 | - 29 | 58 | -331.03% | 15.52% | |||||||||||||||
| Result of business combinations |
— | -119 | — | — | — | |||||||||||||||
| Adjustment for impairment of Investments |
— | -127 | — | — | — | |||||||||||||||
| EBITDA |
1,461 | 989 | 1,007 | 47.71% | 45.08% | |||||||||||||||
| Financial Result |
-101 | 670 | -158 | -115.07% | -36.08% | |||||||||||||||
| Provision for Income Taxes, Social Cont & Deferred Income Tax |
-332 | -311 | -171 | 6.75% | 94.15% | |||||||||||||||
| Profit for the business year from going concern operations |
797 | 716 | 465 | 11.28% | 71.40% | |||||||||||||||
| Net Profit for the business year from discontinued operations |
— | 287 | — | — | — | |||||||||||||||
| Net profit for the period attributable to equity holders of the parent |
797 | 1,003 | 465 | -20.56% | 71.40% | |||||||||||||||
| Net profit for the period attributable to non-controlling interests |
— | 42 | — | — | — | |||||||||||||||
| NET PROFIT FOR THE YEAR |
797 | 1,045 | 465 | -23.75% | 71.40% | |||||||||||||||
| Av. Barbacena 1200 Santo Agostinho 30190-131 Belo Horizonte, Minas Gerais, Brazil Tel.: +55 31 3506-5024 Fax +55 31 3506-5025
This text is a translation, provided for information only. The original text in Portuguese is the legally valid version. | ||||||||||
65
| Cash Flow Statement |
1Q19 | 1Q18 | ||||||
| Cash at beginning of period |
891 | 1,030 | ||||||
| Cash generated by operations |
616 | -373 | ||||||
| Net income for the period from going concern operations |
797 | 464 | ||||||
| Current and deferred income tax and Social Contribution tax |
27 | -14 | ||||||
| Depreciation and amortization |
231 | 213 | ||||||
| CVA and other financial components |
-49 | -288 | ||||||
| Equity gain (loss) in subsidiaries |
-67 | -57 | ||||||
| Provisions (reversals) for operational losses |
98 | 94 | ||||||
| Dividends received from equity holdings |
1 | 36 | ||||||
| Interest and monetary variation |
301 | 181 | ||||||
| Interest paid on loans and financings |
-285 | -345 | ||||||
| Others |
-438 | -657 | ||||||
| Financing activities | -771 | -613 | ||||||
| Lease payments |
-15 | — | ||||||
| Payments of loans and financings |
-754 | -723 | ||||||
| Interest on Equity, and dividends |
-2 | — | ||||||
| Capital Increase / Subscription of shares to be capitalized |
— | 110 | ||||||
| Investment activity |
61 | 378 | ||||||
| Securities—Financial Investment |
225 | 649 | ||||||
| Contract assets—Distribution and gas infrastructure |
-152 | — | ||||||
| Financial assets |
— | -82 | ||||||
| Fixed and Intangible assets |
-12 | -189 | ||||||
| Cash at end of period |
797 | 422 | ||||||
| Av. Barbacena 1200 Santo Agostinho 30190-131 Belo Horizonte, Minas Gerais, Brazil Tel.: +55 31 3506-5024 Fax +55 31 3506-5025
This text is a translation, provided for information only. The original text in Portuguese is the legally valid version. | ||||||||||
66
| BALANCE SHEETS (CONSOLIDATED) — ASSETS |
03/31/2019 | 12/31/2018 | ||||||
| CURRENT |
||||||||
| Cash and cash equivalents |
797 | 891 | ||||||
| Securities |
506 | 704 | ||||||
| Consumers and traders |
4,268 | 4,092 | ||||||
| Financial assets of the concession |
1,325 | 1,070 | ||||||
| Contractual assets |
131 | 131 | ||||||
| Tax offsetable |
115 | 124 | ||||||
| Income tax and Social Contribution tax recoverable |
372 | 387 | ||||||
| Dividends receivable |
119 | 120 | ||||||
| Restricted cash |
88 | 91 | ||||||
| Inventories |
32 | 36 | ||||||
| Advances to suppliers |
— | 7 | ||||||
| Refund tariff subsidies |
169 | 30 | ||||||
| Low Income Subsidy |
41 | 70 | ||||||
| Derivative financial instruments – Swaps |
75 | 506 | ||||||
| Other credits |
436 | 19,446 | ||||||
| Assets classified as held for sale |
19,285 | 32,058 | ||||||
| NON-CURRENT |
32,455 | 109 | ||||||
| Securities |
86 | 109 | ||||||
| Consumers and traders |
89 | 81 | ||||||
| Tax offsetable |
242 | 242 | ||||||
| Income tax and Social Contribution tax recoverable |
5 | 6 | ||||||
| Deferred income tax and Social Contribution tax |
2,147 | 2,147 | ||||||
| Escrow deposits in legal actions |
2,483 | 2,502 | ||||||
| Derivative financial instruments – Swaps |
890 | 744 | ||||||
| Other credits |
1,464 | 1,028 | ||||||
| Financial assets of the concession |
4,798 | 4,927 | ||||||
| Contractual assets |
1,581 | 1,598 | ||||||
| Investments |
5,302 | 5,235 | ||||||
| Property, plant and equipment |
2,627 | 2,662 | ||||||
| Intangible assets |
10,741 | 10,777 | ||||||
| TOTAL ASSETS |
60,214 | 59,854 |
| Av. Barbacena 1200 Santo Agostinho 30190-131 Belo Horizonte, Minas Gerais, Brazil Tel.: +55 31 3506-5024 Fax +55 31 3506-5025
This text is a translation, provided for information only. The original text in Portuguese is the legally valid version. | ||||||||||
67
| BALANCE SHEETS LIABILITIES AND SHAREHOLDERS’ EQUITY |
03/31/2019 | 12/31/2018 | ||||||
| CURRENT |
23,760 | 23,394 | ||||||
| Suppliers |
2,012 | 1,801 | ||||||
| Regulatory charges |
498 | 514 | ||||||
| Profit sharing |
144 | 79 | ||||||
| Taxes |
298 | 410 | ||||||
| Income tax and Social Contribution tax |
42 | 112 | ||||||
| Interest on Equity, and dividends, payable |
861 | 864 | ||||||
| Loans and financings |
2,650 | 2,198 | ||||||
| Payroll and related charges |
277 | 284 | ||||||
| Post-retirement liabilities |
257 | 253 | ||||||
| Other obligations |
609 | 607 | ||||||
| Liabilities classified as held for sale |
16,112 | 16,272 | ||||||
| NON-CURRENT |
19,718 | 20,522 | ||||||
| Regulatory charges |
161 | 179 | ||||||
| Loans and financings |
11,487 | 12,574 | ||||||
| Taxes |
30 | 29 | ||||||
| Income tax and Social Contribution tax |
756 | 728 | ||||||
| Provisions |
603 | 641 | ||||||
| Post-retirement liabilities |
4,768 | 4,736 | ||||||
| PASEP / COFINS to be returned to consumers |
1,130 | 1,124 | ||||||
| Derivative financial instruments-options |
430 | 419 | ||||||
| Leasing operations |
234 | — | ||||||
| Others |
119 | 92 | ||||||
| TOTAL EQUITY |
16,736 | 15,938 | ||||||
| Share capital |
7,294 | 7,294 | ||||||
| Capital reserves |
2,249 | 2,249 | ||||||
| Profit reserves |
6,362 | 6,362 | ||||||
| Equity valuation adjustments |
-1,332 | -1,327 | ||||||
| Subscription of shares, to be capitalized |
803 | — | ||||||
| Non-Controlling Interests |
1,360 | 1,360 | ||||||
| TOTAL LIABILITIES AND EQUITY |
60,214 | 59,854 |
| Av. Barbacena 1200 Santo Agostinho 30190-131 Belo Horizonte, Minas Gerais, Brazil Tel.: +55 31 3506-5024 Fax +55 31 3506-5025
This text is a translation, provided for information only. The original text in Portuguese is the legally valid version. | ||||||||||
68
10. PRESENTATION OF 1Q2019 RESULTS DATED MAY 16, 2019
69

2019 Results1Q192019 Results1Q19
2 Certain statements and estimates in this material may represent expectations about future events or results, which are subject to risks and uncertainties, which may be known or unknown. There is no guarantee that the eventsorresultswilltakeplaceasreferredtointheseexpectations. These expectations are based on the present assumptions and analyses from the point of view of our management, in accordance with theirexperienceand other factorssuch as the macroeconomic environment, and market conditions in the electricity sector; and on our expectations for future results, many of which are notunderourcontrol. Important factors that could lead to significant differences between actual results and the projections about future events or results include our business strategy, Brazilian and international economic conditions, technology, our financial strategy, changes in the electricity sector, hydrological conditions, conditions in the financial and energy markets, uncertainty on our results from future operations, plans and objectives, and other factors. Because of these and other factors, our real results may differ significantly from those indicated inorimpliedbysuchstatements. The information and opinions herein should not be understood as a recommendation to potential investors, and no investment decision should be based on the veracity, currentness or completeness of this information or these opinions. None of our professionals nor any of their related parties or representatives shall have any liabilityforanylossesthatmayresultfromtheuseofthecontentofthispresentation. To evaluate the risks and uncertainties as they relate to Cemig, and to obtain additional information about factors that could give rise to different results from those estimated by Cemig, please consult the section on Risk Factors included in the Reference Form filed with the Brazilian Securities Commission – CVM – and in the 20‐FformfiledwiththeU.S.SecuritiesandExchangeCommission–SEC. In this material, financial amounts are in R$million (R$mn) unless otherwise stated. Financial data reflect the adoption of IFRS. Disclaimer2 Certain statements and estimates in this material may represent expectations about future events or results, which are subject to risks and uncertainties, which may be known or unknown. There is no guarantee that the eventsorresultswilltakeplaceasreferredtointheseexpectations. These expectations are based on the present assumptions and analyses from the point of view of our management, in accordance with theirexperienceand other factorssuch as the macroeconomic environment, and market conditions in the electricity sector; and on our expectations for future results, many of which are notunderourcontrol. Important factors that could lead to significant differences between actual results and the projections about future events or results include our business strategy, Brazilian and international economic conditions, technology, our financial strategy, changes in the electricity sector, hydrological conditions, conditions in the financial and energy markets, uncertainty on our results from future operations, plans and objectives, and other factors. Because of these and other factors, our real results may differ significantly from those indicated inorimpliedbysuchstatements. The information and opinions herein should not be understood as a recommendation to potential investors, and no investment decision should be based on the veracity, currentness or completeness of this information or these opinions. None of our professionals nor any of their related parties or representatives shall have any liabilityforanylossesthatmayresultfromtheuseofthecontentofthispresentation. To evaluate the risks and uncertainties as they relate to Cemig, and to obtain additional information about factors that could give rise to different results from those estimated by Cemig, please consult the section on Risk Factors included in the Reference Form filed with the Brazilian Securities Commission – CVM – and in the 20‐FformfiledwiththeU.S.SecuritiesandExchangeCommission–SEC. In this material, financial amounts are in R$million (R$mn) unless otherwise stated. Financial data reflect the adoption of IFRS. Disclaimer
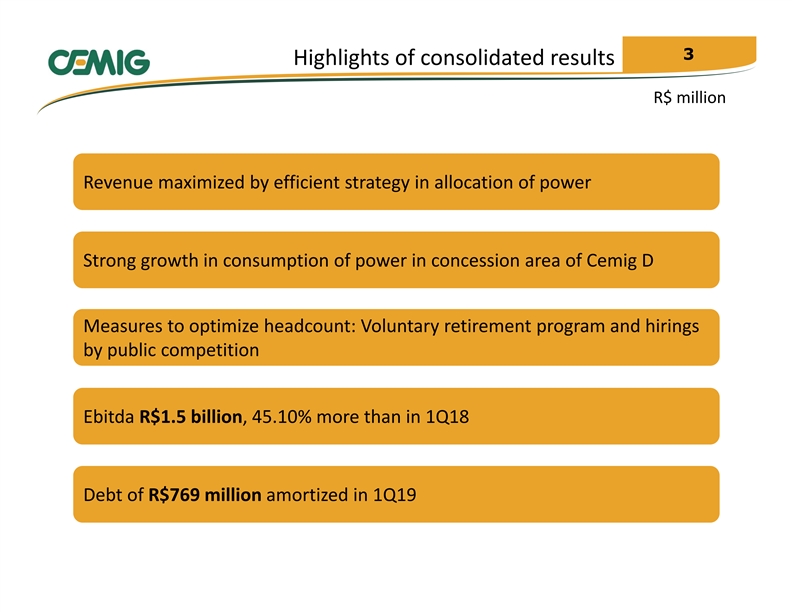
3 Highlightsofconsolidatedresults R$ million Revenue maximized by efficient strategy in allocation of power Strong growth in consumption of power in concession area of Cemig D Measures to optimize headcount: Voluntary retirement program and hirings by public competition Ebitda R$1.5 billion, 45.10% more than in 1Q18 Debt of R$769 millionamortized in 1Q193 Highlightsofconsolidatedresults R$ million Revenue maximized by efficient strategy in allocation of power Strong growth in consumption of power in concession area of Cemig D Measures to optimize headcount: Voluntary retirement program and hirings by public competition Ebitda R$1.5 billion, 45.10% more than in 1Q18 Debt of R$769 millionamortized in 1Q19
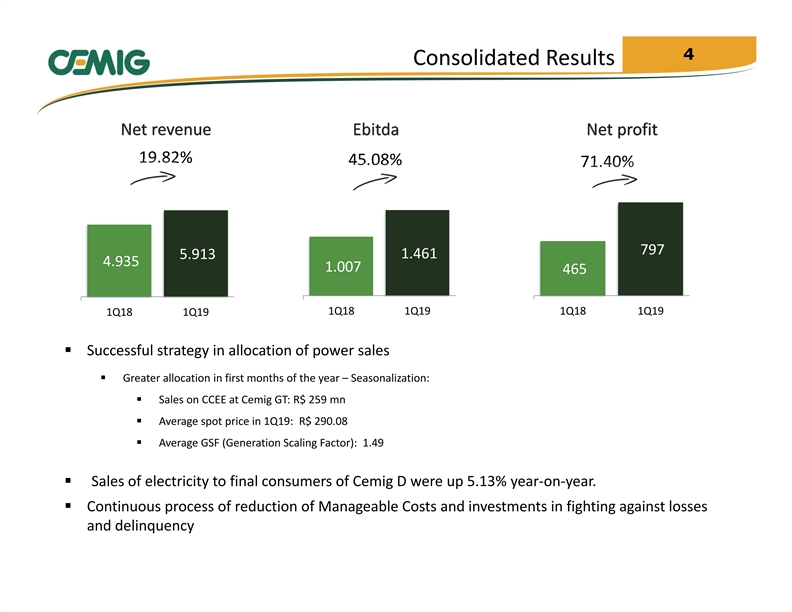
4 ConsolidatedResults 19.82% 45.08% 71.40% 797 1.461 5.913 4.935 1.007 465 1Q18 1Q19 1Q18 1Q19 1Q18 1Q19 § Successful strategy in allocation of power sales § Greater allocation in first months of the year –Seasonalization: § Sales on CCEE at Cemig GT: R$ 259 mn § Average spot price in 1Q19: R$ 290.08 § Average GSF (Generation Scaling Factor): 1.49 § Sales of electricity to final consumers of Cemig D were up 5.13% year‐on‐year. § Continuous process of reduction of Manageable Costs and investments in fighting against losses and delinquency4 ConsolidatedResults 19.82% 45.08% 71.40% 797 1.461 5.913 4.935 1.007 465 1Q18 1Q19 1Q18 1Q19 1Q18 1Q19 § Successful strategy in allocation of power sales § Greater allocation in first months of the year –Seasonalization: § Sales on CCEE at Cemig GT: R$ 259 mn § Average spot price in 1Q19: R$ 290.08 § Average GSF (Generation Scaling Factor): 1.49 § Sales of electricity to final consumers of Cemig D were up 5.13% year‐on‐year. § Continuous process of reduction of Manageable Costs and investments in fighting against losses and delinquency

5 Cemig’senergymarket Total Consumptionofelectricity(GWh) 444 236 35 95 156 150 13.758 6.21% 12.954 1Q18 Residential Industrial Commercial Rural Other Wholesale 1Q19 Total energybilledCemig D + Transport Market Cemig GT 4.07% 6.52% Discos 76 10.14% 69 916 11,279 4.10% 10,838 880 6,995 6,567 Others 864 769 12.35% 5.07% 599 631 1.687 1.643 2.68% 4.760 Rural 4.637 2.65% 2.408 21.07% 1.989 Commercial 2.21% 4.992 4.884 Industrial 3.947 3.987 6.519 6.201 5.13% 1.01% Residential 5.82% 2.744 2.593 1Q18 1Q19 1Q18 1Q19 Free costumers ACL ACR Electricity transported ACL ‐Sales on the Free Market –Sales to traders and 1Q18 1Q19 generation companies, ‘bilateral contracts’ with other agents Consumption by captive market ACR –Regulated Market5 Cemig’senergymarket Total Consumptionofelectricity(GWh) 444 236 35 95 156 150 13.758 6.21% 12.954 1Q18 Residential Industrial Commercial Rural Other Wholesale 1Q19 Total energybilledCemig D + Transport Market Cemig GT 4.07% 6.52% Discos 76 10.14% 69 916 11,279 4.10% 10,838 880 6,995 6,567 Others 864 769 12.35% 5.07% 599 631 1.687 1.643 2.68% 4.760 Rural 4.637 2.65% 2.408 21.07% 1.989 Commercial 2.21% 4.992 4.884 Industrial 3.947 3.987 6.519 6.201 5.13% 1.01% Residential 5.82% 2.744 2.593 1Q18 1Q19 1Q18 1Q19 Free costumers ACL ACR Electricity transported ACL ‐Sales on the Free Market –Sales to traders and 1Q18 1Q19 generation companies, ‘bilateral contracts’ with other agents Consumption by captive market ACR –Regulated Market

6 Consolidatedoperationalexpenses Change in consolidated operational expenses–1Q19/1Q18 330 +13.14% PMSO 132 47 46 18 33 18 19 5 4.750 ‐14 ‐24 4.198 ‐58 1Q18 1Q19 Consolidado PMSO Adjustment in PMSO 1Q19 1Q18 Change 3.6% Personnel expenses: Personnel adjusted 344 332 • Voluntary retirement program cost R$21 million in Materials 20 15 34.0% 1Q19 20.3% Outsourced sevices 284 236 • 155 employees accepted the plan Others 52 66 ‐21.7% 7.8% PMSO 700 6496 Consolidatedoperationalexpenses Change in consolidated operational expenses–1Q19/1Q18 330 +13.14% PMSO 132 47 46 18 33 18 19 5 4.750 ‐14 ‐24 4.198 ‐58 1Q18 1Q19 Consolidado PMSO Adjustment in PMSO 1Q19 1Q18 Change 3.6% Personnel expenses: Personnel adjusted 344 332 • Voluntary retirement program cost R$21 million in Materials 20 15 34.0% 1Q19 20.3% Outsourced sevices 284 236 • 155 employees accepted the plan Others 52 66 ‐21.7% 7.8% PMSO 700 649
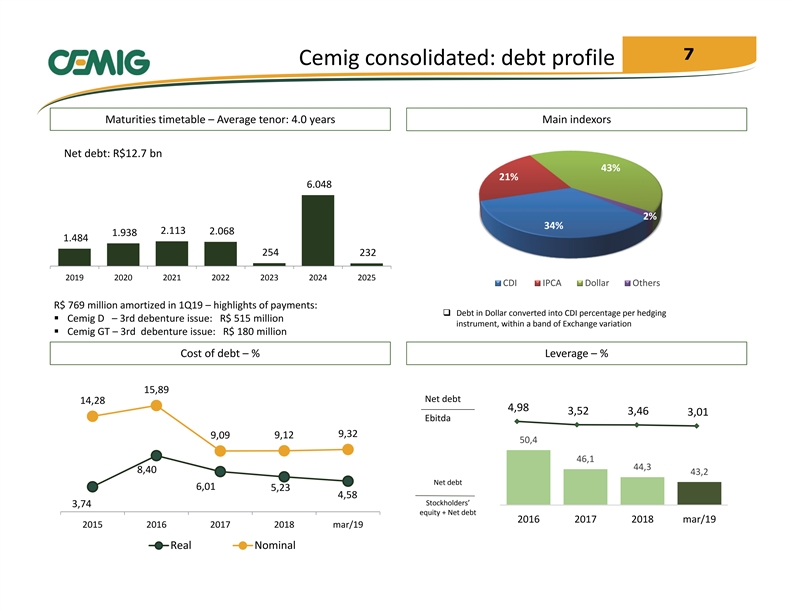
7 Cemig consolidated: debt profile Maturities timetable –Average tenor: 4.0years Mainindexors Net debt: R$12.7 bn 43% 21% 6.048 2% 34% 2.113 2.068 1.938 1.484 254 232 2019 2020 2021 2022 2023 2024 2025 CDI IPCA Dollar Others R$ 769 million amortized in 1Q19 –highlights of payments: q Debt in Dollar converted into CDI percentage per hedging § Cemig D –3rd debenture issue: R$ 515 million instrument, within a band of Exchange variation § Cemig GT –3rd debenture issue: R$ 180 million Costofdebt–% Leverage–% 15,89 Net debt 14,28 4,98 3,52 3,46 3,01 Ebitda 9,32 9,12 9,09 50,4 46,1 44,3 8,40 43,2 Net debt 6,01 5,23 4,58 Stockholders’ 3,74 equity + Net debt 2016 2017 2018 mar/19 2015 2016 2017 2018 mar/19 Real Nominal7 Cemig consolidated: debt profile Maturities timetable –Average tenor: 4.0years Mainindexors Net debt: R$12.7 bn 43% 21% 6.048 2% 34% 2.113 2.068 1.938 1.484 254 232 2019 2020 2021 2022 2023 2024 2025 CDI IPCA Dollar Others R$ 769 million amortized in 1Q19 –highlights of payments: q Debt in Dollar converted into CDI percentage per hedging § Cemig D –3rd debenture issue: R$ 515 million instrument, within a band of Exchange variation § Cemig GT –3rd debenture issue: R$ 180 million Costofdebt–% Leverage–% 15,89 Net debt 14,28 4,98 3,52 3,46 3,01 Ebitda 9,32 9,12 9,09 50,4 46,1 44,3 8,40 43,2 Net debt 6,01 5,23 4,58 Stockholders’ 3,74 equity + Net debt 2016 2017 2018 mar/19 2015 2016 2017 2018 mar/19 Real Nominal

8 Cemig GT : debt profile Maturities timetable –Average tenor: 4.8 years Mainindexors Net debt: R$7.6 bn 74% 5.791 2% 11% 13% 728 760 478 365 ‐ CDI IPCA Dollar Others 2019 2020 2021 2022 2023 2024 q Debt in Dollar converted into CDI percentage per hedging instrument, within a band of Exchange variation Costofdebt–% Leverage–% 16,03 Net debt 14,41 5,60 5,14 3,78 3,95 Ebitda 9,36 9,46 9,23 62,9 60,7 60,6 57,7 8,59 Net debt 6,14 5,45 4,71 Stockholders’ 3,66 equity + Net debt 2016 2017 2018 mar/19 2015 2016 2017 2018 mar/19 Real Nominal8 Cemig GT : debt profile Maturities timetable –Average tenor: 4.8 years Mainindexors Net debt: R$7.6 bn 74% 5.791 2% 11% 13% 728 760 478 365 ‐ CDI IPCA Dollar Others 2019 2020 2021 2022 2023 2024 q Debt in Dollar converted into CDI percentage per hedging instrument, within a band of Exchange variation Costofdebt–% Leverage–% 16,03 Net debt 14,41 5,60 5,14 3,78 3,95 Ebitda 9,36 9,46 9,23 62,9 60,7 60,6 57,7 8,59 Net debt 6,14 5,45 4,71 Stockholders’ 3,66 equity + Net debt 2016 2017 2018 mar/19 2015 2016 2017 2018 mar/19 Real Nominal

9 Cemig D : debt profile Maturities timetable –Average tenor: 2.9 years Mainindexors Net debt: R$5.1 bn 1.651 35% 1.257 1.159 923 64% 256 234 232 1% 2019 2020 2021 2022 2023 2024 2025 CDI IPCA Others Costofdebt–% Leverage–% 12,55 Net debt 15,87 5,84 3,49 2,99 14,31 Ebitda 68,5 9,28 56,5 8,93 8,94 53,5 51,5 Net debt 8,06 5,87 Stockholders’ 5,08 4,56 4,01 equity + Net debt 2016 2017 2018 mar/19 2015 2016 2017 2018 mar/19 Real Nominal9 Cemig D : debt profile Maturities timetable –Average tenor: 2.9 years Mainindexors Net debt: R$5.1 bn 1.651 35% 1.257 1.159 923 64% 256 234 232 1% 2019 2020 2021 2022 2023 2024 2025 CDI IPCA Others Costofdebt–% Leverage–% 12,55 Net debt 15,87 5,84 3,49 2,99 14,31 Ebitda 68,5 9,28 56,5 8,93 8,94 53,5 51,5 Net debt 8,06 5,87 Stockholders’ 5,08 4,56 4,01 equity + Net debt 2016 2017 2018 mar/19 2015 2016 2017 2018 mar/19 Real Nominal
1010

Investor Relations Tel: +55 (31) 3506-5024 ri@cemig.com.br http://ri.cemig.com.brInvestor Relations Tel: +55 (31) 3506-5024 ri@cemig.com.br http://ri.cemig.com.br
11. MARKET NOTICE DATED MAY 27, 2019: ITAÚ FUNDS REDUCE TOTAL ON HOLDING BELOW 5%
81
COMPANHIA ENERGÉTICA DE MINAS GERAIS – CEMIG
LISTED COMPANY – CNPJ 17.155.730/0001-64 – NIRE 31300040127
MARKET NOTICE
Itaú funds reduce total ON holding below 5%
In accordance with Article 12 of CVM Instruction 358, Cemig (Companhia Energética de Minas Gerais, listed and traded in São Paulo, New York and Madrid) – hereby informs the Brazilian Securities Commission (CVM), the São Paulo Stock Exchange (B3) and the market in general, as follows:
Cemig has received the following notification from Itaú Unibanco S.A.:
| “ | Itaú Unibanco S.A., CNPJ 60.701.190/0001-04, herein ‘Itaú Unibanco’, hereby notifies you that on May 24, 2019 the aggregate value of the shares and other securities and financial instruments referenced to shares (as applicable) held by investment funds managed by Itaú Unibanco was 4.375% of the common shares (CMIG3) issued by Cemig, a total of 21,333,125 shares. This characterizes a material reduction in stock holding, under the terms of Article 12 of CVM Instruction 568/2015. |
Itaú Unibanco further advises that the objective of this equity interest is not in any way to alter the composition of the stockholding control or management structure of Cemig.
For maximum clarity Itaú Unibanco underlines that as mentioned above this notification refers to positions held by investment funds managed by Itaú Unibanco, as part of its activity of asset management of third party funds. ”
Belo Horizonte, May 27, 2019
Maurício Fernandes Leonardo Júnior
Chief Finance and Investor Relations Officer
| Av. Barbacena 1200 Santo Agostinho 30190-131 Belo Horizonte, Minas Gerais, Brazil Tel.: +55 31 3506-5024 Fax +55 31 3506-5025
This text is a translation, provided for information only. The original text in Portuguese is the legally valid version. | ||||||||||
82
12. XXIV CEMIG ANNUAL MEETING WITH INVESTORS DATED MAY 29, 2019: CEMIG OPERATIONAL EFFICIENCY
83
th Cemig Annual Meeting With Investors CEMIG – Operational Efficiencyth Cemig Annual Meeting With Investors CEMIG – Operational Efficiency

th Cemig Annual Meeting With Investors DISCLAIMER Some statements and estimates in this material may represent expectations about future events or results that involve risks and uncertainties known and unknown. There is no guarantee that the events or results referred to in these expectations will occur. These expectations are based on present assumptions and analyses from the viewpoint of our management, based on their experience, the macroeconomic environment, market conditions in the energy sector and our expected future results, manyofwhicharenotunderCemig’s control. Important factors that can lead to significant differences between actual results and projections about future events or resultsincludeCemig’sbusinessstrategy,Brazilianandinternationaleconomicconditions,technology,Cemig´sfinancial strategy, changes in the energy sector, hydrological conditions, conditions in the financial markets, uncertainty regarding future results of operations, plans and objectives as well as other factors. Because of these and other factors,ouractualresults maydiffersignificantly fromthose indicated inorimplied bythese statements. The information and opinions contained herein should not be understood as a recommendation to potential investors and no investment decision should be based on the truthfulness, or completeness as of the date hereof of this information or these opinions. None of Cemig’s professionals nor any of their related parties or representatives shall haveanyliability foranylosses that mayresult fromtheuseofthecontent ofthis presentation. To evaluate the risks and uncertainties as they relate to Cemig, and to obtain additional information about factors that couldleadtodifferentresultsfromthoseestimatedbyCemig,pleaseconsultthesectiononRiskFactorsincludedinour Formulário de Referência filed with the Brazilian Securities Commission – CVM, and in Form 20‐F filed with the U.S. Securities andExchange Commission –SEC. In this material, financial amounts are in R$ million (R$ mn) unless otherwise stated. Financial data reflect the adoption ofIFRSth Cemig Annual Meeting With Investors DISCLAIMER Some statements and estimates in this material may represent expectations about future events or results that involve risks and uncertainties known and unknown. There is no guarantee that the events or results referred to in these expectations will occur. These expectations are based on present assumptions and analyses from the viewpoint of our management, based on their experience, the macroeconomic environment, market conditions in the energy sector and our expected future results, manyofwhicharenotunderCemig’s control. Important factors that can lead to significant differences between actual results and projections about future events or resultsincludeCemig’sbusinessstrategy,Brazilianandinternationaleconomicconditions,technology,Cemig´sfinancial strategy, changes in the energy sector, hydrological conditions, conditions in the financial markets, uncertainty regarding future results of operations, plans and objectives as well as other factors. Because of these and other factors,ouractualresults maydiffersignificantly fromthose indicated inorimplied bythese statements. The information and opinions contained herein should not be understood as a recommendation to potential investors and no investment decision should be based on the truthfulness, or completeness as of the date hereof of this information or these opinions. None of Cemig’s professionals nor any of their related parties or representatives shall haveanyliability foranylosses that mayresult fromtheuseofthecontent ofthis presentation. To evaluate the risks and uncertainties as they relate to Cemig, and to obtain additional information about factors that couldleadtodifferentresultsfromthoseestimatedbyCemig,pleaseconsultthesectiononRiskFactorsincludedinour Formulário de Referência filed with the Brazilian Securities Commission – CVM, and in Form 20‐F filed with the U.S. Securities andExchange Commission –SEC. In this material, financial amounts are in R$ million (R$ mn) unless otherwise stated. Financial data reflect the adoption ofIFRS
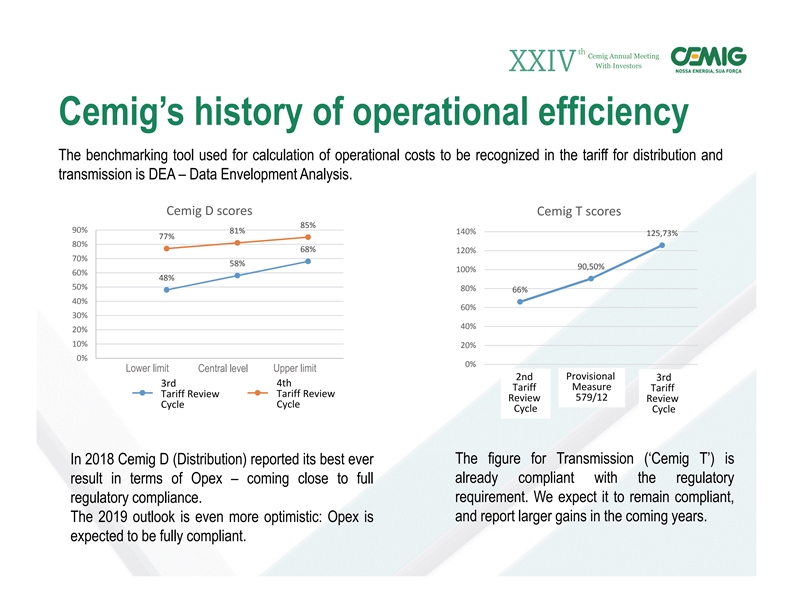
th Cemig Annual Meeting With Investors Cemig’s history of operational efficiency The benchmarking tool used for calculation of operational costs to be recognized in the tariff for distribution and transmission is DEA – Data Envelopment Analysis. Cemig D scores Cemig T scores 85% 90% 81% 140% 125,73% 77% 80% 68% 120% 70% 58% 90,50% 100% 60% 48% 50% 80% 66% 40% 60% 30% 40% 20% 10% 20% 0% 0% Lower limit Central level Upper limit 0 0,5 1 1,5 2 2,5 3 3,5 2ºCRTP MP 579/12 3ºCRTP 2nd Provisional 3rd 3rd 4th Measure Tariff Tariff 3ºCRTP 4ºCRTP Tariff Review Tariff Review Review 579/12 Review Cycle Cycle Cycle Cycle In 2018 Cemig D (Distribution) reported its best ever The figure for Transmission (‘Cemig T’) is already compliant with the regulatory result in terms of Opex – coming close to full requirement. We expect it to remain compliant, regulatory compliance. and report larger gains in the coming years. The 2019 outlook is even more optimistic: Opex is expected to be fully compliant.th Cemig Annual Meeting With Investors Cemig’s history of operational efficiency The benchmarking tool used for calculation of operational costs to be recognized in the tariff for distribution and transmission is DEA – Data Envelopment Analysis. Cemig D scores Cemig T scores 85% 90% 81% 140% 125,73% 77% 80% 68% 120% 70% 58% 90,50% 100% 60% 48% 50% 80% 66% 40% 60% 30% 40% 20% 10% 20% 0% 0% Lower limit Central level Upper limit 0 0,5 1 1,5 2 2,5 3 3,5 2ºCRTP MP 579/12 3ºCRTP 2nd Provisional 3rd 3rd 4th Measure Tariff Tariff 3ºCRTP 4ºCRTP Tariff Review Tariff Review Review 579/12 Review Cycle Cycle Cycle Cycle In 2018 Cemig D (Distribution) reported its best ever The figure for Transmission (‘Cemig T’) is already compliant with the regulatory result in terms of Opex – coming close to full requirement. We expect it to remain compliant, regulatory compliance. and report larger gains in the coming years. The 2019 outlook is even more optimistic: Opex is expected to be fully compliant.

th Cemig Annual Meeting With Investors Operational Efficiency Committee (OEC) RESULTS AGENDA COMPOSITION START December 2018 10 members: 45 initiatives Weekly Optimize processes and General Managers meetings Cost and revenue ensure corporate representing all (in May 2019) sustainability Departments th Cemig Annual Meeting With Investors Operational Efficiency Committee (OEC) RESULTS AGENDA COMPOSITION START December 2018 10 members: 45 initiatives Weekly Optimize processes and General Managers meetings Cost and revenue ensure corporate representing all (in May 2019) sustainability Departments
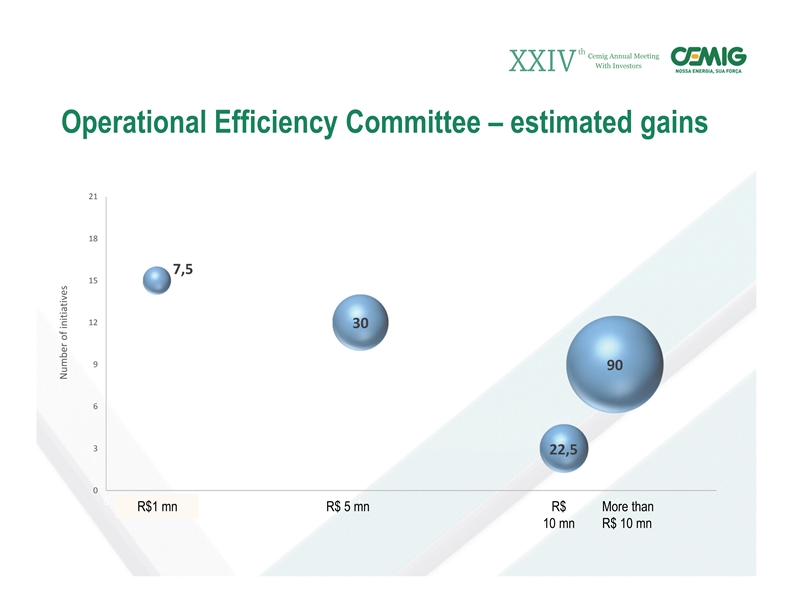
th Cemig Annual Meeting With Investors Operational Efficiency Committee – estimated gains 21 18 7,5 15 12 30 9 90 6 3 22,5 0 05 10 R$1 mn R$ 5 mn R$ More than 10 mn R$ 10 mn Number of initiatives th Cemig Annual Meeting With Investors Operational Efficiency Committee – estimated gains 21 18 7,5 15 12 30 9 90 6 3 22,5 0 05 10 R$1 mn R$ 5 mn R$ More than 10 mn R$ 10 mn Number of initiatives
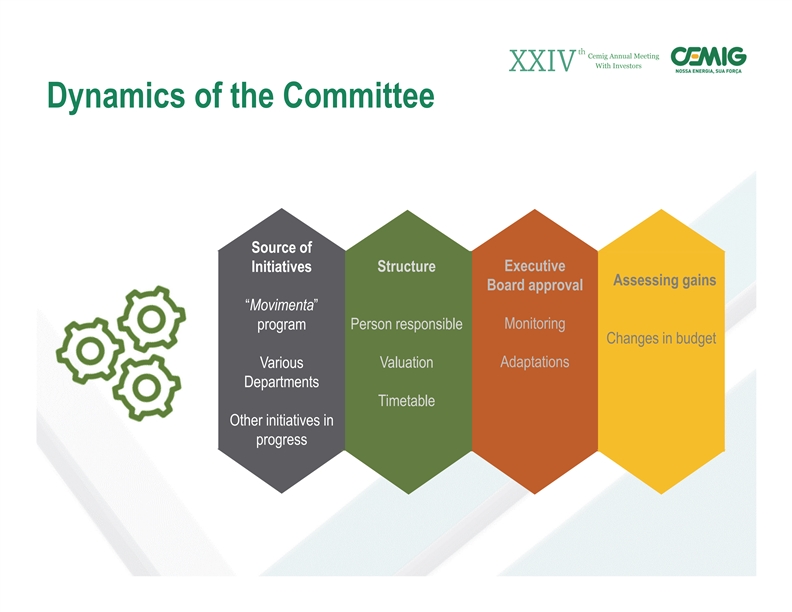
th Cemig Annual Meeting With Investors Dynamics of the Committee Source of Executive Initiatives Structure Assessing gains Board approval “Movimenta” Person responsible Monitoring program Changes in budget Adaptations Various Valuation Departments Timetable Other initiatives in progressth Cemig Annual Meeting With Investors Dynamics of the Committee Source of Executive Initiatives Structure Assessing gains Board approval “Movimenta” Person responsible Monitoring program Changes in budget Adaptations Various Valuation Departments Timetable Other initiatives in progress
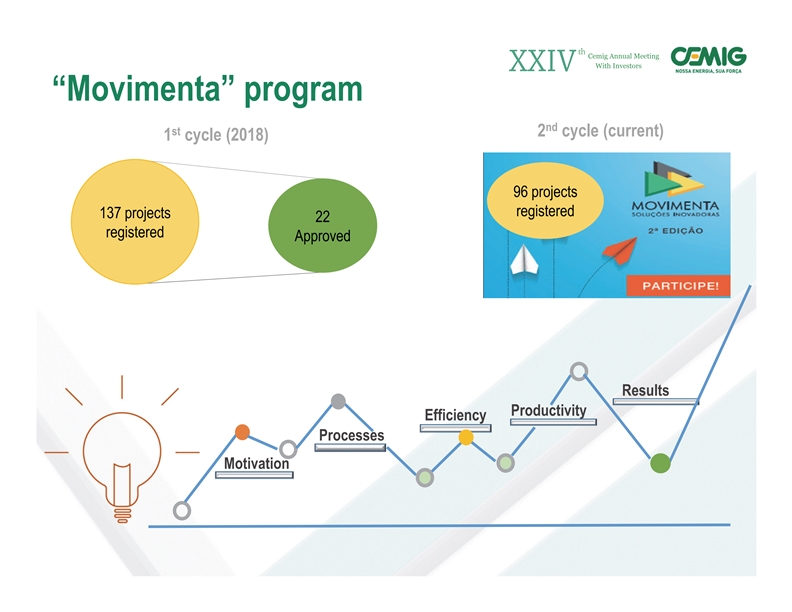
th Cemig Annual Meeting With Investors “Movimenta” program nd st 2 cycle (current) 1 cycle (2018) 96 projects registered 137 projects 22 registered Approved Results Productivity Efficiency Processes Motivationth Cemig Annual Meeting With Investors “Movimenta” program nd st 2 cycle (current) 1 cycle (2018) 96 projects registered 137 projects 22 registered Approved Results Productivity Efficiency Processes Motivation
th Cemig Annual Meeting With Investors Examples of initiatives Pole sharing – public lighting Reconciliation Center Use of pruning waste in agro-systems th Cemig Annual Meeting With Investors Examples of initiatives Pole sharing – public lighting Reconciliation Center Use of pruning waste in agro-systems

Investor Relations Tel: +55 (31) 3506-5024 ri@cemig.com.br http://ri.cemig.com.brInvestor Relations Tel: +55 (31) 3506-5024 ri@cemig.com.br http://ri.cemig.com.br
13. XXIV CEMIG ANNUAL MEETING WITH INVESTORS DATED MAY 29: GUIDANCE 2019-2023
93
th Cemig Annual Meeting With Investors Guidance 2019-2023th Cemig Annual Meeting With Investors Guidance 2019-2023
DISCLAIMER Some statements and estimates in this material may represent expectations about future events or results that involve risks and uncertainties known and unknown. There is no guarantee that the events or results referred to in these expectations willoccur. These expectations are based on present assumptions and analyses from the viewpoint of our management, based on their experience, the macroeconomic environment, market conditions in the energy sector and our expected future results, manyofwhicharenotunder Cemig’s control. Important factors that can lead to significant differences between actual results and projections about future events or results include Cemig’s business strategy, Brazilian and international economic conditions, technology, Cemig´s financial strategy, changes in the energy sector, hydrological conditions, conditions in the financial markets, uncertainty regarding future results of operations, plans and objectives as well as other factors. Because of these andotherfactors,ouractual results maydiffersignificantly fromthoseindicated inorimplied bythese statements. The information and opinions contained herein should not be understood as a recommendation to potential investors and no investment decision should be based on the truthfulness, or completeness as of the date hereof of this information or these opinions. None of Cemig’s professionals nor any of their related parties or representatives shall haveanyliability foranylossesthat mayresult fromtheuseofthecontent ofthis presentation. To evaluate the risks and uncertainties as they relate to Cemig, and to obtain additional information about factors that could lead to different results from those estimated by Cemig, please consult the section on Risk Factors includedinour Formulário de Referência filedwiththe BrazilianSecurities Commission– CVM, andinForm20‐Ffiled withtheU.S.Securities andExchange Commission –SEC. In this material, financial amounts are in R$ million (R$ mn) unless otherwise stated. Financial data reflect the adoption ofIFRSDISCLAIMER Some statements and estimates in this material may represent expectations about future events or results that involve risks and uncertainties known and unknown. There is no guarantee that the events or results referred to in these expectations willoccur. These expectations are based on present assumptions and analyses from the viewpoint of our management, based on their experience, the macroeconomic environment, market conditions in the energy sector and our expected future results, manyofwhicharenotunder Cemig’s control. Important factors that can lead to significant differences between actual results and projections about future events or results include Cemig’s business strategy, Brazilian and international economic conditions, technology, Cemig´s financial strategy, changes in the energy sector, hydrological conditions, conditions in the financial markets, uncertainty regarding future results of operations, plans and objectives as well as other factors. Because of these andotherfactors,ouractual results maydiffersignificantly fromthoseindicated inorimplied bythese statements. The information and opinions contained herein should not be understood as a recommendation to potential investors and no investment decision should be based on the truthfulness, or completeness as of the date hereof of this information or these opinions. None of Cemig’s professionals nor any of their related parties or representatives shall haveanyliability foranylossesthat mayresult fromtheuseofthecontent ofthis presentation. To evaluate the risks and uncertainties as they relate to Cemig, and to obtain additional information about factors that could lead to different results from those estimated by Cemig, please consult the section on Risk Factors includedinour Formulário de Referência filedwiththe BrazilianSecurities Commission– CVM, andinForm20‐Ffiled withtheU.S.Securities andExchange Commission –SEC. In this material, financial amounts are in R$ million (R$ mn) unless otherwise stated. Financial data reflect the adoption ofIFRS
th Cemig Annual Meeting With Investors Cemig Dth Cemig Annual Meeting With Investors Cemig D
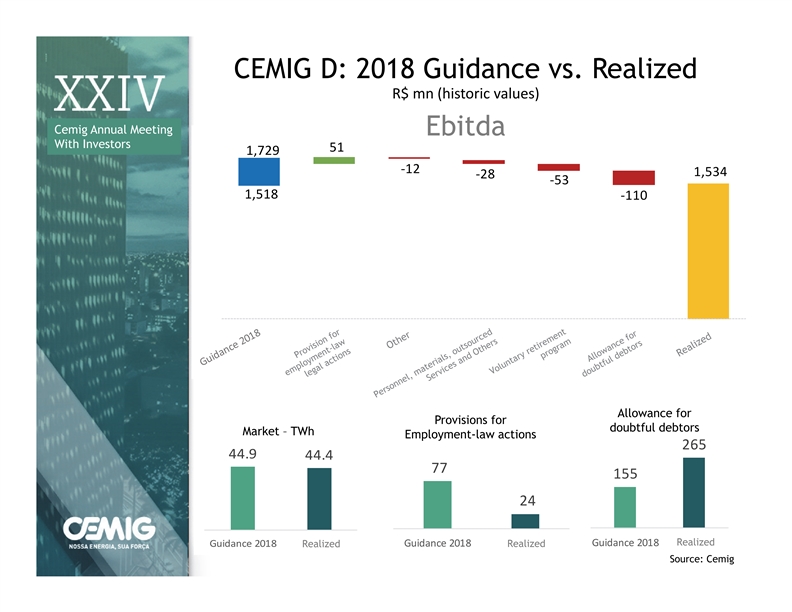
CEMIG D: 2018 Guidance vs. Realized R$ mn (historic values) Cemig Annual Meeting Ebitda With Investors 51 1,729 ‐12 1,534 ‐28 ‐53 1,518 ‐110 Market – TWh Allowance for Provisões Trabalhistas PECLD Provisions for Mercado - TWh doubtful debtors Market – TWh Employment-law actions 265 44.9 44.4 77 155 24 Guidance 2018 RRealized ealizado Guidance 2018 RRealized ealizado Guidance 2018 Re Realized alizado Source: CemigCEMIG D: 2018 Guidance vs. Realized R$ mn (historic values) Cemig Annual Meeting Ebitda With Investors 51 1,729 ‐12 1,534 ‐28 ‐53 1,518 ‐110 Market – TWh Allowance for Provisões Trabalhistas PECLD Provisions for Mercado - TWh doubtful debtors Market – TWh Employment-law actions 265 44.9 44.4 77 155 24 Guidance 2018 RRealized ealizado Guidance 2018 RRealized ealizado Guidance 2018 Re Realized alizado Source: Cemig
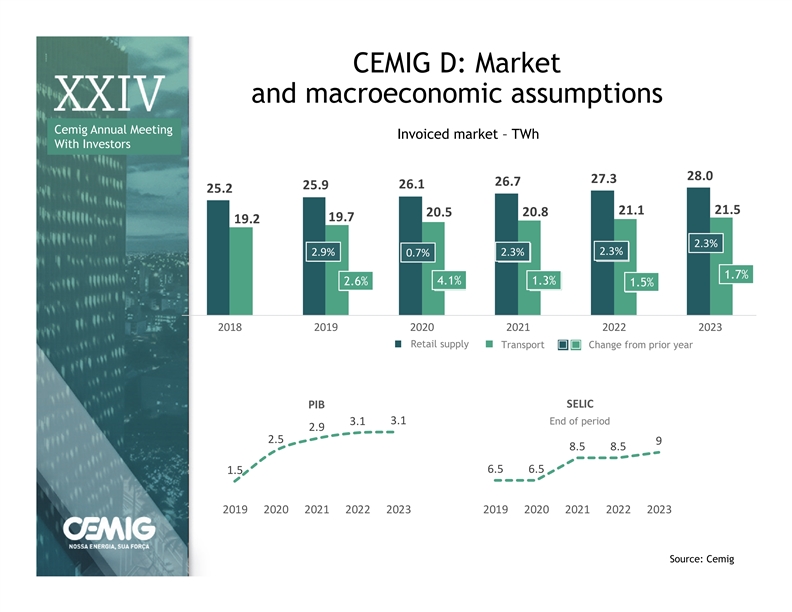
CEMIG D: Market and macroeconomic assumptions Cemig Annual Meeting Mercado Faturado ‐TWh Invoiced market – TWh With Investors 28.0 27.3 26.7 25.9 26.1 25.2 21.5 21.1 20.8 20.5 19.7 19.2 2.3% 2.3% 0. 2.9% 72% 2.3% 2.26% 2.31% 2. 0.7% 30% 1.7% 4. 2.6% 11% 4.1% 1.34% 1.3% 1.46% 1.5% 1.68% 2018 2019 2020 2021 2022 2023 Retail supply Fornecimento Tr Transport ansporte Change from prior year Variação Ano Anterior SELIC PIB Fim de período 3.1 3.1 End of period 2.9 2.5 9 8.5 8.5 6.5 6.5 1.5 2019 2020 2021 2022 2023 2019 2020 2021 2022 2023 Source: CemigCEMIG D: Market and macroeconomic assumptions Cemig Annual Meeting Mercado Faturado ‐TWh Invoiced market – TWh With Investors 28.0 27.3 26.7 25.9 26.1 25.2 21.5 21.1 20.8 20.5 19.7 19.2 2.3% 2.3% 0. 2.9% 72% 2.3% 2.26% 2.31% 2. 0.7% 30% 1.7% 4. 2.6% 11% 4.1% 1.34% 1.3% 1.46% 1.5% 1.68% 2018 2019 2020 2021 2022 2023 Retail supply Fornecimento Tr Transport ansporte Change from prior year Variação Ano Anterior SELIC PIB Fim de período 3.1 3.1 End of period 2.9 2.5 9 8.5 8.5 6.5 6.5 1.5 2019 2020 2021 2022 2023 2019 2020 2021 2022 2023 Source: Cemig

CEMIG D: Opex Number of clients Número de Clientes Opex/client (R$/Client) OPEX/Cliente (R$/Cliente) Cemig Annual Meeting June 2019 currency 2018 8,409,156 Moeda Jun/2019 With Investors 348 2019 8,566,590 370 350 350 2020 8,722,065 330 2021 8,889,208 310 325 2022 9,065,569 320 315 290 309 2023 9,244,804 270 Source: CEMIG, end of period. 250 2018 2019 2020 2021 2022 2023 Guidance 2019 Re Regulatory * gulatório* Doubtful debtor allowance PECLD Means to reduce allowance for doubtful June 2019 R$ mn R$ MM ‐Moeda Jun/2019 debtors: 273 • Specialized consultancy 191 • AMI – Advanced Metering Infrastructure 169 159 149 139 • Economic recovery • Maintain cutoff level 2018 2019 2020 2021 2022 2023 Doubtful debtor allowance / PECLD/Receita Faturada billed revenue – % 1.32% 0.83% 0.80% 0.78% 0.75% 0.72% 2018 2019 2020 2021 2022 2023 Source: Cemig * Regulatory Opex Includes PMSO, Unrecoverable revenue and 2/3 of annual payments. CEMIG D: Opex Number of clients Número de Clientes Opex/client (R$/Client) OPEX/Cliente (R$/Cliente) Cemig Annual Meeting June 2019 currency 2018 8,409,156 Moeda Jun/2019 With Investors 348 2019 8,566,590 370 350 350 2020 8,722,065 330 2021 8,889,208 310 325 2022 9,065,569 320 315 290 309 2023 9,244,804 270 Source: CEMIG, end of period. 250 2018 2019 2020 2021 2022 2023 Guidance 2019 Re Regulatory * gulatório* Doubtful debtor allowance PECLD Means to reduce allowance for doubtful June 2019 R$ mn R$ MM ‐Moeda Jun/2019 debtors: 273 • Specialized consultancy 191 • AMI – Advanced Metering Infrastructure 169 159 149 139 • Economic recovery • Maintain cutoff level 2018 2019 2020 2021 2022 2023 Doubtful debtor allowance / PECLD/Receita Faturada billed revenue – % 1.32% 0.83% 0.80% 0.78% 0.75% 0.72% 2018 2019 2020 2021 2022 2023 Source: Cemig * Regulatory Opex Includes PMSO, Unrecoverable revenue and 2/3 of annual payments.

CEMIG D: Investment (June 2019 R$ mn) Cemig Annual Meeting 1,448 1600,0 2019-2023 cycle With Investors 1,303 1,254 Total R$ 6,458 1,257 1,197 1400,0 86 71 1200,0 53 91 52 1000,0 800,0 1,362 600,0 1,232 1,201 1,166 1,145 400,0 200,0 ‐ 2019 2020 2021 2022 2023 Sistema Elétrico Infraestrutura/Outros Electricity system Infrastructure / Other 1,448 1,303 1600,0 1,257 1,254 1,197 1300,0 1400,0 179 1200,0 170 158 178 114 800,0 1000,0 800,0 300,0 1,269 600,0 1,133 1,078 1,096 1,083 400,0 ‐200,0 200,0 ‐700,0 ‐ 2019 2020 2021 2022 2023 Re Cemig funding curso Cemig Re Client funding curso Clientes Source: CemigCEMIG D: Investment (June 2019 R$ mn) Cemig Annual Meeting 1,448 1600,0 2019-2023 cycle With Investors 1,303 1,254 Total R$ 6,458 1,257 1,197 1400,0 86 71 1200,0 53 91 52 1000,0 800,0 1,362 600,0 1,232 1,201 1,166 1,145 400,0 200,0 ‐ 2019 2020 2021 2022 2023 Sistema Elétrico Infraestrutura/Outros Electricity system Infrastructure / Other 1,448 1,303 1600,0 1,257 1,254 1,197 1300,0 1400,0 179 1200,0 170 158 178 114 800,0 1000,0 800,0 300,0 1,269 600,0 1,133 1,078 1,096 1,083 400,0 ‐200,0 200,0 ‐700,0 ‐ 2019 2020 2021 2022 2023 Re Cemig funding curso Cemig Re Client funding curso Clientes Source: Cemig
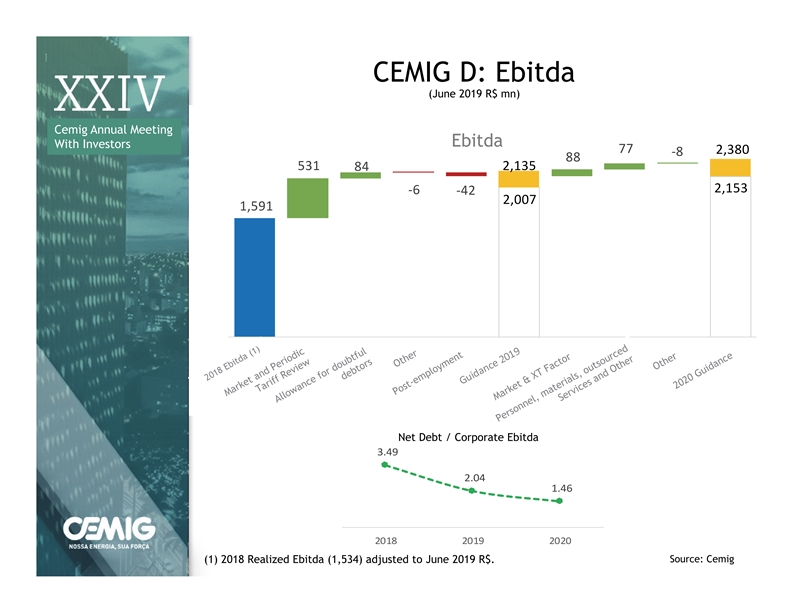
CEMIG D: Ebitda (June 2019 R$ mn) Cemig Annual Meeting Ebitda With Investors 77 2,380 ‐8 88 531 2,135 84 2,153 ‐6 ‐42 2,007 1,591 Net Debt / Corporate Ebitda Dívida Líquida / LAJDIA ‐Societário 3.49 2.04 1.46 2018 2019 2020 Source: Cemig (1) 2018 Realized Ebitda (1,534) adjusted to June 2019 R$.CEMIG D: Ebitda (June 2019 R$ mn) Cemig Annual Meeting Ebitda With Investors 77 2,380 ‐8 88 531 2,135 84 2,153 ‐6 ‐42 2,007 1,591 Net Debt / Corporate Ebitda Dívida Líquida / LAJDIA ‐Societário 3.49 2.04 1.46 2018 2019 2020 Source: Cemig (1) 2018 Realized Ebitda (1,534) adjusted to June 2019 R$.
Cemig Annual Meeting With Investors Cemig GTCemig Annual Meeting With Investors Cemig GT
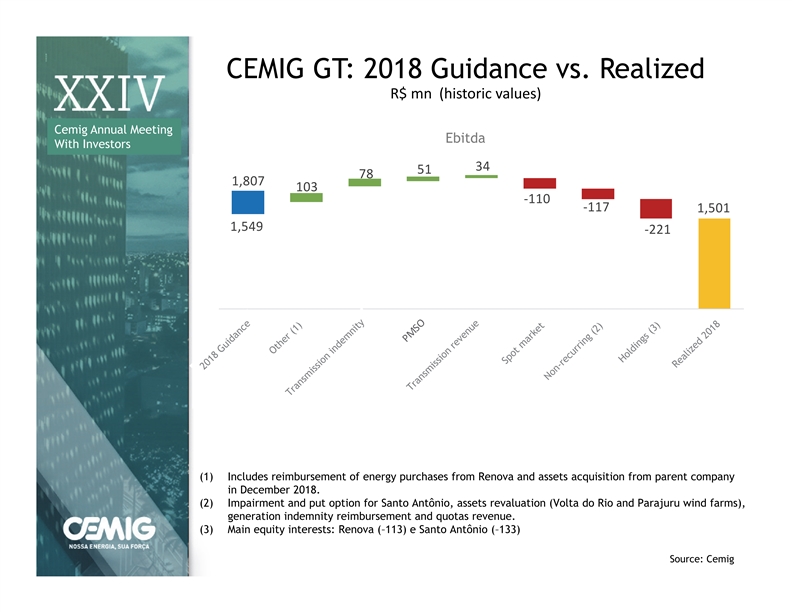
CEMIG GT: 2018 Guidance vs. Realized R$ mn (historic values) Cemig Annual Meeting Ebitda With Investors 2100 34 51 78 1900 1,807 103 1700 ‐110 ‐117 1,501 1500 1,549 ‐221 1300 1100 90 0 70 0 50 0 (1) Includes reimbursement of energy purchases from Renova and assets acquisition from parent company in December 2018. (2) Impairment and put option for Santo Antônio, assets revaluation (Volta do Rio and Parajuru wind farms), generation indemnity reimbursement and quotas revenue. (3) Main equity interests: Renova (–113) e Santo Antônio (–133) Source: CemigCEMIG GT: 2018 Guidance vs. Realized R$ mn (historic values) Cemig Annual Meeting Ebitda With Investors 2100 34 51 78 1900 1,807 103 1700 ‐110 ‐117 1,501 1500 1,549 ‐221 1300 1100 90 0 70 0 50 0 (1) Includes reimbursement of energy purchases from Renova and assets acquisition from parent company in December 2018. (2) Impairment and put option for Santo Antônio, assets revaluation (Volta do Rio and Parajuru wind farms), generation indemnity reimbursement and quotas revenue. (3) Main equity interests: Renova (–113) e Santo Antônio (–133) Source: Cemig
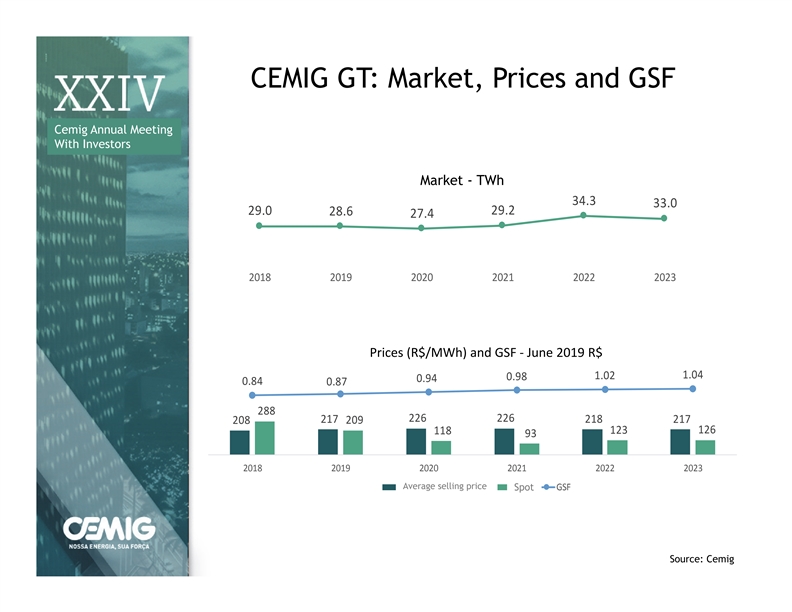
CEMIG GT: Market, Prices and GSF Cemig Annual Meeting With Investors Market - TWh Mercado ‐TWh 34.3 33.0 29.0 29.2 28.6 27.4 2018 2019 2020 2021 2022 2023 Prices (R$/MWh) and GSF ‐June 2019 R$ Preços (R$/MWh) e GSF 700 2 1.02 1.04 0.98 0.94 0.84 600 0.87 1 500 1 400 288 300 226 226 217 218 217 ‐ 208 209 200 126 118 123 93 1 ‐ 100 ‐ 1 ‐ 2018201920202021 20222023 Average selling price Preço medio de venda PLD GSF Spot Moeda Constante Source: CemigCEMIG GT: Market, Prices and GSF Cemig Annual Meeting With Investors Market - TWh Mercado ‐TWh 34.3 33.0 29.0 29.2 28.6 27.4 2018 2019 2020 2021 2022 2023 Prices (R$/MWh) and GSF ‐June 2019 R$ Preços (R$/MWh) e GSF 700 2 1.02 1.04 0.98 0.94 0.84 600 0.87 1 500 1 400 288 300 226 226 217 218 217 ‐ 208 209 200 126 118 123 93 1 ‐ 100 ‐ 1 ‐ 2018201920202021 20222023 Average selling price Preço medio de venda PLD GSF Spot Moeda Constante Source: Cemig

CEMIG GT: Capex (June 2019 R$ mn) Cemig Annual Meeting With Investors 2019-2023 cycle 466 444 Total R$ 1,876 394 89 340 183 117 96 46 30 231 23 281 276 263 261 207 2019 2020 2021 2022 2023 Transmission Generation Capital contributions Transmissão (reforço e melhoria) Geração (operação e manutenção) Aportes – Upgrades and improvements (operation and maintenance) Source: CemigCEMIG GT: Capex (June 2019 R$ mn) Cemig Annual Meeting With Investors 2019-2023 cycle 466 444 Total R$ 1,876 394 89 340 183 117 96 46 30 231 23 281 276 263 261 207 2019 2020 2021 2022 2023 Transmission Generation Capital contributions Transmissão (reforço e melhoria) Geração (operação e manutenção) Aportes – Upgrades and improvements (operation and maintenance) Source: Cemig
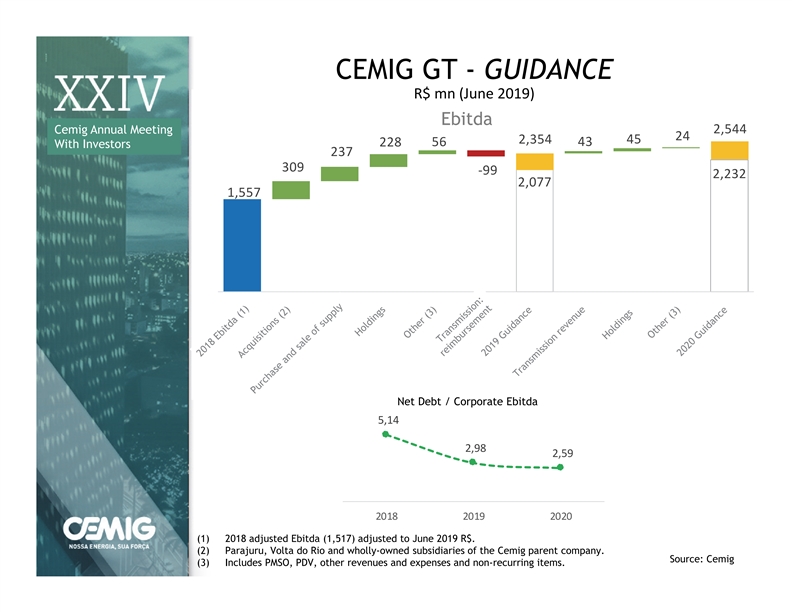
CEMIG GT - GUIDANCE R$ mn(June 2019) Ebitda 2,544 Cemig Annual Meeting 24 2,354 45 56 43 228 With Investors 237 309 ‐99 2,232 2,077 1,557 Net Debt / Corporate Ebitda Dívida Líquida / LAJIDA ‐Societário 5,14 2,98 2,59 2018 2019 2020 (1) 2018 adjusted Ebitda (1,517) adjusted to June 2019 R$. (2) Parajuru, Volta do Rio and wholly-owned subsidiaries of the Cemig parent company. Source: Cemig (3) Includes PMSO, PDV, other revenues and expenses and non-recurring items.CEMIG GT - GUIDANCE R$ mn(June 2019) Ebitda 2,544 Cemig Annual Meeting 24 2,354 45 56 43 228 With Investors 237 309 ‐99 2,232 2,077 1,557 Net Debt / Corporate Ebitda Dívida Líquida / LAJIDA ‐Societário 5,14 2,98 2,59 2018 2019 2020 (1) 2018 adjusted Ebitda (1,517) adjusted to June 2019 R$. (2) Parajuru, Volta do Rio and wholly-owned subsidiaries of the Cemig parent company. Source: Cemig (3) Includes PMSO, PDV, other revenues and expenses and non-recurring items.
Cemig Annual Meeting With Investors CEMIGCemig Annual Meeting With Investors CEMIG
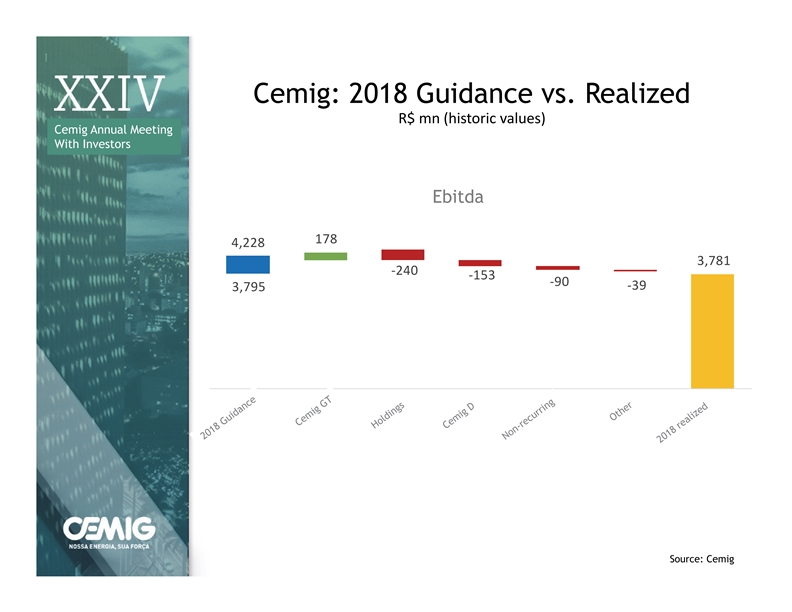
Cemig: 2018 Guidance vs. Realized R$ mn (historic values) Cemig Annual Meeting With Investors Ebitda 178 4,228 3,781 ‐240 ‐153 ‐90 ‐39 3,795 Source: CemigCemig: 2018 Guidance vs. Realized R$ mn (historic values) Cemig Annual Meeting With Investors Ebitda 178 4,228 3,781 ‐240 ‐153 ‐90 ‐39 3,795 Source: Cemig
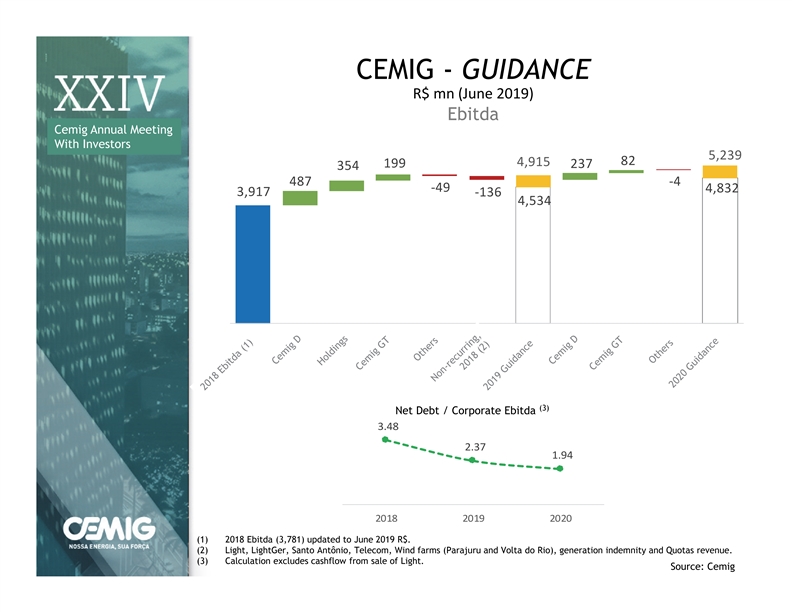
CEMIG - GUIDANCE R$ mn(June 2019) Ebitda Cemig Annual Meeting With Investors 5,239 82 4,915 199 237 354 487 ‐4 ‐49 4,832 3,917 ‐136 4,534 (3) Net Debt / Corporate Ebitda Dívida Líquida / LAJDIA ‐Societário 3.48 2.37 1.94 2018 2019 2020 (1) 2018 Ebitda (3,781) updated to June 2019 R$. (2) Light, LightGer, Santo Antônio, Telecom, Wind farms (Parajuru and Volta do Rio), generation indemnity and Quotas revenue. (3) Calculation excludes cashflow from sale of Light. Source: CemigCEMIG - GUIDANCE R$ mn(June 2019) Ebitda Cemig Annual Meeting With Investors 5,239 82 4,915 199 237 354 487 ‐4 ‐49 4,832 3,917 ‐136 4,534 (3) Net Debt / Corporate Ebitda Dívida Líquida / LAJDIA ‐Societário 3.48 2.37 1.94 2018 2019 2020 (1) 2018 Ebitda (3,781) updated to June 2019 R$. (2) Light, LightGer, Santo Antônio, Telecom, Wind farms (Parajuru and Volta do Rio), generation indemnity and Quotas revenue. (3) Calculation excludes cashflow from sale of Light. Source: Cemig
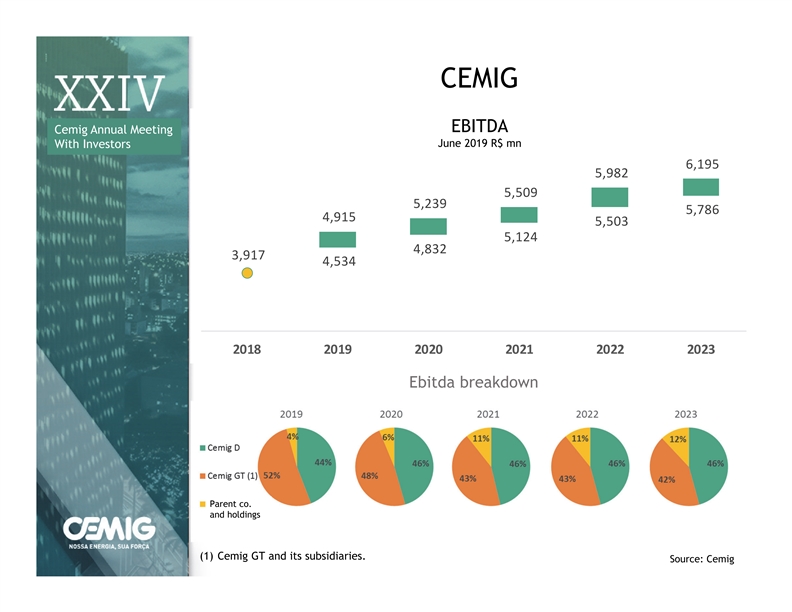
CEMIG EBITDA Cemig Annual Meeting LAJIDA June 2019 R$ mn With Investors R$MM Moeda jun/2019 6,195 5,982 5,509 5,239 5,786 4,915 5,503 5,124 4,832 3,917 4,534 2018 2019 2020 2021 2022 2023 Ebitda breakdown Parent co. Parent co. and holdings and holdings (1) Cemig GT and its subsidiaries. Source: CemigCEMIG EBITDA Cemig Annual Meeting LAJIDA June 2019 R$ mn With Investors R$MM Moeda jun/2019 6,195 5,982 5,509 5,239 5,786 4,915 5,503 5,124 4,832 3,917 4,534 2018 2019 2020 2021 2022 2023 Ebitda breakdown Parent co. Parent co. and holdings and holdings (1) Cemig GT and its subsidiaries. Source: Cemig
14. XXIV CEMIG ANNUAL MEETING WITH INVESTORS DATED MAY 29, 2019: THE 2019 ANNUAL TARIFF ADJUSTMENT
111
th Cemig Annual Meeting With Investors The 2019 annual tariff adjustment Economic Regulation Departmentth Cemig Annual Meeting With Investors The 2019 annual tariff adjustment Economic Regulation Department
th Cemig Annual Meeting With Investors DISCLAIMER Some statements and estimates in this material may represent expectations about future events or results that involve risks and uncertainties known and unknown. There is no guarantee that the events or results referred to in these expectations will occur. These expectations are based on present assumptions and analyses from the viewpoint of our management, based on their experience, the macroeconomic environment, market conditions in the energy sector and our expected future results, manyofwhicharenotunder Cemig’s control. Important factors that can lead to significant differences between actual results and projections about future events or resultsincludeCemig’sbusinessstrategy,Brazilianandinternationaleconomicconditions,technology,Cemig´sfinancial strategy, changes in the energy sector, hydrological conditions, conditions in the financial markets, uncertainty regarding future results of operations, plans and objectives as well as other factors. Because of these and other factors,ouractualresults maydiffersignificantly fromthose indicated inorimplied bythese statements. The information and opinions contained herein should not be understood as a recommendation to potential investors and no investment decision should be based on the truthfulness, or completeness as of the date hereof of this information or these opinions. None of Cemig’s professionals nor any of their related parties or representatives shall have anyliability foranylosses that mayresult fromthe useofthe content ofthis presentation. To evaluate the risks and uncertainties as they relate to Cemig, and to obtain additional information about factors that couldleadtodifferentresultsfromthose estimatedbyCemig, pleaseconsultthesectiononRiskFactorsincludedinour Formulário de Referência filed with the Brazilian Securities Commission – CVM, and in Form 20‐F filed with the U.S. Securities andExchange Commission –SEC. In this material, financial amounts are in R$ million (R$ mn) unless otherwise stated. Financial data reflect the adoption ofIFRSth Cemig Annual Meeting With Investors DISCLAIMER Some statements and estimates in this material may represent expectations about future events or results that involve risks and uncertainties known and unknown. There is no guarantee that the events or results referred to in these expectations will occur. These expectations are based on present assumptions and analyses from the viewpoint of our management, based on their experience, the macroeconomic environment, market conditions in the energy sector and our expected future results, manyofwhicharenotunder Cemig’s control. Important factors that can lead to significant differences between actual results and projections about future events or resultsincludeCemig’sbusinessstrategy,Brazilianandinternationaleconomicconditions,technology,Cemig´sfinancial strategy, changes in the energy sector, hydrological conditions, conditions in the financial markets, uncertainty regarding future results of operations, plans and objectives as well as other factors. Because of these and other factors,ouractualresults maydiffersignificantly fromthose indicated inorimplied bythese statements. The information and opinions contained herein should not be understood as a recommendation to potential investors and no investment decision should be based on the truthfulness, or completeness as of the date hereof of this information or these opinions. None of Cemig’s professionals nor any of their related parties or representatives shall have anyliability foranylosses that mayresult fromthe useofthe content ofthis presentation. To evaluate the risks and uncertainties as they relate to Cemig, and to obtain additional information about factors that couldleadtodifferentresultsfromthose estimatedbyCemig, pleaseconsultthesectiononRiskFactorsincludedinour Formulário de Referência filed with the Brazilian Securities Commission – CVM, and in Form 20‐F filed with the U.S. Securities andExchange Commission –SEC. In this material, financial amounts are in R$ million (R$ mn) unless otherwise stated. Financial data reflect the adoption ofIFRS
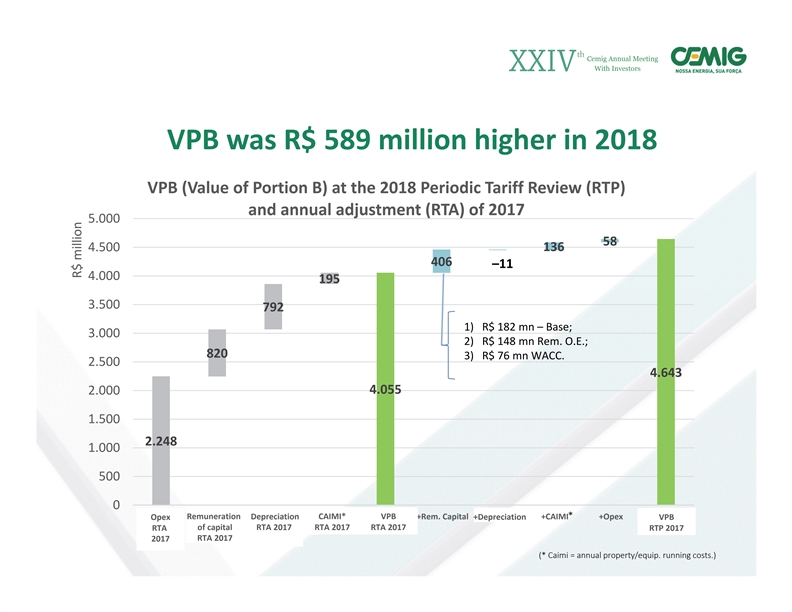
th Cemig Annual Meeting With Investors VPB was R$589 million higher in 2018 VPB (Value of Portion B) at the 2018 Periodic Tariff Review (RTP) and annual adjustment (RTA) of 2017 5.000 58 4.500 136 406 –11 4.000 195 3.500 792 1) R$182 mn –Base; 3.000 2) R$148 mn Rem. O.E.; 820 3) R$76 mn WACC. 2.500 4.643 4.055 2.000 1.500 2.248 1.000 500 0 Opex ReRe muner m. Capital ation De Depr preeciation ciaçao CAIMI CAIMI* RTA17 VPB VPB RTA17 +Rem. Capital +Depreciaçao +CAIMI* +Opex VPB RTP18 Opex +Depreciation VPB RTA17 ofRT capital A17 RTA RTA17 2017 RTA 2017 RTA 2017 RTA RTP 2017 RTA 2017 2017 (* Caimi = annual property/equip. running costs.) R$ millionth Cemig Annual Meeting With Investors VPB was R$589 million higher in 2018 VPB (Value of Portion B) at the 2018 Periodic Tariff Review (RTP) and annual adjustment (RTA) of 2017 5.000 58 4.500 136 406 –11 4.000 195 3.500 792 1) R$182 mn –Base; 3.000 2) R$148 mn Rem. O.E.; 820 3) R$76 mn WACC. 2.500 4.643 4.055 2.000 1.500 2.248 1.000 500 0 Opex ReRe muner m. Capital ation De Depr preeciation ciaçao CAIMI CAIMI* RTA17 VPB VPB RTA17 +Rem. Capital +Depreciaçao +CAIMI* +Opex VPB RTP18 Opex +Depreciation VPB RTA17 ofRT capital A17 RTA RTA17 2017 RTA 2017 RTA 2017 RTA RTP 2017 RTA 2017 2017 (* Caimi = annual property/equip. running costs.) R$ million
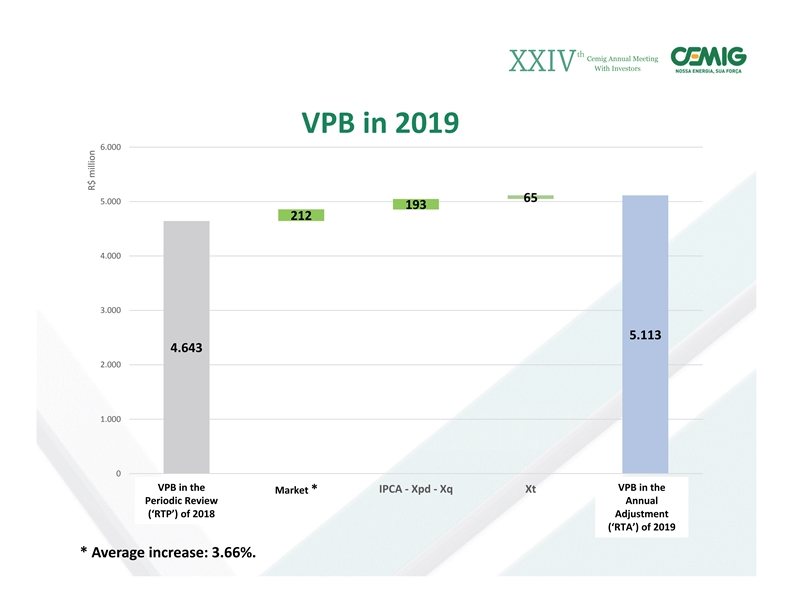
th Cemig Annual Meeting With Investors VPB in 2019 6.000 65 5.000 193 212 4.000 3.000 5.113 4.643 2.000 1.000 0 VPB in the VPB in the VPB RTP 2018 Mercado* IPCA ‐ Xpd ‐ Xq Xt VPB IRT 2019 Market * Periodic Review Annual (‘RTP’) of 2018 Adjustment (‘RTA’) of 2019 * Average increase: 3.66%. R$ millionth Cemig Annual Meeting With Investors VPB in 2019 6.000 65 5.000 193 212 4.000 3.000 5.113 4.643 2.000 1.000 0 VPB in the VPB in the VPB RTP 2018 Mercado* IPCA ‐ Xpd ‐ Xq Xt VPB IRT 2019 Market * Periodic Review Annual (‘RTP’) of 2018 Adjustment (‘RTA’) of 2019 * Average increase: 3.66%. R$ million
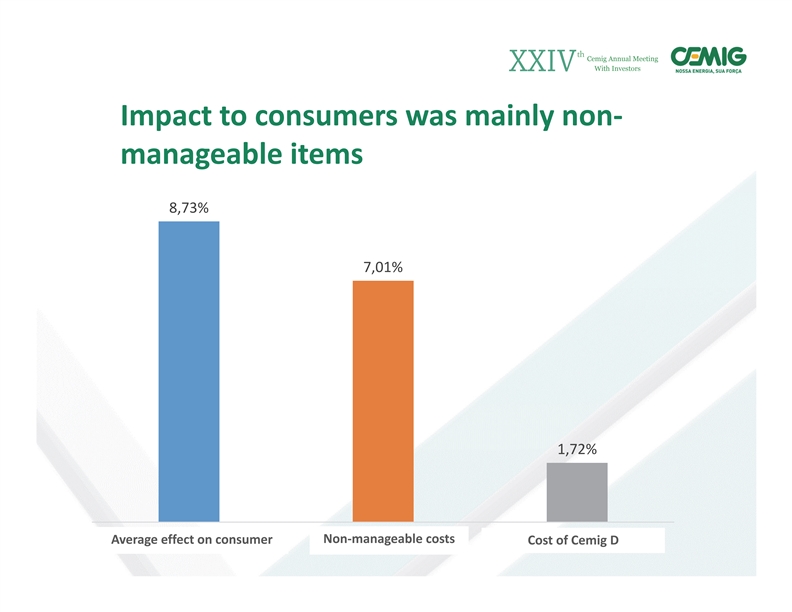
th Cemig Annual Meeting With Investors Impact to consumers was mainly non‐ manageable items 8,73% 7,01% 1,72% Non‐manageable costs Av Efeito erag eMédio effec tC on ons consumer umidor Custos Não Gerenciáveis Custos Cemig Distribuição Cost of Cemig Dth Cemig Annual Meeting With Investors Impact to consumers was mainly non‐ manageable items 8,73% 7,01% 1,72% Non‐manageable costs Av Efeito erag eMédio effec tC on ons consumer umidor Custos Não Gerenciáveis Custos Cemig Distribuição Cost of Cemig D
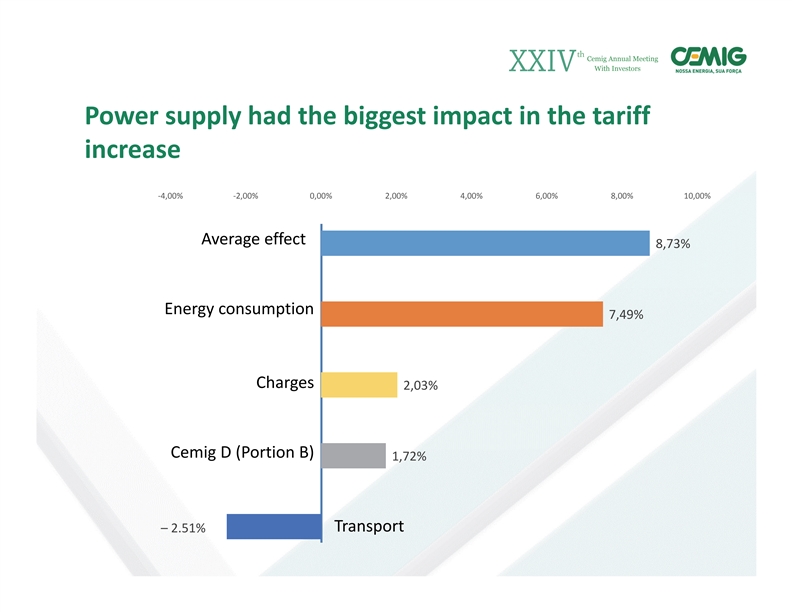
th Cemig Annual Meeting With Investors Power supply had the biggest impact in the tariff increase ‐4,00% ‐2,00% 0,00% 2,00% 4,00% 6,00% 8,00% 10,00% Average effect 8,73% Energy consumption 7,49% Charges 2,03% Cemig D (Portion B) 1,72% –2.51% Transportth Cemig Annual Meeting With Investors Power supply had the biggest impact in the tariff increase ‐4,00% ‐2,00% 0,00% 2,00% 4,00% 6,00% 8,00% 10,00% Average effect 8,73% Energy consumption 7,49% Charges 2,03% Cemig D (Portion B) 1,72% –2.51% Transport
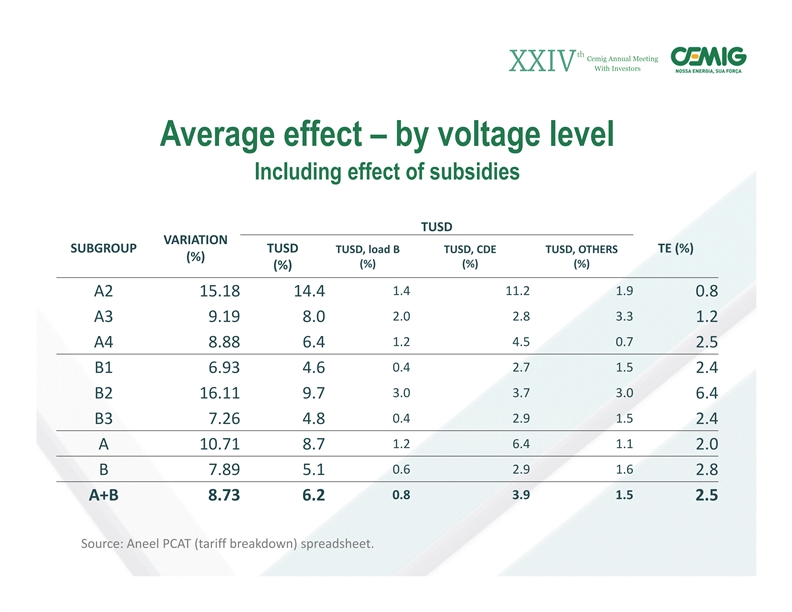
th Cemig Annual Meeting With Investors Average effect – by voltage level Including effect of subsidies TUSD VARIATION SUBGROUP TUSD TUSD, load B TUSD, CDE TUSD, OTHERS TE (%) (%) (%) (%) (%) (%) 1.4 11.2 1.9 A2 15.18 14.4 0.8 2.0 2.8 3.3 A3 9.19 8.0 1.2 1.2 4.5 0.7 A4 8.88 6.4 2.5 0.4 2.7 1.5 B1 6.93 4.6 2.4 3.0 3.7 3.0 B2 16.11 9.7 6.4 0.4 2.9 1.5 B3 7.26 4.8 2.4 1.2 6.4 1.1 A 10.71 8.7 2.0 0.6 2.9 1.6 B 7.89 5.1 2.8 0.8 3.9 1.5 A+B 8.73 6.2 2.5 Source: Aneel PCAT (tariff breakdown) spreadsheet.th Cemig Annual Meeting With Investors Average effect – by voltage level Including effect of subsidies TUSD VARIATION SUBGROUP TUSD TUSD, load B TUSD, CDE TUSD, OTHERS TE (%) (%) (%) (%) (%) (%) 1.4 11.2 1.9 A2 15.18 14.4 0.8 2.0 2.8 3.3 A3 9.19 8.0 1.2 1.2 4.5 0.7 A4 8.88 6.4 2.5 0.4 2.7 1.5 B1 6.93 4.6 2.4 3.0 3.7 3.0 B2 16.11 9.7 6.4 0.4 2.9 1.5 B3 7.26 4.8 2.4 1.2 6.4 1.1 A 10.71 8.7 2.0 0.6 2.9 1.6 B 7.89 5.1 2.8 0.8 3.9 1.5 A+B 8.73 6.2 2.5 Source: Aneel PCAT (tariff breakdown) spreadsheet.
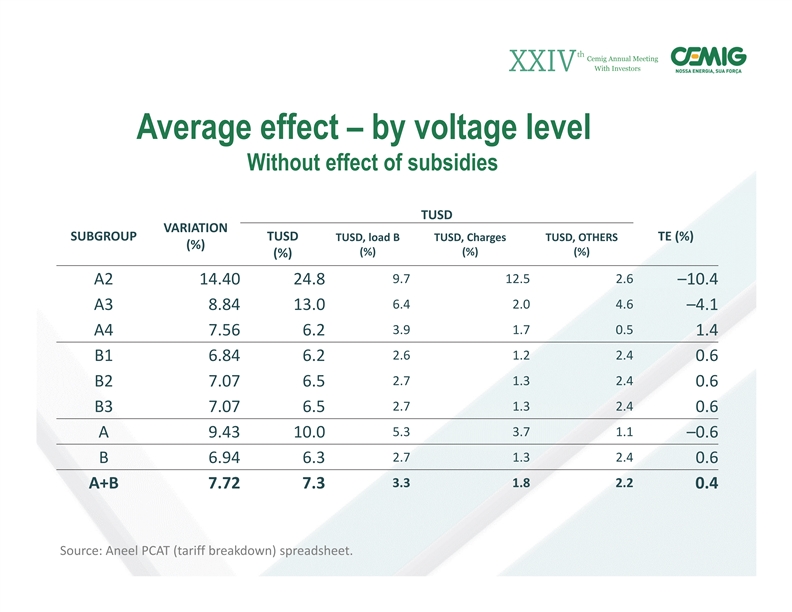
th Cemig Annual Meeting With Investors Average effect – by voltage level Without effect of subsidies TUSD VARIATION SUBGROUP TUSD TUSD, load B TUSD, Charges TUSD, OTHERS TE (%) (%) (%) (%) (%) (%) 9.7 12.5 2.6 A2 14.40 24.8 –10.4 6.4 2.0 4.6 A3 8.84 13.0 –4.1 3.9 1.7 0.5 A4 7.56 6.2 1.4 2.6 1.2 2.4 B1 6.84 6.2 0.6 2.7 1.3 2.4 B2 7.07 6.5 0.6 2.7 1.3 2.4 B3 7.07 6.5 0.6 5.3 3.7 1.1 A 9.43 10.0 –0.6 2.7 1.3 2.4 B 6.94 6.3 0.6 3.3 1.8 2.2 A+B 7.72 7.3 0.4 Source: Aneel PCAT (tariff breakdown) spreadsheet.th Cemig Annual Meeting With Investors Average effect – by voltage level Without effect of subsidies TUSD VARIATION SUBGROUP TUSD TUSD, load B TUSD, Charges TUSD, OTHERS TE (%) (%) (%) (%) (%) (%) 9.7 12.5 2.6 A2 14.40 24.8 –10.4 6.4 2.0 4.6 A3 8.84 13.0 –4.1 3.9 1.7 0.5 A4 7.56 6.2 1.4 2.6 1.2 2.4 B1 6.84 6.2 0.6 2.7 1.3 2.4 B2 7.07 6.5 0.6 2.7 1.3 2.4 B3 7.07 6.5 0.6 5.3 3.7 1.1 A 9.43 10.0 –0.6 2.7 1.3 2.4 B 6.94 6.3 0.6 3.3 1.8 2.2 A+B 7.72 7.3 0.4 Source: Aneel PCAT (tariff breakdown) spreadsheet.
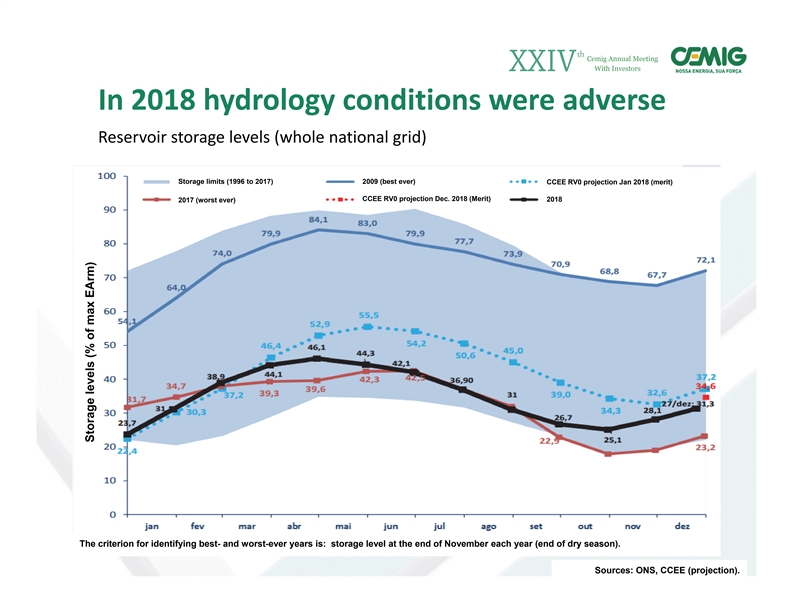
th Cemig Annual Meeting With Investors In 2018 hydrology conditions were adverse Reservoir storage levels (whole national grid) Storage limits (1996 to 2017) 2009 (best ever) CCEE RV0 projection Jan 2018 (merit) CCEE RV0 projection Dec. 2018 (Merit) 2018 2017 (worst ever) The criterion for identifying best- and worst-ever years is: storage level at the end of November each year (end of dry season). Sources: ONS, CCEE (projection). Storage levels (% of max EArm)th Cemig Annual Meeting With Investors In 2018 hydrology conditions were adverse Reservoir storage levels (whole national grid) Storage limits (1996 to 2017) 2009 (best ever) CCEE RV0 projection Jan 2018 (merit) CCEE RV0 projection Dec. 2018 (Merit) 2018 2017 (worst ever) The criterion for identifying best- and worst-ever years is: storage level at the end of November each year (end of dry season). Sources: ONS, CCEE (projection). Storage levels (% of max EArm)
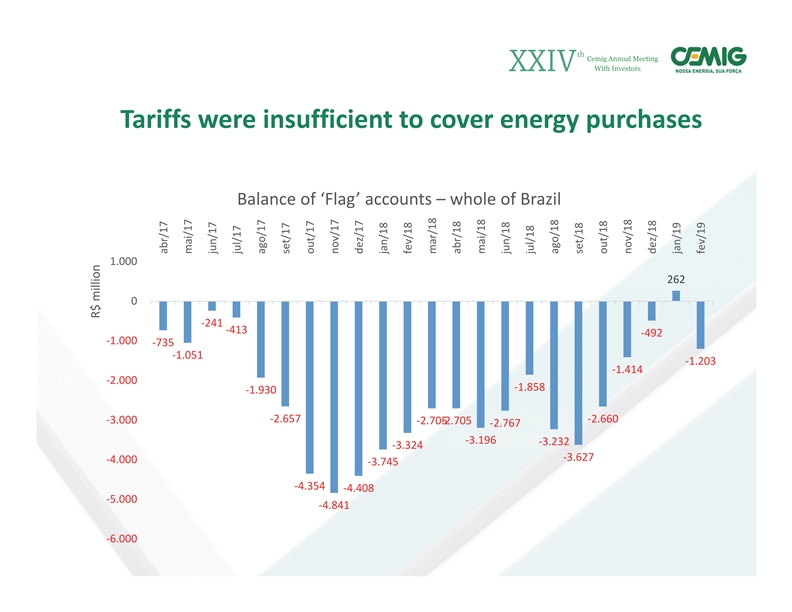
th Cemig Annual Meeting With Investors Tariffs were insufficient to cover energy purchases Balance of ‘Flag’ accounts –whole of Brazil 1.000 262 0 ‐241 ‐413 ‐492 ‐1.000 ‐735 ‐1.051 ‐1.203 ‐1.414 ‐2.000 ‐1.858 ‐1.930 ‐2.657 ‐2.660 ‐3.000 ‐2.705 ‐2.705 ‐2.767 ‐3.196 ‐3.232 ‐3.324 ‐3.627 ‐4.000 ‐3.745 ‐4.354 ‐4.408 ‐5.000 ‐4.841 ‐6.000 R$ million abr/17 mai/17 jun/17 jul/17 ago/17 set/17 out/17 nov/17 dez/17 jan/18 fev/18 mar/18 abr/18 mai/18 jun/18 jul/18 ago/18 set/18 out/18 nov/18 dez/18 jan/19 fev/19th Cemig Annual Meeting With Investors Tariffs were insufficient to cover energy purchases Balance of ‘Flag’ accounts –whole of Brazil 1.000 262 0 ‐241 ‐413 ‐492 ‐1.000 ‐735 ‐1.051 ‐1.203 ‐1.414 ‐2.000 ‐1.858 ‐1.930 ‐2.657 ‐2.660 ‐3.000 ‐2.705 ‐2.705 ‐2.767 ‐3.196 ‐3.232 ‐3.324 ‐3.627 ‐4.000 ‐3.745 ‐4.354 ‐4.408 ‐5.000 ‐4.841 ‐6.000 R$ million abr/17 mai/17 jun/17 jul/17 ago/17 set/17 out/17 nov/17 dez/17 jan/18 fev/18 mar/18 abr/18 mai/18 jun/18 jul/18 ago/18 set/18 out/18 nov/18 dez/18 jan/19 fev/19
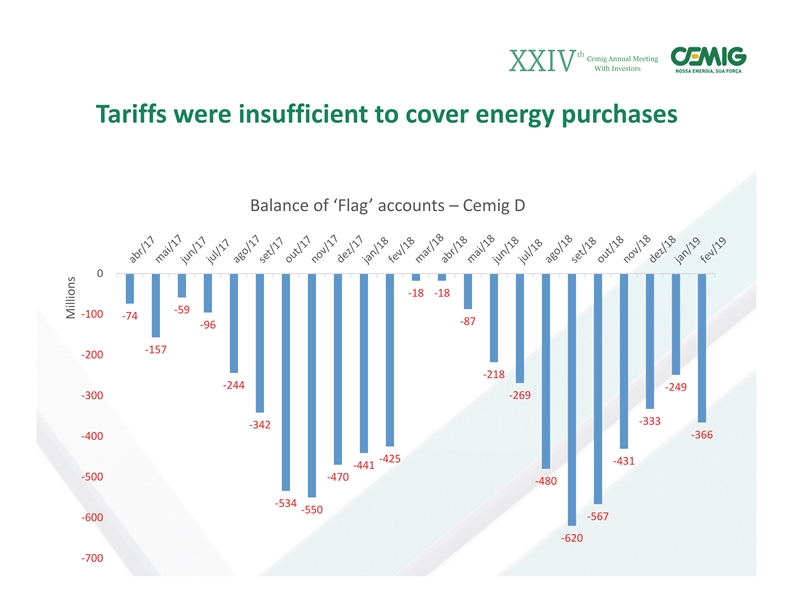
th Cemig Annual Meeting With Investors Tariffs were insufficient to cover energy purchases Balance of ‘Flag’ accounts –Cemig D 0 ‐18 ‐18 ‐59 ‐100 ‐74 ‐87 ‐96 ‐157 ‐200 ‐218 ‐244 ‐249 ‐300 ‐269 ‐333 ‐342 ‐366 ‐400 ‐425 ‐431 ‐441 ‐500 ‐470 ‐480 ‐534 ‐550 ‐567 ‐600 ‐620 ‐700 Millionsth Cemig Annual Meeting With Investors Tariffs were insufficient to cover energy purchases Balance of ‘Flag’ accounts –Cemig D 0 ‐18 ‐18 ‐59 ‐100 ‐74 ‐87 ‐96 ‐157 ‐200 ‐218 ‐244 ‐249 ‐300 ‐269 ‐333 ‐342 ‐366 ‐400 ‐425 ‐431 ‐441 ‐500 ‐470 ‐480 ‐534 ‐550 ‐567 ‐600 ‐620 ‐700 Millions
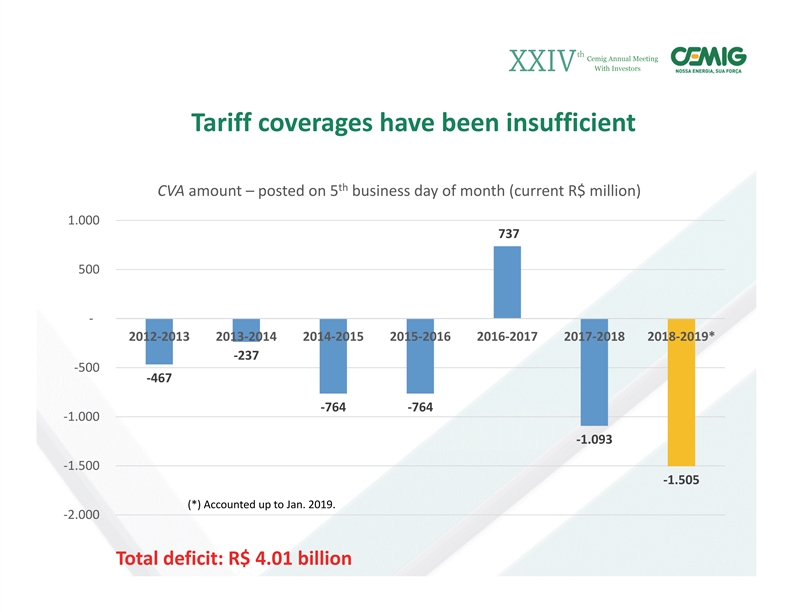
th Cemig Annual Meeting With Investors Tariff coverages have been insufficient th CVAamount –posted on 5 business day of month (current R$ million) 1.000 737 500 ‐ 2012‐2013 2013‐2014 2014‐2015 2015‐2016 2016‐2017 2017‐2018 2018‐2019* ‐237 ‐500 ‐467 ‐764 ‐764 ‐1.000 ‐1.093 ‐1.500 ‐1.505 (*) Accounted up to Jan. 2019. ‐2.000 Total deficit: R$ 4.01 billionth Cemig Annual Meeting With Investors Tariff coverages have been insufficient th CVAamount –posted on 5 business day of month (current R$ million) 1.000 737 500 ‐ 2012‐2013 2013‐2014 2014‐2015 2015‐2016 2016‐2017 2017‐2018 2018‐2019* ‐237 ‐500 ‐467 ‐764 ‐764 ‐1.000 ‐1.093 ‐1.500 ‐1.505 (*) Accounted up to Jan. 2019. ‐2.000 Total deficit: R$ 4.01 billion
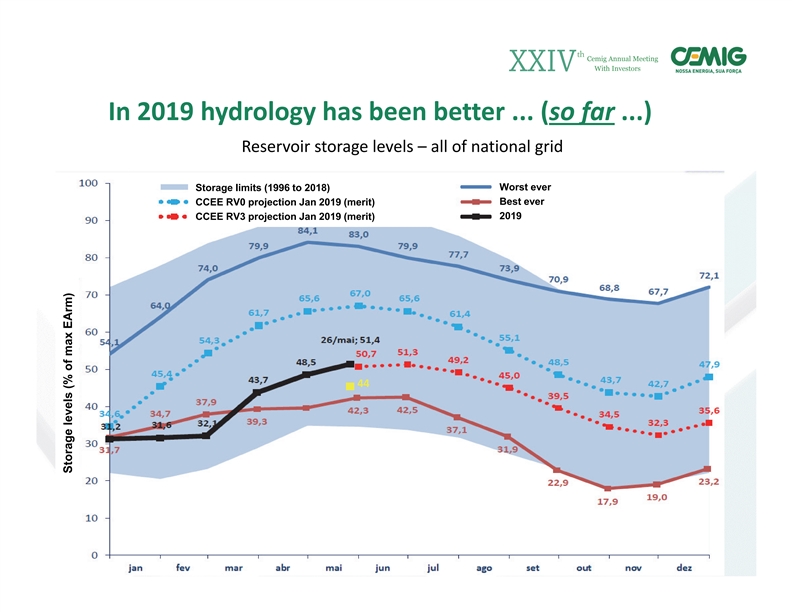
th Cemig Annual Meeting With Investors In 2019 hydrology has been better ... (so far...) Reservoir storage levels –all of national grid Storage limits (1996 to 2018) Worst ever Best ever CCEE RV0 projection Jan 2019 (merit) 2019 CCEE RV3 projection Jan 2019 (merit) 44 Storage levels (% of max EArm)th Cemig Annual Meeting With Investors In 2019 hydrology has been better ... (so far...) Reservoir storage levels –all of national grid Storage limits (1996 to 2018) Worst ever Best ever CCEE RV0 projection Jan 2019 (merit) 2019 CCEE RV3 projection Jan 2019 (merit) 44 Storage levels (% of max EArm)

Investor Relations Tel: +55 (31) 3506-5024 ri@cemig.com.br http://ri.cemig.com.brInvestor Relations Tel: +55 (31) 3506-5024 ri@cemig.com.br http://ri.cemig.com.br
15. XXIV CEMIG ANNUAL MEETING WITH INVESTORS DATED MAY 29, 2019: CEMIG GT AND THE GRID: SUPPLY AND DEMAND
126

th Cemig Annual Meeting With Investors Cemig GT and the Grid: Supply and demandth Cemig Annual Meeting With Investors Cemig GT and the Grid: Supply and demand

DISCLAIMER Some statements and estimates in this material may represent expectations about future events or results that involve risks and uncertainties known and unknown. There is no guarantee that the events or results referred to in these expectations willoccur. These expectations are based on present assumptions and analyses from the viewpoint of our management, based on their experience, the macroeconomic environment, market conditions in the energy sector and our expected future results, manyofwhicharenotunder Cemig’s control. Important factors that can lead to significant differences between actual results and projections about future events or results include Cemig’s business strategy, Brazilian and international economic conditions, technology, Cemig´s financial strategy, changes in the energy sector, hydrological conditions, conditions in the financial markets, uncertainty regarding future results of operations, plans and objectives as well as other factors. Because of these andotherfactors,ouractual results maydiffersignificantly fromthose indicated inorimplied bythese statements. The information and opinions contained herein should not be understood as a recommendation to potential investors and no investment decision should be based on the truthfulness, or completeness as of the date hereof of this information or these opinions. None of Cemig’s professionals nor any of their related parties or representatives shall haveanyliability foranylossesthat mayresult fromtheuseofthecontent ofthis presentation. To evaluate the risks and uncertainties as they relate to Cemig, and to obtain additional information about factors that could lead to different results from those estimated by Cemig, please consult the section on Risk Factors included in our Formulário de Referência filed with the Brazilian Securities Commission – CVM, and in Form20‐Ffiled withtheU.S.Securities andExchange Commission –SEC. In this material, financial amounts are in R$ million (R$ mn) unless otherwise stated. Financial data reflect the adoption ofIFRSDISCLAIMER Some statements and estimates in this material may represent expectations about future events or results that involve risks and uncertainties known and unknown. There is no guarantee that the events or results referred to in these expectations willoccur. These expectations are based on present assumptions and analyses from the viewpoint of our management, based on their experience, the macroeconomic environment, market conditions in the energy sector and our expected future results, manyofwhicharenotunder Cemig’s control. Important factors that can lead to significant differences between actual results and projections about future events or results include Cemig’s business strategy, Brazilian and international economic conditions, technology, Cemig´s financial strategy, changes in the energy sector, hydrological conditions, conditions in the financial markets, uncertainty regarding future results of operations, plans and objectives as well as other factors. Because of these andotherfactors,ouractual results maydiffersignificantly fromthose indicated inorimplied bythese statements. The information and opinions contained herein should not be understood as a recommendation to potential investors and no investment decision should be based on the truthfulness, or completeness as of the date hereof of this information or these opinions. None of Cemig’s professionals nor any of their related parties or representatives shall haveanyliability foranylossesthat mayresult fromtheuseofthecontent ofthis presentation. To evaluate the risks and uncertainties as they relate to Cemig, and to obtain additional information about factors that could lead to different results from those estimated by Cemig, please consult the section on Risk Factors included in our Formulário de Referência filed with the Brazilian Securities Commission – CVM, and in Form20‐Ffiled withtheU.S.Securities andExchange Commission –SEC. In this material, financial amounts are in R$ million (R$ mn) unless otherwise stated. Financial data reflect the adoption ofIFRS
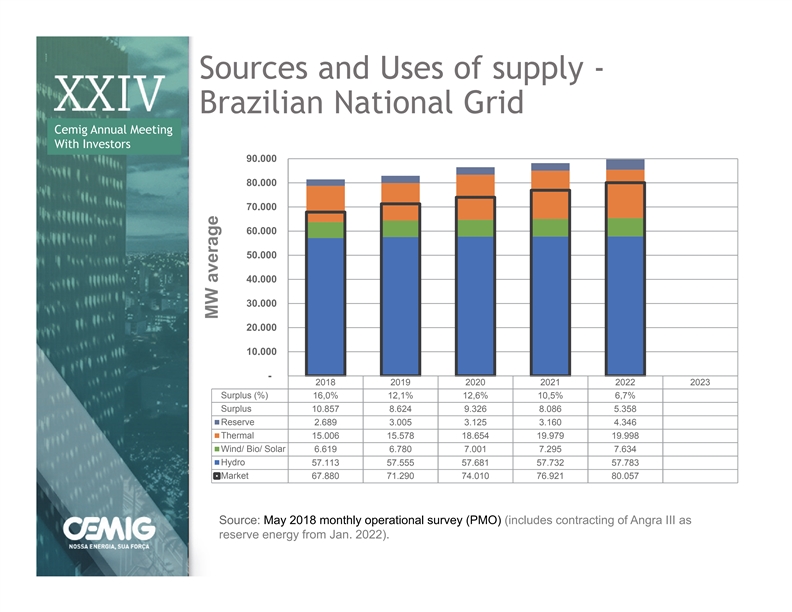
Sources and Uses of supply - Brazilian National Grid Cemig Annual Meeting With Investors 90.000 80.000 70.000 60.000 50.000 40.000 30.000 20.000 10.000 - 2018 2019 2020 2021 2022 2023 Surplus (%) 16,0% 12,1% 12,6% 10,5% 6,7% Surplus 10.857 8.624 9.326 8.086 5.358 Reserve 2.689 3.005 3.125 3.160 4.346 Thermal 15.006 15.578 18.654 19.979 19.998 Wind/ Bio/ Solar 6.619 6.780 7.001 7.295 7.634 Hydro 57.113 57.555 57.681 57.732 57.783 Market 67.880 71.290 74.010 76.921 80.057 Source: May 2018 monthly operational survey (PMO) (includes contracting of Angra III as reserve energy from Jan. 2022). MW averageSources and Uses of supply - Brazilian National Grid Cemig Annual Meeting With Investors 90.000 80.000 70.000 60.000 50.000 40.000 30.000 20.000 10.000 - 2018 2019 2020 2021 2022 2023 Surplus (%) 16,0% 12,1% 12,6% 10,5% 6,7% Surplus 10.857 8.624 9.326 8.086 5.358 Reserve 2.689 3.005 3.125 3.160 4.346 Thermal 15.006 15.578 18.654 19.979 19.998 Wind/ Bio/ Solar 6.619 6.780 7.001 7.295 7.634 Hydro 57.113 57.555 57.681 57.732 57.783 Market 67.880 71.290 74.010 76.921 80.057 Source: May 2018 monthly operational survey (PMO) (includes contracting of Angra III as reserve energy from Jan. 2022). MW average

Sources and Uses of supply - Brazilian National Grid Cemig Annual Meeting With Investors 90.000 80.000 70.000 60.000 50.000 40.000 30.000 20.000 10.000 - 2018 2019 2020 2021 2022 2023 Surplus (%) 17,8% 14,9% 13,0% 9,4% 5,8% Suplus 12.372 10.933 9.897 7.426 4.758 Reserve 2.792 2.585 2.646 3.879 3.906 Thermal 15.081 18.220 19.514 19.585 19.598 Wind, Bio, Solar 9.403 8.268 8.548 8.762 9.260 Hydro 57.300 57.649 57.709 57.792 57.801 Market 69.412 73.203 75.874 78.712 81.901 Source: May 2019 monthly operational survey (PMO). MW averageSources and Uses of supply - Brazilian National Grid Cemig Annual Meeting With Investors 90.000 80.000 70.000 60.000 50.000 40.000 30.000 20.000 10.000 - 2018 2019 2020 2021 2022 2023 Surplus (%) 17,8% 14,9% 13,0% 9,4% 5,8% Suplus 12.372 10.933 9.897 7.426 4.758 Reserve 2.792 2.585 2.646 3.879 3.906 Thermal 15.081 18.220 19.514 19.585 19.598 Wind, Bio, Solar 9.403 8.268 8.548 8.762 9.260 Hydro 57.300 57.649 57.709 57.792 57.801 Market 69.412 73.203 75.874 78.712 81.901 Source: May 2019 monthly operational survey (PMO). MW average
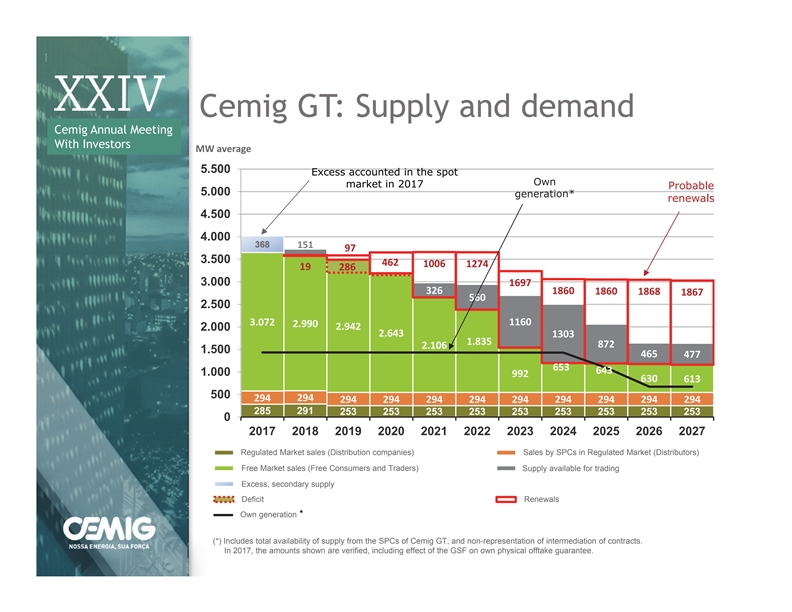
Cemig GT: Supply and demand Cemig Annual Meeting With Investors MW average 5.500 Excess accounted in the spot market in 2017 Probable 5.000 renewals 4.500 4.000 368 151 97 3.500 462 1006 1274 19 286 3.000 1697 326 1860 1860 1868 1867 560 2.500 1160 3.072 2.990 2.942 2.000 2.643 1303 1.835 872 2.106 1.500 465 477 653 643 1.000 992 630 613 500 294 294 294 294 294 294 294 294 294 294 294 285 291 253 253 253 253 253 253 253 253 253 0 2017 2018 2019 2020 2021 2022 2023 2024 2025 2026 2027 Vendas Regulate ACR d Market sales (Distribuidoras) (Distribution companies) Vendas Sales by ACR SPCs in Regulated SPEs (distribuidorMarket as) (Distributors) Vendas Free Market sales (Free ACL (Consumidore Consumers s Livres e Come and Traders) rcializadoras) Re Supply cursos available Disponívfor eis trading para Comercialização Sobra Excess, secondar Energia Secun y d supply ária Base Défic Deficit it Re Renew novaçõe alss Own generation * Recursos Próprios (*) Includes total availability of supply from the SPCs of Cemig GT, and non-representation of intermediation of contracts. In 2017, the amounts shown are verified, including effect of the GSF on own physical offtake guarantee.Cemig GT: Supply and demand Cemig Annual Meeting With Investors MW average 5.500 Excess accounted in the spot market in 2017 Probable 5.000 renewals 4.500 4.000 368 151 97 3.500 462 1006 1274 19 286 3.000 1697 326 1860 1860 1868 1867 560 2.500 1160 3.072 2.990 2.942 2.000 2.643 1303 1.835 872 2.106 1.500 465 477 653 643 1.000 992 630 613 500 294 294 294 294 294 294 294 294 294 294 294 285 291 253 253 253 253 253 253 253 253 253 0 2017 2018 2019 2020 2021 2022 2023 2024 2025 2026 2027 Vendas Regulate ACR d Market sales (Distribuidoras) (Distribution companies) Vendas Sales by ACR SPCs in Regulated SPEs (distribuidorMarket as) (Distributors) Vendas Free Market sales (Free ACL (Consumidore Consumers s Livres e Come and Traders) rcializadoras) Re Supply cursos available Disponívfor eis trading para Comercialização Sobra Excess, secondar Energia Secun y d supply ária Base Défic Deficit it Re Renew novaçõe alss Own generation * Recursos Próprios (*) Includes total availability of supply from the SPCs of Cemig GT, and non-representation of intermediation of contracts. In 2017, the amounts shown are verified, including effect of the GSF on own physical offtake guarantee.
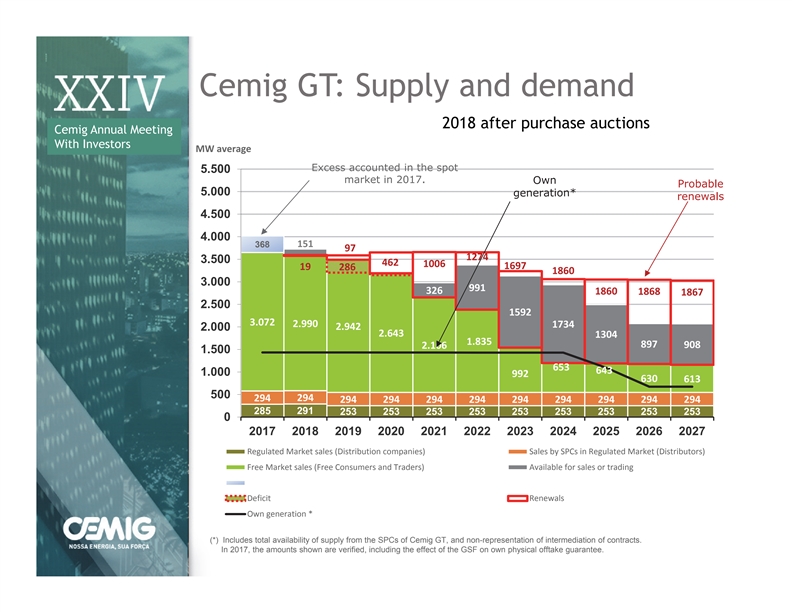
Cemig GT: Supply and demand 2018 after purchase auctions Cemig Annual Meeting With Investors MW average Excess accounted in the spot 5.500 market in 2017. Probable 5.000 renewals 4.500 4.000 368 151 97 1274 3.500 462 1006 1697 19 286 1860 3.000 991 326 1860 1868 1867 2.500 1592 3.072 2.990 1734 2.942 2.000 2.643 1304 1.835 897 908 2.106 1.500 653 643 1.000 992 630 613 500 294 294 294 294 294 294 294 294 294 294 294 285 291 253 253 253 253 253 253 253 253 253 0 2017 2018 2019 2020 2021 2022 2023 2024 2025 2026 2027 Regulated Market sales (Distribution companies) Sales by SPCs in Regulated Market (Distributors) Free Market sales (Free Consumers and Traders) Available for sales or trading Base Deficit Renewals Own generation * (*) Includes total availability of supply from the SPCs of Cemig GT, and non-representation of intermediation of contracts. In 2017, the amounts shown are verified, including the effect of the GSF on own physical offtake guarantee.Cemig GT: Supply and demand 2018 after purchase auctions Cemig Annual Meeting With Investors MW average Excess accounted in the spot 5.500 market in 2017. Probable 5.000 renewals 4.500 4.000 368 151 97 1274 3.500 462 1006 1697 19 286 1860 3.000 991 326 1860 1868 1867 2.500 1592 3.072 2.990 1734 2.942 2.000 2.643 1304 1.835 897 908 2.106 1.500 653 643 1.000 992 630 613 500 294 294 294 294 294 294 294 294 294 294 294 285 291 253 253 253 253 253 253 253 253 253 0 2017 2018 2019 2020 2021 2022 2023 2024 2025 2026 2027 Regulated Market sales (Distribution companies) Sales by SPCs in Regulated Market (Distributors) Free Market sales (Free Consumers and Traders) Available for sales or trading Base Deficit Renewals Own generation * (*) Includes total availability of supply from the SPCs of Cemig GT, and non-representation of intermediation of contracts. In 2017, the amounts shown are verified, including the effect of the GSF on own physical offtake guarantee.

Cemig GT: Supply and demand Cemig Annual Meeting With Investors MW average 5.500 Excess accounted in the spot market in 2018 Probable 5.000 renewals 4.500 4.000 841 156 144 1521 171 3.500 10 474 618 1771 1841 1803 3.000 46 1227 496 1799 874 1783 1494 2.500 1244 3.010 2.942 2.000 769 1152 2.643 1173 541 2.106 638 1.500 1.835 103 454 992 123 112 643 630 1.000 653 835 613 500 294 294 294 294 294 294 294 294 294 294 294 285 253 253 253 253 253 253 253 253 253 253 0 2018 2019 2020 2021 2022 2023 2024 2025 2026 2027 2028 Vendas ACR (Distribuidoras) Vendas ACR SPEs (distribuidoras) Regulated Market sales (Distribution companies) Sales by SPCs in Regulated Market (Distributors) Free Market sales (Free Consumers and Traders) Vendas ACL (Consumidores Livres e Comercializadoras) Vendas Sales ACL in Regulated (Novos Con Market (New tratos) contracts) Re Supply cursos available Disponív for eistrading para Comercialização Sobra Energia Secundária Excess, secondary supply Défic Deficit it Re Ow cur n generatio sos Próprios n (*) Includes total availability of supply from the SPCs of Cemig GT, and non-representation of the intermediation of contracts. In 2018, the amounts shown are verified, including the effect of the GSF on own physical offtake guarantee.Cemig GT: Supply and demand Cemig Annual Meeting With Investors MW average 5.500 Excess accounted in the spot market in 2018 Probable 5.000 renewals 4.500 4.000 841 156 144 1521 171 3.500 10 474 618 1771 1841 1803 3.000 46 1227 496 1799 874 1783 1494 2.500 1244 3.010 2.942 2.000 769 1152 2.643 1173 541 2.106 638 1.500 1.835 103 454 992 123 112 643 630 1.000 653 835 613 500 294 294 294 294 294 294 294 294 294 294 294 285 253 253 253 253 253 253 253 253 253 253 0 2018 2019 2020 2021 2022 2023 2024 2025 2026 2027 2028 Vendas ACR (Distribuidoras) Vendas ACR SPEs (distribuidoras) Regulated Market sales (Distribution companies) Sales by SPCs in Regulated Market (Distributors) Free Market sales (Free Consumers and Traders) Vendas ACL (Consumidores Livres e Comercializadoras) Vendas Sales ACL in Regulated (Novos Con Market (New tratos) contracts) Re Supply cursos available Disponív for eistrading para Comercialização Sobra Energia Secundária Excess, secondary supply Défic Deficit it Re Ow cur n generatio sos Próprios n (*) Includes total availability of supply from the SPCs of Cemig GT, and non-representation of the intermediation of contracts. In 2018, the amounts shown are verified, including the effect of the GSF on own physical offtake guarantee.
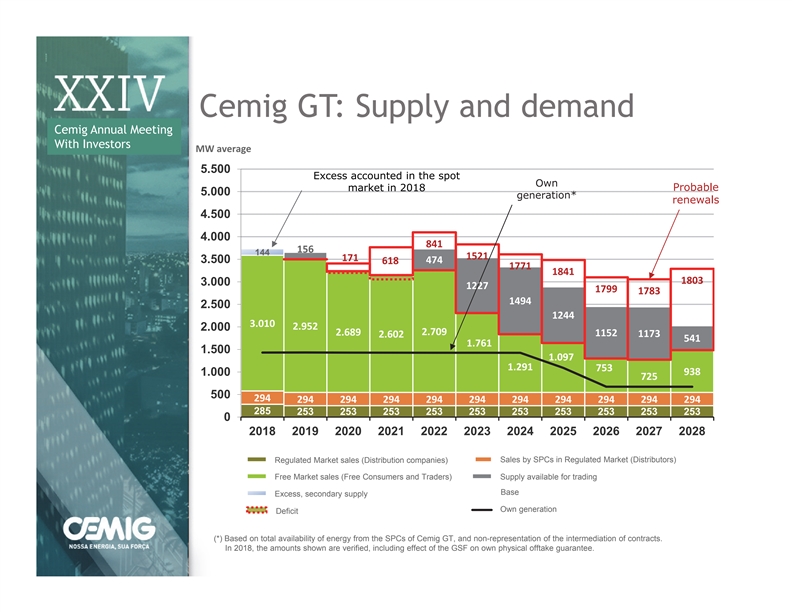
Cemig GT: Supply and demand Cemig Annual Meeting With Investors MW average 5.500 Excess accounted in the spot market in 2018 Probable 5.000 renewals 4.500 4.000 841 156 144 1521 171 3.500 474 618 1771 1841 1803 3.000 1227 1799 1783 1494 2.500 1244 3.010 2.952 2.000 2.709 2.689 1152 1173 2.602 541 1.761 1.500 1.097 1.291 753 938 1.000 725 500 294 294 294 294 294 294 294 294 294 294 294 285 253 253 253 253 253 253 253 253 253 253 0 2018 2019 2020 2021 2022 2023 2024 2025 2026 2027 2028 Vendas ACR (Distribuidoras) Vendas Sales ACR by SPCs in Regulated SPEs (distribuidora Market s) (Distributors) Regulated Market sales (Distribution companies) Vendas ACL (Consumidores Livres e Comercializadoras) Recursos Disponíveis para Comercialização Free Market sales (Free Consumers and Traders) Supply available for trading Base Sobra Energia Secundária Base Excess, secondary supply Own generation Déficit Recursos Próprios Deficit (*) Based on total availability of energy from the SPCs of Cemig GT, and non-representation of the intermediation of contracts. In 2018, the amounts shown are verified, including effect of the GSF on own physical offtake guarantee.Cemig GT: Supply and demand Cemig Annual Meeting With Investors MW average 5.500 Excess accounted in the spot market in 2018 Probable 5.000 renewals 4.500 4.000 841 156 144 1521 171 3.500 474 618 1771 1841 1803 3.000 1227 1799 1783 1494 2.500 1244 3.010 2.952 2.000 2.709 2.689 1152 1173 2.602 541 1.761 1.500 1.097 1.291 753 938 1.000 725 500 294 294 294 294 294 294 294 294 294 294 294 285 253 253 253 253 253 253 253 253 253 253 0 2018 2019 2020 2021 2022 2023 2024 2025 2026 2027 2028 Vendas ACR (Distribuidoras) Vendas Sales ACR by SPCs in Regulated SPEs (distribuidora Market s) (Distributors) Regulated Market sales (Distribution companies) Vendas ACL (Consumidores Livres e Comercializadoras) Recursos Disponíveis para Comercialização Free Market sales (Free Consumers and Traders) Supply available for trading Base Sobra Energia Secundária Base Excess, secondary supply Own generation Déficit Recursos Próprios Deficit (*) Based on total availability of energy from the SPCs of Cemig GT, and non-representation of the intermediation of contracts. In 2018, the amounts shown are verified, including effect of the GSF on own physical offtake guarantee.
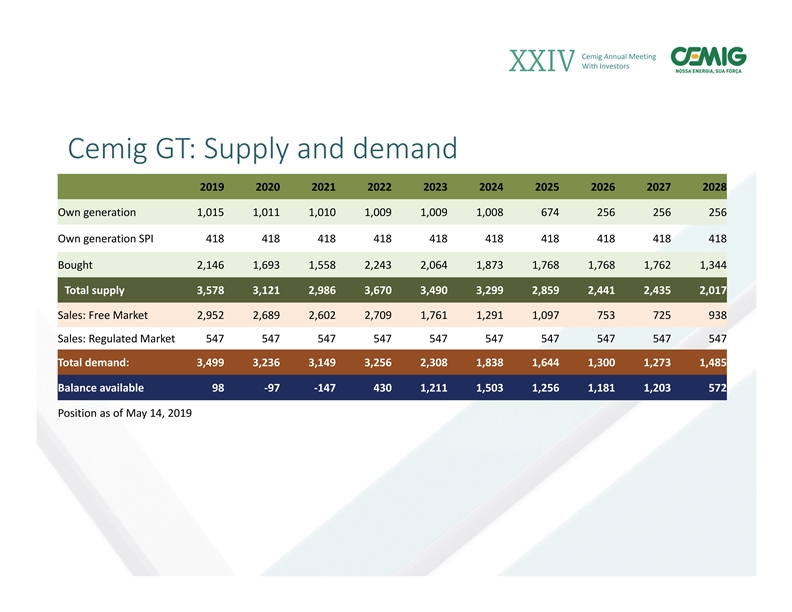
Cemig Annual Meeting With Investors Cemig GT: Supply and demand 2019 2020 2021 2022 2023 2024 2025 2026 2027 2028 Own generation 1,015 1,011 1,010 1,009 1,009 1,008 674 256 256 256 Own generation SPI 418 418 418 418 418 418 418 418 418 418 Bought 2,146 1,693 1,558 2,243 2,064 1,873 1,768 1,768 1,762 1,344 Total supply 3,578 3,121 2,986 3,670 3,490 3,299 2,859 2,441 2,435 2,017 Sales: Free Market 2,952 2,689 2,602 2,709 1,761 1,291 1,097 753 725 938 Sales: Regulated Market 547 547 547 547 547 547 547 547 547 547 Total demand: 3,499 3,236 3,149 3,256 2,308 1,838 1,644 1,300 1,273 1,485 Balance available 98 ‐97 ‐147 430 1,211 1,503 1,256 1,181 1,203 572 Position as ofMay 14, 2019Cemig Annual Meeting With Investors Cemig GT: Supply and demand 2019 2020 2021 2022 2023 2024 2025 2026 2027 2028 Own generation 1,015 1,011 1,010 1,009 1,009 1,008 674 256 256 256 Own generation SPI 418 418 418 418 418 418 418 418 418 418 Bought 2,146 1,693 1,558 2,243 2,064 1,873 1,768 1,768 1,762 1,344 Total supply 3,578 3,121 2,986 3,670 3,490 3,299 2,859 2,441 2,435 2,017 Sales: Free Market 2,952 2,689 2,602 2,709 1,761 1,291 1,097 753 725 938 Sales: Regulated Market 547 547 547 547 547 547 547 547 547 547 Total demand: 3,499 3,236 3,149 3,256 2,308 1,838 1,644 1,300 1,273 1,485 Balance available 98 ‐97 ‐147 430 1,211 1,503 1,256 1,181 1,203 572 Position as ofMay 14, 2019

Cemig Annual Meeting With Investors Investor Relations Tel: +55 (31) 3506-5024 ri@cemig.com.br http://ri.cemig.com.brCemig Annual Meeting With Investors Investor Relations Tel: +55 (31) 3506-5024 ri@cemig.com.br http://ri.cemig.com.br
16. MATERIAL ANNOUNCEMENT DATED MAY 31, 2019: TAESA COMPLETED THE ACQUISITION OF LOTS IN ELETROBRAS AUCTION 01/2018
137
COMPANHIA ENERGÉTICA DE MINAS GERAIS – CEMIG
LISTED COMPANY – CNPJ 17.155.730/0001-64 – NIRE 31300040127
MATERIAL ANNOUNCEMENT
TAESA – Acquisition of lots in Eletrobras Auction 01/2018 completed
Cemig (Companhia Energética de Minas Gerais, listed and traded in São Paulo, New York and Madrid), in accordance with CVM Instruction 358 of Jan. 3, 2002 as amended, hereby reports to the Brazilian Securities Commission (CVM), the São Paulo Stock Exchange (B3) and the market as follows:
Cemig’s affiliated company Transmissora Aliança de Energia Elétrica S.A. (‘Taesa’) has today published the following Material Announcement:
| “ | Transmissora Aliança de Energia Elétrica S.A. (B3: TAEE11) (‘Taesa’) based on CVM Instruction 358/02 as amended, hereby informs its stockholders, and the market as follows: |
In continuation of the reports given in the
– Material Announcements published September 27, October 4 and November 26, 2018
and January 15 and April 29, 2019, and in the
– Market Notices of January 25, February 13, March 14, 18 and 25, April 12 and May 13 of 2019,
referring to the acquisition of certain lots that were the subject of Eletrobras Auction 01/2018,
Taesa has today concluded the following acquisitions:
| (i) | 49.7115% of the shares of Brasnorte Transmissora de Energia S.A. (‘Brasnorte’), |
– for total payment of R$ 75,622,181.62; and
| (ii) | 24.50% of the shares of Companhia Transirapé de Transmissão (‘Transirapé’), |
24.00% of the shares of Companhia Transleste de Transmissão S.A. (‘Transleste’),
| and | 25.00% of the shares of Companhia Transudeste de Transmissão (‘Transudeste’) |
(jointly, ‘the Transmineiras Companies’),
– for total payment of R$ 77,507,577.85,
on the terms stated in the related share purchase agreements, all the conditions precedent applicable to these acquisitions having been met.
With completion of this transaction Taesa, previously holder of 38.6645% of the shares in Brasnorte, now owns 88.376% of the total stock of Brasnorte; and directly and indirectly holds, in aggregate, 54% of Transirapé, Transleste and Transudeste. It previously held, in aggregate of direct and indirect holdings, 29.50% of Transirapé, 30.00% of Transleste and 29.00% of Transudeste.
Taesa will consolidate the results of Brasnorte in its financial statements, as specified in the stockholders’ agreement. The profit of the Transmineiras companies will continue to be accounted in the equity income line (Share of profit (loss) in non-consolidated investees, net) of Taesa. ”
Belo Horizonte, May 31, 2019
Maurício Fernandes Leonardo Júnior
Chief Finance and Investor Relations Officer
|
Av. Barbacena 1200 Santo Agostinho 30190-131 Belo Horizonte, Minas Gerais, Brazil Tel.: +55 31 3506-5024 Fax +55 31 3506-5025
This text is a translation, provided for information only. The original text in Portuguese is the legally valid version. | ||||||||||||||
138
17. MATERIAL ANNOUNCEMENT DATED JUNE 3, 2019: LIGHT S.A. IS CONSIDERING A PRIMARY PUBLIC OFFERING OF ITS SHARES
139
COMPANHIA ENERGÉTICA DE MINAS GERAIS – CEMIG
LISTED COMPANY – CNPJ 17.155.730/0001-64 – NIRE 31300040127
MATERIAL ANNOUNCEMENT
Cemig (Companhia Energética de Minas Gerais – listed in São Paulo, New York and Madrid), in compliance with CVM Instruction 358 of January 3, 2002 as amended, hereby reports to the Brazilian Securities Commission (CVM), the São Paulo Stock Exchange (B3) and the market as follows:
Light S.A. (‘Light’) on May 31, 2019, published the following Material Announcement:
| “ | Light S.A. (“Company” or “Light”), in compliance with the provisions of Instruction No. 358, dated January 3, 2002, as amended, of the Brazilian Securities Commission (“CVM”), hereby informs its shareholders and the market in general that it is considering a primary public offering of its shares with restricted selling efforts, in Brazil and internationally, to qualified institutional investors in the United States and to investors who are deemed to be non-residents of or not domiciled in the United States of America, pursuant to Rule 144A and Regulation S, under the U.S. Securities Act of 1933, as amended (the “Securities Act”) (“Offering”). The Offering may also include a sale by shareholders of the Company. The funds raised with a possible Offering will be used primarily to reduce the Company’s indebtedness. |
It is worth noting that any potential public offering is subject to the prevailing conditions of the Brazilian and international capital markets and the Company and the selling shareholders obtaining the requisite corporate approvals. Additionally, any future equity offering will be conducted in accordance with applicable laws and regulation.
This material fact is not intended for publication or distribution, directly or indirectly, in or into the United States and does not constitute an offer of securities for sale in the United States. The securities mentioned in this material fact have not been and will not be registered under the Securities Act, or any state securities laws, and they may not be offered or sold in the United States absent registration or an applicable exemption from the registration requirements of the Securities Act.
On this date, there is no public offer of securities of the Company being conducted in Brazil or in the United States.
There shall not be any sale of the securities to be sold in the offering in any state or jurisdiction, including in Brazil or the United States, in which such offer, solicitation or sale would be unlawful prior to registration or qualification under the securities laws of any such state or jurisdiction.
This Material Fact is intended to be merely informative and under no circumstances shall be construed as, nor configure, an investment recommendation or offer to sell, or a solicitation or offer to buy, any security issued by the Company in Brazil, including its shares.
The Company will keep its shareholders and the market in general informed about any public offering of shares, pursuant to the applicable regulations. ”
Belo Horizonte, June 3, 2019.
Maurício Fernandes Leonardo Júnior
Chief Finance and Investor Relations Officer
|
Av. Barbacena 1200 Santo Agostinho 30190-131 Belo Horizonte, Minas Gerais, Brazil Tel.: +55 31 3506-5024 Fax +55 31 3506-5025
This text is a translation, provided for information only. The original text in Portuguese is the legally valid version. | ||||||||||||||
140