Table of Contents


UNITED STATES

SECURITIES AND EXCHANGE COMMISSION

Washington, D.C. 20549


FORM 10-Q


Quarterly report pursuant to Section 13 or 15 (d) of the Securities Exchange Act of 1934

For the quarterly period ended September 30, 2018

or


Transition report pursuant to Section 13 or 15 (d) of the Securities Exchange Act of 1934

for the transition period from                      to                     

Commission file number: 000-20971


EDGEWATER TECHNOLOGY, INC.

(Alithya USA, Inc., as successor by merger to Edgewater Technology, Inc.)

(Exact Name of Registrant as Specified in its Charter)


Delaware   71-0788538

(State or Other Jurisdiction of

Incorporation or Organization)


(I.R.S. Employer

Identification No.)

200 Harvard Mill Square, Suite 210

Wakefield, MA

  01880-3209
(Address of Principal Executive Offices)   (Zip Code)

Registrant’s telephone number, including area code: (781) 246-3343


Indicate by check mark whether the registrant (1) has filed all reports required to be filed by Section 13 or 15(d) of the Securities Exchange Act of 1934 during the preceding 12 months (or for such shorter period that the registrant was required to file such reports), and (2) has been subject to such filing requirements for the past 90 days.    Yes  ☒    No  ☐

Indicate by check mark whether the registrant has submitted electronically and posted on its corporate Web site, if any, every Interactive Data File required to be submitted and posted pursuant to Rule 405 of Regulation S-T (§232.405 of this chapter) during the preceding 12 months (or for such shorter period that the registrant was required to submit and post such files).    Yes  ☒    No  ☐

Indicate by check mark whether the registrant is a large accelerated filer, an accelerated filer, a non-accelerated filer, smaller reporting company, or an emerging growth company. See the definitions of “large accelerated filer,” “accelerated filer,” “smaller reporting company” and “emerging growth company” in Rule 12b-2 of the Exchange Act:


Large accelerated filer      Accelerated filer  
Non-accelerated filer   ☐  (Do not check if smaller reporting company)    Smaller Reporting Company  
   Emerging Growth Company  

If an emerging growth company, indicate by check mark if the registrant has elected not to use the extended transition period for complying with any new or revised financial accounting standards provided pursuant to Section 13(a) of the Exchange Act.  ☐

Indicate by check mark whether the registrant is a shell company (as defined in Rule 12b-2 of the Exchange Act).    Yes  ☐    No  ☒

The number of shares of Common Stock of the Registrant, par value $.01 per share, outstanding at November 5, 2018 was 14,676,663.


Table of Contents

EDGEWATER TECHNOLOGY, INC.

FORM 10-Q FOR THE QUARTER ENDED SEPTEMBER 30, 2018

INDEX


     Page  

PART I—FINANCIAL INFORMATION


Item 1 – Financial Statements


Unaudited Condensed Consolidated Balance Sheets as of September  30, 2018 and December 31, 2017

     3  

Unaudited Condensed Consolidated Statements of Comprehensive Loss for the Three and Nine Months Ended September 30, 2018 and 2017

     4  

Unaudited Condensed Consolidated Statements of Cash Flows for the Nine Months Ended September 30, 2018 and 2017

     5  

Notes to Unaudited Condensed Consolidated Financial Statements

     6  

Item 2 – Management’s Discussion and Analysis of Financial Condition and Results of Operations


Business Overview

     16  

Results for the Three and Nine Months Ended September  30, 2018, Compared to Results for the Three and Nine Months Ended September 30, 2017

     19  

Liquidity and Capital Resources

     25  

Acquisitions, Earnout Payments and Commitments

     26  

Off Balance Sheet Arrangements, Contractual Obligations and Contingent Liabilities and Commitments

     26  

Critical Accounting Policies and Estimates

     26  

Recent Accounting Pronouncements

     26  

Risk Factors

     27  

Special Note Regarding Forward-Looking Statements

     28  

Item  3 – Quantitative and Qualitative Disclosures About Market Risk

     28  

Item 4 – Controls and Procedures


Evaluation of Disclosure Controls and Procedures

     28  

Changes in Controls and Procedures

     29  

PART II – OTHER INFORMATION


Item 1 – Legal Proceedings

     29  

Item 1A – Risk Factors

     29  

Item  2 – Unregistered Sales of Equity Securities and Use of Proceeds

     29  

Item 3 – Defaults upon Senior Securities

     29  

Item 4 – Mine Safety Disclosures

     29  

Item 5 – Other Information

     30  

Item 6 – Exhibits

     30  

Signatures

     31  


2


Table of Contents

PART I – FINANCIAL INFORMATION

ITEM 1. FINANCIAL STATEMENTS

EDGEWATER TECHNOLOGY, INC.

UNAUDITED CONDENSED CONSOLIDATED BALANCE SHEETS

(In Thousands, Except Per Share Data)


     September 30,
2018
    December 31,
2017
 
ASSETS             

Current assets:


Cash and cash equivalents

   $ 4,444     $ 15,398  

Restricted cash

     5,000       —    

Accounts receivable, net of allowance of $150

     26,266       22,218  

Prepaid expenses and other current assets

     2,312       2,075  


Total current assets

     38,022       39,691  

Property and equipment, net

     386       409  

Intangible assets, net

     3,895       5,575  

Goodwill

     29,983       29,983  

Other assets

     886       216  


Total assets

   $ 73,172     $ 75,874  


LIABILITIES AND STOCKHOLDERS’ EQUITY             

Current liabilities:


Accounts payable

   $ 1,585     $ 767  

Accrued liabilities

     14,444       14,984  

Deferred revenue

     2,751       2,140  

Revolving credit facility

     5,000       5,000  


Total liabilities

     23,780       22,891  

Stockholders’ equity:


Preferred stock, $.01 par value; 2,000 shares authorized, no shares issued or outstanding

     —         —    

Common stock, $.01 par value; 48,000 shares authorized, 29,736 shares issued as of September 30, 2018 and December 31, 2017, 14,641 and 14,046 shares outstanding as of September 30, 2018 and December 31, 2017, respectively

     297       297  

Paid-in capital

     199,936       202,749  

Treasury stock, at cost, 15,096 and 15,690 shares at September 30, 2018 and December 31, 2017, respectively

     (93,671     (98,684

Accumulated other comprehensive loss

     (647     (582

Retained deficit

     (56,523     (50,797


Total stockholders’ equity

     49,392       52,983  


Total liabilities and stockholders’ equity

   $ 73,172     $ 75,874  


See notes to the unaudited condensed consolidated financial statements.


3


Table of Contents

EDGEWATER TECHNOLOGY, INC.

UNAUDITED CONDENSED CONSOLIDATED STATEMENTS OF COMPREHENSIVE LOSS

(In Thousands, Except Per Share Data)


     Three Months
Ended
September 30,
    Nine Months
Ended
September 30,
 
     2018     2017     2018     2017  

Revenue:


Service revenue

   $ 22,955     $ 23,562     $ 68,335     $ 73,132  

Software revenue

     1,044       2,385       4,330       9,339  

Reimbursable expenses

     1,336       1,414       4,133       4,325  


Total revenue

     25,335       27,361       76,798       86,796  

Cost of revenue:


Project and personnel costs

     13,801       14,185       44,493       45,574  

Software costs

     —         1,441       —         5,079  

Reimbursable expenses

     1,336       1,414       4,133       4,325  


Total cost of revenue

     15,137       17,040       48,626       54,978  


Gross profit

     10,198       10,321       28,172       31,818  

Operating expenses:


Selling, general and administrative

     8,045       10,312       27,187       29,231  

Executive officer severance

     —         816       —         4,187  

Merger related transaction costs

     2,744       —         4,348       —    

Consent solicitation expense

     —         —         —         666  

Contract termination expense

     —         —         —         1,125  

Change in fair value of contingent earnout consideration

     —         (856     —         (252

Depreciation and amortization

     627       782       1,895       2,376  


Total operating expenses

     11,416       11,054       33,430       37,333  


Operating income (loss)

     (1,218     (733     (5,258     (5,515

Other expense, net

     68       (33     241       200  


(Loss) income before income taxes

     (1,286     (700     (5,499     (5,715

Tax provision (benefit)

     20       (528     227       (1,996


Net loss

   $ (1,306   $ (172   $ (5,726   $ (3,719


Comprehensive loss:


Currency translation adjustments

     (2     23       (65     30  


Total comprehensive loss

   $ (1,308   $ (149   $ (5,791   $ (3,689


Net loss per share:


Basic net loss per share of common stock

   $ (0.09   $ (0.01   $ (0.40   $ (0.28


Diluted net loss per share of common stock

   $ (0.09   $ (0.01   $ (0.40   $ (0.28


Shares used in computing basic net loss per share of common stock

     14,620       13,924       14,423       13,497  


Shares used in computing diluted net loss per share of common stock

     14,620       13,924       14,423       13,497  


See notes to the unaudited condensed consolidated financial statements.


4


Table of Contents

EDGEWATER TECHNOLOGY, INC.

UNAUDITED CONDENSED CONSOLIDATED STATEMENTS OF CASH FLOWS

(In Thousands)


     Nine Months
Ended September 30,
 
     2018     2017  

CASH FLOWS FROM OPERATING ACTIVITIES:


Net loss

   $ (5,726   $ (3,719

Adjustments to reconcile net loss to net cash used in operating activities, excluding the impact of acquisitions:


Depreciation and amortization

     1,893       2,384  

Share-based compensation expense

     346       889  

Deferred income taxes

     —         (2,758

Change in fair value of contingent earnout consideration

     —         (252

Accretion of contingent earnout consideration

     —         295  

Changes in operating accounts, net of acquisition:


Accounts receivable

     (4,067     5  

Prepaid expenses and other current assets

     (912     45  

Accounts payable

     818       (181

Accrued liabilities and other liabilities

     (285     (2,744

Deferred revenue

     611       246  


Net cash used in operating activities

     (7,322     (5,790


CASH FLOWS FROM INVESTING ACTIVITIES:


Purchases of property and equipment

     (190     (116


Net cash used in investing activities

     (190     (116


CASH FLOW FROM FINANCING ACTIVITES:


Proceeds from employee stock plans and stock option exercises

     2,552       4,100  

Purchase of treasury stock

     (948     —    

Payment of contingent earnout consideration

     —         (5,189


Net cash provided by (used in) financing activities

     1,604       (1,089


Effects of exchange rates on cash

     (46     98  


Net decrease in cash, cash equivalents and restricted cash

     (5,954     (6,897

CASH, CASH EQUIVALENTS AND RESTRICTED CASH, beginning of period

     15,398       19,693  


CASH, CASH EQUIVALENTS AND RESTRICTED CASH, end of period

   $ 9,444     $ 12,796  


SUPPLEMENTAL DISCLOSURES OF CASH FLOW INFORMATION:


Cash paid for income taxes

   $ 110     $ 409  


Issuance of restricted stock awards

   $ —       $ 108


See notes to the unaudited condensed consolidated financial statements.


5


Table of Contents

EDGEWATER TECHNOLOGY, INC.

NOTES TO UNAUDITED CONDENSED CONSOLIDATED FINANCIAL STATEMENTS


1.

ORGANIZATION:

Edgewater Technology, Inc. helps the C-suite drive transformational change through its unique selection of business and technology services and channel-based solutions.

Classic consulting disciplines (such as business advisory, process improvement, organizational change management, M&A due diligence, and domain expertise) are blended with technical services (such as digital transformation, technical roadmaps, data and analytics services, custom development and system integration) to help organizations leverage investments in legacy IT assets to create new digital business models.

The Company delivers product based consulting in both the Enterprise Performance Management (“EPM”) and Enterprise Resource Planning (“ERP”) areas both on premise and in the cloud. Within the EPM offering, our Oracle channel, Edgewater Ranzal, provides Business Analytics solutions leveraging Oracle EPM, Business Intelligence (“BI”) and Big Data technologies. Within the ERP offering, our Microsoft channel, Edgewater Fullscope, delivers Dynamics AX ERP, Business Intelligence and CRM solutions primarily in the manufacturing space.

On November 1, 2018 (the “Effective Date”), 9374-8572 Delaware Inc., a Delaware corporation (“Merger Sub”) and a wholly owned subsidiary of Alithya Group inc., a newly-formed Québec corporation (“New Alithya”), merged with and into Edgewater Technology, Inc., a Delaware corporation (“Edgewater”), with Edgewater surviving as a wholly-owned subsidiary of New Alithya (the “Merger”). The Merger was effected pursuant to the Arrangement Agreement, dated as of March 15, 2018, as amended by Amendment No. 1 thereto dated as of September 10, 2018 and Amendment No. 2 thereto dated as of October 17, 2018 (as so amended, the “Arrangement Agreement”), among Alithya Group Inc., a Québec corporation (“Alithya”), New Alithya, Merger Sub and Edgewater. On the Effective Date, each of Alithya and Edgewater became a wholly-owned subsidiary of New Alithya in accordance with the Arrangement Agreement and an arrangement approved by Superior Court of Québec (the “Arrangement”) and Edgewater was renamed “Alithya USA, Inc.”

Pursuant to the terms of the Arrangement Agreement, upon the completion of the Merger, each issued and outstanding share of common stock, U.S.$0.01 par value per share, of Edgewater (“Edgewater Common Stock”) was converted into the right to receive 1.1918 fully-paid and nonassessable shares of New Alithya Class A subordinate voting stock, no par value (“New Alithya Subordinate Voting Shares”), rounded up to the nearest whole New Alithya Subordinate Voting Share. In addition, on October 19, 2018, the Edgewater Board of Directors declared a special cash dividend in the amount of U.S.$1.15 per share of Edgewater Common Stock payable on or around November 9, 2018 to Edgewater’s stockholders of record at the close of business on October 31, 2018. Due to the contingent nature of the Edgewater special cash dividend, Edgewater Common Stock traded with “due bills” representing an assignment of the right to receive the special cash dividend during the period from October 30, 2018 until the close of trading on November 1, 2018. Edgewater stockholders who sold their shares through NASDAQ on or after October 30, 2018 until the closing of trading on November 1, 2018 also sold their entitlement to the special cash dividend to the respective purchasers of shares.

On the Effective Date, each common share, no par value (“Alithya Common Shares”), of Alithya and each multiple voting common share, no par value (“Alithya Multiple Voting Shares” and, together with Alithya Common Shares, “Alithya Shares”), of Alithya then issued and outstanding were cancelled and automatically converted into the right to receive one newly issued New Alithya Subordinate Voting Share and one newly issued Class B multiple voting share, no par value (“New Alithya Multiple Voting Shares” and, together with New Alithya Subordinate Voting Shares, “New Alithya Shares”), of New Alithya, respectively. On the Effective Date, the former stockholders of Edgewater and the former shareholders of Alithya were issued approximately 40% and 60% of the total number New Alithya Shares on a fully-diluted basis, respectively (excluding the New Alithya Subordinate Voting Shares issued to investors in Alithya’s private placement that closed on October 30, 2018). However, because New Alithya Multiple Voting Shares were issued only to those former Alithya shareholders which previously held Alithya Multiple Voting Shares, the former stockholders of Edgewater and the former shareholders of Alithya received on the Effective Date approximately 16% and 84% of the total voting power of the total New Alithya Shares then issued, respectively (excluding the New Alithya Subordinate Voting Shares issued to investors in Alithya’s private placement that closed on October 30, 2018).

The issuance of New Alithya Subordinate Voting Shares in connection with the Arrangement was registered under the Securities Act of 1933, as amended, pursuant to New Alithya’s registration statement on Form F-4 (File No. 333-227310) filed with


6


Table of Contents

the Securities and Exchange Commission (the “SEC”) and declared effective on September 27, 2018. The prospectus/proxy statement dated September 28, 2018 (the “Prospectus/Proxy Statement”) and the supplement thereto dated October 23, 2018 (the “Supplement”), as filed under the Registration Statement, contains additional information about the Merger and the Arrangement.

The New Alithya Subordinate Voting Shares have been approved for listing, on the Nasdaq Capital Market and on the Toronto Stock Exchange under the symbol “ALYA”. The trading of the New Alithya Subordinate Voting Shares commenced on the Nasdaq Capital Market and the Toronto Stock Exchange on November 2, 2018.

In connection with the completion of the Arrangement, New Alithya received binding agreements from certain former Edgewater stockholders and Alithya shareholders not to sell their New Alithya Subordinate Voting Shares or New Alithya Multiple Voting Shares for a minimum period of 12 months following the Effective Date, without receiving New Alithya’s prior written consent. Those former Edgewater stockholders and Alithya shareholders included Ancora Advisors, LLC (which prior to the Effective Date owned approximately 10.2% of the total outstanding Edgewater Common Stock), the directors and officers of Alithya and Edgewater remaining with the post-closing operations of New Alithya, Alithya shareholders receiving more than 5% of all of the issued and outstanding New Alithya Shares taken as a whole, at closing, and certain other employees or other persons mutually agreed upon between Alithya and Edgewater.

In this Quarterly Report on Form 10-Q (the “Form 10-Q”), we use the terms “Edgewater,” “Edgewater Technology,” “we,” “our Company,” “the Company,” “our” and “us” to refer to Edgewater Technology, Inc. and its wholly-owned subsidiaries, which are described in our 2017 Annual Report on Form 10-K, as filed with the Securities and Exchange Commission (the “SEC”) on March 16, 2018 (the “2017 Form 10-K”).


2.

BASIS OF PRESENTATION:

The accompanying unaudited condensed consolidated financial statements have been prepared by Edgewater pursuant to the rules and regulations of the SEC regarding interim financial reporting. Certain information and note disclosures normally included in annual financial statements prepared in accordance with accounting principles generally accepted in the United States of America have been omitted pursuant to those rules and regulations, although we believe that the disclosures made are adequate to ensure the information presented is not misleading.

The accompanying unaudited condensed consolidated financial statements reflect all adjustments (which were of a normal, recurring nature) that, in the opinion of management, are necessary to present fairly our financial position, results of operations and cash flows as of and for the interim periods presented. All intercompany transactions have been eliminated in the accompanying unaudited condensed consolidated financial statements. These financial statements should be read in conjunction with the audited financial statements and notes thereto included in our 2017 Form 10-K.

The results of operations for the three- and nine-months ended September 30, 2018 are not necessarily indicative of the results to be expected for any future period or the full fiscal year. Our revenue and earnings may fluctuate from quarter-to-quarter based on factors within and outside our control, including variability in demand for information technology professional services, the length of the sales cycle associated with our service offerings, the number, size and scope of our projects and the efficiency with which we utilize our employees.

Other comprehensive loss consists of net loss plus or minus any currency translation adjustments.


3.

REVENUE RECOGNITION:

As of January 1, 2018, the Company adopted Accounting Standards Update (“ASU”) 2014-09, Revenue from Contracts with Customers (“ASC 606”), which impacts the timing of when certain types of revenue will be recognized. Revenues are recognized when we satisfy a performance obligation by transferring goods or services promised in a contract to a customer, in an amount that reflects the consideration that we expect to receive in exchange for those goods and services. Performance obligations in our contracts represent distinct or separate service or product streams that we provide to our customers. The Company has adopted the standard using the modified retrospective approach. The standard was applied to all open contracts as of the date of adoption. The Company did not recognize any cumulative catch-up adjustment in connection with the adoption of this standard.

We evaluate our revenue contracts with customers based on the five-step model under ASC 606: (1) Identify the contract with the customer; (2) Identify the performance obligations in the contract; (3) Determine the transaction price; (4) Allocate the transaction price to separate performance obligations; and (5) Recognize revenue when (or as) each performance obligation is satisfied.

The Company’s contracts with customers contain performance obligations related to the performance of professional services (in the form of time and materials, fixed fee or retainer based contracts), the delivery of software and/or the performance of maintenance services. The Company separately evaluates all performance obligations and allocates revenue based upon stand-alone selling price of the individual performance obligations.


7


Table of Contents

We generate the majority of our revenues by providing consulting services to our clients. Our consulting service contracts are based on one of the following types of arrangements:


Time and expense arrangements require the client to pay us based on the number of hours worked at contractually agreed-upon rates. We recognize revenue for these arrangements over time based on hours incurred and contracted rates. Revenue recognition over time is based on the enforceable right to payment.


Fixed fee arrangements require the client to pay a pre-established fee in exchange for a predetermined set of professional services. We recognize revenue for these arrangements over time based on the proportional performance (using a hours-based input method) related to individual performance obligations within each arrangement. Revenue recognition over time is based on the enforceable right to payment.


Retainer based arrangements require the client to pay a recurring fee in exchange for a monthly recurring service (typically support). We recognize revenue for these arrangements over time (using a hours-based input method). Revenue recognition over time is based on customer simultaneously receiving and consuming the benefit of the services provided.

We generate software revenue from the resale of certain third-party off-the-shelf software and maintenance. The majority of the software sold by the Company is delivered electronically. For software that is delivered electronically, we consider transfer of control to have occurred when the customer either (a) takes possession of the software via a download (that is, when the customer takes possession of the electronic data on its hardware), or (b) has been provided with access codes that allow the customer to take immediate possession of the software on its hardware pursuant to an agreement or purchase order for the software. In all instances, the resale of third-party software and maintenance is recorded on a net basis. Company created software, and the associated maintenance, is reported on a gross basis, however it is immaterial in all periods presented.

Third party software and maintenance revenue are recognized upon delivery of the software, as all related warranty and maintenance is performed by the primary software vendor and not the Company.

The Company enters into arrangements with multiple performance obligations which typically include software, post-contract support (or maintenance), and consulting services. Contracts that contain multiple performance obligations require an allocation of the transaction price to each performance obligation based on a relative standalone selling price basis. The Company has determined standalone selling price for each of the performance obligations in connection with our evaluation of arrangements with multiple performance obligations. The Company has established standalone selling price for consulting services based on a stated and consistent rate per hour range in standalone transactions. The Company has established standalone selling price for software through consistent stated rates for software components. The Company has established standalone selling price for maintenance based on observable prices for standalone renewals.

Unfulfilled performance obligations represent the remaining contract transaction prices allocated to the performance obligations that are unsatisfied, or partially unsatisfied, and therefore revenues have not yet been recorded. Unfulfilled performance obligations primarily consist of the remaining fees not yet recognized under our proportional performance method for our fixed fee arrangements. The aggregate amount of the transaction price allocated to the performance obligations that are unsatisfied (or partially unsatisfied) as of September 30, 2018 was $2.8 million and is expected to be recognized within the next twelve months. For time and expense arrangements, the Company has elected the practical expedient not to disclose transaction price allocated to unsatisfied (or partially unsatisfied) performance obligations for which we recognize revenue in accordance with paragraph 606-10-55-18. Revenue from these performance obligations is expected to be recognized within the next twelve months.

Contract liabilities are defined as liabilities incurred when we have received consideration from a client but have not yet performed the agreed upon services. This may occur when we receive advance billings before the performance of a support contract, billings in advance of service performed in connection with a fixed price arrangement, or occasional pre-billing of services to be performed under a time and materials contract. The contract liability balance was $2.8 million and $2.1 million as of September 30, 2018 and December 31, 2017, respectively.

The Company’s standard payment terms are 30 days from invoice date. Customer prepayments, even if nonrefundable, are deferred (classified as deferred revenue) and recognized over future periods as services are performed.

The Company routinely assesses the exposure associated with the potential for returns and refunds. Historic results support the conclusion that returns and refunds are insignificant, however should such concessions be deemed necessary the reserve would be established in the period in which the item was identified.


8


Table of Contents

The following tables further depict the disaggregation of revenue for the three- and nine-month periods ended September 30, 2018. The information included in the disaggregation of revenue tables below have been presented in accordance with the standards set forth in ASC 606 for the three- and nine-month periods ended September 30, 2018.


Three-Months Ended September 30, 2018

 
     Service (1)      Software      Total  

Revenue by Reporting Unit:


ERP

   $ 11,933      $ 1,059      $ 12,992  

EPM

     12,001        (8      11,993  

Classic Consulting

     357        (7      350  


Consolidated revenue

   $ 24,291      $ 1,044      $ 25,335  


Revenue by Contract Type:


Time and materials

     20,280        —          20,280  

Fixed price

     1,675        —          1,675  

Retainer

     1,000        —          1,000  

Software

     —        1,044      1,044

Expense

     1,336        —          1,336  


Consolidated revenue

   $ 24,291      $ 1,044      $ 25,335  


Revenue Recognition


Point in time

     —        1,044      1,044

Over time

     24,291        —          24,291  


Consolidated revenue

   $ 24,291      $ 1,044      $ 25,335  


Nine-Months Ended September 30, 2018

 
     Service (1)      Software      Total  

Revenue by Reporting Unit:


ERP

   $ 35,077      $ 4,420      $ 39,497  

EPM

     35,086        (16      35,070  

Classic Consulting

     2,305        (74      2,231  


Consolidated revenue

   $ 72,468      $ 4,330      $ 76,798  


Revenue by Contract Type:


Time and materials

     59,389        —          59,389  

Fixed price

     5,465        —          5,465  

Retainer

     3,481        —          3,481  

Software

     —        4,330      4,330

Expense

     4,133        —          4,133  


Consolidated revenue

   $ 72,468      $ 4,330      $ 76,798  


Revenue Recognition


Point in time

     —        4,330      4,330

Over time

     72,468        —          72,468  


Consolidated revenue

   $ 72,468      $ 4,330      $ 76,798  


(1)

Service revenue includes both service and the corresponding reimbursable expense revenue.

Adoption of the new revenue recognition standard did not have a meaningful impact on the Company’s consolidated balance sheet. The Company has not made any significant changes to the outstanding contracts. The Company has not changed the method of recording or presenting accounts receivable or deferred revenue. The Company did not incur or capitalize any amounts in connection with the cost to obtain customer contracts nor did the Company record any contract assets in connection with our contracts with customers. During the three- and nine-month periods ended September 30, 2018, the Company recognized $925 thousand and $2.3 million of service revenue that was recorded and presented as deferred revenue in prior periods.

The Company, under the standards set forth in ASC 606 has presented software revenue on a net basis for the three- and nine-month period ended September 30, 2018. This represents a change from the presentation basis on the previous revenue recognition guidance. There have been no meaningful changes to the structure of the software contracts during the current quarter, however the assessment of gross versus net now relies heavily on the concept of control and therefore the Company has concluded that net presentation is appropriate.


9


Table of Contents

The table below presents software revenue in accordance with ASC 605 for the three- and nine-month periods ended September 30, 2018. No other financials statement line items were affected by the adoption of ASC 606.


Comparable Software Revenue:

   Three-
month period
ended
September 30,
2018
 

Software Revenue

   $ 2,346  

Software Expense

     1,302  


Software Gross Margin

   $ 1,044  


Comparable Software Revenue:

   Nine-
month period
ended
September 30,
2018
 

Software Revenue

   $ 9,310  

Software Expense

     4,980  


Software Gross Margin

   $ 4,330  


The Company has elected to make the following accounting policy elections through the adoption of the following practical expedients:

Right to Invoice – Where applicable, the Company will recognize revenue from a contract with a customer in an amount that corresponds directly with the value to the customer of the Company’s performance completed to date and the amount to which the entity has a right to invoice.

Significant Financing Component – The Company will not adjust the promised amount of consideration for the effects of a significant financing component if the Company expects, at contract inception, that the period between when the entity transfers a promised good or service to a customer and when the customer pays for that good or service will be one year or less.

There are also certain considerations related to internal control over financial reporting that are associated with implementing Topic 606. The Company has evaluated its internal control framework over revenue recognition and designed and implemented the appropriate internal controls to enable the preparation of financial information and obtain and disclose the information required under Topic 606. This evaluation did not result in any material changes to the Company’s existing internal control framework over revenue recognition.


4.

SHARE-BASED COMPENSATION:

Share-based compensation expense under all of the Company’s share-based plans was $57 thousand and $346 thousand for the three- and nine-month periods ended September 30, 2018, respectively. Share-based compensation expense under all of the Company’s share-based plans was $219 thousand and $889 thousand for the three- and nine-month periods ended September 30, 2017, respectively.

Cash received from the employee stock purchase plan (“ESPP”) and through stock option exercises was $205 thousand and $2.6 million during the three- and nine-month periods ended September 30, 2018, respectively. Cash received from ESPP and stock option exercises was $313 thousand and $4.1 million during the three- and nine-month periods ended September 30, 2017, respectively.

As of September 30, 2018, unrecognized compensation expense, net of estimated forfeitures, related to the unvested portion of all share-based compensation arrangements was approximately $127 thousand and is expected to be recognized over a weighted-average period of 1.3 years.

The Company intends to use previously purchased treasury shares for shares issued for options, restricted share awards and ESPP purchases. Shares may also be issued from authorized but unissued share reserves.


10


Table of Contents
5.

INCOME TAXES:

The Company recorded a tax provision of $20 thousand and a tax benefit of $(528) thousand for the three-month periods ended September 30, 2018 and 2017, respectively. The Company recorded tax provisions of $227 thousand and $(2.0) million for the nine-month periods ended September 30, 2018 and 2017, respectively. The reported tax (benefit) provision for the three-month periods ended September 30, 2018 and 2017, are based upon estimated quarterly effective tax rates of (1.5)% and (75.4)%, respectively. The effective tax rate, in the three-month period ended September 30, 2018, reflected our foreign income tax provisions. The effective tax rate, in the three-month period ended September 30, 2017, reflected our combined Federal and state income tax rates, foreign income tax provisions and the recognition of U.S. deferred tax liabilities for differences between the book and tax basis of goodwill. The reported tax provisions for the nine-month periods ended September 30, 2018 and 2017, are based upon estimated quarterly effective tax rates of (4.1)% and (34.9)%, respectively. The effective tax rate, in the nine-month period ended September 30, 2018, reflected our foreign income tax provisions. The effective tax rate, in the three-month period ended September 30, 2017, reflected our combined Federal and state income tax rates, foreign income tax provisions and the recognition of U.S. deferred tax liabilities for differences between the book and tax basis of goodwill.

We assess the realizability of our deferred tax assets and assess the need for a valuation allowance on an ongoing basis. The periodic assessment of the net carrying value of our deferred tax assets under the applicable accounting rules is highly judgmental. We are required to consider all available positive and negative evidence in evaluating the likelihood that we will be able to realize the benefit of our deferred tax assets in the future. Such evidence includes scheduled reversals of deferred tax liabilities, projected future taxable income, tax planning strategies and the results of recent operations. Since this evaluation requires consideration of events that may occur some years into the future, there is significant judgment involved, and our conclusion could be materially different should certain of our expectations not transpire.

When assessing all available evidence, we consider the extent to which we have generated pre-tax income or losses over the most recent three-year period to be an important piece of objective evidence. As of September 30, 2018, and December 31, 2017, the recorded deferred tax asset valuation allowance balance was $23.0 million and $21.7 million, respectively.

Our policy is to classify interest and penalties related to unrecognized tax benefits as income tax expense. This policy has been consistently applied in all periods. No such amounts were recognized in the three- or nine-month periods ended September 30, 2018 or 2017. We have reviewed the tax positions taken, or to be taken, in our tax returns for all tax years currently open to examination by a taxing authority. We have identified no uncertain tax positions for which it is reasonably possible that the total amount of unrecognized tax benefits will significantly increase or decrease within the twelve months ending September 30, 2019. We remain subject to examination until the statute of limitations expires for each respective tax jurisdiction.

The Company adopted the Accounting Standards Update related to stock-based compensation during the nine-month period ended September 30, 2017. This adoption had an impact on the tax treatment for stock option exercises during the nine-months ended September 30, 2017 (as well as a cumulative adjustment for prior period activity). In connection with the adoption of this standard, all excess tax benefits and tax deficiencies will be recognized in the statement of comprehensive income in the period in which they occur. The Company recognized $306 thousand and $786 thousand of tax expense related to stock option exercises in the nine-month periods ended September 30, 2018 and 2017, respectively, however, because the Company is in a full valuation allowance position, no benefit was taken in the consolidated financial statements. During the nine-month period ended September 30, 2017, the Company recorded a $1.4 million cumulative adjustment to retained earnings to present the impact of prior period activity in accordance with the adopted standard.

On December 22, 2017, the Tax Cuts and Jobs Act (“TCJA”) was signed into law. The TCJA changed many aspects of U.S. corporate income taxation and included reduction of the corporate income tax rate from 35% to 21% , implementation of a territorial tax system and imposition of a tax on deemed repatriated earnings of foreign subsidiaries. The TCJA was effective as of December 31, 2017 and at that time we made a reasonable estimate of the effects on our existing deferred tax balances and the one-time transition tax. As of September 30, 2018, we have not completed our accounting for the tax effects of the TCJA nor have we recorded any adjustments during the quarter ended September 30, 2018. We will continue to assess our provision for income taxes as future guidance is issued, but do not currently anticipate significant revisions will be necessary. Any such revisions will be treated in accordance with the one year measurement period guidance outlined in Staff Accounting Bulletin No. 118. The ultimate impact may differ from these provisional amounts, possibly materially, due to, among other things, additional analysis, changes in interpretations and assumptions we have made, additional regulatory guidance that may be issued, and actions we may take as a result of the TCJA. Subsequent to September 30, 2018, the Company completed the accounting for the tax effects of the TCJA and no changes to prior amounts were recorded.


11


Table of Contents
6.

GOODWILL AND INTANGIBLE ASSETS:

There have been no changes to the Company’s goodwill balance during 2018. Our annual goodwill and intangible assets measurement date is December 2. The Company continuously evaluates for any triggering events and no such events have occurred during the three- or nine-month periods ended September 30, 2018.

We amortize our intangible assets that have finite lives using either the straight-line method or based on estimated future cash flows to approximate the pattern in which the economic benefit of the asset will be utilized. Amortization expense was $561 thousand and $1.7 million during the three- and nine-month periods ended September 30, 2018, respectively. Amortization expense was $699 thousand and $2.1 million during the three- and nine-month periods ended September 30, 2017, respectively. This amortization expense relates to certain non-competition covenants and customer lists, which expire at various times through 2021.

Estimated annual amortization expense of our intangible assets (including amortization expense associated with capitalized software costs) for the current year and the following five years ending December 31, is as follows:


     Amortization
Expense
 
     (In Thousands)  

2018

   $ 2,240  

2019

   $ 1,713  

2020

   $ 1,057  

2021 and beyond

   $ 565  


7.

ACCRUED EXPENSES AND OTHER LIABILITIES:

Accrued liabilities as of September 30, 2018 and December 31, 2017 consisted of the following:


     September 30,
2018
     December 31,
2017
 
     (In Thousands)  

Accrued bonuses

   $ 3,006      $ 5,590  

Accrued payroll related liabilities

     1,531        3,277  

Accrued vacation

     2,818        2,497  

Accrued commissions

     1,047        825  

Accrued software expense

     545        675  

Accrued contractor fees

     581        346  

Accrued professional service fees

     3,227        341  

Deferred rent

     50        64  

Income tax related accruals

     331        189  

Other accrued expenses

     1,308        1,180  


Total

   $ 14,444      $ 14,984  


8.

NET LOSS PER SHARE:

A reconciliation of net income and weighted average shares used in computing basic and diluted net loss per share is as follows:


     Three Months Ended
September 30,
     Nine Months Ended
September 30,
 
     2018      2017      2018      2017  
     (In Thousands, Except Per Share Data)  

Basic net loss per share:


Net loss applicable to common shares

   $ (1,306    $ (172    $ (5,726    $ (3,719


Weighted average common shares outstanding

     14,620        13,924        14,423        13,497  


Basic net loss per share of common stock

   $ (0.09    $ (0.01    $ (0.40    $ (0.28


12


Table of Contents
     Three Months Ended
September 30,
     Nine Months Ended
September 30,
 
     2018      2017      2018      2017  
     (In Thousands, Except Per Share Data)  

Diluted net loss per share:


Net loss applicable to common shares

   $ (1,306    $ (172    $ (5,726    $ (3,719


Weighted average common shares outstanding

     14,620        13,924        14,423        13,497  

Dilutive effects of stock options

     —          —          —          —    


Weighted average common shares, assuming dilutive effect of stock options

     14,620        13,924        14,423        13,497  


Diluted net loss per share of common stock

   $ (0.09    $ (0.01    $ (0.40    $ (0.28


Share-based awards, inclusive of all grants made under the Company’s equity plans, for which either the stock option exercise price or the fair value of the restricted share award exceeds the average market price over the period, have an anti-dilutive effect on earnings per share, and accordingly, are excluded from the diluted computations for all periods presented. Had such shares been included, shares for the diluted computation would have increased by approximately 465 thousand shares and 465 thousand shares in the three- and nine-month periods ended September 30, 2018, respectively. Had such shares been included, shares for the diluted computation would have increased by approximately 542 thousand shares and 148 thousand shares in the three- and nine-month periods ended September 30, 2017, respectively. As of September 30, 2018 and 2017, there were approximately 766 thousand and 1.8 million share-based awards outstanding, respectively, under the Company’s equity plans. Options to purchase 79 thousand and 534 thousand shares of common stock that were outstanding during the three months ended September 30, 2018 and September 30, 2017, respectively, were not included in the computation of diluted net loss per share due to the reported periodic loss. Options to purchase 118 thousand and 760 thousand shares of common stock that were outstanding during the nine months ended September 30, 2018 and September 30, 2017, respectively, were not included in the computation of diluted net loss per share due to the reported periodic loss.


9.

STOCK REPURCHASE PROGRAM:

In December 2007, our Board of Directors (the “Board”) authorized a stock repurchase program for up to $5.0 million of common stock on the open market or through privately negotiated transactions from time-to-time through December 31, 2008 (the “Stock Repurchase Program”). The Board subsequently amended the Stock Repurchase Program, authorizing both an increase to and an extension of the Stock Repurchase Program. The Stock Repurchase Program, as amended, had a maximum purchase value of shares of $23.1 million (the “Purchase Authorization”) and expired on September 21, 2018.

The timing and amount of the purchases was dependent upon market conditions, securities law considerations and other factors. The Stock Repurchase Program did not obligate the Company to acquire a specific number of shares in any period and could have been modified, suspended, extended or discontinued at any time, without prior notice.

The Company repurchased 151 thousand shares at an aggregate price of $948 thousand during the nine-month period ended September 30, 2018. The Company did not repurchase any shares of common stock during the three-month period ended September 30, 2018 or the three- and nine-month periods ended September 30, 2017.


10.

REVOLVING LINE OF CREDIT:

In September 2013, the Company entered into a secured revolving credit facility (the “Credit Facility”). The Credit Facility was modified through an amendment in December 2015, which increased the borrowing base to $15 million (from the previous $10 million) with an additional accordion feature that allows the Company to request an additional $5.0 million as needed, extending the total credit facility borrowing capacity to $20 million over its three-year term. The Credit Facility is collateralized by substantially all assets of the Company and its domestic subsidiaries, and is subject to normal financial covenants.

In October 2018, the Company entered into an amendment, which amended certain terms of the Credit Facility. The amendment waived the restrictions on change of control of Edgewater in the Loan Agreement to the extent required to permit the acquisition of all of the outstanding stock of Edgewater by New Alithya.

The amendment modified certain provisions of the Credit Facility, including, among other things, (i) the right of Edgewater obtain up to $7.0 million of additional Revolving Advances provided that all such additional Revolving Advances shall be deposited into the blocked deposit account maintained by Edgewater at Citizens, (ii) Edgewater’s agreement that all funds held in such blocked account (including the $5.0 million of funds now held in such blocked account) will constitute cash collateral for all obligations of Edgewater to Citizens under the Loan Agreement, and (iii) Edgewater’s right to withdraw the funds in the blocked account will be contingent on the repayment in full of all obligations then outstanding under the Loan Agreement.


13


Table of Contents

The Company had drawn down $5.0 million of this balance as of September 30, 2018. Subsequent to September 30, 2018, the Company drew down the additional $7.0 million allowed under the Credit Facility. The Company was not in compliance with one of its loan covenants as of September 30, 2018, however, the full $12.0 million was paid off and the Credit Facility closed in November 2018.


11.

RESTRICTED CASH:

In May 2018, the Company entered into a minimum cash balance agreement in connection with the existing Credit Facility (see Note 10). The Company has presented $5.0 million as restricted cash as of September 30, 2018 as this cash has been specifically restricted to serve as collateral for the Company’s outstanding balance under the Credit Facility agreement. No such amounts were restricted as of December 31, 2017.


12.

GEOGRAPHIC INFORMATION

Total revenue to unaffiliated customers by geographic area were as follows:


     Three Months
Ended September 30,
     Nine Months
Ended September 30,
 
     2018      2017      2018      2017  

United States

   $ 23,296      $ 24,488      $ 68,615      $ 76,842  

Canada

     1,468        2,218        5,425        7,365  

Other International

     571        655        2,758        2,589  


Total revenue

   $ 25,335      $ 27,361      $ 76,798      $ 86,796  


Substantially all of the Company’s long-lived assets are located within the United States.


13.

SEGMENT INFORMATION

In accordance with the provisions of Topic 280, Segment Reporting to the FASB ASC (“ASC 280”), the Company determined that it has three operating segments (Enterprise Performance Management (“EPM”), Enterprise Resource Planning (“ERP”) and Classic Consulting).

The EPM segment provides Business Analytics solutions leveraging Oracle EPM, BI and Big Data technologies. The ERP segment delivers Dynamics AX ERP, Business Intelligence and CRM solutions, primarily in the manufacturing space. The Classic Consulting segment provides business advisory services that are blended with technical services to help organizations leverage investments in legacy IT assets to create new digital business models.

The Company’s chief operating decision maker evaluates performance using several factors, of which the primary financial measures are revenue and operating segment operating income. The accounting policies of the operating segments are the same as those described in Note 2 “Summary of Significant Accounting Policies”.

Segment information for the three-month periods ended September 30, 2018 and 2017 were as follows:


     EPM      ERP      Classic
Consulting
    Corporate     Consolidated  
     (In Thousands)  

September 30, 2018


Total revenue

   $ 11,993      $ 12,992      $ 350     $ —       $ 25,335  

Operating income (loss)

   $ 896      $ 2,067      $ 10     $ (4,191   $ (1,218

Depreciation and amortization expense

   $ 446      $ 171      $ —       $ 10     $ 627  

September 30, 2017


Total revenue

   $ 12,273      $ 12,927      $ 2,161     $ —       $ 27,361  

Operating income (loss)

   $ 166      $ 1,599      $ (471   $ (2,027   $ (733

Depreciation and amortization expense

   $ 559      $ 200      $ —       $ 25     $ 784  


14


Table of Contents

Segment information for the nine-month periods ended September 30, 2018 and 2017 were as follows:


     EPM      ERP      Classic
Consulting
    Corporate     Consolidated  
     (In Thousands)  

September 30, 2018


Total revenue

   $ 35,070      $ 39,497      $ 2,231     $ —       $ 76,798  

Operating income (loss)

   $ 194      $ 5,731      $ (760   $ (10,423   $ (5,258

Depreciation and amortization expense

   $ 1,342      $ 514      $ —       $ 37     $ 1,893  

September 30, 2017


Total revenue

   $ 39,271      $ 38,881      $ 8,644     $ —       $ 86,796  

Operating income (loss)

   $ 1,689      $ 5,138      $ (404   $ (11,938   $ (5,515

Depreciation and amortization expense

   $ 1,682      $ 598      $ —       $ 104     $ 2,384  

The Company is not disclosing total assets for each of its reportable segments, as total assets by reportable segment is not a key metric provided to the Company’s chief operating decision maker.


15


Table of Contents

ITEM 2. MANAGEMENT’S DISCUSSION AND ANALYSIS OF FINANCIAL CONDITION AND RESULTS OF OPERATIONS

The following information should be read in conjunction with the information contained in the Unaudited Condensed Consolidated Financial Statements and notes thereto appearing elsewhere in this Quarterly Report on Form 10-Q. This Quarterly Report on Form 10-Q contains forward-looking statements that involve risks and uncertainties. See “Risk Factors” and “Special Note Regarding Forward-Looking Statements” included elsewhere herein. We use the terms “we,” “our,” “us,” “Edgewater” and “the Company” in this report to refer to Alithya USA, Inc., as successor by merger to Edgewater Technology, Inc. and its wholly-owned subsidiaries.

Business Overview

Edgewater Technology, Inc. helps the C-suite drive transformational change through its unique selection of business and technology services and channel-based solutions.

Classic consulting disciplines (such as business advisory, process improvement, organizational change management, M&A due diligence, and domain expertise) are blended with technical services (such as digital transformation, technical roadmaps, data and analytics services, custom development and system integration) to help organizations leverage investments in legacy IT assets to create new digital business models.

Delivering both on premise and in the cloud, Edgewater offers two major channel-based services. In the Oracle channel, Edgewater Ranzal provides Business Analytics solutions leveraging Oracle EPM, BI and Big Data technologies. In the Microsoft channel, Edgewater Fullscope delivers Dynamics AX ERP, Business Intelligence and CRM solutions primarily in the manufacturing space.

On November 1, 2018 (the “Effective Date”), 9374-8572 Delaware Inc., a Delaware corporation (“Merger Sub”) and a wholly owned subsidiary of Alithya Group inc., a newly-formed Québec corporation (“New Alithya”), merged with and into Edgewater Technology, Inc., a Delaware corporation (“Edgewater”), with Edgewater surviving as a wholly-owned subsidiary of New Alithya (the “Merger”). The Merger was effected pursuant to the Arrangement Agreement, dated as of March 15, 2018, as amended by Amendment No. 1 thereto dated as of September 10, 2018 and Amendment No. 2 thereto dated as of October 17, 2018 (as so amended, the “Arrangement Agreement”), among Alithya Group Inc., a Québec corporation (“Alithya”), New Alithya, Merger Sub and Edgewater. On the Effective Date, each of Alithya and Edgewater became a wholly-owned subsidiary of New Alithya in accordance with the Arrangement Agreement and an arrangement approved by Superior Court of Québec (the “Arrangement”) and Edgewater was renamed “Alithya USA, Inc.”

Pursuant to the terms of the Arrangement Agreement, upon the completion of the Merger, each issued and outstanding share of common stock, U.S.$0.01 par value per share, of Edgewater (“Edgewater Common Stock”) was converted into the right to receive 1.1918 fully-paid and nonassessable shares of New Alithya Class A subordinate voting stock, no par value (“New Alithya Subordinate Voting Shares”), rounded up to the nearest whole New Alithya Subordinate Voting Share. In addition, on October 19, 2018, the Edgewater Board of Directors declared a special cash dividend in the amount of U.S.$1.15 per share of Edgewater Common Stock payable on or around November 9, 2018 to Edgewater’s stockholders of record at the close of business on October 31, 2018. Due to the contingent nature of the Edgewater special cash dividend, Edgewater Common Stock traded with “due bills” representing an assignment of the right to receive the special cash dividend during the period from October 30, 2018 until the close of trading on November 1, 2018. Edgewater stockholders who sold their shares through NASDAQ on or after October 30, 2018 until the closing of trading on November 1, 2018 also sold their entitlement to the special cash dividend to the respective purchasers of shares.

On the Effective Date, each common share, no par value (“Alithya Common Shares”), of Alithya and each multiple voting common share, no par value (“Alithya Multiple Voting Shares” and, together with Alithya Common Shares, “Alithya Shares”), of Alithya then issued and outstanding were cancelled and automatically converted into the right to receive one newly issued New Alithya Subordinate Voting Share and one newly issued Class B multiple voting share, no par value (“New Alithya Multiple Voting Shares” and, together with New Alithya Subordinate Voting Shares, “New Alithya Shares”), of New Alithya, respectively. On the Effective Date, the former stockholders of Edgewater and the former shareholders of Alithya were issued approximately 40% and 60% of the total number New Alithya Shares on a fully-diluted basis, respectively (excluding the New Alithya Subordinate Voting Shares issued to investors in Alithya’s private placement that closed on October 30, 2018). However, because New Alithya Multiple Voting Shares were issued only to those former Alithya shareholders which previously held Alithya Multiple Voting Shares, the former stockholders of Edgewater and the former shareholders of Alithya received on the Effective Date approximately 16% and 84% of the total voting power of the total New Alithya Shares then issued, respectively (excluding the New Alithya Subordinate Voting Shares issued to investors in Alithya’s private placement that closed on October 30, 2018).

The issuance of New Alithya Subordinate Voting Shares in connection with the Arrangement was registered under the Securities Act of 1933, as amended, pursuant to New Alithya’s registration statement on Form F-4 (File No. 333-227310) filed with the Securities and Exchange Commission (the “SEC”) and declared effective on September 27, 2018. The prospectus/proxy statement


16


Table of Contents

dated September 28, 2018 (the “Prospectus/Proxy Statement”) and the supplement thereto dated October 23, 2018 (the “Supplement”), as filed under the Registration Statement, contains additional information about the Merger and the Arrangement.

The New Alithya Subordinate Voting Shares have been approved for listing, on the Nasdaq Capital Market and the Toronto Stock Exchange under the symbol “ALYA”. The trading of the New Alithya Subordinate Voting Shares commenced on the Nasdaq Capital Market and the Toronto Stock Exchange on November 2, 2018.

In connection with the completion of the Arrangement, New Alithya received binding agreements from certain former Edgewater stockholders and Alithya shareholders not to sell their New Alithya Subordinate Voting Shares or New Alithya Multiple Voting Shares for a minimum period of 12 months following the Effective Date, without receiving New Alithya’s prior written consent. Those former Edgewater stockholders and Alithya shareholders included Ancora Advisors, LLC (which prior to the Effective Date owned approximately 10.2% of the total outstanding Edgewater Common Stock), the directors and officers of Alithya and Edgewater remaining with the post-closing operations of New Alithya, Alithya shareholders receiving more than 5% of all of the issued and outstanding New Alithya Shares taken as a whole, at closing, and certain other employees or other persons mutually agreed upon between Alithya and Edgewater.

Our Services

Edgewater offers a full spectrum of services and expertise to ensure the success of our engagements. Our consulting services are categorized into two different components: (1) Channel View and (2) Systems Integration View.

The following diagram illustrates these offerings:


LOGO

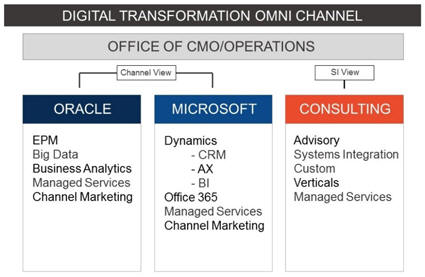
Edgewater has the proven expertise to plan, deliver and manage integration services that improve performance and maximize business results. We focus on deploying new systems and unlocking the value of the existing corporate assets. This proven expertise enables us to bring complex technologies and systems together while minimizing risk, leveraging our clients’ technology investments and delivering tailored solutions.

Factors Influencing Our Results of Operations

Revenue. The Company derives its service revenue from time and materials-based contracts, fixed-price contracts and retainer-based arrangements. Time and materials-based contracts represented 88.3% and 86.9% of service revenue for the three- and nine-month periods ended September 30, 2018, respectively. Time and materials-based contracts represented 82.9% and 83.9% of service revenue for the three- and nine-month periods ended September 30, 2017. Revenue under time and materials contracts is recognized as services are rendered and performed at contractually agreed upon rates. Fixed-price contracts represented 7.3% and 8.0% of service revenue for the three- and nine-month periods ended September 30, 2018. Fixed-price contracts represented 11.5% and 9.6% of service revenue for the three- and nine-month periods ended September 30, 2017. Revenue pursuant to fixed-price contracts is recognized over time based on the proportional performance (using a hours-based input method) related to individual performance


17


Table of Contents

obligations within each arrangement. Retainer-based contracts represented 4.4% and 5.1% of service revenue during the three- and nine-month periods ended September 30, 2018. Retainer-based contracts represented 5.6% and 6.5% of service revenue during the three- and nine-month periods ended September 30, 2017. Revenue under retainer-based contracts is recognized ratably over the contract period, as outlined within the respective contract.

Estimates of total project costs are continually monitored during the term of an engagement. There are situations where the number of hours to complete projects may exceed (or be less than) our original estimate, because of an increase (or decrease) in project scope, unforeseen events that arise, or the inability of the client or the delivery team to fulfill their responsibilities. Accordingly, recorded revenues and costs are subject to revision throughout the life of a project based on current information and historical trends. Such revisions may result in increases or decreases to revenue and income and are reflected in the consolidated financial statements in the periods in which they are first identified. In all instances, the re-sale of third party software is recorded in a net basis, company created software, and the associated maintenance, is reported on a gross basis, however it is immaterial in all periods presented.

We anticipate that software revenue will continue to be a significant portion of our revenues. Our reported software revenue represents the resale of certain third-party off-the-shelf software and related maintenance (primarily relates to the resale of Microsoft Dynamics AX product).

Software revenue is recognized upon delivery, except in the infrequent situation where the Company provides maintenance services, in which case the related maintenance is recognized over time over the maintenance period (while the software revenue is recognized upon delivery). Software revenue is expected to fluctuate between quarters, dependent on our customers’ demand for such third-party off-the-shelf software. Fluctuations in software revenue may have an impact upon our periodic operating performance, including gross margin.

Operating Expenses. The largest portion of our operating expenses consists of cash and non-cash compensation and benefits associated with our project consulting personnel and related expenses. Non-cash compensation includes share-based compensation expense arising from restricted stock and option grants to employees. Project personnel expenses also consist of payroll costs and related benefits associated with our professional staff. Other related expenses include travel, subcontracting costs, third-party vendor payments and non-billable expenses associated with the delivery of services to our customers. We consider the relationship between project personnel expenses and service revenue to be an important measure of our operating performance. The relationship between project personnel expenses and service revenue is driven largely by the chargeability of our consultant base, the prices we charge our customers and the non-billable costs associated with securing new customer engagements and developing new service offerings. The remainder of our recurring operating expense is composed of expenses associated with the development of our business and the support of our customer-serving professionals, such as professional development and recruiting, marketing and sales, and management and administrative support. Professional development and recruiting expenses consist primarily of recruiting and training content development and delivery costs. Marketing and sales expenses consist primarily of the costs associated with the development and maintenance of our marketing materials and programs. Management and administrative support expenses consist primarily of the costs associated with operations, including finance, information systems, human resources, facilities (including the rent of office space) and other administrative support for project personnel.

We regularly review our fees for services, professional compensation and overhead costs to ensure that our services and compensation are competitive within the industry and that our overhead costs are balanced with our revenue levels. In addition, we monitor the progress of customer projects with customer senior management. We manage the activities of our professionals by closely monitoring engagement schedules and staffing requirements. However, a rapid decline in the demand for the professional services that we provide could result in lower utilization of our professionals than we planned. In addition, because most of our customer engagements are terminable by our customers without penalty, an unanticipated termination of a customer project could require us to maintain underutilized employees. While professional staff levels must be adjusted to reflect active engagements, we must also maintain a sufficient number of consulting professionals to oversee existing customer engagements and to participate in sales activities to secure new customer assignments.

Merger related transaction costs. The Company incurred $2.7 million and $4.3 million of merger related acquisition costs related to the Alithya merger transaction in the three- and nine-month periods ended September 30, 2018, respectively. Incurred expenses included investment banking fees, legal fees, accounting and other professional fees directly associated with completion of the merger. No such expenses were incurred in the three- or nine-month periods ended September 30, 2017.

Executive Officer Severance. The Company incurred $3.4 million of expense associated with the termination of two Executive Officers of the Company during the three-month period ended March 31, 2017. During the three-months ended March 31, 2017 the Company terminated without cause the employment of the Chairman, President, and Chief Executive Officer as well as the Executive Vice President and Chief Strategy and Technology Officer. The severance expense associated with these terminations include salary and salary related expenses (including bonus) as well as the expense associated with the acceleration of stock award vesting. The Company also incurred $816 thousand of expense associated with the termination of an Executive Officer of the Company during the three-month period ended September 30, 2017. During the three-month period ended September 30, 2017 the Company terminated without cause the employment of the President of Edgewater-Ranzal. The severance expense associated with this termination includes salary and salary related expenses (including bonus) as well as the expense associated with the acceleration of stock award vesting. No such expense was recognized in the three- or nine-month periods ended September 30, 2018.


18


Table of Contents

Consent solicitation expense. The Company incurred $666 thousand of legal and advisory costs related to the defense of a consent solicitation in the three-month period ended March 31, 2017. No such expenses were incurred in the three-month period ended September 30, 2017 or the three- or nine-month periods ended September 30, 2018.

Adjustments to Fair Value of Contingent Consideration. The Company remeasures the estimated carrying value of contingent consideration each quarter, with any changes (income or expense) in the estimated fair value recorded as an operating expense. During the three-month period ended September 30, 2017 the Company recorded a decrease to the fair value of contingent earnout consideration (recorded within selling, general and administrative expense) of $(856) thousand. This adjustment was related to the finalization of the Branchbird earnout calculation. During the three-month period ended March 31, 2017 the Company recorded an increase to the fair value of contingent earnout consideration (recorded within selling, general and administrative expense) of $604 thousand. This adjustment was related to the finalization of the M2 Dynamics and Zero2Ten earnout calculations. During the three-month period ended June 30, 2016 the Company recorded a decrease to the fair value of contingent earnout consideration (recorded within selling, general and administrative expense) of $(928) thousand. This adjustment was related to the change in forecasted performance of M2 Dynamics, Zero2Ten and Branchbird. Accretion of the contingent earnout liability is classified as other expense on the consolidated statements of comprehensive (loss) income. As of September 30, 2017, the Company has no ongoing contingent earnout obligations and no accrued balances. As of December 31, 2016, the Company had $8.1 million accrued in connection with the contingent earnout obligations associated with the Zero2Ten, Branchbird, and M2 Dynamics Acquisitions. As of September 30, 2018 and December 31, 2017, the Company had no remaining obligations under any contingent earnout consideration agreements.

Contract termination expense. In the second quarter of 2017 the Company paid $1.1 million in connection with the termination of a professional services agreement for advisory services initially entered into during our publicly announced strategic alternative process. No further expense will be incurred in connection with this agreement.

Company Performance Measurement Systems and Metrics. The Company’s management monitors and assesses its operating performance by evaluating key metrics and indicators on an ongoing basis. For example, we regularly review performance information related to annualized revenue per billable consultant, periodic consultant utilization rates, gross profit margins, average bill rates and billable employee headcount. Edgewater has also developed internal Enterprise Performance Management systems which aid us in measuring our operating performance and consultant utilization rates. The matching of sales opportunities to available skill sets in our consultant base is one of our greatest challenges and therefore, we monitor consultant utilization closely. These metrics, along with other operating and financial performance metrics, are used in evaluating management’s overall performance. These metrics and indicators are discussed in more detail under “Results for the Three and Nine Months Ended September 30, 2018, Compared to Results for the Three and Nine Months Ended September 30, 2017,” included elsewhere in this Quarterly Report on Form  10-Q.

Results for the Three and Nine Months Ended September 30, 2018, Compared to Results for the Three and Nine Months Ended September 30, 2017

The financial information that follows has been rounded in order to simplify its presentation. The amounts and percentages below have been calculated using the detailed financial information contained in the unaudited condensed consolidated financial statements, the notes thereto, and the other financial data included in this Quarterly Report on Form 10-Q.


19


Table of Contents

The following table sets forth the percentage of total revenue of items included in our unaudited condensed consolidated statements of comprehensive (loss) income:


     Three Months Ended
September 30,
    Nine Months Ended
September 30,
 
     2018     2017     2018     2017  

Revenue:


Service revenue

     90.6     86.1     89.0     84.2

Software revenue

     4.1     8.7     5.6     10.8

Reimbursable expenses

     5.3     5.2     5.4     5.0


Total revenue

     100.0     100.0     100.0     100.0

Cost of revenue:


Project and personnel costs

     54.4     51.8     57.9     52.4

Software costs

         5.3         5.9

Reimbursable expenses

     5.3     5.2     5.4     5.0


Total cost of revenue

     59.7     62.3     63.3     63.3


Gross profit

     40.3     37.7     36.7     36.7

Operating expenses:


Selling, general and administrative

     31.8     37.6     35.3     33.7

Merger related transaction costs

     10.8     —       5.7     —  

Executive officer severance

     —       3.0     —       4.8

Contract termination expense

     —       —       —       1.3

Consent solicitation expense

     —       —       —       0.8

Change in fair value of contingent earnout
consideration

     —       (3.1 )%      —       (0.3 )% 

Depreciation and amortization

     2.5     2.9     2.5     2.7


Total operating expenses

     45.1     40.4     43.5     43.0


Operating income (loss)

     (4.8 )%      (2.7 )%      (6.8 )%      (6.3 )% 

Other expense, net

     0.3     (0.1 )%      0.3     0.3


Income (loss) before income taxes

     (5.1 )%      (2.6 )%      (7.1 )%      (6.6 )% 

Income tax provision (benefit)

     0.1     (1.9 )%      0.4     (2.3 )% 


Net loss

     (5.2 )%      (0.7 )%      (7.5 )%      (4.3 )% 


Revenue. Total revenue decreased by $(2.0) million, or (7.4)%, to $25.3 million during the three-month period ended September 30, 2018, compared to total revenue of $27.4 million in the three-month period ended September 30, 2017. Total revenue decreased by $(10.0) million, or (11.5)%, to $76.8 million during the nine-month period ended September 30, 2018, compared to total revenue of $86.8 million in the nine-month period ended September 30, 2017. Service revenue decreased by $(607) thousand, or (2.6)%, to $23.0 million during the three-month period ended September 30, 2018, compared to service revenue of $23.6 million in the three-month period ended September 30, 2017. Service revenue decreased by $(4.8) million, or (6.6)%, to $68.3 million during the nine-month period ended September 30, 2018, compared to service revenue of $73.1 million in the nine-month period ended September 30, 2017.

Our ability to close project deals and generate service revenue has been impacted by the Alithya merger transaction. We have experienced delays in the signing of certain engagements particularly within our EPM business. While our 2015 acquisitions of M2 Dynamics, Branchbird and Zero2Ten have strengthened the Company’s cloud-based offerings in both the EPM and ERP markets, we are still experiencing delays in customer purchasing. The transition to cloud-based offerings is further along within our ERP customer base (with this practice showing year over year quarterly and year-to-date growth). While the transition to cloud is further along in the ERP business, we are starting to gain traction in the EPM business and we are gaining traction in our cloud based offerings.

As we experience a transition within our EPM and ERP channels from on-premise to hybrid to cloud-based solutions we may experience a disruption in the timing of our customer purchasing habits. This transition may cause fluctuations in our service and software revenue and related margin contributions in the coming periods. Because of this, we believe that periodic fluctuations in the amount of revenue recognized by the Company may have a material impact upon our gross margins.


20


Table of Contents

Billable consultant utilization increased to 76.9% and 73.6% in the three- and nine-month periods ended September 30, 2018 compared to 71.3% and 73.1% in the three- and nine-month periods ended September 30, 2017. Billable consultant utilization has increased and the billable headcount base has decreased by 54, to 282 (excluding contractors) compared to 336 (excluding contractors) at September 30, 2017.

On a sequential quarterly basis, service revenue remained relatively consistent (despite one fewer billing day). While the industry continues to experience a temporary disruption in the marketplace as our customer base considers the adoption of cloud based solutions, our increasing utilization rates support our position that we are uniquely positioned to serve customers in both the cloud based as well as on premise solutions.

Annualized service revenue per billable consultant, as adjusted for utilization, was $362 thousand and $367 thousand during the three-month periods ended September 30, 2018 and 2017, respectively. Annualized service revenue per billable consultant, as adjusted for utilization, was $367 thousand and $368 thousand during the nine-month periods ended September 30, 2018 and 2017, respectively. The periodic fluctuations in our annualized service revenue per billable consultant metric continue to reflect the changes in the mix of our service offering revenue generated by our current engagements.

During the three- and nine-month periods ended September 30, 2018, software revenue totaled $1.0 million and $4.3 million, or 4.1% and 5.6% of total revenue, respectively, compared to software revenue of $2.4 million and $9.3 million, or 8.7% and 10.8%, respectively, in the three- and nine-month periods ended September 30, 2017. Our software revenue is primarily related to our resale of Microsoft Dynamics software, cloud-based licenses and maintenance. Software revenue is expected to fluctuate on a period-to-period basis dependent upon our customers’ demand for such third-party off-the-shelf software. We anticipate that software revenue will continue to represent a meaningful portion of revenues in future years. Because of this, we believe that periodic fluctuations in the amount of software revenue recognized by the Company may have a material impact upon our gross margins.

Generally, we are reimbursed for our out-of-pocket expenses incurred in connection with our customers’ consulting projects. Reimbursed expense revenue was $1.3 million and $1.4 million for the three-month periods ended September 30, 2018 and 2017, respectively. Reimbursed expense revenue was $4.1 million and $4.3 million for each of the nine-month periods ended September 30, 2018 and 2017, respectively. The aggregate amount of reimbursed expenses will fluctuate from period-to-period depending on the number of billable consultants as well the location of our customers, the general fluctuation of travel costs, such as airfare, and the number of our projects that require travel.

The number of customers the Company served during the nine-month period ended September 30, 2018 totaled 558, as compared to 570 customers during the nine-month period ended September 30, 2017. During the first nine months of 2018, we secured first-time engagements with a total of 83 new customers, compared to 78 new customer engagements during the first nine months of 2017.

Cost of Revenue. Cost of revenue primarily consists of project personnel costs principally related to salaries, payroll taxes, employee benefits, software costs and travel expenses for personnel dedicated to customer projects. These costs represent the most significant expense we incur in providing our services. In total, cost of revenue decreased by $(1.9) million, or (11.2)%, to $15.1 million for the three-month period ended September 30, 2018, compared to $17.0 million in the comparative 2017 quarterly period. Cost of revenue decreased by $(6.4) million, or (11.6)%, to $48.6 million during the year-to-date period ended September 30, 2018 compared to $55.0 million in the comparative 2017 year-to-date period.

The primary drivers of the 2018 year-over-year decrease in total cost of revenue during the three- and nine-month periods ended September 30, 2018, on an absolute dollar basis, were related to decreases in salary and salary-related expenses, inclusive of incentive compensation (primarily associated with the decrease in billable consultant headcount). The Company maintained 282 billable consultants (excluding contractors) as of the quarter ended September 30, 2018, compared to 336 billable consultants (excluding contractors) at the end of the third quarter of 2017.

Project and personnel costs represented 54.4% and 57.9% of total revenue during the three- and nine-month periods ended September 30, 2018, respectively, as compared to 51.8% and 52.4% of total revenue during the three- and nine-month periods ended September 30, 2017, respectively.

The increase in project and personnel costs for both the three- and nine-month periods ended September 30, 2018, as a percentage of total revenue, is the result of an increased reliance on third party contractors (which was necessary with the reductions in full time billable employees).

Reimbursable expenses were $1.3 million and $4.1 million for the three- and nine-month periods ended September 30, 2018, respectively, compared to $1.4 million and $4.3 million in the comparative periods of 2017, respectively.


21


Table of Contents

Gross Profit. During the three-month period ended September 30, 2018, total gross profit decreased $(123) thousand, or (1.2)%, to $10.2 million compared to gross profit of $10.3 million in the three-month period ended September 30, 2017. During the nine-month period ended September 30, 2018, total gross profit decreased $(3.6) million, or (11.5)%, to $28.2 million compared to total gross profit of $31.8 million in the nine-month period ended September 30, 2017. For purposes of further analysis, we refer to gross profit as a percentage of revenue generally as gross margin.

Total gross margin, as a percentage of total revenue, increased to 40.3% in the third quarter of 2018, compared to 37.7% in the third quarter of 2017. Total gross margin remained consistent at 36.7% in the nine-month period ended September 30, 2018, compared to 36.7% in the comparative 2017 year-to-date period. The year-over-year quarterly increase in total gross margin percentage was primarily the result of increased billable consultant utilization (partially offset by the decrease in billable headcount).

Service revenue gross margins were 39.8% in the third quarter of 2018, compared to 39.8% in the third quarter of 2017. Service revenue gross margins were 34.9% in the nine-month period ended September 30, 2018, compared to 37.7% in the comparative 2017 year-to-date period. The decrease in service gross margin for the three- and nine-month periods ended September 30, 2018 are directly related to the decreases in billable consultant utilization and billable headcount.

We anticipate that software revenue will continue to be a meaningful part of our revenue in future periods. Additionally, our future gross margins may continue to be influenced by the timing of the recognition of our software revenue.

Selling, General and Administrative (“SG&A”) Expenses. As a percentage of total revenue, SG&A expenses were 31.8% and 35.3% during the three- and nine-month periods ended September 30, 2018, respectively, compared to 37.6% and 33.7% in the three- and nine-month periods of 2017, respectively. On an absolute dollar-basis, SG&A expenses decreased by $(2.3) million, or (22.0)%, and decreased by $(2.0) million, or (7.0)%, to $8.1 million and $27.3 million in the three- and nine-month periods ended September 30, 2018, respectively, compared to SG&A expenses of $10.3 million and $29.2 million in the three- and nine-month periods ended September 30, 2017, respectively.

Selling, general and administrative expense decreased, during the three-month period ended September 30, 2018 as a result of overhead related expenses (primarily in the form of marketing and selling expense). Selling, general and administrative expenses remained essentially flat during the nine-month period ended September 30, 2018 as the overhead related decreases were offset by increases related to salary and salary-related expenses.

Merger related transaction costs. The Company incurred $2.7 million and $4.3 million of merger related acquisition costs related to the Alithya merger transaction in the three- and nine month periods ended September 30, 2018, respectively. Incurred expenses included investment banking fees, legal fees, accounting and other professional fees directly associated with completion of the merger. No such expenses were incurred in the three- or nine-month periods ended September 30, 2017.

Executive Officer Severance. During the three-month period ended March 31, 2017, the Company terminated the employment of the former Chairman, President, and Chief Executive Officer and the former Chief Strategy and Technology Officer. In connection with these terminations, the Company incurred $3.4 million of severance related expenses. These expenses were associated with contractually agreed upon salary, bonus and acceleration of vesting of stock-based compensation awards. Also, during the three-month period ended September 30, 2017, the Company terminated the employment of the former President of Edgewater-Ranzal. In connection with this termination, the Company incurred $816 thousand of severance related expenses. These expenses were associated with contractually agreed upon salary, bonus and acceleration of vesting of stock-based compensation awards. No such expenses were incurred in the three- or nine-month periods ended September 30, 2018.

Contract Termination Expense. In the second quarter of 2017 the Company paid $1.1 million in connection with the termination of a professional services agreement for advisory services initially entered into during our publicly announced strategic alternative process. No further expense will be incurred in connection with this agreement.

Consent Solicitation Expense. During the three-month period ended March 31, 2017, we incurred $666 thousand of legal and advisory expenses in connection with defense against a consent solicitation. No such expenses were incurred in the three-month period ended September 30, 2017 or the three- or nine-month periods ended September 30, 2018, respectively.

Change in Fair Value of Contingent Earnout Consideration. The Company continually examines actual results in comparison to financial metrics utilized in each of our earnout calculations and assesses the carrying value of the contingent earnout consideration. During the three-month period ended September 30, 2017, the Company recorded changes in fair value of the estimated earnout consideration to be achieved (as a result of the finalization of the Branchbird earnout) which resulted in the reversal of $(856) thousand of expense. During the three-month period ended March 31, 2017, the Company recorded changes in fair value of the estimated earnout consideration to be achieved (as a result of higher achievement of financial targets than initially forecasted) which resulted in $604 thousand of expense. The Company had no active contingent earnout arrangements during 2018 and therefore there were no expenses for the three- or nine-month periods ended September 30, 2018.


22


Table of Contents

Depreciation and Amortization Expense. Depreciation and amortization expense decreased $(155) thousand, or (19.8)%, to $627 thousand in the quarter ended September 30, 2018 as compared to $782 thousand in the quarter ended September 30, 2017. Similarly, depreciation and amortization expense decreased $(481) thousand, or (20.2)%, to $1.9 million in the nine-month period ended September 30, 2018 compared to $2.4 million in the comparative 2017 year-to-date period.

Amortization expense was $561 thousand and $1.7 million during the three- and nine-month periods ended September 30, 2018, respectively, compared to amortization expense of $700 thousand and $2.1 million in the three- and nine-month periods ended September 30, 2017, respectively. The amortization expense recognized during 2018 and 2017 is primarily the result of the amortization expense associated with the intangible assets identified in connection with the Zero2Ten, Branchbird and M2 Dynamics Acquisitions. The Company recognizes amortization expense over the periods in which it expects to realize the economic benefit.

Depreciation expense was $66 thousand and $213 thousand recorded in the three- and nine-month periods ended September 30, 2018, respectively. Depreciation expense was $82 thousand and $279 thousand recorded in the three- and nine-month periods ended September 30, 2017, respectively.

Operating Income (Loss). Operating loss was $(1.2) million in the third quarter of 2018, compared to operating loss of $(733) thousand in the comparative 2017 quarterly period. Operating loss for the nine-month period ended September 30, 2018 was $(5.3) million, compared to operating loss of $(5.5) million in the comparative 2017 year-to-date period.

The decrease in operating income for the three-month period ended September 30, 2018, compared to September 30, 2017 is primarily driven by the decreased revenue contribution from the EPM unit combined with the increase in professional fees related to the merger. The change in operating loss for the nine-month period ended September 30, 2018, compared to September 30, 2017 is primarily related to the merger related transaction costs.

Other Expense, Net. Other expense, net, totaled $68 thousand and $241 thousand during the three- and nine-month periods ended September 30, 2018, respectively, while other expense, net, totaled $(33) thousand and $200 thousand during the three- and nine-month periods ended September 30, 2017, respectively. Other expense, net for the three- and nine-months ended September 30, 2018 were related to the periodic foreign currency exchange gains and losses. Other expense, net, for the three-months ended September 30, 2017 are primarily the result of the accretion of the contingent earnout liability recognized in connection with the Branchbird Acquisition which was offset by periodic foreign currency exchange gains and losses. Other expense, net, for the nine-months ended September 30, 2017 are primarily the result of the accretion of the contingent earnout liability recognized in connection with the Zero2Ten and Branchbird Acquisitions and also includes periodic foreign currency exchange gains and losses.

Income Tax Provision (Benefit). We recorded a provision for income taxes of $20 thousand and a provision of $227 thousand during the three- and nine-month periods ended September 30, 2018, respectively. We recorded a benefit for income taxes of $(528) thousand and a benefit of $(2.0) million during the three- and nine-month periods ended September 30, 2017, respectively. Our periodic income tax provision amounts are derived based upon an estimated annual effective income tax rate, inclusive of federal and state income taxes, of (1.5)% and (4.1)% during the three- and nine-month periods ended September 30, 2018, respectively. Our periodic income tax provision amounts are derived based upon an estimated annual effective income tax rate, inclusive of federal and state income taxes, of 75.4% and 34.9% during the three- and nine-month periods ended September 30, 2017, respectively.

Reported income tax expense also includes expense amounts attributable to foreign income taxes, the recognition of U.S. deferred tax liabilities for differences between the book and tax basis of goodwill and interest and penalties.

We have deferred tax assets that have arisen primarily as a result of timing differences, net operating loss carryforwards and tax credits. Our ability to realize a deferred tax asset is based on our ability to generate sufficient future taxable income. We assess, on a routine periodic basis, the estimated future realizability of the gross carrying value of our deferred tax assets on a more likely than not basis. Our periodic assessments take into consideration both positive evidence (future profitability projections for example) and negative evidence (accumulated deficit) as it relates to evaluating the future recoverability of our deferred tax assets.

The Company considers scheduled reversals of deferred tax liabilities, projected future taxable income, ongoing tax planning strategies and other matters, including the period over which our deferred tax assets will be recoverable, in assessing the need for and the amount of the valuation allowance. In the event that actual results differ from these estimates, or we adjust these estimates in the future periods, further adjustments to our valuation allowance may be recorded, which could materially impact our financial position and net income in the period of the adjustment.


23


Table of Contents

Net Loss. We recorded net loss of $(1.3) million and net loss of $(5.7) million during the three- and nine-month periods ended September 30, 2018, respectively, compared to net loss of $(172) thousand and $(3.7) million during the three- and nine-month periods ended September 30, 2017, respectively. The 2018 third quarter and year-to-date net loss are driven by the decrease service revenue contribution combined with the merger related expenses identified above.

Operating Segments. Total revenue within our EPM operating segment decreased $(280) thousand, or (2.3)%, to $12.0 million in the three-month period ended September 30, 2018 compared to $12.3 million in the three-month period ended September 30, 2017. The decrease in EPM total revenue was driven primarily by the channel disruption associated with the emphasis of cloud-based solutions by channel partners. Total revenue within our ERP operating segment increased by $65 thousand, or 0.5%, to $13.0 million in the three-month period ended September 30, 2018 compared to $12.9 million in the three-month period ended September 30, 2017. The increase in ERP revenue was driven primarily by the timing of engagements and the billable hours performed. Total revenue within our Classic Consulting segment decreased $(1.8) million, or (83.8)%, to $350 thousand in the three-month period ended September 30, 2018 compared to $2.2 million in the three-month period ended September 30, 2017. The decrease in Classic Consulting was driven principally by the decrease in billable consultant utilization specific to the Classic Consulting segment.

Total revenue within our EPM operating segment decreased $(4.2) million, or (10.7)%, to $35.1 million in the nine-month period ended September 30, 2018 compared to $39.3 million in the nine-month period ended September 30, 2017. The decrease in EPM total revenue was driven primarily by the channel disruption associated with the emphasis of cloud-based solutions by channel partners. Total revenue within our ERP operating segment increased by $616 thousand, or 1.6%, to $39.5 million in the nine-month period ended September 30, 2018 compared to $38.9 million in the nine-month period ended September 30, 2017. The increase in ERP revenue was driven primarily by the timing of engagements and the billable hours performed. Total revenue within our Classic Consulting segment decreased $(6.4) million, or (74.2)%, to $2.2 million in the nine-month period ended September 30, 2018 compared to $8.6 million in the nine-month period ended September 30, 2017. The decrease in Classic Consulting was driven principally by the decrease in billable consultant utilization specific to the Classic Consulting segment.

Operating income within our EPM operating segment increased $730 thousand, or 439.8%, to $896 thousand in the three-month period ended September 30, 2018 compared to $166 thousand in the three-month period ended September 30, 2017. The increase in operating income was driven principally by the increase in billable consultant utilization. Operating income within our ERP operating segment increased by $468 thousand, or 29.3%, to $2.1 million in the three-month period ended September 30, 2018 compared to $1.6 million in the three-month period ended September 30, 2017. The increase in operating income was, due in part to the increased revenue contribution noted above. Operating income within our Classic Consulting operating segment increased by $481 thousand, or 102.1%, to $10 thousand in the three-month period ended September 30, 2018 compared to $(471) thousand in the three-month period ended September 30, 2017. The increase in operating income was driven primarily by the decrease in overhead related expenses (specifically within Classic Consulting).

Operating income within our EPM operating segment decreased $(1.5) million, or (88.5)%, to $194 thousand in the nine-month period ended September 30, 2018 compared to $1.7 million in the nine-month period ended September 30, 2017. The decrease in operating income was driven principally by the decrease in total revenue (which was driven by the channel disruption of the transition to cloud-based solutions). Operating income within our ERP operating segment increased by $593 thousand, or 11.5%, to $5.7 million in the nine-month period ended September 30, 2018 compared to $5.1 million in the nine-month period ended September 30, 2017. The increase in operating income was, due in part to the increased revenue contribution noted above. Operating income within our Classic Consulting operating segment decreased by $(356) thousand, or (88.1)%, to $(760) thousand in the nine-month period ended September 30, 2018 compared to $(404) thousand in the nine-month period ended September 30, 2017. The decrease in operating income was driven primarily by the decrease in billable consultant utilization (specifically within Classic Consulting).


24


Table of Contents

Liquidity and Capital Resources

The following table summarizes our cash flow activities for the periods indicated:


     Nine Months Ended
September 30,
 
     2018      2017  
     (In Thousands)  

Cash flows (used in) provided by:


Operating activities

   $ (7,322    $ (5,790

Investing activities

     (190      (116

Financing activities

     1,604        (1,089

Effects of exchange rates on cash

     (46      98  


Total cash used in the period

   $ (5,954    $ (6,897


As of September 30, 2018, we had cash and cash equivalents of $4.4 million, a $(11.0) million decrease from the December 31, 2017 balance of $15.4 million. The primary drivers of the decrease in cash during the nine-month period ended September 31, 2018 are the bonus and commission payments related to the Company’s 2017 performance-based incentive programs, the payment of retention based compensation for key individuals in our EPM and ERP business units, the classification of $5.0 million in restricted cash in connection with our credit agreement and premium payments associated with the renewal of annual insurance policies. The Company partially offset these cash outflows through the recurring collection of customer receivables.

Working capital, which is defined as current assets less current liabilities, decreased to $14.2 million as of September 30, 2018, as compared to $16.8 million as of December 31, 2017.

Historically, we have used our operating cash flows, available cash, available funds under our credit facility and periodic sales of our common stock to finance ongoing operations and business combinations. We believe that our cash and cash equivalents will be sufficient to finance our working capital needs for at least the next twelve months. We periodically reassess the adequacy of our liquidity position, taking into consideration current and anticipated operating cash flow, anticipated capital expenditures, and possible business combinations. The pace at which we will either generate or consume cash will be dependent upon future operations and the level of demand for our services on an ongoing basis.

Cash flow from operating activities is driven by collections of fees for our consulting services and the reselling of software products. Cash used in operations predominantly relates to employee compensation and payments to third-party software providers. Accrued payroll and related liabilities fluctuate from period to period based on the timing of our normal payroll cycle and the timing of variable compensation payments. Annual components of our variable compensation plans are paid in the first quarter of the following year, causing fluctuations in cash flow from quarter to quarter.

Accounts payable and accrued expenses are most significantly affected by the timing of payments required to be made to third-party software providers in connection with the resale of software products to our customers. Historically, a significant portion of our software sales has occurred at the end of the second quarter.

Net cash used in operating activities was $(7.3) million for the nine-month period ended September 30, 2018, as compared to net cash used in operating activities of $(5.8) million for the nine-month period ended September 30, 2017. The primary components of operating cash flows during the first nine months of 2018 were driven by the collection of receivables, offset by the reported net loss, payments of bonus and commissions under our 2017 performance-based and retention-based bonus programs, and the timing of payments related to annual insurance-related premiums and third-party software expenses. Additionally, non-cash charges were primarily driven by depreciation and amortization, stock-based compensation. The primary components of operating cash flows during the first nine months of 2017 were driven by the collection of receivables, offset by the reported net loss, payments of executive officer severance, contingent earnout consideration, bonus and commissions under our 2016 performance-based bonus programs, contract termination fees and the timing of payments related to annual insurance-related premiums and third-party software expenses. Additionally, non-cash charges were primarily driven by depreciation and amortization and stock-based compensation, partially offset by deferred income taxes.

Net cash used in investing activities was $(190) thousand during the nine-month period ended September 30, 2018, compared to net cash used in investing activities of $(116) thousand in the nine-month period ended September 30, 2017. Cash used in investing activities in the nine-month period ended September 30, 2018 and 2017 related to the purchases of property and equipment.

All capital expenditures are discretionary as the Company currently has no long-term commitments for capital expenditures.


25


Table of Contents

Net cash provided by financing activities was $1.6 million in the nine-month period ended September 30, 2018, compared to net cash used in financing activities of $(1.1) million in the nine-month period ended September 30, 2017. The 2018 cash provided in financing activities was driven by stock option exercises, partially offset by the purchase of treasury stock. The 2017 cash used in financing activities was driven by the payments of the contingent earnout consideration related to the M2 Dynamics and Zero2Ten Acquisitions, partially offset by the proceeds attributable to our Employee Stock Purchase Plan and stock option exercises.

In September 2013, the Company entered into a secured revolving credit facility (the “Credit Facility”). The Credit Facility was modified through an amendment in December 2015, which increased the borrowing base to $15 million (from the previous $10 million) with an additional accordion feature that allows the Company to request an additional $5.0 million as needed, extending the total credit facility borrowing capacity to $20 million over its three-year term. The Credit Facility is collateralized by substantially all assets of the Company and its domestic subsidiaries, and is subject to normal financial covenants.

In October 2018, the Company entered into an amendment, which amended certain terms of the Credit Facility. The amendment waived the restrictions on change of control of Edgewater in the Loan Agreement to the extent required to permit the acquisition of all of the outstanding stock of Edgewater by New Alithya.

The amendment modified certain provisions of the Credit Facility, including, among other things, (i) the right of Edgewater obtain up to $7.0 million of additional Revolving Advances provided that all such additional Revolving Advances shall be deposited into the blocked deposit account maintained by Edgewater at Citizens, (ii) Edgewater’s agreement that all funds held in such blocked account (including the $5.0 million of funds now held in such blocked account) will constitute cash collateral for all obligations of Edgewater to Citizens under the Loan Agreement, and (iii) Edgewater’s right to withdraw the funds in the blocked account will be contingent on the repayment in full of all obligations then outstanding under the Loan Agreement.

The Company had drawn down $5.0 million of this balance as of September 30, 2018. Subsequent to September 30, 2018, the Company drew down the additional $7.0 million allowed under the Credit Facility. The Company was not in compliance with one of its loan covenants as of September 30, 2018, however, the full $12.0 million was paid off and the Credit Facility closed in November 2018.

Off Balance Sheet Arrangements

We do not have any off-balance sheet arrangements that have or are reasonably likely to have a current or future effect on our financial condition, changes in financial condition, revenues or expenses, results of operations, liquidity, capital expenditures or capital resources that are material to investors.

Critical Accounting Policies and Estimates

We prepare our unaudited condensed consolidated financial statements in conformity with accounting principles generally accepted in the United States of America. As such, we are required to make certain estimates, judgments and assumptions that we believe are reasonable based upon the information available. These estimates and assumptions affect the reported amounts of assets and liabilities at the date of the financial statements and the reported amounts of revenues and expenses during the periods presented.

The Company’s accounting policies were revised in connection with the implementation of ASC 606. See Note 3, “Revenue Recognition” in Part I, Item 1, of this Quarterly Report on Form 10-Q. There were no other material changes to our critical accounting policies and estimates from the information provided in “Critical Accounting Policies” in Part II, Item 7, of our Annual Report on Form 10-K for the year ended December  31, 2017 filed with the SEC.

Recent Accounting Pronouncements

In February 2016, the FASB issued Accounting Standards Update No. 2016-02, Leases (Topic 842) (ASU 2016-02), which requires lessees to record most leases on their balance sheets, recognizing a lease liability for the obligation to make lease payments and a right-to-use asset for the right to use the underlying asset for the lease term. The guidance in ASU 2016-02 is required for annual reporting periods beginning after December 15, 2018, with early adoption permitted. We currently expect that most of our operating lease commitments will be subject to the update and recognized as operating lease liabilities and right-of-use assets upon adoption. However, the Company is currently evaluating the effect that implementation of this update will have upon adoption on its consolidated financial position and results of operations.


26


Table of Contents

Risk Factors

We operate in a rapidly changing environment that involves certain risks and uncertainties, some of which are beyond our control. You should carefully review and consider the information regarding certain risk factors that could materially affect our business, financial condition or future results set forth under “Part I – Item 1A – Risk Factors” in our Annual Report on Form 10-K, for the year ended December 31, 2017, which was filed with the Securities and Exchange Commission on March 16, 2018 and in this Quarterly Report on Form 10-Q under “Special Note Regarding Forward-Looking Statements.”


27


Table of Contents

SPECIAL NOTE REGARDING FORWARD-LOOKING STATEMENTS

Some of the statements in this Quarterly Report on Form 10-Q and elsewhere constitute forward-looking statements under Section 27A of the Securities Act of 1933, as amended, and Section 21E of the Securities Exchange Act of 1934, as amended. These statements involve known and unknown risks, uncertainties and other factors that may cause results, levels of activity, growth, performance, tax consequences or achievements to be materially different from any future results, levels of activity, growth, performance, tax consequences or achievements expressed or implied by such forward-looking statements. Such factors include, among other things, those listed below, as well as those further set forth under the heading “Risk Factors” in our 2017 Annual Report on Form 10-K as filed with the SEC on March 16, 2018.

Factors that may cause actual results, goals, targets or objectives to differ materially from those contemplated, projected, forecasted, estimated, anticipated, planned or budgeted in such forward-looking statements include, among others, the following possibilities: (1) failure to obtain new customers or retain significant existing customers; (2) the loss of one or more key executives and/or employees; (3) changes in industry trends, such as a decline in the demand for Enterprise Resource Planning and Enterprise Performance Management solutions, custom development and system integration services and/or declines in industry-wide information technology spending, whether on a temporary or permanent basis and/or delays by customers in initiating new projects or existing project milestones; (4) inability to execute upon growth objectives, including new services and growth in entities acquired by our Company; (5) adverse developments and volatility involving geopolitical or technology market conditions; (6) unanticipated events or the occurrence of fluctuations or variability in the matters identified under “Critical Accounting Policies”; (7) delays in, or the failure of, our sales pipeline being converted to billable work and recorded as revenue; (8) termination by clients of their contracts with us or inability or unwillingness of clients to pay for our services, which may impact our accounting assumptions; (9) inability to recruit and retain professionals with the high level of information technology skills and experience needed to provide our services; (10) failure to expand outsourcing services to generate additional revenue; (11) any changes in ownership of the Company or otherwise that would result in a limitation of the net operating loss carry forward under applicable tax laws; (12) the possibility that activist stockholders may wage proxy or consent contests or gain representation on or control of our Board of Directors, causing uncertainty about the direction of our business; (13) the increased emphasis on a cloud strategy that may give rise to risks that could harm our business; (14) the failure of the marketplace to embrace advisory and product-based consulting services; and/or (15) the effects of the merger with a wholly-owned subsidiary of Alithya Group Inc., a Quebec corporation (“Alithya”), on our business and operations, and the potential adverse effects if such merger is not completed.

Although we believe that the expectations in the forward-looking statements are reasonable, we cannot guarantee future results, levels of activity, performance, growth, earnings per share or achievements. However, neither we nor any other person assumes responsibility for the accuracy and completeness of such statements. Except as otherwise required, we undertake no obligation to update any of the forward-looking statements after the date of this Form 10-Q to conform such statements to actual results.

ITEM 3. QUANTITATIVE AND QUALITATIVE DISCLOSURES ABOUT MARKET RISK

Our primary financial instruments include investments in money market funds that are sensitive to market risks and interest rates. The investment portfolio is used to preserve our capital until it is required to fund operations, strategic acquisitions or distributions to stockholders. None of our market-risk sensitive instruments are held for trading purposes. We did not purchase derivative financial instruments in the three-month periods ended September 30, 2018 or 2017. Should interest rates on the Company’s investments fluctuate by 10% the impact would not be material to the financial condition, results of operations or cash flows.

The impact of inflation and changing prices has not been material on revenue or income from continuing operations during the three-month periods ended September 30, 2018 and 2017.

ITEM 4. CONTROLS AND PROCEDURES

Evaluation of Disclosure Controls and Procedures

We maintain disclosure controls and procedures, which we have designed to ensure that material information related to the Company, including our consolidated subsidiaries, is properly identified and evaluated on a regular basis and disclosed in accordance with all applicable laws and regulations. The Interim Chief Executive Officer and Interim Chief Financial Officer of Edgewater Technology, Inc. (its principal executive officer and principal financial officer) have concluded, based on an evaluation of the Company’s disclosure controls and procedures as of the end of the period covered by this report, that the Company’s disclosure controls and procedures are effective to ensure that information required to be disclosed by the Company in the reports filed or submitted by it under the Securities Exchange Act of 1934, as amended, is recorded, processed, summarized and reported within the time periods specified in the Securities and Exchange Commission rules and forms, and include controls and procedures designed to ensure that information required to be disclosed by the Company in such reports is accumulated and communicated to the Company’s management as appropriate to allow timely decisions regarding required disclosure.


28


Table of Contents

Changes in Controls and Procedures

There were no changes in our internal control over financial reporting, as such term is defined in Rules 13a-15(f) and 15d-15(f) under the Exchange Act, during the period covered by this report that have materially affected, or are reasonably likely to materially affect, our internal control over financial reporting.

PART II – OTHER INFORMATION

ITEM 1. LEGAL PROCEEDINGS

The Company is involved in legal proceedings, claims, and litigation arising in the ordinary course of business not specifically discussed herein.

ITEM 1A. RISK FACTORS

As discussed in “Part I – Item 1A – Risk Factors” of our Annual Report on Form 10-K for the year ended December 31, 2017 and herein under “Special Note Regarding Forward-Looking Statements,” investors should be aware of certain risks, uncertainties and assumptions in our business. We encourage you to refer to our Annual Report on Form 10-K to carefully consider these risks, uncertainties and assumptions.

ITEM 2. UNREGISTERED SALES OF EQUITY SECURITIES AND USE OF PROCEEDS

In December 2007, our Board of Directors (the “Board”) authorized a stock repurchase program for up to $5.0 million of common stock on the open market or through privately negotiated transactions from time-to-time through December 31, 2008 (the “Stock Repurchase Program”). The Board subsequently amended the Stock Repurchase Program, authorizing both an increase to and an extension of the Stock Repurchase Program. The Stock Repurchase Program, as amended, had a maximum purchase value of shares of $23.1 million (the “Purchase Authorization”) and expired on September 21, 2018.

The timing and amount of the purchases was based upon market conditions, securities law considerations and other factors. The Stock Repurchase Program did not obligate the Company to acquire a specific number of shares in any period and could have been modified, suspended, extended or discontinued at any time, without prior notice.

The following table provides information with respect to purchases of our common stock during the quarter ended September 30, 2018:

Issuer Purchases of Equity Securities


Period

   Total
Number of
Shares
Purchased
     Average
Price Paid
Per Share
     Total Number of
Shares
Purchased as
Part of Publicly
Announced
Plans or
Programs
     Maximum Dollar
Value of Shares that
May Yet Be
Purchased Under the
Plans or Programs
 

July 1 – 31, 2018

     —        $ —        —        $ 6,500,636  

August 1 – 31, 2018

     —        $ —             $ 6,500,636  

September 1 – 30, 2018

     —        $ —        —        $ —    


Total

     —        $ —        —        $ —    


ITEM 3. DEFAULTS UPON SENIOR SECURITIES

None.

ITEM 4. MINE SAFETY DISCLOSURES

Not applicable.


29


Table of Contents

ITEM 5. OTHER INFORMATION

None.

ITEM 6. EXHIBITS


  31.1    13a-14 Certification –Chief Executive Officer and Chief Financial Officer*
  32    Section 1350 Certification**
101    Interactive Data Files Pursuant to Rule 405 of Regulation S-T: (i) Unaudited Condensed Consolidated Balance Sheets as of September 30, 2018 and December 31, 2017, (ii) Unaudited Condensed Consolidated Statements of Comprehensive Income (Loss) for the Three and Nine Months ended September 30, 2018 and 2017, (iii) Unaudited Condensed Consolidated Statements of Cash Flows for the Nine Months ended September 30, 2018 and 2017 and (iv) Notes to Unaudited Condensed Consolidated Financial Statements.*


*

- Filed herewith.

**

- Furnished herewith.


30


Table of Contents

SIGNATURES

Pursuant to the requirements of the Securities Exchange Act of 1934, as amended, the registrant has duly caused this report to be signed on its behalf by the undersigned thereunto duly authorized.


Date: November 9, 2018   /s/ PAUL MCNEICE
 

Paul McNeice

Interim Chief Executive Officer and Interim Chief Financial Officer

(Principal Executive, Financial and Accounting Officer)


31

EX-31.1

Exhibit 31.1

13a-14 CERTIFICATION

I, Paul McNeice, certify that:


  1.

I have reviewed this Quarterly Report on Form 10-Q of Edgewater Technology, Inc. (the “Company”);


  2.

Based on my knowledge, this report does not contain any untrue statement of a material fact or omit to state a material fact necessary to make the statements made, in light of the circumstances under which such statements were made, not misleading with respect to the period covered by this report;


  3.

Based on my knowledge, the financial statements, and other financial information included in this report, fairly present in all material respects the financial condition, results of operations and cash flows of the Company as of, and for, the periods presented in this report;


  4.

The Company’s other certifying officer(s) and I are responsible for establishing and maintaining disclosure controls and procedures (as defined in Exchange Act Rules 13a-15(e) and 15d-15(e)) and internal control over financial reporting (as defined in Exchange Act Rules 13a-15(f) and 15d-15(f)) for the Company and have:


  (a)

Designed such disclosure controls and procedures, or caused such disclosure controls and procedures to be designed under our supervision, to ensure that material information relating to the Company, including its consolidated subsidiaries, is made known to us by others within those entities, particularly during the period in which this report is being prepared;


  (b)

Designed such internal control over financial reporting, or caused such internal control over financial reporting to be designed under our supervision, to provide reasonable assurance regarding the reliability of financial reporting and the preparation of financial statements for external purposes in accordance with generally accepted accounting principles;


  (c)

Evaluated the effectiveness of the Company’s disclosure controls and procedures and presented in this report our conclusions about the effectiveness of the disclosure controls and procedures, as of the end of the period covered by this report based on such evaluation; and


  (d)

Disclosed in this report any change in the Company’s internal control over financial reporting that occurred during the Company’s most recent fiscal quarter (the Company’s fourth fiscal quarter in the case of an annual report) that has materially affected, or is reasonably likely to materially affect, the Company’s internal control over financial reporting; and


  5.

The Company’s other certifying officer(s) and I have disclosed, based on our most recent evaluation of internal control over financial reporting, to the Company’s auditors and the Audit Committee of the Company’s Board of Directors (or persons performing the equivalent functions):


  (a)

All significant deficiencies and material weaknesses in the design or operation of internal control over financial reporting which are reasonably likely to adversely affect the Company’s ability to record, process, summarize and report financial information; and


  (b)

Any fraud, whether or not material, that involves management or other employees who have a significant role in the Company’s internal control over financial reporting.


Date: November 9, 2018   /s/ PAUL MCNEICE
  Paul McNeice
  Interim Chief Executive Officer and Interim Chief Financial Officer
  (Principal Executive, Financial and Accounting Officer)
EX-32

Exhibit 32

1350 CERTIFICATION

Pursuant to Section 906 of the Sarbanes-Oxley Act of 2002 (18 U.S.C. § 1350, as adopted), Paul McNeice, the Interim Chief Executive Officer and Interim Chief Financial Officer of the Company, hereby certifies that, to the best of his knowledge:

The Company’s Quarterly Report on Form 10-Q for the period ended September 30, 2018, to which this Certification is attached as Exhibit 32 (the “Periodic Report”), fully complies with the requirements of Section 13(a) or Section 15(d) of the Securities Exchange Act of 1934, as amended; and the information contained in the Periodic Report fairly presents, in all material respects, the financial condition and results of operations of the Company.


Date: November 9, 2018   /s/ PAUL MCNEICE
  Paul McNeice
 

Interim Chief Executive Officer and Interim Chief Financial Officer

(Principal Executive, Financial and Accounting Officer)

A signed original of this written statement required by Section 906, or other document authenticating, acknowledging or otherwise adopting the signatures that appear in typed form within the electronic version of this written statement required by Section 906, has been provided to the Company and will be retained by the Company and furnished to the Securities and Exchange Commission or its staff upon request.

v3.10.0.1
Document and Entity Information - shares
9 Months Ended
Sep. 30, 2018
Nov. 05, 2018
Document And Entity Information [Abstract]    
Document Type 10-Q  
Amendment Flag false  
Document Period End Date Sep. 30, 2018  
Document Fiscal Year Focus 2018  
Document Fiscal Period Focus Q3  
Trading Symbol EDGW  
Entity Registrant Name EDGEWATER TECHNOLOGY INC/DE/  
Entity Central Index Key 0001017968  
Current Fiscal Year End Date --12-31  
Entity Filer Category Accelerated Filer  
Entity Small Business false  
Entity Emerging Growth Company false  
Entity Common Stock, Shares Outstanding   14,676,663
v3.10.0.1
Unaudited Condensed Consolidated Balance Sheets - USD ($)
Sep. 30, 2018
Dec. 31, 2017
Current assets:    
Cash and cash equivalents $ 4,444,000 $ 15,398,000
Restricted cash 5,000,000 0
Accounts receivable, net of allowance of $150 26,266,000 22,218,000
Prepaid expenses and other current assets 2,312,000 2,075,000
Total current assets 38,022,000 39,691,000
Property and equipment, net 386,000 409,000
Intangible assets, net 3,895,000 5,575,000
Goodwill 29,983,000 29,983,000
Other assets 886,000 216,000
Total assets 73,172,000 75,874,000
Current liabilities:    
Accounts payable 1,585,000 767,000
Accrued liabilities 14,444,000 14,984,000
Deferred revenue 2,751,000 2,140,000
Revolving credit facility 5,000,000 5,000,000
Total liabilities 23,780,000 22,891,000
Stockholders' equity:    
Preferred stock, $.01 par value; 2,000 shares authorized, no shares issued or outstanding
Common stock, $.01 par value; 48,000 shares authorized, 29,736 shares issued as of September 30, 2018 and December 31, 2017, 14,641 and 14,046 shares outstanding as of September 30, 2018 and December 31, 2017, respectively 297,000 297,000
Paid-in capital 199,936,000 202,749,000
Treasury stock, at cost, 15,096 and 15,690 shares at September 30, 2018 and December 31, 2017, respectively (93,671,000) (98,684,000)
Accumulated other comprehensive loss (647,000) (582,000)
Retained deficit (56,523,000) (50,797,000)
Total stockholders' equity 49,392,000 52,983,000
Total liabilities and stockholders' equity $ 73,172,000 $ 75,874,000
v3.10.0.1
Unaudited Condensed Consolidated Balance Sheets (Parenthetical) - USD ($)
$ in Thousands
Sep. 30, 2018
Dec. 31, 2017
Statement of Financial Position [Abstract]    
Accounts receivable, allowance $ 150 $ 150
Preferred stock, par value $ 0.01 $ 0.01
Preferred stock, shares authorized 2,000,000 2,000,000
Preferred stock, shares issued 0 0
Preferred stock, shares outstanding 0 0
Common stock, par value $ 0.01 $ 0.01
Common stock, shares authorized 48,000,000 48,000,000
Common stock, shares issued 29,736,000 29,736,000
Common stock, shares outstanding 14,641,000 14,046,000
Treasury stock, shares 15,096,000 15,690,000
v3.10.0.1
Unaudited Condensed Consolidated Statements of Comprehensive Loss - USD ($)
shares in Thousands, $ in Thousands
3 Months Ended 9 Months Ended
Sep. 30, 2018
Sep. 30, 2017
Sep. 30, 2018
Sep. 30, 2017
Revenue:        
Revenue $ 25,335 $ 27,361 $ 76,798 $ 86,796
Cost of revenue:        
Cost of revenue 15,137 17,040 48,626 54,978
Gross profit 10,198 10,321 28,172 31,818
Operating expenses:        
Selling, general and administrative 8,045 10,312 27,187 29,231
Executive officer severance   816   4,187
Merger related transaction costs 2,744   4,348  
Consent solicitation expense       666
Contract termination expense       1,125
Change in fair value of contingent earnout consideration   (856)   (252)
Depreciation and amortization 627 782 1,895 2,376
Total operating expenses 11,416 11,054 33,430 37,333
Operating income (loss) (1,218) (733) (5,258) (5,515)
Other expense, net 68 (33) 241 200
(Loss) income before income taxes (1,286) (700) (5,499) (5,715)
Tax provision (benefit) 20 (528) 227 (1,996)
Net loss (1,306) (172) (5,726) (3,719)
Comprehensive loss:        
Currency translation adjustments (2) 23 (65) 30
Total comprehensive loss $ (1,308) $ (149) $ (5,791) $ (3,689)
Net loss per share:        
Basic net loss per share of common stock $ (0.09) $ (0.01) $ (0.40) $ (0.28)
Diluted net loss per share of common stock $ (0.09) $ (0.01) $ (0.40) $ (0.28)
Shares used in computing basic net loss per share of common stock 14,620 13,924 14,423 13,497
Shares used in computing diluted net loss per share of common stock 14,620 13,924 14,423 13,497
Service [Member]        
Revenue:        
Revenue $ 22,955 $ 23,562 $ 68,335 $ 73,132
Cost of revenue:        
Cost of revenue 13,801 14,185 44,493 45,574
Software [Member]        
Revenue:        
Revenue 1,044 2,385 4,330 9,339
Cost of revenue:        
Cost of revenue   1,441   5,079
Reimbursable Expenses [Member]        
Revenue:        
Revenue 1,336 1,414 4,133 4,325
Cost of revenue:        
Cost of revenue $ 1,336 $ 1,414 $ 4,133 $ 4,325
v3.10.0.1
Unaudited Condensed Consolidated Statements of Cash Flows - USD ($)
$ in Thousands
3 Months Ended 9 Months Ended
Sep. 30, 2018
Sep. 30, 2017
Sep. 30, 2018
Sep. 30, 2017
CASH FLOWS FROM OPERATING ACTIVITIES:        
Net loss     $ (5,726) $ (3,719)
Adjustments to reconcile net loss to net cash used in operating activities, excluding the impact of acquisitions:        
Depreciation and amortization $ 627 $ 784 1,893 2,384
Share-based compensation expense 57 219 346 889
Deferred income taxes       (2,758)
Change in fair value of contingent earnout consideration   (856)   (252)
Accretion of contingent earnout consideration       295
Changes in operating accounts, net of acquisition:        
Accounts receivable     (4,067) 5
Prepaid expenses and other current assets     (912) 45
Accounts payable     818 (181)
Accrued liabilities and other liabilities     (285) (2,744)
Deferred revenue     611 246
Net cash used in operating activities     (7,322) (5,790)
CASH FLOWS FROM INVESTING ACTIVITIES:        
Purchases of property and equipment     (190) (116)
Net cash used in investing activities     (190) (116)
CASH FLOW FROM FINANCING ACTIVITIES:        
Proceeds from employee stock plans and stock option exercises 205 313 2,552 4,100
Purchase of treasury stock     (948)  
Payment of contingent earnout consideration       (5,189)
Net cash provided by (used in) financing activities     1,604 (1,089)
Effects of exchange rates on cash     (46) 98
Net decrease in cash, cash equivalents and restricted cash     (5,954) (6,897)
CASH, CASH EQUIVALENTS AND RESTRICTED CASH, beginning of period     15,398 19,693
CASH, CASH EQUIVALENTS AND RESTRICTED CASH, end of period $ 9,444 $ 12,796 9,444 12,796
SUPPLEMENTAL DISCLOSURES OF CASH FLOW INFORMATION:        
Cash paid for income taxes     $ 110 409
Issuance of restricted stock awards       $ 108
v3.10.0.1
Organization
9 Months Ended
Sep. 30, 2018
Organization, Consolidation and Presentation of Financial Statements [Abstract]  
Organization
1.

ORGANIZATION:

Edgewater Technology, Inc. helps the C-suite drive transformational change through its unique selection of business and technology services and channel-based solutions.

Classic consulting disciplines (such as business advisory, process improvement, organizational change management, M&A due diligence, and domain expertise) are blended with technical services (such as digital transformation, technical roadmaps, data and analytics services, custom development and system integration) to help organizations leverage investments in legacy IT assets to create new digital business models.

The Company delivers product based consulting in both the Enterprise Performance Management (“EPM”) and Enterprise Resource Planning (“ERP”) areas both on premise and in the cloud. Within the EPM offering, our Oracle channel, Edgewater Ranzal, provides Business Analytics solutions leveraging Oracle EPM, Business Intelligence (“BI”) and Big Data technologies. Within the ERP offering, our Microsoft channel, Edgewater Fullscope, delivers Dynamics AX ERP, Business Intelligence and CRM solutions primarily in the manufacturing space.

On November 1, 2018 (the “Effective Date”), 9374-8572 Delaware Inc., a Delaware corporation (“Merger Sub”) and a wholly owned subsidiary of Alithya Group inc., a newly-formed Québec corporation (“New Alithya”), merged with and into Edgewater Technology, Inc., a Delaware corporation (“Edgewater”), with Edgewater surviving as a wholly-owned subsidiary of New Alithya (the “Merger”). The Merger was effected pursuant to the Arrangement Agreement, dated as of March 15, 2018, as amended by Amendment No. 1 thereto dated as of September 10, 2018 and Amendment No. 2 thereto dated as of October 17, 2018 (as so amended, the “Arrangement Agreement”), among Alithya Group Inc., a Québec corporation (“Alithya”), New Alithya, Merger Sub and Edgewater. On the Effective Date, each of Alithya and Edgewater became a wholly-owned subsidiary of New Alithya in accordance with the Arrangement Agreement and an arrangement approved by Superior Court of Québec (the “Arrangement”) and Edgewater was renamed “Alithya USA, Inc.”

Pursuant to the terms of the Arrangement Agreement, upon the completion of the Merger, each issued and outstanding share of common stock, U.S.$0.01 par value per share, of Edgewater (“Edgewater Common Stock”) was converted into the right to receive 1.1918 fully-paid and nonassessable shares of New Alithya Class A subordinate voting stock, no par value (“New Alithya Subordinate Voting Shares”), rounded up to the nearest whole New Alithya Subordinate Voting Share. In addition, on October 19, 2018, the Edgewater Board of Directors declared a special cash dividend in the amount of U.S.$1.15 per share of Edgewater Common Stock payable on or around November 9, 2018 to Edgewater’s stockholders of record at the close of business on October 31, 2018. Due to the contingent nature of the Edgewater special cash dividend, Edgewater Common Stock traded with “due bills” representing an assignment of the right to receive the special cash dividend during the period from October 30, 2018 until the close of trading on November 1, 2018. Edgewater stockholders who sold their shares through NASDAQ on or after October 30, 2018 until the closing of trading on November 1, 2018 also sold their entitlement to the special cash dividend to the respective purchasers of shares.

On the Effective Date, each common share, no par value (“Alithya Common Shares”), of Alithya and each multiple voting common share, no par value (“Alithya Multiple Voting Shares” and, together with Alithya Common Shares, “Alithya Shares”), of Alithya then issued and outstanding were cancelled and automatically converted into the right to receive one newly issued New Alithya Subordinate Voting Share and one newly issued Class B multiple voting share, no par value (“New Alithya Multiple Voting Shares” and, together with New Alithya Subordinate Voting Shares, “New Alithya Shares”), of New Alithya, respectively. On the Effective Date, the former stockholders of Edgewater and the former shareholders of Alithya were issued approximately 40% and 60% of the total number New Alithya Shares on a fully-diluted basis, respectively (excluding the New Alithya Subordinate Voting Shares issued to investors in Alithya’s private placement that closed on October 30, 2018). However, because New Alithya Multiple Voting Shares were issued only to those former Alithya shareholders which previously held Alithya Multiple Voting Shares, the former stockholders of Edgewater and the former shareholders of Alithya received on the Effective Date approximately 16% and 84% of the total voting power of the total New Alithya Shares then issued, respectively (excluding the New Alithya Subordinate Voting Shares issued to investors in Alithya’s private placement that closed on October 30, 2018).

The issuance of New Alithya Subordinate Voting Shares in connection with the Arrangement was registered under the Securities Act of 1933, as amended, pursuant to New Alithya’s registration statement on Form F-4 (File No. 333-227310) filed with the Securities and Exchange Commission (the “SEC”) and declared effective on September 27, 2018. The prospectus/proxy statement dated September 28, 2018 (the “Prospectus/Proxy Statement”) and the supplement thereto dated October 23, 2018 (the “Supplement”), as filed under the Registration Statement, contains additional information about the Merger and the Arrangement.

The New Alithya Subordinate Voting Shares have been approved for listing, on the Nasdaq Capital Market and on the Toronto Stock Exchange under the symbol “ALYA”. The trading of the New Alithya Subordinate Voting Shares commenced on the Nasdaq Capital Market and the Toronto Stock Exchange on November 2, 2018.

In connection with the completion of the Arrangement, New Alithya received binding agreements from certain former Edgewater stockholders and Alithya shareholders not to sell their New Alithya Subordinate Voting Shares or New Alithya Multiple Voting Shares for a minimum period of 12 months following the Effective Date, without receiving New Alithya’s prior written consent. Those former Edgewater stockholders and Alithya shareholders included Ancora Advisors, LLC (which prior to the Effective Date owned approximately 10.2% of the total outstanding Edgewater Common Stock), the directors and officers of Alithya and Edgewater remaining with the post-closing operations of New Alithya, Alithya shareholders receiving more than 5% of all of the issued and outstanding New Alithya Shares taken as a whole, at closing, and certain other employees or other persons mutually agreed upon between Alithya and Edgewater.

In this Quarterly Report on Form 10-Q (the “Form 10-Q”), we use the terms “Edgewater,” “Edgewater Technology,” “we,” “our Company,” “the Company,” “our” and “us” to refer to Edgewater Technology, Inc. and its wholly-owned subsidiaries, which are described in our 2017 Annual Report on Form 10-K, as filed with the Securities and Exchange Commission (the “SEC”) on March 16, 2018 (the “2017 Form 10-K”).

v3.10.0.1
Basis of Presentation
9 Months Ended
Sep. 30, 2018
Organization, Consolidation and Presentation of Financial Statements [Abstract]  
Basis of Presentation
2.

BASIS OF PRESENTATION:

The accompanying unaudited condensed consolidated financial statements have been prepared by Edgewater pursuant to the rules and regulations of the SEC regarding interim financial reporting. Certain information and note disclosures normally included in annual financial statements prepared in accordance with accounting principles generally accepted in the United States of America have been omitted pursuant to those rules and regulations, although we believe that the disclosures made are adequate to ensure the information presented is not misleading.

The accompanying unaudited condensed consolidated financial statements reflect all adjustments (which were of a normal, recurring nature) that, in the opinion of management, are necessary to present fairly our financial position, results of operations and cash flows as of and for the interim periods presented. All intercompany transactions have been eliminated in the accompanying unaudited condensed consolidated financial statements. These financial statements should be read in conjunction with the audited financial statements and notes thereto included in our 2017 Form 10-K.

The results of operations for the three- and nine-months ended September 30, 2018 are not necessarily indicative of the results to be expected for any future period or the full fiscal year. Our revenue and earnings may fluctuate from quarter-to-quarter based on factors within and outside our control, including variability in demand for information technology professional services, the length of the sales cycle associated with our service offerings, the number, size and scope of our projects and the efficiency with which we utilize our employees.

Other comprehensive loss consists of net loss plus or minus any currency translation adjustments.

v3.10.0.1
Revenue Recognition
9 Months Ended
Sep. 30, 2018
Text Block [Abstract]  
Revenue Recognition
3.

REVENUE RECOGNITION:

As of January 1, 2018, the Company adopted Accounting Standards Update (“ASU”) 2014-09, Revenue from Contracts with Customers (“ASC 606”), which impacts the timing of when certain types of revenue will be recognized. Revenues are recognized when we satisfy a performance obligation by transferring goods or services promised in a contract to a customer, in an amount that reflects the consideration that we expect to receive in exchange for those goods and services. Performance obligations in our contracts represent distinct or separate service or product streams that we provide to our customers. The Company has adopted the standard using the modified retrospective approach. The standard was applied to all open contracts as of the date of adoption. The Company did not recognize any cumulative catch-up adjustment in connection with the adoption of this standard.

We evaluate our revenue contracts with customers based on the five-step model under ASC 606: (1) Identify the contract with the customer; (2) Identify the performance obligations in the contract; (3) Determine the transaction price; (4) Allocate the transaction price to separate performance obligations; and (5) Recognize revenue when (or as) each performance obligation is satisfied.

The Company’s contracts with customers contain performance obligations related to the performance of professional services (in the form of time and materials, fixed fee or retainer based contracts), the delivery of software and/or the performance of maintenance services. The Company separately evaluates all performance obligations and allocates revenue based upon stand-alone selling price of the individual performance obligations.


We generate the majority of our revenues by providing consulting services to our clients. Our consulting service contracts are based on one of the following types of arrangements:


Time and expense arrangements require the client to pay us based on the number of hours worked at contractually agreed-upon rates. We recognize revenue for these arrangements over time based on hours incurred and contracted rates. Revenue recognition over time is based on the enforceable right to payment.


Fixed fee arrangements require the client to pay a pre-established fee in exchange for a predetermined set of professional services. We recognize revenue for these arrangements over time based on the proportional performance (using a hours-based input method) related to individual performance obligations within each arrangement. Revenue recognition over time is based on the enforceable right to payment.


Retainer based arrangements require the client to pay a recurring fee in exchange for a monthly recurring service (typically support). We recognize revenue for these arrangements over time (using a hours-based input method). Revenue recognition over time is based on customer simultaneously receiving and consuming the benefit of the services provided.

We generate software revenue from the resale of certain third-party off-the-shelf software and maintenance. The majority of the software sold by the Company is delivered electronically. For software that is delivered electronically, we consider transfer of control to have occurred when the customer either (a) takes possession of the software via a download (that is, when the customer takes possession of the electronic data on its hardware), or (b) has been provided with access codes that allow the customer to take immediate possession of the software on its hardware pursuant to an agreement or purchase order for the software. In all instances, the resale of third-party software and maintenance is recorded on a net basis. Company created software, and the associated maintenance, is reported on a gross basis, however it is immaterial in all periods presented.

Third party software and maintenance revenue are recognized upon delivery of the software, as all related warranty and maintenance is performed by the primary software vendor and not the Company.

The Company enters into arrangements with multiple performance obligations which typically include software, post-contract support (or maintenance), and consulting services. Contracts that contain multiple performance obligations require an allocation of the transaction price to each performance obligation based on a relative standalone selling price basis. The Company has determined standalone selling price for each of the performance obligations in connection with our evaluation of arrangements with multiple performance obligations. The Company has established standalone selling price for consulting services based on a stated and consistent rate per hour range in standalone transactions. The Company has established standalone selling price for software through consistent stated rates for software components. The Company has established standalone selling price for maintenance based on observable prices for standalone renewals.

Unfulfilled performance obligations represent the remaining contract transaction prices allocated to the performance obligations that are unsatisfied, or partially unsatisfied, and therefore revenues have not yet been recorded. Unfulfilled performance obligations primarily consist of the remaining fees not yet recognized under our proportional performance method for our fixed fee arrangements. The aggregate amount of the transaction price allocated to the performance obligations that are unsatisfied (or partially unsatisfied) as of September 30, 2018 was $2.8 million and is expected to be recognized within the next twelve months. For time and expense arrangements, the Company has elected the practical expedient not to disclose transaction price allocated to unsatisfied (or partially unsatisfied) performance obligations for which we recognize revenue in accordance with paragraph 606-10-55-18. Revenue from these performance obligations is expected to be recognized within the next twelve months.

Contract liabilities are defined as liabilities incurred when we have received consideration from a client but have not yet performed the agreed upon services. This may occur when we receive advance billings before the performance of a support contract, billings in advance of service performed in connection with a fixed price arrangement, or occasional pre-billing of services to be performed under a time and materials contract. The contract liability balance was $2.8 million and $2.1 million as of September 30, 2018 and December 31, 2017, respectively.

The Company’s standard payment terms are 30 days from invoice date. Customer prepayments, even if nonrefundable, are deferred (classified as deferred revenue) and recognized over future periods as services are performed.

The Company routinely assesses the exposure associated with the potential for returns and refunds. Historic results support the conclusion that returns and refunds are insignificant, however should such concessions be deemed necessary the reserve would be established in the period in which the item was identified.


The following tables further depict the disaggregation of revenue for the three- and nine-month periods ended September 30, 2018. The information included in the disaggregation of revenue tables below have been presented in accordance with the standards set forth in ASC 606 for the three- and nine-month periods ended September 30, 2018.


Three-Months Ended September 30, 2018

 
     Service (1)      Software      Total  

Revenue by Reporting Unit:


ERP

   $ 11,933      $ 1,059      $ 12,992  

EPM

     12,001        (8      11,993  

Classic Consulting

     357        (7      350  


Consolidated revenue

   $ 24,291      $ 1,044      $ 25,335  


Revenue by Contract Type:


Time and materials

     20,280        —          20,280  

Fixed price

     1,675        —          1,675  

Retainer

     1,000        —          1,000  

Software

     —        1,044      1,044

Expense

     1,336        —          1,336  


Consolidated revenue

   $ 24,291      $ 1,044      $ 25,335  


Revenue Recognition


Point in time

     —        1,044      1,044

Over time

     24,291        —          24,291  


Consolidated revenue

   $ 24,291      $ 1,044      $ 25,335  


Nine-Months Ended September 30, 2018

 
     Service (1)      Software      Total  

Revenue by Reporting Unit:


ERP

   $ 35,077      $ 4,420      $ 39,497  

EPM

     35,086        (16      35,070  

Classic Consulting

     2,305        (74      2,231  


Consolidated revenue

   $ 72,468      $ 4,330      $ 76,798  


Revenue by Contract Type:


Time and materials

     59,389        —          59,389  

Fixed price

     5,465        —          5,465  

Retainer

     3,481        —          3,481  

Software

     —        4,330      4,330

Expense

     4,133        —          4,133  


Consolidated revenue

   $ 72,468      $ 4,330      $ 76,798  


Revenue Recognition


Point in time

     —        4,330      4,330

Over time

     72,468        —          72,468  


Consolidated revenue

   $ 72,468      $ 4,330      $ 76,798  


(1)

Service revenue includes both service and the corresponding reimbursable expense revenue.

Adoption of the new revenue recognition standard did not have a meaningful impact on the Company’s consolidated balance sheet. The Company has not made any significant changes to the outstanding contracts. The Company has not changed the method of recording or presenting accounts receivable or deferred revenue. The Company did not incur or capitalize any amounts in connection with the cost to obtain customer contracts nor did the Company record any contract assets in connection with our contracts with customers. During the three- and nine-month periods ended September 30, 2018, the Company recognized $925 thousand and $2.3 million of service revenue that was recorded and presented as deferred revenue in prior periods.

The Company, under the standards set forth in ASC 606 has presented software revenue on a net basis for the three- and nine-month period ended September 30, 2018. This represents a change from the presentation basis on the previous revenue recognition guidance. There have been no meaningful changes to the structure of the software contracts during the current quarter, however the assessment of gross versus net now relies heavily on the concept of control and therefore the Company has concluded that net presentation is appropriate.


The table below presents software revenue in accordance with ASC 605 for the three- and nine-month periods ended September 30, 2018. No other financials statement line items were affected by the adoption of ASC 606.


Comparable Software Revenue:

   Three-
month period
ended
September 30,
2018
 

Software Revenue

   $ 2,346  

Software Expense

     1,302  


Software Gross Margin

   $ 1,044  


Comparable Software Revenue:

   Nine-
month period
ended
September 30,
2018
 

Software Revenue

   $ 9,310  

Software Expense

     4,980  


Software Gross Margin

   $ 4,330  


The Company has elected to make the following accounting policy elections through the adoption of the following practical expedients:

Right to Invoice – Where applicable, the Company will recognize revenue from a contract with a customer in an amount that corresponds directly with the value to the customer of the Company’s performance completed to date and the amount to which the entity has a right to invoice.

Significant Financing Component – The Company will not adjust the promised amount of consideration for the effects of a significant financing component if the Company expects, at contract inception, that the period between when the entity transfers a promised good or service to a customer and when the customer pays for that good or service will be one year or less.

There are also certain considerations related to internal control over financial reporting that are associated with implementing Topic 606. The Company has evaluated its internal control framework over revenue recognition and designed and implemented the appropriate internal controls to enable the preparation of financial information and obtain and disclose the information required under Topic 606. This evaluation did not result in any material changes to the Company’s existing internal control framework over revenue recognition.


v3.10.0.1
Share-based compensation
9 Months Ended
Sep. 30, 2018
Disclosure of Compensation Related Costs, Share-based Payments [Abstract]  
Share-based compensation
4.

SHARE-BASED COMPENSATION:

Share-based compensation expense under all of the Company’s share-based plans was $57 thousand and $346 thousand for the three- and nine-month periods ended September 30, 2018, respectively. Share-based compensation expense under all of the Company’s share-based plans was $219 thousand and $889 thousand for the three- and nine-month periods ended September 30, 2017, respectively.

Cash received from the employee stock purchase plan (“ESPP”) and through stock option exercises was $205 thousand and $2.6 million during the three- and nine-month periods ended September 30, 2018, respectively. Cash received from ESPP and stock option exercises was $313 thousand and $4.1 million during the three- and nine-month periods ended September 30, 2017, respectively.

As of September 30, 2018, unrecognized compensation expense, net of estimated forfeitures, related to the unvested portion of all share-based compensation arrangements was approximately $127 thousand and is expected to be recognized over a weighted-average period of 1.3 years.

The Company intends to use previously purchased treasury shares for shares issued for options, restricted share awards and ESPP purchases. Shares may also be issued from authorized but unissued share reserves.

v3.10.0.1
Income Taxes
9 Months Ended
Sep. 30, 2018
Income Tax Disclosure [Abstract]  
Income Taxes
5.

INCOME TAXES:

The Company recorded a tax provision of $20 thousand and a tax benefit of $(528) thousand for the three-month periods ended September 30, 2018 and 2017, respectively. The Company recorded tax provisions of $227 thousand and $(2.0) million for the nine-month periods ended September 30, 2018 and 2017, respectively. The reported tax (benefit) provision for the three-month periods ended September 30, 2018 and 2017, are based upon estimated quarterly effective tax rates of (1.5)% and (75.4)%, respectively. The effective tax rate, in the three-month period ended September 30, 2018, reflected our foreign income tax provisions. The effective tax rate, in the three-month period ended September 30, 2017, reflected our combined Federal and state income tax rates, foreign income tax provisions and the recognition of U.S. deferred tax liabilities for differences between the book and tax basis of goodwill. The reported tax provisions for the nine-month periods ended September 30, 2018 and 2017, are based upon estimated quarterly effective tax rates of (4.1)% and (34.9)%, respectively. The effective tax rate, in the nine-month period ended September 30, 2018, reflected our foreign income tax provisions. The effective tax rate, in the three-month period ended September 30, 2017, reflected our combined Federal and state income tax rates, foreign income tax provisions and the recognition of U.S. deferred tax liabilities for differences between the book and tax basis of goodwill.

We assess the realizability of our deferred tax assets and assess the need for a valuation allowance on an ongoing basis. The periodic assessment of the net carrying value of our deferred tax assets under the applicable accounting rules is highly judgmental. We are required to consider all available positive and negative evidence in evaluating the likelihood that we will be able to realize the benefit of our deferred tax assets in the future. Such evidence includes scheduled reversals of deferred tax liabilities, projected future taxable income, tax planning strategies and the results of recent operations. Since this evaluation requires consideration of events that may occur some years into the future, there is significant judgment involved, and our conclusion could be materially different should certain of our expectations not transpire.

When assessing all available evidence, we consider the extent to which we have generated pre-tax income or losses over the most recent three-year period to be an important piece of objective evidence. As of September 30, 2018, and December 31, 2017, the recorded deferred tax asset valuation allowance balance was $23.0 million and $21.7 million, respectively.

Our policy is to classify interest and penalties related to unrecognized tax benefits as income tax expense. This policy has been consistently applied in all periods. No such amounts were recognized in the three- or nine-month periods ended September 30, 2018 or 2017. We have reviewed the tax positions taken, or to be taken, in our tax returns for all tax years currently open to examination by a taxing authority. We have identified no uncertain tax positions for which it is reasonably possible that the total amount of unrecognized tax benefits will significantly increase or decrease within the twelve months ending September 30, 2019. We remain subject to examination until the statute of limitations expires for each respective tax jurisdiction.

The Company adopted the Accounting Standards Update related to stock-based compensation during the nine-month period ended September 30, 2017. This adoption had an impact on the tax treatment for stock option exercises during the nine-months ended September 30, 2017 (as well as a cumulative adjustment for prior period activity). In connection with the adoption of this standard, all excess tax benefits and tax deficiencies will be recognized in the statement of comprehensive income in the period in which they occur. The Company recognized $306 thousand and $786 thousand of tax expense related to stock option exercises in the nine-month periods ended September 30, 2018 and 2017, respectively, however, because the Company is in a full valuation allowance position, no benefit was taken in the consolidated financial statements. During the nine-month period ended September 30, 2017, the Company recorded a $1.4 million cumulative adjustment to retained earnings to present the impact of prior period activity in accordance with the adopted standard.

On December 22, 2017, the Tax Cuts and Jobs Act (“TCJA”) was signed into law. The TCJA changed many aspects of U.S. corporate income taxation and included reduction of the corporate income tax rate from 35% to 21% , implementation of a territorial tax system and imposition of a tax on deemed repatriated earnings of foreign subsidiaries. The TCJA was effective as of December 31, 2017 and at that time we made a reasonable estimate of the effects on our existing deferred tax balances and the one-time transition tax. As of September 30, 2018, we have not completed our accounting for the tax effects of the TCJA nor have we recorded any adjustments during the quarter ended September 30, 2018. We will continue to assess our provision for income taxes as future guidance is issued, but do not currently anticipate significant revisions will be necessary. Any such revisions will be treated in accordance with the one year measurement period guidance outlined in Staff Accounting Bulletin No. 118. The ultimate impact may differ from these provisional amounts, possibly materially, due to, among other things, additional analysis, changes in interpretations and assumptions we have made, additional regulatory guidance that may be issued, and actions we may take as a result of the TCJA. Subsequent to September 30, 2018, the Company completed the accounting for the tax effects of the TCJA and no changes to prior amounts were recorded.

v3.10.0.1
Goodwill and Intangible Assets
9 Months Ended
Sep. 30, 2018
Goodwill and Intangible Assets Disclosure [Abstract]  
Goodwill and Intangible Assets
6.

GOODWILL AND INTANGIBLE ASSETS:

There have been no changes to the Company’s goodwill balance during 2018. Our annual goodwill and intangible assets measurement date is December 2. The Company continuously evaluates for any triggering events and no such events have occurred during the three- or nine-month periods ended September 30, 2018.

We amortize our intangible assets that have finite lives using either the straight-line method or based on estimated future cash flows to approximate the pattern in which the economic benefit of the asset will be utilized. Amortization expense was $561 thousand and $1.7 million during the three- and nine-month periods ended September 30, 2018, respectively. Amortization expense was $699 thousand and $2.1 million during the three- and nine-month periods ended September 30, 2017, respectively. This amortization expense relates to certain non-competition covenants and customer lists, which expire at various times through 2021.

Estimated annual amortization expense of our intangible assets (including amortization expense associated with capitalized software costs) for the current year and the following five years ending December 31, is as follows:


     Amortization
Expense
 
     (In Thousands)  

2018

   $ 2,240  

2019

   $ 1,713  

2020

   $ 1,057  

2021 and beyond

   $ 565  
v3.10.0.1
Accrued Expenses and Other Liabilities
9 Months Ended
Sep. 30, 2018
Payables and Accruals [Abstract]  
Accrued Expenses and Other Liabilities
7.

ACCRUED EXPENSES AND OTHER LIABILITIES:

Accrued liabilities as of September 30, 2018 and December 31, 2017 consisted of the following:


     September 30,
2018
     December 31,
2017
 
     (In Thousands)  

Accrued bonuses

   $ 3,006      $ 5,590  

Accrued payroll related liabilities

     1,531        3,277  

Accrued vacation

     2,818        2,497  

Accrued commissions

     1,047        825  

Accrued software expense

     545        675  

Accrued contractor fees

     581        346  

Accrued professional service fees

     3,227        341  

Deferred rent

     50        64  

Income tax related accruals

     331        189  

Other accrued expenses

     1,308        1,180  


Total

   $ 14,444      $ 14,984  


v3.10.0.1
Net Loss Per Share
9 Months Ended
Sep. 30, 2018
Earnings Per Share [Abstract]  
Net Loss Per Share
8.

NET LOSS PER SHARE:

A reconciliation of net income and weighted average shares used in computing basic and diluted net loss per share is as follows:


     Three Months Ended
September 30,
     Nine Months Ended
September 30,
 
     2018      2017      2018      2017  
     (In Thousands, Except Per Share Data)  

Basic net loss per share:


Net loss applicable to common shares

   $ (1,306    $ (172    $ (5,726    $ (3,719


Weighted average common shares outstanding

     14,620        13,924        14,423        13,497  


Basic net loss per share of common stock

   $ (0.09    $ (0.01    $ (0.40    $ (0.28


     Three Months Ended
September 30,
     Nine Months Ended
September 30,
 
     2018      2017      2018      2017  
     (In Thousands, Except Per Share Data)  

Diluted net loss per share:


Net loss applicable to common shares

   $ (1,306    $ (172    $ (5,726    $ (3,719


Weighted average common shares outstanding

     14,620        13,924        14,423        13,497  

Dilutive effects of stock options

     —          —          —          —    


Weighted average common shares, assuming dilutive effect of stock options

     14,620        13,924        14,423        13,497  


Diluted net loss per share of common stock

   $ (0.09    $ (0.01    $ (0.40    $ (0.28


Share-based awards, inclusive of all grants made under the Company’s equity plans, for which either the stock option exercise price or the fair value of the restricted share award exceeds the average market price over the period, have an anti-dilutive effect on earnings per share, and accordingly, are excluded from the diluted computations for all periods presented. Had such shares been included, shares for the diluted computation would have increased by approximately 465 thousand shares and 465 thousand shares in the three- and nine-month periods ended September 30, 2018, respectively. Had such shares been included, shares for the diluted computation would have increased by approximately 542 thousand shares and 148 thousand shares in the three- and nine-month periods ended September 30, 2017, respectively. As of September 30, 2018 and 2017, there were approximately 766 thousand and 1.8 million share-based awards outstanding, respectively, under the Company’s equity plans. Options to purchase 79 thousand and 534 thousand shares of common stock that were outstanding during the three months ended September 30, 2018 and September 30, 2017, respectively, were not included in the computation of diluted net loss per share due to the reported periodic loss. Options to purchase 118 thousand and 760 thousand shares of common stock that were outstanding during the nine months ended September 30, 2018 and September 30, 2017, respectively, were not included in the computation of diluted net loss per share due to the reported periodic loss.

v3.10.0.1
Stock Repurchase Program
9 Months Ended
Sep. 30, 2018
Equity [Abstract]  
Stock Repurchase Program
9.

STOCK REPURCHASE PROGRAM:

In December 2007, our Board of Directors (the “Board”) authorized a stock repurchase program for up to $5.0 million of common stock on the open market or through privately negotiated transactions from time-to-time through December 31, 2008 (the “Stock Repurchase Program”). The Board subsequently amended the Stock Repurchase Program, authorizing both an increase to and an extension of the Stock Repurchase Program. The Stock Repurchase Program, as amended, had a maximum purchase value of shares of $23.1 million (the “Purchase Authorization”) and expired on September 21, 2018.

The timing and amount of the purchases was dependent upon market conditions, securities law considerations and other factors. The Stock Repurchase Program did not obligate the Company to acquire a specific number of shares in any period and could have been modified, suspended, extended or discontinued at any time, without prior notice.

The Company repurchased 151 thousand shares at an aggregate price of $948 thousand during the nine-month period ended September 30, 2018. The Company did not repurchase any shares of common stock during the three-month period ended September 30, 2018 or the three- and nine-month periods ended September 30, 2017.

v3.10.0.1
Revolving Line of Credit
9 Months Ended
Sep. 30, 2018
Debt Disclosure [Abstract]  
Revolving Line of Credit
10.

REVOLVING LINE OF CREDIT:

In September 2013, the Company entered into a secured revolving credit facility (the “Credit Facility”). The Credit Facility was modified through an amendment in December 2015, which increased the borrowing base to $15 million (from the previous $10 million) with an additional accordion feature that allows the Company to request an additional $5.0 million as needed, extending the total credit facility borrowing capacity to $20 million over its three-year term. The Credit Facility is collateralized by substantially all assets of the Company and its domestic subsidiaries, and is subject to normal financial covenants.

In October 2018, the Company entered into an amendment, which amended certain terms of the Credit Facility. The amendment waived the restrictions on change of control of Edgewater in the Loan Agreement to the extent required to permit the acquisition of all of the outstanding stock of Edgewater by New Alithya.

The amendment modified certain provisions of the Credit Facility, including, among other things, (i) the right of Edgewater obtain up to $7.0 million of additional Revolving Advances provided that all such additional Revolving Advances shall be deposited into the blocked deposit account maintained by Edgewater at Citizens, (ii) Edgewater’s agreement that all funds held in such blocked account (including the $5.0 million of funds now held in such blocked account) will constitute cash collateral for all obligations of Edgewater to Citizens under the Loan Agreement, and (iii) Edgewater’s right to withdraw the funds in the blocked account will be contingent on the repayment in full of all obligations then outstanding under the Loan Agreement.


The Company had drawn down $5.0 million of this balance as of September 30, 2018. Subsequent to September 30, 2018, the Company drew down the additional $7.0 million allowed under the Credit Facility. The Company was not in compliance with one of its loan covenants as of September 30, 2018, however, the full $12.0 million was paid off and the Credit Facility closed in November 2018.

v3.10.0.1
Restricted cash
9 Months Ended
Sep. 30, 2018
Receivables [Abstract]  
Restricted cash
11.

RESTRICTED CASH:

In May 2018, the Company entered into a minimum cash balance agreement in connection with the existing Credit Facility (see Note 10). The Company has presented $5.0 million as restricted cash as of September 30, 2018 as this cash has been specifically restricted to serve as collateral for the Company’s outstanding balance under the Credit Facility agreement. No such amounts were restricted as of December 31, 2017.

v3.10.0.1
Geographic Information
9 Months Ended
Sep. 30, 2018
Text Block [Abstract]  
Geographic Information
12.

GEOGRAPHIC INFORMATION

Total revenue to unaffiliated customers by geographic area were as follows:


     Three Months
Ended September 30,
     Nine Months
Ended September 30,
 
     2018      2017      2018      2017  

United States

   $ 23,296      $ 24,488      $ 68,615      $ 76,842  

Canada

     1,468        2,218        5,425        7,365  

Other International

     571        655        2,758        2,589  


Total revenue

   $ 25,335      $ 27,361      $ 76,798      $ 86,796  


Substantially all of the Company’s long-lived assets are located within the United States.

v3.10.0.1
Segment Information
9 Months Ended
Sep. 30, 2018
Segment Reporting [Abstract]  
Segment Information
13.

SEGMENT INFORMATION

In accordance with the provisions of Topic 280, Segment Reporting to the FASB ASC (“ASC 280”), the Company determined that it has three operating segments (Enterprise Performance Management (“EPM”), Enterprise Resource Planning (“ERP”) and Classic Consulting).

The EPM segment provides Business Analytics solutions leveraging Oracle EPM, BI and Big Data technologies. The ERP segment delivers Dynamics AX ERP, Business Intelligence and CRM solutions, primarily in the manufacturing space. The Classic Consulting segment provides business advisory services that are blended with technical services to help organizations leverage investments in legacy IT assets to create new digital business models.

The Company’s chief operating decision maker evaluates performance using several factors, of which the primary financial measures are revenue and operating segment operating income. The accounting policies of the operating segments are the same as those described in Note 2 “Summary of Significant Accounting Policies”.

Segment information for the three-month periods ended September 30, 2018 and 2017 were as follows:


     EPM      ERP      Classic
Consulting
    Corporate     Consolidated  
     (In Thousands)  

September 30, 2018


Total revenue

   $ 11,993      $ 12,992      $ 350     $ —       $ 25,335  

Operating income (loss)

   $ 896      $ 2,067      $ 10     $ (4,191   $ (1,218

Depreciation and amortization expense

   $ 446      $ 171      $ —       $ 10     $ 627  

September 30, 2017


Total revenue

   $ 12,273      $ 12,927      $ 2,161     $ —       $ 27,361  

Operating income (loss)

   $ 166      $ 1,599      $ (471   $ (2,027   $ (733

Depreciation and amortization expense

   $ 559      $ 200      $ —       $ 25     $ 784  


Segment information for the nine-month periods ended September 30, 2018 and 2017 were as follows:


     EPM      ERP      Classic
Consulting
    Corporate     Consolidated  
     (In Thousands)  

September 30, 2018


Total revenue

   $ 35,070      $ 39,497      $ 2,231     $ —       $ 76,798  

Operating income (loss)

   $ 194      $ 5,731      $ (760   $ (10,423   $ (5,258

Depreciation and amortization expense

   $ 1,342      $ 514      $ —       $ 37     $ 1,893  

September 30, 2017


Total revenue

   $ 39,271      $ 38,881      $ 8,644     $ —       $ 86,796  

Operating income (loss)

   $ 1,689      $ 5,138      $ (404   $ (11,938   $ (5,515

Depreciation and amortization expense

   $ 1,682      $ 598      $ —       $ 104     $ 2,384  

The Company is not disclosing total assets for each of its reportable segments, as total assets by reportable segment is not a key metric provided to the Company’s chief operating decision maker.

v3.10.0.1
Revenue Recognition (Tables)
9 Months Ended
Sep. 30, 2018
Summary of Disaggregation of Revenue

The following tables further depict the disaggregation of revenue for the three- and nine-month periods ended September 30, 2018. The information included in the disaggregation of revenue tables below have been presented in accordance with the standards set forth in ASC 606 for the three- and nine-month periods ended September 30, 2018.


Three-Months Ended September 30, 2018

 
     Service (1)      Software      Total  

Revenue by Reporting Unit:


ERP

   $ 11,933      $ 1,059      $ 12,992  

EPM

     12,001        (8      11,993  

Classic Consulting

     357        (7      350  


Consolidated revenue

   $ 24,291      $ 1,044      $ 25,335  


Revenue by Contract Type:


Time and materials

     20,280        —          20,280  

Fixed price

     1,675        —          1,675  

Retainer

     1,000        —          1,000  

Software

     —        1,044      1,044

Expense

     1,336        —          1,336  


Consolidated revenue

   $ 24,291      $ 1,044      $ 25,335  


Revenue Recognition


Point in time

     —        1,044      1,044

Over time

     24,291        —          24,291  


Consolidated revenue

   $ 24,291      $ 1,044      $ 25,335  


Nine-Months Ended September 30, 2018

 
     Service (1)      Software      Total  

Revenue by Reporting Unit:


ERP

   $ 35,077      $ 4,420      $ 39,497  

EPM

     35,086        (16      35,070  

Classic Consulting

     2,305        (74      2,231  


Consolidated revenue

   $ 72,468      $ 4,330      $ 76,798  


Revenue by Contract Type:


Time and materials

     59,389        —          59,389  

Fixed price

     5,465        —          5,465  

Retainer

     3,481        —          3,481  

Software

     —        4,330      4,330

Expense

     4,133        —          4,133  


Consolidated revenue

   $ 72,468      $ 4,330      $ 76,798  


Revenue Recognition


Point in time

     —        4,330      4,330

Over time

     72,468        —          72,468  


Consolidated revenue

   $ 72,468      $ 4,330      $ 76,798  


(1)

Service revenue includes both service and the corresponding reimbursable expense revenue.

Accounting Standards Update 2014-09 [Member]  
Summary of Disaggregation of Revenue

The table below presents software revenue in accordance with ASC 605 for the three- and nine-month periods ended September 30, 2018. No other financials statement line items were affected by the adoption of ASC 606.


Comparable Software Revenue:

   Three-
month period
ended
September 30,
2018
 

Software Revenue

   $ 2,346  

Software Expense

     1,302  


Software Gross Margin

   $ 1,044  


Comparable Software Revenue:

   Nine-
month period
ended
September 30,
2018
 

Software Revenue

   $ 9,310  

Software Expense

     4,980  


Software Gross Margin

   $ 4,330  


v3.10.0.1
Goodwill and Intangible Assets (Tables)
9 Months Ended
Sep. 30, 2018
Goodwill and Intangible Assets Disclosure [Abstract]  
Estimated Annual Amortization Expense

Estimated annual amortization expense of our intangible assets (including amortization expense associated with capitalized software costs) for the current year and the following five years ending December 31, is as follows:


     Amortization
Expense
 
     (In Thousands)  

2018

   $ 2,240  

2019

   $ 1,713  

2020

   $ 1,057  

2021 and beyond

   $ 565  
v3.10.0.1
Accrued Expenses and Other Liabilities (Tables)
9 Months Ended
Sep. 30, 2018
Payables and Accruals [Abstract]  
Components of Accrued Expenses

Accrued liabilities as of September 30, 2018 and December 31, 2017 consisted of the following:


     September 30,
2018
     December 31,
2017
 
     (In Thousands)  

Accrued bonuses

   $ 3,006      $ 5,590  

Accrued payroll related liabilities

     1,531        3,277  

Accrued vacation

     2,818        2,497  

Accrued commissions

     1,047        825  

Accrued software expense

     545        675  

Accrued contractor fees

     581        346  

Accrued professional service fees

     3,227        341  

Deferred rent

     50        64  

Income tax related accruals

     331        189  

Other accrued expenses

     1,308        1,180  


Total

   $ 14,444      $ 14,984  
v3.10.0.1
Net Loss Per Share (Tables)
9 Months Ended
Sep. 30, 2018
Earnings Per Share [Abstract]  
Reconciliation of Net Income and Weighted Average Shares used in Computing Basic and Diluted Net Loss Per Share

A reconciliation of net income and weighted average shares used in computing basic and diluted net loss per share is as follows:


     Three Months Ended
September 30,
     Nine Months Ended
September 30,
 
     2018      2017      2018      2017  
     (In Thousands, Except Per Share Data)  

Basic net loss per share:


Net loss applicable to common shares

   $ (1,306    $ (172    $ (5,726    $ (3,719


Weighted average common shares outstanding

     14,620        13,924        14,423        13,497  


Basic net loss per share of common stock

   $ (0.09    $ (0.01    $ (0.40    $ (0.28


     Three Months Ended
September 30,
     Nine Months Ended
September 30,
 
     2018      2017      2018      2017  
     (In Thousands, Except Per Share Data)  

Diluted net loss per share:


Net loss applicable to common shares

   $ (1,306    $ (172    $ (5,726    $ (3,719


Weighted average common shares outstanding

     14,620        13,924        14,423        13,497  

Dilutive effects of stock options

     —          —          —          —    


Weighted average common shares, assuming dilutive effect of stock options

     14,620        13,924        14,423        13,497  


Diluted net loss per share of common stock

   $ (0.09    $ (0.01    $ (0.40    $ (0.28


v3.10.0.1
Geographic Information (Tables)
9 Months Ended
Sep. 30, 2018
Text Block [Abstract]  
Schedule of Geographic Information

Total revenue to unaffiliated customers by geographic area were as follows:


     Three Months
Ended September 30,
     Nine Months
Ended September 30,
 
     2018      2017      2018      2017  

United States

   $ 23,296      $ 24,488      $ 68,615      $ 76,842  

Canada

     1,468        2,218        5,425        7,365  

Other International

     571        655        2,758        2,589  


Total revenue

   $ 25,335      $ 27,361      $ 76,798      $ 86,796  


v3.10.0.1
Segment Information (Tables)
9 Months Ended
Sep. 30, 2018
Segment Reporting [Abstract]  
Schedule of Segment Information

Segment information for the three-month periods ended September 30, 2018 and 2017 were as follows:


     EPM      ERP      Classic
Consulting
    Corporate     Consolidated  
     (In Thousands)  

September 30, 2018


Total revenue

   $ 11,993      $ 12,992      $ 350     $ —       $ 25,335  

Operating income (loss)

   $ 896      $ 2,067      $ 10     $ (4,191   $ (1,218

Depreciation and amortization expense

   $ 446      $ 171      $ —       $ 10     $ 627  

September 30, 2017


Total revenue

   $ 12,273      $ 12,927      $ 2,161     $ —       $ 27,361  

Operating income (loss)

   $ 166      $ 1,599      $ (471   $ (2,027   $ (733

Depreciation and amortization expense

   $ 559      $ 200      $ —       $ 25     $ 784  


Segment information for the nine-month periods ended September 30, 2018 and 2017 were as follows:


     EPM      ERP      Classic
Consulting
    Corporate     Consolidated  
     (In Thousands)  

September 30, 2018


Total revenue

   $ 35,070      $ 39,497      $ 2,231     $ —       $ 76,798  

Operating income (loss)

   $ 194      $ 5,731      $ (760   $ (10,423   $ (5,258

Depreciation and amortization expense

   $ 1,342      $ 514      $ —       $ 37     $ 1,893  

September 30, 2017


Total revenue

   $ 39,271      $ 38,881      $ 8,644     $ —       $ 86,796  

Operating income (loss)

   $ 1,689      $ 5,138      $ (404   $ (11,938   $ (5,515

Depreciation and amortization expense

   $ 1,682      $ 598      $ —       $ 104     $ 2,384  
v3.10.0.1
Organization - Additional Information (Detail) - $ / shares
1 Months Ended
Nov. 01, 2018
Oct. 19, 2018
Oct. 31, 2018
Sep. 30, 2018
Dec. 31, 2017
Organization Consolidation And Presentation Of Financial Statements [Line Items]          
Common stock, par value       $ 0.01 $ 0.01
Subsequent Event [Member]          
Organization Consolidation And Presentation Of Financial Statements [Line Items]          
Common stock, par value $ 0.01        
Dividend Declared [Member] | Common Stock [Member] | Subsequent Event [Member]          
Organization Consolidation And Presentation Of Financial Statements [Line Items]          
Dividend per share   $ 1.15      
Dividends Payable, date declared   Oct. 19, 2018      
Dividends payable, date to be paid   Nov. 09, 2018      
Dividends payable, date of record   Oct. 31, 2018      
Alithya [Member] | Common Class Undefined [Member] | Subsequent Event [Member]          
Organization Consolidation And Presentation Of Financial Statements [Line Items]          
Common stock, par value 0        
Alithya [Member] | Multiple Voting Shares [Member] | Subsequent Event [Member]          
Organization Consolidation And Presentation Of Financial Statements [Line Items]          
Common stock, par value $ 0        
Ancora Advisors LLC [Member] | Edgewater [Member]          
Organization Consolidation And Presentation Of Financial Statements [Line Items]          
Ownership percentage     10.20%    
Parent Company - New Alithya [Member] | Subsequent Event [Member]          
Organization Consolidation And Presentation Of Financial Statements [Line Items]          
Lock in period of share issuance 12 months        
Parent Company - New Alithya [Member] | Edgewater Business Combination [Member] | Subsequent Event [Member]          
Organization Consolidation And Presentation Of Financial Statements [Line Items]          
Share issued, percentage 40.00%        
Percentage of voting interests, issued 16.00%        
Parent Company - New Alithya [Member] | Edgewater Business Combination [Member] | Subordinate Voting Share [Member] | Subsequent Event [Member]          
Organization Consolidation And Presentation Of Financial Statements [Line Items]          
Common stock, par value $ 0        
Share exchange ratio 1.1918        
Parent Company - New Alithya [Member] | Alithya Business Combination [Member] | Subsequent Event [Member]          
Organization Consolidation And Presentation Of Financial Statements [Line Items]          
Share issued, percentage 60.00%        
Percentage of voting interests, issued 84.00%        
Parent Company - New Alithya [Member] | Alithya Business Combination [Member] | Subordinate Voting Share [Member] | Subsequent Event [Member]          
Organization Consolidation And Presentation Of Financial Statements [Line Items]          
Common stock, par value $ 0        
Share exchange ratio 1        
Parent Company - New Alithya [Member] | Alithya Business Combination [Member] | Class B Multiple Voting Share [Member] | Subsequent Event [Member]          
Organization Consolidation And Presentation Of Financial Statements [Line Items]          
Common stock, par value $ 0        
Share exchange ratio 1        
Parent Company - New Alithya [Member] | Alithya Business Combination [Member] | Minimum [Member] | Significant Shareholder [Member] | Subsequent Event [Member]          
Organization Consolidation And Presentation Of Financial Statements [Line Items]          
Issued and outstanding shares received, percentage 5.00%        
v3.10.0.1
Revenue Recognition - Additional Information (Detail) - USD ($)
$ in Thousands
3 Months Ended 9 Months Ended
Sep. 30, 2018
Sep. 30, 2017
Sep. 30, 2018
Sep. 30, 2017
Dec. 31, 2017
Revenue from Contract with Customers [Line Items]          
Transaction price expected to be recognized within the next twelve months $ 2,800   $ 2,800    
Contract liability 2,800   2,800   $ 2,100
Service revenue 25,335 $ 27,361 76,798 $ 86,796  
Service [Member]          
Revenue from Contract with Customers [Line Items]          
Service revenue 22,955 $ 23,562 68,335 $ 73,132  
Accounting Standards Update 2014-09 [Member] | Service [Member]          
Revenue from Contract with Customers [Line Items]          
Service revenue $ 925   $ 2,300    
v3.10.0.1
Revenue Recognition - Summary of Disaggregation of Revenue (Detail) - USD ($)
$ in Thousands
3 Months Ended 9 Months Ended
Sep. 30, 2018
Sep. 30, 2017
Sep. 30, 2018
Sep. 30, 2017
Disaggregation of Revenue [Line Items]        
Consolidated revenue $ 25,335 $ 27,361 $ 76,798 $ 86,796
ERP [Member]        
Disaggregation of Revenue [Line Items]        
Consolidated revenue 12,992 12,927 39,497 38,881
EPM [Member]        
Disaggregation of Revenue [Line Items]        
Consolidated revenue 11,993 12,273 35,070 39,271
Classic Consulting [Member]        
Disaggregation of Revenue [Line Items]        
Consolidated revenue 350 2,161 2,231 8,644
Time and materials [Member]        
Disaggregation of Revenue [Line Items]        
Consolidated revenue 20,280   59,389  
Fixed Price [Member]        
Disaggregation of Revenue [Line Items]        
Consolidated revenue 1,675   5,465  
Retainer [Member]        
Disaggregation of Revenue [Line Items]        
Consolidated revenue 1,000   3,481  
Software [Member]        
Disaggregation of Revenue [Line Items]        
Consolidated revenue 1,044   4,330  
Expense [Member]        
Disaggregation of Revenue [Line Items]        
Consolidated revenue 1,336   4,133  
Point in Time [Member]        
Disaggregation of Revenue [Line Items]        
Consolidated revenue 1,044   4,330  
Over Time [Member]        
Disaggregation of Revenue [Line Items]        
Consolidated revenue 24,291   72,468  
Service [Member]        
Disaggregation of Revenue [Line Items]        
Consolidated revenue 24,291   72,468  
Service [Member] | ERP [Member]        
Disaggregation of Revenue [Line Items]        
Consolidated revenue 11,933   35,077  
Service [Member] | EPM [Member]        
Disaggregation of Revenue [Line Items]        
Consolidated revenue 12,001   35,086  
Service [Member] | Classic Consulting [Member]        
Disaggregation of Revenue [Line Items]        
Consolidated revenue 357   2,305  
Service [Member] | Time and materials [Member]        
Disaggregation of Revenue [Line Items]        
Consolidated revenue 20,280   59,389  
Service [Member] | Fixed Price [Member]        
Disaggregation of Revenue [Line Items]        
Consolidated revenue 1,675   5,465  
Service [Member] | Retainer [Member]        
Disaggregation of Revenue [Line Items]        
Consolidated revenue 1,000   3,481  
Service [Member] | Expense [Member]        
Disaggregation of Revenue [Line Items]        
Consolidated revenue 1,336   4,133  
Service [Member] | Over Time [Member]        
Disaggregation of Revenue [Line Items]        
Consolidated revenue 24,291   72,468  
Software [Member]        
Disaggregation of Revenue [Line Items]        
Consolidated revenue 1,044 $ 2,385 4,330 $ 9,339
Software [Member] | ERP [Member]        
Disaggregation of Revenue [Line Items]        
Consolidated revenue 1,059   4,420  
Software [Member] | EPM [Member]        
Disaggregation of Revenue [Line Items]        
Consolidated revenue (8)   (16)  
Software [Member] | Classic Consulting [Member]        
Disaggregation of Revenue [Line Items]        
Consolidated revenue (7)   (74)  
Software [Member] | Software [Member]        
Disaggregation of Revenue [Line Items]        
Consolidated revenue 1,044   4,330  
Software [Member] | Point in Time [Member]        
Disaggregation of Revenue [Line Items]        
Consolidated revenue $ 1,044   $ 4,330  
v3.10.0.1
Revenue Recognition - Summary of Software Revenue (Detail) - USD ($)
$ in Thousands
3 Months Ended 9 Months Ended
Sep. 30, 2018
Sep. 30, 2017
Sep. 30, 2018
Sep. 30, 2017
Disaggregation of Revenue [Line Items]        
Revenue $ 25,335 $ 27,361 $ 76,798 $ 86,796
Expense 15,137 17,040 48,626 54,978
Gross Margin 10,198 10,321 28,172 31,818
Software [Member]        
Disaggregation of Revenue [Line Items]        
Revenue 1,044 2,385 4,330 9,339
Expense   $ 1,441   $ 5,079
Accounting Standards Update 2014-09 [Member] | Software [Member]        
Disaggregation of Revenue [Line Items]        
Revenue 2,346   9,310  
Expense 1,302   4,980  
Gross Margin $ 1,044   $ 4,330  
v3.10.0.1
Share-Based Compensation - Additional Information (Detail) - USD ($)
$ in Thousands
3 Months Ended 9 Months Ended
Sep. 30, 2018
Sep. 30, 2017
Sep. 30, 2018
Sep. 30, 2017
Share-based Compensation [Abstract]        
Stock-based compensation expense under share based plans $ 57 $ 219 $ 346 $ 889
Proceeds from employee stock purchase plans and stock option exercises 205 $ 313 2,552 $ 4,100
Unrecognized compensation expense $ 127   $ 127  
Expected weighted-average recognition period for unrecognized compensation expense     1 year 3 months 18 days  
v3.10.0.1
Income Taxes - Additional Information (Detail) - USD ($)
3 Months Ended 9 Months Ended 12 Months Ended
Sep. 30, 2018
Sep. 30, 2017
Sep. 30, 2018
Sep. 30, 2017
Dec. 31, 2017
Income Tax Benefit [Line Items]          
Tax provisions (benefits) $ 20,000 $ (528,000) $ 227,000 $ (1,996,000)  
Effective tax rate (1.50%) (75.40%) (4.10%) (34.90%)  
Deferred tax asset valuation allowance $ 23,000,000   $ 23,000,000   $ 21,700,000
Interest and penalties related to unrecognized tax benefits 0 $ 0 0 $ 0  
Uncertain tax portions $ 0   $ 0    
Cumulative adjustment to retained earnings       1,400,000  
U.S. federal corporate tax rate     21.00%   35.00%
Stock Option Exercises [Member]          
Income Tax Benefit [Line Items]          
Tax provisions (benefits)     $ 306,000 $ 786,000  
v3.10.0.1
Goodwill and Intangible Assets - Additional Information (Detail) - USD ($)
3 Months Ended 9 Months Ended
Sep. 30, 2018
Sep. 30, 2017
Sep. 30, 2018
Sep. 30, 2017
Goodwill and Intangible Assets Disclosure [Abstract]        
Changes in goodwill balance     $ 0  
Amortization expense of intangible assets $ 561,000 $ 699,000 $ 1,700,000 $ 2,100,000
v3.10.0.1
Goodwill and Intangible Assets - Estimated Annual Amortization Expense (Detail)
$ in Thousands
Sep. 30, 2018
USD ($)
Finite-Lived Intangible Assets, Net, Amortization Expense, Fiscal Year Maturity [Abstract]  
2018 $ 2,240
2019 1,713
2020 1,057
2021 and beyond $ 565
v3.10.0.1
Accrued Expenses and Other Liabilities - Components of Accrued Expenses (Detail) - USD ($)
$ in Thousands
Sep. 30, 2018
Dec. 31, 2017
Components of accrued liabilities    
Accrued bonuses $ 3,006 $ 5,590
Accrued payroll related liabilities 1,531 3,277
Accrued vacation 2,818 2,497
Accrued commissions 1,047 825
Accrued software expense 545 675
Accrued contractor fees 581 346
Accrued professional service fees 3,227 341
Deferred rent 50 64
Income tax related accruals 331 189
Other accrued expenses 1,308 1,180
Total $ 14,444 $ 14,984
v3.10.0.1
Net Loss Per Share - Reconciliation of Net Income (Loss) and Weighted Average Shares used in Computing Basic and Diluted Net Income (Loss) Per Share (Detail) - USD ($)
$ / shares in Units, shares in Thousands, $ in Thousands
3 Months Ended 9 Months Ended
Sep. 30, 2018
Sep. 30, 2017
Sep. 30, 2018
Sep. 30, 2017
Basic net loss per share:        
Net loss applicable to common shares $ (1,306) $ (172) $ (5,726) $ (3,719)
Weighted average common shares outstanding 14,620 13,924 14,423 13,497
Basic net loss per share of common stock $ (0.09) $ (0.01) $ (0.40) $ (0.28)
Diluted net loss per share:        
Net loss applicable to common shares $ (1,306) $ (172) $ (5,726) $ (3,719)
Weighted average common shares outstanding 14,620 13,924 14,423 13,497
Dilutive effects of stock options 0 0 0 0
Weighted average common shares, assuming dilutive effect of stock options 14,620 13,924 14,423 13,497
Diluted net loss per share of common stock $ (0.09) $ (0.01) $ (0.40) $ (0.28)
v3.10.0.1
Net loss Per Share - Additional Information (Detail) - shares
shares in Thousands
3 Months Ended 9 Months Ended
Sep. 30, 2018
Sep. 30, 2017
Sep. 30, 2018
Sep. 30, 2017
Summary Of Significant Accounting Policies [Line Items]        
Diluted computation increased 465 542 465 148
Share-based awards outstanding under equity plans 766 1,800 766 1,800
Option Plans [Member]        
Summary Of Significant Accounting Policies [Line Items]        
Diluted computation increased 79 534 118 760
v3.10.0.1
Stock Repurchase Program - Additional Information (Detail) - USD ($)
3 Months Ended 9 Months Ended
Sep. 30, 2018
Sep. 30, 2017
Sep. 30, 2018
Sep. 30, 2017
Dec. 31, 2008
Dec. 31, 2007
Equity [Abstract]            
Stock repurchase program         $ 23,100,000 $ 5,000,000
Repurchase of common stock 0 0 151,000 0    
Aggregate purchase price common stock     $ 948,000      
v3.10.0.1
Revolving Line of Credit - Additional Information (Detail) - Revolving Credit Facility [Member] - USD ($)
$ in Millions
9 Months Ended
Sep. 30, 2018
Oct. 31, 2018
Oct. 01, 2018
Dec. 31, 2015
Sep. 30, 2013
Line of Credit Facility [Line Items]          
Borrowing credit facility       $ 15.0 $ 10.0
Additional borrowing credit facility       5.0  
Total credit facility borrowing capacity       $ 20.0  
Revolving credit facility period 3 years        
Amount drawn under credit facility $ 5.0        
Debt covenant terms and compliance The Company was not in compliance with one of its loan covenants as of September 30, 2018. Subsequent to quarter-end, the Company has fully paid off the Credit Facility Obligation.        
Payment of credit facility $ 12.0        
Subsequent Event [Member]          
Line of Credit Facility [Line Items]          
Additional borrowing credit facility   $ 7.0      
Cash collateral for obligations   $ 5.0      
Amount drawn under credit facility     $ 7.0    
v3.10.0.1
Restricted Cash - Additional Information (Detail) - USD ($)
Sep. 30, 2018
Dec. 31, 2017
Restricted Cash and Cash Equivalents [Abstract]    
Restricted cash $ 5,000,000 $ 0
v3.10.0.1
Geographic Information - Schedule of Geographic Information (Detail) - USD ($)
$ in Thousands
3 Months Ended 9 Months Ended
Sep. 30, 2018
Sep. 30, 2017
Sep. 30, 2018
Sep. 30, 2017
Segment Reporting Information [Line Items]        
Total revenue $ 25,335 $ 27,361 $ 76,798 $ 86,796
UNITED STATES        
Segment Reporting Information [Line Items]        
Total revenue 23,296 24,488 68,615 76,842
CANADA        
Segment Reporting Information [Line Items]        
Total revenue 1,468 2,218 5,425 7,365
Non-US [Member]        
Segment Reporting Information [Line Items]        
Total revenue $ 571 $ 655 $ 2,758 $ 2,589
v3.10.0.1
Segment Information - Additional Information (Detail)
9 Months Ended
Sep. 30, 2018
Segment
Segment Reporting [Abstract]  
Number of Operating Segments 3
v3.10.0.1
Segment Information - Schedule of Segment Information (Detail) - USD ($)
$ in Thousands
3 Months Ended 9 Months Ended
Sep. 30, 2018
Sep. 30, 2017
Sep. 30, 2018
Sep. 30, 2017
Schedule of Statement of Income Components [Line Items]        
Total revenue $ 25,335 $ 27,361 $ 76,798 $ 86,796
Operating income (loss) (1,218) (733) (5,258) (5,515)
Depreciation and amortization expense 627 784 1,893 2,384
EPM [Member]        
Schedule of Statement of Income Components [Line Items]        
Total revenue 11,993 12,273 35,070 39,271
Operating income (loss) 896 166 194 1,689
Depreciation and amortization expense 446 559 1,342 1,682
ERP [Member]        
Schedule of Statement of Income Components [Line Items]        
Total revenue 12,992 12,927 39,497 38,881
Operating income (loss) 2,067 1,599 5,731 5,138
Depreciation and amortization expense 171 200 514 598
Classic Consulting [Member]        
Schedule of Statement of Income Components [Line Items]        
Total revenue 350 2,161 2,231 8,644
Operating income (loss) 10 (471) (760) (404)
Corporate [Member]        
Schedule of Statement of Income Components [Line Items]        
Operating income (loss) (4,191) (2,027) (10,423) (11,938)
Depreciation and amortization expense $ 10 $ 25 $ 37 $ 104