Table of Contents


UNITED STATES SECURITIES AND EXCHANGE COMMISSION
WASHINGTON, D.C. 20549

FORM 10-K


      ANNUAL REPORT PURSUANT TO SECTION 13 OR 15(d) OF THE SECURITIES EXCHANGE ACT OF 1934

For the Fiscal Year Ended: July 31, 2018

OR

      TRANSITION REPORT PURSUANT TO SECTION 13 OR 15(d) OF THE SECURITIES EXCHANGE ACT OF 1934


For the Transition Period from                    to

Commission file number: 1-3647

J.W. MAYS, INC.
(Exact name of registrant as specified in its charter)

New York 11-1059070
(State or other jurisdiction of incorporation or organization) (I.R.S. Employer Identification No.)
 
Nine Bond Street, Brooklyn, New York 11201-5805
(Address of principal executive offices) (Zip Code)

Registrant’s telephone number, including area code: (718) 624-7400

Securities registered pursuant to Section 12(b) of the Act:

Title of each class Name of each exchange on which registered
Common Stock, par value $1 per share The NASDAQ Stock Market LLC

Securities registered pursuant to Section 12(g) of the Act: None

Indicate by check mark if the registrant is a well-known seasoned issuer, as defined in Rule 405 of the Securities Act. Yes ☐  No ☒ 

Indicate by check mark if the registrant is not required to file reports pursuant to Section 13 or Section 15(d) of the Act. Yes ☐  No ☒ 

Indicate by check mark whether the registrant (1) has filed all reports required to be filed by Section 13 or 15(d) of the Securities Exchange Act of 1934 during the preceding 12 months (or for such shorter period that the registrant was required to file such reports), and (2) has been subject to such filing requirements for the past 90 days. Yes ☒  No ☐ 

Indicate by check mark whether the registrant has submitted electronically and posted on its corporate web site, if any, every Interactive Data File required to be submitted and posted pursuant to Rule 405 of Regulation S-T (§232.405 of this chapter) during the preceding 12 months (or for such shorter period that the registrant was required to submit and post such files). Yes ☒  No

Indicate by check mark if disclosure of delinquent filers pursuant to Item 405 of Regulations S-K (§229.405 of this chapter) is not contained herein, and will not be contained, to the best of registrant’s knowledge, in definitive proxy or information statements incorporated by reference in Part III of this Form 10-K or any amendment to this Form 10-K. ☒  No delinquent filers

Indicate by check mark whether the registrant is a large accelerated filer, an accelerated filer, a non-accelerated filer, a smaller reporting company or an emerging growth company. See the definitions of “large accelerated filer,” “accelerated filer”, “smaller reporting company” and “emerging growth company” in Rule 12b-2 of the Exchange Act.

           Large accelerated filer Accelerated filer Emerging growth company
Non-accelerated filer Smaller reporting company

If an emerging growth company, indicate by check mark if the registrant has elected not to use the extended transition period for complying with any new or revised financial accounting standards provided pursuant to Section 13(a) of the Exchange Act.

Indicate by check mark whether the registrant is a shell company (as defined in Rule 12b-2 of the Exchange Act). Yes ☐  No ☒ 

The aggregate market value of voting stock held by non-affiliates of the registrant was approximately $16,836,624 as of January 31, 2018 based on the average of the bid and asked price of the stock reported for such date. For the purpose of the foregoing calculation, the shares of common stock held by each officer and director and by each person who owns 5% or more of the outstanding common stock have been excluded in that such persons may be deemed to be affiliates. This determination of affiliate status is not necessarily a conclusive determination for other purposes.

The number of shares outstanding of the registrant’s common stock as of September 4, 2018 was 2,015,780.

DOCUMENTS INCORPORATED BY REFERENCE

      Part of Form 10-K
in which the Document
Document is incorporated
Annual Report to Shareholders for Fiscal Year Ended July 31, 2018 Parts I and II
Definitive Proxy Statement for the 2018 Annual Meeting of Shareholders Part III


Table of Contents

J.W. MAYS, INC.
FORM 10-K FOR THE FISCAL YEAR ENDED JULY 31, 2018

TABLE OF CONTENTS

      Page
Part I      
Item 1.  Business 1
Item 1A.  Risk Factors 1
Item 1B.  Unresolved Staff Comments 2
Item 2.  Properties 3
Item 3.  Legal Proceedings 8
Item 4.  Mine Safety Disclosures 8
Part II
Item 5.  Market for Registrant’s Common Equity, Related Stockholder
Matters and Issuer Purchases of Equity Securities
9
Performance Graph 10
Item 6.  Selected Financial Data 11
Item 7.  Management’s Discussion and Analysis of Financial Condition and Results of Operations 11
Item 7A. Quantitative and Qualitative Disclosures About Market Risk 11
Item 8. Financial Statements and Supplementary Data 11
Item 9.  Changes in and Disagreements with Accountants on Accounting and Financial Disclosure 11
Item 9A.  Controls and Procedures 11
Item 9B.  Other Information 12
Part III
Item 10.  Directors, Executive Officers and Corporate Governance 12
Item 11.  Compensation 13
Item 12.  Security Ownership of Certain Beneficial Owners and Management and Related Stockholder Matters 13
Item 13. Certain Relationships and Related Transactions, and Director Independence 13
Item 14.  Principal Accounting Fees and Services 13
Part IV
Item 15.  Exhibits and Financial Statement Schedules 13
Signatures 15


Table of Contents

PART I

ITEM 1. BUSINESS.

J.W. Mays, Inc. (the “Company” or “Registrant”) with executive offices at Nine Bond Street, Brooklyn, New York 11201, operates a number of commercial real estate properties, which are described in Item 2 “Properties”. The Company’s business was founded in 1924 and incorporated under the laws of the State of New York on July 6, 1927.

The Company has 30 employees and has a contract, expiring November 30, 2019, with a union covering rates of pay, hours of employment and other conditions of employment for approximately 23% of its employees. The Company considers that its labor relations with its employees and union are good.

CAUTIONARY STATEMENT REGARDING FORWARD-LOOKING STATEMENTS

This Annual Report on Form 10-K may contain forward-looking statements which include assumptions about future market conditions, operations and financial results. These statements are based on current expectations and are subject to risks and uncertainties. They are made pursuant to safe harbor provisions of the Private Securities Litigation Reform Act of 1995. The Company’s actual results, performance or achievements in the future could differ significantly from the results, performance or achievements discussed or implied in such forward-looking statements herein and in prior U. S. Securities and Exchange Commission (“SEC”) filings by the Company. The Company assumes no obligation to update these forward-looking statements or to advise of changes in the assumptions on which they were based.

Factors that could cause or contribute to such differences include, but are not limited to, changes in the competitive environment of the Company, general economic and business conditions, industry trends, changes in government rules and regulations and environmental rules and regulations. Statements concerning interest rates and other financial instrument fair values and their estimated contribution to the Company’s future results of operations are based upon market information as of a specific date. This market information is often a function of significant judgment and estimation. Further, market interest rates are subject to potential significant volatility.

ITEM 1A. RISK FACTORS.

Risks Relating to Ownership Structure

The controlling shareholder group may be able to vote its shares in favor of its interests that may not always coincide with the interests of shareholders not part of such group. This risk may be counter-balanced to a degree by the actions of the Board of Directors whose composition is made up of a majority of independent directors.

The controlling shareholder group includes a corporation that owns a significant percentage of the Company’s common stock and which does business with the Company, as further described in the Notes to the Consolidated Financial Statements. In theory, this could result in a conflict of interest; nevertheless, the Company and its largest shareholder have put in place some controls to reduce the effects of any perceived conflict of interest.

Certain conflicts of interest may be perceived by the relationship between the Company and its largest shareholder. Both entities have the same Chief Executive Officer, and certain management personnel work for both entities. Nevertheless, the Company’s Board of Directors (“Board”) is composed of a majority of independent directors. As recently as 2005, in a case involving both entities, the Delaware Supreme Court in connection with an attempt to obtain books and records of the Company through a proceeding against the Company’s significant shareholder, held that the actions of the Company’s Board were proper.

1


Table of Contents

Risks Related to Our Business

We are a part of the communities in which we do business. Accordingly, like other businesses in our communities, we are subject to the following risks:

the continued threat of terrorism;
 
economic downturns, both on a national and on local scales;
 
loss of key personnel;
 
the availability, if needed, of additional financing;
 
the continued availability of insurance (in different types of policies) at reasonably acceptable rates;
 
the general burdens of governmental regulation, at the Local, State and Federal levels;
 
climate change; and
 
cyber security.

Risks Related to Real Estate Operations

Our investment in property development may be limited by increasing costs required to “fit up” property to be leased to tenants. Also, as the cost of fitting up properties increases, we may be required to wait and forsake opportunities that would be revenue producing until such time that we obtain the necessary financing of such ventures. This risk may be mitigated by our obtaining lines of credit and other financing vehicles, although such have significant limitations on the amounts that may be borrowed at any point in time.

We also may be subject to environmental liability as an owner or operator of properties. Many of our properties are old and when we need to fit up a property for a new tenant, we may find materials and the like that could be deemed to contain hazardous elements requiring remediation or encapsulation.

We try to lease our properties to tenants with adequate finances, but as a result of occasional business downturns, even formerly financially strong tenants may be at risk. The Company mitigates risks of tenants with less than adequate finances by leasing our properties to multiple tenants where applicable in order to diversify the tenant base.

Risks Related to our Investments

Excess cash and cash equivalents may be invested from time to time. We seek to earn rates of return that will help us finance our business operations. These investments may be subject to significant uncertainties and may not be successful for many reasons, including, but not limited to the following:

fluctuations in interest rates;
 
worsening of general economic and market conditions; and
 
adverse legal, financial and regulatory developments that may affect a particular business.

Risk Factors Summary

These are some of the “Risk Factors” that could affect the Company’s business. The Company endeavors to take actions and do business in a way that reduces these “Risk Factors” or, at least, takes them into account when conducting its business. Nevertheless, some of these “Risk Factors” cannot be avoided so that the Company must also take actions and do business that negates the adverse effects that these may have on the Company.

ITEM 1B. UNRESOLVED STAFF COMMENTS.

There are no unresolved comments from the staff of the U. S. Securities and Exchange Commission as of the date of this Annual Report on Form 10-K.

2


Table of Contents

ITEM 2. PROPERTIES.

The table below sets forth certain information as to each of the properties currently operated by the Company:

          Approximate
Location Square Feet
1. Brooklyn, New York
Fulton Street at Bond Street 380,000
2. Brooklyn, New York
Jowein building at Elm Place 201,000
3. Jamaica, New York
Jamaica Avenue at 169th Street 297,000
4. Fishkill, New York
Route 9 at Interstate Highway 84 203,000
(located on
14.6 acres)
5. Levittown, New York
Hempstead Turnpike 10,000
(located on
75,800 square
feet of land)
6. Massapequa, New York
Sunrise Highway 133,400
7. Circleville, Ohio
Tarlton Road 193,350
(located on
11.6 acres)
8. Brooklyn, New York
Truck bays, passage facilities and tunnel-Schermerhorn Street 17,000
Building-Livingston Street 10,500

Properties are leased under long-term leases for varying periods, the longest of which extends to 2073, and in most instances renewal options are included. Reference is made to Note 5 to the Consolidated Financial Statements contained in the 2018 Annual Report to Shareholders, incorporated herein by reference. The property owned which is held subject to mortgage is the Brooklyn Fulton Street at Bond Street building.

1. Brooklyn, New York—Fulton Street at Bond Street
        

90% of the property is owned by the Company and the remaining 10% of the property is leased by the Company under five separate leases. Expiration dates are as follows: 12/8/2043 (1 lease) which lease currently has one thirty-year renewal option through 12/8/2073. The Company in July 2012, exercised the first renewal option for thirty years ending 12/8/2043; 4/30/2026 (1 lease), 4/30/2021 (1 lease); and 4/30/2031 (2 leases) which leases previously had expiration dates of April 30, 2011 and were extended for an additional twenty years.

The property is currently leased to twenty-three tenants of which eight are retail tenants, two are fast food restaurants, eleven occupy office space, one is a dental office and one is a medical office. Two tenants have leased in excess of 10% of the rentable square footage. One tenant is a department store (33.42%) and the other tenant occupies office space (15.06%).

In March 2017, the Company leased 7,700 square feet to a medical facility for a term of ten years with two five year option periods. To accommodate this tenant, an existing tenant surrendered 400 square feet of retail space. The cost of renovations for this tenant will be approximately $400,000 and brokerage commissions were $216,052. The tenant is anticipated to take occupancy and commence payment of rent in January 2019.

In August, 2017, the Company leased 1,423 square feet of retail space to an existing tenant for a period of 18.5 years at the Company’s Nine Bond Street, Brooklyn, New York building. Rent and occupancy commenced July 2018.

3


Table of Contents


In September, 2017, the Company leased 5,167 square feet of retail space to a tenant at the Company’s Nine Bond Street, Brooklyn, New York building for a period of ten years, effective January, 2018.

In November, 2017, the Company extended a lease with the existing dental office tenant at its Nine Bond Street, Brooklyn, New York building for an additional ten years, expiring January 15, 2028.

In May 2018, an office tenant who occupies 3,080 square feet at the Company’s Nine Bond Street Brooklyn, New York building informed the Company that it intends to vacate the premises in October 2018. The annual loss in rent will be $112,000.

In June 2018, the Company extended a lease with an office tenant who occupies 23,574 square feet at its Nine Bond Street, Brooklyn, New York building for an additional four years expiring June 30, 2022.

In June 2018, the Company extended a lease with one of the Company’s landlords, which expire on April 30, 2021 for an additional five years to expire on April 30, 2026 at its Nine Bond Street, Brooklyn, New York building.

In August 2018, the Company entered into a lease agreement with an existing office tenant for an additional 1,849 square feet until June 30, 2022 at its Nine Bond Street Brooklyn, New York building.

It is the intention of the Company to negotiate the renewals of the expiring leases as they come due, providing the tenants maintain adequate finances.


Occupancy Lease Expiration Rent
Year             Year       Number of       Area       Annual       Percentage of
Ended Rate Ended Leases Sq. Ft. Rent Gross Annual Rent
         7/31/2014 76.21 % 7/31/2019       6       62,229 $ 1,187,390       6.152      
7/31/2015 77.08 % 7/31/2020 1 1,000 42,000 .218
7/31/2016 76.44 % 7/31/2021 4 17,205 801,463 4.152
7/31/2017 75.59 % 7/31/2022 2 27,423 1,080,858 5.600
7/31/2018 75.26 % 7/31/2023 1 63 10,250 .053
7/31/2024 1 1,140 64,799 .336
7/31/2028 4 18,327 428,257 2.219
7/31/2032 2 28,218 891,343 4.618
7/31/2036 2 139,547 3,393,538 17.582
23 295,152 $ 7,899,898 40.930

The Company uses 17,810 square feet of available space.

As of July 31, 2018 the federal tax basis is $22,474,715 with accumulated depreciation of $11,878,256 for a net carrying value of $10,596,459. The lives taken for depreciation vary between 15-40 years and the methods used are straight-line and declining balance.

The real estate taxes for this property are $1,944,456 per year and the rate used is averaged at $11.128 per $100 of assessed valuation.

        
2. Brooklyn, New York—Jowein building at Elm Place
 

The building is owned. The property is currently leased to sixteen tenants of which two are retail stores, one is a fast food restaurant, two for warehouse space and eleven leases are for office space.

In November, 2017, the Company leased an additional 3,005 square feet to an existing tenant for warehouse space at its Jowein building in Brooklyn, New York.

In May 2018, the Company extended a lease with an existing tenant who occupies 3,300 square feet of office space at the Company’s Jowein building in Brooklyn, New York for an additional five years expiring on June 30, 2023.

4


Table of Contents


It is the intention of the Company to negotiate the renewals of the expiring leases as they come due, providing the tenants maintain adequate finances.


Occupancy Lease Expiration       Rent
Year       Year       Number of       Area Annual        Percentage of
Ended Rate Ended Leases Sq. Ft. Rent Gross Annual Rent
         7/31/2014 70.49 % 7/31/2019       5       30,360 $ 825,173       4.275      
7/31/2015 68.83 % 7/31/2020 1 30,816 771,788 3.999
7/31/2016 70.70 % 7/31/2021 1 500 45,872 .238
7/31/2017 77.53 % 7/31/2022 2 16,069 525,326 2.722
7/31/2018 84.22 % 7/31/2023 2 16,760 515,513 2.671
7/31/2025 1 23,004 583,015 3.021
7/31/2028 1 5,000 150,439 .779
7/31/2036 1 11,505 34,551 .179
7/31/2037 1 17,425 567,234 2.939
7/31/2059 1 19,437 115,945 .601
16 170,876 $ 4,134,856 21.424

As of July 31, 2018 the federal tax basis is $7,550,837 with accumulated depreciation of $4,325,729 for a net carrying value of $3,225,108. The lives taken for depreciation vary between 15-40 years and the methods used are straight-line and declining balance.

The real estate taxes for this property are $632,708 per year and the rate used is averaged at $11.065 per $100 of assessed valuation.

        
3. Jamaica, New York—Jamaica Avenue at 169th Street
 

The building is owned and the land is leased from an affiliated company. The lease expires July 31, 2027. The property is currently leased to ten tenants: five are retail tenants and five occupy office space. Four tenants each occupy in excess of 10% of the rentable square footage: two retail stores occupy 15.86% and 17.66%, respectively; and two office tenants occupy 14.23% and 13.50%, respectively. Approximately 23,000 square feet of the building is available for lease. There are plans to renovate vacant space for office use upon the execution of future leases to tenants, although no assurances can be made as to when or if such leases will be entered into.

In September, 2017, an office tenant who occupied 2,000 square feet at the Company’s Jamaica, New York building vacated the space. The Company re-let the space in July 2018.

It is the intention of the Company to negotiate the renewals of the expiring leases as they come due, providing the tenants maintain adequate finances.


Occupancy   Lease Expiration   Rent
Year       Year       Number of       Area Annual Percentage of
Ended Rate Ended Leases Sq. Ft. Rent Gross Annual Rent
          7/31/2014 75.41 % 7/31/2019       1       47,100 $ 980,256             5.079      
7/31/2015 80.50 % 7/31/2020 1 42,250 1,104,498 5.723
7/31/2016 80.16 % 7/31/2021 2 472 70,800 .367
7/31/2017 80.50 % 7/31/2022 1 22,045 531,338 2.753
7/31/2018 79.99 % 7/31/2023 2 40,109 1,000,816 5.185
7/31/2024 1 28,634 622,116 3.223
7/31/2026 1 6,021 169,245 .877
7/31/2027 1 52,444 796,278 4.126
10 239,075 $ 5,275,347 27.333

5


Table of Contents

As of July 31, 2018 the federal tax basis is $13,778,919 with accumulated depreciation of $8,636,875 for a net carrying value of $5,142,044. The lives taken for depreciation vary between 15-40 years and the methods used are straight-line and declining balance.

The real estate taxes for this property are $558,055 per year and the rate used is averaged at $11.373 per $100 of assessed valuation.

          
4. Fishkill, New York—Route 9 at Interstate Highway 84
 

The Company owns the entire property. In October 2013, the Company leased 99,992 square feet to a retail tenant. Occupancy commenced in November 2013 and rent commenced in March 2014. This tenant planned to vacate the space, but in May 2017, an agreement was reached where they will continue occupancy. There are approximately 100,000 square feet of the building available for lease. There are plans to renovate vacant space upon the execution of future leases to tenants, although no assurances can be made as to when or if such leases will be entered into.


Occupancy       Lease Expiration Rent
Year       Year       Number of       Area Annual Percentage of
Ended Rate Ended

Leases

Sq. Ft. Rent Gross Annual Rent
         7/31/2014 29.62 % 7/31/2019       1       99,992 $ 299,000             1.549      
7/31/2015 47.39 %
7/31/2016 47.39 %
7/31/2017 47.39 %
7/31/2018 47.39 %

As of July 31, 2018 the federal tax basis is $11,812,241 with accumulated depreciation of $9,269,613 for a net carrying value of $2,542,628. The lives taken for depreciation vary between 15-40 years and the methods used are straight-line and declining balance.

The real estate taxes for this property are $144,763 per year and the rate used is averaged at $3.22 per $100 of assessed valuation.

          
5. Levittown, New York—Hempstead Turnpike
 

The Company owns the entire property. In October 2006, the Company entered into a lease agreement with a restaurant. The restaurant constructed a new 10,000 square foot building, which opened in May 2008. In October 2016, the restaurant extended its lease for an additional five years expiring May 3, 2023. Ownership of the building reverts to the Company at the conclusion of the leasing arrangement, currently May 3, 2023.


Occupancy       Lease Expiration       Rent
Year Year Number of Area Annual Percentage of
Ended       Rate Ended Leases Sq. Ft. Rent Gross Annual Rent
         7/31/2014 100.00 % 7/31/2023 Building 10,000 $ 398,950 2.067
7/31/2015 100.00 %       Land 75,800                  
7/31/2016 100.00 %       1       85,800
7/31/2017 100.00 %      
7/31/2018 100.00 %

The real estate taxes for this property are $162,935 per year and the rate used is averaged at $1,185.18 per $100 of assessed valuation.

           
6. Massapequa, New York—Sunrise Highway
 

The Company is the prime tenant of this leasehold. The lease expired May 14, 2009, and there was one renewal option for twenty-one years, which the Company exercised in April 2008. The leasehold is currently subleased to two tenants; one tenant who occupies 113,400 square feet of the property and the other tenant is a restaurant who occupies 20,000 square feet of the property. The sublease expires in May 2030, with no renewal options.

6


Table of Contents

In March 2018, the Company leased the 20,000 square feet of area available at its Massapequa, New York property to a restaurant until May 2030. Rent is anticipated to commence in late 2018.

        
         Occupancy Lease Expiration Rent
Year Year Number of Area Annual Percentage of
Ended       Rate       Ended       Leases       Sq. Ft.       Rent       Gross Annual Rent
7/31/2014 98.75 % 7/31/2030        2        133,400 $ 775,256         4.017        
7/31/2015 85.01 %
7/31/2016 85.01 %
7/31/2017 85.01 %
7/31/2018 90.63 %

The real estate taxes for this property are $276,039 per year and the rate used is averaged at $961.47 per $100 of assessed valuation.

The Company does not own this property. Improvements to the property, if any, are made by tenants.

 
7. Circleville, Ohio—Tarlton Road
        

The Company owns the entire property. The property is currently leased to two tenants. The tenants use these premises for warehouse and distribution facilities. One tenant’s lease agreement was executed for a five year period, with a right to cancel after three years, for 75,000 square feet to November 11, 2010 at which time the tenant occupied 30,000 square feet on a month to month basis. In October 2013, the tenant signed a lease agreement for a five year period to occupy 48,000 square feet and in May 2015 signed a modification of lease to occupy 72,000 square feet. In August 2016, this tenant signed a further modification of lease to occupy 84,000 square feet. The other tenant’s lease agreement was executed in May 2015, for a five-year period effective June 1, 2015, and allows the tenant to have permanent space of 108,000 square feet.

In April 2018, the Company extended a lease with an existing tenant who occupies 84,000 square feet for warehouse space at the Company’s Circleville, Ohio building for an additional three years expiring on October 31, 2021.


Occupancy Lease Expiration Rent
         Year Year Number of Area Annual Percentage of
Ended       Rate       Ended       Leases       Sq. Ft.       Rent       Gross Annual Rent
7/31/2014 78.36 % 7/31/2020        1        108,000 $ 258,700       1.340      
7/31/2015 91.54 % 7/31/2022 1 84,000 221,951 1.150
7/31/2016 96.72 % 2 192,000 $ 480,651 2.490
7/31/2017 99.04 %
7/31/2018 99.04 %

As of July 31, 2018 the federal tax basis is $4,466,746 with accumulated depreciation of $3,477,250 for a net carrying value of $989,496. The lives taken for depreciation vary between 15-40 years and the methods used are straight-line and declining balance.

The real estate taxes for this property are $35,538 per year and the rate used is averaged at $4.948 per $100 of assessed valuation.

 
8. Brooklyn, New York—Livingston Street
                 

The City of New York through its Economic Development Administration constructed a municipal garage at Livingston Street opposite the Company’s Brooklyn properties. The Company has a long-term lease with the City of New York and another landlord which expired in 2013. The lease has two renewal options, the last of which expires in 2073. The Company exercised one of the renewal options in July 2012 for an additional thirty year period, expiring in 2043, under which:

 
(1)

Such garage provided truck bays and passage facilities through a tunnel, both for the exclusive use of the Company, to the structure referred to in (2) below. The truck bays, passage facilities and tunnel, totaling approximately 17,000 square feet, are included in the lease from the City of New York and another landlord referred to in the preceding paragraph.

7


Table of Contents

On June 16, 2014, the Company entered into a Second Amendment of Lease (the “Amendment”) with 33 Bond St. LLC (“Bond”), its landlord, for certain truck bays and approximately 1,000 square feet located at the cellar level within a garage at Livingston and Bond Street (“Premises”). Pursuant to the Amendment, (1) a lease option for the Premises was exercised extending the lease until December 8, 2043, (2) the Company, simultaneously with the execution of the Amendment, vacated the Premises so that Bond may demolish the building in which the Premises is located in order to develop and construct a new building at the location, and (3) Bond agreed to redeliver to the Company possession of the reconfigured Premises after construction.

As consideration under the Amendment, Bond agreed to pay the Company a total of $3,500,000. Upon execution of the Amendment, the Company recorded $3,500,000 to deferred revenue to be amortized to revenue to temporally vacate the premises over the expected vacate period of 36 months. Bond tendered $2,250,000 simultaneously with the execution of the Amendment, and the balance due of $1,250,000 on June 16, 2015 had been received by the Company. The Company re-occupied the premises in October 2017.

In connection with the Amendment, the parties also agreed to settle a pending lawsuit in the Supreme Court of the State of New York, Kings County, Index No. 50796/13 (the “Action”), in which the Company sought, among other things, a declaratory judgment that it validly renewed the lease for the Premises, and Bond sought, among other things, a declaratory judgment that the lease expired by its terms on December 8, 2013. Pursuant to a stipulation of settlement, filed on June 16, 2014, the Action, including all claims and counterclaims, has been discontinued with prejudice, without costs or attorneys’ fees to any party as against the other. The stipulation of settlement also contains general releases by both parties of all claims.

                 
(2) The Company constructed a building of six stories and basement on a 20 x 75-foot plot (acquired and made available by the City of New York and leased to the Company for a term expiring in 2013 with renewal options, the last of which expires in 2073). The Company in July 2012, exercised the first renewal option for thirty years, ending in 2043. The plot is adjacent to and connected with the Company’s Brooklyn properties.
 

In the opinion of management, all of the Company’s properties are adequately covered by insurance.

See Note 10 to the Consolidated Financial Statements contained in the 2018 Annual Report to Shareholders, which information is incorporated herein by reference, for information concerning the tenants, the rental income from which equals 10% or more of the Company’s rental income.

ITEM 3. LEGAL PROCEEDINGS.

Due to defective workmanship and breach of contract, the Company continues to pursue damages and return in full of a $376,467 deposit paid a contractor when construction commenced to replace a roof and various other work on the Fishkill, New York building. Both the contractor and subcontractors have claimed the Company tortuously interfered with the construction contracts arguing for fees and costs which approximate $700,000. While the Company strongly disputes the claims, it is possible that the court may rule against the Company and may assess damages in amounts up to approximately $700,000. It is also possible that the court may rule in favor of the Company and that no damages would be awarded against the Company and the Company could obtain an order for the return of all or a portion of amounts previously paid. A charge to real estate operating expenses in the amount of $279,213 was recorded for the fiscal year ended July 31, 2016. Following initial court decisions, another $141,132 was charged to operating expenses on October 31, 2016 and this amount was ordered by the Court to be paid, plus interest, in a judgement dated September 14, 2017. The testimony phase of the trial has been completed and the parties await further decisions and orders of the court.

There are various other lawsuits and claims pending against the Company. It is the opinion of management that the resolution of these matters will not have a material adverse effect on the Company’s Consolidated Financial Statements.

If the Company sells, transfers, disposes of or demolishes 25 Elm Place, Brooklyn, New York, then the Company may be liable to create a condominium unit for the loading dock. The necessity of creating the condominium unit and the cost of such condominium unit cannot be determined at this time.

ITEM 4. MINE SAFETY DISCLOSURES.

None

8


Table of Contents

PART II

ITEM 5.  MARKET FOR REGISTRANT’S COMMON EQUITY, RELATED STOCKHOLDER MATTERS AND ISSUER PURCHASES OF EQUITY SECURITIES.

COMMON STOCK AND DIVIDEND INFORMATION

Effective November 8, 1999, the Company’s common stock commenced trading on The Nasdaq Capital Market tier of The Nasdaq Stock Market under the Symbol: “Mays”. Such shares were previously traded on The Nasdaq National Market. Effective August 1, 2006, NASDAQ became operational as an exchange in NASDAQ-Listed Securities. It is now known as The NASDAQ Stock Market LLC.

The following is the sales price range per share of J. W. Mays, Inc. common stock during the fiscal years ended July 31, 2018 and 2017:

Sales Price
Three Months Ended       High       Low
October 31, 2017 $ 47.00 $ 35.30
January 31, 2018 42.45 35.50
April 30, 2018 38.00 37.25
July 31, 2018 43.50 37.70
 
October 31, 2016 $ 48.50 $ 42.50
January 31, 2017 46.50 41.50
April 30, 2017 43.00 38.00
July 31, 2017 41.50 33.55

The quotations were obtained for the respective periods from the National Association of Securities Dealers, Inc. There were no dividends declared in either of the two fiscal years.

On September 1, 2018, the Company had approximately 800 shareholders of record.

RECENT SALES OF UNREGISTERED SECURITIES

During the year ended July 31, 2018 we did not sell any unregistered securities.

RECENT PURCHASES OF EQUITY SECURITIES

During the year ended July 31, 2018 we did not repurchase any of our outstanding equity securities.

9


Table of Contents

PERFORMANCE GRAPH

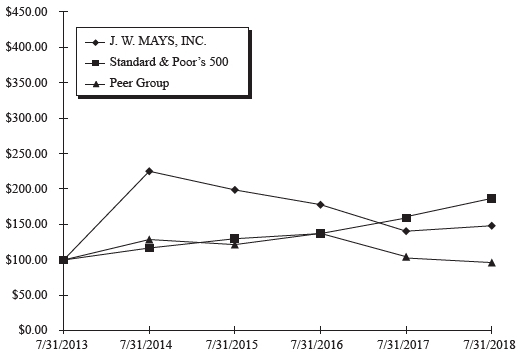
The following graph sets forth a five-year comparison of cumulative total shareholder return for the Company, the Standard & Poor’s 500 Stock-Index (“S&P 500”), and a Peer Group. The graph assumes the investment of $100 at the close of trading July 31, 2013 in the common stock of the Company, the S&P 500 and the Peer Group, and the reinvestment of all dividends, although the Company did not pay a dividend during this five-year period.

Comparison of Five-Year Cumulative Total Return*
J. W. MAYS, INC., Standard & Poor’s 500 And Peer Group
(Performance Results Through 7/31/18)


      7/31/2013       7/31/2014       7/31/2015       7/31/2016       7/31/2017       7/31/2018
J. W. MAYS, INC. $ 100.00 $ 225.44 $ 199.06 $ 178.24 $ 140.71 $ 148.41
Standard & Poor’s 500 $ 100.00 $ 116.94 $ 130.05 $ 137.35 $ 159.38 $ 185.27
Peer Group $ 100.00 $ 128.92 $ 121.74 $ 137.65 $ 104.64 $98.17
____________________

Assumes $100 invested at the close of trading 7/31/13 in J. W. MAYS, INC. common stock, Standard & Poor’s 500 and Peer Group.

*Cumulative total return assumes reinvestment of dividends.

Source: Value Line Publishing LLC

Factual material is obtained from sources believed to be reliable, but the publisher is not responsible for any errors or omisions contained herein.

The Performance Graph shall not be deemed incorporated by reference by any general statement of incorporation by reference in any filing made under the Securities Act of 1933, as amended, or the Securities Exchange Act of 1934, as amended, and shall not otherwise be deemed filed under such Acts.

10


Table of Contents

ITEM 6. SELECTED FINANCIAL DATA.

The information appearing under the heading “Summary of Selected Financial Data” on page 2 of the Registrant’s 2018 Annual Report to Shareholders is incorporated herein by reference.

ITEM 7.  MANAGEMENT’S DISCUSSION AND ANALYSIS OF FINANCIAL CONDITION AND RESULTS OF OPERATIONS.

The information appearing under the heading “Management’s Discussion and Analysis of Financial Condition and Results of Operations” on pages 27-31 of the Registrant’s 2018 Annual Report to Shareholders is incorporated herein by reference.

ITEM 7A. QUANTITATIVE AND QUALITATIVE DISCLOSURES ABOUT MARKET RISK.

The Company uses fixed-rate debt to finance its capital requirements. These transactions do not expose the Company to market risk related to changes in interest rates. The Company does not use derivative financial instruments. At July 31, 2018, the Company had fixed-rate debt of $5,467,111.

ITEM 8. FINANCIAL STATEMENTS AND SUPPLEMENTARY DATA.

The Registrant’s Consolidated Financial Statements, together with the report of D’Arcangelo & Co., LLP, independent registered public accounting firm, dated October 4, 2018, appearing on pages 4 through 25 of the Registrant’s 2018 Annual Report to Shareholders is incorporated herein by reference. With the exception of the aforementioned information and the information incorporated by reference in Items 2, 6, and 7 hereof, the 2018 Annual Report to Shareholders is not to be deemed filed as part of this Form 10-K Annual Report.

ITEM 9.  CHANGES IN AND DISAGREEMENTS WITH ACCOUNTANTS ON ACCOUNTING AND FINANCIAL DISCLOSURE.

There are no disagreements between the Company and its accountants relating to accounting or financial disclosures.

ITEM 9A. CONTROLS AND PROCEDURES.

(A) EVALUATION OF DISCLOSURE CONTROLS AND PROCEDURES.

The Company’s management reviewed the Company’s internal controls and procedures and the effectiveness of these controls. As of July 31, 2018, the Company carried out an evaluation, under the supervision of, and with the participation of the Company’s management, including its Chief Executive Officer and Chief Financial Officer, of the effectiveness of the design and operation of the Company’s disclosure controls and procedures pursuant to Rules 13a-14(c) and 15d-14(c) of the Securities Exchange Act of 1934. Based upon that evaluation, the Chief Executive Officer and Chief Financial Officer concluded that the Company’s disclosure controls and procedures are effective in timely alerting them to material information relating to the Company required to be included in its periodic SEC filings.

(B) CHANGE TO INTERNAL CONTROLS OVER FINANCIAL REPORTING.

There was no change in the Company’s internal controls over financial reporting or in other factors during the Company’s last fiscal quarter that materially affected, or is reasonably likely to materially affect, the Company’s internal controls over financial reporting. There were no significant deficiencies or material weaknesses noted, and therefore there were no corrective actions taken.

11


Table of Contents

(C) MANAGEMENT’S ANNUAL REPORT ON INTERNAL CONTROL OVER FINANCIAL REPORTING.

The Company’s management is responsible for establishing and maintaining adequate internal control over financial reporting as such term is defined in Rule 13(a)-15(f). Our internal control system has been designed to provide reasonable assurance to the Company’s management and its Board of Directors regarding the preparation and fair presentation of published financial statements. All internal control systems, no matter how well designed, have inherent limitations. Even those systems that have been determined to be effective can provide only reasonable assurance with respect to financial statement preparation and presentation. The Company’s management assessed the effectiveness of our internal control over financial reporting as of July 31, 2018. In making this assessment, the Company’s management used the criteria set forth by the Committee of Sponsoring Organizations of the Treadway Commission in Internal Control – Integrated Framework published in 2013. Based on the Company’s assessments, we believe that, as of July 31, 2018, its internal control over financial reporting is effective based on these criteria.

This Form 10-K Annual Report does not include an attestation report of our independent registered public accounting firm regarding internal controls over financial reporting. Management’s report was not subject to attestation by our independent registered public accounting firm pursuant to the permanent exemption for smaller reporting company filers from the internal control audit requirement of Section 404(b) of the Sarbanes-Oxley Act of 2002.

ITEM 9B. OTHER INFORMATION.

Reports on Form 8-K - One report on Form 8-K was filed by the Company during the three months ended July 31, 2018.

Item reported - The Company reported its financial results for the three and nine months ended April 30, 2018.

Date of report filed - June 7, 2018.

PART III

ITEM 10. DIRECTORS, EXECUTIVE OFFICERS AND CORPORATE GOVERNANCE.

The information relating to directors of the Company is contained in the Definitive Proxy Statement for the 2018 Annual Meeting of Shareholders and such information is incorporated herein by reference.

Executive Officers of the Registrant

The following information is furnished with respect to each Executive Officer of the Registrant (each of whose position is reviewed annually but each of whom has a three-year employment agreement, effective August 1, 2011 and renewed August 1, 2014 and August 1, 2017).

First Became
Business Experience During Such Officer
Name       Age       the Past Five Years       or Director
Lloyd J. Shulman 76 President November, 1978
Co-Chairman of the Board
      and President June, 1995
Chairman of the Board
      and President November, 1996
Director November, 1977
Mark S. Greenblatt 64 Vice President August, 2000
Treasurer August, 2003
Director August, 2003
Assistant Treasurer November, 1987
Ward N. Lyke, Jr. 67 Vice President February, 1984
Assistant Treasurer August, 2003
George Silva 68 Vice President March, 1995

All of the above mentioned officers have been appointed as such by the directors and have been employed as Executive Officers of the Company during the past five years.

12


Table of Contents

ITEM 11. COMPENSATION.

The information required by this item appears under the heading “Compensation” in the Definitive Proxy Statement for the 2018 Annual Meeting of Shareholders and such information is incorporated herein by reference.

ITEM 12.  SECURITY OWNERSHIP OF CERTAIN BENEFICIAL OWNERS AND MANAGEMENT AND RELATED STOCKHOLDER MATTERS.

The information required by this item appears under the headings “Security Ownership of Certain Beneficial Owners and Management” and “Information Concerning Nominees for Election as Directors” in the Definitive Proxy Statement for the 2018 Annual Meeting of Shareholders and such information is incorporated herein by reference.

ITEM 13.  CERTAIN RELATIONSHIPS AND RELATED TRANSACTIONS, AND DIRECTOR INDEPENDENCE.

The information required by this item appears under the headings “Compensation” “Certain Transactions,” and “Board Interlocks and Insider Participation” in the Definitive Proxy Statement for the 2018 Annual Meeting of Shareholders and such information is incorporated herein by reference.

ITEM 14. PRINCIPAL ACCOUNTING FEES AND SERVICES.

The following table sets forth the fees paid by the Company (on a cash basis) to its independent registered public accounting firm, D’Arcangelo & Co., LLP, for the fiscal years 2018 and 2017.

Fiscal Year Fiscal Year
      2018       2017
Audit fees   $ 168,348     $ 214,000  
Tax fees 60,050 21,653
Other fees 9,000 4,325
Total $ 237,398 $ 239,978

Audit Fees for fiscal year 2018 and fiscal year 2017 were for professional services rendered for the audits of the consolidated financial statements of the Company, interim quarterly reviews of Form 10-Q information and assistance with the review of documents filed with the U. S. Securities and Exchange Commission.

Tax Fees and Other Fees for fiscal year 2018 and fiscal year 2017 were for services related to tax compliance and preparation of federal, state and local corporate tax returns and audit of real estate tax matters.

The officers of the Company consult with, and receive the approval of, the Audit Committee before engaging accountants for any services.

PART IV

ITEM 15. EXHIBITS AND FINANCIAL STATEMENT SCHEDULES.

The following documents are filed as part of this report:

      1.        The Consolidated Financial Statements and report of D’Arcangelo & Co., LLP, independent registered public accounting firm, dated October 4, 2018, set forth on pages 4 through 25 of the Company’s 2018 Annual Report to Shareholders.
 
2. See accompanying Index to the Company’s Consolidated Financial Statements and Schedules.

13


Table of Contents


3.


Exhibits:

 
(2) Plan of acquisition, reorganization, arrangement, liquidation or succession—not applicable.
 
(3) Articles of incorporation and by-laws:
 
(i) Certificate of Incorporation and certificate of amendment.
  
(ii) By-laws, as amended — incorporated by reference.
 
(4) Instruments defining the rights of security holders, including indentures—see Exhibit (3) above.
 
(9) Voting trust agreement—not applicable.
 
(10)        Material contracts:
 
(i) The J.W. Mays, Inc. Retirement Plan and Trust, Summary Plan Description, effective August 1, 2015.
 
(ii)       Employment Agreements with Messrs. Shulman, Greenblatt, Lyke and Silva, each dated August 1, 2017 — incorporated by reference.
 
(11) Statement re computation of per share earnings—not applicable.
 
(12) Statement re computation of ratios—not applicable.
 
(13) Annual Report to security holders.
 
(14) Code of ethics—not applicable.
 
(16) Letter re change in certifying auditors—not applicable.
 
(18) Letter re change in accounting principles—not applicable.
 
(21) Subsidiaries of the registrant.
 
(22) Published report re matters submitted to vote of security holders—not applicable.
 
(24) Power of attorney—none.
 
(28) Information from reports furnished to state insurance regulatory authorities—not applicable.
 
(31) Certifications pursuant to Section 302 of the Sarbanes-Oxley Act of 2002.
 
31.1—Chief Executive Officer
  
31.2—Chief Financial Officer
 
(32) Certification pursuant to Section 906 of the Sarbanes-Oxley Act of 2002; 18 U.S.C. Sec. 1350.

14


Table of Contents

SIGNATURES

Pursuant to the requirements of Section 13 or 15(d) of the Securities Exchange Act of 1934, the Registrant has duly caused this report to be signed on its behalf by the undersigned, thereunto duly authorized.

      J.W. MAYS, INC.  
(Registrant)
 
October 4, 2018 By:       LLOYD J. SHULMAN
Lloyd J. Shulman
Chairman of the Board
Principal Executive Officer
President
Principal Operating Officer
 
October 4, 2018 By: MARK S. GREENBLATT
Mark S. Greenblatt
Vice President and Treasurer
Principal Financial Officer
 
October 4, 2018 By: WARD N. LYKE, JR.
Ward N. Lyke, Jr.
Vice President
and Assistant Treasurer

Pursuant to the requirements of the Securities Exchange Act of 1934, this report has been signed below by the following persons on behalf of the Registrant in the capacities and on the date indicated.

Signature       Title       Date
         
LLOYD J. SHULMAN Chairman of the Board, Chief Executive October 4, 2018
Lloyd J. Shulman Officer, President, Chief Operating
  Officer and Director    
 
MARK S. GREENBLATT Vice President, Treasurer and Director October 4, 2018
Mark S. Greenblatt
 
ROBERT L. ECKER Director October 4, 2018
Robert L. Ecker
 
STEVEN GURNEY-GOLDMAN Director October 4, 2018
Steven Gurney-Goldman
 
JOHN J. PEARL Director October 4, 2018
John J. Pearl
 
DEAN L. RYDER Director October 4, 2018
Dean L. Ryder
 
JACK SCHWARTZ Director October 4, 2018
Jack Schwartz

15


Table of Contents

INDEX TO REGISTRANT’S FINANCIAL STATEMENTS AND SCHEDULES

Reference is made to the following sections of the Registrant’s Annual Report to Shareholders for the fiscal year ended July 31, 2018, which are incorporated herein by reference:

Report of Independent Registered Public Accounting Firm (page 25)

Consolidated Balance Sheets (pages 4 and 5)

Consolidated Statements of Income and Retained Earnings (page 6)

Consolidated Statements of Comprehensive Income (page 7)

Consolidated Statements of Cash Flows (page 8)

Notes to Consolidated Financial Statements (pages 9-21)

Financial Statement Schedules

Valuation and Qualifying Accounts (page 22)

Real Estate and Accumulated Depreciation (page 23)

Report of Management (page 24)

All other schedules for which provision is made in the applicable regulations of the U. S. Securities and Exchange Commission are not required under the related instructions or are inapplicable and, accordingly, are omitted.

The separate financial statements and schedules of J.W. Mays, Inc. (not consolidated) are omitted because the Company is primarily an operating company and its subsidiaries are wholly-owned.

____________________

16


Table of Contents

EXHIBIT INDEX TO FORM 10-K

      (2)       Plan of acquisition, reorganization, arrangement, liquidation or succession—not applicable
   
  (3) (i)       Certificate of incorporation and certificate of amendment
   
  (ii) By-laws, as amended — incorporated by reference
   
  (4) Instruments defining the rights of security holders, including indentures—see Exhibit (3) above
   
  (9) Voting trust agreement—not applicable
   
  (10) Material contracts:
   
  (i) Retirement Plan and Trust, Summary Plan Description
   
  (ii) Employment agreements — incorporated by reference
   
  (11) Statement re computation of per share earnings—not applicable
   
  (12)   Statement re computation of ratios—not applicable
   
  (13)   Annual Report to security holders
   
  (14)   Code of ethics—not applicable
   
  (16)   Letter re change in certifying auditors—not applicable
   
  (18)   Letter re change in accounting principles—not applicable
   
  (21)   Subsidiaries of the registrant
   
  (22)   Published report re matters submitted to vote of security holders—not applicable
   
  (24)   Power of attorney—none
   
  (28)   Information from reports furnished to state insurance regulatory authorities—not applicable
   
  (31)   Certifications Pursuant to Section 302 of the Sarbanes-Oxley Act—1 and 2
   
  31.1—Chief Executive Officer
   
  31.2—Chief Financial Officer
   
  (32)   Certification Pursuant to Section 906 of the Sarbanes-Oxley Act
 
EX-101.INS XBRL INSTANCE DOCUMENT
 
EX-101.SCH XBRL TAXONOMY EXTENSION SCHEMA
 
EX-101.PRE XBRL TAXONOMY EXTENSION PRESENTATION LINKBASE
 
EX-101.LAB XBRL TAXONOMY EXTENSION LABEL LINKBASE
 
EX-101.CAL XBRL TAXONOMY EXTENSION CALCULATION LINKBASE
 
EX-101.DEF XBRL TAXONOMY EXTENSION DEFINITION LINKBASE

17


EXHIBIT 13


J.W. MAYS, INC.


Annual Report

2018

Year Ended July 31, 2018


J.W. MAYS, INC.

Contents       Page No.
Summary of Selected Financial Data 2
The Company 2
Message to Shareholders 3
Consolidated Balance Sheets 4-5
Consolidated Statements of Income and Retained Earnings 6
Consolidated Statements of Comprehensive Income 7
Consolidated Statements of Cash Flows 8
Notes to Consolidated Financial Statements 9-21
Valuation and Qualifying Accounts (Schedule II) 22
Real Estate and Accumulated Depreciation (Schedule III) 23
Report of Management 24
Report of Independent Registered Public Accounting Firm 25
Five Year Summary of Consolidated Operations 26
Management’s Discussion and Analysis of Financial Condition and Results of Operations 27-31
Controls and Procedures 32
Quarterly Financial Information (Unaudited) 33
Common Stock and Dividend Information 33
Officers and Directors 34

Executive Offices
9 Bond Street, Brooklyn, N.Y. 11201-5805

Transfer Agent and Registrar
American Stock Transfer & Trust Company, LLC
6201 15th Avenue
Brooklyn, N.Y. 11219

Special Counsel
Holland & Knight LLP
31 West 52nd Street
New York, N.Y. 10019

Independent Registered Public Accounting Firm
D’Arcangelo & Co., LLP
510 Haight Avenue
Poughkeepsie, NY 12603

Annual Meeting
The Annual Meeting of Shareholders will be
held on Tuesday, November 20, 2018, at
10:00 A.M., Eastern Standard time, at J.W. MAYS, INC.,
9 Bond Street, Brooklyn, New York.


J.W. MAYS, INC.

SUMMARY OF SELECTED FINANCIAL DATA
(dollars in thousands except per share data)

2018 2017 2016 2015 2014
Rental Income       $ 19,301       $ 18,518       $ 17,416       $ 17,732       $ 16,935
Recovery of Real Estate Taxes 11 11
Revenue to Temporarily Vacate Lease 1,021 1,167 1,167 146
Total Revenues 19,301 19,550 18,583 18,910 17,081
Net Income 2,974 1,926 1,518 2,209 739
Real Estate-Net 50,679 49,368 48,928 48,060 47,320
Total Assets 66,562 64,849 63,545 62,802 59,573
Long-Term Debt:
Mortgages and Term Loan Payable* 5,264 5,410 5,550 5,683 5,141
Note Payable 1,000 1,000
Deferred Revenue 1,021 2,188
Deferred Income Taxes 4,506 5,637 4,617 3,855 2,656
Other 1,242 1,020 989 815 736
Total Long-Term Debt 11,012 12,067 11,156 12,374 11,721
Shareholders’ Equity $ 53,093 $ 50,000 $ 47,971 $ 46,385 $ 44,109
 
Income per Common Share $ 1.48 $ .96 $ .75 $ 1.10 $ .37
Cash Dividends Declared per Share $ $ $ $ $

Average common shares outstanding for fiscal years 2014 through 2018: 2,015,780.

* Includes reclassifications for comparative purposes.

THE COMPANY

J.W. Mays, Inc. was founded in 1924 and incorporated under the laws of the State of New York on July 6, 1927.

The Company operates a number of commercial real estate properties located in Brooklyn and Jamaica in New York City; in Levittown and Massapequa, Long Island, New York; in Fishkill, Dutchess County, New York; and in Circleville, Ohio. The major portions of these properties are owned and the balance is leased. A substantial percentage of these properties are leased to tenants while the remainder is available for lease.

More comprehensive information concerning the Company appears in its Form 10-K Annual Report for the fiscal year ended July 31, 2018.

2


J.W. MAYS, INC.

TO OUR SHAREHOLDERS:

The financial condition of our Company continued to be strong during the fiscal year ended July 31, 2018 with profits earned during this period.

In fiscal 2018, our revenues from operations were $19,300,882 compared to $19,549,387 in the 2017 fiscal year. Net income for fiscal 2018 was $2,974,141, or $1.48 per share. This compares to net income of $1,925,539, or $.96 per share for fiscal 2017.

The Company was able to extend four leases with existing tenants: two at its Nine Bond Street building in Brooklyn, New York, one at its Jowein building in Brooklyn, New York, and one at its Circleville, Ohio property. The Company was also able to sign two leases with tenants at its Nine Bond Street, Brooklyn, New York building which replaced the tenant that vacated the Premises in July 2017, and a lease with a tenant for the balance of the Massapequa property. These new tenants, lease extensions, and increased rentals from existing tenants should help enable the Company to maintain consistent revenue growth from operations in the future.

Our emphasis on pursuing and obtaining government agencies, health care providers and prospective corporate and retail tenants has helped us to have strong rental income and net income and, to a great extent, we have been able to retain these tenants over a long period of time.

I believe our Company is well-positioned to continue its positive operational performance. I specifically want to thank the Mays’ personnel and our Board colleagues for their ongoing commitment and support, our shareholders for their continuing belief in our Company and its future and our tenants for their continuing loyalty to our Company.


Lloyd J. Shulman
Chairman, President and Chief Executive Officer

October 4, 2018

3


J.W. MAYS, INC.

CONSOLIDATED BALANCE SHEETS
July 31, 2018 and 2017

Assets       2018       2017
Property and Equipment-at cost (Notes 1, 3, 4, 14 and 15):
Buildings and improvements $ 82,728,826 $ 80,825,601
Improvements to leased property 1,478,012 1,478,012
Fixtures and equipment 144,545 144,545
Land 6,067,805 6,067,805
Other 205,619 193,015
Construction in progress 1,786,980 644,809
92,411,787 89,353,787
Less accumulated depreciation 41,618,803 39,868,698
Property and equipment-net 50,792,984 49,485,089
 
Current Assets:
Cash and cash equivalents (Notes 9 and 10) 5,255,073 5,381,195
Receivables (Notes 1, 6 and 10) 252,304 164,716
Income taxes refundable 8,792 6,891
Restricted cash 100,789 15,905
Prepaid expenses 1,951,132 1,675,019
Total current assets 7,568,090 7,243,726
 
Other Assets:
Deferred charges (Notes 1 and 11) 3,228,162 3,465,062
Less accumulated amortization (Notes 1 and 11) 1,369,445 1,384,142
Net 1,858,717 2,080,920
Restricted cash 1,523,761 1,279,829
Unbilled receivables (Notes 1, 4, 6 and 10) 1,677,093 1,943,648
Marketable securities (Notes 1, 2, 10 and 13) 3,141,828 2,815,727
Total other assets 8,201,399 8,120,124
 
TOTAL ASSETS $ 66,562,473 $ 64,848,939

See Notes to Consolidated Financial Statements.

4


Liabilities and Shareholders’ Equity       2018       2017
Long-Term Liabilities:
Mortgage payable, net (Notes 3 and 10) $ 5,264,285 $ 5,409,908
Security deposits payable (Note 10) 1,242,382 1,020,292
Deferred income taxes (Notes 1 and 4) 4,506,000 5,637,000
Total long-term liabilities 11,012,667 12,067,200
 
Current Liabilities:
Accounts payable 74,205 79,103
Payroll and other accrued liabilities (Notes 1, 5 and 7) 2,104,359 2,515,616
Other taxes payable 8,240 8,135
Current portion of mortgage payable (Notes 3 and 10) 168,501 162,569
Current portion of security deposits payable (Note 10) 101,289 15,905
 
Total current liabilities 2,456,594 2,781,328
 
Total liabilities 13,469,261 14,848,528
 
Shareholders’ Equity:
Common stock, par value $1 each share (shares-5,000,000 authorized; 2,178,297 issued) 2,178,297 2,178,297
Additional paid in capital 3,346,245 3,346,245
Unrealized gain on available-for-sale securities - net of deferred taxes of $313,000 at July 31, 2018 and $190,000 at July 31, 2017 (Notes 1, 4, 10 and 13) 487,136 368,476
Retained earnings 48,369,386 45,395,245
54,381,064 51,288,263
Less common stock held in treasury, at cost - 162,517 shares at July 31, 2018 and July 31, 2017 (Note 12) 1,287,852 1,287,852
Total shareholders’ equity 53,093,212 50,000,411
 
Commitments (Notes 5 and 6) and Contingencies (Notes 8 and 15)
 
TOTAL LIABILITIES AND SHAREHOLDERS’ EQUITY $ 66,562,473 $ 64,848,939

See Notes to Consolidated Financial Statements.

5


J.W. MAYS, INC.

CONSOLIDATED STATEMENTS OF INCOME AND RETAINED EARNINGS

Years Ended July 31,
2018 2017 2016
Revenues                              
Rental income (Notes 1 and 6) $ 19,300,882 $ 18,517,602 $ 17,416,187
Recovery of real estate taxes 10,952
Revenue to temporarily vacate lease (Note 14) 1,020,833 1,166,667
Total revenues 19,300,882 19,549,387 18,582,854
Expenses
Real estate operating expenses (Note 5) 11,074,396 10,212,761 10,080,913
Administrative and general expenses 4,598,144 4,616,086 4,333,589
Depreciation (Note 1) 1,775,690 1,682,690 1,635,660
(Gain) on disposition of property and equipment (500 )
Total expenses 17,448,230 16,511,537 16,049,662
Income from operations before investment income, interest expense and income taxes 1,852,652 3,037,850 2,533,192
Investment income and interest expense:
Investment income (Notes 1 and 2) 110,963 94,627 25,949
Interest expense (Notes 3 and 9) (233,474 ) (225,938 ) (245,381 )
(122,511 ) (131,311 ) (219,432 )
Income from operations before income taxes 1,730,141 2,906,539 2,313,760
Income taxes provided (benefit) (Notes 1 and 4) (1,244,000 ) 981,000 796,000
Net income 2,974,141 1,925,539 1,517,760
Retained earnings, beginning of year 45,395,245 43,469,706 41,951,946
Retained earnings, end of year $ 48,369,386 $ 45,395,245 $ 43,469,706
Income per common share (Note 1) $ 1.48 $ 0.96 $ 0.75
Dividends per share $ $ $
Average common shares outstanding (Note 1) 2,015,780 2,015,780 2,015,780

See Notes to Consolidated Financial Statements.

6


J.W. MAYS, INC.

CONSOLIDATED STATEMENTS OF COMPREHENSIVE INCOME

Years Ended July 31,
2018 2017 2016
Net income       $ 2,974,141       $ 1,925,539       $ 1,517,760
Unrealized gain on available-for-sale securities:
Unrealized holding gains arising during the period net of taxes of $130,963, $68,000 and $43,000 for the fiscal years 2018, 2017 and 2016, respectively (Note 13) 134,117 130,776 85,515
Reclassification adjustment for net gains included in net income, net of taxes of $7,963 for the year ended July 31, 2018 and $14,000 for the year ended July 31, 2017 and $8,000 for the year ended July 31, 2016 (Note 13) (15,457 ) (26,841 ) (17,007 )
Unrealized gain on available-for-sale securities, net of taxes 118,660 103,935 68,508
Comprehensive income $ 3,092,801 $ 2,029,474 $ 1,586,268

See Notes to Consolidated Financial Statements.

7


J.W. MAYS, INC.

CONSOLIDATED STATEMENTS OF CASH FLOWS

Years Ended July 31,
2018 2017 2016
Cash Flows From Operating Activities:
Net income       $ 2,974,141       $ 1,925,539       $ 1,517,760
Adjustments to reconcile net income to net cash provided by operating activities:
Provision (benefit) for deferred income taxes (1,254,000 ) 966,000 727,000
Deferred revenue (1,020,833 ) (1,166,667 )
Realized (gain) loss on sale of marketable securities 805 (23,734 ) 36,999
(Gain) on disposition of property and equipment (500 )
Depreciation 1,775,690 1,682,690 1,635,660
Amortization of deferred charges 296,298 279,875 315,779
Deferred finance costs included in interest expense 22,877 22,877 22,872
Other assets - deferred charges (74,095 ) (417,031 ) (63,105 )
- unbilled receivables 266,555 198,896 390,400
- unbilled receivable - bad debts 80,302
- receivables 30,000
Changes in:
Receivables (87,588 ) 128,601 345,326
Prepaid expenses (276,113 ) (121,802 ) (75,221 )
Income taxes refundable (1,901 ) 10,113 678,261
Accounts payable (4,898 ) (1,240 ) 40,584
Payroll and other accrued liabilities (411,257 ) 270,849 (473,560 )
Other taxes payable 105 1,172 991
Net cash provided by operating activities 3,226,619 3,982,274 3,962,579
Cash Flows From Investing Activities:
Acquisition of property and equipment (3,083,585 ) (2,103,042 ) (2,508,505 )
Restricted cash (328,816 ) (136,396 ) 252,626
Marketable securities:
Receipts from sales 268,857 282,435 314,008
Payments for purchases (354,103 ) (854,288 ) (848,200 )
Net cash (used) by investing activities (3,497,647 ) (2,811,291 ) (2,790,071 )
Cash Flows From Financing Activities:
Increase - security deposits payable 307,474 138,232 121,377
Payments - mortgage and other debt payments (162,568 ) (1,156,846 ) (150,763 )
Net cash provided (used) by financing activities 144,906 (1,018,614 ) (29,386 )
Net increase (decrease) in cash and cash equivalents (126,122 ) 152,369 1,143,122
Cash and cash equivalents at beginning of year 5,381,195 5,228,826 4,085,704
Cash and cash equivalents at end of year $ 5,255,073 $ 5,381,195 $ 5,228,826

See Notes to Consolidated Financial Statements.

8


J.W. MAYS, INC.

NOTES TO CONSOLIDATED FINANCIAL STATEMENTS

1. SUMMARY OF SIGNIFICANT ACCOUNTING POLICIES:

Organization

J.W. Mays, Inc. (the “Company” or “Registrant”) with executive offices at 9 Bond Street, Brooklyn, New York 11201, operates a number of commercial real estate properties in New York and one building in Ohio. The Company’s business was founded in 1924 and incorporated under the laws of the State of New York on July 6, 1927.

Consolidation

The consolidated financial statements include the accounts of the Company, a New York corporation and its subsidiaries (J. W. M. Realty Corp. and Dutchess Mall Sewage Plant, Inc.), which are wholly-owned. Material intercompany items have been eliminated in consolidation.

Accounting Records and Use of Estimates

The accounting records are maintained in accordance with accounting principles generally accepted in the United States of America (“GAAP”). The preparation of the Company’s financial statements in accordance with GAAP requires management to make estimates and assumptions that affect the reported amounts of assets and liabilities at the date of the financial statements, the disclosure of contingent assets and liabilities, and the reported amounts of revenues and expenses during the reporting period. The estimates that we make include allowance for doubtful accounts, depreciation, income tax assets and liabilities, fair value of marketable securities, revenue recognition and accrued expenses. Estimates are based on historical experience where applicable or other assumptions that management believes are reasonable under the circumstances. Due to the inherent uncertainty involved in making estimates, actual results may differ from those estimates under different assumptions or conditions.

Restricted Cash

Restricted cash primarily consists of cash held in bank accounts for tenant security deposits and other amounts required under certain loan agreements.

Rental Income and Receivables

All of the real estate owned by the Company is held for leasing to tenants except for a small portion used for Company offices. Rent is recognized from tenants under executed leases no later than on an established date or on an earlier date if the tenant should commence conducting business. Unbilled receivables represent the excess of scheduled rental income recognized on a straight-line basis over rental income as it becomes receivable according to the provisions of the lease. Contingent rental income is recorded when earned and is not based on tenant revenue. The effect of lease modifications that result in rent relief or other credits to tenants, including any retroactive effects relating to prior periods, is recognized in the period when the lease modification is signed. At the time of the lease modification, we assess the realizability of any accrued but unpaid rent and amounts that had been recognized as revenue in prior periods. If the amounts are not determined to be realizable, the accrued but unpaid rent is written off. Accounts receivable are recognized in accordance with lease agreements at its net realizable value. Rental payments received in advance are deferred until earned.

Based upon its periodic assessment of the quality of the receivables, management uses its historical knowledge of the tenants and industry experience to determine whether a reserve or write-off is required. Management has determined that no allowance for uncollected receivables is considered necessary. The Company uses specific identification to write-off receivables to bad debt expense in the period when issues of collectability become known. Collectability issues include circumstances when a tenant indicates their intention to vacate the property without paying, or when tenant litigation or bankruptcy proceedings are not expected to result in full payment. Due to the early termination of a lease, the Company recorded a bad debt expense of $80,302 for the year ended July 31, 2017, which is included in administration and general expenses.

9


Property and Equipment

Property and equipment are stated at cost. Depreciation is calculated using the straight-line method and the declining-balance method. Amortization of improvements to leased property is calculated over the shorter of the life of the lease or the estimated useful life of the improvements. Lives used to determine depreciation and amortization are generally as follows:

Buildings and improvements 18-40 years
Improvements to leased property 3-40 years
Fixtures and equipment 7-12 years
Other 3-5 years

Maintenance, repairs, renewals and improvements of a non-permanent nature are charged to expense when incurred. Expenditures for additions and major renewals or improvements are capitalized along with the associated interest cost during construction. The cost of assets sold or retired and the accumulated depreciation or amortization thereon are eliminated from the respective accounts in the year of disposal, and the resulting gain or loss is credited or charged to income. Capitalized interest is recorded as part of the asset to which it relates and is amortized over the asset’s estimated useful life.

The Company reviews long-lived assets for impairment whenever circumstances and situations change such that there is an indication that the carrying amounts may not be recovered. At July 31, 2018 and 2017, there were no impairments of its property and equipment.

Deferred Charges

Deferred charges consist principally of costs incurred in connection with the leasing of property to tenants. Such costs are amortized over the related lease periods, ranging from 1 to 21 years, using the straight-line method. If a lease is terminated early, such costs are expensed.

Income Taxes

Deferred income taxes are provided for the temporary differences between the financial reporting basis and the tax basis of the Company’s assets and liabilities. Deferred tax assets result principally from the recording of certain accruals, reserves and net operating loss carry forwards which currently are not deductible for tax purposes. Deferred tax liabilities result principally from temporary differences in the recognition of unrealized gains and losses from certain investments and from the use, for tax purposes, of accelerated depreciation. Deferred tax assets and liabilities are offset for each jurisdiction and are presented net on the balance sheet.

The effect on deferred income taxes of a change in tax rates is recognized in income in the period that includes the enactment date. Actual income taxes could vary from these estimates due to future changes in income tax law or results from the final review of tax returns by federal, state or city tax authorities. Financial statement effects on tax positions are recognized in the period in which it is more likely than not that the position will be sustained upon examination, the position is effectively settled or when the statute of limitations to challenge the position has expired. Interest and penalties, if any, related to unrecognized tax benefits are recorded as interest expense and administrative and general expenses, respectively.

Income Per Share of Common Stock

Income per share has been computed by dividing net income for the year by the weighted average number of shares of common stock outstanding during the year, adjusted for the purchase of treasury stock. Shares used in computing income per share were 2,015,780 in fiscal years 2018, 2017 and 2016.

Marketable Securities

The Company categorizes marketable securities as either trading, available-for-sale or held-to-maturity at the time of purchase. Trading securities are carried at fair value with unrealized gains and losses included in income. Available-for-sale securities are carried at fair value measurements using quoted prices in active markets for identical assets or liabilities with unrealized gains and losses recorded as a separate component of shareholders’ equity. Held-to-maturity securities are carried at amortized cost. Dividends and interest income are accrued as earned. Realized gains and losses are determined on a specific identification basis. The Company reviews marketable securities for impairment whenever circumstances and situations change such that there is an indication that the carrying amounts may not be recovered. The Company did not classify any securities as trading or held to maturity during the three years ended July 31, 2018.

10


The Company follows GAAP which establishes a fair value hierarchy that prioritizes the valuation techniques and creates the following three broad levels, with Level 1 valuation being the highest priority:

Level 1 valuation inputs are quoted market prices in active markets for identical assets or liabilities that are accessible at the measurement date (e.g., equity securities traded on the New York Stock Exchange).

Level 2 valuation inputs are from other than quoted market prices included in Level 1 that are observable for the asset or liability, either directly or indirectly (e.g., quoted market prices of similar assets or liabilities in active markets, or quoted market prices for identical or similar assets or liabilities in markets that are not active).

Level 3 valuation inputs are unobservable (e.g., an entity’s own data) and should be used to measure fair value to the extent that observable inputs are not available.

Following is a description of the valuation methodologies used for assets measured at fair value on a recurring basis. There have been no changes in the methodologies used at July 31, 2018 and 2017.

Equity securities are valued at the closing price reported on the active market on which the individual securities are traded that the Company has access to.

Mutual funds are valued at the daily closing price as reported by the fund. Mutual funds held by the Company are open-end mutual funds that are registered with the U.S. Securities and Exchange Commission. These funds are required to publish their daily net asset value (“NAV”) and to transact at that price. The mutual funds held by the Company are deemed to be actively traded.

In accordance with the provisions of Fair Value Measurements, the following are the Company’s financial assets measured on a recurring basis presented at fair value.

Fair value measurements at reporting date using
Description    July 31, 2018    Level 1    Level 2    Level 3    July 31, 2017    Level 1    Level 2    Level 3
Assets:                                                           
Marketable securities - available-for-sale $ 3,141,828 $ 3,141,828 $ $– $ 2,815,727 $ 2,815,727      $      $

Recently issued accounting standards not yet adopted:

In May 2014, the Financial Accounting Standards Board (“FASB”), issued Accounting Standards Update (“ASU”) 2014-09 “Revenue from Contracts with Customers” (“ASU 2014-09”) establishing ASC Topic 606 Revenue from Contracts with Customers. ASU 2014-09 establishes a single comprehensive model for entities to use in accounting for revenue arising from contracts with customers and supersedes most of the existing revenue recognition guidance. ASU 2014-09 requires an entity to recognize revenue when it transfers promised goods or services to customers in an amount that reflects the consideration to which the entity expects to be entitled in exchange for those goods or services and also requires certain additional disclosures. ASU 2014-09 is effective for interim and annual reporting in fiscal years that begin after December 15, 2016. ASU 2015-14 extended the implementation date for fiscal years beginning after December 31, 2017.

Subsequent to the issuance of ASU 2014-09, the FASB issued ASU No. 2016-08, “Revenue from Contracts with Customers (Topic 606): Principal versus Agent Considerations (Reporting Revenue Gross versus Net)”, ASU No. 2016-10, “Revenue from Contracts with Customers (Topic 606): Identifying Performance Obligations and Licensing”, ASU No. 2016-12, “Revenue from Contracts with Customers (Topic 606): Narrow-Scope Improvements and Practical Expedients”, and ASU No. 2016-20, “Technical Corrections and Improvements to Topic 606, Revenue from Contracts with Customers.” The additional ASU’s clarified certain provisions of ASU 2014-09 in response to recommendations from the Transition Resource Group established by the FASB and have the same effective date and transition requirements as ASU 2014-09. We adopted these standards effective August 1, 2018 and expect the adoption will not have a significant impact on our consolidated financial statements.

In January 2016, the FASB issued ASU No. 2016-01 “Financial Instruments-Overall (Subtopic 825-10): Recognition and Measurement of Financial Assets and Financial Liabilities.” ASU 2016-01 amends certain aspects of recognition, measurement, presentation and disclosure of financial instruments, including the requirement to measure certain equity investments at fair value with changes in fair value recognized in net income. ASU No. 2016-01 is effective for interim and annual periods beginning after December 15, 2017. We adopted this standard effective August 1, 2018 and expect the adoption will not have a significant impact on our consolidated financial statements.

11


In February 2016, the FASB issued ASU 2016-02, “Leases.” ASU 2016-02 is intended to increase transparency and comparability among organizations of accounting for leasing arrangements. This guidance establishes a right-of-use model that requires a lessee to record a right-of-use asset and a lease liability on the balance sheet for all leases with terms longer than twelve months. Leases will be classified as either finance or operating, with classification affecting the pattern of expense recognition in the income statement. Lessor accounting remains similar to the current model, but updated to align with certain changes to the lessee model and the new revenue recognition standard (ASU 2014-09). ASU 2016-02 offers specific accounting guidance for a lessee, a lessor and sale and leaseback transactions. Lessees and lessors are required to disclose qualitative and quantitative information about leasing arrangements to enable a user of the financial statements to assess the amount, timing and uncertainty of cash flows arising from leases. Entities will be required to recognize and measure leases as of the earliest period presented using a modified retrospective approach.

In July 2018, the FASB issued ASU No. 2018-10, “Codification Improvements to Topic 842”, which provides amendments and clarification to ASU 2016-12 based on the FASB’s interaction with stakeholders. In July 2018, the FASB issued ASU No. 2018-11 “Leases (Topic 842): Targeted Improvements”, which amends Leases (Topic 842) to (i) add an optional transition method that would permit entities to apply the new requirements by recognizing a cumulative-effect adjustment to the opening balance of retained earnings in the year of adoption, and (ii) provide a practical expedient for lessors regarding the separation of the lease and non-lease components of a contract. The standards are effective for fiscal years beginning after December 15, 2018, including interim periods within those fiscal years. The new standards will be effective for the Company for the fiscal year beginning August 1, 2019, with early adoption permitted, and the Company expects to use the cumulative-effect adjustment approach in the year of adoption. The adoption of this guidance is expected to result in an increase in assets and liabilities on the Company’s balance sheet, with no material impact on the statement of operations. However, the ultimate impact of adopting this ASU will depend on the Company’s lease portfolio as of the adoption date.

In November 2016, the FASB issued ASU 2016-18, “Restricted Cash”. ASU 2016-18 requires that a statement of cash flows explain the change during the period in the total of cash, cash equivalents, and amounts generally described as restricted cash or restricted cash equivalents. Restricted cash and restricted cash equivalents will be included with cash and cash equivalents when reconciling the beginning of period and end of period balances on the statement of cash flows upon adoption of this standard. ASU 2016-18 is effective for interim and annual reporting periods in fiscal years beginning after December 15, 2017. We adopted this standard effective August 1, 2018 and expect the adoption will not have a significant impact on our consolidated financial statements.

In February 2018, the FASB issued ASU 2018-02, “Income Statement—Reporting Comprehensive Income (Topic 220)”. ASU 2018-02 allows a reclassification from accumulated other comprehensive income to retained earnings for stranded tax effects resulting from the December 22, 2017 Tax Act. The amendments in this ASU are effective for all entities for fiscal years beginning after December 15, 2018, and interim periods within those fiscal years. Early adoption of the amendments in this ASU is permitted, including adoption in any interim period, (1) for public business entities for reporting periods for which financial statements have not yet been issued and (2) for all other entities for reporting periods for which financial statements have not yet been made available for issuance. The amendments in this ASU should be applied either in the period of adoption or retrospectively to each period (or periods) in which the change in the U.S. federal corporate income tax rate in the Tax Act is recognized. We are in the process of evaluating the impact of this standard on the consolidated financial statements.

2. MARKETABLE SECURITIES:

As of July 31, 2018 and 2017, the Company’s marketable securities were classified as follows:

July 31, 2018 July 31, 2017
      Cost     Gross
Unrealized

Gains
    Gross
Unrealized

Losses
    Fair
Value
    Cost     Gross
Unrealized
Gains
    Gross
Unrealized
Losses
    Fair
Value
Non-current:               
Available-for-sale:
Mutual funds $ 774,602 $ 237,149 $ $ 1,011,751 $ 716,463 $ 193,932 $ $ 910,395
Corporate equity securities 1,567,089 562,988 2,130,077 1,540,788 364,544 1,905,332
$ 2,341,691 $ 800,137 $ $ 3,141,828 $ 2,257,251 $ 558,476 $ $ 2,815,727

12


Investment income for the years ended July 31, 2018, 2017 and 2016 consists of the following:

2018 2017 2016
Interest income       $ 25,414       $ 13,176       $ 8,422
Dividend income 86,354 57,717 54,526
Gain (loss) on sale of marketable securities (805 ) 23,734 (36,999 )
Total $ 110,963 $ 94,627 $ 25,949

3. LONG-TERM DEBT—MORTGAGE:

July 31, 2018 July 31, 2017
Current
Annual Final Due Due Due Due
Interest Payment Within After Within After
Rate Date One Year One Year One Year One Year
Mortgage:                                      
Bond St. building, Brooklyn, NY 3.54% 2/1/2020 $ 168,501 $ 5,298,610 $ 162,569 $ 5,467,110
Less: Deferred financing costs 34,325 57,202
Total $ 168,501 $ 5,264,285 $ 162,569 $ 5,409,908

On January 9, 2015, the Company refinanced its loan with a bank for $6,000,000, which included the outstanding balance as of January 2015 in the amount of $5,347,726 and an additional borrowing of $652,274. The loan is for a period of five years with a payment based on a twenty-five year amortization period. The interest rate for this period is fixed at 3.54% per annum. The mortgage loan is secured by the Bond Street building in Brooklyn, New York.

Maturities of long-term mortgage and term loan payable outstanding at July 31, 2018 are as follows: Years ending July 31, 2019 (included in current liabilities): $168,501; and 2020: $5,298,610.

The carrying value of the property collateralizing the above debt is $22,280,525 at July 31, 2018.

4. INCOME TAXES:

On December 22, 2017, the United States government (“U.S.”) enacted significant changes to the U.S. tax law following the passage and signing of H.R.1, “An Act to Provide for Reconciliation Pursuant to Titles II and V of the Concurrent Resolution on the Budget for Fiscal Year 2018” (the “Tax Act”) (previously known as “The Tax Cuts and Jobs Act”). The Tax Act included significant changes to existing tax law, including a permanent reduction to the U.S. federal corporate income tax rate from 34% to 21%, a one-time repatriation tax on deferred foreign income, deductions, credits and business related exclusions.

The permanent reduction to the U.S. federal corporate income tax rate from 34% to 21% was effective January 1, 2018 (the “Effective Date”). When a U.S. federal tax rate change occurs during a fiscal year, taxpayers are required to compute a weighted daily average rate for the fiscal year of enactment. As a result of the Tax Act, the Company has calculated a U.S. federal statutory corporate income tax rate of 26% for the fiscal year ending July 31, 2018 and applied this rate in computing the income tax provision. The U.S. federal statutory corporate income tax rate of 26% is the weighted daily average rate between the pre-enactment U.S. federal statutory tax rate of 34%, applicable to the Company’s fiscal year ending July 31 2018 prior to the Effective Date, and the post-enactment U.S. federal statutory tax rate of 21% applicable thereafter. The Company expects the U.S. federal statutory rate to be 21% for fiscal years beginning after July 31, 2018.

On December 22, 2017, the SEC issued Staff Accounting Bulletin 118 (“SAB 118”). SAB 118 expresses views of the SEC regarding ASC Topic 740, Income Taxes (“ASC 740”), in the reporting period that includes the enactment date of the Tax Act. The SEC staff issuing SAB 118 (the “Staff’) recognized that a registrant’s review of certain income tax effects of the Tax Act may be incomplete at the time financial statements are issued for the reporting period that includes the enactment date, including interim periods therein. If a company does not have the necessary information available, prepared or analyzed for certain income tax effects of the Tax Act, SAB 118 allows a company to report provisional numbers and adjust those amounts during the measurement period not to extend beyond one year. The Company has recorded all known and estimable impacts of the Tax Act that are effective for the fiscal year ended July 31, 2018. Future adjustments to the provisional numbers will be recorded as discrete adjustments to income tax expense in the period in which those adjustments become estimable and/or are finalized.

13


As of July 31, 2017, the Company had net deferred federal tax liabilities totaling approximately $5.6 million. The lower future tax rate means the future expense of existing deferred tax liabilities needs to be computed at the new, lower tax rate which results in a reduction in deferred tax liabilities and an income tax benefit in the period of enactment.

As a direct result of the permanent reduction in federal tax rates from 34% to 21%, the value of these net deferred tax liabilities has declined. Accordingly, the Company’s income tax provision for the fiscal year ended July 31, 2018 includes a $2.4 million non-cash reduction to the value of net deferred tax liabilities to the revised value based on the new, lower tax rate.

In accordance with SAB 118, the provision estimates recorded represent reasonable estimates of the effects of the Tax Act for which the analysis is not yet complete. As the Company completes its analysis of the effects of the Tax Act, including performing and refining calculations and obtaining additional guidance from such standard setting and regulatory bodies as the US Internal Revenue Services, US Treasury Department and FASB, among others, it may record adjustments to the provisional estimates. The Company expects to finalize its provisional estimates at the earlier of the time it files its US federal income tax return for the fiscal year ended July 31, 2018 or the end of the measurement period provided for under SAB 118, which is December 31, 2018.

Income taxes provided for the years ended July 31, 2018, 2017 and 2016 consist of the following:

2018 2017 2016
Current:
Federal       $ 10,000       $ 15,000       $ 69,000
Deferred taxes:
Federal (1,841,000 ) 966,000 727,000
State 587,000
Total provision $ (1,244,000 ) $ 981,000 $ 796,000

Taxes provided for the years ended July 31, 2018, 2017 and 2016 differ from amounts which would result from applying the federal statutory tax rate to pre-tax income, as follows:

2018 2017 2016
Income before income taxes             $ 1,730,141       $ 2,906,539       $ 2,313,760
Other-net 2,443 4,507 7,427
Adjusted pre-tax income $ 1,732,584 $ 2,911,046 $ 2,321,187
Statutory rate 26.42 % 34 % 34 %
Income tax provision at statutory rate $ 457,749 $ 989,756 $ 789,204
Remeasurement of federal deferred income taxes (2,390,000 )
State deferred income taxes 587,000
Other-net 101,251 (8,756 ) 6,796
Income tax provision $ (1,244,000 ) $ 981,000 $ 796,000

The Company has a federal net operating loss carryforward approximating $4,053,000, $5,446,000 and $6,580,000 as of July 31, 2018, July 31, 2017 and July 31, 2016, respectively, available to offset future taxable income. As of July 31, 2018, 2017 and 2016, the Company had unused state and city net operating loss carryforwards of approximately $10,107,000 for state and $8,274,000 for city, available to offset future state and city taxable income. The net operating loss carryforwards will begin to expire, if not used, in 2035.

The Company’s federal tax returns have been audited through the year ended July 31, 2013 and the New York State and New York City tax returns have been audited through July 31, 2012.

Generally, tax returns filed are subject to audit for three years by the appropriate taxing jurisdictions. The statute of limitations in each of the state jurisdictions in which the Company operates remain open until the years are settled for federal income tax purposes, at which time amended state income tax returns reflecting all federal income tax adjustments are filed. As of July 31, 2018, there were no income tax audits in progress that would have a material impact on the consolidated financial statements.

14


Significant components of the Company’s deferred tax assets and liabilities as of July 31, 2018 and 2017 are a result of temporary differences related to the items described as follows:

2018 2017
Deferred Deferred Deferred Deferred
      Tax Assets       Tax Liabilities       Tax Assets       Tax Liabilities
Rental income received in advance $ 174,975   $   $ 240,974    $   
Federal Net operating loss carryforward 851,175 1,851,535
State Net operating loss carryforward 665,934 660,840
Unbilled receivables 462,686 7,347,278
Property and equipment 5,916,568
Unrealized gain on marketable securities 220,746 189,882
Litigation deposit due from contractor 103,862 94,932
Other 298,054 373,559
$ 2,094,000 $ 6,600,000 $ 2,561,000 $ 8,198,000
Net deferred tax liability $ 4,506,000 $ 5,637,000

Management periodically assesses the realization of its net deferred tax assets by evaluating all available evidence, both positive and negative, associated with the Company and determining whether, based on the weight of that associated evidence, a valuation allowance for the deferred tax assets is needed. Based on this analysis, management has determined that it is more likely than not that future taxable income will be sufficient to fully utilize the federal and state deferred tax assets at July 31, 2018.

New York State and New York City taxes are calculated using the higher of taxes based on income or the respective capital-based franchise taxes. Beginning with the Company’s tax year ended July 31, 2016, changes in the law required the state capital-based tax will be phased out over a 7-year period. The Company anticipates New York State taxes will be based on income beginning August 1, 2018. For the quarter ending July 31, 2018, the Company recorded a state deferred tax asset, deferred tax liability and deferred taxes on unrealized gain on available-for-sale securities in the amounts of $790,000, $1,430,000 and $53,000, respectively, resulting in a state deferred tax expense of $587,000. New York City taxes will be based on capital for the foreseeable future. Capital-based franchise taxes are recorded to administrative and general expense. State tax amounts in excess of the capital-based franchise taxes are recorded to income tax expense. Due to both the application of the capital-based tax and due to the possible absence of city taxable income, the Company does not record city deferred taxes.

Components of the deferred tax provision (benefit) for the years ended July 31, 2018, 2017 and 2016 consist of the following:

      2018       2017       2016
Tax depreciation exceeding book depreciation $ (1,430,906 ) $ 397,273 $ 553,647
Federal operating loss carryforward 1,000,360 384,208 11,453
State net operating loss carryforward (665,934 )
Decrease (increase) of rental income received in advance 65,999 (82,775 ) 44,298
(Decrease) in unbilled receivables (198,154 ) (94,927 ) (132,736 )
Increase (decrease) in average rent payable 81,230 29,383 (28,389 )
Deferred revenue 347,083 396,667
Litigation deposit due from contractor (8,930 ) (94,932 )
Other (97,665 ) (14,245 ) (23,008 )
$ (1,254,000 ) $ 966,000 $ 727,000

15


5. LEASES:

The Company’s real estate operations encompass both owned and leased properties. The current leases on leased property, most of which have options to extend the terms, range from 3 years to 25 years. Certain of the leases provide for additional rentals under certain circumstances and obligate the Company for payments of real estate taxes and other expenses.

Rental expense for leased real property for each of the three fiscal years in the period ended July 31, 2018 was exceeded by sublease rental income, as follows:

2018 2017 2016
Minimum rental expense       $ 1,750,859       $ 1,899,374       $ 1,726,528
Contingent rental expense 1,034,762 833,641 825,695
2,785,621 2,733,015 2,552,223
Sublease rental income 6,901,958 6,750,325 6,341,145
Excess of sublease income over expense $ 4,116,337 $ 4,017,310 $ 3,788,922

Rent expense related to an affiliate principally owned by a director of the Company totaled $987,250 for fiscal year ended July 31, 2018, $987,250 for fiscal year ended 2017 and $836,813 for fiscal year ended 2016. The rent expense is derived from two leases which expire July 31, 2027 and April 30, 2031, respectively. Rent expense is recognized on a straight-line basis over the lives of the leases.

The lease which expires July 31, 2027 related to an affiliate principally owned by a director of the Company, is for a ground lease which permitted the Company to construct a building during the lease period. In accordance with the terms of the lease, upon lease termination in 2027, the building and all improvements are turned over to the property owner.

Future minimum non-cancelable rental commitments for operating leases with initial or remaining terms of one year or more are payable as follows:

Operating
Fiscal Year       Leases
2019 $ 1,853,841
2020 1,858,754
2021 1,860,485
2022 1,856,314
2023 1,864,455
After 2023 10,801,871
Total required* $ 20,095,720

*        Minimum payments have not been reduced by minimum sublease rentals of $31,436,747 under operating leases due in the future under non-cancelable leases.

6. RENTAL INCOME:

Rental income for each of the fiscal years 2018, 2017 and 2016 is as follows:

July 31,
      2018       2017       2016
Minimum rentals
Company owned property $ 11,652,482 $ 11,144,902 $ 10,478,878
Leased property 6,502,219 6,414,724 6,008,185
18,154,701 17,559,626 16,487,063
Contingent rentals
Company owned property 746,442 622,375 596,164
Leased property 399,739 335,601 332,960
1,146,181 957,976 929,124
Total $ 19,300,882 $ 18,517,602 $ 17,416,187

16


Future minimum non-cancelable rental income for leases with initial or remaining terms of one year or more is as follows:

Company
Owned Leased
Fiscal Year       Property       Property       Total
2019 $ 10,702,102 $ 5,601,866 $ 16,303,968
2020 9,775,733 4,072,267 13,848,000
2021 9,331,495 3,216,011 12,547,506
2022 7,352,730 2,878,732 10,231,462
2023 8,261,901 2,463,368 10,725,269
After 2023 56,946,159 13,204,503 70,150,662
Total $ 102,370,120 $ 31,436,747 $ 133,806,867

Rental income is recognized on a straight-line basis over the lives of the leases.

7. PAYROLL AND OTHER ACCRUED LIABILITIES:

Payroll and other accrued liabilities for the fiscal years ended July 31, 2018 and 2017 consist of the following:

      2018       2017
Payroll $ 259,149 $ 260,741
Interest 16,666 17,161
Professional fees 140,000 145,000
Rents received in advance 644,728 708,747
Utilities 19,200 12,452
Brokers commissions 134,418 287,940
Construction costs 146,132
Other 890,198 937,443
Total 2,104,359 2,515,616
Less current portion 2,104,359 2,515,616
Long term portion $ $

8. EMPLOYEES’ RETIREMENT PLANS:

The Company sponsors a non-contributory Money Purchase Plan covering substantially all of its non-union employees. Operations were charged $413,256, $399,651, and $391,962, as contributions to the Plan for fiscal years 2018, 2017 and 2016, respectively.

MULTI-EMPLOYER PLAN:

The Company contributes to a union sponsored multi-employer pension plan covering its union employees. The Company contributions to the pension plan for the years ended July 31, 2018, 2017 and 2016 were $62,425, $56,880, and $53,405, respectively. Contributions and costs are determined in accordance with the provisions of negotiated labor contracts or terms of the plans. The Company also contributes to union sponsored health benefit plans.

CONTINGENT LIABILITY FOR PENSION PLANS:

Information as to the Company’s portion of accumulated plan benefits and plan assets is not reported separately by the pension plan. Under the Employee Retirement Income Security Act, upon withdrawal from a multi-employer benefit plan, an employer is required to continue to pay its proportionate share of the plan’s unfunded vested benefits, if any. Any liability under this provision cannot be determined: however, the Company has not made a decision to withdraw from the plan.

17


Information for contributing employer’s participation in the multi-employer plan:

Legal name of Plan: United Food and Commercial Workers Local 888 Pension Fund
Employer identification number: 13-6367793
Plan number: 001
Date of most recent Form 5500: December 31, 2016
Certified zone status: Critical and declining status
Status determination date: January 1, 2018
Plan used extended amortization provisions in status calculation: Yes
Minimum required contribution: Yes
Employer contributing greater than 5% of Plan contributions for year ended December 31, 2016: Yes
Rehabilitation plan implemented: Yes
Employer subject to surcharge: Yes
Contract expiration date: November 30, 2019

For the plan years 2017-2019, under the pension fund’s rehabilitation plan, the Company agreed to pay a minimum contribution rate equal to 9.1% of the prior year total contribution rate. The Company has 30 employees and has a contract, expiring November 30, 2019, with a union covering rates of pay, hours of employment and other conditions of employment for approximately 23% of its employees. The Company considers that its labor relations with its employees and union are good.

9. CASH FLOW INFORMATION:

For purposes of reporting cash flows, the Company considers cash equivalents to consist of short-term highly liquid investments with maturities of three months or less, which are readily convertible into cash.

Supplemental disclosures:

July 31,
     2018      2017      2016
Interest paid, net of capitalized interest of $37,471 (2018), $20,360 (2017) and $49,707 (2016) $ 211,092 $ 209,789 $ 222,969
Income taxes paid (refunded) $ 36,494 $ 213,096 $ (367,755 )

10. FINANCIAL INSTRUMENTS AND CREDIT RISK CONCENTRATIONS:

The following disclosure of estimated fair value was determined by the Company using available market information and appropriate valuation methods. Considerable judgment is necessary to develop estimates of fair value. The estimates presented herein are not necessarily indicative of the amounts that could be realized upon disposition of the financial instruments.

The Company estimates the fair value of its financial instruments using the following methods and assumptions: (i) quoted market prices, when available, are used to estimate the fair value of investments in marketable debt and equity securities; (ii) discounted cash flow analyses are used to estimate the fair value of long-term debt, using the Company’s estimate of current interest rates for similar debt; and (iii) carrying amounts in the balance sheet approximate fair value for cash and cash equivalents, restricted cash, and tenant security deposits due to their high liquidity.

July 31, 2018 July 31, 2017
Carrying Fair Carrying Fair
      Value       Value       Value       Value
Cash and cash equivalents $ 5,255,073 $ 5,255,073 $ 5,381,195 $ 5,381,195
Marketable securities $ 3,141,828 $ 3,141,828 $ 2,815,727 $ 2,815,727
Restricted cash $ 1,624,550 $ 1,624,550 $ 1,295,734 $ 1,295,734
Security deposits payable $ 1,343,671 $ 1,343,671 $ 1,036,197 $ 1,036,197
Mortgage $ 5,467,111 $ 4,939,149 $ 5,629,679 $ 5,403,180

18


Financial instruments that are potentially subject to concentrations of credit risk consist principally of marketable securities, restricted cash, cash and cash equivalents, and receivables. Marketable securities, restricted cash, cash and cash equivalents, and receivables are placed with multiple financial institutions and instruments to minimize risk. No assurance can be made that such financial institutions and instruments will minimize all such risk.

The Company derived rental income from approximately fifty tenants during the years ended July 31, 2018 and the preceding two fiscal years.

As of July 31, 2018 four tenants accounted for approximately 77.7% of receivables and three tenants accounted for 66.9% of unbilled receivables. As of July 31, 2017 three tenants accounted for 66.7% of receivables and three tenants accounted for 71.6% of unbilled receivables. During the year ended July 31, 2018, three tenants accounted for 44.6% of total rental revenue. Three tenants accounted for 44.0% and two tenants accounted for 34.7% of total rental revenue for the years ended July 31, 2017 and 2016, respectively.

The Company has no irrevocable Letters of Credit at July 31, 2018 and one irrevocable Letter of Credit totaling $230,000 at July 31, 2017 provided by one tenant as a security deposit.

11. DEFERRED CHARGES:

Deferred charges for the fiscal years ended July 31, 2018 and 2017 consist of the following:

July 31, 2018 July 31, 2017
Gross Gross
Carrying Accumulated Carrying Accumulated
Amount       Amortization       Amount       Amortization
Leasing brokerage commissions       $ 3,035,040 $ 1,264,427 $ 3,059,615 $ 1,089,934
Professional fees for leasing 193,122 105,018 405,447 294,208
Total $ 3,228,162 $ 1,369,445 $ 3,465,062 $ 1,384,142

The aggregate amortization expense for the three years in the period ended July 31, 2018 was $296,298, $279,875, and $315,779, respectively.

The weighted average life of current year additions to deferred charges was four years.

The estimated aggregate amortization expense for each of the five succeeding fiscal years is as follows:

Fiscal Year      Amortization
2019          $ 287,541   
2020 $ 234,462
2021 $ 215,897
2022 $ 188,856
2023 $ 167,132

12. CAPITALIZATION:

The Company is capitalized entirely through common stock with identical voting rights and rights to liquidation. Treasury stock is recorded at cost and consists of 162,517 shares at July 31, 2018 and at July 31, 2017.

19


13. ACCUMULATED OTHER COMPREHENSIVE INCOME:

The only component of accumulated other comprehensive income is unrealized gains (losses) on available-for-sale securities.

A summary of the changes in accumulated other comprehensive income for the fiscal years ended July 31, 2018, 2017, and 2016 are as follows:

Years Ended July 31,
2018 2017 2016
Beginning balance, net of tax effect       $ 368,476       $ 264,541       $ 196,033
Other comprehensive income, net of tax effect:
Unrealized gains on available-for-sale securities 265,080 198,776 128,515
Tax effect (130,963 ) (68,000 ) (43,000 )
Unrealized gains on available-for-sale securities, net of tax effect 134,117 130,776 85,515
 

Amounts reclassified from accumulated other comprehensive income comprehensive income, net of tax effect:

Unrealized gain on available-for-sale securities reclassified

(23,420 ) (40,841 ) (25,007 )
Tax effect 7,963 14,000 8,000
Amount reclassified, net of tax effect (15,457 ) (26,841 ) (17,007 )
Ending balance, net of tax effect $ 487,136 $ 368,476 $ 264,541

A summary of the line items in the Consolidated Statements of Income and Retained Earnings affected by the amounts reclassified from accumulated other comprehensive income is as follows:

      Details about accumulated other       Affected line item in the statement
comprehensive income components where net income is presented
Other comprehensive income reclassified Investment income
Tax effect Income taxes provided

14. ENTRY INTO A MATERIAL DEFINITIVE AGREEMENT:

On June 16, 2014, the Company entered into a Second Amendment of Lease (the “Amendment”) with 33 Bond St. LLC (“Bond”), its landlord, for certain truck bays and approximately 1,000 square feet located at the cellar level within a garage at Livingston and Bond Street (“Premises”). Pursuant to the Amendment, (1) a lease option for the Premises was exercised extending the lease until December 8, 2043, (2) the Company, simultaneously with the execution of the Amendment, vacated the Premises so that Bond may demolish the building in which the Premises is located in order to develop and construct a new building at the location, and (3) Bond agreed to redeliver to the Company possession of the reconfigured Premises after construction.

As consideration under the Amendment, Bond agreed to pay the Company a total of $3,500,000. Upon execution of the Amendment, the Company recorded $3,500,000 to deferred revenue to be amortized to revenue to temporarily vacate the premises over the expected vacate period of 36 months. Bond tendered $2,250,000 simultaneously with the execution of the Amendment, and the balance due of $1,250,000 on June 16, 2015 had been received by the Company. The Company re-occupied the premises in October 2017.

In connection with the Amendment, the parties also agreed to settle a pending lawsuit in the Supreme Court of the State of New York, Kings County, Index No. 50796/13 (the “Action”), in which the Company sought, among other things, a declaratory judgment that it validly renewed the lease for the Premises, and Bond sought, among other things, a declaratory judgment that the lease expired by its terms on December 8, 2013. Pursuant to a stipulation of settlement, filed on June 16, 2014, the Action, including all claims and counterclaims, has been discontinued with prejudice, without costs or attorneys’ fees to any party as against the other. The stipulation of settlement also contains general releases by both parties of all claims.

20


15. CONTINGENCIES:

Due to defective workmanship and breach of contract, the Company continues to pursue damages and return in full of a $376,467 deposit paid a contractor when construction commenced to replace a roof and various other work on the Fishkill, New York building. Both the contractor and subcontractors have claimed the Company tortuously interfered with the construction contracts arguing for fees and costs which approximate $700,000. While the Company strongly disputes the claims, it is possible that the court may rule against the Company and may assess damages in amounts up to approximately $700,000. It is also possible that the court may rule in favor of the Company and that no damages would be awarded against the Company and the Company could obtain an order for the return of all or a portion of amounts previously paid. A charge to real estate operating expenses in the amount of $279,213 was recorded for the fiscal year ended July 31, 2017. Following initial court decisions, another $141,132 was charged to operating expenses on October 31, 2016 and this amount was ordered by the Court to be paid, plus interest, in a judgement dated September 14, 2017. The testimony phase of the trial has been completed and the parties await further decisions and orders of the court.

There are various other lawsuits and claims pending against the Company. It is the opinion of management that the resolution of these matters will not have a material adverse effect on the Company’s Consolidated Financial Statements.

If the Company sells, transfers, disposes of or demolishes 25 Elm Place, Brooklyn, New York, then the Company may be liable to create a condominium unit for the loading dock. The necessity of creating the condominium unit and the cost of such condominium unit cannot be determined at this time.

21


SCHEDULE II

J.W. MAYS, INC.
VALUATION AND QUALIFYING ACCOUNTS

Year Ended July 31,
2018 2017 2016
Allowance for net unrealized gains on marketable securities:               
Balance, beginning of year $ 558,476 $ 400,541 $ 297,031
Additions 241,661 157,935 103,510
Balance, end of year $ 800,137 $ 558,476 $ 400,541

22


SCHEDULE III

J.W. MAYS, INC.
REAL ESTATE AND ACCUMULATED DEPRECIATION
July 31, 2018

Col. A     Col. B     Col. C     Col. D     Col. E     Col. F Col. G     Col. H     Col. I
    Cost Capitalized         Life on Which
Subsequent to Gross Amount at Which Carried Depreciation in
Initial Cost to Company Acquisition At Close of Period     Latest Income
Building &     Carried Building & Accumulated Date of Date Statement is
Description Encumbrances Land Improvements Improvements Cost Land Improvements Total Depreciation Construction  Acquired   Computed 
Office and Rental Buildings
Brooklyn, New York
       Fulton Street at Bond Street
     $ 5,467,111      $ 3,901,349   $ 7,403,468      $ 23,917,153        $     $ 3,901,349     $ 31,320,621     $ 35,221,970    $ 12,941,445    Various Various (1) (2)
Jamaica, New York
       Jamaica Avenue at
              169th Street
3,215,699 17,588,009 20,803,708 20,803,708 10,987,347 1959 1959 (1) (2)
Fishkill, New York
       Route 9 at Interstate
              Highway 84
594,723 7,212,116 5,853,612 594,723 13,065,728 13,660,451 9,058,246 10/74 11/72 (1)
Brooklyn, New York
       Jowein Building Fulton Street
       and Elm Place
1,324,957 728,327 15,600,458 1,324,957 16,328,785 17,653,742 5,591,005 1915 1950 (1) (2)
Levittown, New York Hempstead
       Turnpike
125,927 125,927 125,927 4/69 6/62 (1)
Circleville, Ohio
       Tarlton Road 120,849 4,388,456 86,520 120,849 4,474,976 4,595,825 2,804,919 9/92 12/92 (1)
Total(A) $ 5,467,111 $ 6,067,805 $ 22,948,066 $ 63,045,752   $ $ 6,067,805 $ 85,993,818 $ 92,061,623 $ 41,382,962
____________________

(1) Building and improvements 18–40 years
       
(2) Improvements to leased property 3–40 years
       
(A) Does not include Office Furniture and Equipment and Transportation Equipment in the amount of $350,164 and Accumulated Depreciation thereon of $235,841 at July 31, 2018.

            Year Ended July 31,
2018       2017       2016
Investment in Real Estate     
Balance at Beginning of Year $ 89,016,227 $ 86,936,827 $ 84,474,345
Improvements 3,045,396 2,079,400 2,462,482
Retirements
Balance at End of Year $ 92,061,623 $ 89,016,227 $ 86,936,827
Accumulated Depreciation
Balance at Beginning of Year $ 39,648,642 $ 38,008,810 $ 36,413,975
Additions Charged to Costs and Expenses 1,734,320 1,639,832 1,594,835
Retirements
Balance at End of Year $ 41,382,962 $ 39,648,642 $ 38,008,810

23


J.W. MAYS, INC.

REPORT OF MANAGEMENT

Management is responsible for the preparation and reliability of the financial statements and the other financial information in this Annual Report. Management has established systems of internal control over financial reporting designed to provide reasonable assurance that the financial records used for preparing financial statements are reliable and reflect the transactions of the Company and that established policies and procedures are carefully followed. The Company reviews, modifies and improves its system of internal controls in response to changes in operations.

The Board of Directors, acting through the Audit Committee, which is comprised solely of independent directors who are not employees of the Company, oversees the financial reporting process. The financial statements have been prepared in accordance with accounting standards generally accepted in the United States of America and include amounts based on judgments and estimates made by management. Actual results could differ from estimated amounts.

To ensure complete independence, D’Arcangelo & Co., LLP, the independent registered public accounting firm, has full and free access to meet with the Audit Committee, without management representatives present, to discuss results of the audit, the adequacy of internal controls and the quality of financial reporting.

24


J.W. MAYS, INC.

REPORT OF INDEPENDENT REGISTERED PUBLIC ACCOUNTING FIRM

To the Board of Directors and Shareholders
J.W. Mays, Inc. and Subsidiaries

Opinion on the Consolidated Financial Statements

We have audited the accompanying consolidated balance sheets of J.W. Mays, Inc. and Subsidiaries (the Company) as of July 31, 2018 and 2017 and the related consolidated statements of income and retained earnings, comprehensive income, and cash flows for each of the years in the three year period ended July 31, 2018, and the related notes and financial statement schedules (collectively referred to as the “consolidated financial statements”). In our opinion, the consolidated financial statements present fairly, in all material respects, the financial position of the Company as of July 31, 2018 and 2017, and the results of its operations and its cash flows for each of the years in the three year period ended July 31, 2018, in conformity with accounting principles generally accepted in the United States of America.

Basis for Opinion

These consolidated financial statements are the responsibility of the Company’s management. Our responsibility is to express an opinion on the Company’s consolidated financial statements based on our audits. We are a public accounting firm registered with the Public Company Accounting Oversight Board (United States) (“PCAOB”) and are required to be independent with respect to the Company in accordance with the U.S. federal securities laws and the applicable rules and regulations of the Securities and Exchange Commission and the PCAOB.

We conducted our audits in accordance with the standards of the PCAOB. Those standards require that we plan and perform the audit to obtain reasonable assurance about whether the consolidated financial statements are free of material misstatement, whether due to error or fraud. The Company is not required to have, nor were we engaged to perform, an audit of its internal control over financial reporting. As part of our audits, we are required to obtain an understanding of internal control over financial reporting but not for the purpose of expressing an opinion on the effectiveness of the Company’s internal control over financial reporting. Accordingly, we express no such opinion.

Our audits included performing procedures to assess the risks of material misstatement of the consolidated financial statements, whether due to error or fraud, and performing procedures that respond to those risks. Such procedures include examining, on a test basis, evidence regarding the amounts and disclosures in the consolidated financial statements. Our audits also included evaluating the accounting principles used and significant estimates made by management, as well as evaluating the overall presentation of the consolidated financial statements. We believe that our audits provide a reasonable basis for our opinion.


{ACCOUNTING FIRM SIGNATURE WILL GO HERE}


We have served as the Company’s auditor since 1996.
Poughkeepsie, New York
October 4, 2018

25


J.W. MAYS, INC.

FIVE YEAR SUMMARY OF CONSOLIDATED OPERATIONS
(dollars in thousands except per share data)

Years Ended July 31,
     2018      2017      2016      2015      2014  
Revenues:
Rental income $ 19,301 $ 18,518 $ 17,416 $ 17,732 $ 16,935
Recovery of real estate taxes 11 11
Revenue to temporarily vacate lease 1,021 1,167 1,167 146
Total revenues 19,301 19,550 18,583 18,910 17,081
 
Expenses:
Real estate operating expenses 11,074 10,213 10,081 9,658 9,629
Administrative and general expenses 4,598 4,616 4,334 4,312 4,218
Depreciation and amortization 1,776 1,683 1,636 1,695 1,722
(Gain) loss on disposition of property and equipment (1 ) 28 4
Total expenses 17,448 16,512 16,050 15,693 15,573
 
Income before investment income, interest expense, and income taxes 1,853 3,038 2,533 3,217 1,508
 
Investment income and interest expense:
Investment income 111 95 26 51 232
Interest expense (234 ) (226 ) (245 ) (346 ) (460 )
(123 ) (131 ) (219 ) (295 ) (228 )
 
Income before income taxes 1,730 2,907 2,314 2,922 1,280
Income taxes provided (benefit) (1,244 ) 981 796 713 541
Net income $ 2,974 $ 1,926 $ 1,518 $ 2,209 $ 739
 
Net income per common share $ 1.48 $ .96 $ .75 $ 1.10 $ .37
Dividends per share $    $    $    $    $   
Average common shares outstanding 2,015,780 2,015,780 2,015,780 2,015,780 2,015,780

26


J.W. MAYS, INC.

MANAGEMENT’S DISCUSSION AND ANALYSIS OF FINANCIAL CONDITION AND RESULTS OF OPERATIONS

Management’s Discussion and Analysis of Financial Condition and Results of Operations should be read in conjunction with our consolidated financial statements and related notes thereto contained in this report. In this discussion, the words “Company”, “we”, “our” and “us” refer to J.W. Mays, Inc. and subsidiaries.

FORWARD LOOKING STATEMENTS

The following can be interpreted as including forward-looking statements under the Private Securities Litigation Reform Act of 1995. The words “outlook”, “intend”, “plans”, “efforts”, “anticipates”, “believes”, “expects” or words of similar import typically identify such statements. Various important factors that could cause actual results to differ materially from those expressed in the forward-looking statements are identified under the heading “Cautionary Statement Regarding Forward-Looking Statements” below. Our actual results may vary significantly from the results contemplated by these forward-looking statements based on a number of factors including, but not limited to, availability of labor, marketing success, competitive conditions and the change in economic conditions of the various markets we serve.

CRITICAL ACCOUNTING POLICIES AND ESTIMATES

Critical accounting policies are defined as those most important to the portrayal of a company’s financial condition and results and require the most difficult, subjective or complex judgments. The preparation of financial statements in conformity with accounting principles generally accepted in the United States of America requires us to make estimates and judgments that affect the reported amounts of assets and liabilities at the date of the financial statements, the reported amount of revenues, and expenses during the reporting period and related disclosure of contingent assets and liabilities. We believe the critical accounting policies in Note 1 affect our more significant judgments and estimates used in the preparation of our financial statements. Estimates are based on historical experience, where applicable or other assumptions that management believes are reasonable under the circumstances. We have identified the policies described below as our critical accounting policies. Actual results may differ from these estimates under different assumptions and conditions. (See Note 1 on pages 9 through 12 to the Consolidated Financial Statements). Newly effective accounting principles and recently issued accounting principles not yet adopted are also disclosed in Note 1.

Revenue recognition

Substantially all of our revenue is recognized pursuant to the terms of long-term leases which usually range from 5 years to 20 years. Most of the leases provide for increases in fixed monthly rental income over the term of the lease. Accounting principles require us to recognize the rental income on a straight-line basis over the term of the lease; therefore during the first half of the lease period we recognize more rental income than is received from the tenant pursuant to the terms of the lease. The difference between the rental income recorded in the financial statements and the amounts due under the terms of the lease is recorded as unbilled receivables in the consolidated balance sheets. During the second half of the lease period, we recognize less rental income than is received from the tenant pursuant to the terms of the lease thereby reducing the amount of unbilled receivables. Modifications are sometimes made to the leases during the lease term which would affect the rental income recorded.

Receivables

Receivables, both billed and unbilled, are reviewed monthly for collectability. Management, based on available information, will make a decision as to whether the receivable is collectable. If circumstances indicate that a tenant will not be able to fulfill the terms of the lease, the unbilled receivable will be written off and revenue will be recorded as received.

Property and equipment

Property and equipment is recorded at cost and depreciated over the asset’s useful life. Significant improvements to the property are capitalized and the costs of improvements no longer in use are written off. Management reviews the value of the properties for significant decreases in valuation. If any significant decreases in valuation are noted, the adjustment is recorded in the financial statements.

27


Deferred charges

In connection with obtaining new tenants and leases, we incur costs including brokerage commissions and legal fees. These costs are written off over the term of the lease on the straight-line basis. Should a tenant vacate prior to the expiration of the lease, the unamortized cost is written off at that time.

Income taxes

Our income tax expense takes into effect taxes that are currently payable, based on our income tax returns filed, and taxes that will be payable in the future based on income earned in the current year that is not taxable until future events occur offset by expenses incurred in the current year that are not deductible until future events occur. Tax audits increase or decrease the amounts currently payable based on the results of the audits. The tax provision is an estimate and can change at any time due to changes in tax laws and tax rates.

Marketable securities

We invest in mutual funds with our extra available cash. The mutual funds are valued daily by the funds based on the assets included within the funds. Our mutual fund investments are recorded in the consolidated financial statements at the daily value established by the mutual funds and we can liquidate our investments at any time. Our investments in corporate equity securities are valued at prices established on the various stock exchanges. We can liquidate these investments at any time. Our investment valuations are subject to market fluctuations and can substantially change in value at any time.

FISCAL 2018 COMPARED TO FISCAL 2017

Net income for the year ended July 31, 2018 amounted to $2,974,141 or $1.48 per share, compared to net income for the year ended July 31, 2017 of $1,925,539, or $.96 per share. The increase was primarily due to the enactment of the U.S. Tax Act on December 22, 2017. These changes required an adjustment to our deferred tax assets and liabilities to the lower federal rates resulting in an estimated net tax benefit of approximately $2.4 million. The Federal adjustment to deferred tax assets and liabilities was partially offset by an increase in the Company’s net deferred liability for New York State taxes in the amount of $587,000.

Revenues in the current year decreased to $19,300,882 from $19,549,387 in the comparable 2017 year primarily due to the decrease in revenue from the temporary vacating of a lease partially offset by a new office tenant, at the Jowein building in Brooklyn, New York and increased rent from existing tenants.

Real estate operating expenses in the current year increased to $11,074,396 from $10,212,761 in the comparable 2017 year primarily due to increases in real estate taxes and maintenance costs, partially offset by decreases in licenses and permits costs.

Administrative and general expenses in the current year decreased to $4,598,144 from $4,616,086 in the comparable 2017 year primarily due to a decrease in a bad debt write off of $80,302 from a tenant who vacated the Nine Bond Street building in July 2017.

Depreciation and amortization expense in the current year increased to $1,775,690 from $1,682,690 in the comparable 2017 year primarily due to improvements on the Jowein and Nine Bond Street Brooklyn, New York buildings and the Jamaica, New York building.

Interest expense in the current year exceeded investment income by $122,511 and by $131,311 in the comparable 2017 year. The decrease is primarily due to increased investment income.

As explained above, the enactment of the U.S. Tax Act required an adjustment to our deferred tax assets and liabilities to the lower federal rates resulting in an estimated net federal tax benefit of approximately $2.4 million. The federal adjustment to deferred tax assets and liabilities was partially offset by an increase in the Company’s net deferred liability for New York State taxes in the amount of $587,000.

FISCAL 2017 COMPARED TO FISCAL 2016

Net income for the year ended July 31, 2017 amounted to $1,925,539, or $.96 per share, compared to net income for the year ended July 31, 2016 of $1,517,760, or $.75 per share.

Revenues in the year ended 2017 increased to $19,549,387 from $18,582,854 in the comparable 2016 year primarily due to one new office tenant, at the Jowein building in Brooklyn, New York, and increased rent from existing tenants, partially offset by a decrease in revenue from the temporary vacating of a lease.

28


Real estate operating expenses in the year ended 2017 increased to $10,212,761 from $10,080,913 in the comparable 2016 year primarily due to increases in real estate taxes, utility costs, payroll costs, a charge for litigation against a contractor in the amount of $141,132 (see Note 15) and license and permits costs, partially offset by decreases in maintenance costs.

Administrative and general expenses in the year ended 2017 increased to $4,616,086 from $4,333,589 in the comparable 2016 year primarily due to increases in a bad debt write off of $80,302 from a tenant who vacated the Nine Bond Street building in July 2017, payroll costs, medical costs, directors fees and legal and professional costs, partially offset by a decrease in New York State and New York City capital based franchise taxes.

Depreciation and amortization expense in the year ended 2017 increased to $1,682,690 from $1,635,660 in the comparable 2016 year primarily due to improvements on the Jowein, Brooklyn, New York building.

There was a $500 gain on disposition of property and equipment in the year ended July 31, 2016 versus zero in the comparable period in 2017.

Interest expense in the year ended 2017 exceeded investment income by $131,311 and by $219,432 in the comparable 2016 year. The decrease is primarily due to a gain on sale of marketable securities in the 2017 year whereas the 2016 year had a loss on the sale of securities.

LIQUIDITY AND CAPITAL RESOURCES

Management considers current working capital and borrowing capabilities adequate to cover the Company’s planned operating and capital requirements. The Company’s cash and cash equivalents amounted to $5,255,073 at July 31, 2018.

In March 2017, the Company leased 7,700 square feet to a medical facility at its Nine Bond Street, Brooklyn, New York building, for a term of ten years with two five year option periods. To accommodate this tenant, an existing tenant surrendered 400 square feet of retail space. The cost of renovations for this tenant will be approximately $400,000 and brokerage commissions were $216,052. The tenant is anticipated to take occupancy and commence payment of rent in late January 2019.

In August 2017, the Company leased 1,423 square feet of retail space to an existing tenant for a period of 18.5 years at the Company’s Nine Bond Street, Brooklyn, New York building. Rent and occupancy commenced in July 2018.

In September 2017, an office tenant who occupies 2,000 square feet at the Company’s Jamaica, New York building vacated the space. The Company re-let the space in July 2018.

In September 2017, the Company leased 5,167 square feet of retail space to a tenant at the Company’s Nine Bond Street, Brooklyn, New York building for a period of ten years, effective January, 2018.

In November 2017, the Company extended a lease with the existing dental office tenant at its Nine Bond Street, Brooklyn, New York building for an additional ten years, expiring January 15, 2028.

In November 2017, the Company leased an additional 3,005 square feet to an existing tenant for warehouse space at its Jowein building in Brooklyn, New York.

In March 2018, the Company leased the 20,000 square feet of area available at its Massapequa, New York property to a restaurant until May 2030. Rent is anticipated to commence in late 2018.

In April 2018, the Company extended a lease with an existing tenant who occupies 84,000 square feet for warehouse space at the Company’s Circleville, Ohio building for an additional three years expiring on October 31, 2021.

In May 2018, the Company extended a lease with an existing tenant who occupies 3,300 square feet of office space at the Company’s Jowein building in Brooklyn, New York for an additional five years expiring on June 30, 2023.

In May 2018, an office tenant who occupies 3,080 square feet at the Company’s Nine Bond Street Brooklyn, New York building informed the Company that it intends to vacate the premises in October 2018. The annual loss in rent will be $112,000.

In June 2018, the Company extended a lease with an office tenant who occupies 23,574 square feet at its Nine Bond Street Brooklyn, New York building for an additional four years expiring June 30, 2022.

In June 2018, the Company extended a lease with one of the Company’s landlords, which was due to expire on April 30, 2021, for an additional five years to expire on April 30, 2026, at its Nine Bond Street Brooklyn, New York building.

In August 2018, the Company entered into a lease agreement with an existing office tenant for an additional 1,849 square feet until June 30, 2022 at its Nine Bond Street Brooklyn, New York building.

29


CONTRACTUAL OBLIGATIONS:

At July 31, 2018, the Company had certain contractual cash obligations, as set forth in the following tables:

Payment Due by Period
Less than 1 1-3 4-5 After
Contractual Cash Obligations      Total      Year      Years      Years      5 Years
Mortgage payable $ 5,467,111 $ 168,501 $ 5,298,610 $ $
Security deposits payable 1,343,671 101,289 203,638 193,183 845,561
Operating leases 20,095,720 1,853,841 3,719,239 3,720,769 10,801,871
Total contractual cash obligations $ 26,906,502 $ 2,123,631 $ 9,221,487 $ 3,913,952 $ 11,647,432

CASH FLOWS:

The following table summarizes our cash flow activity for the fiscal years ended July 31, 2018, 2017 and 2016:

2018 2017 2016
Net cash provided by operating activities      $ 3,226,619      $ 3,982,274      $ 3,962,579
Net cash (used) by investing activities (3,497,647 ) (2,811,291 ) (2,790,071 )
Net cash provided (used) by financing activities 144,906 (1,018,614 ) (29,386 )

CASH FLOWS FROM OPERATING ACTIVITIES:

Deferred Charges: The Company incurred expenditures in the amount of $74,096 for brokerage commissions for one new office tenant at the Company’s Jamaica, New York building, one existing tenant at the Company’s Circleville, Ohio property, and one existing office tenant at the Company’s Nine Bond Street building in Brooklyn, New York.

Payroll and Other Accrued Liabilities: The Company had a balance due at July 31, 2018 for brokerage commissions of $134,418. Brokerage commissions in the amount of $200,322 were paid in the year ended July 31, 2018.

Provision (Benefit) for Deferred Income Taxes: Enactment of the U.S. Tax Act on December 22, 2017, as explained above, resulted in an estimated net federal tax benefit of approximately $2.4 million partially offset by an increase in the Company’s net deferred liability for New York State taxes in the amount of $587,000. Although the adjustment increased the Company’s net income, it did not increase cash. To reconcile net income to net cash provided by operating activities, provision (benefit) for deferred income taxes changed to a benefit of approximately $1.3 million for the current year compared to an expense of approximately $1 million and $.8 million for the comparable 2017 and 2016 years, respectively.

CASH FLOWS FROM INVESTING ACTIVITIES:

The Company had expenditures for elevator upgrade work in the amount of $227,672 for the year ended July 31, 2018, at the Company’s Nine Bond Street, Brooklyn, New York building. The total cost of the project was $627,333, and it was completed in October, 2017. The Company had expenditures of $45,006 for a new tenant. The cost of the project will be approximately $400,000 of which $290,154 has been paid, and is expected to be completed in late 2018. The Company also had expenditures of $385,615 for various other construction projects.

The Company had expenditures for electrical work in the amount of $107,661 for the year ended July 31, 2018, at its Jowein, Brooklyn, New York building. The work was completed in January, 2018. The Company also had expenditures in the amount of $153,010 for steel work.

The Company had expenditures for elevator upgrade work in the amount of $779,399 for the year ended July 31, 2018, at the Company’s Jamaica, New York building. The total cost of the project was $864,460, and was completed in August, 2018. The Company had expenditures of $278,184 for renovation work for two existing tenants. Work was completed in March, 2018. The Company also had expenditures of $87,678 for various other construction projects.

The Company had expenditures for parking lot lights in the amount of $123,164 for the year ended July 31, 2018, at its Fishkill, New York building. The total cost was $234,339 and was completed in August 2018. The Company also had expenditures of $175,671 for paving of the parking lot. Work was completed in May 2018. The Company also had expenditures of $628,767 for windows. The total cost of the project will be approximately $900,000 and will be completed in November 2018. The Company also had expenditures of $53,569 for various other construction projects.

30


RELATED PARTY TRANSACTIONS:

During fiscal 2018, the Company paid Weinstein Enterprises, Inc. (“Enterprises”) total rentals of $987,250 for leases on which two of the Company’s real estate properties are located.

CAUTIONARY STATEMENT REGARDING FORWARD-LOOKING STATEMENTS:

This section, Management’s Discussion and Analysis of Financial Condition and Results of Operations, other sections of the Annual Report on Form 10-K and this Annual Report to Shareholders and other reports and verbal statements made by our representatives from time to time may contain forward-looking statements that are based on our assumptions, expectations and projections about us and the real estate industry. These include statements regarding our expectations about revenues, our liquidity, or expenses and our continued growth, among others. Such forward-looking statements by their nature involve a degree of risk and uncertainty. We caution that a variety of factors, including but not limited to the factors described under Item 1A, “Risk Factors” in our Form 10-K for the fiscal year ended July 31, 2018 and the following, could cause business conditions and our results to differ materially from what is contained in forward-looking statements:

changes in the rate of economic growth in the United States;
changes in the financial condition of our customers;
changes in regulatory environment;
lease cancellations;
changes in our estimates of costs;
war and/or terrorist attacks on facilities where services are or may be provided;
outcomes of pending and future litigation;
increasing competition by other companies;

compliance with our loan covenants;

recoverability of claims against our customers and others by us and claims by third parties against us; and

changes in estimates used in our critical accounting policies.

Other factors and assumptions not identified above were also involved in the formation of these forward-looking statements and the failure of such other assumptions to be realized, as well as other factors, may also cause actual results to differ materially from those projected. Most of these factors are difficult to predict accurately and are generally beyond our control. You should consider the areas of risk described above in connection with any forward-looking statements that may be made by us.

We undertake no obligation to publicly update any forward-looking statements, whether as a result of new information, future events or otherwise. You are advised, however, to consult any additional disclosures we make in proxy statements, Quarterly Reports on Form 10-Q, Annual Reports on Form 10-K and Current Reports on Form 8-K filed with the U.S. Securities and Exchange Commission.

31


CONTROLS AND PROCEDURES:

The Company’s management reviewed the Company’s internal controls and procedures and the effectiveness of these controls. As of July 31, 2018, the Company carried out an evaluation, under the supervision and with the participation of the Company’s management, including its Chief Executive Officer and Chief Financial Officer, of the effectiveness of the design and operation of the Company’s disclosure controls and procedures pursuant to Rules 13a-14(c) and 15d-14(c) of the Securities Exchange Act of 1934. Based upon that evaluation, the Chief Executive Officer and Chief Financial Officer concluded that the Company’s disclosure controls and procedures are effective in timely alerting them to material information relating to the Company required to be included in its periodic SEC filings.

There was no change in the Company’s internal controls over financial reporting or in other factors during the Company’s last fiscal quarter that materially affected, or are reasonably likely to materially affect, the Company’s internal controls over financial reporting. There were no material weaknesses or significant deficiencies noted, and therefore there were no corrective actions taken.

32


J.W. MAYS, INC.

QUARTERLY FINANCIAL INFORMATION (UNAUDITED)
(dollars in thousands except per share data)

Three Months Ended
      Oct. 31, 2017       Jan. 31, 2018       Apr. 30, 2018       July 31, 2018
Revenues      $ 4,785           $ 4,792           $ 4,855           $ 4,869     
Revenues less expenses $ 605 $ 87 $ 401 $ 637
Net income (loss) $ 395 $ 2,454 $ 318 $ (193 )
Net income (loss) per common share $ .20 $ 1.21 $ .16 $ (.09 )
  
Three Months Ended
Oct. 31, 2016 Jan. 31, 2017 Apr. 30, 2017 July 31, 2017
Revenues $ 4,783 $ 4,825 $ 4,952 $ 4,989
Revenues less expenses $ 693 $ 490 $ 915 $ 809
Net income $ 462 $ 324 $ 606 $ 534
Net income per common share $ .23 $ .16 $ .30 $ .27

Income per share is computed independently for each of the quarters presented on the basis described in Note 1 to the Consolidated Financial Statements.

COMMON STOCK AND DIVIDEND INFORMATION:

Effective November 8, 1999, the Company’s common stock commenced trading on The Nasdaq Capital Market tier of The Nasdaq Stock Market under the Symbol: “Mays”. Such shares were previously traded on The Nasdaq National Market. Effective August 1, 2006, NASDAQ became operational as an exchange in NASDAQ-Listed Securities. It is now known as The NASDAQ Stock Market LLC.

The following is the sales price range per share of J.W. Mays, Inc. common stock during the fiscal years ended July 31, 2018 and 2017:

Sales Price
Three Months Ended       High       Low
October 31, 2017 $ 47.00 $ 35.30
January 31, 2018 42.45 35.50
April 30, 2018 38.00 37.25
July 31, 2018 43.50 37.70
    
October 31, 2016 $ 48.50 $ 42.50
January 31, 2017 46.50 41.50
April 30, 2017 43.00 38.00
July 31, 2017 41.50 33.55

The quotations were obtained for the respective periods from the National Association of Securities Dealers, Inc. There were no dividends declared in either of the two fiscal years.

On September 4, 2018, the Company had approximately 800 shareholders of record.

33


J.W. MAYS, INC.

OFFICERS

Lloyd J. Shulman        Chairman of the Board and President, Chief Executive Officer and Chief Operating Officer
Mark S. Greenblatt Vice President and Treasurer
Ward N. Lyke, Jr. Vice President and Assistant Treasurer
George Silva Vice President-Operations
Salvatore Cappuzzo Secretary
 
BOARD OF DIRECTORS
 
Robert L. Ecker2,3,4,6 Partner in the law firm of Ecker, Ecker & Associates, LLP
Mark S. Greenblatt3,5 Vice President and Treasurer, J.W. Mays, Inc.
Steven Gurney-Goldman2,3 Solil Management, LLC
John J. Pearl2,3,4,6 Retired partner in the accounting firm of D’Arcangelo & Co., LLP
Dean L. Ryder1,2,3,4,6 President, Putnam County National Bank
Jack Schwartz1,2,3,4,6 Private Consultant
Lloyd J. Shulman1,3 Chairman of the Board and President, Chief Executive Officer and Chief Operating Officer,
J.W. Mays, Inc.

Committee Assignments Key:

1         Member of Executive Committee
2 Member of Audit Committee
3 Member of Investment Advisory Committee
4 Member of Compensation Committee
5 Member of Disclosure Committee (Mr. Lyke and Mr. Lance Myers, a partner in Holland & Knight LLP, are also members)
6 Member of Nominating Committee

FORM 10-K ANNUAL REPORT

Copies of the Company’s Form 10-K Annual Report to the U.S. Securities and Exchange Commission for the fiscal year ended July 31, 2018 will be furnished without charge to shareholders upon written request to:

Secretary, J.W. Mays, Inc.
9 Bond Street
Brooklyn, New York 11201-5805.

Copies of the Notice of Meeting, Proxy Statement, Proxy Card and Annual Report to Shareholders are available at: http://www.astproxyportal.com/ast/03443

34


EXHIBIT 21


EXHIBIT 21

Subsidiaries of the Registrant

The Registrant owns all of the outstanding stock of the following corporations, which are included in the Consolidated Financial Statements filed with this report:

Dutchess Mall Sewage Plant, Inc. (a New York corporation)

J. W. M. Realty Corp. (an Ohio corporation)


EXHIBIT 31.1


EXHIBIT 31.1

CERTIFICATION

I, Lloyd J. Shulman, certify that:

1. I have reviewed this Annual Report on Form 10-K of J.W. Mays, Inc.;

2. Based on my knowledge, this report does not contain any untrue statement of a material fact or omit to state a material fact necessary to make the statements made, in light of the circumstances under which such statements were made, not misleading with respect to the period covered by this report;

3. Based on my knowledge, the financial statements, and other financial information included in this report, fairly present in all material respects the financial condition, results of operations and cash flows of the registrant as of, and for, the periods presented in this report;

4. The registrant’s other certifying officer(s) and I are responsible for establishing and maintaining disclosure controls and procedures (as defined in Exchange Act Rules 13a-15(e) and 15d-15(e)) and internal control over financial reporting (as defined in Exchange Act Rules 13a-15(f) and 15d-15(f)) for the registrant and have:

(a)       

Designed such disclosure controls and procedures, or caused such disclosure controls and procedures to be designed under our supervision, to ensure that material information relating to the registrant, including its consolidated subsidiaries, is made known to us by others within those entities, particularly during the period in which this report is being prepared;

 
(b)

Designed such internal control over financial reporting, or caused such internal control over financial reporting to be designed under my supervision, to provide reasonable assurance regarding the reliability of financial reporting and the preparation of financial statements for external purposes in accordance with accounting principles generally accepted in the United States of America;

 
(c)

Evaluated the effectiveness of the registrant’s disclosure controls and procedures and presented in this report our conclusions about the effectiveness of the disclosure controls and procedures, as of the end of the period covered by this report based on such evaluation; and

 
(d)

Disclosed in this report any change in the registrant’s internal control over financial reporting that occurred during the registrant’s most recent fiscal quarter (the registrant’s fourth fiscal quarter in the case of an Annual Report) that has materially affected, or is reasonably likely to materially affect, the registrant’s internal control over financial reporting;

5. The registrant’s other certifying officer(s) and I have disclosed, based on our most recent evaluation of internal control over financial reporting, to the registrant’s auditors and the audit committee of the registrant’s board of directors (or persons performing the equivalent functions):

(a)       

All significant deficiencies and material weaknesses in the design or operation of internal control over financial reporting which are reasonably likely to adversely affect the registrant’s ability to record, process, summarize and report financial information; and

  
(b)

Any fraud, whether or not material, that involves management or other employees who have a significant role in the registrant’s internal control over financial reporting.

Date: October 4, 2018

/s/ LLOYD J. SHULMAN  
Lloyd J. Shulman
President
Chief Executive Officer


EXHIBIT 31.2


EXHIBIT 31.2

CERTIFICATION

I, Mark S. Greenblatt, certify that:

1. I have reviewed this Annual Report on Form 10-K of J.W. Mays, Inc.;

2. Based on my knowledge, this report does not contain any untrue statement of a material fact or omit to state a material fact necessary to make the statements made, in light of the circumstances under which such statements were made, not misleading with respect to the period covered by this report;

3. Based on my knowledge, the financial statements, and other financial information included in this report, fairly present in all material respects the financial condition, results of operations and cash flows of the registrant as of, and for, the periods presented in this report;

4. The registrant’s other certifying officer(s) and I are responsible for establishing and maintaining disclosure controls and procedures (as defined in Exchange Act Rules 13a-15(e) and 15d-15(e)) and internal control over financial reporting (as defined in Exchange Act Rules 13a-15(f) and 15d-15(f)) for the registrant and have:

(a)       Designed such disclosure controls and procedures, or caused such disclosure controls and procedures to be designed under our supervision, to ensure that material information relating to the registrant, including its consolidated subsidiaries, is made known to us by others within those entities, particularly during the period in which this report is being prepared;
 
(b) Designed such internal control over financial reporting, or caused such internal control over financial reporting to be designed under my supervision, to provide reasonable assurance regarding the reliability of financial reporting and the preparation of financial statements for external purposes in accordance with accounting principles generally accepted in the United States of America;
 
(c) Evaluated the effectiveness of the registrant’s disclosure controls and procedures and presented in this report our conclusions about the effectiveness of the disclosure controls and procedures, as of the end of the period covered by this report based on such evaluation; and
 
(d) Disclosed in this report any change in the registrant’s internal control over financial reporting that occurred during the registrant’s most recent fiscal quarter (the registrant’s fourth fiscal quarter in the case of an Annual Report) that has materially affected, or is reasonably likely to materially affect, the registrant’s internal control over financial reporting;

5. The registrant’s other certifying officer(s) and I have disclosed, based on our most recent evaluation of internal control over financial reporting, to the registrant’s auditors and the audit committee of the registrant’s board of directors (or persons performing the equivalent functions):

(a)       All significant deficiencies and material weaknesses in the design or operation of internal control over financial reporting which are reasonably likely to adversely affect the registrant’s ability to record, process, summarize and report financial information; and
 
(b) Any fraud, whether or not material, that involves management or other employees who have a significant role in the registrant’s internal control over financial reporting.

Date: October 4, 2018

/s/ MARK S. GREENBLATT          
Mark S. Greenblatt
Vice President
Chief Financial Officer


EXHIBIT 32


EXHIBIT 32

CERTIFICATION PURSUANT TO
18 U.S.C. SECTION 1350,
AS ADOPTED PURSUANT TO
SECTION 906 OF THE SARBANES-OXLEY ACT OF 2002

In connection with the Annual Report of J.W. Mays, Inc. (the “Company”) on Form 10-K for the period ending July 31, 2018 as filed with the U.S. Securities and Exchange Commission (the “Report”), we, Lloyd J. Shulman and Mark S. Greenblatt, Chief Executive Officer and Chief Financial Officer, respectively, of the Company, certify, pursuant to 18 U.S.C. §1350, as adopted pursuant to §906 of the Sarbanes-Oxley Act of 2002, that to our knowledge:

(1)       The Report fully complies with the requirements of Section 13(a) or 15(d) of the Securities Exchange Act of 1934; and
 
(2) The information contained in the Report fairly presents, in all material respects, the financial condition and results of operations of the Company.

October 4, 2018

/s/ LLOYD J. SHULMAN          
Lloyd J. Shulman
Chief Executive Officer
 
/s/ MARK S. GREENBLATT
Mark S. Greenblatt
Chief Financial Officer

A signed original of this written statement required by Section 906 has been provided to J.W. Mays, Inc. and will be retained by J.W. Mays, Inc. and furnished to the U.S. Securities and Exchange Commission or its staff upon request.


v3.10.0.1
DOCUMENT AND ENTITY INFORMATION - USD ($)
12 Months Ended
Jul. 31, 2018
Sep. 04, 2018
Jan. 31, 2018
Document And Entity Information [Abstract]      
Entity Registrant Name MAYS J W INC    
Entity Central Index Key 0000054187    
Current Fiscal Year End Date --07-31    
Entity Filer Category Non-accelerated Filer    
Entity Small Business true    
Entity Shell Company false    
Entity Emerging Growth Company false    
Trading Symbol mays    
Document Type 10-K    
Amendment Flag false    
Document Period End Date Jul. 31, 2018    
Document Fiscal Period Focus FY    
Document Fiscal Year Focus 2018    
Entity Well-Known Seasoned Issuer No    
Entity Voluntary Filers No    
Entity Current Reporting Status Yes    
Entity Common Stock, Shares Outstanding   2,015,780  
Entity Public Float     $ 16,836,624
v3.10.0.1
CONSOLIDATED BALANCE SHEETS - USD ($)
Jul. 31, 2018
Jul. 31, 2017
Property and Equipment-at cost (Notes 1, 3, 4, 14 and 15):    
Buildings and improvements $ 82,728,826 $ 80,825,601
Improvements to leased property 1,478,012 1,478,012
Fixtures and equipment 144,545 144,545
Land 6,067,805 6,067,805
Other 205,619 193,015
Construction in progress 1,786,980 644,809
Property, Plant and Equipment, Gross 92,411,787 89,353,787
Less accumulated depreciation 41,618,803 39,868,698
Property and equipment-net 50,792,984 49,485,089
Current Assets:    
Cash and cash equivalents (Notes 9 and 10) 5,255,073 5,381,195
Receivables (Notes 1, 6 and 10) 252,304 164,716
Income taxes refundable 8,792 6,891
Restricted cash 100,789 15,905
Prepaid expenses 1,951,132 1,675,019
Total current assets 7,568,090 7,243,726
Other Assets:    
Deferred charges (Notes 1 and 11) 3,228,162 3,465,062
Less accumulated amortization (Notes 1 and 11) 1,369,445 1,384,142
Net 1,858,717 2,080,920
Restricted cash 1,523,761 1,279,829
Unbilled receivables (Notes 1, 4, 6 and 10) 1,677,093 1,943,648
Marketable securities (Notes 1, 2, 10 and 13) 3,141,828 2,815,727
Total other assets 8,201,399 8,120,124
TOTAL ASSETS 66,562,473 64,848,939
Long-Term Liabilities:    
Mortgage payable, net (Notes 3 and 10) 5,264,285 5,409,908
Security deposits payable (Note 10) 1,242,382 1,020,292
Deferred income taxes (Notes 1 and 4) 4,506,000 5,637,000
Total long-term liabilities 11,012,667 12,067,200
Current Liabilities:    
Accounts payable 74,205 79,103
Payroll and other accrued liabilities (Notes 1, 5 and 7) 2,104,359 2,515,616
Other taxes payable 8,240 8,135
Current portion of mortgage payable (Notes 3 and 10) 168,501 162,569
Current portion of security deposits payable (Note 10) 101,289 15,905
Total current liabilities 2,456,594 2,781,328
Total liabilities 13,469,261 14,848,528
Shareholders' Equity:    
Common stock, par value $1 each share (shares-5,000,000 authorized; 2,178,297 issued) 2,178,297 2,178,297
Additional paid in capital 3,346,245 3,346,245
Unrealized gain on available-for-sale securities - net of deferred taxes of $313,000 at July 31, 2018 and $190,000 at July 31, 2017 (Notes 1, 4, 10 and 13) 487,136 368,476
Retained earnings 48,369,386 45,395,245
Stockholders' Equity before Treasury Stock 54,381,064 51,288,263
Less common stock held in treasury, at cost - 162,517 shares at July 31, 2018 and July 31, 2017 (Note 12) 1,287,852 1,287,852
Total shareholders' equity 53,093,212 50,000,411
Commitments (Notes 5 and 6) and Contingencies (Notes 8 and 15)
TOTAL LIABILITIES AND SHAREHOLDERS' EQUITY $ 66,562,473 $ 64,848,939
v3.10.0.1
CONSOLIDATED BALANCE SHEETS (Parenthetical) - USD ($)
Jul. 31, 2018
Jul. 31, 2017
Common stock, par value $ 1 $ 1
Common stock, shares authorized 5,000,000 5,000,000
Common stock, shares issued 2,178,297 2,178,297
Treasury stock, shares 162,517 162,517
Unrealized Gain on Available-for-sale Securities - Net of Deferred Taxes [Member]    
Unrealized gain (loss) on available-for-sale securities, deferred taxes (benefit) $ 313,000 $ 190,000
v3.10.0.1
CONSOLIDATED STATEMENTS OF INCOME AND RETAINED EARNINGS - USD ($)
12 Months Ended
Jul. 31, 2018
Jul. 31, 2017
Jul. 31, 2016
Revenues      
Rental income (Notes 1 and 6) $ 19,300,882 $ 18,517,602 $ 17,416,187
Recovery of real estate taxes 10,952
Revenue to temporarily vacate lease (Note 14) 1,020,833 1,166,667
Total revenues 19,300,882 19,549,387 18,582,854
Expenses      
Real estate operating expenses (Note 5) 11,074,396 10,212,761 10,080,913
Administrative and general expenses 4,598,144 4,616,086 4,333,589
Depreciation (Note 1) 1,775,690 1,682,690 1,635,660
(Gain) on disposition of property and equipment (500)
Total expenses 17,448,230 16,511,537 16,049,662
Income from operations before investment income, interest expense and income taxes 1,852,652 3,037,850 2,533,192
Investment income and interest expense:      
Investment income (Notes 1 and 2) 110,963 94,627 25,949
Interest expense (Notes 3, and 9) (233,474) (225,938) (245,381)
Total investment income and interest expense: (122,511) (131,311) (219,432)
Income from operations before income taxes 1,730,141 2,906,539 2,313,760
Income taxes provided (benefit) (Notes 1 and 4) (1,244,000) 981,000 796,000
Net income 2,974,141 1,925,539 1,517,760
Retained earnings, beginning of year 45,395,245 43,469,706 41,951,946
Retained earnings, end of year $ 48,369,386 $ 45,395,245 $ 43,469,706
Income per common share (Note 1) $ 1.48 $ 0.96 $ 0.75
Dividends per share
Average common shares outstanding (Note 1) 2,015,780 2,015,780 2,015,780
v3.10.0.1
CONSOLIDATED STATEMENTS OF COMPREHENSIVE INCOME - USD ($)
12 Months Ended
Jul. 31, 2018
Jul. 31, 2017
Jul. 31, 2016
Statement of Comprehensive Income [Abstract]      
Net income $ 2,974,141 $ 1,925,539 $ 1,517,760
Unrealized gain on available-for-sale securities:      
Unrealized holding gains arising during the period net of taxes of $130,963, $68,000 and $43,000 for the fiscal years 2018, 2017 and 2016, respectively (Note 13) 134,117 130,776 85,515
Reclassification adjustment for net gains included in net income, net of taxes of $7,963 for the year ended July 31, 2018 and $14,000 for the year ended July 31, 2017 and $8,000 for the year ended July 31, 2016 (Note 13) (15,457) (26,841) (17,007)
Unrealized gain on available-for-sale securities, net of taxes 118,660 103,935 68,508
Comprehensive income $ 3,092,801 $ 2,029,474 $ 1,586,268
v3.10.0.1
CONSOLIDATED STATEMENTS OF COMPREHENSIVE INCOME (Parenthetical) - USD ($)
12 Months Ended
Jul. 31, 2018
Jul. 31, 2017
Jul. 31, 2016
Statement of Comprehensive Income [Abstract]      
Unrealized holding gains arising during the period, tax $ 130,963 $ 68,000 $ 43,000
Reclassification adjustment for net gains included in net income, tax $ 7,963 $ 14,000 $ 8,000
v3.10.0.1
CONSOLIDATED STATEMENTS OF CASH FLOWS - USD ($)
12 Months Ended
Jul. 31, 2018
Jul. 31, 2017
Jul. 31, 2016
Cash Flows From Operating Activities:      
Net income $ 2,974,141 $ 1,925,539 $ 1,517,760
Adjustments to reconcile net income to net cash provided by operating activities:      
Provision (benefit) for deferred income taxes (1,254,000) 966,000 727,000
Deferred revenue (1,020,833) (1,166,667)
Realized (gain) loss on sale of marketable securities 805 (23,734) 36,999
(Gain) on disposition of property and equipment (500)
Depreciation 1,775,690 1,682,690 1,635,660
Amortization of deferred charges 296,298 279,875 315,779
Deferred finance costs included in interest expense 22,877 22,877 22,872
Other assets - deferred charges (74,095) (417,031) (63,105)
- unbilled receivables 266,555 198,896 390,400
- unbilled receivable - bad debts 80,302
- receivables 30,000
Changes in:      
Receivables (87,588) 128,601 345,326
Prepaid expenses (276,113) (121,802) (75,221)
Income taxes refundable (1,901) 10,113 678,261
Accounts payable (4,898) (1,240) 40,584
Payroll and other accrued liabilities (411,257) 270,849 (473,560)
Other taxes payable 105 1,172 991
Net cash provided by operating activities 3,226,619 3,982,274 3,962,579
Cash Flows From Investing Activities:      
Acquisition of property and equipment (3,083,585) (2,103,042) (2,508,505)
Restricted cash (328,816) (136,396) 252,626
Marketable securities:      
Receipts from sales 268,857 282,435 314,008
Payments for purchases (354,103) (854,288) (848,200)
Net cash (used) by investing activities (3,497,647) (2,811,291) (2,790,071)
Cash Flows From Financing Activities:      
Increase - security deposits payable 307,474 138,232 121,377
Payments - mortgage and other debt payments (162,568) (1,156,846) (150,763)
Net cash provided (used) by financing activities 144,906 (1,018,614) (29,386)
Net increase (decrease) in cash and cash equivalents (126,122) 152,369 1,143,122
Cash and cash equivalents at beginning of year 5,381,195 5,228,826 4,085,704
Cash and cash equivalents at end of year $ 5,255,073 $ 5,381,195 $ 5,228,826
v3.10.0.1
SUMMARY OF SIGNIFICANT ACCOUNTING POLICIES
12 Months Ended
Jul. 31, 2018
Accounting Policies [Abstract]  
SUMMARY OF SIGNIFICANT ACCOUNTING POLICIES

1. SUMMARY OF SIGNIFICANT ACCOUNTING POLICIES:

Organization

J.W. Mays, Inc. (the “Company” or “Registrant”) with executive offices at 9 Bond Street, Brooklyn, New York 11201, operates a number of commercial real estate properties in New York and one building in Ohio. The Company’s business was founded in 1924 and incorporated under the laws of the State of New York on July 6, 1927.

Consolidation

The consolidated financial statements include the accounts of the Company, a New York corporation and its subsidiaries (J. W. M. Realty Corp. and Dutchess Mall Sewage Plant, Inc.), which are wholly-owned. Material intercompany items have been eliminated in consolidation.

Accounting Records and Use of Estimates

The accounting records are maintained in accordance with accounting principles generally accepted in the United States of America (“GAAP”). The preparation of the Company’s financial statements in accordance with GAAP requires management to make estimates and assumptions that affect the reported amounts of assets and liabilities at the date of the financial statements, the disclosure of contingent assets and liabilities, and the reported amounts of revenues and expenses during the reporting period. The estimates that we make include allowance for doubtful accounts, depreciation, income tax assets and liabilities, fair value of marketable securities, revenue recognition and accrued expenses. Estimates are based on historical experience where applicable or other assumptions that management believes are reasonable under the circumstances. Due to the inherent uncertainty involved in making estimates, actual results may differ from those estimates under different assumptions or conditions.

Restricted Cash

Restricted cash primarily consists of cash held in bank accounts for tenant security deposits and other amounts required under certain loan agreements.

Rental Income and Receivables

All of the real estate owned by the Company is held for leasing to tenants except for a small portion used for Company offices. Rent is recognized from tenants under executed leases no later than on an established date or on an earlier date if the tenant should commence conducting business. Unbilled receivables represent the excess of scheduled rental income recognized on a straight-line basis over rental income as it becomes receivable according to the provisions of the lease. Contingent rental income is recorded when earned and is not based on tenant revenue. The effect of lease modifications that result in rent relief or other credits to tenants, including any retroactive effects relating to prior periods, is recognized in the period when the lease modification is signed. At the time of the lease modification, we assess the realizability of any accrued but unpaid rent and amounts that had been recognized as revenue in prior periods. If the amounts are not determined to be realizable, the accrued but unpaid rent is written off. Accounts receivable are recognized in accordance with lease agreements at its net realizable value. Rental payments received in advance are deferred until earned.

Based upon its periodic assessment of the quality of the receivables, management uses its historical knowledge of the tenants and industry experience to determine whether a reserve or write-off is required. Management has determined that no allowance for uncollected receivables is considered necessary. The Company uses specific identification to write-off receivables to bad debt expense in the period when issues of collectability become known. Collectability issues include circumstances when a tenant indicates their intention to vacate the property without paying, or when tenant litigation or bankruptcy proceedings are not expected to result in full payment. Due to the early termination of a lease, the Company recorded a bad debt expense of $80,302 for the year ended July 31, 2017, which is included in administration and general expenses.

Property and Equipment

Property and equipment are stated at cost. Depreciation is calculated using the straight-line method and the declining-balance method. Amortization of improvements to leased property is calculated over the shorter of the life of the lease or the estimated useful life of the improvements. Lives used to determine depreciation and amortization are generally as follows:

Buildings and improvements 18-40 years
Improvements to leased property 3-40 years
Fixtures and equipment 7-12 years
Other 3-5 years

Maintenance, repairs, renewals and improvements of a non-permanent nature are charged to expense when incurred. Expenditures for additions and major renewals or improvements are capitalized along with the associated interest cost during construction. The cost of assets sold or retired and the accumulated depreciation or amortization thereon are eliminated from the respective accounts in the year of disposal, and the resulting gain or loss is credited or charged to income. Capitalized interest is recorded as part of the asset to which it relates and is amortized over the asset’s estimated useful life.

The Company reviews long-lived assets for impairment whenever circumstances and situations change such that there is an indication that the carrying amounts may not be recovered. At July 31, 2018 and 2017, there were no impairments of its property and equipment.

Deferred Charges

Deferred charges consist principally of costs incurred in connection with the leasing of property to tenants. Such costs are amortized over the related lease periods, ranging from 1 to 21 years, using the straight-line method. If a lease is terminated early, such costs are expensed.

Income Taxes

Deferred income taxes are provided for the temporary differences between the financial reporting basis and the tax basis of the Company’s assets and liabilities. Deferred tax assets result principally from the recording of certain accruals, reserves and net operating loss carry forwards which currently are not deductible for tax purposes. Deferred tax liabilities result principally from temporary differences in the recognition of unrealized gains and losses from certain investments and from the use, for tax purposes, of accelerated depreciation. Deferred tax assets and liabilities are offset for each jurisdiction and are presented net on the balance sheet.

The effect on deferred income taxes of a change in tax rates is recognized in income in the period that includes the enactment date. Actual income taxes could vary from these estimates due to future changes in income tax law or results from the final review of tax returns by federal, state or city tax authorities. Financial statement effects on tax positions are recognized in the period in which it is more likely than not that the position will be sustained upon examination, the position is effectively settled or when the statute of limitations to challenge the position has expired. Interest and penalties, if any, related to unrecognized tax benefits are recorded as interest expense and administrative and general expenses, respectively.

Income Per Share of Common Stock

Income per share has been computed by dividing net income for the year by the weighted average number of shares of common stock outstanding during the year, adjusted for the purchase of treasury stock. Shares used in computing income per share were 2,015,780 in fiscal years 2018, 2017 and 2016.

Marketable Securities

The Company categorizes marketable securities as either trading, available-for-sale or held-to-maturity at the time of purchase. Trading securities are carried at fair value with unrealized gains and losses included in income. Available-for-sale securities are carried at fair value measurements using quoted prices in active markets for identical assets or liabilities with unrealized gains and losses recorded as a separate component of shareholders’ equity. Held-to-maturity securities are carried at amortized cost. Dividends and interest income are accrued as earned. Realized gains and losses are determined on a specific identification basis. The Company reviews marketable securities for impairment whenever circumstances and situations change such that there is an indication that the carrying amounts may not be recovered. The Company did not classify any securities as trading or held to maturity during the three years ended July 31, 2018.

The Company follows GAAP which establishes a fair value hierarchy that prioritizes the valuation techniques and creates the following three broad levels, with Level 1 valuation being the highest priority:

Level 1 valuation inputs are quoted market prices in active markets for identical assets or liabilities that are accessible at the measurement date (e.g., equity securities traded on the New York Stock Exchange).

Level 2 valuation inputs are from other than quoted market prices included in Level 1 that are observable for the asset or liability, either directly or indirectly (e.g., quoted market prices of similar assets or liabilities in active markets, or quoted market prices for identical or similar assets or liabilities in markets that are not active).

Level 3 valuation inputs are unobservable (e.g., an entity’s own data) and should be used to measure fair value to the extent that observable inputs are not available.

Following is a description of the valuation methodologies used for assets measured at fair value on a recurring basis. There have been no changes in the methodologies used at July 31, 2018 and 2017.

Equity securities are valued at the closing price reported on the active market on which the individual securities are traded that the Company has access to.

Mutual funds are valued at the daily closing price as reported by the fund. Mutual funds held by the Company are open-end mutual funds that are registered with the U.S. Securities and Exchange Commission. These funds are required to publish their daily net asset value (“NAV”) and to transact at that price. The mutual funds held by the Company are deemed to be actively traded.

In accordance with the provisions of Fair Value Measurements, the following are the Company’s financial assets measured on a recurring basis presented at fair value.

Fair value measurements at reporting date using
Description    July 31, 2018    Level 1    Level 2    Level 3    July 31, 2017    Level 1    Level 2    Level 3
Assets:                                                           
Marketable securities - available-for-sale $ 3,141,828 $ 3,141,828 $ $– $ 2,815,727 $ 2,815,727      $      $

Recently issued accounting standards not yet adopted:

In May 2014, the Financial Accounting Standards Board (“FASB”), issued Accounting Standards Update (“ASU”) 2014-09 “Revenue from Contracts with Customers” (“ASU 2014-09”) establishing ASC Topic 606 Revenue from Contracts with Customers. ASU 2014-09 establishes a single comprehensive model for entities to use in accounting for revenue arising from contracts with customers and supersedes most of the existing revenue recognition guidance. ASU 2014-09 requires an entity to recognize revenue when it transfers promised goods or services to customers in an amount that reflects the consideration to which the entity expects to be entitled in exchange for those goods or services and also requires certain additional disclosures. ASU 2014-09 is effective for interim and annual reporting in fiscal years that begin after December 15, 2016. ASU 2015-14 extended the implementation date for fiscal years beginning after December 31, 2017.

Subsequent to the issuance of ASU 2014-09, the FASB issued ASU No. 2016-08, “Revenue from Contracts with Customers (Topic 606): Principal versus Agent Considerations (Reporting Revenue Gross versus Net)”, ASU No. 2016-10, “Revenue from Contracts with Customers (Topic 606): Identifying Performance Obligations and Licensing”, ASU No. 2016-12, “Revenue from Contracts with Customers (Topic 606): Narrow-Scope Improvements and Practical Expedients”, and ASU No. 2016-20, “Technical Corrections and Improvements to Topic 606, Revenue from Contracts with Customers.” The additional ASU’s clarified certain provisions of ASU 2014-09 in response to recommendations from the Transition Resource Group established by the FASB and have the same effective date and transition requirements as ASU 2014-09. We adopted these standards effective August 1, 2018 and expect the adoption will not have a significant impact on our consolidated financial statements.

In January 2016, the FASB issued ASU No. 2016-01 “Financial Instruments-Overall (Subtopic 825-10): Recognition and Measurement of Financial Assets and Financial Liabilities.” ASU 2016-01 amends certain aspects of recognition, measurement, presentation and disclosure of financial instruments, including the requirement to measure certain equity investments at fair value with changes in fair value recognized in net income. ASU No. 2016-01 is effective for interim and annual periods beginning after December 15, 2017. We adopted this standard effective August 1, 2018 and expect the adoption will not have a significant impact on our consolidated financial statements.

In February 2016, the FASB issued ASU 2016-02, “Leases.” ASU 2016-02 is intended to increase transparency and comparability among organizations of accounting for leasing arrangements. This guidance establishes a right-of-use model that requires a lessee to record a right-of-use asset and a lease liability on the balance sheet for all leases with terms longer than twelve months. Leases will be classified as either finance or operating, with classification affecting the pattern of expense recognition in the income statement. Lessor accounting remains similar to the current model, but updated to align with certain changes to the lessee model and the new revenue recognition standard (ASU 2014-09). ASU 2016-02 offers specific accounting guidance for a lessee, a lessor and sale and leaseback transactions. Lessees and lessors are required to disclose qualitative and quantitative information about leasing arrangements to enable a user of the financial statements to assess the amount, timing and uncertainty of cash flows arising from leases. Entities will be required to recognize and measure leases as of the earliest period presented using a modified retrospective approach.

In July 2018, the FASB issued ASU No. 2018-10, “Codification Improvements to Topic 842”, which provides amendments and clarification to ASU 2016-12 based on the FASB’s interaction with stakeholders. In July 2018, the FASB issued ASU No. 2018-11 “Leases (Topic 842): Targeted Improvements”, which amends Leases (Topic 842) to (i) add an optional transition method that would permit entities to apply the new requirements by recognizing a cumulative-effect adjustment to the opening balance of retained earnings in the year of adoption, and (ii) provide a practical expedient for lessors regarding the separation of the lease and non-lease components of a contract. The standards are effective for fiscal years beginning after December 15, 2018, including interim periods within those fiscal years. The new standards will be effective for the Company for the fiscal year beginning August 1, 2019, with early adoption permitted, and the Company expects to use the cumulative-effect adjustment approach in the year of adoption. The adoption of this guidance is expected to result in an increase in assets and liabilities on the Company’s balance sheet, with no material impact on the statement of operations. However, the ultimate impact of adopting this ASU will depend on the Company’s lease portfolio as of the adoption date.

In November 2016, the FASB issued ASU 2016-18, “Restricted Cash”. ASU 2016-18 requires that a statement of cash flows explain the change during the period in the total of cash, cash equivalents, and amounts generally described as restricted cash or restricted cash equivalents. Restricted cash and restricted cash equivalents will be included with cash and cash equivalents when reconciling the beginning of period and end of period balances on the statement of cash flows upon adoption of this standard. ASU 2016-18 is effective for interim and annual reporting periods in fiscal years beginning after December 15, 2017. We adopted this standard effective August 1, 2018 and expect the adoption will not have a significant impact on our consolidated financial statements.

In February 2018, the FASB issued ASU 2018-02, “Income Statement—Reporting Comprehensive Income (Topic 220)”. ASU 2018-02 allows a reclassification from accumulated other comprehensive income to retained earnings for stranded tax effects resulting from the December 22, 2017 Tax Act. The amendments in this ASU are effective for all entities for fiscal years beginning after December 15, 2018, and interim periods within those fiscal years. Early adoption of the amendments in this ASU is permitted, including adoption in any interim period, (1) for public business entities for reporting periods for which financial statements have not yet been issued and (2) for all other entities for reporting periods for which financial statements have not yet been made available for issuance. The amendments in this ASU should be applied either in the period of adoption or retrospectively to each period (or periods) in which the change in the U.S. federal corporate income tax rate in the Tax Act is recognized. We are in the process of evaluating the impact of this standard on the consolidated financial statements.

v3.10.0.1
MARKETABLE SECURITIES
12 Months Ended
Jul. 31, 2018
Investments, Debt and Equity Securities [Abstract]  
MARKETABLE SECURITIES

2. MARKETABLE SECURITIES:

As of July 31, 2018 and 2017, the Company’s marketable securities were classified as follows:

July 31, 2018 July 31, 2017
      Cost     Gross
Unrealized

Gains
    Gross
Unrealized

Losses
    Fair
Value
    Cost     Gross
Unrealized
Gains
    Gross
Unrealized
Losses
    Fair
Value
Non-current:               
Available-for-sale:
Mutual funds $ 774,602 $ 237,149 $ $ 1,011,751 $ 716,463 $ 193,932 $ $ 910,395
Corporate equity securities 1,567,089 562,988 2,130,077 1,540,788 364,544 1,905,332
$ 2,341,691 $ 800,137 $ $ 3,141,828 $ 2,257,251 $ 558,476 $ $ 2,815,727

Investment income for the years ended July 31, 2018, 2017 and 2016 consists of the following:

2018 2017 2016
Interest income       $ 25,414       $ 13,176       $ 8,422
Dividend income 86,354 57,717 54,526
Gain (loss) on sale of marketable securities (805 ) 23,734 (36,999 )
Total $ 110,963 $ 94,627 $ 25,949
v3.10.0.1
LONG-TERM DEBT - MORTGAGE
12 Months Ended
Jul. 31, 2018
LONG-TERM DEBT - MORTGAGES AND TERM LOAN [Abstract]  
LONG-TERM DEBT - MORTGAGE

3. LONG-TERM DEBT—MORTGAGE:

July 31, 2018 July 31, 2017
Current
Annual Final Due Due Due Due
Interest Payment Within After Within After
Rate Date One Year One Year One Year One Year
Mortgage:                                      
Bond St. building, Brooklyn, NY 3.54% 2/1/2020 $ 168,501 $ 5,298,610 $ 162,569 $ 5,467,110
Less: Deferred financing costs 34,325 57,202
Total $ 168,501 $ 5,264,285 $ 162,569 $ 5,409,908

On January 9, 2015, the Company refinanced its loan with a bank for $6,000,000, which included the outstanding balance as of January 2015 in the amount of $5,347,726 and an additional borrowing of $652,274. The loan is for a period of five years with a payment based on a twenty-five year amortization period. The interest rate for this period is fixed at 3.54% per annum. The mortgage loan is secured by the Bond Street building in Brooklyn, New York.

Maturities of long-term mortgage and term loan payable outstanding at July 31, 2018 are as follows: Years ending July 31, 2019 (included in current liabilities): $168,501; and 2020: $5,298,610.

The carrying value of the property collateralizing the above debt is $22,280,525 at July 31, 2018.

v3.10.0.1
INCOME TAXES
12 Months Ended
Jul. 31, 2018
Income Tax Disclosure [Abstract]  
INCOME TAXES

4. INCOME TAXES:

On December 22, 2017, the United States government (“U.S.”) enacted significant changes to the U.S. tax law following the passage and signing of H.R.1, “An Act to Provide for Reconciliation Pursuant to Titles II and V of the Concurrent Resolution on the Budget for Fiscal Year 2018” (the “Tax Act”) (previously known as “The Tax Cuts and Jobs Act”). The Tax Act included significant changes to existing tax law, including a permanent reduction to the U.S. federal corporate income tax rate from 34% to 21%, a one-time repatriation tax on deferred foreign income, deductions, credits and business related exclusions.

The permanent reduction to the U.S. federal corporate income tax rate from 34% to 21% was effective January 1, 2018 (the “Effective Date”). When a U.S. federal tax rate change occurs during a fiscal year, taxpayers are required to compute a weighted daily average rate for the fiscal year of enactment. As a result of the Tax Act, the Company has calculated a U.S. federal statutory corporate income tax rate of 26% for the fiscal year ending July 31, 2018 and applied this rate in computing the income tax provision. The U.S. federal statutory corporate income tax rate of 26% is the weighted daily average rate between the pre-enactment U.S. federal statutory tax rate of 34%, applicable to the Company’s fiscal year ending July 31 2018 prior to the Effective Date, and the post-enactment U.S. federal statutory tax rate of 21% applicable thereafter. The Company expects the U.S. federal statutory rate to be 21% for fiscal years beginning after July 31, 2018.

On December 22, 2017, the SEC issued Staff Accounting Bulletin 118 (“SAB 118”). SAB 118 expresses views of the SEC regarding ASC Topic 740, Income Taxes (“ASC 740”), in the reporting period that includes the enactment date of the Tax Act. The SEC staff issuing SAB 118 (the “Staff’) recognized that a registrant’s review of certain income tax effects of the Tax Act may be incomplete at the time financial statements are issued for the reporting period that includes the enactment date, including interim periods therein. If a company does not have the necessary information available, prepared or analyzed for certain income tax effects of the Tax Act, SAB 118 allows a company to report provisional numbers and adjust those amounts during the measurement period not to extend beyond one year. The Company has recorded all known and estimable impacts of the Tax Act that are effective for the fiscal year ended July 31, 2018. Future adjustments to the provisional numbers will be recorded as discrete adjustments to income tax expense in the period in which those adjustments become estimable and/or are finalized.

As of July 31, 2017, the Company had net deferred federal tax liabilities totaling approximately $5.6 million. The lower future tax rate means the future expense of existing deferred tax liabilities needs to be computed at the new, lower tax rate which results in a reduction in deferred tax liabilities and an income tax benefit in the period of enactment.

As a direct result of the permanent reduction in federal tax rates from 34% to 21%, the value of these net deferred tax liabilities has declined. Accordingly, the Company’s income tax provision for the fiscal year ended July 31, 2018 includes a $2.4 million non-cash reduction to the value of net deferred tax liabilities to the revised value based on the new, lower tax rate.

In accordance with SAB 118, the provision estimates recorded represent reasonable estimates of the effects of the Tax Act for which the analysis is not yet complete. As the Company completes its analysis of the effects of the Tax Act, including performing and refining calculations and obtaining additional guidance from such standard setting and regulatory bodies as the US Internal Revenue Services, US Treasury Department and FASB, among others, it may record adjustments to the provisional estimates. The Company expects to finalize its provisional estimates at the earlier of the time it files its US federal income tax return for the fiscal year ended July 31, 2018 or the end of the measurement period provided for under SAB 118, which is December 31, 2018.

Income taxes provided for the years ended July 31, 2018, 2017 and 2016 consist of the following:

2018 2017 2016
Current:
Federal       $ 10,000       $ 15,000       $ 69,000
Deferred taxes:
Federal (1,841,000 ) 966,000 727,000
State 587,000
Total provision $ (1,244,000 ) $ 981,000 $ 796,000

Taxes provided for the years ended July 31, 2018, 2017 and 2016 differ from amounts which would result from applying the federal statutory tax rate to pre-tax income, as follows:

2018 2017 2016
Income before income taxes             $ 1,730,141       $ 2,906,539       $ 2,313,760
Other-net 2,443 4,507 7,427
Adjusted pre-tax income $ 1,732,584 $ 2,911,046 $ 2,321,187
Statutory rate 26.42 % 34 % 34 %
Income tax provision at statutory rate $ 457,749 $ 989,756 $ 789,204
Remeasurement of federal deferred income taxes (2,390,000 )
State deferred income taxes 587,000
Other-net 101,251 (8,756 ) 6,796
Income tax provision $ (1,244,000 ) $ 981,000 $ 796,000

The Company has a federal net operating loss carryforward approximating $4,053,000, $5,446,000 and $6,580,000 as of July 31, 2018, July 31, 2017 and July 31, 2016, respectively, available to offset future taxable income. As of July 31, 2018, 2017 and 2016, the Company had unused state and city net operating loss carryforwards of approximately $10,107,000 for state and $8,274,000 for city, available to offset future state and city taxable income. The net operating loss carryforwards will begin to expire, if not used, in 2035.

The Company’s federal tax returns have been audited through the year ended July 31, 2013 and the New York State and New York City tax returns have been audited through July 31, 2012.

Generally, tax returns filed are subject to audit for three years by the appropriate taxing jurisdictions. The statute of limitations in each of the state jurisdictions in which the Company operates remain open until the years are settled for federal income tax purposes, at which time amended state income tax returns reflecting all federal income tax adjustments are filed. As of July 31, 2018, there were no income tax audits in progress that would have a material impact on the consolidated financial statements.

Significant components of the Company’s deferred tax assets and liabilities as of July 31, 2018 and 2017 are a result of temporary differences related to the items described as follows:

2018 2017
Deferred Deferred Deferred Deferred
      Tax Assets       Tax Liabilities       Tax Assets       Tax Liabilities
Rental income received in advance $ 174,975   $   $ 240,974    $   
Federal Net operating loss carryforward 851,175 1,851,535
State Net operating loss carryforward 665,934 660,840
Unbilled receivables 462,686 7,347,278
Property and equipment 5,916,568
Unrealized gain on marketable securities 220,746 189,882
Litigation deposit due from contractor 103,862 94,932
Other 298,054 373,559
$ 2,094,000 $ 6,600,000 $ 2,561,000 $ 8,198,000
Net deferred tax liability $ 4,506,000 $ 5,637,000

Management periodically assesses the realization of its net deferred tax assets by evaluating all available evidence, both positive and negative, associated with the Company and determining whether, based on the weight of that associated evidence, a valuation allowance for the deferred tax assets is needed. Based on this analysis, management has determined that it is more likely than not that future taxable income will be sufficient to fully utilize the federal and state deferred tax assets at July 31, 2018.

New York State and New York City taxes are calculated using the higher of taxes based on income or the respective capital-based franchise taxes. Beginning with the Company’s tax year ended July 31, 2016, changes in the law required the state capital-based tax will be phased out over a 7-year period. The Company anticipates New York State taxes will be based on income beginning August 1, 2018. For the quarter ending July 31, 2018, the Company recorded a state deferred tax asset, deferred tax liability and deferred taxes on unrealized gain on available-for-sale securities in the amounts of $790,000, $1,430,000 and $53,000, respectively, resulting in a state deferred tax expense of $587,000. New York City taxes will be based on capital for the foreseeable future. Capital-based franchise taxes are recorded to administrative and general expense. State tax amounts in excess of the capital-based franchise taxes are recorded to income tax expense. Due to both the application of the capital-based tax and due to the possible absence of city taxable income, the Company does not record city deferred taxes.

Components of the deferred tax provision (benefit) for the years ended July 31, 2018, 2017 and 2016 consist of the following:

      2018       2017       2016
Tax depreciation exceeding book depreciation $ (1,430,906 ) $ 397,273 $ 553,647
Federal operating loss carryforward 1,000,360 384,208 11,453
State net operating loss carryforward (665,934 )
Decrease (increase) of rental income received in advance 65,999 (82,775 ) 44,298
(Decrease) in unbilled receivables (198,154 ) (94,927 ) (132,736 )
Increase (decrease) in average rent payable 81,230 29,383 (28,389 )
Deferred revenue 347,083 396,667
Litigation deposit due from contractor (8,930 ) (94,932 )
Other (97,665 ) (14,245 ) (23,008 )
$ (1,254,000 ) $ 966,000 $ 727,000
v3.10.0.1
LEASES
12 Months Ended
Jul. 31, 2018
Leases [Abstract]  
LEASES

5. LEASES:

The Company’s real estate operations encompass both owned and leased properties. The current leases on leased property, most of which have options to extend the terms, range from 3 years to 25 years. Certain of the leases provide for additional rentals under certain circumstances and obligate the Company for payments of real estate taxes and other expenses.

Rental expense for leased real property for each of the three fiscal years in the period ended July 31, 2018 was exceeded by sublease rental income, as follows:

2018 2017 2016
Minimum rental expense       $ 1,750,859       $ 1,899,374       $ 1,726,528
Contingent rental expense 1,034,762 833,641 825,695
2,785,621 2,733,015 2,552,223
Sublease rental income 6,901,958 6,750,325 6,341,145
Excess of sublease income over expense $ 4,116,337 $ 4,017,310 $ 3,788,922

Rent expense related to an affiliate principally owned by a director of the Company totaled $987,250 for fiscal year ended July 31, 2018, $987,250 for fiscal year ended 2017 and $836,813 for fiscal year ended 2016. The rent expense is derived from two leases which expire July 31, 2027 and April 30, 2031, respectively. Rent expense is recognized on a straight-line basis over the lives of the leases.

The lease which expires July 31, 2027 related to an affiliate principally owned by a director of the Company, is for a ground lease which permitted the Company to construct a building during the lease period. In accordance with the terms of the lease, upon lease termination in 2027, the building and all improvements are turned over to the property owner.

Future minimum non-cancelable rental commitments for operating leases with initial or remaining terms of one year or more are payable as follows:

Operating
Fiscal Year       Leases
2019 $ 1,853,841
2020 1,858,754
2021 1,860,485
2022 1,856,314
2023 1,864,455
After 2023 10,801,871
Total required* $ 20,095,720

*        Minimum payments have not been reduced by minimum sublease rentals of $31,436,747 under operating leases due in the future under non-cancelable leases.
v3.10.0.1
RENTAL INCOME
12 Months Ended
Jul. 31, 2018
RENTAL INCOME [Abstract]  
RENTAL INCOME

6. RENTAL INCOME:

Rental income for each of the fiscal years 2018, 2017 and 2016 is as follows:

July 31,
      2018       2017       2016
Minimum rentals
Company owned property $ 11,652,482 $ 11,144,902 $ 10,478,878
Leased property 6,502,219 6,414,724 6,008,185
18,154,701 17,559,626 16,487,063
Contingent rentals
Company owned property 746,442 622,375 596,164
Leased property 399,739 335,601 332,960
1,146,181 957,976 929,124
Total $ 19,300,882 $ 18,517,602 $ 17,416,187

Future minimum non-cancelable rental income for leases with initial or remaining terms of one year or more is as follows:

Company
Owned Leased
Fiscal Year       Property       Property       Total
2019 $ 10,702,102 $ 5,601,866 $ 16,303,968
2020 9,775,733 4,072,267 13,848,000
2021 9,331,495 3,216,011 12,547,506
2022 7,352,730 2,878,732 10,231,462
2023 8,261,901 2,463,368 10,725,269
After 2023 56,946,159 13,204,503 70,150,662
Total $ 102,370,120 $ 31,436,747 $ 133,806,867

Rental income is recognized on a straight-line basis over the lives of the leases.

v3.10.0.1
PAYROLL AND OTHER ACCRUED LIABILITIES
12 Months Ended
Jul. 31, 2018
Payables and Accruals [Abstract]  
PAYROLL AND OTHER ACCRUED LIABILITIES

7. PAYROLL AND OTHER ACCRUED LIABILITIES:

Payroll and other accrued liabilities for the fiscal years ended July 31, 2018 and 2017 consist of the following:

      2018       2017
Payroll $ 259,149 $ 260,741
Interest 16,666 17,161
Professional fees 140,000 145,000
Rents received in advance 644,728 708,747
Utilities 19,200 12,452
Brokers commissions 134,418 287,940
Construction costs 146,132
Other 890,198 937,443
Total 2,104,359 2,515,616
Less current portion 2,104,359 2,515,616
Long term portion $ $
v3.10.0.1
EMPLOYEES' RETIREMENT PLANS
12 Months Ended
Jul. 31, 2018
Retirement Benefits [Abstract]  
EMPLOYEES' RETIREMENT PLANS

8. EMPLOYEES’ RETIREMENT PLANS:

The Company sponsors a non-contributory Money Purchase Plan covering substantially all of its non-union employees. Operations were charged $413,256, $399,651, and $391,962, as contributions to the Plan for fiscal years 2018, 2017 and 2016, respectively.

MULTI-EMPLOYER PLAN:

The Company contributes to a union sponsored multi-employer pension plan covering its union employees. The Company contributions to the pension plan for the years ended July 31, 2018, 2017 and 2016 were $62,425, $56,880, and $53,405, respectively. Contributions and costs are determined in accordance with the provisions of negotiated labor contracts or terms of the plans. The Company also contributes to union sponsored health benefit plans.

CONTINGENT LIABILITY FOR PENSION PLANS:

Information as to the Company’s portion of accumulated plan benefits and plan assets is not reported separately by the pension plan. Under the Employee Retirement Income Security Act, upon withdrawal from a multi-employer benefit plan, an employer is required to continue to pay its proportionate share of the plan’s unfunded vested benefits, if any. Any liability under this provision cannot be determined: however, the Company has not made a decision to withdraw from the plan.

Information for contributing employer’s participation in the multi-employer plan:

Legal name of Plan: United Food and Commercial Workers Local 888 Pension Fund
Employer identification number: 13-6367793
Plan number: 001
Date of most recent Form 5500: December 31, 2016
Certified zone status: Critical and declining status
Status determination date: January 1, 2018
Plan used extended amortization provisions in status calculation: Yes
Minimum required contribution: Yes
Employer contributing greater than 5% of Plan contributions for year ended December 31, 2016: Yes
Rehabilitation plan implemented: Yes
Employer subject to surcharge: Yes
Contract expiration date: November 30, 2019

For the plan years 2017-2019, under the pension fund’s rehabilitation plan, the Company agreed to pay a minimum contribution rate equal to 9.1% of the prior year total contribution rate. The Company has 30 employees and has a contract, expiring November 30, 2019, with a union covering rates of pay, hours of employment and other conditions of employment for approximately 23% of its employees. The Company considers that its labor relations with its employees and union are good.

v3.10.0.1
CASH FLOW INFORMATION
12 Months Ended
Jul. 31, 2018
Supplemental Cash Flow Elements [Abstract]  
CASH FLOW INFORMATION

9. CASH FLOW INFORMATION:

For purposes of reporting cash flows, the Company considers cash equivalents to consist of short-term highly liquid investments with maturities of three months or less, which are readily convertible into cash.

Supplemental disclosures:

July 31,
     2018      2017      2016
Interest paid, net of capitalized interest of $37,471 (2018), $20,360 (2017) and $49,707 (2016) $ 211,092 $ 209,789 $ 222,969
Income taxes paid (refunded) $ 36,494 $ 213,096 $ (367,755 )
v3.10.0.1
FINANCIAL INSTRUMENTS AND CREDIT RISK CONCENTRATIONS
12 Months Ended
Jul. 31, 2018
Fair Value Disclosures [Abstract]  
FINANCIAL INSTRUMENTS AND CREDIT RISK CONCENTRATIONS

10. FINANCIAL INSTRUMENTS AND CREDIT RISK CONCENTRATIONS:

The following disclosure of estimated fair value was determined by the Company using available market information and appropriate valuation methods. Considerable judgment is necessary to develop estimates of fair value. The estimates presented herein are not necessarily indicative of the amounts that could be realized upon disposition of the financial instruments.

The Company estimates the fair value of its financial instruments using the following methods and assumptions: (i) quoted market prices, when available, are used to estimate the fair value of investments in marketable debt and equity securities; (ii) discounted cash flow analyses are used to estimate the fair value of long-term debt, using the Company’s estimate of current interest rates for similar debt; and (iii) carrying amounts in the balance sheet approximate fair value for cash and cash equivalents, restricted cash, and tenant security deposits due to their high liquidity.

July 31, 2018 July 31, 2017
Carrying Fair Carrying Fair
      Value       Value       Value       Value
Cash and cash equivalents $ 5,255,073 $ 5,255,073 $ 5,381,195 $ 5,381,195
Marketable securities $ 3,141,828 $ 3,141,828 $ 2,815,727 $ 2,815,727
Restricted cash $ 1,624,550 $ 1,624,550 $ 1,295,734 $ 1,295,734
Security deposits payable $ 1,343,671 $ 1,343,671 $ 1,036,197 $ 1,036,197
Mortgage $ 5,467,111 $ 4,939,149 $ 5,629,679 $ 5,403,180

Financial instruments that are potentially subject to concentrations of credit risk consist principally of marketable securities, restricted cash, cash and cash equivalents, and receivables. Marketable securities, restricted cash, cash and cash equivalents, and receivables are placed with multiple financial institutions and instruments to minimize risk. No assurance can be made that such financial institutions and instruments will minimize all such risk.

The Company derived rental income from approximately fifty tenants during the years ended July 31, 2018 and the preceding two fiscal years.

As of July 31, 2018 four tenants accounted for approximately 77.7% of receivables and three tenants accounted for 66.9% of unbilled receivables. As of July 31, 2017 three tenants accounted for 66.7% of receivables and three tenants accounted for 71.6% of unbilled receivables. During the year ended July 31, 2018, three tenants accounted for 44.6% of total rental revenue. Three tenants accounted for 44.0% and two tenants accounted for 34.7% of total rental revenue for the years ended July 31, 2017 and 2016, respectively.

The Company has no irrevocable Letters of Credit at July 31, 2018 and one irrevocable Letter of Credit totaling $230,000 at July 31, 2017 provided by one tenant as a security deposit.

v3.10.0.1
DEFERRED CHARGES
12 Months Ended
Jul. 31, 2018
Deferred Costs, Capitalized, Prepaid, and Other Assets Disclosure [Abstract]  
DEFERRED CHARGES

11. DEFERRED CHARGES:

Deferred charges for the fiscal years ended July 31, 2018 and 2017 consist of the following:

July 31, 2018 July 31, 2017
Gross Gross
Carrying Accumulated Carrying Accumulated
Amount       Amortization       Amount       Amortization
Leasing brokerage commissions       $ 3,035,040 $ 1,264,427 $ 3,059,615 $ 1,089,934
Professional fees for leasing 193,122 105,018 405,447 294,208
Total $ 3,228,162 $ 1,369,445 $ 3,465,062 $ 1,384,142

The aggregate amortization expense for the three years in the period ended July 31, 2018 was $296,298, $279,875, and $315,779, respectively.

The weighted average life of current year additions to deferred charges was four years.

The estimated aggregate amortization expense for each of the five succeeding fiscal years is as follows:

Fiscal Year      Amortization
2019          $ 287,541   
2020 $ 234,462
2021 $ 215,897
2022 $ 188,856
2023 $ 167,132
v3.10.0.1
CAPITALIZATION
12 Months Ended
Jul. 31, 2018
Stockholders' Equity Note [Abstract]  
CAPITALIZATION

12. CAPITALIZATION:

The Company is capitalized entirely through common stock with identical voting rights and rights to liquidation. Treasury stock is recorded at cost and consists of 162,517 shares at July 31, 2018 and at July 31, 2017.

v3.10.0.1
ACCUMULATED OTHER COMPREHENSIVE INCOME
12 Months Ended
Jul. 31, 2018
ACCUMULATED OTHER COMPREHENSIVE INCOME [Abstract]  
ACCUMULATED OTHER COMPREHENSIVE INCOME

13. ACCUMULATED OTHER COMPREHENSIVE INCOME:

The only component of accumulated other comprehensive income is unrealized gains (losses) on available-for-sale securities.

A summary of the changes in accumulated other comprehensive income for the fiscal years ended July 31, 2018, 2017, and 2016 are as follows:

Years Ended July 31,
2018 2017 2016
Beginning balance, net of tax effect       $ 368,476       $ 264,541       $ 196,033
Other comprehensive income, net of tax effect:
Unrealized gains on available-for-sale securities 265,080 198,776 128,515
Tax effect (130,963 ) (68,000 ) (43,000 )
Unrealized gains on available-for-sale securities, net of tax effect 134,117 130,776 85,515
 

Amounts reclassified from accumulated other comprehensive income comprehensive income, net of tax effect:

Unrealized gain on available-for-sale securities reclassified

(23,420 ) (40,841 ) (25,007 )
Tax effect 7,963 14,000 8,000
Amount reclassified, net of tax effect (15,457 ) (26,841 ) (17,007 )
Ending balance, net of tax effect $ 487,136 $ 368,476 $ 264,541

A summary of the line items in the Consolidated Statements of Income and Retained Earnings affected by the amounts reclassified from accumulated other comprehensive income is as follows:

      Details about accumulated other       Affected line item in the statement
comprehensive income components where net income is presented
Other comprehensive income reclassified Investment income
Tax effect Income taxes provided
v3.10.0.1
ENTRY INTO A MATERIAL DEFINITIVE AGREEMENT
12 Months Ended
Jul. 31, 2018
ENTRY INTO A MATERIAL DEFINITIVE AGREEMENT [Abstract]  
ENTRY INTO A MATERIAL DEFINITIVE AGREEMENT

14. ENTRY INTO A MATERIAL DEFINITIVE AGREEMENT:

On June 16, 2014, the Company entered into a Second Amendment of Lease (the “Amendment”) with 33 Bond St. LLC (“Bond”), its landlord, for certain truck bays and approximately 1,000 square feet located at the cellar level within a garage at Livingston and Bond Street (“Premises”). Pursuant to the Amendment, (1) a lease option for the Premises was exercised extending the lease until December 8, 2043, (2) the Company, simultaneously with the execution of the Amendment, vacated the Premises so that Bond may demolish the building in which the Premises is located in order to develop and construct a new building at the location, and (3) Bond agreed to redeliver to the Company possession of the reconfigured Premises after construction.

As consideration under the Amendment, Bond agreed to pay the Company a total of $3,500,000. Upon execution of the Amendment, the Company recorded $3,500,000 to deferred revenue to be amortized to revenue to temporarily vacate the premises over the expected vacate period of 36 months. Bond tendered $2,250,000 simultaneously with the execution of the Amendment, and the balance due of $1,250,000 on June 16, 2015 had been received by the Company. The Company re-occupied the premises in October 2017.

In connection with the Amendment, the parties also agreed to settle a pending lawsuit in the Supreme Court of the State of New York, Kings County, Index No. 50796/13 (the “Action”), in which the Company sought, among other things, a declaratory judgment that it validly renewed the lease for the Premises, and Bond sought, among other things, a declaratory judgment that the lease expired by its terms on December 8, 2013. Pursuant to a stipulation of settlement, filed on June 16, 2014, the Action, including all claims and counterclaims, has been discontinued with prejudice, without costs or attorneys’ fees to any party as against the other. The stipulation of settlement also contains general releases by both parties of all claims.

v3.10.0.1
CONTINGENCIES
12 Months Ended
Jul. 31, 2018
Commitments and Contingencies Disclosure [Abstract]  
CONTINGENCIES

15. CONTINGENCIES:

Due to defective workmanship and breach of contract, the Company continues to pursue damages and return in full of a $376,467 deposit paid a contractor when construction commenced to replace a roof and various other work on the Fishkill, New York building. Both the contractor and subcontractors have claimed the Company tortuously interfered with the construction contracts arguing for fees and costs which approximate $700,000. While the Company strongly disputes the claims, it is possible that the court may rule against the Company and may assess damages in amounts up to approximately $700,000. It is also possible that the court may rule in favor of the Company and that no damages would be awarded against the Company and the Company could obtain an order for the return of all or a portion of amounts previously paid. A charge to real estate operating expenses in the amount of $279,213 was recorded for the fiscal year ended July 31, 2017. Following initial court decisions, another $141,132 was charged to operating expenses on October 31, 2016 and this amount was ordered by the Court to be paid, plus interest, in a judgement dated September 14, 2017. The testimony phase of the trial has been completed and the parties await further decisions and orders of the court.

There are various other lawsuits and claims pending against the Company. It is the opinion of management that the resolution of these matters will not have a material adverse effect on the Company’s Consolidated Financial Statements.

If the Company sells, transfers, disposes of or demolishes 25 Elm Place, Brooklyn, New York, then the Company may be liable to create a condominium unit for the loading dock. The necessity of creating the condominium unit and the cost of such condominium unit cannot be determined at this time.

v3.10.0.1
VALUATION AND QUALIFYING ACCOUNTS
12 Months Ended
Jul. 31, 2018
SEC Schedule, 12-09, Valuation and Qualifying Accounts [Abstract]  
VALUATION AND QUALIFYING ACCOUNTS

SCHEDULE II

J.W. MAYS, INC.
VALUATION AND QUALIFYING ACCOUNTS

Year Ended July 31,
2018 2017 2016
Allowance for net unrealized gains on marketable securities:               
Balance, beginning of year $ 558,476 $ 400,541 $ 297,031
Additions 241,661 157,935 103,510
Balance, end of year $ 800,137 $ 558,476 $ 400,541
v3.10.0.1
REAL ESTATE AND ACCUMULATED DEPRECIATION
12 Months Ended
Jul. 31, 2018
SEC Schedule, 12-28, Real Estate Companies, Investment in Real Estate and Accumulated Depreciation Disclosure [Abstract]  
REAL ESTATE AND ACCUMULATED DEPRECIATION

SCHEDULE III

J.W. MAYS, INC.
REAL ESTATE AND ACCUMULATED DEPRECIATION
July 31, 2018

Col. A     Col. B     Col. C     Col. D     Col. E     Col. F Col. G     Col. H     Col. I
    Cost Capitalized         Life on Which
Subsequent to Gross Amount at Which Carried Depreciation in
Initial Cost to Company Acquisition At Close of Period     Latest Income
Building &     Carried Building & Accumulated Date of Date Statement is
Description Encumbrances Land Improvements Improvements Cost Land Improvements Total Depreciation Construction  Acquired   Computed 
Office and Rental Buildings
Brooklyn, New York
       Fulton Street at Bond Street
     $ 5,467,111      $ 3,901,349   $ 7,403,468      $ 23,917,153        $     $ 3,901,349     $ 31,320,621     $ 35,221,970    $ 12,941,445    Various Various (1) (2)
Jamaica, New York
       Jamaica Avenue at
              169th Street
3,215,699 17,588,009 20,803,708 20,803,708 10,987,347 1959 1959 (1) (2)
Fishkill, New York
       Route 9 at Interstate
              Highway 84
594,723 7,212,116 5,853,612 594,723 13,065,728 13,660,451 9,058,246 10/74 11/72 (1)
Brooklyn, New York
       Jowein Building Fulton Street
       and Elm Place
1,324,957 728,327 15,600,458 1,324,957 16,328,785 17,653,742 5,591,005 1915 1950 (1) (2)
Levittown, New York Hempstead
       Turnpike
125,927 125,927 125,927 4/69 6/62 (1)
Circleville, Ohio
       Tarlton Road 120,849 4,388,456 86,520 120,849 4,474,976 4,595,825 2,804,919 9/92 12/92 (1)
Total(A) $ 5,467,111 $ 6,067,805 $ 22,948,066 $ 63,045,752   $ $ 6,067,805 $ 85,993,818 $ 92,061,623 $ 41,382,962
____________________

(1) Building and improvements 18–40 years
       
(2) Improvements to leased property 3–40 years
       
(A) Does not include Office Furniture and Equipment and Transportation Equipment in the amount of $350,164 and Accumulated Depreciation thereon of $235,841 at July 31, 2018.

            Year Ended July 31,
2018       2017       2016
Investment in Real Estate     
Balance at Beginning of Year $ 89,016,227 $ 86,936,827 $ 84,474,345
Improvements 3,045,396 2,079,400 2,462,482
Retirements
Balance at End of Year $ 92,061,623 $ 89,016,227 $ 86,936,827
Accumulated Depreciation
Balance at Beginning of Year $ 39,648,642 $ 38,008,810 $ 36,413,975
Additions Charged to Costs and Expenses 1,734,320 1,639,832 1,594,835
Retirements
Balance at End of Year $ 41,382,962 $ 39,648,642 $ 38,008,810
v3.10.0.1
SUMMARY OF SIGNIFICANT ACCOUNTING POLICIES (Policies)
12 Months Ended
Jul. 31, 2018
Accounting Policies [Abstract]  
Organization

Organization

J.W. Mays, Inc. (the “Company” or “Registrant”) with executive offices at 9 Bond Street, Brooklyn, New York 11201, operates a number of commercial real estate properties in New York and one building in Ohio. The Company’s business was founded in 1924 and incorporated under the laws of the State of New York on July 6, 1927.

Consolidation

Consolidation

The consolidated financial statements include the accounts of the Company, a New York corporation and its subsidiaries (J. W. M. Realty Corp. and Dutchess Mall Sewage Plant, Inc.), which are wholly-owned. Material intercompany items have been eliminated in consolidation.

Accounting Records and Use of Estimates

Accounting Records and Use of Estimates

The accounting records are maintained in accordance with accounting principles generally accepted in the United States of America (“GAAP”). The preparation of the Company’s financial statements in accordance with GAAP requires management to make estimates and assumptions that affect the reported amounts of assets and liabilities at the date of the financial statements, the disclosure of contingent assets and liabilities, and the reported amounts of revenues and expenses during the reporting period. The estimates that we make include allowance for doubtful accounts, depreciation, income tax assets and liabilities, fair value of marketable securities, revenue recognition and accrued expenses. Estimates are based on historical experience where applicable or other assumptions that management believes are reasonable under the circumstances. Due to the inherent uncertainty involved in making estimates, actual results may differ from those estimates under different assumptions or conditions.

Restricted Cash

Restricted Cash

Restricted cash primarily consists of cash held in bank accounts for tenant security deposits and other amounts required under certain loan agreements.

Rental Income and Receivables

Rental Income and Receivables

All of the real estate owned by the Company is held for leasing to tenants except for a small portion used for Company offices. Rent is recognized from tenants under executed leases no later than on an established date or on an earlier date if the tenant should commence conducting business. Unbilled receivables represent the excess of scheduled rental income recognized on a straight-line basis over rental income as it becomes receivable according to the provisions of the lease. Contingent rental income is recorded when earned and is not based on tenant revenue. The effect of lease modifications that result in rent relief or other credits to tenants, including any retroactive effects relating to prior periods, is recognized in the period when the lease modification is signed. At the time of the lease modification, we assess the realizability of any accrued but unpaid rent and amounts that had been recognized as revenue in prior periods. If the amounts are not determined to be realizable, the accrued but unpaid rent is written off. Accounts receivable are recognized in accordance with lease agreements at its net realizable value. Rental payments received in advance are deferred until earned.

Based upon its periodic assessment of the quality of the receivables, management uses its historical knowledge of the tenants and industry experience to determine whether a reserve or write-off is required. Management has determined that no allowance for uncollected receivables is considered necessary. The Company uses specific identification to write-off receivables to bad debt expense in the period when issues of collectability become known. Collectability issues include circumstances when a tenant indicates their intention to vacate the property without paying, or when tenant litigation or bankruptcy proceedings are not expected to result in full payment. Due to the early termination of a lease, the Company recorded a bad debt expense of $80,302 for the year ended July 31, 2017, which is included in administration and general expenses.

Property and Equipment

Property and Equipment

Property and equipment are stated at cost. Depreciation is calculated using the straight-line method and the declining-balance method. Amortization of improvements to leased property is calculated over the shorter of the life of the lease or the estimated useful life of the improvements. Lives used to determine depreciation and amortization are generally as follows:

Buildings and improvements 18-40 years
Improvements to leased property 3-40 years
Fixtures and equipment 7-12 years
Other 3-5 years

Maintenance, repairs, renewals and improvements of a non-permanent nature are charged to expense when incurred. Expenditures for additions and major renewals or improvements are capitalized along with the associated interest cost during construction. The cost of assets sold or retired and the accumulated depreciation or amortization thereon are eliminated from the respective accounts in the year of disposal, and the resulting gain or loss is credited or charged to income. Capitalized interest is recorded as part of the asset to which it relates and is amortized over the asset’s estimated useful life.

The Company reviews long-lived assets for impairment whenever circumstances and situations change such that there is an indication that the carrying amounts may not be recovered. At July 31, 2018 and 2017, there were no impairments of its property and equipment.

Deferred Charges

Deferred Charges

Deferred charges consist principally of costs incurred in connection with the leasing of property to tenants. Such costs are amortized over the related lease periods, ranging from 1 to 21 years, using the straight-line method. If a lease is terminated early, such costs are expensed.

Income Taxes

Income Taxes

Deferred income taxes are provided for the temporary differences between the financial reporting basis and the tax basis of the Company’s assets and liabilities. Deferred tax assets result principally from the recording of certain accruals, reserves and net operating loss carry forwards which currently are not deductible for tax purposes. Deferred tax liabilities result principally from temporary differences in the recognition of unrealized gains and losses from certain investments and from the use, for tax purposes, of accelerated depreciation. Deferred tax assets and liabilities are offset for each jurisdiction and are presented net on the balance sheet.

The effect on deferred income taxes of a change in tax rates is recognized in income in the period that includes the enactment date. Actual income taxes could vary from these estimates due to future changes in income tax law or results from the final review of tax returns by federal, state or city tax authorities. Financial statement effects on tax positions are recognized in the period in which it is more likely than not that the position will be sustained upon examination, the position is effectively settled or when the statute of limitations to challenge the position has expired. Interest and penalties, if any, related to unrecognized tax benefits are recorded as interest expense and administrative and general expenses, respectively.

Income Per Share of Common Stock

Income Per Share of Common Stock

Income per share has been computed by dividing net income for the year by the weighted average number of shares of common stock outstanding during the year, adjusted for the purchase of treasury stock. Shares used in computing income per share were 2,015,780 in fiscal years 2018, 2017 and 2016.

Marketable Securities

Marketable Securities

The Company categorizes marketable securities as either trading, available-for-sale or held-to-maturity at the time of purchase. Trading securities are carried at fair value with unrealized gains and losses included in income. Available-for-sale securities are carried at fair value measurements using quoted prices in active markets for identical assets or liabilities with unrealized gains and losses recorded as a separate component of shareholders’ equity. Held-to-maturity securities are carried at amortized cost. Dividends and interest income are accrued as earned. Realized gains and losses are determined on a specific identification basis. The Company reviews marketable securities for impairment whenever circumstances and situations change such that there is an indication that the carrying amounts may not be recovered. The Company did not classify any securities as trading or held to maturity during the three years ended July 31, 2018.

The Company follows GAAP which establishes a fair value hierarchy that prioritizes the valuation techniques and creates the following three broad levels, with Level 1 valuation being the highest priority:

Level 1 valuation inputs are quoted market prices in active markets for identical assets or liabilities that are accessible at the measurement date (e.g., equity securities traded on the New York Stock Exchange).

Level 2 valuation inputs are from other than quoted market prices included in Level 1 that are observable for the asset or liability, either directly or indirectly (e.g., quoted market prices of similar assets or liabilities in active markets, or quoted market prices for identical or similar assets or liabilities in markets that are not active).

Level 3 valuation inputs are unobservable (e.g., an entity’s own data) and should be used to measure fair value to the extent that observable inputs are not available.

Following is a description of the valuation methodologies used for assets measured at fair value on a recurring basis. There have been no changes in the methodologies used at July 31, 2018 and 2017.

Equity securities are valued at the closing price reported on the active market on which the individual securities are traded that the Company has access to.

Equity securities

Equity securities are valued at the closing price reported on the active market on which the individual securities are traded that the Company has access to.

Mutual funds

Mutual funds are valued at the daily closing price as reported by the fund. Mutual funds held by the Company are open-end mutual funds that are registered with the U.S. Securities and Exchange Commission. These funds are required to publish their daily net asset value (“NAV”) and to transact at that price. The mutual funds held by the Company are deemed to be actively traded.

In accordance with the provisions of Fair Value Measurements, the following are the Company’s financial assets measured on a recurring basis presented at fair value.

Fair value measurements at reporting date using
Description    July 31, 2018    Level 1    Level 2    Level 3    July 31, 2017    Level 1    Level 2    Level 3
Assets:                                                           
Marketable securities - available-for-sale $ 3,141,828 $ 3,141,828 $ $– $ 2,815,727 $ 2,815,727      $      $
Recently issued accounting standards not yet adopted

Recently issued accounting standards not yet adopted:

In May 2014, the Financial Accounting Standards Board (“FASB”), issued Accounting Standards Update (“ASU”) 2014-09 “Revenue from Contracts with Customers” (“ASU 2014-09”) establishing ASC Topic 606 Revenue from Contracts with Customers. ASU 2014-09 establishes a single comprehensive model for entities to use in accounting for revenue arising from contracts with customers and supersedes most of the existing revenue recognition guidance. ASU 2014-09 requires an entity to recognize revenue when it transfers promised goods or services to customers in an amount that reflects the consideration to which the entity expects to be entitled in exchange for those goods or services and also requires certain additional disclosures. ASU 2014-09 is effective for interim and annual reporting in fiscal years that begin after December 15, 2016. ASU 2015-14 extended the implementation date for fiscal years beginning after December 31, 2017.

Subsequent to the issuance of ASU 2014-09, the FASB issued ASU No. 2016-08, “Revenue from Contracts with Customers (Topic 606): Principal versus Agent Considerations (Reporting Revenue Gross versus Net)”, ASU No. 2016-10, “Revenue from Contracts with Customers (Topic 606): Identifying Performance Obligations and Licensing”, ASU No. 2016-12, “Revenue from Contracts with Customers (Topic 606): Narrow-Scope Improvements and Practical Expedients”, and ASU No. 2016-20, “Technical Corrections and Improvements to Topic 606, Revenue from Contracts with Customers.” The additional ASU’s clarified certain provisions of ASU 2014-09 in response to recommendations from the Transition Resource Group established by the FASB and have the same effective date and transition requirements as ASU 2014-09. We adopted these standards effective August 1, 2018 and expect the adoption will not have a significant impact on our consolidated financial statements.

In January 2016, the FASB issued ASU No. 2016-01 “Financial Instruments-Overall (Subtopic 825-10): Recognition and Measurement of Financial Assets and Financial Liabilities.” ASU 2016-01 amends certain aspects of recognition, measurement, presentation and disclosure of financial instruments, including the requirement to measure certain equity investments at fair value with changes in fair value recognized in net income. ASU No. 2016-01 is effective for interim and annual periods beginning after December 15, 2017. We adopted this standard effective August 1, 2018 and expect the adoption will not have a significant impact on our consolidated financial statements.

In February 2016, the FASB issued ASU 2016-02, “Leases.” ASU 2016-02 is intended to increase transparency and comparability among organizations of accounting for leasing arrangements. This guidance establishes a right-of-use model that requires a lessee to record a right-of-use asset and a lease liability on the balance sheet for all leases with terms longer than twelve months. Leases will be classified as either finance or operating, with classification affecting the pattern of expense recognition in the income statement. Lessor accounting remains similar to the current model, but updated to align with certain changes to the lessee model and the new revenue recognition standard (ASU 2014-09). ASU 2016-02 offers specific accounting guidance for a lessee, a lessor and sale and leaseback transactions. Lessees and lessors are required to disclose qualitative and quantitative information about leasing arrangements to enable a user of the financial statements to assess the amount, timing and uncertainty of cash flows arising from leases. Entities will be required to recognize and measure leases as of the earliest period presented using a modified retrospective approach.

In July 2018, the FASB issued ASU No. 2018-10, “Codification Improvements to Topic 842”, which provides amendments and clarification to ASU 2016-12 based on the FASB’s interaction with stakeholders. In July 2018, the FASB issued ASU No. 2018-11 “Leases (Topic 842): Targeted Improvements”, which amends Leases (Topic 842) to (i) add an optional transition method that would permit entities to apply the new requirements by recognizing a cumulative-effect adjustment to the opening balance of retained earnings in the year of adoption, and (ii) provide a practical expedient for lessors regarding the separation of the lease and non-lease components of a contract. The standards are effective for fiscal years beginning after December 15, 2018, including interim periods within those fiscal years. The new standards will be effective for the Company for the fiscal year beginning August 1, 2019, with early adoption permitted, and the Company expects to use the cumulative-effect adjustment approach in the year of adoption. The adoption of this guidance is expected to result in an increase in assets and liabilities on the Company’s balance sheet, with no material impact on the statement of operations. However, the ultimate impact of adopting this ASU will depend on the Company’s lease portfolio as of the adoption date.

In November 2016, the FASB issued ASU 2016-18, “Restricted Cash”. ASU 2016-18 requires that a statement of cash flows explain the change during the period in the total of cash, cash equivalents, and amounts generally described as restricted cash or restricted cash equivalents. Restricted cash and restricted cash equivalents will be included with cash and cash equivalents when reconciling the beginning of period and end of period balances on the statement of cash flows upon adoption of this standard. ASU 2016-18 is effective for interim and annual reporting periods in fiscal years beginning after December 15, 2017. We adopted this standard effective August 1, 2018 and expect the adoption will not have a significant impact on our consolidated financial statements.

In February 2018, the FASB issued ASU 2018-02, “Income Statement—Reporting Comprehensive Income (Topic 220)”. ASU 2018-02 allows a reclassification from accumulated other comprehensive income to retained earnings for stranded tax effects resulting from the December 22, 2017 Tax Act. The amendments in this ASU are effective for all entities for fiscal years beginning after December 15, 2018, and interim periods within those fiscal years. Early adoption of the amendments in this ASU is permitted, including adoption in any interim period, (1) for public business entities for reporting periods for which financial statements have not yet been issued and (2) for all other entities for reporting periods for which financial statements have not yet been made available for issuance. The amendments in this ASU should be applied either in the period of adoption or retrospectively to each period (or periods) in which the change in the U.S. federal corporate income tax rate in the Tax Act is recognized. We are in the process of evaluating the impact of this standard on the consolidated financial statements.

v3.10.0.1
SUMMARY OF SIGNIFICANT ACCOUNTING POLICIES (Tables)
12 Months Ended
Jul. 31, 2018
Accounting Policies [Abstract]  
Schedule of property and equipment depreciation and amortization period

Amortization of improvements to leased property is calculated over the shorter of the life of the lease or the estimated useful life of the improvements. Lives used to determine depreciation and amortization are generally as follows:

Buildings and improvements 18-40 years
Improvements to leased property 3-40 years
Fixtures and equipment 7-12 years
Other 3-5 years
Schedule of investments measured at fair value

In accordance with the provisions of Fair Value Measurements, the following are the Company’s financial assets measured on a recurring basis presented at fair value.

Fair value measurements at reporting date using
Description    July 31, 2018    Level 1    Level 2    Level 3    July 31, 2017    Level 1    Level 2    Level 3
Assets:                                                           
Marketable securities - available-for-sale $ 3,141,828 $ 3,141,828 $ $– $ 2,815,727 $ 2,815,727      $      $
v3.10.0.1
MARKETABLE SECURITIES (Tables)
12 Months Ended
Jul. 31, 2018
Investments, Debt and Equity Securities [Abstract]  
Schedule of classified marketable securities

As of July 31, 2018 and 2017, the Company’s marketable securities were classified as follows:

July 31, 2018 July 31, 2017
      Cost     Gross
Unrealized

Gains
    Gross
Unrealized

Losses
    Fair
Value
    Cost     Gross
Unrealized
Gains
    Gross
Unrealized
Losses
    Fair
Value
Non-current:               
Available-for-sale:
Mutual funds $ 774,602 $ 237,149 $ $ 1,011,751 $ 716,463 $ 193,932 $ $ 910,395
Corporate equity securities 1,567,089 562,988 2,130,077 1,540,788 364,544 1,905,332
$ 2,341,691 $ 800,137 $ $ 3,141,828 $ 2,257,251 $ 558,476 $ $ 2,815,727
Schedule of investment income

Investment income for the years ended July 31, 2018, 2017 and 2016 consists of the following:

2018 2017 2016
Interest income       $ 25,414       $ 13,176       $ 8,422
Dividend income 86,354 57,717 54,526
Gain (loss) on sale of marketable securities (805 ) 23,734 (36,999 )
Total $ 110,963 $ 94,627 $ 25,949
v3.10.0.1
LONG-TERM DEBT - MORTGAGE (Tables)
12 Months Ended
Jul. 31, 2018
LONG-TERM DEBT - MORTGAGES AND TERM LOAN [Abstract]  
Schedule of long-term debt
July 31, 2018 July 31, 2017
Current
Annual Final Due Due Due Due
Interest Payment Within After Within After
Rate Date One Year One Year One Year One Year
Mortgage:                                      
Bond St. building, Brooklyn, NY 3.54% 2/1/2020 $ 168,501 $ 5,298,610 $ 162,569 $ 5,467,110
Less: Deferred financing costs 34,325 57,202
Total $ 168,501 $ 5,264,285 $ 162,569 $ 5,409,908
v3.10.0.1
INCOME TAXES (Tables)
12 Months Ended
Jul. 31, 2018
Income Tax Disclosure [Abstract]  
Schedule of income tax expense

Income taxes provided for the years ended July 31, 2018, 2017 and 2016 consist of the following:

2018 2017 2016
Current:
Federal       $ 10,000       $ 15,000       $ 69,000
Deferred taxes:
Federal (1,841,000 ) 966,000 727,000
State 587,000
Total provision $ (1,244,000 ) $ 981,000 $ 796,000
Schedule of effective income tax rate reconciliation

Taxes provided for the years ended July 31, 2018, 2017 and 2016 differ from amounts which would result from applying the federal statutory tax rate to pre-tax income, as follows:

2018 2017 2016
Income before income taxes             $ 1,730,141       $ 2,906,539       $ 2,313,760
Other-net 2,443 4,507 7,427
Adjusted pre-tax income $ 1,732,584 $ 2,911,046 $ 2,321,187
Statutory rate 26.42 % 34 % 34 %
Income tax provision at statutory rate $ 457,749 $ 989,756 $ 789,204
Remeasurement of federal deferred income taxes (2,390,000 )
State deferred income taxes 587,000
Other-net 101,251 (8,756 ) 6,796
Income tax provision $ (1,244,000 ) $ 981,000 $ 796,000
Schedule of deferred tax assets and liabilities

Significant components of the Company’s deferred tax assets and liabilities as of July 31, 2018 and 2017 are a result of temporary differences related to the items described as follows:

2018 2017
Deferred Deferred Deferred Deferred
      Tax Assets       Tax Liabilities       Tax Assets       Tax Liabilities
Rental income received in advance $ 174,975   $   $ 240,974    $   
Federal Net operating loss carryforward 851,175 1,851,535
State Net operating loss carryforward 665,934 660,840
Unbilled receivables 462,686 7,347,278
Property and equipment 5,916,568
Unrealized gain on marketable securities 220,746 189,882
Litigation deposit due from contractor 103,862 94,932
Other 298,054 373,559
$ 2,094,000 $ 6,600,000 $ 2,561,000 $ 8,198,000
Net deferred tax liability $ 4,506,000 $ 5,637,000
Components of deferred tax provision (benefit)

Components of the deferred tax provision (benefit) for the years ended July 31, 2018, 2017 and 2016 consist of the following:

      2018       2017       2016
Tax depreciation exceeding book depreciation $ (1,430,906 ) $ 397,273 $ 553,647
Federal operating loss carryforward 1,000,360 384,208 11,453
State net operating loss carryforward (665,934 )
Decrease (increase) of rental income received in advance 65,999 (82,775 ) 44,298
(Decrease) in unbilled receivables (198,154 ) (94,927 ) (132,736 )
Increase (decrease) in average rent payable 81,230 29,383 (28,389 )
Deferred revenue 347,083 396,667
Litigation deposit due from contractor (8,930 ) (94,932 )
Other (97,665 ) (14,245 ) (23,008 )
$ (1,254,000 ) $ 966,000 $ 727,000
v3.10.0.1
LEASES (Tables)
12 Months Ended
Jul. 31, 2018
Leases [Abstract]  
Schedule of rental expense

Rental expense for leased real property for each of the three fiscal years in the period ended July 31, 2018 was exceeded by sublease rental income, as follows:

2018 2017 2016
Minimum rental expense       $ 1,750,859       $ 1,899,374       $ 1,726,528
Contingent rental expense 1,034,762 833,641 825,695
2,785,621 2,733,015 2,552,223
Sublease rental income 6,901,958 6,750,325 6,341,145
Excess of sublease income over expense $ 4,116,337 $ 4,017,310 $ 3,788,922
Schedule of future minimum non-cancelable rental commitments

Future minimum non-cancelable rental commitments for operating leases with initial or remaining terms of one year or more are payable as follows:

Operating
Fiscal Year       Leases
2019 $ 1,853,841
2020 1,858,754
2021 1,860,485
2022 1,856,314
2023 1,864,455
After 2023 10,801,871
Total required* $ 20,095,720

*        Minimum payments have not been reduced by minimum sublease rentals of $31,436,747 under operating leases due in the future under non-cancelable leases.
v3.10.0.1
RENTAL INCOME (Tables)
12 Months Ended
Jul. 31, 2018
RENTAL INCOME [Abstract]  
Schedule of rental income

Rental income for each of the fiscal years 2018, 2017 and 2016 is as follows:

July 31,
      2018       2017       2016
Minimum rentals
Company owned property $ 11,652,482 $ 11,144,902 $ 10,478,878
Leased property 6,502,219 6,414,724 6,008,185
18,154,701 17,559,626 16,487,063
Contingent rentals
Company owned property 746,442 622,375 596,164
Leased property 399,739 335,601 332,960
1,146,181 957,976 929,124
Total $ 19,300,882 $ 18,517,602 $ 17,416,187
Schedule of future minimum non-cancelable rental income

Future minimum non-cancelable rental income for leases with initial or remaining terms of one year or more is as follows:

Company
Owned Leased
Fiscal Year       Property       Property       Total
2019 $ 10,702,102 $ 5,601,866 $ 16,303,968
2020 9,775,733 4,072,267 13,848,000
2021 9,331,495 3,216,011 12,547,506
2022 7,352,730 2,878,732 10,231,462
2023 8,261,901 2,463,368 10,725,269
After 2023 56,946,159 13,204,503 70,150,662
Total $ 102,370,120 $ 31,436,747 $ 133,806,867
v3.10.0.1
PAYROLL AND OTHER ACCRUED LIABILITIES (Tables)
12 Months Ended
Jul. 31, 2018
Payables and Accruals [Abstract]  
Schedule of payroll and other accrued liabilities

Payroll and other accrued liabilities for the fiscal years ended July 31, 2018 and 2017 consist of the following:

      2018       2017
Payroll $ 259,149 $ 260,741
Interest 16,666 17,161
Professional fees 140,000 145,000
Rents received in advance 644,728 708,747
Utilities 19,200 12,452
Brokers commissions 134,418 287,940
Construction costs 146,132
Other 890,198 937,443
Total 2,104,359 2,515,616
Less current portion 2,104,359 2,515,616
Long term portion $ $
v3.10.0.1
CASH FLOW INFORMATION (Tables)
12 Months Ended
Jul. 31, 2018
Supplemental Cash Flow Elements [Abstract]  
Schedule of cash flow information

Supplemental disclosures:

July 31,
     2018      2017      2016
Interest paid, net of capitalized interest of $37,471 (2018), $20,360 (2017) and $49,707 (2016) $ 211,092 $ 209,789 $ 222,969
Income taxes paid (refunded) $ 36,494 $ 213,096 $ (367,755 )
v3.10.0.1
FINANCIAL INSTRUMENTS AND CREDIT RISK CONCENTRATIONS (Tables)
12 Months Ended
Jul. 31, 2018
Fair Value Disclosures [Abstract]  
Schedule of fair value of financial instruments
July 31, 2018 July 31, 2017
Carrying Fair Carrying Fair
      Value       Value       Value       Value
Cash and cash equivalents $ 5,255,073 $ 5,255,073 $ 5,381,195 $ 5,381,195
Marketable securities $ 3,141,828 $ 3,141,828 $ 2,815,727 $ 2,815,727
Restricted cash $ 1,624,550 $ 1,624,550 $ 1,295,734 $ 1,295,734
Security deposits payable $ 1,343,671 $ 1,343,671 $ 1,036,197 $ 1,036,197
Mortgage $ 5,467,111 $ 4,939,149 $ 5,629,679 $ 5,403,180
v3.10.0.1
DEFERRED CHARGES (Tables)
12 Months Ended
Jul. 31, 2018
Deferred Costs, Capitalized, Prepaid, and Other Assets Disclosure [Abstract]  
Schedule of deferred charges

Deferred charges for the fiscal years ended July 31, 2018 and 2017 consist of the following:

July 31, 2018 July 31, 2017
Gross Gross
Carrying Accumulated Carrying Accumulated
Amount       Amortization       Amount       Amortization
Leasing brokerage commissions       $ 3,035,040 $ 1,264,427 $ 3,059,615 $ 1,089,934
Professional fees for leasing 193,122 105,018 405,447 294,208
Total $ 3,228,162 $ 1,369,445 $ 3,465,062 $ 1,384,142
Schedule of estimated aggregate amortization expense

The estimated aggregate amortization expense for each of the five succeeding fiscal years is as follows:

Fiscal Year      Amortization
2019          $ 287,541   
2020 $ 234,462
2021 $ 215,897
2022 $ 188,856
2023 $ 167,132
v3.10.0.1
ACCUMULATED OTHER COMPREHENSIVE INCOME (Tables)
12 Months Ended
Jul. 31, 2018
ACCUMULATED OTHER COMPREHENSIVE INCOME [Abstract]  
Schedule of Accumulated Other Comprehensive Income (Loss)

A summary of the changes in accumulated other comprehensive income for the fiscal years ended July 31, 2018, 2017, and 2016 are as follows:

Years Ended July 31,
2018 2017 2016
Beginning balance, net of tax effect       $ 368,476       $ 264,541       $ 196,033
Other comprehensive income, net of tax effect:
Unrealized gains on available-for-sale securities 265,080 198,776 128,515
Tax effect (130,963 ) (68,000 ) (43,000 )
Unrealized gains on available-for-sale securities, net of tax effect 134,117 130,776 85,515
 

Amounts reclassified from accumulated other comprehensive income comprehensive income, net of tax effect:

Unrealized gain on available-for-sale securities reclassified

(23,420 ) (40,841 ) (25,007 )
Tax effect 7,963 14,000 8,000
Amount reclassified, net of tax effect (15,457 ) (26,841 ) (17,007 )
Ending balance, net of tax effect $ 487,136 $ 368,476 $ 264,541
v3.10.0.1
SUMMARY OF SIGNIFICANT ACCOUNTING POLICIES (Narrative) (Details) - USD ($)
12 Months Ended
Jul. 31, 2018
Jul. 31, 2017
Jul. 31, 2016
Bad debt expense $ 80,302
Weighted average number of shares outstanding, basic (in shares) 2,015,780 2,015,780 2,015,780
Minimum [Member]      
Deferred charges amortization period 1 year    
Maximum [Member]      
Deferred charges amortization period 21 years    
v3.10.0.1
SUMMARY OF SIGNIFICANT ACCOUNTING POLICIES (Schedule of property and equipment depreciation and amortization period) (Details)
12 Months Ended
Jul. 31, 2018
Buildings and improvements [Member] | Minimum [Member]  
Property, Plant and Equipment [Line Items]  
Useful life 18 years
Buildings and improvements [Member] | Maximum [Member]  
Property, Plant and Equipment [Line Items]  
Useful life 40 years
Improvements to leased property [Member] | Minimum [Member]  
Property, Plant and Equipment [Line Items]  
Useful life 3 years
Improvements to leased property [Member] | Maximum [Member]  
Property, Plant and Equipment [Line Items]  
Useful life 40 years
Fixtures and equipment [Member] | Minimum [Member]  
Property, Plant and Equipment [Line Items]  
Useful life 7 years
Fixtures and equipment [Member] | Maximum [Member]  
Property, Plant and Equipment [Line Items]  
Useful life 12 years
Other [Member] | Minimum [Member]  
Property, Plant and Equipment [Line Items]  
Useful life 3 years
Other [Member] | Maximum [Member]  
Property, Plant and Equipment [Line Items]  
Useful life 5 years
v3.10.0.1
SUMMARY OF SIGNIFICANT ACCOUNTING POLICIES (Schedule of financial assets measured at fair value on recurring basis) (Details) - USD ($)
Jul. 31, 2018
Jul. 31, 2017
Fair Value, Assets and Liabilities Measured on Recurring and Nonrecurring Basis [Line Items]    
Marketable securities - available-for-sale $ 3,141,828 $ 2,815,727
Fair Value, Inputs, Level 1 [Member]    
Fair Value, Assets and Liabilities Measured on Recurring and Nonrecurring Basis [Line Items]    
Marketable securities - available-for-sale 3,141,828 2,815,727
Fair Value, Inputs, Level 2 [Member]    
Fair Value, Assets and Liabilities Measured on Recurring and Nonrecurring Basis [Line Items]    
Marketable securities - available-for-sale
Fair Value, Inputs, Level 3 [Member]    
Fair Value, Assets and Liabilities Measured on Recurring and Nonrecurring Basis [Line Items]    
Marketable securities - available-for-sale
v3.10.0.1
MARKETABLE SECURITIES (Schedule of classified marketable securities) (Details) - USD ($)
Jul. 31, 2018
Jul. 31, 2017
Fair Value $ 3,141,828 $ 2,815,727
Noncurrent [Member]    
Fair Value 3,141,828 2,815,727
Gross Unrealized Gains 800,137 558,476
Gross Unrealized Losses
Cost 2,341,691 2,257,251
Noncurrent [Member] | Mutual Fund [Member]    
Fair Value 1,011,751 910,395
Gross Unrealized Gains 237,149 193,932
Gross Unrealized Losses
Cost 774,602 716,463
Noncurrent [Member] | Corporate Equity Securities [Member]    
Fair Value 2,130,077 1,905,332
Gross Unrealized Gains 562,988 364,544
Gross Unrealized Losses
Cost $ 1,567,089 $ 1,540,788
v3.10.0.1
MARKETABLE SECURITIES (Schedule of investment income) (Details) - USD ($)
12 Months Ended
Jul. 31, 2018
Jul. 31, 2017
Jul. 31, 2016
Investments, Debt and Equity Securities [Abstract]      
Interest income $ 25,414 $ 13,176 $ 8,422
Dividend income 86,354 57,717 54,526
Gain (loss) on sale of marketable securities (805) 23,734 (36,999)
Total $ 110,963 $ 94,627 $ 25,949
v3.10.0.1
LONG-TERM DEBT - MORTGAGE (Schedule of long-term debt) (Details) - USD ($)
12 Months Ended
Jul. 31, 2018
Jul. 31, 2017
Jan. 09, 2015
Less: Deferred financing costs      
Due After One Year, Total $ 5,264,285 $ 5,409,908  
Bond St. Building Brooklyn, NY Two [Member]      
Mortgage:      
Due Within One Year 168,501 162,569  
Due After One Year 5,298,610 5,467,110  
Less: Deferred financing costs      
Due Within One Year  
Due After One Year 34,325 57,202  
Due Within One Year, Total 168,501 162,569  
Due After One Year, Total $ 5,264,285 $ 5,409,908  
Current Annual Interest Rate 3.54% 3.54% 3.54%
Final Payment Date Feb. 01, 2020    
v3.10.0.1
LONG-TERM DEBT - MORTGAGE (Narrative) (Details) - USD ($)
Jan. 09, 2015
Jul. 31, 2018
Jul. 31, 2017
Debt maturing in 2019   $ 168,501  
Debt maturing in 2020   5,298,610  
Carrying value of properties collateralizing debt   $ 22,280,525  
Bond St. Building Brooklyn, NY Two [Member]      
Closed bank liabilities $ 6,000,000    
Additional loans 652,274    
Amount outstanding $ 5,347,726    
Term of loan 5 years    
Amortization period of loan 25 years    
Interest rate, percent 3.54% 3.54% 3.54%
v3.10.0.1
INCOME TAXES (Narrative) (Details) - USD ($)
12 Months Ended
Jul. 31, 2018
Jul. 31, 2017
Jul. 31, 2016
Operating Loss Carryforwards [Line Items]      
Operating loss carryforwards    
Period over which state capital-based tax will be phased out 7 years    
Deferred tax expense $ 587,000    
Deferred tax liabilities $ 4,506,000 $ 5,637,000  
State deferred tax asset   790,000  
Deferred tax liabilities   1,430,000  
Deferred taxes unrealized gain (loss) on available-for-sale securities   $ 53,000  
U.S. federal corporate income tax rate 26.42% 34.00% 34.00%
Weighted average federal corporate tax rate 26.00%    
Non-cash reduction to the value of net deferred tax liabilities $ 2,400,000    
Minimum [Member]      
Operating Loss Carryforwards [Line Items]      
U.S. federal corporate income tax rate 21.00%    
Maximum [Member]      
Operating Loss Carryforwards [Line Items]      
U.S. federal corporate income tax rate 34.00%    
State and Local Jurisdiction [Member]      
Operating Loss Carryforwards [Line Items]      
Operating loss carryforwards $ 10,107,000 $ 8,274,000 $ 8,274,000
Domestic Tax Authority [Member]      
Operating Loss Carryforwards [Line Items]      
Operating loss carryforwards $ 4,053,000 $ 5,446,000 $ 6,580,000
v3.10.0.1
INCOME TAXES (Schedule of income tax expense) (Details) - USD ($)
12 Months Ended
Jul. 31, 2018
Jul. 31, 2017
Jul. 31, 2016
Current:      
Federal $ 10,000 $ 15,000 $ 69,000
Deferred taxes:      
Federal (1,841,000) 966,000 727,000
State 587,000
Income tax provision $ (1,244,000) $ 981,000 $ 796,000
v3.10.0.1
INCOME TAXES (Schedule of effective income tax rate reconciliation) (Details) - USD ($)
12 Months Ended
Jul. 31, 2018
Jul. 31, 2017
Jul. 31, 2016
Income Tax Disclosure [Abstract]      
Income before income taxes $ 1,730,141 $ 2,906,539 $ 2,313,760
Other-net 2,443 4,507 7,427
Adjusted pre-tax income $ 1,732,584 $ 2,911,046 $ 2,321,187
Statutory rate 26.42% 34.00% 34.00%
Income tax provision at statutory rate $ 457,749 $ 989,756 $ 789,204
Remeasurement of federal deferred income taxes (2,390,000)
State deferred income taxes 587,000
Other-net 101,251 (8,756) 6,796
Income tax provision $ (1,244,000) $ 981,000 $ 796,000
v3.10.0.1
INCOME TAXES (Schedule of deferred tax assets and liabilities) (Details) - USD ($)
Jul. 31, 2018
Jul. 31, 2017
Deferred Tax Assets    
Rental income received in advance $ 174,975 $ 240,974
Federal Net operating loss carryforward 851,175 1,851,535
State Net operating loss carryforward 665,934
Litigation deposit due from contractor 103,862 94,932
Other 298,054 373,559
Total 2,094,000 2,561,000
Deferred Tax Liabilities    
State Net operating loss carryforward 660,840
Unbilled receivables 462,686 7,347,278
Property and equipment 5,916,568
Unrealized gain on marketable securities 220,746 189,882
Total 6,600,000 8,198,000
Net deferred tax liability $ 4,506,000 $ 5,637,000
v3.10.0.1
INCOME TAXES (Components of deferred tax provision (benefit)) (Details) - USD ($)
12 Months Ended
Jul. 31, 2018
Jul. 31, 2017
Jul. 31, 2016
Deferred tax provision (benefit) $ (1,254,000) $ 966,000 $ 727,000
Tax Depreciation Exceeding Book Depreciation [Member]      
Deferred tax provision (benefit) (1,430,906) 397,273 553,647
Federal Operating Loss Carryforward [Member]      
Deferred tax provision (benefit) 1,000,360 384,208 11,453
State net operating loss carryforward [Member]      
Deferred tax provision (benefit) (665,934)
Decrease (Increase) of Rental Income Received in Advance [Member]      
Deferred tax provision (benefit) 65,999 (82,775) 44,298
(Decrease) In Unbilled Receivables [Member]      
Deferred tax provision (benefit) (198,154) (94,927) (132,736)
Increase (decrease) in average rent payable [Member]      
Deferred tax provision (benefit) 81,230 29,383 (28,389)
Deferred Revenue [Member]      
Deferred tax provision (benefit) 347,083 396,667
Litigation Deposit Due From Contractor [Member]      
Deferred tax provision (benefit) (8,930) (94,932)
Other Deferred Income Tax Expense [Member]      
Deferred tax provision (benefit) $ (97,665) $ (14,245) $ (23,008)
v3.10.0.1
LEASES (Schedule of rental expense) (Details) - USD ($)
12 Months Ended
Jul. 31, 2018
Jul. 31, 2017
Jul. 31, 2016
Leases [Abstract]      
Minimum rental expense $ 1,750,859 $ 1,899,374 $ 1,726,528
Contingent rental expense 1,034,762 833,641 825,695
Operating leases rent expense minimum and contingent rentals 2,785,621 2,733,015 2,552,223
Sublease rental income 6,901,958 6,750,325 6,341,145
Excess of sublease income over expense $ 4,116,337 $ 4,017,310 $ 3,788,922
v3.10.0.1
LEASES (Narrative) (Details) - USD ($)
12 Months Ended
Jul. 31, 2018
Jul. 31, 2017
Jul. 31, 2016
Operating Leased Assets [Line Items]      
Rent expense $ 987,250 $ 987,250 $ 836,813
Minimum sublease rentals $ 31,436,747    
Minimum [Member]      
Operating Leased Assets [Line Items]      
Operating leases extended period 3 years    
Maximum [Member]      
Operating Leased Assets [Line Items]      
Operating leases extended period 25 years    
v3.10.0.1
LEASES (Schedule of future minimum non-cancelable rental commitments) (Details)
Jul. 31, 2018
USD ($)
Leases [Abstract]  
2019 $ 1,853,841
2020 1,858,754
2021 1,860,485
2022 1,856,314
2023 1,864,455
After 2023 10,801,871
Total required $ 20,095,720 [1]
[1] Minimum payments have not been reduced by minimum sublease rentals of $31,436,747 under operating leases due in the future under non-cancelable leases.
v3.10.0.1
RENTAL INCOME (Schedule of rental income) (Details) - USD ($)
12 Months Ended
Jul. 31, 2018
Jul. 31, 2017
Jul. 31, 2016
Minimum rentals $ 18,154,701 $ 17,559,626 $ 16,487,063
Contingent rentals 1,146,181 957,976 929,124
Total 19,300,882 18,517,602 17,416,187
Company Owned Property [Member]      
Minimum rentals 11,652,482 11,144,902 10,478,878
Contingent rentals 746,442 622,375 596,164
Leased Property [Member]      
Minimum rentals 6,502,219 6,414,724 6,008,185
Contingent rentals $ 399,739 $ 335,601 $ 332,960
v3.10.0.1
RENTAL INCOME (Schedule of future minimum non-cancelable rental income) (Details)
Jul. 31, 2018
USD ($)
2019 $ 16,303,968
2020 13,848,000
2021 12,547,506
2022 10,231,462
2023 10,725,269
After 2023 70,150,662
Total 133,806,867
Company Owned Property [Member]  
2019 10,702,102
2020 9,775,733
2021 9,331,495
2022 7,352,730
2023 8,261,901
After 2023 56,946,159
Total 102,370,120
Leased Property [Member]  
2019 5,601,866
2020 4,072,267
2021 3,216,011
2022 2,878,732
2023 2,463,368
After 2023 13,204,503
Total $ 31,436,747
v3.10.0.1
PAYROLL AND OTHER ACCRUED LIABILITIES (Details) - USD ($)
Jul. 31, 2018
Jul. 31, 2017
Payables and Accruals [Abstract]    
Payroll $ 259,149 $ 260,741
Interest 16,666 17,161
Professional fees 140,000 145,000
Rents received in advance 644,728 708,747
Utilities 19,200 12,452
Brokers commissions 134,418 287,940
Construction costs 146,132
Other 890,198 937,443
Total 2,104,359 2,515,616
Less current portion 2,104,359 2,515,616
Long term portion
v3.10.0.1
EMPLOYEES' RETIREMENT PLANS (Details) - USD ($)
12 Months Ended
Jul. 31, 2018
Jul. 31, 2017
Jul. 31, 2016
Retirement Benefits [Abstract]      
Pension contributions $ 413,256 $ 399,651 $ 391,962
Employer contributions $ 62,425 $ 56,880 $ 53,405
Minimum contribution rate 9.10%    
v3.10.0.1
CASH FLOW INFORMATION (Details) - USD ($)
12 Months Ended
Jul. 31, 2018
Jul. 31, 2017
Jul. 31, 2016
Supplemental Cash Flow Elements [Abstract]      
Interest paid, net of capitalized interest of $37,471 (2018), $20,360 (2017) and $49,707 (2016) $ 211,092 $ 209,789 $ 222,969
Income taxes paid (refunded) 36,494 213,096 (367,755)
Capitalized interest $ 37,471 $ 20,360 $ 49,707
v3.10.0.1
FINANCIAL INSTRUMENTS AND CREDIT RISK CONCENTRATIONS (Schedule of fair value of financial instruments) (Details) - USD ($)
Jul. 31, 2018
Jul. 31, 2017
Fair Value, Balance Sheet Grouping, Financial Statement Captions [Line Items]    
Marketable securities $ 3,141,828 $ 2,815,727
Restricted cash 1,523,761 1,279,829
Carrying Value [Member]    
Fair Value, Balance Sheet Grouping, Financial Statement Captions [Line Items]    
Cash and cash equivalents 5,255,073 5,381,195
Marketable securities 3,141,828 2,815,727
Restricted cash 1,624,550 1,295,734
Security deposits payable 1,343,671 1,036,197
Mortgage 5,467,111 5,629,679
Fair Value [Member]    
Fair Value, Balance Sheet Grouping, Financial Statement Captions [Line Items]    
Cash and cash equivalents 5,255,073 5,381,195
Marketable securities 3,141,828 2,815,727
Restricted cash 1,624,550 1,295,734
Security deposits payable 1,343,671 1,036,197
Mortgage $ 4,939,149 $ 5,403,180
v3.10.0.1
FINANCIAL INSTRUMENTS AND CREDIT RISK CONCENTRATIONS (Narrative) (Details)
12 Months Ended
Jul. 31, 2018
tenants
Jul. 31, 2017
USD ($)
Jul. 31, 2016
Concentration Risk [Line Items]      
Irrevocable letter of credit | $   $ 230,000  
Number of tenants | tenants 50    
Four Customers [Member] | Accounts Receivable [Member]      
Concentration Risk [Line Items]      
Concentration risk 77.70%    
Three Customers [Member] | Accounts Receivable [Member]      
Concentration Risk [Line Items]      
Concentration risk   66.70%  
Three Customers [Member] | Unbilled Receivables [Member]      
Concentration Risk [Line Items]      
Concentration risk 66.90% 71.60%  
Three Customers [Member] | Rental Income [Member]      
Concentration Risk [Line Items]      
Concentration risk 44.60% 44.00%  
Two Customers [Member] | Rental Income [Member]      
Concentration Risk [Line Items]      
Concentration risk   34.70% 34.70%
v3.10.0.1
DEFERRED CHARGES (Schedule of deferred charges) (Details) - USD ($)
Jul. 31, 2018
Jul. 31, 2017
Leasing Charges    
Deferred charges $ 3,228,162 $ 3,465,062
Less accumulated amortization 1,369,445 1,384,142
Leasing Brokerage Commissions [Member]    
Leasing Charges    
Deferred charges 3,035,040 3,059,615
Less accumulated amortization 1,264,427 1,089,934
Professional Fees For Leasing [Member]    
Leasing Charges    
Deferred charges 193,122 405,447
Less accumulated amortization $ 105,018 $ 294,208
v3.10.0.1
DEFERRED CHARGES (Schedule of estimated aggregate amortization expense) (Details)
Jul. 31, 2018
USD ($)
Deferred Costs, Capitalized, Prepaid, and Other Assets Disclosure [Abstract]  
2019 $ 287,541
2020 234,462
2021 215,897
2022 188,856
2023 $ 167,132
v3.10.0.1
DEFERRED CHARGES (Narrative) (Details) - USD ($)
12 Months Ended
Jul. 31, 2018
Jul. 31, 2017
Jul. 31, 2016
Deferred Costs, Capitalized, Prepaid, and Other Assets Disclosure [Abstract]      
Amortization of deferred charges $ 296,298 $ 279,875 $ 315,779
Weighted average life of current year additions to deferred charges 4 years    
v3.10.0.1
CAPITALIZATION (Details) - shares
Jul. 31, 2018
Jul. 31, 2017
Stockholders' Equity Note [Abstract]    
Treasury stock, shares 162,517 162,517
v3.10.0.1
ACCUMULATED OTHER COMPREHENSIVE INCOME (Details) - USD ($)
12 Months Ended
Jul. 31, 2018
Jul. 31, 2017
Jul. 31, 2016
ACCUMULATED OTHER COMPREHENSIVE INCOME [Abstract]      
Beginning balance, net of tax effect $ 368,476 $ 264,541 $ 196,033
Other comprehensive income, net of tax effect:      
Unrealized gains on available-for-sale securities 265,080 198,776 128,515
Tax effect (130,963) (68,000) (43,000)
Unrealized gains on available-for-sale securities, net of tax effect 134,117 130,776 85,515
Amounts reclassified from accumulated other comprehensive income, net of tax effect:      
Unrealized gain on available-for-sale securities reclassified (23,420) (40,841) (25,007)
Tax effect 7,963 14,000 8,000
Amounts reclassified, net of tax effect (15,457) (26,841) (17,007)
Ending balance, net of tax effect $ 487,136 $ 368,476 $ 264,541
v3.10.0.1
ENTRY INTO A MATERIAL DEFINITIVE AGREEMENT (Details) - Thirty Three Bond Street Llc [Member]
Jun. 16, 2015
USD ($)
Related Party Transaction [Line Items]  
Deferred revenue $ 3,500,000
Tendered amount with execution of the Amendment 2,250,000
Balance due $ 1,250,000
v3.10.0.1
CONTINGENCIES (Details) - Fishkill, New York Property [Member] - USD ($)
3 Months Ended 12 Months Ended
Oct. 31, 2016
Jul. 31, 2018
Jul. 31, 2017
Damages filed   $ 376,467  
Commitment to replace roof   $ 700,000  
Charge to operations $ 141,132   $ 279,213
v3.10.0.1
VALUATION AND QUALIFYING ACCOUNTS - VALUATION AND QUALIFYING ACCOUNTS (Details) - USD ($)
12 Months Ended
Jul. 31, 2018
Jul. 31, 2017
Jul. 31, 2016
Allowance for net unrealized gains on marketable securities:      
Balance, beginning of year $ 558,476 $ 400,541 $ 297,031
Additions 241,661 157,935 103,510
Balance, end of year $ 800,137 $ 558,476 $ 400,541
v3.10.0.1
REAL ESTATE AND ACCUMULATED DEPRECIATION (Details) - USD ($)
12 Months Ended
Jul. 31, 2018
Jul. 31, 2017
Jul. 31, 2016
Jul. 31, 2018
Jul. 31, 2017
SEC Schedule, 12-28, Real Estate Companies, Investment in Real Estate and Accumulated Depreciation [Line Items]          
Encumbrances       $ 5,467,111  
Initial Cost to Company          
Land       6,067,805  
Building & Improvements       22,948,066  
Cost Capitalized Subsequent to Acquisition          
Improvements       63,045,752  
Carried Cost        
Gross Amount at Which Carried At Close of Period          
Land       6,067,805  
Building & Improvements       85,993,818  
Total $ 89,016,227 $ 86,936,827 $ 86,936,827 92,061,623 $ 89,016,227
Accumulated Depreciation 39,648,642 38,008,810 38,008,810 41,382,962 39,648,642
Property and Equipment       92,411,787 89,353,787
Accumulated depreciation       41,618,803 $ 39,868,698
Investment in Real Estate          
Balance at Beginning of Year 89,016,227 86,936,827 84,474,345    
Improvements 3,045,396 2,079,400 2,462,482    
Retirements    
Balance at End of Year 92,061,623 89,016,227 86,936,827    
Accumulated Depreciation          
Balance at Beginning of Year 39,648,642 38,008,810 36,413,975    
Additions Charged to Costs and Expenses 1,734,320 1,639,832 1,594,835    
Retirements    
Balance at End of Year $ 41,382,962 $ 39,648,642 $ 38,008,810    
Buildings and Improvements [Member] | Minimum [Member]          
Gross Amount at Which Carried At Close of Period          
Life on Which Depreciation in Latest Income Statement is Computed 18 years        
Buildings and Improvements [Member] | Maximum [Member]          
Gross Amount at Which Carried At Close of Period          
Life on Which Depreciation in Latest Income Statement is Computed 40 years        
Improvements to leased property [Member] | Minimum [Member]          
Gross Amount at Which Carried At Close of Period          
Life on Which Depreciation in Latest Income Statement is Computed 3 years        
Improvements to leased property [Member] | Maximum [Member]          
Gross Amount at Which Carried At Close of Period          
Life on Which Depreciation in Latest Income Statement is Computed 40 years        
Office Furniture and Equipment and Transportation Equipment [Member]          
Gross Amount at Which Carried At Close of Period          
Property and Equipment       350,164  
Accumulated depreciation       235,841  
Bond St. Building Brooklyn, NY Two [Member]          
SEC Schedule, 12-28, Real Estate Companies, Investment in Real Estate and Accumulated Depreciation [Line Items]          
Encumbrances       5,467,111  
Initial Cost to Company          
Land       3,901,349  
Building & Improvements       7,403,468  
Cost Capitalized Subsequent to Acquisition          
Improvements       23,917,153  
Carried Cost        
Gross Amount at Which Carried At Close of Period          
Land       3,901,349  
Building & Improvements       31,320,621  
Total $ 35,221,970     35,221,970  
Accumulated Depreciation 12,941,445     12,941,445  
Investment in Real Estate          
Balance at End of Year 35,221,970        
Accumulated Depreciation          
Balance at End of Year 12,941,445        
Jamaica, New York [Member]          
SEC Schedule, 12-28, Real Estate Companies, Investment in Real Estate and Accumulated Depreciation [Line Items]          
Encumbrances        
Initial Cost to Company          
Land        
Building & Improvements       3,215,699  
Cost Capitalized Subsequent to Acquisition          
Improvements       17,588,009  
Carried Cost        
Gross Amount at Which Carried At Close of Period          
Land        
Building & Improvements       20,803,708  
Total 20,803,708     20,803,708  
Accumulated Depreciation 10,987,347     10,987,347  
Investment in Real Estate          
Balance at End of Year 20,803,708        
Accumulated Depreciation          
Balance at End of Year 10,987,347        
Fishkill, New York Property [Member]          
SEC Schedule, 12-28, Real Estate Companies, Investment in Real Estate and Accumulated Depreciation [Line Items]          
Encumbrances        
Initial Cost to Company          
Land       594,723  
Building & Improvements       7,212,116  
Cost Capitalized Subsequent to Acquisition          
Improvements       5,853,612  
Carried Cost        
Gross Amount at Which Carried At Close of Period          
Land       594,723  
Building & Improvements       13,065,728  
Total 13,660,451     13,660,451  
Accumulated Depreciation 9,058,246     9,058,246  
Investment in Real Estate          
Balance at End of Year 13,660,451        
Accumulated Depreciation          
Balance at End of Year 9,058,246        
Brooklyn, New York, Jowein Building, Fulton Street and Elm Place Property [Member]          
SEC Schedule, 12-28, Real Estate Companies, Investment in Real Estate and Accumulated Depreciation [Line Items]          
Encumbrances        
Initial Cost to Company          
Land       1,324,957  
Building & Improvements       728,327  
Cost Capitalized Subsequent to Acquisition          
Improvements       15,600,458  
Carried Cost        
Gross Amount at Which Carried At Close of Period          
Land       1,324,957  
Building & Improvements       16,328,785  
Total 17,653,742     17,653,742  
Accumulated Depreciation 5,591,005     5,591,005  
Investment in Real Estate          
Balance at End of Year 17,653,742        
Accumulated Depreciation          
Balance at End of Year 5,591,005        
Levittown, New York, Hempstead Turnpike [Member]          
SEC Schedule, 12-28, Real Estate Companies, Investment in Real Estate and Accumulated Depreciation [Line Items]          
Encumbrances        
Initial Cost to Company          
Land       125,927  
Building & Improvements        
Cost Capitalized Subsequent to Acquisition          
Improvements        
Carried Cost        
Gross Amount at Which Carried At Close of Period          
Land       125,927  
Building & Improvements        
Total 125,927     125,927  
Accumulated Depreciation      
Investment in Real Estate          
Balance at End of Year 125,927        
Accumulated Depreciation          
Balance at End of Year        
Circleville, Ohio, Tarlton Road [Member]          
SEC Schedule, 12-28, Real Estate Companies, Investment in Real Estate and Accumulated Depreciation [Line Items]          
Encumbrances        
Initial Cost to Company          
Land       120,849  
Building & Improvements       4,388,456  
Cost Capitalized Subsequent to Acquisition          
Improvements       86,520  
Carried Cost        
Gross Amount at Which Carried At Close of Period          
Land       120,849  
Building & Improvements       4,474,976  
Total 4,595,825     4,595,825  
Accumulated Depreciation 2,804,919     $ 2,804,919  
Investment in Real Estate          
Balance at End of Year 4,595,825        
Accumulated Depreciation          
Balance at End of Year $ 2,804,919